What a fantastic year it was!

Post Syndicated from Jekaterina Sizova original https://blog.zabbix.com/what-a-fantastic-year-it-was/18253/

The year 2021 is coming to the end and what a year it has been for Zabbix! Thank you for spending this year with us – installing new versions of Zabbix, solving monitoring tasks on the forum and community groups, reading our blog posts and watching videos, attending our events, and much more.

Let’s look back at some of the Zabbix Highlights of the year.

Great Minds Think Alike

Thanks to our community and partners’ support, we have organized about 50 online meetups and meetings in English, Russian, Chinese, Dutch, French, Portuguese, Spanish, Italian, and Polish this year. The recordings of the presentations are always available on our events page.

Offline events also took place – Zabbix Conferences have been held in China and Japan – both events were available to attend online and in person.

We organized and held Zabbix Summit Online 2021, which had been visited by thousands of attendees from 130+ countries.

The Ongoing Development

Our integrations team has released 35 new integrations and monitoring templates during the year and is currently developing new in-demand solutions.

Our main page received a few extra tweaks with a new menu bar which makes it easier to navigate between the website sections. Plus, we have completely redesigned and updated the features page, providing a more in-depth overview of Zabbix monitoring solution capabilities.

We released Zabbix 5.4 version that came with scheduled PDF report generation, robust problem detection, advanced data aggregation, and other significant improvements demanded by Zabbix users.

We’ve been working hard on the new Zabbix 6.0 LTS version, developing the most required features. By the beginning of the new year, we’ll be ready to celebrate this long-awaited release together with you.

Knowledge is Power

We’ve been working on the Zabbix Series and have recorded a number of helpful educational videos. Be sure to check out the entire playlist.

We launched the one-day intensive training courses that allow Zabbix users to learn in-depth one specific monitoring topic at a time.

We’ve started a new weekly tradition of sharing the Handy Tips with you – the detailed how-tos where we briefly explain all the nuances of monitoring with Zabbix. Remember that all the handy tips are available in Zabbix Blog.

Finally, we have reached a meaningful internal milestone. In 2021, Zabbix international team has passed the 100-employee mark and continues to grow, becoming more powerful.

Setting the Course for New Achievements

Well, this year is over, and there’s a new one ahead – full of big plans and inspiring intentions. However, we’ll have time to talk about new goals later, but for now, have fun with the holidays! We wish you to enjoy the magic of this festive period and get charged with joy for the whole coming year!

[$] Locked root and rescue mode

Post Syndicated from original https://lwn.net/Articles/879272/rss

Fedora is among the group of Linux distributions that, by default, lock
out the root account such that it does not have a password and cannot be
logged into. But, traditionally, “rescue mode” boots the system into
single-user
mode
, which requires a root password—difficult to provide if it
does not exist. A Fedora proposal to remove the need for the password in
that case, and just drop into a root shell, does not seem likely to go far
in that form,
but it would seem to have pointed toward some better solutions for the
underlying problem.

Find Public IPs of Resources – Use AWS Config for Vulnerability Assessment

Post Syndicated from Gurkamal Deep Singh Rakhra original https://aws.amazon.com/blogs/architecture/find-public-ips-of-resources-use-aws-config-for-vulnerability-assessment/

Systems vulnerability management is a key component of your enterprise security program. Its goal is to remediate OS, software, and applications vulnerabilities. Scanning tools can help identify and classify these vulnerabilities to keep the environment secure and compliant.

Typically, vulnerability scanning tools operate from internal or external networks to discover and report vulnerabilities. For internal scanning, the tools use private IPs of target systems in scope. For external scans, the public target system’s IP addresses are used. It is important that security teams always maintain an accurate inventory of all deployed resource’s IP addresses. This ensures a comprehensive, consistent, and effective vulnerability assessment.

This blog discusses a scalable, serverless, and automated approach to discover public IP addresses assigned to resources in a single or multi-account environment in AWS, using AWS Config.

Single account is when you have all your resources in a single AWS account. A multi-account environment refers to many accounts under the same AWS Organization.

Understanding scope of solution

You may have good visibility into the private IPs assigned to your resources: Amazon Elastic Compute Cloud (Amazon EC2), Amazon Elastic Kubernetes Service (EKS) clusters, Elastic Load Balancing (ELB), and Amazon Elastic Container Service (Amazon ECS). But it may require some effort to establish a complete view of the existing public IPs. And these IPs can change over time, as new systems join and exit the environment.

An elastic network interface is a logical networking component in a Virtual Private Cloud (VPC) that represents a virtual network card. The elastic network interface routes traffic to other destinations/resources. Usually, you have to make Describe* API calls for the specific resource with an elastic network interface to get information about its configuration and IP address. This may throttle the resource-specific API calls, and result in higher costs. Additionally, if there are tens or hundreds of accounts, it becomes exponentially more difficult to get the information into a single inventory.

AWS Config enables you to assess, audit, and evaluate the configurations of your AWS resources. The advanced query feature provides a single query endpoint and language to get current resource state metadata for a single account and Region, or multiple accounts and Regions. You can use configuration aggregators to run the same queries from a central account across multiple accounts and AWS Regions.

AWS Config supports a subset of structured query language (SQL) SELECT syntax, which enables you to perform property-based queries and aggregations on the current configuration item (CI) data. Advanced query is available at no additional cost to AWS Config customers in all AWS Regions (except China Regions) and AWS GovCloud (US).

AWS Organizations helps you centrally govern your environment. Its integration with other AWS services lets you define central configurations, security mechanisms, audit requirements, and resource sharing across accounts in your organization.

Choosing scope of advanced queries in AWS Config

When running advanced queries in AWS Config, you must choose the scope of the query. The scope defines the accounts you want to run the query against and is configured when you create an aggregator.

Following are the three possible scopes when running advanced queries:

  1. Single account and single Region
  2. Multiple accounts and multiple Regions
  3. AWS Organization accounts

Single account and single Region

Figure 1. AWS Config workflow for single account and single Region

Figure 1. AWS Config workflow for single account and single Region

The use case shown in Figure 1 addresses the need of customers operating within a single account and single Region. With AWS Config enabled for the individual account, you will use AWS Config advanced query feature to run SQL queries. These will give you resource metadata about associated public IPs. You do not require an aggregator for single-account and single Region.

In Figure 1.1, the advanced query returned results from a single account and all Availability Zones within the Region in which the query was run.

Figure 1.1 Advanced query returning results for a single account and single Region

Figure 1.1 Advanced query returning results for a single account and single Region

Query for reference

SELECT

  resouceId,

  resourceName,

  resourceType,

  configuration.association.publicIp,

  availabilityZone,

  awsRegion

WHERE

  resourceType='AWS::EC2::NetworkInterface'

  AND configuration.association.publicIp>'0.0.0.0'

This query is fetching the properties of all elastic network interfaces. The WHERE condition is used to list the elastic network interfaces using the resourceType property and find all public IPs greater than 0.0.0.0. This is because elastic network interfaces can exist with a private IP, in which case there will be no public IP assigned to it. For a list of supported resourceType, refer to supported resource types for AWS Config.

Multiple accounts and multiple Regions

Figure 2. AWS Config monitoring workflow for multiple account and multiple Regions. The figure shows EC2, EKS, and Amazon ECS, but it can be any AWS resource having a public elastic network interface.

Figure 2. AWS Config monitoring workflow for multiple account and multiple Regions. The figure shows EC2, EKS, and Amazon ECS, but it can be any AWS resource having a public elastic network interface.

AWS Config enables you to monitor configuration changes against multiple accounts and multiple Regions via an aggregator, see Figure 2. An aggregator is an AWS Config resource type that collects AWS Config data from multiple accounts and Regions. You can choose the aggregator scope when running advanced queries in AWS Config. Remember to authorize the aggregator accounts to collect AWS Config configuration and compliance data.

Figure 2.1 Advanced query returning results from multiple Regions (awsRegion column) as highlighted in the diagram

Figure 2.1 Advanced query returning results from multiple Regions (awsRegion column) as highlighted in the diagram

This use case applies when you have AWS resources in multiple accounts (or span multiple organizations) and multiple Regions. Figure 2.1 shows the query results being returned from multiple AWS Regions.

Accounts in AWS Organization

Figure 3. The workflow of accounts in an AWS Organization being monitored by AWS Config. This figure shows EC2, EKS, and Amazon ECS but it can be any AWS resource having a public elastic network interface.

Figure 3. The workflow of accounts in an AWS Organization being monitored by AWS Config. This figure shows EC2, EKS, and Amazon ECS but it can be any AWS resource having a public elastic network interface.

An aggregator also enables you to monitor all the accounts in your AWS Organization, see Figure 3. When this option is chosen, AWS Config enables you to run advanced queries against the configuration history in all the accounts in your AWS Organization. Remember that an aggregator will only aggregate data from the accounts and Regions that are specified when the aggregator is created.

Figure 3.1 Advanced query returning results from all accounts (accountId column) under an AWS Organization

Figure 3.1 Advanced query returning results from all accounts (accountId column) under an AWS Organization

In Figure 3.1, the query is run against all accounts in an AWS Organization. This scope of AWS Organization is accomplished by the aggregator and it automatically accumulates data from all accounts under a specific AWS Organization.

Common architecture workflow for discovering public IPs

Figure 4. High-level architecture pattern for discovering public IPs

Figure 4. High-level architecture pattern for discovering public IPs

The workflow shown in Figure 4 starts with Amazon EventBridge triggering an AWS Lambda function. You can configure an Amazon EventBridge schedule via rate or cron expressions, which define the frequency. This AWS Lambda function will host the code to make an API call to AWS Config that will run an advanced query. The advanced query will check for all elastic network interfaces in your account(s). This is because any public resource launched in your account will be assigned an elastic network interface.

When the results are returned, they can be stored on Amazon S3. These result files can be timestamped (via naming or S3 versioning) in order to keep a history of public IPs used in your account. The result set can then be fed into or accessed by the vulnerability scanning tool of your choice.

Note: AWS Config advanced queries can also be used to query IPv6 addresses. You can use the “configuration.ipv6Addresses” AWS Config property to get IPv6 addresses. When querying IPv6 addresses, remove “configuration.association.publicIp > ‘0.0.0.0’” condition from the preceding sample queries. For more information on available AWS Config properties and data types, refer to GitHub.

Conclusion

In this blog, we demonstrated how to extract public IP information from resources deployed in your account(s) using AWS Config and AWS Config advanced query. We discussed how you can support your vulnerability scanning process by identifying public IPs in your account(s) that can be fed into your scanning tool. This solution is serverless, automated, and scalable, which removes the undifferentiated heavy lifting required to manage your resources.

Learn more about AWS Config best practices:

Скритата сила на големите приказки

Post Syndicated from original https://bivol.bg/%D1%81%D0%BA%D1%80%D0%B8%D1%82%D0%B0%D1%82%D0%B0-%D1%81%D0%B8%D0%BB%D0%B0-%D0%BD%D0%B0-%D0%B3%D0%BE%D0%BB%D0%B5%D0%BC%D0%B8%D1%82%D0%B5-%D0%BF%D1%80%D0%B8%D0%BA%D0%B0%D0%B7%D0%BA%D0%B8.html

сряда 22 декември 2021


Ние, българите, отдавна сме свикнали да се отнасяме с надменно пренебрежение към приказки. Поне към някои от тях. Можем с лека ръка да приемем щедрите, на практика неизпълними, обещания на…

AWS publishes PiTuKri ISAE3000 Type II Attestation Report for Finnish customers

Post Syndicated from Niyaz Noor original https://aws.amazon.com/blogs/security/aws-publishes-pitukri-isae3000-type-ii-attestation-report-for-finnish-customers/

Gaining and maintaining customer trust is an ongoing commitment at Amazon Web Services (AWS). Our customers’ industry security requirements drive the scope and portfolio of compliance reports, attestations, and certifications we pursue. AWS is pleased to announce the issuance of the Criteria to Assess the Information Security of Cloud Services (PiTuKri) ISAE 3000 Type 2 attestation report. The scope of this report includes 141 AWS services and associated AWS global infrastructure, such as Regions and Edge Locations supporting these services.

Criteria for Assessing the Information Security of Cloud Services (PiTuKri) is a guidance document published by the Finnish Transport and Communications Agency (Traficom) Cyber Security Centre for assessing the security of cloud computing services, such as AWS. The PiTuKri criteria covers a total of 11 subdivisions such as security management, personnel security and physical security which cloud service providers are expected to implement. AWS has engaged with an independent third-party audit firm to examine whether the AWS control environment is appropriately designed and implemented to align with PiTuKri requirements. Additionally, the report provides customers with important guidance on complementary user entity controls (CUECs), which customers should consider implementing as part of the shared responsibility model to help them comply with PiTuKri requirements. The report covers the period from October 1, 2020 to September 30, 2021. A full list of certified services and Regions is presented within the published PiTuKri ISAE3000 report.

The alignment of AWS with PiTuKri requirements demonstrates our continuous commitment to meeting the heightened expectations for cloud service providers set by Traficom. Customers can use the AWS’ PiTuKri ISAE 3000 report as a tool to conduct their due diligence on AWS, which may minimize the effort and costs required for compliance. The report is now available free of charge to AWS customers from AWS Artifact. More information on how to download the report is available here.

As always, AWS is committed to bringing new services into the scope of our PiTuKri program in the future, based on customers’ architectural and regulatory needs. Please reach out to your AWS account team if you have questions about the PiTuKri report. You can also download this blog post translated into Finnish.

 
If you have feedback about this post, submit comments in the Comments section below.

Want more AWS Security news? Follow us on Twitter.

Author

Niyaz Noor

Niyaz is the Security Audit Program Manager at AWS. Niyaz leads multiple security certification programs across Europe and other regions. During his professional career, he has helped multiple cloud service providers in obtaining global and regional security certification. He is passionate about delivering programs that build customers’ trust and provide them assurance on cloud security.

2021 FINMA ISAE 3000 Type 2 attestation report for Switzerland now available on AWS Artifact

Post Syndicated from Niyaz Noor original https://aws.amazon.com/blogs/security/2021-finma-isae-3000-type-2-attestation-report-for-switzerland-now-available-on-aws-artifact/

AWS is pleased to announce the issuance of a second Swiss Financial Market Supervisory Authority (FINMA) ISAE 3000 Type 2 attestation report. The latest report covers the period from October 1, 2020 to September 30, 2021, with a total of 141 AWS services and 23 global AWS Regions included in the scope.

A full list of certified services and Regions are presented within the published FINMA report; customers can download the latest report from AWS Artifact.

The FINMA ISAE 3000 Type 2 report, conducted by an independent third-party audit firm, provides Swiss financial industry customers with the assurance that the AWS control environment is appropriately designed and implemented to address key operational risks, as well as risks related to outsourcing and business continuity management.

FINMA circulars

The report covers the five core FINMA circulars applicable to Swiss banks and insurers in the context of outsourcing arrangements to the cloud. These FINMA circulars are intended to assist Swiss-regulated financial institutions in understanding approaches to due diligence, third-party management, and key technical and organizational controls that should be implemented in cloud outsourcing arrangements, particularly for material workloads.

The report’s scope covers, in detail, the requirements of the following FINMA circulars:

  • 2018/03 Outsourcing – banks, insurance companies and selected financial institutions under FinIA;
  • 2008/21 Operational Risks – Banks – Principle 4 Technology Infrastructure (31.10.2019);
  • 2008/21 Operational Risks – Banks – Appendix 3 Handling of electronic Client Identifying Data (31.10.2019);
  • 2013/03 Auditing – Information Technology (04.11.2020);
  • 2008/10 Self-regulation as a minimum standard – Minimum Business Continuity Management (BCM) minimum standards proposed by the Swiss Insurance Association (01.06.2015) and Swiss Bankers Association (29.08.2013);

Customers can continue to use the detailed FINMA workbooks that include detailed control mappings for each FINMA circular covered under this audit report; these workbooks are available on AWS Artifact. Where applicable, under the AWS shared responsibility model, these workbooks provide best practices guidance using AWS Well-Architected to assist Swiss customers in their own preparation for alignment with FINMA circulars.

As always, AWS is committed to bringing new services into the future scope of our FINMA program based on customers’ architectural and regulatory needs. Please reach out to your AWS account team if you have questions or feedback about the FINMA report.

If you have feedback about this post, submit comments in the Comments section below.

Want more AWS Security news? Follow us on Twitter.

Author

Niyaz Noor

Niyaz is the Security Audit Program Manager at AWS. Niyaz leads multiple security certification programs across Europe and other regions. During his professional career, he has helped multiple cloud service providers in obtaining global and regional security certification. He is passionate about delivering programs that build customers’ trust and provide them assurance on cloud security.

Automating Index State Management for Amazon OpenSearch Service (successor to Amazon Elasticsearch Service)

Post Syndicated from Gene Alpert original https://aws.amazon.com/blogs/big-data/automating-index-state-management-for-amazon-opensearch-service-successor-to-amazon-elasticsearch-service/

When it comes to time-series data, it’s more common to access new data than existing data, such as the last four hours or one day. Often, application teams must maintain multiple indexes for diverse data workloads, which bring new requirements to set up a custom solution to manage the index lifecycles. This becomes tedious as the indexes grow, and it results in housekeeping overhead.

Amazon OpenSearch Service (successor to Amazon Elasticsearch Service) enables you to automate recurring index management activities. This avoids having to use any additional tools to manage the index lifecycles. Index State Management (ISM) lets you create a policy that automates these operations based on index age, size, and other conditions, all from within your Amazon OpenSearch Service domain.

In this post, we discuss how you can implement a policy to automate routine index management tasks and apply them to indexes and index patterns.

Prerequisites

Before you get started, make sure to complete the following prerequisites:

  1. Have Elasticsearch 6.8 or later (required to use ISM and UltraWarm) or Set up a new Amazon OpenSearch Service domain with UltraWarm enabled.
  2. Register a manual snapshot repository for your new domain.
  3. Make sure that your user role has sufficient permissions to access the Kibana console of the Amazon OpenSearch Service domain. If required, validate and configure the access to your domains.

Use case

Amazon OpenSearch Service supports three storage tiers: the default “hot” for active writing and low-latency analytics, UltraWarm for read-only data up to three petabytes at one-tenth of the hot tier cost, and cold for unlimited long-term archival. Although hot storage is used for indexing and providing the fastest access, UltraWarm complements the hot storage tier by providing less expensive storage for older and less-frequently accessed data. This is done while maintaining the same interactive analytics experience. Rather than attached storage, UltraWarm nodes use Amazon Simple Storage Service (Amazon S3) and a sophisticated caching solution to improve performance.

To demonstrate the functionality, we present a sample use case of handling time-series data in daily indices. In this use case, we automatically snapshot each index after 24 hours, then we migrate the index from the default hot state to UltraWarm storage after two days, cold storage after 30 days, and finally delete the index after 60 days.

After you create the Amazon OpenSearch Service domain and register a snapshot repository, complete the following steps:

  1. Wait for the domain status to turn active and choose the Kibana endpoint.
  2. Log in using the Kibana UI endpoint.
  3. On Kibana’s splash page, add all of the sample data listed by choosing Try our sample data and choosing Add data.
  4. After adding the data, choose Index Management (the IM icon on the left navigation pane), which lands into the Index Policies page.
  5. Choose Create policy.
  6. For Name policy, enter ism-policy-example.
  7. Replace the default policy with the following policy:
{
    "policy": {
        "description": "Demonstrate a hot-snapshot-warm-cold-delete workflow.",
        "default_state": "hot",
        "states": [
            {
                "name": "hot",
                "actions": [],
                "transitions": [
                    {
                        "state_name": "snapshot",
                        "conditions": {
                            "min_index_age": "24h"
                        }
                    }
                ]
            },
            {
                "name": "snapshot",
                "actions": [
                    {
                        "retry": {
                            "count": 5,
                            "backoff": "exponential",
                            "delay": "30m"
                        },
                        "snapshot": {
                            "repository": "snapshot-repo",
                            "snapshot": "ism-snapshot"
                        }
                    }
                ],
                "transitions": [
                    {
                        "state_name": "warm",
                        "conditions": {
                            "min_index_age": "2d"
                        }
                    }
                ]
            },
            {
                "name": "warm",
                "actions": [
                    {
                        "retry": {
                            "count": 5,
                            "backoff": "exponential",
                            "delay": "1h"
                        },
                        "warm_migration": {}
                    }
                ],
                "transitions": [
                    {
                        "state_name": "cold",
                        "conditions": {
                            "min_index_age": "30d"
                        }
                    }
                ]
            },
            {
                "name": "cold",
                "actions": [
                    {
                        "retry": {
                            "count": 5,
                            "backoff": "exponential",
                            "delay": "1h"
                        },
                        "cold_migration": {
                            "start_time": null,
                            "end_time": null,
                            "timestamp_field": "@timestamp",
                            "ignore": "none"
                        }
                    }
                ],
                "transitions": [
                    {
                        "state_name": "delete",
                        "conditions": {
                            "min_index_age": "60d"
                        }
                    }
                ]
            },
            {
                "name": "delete",
                "actions": [
                    {
                        "cold_delete": {}
                    }
                ],
                "transitions": []
            }
        ],
        "ism_template": [
            {
                "index_patterns": [
                    "index-*"
                ],
                "priority": 100
            }
        ]
    }
}    

Note that the last section of the policy, “ism_template”, is used to automatically attach the ISM policy to any newly created index that matches the index_patterns. You can define multiple patterns.

Furthermore, you can use the  ISM API to programmatically work with policies and managed indexes.

  1. Choose Create. You can now see your index policy on the Index Policies page.
  2. On the Indices page, search for kibana_sample, which should list all of the sample data indexes that you added earlier.
  3. Select all of the indexes and choose Apply policy.
  4. From the Policy ID drop-down menu, choose the policy created in the previous step.
  5. Choose Apply.

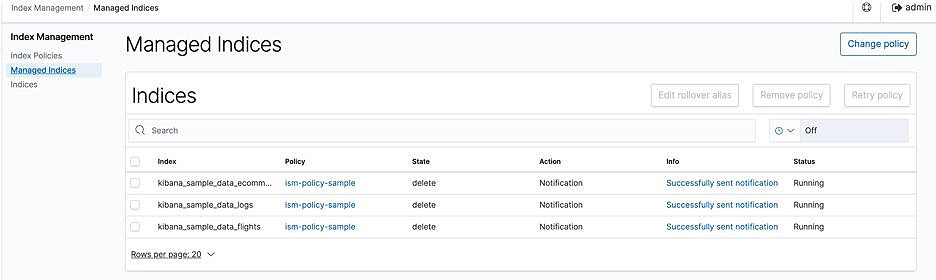
The policy is now assigned and starts managing the indexes. On the Managed Indices page, you can observe the status as Initializing.

When initialization is complete, the status changes to Running.

You can also set a refresh frequency to refresh the managed indexes’ status information.

Demystifying the policy

In this section, we explain the index policy and its structure.

Policies are JSON documents that define the following:

  • The states an index can be in
  • Any actions that you want the plugin to take when an index enters the state
  • Conditions that must be met for an index to move or transition into a new state

The policy document begins with basic metadata such as description, the default_state that the index should enter, and finally a series of state definitions.

A state is the status that the managed index is currently in. A managed index can only be in one state at a time. Each state has associated actions that are run sequentially upon entering a state, and transitions that are checked after all of the actions are complete.

The first state is hot. In this use case, no actions are defined in this hot state. Moreover, the managed indexes land in this state initially, and then transition to snapshot, warm, cold, and finally delete. Transitions define the conditions that must be met for a state to change (in this case, change to snapshot after the index crosses 24 hours).

We can quickly verify the status in the Index Managemet section of Kibana. Each index will have state details listed under Policy managed indices.

You can also verify this on the Amazon OpenSearch Service console under the Ultrawarm Storage usage and Cold Storage usage columns.

The last state of the policy document marks the indexes to delete based on the actions. This policy state assumes that your index is non-critical and no longer receiving write requests. Having zero replicas carries some risk of data loss.

Among other actions, you can also configure the notification to send policy action information to Chime, Slack, or a webhook URL. Complete details can be found here.

The following screenshot shows the index status on the console.

Additional information on ISM policies

If you have an existing Amazon OpenSearch Service domain with no UltraWarm support (because of any missing prerequisites), you can use policy operations read_only and reduces_replicas to replace the warm state. The following code is the policy template for these two states:

{
                "name": "reduce_replicas",
                "actions": [{
                  "replica_count": {
                    "number_of_replicas": 0
                  }
                }],
                "transitions": [{
                  "state_name": "read_only",
                  "conditions": {
                    "min_index_age": "2d"
                  }
                }]
            },
            {
                "name": "read_only",
                "actions": [
                    {
                        "read_only": {}
                      }
                ],
                "transitions": [
                    {
                        "state_name": "delete",
                        "conditions": {
                            "min_index_age": "3d"
                        }
                    }
                ]
            },

Summary

In this post, you learned how to use the ISM feature with UltraWarm and cold storage tiers for Amazon OpenSearch Service. The walkthrough illustrated how to manage indexes using this plugin with a sample lifecycle policy.

For more information about the ISM plugin, see Index State Management. If you need enhancements or have other feature requests, then please file an issue. To get involved with the project, see Contributing Guidelines.

A big takeaway for me as I evaluated the ISM plugin in Amazon OpenSearch Service was that the ISM plugin is fully compatible and works on any deployment of the open source OpenSearch software. For more information, see the Index State Management in OpenSearch documentation.


About the Author

Gene Alpert is a Big Data and Analytics Consultant with Amazon Web Services. He helps AWS customers optimize their cloud data operations.
The Linux Foundation’s report on diversity, equity, and inclusion in open source

Post Syndicated from original https://lwn.net/Articles/879379/rss

The Linux Foundation has announced
the posting of a report on its research into diversity, equity, and
inclusion in open-source communities.

The research shows that while
a majority of respondents feel welcome in open source, many in
underrepresented communities do not. We hope that the data and insights
that this project provides will be a catalyst for strengthening existing
DEI initiatives and creating new ones.

The full report can be downloaded from this page.

Testing Your Ransomware Readiness

Post Syndicated from Molly Clancy original https://www.backblaze.com/blog/testing-your-ransomware-readiness/

Every eleven seconds. That’s how frequently ransomware attacks were predicted to happen this year according to Cybersecurity Ventures. And if U.S. Treasury predictions are correct, the payouts from those attacks will exceed a billion dollars by the end of the year.

Despite taking steps to be better prepared, many companies still end up paying ransoms because the cost of extended downtime to restore from backups with limited resources exceeds the ransom demand. Even then, assuming the decryption key even works, there’s no reason to assume threat actors won’t make additional modifications, leave backdoors they can exploit again, or use exfiltrated data against you.

But, you don’t have to let that be your story. Today, we’re explaining the reasons for testing your security stance, different testing strategies and best practices including penetration testing and recovery testing, and steps you can take to develop a testing protocol.

Ransomware is on the rise. Level up your security practices along with it.

First, Implement a Strong Backup Practice

Backups are a critical piece of your ransomware defense strategy. Before thinking about testing, take the time to shore up your ransomware defenses by implementing at least a 3-2-1 backup strategy, if not a more comprehensive strategy like 3-2-1-1-0 or 4-3-2.

If you’re unfamiliar with these strategies, they advise keeping at least three copies of your data on two different media with at least one off-site. Strategies like 3-2-1-1-0 and 4-3-2 go a step further, advising you to keep a copy offline or protected by Object Lock, ensure your data has zero errors, and/or keeping additional backup copies for good measure.

Ransomware Readiness Resources

The National Cybersecurity Center of Excellence (NCCoE), a part of the National Institute of Standards and Technology (NIST), publishes a set of guidelines that support the development of secure information systems. These controls cover operational, technical, and management practices for information security teams, including:

What Is the National Cybersecurity Center of Excellence?

NCCoE is a collaboration between industry organizations, government agencies, and academic institutions that work together to address the most important cybersecurity challenges facing businesses today. NCCoE develops modular, adaptable example cybersecurity solutions that demonstrate how to apply standards and best practices using commercially available technology.

The Cybersecurity and Infrastructure Agency (CISA) also offers a module, the Cybersecurity Evaluation Tool, that guides network administrators through a process to evaluate the cybersecurity practices on their networks. When it comes to evaluating your cybersecurity defensive stance, these resources are a good place to start.

Why Test Your Ransomware Defenses?

Weathering a ransomware incident depends on how prepared you are before the attack. First, by establishing a solid backup strategy. Second, by analyzing your vulnerabilities in a penetration test. And third, by testing recovery procedures to prepare and familiarize your team with your defense systems and your recovery plans. While there are many, the biggest reasons for testing your ransomware defenses include:

  1. Shifting threats: Cybersecurity threats are always evolving and changing. Regularly evaluating potential vulnerabilities and testing your recovery practices prepares you for unforeseen situations.
  2. Compliance: Companies in certain industries are required to show proof of vulnerability assessments and recovery testing in order to comply with regulations.
  3. Creating a culture of preparedness: Familiarizing your staff with testing and recovery procedures better prepares them if the real thing happens. In the moment, they’ll know exactly what to do.
  4. Prioritizing budgets: Identifying threats and potential vulnerabilities helps your team prioritize spending around the most mission critical efforts to protect your company.

Maybe your backup system is functioning well, but the effort to test recovery scenarios or analyze your environment for vulnerabilities is lower priority than day-to-day demands. Or maybe you’ve looked into vulnerability testing or recovery planning, but it’s out of scope for your organization—you may not need enterprise-scale solutions.

Either way, if you need any more justification to implement a vulnerability testing program or recovery solution, look no further than the many companies scrambling to respond to the Log4j vulnerability. A security engineer from a major software company explained it well in a WIRED article, “Security-mature organizations will start trying to assess their exposure within hours of an exploit like this, but some organizations will take a few weeks, and some will never look at it.” Any amount of time you can spend on preparation brings you that much closer to security maturity.

Testing Your Cybersecurity Readiness

Two security practices that security-mature organizations regularly undertake include penetration testing and disaster recovery testing. When thinking about your overall cybersecurity readiness, it helps to have an understanding of these key practices.

What Is Penetration Testing?

Penetration testing or pen testing is a broad term that covers many different levels of testing from phishing assessments, to vulnerability identification, to full on adversarial hacking simulations. Most organizations will choose to work with an outside consultant to conduct penetration testing and will scope out the depth and breadth of the testing procedures. Ideally, you want to work with someone with little or no knowledge of your systems so they can uncover vulnerabilities you might not see.

Those vulnerabilities are the output of a pen test, and they help organizations identify and prioritize steps to address in order to implement security upgrades.

What Is Disaster Recovery Testing?

Disaster recovery testing involves going through a simulated recovery scenario to make sure you can recover quickly and completely from backups. In the event of a ransomware attack or identification of a breach, the last thing you want is chaos. Regularly testing your recovery protocols helps you and your team build familiarity with the procedures. If you ever are attacked by ransomware, you’ll be much more comfortable knowing exactly what to do to bring your systems safely back up.

Disaster Recovery With a Single Command

If you’re using Veeam to manage backups, you can use Backblaze Instant Recovery in Any Cloud to quickly recover your systems without the overhead of an enterprise-scale solution. Instant Recovery in Any Cloud is an infrastructure as code package that makes ransomware recovery into a VMware/Hyper-V based cloud easy to plan and execute. Read more here.

The Testing Process

Whether you’re approaching a pen test or a recovery test, the overall steps in the process are generally similar:

  1. Design test objectives: Testing consumes time and resources, so it is essential to be thoughtful about what exactly you decide to test. If you are new to cybersecurity testing, you might find it helpful to start by running a simple small-scale test. At a minimum, define the business function you’re testing, the test duration, test method, the test objective, and any secondary objectives.
  2. Execute the test: Make early decisions about execution, including when you’ll conduct the test, if the test will interrupt production, and whether you’ll make employees aware of the test. There are pros and cons to most execution methods, so it really depends on your overall objectives.
  3. Analyze test results: When analyzing test results, identify both technical issues and business impacts. Did the process substantially disrupt production resulting in extensive downtime? How can you work to minimize that business impact?
  4. Implement continuous improvements: If you find gaps in your process during testing, celebrate that fact. You now know where you need to boost defenses or strengthen your recovery protocol before a real attack comes along. Generally speaking, focus your continuous improvement efforts on two principles: impact and likelihood. For example, a vulnerability capable of taking your payment system offline would have a high impact. If that vulnerability is also highly likely, addressing this issue may be a top priority.
  5. Schedule the next test: In IT security, there is no such thing as “done” because threats are constantly evolving. Tomorrow’s threats may require different safeguards. That’s why experts advise conducting annual testing of cybersecurity programs and recovery procedures as a starting point.

You Can Reduce Your Security Risk

By using regular testing and continuous improvement, you can reduce the likelihood of a severe IT security incident. Of course, there are other ways you can enhance your safeguards. If you’re looking for more detailed information on ransomware and how to protect data, identify threats, and recover from an attack, download our Complete Guide to Ransomware.

The post Testing Your Ransomware Readiness appeared first on Backblaze Blog | Cloud Storage & Cloud Backup.

Security updates for Tuesday

Post Syndicated from original https://lwn.net/Articles/879360/rss

Security updates have been issued by Mageia (log4j), openSUSE (chromium, log4j, netdata, and nextcloud), Oracle (kernel and kernel-container), Red Hat (kernel, kernel-rt, log4j, openssl, postgresql:12, postgresql:13, and virt:rhel and virt-devel:rhel), Slackware (httpd), SUSE (xorg-x11-server), and Ubuntu (firefox).

Излезе от печат сборникът „Ще ви разкажа за моя спасител”

Post Syndicated from original https://bivol.bg/%D0%B8%D0%B7%D0%BB%D0%B5%D0%B7%D0%B5-%D0%BE%D1%82-%D0%BF%D0%B5%D1%87%D0%B0%D1%82-%D1%81%D0%B1%D0%BE%D1%80%D0%BD%D0%B8%D0%BA%D1%8A%D1%82-%D1%89%D0%B5-%D0%B2%D0%B8-%D1%80%D0%B0%D0%B7%D0%BA.html

вторник 21 декември 2021


Излезе от печат сборникът „Ще ви разкажа за моя спасител” с творби, получили награди и номинации на Международния литературен ученически конкурс „Който спаси един човешки живот, спасява цяла вселена”, организиран…

Raspberry Pi computers are speeding to the International Space Station

Post Syndicated from Olympia Brown original https://www.raspberrypi.org/blog/astro-pi-rocket-launch-21-space-raspberry-pi-computer/

This morning, our two new Astro Pi units launched into space. Actual, real-life space. The new Astro Pi units each consist of a Raspberry Pi computer with a Raspberry Pi High Quality Camera and a host of sensors, all housed inside a special space-ready case that makes the hardware suitable for the International Space Station (ISS).

Astro Pi MK II hardware.

The journey to space for two special Raspberry Pi computers

Today’s launch is the culmination of a huge piece of work we’ve done for the European Space Agency to get the new Astro Pi units ready to become part of the European Astro Pi Challenge.

Logo of the European Astro Pi Challenge.

After lift-off from Launch Complex 39A at Kennedy Space Center in Florida, the new Astro Pi units are currently travelling on a SpaceX Falcon 9 rocket carrying the Dragon 2 spacecraft, the module atop the rocket. You can watch the launch again here.

SpaceX’s Falcon 9 rocket carrying the Crew Dragon spits fire as it lifts off from Kennedy Space Center in Florida.
A SpaceX rocket is delivering the special Raspberry Pi computers to the ISS today. © SpaceX

Also travelling with our Astro Pi units are food and some Christmas presents for the astronauts on board the ISS, materials for a study of the delivery of cancer drugs; a bioprinter for experiments investigating wound healing; and materials for a study of how detergents work in microgravity.

The Dragon 2 spacecraft will berth with the ISS tomorrow, with NASA astronauts Raja Chari and Tom Marshburn monitoring its arrival. ESA astronaut Matthias Maurer and another colleague will be there to unpack its cargo. You can watch the process of unpacking tomorrow, Wed 22 December, at 8.30am GMT / 9.30am CET. In the new year, Matthias will be switching our Astro Pi units on and getting them ready to run the code written by young people participating in the European Astro Pi Challenge. The new Astro Pi units will replace Astro Pi units Ed and Izzy, which have been on the ISS for 6 years — ever since the very first Astro Pi Challenge with British ESA astronaut Tim Peake in 2015.

The International Space Station.
The International Space Station, where the special Raspberry Pi computers will arrive tomorrow, © ESA–L. Parmitano, CC BY-SA 3.0 IGO

We’re looking forward to seeing the amazing experiments this year’s Astro Pi Mission Space Lab teams will perform on the new hardware, and what they’ll discover about life on Earth and in space. We also can’t wait to see what the young people participating in Astro Pi Mission Zero will name the new Astro Pi units!

Building space-ready Astro Pi units

None of us on the team working on the Astro Pi Challenge here at the Foundation are aerospace engineers. While building the new Astro Pi units, we’ve learned so much.

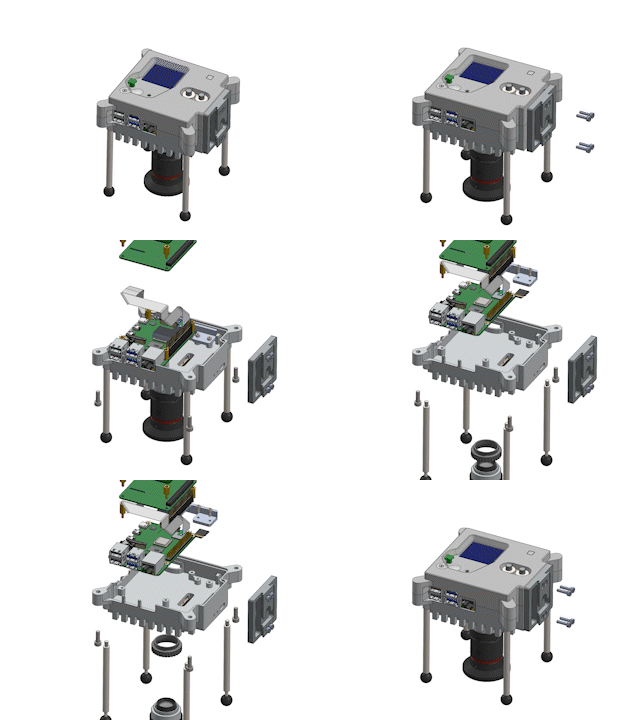
Animation of how the components of the Mark 2 Astro Pi hardware unit fit together.

To get the Astro Pis ready to be loaded onto the rocket has been a project of more than three years. That’s because, in addition to manufacturing the Astro Pi units, we also had to ensure they pass the necessary safety and certification process. The official name for this is the Safety Gate process. It’s been set up by ESA and NASA to ensure that any items sent to the ISS are safe to operate on board the station.

For the three separate safety panels the Astro Pi units needed to get through, we put the units through different tests and completed various safety reports. The tests included:

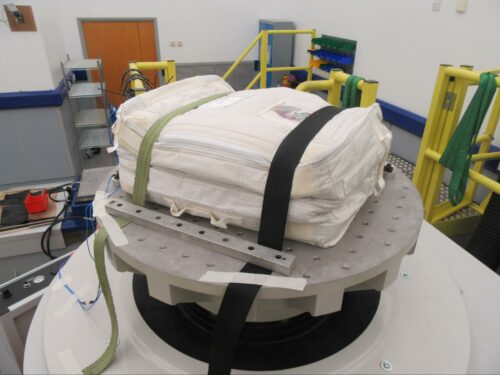
  • A vibration test: To make sure the Astro Pi units survive the rigours of the launch, we tested them using the sophisticated rigs at Airbus in Portsmouth. These rigs are capable of simulating the vibrations produced by various different launch vehicles. We needed to test all possible options, because the Astro Pi units didn’t have a confirmed vehicle to travel to the ISS yet.
A vibration test of the new Raspberry Pi-powered Astro Pi units at Airbus in Portsmouth
  • A thermal test: To make sure no harm can possibly come to the crew from the Astro Pi units, we needed to check that the touch temperature of the Astro Pi units’ surface is never above 45°C.
  • A test for sharp edges: Each Astro Pi unit also needed to be manually inspected by someone wearing a latex glove who carefully feels the case for sharp edges.
Testing the new Raspberry Pi-powered Astro Pi units for sharp edges using a latex glove.
  • Stringent, military-grade electromagnetic emissions and susceptibility tests: These are required to guarantee that the Astro Pi units won’t interfere with any ISS systems, and that the units themselves are not affected by other equipment on board.
  • We built two additional Astro Pi units and sent them to NASA so that they could test that plugging the units into the ISS power grid wouldn’t cause a power overload. 

For almost all of these tests, we created custom software to do things like stress the Astro Pi units’ processors, saturate the network links, and generally make the units work as hard as possible. 

To accompany these safety and test reports, we also had to create the Flight Safety Data Package (FSDP), which contains exact technical information about every component of the Astro Pi hardware, and about all the necessary safety controls to qualify the use of certain materials and safely manage operation of the units. The current FSDP paperwork stands at over 700 pages, which thankfully we haven’t had to actually print out!

Young people’s code will run on the new Astro Pi units next year — is yours on board?

All of this work culminated today in the Astro Pis being launched up into space from Cape Canaveral. And we’re doing all this so that more young people can take part in the European Astro Pi Challenge and send messages to the ISS astronauts using code as part of Mission Zero, or write code for new, ambitious experiments to run on the ISS as part of Mission Space Lab.

Young people can take part in Astro Pi Mission Zero right now! Mission Zero is a beginners’ coding activity for all young people under the age of 19 in ESA member and associate states. It gives them the chance to write code to show their own message to the astronauts on board the ISS using the Astro Pi units. And this time, Mission Zero participants can also vote to name the new Astro Pi units!

To participate, young people follow our step-by-step instructions to write their Mission Zero code. As an adult supporting a young person on Mission Zero, all you need to do is sign up as a mentor to get them a registration code for their Mission Zero entry. Once your young person’s code has run in space, we’ll send you a special certificate for them showing where the ISS, and the Astro Pi computers, were when their code ran.

Inspire a young person to learn about coding and space science today with Astro Pi Mission Zero!

The post Raspberry Pi computers are speeding to the International Space Station appeared first on Raspberry Pi.

[$] Content blockers and Chrome’s Manifest V3

Post Syndicated from original https://lwn.net/Articles/879063/rss

A clarion call from the Electronic Frontier Foundation (EFF) warning about upcoming changes to the Chrome
browser’s extension API was not the first such—from the EFF or from
others. The time of the switch to Manifest
V3
, as the new API is known, is growing closer; privacy advocates are
concerned that it will preclude a number of techniques that browser
extensions use for features like ad and tracker blocking. Part of the
concern stems from the fact that Google is both the developer of a popular
web browser and the operator of an enormous advertising network so its
incentives seem, at least, plausibly misaligned.

Our Response to the Log4j Vulnerability

Post Syndicated from Mark Potter original https://www.backblaze.com/blog/our-response-to-the-log4j-vulnerability/

When the director of the Cybersecurity and Infrastructure Agency calls a vulnerability “one of the most serious I’ve seen in my entire career, if not the most serious,” ears perk up.

The director was referring to the Apache Log4j vulnerability that was discovered this month. Some more colorful phrases used to describe the Log4j incident include: “a grave threat,” “a design failure of catastrophic proportions,” something that will “haunt the internet for years.”

The vulnerability proceeded to set off five-alarm fires in IT, security, and operations departments around the world. Or should have, at least. Researchers estimate at least 840,000 attacks have since been launched via the vulnerability since it was discovered. That is to say, if you’re using a software or cloud vendor that hasn’t made some kind of statement or taken corrective action, you should be asking them why not.

At Backblaze, we made the decision to take our servers temporarily offline in order to hunt down potential threats, apply the appropriate security patches, and test those patches to help prevent our systems from being compromised. This post explains why we made the decision, outlines the actions we took to meet our objective of securing customer data as well as our environment, and provides more insight into our process.

What Is the Log4j Vulnerability?

As reported by ArsTechnica, a zero-day vulnerability was discovered in the Apache Log4j logging library that enables attackers to take control of vulnerable servers. Though it may not be an immediately recognizable name, Log4j is widely used throughout the world by companies like Apple, Twitter, and Tesla as well as the game Minecraft. The library allows developers to easily log application events. The Cybersecurity & Infrastructure Security Agency (CISA) urged users to apply patches immediately to address the vulnerabilities.

Our Decision

Upon learning of the Log4j vulnerability, our team took swift action to investigate and assess available options to address the potential impacts since Log4j is leveraged widely in our environment. As part of our investigation, our internal team used a nondestructive form of the exploit to confirm our vulnerability. We also noted close to 80,000 unsuccessful Log4j exploit attempts on our sites in a 12-hour period. The level of activity, along with our success using the exploit (albeit with internal knowledge of our own systems), was very concerning to us.

Although we were not aware of any unauthorized access to our systems due to the Log4j vulnerability, out of an abundance of caution, we decided it was in our customers’ best interest to take systems offline until they could be patched. The decision to take our systems offline was not one we took lightly. However, our Incident Management Guidelines are quite clear. In a crisis where tradeoffs must be made, our descending list of priorities (all of which are very important to us) is as follows:

  1. Health & Safety.
  2. Data Integrity & Confidentiality.
  3. Service Availability.
  4. Service Performance.

Protecting customer data integrity is second only to health and safety and above service availability. That said, the decision to temporarily bring all services down was unprecedented in the 14-year history of Backblaze. This was an extraordinary case where we made a decision to take a necessary action to address an imminent risk of a vulnerability with a Common Vulnerability Scoring System (CVSS) score of 10.0—the highest possible score. We believe that we needed to take preventative steps to protect customer data by temporarily taking our services offline until the security patching process was complete.

What Actions Have We Taken?

A recap of recent actions is outlined below:

  • Upon learning of the Log4j vulnerability, our Security team took immediate action to investigate.
  • Based on our assessment of the potential threat, we decided to temporarily take our services offline to apply a security patch to prevent our systems from potentially being compromised.
  • We announced our systems had been taken offline at 5:20 p.m. PT on December 10, 2021.*
  • We announced our systems were back online and functioning normally at 3:01 a.m. PT on December 11, 2021.
  • Based on our investigation, we also determined that there was no evidence of our systems being compromised or unauthorized access to customer data or files due to the Log4j vulnerability.

*We decided not to announce downtime publicly until after our systems were offline to avoid any elevation of priority to those targeting our services. Accordingly, we did not make a public announcement until after the servers were disconnected.

Was Backblaze Compromised?

We have not found any evidence of system compromise or unauthorized access to customer data or files at this time.

Next Steps

As is part of our incident response process, we always look for ways to do better and identify areas for improvement. In this case, two top priorities moving forward would be to improve how we can apply security patches faster and reduce downtime.

Thank you to our customers for your understanding as we navigated this challenging incident.

The post Our Response to the Log4j Vulnerability appeared first on Backblaze Blog | Cloud Storage & Cloud Backup.

Beware The CopyLEFT Trolls (Techdirt)

Post Syndicated from original https://lwn.net/Articles/879263/rss

Techdirt looks
at the problem of copyleft trolls
, and those who target users of
Creative Commons materials in particular.

However, in the end, they are still licenses, and those licenses
are still backed by copyright — which means that if you don’t
abide by the specifics of the Creative Commons license, you could
very much be liable for copyright infringement. Enter the copyleft
trolls. They search for those using CC-licensed works, but not
following the exact terms of the license, and then resort to the
typical copyright troll shakedown game.

The collective thoughts of the interwebz