How Delivery Hero rebuilt real-time ad measurement with Apache Flink

Post Syndicated from Kirill Tishenkov original https://aws.amazon.com/blogs/big-data/how-delivery-hero-rebuilt-real-time-ad-measurement-with-apache-flink/

This post is co-written with Kirill Tishenkov, Alexandru Pisarenco, Upendra Kambhampati, and Sabariesh Ganesan from Delivery Hero.

Real-time ad measurement is one of the harder streaming problems in advertising. Every impression and click has to be accurate enough to bill a vendor for, and fresh enough for the ad server to act on. In this post, we describe how Delivery Hero moved its ad measurement pipeline from hourly batch processing to real time on Amazon Managed Service for Apache Flink. Delivery Hero, based in Berlin, Germany, is one of the world’s leading local delivery platforms, operating across Asia, Europe, Latin America, the Middle East, and North Africa. Working with more than 1.5 million restaurant partners and local vendors in around 65 countries, Delivery Hero handles millions of orders for food, groceries, and everyday essentials daily.

At the center of Delivery Hero’s business sits an advertising platform that connects vendors and brands with millions of active consumers. The platform handles tens of thousands of messages per second and processes billions of ad events per day, supporting an advertising revenue stream that reached almost EUR 1.5 billion in 2025. Every impression served and every click recorded must satisfy two requirements at once. The data must be accurate enough to bill vendors fairly, and fresh enough for the ad server to act on in real time. Delivery Hero replaced its batch-oriented measurement system with a fully real-time pipeline built on Amazon Managed Service for Apache Flink. The new pipeline cut infrastructure costs by more than half and reached a level of data quality the previous system could not.

Challenges with the legacy system

The legacy ads measurement system consumed impression, click, and order events from message queues. It enriched them through synchronous API calls for campaign metadata and product lookups, then wrote hourly aggregated metrics to a reporting database. This design worked at a modest scale, but five structural problems emerged as traffic grew.

No event-time semantics, and slow processing. The pipeline bucketed events by the time it processed them rather than the time they occurred, because most events arrived without a usable event timestamp. Results were internally consistent, but they skewed whenever ingestion lagged or events arrived out of order. That widened the error bar on every time-sensitive metric, including return on ad spend (ROAS). The bigger cost was speed. Metrics were assembled in hourly batches, so the average gap between when an event occurred and when it was recorded was 61 minutes. The platform was reacting to clicks and impressions up to an hour after the fact, far too late for budget pacing or ad serving.

Synchronous enrichment capped how far the system could scale. Enrichment is the step that attaches business context to a raw ad event: which campaign it belongs to, which vendor owns it, and which product was advertised. In the legacy system, every event triggered a chain of blocking external API calls to fetch that context. During traffic spikes, such as a flash sale or a back-to-school surge, exhausted connection pools cascaded into billing, ad serving, and reporting simultaneously. There was no back-pressure mechanism and no way to scale enrichment independently of event ingestion.

The database behind the pipeline was built for a very different access pattern. The pipeline kept its working data in a NoSQL document database: deduplication keys, attribution history, and running totals. The platform inherited that database from its pre-streaming era, when ad measurement looked like document storage and retrieval. The workload then evolved into continuous deduplication, multi-day attribution lookups, and rolling aggregation. Every event ended up triggering a full document read and write against a database designed for occasional access, not per-event mutation. Read/write amplification stored far more data than the logic needed, every write triggered index updates and collection scans, and storage costs grew in lockstep with query latency. At peak load, this often tipped into production outages.

Reprocessing was a project, not a capability. Recovery from a bug, a traffic spike, or a corrupted upstream batch required different tooling for every consuming system. Billing replay was a hand-rolled combination of Google Cloud BigQuery tables, Pub/Sub topics, and custom CLI scripts. Reporting replay ran as a separate daily Airflow job with a one-hour-per-day cost and a six-month horizon. Campaigns and credits events had no replay path at all. Every recovery was a coordination exercise across teams. Every event type that could not be replayed was a class of problems that could only be patched manually after the fact.

Incomplete event context corrupted downstream data quality. Enrichment was synchronous and best-effort, so the pipeline still wrote through events that failed a lookup or arrived malformed, leaving their fields blank. The pipeline had no mechanism to recover the missing context later. Three gaps mattered most:

  • Missing session rate: the share of events that landed without a usable session ID, leaving the interaction unattached to the user browsing session it belonged to. At 30–40 percent, roughly a third of all events could not be tied back to a session, breaking any session-scoped analysis or feature.
  • Missing customer identifiers (IDs): the share of events with no customer ID, severing the link between an ad interaction and the customer who generated it and weakening attribution and personalization.
  • Missing impression timestamps: the share of impression events lacking a reliable event-time timestamp (the same root cause as the processing-time fallback described earlier). At 91 percent, most impressions had no trustworthy event time, forcing the processing-time approximation and widening the error bar on every time-based metric.

These omissions propagated silently into the reporting metrics and into the session-scoped features consumed by machine learning (ML) models for campaign ranking, conversion-rate estimation, and anomaly detection.

The team set three non-negotiable requirements. First, fault-tolerant data processing, to eliminate data loss. Second, stateful stream processing that could hold multiple days of interaction history in low-cost, low-latency storage. Third, fully managed infrastructure, so engineers could focus on application logic rather than cluster operations.

The team selected Apache Flink because it satisfies all three requirements natively, without bolting on external systems. Its event-time watermark model helps place out-of-order events in the correct time window even when they arrive late. Its RocksDB state backend holds large keyed state on disk without Java Virtual Machine (JVM) heap pressure.

The team chose Amazon Managed Service for Apache Flink over self-hosted Flink on Amazon Elastic Kubernetes Service (Amazon EKS) to eliminate the operational burden of managing JobManagers, TaskManagers, and checkpoint storage. Amazon Kinesis Data Streams serves as the upstream event bus, with two streams: one for user event actions (impressions and clicks) and one for orders. The team chose Kinesis Data Streams over Amazon Managed Streaming for Apache Kafka (Amazon MSK) for cost efficiency at this topology.

Amazon DynamoDB holds campaign and product reference data, queried through Flink’s Async I/O API to enrich events without blocking the processing pipeline. AWS Secrets Manager stores ad event decryption keys, retrieved once at job startup. Amazon Simple Storage Service (Amazon S3) stores granular event logs in Avro format and serves as the incremental checkpoint store for Flink state. Amazon EventBridge Pipes bridged Amazon Simple Queue Service (Amazon SQS) to Kinesis in the minimum viable product (MVP) phase without any custom code, cutting time-to-production by two weeks.

Solution architecture

The following diagram shows the end-to-end pipeline.
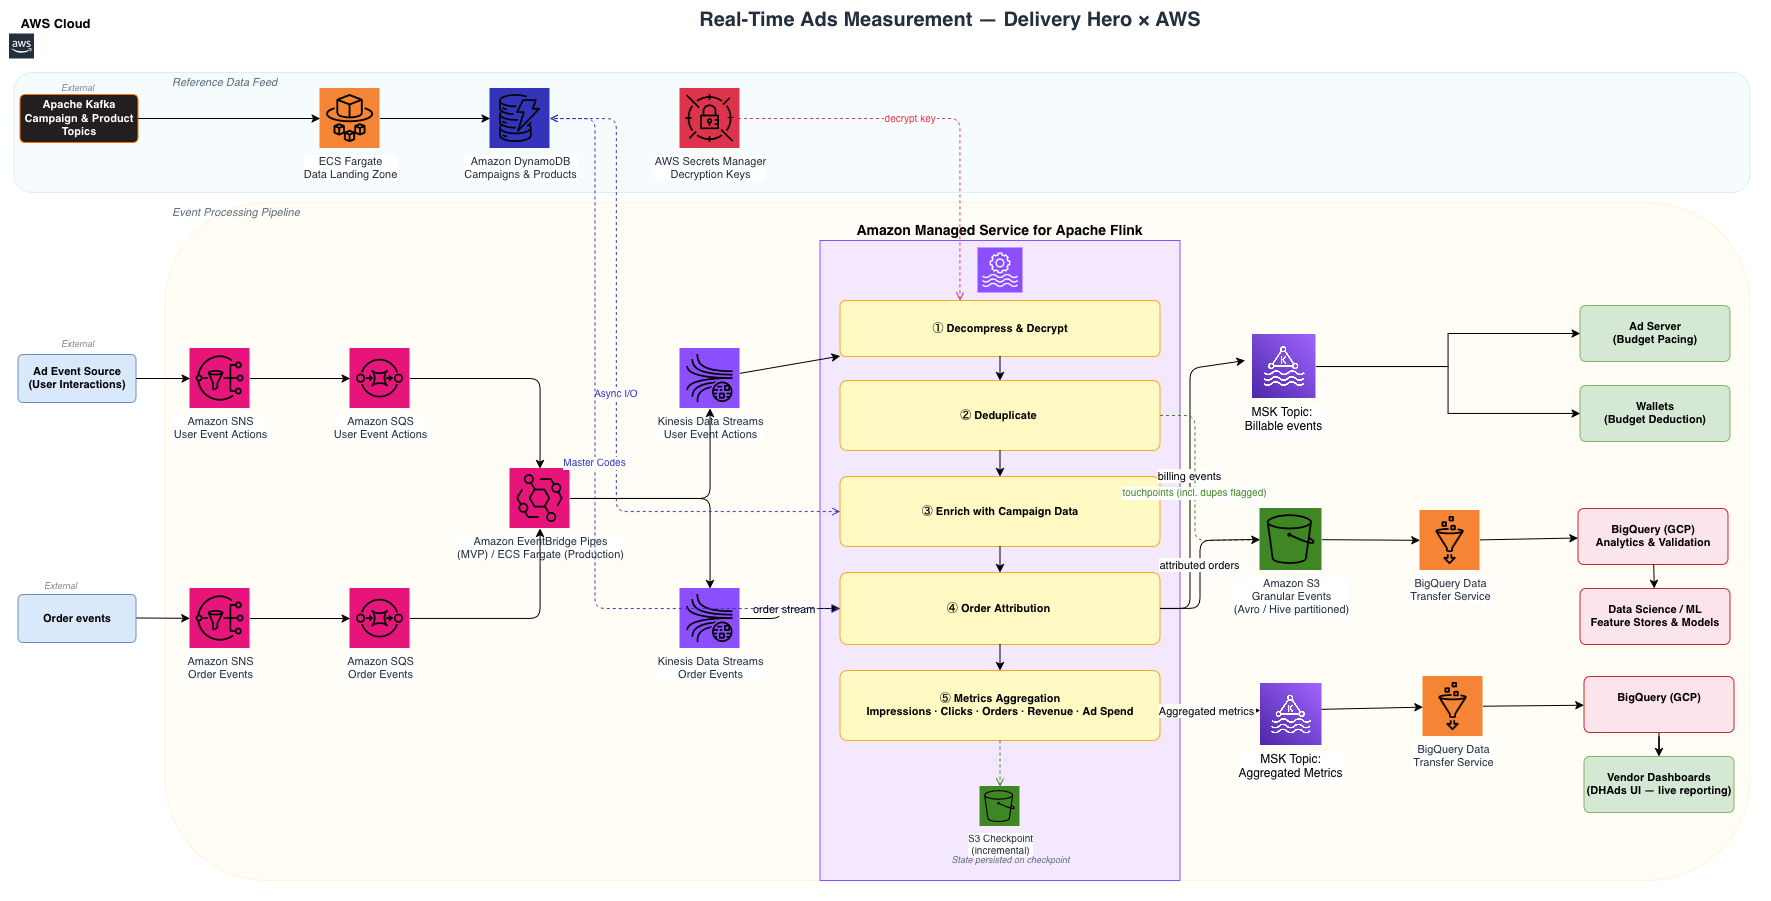
Architecture diagram. Two Amazon Simple Notification Service (Amazon SNS) topics receive user event actions and order events. Amazon SQS buffers them, and Amazon EventBridge Pipes or AWS Fargate forwards them into two Amazon Kinesis Data Streams. Amazon Managed Service for Apache Flink then decrypts, deduplicates, enriches from Amazon DynamoDB, attributes, and aggregates the events. It writes granular events and checkpoints to Amazon S3, aggregated metrics to the reporting database, and billing events to Apache Kafka topics consumed by the ad server and budget service.

Figure 1: End-to-end architecture of the real-time ad measurement pipeline

Two Amazon Simple Notification Service (Amazon SNS) topics ingest events: one receives user event actions (compressed, encrypted ad tokens containing campaign, vendor, and placement metadata), the other receives order events. Amazon SQS buffers both before Amazon EventBridge Pipes (MVP) or an AWS Fargate service (production) forwards them into Kinesis.

Amazon Managed Service for Apache Flink runs a five-stage Java pipeline:

  1. Decompress and decrypt. The pipeline decrypts the ad event token using keys from AWS Secrets Manager.
  2. Deduplicate. The pipeline keys events on a composite of entity, ad, event, and customer identifiers. Flink’s RocksDB state tracks seen events over a 30-hour window (approximately 20 GB of state), filtering duplicates while preserving them in Amazon S3 for audit.
  3. Enrich. Flink’s Async I/O API queries Amazon DynamoDB concurrently for campaign metadata and product master codes, populated continuously from upstream Kafka topics by an AWS Fargate consumer.
  4. Attribute. A multi-day keyed interval join matches user event actions to subsequent orders on entity, customer, vendor, and campaign dimensions (approximately 100 GB of state). This stage emits attributed orders to Amazon S3.
  5. Aggregate. The pipeline accumulates impression, click, order, revenue, and ad spend metrics in RocksDB state, then batch-upserts them to the reporting database every 5 minutes.

The pipeline emits billing events (cost per mille (CPM) impressions and valid cost per click (CPC) clicks) to Apache Kafka topics. The ad server and budget service consume those topics in real time. Flink checkpoints all state incrementally to Amazon S3, so the job restores from the last checkpoint after a failure. Kinesis Data Streams and the upstream sources deliver at-least-once, and the deduplication stage in step 2 drops any event replayed during recovery. Billing is therefore effectively exactly-once, even though the transport underneath it is at-least-once.

Results and impact

The redesigned architecture achieved quantifiable performance gains across data fidelity, processing throughput, and operational expenditure, while introducing capabilities that were not feasible under the legacy model.

Processing latency: From hourly windows to real time

The average gap between when an event was published and when it was recorded dropped from 61 minutes to 1.2 seconds. Budget pacing and aggregated metrics now reflect activity within seconds rather than the following hour. Downstream ad serving and budget pacing systems act on real-time signals instead of reconciling after the fact.

Cost efficiency

The migration reduced monthly operational costs by approximately 57 percent, which more than halves the annual run rate for the pipeline. The saving came alongside stronger reliability, not at its expense.

System reliability

Durable attribution window. The multi-day attribution window lives in RocksDB-backed keyed state, roughly 100 GB on local TaskManager disks, checkpointed incrementally to Amazon S3. Per-key lookups stay in the low-millisecond range regardless of state size, and a crash or shard rebalance restores state from the last checkpoint rather than triggering a reconciliation job.

Elasticity replacing fragility. Async I/O against DynamoDB removed the synchronous enrichment chain that previously gated every event. The pipeline sustains 20,000 messages per second at peak without back-pressure leaking into ad serving or billing, and enrichment scales independently of ingestion. Flash sales and seasonal surges no longer threaten upstream systems.

Replayable history. The pipeline persists every raw event to Amazon S3 in Avro format the moment it lands, and Kinesis Data Streams retains the source stream for up to 7 days. When a logic bug surfaces or a downstream contract changes, the team reprocesses the affected time range deterministically against the original inputs. There is no bespoke backfill job and no reconciliation against external systems. Past data is a first-class input, not a frozen artifact.

Data quality at the source

The following table compares the three data quality gaps before and after the migration.

Metric Before After
Missing session rate 30–40% 0%
Missing customer IDs 5% 0.8%
Missing impression timestamps 91% 0.2%

Downstream applications now receive fully enriched transactional and session context. Machine learning models use session-scoped features for campaign ranking, conversion-rate estimation, and anomaly detection. The pipeline now computes those features from a complete event stream, rather than one in which roughly a third of events were missing session context and 91 percent of impressions were missing a reliable timestamp.

What’s next

The pipeline described here is the first of several planned migrations to Amazon Managed Service for Apache Flink. The team is extending the same architecture to additional ad formats, and connecting real-time Flink aggregations directly to the ad serving layer for sub-second budget pacing. The real-time data layer built for measurement also serves as the foundation for AI-driven use cases. The team plans to explore live user interaction streams feeding personalization ranking models and grounded large language model (LLM) recommendations, which were impractical with batch-oriented infrastructure.

Conclusion

Delivery Hero’s migration to Amazon Managed Service for Apache Flink shows that effectively exactly-once billing, multi-day stateful attribution, and manageable operational complexity are not competing goals. The combination that made it work: Kinesis Data Streams for ingestion, DynamoDB for low-latency enrichment, Amazon S3 for event storage and checkpointing, and Amazon EventBridge Pipes for rapid MVP delivery. Together they produced a system that is more accurate, more resilient, and less expensive than the one it replaced. For advertising platforms where billing accuracy and attribution correctness are commercial imperatives, this architecture offers a replicable path from batch approximation to real-time measurement.

To get started with Apache Flink on AWS, see the Amazon Managed Service for Apache Flink Developer Guide.

Additional resources


About the authors

Kirill Tishenkov

Kirill Tishenkov

Kirill is a Senior Software Engineer at Delivery Hero specializing in distributed stream processing and large-scale state management.

Alexandru Pisarenco

Alexandru Pisarenco

Alexandru is a Senior Software Engineer at Delivery Hero focusing on real-time data pipelines, backfill strategies, and multi-market rollouts.

Upendra Kambhampati

Upendra Kambhampati

Upendra is an Engineering Manager at Delivery Hero leading the AdTech Data Engineering team.

Sabariesh Ganesan

Sabariesh Ganesan

Sabariesh is a Senior Engineering Manager at Delivery Hero responsible for the Vendor AdTech Data platform and Ads measurement domain.

Joseph Idicula Watasseril

Joseph Idicula Watasseril

Joseph (he/him) is a Senior Solutions Architect at AWS, based in Berlin. With over 15 years of experience in tech consulting and software development, Joseph works with Delivery Hero to apply cloud solutions to their business challenges.

Francisco Morillo

Francisco Morillo

Francisco is a Senior Streaming Solutions Architect at AWS, specializing in real-time analytics architectures. With over five years in the streaming data space, Francisco has worked as a data analyst for startups and as a big data engineer for consultancies, building streaming data pipelines. He has deep expertise in Amazon Managed Streaming for Apache Kafka (Amazon MSK) and Amazon Managed Service for Apache Flink.

How Cloudflare addressed a cross-tenant data exposure vulnerability in Containers

Post Syndicated from Rushil Mehra original https://blog.cloudflare.com/containers-cross-tenant-vulnerability/

On September 4, 2026, Oren Yomtov, a security researcher from Accomplish, responsibly reported a vulnerability affecting Cloudflare Containers and Cloudflare Sandboxes (which is built on Containers), through Cloudflare’s bug bounty program. Cloudflare has fully remediated the vulnerability, and we have no evidence that customer data has been compromised. 

This post was prepared in collaboration with Oren Yomtov and the Accomplish security research team, whose detailed report and controlled testing helped us validate the issue and respond quickly.

Cloudflare Containers run workloads on multi-tenant infrastructure and automatically assign them to eligible servers; customers cannot select the underlying host. The researchers demonstrated that a customer with a Workers Paid account could recover residual disk blocks previously used by Containers on the same host. The technique could not target a particular customer, workload, host, or data, and residual data was not guaranteed to be present.

Cloudflare applied a fix across the Containers fleet, with no customer-side configuration changes required. Within the historical disk-I/O telemetry available to us, we identified no evidence of malicious exploitation. Activity we could attribute to the reported technique came from the researchers and Cloudflare engineers conducting authorized validation.

Here, we explain the underlying storage behavior, its potential impact, our investigation, and the actions we took in response.

How container storage allocation works 

Cloudflare Containers use Linux device mapper thin provisioning (dm-thin) to provide each container with a writable root disk. Each container lives inside a dedicated virtual machine powered by the Firecracker virtual machine monitor. Firecracker presents this disk to the virtual machine as /dev/vdc.

Thin provisioning allocates physical storage only when a virtual disk writes to a previously unmapped region. The affected storage pools used a 64 KiB thin-block size. When the thin volume backing a container's root disk was deleted, its physical blocks were returned to a pool that served workloads belonging to multiple customer accounts.

The affected pool configuration included the following option:

skip_block_zeroing

With this option configured, dm-thin skips zeroing newly allocated blocks before making them accessible. Consequently, when a previously-used 64 KiB block was reassigned, a full-block write replaced its previous contents, but a smaller write changed only the written portion. The remainder could retain data from the block’s previous owner.

How the exploit worked

Reading an unmapped region of a new thin disk did not reveal residual data. For an unmapped region of the thin device, dm-thin returned zeroes without allocating a physical block.

The proof of concept identified 64 KiB-aligned regions corresponding to free space in the guest’s ext4 filesystem and wrote one aligned 4 KiB block into each region.

When such a write reached an unmapped thin block, dm-thin allocated a physical 64 KiB block from the shared pool. The 4 KiB write replaced only that portion of the block, and because block zeroing was disabled, the remaining 60 KiB could retain data from a previous container.

A subsequent raw-device read could therefore observe bytes that the new container had never written.

The proof of concept performed the following steps:

  1. Create a container using a Workers Paid account.
  2. Open the writable root disk at /dev/vdc.
  3. Read the disk and record a baseline.
  4. Write one 4 KiB block into each selected 64 KiB region corresponding to ext4 free space.
  5. Read the resulting blocks again.
  6. Examine only the portions not overwritten by the new container.

The submission included counts, block offsets, sizes, checksum results, and truncated hash prefixes. Although the researchers recovered raw blocks to validate the issue, the materials provided to Cloudflare contained no third-party filenames, identifiers, credentials, hostnames, addresses, or recovered content values. As described below, the researchers have also confirmed that they securely deleted the recovered data.

How the vulnerability was validated 

The researchers used ext4 directory block checksums to distinguish blocks belonging to their own test filesystem created for the proof of concept from blocks originating from other filesystems.

When ext4 uses the metadata_csum feature, directory block checksums incorporate values associated with the filesystem and inode. 

Across six production placements, the researchers reported:

  • All 5,614 testable directory blocks.
  • Zero of those blocks were attributed to the researchers’ filesystem. 
  • 2,700 distinct foreign directory inodes identified through checksum analysis.

To validate the method, the researchers tested it against blocks they had deliberately created and deleted in the controlled test filesystem used for the proof of concept. The method correctly attributed all 162 blocks to that filesystem.

The researchers ultimately observed residual material on 18 of 24 placements and 20 of 22 underlying nodes across four continents. The recovered block types included directory structures, database pages, and structurally complete SQLite databases. The researchers reported using scripts that output only aggregate counts and format checks, not recovered file contents. The materials submitted to Cloudflare contained no recovered content values or third-party identifiers. The researchers subsequently confirmed that recovered data under their control remained confidential and was securely deleted following submission, consistent with Cloudflare’s HackerOne disclosure policy.

Impact 

The vulnerability would potentially have allowed for a customer with a Workers Paid account to recover residual data from storage blocks previously used by other customers’ Containers on the same underlying host.

A successful exploitation would have crossed the tenant-isolation boundary and could disclose filesystem metadata, directory structures, database pages, and application data.

However, an attacker could not select a particular victim or access an actively attached disk. Exposure depended on Cloudflare’s workload placement and which previously released blocks dm-thin reassigned. Moreover, the researchers did not demonstrate modification of another customer’s active data or impact to workload availability.

How we mitigated the vulnerability

Our first mitigation was to remove skip_block_zeroing from the dm-thin pool configuration across the fleet. This restored dm-thin’s default behavior of clearing newly allocated blocks before exposing them to a container. It stopped the reported technique, in which a small write triggered allocation and a larger read recovered residual data from the remainder of the block. The researchers independently confirmed that their proof of concept no longer worked after this change.

Zeroing new allocations did not sanitize blocks already mapped into existing thin devices. These mappings existed in running container disks and in each host’s cache of prepared dm-thin snapshots for OCI image layers. A new container could inherit mappings from a cached layer without allocating those blocks again, allowing residual bytes in unused regions, including ext4 free space, to remain readable through raw reads of /dev/vdc.

We therefore also retired all running container disks and removed cached image snapshots created before the mitigation. We drained hosts during off-peak hours, restarted the VMs on each host, and cleared each host's image cache so that disks and cached layers were recreated using zeroed allocations. We have completed this cleanup across the Containers fleet.

No evidence of exploitation

As part of our response, we investigated whether other workloads showed activity consistent with the reported exploitation technique. We reviewed retained historical disk-I/O telemetry from our container infrastructure, using the researchers’ proof of concept and our internal reproduction as reference activity.

The proof of concept produced a characteristic relationship between writes and reads. When a 4 KiB write reached a previously unmapped region, it could trigger allocation of a reused 64 KiB storage block. With zeroing disabled, the remaining 60 KiB could retain data from a previous container. Subsequent reads could therefore recover substantially more data than the new container had overwritten.

Using these characteristics, we developed detection signatures and applied them to the historical telemetry available to us. We identified activity attributable to the researchers and Cloudflare engineers conducting authorized validation, and did not identify additional activity consistent with the reported technique.

We saw no evidence that this specific attack vector was exploited by anyone else.  

Cloudflare customers are protected

As we noted above, Cloudflare has patched this vulnerability and remediation does not require any further action by Cloudflare customers. In addition, we found no evidence of any malicious actor abusing this vulnerability.

Moving quickly with transparency 

We thank Oren Yomtov and the Accomplish security research team for their thorough research, responsible disclosure, and collaboration on this post. We encourage the Cloudflare community to submit any identified vulnerabilities to help us continually improve the security posture of our products and platform.

We also recognize that the trust you place in us is paramount to the success of your infrastructure on Cloudflare. We take these vulnerabilities very seriously and will continue to do everything in our power to mitigate impact. We deeply appreciate your continued support and trust in our platform, and remain committed not only to prioritizing security in all we do, but also acting swiftly and transparently whenever an issue arises.

Timeline

  • September 4, 15:26 UTC: Oren Yomtov from Accomplish reported the issue through HackerOne.
  • September 4, 18:45 UTC: Cloudflare opened a security incident and confirmed the production setup that caused the flaw.
  • September 4, 21:27 UTC: Cloudflare merged the runtime fix and its reuse test.
  • September 4, 22:03 UTC: Cloudflare merged the changes for new and live pools.
  • September 4, 23:15 UTC: Cloudflare started rolling out the changes.
  • September 7, 06:13 UTC: Cloudflare completed rolling out the changes and began clearing old pool data.
  • September 14, 10:50 UTC: The researchers reported that their proof of concept had stopped working.
  • September 14, 12:52 UTC: Cloudflare awarded the researcher a bounty.
  • September 19, 15:03 UTC: Cloudflare completed cleanup of all pre-mitigation cached snapshots across the affected fleet.

[$] Listening to the radio with Rust

Post Syndicated from daroc original https://lwn.net/Articles/1095721/

Many of the transmissions sent over the radio spectrum can
be decoded with a relatively cheap hardware dongle. Thomas Eckert presented at

RustConf 2026
in Montreal about his hobby:
decoding radio transmissions with Rust.
In his presentation, he
covered all of the math necessary to get started with

software-defined radio
,
and gave demonstrations of listening to AM and FM radio, as well as decoding
transmissions from
aircraft transponders. His slides and example code are

available
on GitHub.

Security updates for Thursday

Post Syndicated from jzb original https://lwn.net/Articles/1096407/

Security updates have been issued by AlmaLinux (buildah, containernetworking-plugins, firefox, kernel, kernel-rt, openexr, perl-DBI, podman, postgresql, postgresql16, postgresql:15, runc, skopeo, and tar), Debian (libdatetime-timezone-perl, tzdata, xdg-dbus-proxy, and znc), Fedora (chromium, evolution, evolution-data-server, evolution-ews, kernel, libheif, mingw-pcre2, nginx-mod-modsecurity, unbound, and webkitgtk), Mageia (borgbackup, coreutils, firefox, nss, kbd, libnfs, libwebsockets, perl-URI, pipewire, and xdg-dbus-proxy), Oracle (apr-util, containernetworking-plugins, coreutils, curl, firefox, freerdp, gstreamer1-plugins-base, host-metering, libarchive, libtiff, libxml2, openexr, openssh, perl-DBI, podman, postgresql16, postgresql18-postgis, postgresql:15, rsyslog, runc, tar, and unbound), SUSE (apptainer, gimp, librepods, libX11-6, perl-Authen-SASL, podofo, python-WebOb, and python313-graphifyy), and Ubuntu (imagemagick, libgit2, moodle, network-manager, Open-iSNS, python-urllib3, sqlparse, and xdg-desktop-portal).

When Business Email Compromise Starts Rewriting Reality

Post Syndicated from Douglas McKee, Director, Vulnerability Intelligence original https://www.rapid7.com/blog/post/ve-business-email-compromise-rewriting-reality-zimbra-cve

Business Email Compromise (BEC) operates on a familiar playbook. Threat actors breach a mailbox, silently monitor operations, map approval chains, and ultimately exploit that access to divert funds or exfiltrate sensitive assets.

This dynamic is central to our analysis as we kick off a series around Rapid7’s collaborative research with Zimbra; upcoming installments will explore technical details and broader findings based within the Zimbra Collaboration Suite. Our investigation disrupted the traditional BEC model in unexpected ways. We uncovered over 50 vulnerabilities, and found that several allow attackers not just to observe environments, but to actively rewrite them by impersonating senders without credentials, controlling inbox visibility, and altering shared documents and calendars.

Business Email Compromise in action: Digital abuse of trust

None of this is theoretical for Zimbra. But don’t take my word for it, just ask Russia. CISA keeps putting Zimbra bugs into the Known Exploited Vulnerabilities catalog, and the last three years make the point on their own:

  • CVE-2024-45519, command injection in the postjournal service, unauthenticated command execution. Proofpoint saw attackers stuffing base64 payloads into CC fields on September 28, 2024. CISA added it to KEV on October 3.

  • CVE-2025-27915, stored XSS in the Classic Web Client, triggered by a crafted .ICS attachment. It is used as a zero-day against Brazilian military targets to steal mail and quietly set forwarding filters. It went into KEV in October, 2025.

  • CVE-2026-73570, unauthenticated command injection through SNMP notification handling. CISA added it on August 21 of this year and gave federal agencies three days. Shadowserver has been counting somewhere north of 260 compromised instances while hunting for exploitation artifacts.

Go back further and the pattern holds. Rapid7 tracked widespread exploitation of CVE-2022-27925 and CVE-2022-37042 in 2022, a path traversal chained with an authentication bypass that let attackers drop a JSP shell on a Zimbra server without credentials. Google’s Threat Analysis Group later documented four separate threat groups working the same zero-day known as CVE-2023-37580. Each of these groups went after email, credentials, and authentication tokens. Attackers figured out a long time ago that the system sitting in the middle of everyone’s communication is worth the effort. So when you find a set of bugs that let you write to that system instead of only reading from it, data theft stops being the interesting part.

Send an email as your CFO without ever touching their password, and you have the front half of a very convincing BEC. Keep control of the mailbox afterward and you have the back half, too. Here, the attacker has a strategic choice. They can delete the sent message to hide their tracks, effectively wiping the trail of the fraud OR they can choose to leave the message in the Sent Items folder. By doing so, they ensure the CFO sees ‘evidence’ of the email they supposedly sent, creating a gaslighting scenario where the victim is left questioning their own actions. Whether the attacker cleans up or leaves the trail, they are shaping the organization’s perception of reality. In the ensuing investigation, where Finance sees a sent request and the CFO sees no such activity, the organization is trapped in a conflict of evidence. At that point, BEC looks less like traditional fraud and more like a psychological operation.

Documents make it worse, as Zimbra is not just a mail server. The collaboration side holds the files employees actually use to make decisions. An attacker who can plant a fake HR memo or financial summary in an executive’s enterprise drive, and make it look like it came from a peer they trust, is starting from a much better position than someone attaching a PDF to a cold email.

Say a document shows up from HR about a confidential restructuring, and a few days later an email from a trusted executive references it. Neither piece has to carry the whole deception, as each one props up the other.

Calendar warfare and manufactured enterprise reality

Then there is the thing I have started calling ‘calendar warfare.’ Meetings can be modified or deleted without generating the notification trail users expect to see. RSVP status can also be flipped. Maybe a key executive is changed from Accepted to Declined and leadership might reschedule, or move ahead without them, or read the whole thing as a deliberate opt-out.

It works in the other direction too. An “Emergency Board Meeting” lands on an executive’s calendar with a believable organizer, a popup reminder, and a malicious Zoom link. When the reminder fires, the victim is not sizing up a suspicious email that arrived thirty seconds ago. They are joining a meeting that has been sitting in their calendar for two days. And the calendar is not some exotic attack surface nobody has thought of. If we look back at CVE-2025-27915, the delivery vehicle was a calendar invite.

Stack all of it together now – a financial document appears, a trusted executive emails about it, then a mandatory meeting shows up to discuss it. And the attacker still has the ability to clean up some of what gets left behind. Every artifact the victim checks lives inside a system they have no reason to question, and all of them tell the same fabricated story.

I keep coming back to the phrase ‘manufactured enterprise reality‘. I have touched on the idea in The Monday Brief, that attackers get to borrow whatever trust an organization has already extended to its own tooling. Zimbra makes it concrete. The platform supplies the credibility, so the attacker does not have to build any.

Collaboration suites quietly became systems of record. Email is the record of who said what. Calendars are the record of who agreed to be where. Classic BEC abuses the trust between two people. The scenario we’ve discussed here abuses the machinery those people use to decide who to trust in the first place. Once employees are making real business decisions off fabricated context, stealing data is the least of your problems.

ICYMI: August 2026 @AWS Security

Post Syndicated from Rodolfo Brenes original https://aws.amazon.com/blogs/security/icymi-august-2026-aws-security/

Read all about the latest AWS security features, compliance updates, and hands-on resources in our monthly digest posts. You’ll find expert blog posts, new service capabilities, code samples, and workshops.

AWS Security Blog posts

August brought 20 AWS Security Blog posts organized across seven categories. Identity and access management led the month with five posts covering self-service rate limits for Amazon Cognito, a decade of AWS Managed Microsoft AD, a redesigned sign-in experience, console Private Access for isolated VPCs, and automated IAM Identity Center governance. Data protection followed with four posts on AWS KMS data key caching, ACME protocol support in AWS Certificate Manager, Amazon S3 over-permissioned access remediation, and the upcoming deprecation of email-based domain validation. AI security continued to grow with four posts on custom authentication in Amazon Bedrock AgentCore Gateway, user authorization propagation in AI agents, and extending Bedrock Guardrails to tool interactions. Threat detection, governance and networking.

Identity

From 2 weeks to 2 minutes: Amazon Cognito launches provisioned limits for self-service rate limit management

Authors: Kiran Dongara, Howie Li | Published: August 5, 2026

Learn to use Amazon Cognito provisioned limits for on-demand authentication rate limit adjustments, replacing the previous 10–14 day support ticket process with self-service capacity scaling in minutes.

A decade of enterprise identity in the cloud with AWS Managed Microsoft AD

Authors: Vladimir Provorov, Tekena Orugbani, Rodney Underkoffler | Published: August 7, 2026

AWS Managed Microsoft AD celebrates 10 years of fully managed Active Directory in the cloud, now offering Standard, Enterprise, and Hybrid editions with multi-Region replication and 20+ AWS service integrations.

Updates to your AWS sign-in experience

Authors: Vaibhav Chowla, Ella Segura | Published: August 17, 2026

AWS is gradually rolling out a redesigned sign-in page with a unified email entry point, social identity provider options, and an updated session selection experience for managing multiple active sessions.

Extend your data perimeter to the AWS Management Console with Private Access

Authors: Madhur Kulkarni, Abhijit Barde, Sujay Ghosh, Mateusz Jaworski | Published: August 28, 2026

AWS Management Console Private Access now supports VPCs without internet connectivity, routing all console traffic – authentication, static assets, and service API calls – through AWS PrivateLink endpoints to strengthen your data perimeter.

Automate IAM Identity Center governance with continuous discovery and reporting

Author: Jonathan Nguyen | Published: August 31, 2026

Learn to deploy automated discovery and reporting for AWS IAM Identity Center applications and assignments across your organization, with event-driven monitoring that validates naming conventions and enables near real-time enforcement of governance policies.

Data Protection

Caching KMS data keys in multi-thread environments: per-tenant encryption for event-driven systems at scale

Authors: Maria Gutovsky, Hemmy Yona | Published: August 6, 2026

Learn to solve the cache stampede problem in multi-tenant envelope encryption using the AWS-recommended hierarchical keyring pattern or a custom Caffeine-based caching approach to reduce AWS KMS costs.

Automate certificates with ACME support in AWS Certificate Manager

Authors: Anthony Harvey, Chandan Kundapur | Published: August 6, 2026

Learn to use ACME protocol support in AWS Certificate Manager to automate public certificate issuance and renewal using standard clients like Certbot and cert-manager, with enterprise controls for domain scoping and centralized visibility.

Securing your Amazon S3 buckets: identifying and remediating over-permissioned access

Authors: Hetal Kolekar, Fernando Chiera di Vasco Freitas, Manonmayi Vedam | Published: August 7, 2026

Learn to detect and fix over-permissioned Amazon S3 buckets across multi-account environments using AWS Lambda, AWS Config, and AWS Security Hub, with automation for continuous monitoring.

AWS Certificate Manager will discontinue email validation to prove domain validation for certificates

Authors: Adam Aboudi, Poojil Tripathi | Published: August 13, 2026

ACM will discontinue email-validated public certificates by September 30, 2027, aligning with CA/B Forum standards – learn the timeline and how to migrate to DNS validation in place.

AI Security

Implement custom authentication for tools integration using request Lambda interceptor in AgentCore Gateway

Authors: Nishant Mainro, Ram Ramani | Published: August 18, 2026

Learn to use a request Lambda interceptor in Amazon Bedrock AgentCore Gateway to bridge legacy authentication mechanisms like Basic Auth, isolating credentials from AI agents using AWS Secrets Manager.

Propagate user authorization context in AI agents with Amazon Bedrock AgentCore

Authors: Anshu Bathla, Prafful Gupta, Rohit Verma | Published: August 19, 2026

Learn to enforce least-privilege access in AI agents by propagating user identity through Amazon Bedrock AgentCore to Amazon DynamoDB, Knowledge Bases, and Salesforce, without embedding authorization logic in agent code.

Extend Amazon Bedrock Guardrails to tool interactions using the Strands Agents SDK

Authors: Stephan Traub | Published: August 27, 2026

Learn to extend Amazon Bedrock Guardrails beyond the model boundary to tool calls, external data, and MCP server interactions using three validation checkpoints built with Strands Agents SDK lifecycle hooks.

Threat detection and incident response

Security Hub Extended adds supply chain security as its tenth category

Author: Michael Fuller | Published: August 18, 2026

AWS Security Hub Extended now includes supply chain security with Chainguard and Socket as curated partners, helping you verify open source dependencies and block malicious packages through a single AWS billing relationship.

Detecting multi-stage attacks on AWS: a guide to cross-service signal correlation

Authors: Nisha Kashyap | Published: August 26, 2026

Learn to correlate signals across AWS CloudTrail, VPC Flow Logs, and Route 53 Resolver logs to detect multi-stage attacks by layering your business context, data classification, access norms, and change windows – on top of Amazon GuardDuty Extended Threat Detection.

AWS partners with Anthropic and OpenAI to bring AWS Continuum into developer workflows

Author: Chet Kapoor | Published: August 5, 2026

AWS Continuum for code vulnerabilities now integrates with Anthropic Claude Code, OpenAI Codex, and Kiro, enabling developers to discover, prioritize, validate, and remediate vulnerabilities within their coding environments.

We invited a direct competitor into Security Hub Extended. Here’s why.

Authors: Michael Fuller | Published: August 31, 2026

AWS Security Hub Extended now includes Upwind, a runtime-first cloud security company, offering eBPF-based workload protection with pay-as-you-go pricing through a single AWS bill, reinforcing customer choice even where capabilities overlap with AWS offerings.

Infrastructure security

AWS Network Firewall now supports rule hit count

Authors: Preetkumar Shah, Amit Gaur, Cheriyan Mundapuzha, Santosh Shanbhag, Srivalsan Mannoor Sudhagar | Published: August 20, 2026

AWS Network Firewall now tracks how often stateful rules match traffic, helping you identify unused rules, validate security controls for compliance, and accelerate incident response at no additional cost.

Governance and compliance

Landing Zone Accelerator independent assessment report for C5:2020 now available on AWS Artifact

Authors: Kevin Donohue, Michael Wahlers | Published: August 11, 2026

An independent assessment by Schellman evaluates how Landing Zone Accelerator on AWS aligns to C5:2020 requirements, implementing 325 security controls to accelerate your compliance journey.

Fast track ISM-ready cloud environments and IRAP assessments with Landing Zone Accelerator on AWS

Authors: Kevin Donohue, Dave Connell, Dan Friebe | Published: August 25, 2026

A new independent assessment by gwi.digital evaluates Landing Zone Accelerator against 1,081 ISM controls, achieving 91% coverage of addressable scope to help Australian customers accelerate IRAP assessment readiness.

How Moeve scales AWS governance with automated AWS Organization Service Control Policies

Authors: Gonzalo Guerrero, Jonatan De Martín, Rayco Martinez | Published: August 26, 2026

Learn how Moeve manages 150 SCPs across 300+ accounts in three AWS Organizations using a governance-as-code model; policies live in Git, deploy through GitHub Actions pipelines, and attach dynamically based on account metadata during onboarding, with Amazon EventBridge and AWS Lambda providing real-time observability of every organizational change.

August Security Bulletins

In August 2026, AWS published 23 security bulletins addressing vulnerabilities across open-source SDKs, MCP servers, developer tools, and the OpenSearch ecosystem. A dominant theme was the AI agent tool surface: prompt-injection consent bypasses in Strands Agents Tools enabled command and code execution, an insecure direct object reference exposed cross-tenant agent memory, and credential disclosure and authorization flaws affected the Amazon MQ, DocumentDB, and AWS Transform MCP servers and the Bedrock AgentCore harness. Remote code execution recurred throughout, from prototype pollution and Java deserialization in OpenSearch to path-traversal-to-root in amazon-ssm-agent, Zip Slip in awsdac, and an uncontrolled search path in the Kiro IDE and CLI on Windows.

Other notable issues include disabled SSH host key verification in the AWS CLI, memory-safety flaws in the AWS SDK for C++, privilege escalation in the FreeRTOS-Kernel, and memory-amplification denial of service in Amazon ion-java. OpenSearch accounted for a large share of the month, spanning authorization, input validation, SSRF, stored XSS, and denial of service, while Athena Federated Query connectors exposed Secrets Manager secrets. A common thread: insufficient authorization and input validation at the boundary between AI agents and the systems they reach. All patches are available, upgrade promptly. For more information, see AWS Security Bulletins.

AWS Samples

In August 2026, we published 17 new code samples organized into five categories: governance and compliance (7), AI security (3), data protection and privacy (3), identity and access management (2), and infrastructure security (2). This month’s collection reflects the rapid growth of agentic AI workloads: most samples focus on governing, auditing, and securing AI agents built on Amazon Bedrock AgentCore, from platform-level governance and telemetry to fraud investigation and biosecurity screening.

Governance and compliance

Agentic Governance Platform

Learn to deploy an AWS-native control plane for governing AI agents across your enterprise with centralized registry, Microsoft Entra ID single sign-on, Cedar tool policies, multi-vendor agent inventory, and Langfuse observability, all self-hosted on Amazon Bedrock AgentCore.

Enterprise Agentic AI Platform Accelerator

Learn to deploy a secure, governed foundation for production AI agents on Amazon Bedrock AgentCore with modular CDK stacks covering identity, gateway, memory, runtime, and observability; supporting Strands Agents, LangGraph, and Claude Agent SDK with opt-in security controls.

Video Compliance Agent

Learn to deploy an end-to-end pipeline that automatically verifies video content against broadcast compliance guidelines such as Ofcom; extracting frames, audio transcripts, and OCR text shot by shot, then using Amazon Bedrock to flag potential violations and produce a structured per-shot compliance report.

Intelligent Security for Healthcare APIs

Learn to add behavioral anomaly detection, automated data sensitivity classification, and HIPAA compliance reporting to your FHIR API using Amazon Bedrock; running asynchronously so clinical workflows are never blocked, with Amazon Comprehend Medical and Bedrock Guardrails anonymizing PHI throughout the monitoring path.

Governed Agentic Companion

Learn to deploy a governed, orchestrator-driven multi-agent builder companion on Amazon Bedrock AgentCore, reachable from Kiro, Claude Code, or any MCP client; the kit enforces 13 codified tenets through an always-on governance gate with no off switch, routing each request to a specialist while blocking deploys, secret leaks, and ungrounded answers by construction.

Audit the Agent

Learn to deploy a serverless daily executive audit pipeline for AWS AI agents (AWS DevOps Agent, AWS Security Agent) using AWS Step Functions and AWS Lambda; the report answers five questions: what the agent accessed, who authorized it, what it cost, its risk posture across five trust dimensions, and whether you should be concerned, all sourced deterministically from AWS CloudTrail, CUR, and IAM with AI-generated summaries bounded by layered guardrails.

AI Security

Telemetry Enablement for AgentCore CloudFormation

Learn to deploy a single AWS CloudFormation stack that enables Amazon CloudWatch logs and X-Ray traces for every Amazon Bedrock AgentCore resource type – Runtime, Gateway, Memory, Browser, CodeInterpreter, and WorkloadIdentity – using native and custom telemetry rules.

Bedrock Guardrails to OCSF on CloudWatch

Learn to transform Amazon Bedrock Guardrails intervention events into OCSF Detection Finding records and land them in the Amazon CloudWatch unified data store; enabling you to query guardrail violations alongside AWS CloudTrail, Amazon VPC Flow Logs, and other sources with Amazon Athena or CloudWatch Logs Insights.

Bedrock Readiness Agent

Learn to deploy a read-only assessment agent built with the Strands Agents SDK that evaluates your Amazon Bedrock environment across six dimensions: IAM governance, data retention, quota headroom, model selection fitness, cost projection, and operational observability; generating severity-rated findings with AWS CloudFormation and Terraform remediation templates you can apply directly.

Infrastructure security

DDoS Guardian

Learn to install an agent skill that reviews an AWS WAF web ACL as a system: evaluation order, rule interactions, and L7 DDoS posture; then delivers a severity-ranked HTML report with ready-to-apply remediation. Offline, read-only, no AWS resources modified.

Biosecurity Screening Policy on Amazon Bedrock AgentCore Gateway

Learn to use Policy in Amazon Bedrock AgentCore to deterministically screen AI agent tool requests for biosecurity risks, combining Cedar policies with three independent screening layers: MMseqs2 sequence alignment, ESMC-600M embedding similarity, and Foldseek structural homology; enabling defense-in-depth controls that block high-risk protein sequences before they reach downstream tools.

MCP Fraud Investigation Agent

Learn to deploy an end-to-end AI-powered e-commerce fraud investigation agent built with the Strands SDK on Amazon Bedrock AgentCore, connecting through an AgentCore Gateway over MCP to query transaction history, customer profiles, login activity, support cases, and fraud playbooks; a React dashboard on AWS Amplifystreams the agent’s reasoning token by token as it works each case.

Identity

IAM Account Access Manager with ABAC

Learn to implement workforce access using IAM account access manager and attribute-based access control, where one IAM role per project shares a single policy document and access decisions are made by comparing role tags against resource tags at request time; onboarding a new project requires only tagging and entitlement configuration with no policy authoring.

Operationalizing Least Privilege: Automate IAM Remediation through Your CI/CD Pipeline

Learn to automate remediation of unused IAM permissions using AWS IAM Access Analyzer, AWS CloudTrail, and Amazon Bedrock for AI-generated AWS CDK code; the solution attributes each role to its origin (IaC or manual), then creates pull requests for IaC-managed roles or issues for manually created roles in GitLab or GitHub, with configurable exclusion rules and policy diffs for human review.

Data Protection

Data Residency Chatbot with Amazon Bedrock AgentCore

Learn to deploy a data-residency-compliant natural-language chatbot on Amazon Bedrock AgentCore where all data and AI inference stay within a single AWS Region; the solution uses a Strands agent that answers plain-English questions from Aurora PostgreSQL through governed, whitelist-validated read-only tools exposed via an AgentCore Gateway, with a residency guard that rejects any cross-region inference profile, demonstrated with a rooftop-solar subsidy program and adaptable to any sector or geography.

LLM-based PII Detection

Learn to detect personally identifiable information in conversational text using Amazon Bedrock; the solution prompts any Converse-compatible model to return PII spans with category, value, and character offsets, handles long inputs via word-boundary chunking, recovers near-miss labels, and supports custom categories, few-shot examples, and pluggable backends beyond Bedrock.

Agentic Data Classification and Redaction

Learn to build a conversational AI research assistant that automatically classifies documents for MNPI, PII, and security sensitivity, then enforces per-user redaction at query time using Amazon Bedrock AgentCore, Guardrails, and Amazon OpenSearch Serverless vector search.

Conclusion

August 2026 provides comprehensive guidance and runnable code for governing agentic AI workloads at enterprise scale, from orchestrator-driven governance gates and biosecurity screening policies to daily executive audit pipelines and OCSF-normalized guardrail telemetry. The posts and samples provide patterns for console Private Access in isolated VPCs, attribute-based access control with IAM account access manager, automated least-privilege remediation through CI/CD, and cross-service signal correlation for multi-stage threat detection. Each resource includes deployment steps or runnable code so you can validate in your own environment before adopting. Subscribe to the AWS Security Blog RSS feed to receive updates as they publish, and revisit this digest monthly for a consolidated view of what changed and what to act on.

If you have feedback about this post, submit comments in the Comments section below.


Rodolfo Brenes

Rodolfo Brenes

Rodolfo is a Principal Solutions Architect focused on Cloud Governance and Compliance. With over 18 years of experience, he currently leads a technical field community in AWS helping customers scale and improve their security and governance frameworks. Besides work, Rodolfo enjoys video games, playing with his four cats, and won’t say no to a good outdoor adventure.

Anna Brinkmann

Anna has 18 years of experience in the technical content space and has spent the last 6 years managing the AWS Security Blog. Outside of work, she enjoys spending time with her family.

Configure domain-level VPC networking in Amazon SageMaker Unified Studio

Post Syndicated from Prasad Nadig original https://aws.amazon.com/blogs/big-data/configure-domain-level-vpc-networking-in-amazon-sagemaker-unified-studio/

Enterprise operations teams that run domain-level VPC networking in Amazon SageMaker Unified Studio often support dozens of projects spanning data engineering, analytics, and machine learning (ML) teams. Each project requires private connectivity to internal databases, Amazon Simple Storage Service (Amazon S3) buckets, and AWS services. Without a domain-level Amazon Virtual Private Cloud (Amazon VPC) configuration, project owners coordinate with the networking team individually. This piecemeal approach leads to inconsistent subnet choices, missing VPC endpoints, connectivity failures that are hard to troubleshoot, and a network posture that is difficult to audit.

With domain-level VPC networking, you configure the network once, and all new projects get the right network immediately upon creation. In this post, you learn how to:

  • Configure SageMaker Unified Studio domain-level VPC networking.
  • Select subnets and security groups that provide multi-Availability Zone (multi-AZ) resilience.
  • Update projects that have no VPC to inherit the domain VPC, and understand when a project must be recreated instead.
  • Validate network connectivity from within a project.

In this post, you learn how to configure VPC networking for a SageMaker Unified Studio domain that uses AWS Identity and Access Management (IAM)-based authentication. You see how network components map to domain and project resources, and how to plan a configuration that balances security, connectivity, and operational simplicity.

Solution overview

Domain-level VPC networking provides a single network configuration that applies to all new projects in the domain. Projects automatically inherit the VPC settings, including subnets, security groups, and connectivity to AWS services through VPC endpoints. Existing projects are an exception and are handled separately (see Step 3).

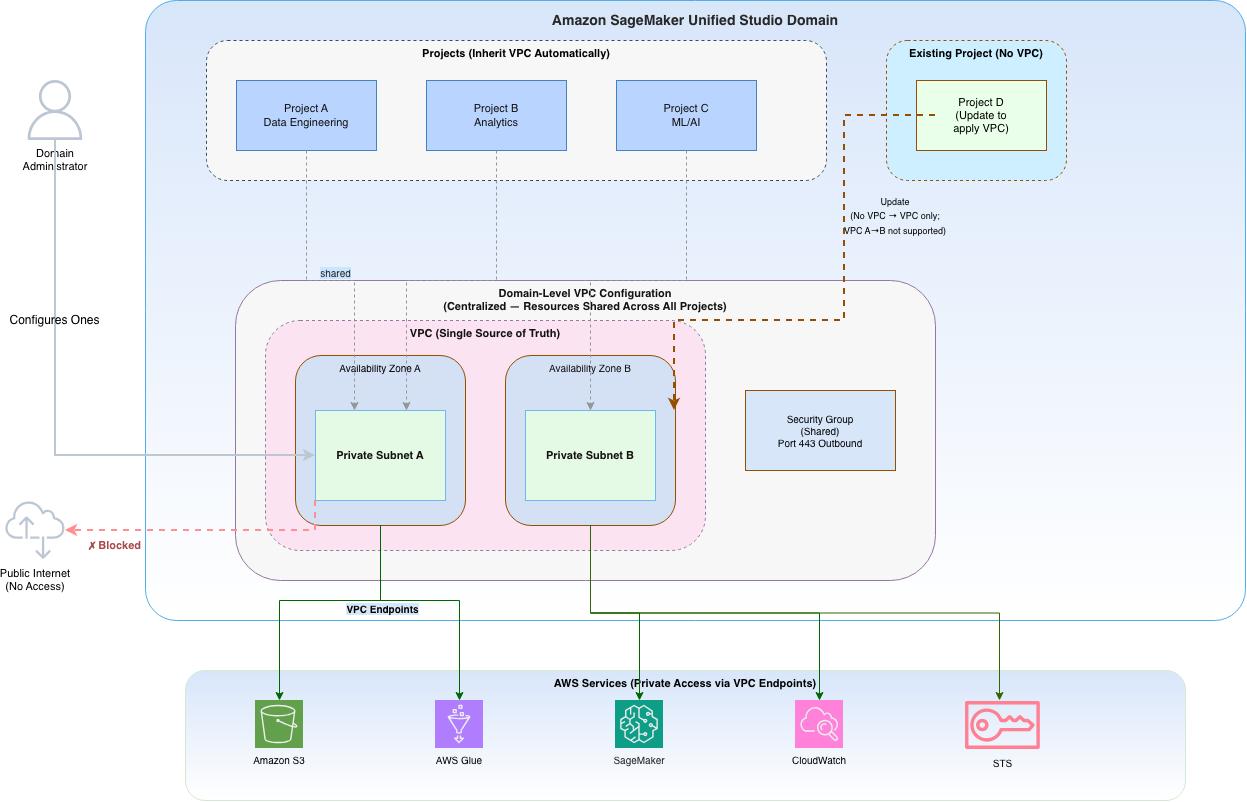
The following diagram shows a single VPC with private subnets across two Availability Zones configured at the domain level, with data engineering, analytics, and ML projects all inheriting that configuration.

Architecture diagram showing domain-level VPC configuration in Amazon SageMaker Unified Studio with private subnets across two Availability Zones.

Figure 1: Domain-level VPC configuration in Amazon SageMaker Unified Studio. A single VPC with private subnets across two Availability Zones is configured at the domain level. All projects (data engineering, analytics, ML) inherit this configuration automatically

Key benefits of this approach:

  • Configure once, apply across projects: New projects inherit the domain VPC without manual intervention.
  • Consistent security posture: A single network boundary covers all data, analytics, and ML workloads.
  • Simplified auditing: One VPC to audit rather than one per project. Turn on VPC Flow Logs and review AWS CloudTrail events for network-level auditing.
  • Reduced operational overhead: Project teams start working immediately without submitting networking requests.

The following AWS services are used in this solution:

Prerequisites

Before configuring domain-level VPC networking, verify you have the following:

  • Domain administrator permissions for Amazon SageMaker Unified Studio.
  • An existing VPC with the following requirements:
    • At least two private subnets in different Availability Zones.
    • DNS hostnames and DNS support enabled.
    • At least five available IP addresses per expected Amazon SageMaker Unified Studio project. This is a baseline minimum. Workloads using AWS Glue, Amazon EMR, or Amazon Redshift Serverless consume additional elastic network interfaces (ENIs) per worker or node. We recommend /24 or larger subnets for production domains and forward-looking capacity planning based on your expected users and compute types. For detailed guidance, see How to set up a network-isolated VPC for Amazon SageMaker Unified Studio.
  • VPC endpoints configured for the AWS services your projects access (for example, Amazon S3, AWS Glue, Amazon SageMaker AI).
  • Private DNS enabled on all interface VPC endpoints (you must enable this so that service DNS names resolve to private IPs). If you use centralized VPC endpoints through AWS Resource Access Manager (AWS RAM) or AWS Transit Gateway, configure Amazon Route 53 Resolver inbound endpoints instead.
  • S3 gateway endpoint route table associations configured for all selected private subnets (without this, S3 access fails in subnets whose route table lacks the prefix-list route).
  • A security group (optional), if not provided, SageMaker Unified Studio creates one automatically.
  • The SageMakerStudioAdminIAMConsolePolicy managed policy (or equivalent permissions including ec2:Describe*, ec2:CreateSecurityGroup, and datazone:* actions) attached to the domain administrator IAM role. See SageMakerStudioAdminIAMConsolePolicy in the AWS Managed Policy Reference for the full permission set.

Note: The VPC must be in the same AWS Region as the domain.

For detailed guidance on VPC networking configuration, see Configure VPC networking for IAM-based domains in the SageMaker Unified Studio Administrator Guide.

VPC endpoint requirements

Because your subnets are private (no internet gateway route), compute resources access AWS services through VPC endpoints. At a minimum, configure the following interface and gateway endpoints (add Amazon Athena, AWS Lake Formation, or Amazon Redshift endpoints if you use them in your projects):

Endpoint Type Purpose
com.amazonaws.region.s3 Gateway S3 access for data storage
com.amazonaws.region.glue Interface AWS Glue job connectivity
com.amazonaws.region.sagemaker.api Interface SageMaker API calls
com.amazonaws.region.sagemaker.runtime Interface Model inference
com.amazonaws.region.logs Interface Amazon CloudWatch Logs
com.amazonaws.region.monitoring Interface Amazon CloudWatch metrics
com.amazonaws.region.sts Interface IAM role assumption
com.amazonaws.region.datazone Interface Amazon SageMaker Unified Studio service connectivity
com.amazonaws.region.ecr.api Interface ECR API calls (container image metadata)
com.amazonaws.region.ecr.dkr Interface ECR image layer pulls (Docker registry)
com.amazonaws.region.kms Interface AWS Key Management Service (AWS KMS) encryption/decryption operations

Note: Interface endpoints incur an hourly charge per Availability Zone plus data processing fees. Gateway endpoints (such as S3) have no hourly charge. Factor endpoint count and AZ spread into your cost estimate.

For a comprehensive list of all mandatory and optional VPC endpoints for a fully network-isolated setup, see How to set up a network-isolated VPC for Amazon SageMaker Unified Studio. For current pricing details, see AWS PrivateLink pricing.

Note: Review your account’s service quotas for interface VPC endpoints per VPC (default 50) and ENIs per Region before scaling. Request increases through Service Quotas if needed.

Solution walkthrough

The following steps walk you through configuring the domain VPC and validating it, from signing in to the console through confirming private connectivity from a project.

Step 1: Sign in and navigate to networking settings

  1. Sign in to the AWS Management Console as your Amazon SageMaker Unified Studio domain administrator (the IAM role designated as the domain login role).
  2. Open the Amazon SageMaker console.
  3. Use the Region selector in the top navigation bar to select the Region where your domain exists.
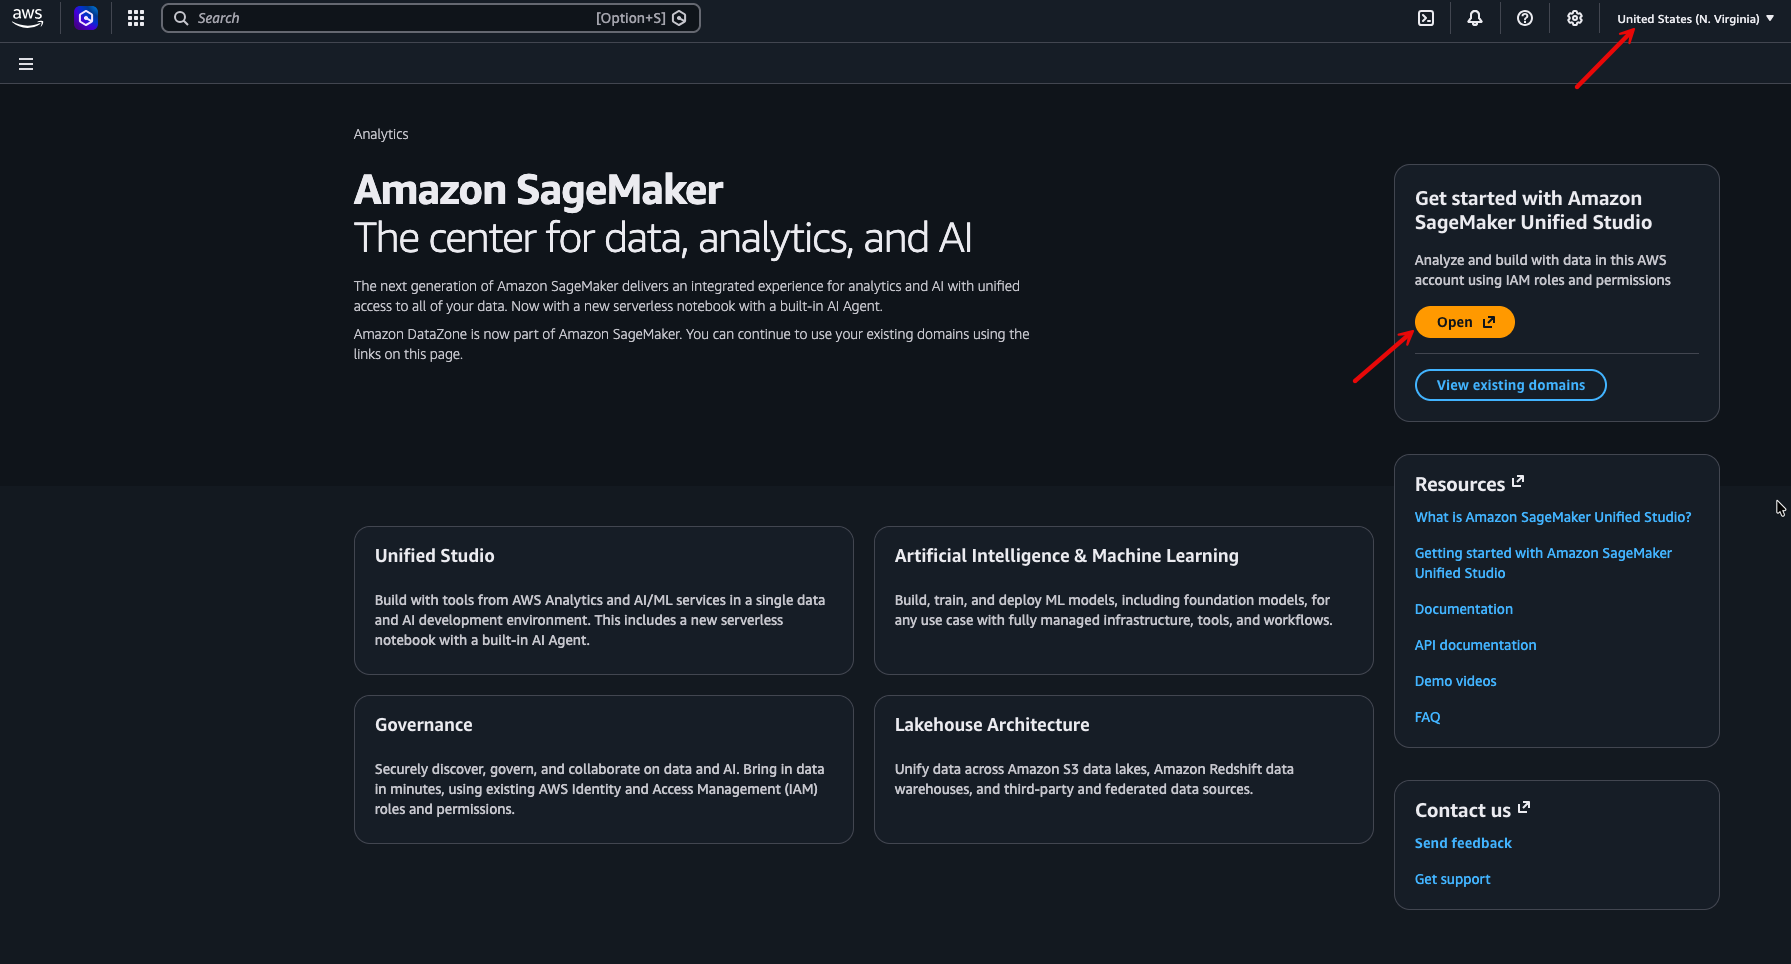
  4. On the Amazon SageMaker Unified Studio landing page, choose Open to launch your IAM-based domain.

The following screenshot shows the Amazon SageMaker Unified Studio landing page, where you choose Open to launch the domain.

Amazon SageMaker Unified Studio landing page with the Open button to launch the IAM-based domain.

Figure 2: Amazon SageMaker Unified Studio landing page with the Open button to launch the IAM-based domain

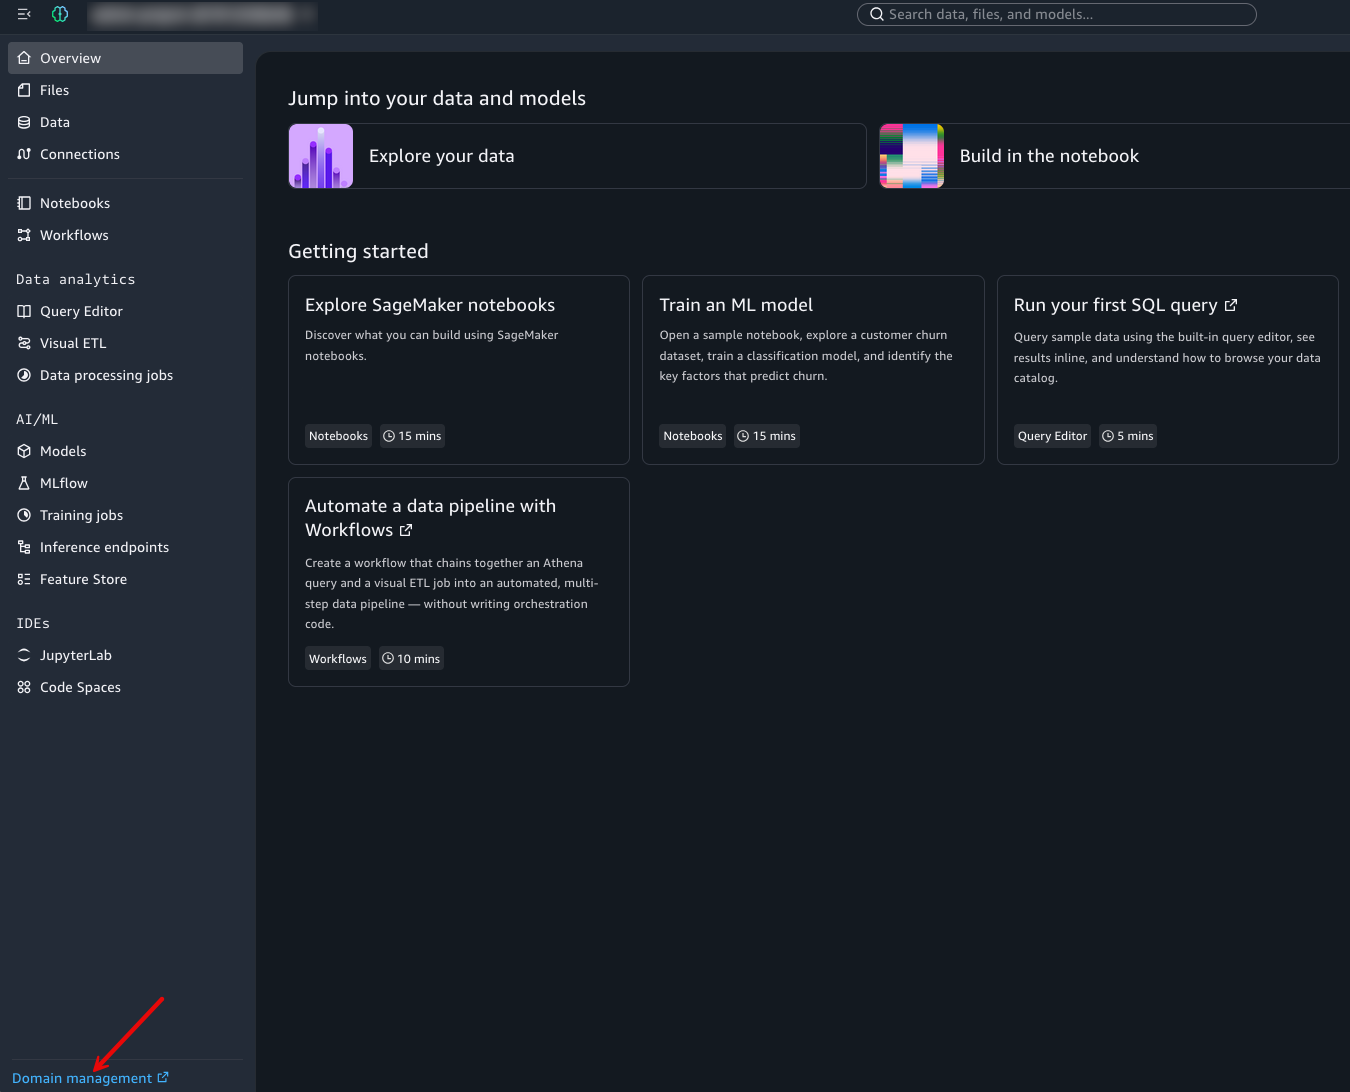
  1. From the navigation pane, choose Domain management.

The following screenshot shows Domain management in the navigation pane.

Navigation pane showing Domain management link in Amazon SageMaker Unified Studio.

Figure 3: Domain management on navigation pane

Note: Access to the domain administration page is restricted to the IAM role specified as the domain login role during domain creation.

Step 2: Add VPC configuration

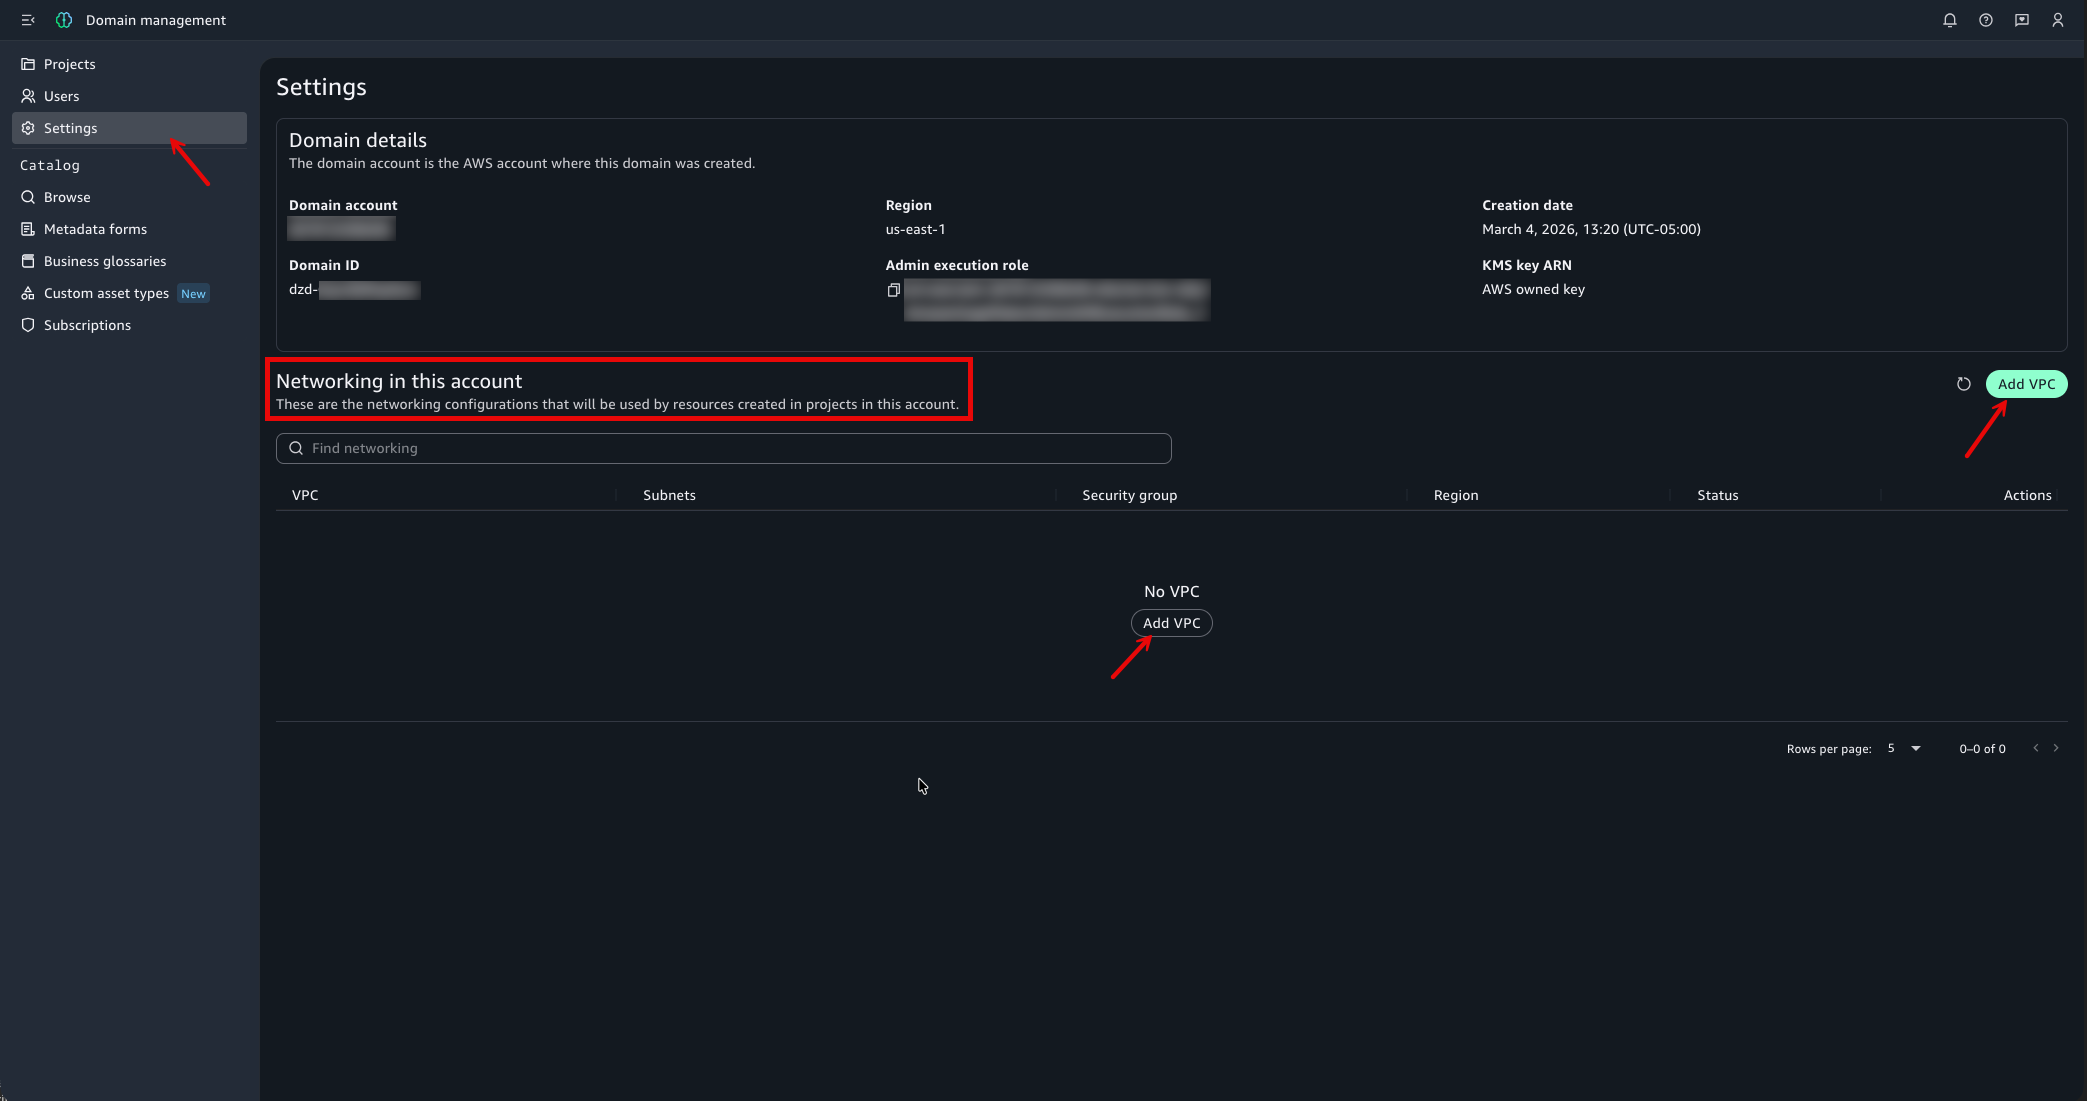
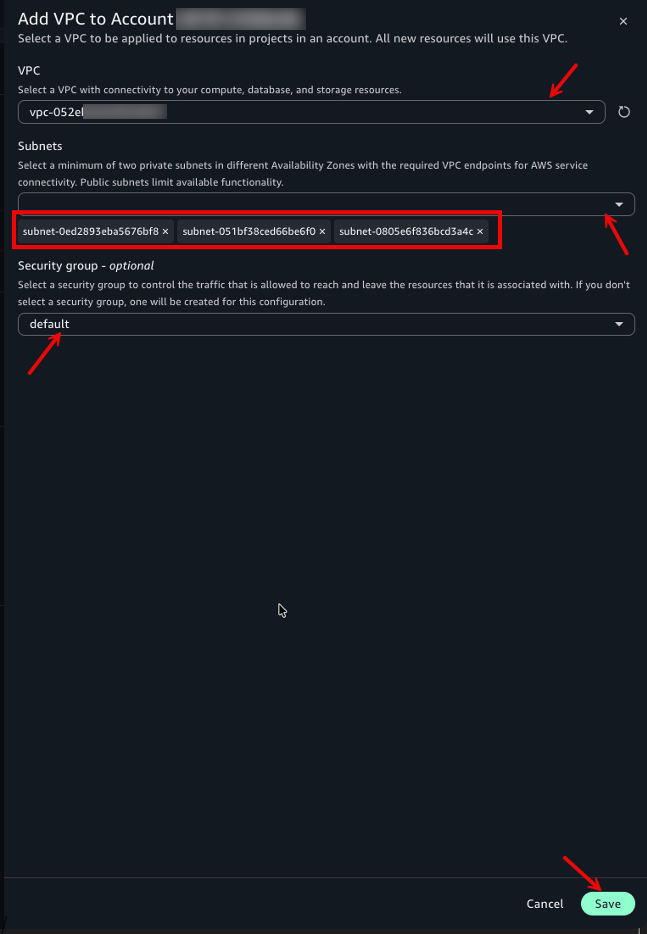
  1. In the navigation pane, choose Settings. In the Networking in this account section, choose Add VPC.

The following screenshot shows the Networking in this account section with the Add VPC button.

Domain management Settings page showing the Networking in this account section with Add VPC button.

Figure 4: Domain management Settings page showing the Networking in this account section to add a VPC

  1. For VPC, select the VPC with connectivity to your compute, database, and storage resources. If no VPC exists, choose Create VPC to provision one using AWS CloudFormation.
  2. For Subnets, select a minimum of two private subnets in different Availability Zones.
  3. (Optional) For Security group, select a security group to control inbound and outbound traffic. If you don’t choose one, SageMaker Unified Studio creates one automatically.
  4. Choose Save.
  5. Verify the VPC configuration status shows Ready in the Networking in this account section.

The following screenshots show the Add VPC dialog and the resulting Ready status in the Networking in this account section.

Add VPC dialog with fields for VPC, subnets, and security group selection.

Figure 5: Add VPC dialog with fields for VPC, subnets, and security group selection

VPC configuration status showing Ready in the Networking in this account section.

Figure 6: VPC configuration status showing Ready in the Networking in this account section

Note: IAM-based domains support only one VPC configuration at a time. AWS IAM Identity Center-based domains can have a VPC per Region. For details, see Configure VPC networking for IAM-based domains in the SageMaker Unified Studio Administrator Guide.

New projects created in the domain now automatically use the saved VPC configuration. Existing projects are an exception. See Step 3 to update them.

Step 3: Update existing projects

Existing projects don’t automatically inherit the domain VPC configuration. How you apply the new settings depends on the project’s current state:

Projects with no VPC configured – Update in place to adopt the domain VPC. See the following steps.

Projects that already have a VPC – These can’t be switched to a different VPC configuration. To adopt the domain VPC:

  1. Create a new project (which inherits the domain VPC automatically).
  2. Recreate connections in the new project.
  3. Migrate assets from the old project.
  4. Back up any data you need, then delete the original project.

Because recreation can disrupt in-progress work and doesn’t migrate project data automatically, schedule this as a planned maintenance window.

To update a project that currently has no VPC configured:

  1. From the domain administration page, choose Projects in the navigation pane.
  2. Choose the project you want to update.
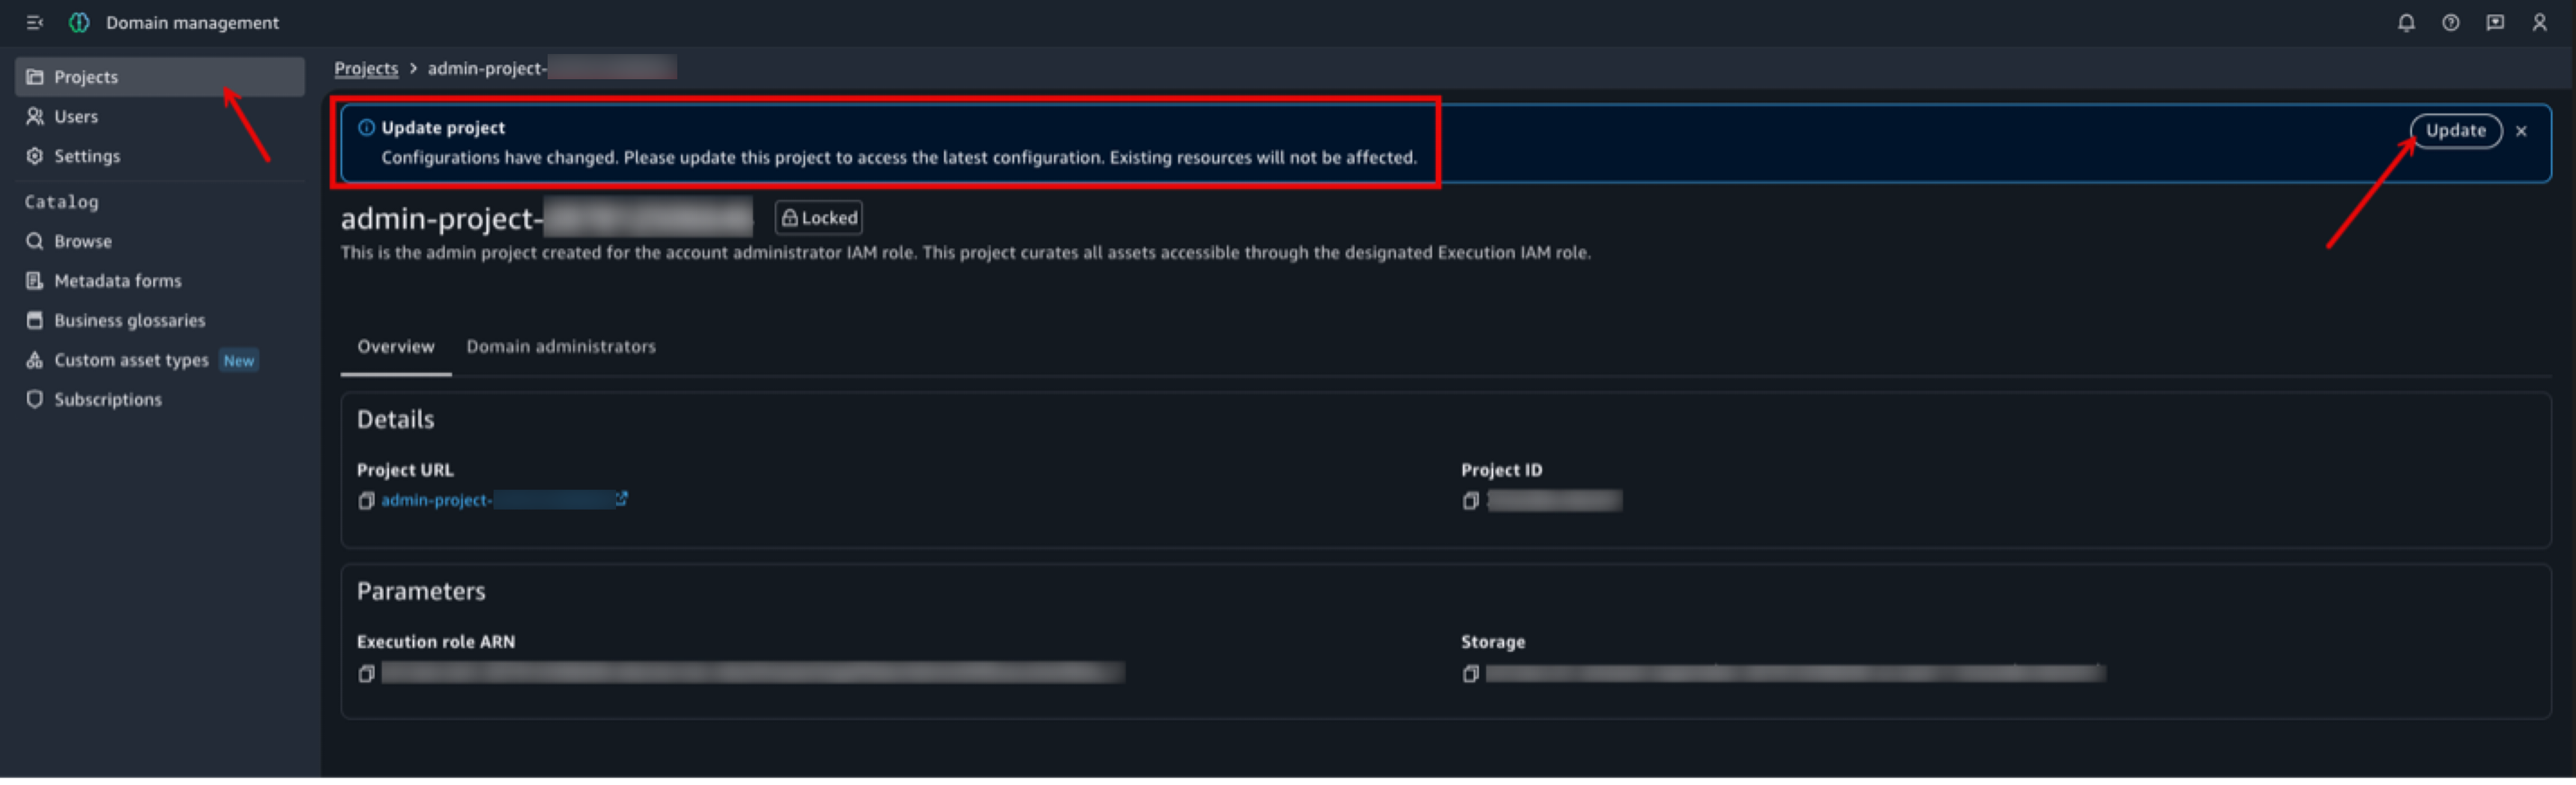
  3. On the project detail page, a banner appears: “Configurations have changed. Please update this project to access the latest configuration.”
  4. In the banner, choose Update.
  5. Confirm the update when prompted.

Repeat this process for each existing project that should use the domain VPC. The following screenshot shows the project detail page with the configuration update banner.

Project detail page showing the update banner for VPC configuration changes.

Figure 7: Project detail page showing the configuration update banner

Step 4: Validate connectivity

After configuring the domain VPC and updating your projects, verify connectivity. Compute resources should have private connectivity to AWS services through the VPC, without any additional project-level network configuration.

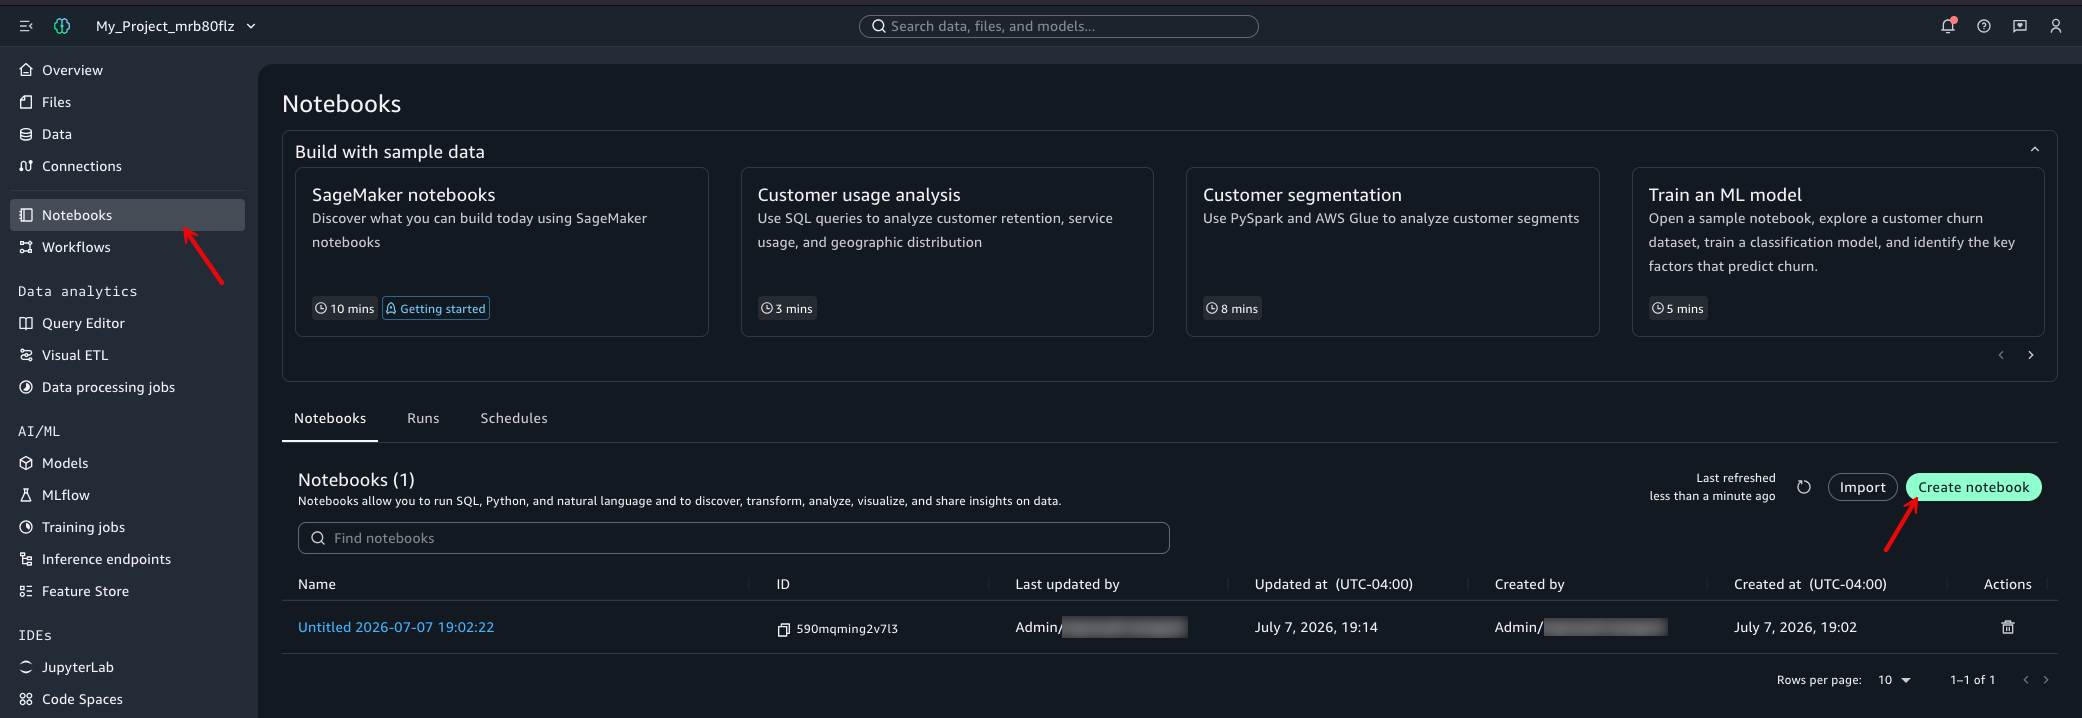
Create a notebook in one of your projects as shown in the following figure and run the following code:

Creating a notebook in a SageMaker Unified Studio project to validate VPC connectivity.

Figure 8: Creating a notebook in a SageMaker Unified Studio project to validate VPC connectivity

Requirements: Python 3.8+, Boto3 1.26 or later. Run in a notebook within your SageMaker Unified Studio project.

import boto3
import socket
import ipaddress

def validate_vpc_connectivity():
    """Validate that the project has private connectivity to AWS services
    through the domain-level VPC configuration."""

    results = {}
    region = boto3.session.Session().region_name
    if not region:
        raise RuntimeError('Could not determine AWS Region. Run this notebook inside a SageMaker Unified Studio project.')

    # Test Amazon S3 access via VPC endpoint
    try:
        s3 = boto3.client('s3')
        response = s3.list_buckets()
        results['S3'] = f"[PASS] Accessible ({len(response['Buckets'])} buckets)"
    except Exception as e:
        results['S3'] = f"[FAIL] Failed: {e}"

    # Test AWS Glue access via VPC endpoint
    try:
        glue = boto3.client('glue')
        dbs = glue.get_databases()
        results['Glue'] = f"[PASS] Accessible ({len(dbs['DatabaseList'])} databases)"
    except Exception as e:
        results['Glue'] = f"[FAIL] Failed: {e}"

    # Test STS (role assumption through VPC endpoint)
    try:
        sts = boto3.client('sts')
        identity = sts.get_caller_identity()
        results['STS'] = f"[PASS] Accessible (Account: {identity['Account']})"
    except Exception as e:
        results['STS'] = f"[FAIL] Failed: {e}"

    # Verify interface endpoint resolves to private IP
    try:
        sts_endpoint = f"sts.{region}.amazonaws.com"
        addr_info = socket.getaddrinfo(sts_endpoint, 443, family=socket.AF_INET)
        ip = addr_info[0][4][0]
        is_private = ipaddress.ip_address(ip).is_private
        if is_private:
            results['DNS Resolution'] = f"[PASS] Private IP ({ip}) (traffic stays on AWS network)"
        else:
            results['DNS Resolution'] = f"[WARN] Public IP ({ip}) - check VPC endpoint config"
    except Exception as e:
        results['DNS Resolution'] = f"[FAIL] Failed: {e}"

    # Print results
    print("-" * 40)
    print("Domain VPC Connectivity Validation")
    print("-" * 40)
    for service, status in results.items():
        print(f" {service}: {status}")
    print("-" * 40)
    print(f"\n Region: {region}")

    # Check if all tests passed
    all_passed = all("[PASS]" in status for status in results.values())
    has_warn = any("[WARN]" in status for status in results.values())
    if all_passed:
        print(f"\n [PASS] All services accessible via private VPC endpoints.")
        print(f" This project inherited its network configuration")
        print(f" from the domain without per-project setup.")
    elif has_warn and all("[PASS]" in s or "[WARN]" in s for s in results.values()):
        print(f"\n [WARN] Services are reachable, but DNS resolves to public IPs.")
        print(f" Verify that Private DNS is enabled on your interface VPC endpoints.")
    else:
        print(f"\n [FAIL] Some services are not reachable.")
        print(f" Check that VPC endpoints are configured and security")
        print(f" groups allow outbound traffic on port 443.")

validate_vpc_connectivity()

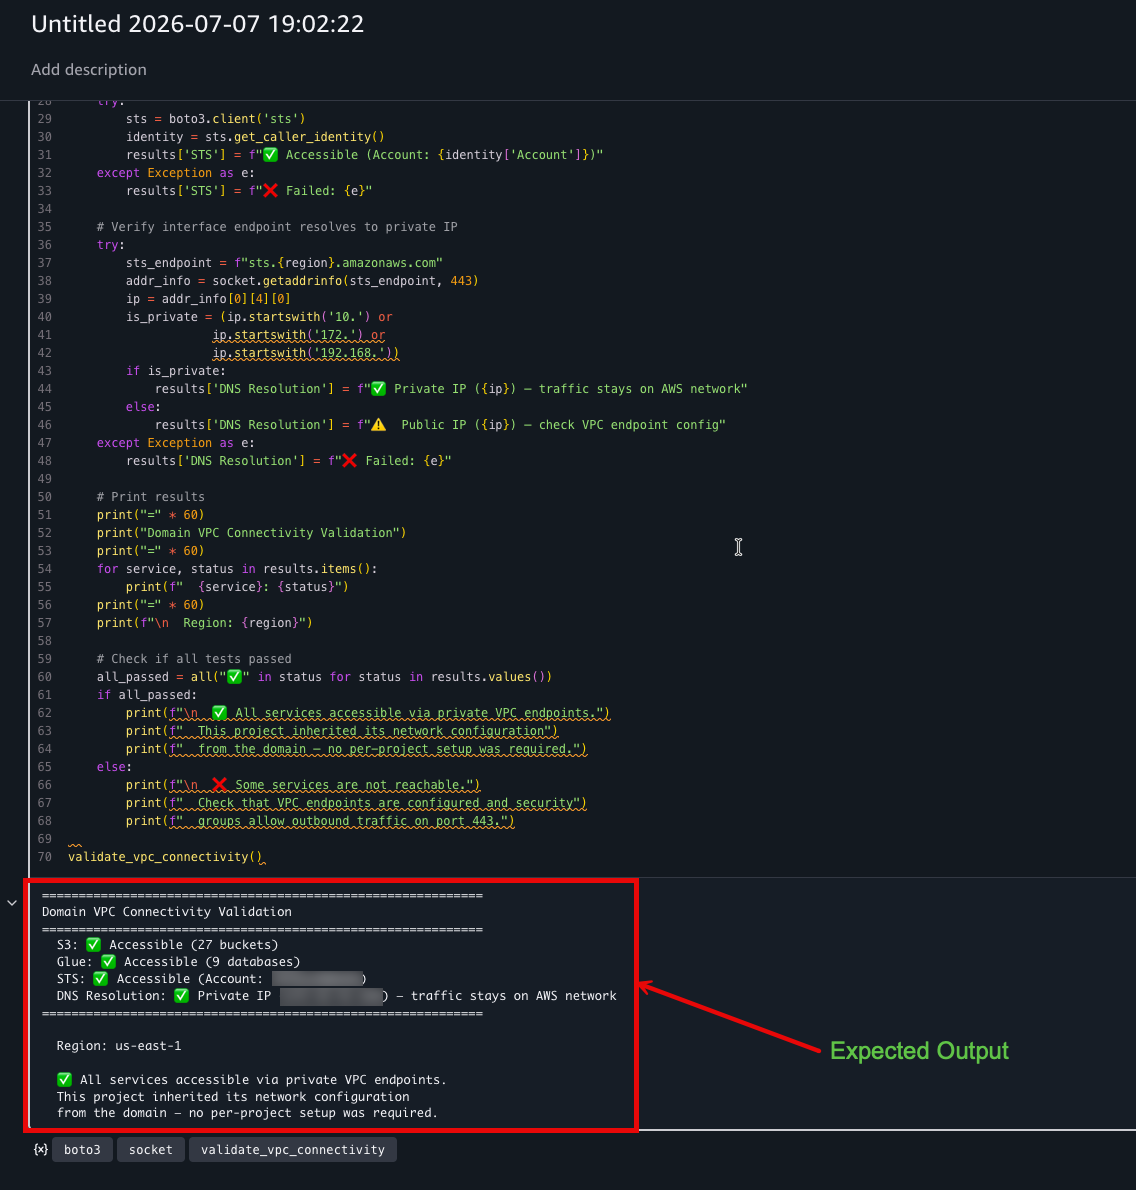
Expected output when VPC is correctly configured:

Successful validation output showing all services accessible through private VPC endpoints.

Figure 9: Successful validation output showing all services accessible through private VPC endpoints

If any service shows a failure, one common cause is security groups preventing traffic on port 443 to the VPC endpoint. Other causes include missing VPC endpoints, incorrect route table entries, or DNS resolution issues. For more information, see Configure VPC networking for IAM-based domains in the SageMaker Unified Studio Administrator Guide.

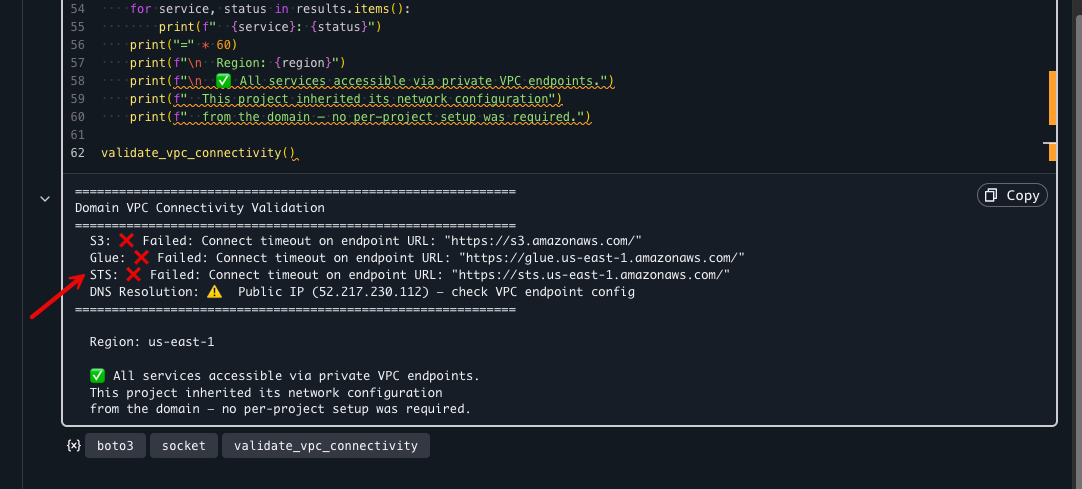
Note: An AccessDenied error indicates the request reached the service. Connectivity is working, but IAM permissions need adjustment (for example, the S3 test requires s3:ListAllMyBuckets, which some project roles lack). A timeout or connection error points to a networking problem (missing endpoint, route, or security group rule). The following screenshot shows the validation output when VPC endpoints are missing, where the affected services report timeout errors.

Validation output when VPC endpoints are not configured showing timeout errors.

Figure 10: Validation output when VPC endpoints are not configured. Timeout errors indicate missing endpoints

The security group applied at the domain level controls network access for all projects. To review or tighten the rules:

  1. Navigate to the Amazon VPC console.
  2. Choose Security groups and choose the security group shown in your domain’s Networking settings.
  3. Review the Inbound rules and Outbound rules tabs.

By default, the auto-created security group allows all outbound traffic on port 443 (HTTPS) to reach AWS services through VPC endpoints. Consider restricting outbound rules to only the specific VPC endpoint security groups for least-privilege access. Additionally, make sure your VPC endpoint security groups allow inbound TCP 443 from the domain security group or subnet CIDRs. For distributed compute services (AWS Glue, Amazon EMR), add a self-referencing inbound rule to allow worker-to-worker communication.

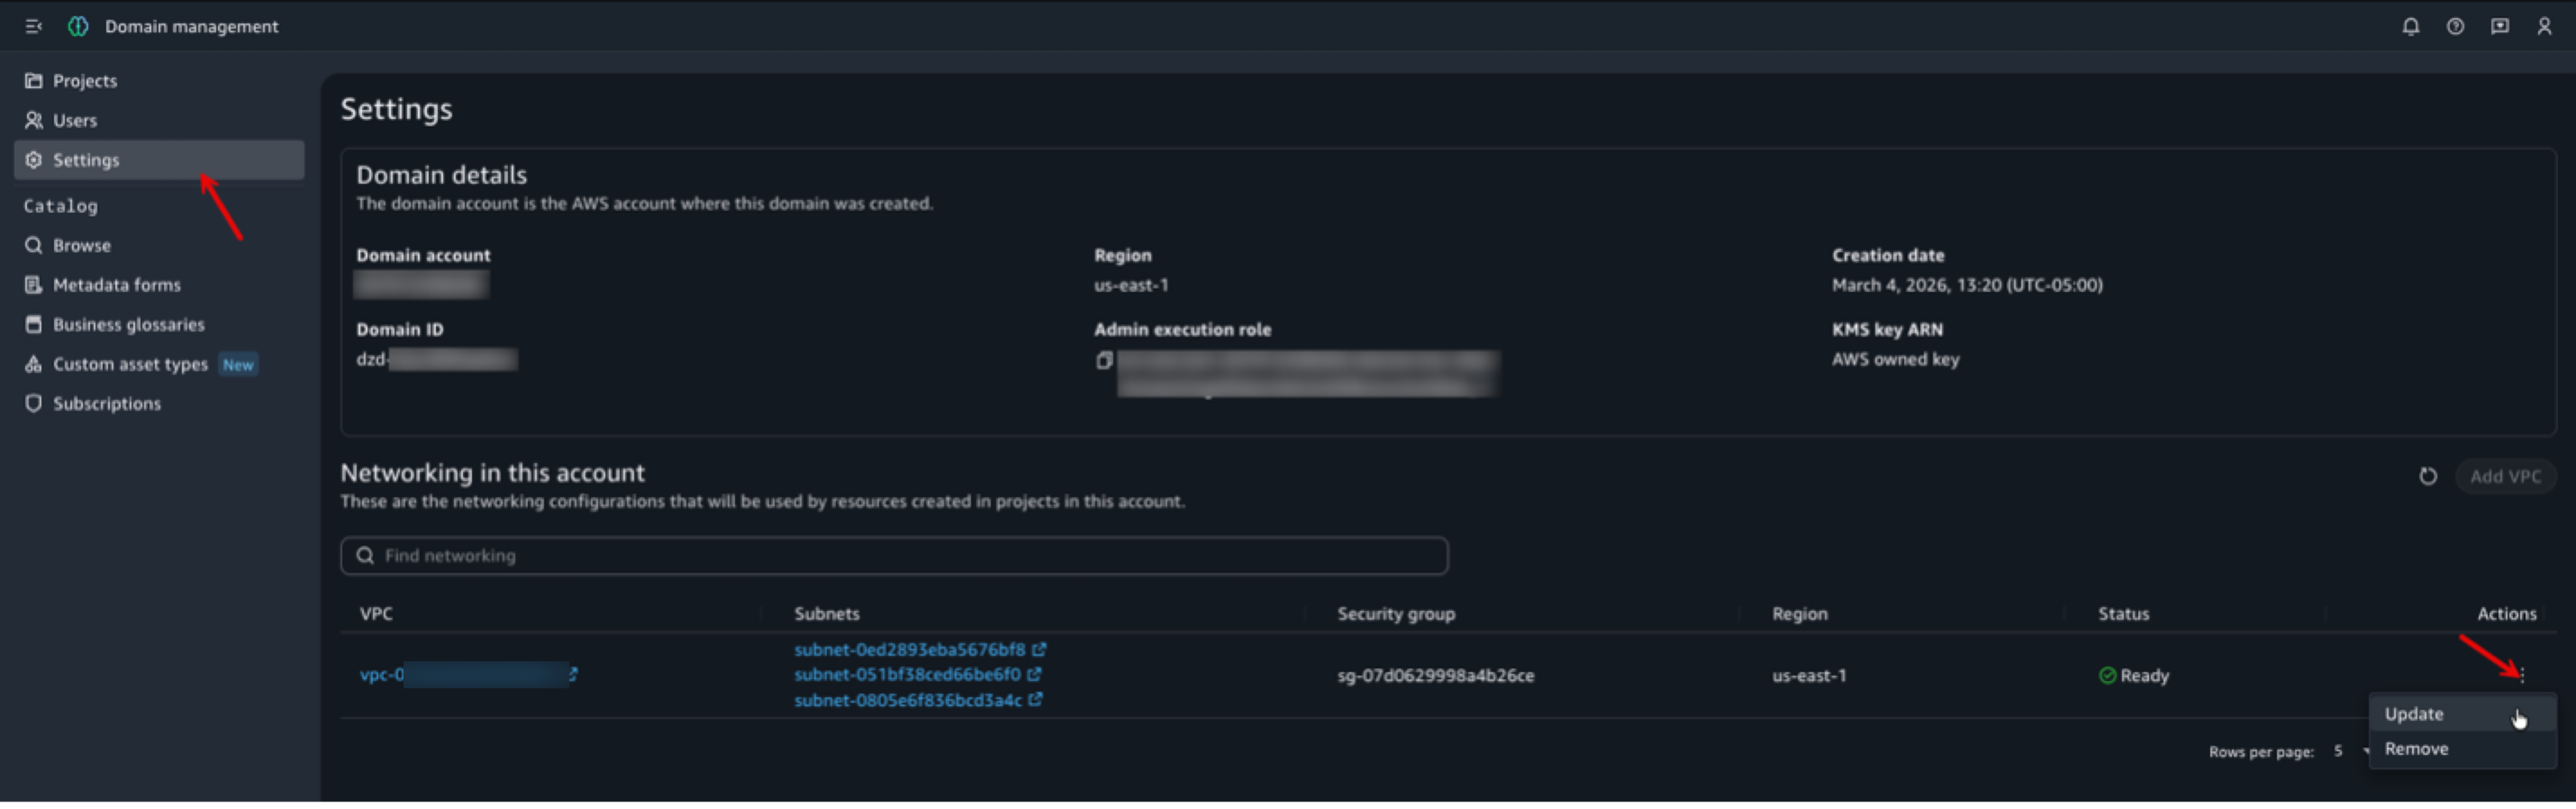
Updating VPC configuration

After the initial setup, you can modify the VPC configuration to change the VPC, subnets, or security group:

  1. From the domain administration page, choose Settings in the navigation pane.
  2. In the Networking in this account section, under the Actions column, choose Update.
  3. Update the VPC, subnets, or security group as needed.
  4. Choose Update.

The following screenshot shows the Update VPC dialog, where you modify the VPC, subnets, or security group.

Settings page with the Actions menu showing Update and Remove options for VPC configuration.

Figure 11: Update VPC dialog showing the option to modify VPC, subnets, or security group for the domain

Important: Updating the VPC does not affect already provisioned resources. Newly created resources in projects use the updated VPC. Existing projects that already have a VPC keep their original settings and must be recreated to adopt the change. Projects with no VPC can be updated in place (see Step 3).

Clean up

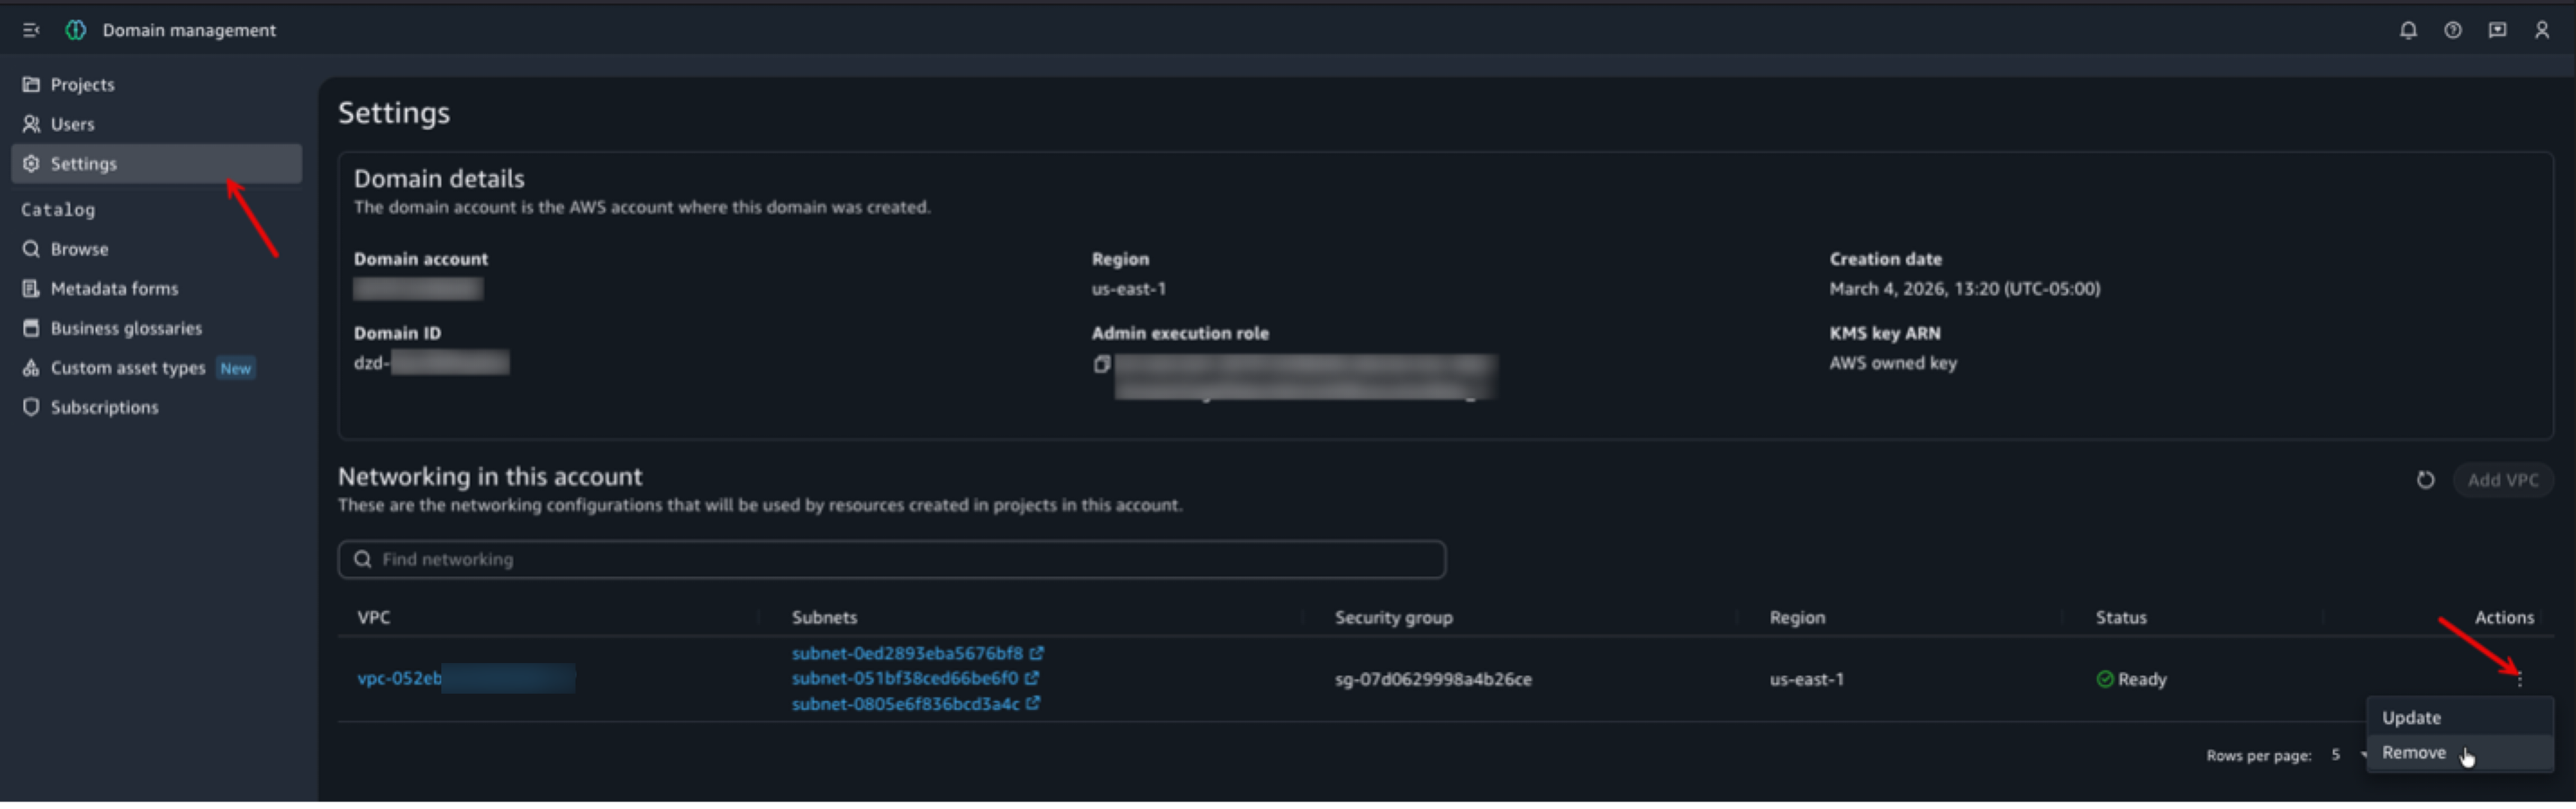
To remove the VPC configuration from your domain:

  1. From the domain administration page, choose Settings in the navigation pane.
  2. In the Networking in this account section, choose the Actions menu (⋮) and choose Remove.

The following screenshot shows the Actions menu with the Remove option.

Actions menu in the Networking in this account section showing the Remove option.

Figure 12: Actions menu in the Networking in this account section showing the Remove option

If you created a dedicated VPC for this walkthrough and no longer need it:

  • Delete the VPC and associated resources (subnets, VPC endpoints, security groups) from the Amazon VPC console. Before deleting, remove the domain VPC configuration and make sure all project resources are terminated. Active projects create ENIs that block VPC and subnet deletion.
  • If you used an AWS CloudFormation template to create the VPC, delete the stack to remove all resources cleanly. Open the AWS CloudFormation console and delete the stack.

Note: Removing the domain VPC configuration does not retroactively change projects that already have VPC applied. Those projects retain their existing network configuration. New projects created after removal do not have a VPC configured.

Conclusion

In this post, we showed how to configure domain-level VPC networking in Amazon SageMaker Unified Studio. A single domain-level VPC eliminates per-project networking overhead, enforces a consistent security posture, and simplifies compliance auditing.

Key takeaways:

  • Domain-level VPC is a one-time configuration that automatically applies to all new projects.
  • Projects with no VPC can be updated in place. Projects that already have a VPC must be recreated to adopt a changed configuration.
  • Private subnets with VPC endpoints provide secure, private connectivity to AWS services without traversing the public internet.

As next steps, consider:

  • Reviewing your auto-created security group rules and tightening them for least-privilege access.
  • Adding VPC endpoints for additional AWS services as your projects’ needs evolve.
  • Monitoring subnet IP address utilization to plan capacity as you add more projects. Use the AvailableIpAddressCount Amazon CloudWatch metric for your subnets to track utilization and set alarms.

For more information, see Configure VPC networking for IAM-based domains in the Amazon SageMaker Unified Studio Administrator Guide.


About the authors

Prasad Nadig

Prasad Nadig

Prasad is a Senior Analytics Specialist Solutions Architect at Amazon Web Services (AWS), specializing in large-scale data analytics and AI. Prasad partners with customers to design, migrate, and modernize their analytics platforms on AWS into scalable, cost-effective solutions, with deep expertise in data lakes, data warehousing, distributed processing, and performance tuning at petabyte scale.

Amit Shyam Jaisinghani

Amit Shyam Jaisinghani

Amit is a Software Engineer on the SageMaker Studio team at Amazon Web Services, and he earned his Master’s degree in Computer Science from Rochester Institute of Technology. Since joining Amazon in 2019, he has built and enhanced several AWS services, including Amazon WorkSpaces and Amazon SageMaker Studio. Outside of work, he explores hiking trails, plays with his two cats, Missy and Minnie, and enjoys playing Age of Empire.

Arun Shanmugam

Arun Shanmugam

Arun is a Senior Analytics Solutions Architect at AWS, with a focus on building modern data architecture. He has been successfully delivering scalable data analytics solutions for customers across diverse industries. Outside of work, Arun is an avid outdoor enthusiast who actively engages in CrossFit, road biking, and cricket.

Rendering huge pull requests in the GitHub Copilot app

Post Syndicated from Alberto Gimeno original https://github.blog/engineering/user-experience/rendering-huge-pull-requests-in-the-github-copilot-app/


Broad refactors and migrations often have to land as one change.

Stacked pull requests are a great way to split work into smaller changes, which makes reviews easier and helps teams ship with less risk. But some changes, like this one, can’t be split cleanly. That leaves you with a single pull request that can get very large, and the review conversation causes it to grow.

The review experience needs to remain fast and smooth even when the diff and its conversation are enormous. In the GitHub Copilot app, we rebuilt the pull request view with that requirement in mind.

To see how far that goes, we opened the biggest pull request we could find: an open source one with 2,200 files, over a million changed lines, and more than 400 inline review comments. Here’s how we made even this extreme pull request performant.

The scope of the problem

Rendering a large diff at speed is well-understood: virtualize the rows, keep the mounted DOM small, and lean on the fact that every row is a line of code at a known height.

Comments are the hard part. A comment’s height depends on how its markdown wraps, the expandable sections, whether there’s a reply box in it, and whether its images have loaded yet. You find all of that out at render time. This forces a different architecture.

Three problems:

  1. Measurement. You can’t know how tall a comment is until you render it. This breaks the design that lets big diffs stay responsive as you scroll.
  2. The data pipeline. A fast diff surface is worthless if the data pipeline feeding it stalls, or if it throws away work it already did.
  3. How we actually found the bugs. These problems surface under load, on a specific engine, at a specific scroll position. So we defined what healthy meant, instrumented the surface to answer it, and ran the whole change → measure → improve loop unattended.

Part 1: Virtualization, and why comments break it

The first step is to understand the geometry that makes a code-only diff fast. Once comments enter the picture, that geometry is no longer enough.

What makes big diffs fast

You cannot put a million DOM nodes on a page. The standard answer is virtualization: mount only the rows that are on screen, plus a small margin, and recycle those same DOM elements as the user scrolls. The list behaves as if all million rows exist. The scrollbar is the right size, scroll-to-row works. But only about 100 rows are ever real at once.

For this illusion to hold, something has to supply the geometry. The scrollbar height is the sum of all row heights. The position of row N is the sum of the heights of the rows above it. Jumping to a row, drawing the scrollbar, deciding what’s on screen, it’s all arithmetic over a table of heights. You can build that table from estimates and correct it as rows get measured, and general-purpose variable-height virtualizers do exactly that.

But if every row is a line of code at a known font size, you don’t have to. You can compute the whole table up front and it never changes, so there’s nothing to correct later.

Call this the “all heights known before paint” contract. Our diff surface is built around it:

  • An imperative, recycled code-row renderer (no React component per row)
  • Typed-array geometry for the offset math
  • Backend-owned diff documents streamed structure-first
  • An imperative scroll API with exact “scroll to row N“

None of it scales badly, because no per-frame work grows with the total row count. On pure code this design is the right one, and we kept all of it.

How comments change the contract

Now put a review thread in the middle of the diff. How tall is it?

You don’t know, and you can’t know without rendering it. Its height depends on things that only exist at render time, and they can keep changing after first paint:

  • Markdown that wraps differently at different widths
  • <details> blocks the user can expand or collapse in place
  • A reply composer that opens inside the existing thread and grows as you type
  • Suggested-change diffs, reactions, edit mode, resolution banners
  • Images and async assets that change height when they finish loading

The obvious answer is to reserve a fixed-height slot for each comment, sized by an estimator. It falls apart on a big pull request. An estimator that’s right on average is still wrong at the extremes. It over-reserves most comments, leaving gaps of whitespace, and under-reserves the expensive ones, which clip or sprout a nested scrollbar. If you measure the real height after paint and write it back into the shared offset table, everything below moves, while the user is already scrolling. That’s a scroll jump, and on a big pull request it’s a large one.

So comments need a different contract. “All heights known before paint” is unachievable for this content. What we could promise instead: heights are bounded, measured lazily, and corrections are small and anchored to whatever the user is looking at.

Two geometries instead of one

The idea that made this tractable was to stop forcing one geometry to serve both kinds of content. We split the document’s height into two independent domains:

total height = deterministic code height          (exact, known up front)
             + Σ dynamic block effective heights   (estimated, then measured)
             + scroll padding

Code geometry keeps the original world. It’s deterministic, prefix-summed, exact, never rebuilt when a comment resizes.

Dynamic block geometry covers everything whose height we can’t predict, such as review threads, drafts, and reply composers. Each one is a block identified by what it is rather than where it currently sits. It has a stable key that survives its content loading, and it’s anchored to a file, line and side rather than to a pixel coordinate, so a reflow can’t lose track of it. We also keep a fingerprint of everything that could change the block’s height: its content, whether a <details> is open, whether a composer is active. And we record the width it was last measured at, rounded into buckets, so an ordinary window resize doesn’t invalidate every measurement in the document.

A block’s effective height is then simple: the measured height if we have a valid one, a cached height if the fingerprint and width still match, and the estimate otherwise. Those heights live in their own index, separate from the code rows, so a resizing comment never forces the code geometry to be rebuilt. And the number of blocks is bounded by comments, not by rows. A few thousand blocks is fine, as long as first paint never mounts or measures all of them at once.

The measurement scheduler, and the mistake we made first

This part took the longest to get right, because our first design was wrong in an instructive way.

The obvious way to measure dynamic content is one ResizeObserver per block, which watches the element and writes its measured height back into the layout whenever it changes. This is what we designed and then rejected during performance hardening. It is the feedback loop that big virtualized surfaces have to avoid. An observer that writes a height back into the layout of the element it’s watching can retrigger itself, and the cost grows with every mounted block.

What shipped instead is a single idle- and scroll-gated measurement pass, held to the same discipline as the deterministic side:

  • Off the hot path. It runs when the visible range settles, never once per scroll frame, and waits entirely while a scroll is in flight. A reflow mid-scroll is exactly the jank we’re avoiding. It runs again once scrolling stops.
  • Scoped to the viewport. Only blocks within roughly 2400px of the viewport are candidates, so the work is O(viewport). Distant blocks keep riding their estimate and get corrected as they approach.
  • On-screen reads win. A mounted block is on screen, so its rendered height is ground truth. The pass reads every mounted candidate in one batch, a single reflow with no writes in between, and records what it finds. A mounted block is never skipped in favor of a stale estimate. That one rule fixed the nastiest bug we hit: comments that rendered with a strip of blank space underneath, because a mounted block had been filtered out of measurement and left sitting on a too-tall estimate.
  • Off-screen measurement is a bounded fallback. For a nearby block that hasn’t mounted yet, the pass does at most one off-screen render, to correct its reservation before it scrolls into view. Blocks taller than the viewport skip even that. Their over-reservation hides below the fold, so the render isn’t worth paying for.
  • An observer catches the rest. Some height changes don’t move the fingerprint and don’t coincide with a scroll: typing in a reply composer, an image finishing loading, toggling a <details>. Each mounted block keeps a ResizeObserver, but by default all it does is flag the block so the idle pass re-reads it. It never writes a height itself, which is what would close the feedback loop we rejected. It disconnects on unmount, and an inactive pull request tab observes nothing.
  • With one deliberate exception. Waiting was visibly wrong for resizes you caused yourself: expanding a <details>, opening a reply composer, an image landing. The block grew immediately, but the code below it only moved on the next idle pass. For one frame the comment was taller while everything under it sat at its old position, and you could see the two steps. So when a block is mounted and on screen, the observer now measures it and applies the correction in the same frame, before paint. The block grows, the code repositions, and everything below shifts together. Two safeguards keep this from becoming the loop we were avoiding: at most one synchronous commit per frame, so a burst of resizes collapses into one, and never during an active scroll, where it falls back to the batched pass.

Scroll anchoring: Correcting without fighting the user

When a measured height differs from its estimate, the scrollbar arithmetic changes, and the naive result is that the viewport jumps. The fix is to correct by identity rather than by pixel:

  1. Before applying height updates, capture what the user is anchored to (a row or a block, by identity), plus the offset within it.
  2. Apply the height deltas.
  3. Resolve that same anchor to its new pixel position.
  4. Scroll so the anchor stays put in the viewport.

Plus a few rules that keep it from feeling wrong:

  • A block above the viewport changing height → adjust by the delta (keeps your place).
  • Content hydrating below the viewport → don’t adjust (you can’t see it).
  • If you toggled a <details> or opened a reply in a visible block → suppress above-block correction for that block, so the interaction feels direct, and let the content below flow down naturally.
  • Never fight active pointer or wheel momentum; batch the correction after the frame.

That last rule has a sharp edge, and it bit us. “Don’t correct while the user is scrolling” was implemented as a guard on the last observed scroll, and programmatic scrolls refreshed that timestamp too. Toggling the file-tree sidebar changes the width of the diff pane. With line wrapping on, every wrapped line above you reflows to a different number of visual lines, the whole coordinate space shifts, and the surface emits a small scroll of its own as it settles. The guard read that as “the user just scrolled” and skipped the very correction that was supposed to keep your place, so the file you were reading drifted off screen. The fix was to tell user scrolls apart from ones the surface caused itself. Any “is the user interacting?” check has to be one your own side effects can’t satisfy.

So corrections stay small, they reuse measurements we already have, and they follow whatever you’re looking at.

Part 2: The pipeline behind the surface

A diff surface can only be as fast as the data feeding it, and three habits from that side of the work shaped what the UI could do. The first is stream structure before content. The diff is requested incrementally, so the file tree and metadata paint while the document is still loading, and the full set of review threads is resolved up front rather than trickling in. The second is defer per-item work until something needs it. Syntax highlighting runs off the main thread, so rows appear as plain text immediately and get colored when the results arrive. Highlighting improves the surface instead of blocking the scroll. Large markdown bodies and suggested-change context work the same way: nothing is built until it approaches the viewport.

The third habit is about which costs are worth keeping. Releasing a diff document when you navigate away is the right default. These documents are large, and holding on to every one you’ve visited is how a long session ends up eating memory. But pull request metadata persists, so the shell around the diff, the header and the file tree, repaints instantly when you go back, and then sits there for several seconds waiting for a diff it had complete moments ago. An instantly-drawn shell around an empty diff looks broken, even though you’re waiting less time overall. So the policy stayed and we added a cache: keep the last few diffs resident, evict anything beyond that, and let the background refresh notice when one has gone stale.

Part 3: The measurement loop, or how we actually found the bugs

Almost every bug in this project was invisible until it wasn’t, and reproducing one by hand is miserable. A typical report reads: “a strip of whitespace appears below some comments, but only sometimes, only on big pull requests, and it heals if you scroll past and back.” You can’t debug that by staring at the screen, so we built tooling to debug it mechanically.

Instrument with the app’s real signals, not throwaway logs

The naive workflow is to sprinkle console.log calls, exercise the flow by hand, copy the output, paste it to someone (or something) that can analyze it, delete the logs, and repeat. It’s slow, it needs a human in the loop, and worst of all you end up measuring your own hand-rolled instrumentation rather than the app’s real behavior.

So the surface carries permanent, structured probes for its own invariants. They’re plain questions it answers about itself on every render:

  • Is the surface actually viewport-bound? How many rows and comment blocks are mounted right now?
  • Is measurement coalescing to a single commit per frame, and how long does that frame take?
  • How large are the scroll corrections we’re making?
  • Did any comment block get inserted after scrolling started? (Must be zero once the backend topology has landed.)
  • Do the per-block observers actually tear down on unmount, or are we leaking one per block?

These are the objective pass/fail signals, and they’re asserted as budgets in an end-to-end test against a synthetic many-comment huge-pull-request fixture. CI can now tell us whether the surface is healthy.

Put the loop on autopilot

The centerpiece was an autonomous change → measure → improve loop. Two lanes:

A headless probe lane ran a declarative flow (open a pull request, scroll to a fraction, toggle a details block, resize the window) against a mock server, reading the app’s own production instrumentation: React render counts, the performance timeline, and a requestAnimationFrame sampler for jank. It did the whole instrument, drive, collect, analyze, rank cycle by itself and printed the bottlenecks in order. Because the flow is just JSON handed to the probe at runtime, an agent could profile any flow by describing it in plain English, without editing a line of source.

An autopilot drove the actual desktop app through the huge-pull-request flow, unattended, on a loop: first cold, with comments still skeletons, then warm, with comments loaded, toggling <details> blocks, opening and cancelling reply composers, collapsing and expanding files, toggling the sidebar tree, sweeping deep into the file list, resizing the window. Every measurement was mirrored to the app’s on-disk log, so an agent could read runtime behavior with nobody at the keyboard. Each sample carried a health signal, and that was the objective check. A warm sample counted as healthy only if there were no unfilled gaps between comments, no comment blocks left blank, and real thread content actually mounted, across the entire scroll range, deep-file sweep included.

The loop we ran was:

  1. Reproduce unattended, on the real engine. Arm the autopilot, let it loop, read the on-disk log.
  2. Detect with a health signal, not with your eyes. Trust the sample fields.
  3. Probe the suspect seam. When a signal goes bad, add one narrow structured probe there, re-arm, re-read. (Editing the surface hot-reloads the live window and re-arms the autopilot, so a fresh capture is about one cycle away.)
  4. Remove the scaffolding. Once you understand the invariant, pin it in a test and the design doc, and keep only the detector-grade signals.

Where this leaves us

Reviewing a pull request this large used to mean one of two things: waiting, or giving up and reading it somewhere else. A review isn’t a document with known dimensions. It’s a conversation that changes shape while you’re reading it, and the surface underneath has to be built for that from the start rather than patched into it afterwards.

The result is a pull request view where a million-line diff with hundreds of threaded comments opens, scrolls, and behaves like a normally sized pull request. Comments render in full instead of clipping into a scrollable box. Expanding a collapsed section moves the code below it and nothing else. Coming back to a pull request you just left puts you where you were.

If you review code for a living, it’s worth feeling the difference on a pull request you already know is painful. Open the worst one you’ve got.

Try the GitHub Copilot app >

The post Rendering huge pull requests in the GitHub Copilot app appeared first on The GitHub Blog.

Announcing Spark Connect on Amazon EMR on EC2: Interactive PySpark anywhere

Post Syndicated from Al MS original https://aws.amazon.com/blogs/big-data/announcing-spark-connect-on-amazon-emr-on-ec2-interactive-pyspark-anywhere/

Today, we’re announcing support for Spark Connect on Amazon EMR on EC2 with the AWS runtime for Apache Spark (emr-spark-8.0, Apache Spark 4.0.2 and later). You can now develop and debug PySpark interactively from Amazon SageMaker Unified Studio Data Notebooks or your own IDE, such as Visual Studio Code, PyCharm, Kiro, or Jupyter. Spark runs on a dedicated Amazon EMR on EC2 cluster while your Python runs locally, so you can set breakpoints and inspect a DataFrame against full-size data from your IDE. In SageMaker Unified Studio Data Notebooks, you connect to your cluster, catalog, and AI tools. Production-scale PySpark and SQL run without leaving the studio. Because each session is isolated with its own permissions, your whole team can share one cluster at the same time. This post shows you how to get started with both SageMaker Unified Studio Data Notebooks and your own IDE.

Previously, developing Spark for an Amazon EMR on EC2 cluster meant working in a notebook tied to that cluster, or packaging your code as a job and submitting it before you could see a result. Local code often behaved differently on the cluster because of version and dependency mismatches, and the slow deploy-and-check loop made those differences hard to find. There was no way to attach your own IDE and debugger and inspect a DataFrame mid-transformation. Spark Connect closes that gap: your code runs against the cluster’s own Spark engine while you develop locally, so the environment you debug in is the one that runs your data.

How Spark Connect works on Amazon EMR on EC2

Spark Connect uses a client-server architecture that separates your application code from the Spark engine. The client is a lightweight PySpark library that runs in your notebook or IDE, and it sends DataFrame and SQL operations over a gRPC/TLS connection to a Spark Connect Server on your cluster. The server runs those operations and returns the results to your local session. Your machine does not need Spark installed and does not need to be sized for the workload.

Spark Connect client-server architecture connecting a local PySpark client to the Spark Connect Server on an Amazon EMR cluster

Figure 1: Spark Connect client-server architecture on Amazon EMR on EC2

When you start a session, Amazon EMR launches the Spark Connect Server as a YARN application on your cluster and hands back an endpoint and a short-lived token. There’s no server for you to stand up or manage. Because that server runs on a cluster you already operate, your session inherits the instance types, libraries, bootstrap actions, and Spark configuration you use in production. What you see while debugging is what runs when the same code is scheduled as a batch job, since both use the same cluster and its configuration.

Share one cluster across your team

Now that you can start sessions, a single dedicated cluster can serve your whole team, because each session is a separate resource with its own execution role, tags, and lifecycle. A single cluster supports up to 1,000 concurrent sessions and 1,000 concurrent execution roles. These values are service maximums, not sizing targets. Actual concurrency depends on cluster size and per-session workload. Because interactive sessions are bursty and rarely all active at once, one cluster typically serves a team larger than its peak concurrent-session count. Enable Amazon EMR managed scaling so that capacity tracks demand. If peak concurrency approaches these maximums, or to isolate cost and data access by group, use multiple clusters—for example, one per team, business unit, or environment. Sharing one cluster gives you:

  • On-demand Spark without extra clusters — Developers get interactive sessions without provisioning a cluster apiece, which keeps utilization high and removes the cost of idle per-person clusters.
  • Consistent environments — Everyone runs the same Spark version, libraries, and security configuration, so results stay consistent, and your platform team patches and monitors one cluster.
  • Isolation and attribution — Per-session execution roles and tags keep each person’s work separate, so you can scope data access by session, track cost by user, and stop one session without disturbing anyone else.
  • Full visibility and control — View active sessions in the Spark UI, review finished ones in the Spark History Server, and manage them from the Amazon EMR console, API, CLI, or SDK.

Getting started

Getting started with Spark Connect on Amazon EMR on EC2 takes three steps: Create an Amazon EMR cluster with Spark Connect session enabled, start a session, and connect from your IDE or SageMaker Unified Studio Data Notebooks.

Note: In SageMaker Unified Studio, on-demand cluster creation is available for domains that use AWS IAM Identity Center. For domains that use AWS Identity and Access Management (IAM), attach an existing cluster. If your cluster runs in a private subnet, make sure that your network configuration allows connectivity between SageMaker Unified Studio and the cluster endpoint.

Prerequisites

You must have the following prerequisites in place.

  • An Amazon EMR cluster running release emr-spark-8.0.0 or later with SessionEnabled set to true.
  • The Spark application is installed on the cluster.
  • Python 3.9 or later with pyspark[connect] installed locally. The PySpark version must match the Spark version on your cluster.
  • For clusters in private subnets, the Amazon EMR service role must include the AmazonEMRServicePolicyForSessions managed policy, which grants permissions to create Network Load Balancers and virtual private cloud (VPC) endpoint services in your account.
  • To use Spark Connect sessions, you need permissions to start and list sessions on the cluster (elasticmapreduce:StartSession, ListSessions), get session details and endpoints and terminate sessions (elasticmapreduce:GetSession, GetSessionEndpoint, TerminateSession), and pass the execution role to the Amazon EMR service (iam:PassRole).

Working with interactive sessions

To create a session-enabled cluster and connect to it, follow these steps.

To start a Spark Connect session

  1. Create a cluster with sessions enabled, running emr-spark-8.0.0 or later. The following is a sample command that you can modify for your needs, such as the instance types and counts:
    aws emr create-cluster \
      --name "spark-connect-cluster" \
      --release-label emr-spark-8.0.0 \
      --applications Name=Spark \
      --service-role EMR_DefaultRole \
      --ec2-attributes InstanceProfile=EMR_EC2_DefaultRole,SubnetId=subnet-id \
      --instance-groups '[
        {"InstanceCount":1,"InstanceGroupType":"MASTER","InstanceType":"m8g.xlarge"},
        {"InstanceCount":2,"InstanceGroupType":"CORE","InstanceType":"m8g.xlarge"}
      ]' \
      --session-enabled \
      --tags Key=for-use-with-amazon-emr-managed-policies,Value=true

    Note: The following steps use the AWS Command Line Interface (AWS CLI) directly. If you develop in SageMaker Unified Studio (Option 1), cluster attachment and session creation are handled for you, so you can skip steps 2 through 6.

  2. After the cluster reaches the WAITING state, start a session and wait for it to reach IDLE:
    aws emr start-session --cluster-id j-XXXXXXXXXXXXX --name "my-session"
    aws emr get-session --cluster-id j-XXXXXXXXXXXXX --session-id is-XXXXXXXXXXXXX

    Note: For runtime role sessions, add the --execution-role-arn parameter to the start-session command.

  3. Retrieve the endpoint and token, and build your connection string from the returned Endpoint value rather than hardcoding a host:
    aws emr get-session-endpoint --cluster-id j-XXXXXXXXXXXXX --session-id is-XXXXXXXXXXXXX

    The response includes the endpoint URL and an authentication token:

    {
      "Endpoint": "https://session-id.emr-spark-connect.region.amazonaws.com",
      "AuthToken": "v2.local.xxx...",
      "AuthTokenExpirationTime": "2026-01-01T01:00:00Z"
    }

  4. Install the matching PySpark client and connect. GetSessionEndpoint returns an https:// URL with no port. Build the connection string by converting it to the sc:// scheme and appending :443. Without the port, the PySpark client defaults to 15002, which isn’t reachable. Your Python code runs locally. The SQL and DataFrame operations run on the cluster:
    pip install 'pyspark[connect]==4.0.2' boto3

    from pyspark.sql import SparkSession
    
    session_id = "is-XXXXXXXXXXXXX"
    auth_token = "<AuthToken from get-session-endpoint>"
    host = "<Endpoint from get-session-endpoint, without https://>"
    
    url = f"sc://{host}:443/;use_ssl=true;x-aws-proxy-auth={auth_token};authorization={session_id}"
    spark = SparkSession.builder.remote(url).getOrCreate()
    spark.sql("SELECT 'Hello from EMR on EC2' AS message").show()

  5. Run a transformation against full-size data. This groups a DataFrame, writes the result to Amazon Simple Storage Service (Amazon S3), and reads it back:
    import pyspark.sql.functions as F
    
    df = spark.range(0, 1000).withColumn(
        "category", F.when(F.col("id") % 2 == 0, "even").otherwise("odd")
    )
    df.groupBy("category").count().show()
    df.write.mode("overwrite").parquet("s3://amzn-s3-demo-bucket/demo/")
    spark.read.parquet("s3://amzn-s3-demo-bucket/demo/").filter("id < 50").orderBy("id").show()

  6. When you finish, terminate the session to release cluster resources. Calling spark.stop() only closes the local connection. The session keeps running until you terminate it or it reaches the idle timeout:
    aws emr terminate-session --cluster-id j-XXXXXXXXXXXXX --session-id is-XXXXXXXXXXXXX

  7. When you’re done with the walkthrough, terminate the cluster you created in step 1 so it stops incurring charges. Terminating the cluster also ends any sessions still running on it:
    aws emr terminate-clusters --cluster-ids j-XXXXXXXXXXXXX

You can start a Spark Connect session in two ways: from SageMaker Unified Studio or from your own IDE client.

Option 1: Develop in SageMaker Unified Studio Data Notebooks

Amazon SageMaker Unified Studio brings your data, catalogs, and analytics and AI tools into one place, and Amazon EMR on EC2 is now one of the Spark runtimes a Data Notebook can use. When you choose that cluster as the notebook runtime, SageMaker Unified Studio connects to it over Spark Connect. The same runtime then drives both your PySpark and SQL cells, so a single notebook can query the AWS Glue Data Catalog and transform the data without switching tools. The built-in AI assistant generates code and execution plans from natural-language prompts, and the Spark UI shows running work alongside your other runtimes.

To start a session from SageMaker Unified Studio:

  1. Open a Data Notebook in SageMaker Unified Studio.
  2. In the Compute panel, do one of the following:
    1. To create a new cluster, choose Create cluster and configure an Amazon EMR on EC2 cluster.
    2. To use an existing cluster, choose Attach cluster and select a running Amazon EMR on EC2 cluster.
  3. Select the cluster as the notebook’s runtime.
  4. Begin writing PySpark or SQL code in the notebook cells.

For a complete example, open the SageMaker Unified Studio Spark Connect example notebook , which connects a Data Notebook to an Amazon EMR on EC2 cluster and runs PySpark and SQL cells against the AWS Glue Data Catalog.

Watch a walkthrough: Develop in a SageMaker Unified Studio Data Notebook. The preceding steps cover the same workflow, so you can complete it from the notebook without the video.

Option 2: Develop in your own IDE

Use the IDE of your choice, such as Visual Studio Code, PyCharm, Kiro, or a local Jupyter notebook. You debug Spark the way you debug any Python program: set a breakpoint, inspect a variable, and step through your code, all while the Spark work runs on the cluster. Your libraries, source control, and continuous integration and continuous delivery (CI/CD) stay on your local machine, and only your Spark operations are sent to the cluster.

To see this end to end, the following example attaches an IDE to a Spark Connect session and steps through a breakpoint against cluster data.

Open the local IDE Spark Connect example notebook then use the connection steps in the preceding Getting started section to attach your client.

Watch a walkthrough: Develop your own IDE with Spark Connect. The written connection steps in Getting started cover the same workflow, so you can complete it without the video.

Use cases

Spark Connect on Amazon EMR on EC2 supports the following interactive workflows:

  • Interactive extract, transform, and load (ETL) development: Build and test pipelines against full-size data on the cluster, then schedule the same transformations as a Spark step on that cluster, where the Spark version, libraries, and configuration already match what you validated.
  • Exploratory data analysis and feature engineering: Analyze production-scale data from your notebook or IDE instead of sampled subsets, so you catch data quality issues earlier.
  • Notebook-driven analytics in SageMaker Unified Studio: Run PySpark and SQL next to your catalogs and AI tools, switching runtimes per notebook.
  • Apache Iceberg lakehouse analytics: Query and manage Iceberg tables through the AWS Glue Data Catalog, with time travel, schema evolution, and partition management.
  • Compute standardization: Point interactive development at the same clusters that run your production batch jobs, so development and production share one engine and configuration.

Release information

Spark Connect on Amazon EMR on EC2 is available with the AWS runtime for Apache Spark (emr-spark-8.0, Apache Spark 4.0.2) and later. It’s available in all AWS Regions where Amazon EMR is available, except the AWS GovCloud (US) Regions and the China Regions. The SageMaker Unified Studio experience is available in its supported Regions. There’s no additional charge for Spark Connect. You pay for the Amazon Elastic Compute Cloud (Amazon EC2) instances in your cluster. Because these sessions run on your own clusters, they use the Amazon EMR on EC2 capabilities you already rely on, including AWS Graviton processors for price-performance and your choice of On-Demand, Reserved, AWS Savings Plans, or Spot capacity.

Considerations for the release are as follows:

  • The PySpark version that you install locally must match the Apache Spark version on your cluster.
  • Spark Connect supports the DataFrame and SQL APIs. RDD-based APIs aren’t supported.
  • Authentication tokens expire after 1 hour, and sessions end after a configurable idle timeout (60 minutes by default, up to 24 hours).
  • High-availability clusters with multiple primary nodes, Trusted Identity Propagation, and fine-grained access control through AWS Lake Formation aren’t supported for Spark Connect sessions in this release.

Conclusion

Spark Connect on Amazon EMR on EC2 brings interactive, debuggable PySpark development to the clusters you already run. Develop on a SageMaker Unified Studio Data Notebook or in your own IDE, debug against full-size data while the cluster runs the work and share a single cluster across your whole team. To get started, see the Interactive sessions with Spark Connect guide or open a Data Notebook in Amazon SageMaker Unified Studio. To learn more about the service, see the Amazon EMR detail page.


About the authors

Al MS

Al MS

Al is a product manager for Amazon EMR at AWS.

Karthik Prabhakar

Karthik Prabhakar

Karthik is a Data Processing Engines Architect for Amazon EMR at AWS, where he specializes in distributed systems architecture and query optimization. He partners with customers to solve complex performance challenges in large-scale data processing workloads. His work centers on engine internals, cost optimization, and architectural patterns for efficient petabyte-scale analytics.

Arun Prabakaran

Arun Prabakaran

Arun is a Senior Software Engineer working at AWS. His expertise spans distributed data processing and large-scale systems. He is passionate about building reliable data platforms and enabling organizations to run analytics and AI workloads at scale.

Rekha Veeraraghavan

Rekha Veeraraghavan

Rekha is a Technical Account Manager at AWS and a Subject Matter Expert in AWS Analytics. She helps enterprise and strategic customers optimize their data analytics solutions with expert guidance and technical support. Drawing deep data engineering expertise, she enables organizations to build scalable, efficient, and cost-effective data processing pipelines on AWS.

The collective thoughts of the interwebz