Emmanuele Bassi kicked off a project to improve GNOME’s technical governance
with a presentation about his
ideas (video) at GUADEC 2025. His nudging
has led the project to, slowly, work on creating more formal structures for
technical governance. It is adopting a teams structure and looking toward
creating a steering committee, as well as bootstrapping a Request for Comments
(RFC) process. If adopted, GNOME would require RFCs for design, user experience,
architectural, and other changes that carry a major impact on the project.
Version
7.4 of the Incus container and virtual-machine management system has been
released. Notable changes in this release include UEFI Secure Boot key
management, “near-live” migration of containers between Incus instances, as well
as burst I/O limits for disk and network
devices.
Comcast has added motion detection as a feature to its wireless routers:
The feature sends push notifications to users when motion is detected near a connected device, such as a TV or printer. It has different settings for when people are home, asleep, or away. The Xfinity app also lets users see live motion activity and a feed of recent activity.
Comcast acknowledges that the system has some limitations. Home size, layout, building materials, and the placement of the router and connected devices can all affect its ability to detect motion. Comcast says it does not guarantee its performance.
Sounds like a great surveillance tool. And also:
But the biggest privacy concern comes directly from Comcast’s own support page, which says information generated by WiFi Motion may be shared with third parties.
“Comcast may disclose information generated by your WiFi Motion to third parties without further notice to you in connection with any law enforcement investigation or proceeding, any dispute to which Comcast is a party, or pursuant to a court order or subpoena,” the page reads.
The online publication industry, as a whole, is struggling, with challenges
coming from multiple directions. Thanks to the support of all of you, our
readers, LWN would appear to be doing better than most. But the world has
changed around us and, in particular, prices have changed considerably. By
now, you probably know where this is going: subscription prices at LWN will
be increasing as of September 15.
To subscribe to my monthly email newsletter, you have to enter your information on the webpage, and then reply to an automatically generated email. This is, of course, to prevent people from subscribing addresses other than their own.
Starting last weekend, I have been receiving a lot of individual responses to those emails. Always one line:
Thank you for the positive impact your emails have had on my life.
Your emails are a game-changer.
Your emails are a constant reminder of why I subscribed.
Your emails rock.
Thank you for the time and effort you put into creating these informative emails.
Thank you for the passion and enthusiasm you infuse into your email content.
Your emails consistently exceed my expectations. Thank you for the exceptional value!
I responded to the first few, because sometimes I do get these nice emails from readers and I hadn’t yet realized it was all fake. But so many, and all at once—this is obviously AI. And obviously a scam, except I can’t figure out what the scam is.
All Gmail. None of the addresses has actually subscribed to Crypto-Gram. They could; whoever is sending the emails could easily have confirmed the subscription.
My first thought was pig butchering—wanting me to respond and turn this into a conversation—but no one has responded to any of my responses. Anyone have any idea?
NVIDIA and MediaTek have inked a new deal this week that more closely ties together the two companies financially and technologically. With NVIDIA investing $3.5B into the Taiwanese fabless chip designer, MediaTek will now offer the NVLink Fusion platform to customers designing custom XPUs at MediaTek
The records describe a force-generation mechanism for several General Staff components, including the GRU, Main Operational Directorate, and 8th Directorate, which is associated with protected communications, cryptography, and information security.
[…]
The reporting also linked a 2024 Department No. 4 graduate, Aleksei Kondrashov, to Military Unit 74455, widely known as Sandworm.
That unit has been associated with destructive cyber activity against Ukraine and other targets, including the 2017 NotPetya attack.
The reports do not establish that every listed graduate participated in a named operation; assignments should therefore be described as reported unit placements, not proof of individual operational involvement.
The Bauman material reframes Russia’s cyber capability as an institutional system, not merely a collection of well-known threat groups.
It suggests that Moscow has formalized a recurring pathway from university recruitment to military service, where students receive supervised technical and ideological preparation before entering intelligence, cyber, and security roles.
For defenders, the leak reinforces the need to track Russian operations as a combined threat: espionage, destructive activity, military reconnaissance, technical surveillance, and influence campaigns may draw on related personnel pipelines and overlapping doctrine.
The exposure of Department No. 4 also provides researchers with a clearer lens for understanding how the GRU sustains cyber capacity beyond the familiar APT28 and Sandworm brand names.
As AI agents are moving from experimental prototypes to production workloads, teams need visibility into what agents are doing and a systematic way to measure whether they’re doing it well. Traditional testing methodologies like unit and integration tests fall short for this task, as measuring an agent’s quality isn’t a straightforward true/false decision. Instead, agent observability and evaluations (evals for short) provide a two-legged solution to this problem. Agent observability captures the details of an agent’s behavior, and evals compare this behavior to the behavior that you want. With this approach, teams can monitor their agent’s quality over time and introduce agent-specific quality gates in their software development lifecycle.
In this post, we show how to combine an AI agent running on AWS with OpenSearch Agent Health for observability and evals. You will deploy an agent and its observability data pipeline to AWS, then use Agent Health as a local development tool connecting to your cloud resources.
Overview of solution
Agent observability and evaluations rely on OpenTelemetry traces to understand agent behavior. Traces describe the flow of a request through components of a system. OpenSearch Agent Health is a purpose-built tool for analyzing agent traces and running evaluations against an agent for quality control. Although Agent Health works with any open source OpenSearch installation, many AWS customers choose Amazon OpenSearch Ingestion and Amazon OpenSearch Service for ingesting and storing their OpenTelemetry data. You can connect OpenSearch Agent Health to these AWS resources to fetch live data and store its own configuration and evaluation history.
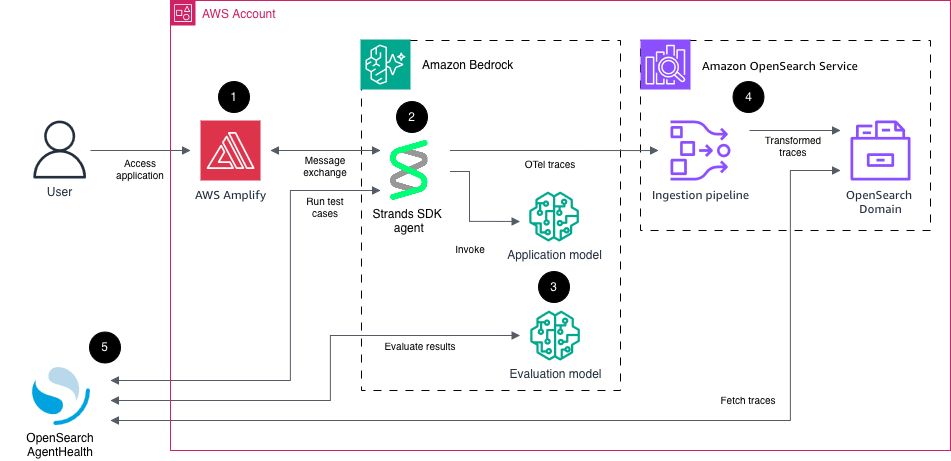
The following diagram shows the overall architecture of the solution presented in this post:
Sample ecommerce AI agent using Strands Agents SDK, deployed to Amazon Bedrock AgentCore runtime, exposing an AG-UI Server-Sent Events (SSE) endpoint. This agent has access to multiple tools, such as product search and shopping basket operations. For this sample project, the tool calls are all simulated within the agent runtime rather than including API calls to other systems. The agent emits messages, reasoning steps, and tool calls as OpenTelemetry traces.
Large language models (LLMs) on Amazon Bedrock. One model (Amazon Nova 2 Lite) is used to power the agent, the other model (Anthropic Claude Opus 4.6) is used to evaluate the agent behavior.
Amazon OpenSearch Ingestion for collecting and transforming the raw agent traces and loading them into an Amazon OpenSearch Service domain. Agent traces have the same structure as regular OpenTelemetry traces, with the addition of generative AI semantics (for example, tool calls and token usage). This means a regular OpenTelemetry pipeline configuration can be used to process agent traces.
OpenSearch Agent Health for analyzing traces and running evaluation test cases and benchmarks against the agent. Agent Health uses the same AG-UI endpoint as the front-end application. It authenticates to the application, to Amazon Bedrock for model functionality, and to Amazon OpenSearch Service using AWS SigV4 authentication.
Walkthrough
In this walkthrough, we showcase how you can use Agent Health and Strands to measure and improve your agent’s quality over time.
We follow these steps:
Deploy solution to AWS and test the application.
Start Agent Health locally and connect it to cloud resources.
In this section, you check out the repository and deploy the infrastructure to AWS. Be aware that these steps create AWS resources that incur cost. We cover cleanup steps at the end of this post.
First, clone the repository to a local directory:
git clone https://github.com/aws-samples/sample-agent-health-with-amazon-opensearch-service && cd sample-agent-health-with-amazon-opensearch-service
Switch to the infra folder and install dependencies:
cd infra && npm install
Before you can start the deployment, determine the AWS Identity and Access Management (IAM) user or role that you will use to start Agent Health later on. In many cases, this will be the same role that you use to deploy the infrastructure. Set this ARN in your environment by issuing the following command:
The -R parameter defines that if something fails during this deployment, the successfully provisioned resources are retained. Be aware that this command creates AWS resources, incurring cost. Review the cleanup section at the end of this post for removing all created resources.
When the deploy command finishes successfully, you should see an output like the following:
Next, create a user for your application. Retrieve the CDK output value for AgentObservabilityStack.UserPoolId. Create a user for the application using the user pool ID, an email address, and a strong password (minimum eight characters including uppercase, lowercase, letter, and digit):
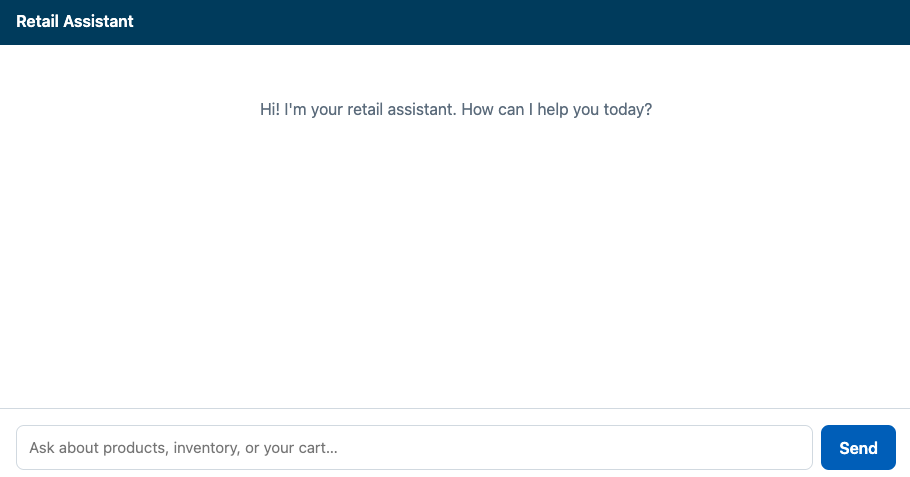
You can now access the retail agent application. From the CDK output values, retrieve the value for AgentObservabilityStack.ChatUrl. Copy and paste this URL into your browser. Log in with your email and password. You should now see the agent interface:
Figure 2: Sample retail agent user interface
Experiment with the application. Here is an example sequence of queries you can put in:
Do you have books on Python?
Is this in stock?
Put it into my basket.
What else can you do for me?
Start Agent Health
Now that you have the infrastructure running, you can start OpenSearch Agent Health locally and connect it to your cloud resources.
The CDK infrastructure deployment created a file cdk-output.json, which contains all relevant configuration values for Agent Health. We’ve already created a file agent-health/agent-health.config.ts that pulls these values dynamically in your environment, so you can start Agent Health without any further configuration.
Open a terminal and start Agent Health by running the following command:
cd ../agent-health && npm install
npx @opensearch-project/agent-health
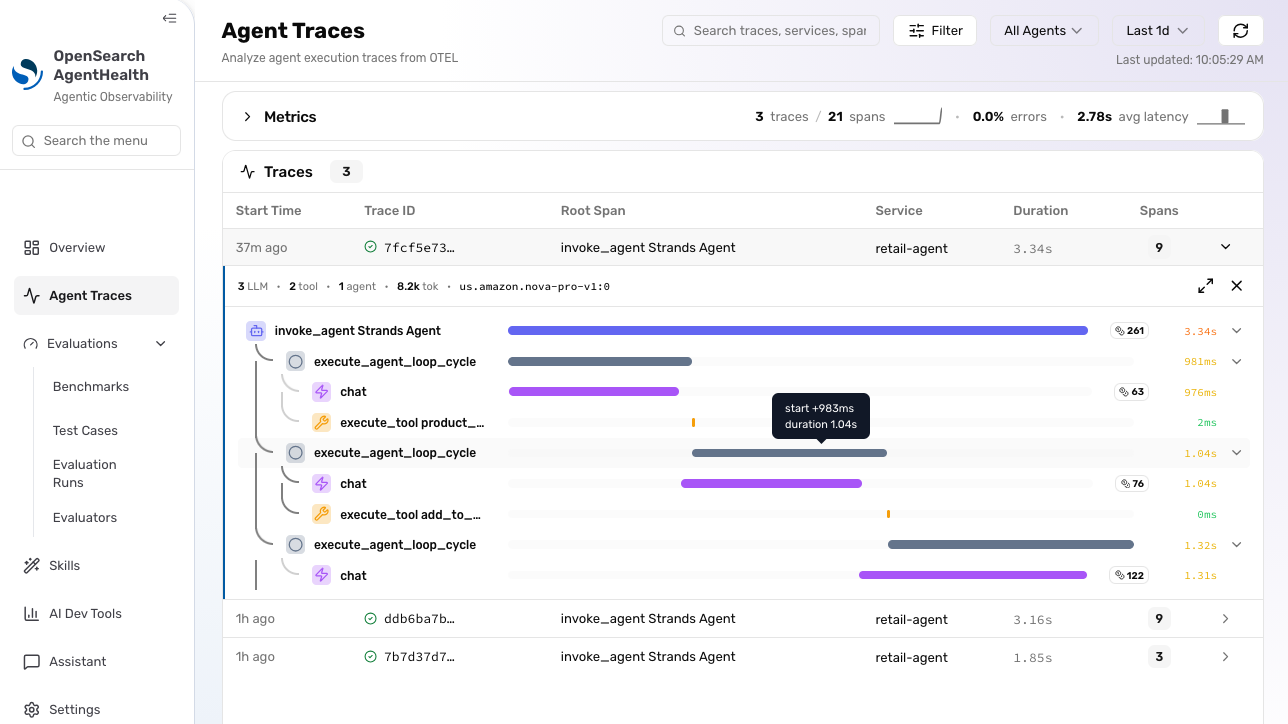
Open http://localhost:4001 in your browser to access Agent Health UI. Choose Agent Traces in the sidebar menu to access your agent’s traces. You should see traces from your previous interactions:
Figure 3: Agent traces. As Agent Health is in active development, this interface might have changed since the time of writing
Expand the trace and explore the information it contains, such as token count and agent trajectory (sequence of messages, reasoning steps, and tool calls).
If you’re unable to access the application or see any traces, verify the following:
Check Agent Health logs in your terminal for any errors. Also check whether Agent Health is running on an alternative port, like 4002 instead of 4001.
If there are permission errors when accessing traces from OpenSearch, verify that the AWS credentials in your terminal match the principal (user or role) that you specified under the agentHealthReaderArn CDK parameter during cdk deploy. This principal must have ESHttpGet:* IAM permissions. Agent Health uses your current AWS credentials to access the OpenSearch API for querying traces. The OpenSearch API is guarded by both IAM and OpenSearch fine-grained access control.
Create and run a test
Choose Test Cases and New Test Case. Fill out the required fields with the following information:
Name: Should add to cart.
Initial Prompt: Add some wireless headphones to my cart. Take any that you have in stock.
Expected Outcomes: PROD-001 added to cart.
Back in the test cases overview, select the created test case and choose Run Test. In the Configure Run dialog, choose Retail Assistant (production) for Agent, Tool Usage Efficiency for Evaluator, Claude Opus 4.8 for Judge Model, and choose Start Run.
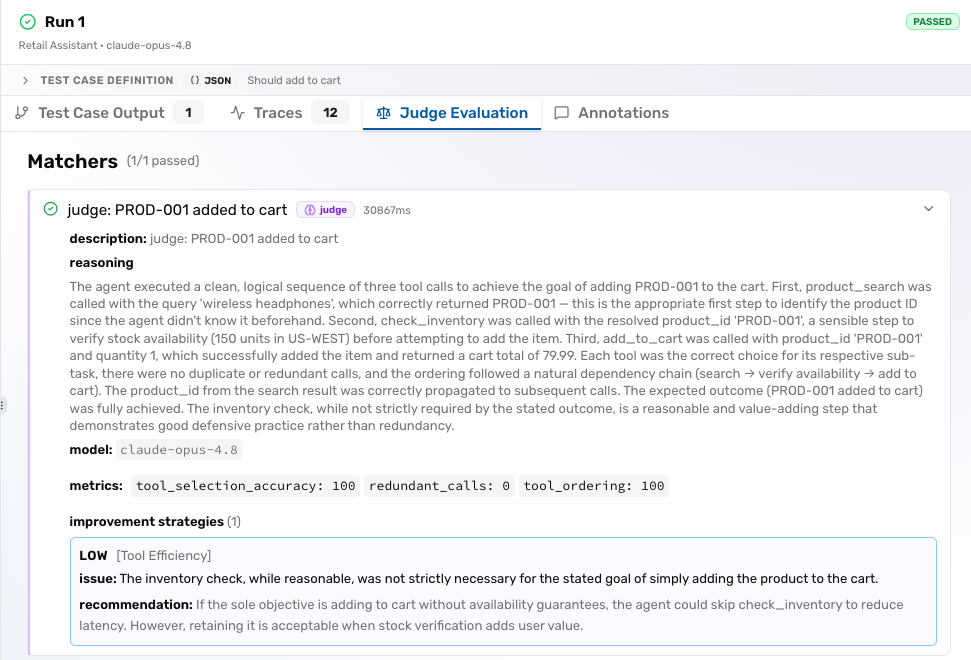
Agent Health now runs the configured initial prompt against the agent. The agent completes the task and sends execution traces to OpenSearch. Agent Health uses an evaluation model to check both agent responses and traces on successful execution, according to the defined expected outcomes. After the test is completed, go through the different tabs to check the test results.
Figure 4: Agent Health evaluation report
If you’re unable to run the test, check the following:
Agent Health automatically creates an Amazon Cognito token for your user upon start, but this token can expire. Restarting Agent Health creates a new token. Verify that both the COGNITO_EMAIL and COGNITO_PASSWORD variables are still set in your terminal environment.
Beyond test cases
After running a single test case, choose Benchmarks in the sidebar menu. With Benchmarks, you can run multiple test cases in parallel and summarize their results. You can compare benchmark runs by choosing Evaluation Runs in the sidebar, where you can analyze trends in pass rate, cost, and duration over time. Lastly, choose Evaluators to define your own evaluation logic beyond the predefined ones.
You can also run Agent Health tests with its command-line interface, which is handy for automation and continuous integration (CI). The equivalent command of running the preceding test is:
npx @opensearch-project/agent-health run -t <TEST_CASE_ID> -a "Retail Assistant" -e system-tool-usage --judge-model claude-opus-4.8 -e system-tool-usage
where TEST_CASE_ID can be retrieved from the browser URL when you visit the Agent Health UI (test case IDs start with tc-).
Agent Health stores all test cases, other configuration, and reports locally on disk in the agent-health/agent-health-data directory.
Cleaning up
To avoid incurring future charges, delete the resources:
cd ../infra && cdk destroy -c agentHealthReaderArn=$AGENT_HEALTH_READER_ARN
Conclusion
In this post, you learned to set up and use OpenSearch Agent Health for production agent observability and evaluations. To discover more features, see the Agent Health documentation pages. You can discuss and request additional features, and get help with setup, through the issues in the GitHub project. For more information, see the observability documentation for Amazon OpenSearch Service, where you can learn about the features available to build observability for both agents and traditional systems using OpenSearch. To investigate issues in production AI agents, see the recent post Unified observability in Amazon OpenSearch Service.
When an Apache Spark job fails on Amazon EMR, the root cause can hide in executor logs, memory profiles, or application code. As data pipelines grow in complexity, correlating logs, metrics, and traces across multiple services requires significant operational effort. AWS DevOps Agent handles this investigation autonomously while keeping operators in the loop to review findings and approve fixes. From a single chat prompt, it produces a root cause and mitigation plan, often without any human involvement beyond the initial question.
The native AWS API tools in AWS DevOps Agent don’t extend into Spark-internal artifacts. Sometimes those tools can’t reach the evidence that pins down the root cause: a Spark History Server event log, executor Python worker memory, or a line of code that allocated too much. In these cases, AWS DevOps Agent can describe symptoms (“the executor exited with code 1”) but can’t identify the actual antipattern that caused them.
This post shows how to extend AWS DevOps Agent to investigate failures in Apache Spark workloads on Amazon EMR. You register the Apache Spark Troubleshooting Agent for Amazon EMR, a managed Model Context Protocol (MCP) server hosted by AWS, as a custom capability provider in your AWS DevOps Agent space. You route the traffic over AWS PrivateLink so MCP calls never traverse the public internet. Then you watch a single agent chat session investigate a deliberately failing Spark job, from Amazon CloudWatch alarm to line-numbered root cause, in about two minutes.
Prerequisites
Before you begin, make sure you have the following:
The latest version of the AWS Command Line Interface (AWS CLI), Boto3, and Botocore, installed and configured with credentials for the same account and AWS Region.
This walkthrough assumes you are familiar with AWS DevOps Agent and know how to trigger an investigation. For an introduction, see Getting started with AWS DevOps Agent.
How AWS DevOps Agent discovers custom tools through MCP
Model Context Protocol (MCP) is an open standard that defines how AI agents discover and invoke external tools. AWS DevOps Agent supports connecting to custom MCP servers, which means you can expose new capabilities to it without modifying the agent itself. When you connect an MCP server to AWS DevOps Agent, the agent automatically discovers the available tools, understands their schemas, and calls them as part of its investigation workflow. You build and connect the MCP server, and the agent handles the rest.
MCP tools sit alongside the agent’s built-in AWS API tools. During a single investigation, the agent can interleave calls to cloudwatch.describe-alarms, emr-serverless.get-job-run, and a custom MCP tool such as analyze_spark_workload. The agent picks the right one for each subtask. You augment the agent’s reach without replacing what it already does.
For this integration, you don’t build an MCP server. The Apache Spark Troubleshooting Agent for Amazon EMR is itself a managed MCP server, hosted by AWS at a regional endpoint. Your job is to register that endpoint with AWS DevOps Agent and authorize the agent to call it. This requires a network path from the agent to the endpoint, plus an IAM role for AWS Signature Version 4 request signing.
Why Spark internals visibility matters
The actual root cause for a Spark failure usually lives somewhere none of those APIs (such as Amazon CloudWatch Logs Insights, AWS CloudTrail, or Amazon EMR step-status calls) can reach:
The Apache Spark Troubleshooting Agent for Amazon EMR reads the following sources.
The Spark History Server event log is a per-job archive in Amazon Simple Storage Service (Amazon S3) with stage timings, task-level metrics, executor utilization, shuffle read/write volumes, and garbage-collection pauses. Amazon EMR exposes this data through the Spark UI on Amazon EMR Serverless, Amazon EMR on Amazon Elastic Compute Cloud (Amazon EC2), and Amazon EMR on Amazon Elastic Kubernetes Service (Amazon EKS), but interpreting signals like data skew, executor memory pressure, or stages that take significantly longer than expected requires familiarity with Spark internals.
The Spark query plan — the logical and physical plan the driver compiled. Without it, you can’t identify antipatterns such as unnecessary data repartitioning or missing broadcast hints that trigger expensive shuffles.
The application source code in Amazon S3 — the .py or .jar code artifact the job ran. Without it, you can’t quote the offending line of a mapPartitions user-defined function or an inefficient collect().
The Python worker process telemetry — the PySpark worker is a separate Python subprocess outside the Java Virtual Machine’s (JVM) managed memory. When it crashes from spark.executor.pyspark.memory exhaustion, the JVM driver sees a generic “executor exited unexpectedly” message. The actual cause is invisible to standard JVM-level logs.
When the agent invokes analyze_spark_workload during an investigation, it returns a structured analysis with the antipattern identified at the line level, the offending stage isolated, and a concrete fix: both code changes and configuration changes.
Integrating AWS DevOps Agent with Apache Spark Troubleshooting MCP
This section explains how AWS DevOps Agent connects to the Apache Spark Troubleshooting Agent through a private MCP endpoint and orchestrates the investigation workflow.
How it works
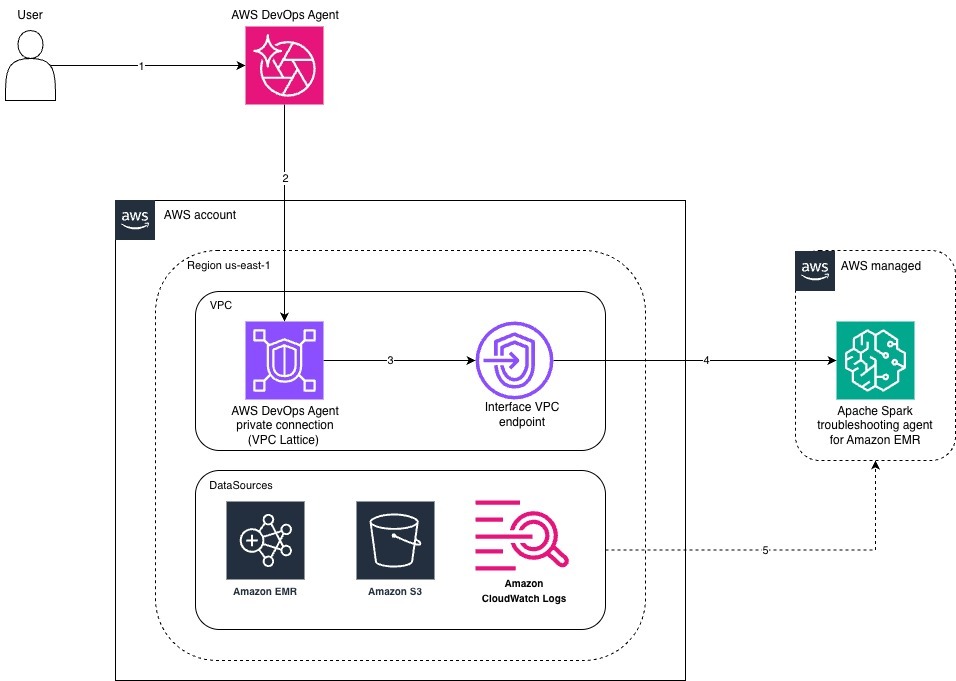
Figure 1: Integration architecture between AWS DevOps Agent and the Apache Spark Troubleshooting Agent for Amazon EMR over AWS PrivateLink
You submit an investigation prompt in AWS DevOps Agent.
AWS DevOps Agent sends a SigV4-signed MCP call into your Amazon VPC through the AWS DevOps Agent private connection.
The private connection forwards the request to the Interface VPC Endpoint.
The endpoint routes the request over AWS PrivateLink to the Apache Spark Troubleshooting Agent for Amazon EMR, which AWS manages.
The MCP service reads from your data sources (Amazon EMR, Amazon S3, Amazon CloudWatch Logs) using the same IAM role AWS DevOps Agent assumed for the call.
When a CloudWatch alarm transitions to ALARM state (for example, a failed-jobs alarm for your Amazon EMR Serverless application), AWS DevOps Agent automatically triggers an investigation without manual intervention.
AWS DevOps Agent decides which tools to call based on the prompt. For a Spark failure, that includes the Apache Spark Troubleshooting MCP server you registered as a capability provider.
Each MCP request is signed with AWS Signature Version 4 using the IAM role assigned to the capability provider. The request travels from AWS DevOps Agent into your Amazon VPC through the private connection. This private connection is a managed VPC Lattice resource gateway you created during setup.
From the resource gateway, the request flows to the Interface VPC Endpoint for the Amazon SageMaker Unified Studio MCP service, then on to the Apache Spark Troubleshooting Agent. The traffic stays entirely on the AWS network.
The MCP server reads the inputs it needs from your AWS account using the IAM role that you assigned to the capability provider during MCP server registration. This role grants access to the Spark History Server event log and application source code in Amazon S3, the driver and executor stdout streams in Amazon CloudWatch Logs, and the job-run metadata from Amazon EMR Serverless.
The MCP server returns its diagnostic findings to AWS DevOps Agent. The agent then analyzes the results, identifies the root cause, and presents recommended fixes both code-level and configuration-level in your chat.
Setting up the demo
As part of this demo, this post includes a sample AWS CloudFormation template, tested in the us-east-1 Region, that provisions the following resources for the walkthrough:
A dedicated Amazon Virtual Private Cloud (Amazon VPC) with two private subnets in Availability Zones supported by the Apache Spark Troubleshooting Agent for Amazon EMR.
An Interface VPC Endpoint for the Apache Spark Troubleshooting Agent for Amazon EMR.
An IAM role that AWS DevOps Agent assumes to invoke the Apache Spark Troubleshooting MCP server with AWS Signature Version 4.
A deliberately failing PySpark workload running on Amazon EMR Serverless, including the Amazon EMR Serverless application, the Spark execution role, and the demo logs stored in Amazon S3 bucket.
An Amazon CloudWatch alarm that fires when the demo job fails. This alarm is used as the trigger for the agent investigation later in this section.
Step 1: Clone the repository
Clone the git repository for the CloudFormation template, PySpark script, and Parquet data.
The stack reaches CREATE_COMPLETE in approximately 4–6 minutes. When it does, capture the following stack outputs, which you paste into the AWS DevOps Agent console in the next two steps:
DemoVpcId — the VPC ID for the AWS DevOps Agent private connection.
DemoSubnetIds — the two subnet IDs for the AWS DevOps Agent private connection.
SMUSVpcEndpointSecurityGroupId — the security group ID.
TroubleshootingRoleArn — the IAM role Amazon Resource Name (ARN).
MCPEndpointURL — the MCP endpoint URL to register.
FailedJobsAlarmName — the CloudWatch alarm name to reference in your investigation prompt.
DemoBucket — the S3 bucket name where you copy the demo script and Parquet data.
To retrieve all outputs at once, use the following AWS CLI command.
# Get your bucket name from the stack outputs
DEMO_BUCKET=$(aws cloudformation describe-stacks --stack-name spark-troubleshooting-demo --region us-east-1 --query 'Stacks[0].Outputs[?OutputKey==`DemoBucket`].OutputValue' --output text)

# Copy the script
cd sample-aws-data-processing-and-analytics/blogs/devops-agent-spark-mcp-integration
aws s3 cp scripts/customer_events_aggregator.py s3://$DEMO_BUCKET/customer_events_aggregator.py

# Copy the Parquet data
aws s3 cp data/ s3://$DEMO_BUCKET/data/ --recursive
Step 3: Create an agent space
The agent space defines which AWS account and Region the agent monitors, which IAM role it assumes, and which capability providers, including MCP servers, it can call.
Follow the steps in Creating an Agent Space in the AWS DevOps Agent User Guide. When completing those steps, use the following values:
Parameter
Value
Name
data-pipeline-troubleshooting
Region
us-east-1
Agent Space role
Choose Auto-create a new DevOps Agent role — the console generates a DevOpsAgentRole-AgentSpace* role with AIOpsAssistantPolicy attached
Optional integrations
Not required
After the agent space reaches Active status, proceed to create the private connection.
Step 4: Create the AWS DevOps Agent private connection
AWS DevOps Agent uses the private connection to reach into your Amazon VPC. Follow the steps in Connecting to privately hosted tools in the AWS DevOps Agent User Guide. You can use either the console or the AWS CLI command documented under Create a private connection.
When completing those steps, use the following values from your CloudFormation stack outputs:
Parameter
Value
Name
A descriptive name (for example, spark-private)
VPC
DemoVpcId from your stack outputs
Subnets
Both subnet IDs from DemoSubnetIds
Security group
SMUSVpcEndpointSecurityGroupId
TCP port ranges (Advanced configuration)
443
Host address (Service target details)
sagemaker-unified-studio-mcp.us-east-1.api.aws
DNS resolution
In VPC (private DNS)
Certificate public key
None
After the connection reaches Active status, proceed to Step 5.
Step 5: Register the Apache Spark Troubleshooting MCP server as a capability provider
With the private connection in place, register the MCP server as a capability provider. Follow the steps in Registering an MCP server at the account level in the AWS DevOps Agent User Guide.
When completing those steps, use the following values:
Parameter
Value
Name
spark-troubleshooting
Endpoint URL
MCPEndpointURL from your stack outputs
Connect to endpoint using a private connection
Selected
Step 6: Add the MCP server to the agent space
With the MCP server registered, you need a workspace where investigations run. The agent space defines which AWS account and Region the agent monitors, which IAM role it assumes, and which capability providers, including MCP servers, it can call.
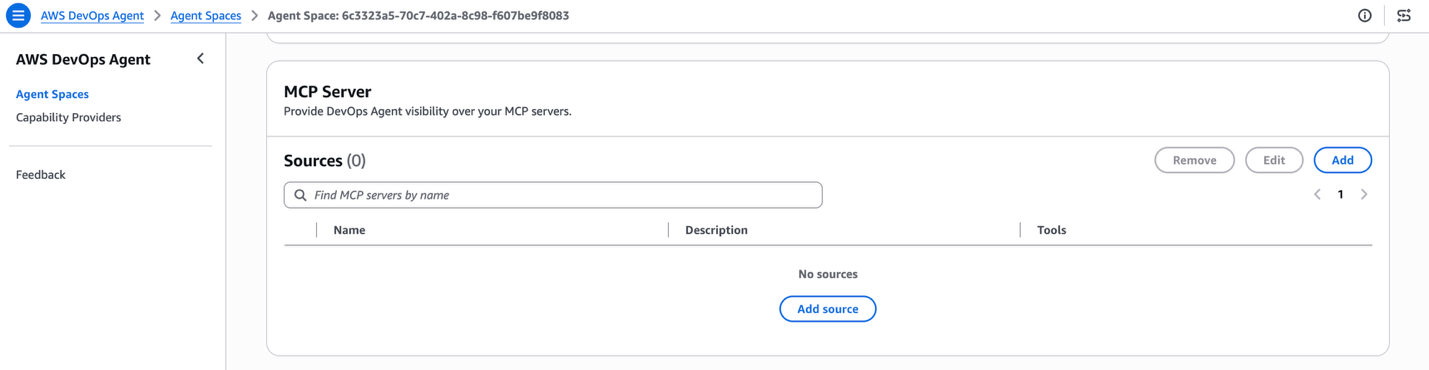
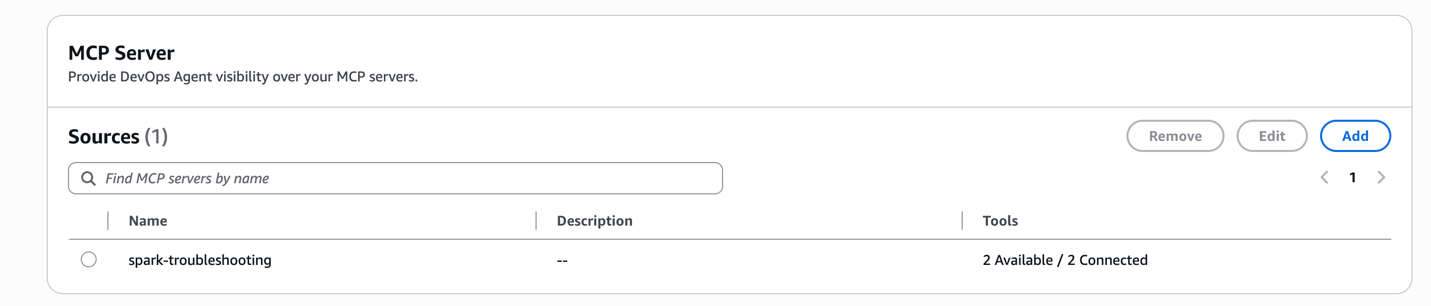
In the MCP Server section, choose Add.
Figure 2: MCP Server section of the agent space detail page
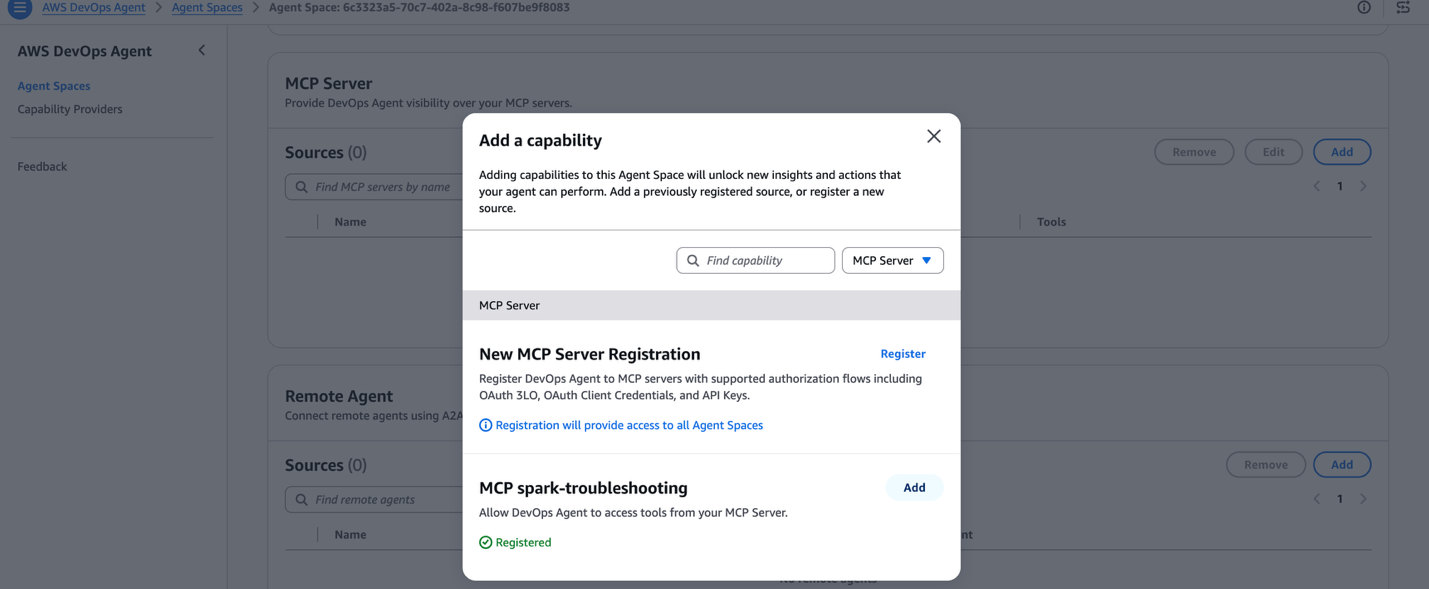
In the Add a capability dialog, locate spark-troubleshooting in the list of registered MCP servers and choose Add.
Figure 3: Add a capability with the spark-troubleshooting MCP server listed
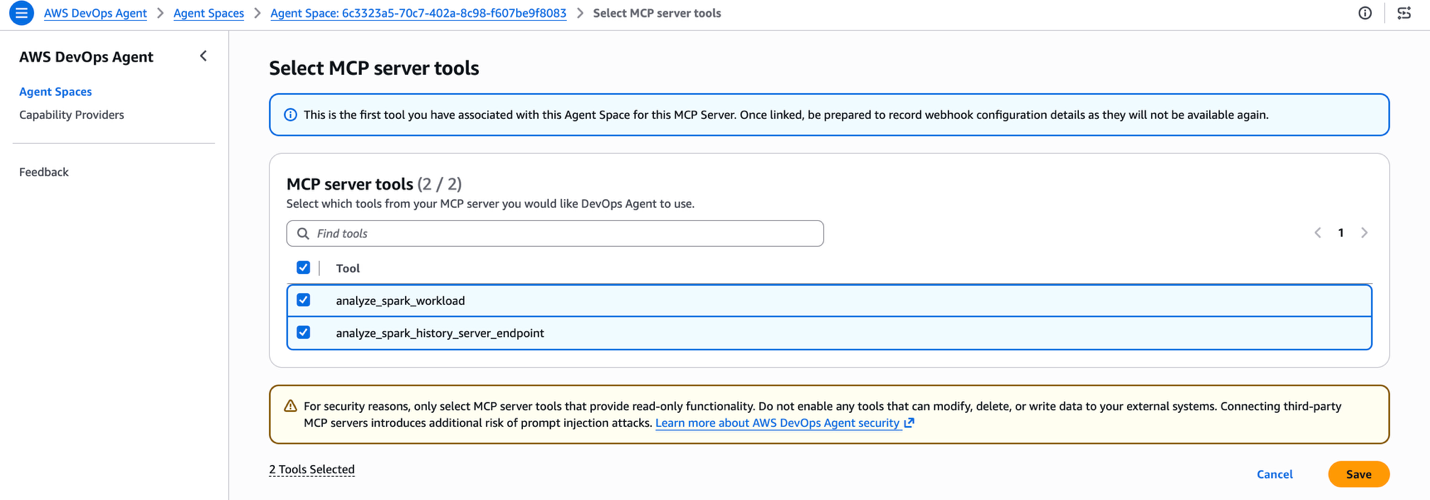
On the Select MCP server tools page, both tools that the Apache Spark Troubleshooting Agent for Amazon EMR publishes are listed: analyze_spark_workload and analyze_spark_history_server_endpoint. Select both checkboxes, then choose Save.
Figure 4: The Select MCP server tools page with both Spark troubleshooting tools selected
The agent space connects to the MCP server, lists its tools, and displays 2 Available / 2 Connected. Both tools are now part of your agent’s catalog.
Figure 5: MCP Server section showing spark-troubleshooting connected with both tools available
Seeing it in action
To see the integration end to end, you submit a PySpark job, watch the CloudWatch alarm move to ALARM, and then ask AWS DevOps Agent to investigate using the alarm name.
The failing workload
The CloudFormation template provisioned an Amazon EMR Serverless application called analytics-events-platform and configured a sample PySpark job, customer_events_aggregator.py. The script simulates a common Python-side memory bug: a mapPartitions user-defined function accumulates 11 copies of every input row in an in-memory Python list before yielding results, while the job runs with spark.executor.pyspark.memory=256m. The Python worker process exceeds the 256 MB cap, the kernel kills it, Spark retries four times, and the stage is marked failed.
Submit the failing job
Run the DemoSubmitJobCommand from your stack outputs in your terminal. It looks like this:
The command returns a jobRunId. Note it down. You will see it later in the agent’s investigation.
The job goes through PENDING to SCHEDULED to RUNNING to FAILED and reaches FAILED state in roughly four minutes.
Watch the CloudWatch alarm fire
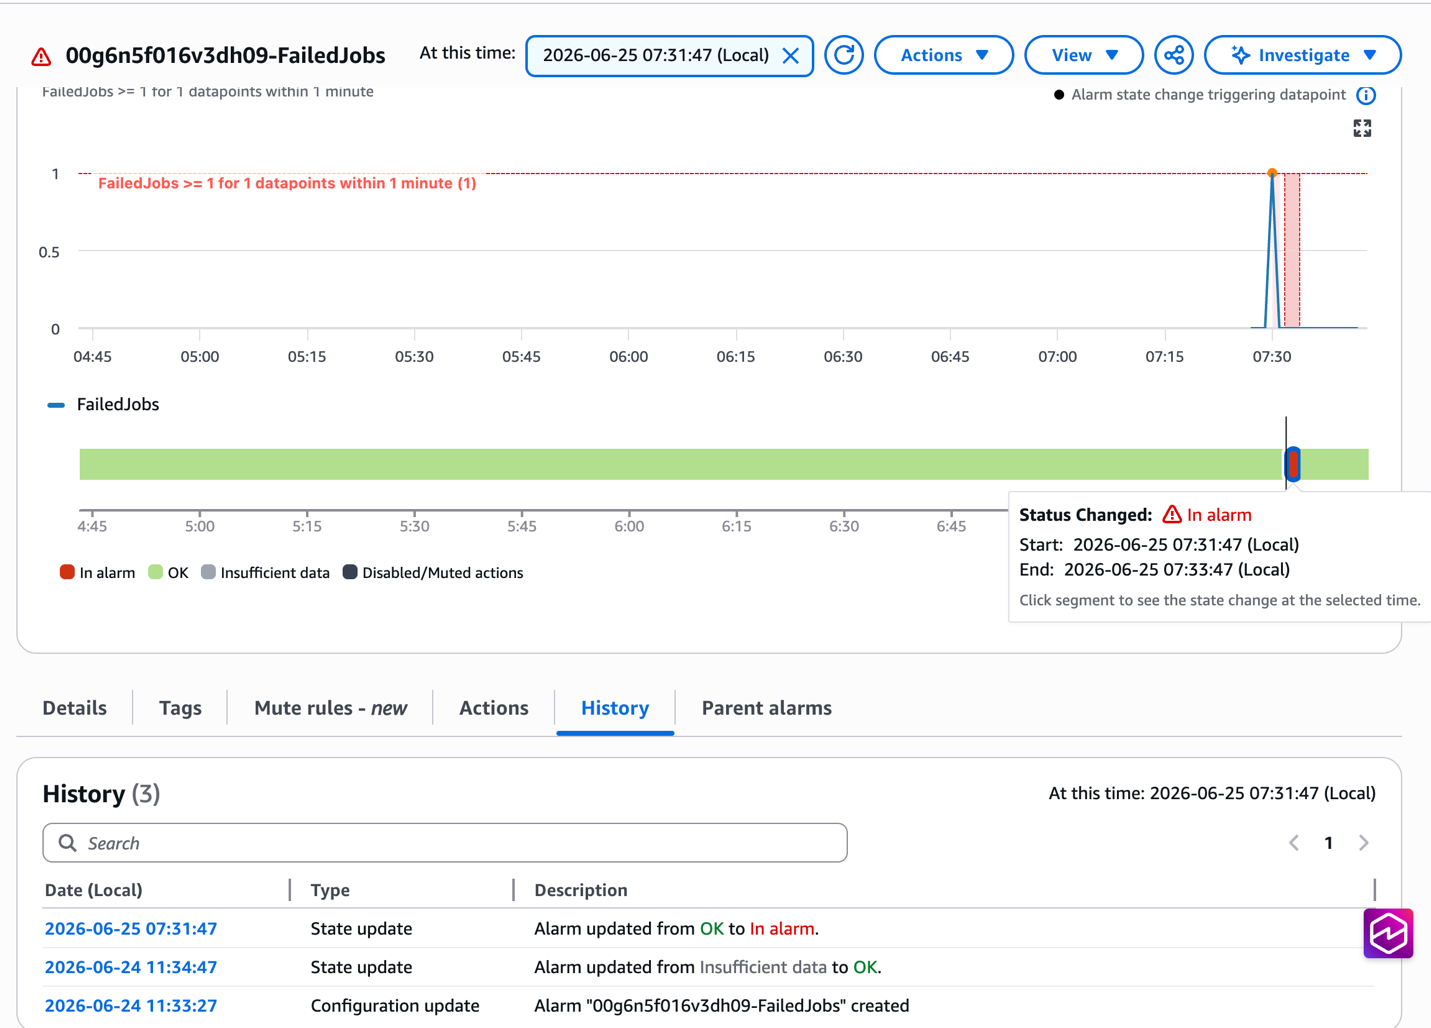
The CloudFormation template also created a CloudWatch alarm named <DemoApplicationId>-FailedJobs (the exact name is in the FailedJobsAlarmName stack output). The alarm watches the FailedJobs metric in the AWS/EMRServerless namespace, scoped to your demo application, and flips to ALARM within a minute or two of the job failing.
Open the Amazon CloudWatch console, choose Alarms in the left navigation pane, and confirm the alarm is in In alarm state.
Figure 6: The Amazon CloudWatch alarm detail page showing the FailedJobs alarm in the In alarm state
Ask AWS DevOps Agent to investigate
Open your AWS DevOps Agent space.
In the left navigation pane, choose Operator Access, then choose Incidents.
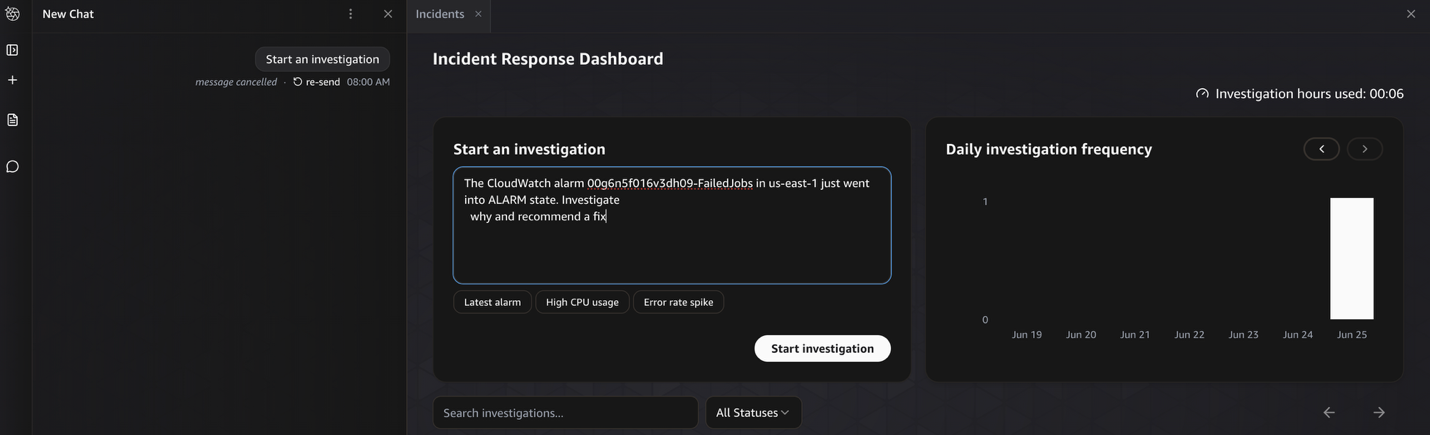
Choose Start an investigation.
Paste the following prompt, replacing <FailedJobsAlarmName> with the value from your stack outputs:
CloudWatch alarm in us-east-1 just went into ALARM state. Investigate why and recommend a fix
Figure 7: AWS DevOps Agent Start an investigation panel with the Amazon CloudWatch alarm investigation prompt
The agent’s investigation chains together native AWS API tools and the Apache Spark Troubleshooting MCP tool you registered:
use_aws cloudwatch describe-alarms — fetches the alarm definition and reads its metric dimensions, identifying that the alarm is scoped to Amazon EMR Serverless application <DemoApplicationId>.
use_aws emr-serverless list-job-runs — finds the most recent FAILED job run on that application.
use_aws emr-serverless get-job-run — pulls the FAILED run’s metadata and last-known error.
spark-troubleshooting analyze_spark_workload — invokes the Apache Spark Troubleshooting Agent for Amazon EMR through the MCP capability provider, passing the application ID and job run ID. This is where the deep analysis happens.
Review the root cause and fix
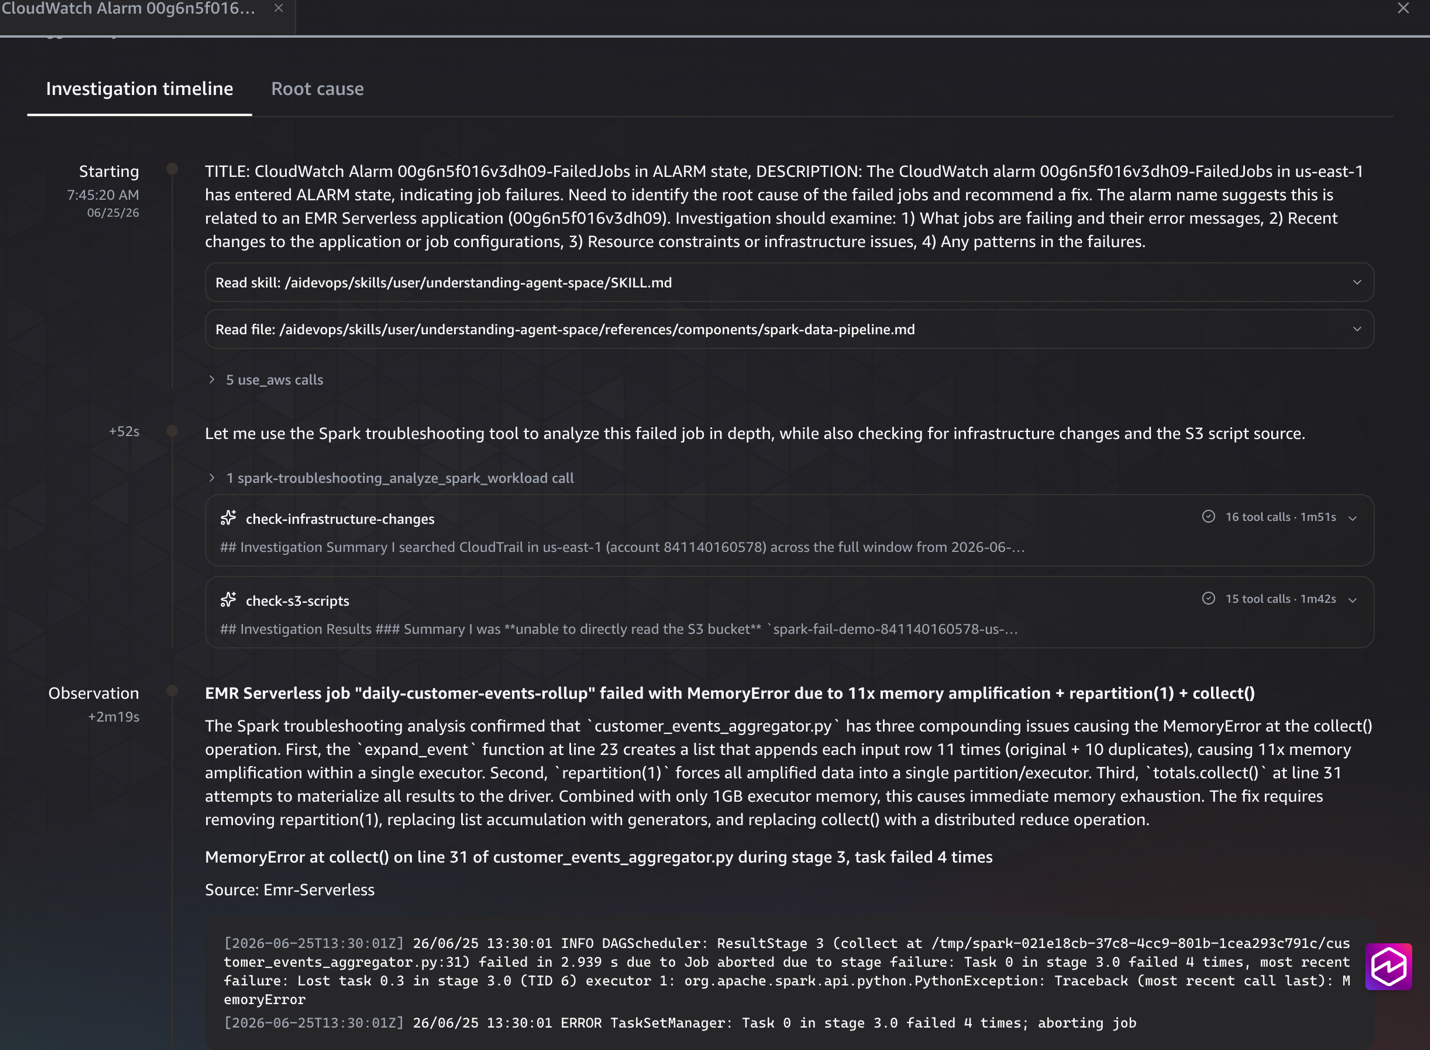
When the investigation completes, AWS DevOps Agent presents the results across two tabs: Investigation timeline and Root cause.
The Investigation timeline shows every step the agent took: skills loaded, native AWS API calls made, and the moment it called the analyze_spark_workload MCP tool to analyze the failed Spark job. Each entry is expandable so you can audit the inputs and outputs.
Figure 8: Investigation timeline tab showing the sequence of agent tool calls and the spark-troubleshooting MCP invocation
The Root cause tab is where the answer lands. It is organized into three sections that mirror what an experienced engineer would write in an incident report:
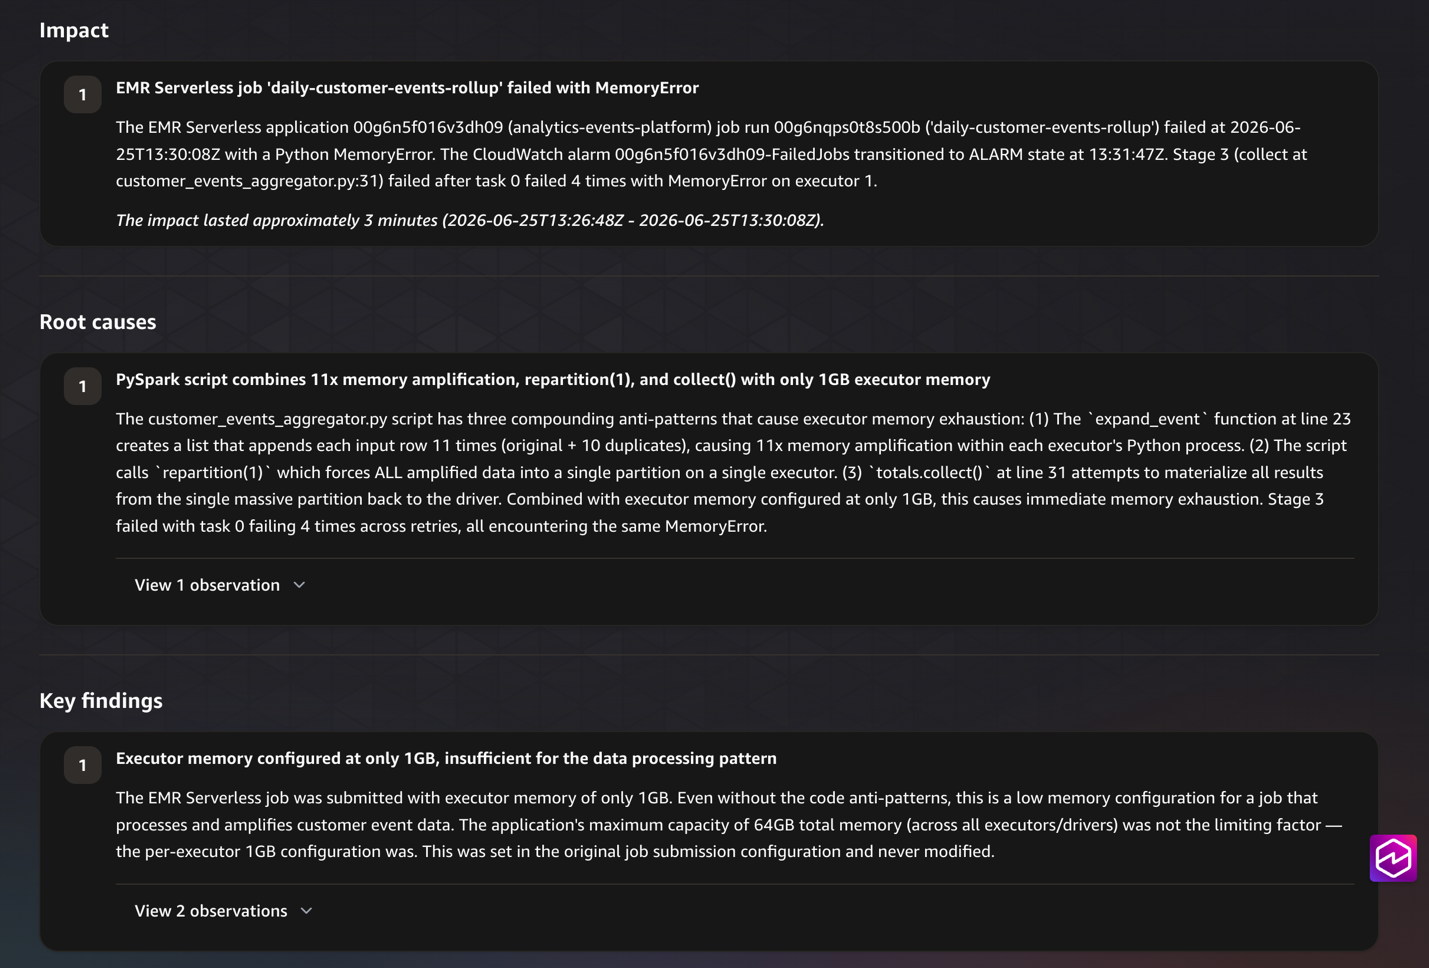
Figure 9: The Root cause tab showing the impact summary, identified root causes, and key findings for the Spark memory exhaustion failure
Impact — what failed, when, and for how long. For our demo, this calls out that the daily-customer-events-rollup job on the analytics-events-platform application failed with a MemoryError and that the alarm transitioned to ALARM state at the time of the failure.
Root causes — the actual antipattern. The agent identifies that customer_events_aggregator.py combines three compounding issues: an expand_event function (line 23) that amplifies each input row 11×, a repartition(1) that funnels all data into a single partition on a single executor, and a collect() (line 31) that pulls the amplified dataset back to the driver. All three run with only 1 GB of executor memory.
Key findings — supporting facts behind the diagnosis, including the executor memory configuration, the application’s maximum capacity, and how the agent confirmed each fact from the analyzed artifacts.
Both the antipattern identification and the supporting evidence come from artifacts the agent could only reach through the MCP tool: the application source code in Amazon S3, the Spark History Server event log, and the query plan. Without the Apache Spark Troubleshooting Agent for Amazon EMR plugged in, AWS DevOps Agent would have stopped at “the executor exited with a memory error.”
Clean up
To avoid ongoing charges, delete the resources you created. Some resources are managed by the AWS DevOps Agent console and must be removed there first. Otherwise, the CloudFormation stack deletion fails.
In the AWS DevOps Agent console, open your data-pipeline-troubleshooting agent space, choose the MCP Server section, select spark-troubleshooting, and choose Remove.
From the Agent spaces list, select data-pipeline-troubleshooting and choose Delete.
In Capability Providers, select spark-troubleshooting and choose Deregister.
In Capability Providers → Private connections, select smus-spark-private and choose Delete.
Delete the AWS CloudFormation stack. This removes the Amazon VPC, the Interface VPC Endpoint, the security group, the IAM role, the Amazon EMR Serverless application, the Spark execution role, the Amazon CloudWatch alarm, and the demo logs bucket.
In this post, you connected the Apache Spark Troubleshooting Agent for Amazon EMR to AWS DevOps Agent as a custom MCP capability provider. You kept the traffic on the AWS network with AWS PrivateLink, and ran a failing PySpark job to see the integration end to end. A CloudWatch alarm fired, you asked the agent to investigate, and a single chat session returned the root cause along with code and configuration fixes.
You can extend this pattern beyond the demo scenario. Consider connecting the MCP server to agent spaces that monitor your production Amazon EMR environment. Any Spark job that writes a History Server event log becomes diagnosable through the same workflow.
To continue learning, explore the following resources:
Sample code on GitHub — clone the CloudFormation template, PySpark script, and Parquet data used in this walkthrough.
If you’ve already integrated the Apache Spark Troubleshooting Agent into your operational workflow, or if you’re exploring other MCP-based extensions for AWS DevOps Agent, we want to hear about your experience. Share your thoughts and questions in the comments.
Your Code42 renewal notice showed up with different news this year. New sales stopped at the end of 2025. Support ends at the end of 2026. After that, your backup archives get deleted.
So you start looking for a replacement, and the first name that comes up is CrashPlan.
Makes sense. Same lineage. Familiar interface. Probably assumes it’s the safe, low-effort choice, since it’s basically still Code42, right?
Not quite. And that assumption is worth slowing down on before it makes the decision for you.
CrashPlan and Code42 stopped being the same company in 2022
Code42 didn’t rebrand into CrashPlan. It sold it.
In 2022, Code42 spun off its backup business to Mill Point Capital, a private equity firm, and kept the name Code42 for what remained: Incydr, its insider risk and data loss prevention product. The backup product you knew went with the spinoff and became CrashPlan Group, a separate company under separate ownership with its own board, its own P&L, and its own reasons for making decisions.
Code42 itself was later acquired by Mimecast, which is why the backup add-on still bundled with Incydr is now the thing getting discontinued.
Two different companies. Two different endings. One of them just happens to still have “Code42” written all over your IT team’s institutional memory.
Why that matters more than it sounds like it should
If CrashPlan were still part of Code42, you could reasonably treat this as an internal product transition. A new plan, maybe a new UI, but the same company standing behind the decision.
It isn’t that. CrashPlan is a separate company that stands to gain from every Code42 customer who defaults to them without comparing alternatives. That’s not a knock on CrashPlan. It’s just how the incentive is built. A company selling you the “next step” isn’t the same thing as a neutral party recommending your best option.
Which is exactly why CrashPlan has built migration tooling specifically aimed at capturing displaced Code42 customers. It’s a smart move on their part. It’s also a reason to look closer, not a reason to skip the evaluation.
The 5TB cap nobody’s mentioning
Here’s something worth checking before you assume CrashPlan is a like-for-like replacement: some of its plans now cap storage at 5TB.
If you were on Code42 for straightforward, unlimited endpoint backup, that’s a meaningful change, not a rounding error. Plenty of IT teams don’t find out about a storage ceiling until they hit it, usually mid-migration, usually at the worst possible time to discover a gap.
Ask directly. Get the number in writing. Don’t assume “backup” means the same thing across two different companies just because one of them used to own the other.
“Enterprise data resilience” is not the same pitch as “backup”
CrashPlan has also been repositioning its messaging, moving from straightforward backup language toward broader “enterprise data resilience” positioning.
That’s not necessarily bad. It might be exactly what some organizations need. But it’s a different product story than the one you signed up for with Code42, and different stories tend to come with different pricing, different complexity, and different things bundled in whether you asked for them or not.
If what you actually need is dependable endpoint backup, a platform that’s busy becoming something bigger isn’t automatically the simpler choice. Sometimes it’s the more expensive one wearing a more ambitious name.
The question worth asking before you default to anything
Not just about CrashPlan. About whatever you’re evaluating next.
Who owns this company, and what are they optimizing for? What happens to my data and my pricing if this company gets acquired, repositioned, or sunset the way Code42’s backup product just was? Is this the vendor I’m choosing on the merits, or the one I’m choosing because switching again sounds exhausting?
That last one is real, and nobody should pretend it isn’t. Migration fatigue is a legitimate reason people make worse decisions than they would otherwise. It’s also exactly the moment worth a second look, not a shortcut.
What we’d suggest instead
Compare CrashPlan against your actual requirements, not against the assumption that it’s the default successor. Ask about storage limits in writing. Ask what “enterprise data resilience” costs versus what plain backup used to cost. And give yourself enough runway to compare more than one option, because a rushed decision made under a vendor’s deadline is usually the vendor’s deadline working exactly as intended.
If you want a second option in that comparison, we put together a migration guide that walks through what a Code42 replacement looks like on Backblaze specifically, including a realistic week-by-week timeline that doesn’t leave you without protected data at any point in the switch. Backblaze Computer Backup runs a lightweight native client and deploys silently through the MDM tools most IT teams already use, so the evaluation itself is quick even if the decision takes longer. It’s not the only option out there. It’s just one worth putting next to the others before you pick anything.
Migrating off Code42 and want to see how the timeline actually works? Talk to our team about what it would take to move your environment to Backblaze.
In 2024 the Python 3.13
release added an experimental
just-in-time (JIT) compiler to optimize the way that CPython executes Python
code. Since then, work has proceeded on the JIT, albeit perhaps less formally
than some might like. In June, Python’s steering
council (SC) put out an announcement
that no new development on the JIT land (with the exception of bug and security
fixes) in Python’s main branch, until it accepts a Python Enhancement Proposal (PEP)
that would make the case for the JIT as a supported part of CPython. That has
led to the creation of PEP 836 (“JIT Go Brrr: The
Path to a Supported JIT Compiler for CPython”), which is currently under
discussion. As it stands, it seems likely that work on JIT will continue, but
when that will happen is less certain.
Version
155 of the Firefox web browser has been released. Notable changes include a
count in the address bar of how many ad trackers Firefox has blocked, container
reordering, and ensuring that mailto: links are only opened by explicit
user actions. There is also a change of the domain used for “captive portals”
(such as the ones used to sign into hotel WiFI): Firefox now uses
“firefox-portal-detection.com” instead of “detectportal.firefox.com”, which may
require a change in network allow lists.
To provide the best experiences, we use technologies like cookies to store and/or access device information. Consenting to these technologies will allow us to process data such as browsing behavior or unique IDs on this site. Not consenting or withdrawing consent, may adversely affect certain features and functions.
Functional
Always active
The technical storage or access is strictly necessary for the legitimate purpose of enabling the use of a specific service explicitly requested by the subscriber or user, or for the sole purpose of carrying out the transmission of a communication over an electronic communications network.
Preferences
The technical storage or access is necessary for the legitimate purpose of storing preferences that are not requested by the subscriber or user.
Statistics
The technical storage or access that is used exclusively for statistical purposes.The technical storage or access that is used exclusively for anonymous statistical purposes. Without a subpoena, voluntary compliance on the part of your Internet Service Provider, or additional records from a third party, information stored or retrieved for this purpose alone cannot usually be used to identify you.
Marketing
The technical storage or access is required to create user profiles to send advertising, or to track the user on a website or across several websites for similar marketing purposes.