Tag Archives: Amazon SageMaker Data & AI Governance

Automate data lineage in Amazon SageMaker using AWS Glue Crawlers supported data sources

Post Syndicated from Mohit Dawar original https://aws.amazon.com/blogs/big-data/automate-data-lineage-in-amazon-sagemaker-using-aws-glue-crawlers-supported-data-sources/

The next generation of Amazon SageMaker is the center for all your data, analytics, and AI. Bringing together widely adopted Amazon Web Services (AWS) machine learning (ML) and analytics capabilities, it delivers an integrated experience for analytics and AI with unified access to all your data. From Amazon SageMaker Unified Studio, a single data and AI development environment, you can access your data and use a suite of powerful tools for data processing, SQL analytics, model development, training and inference, and generative AI development.

With data lineage, now part of Amazon SageMaker Catalog, you can centralize lineage metadata of your data assets in a single place. You can track the flow of data over time, determining a clear understanding of where it originated, how it has changed, and its usage across the business. By providing this level of transparency, data lineage helps data consumers gain trust that the data is correct and compliant for their use cases. With data lineage captured at the table, column, and job level, data producers can conduct impact analysis of changes in their data pipelines and respond to data issues when needed, for example, when a column in the resulting dataset is missing the quality required by the business.

Data lineage is a powerful tool that can transform how organizations understand and manage their data flows. In this post, we explore its real-world impact through the lens of an ecommerce company striving to boost their bottom line.

To illustrate this practical application, we walk you through how you can use the prebuilt integration between SageMaker Catalog and AWS Glue crawlers to automatically capture lineage for data assets stored in Amazon Simple Storage Service (Amazon S3) and Amazon DynamoDB. Using this workflow, you can capture lineage automatically from additional data sources using AWS Glue crawlers. Refer to the Data lineage support matrix in the SageMaker Unified Studio User Guide for supported sources. We also use SageMaker Unified Studio to navigate these data assets and learn about their origin, transformations, and dependencies, thanks to the lineage metadata captured using the AWS Glue crawlers.

Key features of the SageMaker Catalog lineage graph

In SageMaker Unified Studio, you can explore and discover data assets of your organization suited for your use case. As you dive into these data assets, you can learn more about its business context, schema, quality, and lineage. When you decide to work with a subset of these assets, you can subscribe to them in a self-service fashion and start working with them. For more detail, visit Data discovery, subscription, and consumption in the SageMaker Unified Studio User Guide.

SageMaker Studio provides a visual lineage graph that shows how a data asset has evolved from its source through transformations to its final state. This helps data scientists, engineers, and analysts answer key questions such as:

  • Where did this data come from?
  • What transformations has it gone through?
  • Which downstream assets will be impacted by a change?

With this level of visibility, teams can perform faster impact analysis, find the root cause of data quality issues, and ensure models are built on trusted data. It also supports better collaboration so users can confidently use and share data across the organization. The following screenshot shows how SageMaker Unified Studio visualizes data lineage, making it straightforward to trace data flow and understand dependencies.
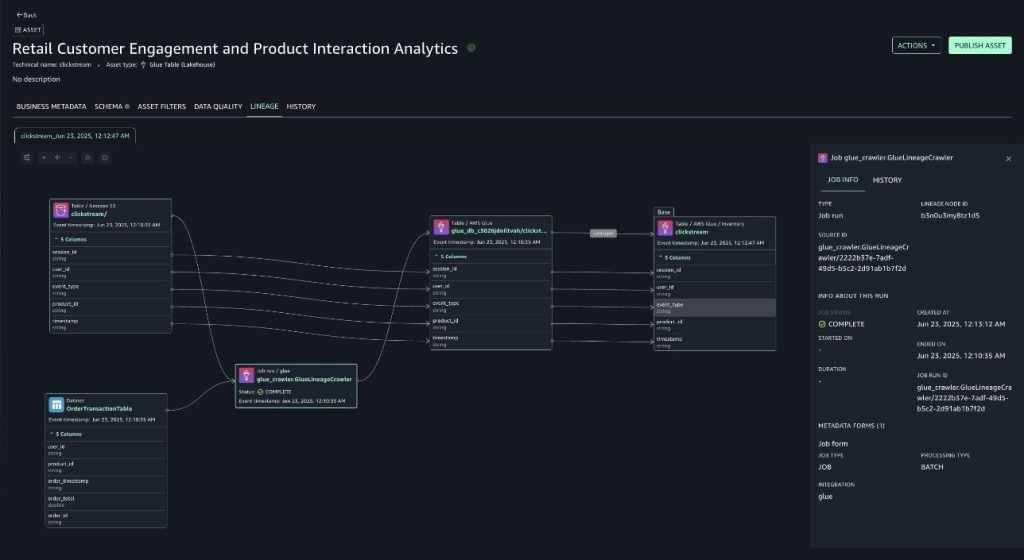
  • Column-level lineage – You can expand column-level lineage when available in dataset nodes. This automatically shows relationships with upstream or downstream dataset nodes if source column information is available.
  • Column search – If the dataset has more than 10 columns, the node presents pagination to navigate to columns not initially presented. To quickly view a particular column, you can search on the dataset node that lists only the searched column.
  • Details pane – Each lineage node captures and displays the following details:
    • Every dataset node has three tabs: LINEAGE, SCHEMA, and HISTORY. The HISTORY tab lists the different versions of lineage event captured for that node.
    • The job node has a details pane to display job details with the tabs Job info and History. The details pane also captures queries or expressions run as part of the job.
  • View dataset nodes only – If you want to filter out the job nodes, you can choose the open view control icon in the graph viewer and toggle the display dataset nodes only, which will remove all the job nodes from the graph and let you navigate only the dataset nodes.
  • Version tabs – All lineage nodes in Amazon DataZone data lineage will have versioning, captured as history, based on lineage events captured. You can view lineage at a selected timestamp that opens a new tab on the lineage page to help compare or contrast between the different timestamps.

You can try some of these features as you explore the data assets of this post. To learn more on data lineage in SageMaker, we encourage you to dive deep into the Data lineage in Amazon SageMaker Unified Studio.

Solution overview

Imagine a scenario where an ecommerce company aims to optimize conversion rates and enhance customer experience by gaining deeper insights into the customer journey. They need to connect the dots between user interactions and actual purchases, but with data scattered across multiple sources, where do they begin? This is where data lineage becomes invaluable. To perform their analysis, they need data from two primary sources:

  • Clickstream data stored in Amazon S3 (in JSON or Parquet format)
  • Transactional order data stored as items in Amazon DynamoDB

To make these datasets discoverable across the business, you need to:

  1. Create a project in SageMaker Unified Studio that will be used to source and manage the datasets
  2. Enable data lineage capture in the SageMaker Unified Studio project
  3. Set up the resources for this use case, which includes an AWS Glue data source (set up in SageMaker Unified Studio) and AWS Glue crawler (set up in AWS Glue)
  4. Run the AWS Glue crawler to catalog the datasets in AWS Glue Data Catalog
  5. Source the metadata of the data assets into the SageMaker Catalog by running the data source
  6. Use SageMaker Unified Studio to navigate through the lineage of the data assets and visualize their origin
  7. Understand how schema evolution is captured in the data asset’s lineage

Prerequisites

To complete the steps on this post, you need an SageMaker Unified Studio domain already deployed in your AWS account. To get started quickly in a testing environment, we suggest creating your SageMaker domain using the quick setup option as explained in Create an Amazon SageMaker Unified Studio domain – quick setup.
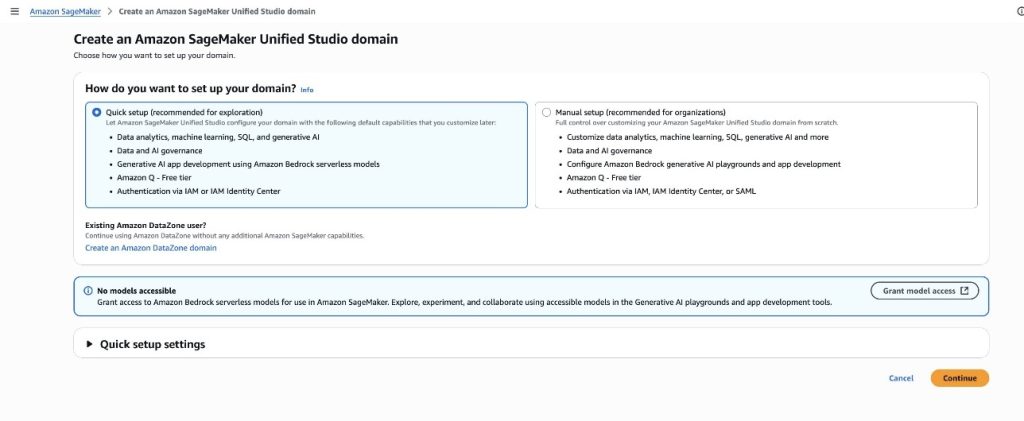
Solution steps

To capture data lineage for AWS Glue tables managed with AWS Glue crawlers using SageMaker Unified Studio, complete the steps in the following sections.

Set up a SageMaker project with SQL capability

In SageMaker Unified Studio, a project profile defines an uber template for projects in your Amazon SageMaker unified domain. By setting up a project with the right tooling (project profile), you will provision resources you can use to work with data, which might include cataloging it in SageMaker, transforming it into new data assets, analyzing it to drive business value, or even use it for ML or AI applications.

To demonstrate data lineage effectively, we use SageMaker SQL analytics project profile for a streamlined setup. Although this profile offers comprehensive data analytics capabilities, we focus specifically on two key components:

  • AWS Glue database – A lakehouse for storing and managing technical metadata
  • Data source job – Automatically collects and tracks metadata into SageMaker Catalog

We’ve chosen this profile to bypass complex manual configurations so we can focus on the core concepts of data lineage.

To create a new project in your SageMaker domain using the SQL analytics project profile, follow the steps detailed in SQL analytics project profile. Keep all default configurations when creating the project.
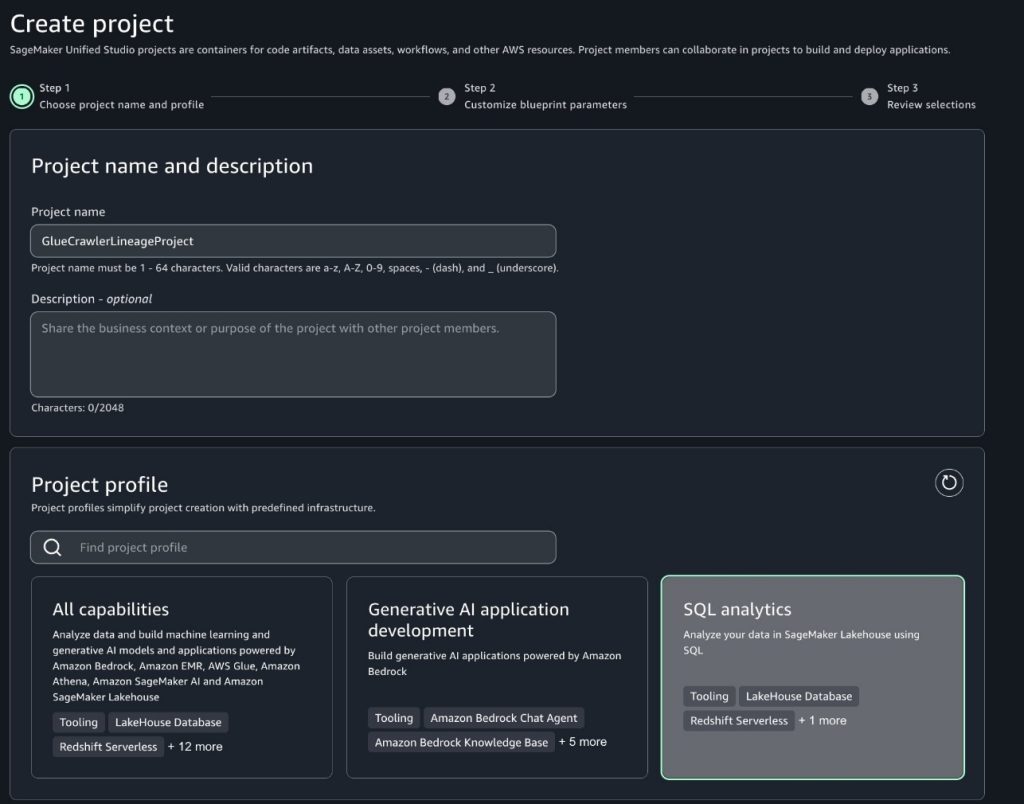
After creating your project in SageMaker Studio, you’ll unlock powerful data lineage capabilities that make tracking and understanding your data flows intuitive. Through the data sourcing feature, you can easily monitor how data moves from source to the AWS Glue database. This visibility becomes particularly valuable when debugging data issues—you can quickly trace data back to its source, understand how changes impact downstream processes, and identify affected analyses or reports. Next, populate the AWS Glue database with sample data to observe these features in action and demonstrate how they can streamline your data operations.

For further guidance on how to access the details of the new SageMaker project, refer to Get project details. After you access the data source details, in the Database name field, take note of the AWS Glue database name associated to the SageMaker project.
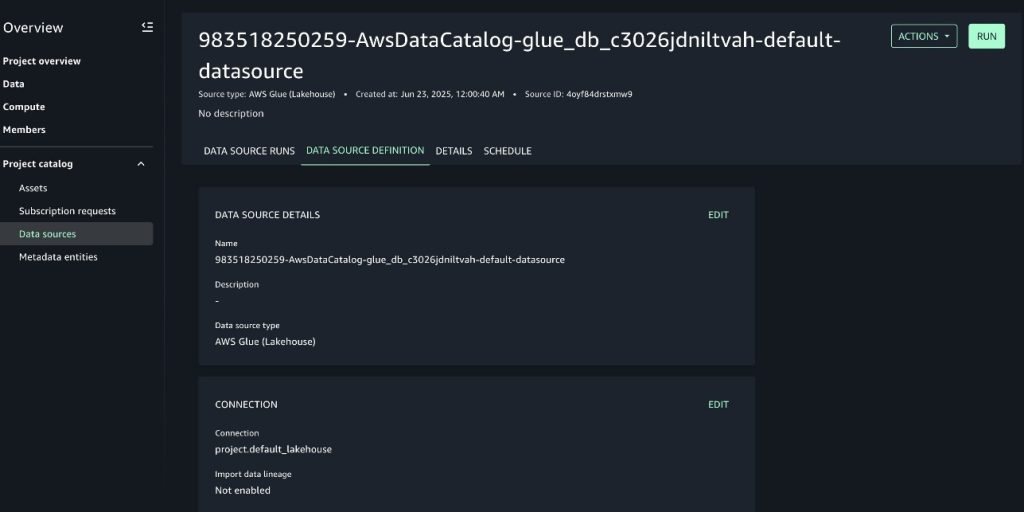
Enable data lineage capture in the SageMaker project’s data source

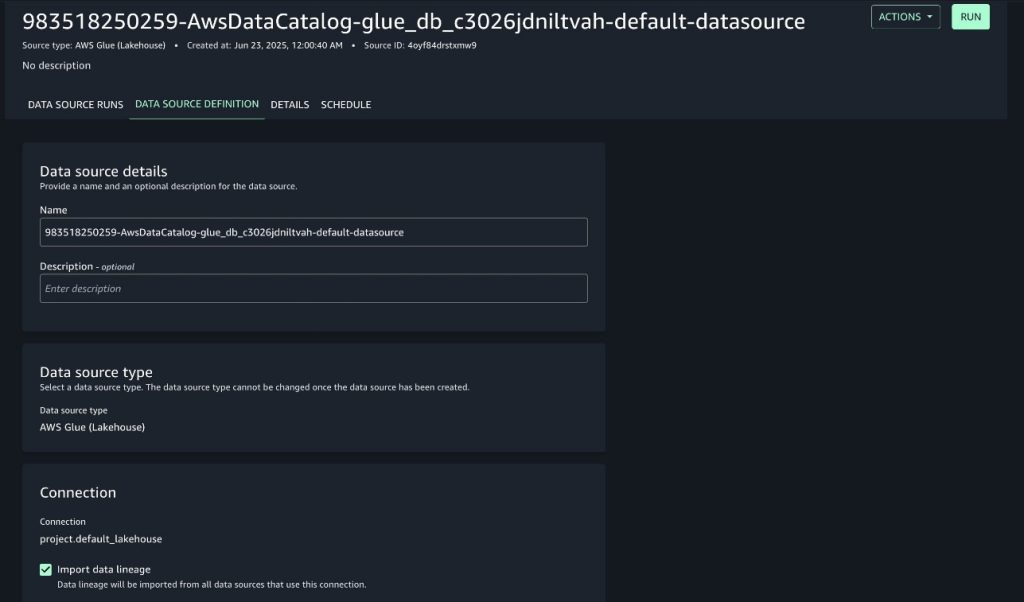
To enable lineage capture, follow these steps:

  1. Expand the Actions menu, then choose Edit data source.
  2. Go to the connections and select Import data lineage to configure lineage capture from the source, as shown in the following screenshot.
  3. Make other changes to the data source fields as desired, then choose Save.

Enabling lineage will make sure the data source job will capture lineage in the next run.
Deploy resources for the use case

Follow these steps:

  1. To deploy the resources required for this post, download the AWS CloudFormation template amazon-datazone-examples in the AWS Samples GitHub repository. Deploy it in your AWS account.

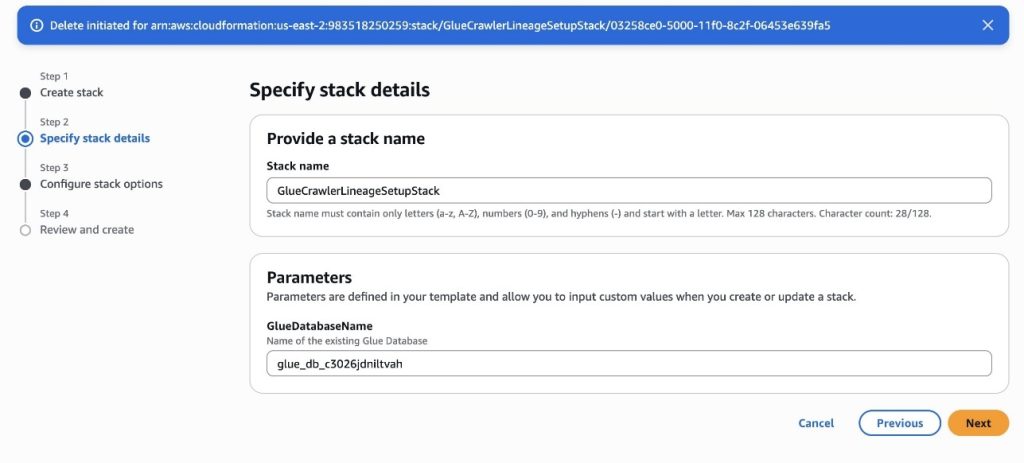
For further guidance on how to deploy a CloudFormation stack, refer to Create a stack from the CloudFormation console. You need to provide a Stack name and the name of the AWS GlueDatabaseName associated to the project of your SageMaker domain, as shown in the following screenshot.

  1. Choose Next.

The template will deploy the following resources:

  • A S3 bucket with a sample file of clickstream data. The bucket name and location of the file will follow the path pattern s3://ecomm-analytics-<ACCOUNT_ID>-<REGION>/clickstream/<YYYY>/<MM>/<DD>/data.json. The file will contain a sample record with the following structure:
{
    "session_id": "abc123",
    "user_id": "u789",
    "event_type": "product_view",
    "product_id": "prod456",
    "timestamp": "2025-06-04T09:23:12Z"
}
  • A DynamoDB table with a sample item of order data (transactions). The table will be named OrderTransactionTable. The sample item will have the following structure:
{
    "order_id": "ord789",
    "user_id": "u789",
    "product_id": "prod456",
    "order_total": 79.99,
    "order_timestamp": "2025-06-04T09:27:10Z"
}
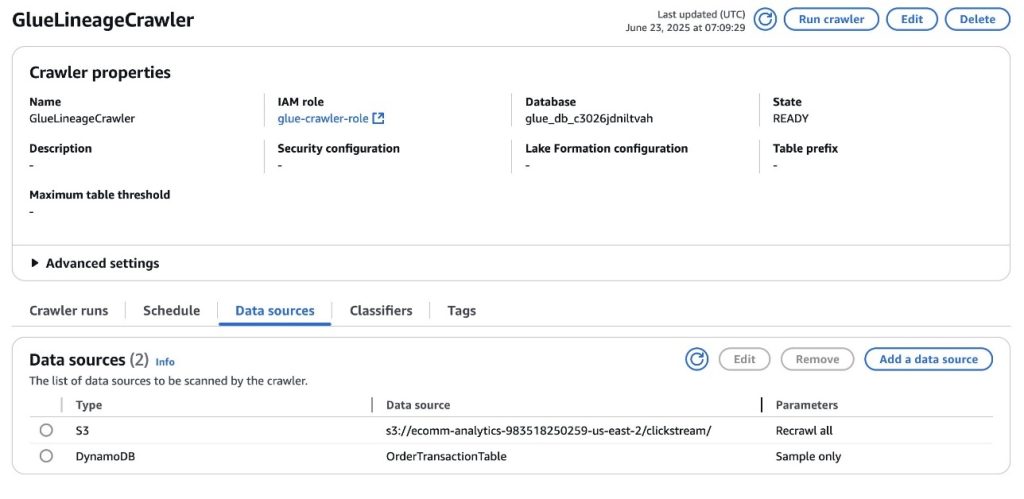
  • An AWS Glue crawler configured to crawl the S3 bucket and DynamoDB table deployed as part of the stack and store the metadata in the AWS Glue database associated to the SageMaker project. You can access the crawler’s details in the AWS console, as shown in the following screenshot.
Run the AWS Glue crawler

The AWS Glue crawler deployed in the previous step will allow you to capture metadata from the two data sources, Amazon S3 and DynamoDB, and store it in AWS Glue Data Catalog, specifically in the database associated to the SageMaker project. After the metadata is stored, it will be accessible to SageMaker.

Before running the crawler, you need to provide AWS Lake Formation permissions to the IAM role that the AWS Glue crawler will use to interact with your data source and target AWS Glue database. The following command will grant the permissions needed for the crawler to store metadata into the AWS Glue database of the SageMaker project.

To invoke this command, we recommend using AWS CloudShell on the AWS console as explained in AWS CloudShell Concepts. Update the <REGION>, <ACCOUNT_ID> and <GLUE_DATABASE_NAME> placeholders with the right values for your AWS Region, AWS account ID, and name of the AWS Glue database associated to the SageMaker project.

aws lakeformation grant-permissions \
  --region  \
  --principal DataLakePrincipalIdentifier=arn:aws:iam:::role/glue-crawler-role \ 
  --permissions CREATE_TABLE \
  --resource '{ "Database": { "Name": "" } }'
  

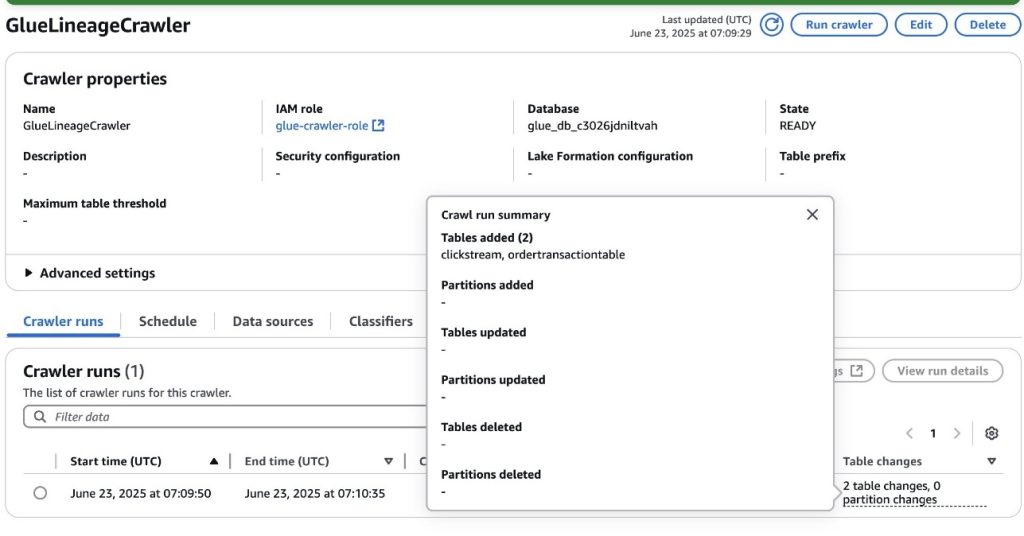
Next, run the AWS Glue Crawler on the AWS console. After the crawler successfully finishes, two new tables, clickstream and ordertransactiontable, will be created in the AWS Glue database associated to the SageMaker project. Refer to Viewing crawler results and details to learn more about AWS Glue crawler results.
Source metadata from the AWS Glue database into SageMaker

To source metadata from data assets in the AWS Glue database, including their lineage, into SageMaker, use the data source that was deployed as part of the SageMaker project creation.

  1. To run the data source, go to the data source details page.
  2. Choose Run. (Data sources can be scheduled to run as well, however, for this demonstration we trigger a manual run).

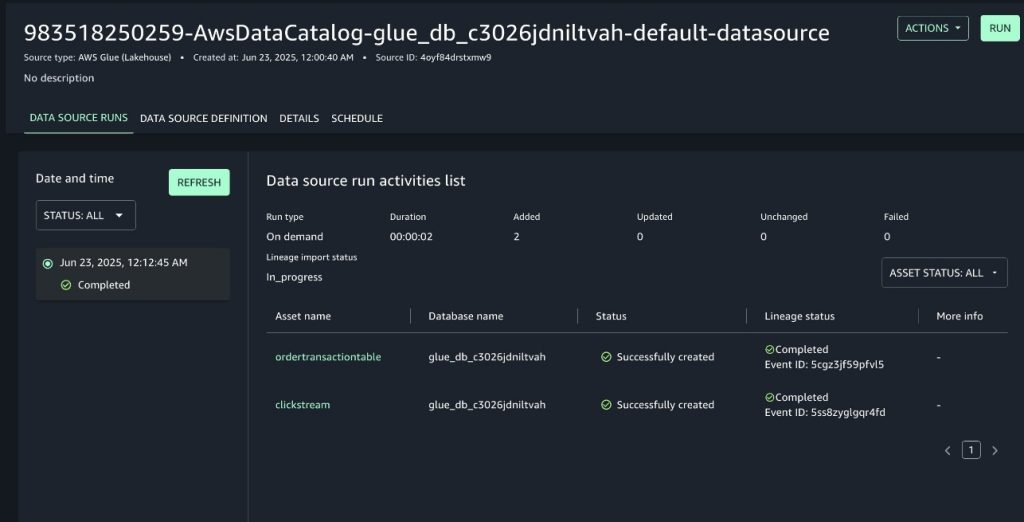
After the data source run is complete, metadata from both data assets in the AWS Glue database will be imported into the SageMaker domain as the project’s inventory assets. You can find the details of the data source run from within SageMaker Unified Studio, which include:

  • The data assets from the AWS Glue database that were ingested into SageMaker.
  • The status of the data lineage import for each data asset, which includes an event ID for traceability. This lineage event ID can be used to debug inconsistencies in the resulting lineage graph. You can use the GetLineageEvent API to retrieve the raw payload of the lineage event.
Visualizing the data lineage graph of the data assets in SageMaker Unified Studio

With SageMaker Unified Studio, you have a single place to manage and discover data assets. When accessing a data asset published in the SageMaker central catalog or in your project’s own inventory, you can dive into the asset’s metadata, which includes its schema, business description, custom metadata forms, quality, lineage, and more. To visualize the lineage graph of each data asset of this post, follow these steps:

  1. In SageMaker Studio, navigate to the Assets section of the SageMaker project details page and choose INVENTORY
  2. Select the asset that you want to explore. You can also access the asset directly from the data source run by selecting the asset name.
  3. To view the lineage graph of the data asset up to its origin, shown in the following screenshots, choose the LINEAGE tab.
    • For clickstream table (Sourced from S3)
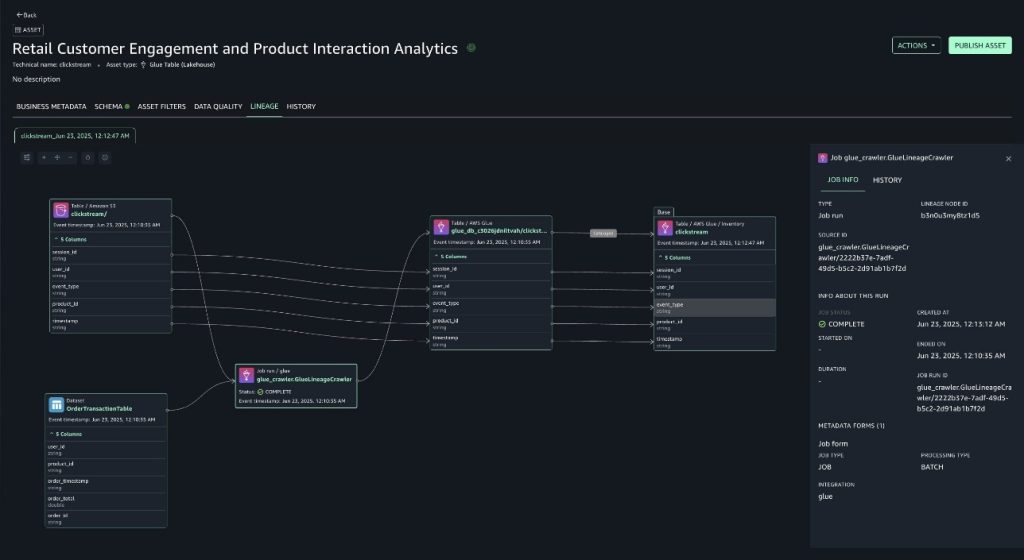
    • For order transactions table (Sourced from DynamoDB)
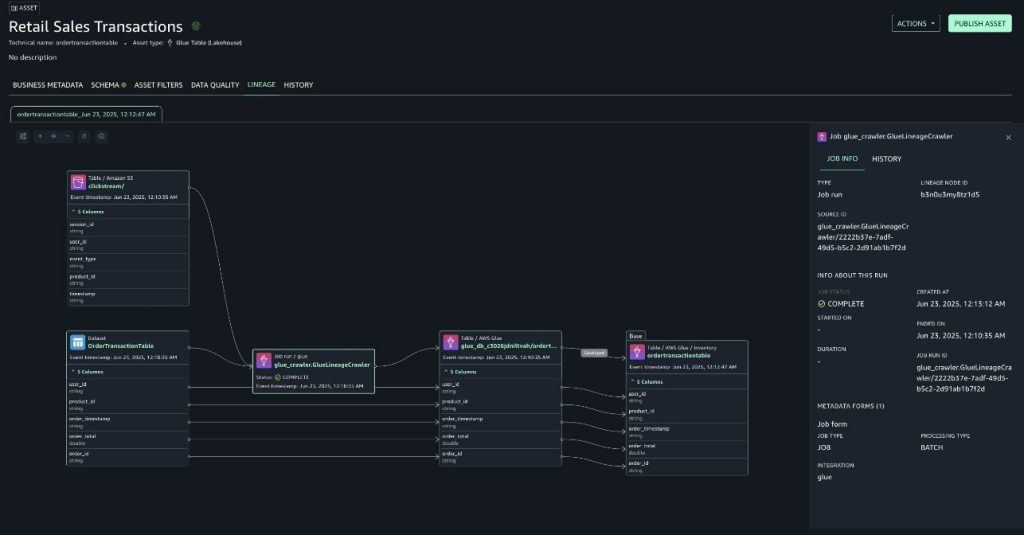
With lineage, you can now confirm that the data originated from sources such as Amazon S3 and Amazon DynamoDB and understand how it has been transformed along the way. Because of this end-to-end visibility, you can trust the data, make informed decisions, and provide compliance with confidence. The lineage graph captures essential metadata that forms the foundation of lineage tracking.

  • This includes table schemas, column definitions and their data types.
  • Column-level lineage becomes particularly powerful in this context. Imagine your clickstream’s AWS Glue table powers an Amazon QuickSight dashboard analyzing customer purchase patterns and notice discrepancies in your revenue reports. With column lineage, you can instantly trace the source of those columns.
  • This granular visibility not only accelerates debugging but also proves invaluable during schema changes, as we show in the following section by changing the source schema.
  • The crawler details such as crawlerRunId (present in the source identifier of the lineage node) and crawler start and end times can be used to debug which crawler runs updated the table.

Understanding your data asset’s schema evolution through lineage in SageMaker Unified Studio

Imagine the order transactions source in DynamoDB was updated with new information. Because this source powers an Amazon QuickSight report for the customer using the AWS Glue database table, it’s important for consumers to know what changes in the data pipeline updated the report.

  1. Edit the DynamoDB table item with additional columns to learn how lineage graph can be used to view historical updates:
{
    "order_id": "ord789",
    "user_id": "u789",
    "product_id": "prod456",
    "order_total": 79.99,
    "order_timestamp": "2025-06-04T09:27:10Z",
	"customerSegment": "new-customer",
    "conversionSource": "primeDayEmailCampaign"
}
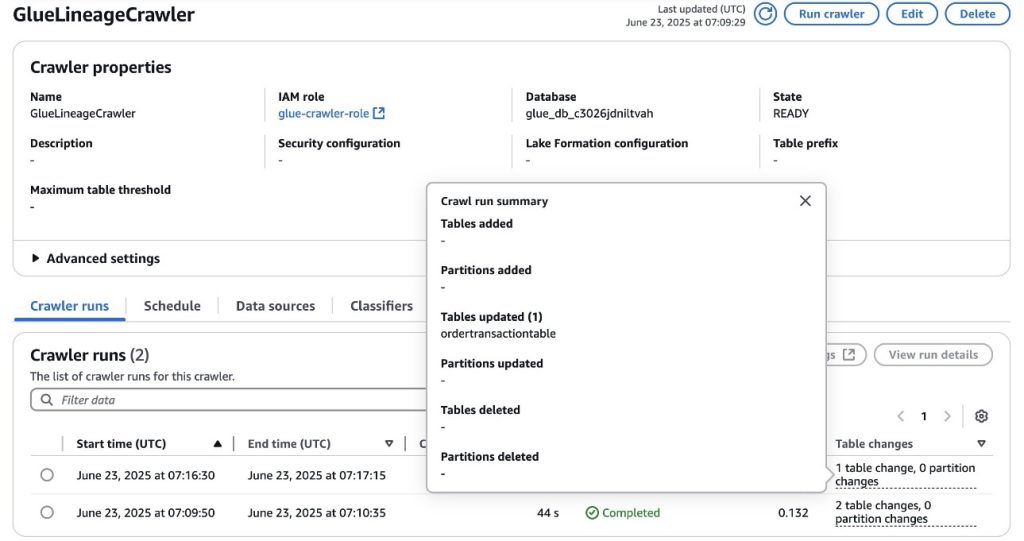
  1. Enter the OrderTransactionsCrawler Glue crawler again on the AWS console. After completion, you’ll notice that it updated the ordertransactiontable AWS Glue table, as shown in the following screenshot.
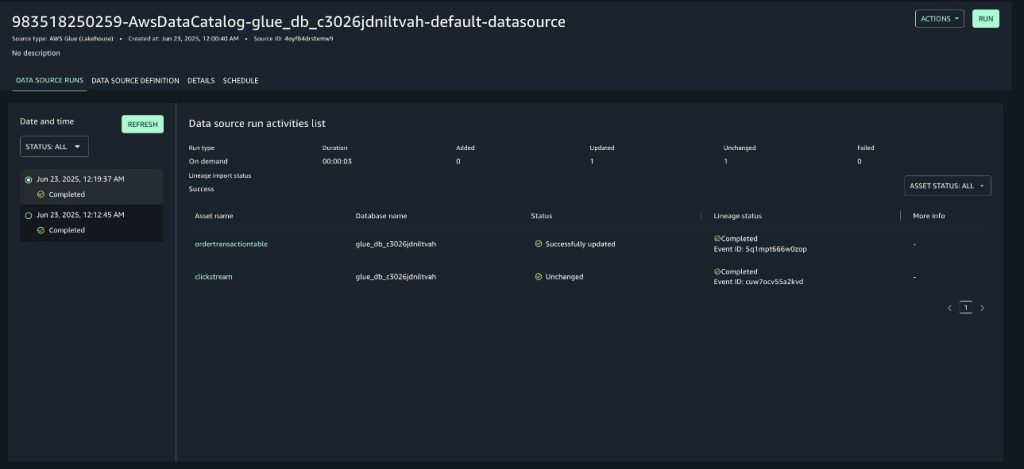
  1. Run again the data source associated to the project in SageMaker Unified Studio to import the latest metadata into the SageMaker Catalog. After completion, you’ll notice the data source updated the ordertransactiontable data asset in the SageMaker Catalog, as shown in the following screenshot.
This section explores how lineage can be useful to track the updates.

Navigate to the ordertransactiontable data asset in SageMaker Catalog by selecting it from the data source run and choose the LINEAGE tab, as shown in the following screenshot.
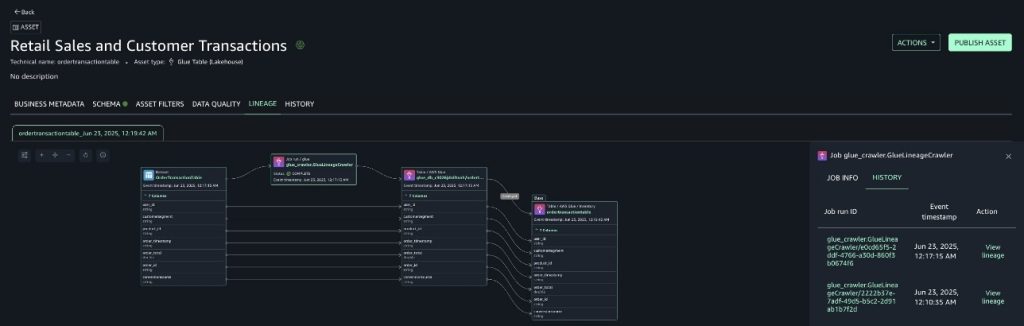
Notice how the new columns are available in the lineage graph. A new crawler run ID is present as the source identifier of the crawler lineage node. The history tab shows multiple crawler runs. You can navigate to check the state of the system during the first run.

Cleanup

After you’re done, we recommend to cleaning up the resources created for this post to avoid unintended charges:

  1. Delete the inventory assets that were cataloged in the SageMaker project’s inventory, as explained in Delete an Amazon SageMaker Unified Studio asset.
  2. Delete the SageMaker project that was created as part of this post, as explained in Delete a project.
  3. Delete the CloudFormation stack that was deployed as part of this post, as explained in Delete a stack from the CloudFormation console.
  4. The S3 bucket created as part of the CloudFormation stack will remain after its deletion because it contains a data file in it. Empty and delete the bucket, as explained in Deleting a general purpose bucket.

Conclusion

In this post, you were able to explore the data lineage capabilities of Amazon SageMaker, specifically when working with AWS Glue crawlers. You learned how you can set up an AWS Glue crawler to infer metadata from data assets in multiple sources such as Amazon S3 and DynamoDB and store it the AWS Glue Data Catalog. You also imported this metadata, including data lineage, into Amazon SageMaker through the data source capability of a SageMaker project. Finally, you explored the resulting lineage graph of data assets in SageMaker Unified Studio and saw some of the functionalities available to understand the origin path of them, understand how columns are transformed, and what impact looks like when performing changes to any step of the pipeline.We encourage you to now test the capabilities you explored in this post with your own data. By following the pattern presented in this post, many customers have been able to achieve governance of their data lake and lakehouse platforms on top of Amazon SageMaker with data lineage and more.


About the authors

Mohit Dawar is a Senior Software Engineer at Amazon Web Services (AWS) working on Amazon DataZone. Over the past 3 years, he has led efforts around the core metadata catalog, generative AI–powered metadata curation, and lineage visualization. He enjoys working on large-scale distributed systems, experimenting with AI to improve user experience, and building tools that make data governance feel effortless. Connect with him on LinkedIn: Mohit Dawar.

Jose Romero is a Senior Solutions Architect for Startups at Amazon Web Services (AWS) based in Austin, TX, US. He is passionate about helping customers architect modern platforms at scale for data, AI, and ML. As a former senior architect in AWS Professional Services, he enjoys building and sharing solutions for common complex problems so that customers can accelerate their cloud journey and adopt best practices. Connect with him on LinkedIn: Jose Romero.

AWS Weekly Roundup: SQS fair queues, CloudWatch generative AI observability, and more (July 28, 2025)

Post Syndicated from Micah Walter original https://aws.amazon.com/blogs/aws/aws-weekly-roundup-sqs-fair-queues-cloudwatch-generative-ai-observability-and-more-july-28-2025/

To be honest, I’m still recovering from the AWS Summit in New York, doing my best to level up on launches like Amazon Bedrock AgentCore (Preview) and Amazon Simple Storage Service (S3) Vectors. There’s a lot of new stuff to learn!

Meanwhile, it’s been an exciting week for AWS builders focused on reliability and observability. The standout announcement has to be Amazon SQS fair queues, which tackles one of the most persistent challenges in multi-tenant architectures: the “noisy neighbor” problem. If you’ve ever dealt with one tenant’s message processing overwhelming shared infrastructure and affecting other tenants, you’ll appreciate how this feature enables more balanced message distribution across your applications.

On the AI front, we’re also seeing AWS continue to enhance our observability capabilities with the preview launch of Amazon CloudWatch generative AI observability. This brings AI-powered insights directly into your monitoring workflows, helping you understand infrastructure and application performance patterns in new ways. And for those managing Amazon Connect environments, the addition of AWS CloudFormation for message template attachments makes it easier to programmatically deploy and manage email campaign assets across different environments.

Last week’s launches

  • Amazon SQS Fair Queues — AWS launched Amazon SQS fair queues to help mitigate the “noisy neighbor” problem in multi-tenant systems, enabling more balanced message processing and improved application resilience across shared infrastructure.
  • Amazon CloudWatch Generative AI Observability (Preview) — AWS launched a preview of Amazon CloudWatch generative AI observability, enabling users to gain AI-powered insights into their cloud infrastructure and application performance through advanced monitoring and analysis capabilities.
  • Amazon Connect CloudFormation Support for Message Template Attachments —AWS has expanded the capabilities of Amazon Connect by introducing support for AWS CloudFormation for Outbound Campaign message template attachments, enabling customers to programmatically manage and deploy email campaign attachments across different environments.
  • Amazon Connect Forecast Editing — Amazon Connect introduces a new forecast editing UI that allows contact center planners to quickly adjust forecasts by percentage or exact values across specific date ranges, queues, and channels for more responsive workforce planning.
  • Bloom Filters for Amazon ElastiCache — Amazon ElastiCache now supports Bloom filters in version 8.1 for Valkey, offering a space-efficient way to quickly check if an item is in a set with over 98% memory efficiency compared to traditional sets.
  • Amazon EC2 Skip OS Shutdown Option — AWS has introduced a new option for Amazon EC2 that allows customers to skip the graceful operating system shutdown when stopping or terminating instances, enabling faster application recovery and instance state transitions.
  • AWS HealthOmics Git Repository Integration — AWS HealthOmics now supports direct Git repository integration for workflow creation, allowing researchers to seamlessly pull workflow definitions from GitHub, GitLab, and Bitbucket repositories while enabling version control and reproducibility.
  • AWS Organizations Tag Policies Wildcard Support — AWS Organizations now supports a wildcard statement (ALL_SUPPORTED) in Tag Policies, allowing users to apply tagging rules to all supported resource types for a given AWS service in a single line, simplifying policy creation and reducing complexity.

Blogs of note

Beyond IAM Access Keys: Modern Authentication Approaches — AWS recommends moving beyond traditional IAM access keys to more secure authentication methods, reducing risks of credential exposure and unauthorized access by leveraging modern, more robust approaches to identity management.

Upcoming AWS events

AWS re:Invent 2025 (December 1-5, 2025, Las Vegas) — AWS’s flagship annual conference offering collaborative innovation through peer-to-peer learning, expert-led discussions, and invaluable networking opportunities.

AWS Summits — Join free online and in-person events that bring the cloud computing community together to connect, collaborate, and learn about AWS. Register in your nearest city: Mexico City (August 6) and Jakarta (August 7).

AWS Community Days — Join community-led conferences that feature technical discussions, workshops, and hands-on labs led by expert AWS users and industry leaders from around the world: Singapore (August 2), Australia (August 15), Adria (September 5), Baltic (September 10), and Aotearoa (September 18).

Introducing MCP Server for Apache Spark History Server for AI-powered debugging and optimization

Post Syndicated from Manabu McCloskey original https://aws.amazon.com/blogs/big-data/introducing-mcp-server-for-apache-spark-history-server-for-ai-powered-debugging-and-optimization/

Organizations running Apache Spark workloads, whether on Amazon EMR, AWS Glue, Amazon Elastic Kubernetes Service (Amazon EKS), or self-managed clusters, invest countless engineering hours in performance troubleshooting and optimization. When a critical extract, transform, and load (ETL) pipeline fails or runs slower than expected, engineers end up spending hours navigating through multiple interfaces such as logs or Spark UI, correlating metrics across different systems and manually analyzing execution patterns to identify root causes. Although Spark History Server provides detailed telemetry data, including job execution timelines, stage-level metrics, and resource consumption patterns, accessing and interpreting this wealth of information requires deep expertise in Spark internals and navigating through multiple interconnected web interface tabs.

Today, we’re announcing the open source release of Spark History Server MCP, a specialized Model Context Protocol (MCP) server that transforms this workflow by enabling AI assistants to access and analyze your existing Spark History Server data through natural language interactions. This project, developed collaboratively by AWS open source and Amazon SageMaker Data Processing, turns complex debugging sessions into conversational interactions that deliver faster, more accurate insights without requiring changes to your current Spark infrastructure. You can use this MCP server with your self-managed or AWS managed Spark History Servers to analyze Spark applications running in the cloud or on-premises deployments.

Understanding Spark observability challenge

Apache Spark has become the standard for large-scale data processing, powering critical ETL pipelines, real-time analytics, and machine learning (ML) workloads across thousands of organizations. Building and maintaining Spark applications is, however, still an iterative process, where developers spend significant time testing, optimizing, and troubleshooting their code. Spark application developers focused on data engineering and data integration use cases often encounter significant operational challenges due to a few different reasons:

  • Complex connectivity and configuration options to a variety of resources with Spark – Although this makes it a popular data processing platform, it often makes it challenging to find the root cause of inefficiencies or failures when Spark configurations aren’t optimally or correctly configured.
  • Spark’s in-memory processing model and distributed partitioning of datasets across its workers – Although good for parallelism, this often makes it difficult for users to identify inefficiencies. This results in slow application execution or root cause of failures caused by resource exhaustion issues such as out of memory and disk exceptions.
  • Lazy evaluation of Spark transformations – Although lazy evaluation optimizes performance, it makes it challenging to accurately and quickly identify the application code and logic that caused the failure from the distributed logs and metrics emitted from different executors.

Spark History Server

Spark History Server provides a centralized web interface for monitoring completed Spark applications, serving comprehensive telemetry data including job execution timelines, stage-level metrics, task distribution, executor resource consumption, and SQL query execution plans. Although Spark History Server assists developers for performance debugging, code optimization, and capacity planning, it still has challenges:

  • Time-intensive manual workflows – Engineers spend hours navigating through the Spark History Server UI, switching between multiple tabs to correlate metrics across jobs, stages, and executors. Engineers must constantly switch between the Spark UI, cluster monitoring tools, code repositories, and documentation to piece together a complete picture of application performance, which often takes days.
  • Expertise bottlenecks – Effective Spark debugging requires deep understanding of execution plans, memory management, and shuffle operations. This specialized knowledge creates dependencies on senior engineers and limits team productivity.
  • Reactive problem-solving – Teams typically discover performance issues only after they impact production systems. Manual monitoring approaches don’t scale to proactively identify degradation patterns across hundreds of daily Spark jobs.

How MCP transforms Spark observability

The Model Context Protocol provides a standardized interface for AI agents to access domain-specific data sources. Unlike general-purpose AI assistants operating with limited context, MCP-enabled agents can access technical information about specific systems and provide insights based on actual operational data rather than generic recommendations.With the help of Spark History Server accessible through MCP, instead of manually gathering performance metrics from multiple sources and correlating them to understand application behavior, engineers can engage with AI agents that have direct access to all Spark execution data. These agents can analyze execution patterns, identify performance bottlenecks, and provide optimization recommendations based on actual job characteristics rather than general best practices.

Introduction to Spark History Server MCP

The Spark History Server MCP is a specialized bridge between AI agents and your existing Spark History Server infrastructure. It connects to one or more Spark History Server instances and exposes their data through standardized tools that AI agents can use to retrieve application metrics, job execution details, and performance data.

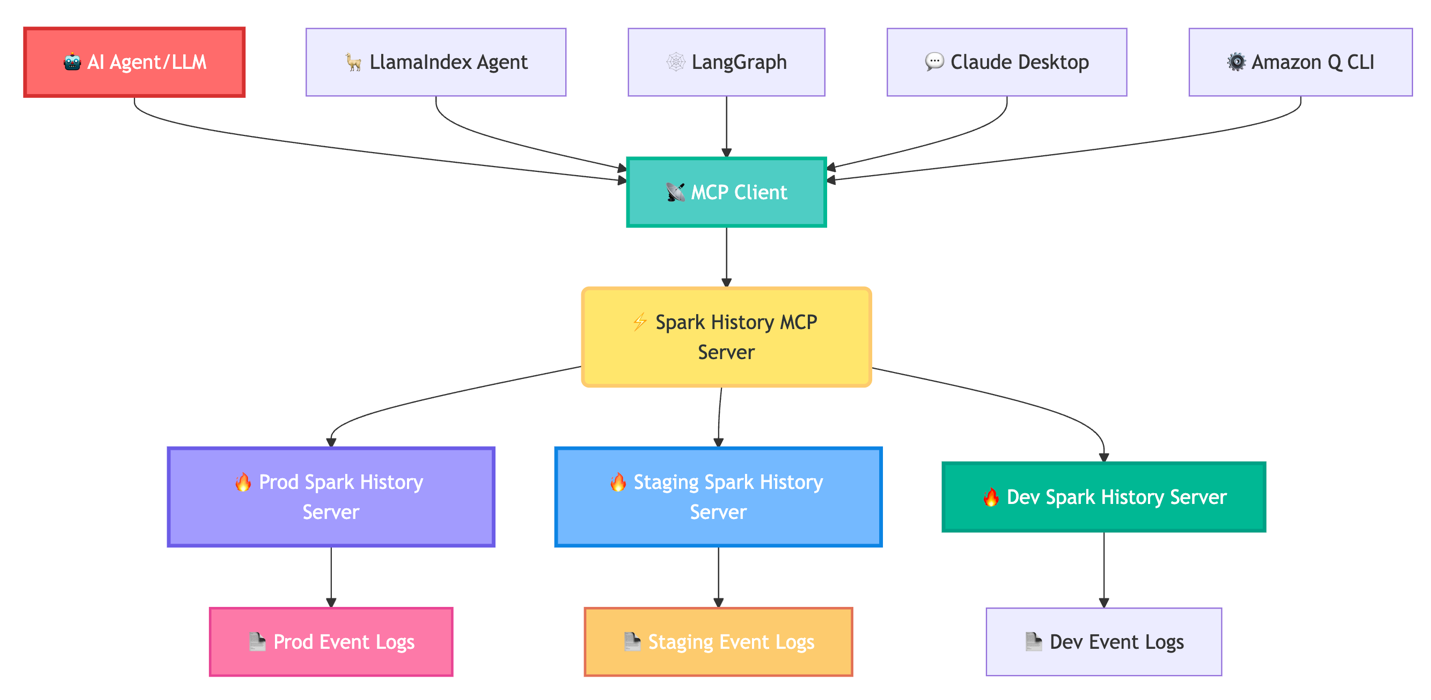
Importantly, the MCP server functions purely as a data access layer, enabling AI agents such as Amazon Q Developer CLI, Claude desktop, Strands Agents, LlamaIndex, and LangGraph to access and reason about your Spark data. The following diagram shows this flow.

The Spark History Server MCP directly addresses these operational challenges by enabling AI agents to access Spark performance data programmatically. This transforms the debugging experience from manual UI navigation to conversational analysis. Instead of hours in the UI, ask, “Why did job spark-abcd fail?” and receive root cause analysis of the failure. This allows users to use AI agents for expert-level performance analysis and optimization recommendations, without requiring deep Spark expertise.

The MCP server provides comprehensive access to Spark telemetry across multiple granularity levels. Application-level tools retrieve execution summaries, resource utilization patterns, and success rates across job runs. Job and stage analysis tools provide execution timelines, stage dependencies, and task distribution patterns for identifying critical path bottlenecks. Task-level tools expose executor resource consumption patterns and individual operation timings for detailed optimization analysis. SQL-specific tools provide query execution plans, join strategies, and shuffle operation details for analytical workload optimization. You can review the complete set of tools available in the MCP server in the project README.

How to use the MCP server

The MCP is an open standard that enables secure connections between AI applications and data sources. This MCP server implementation supports both Streamable HTTP and STDIO protocols for maximum flexibility.

The MCP server runs as a local service within your infrastructure either on Amazon Elastic Compute Cloud (Amazon EC2) or Amazon EKS, connecting directly to your Spark History Server instances. You maintain complete control over data access, authentication, security, and scalability.

All the tools are available with streamable HTTP and STDIO protocol:

  • Streamable HTTP – Full advanced tools for LlamaIndex, LangGraph, and programmatic integrations
  • STDIO mode – Core functionality of Amazon Q CLI and Claude Desktop

For deployment, it supports multiple Spark History Server instances and provides deployments with AWS Glue, Amazon EMR, and Kubernetes.

Quick local setup

To set up Spark History MCP server locally, execute the following commands in your terminal:

git clone 
cd spark-history-server-mcp

# Install Task (if not already installed)
brew install go-task # macOS, see  for others

# Setup and start testing
task install            # Install dependencies
task start-spark-bg     # Start Spark History Server with sample data
task start-mcp-bg       # Start MCP Server
task start-inspector-bg # Start MCP Inspector

# Opens  for interactive testing
# When done, run task stop-all

For comprehensive configuration examples and integration guides, refer to the project README.

Integration with AWS managed services

The Spark History Server MCP integrates seamlessly with AWS managed services, offering enhanced debugging capabilities for Amazon EMR and AWS Glue workloads. This integration adapts to various Spark History Server deployments available across these AWS managed services while providing a consistent, conversational debugging experience:

  • AWS Glue – Users can use the Spark History Server MCP integration with self-managed Spark History Server on an EC2 instance or launch locally using Docker container. Setting up the integration is straightforward. Follow the step-by-step instructions in the README to configure the MCP server with your preferred Spark History Server deployment. Using this integration, AWS Glue users can analyze AWS Glue ETL job performance regardless of their Spark History Server deployment approach.
  • Amazon EMR – Integration with Amazon EMR uses the service-managed Persistent UI feature for EMR on Amazon EC2. The MCP server requires only an EMR cluster Amazon Resource Name (ARN) to discover the available Persistent UI on the EMR cluster or automatically configure a new one for cases its missing with token-based authentication. This eliminates the need for manually configuring Spark History Server setup while providing secure access to detailed execution data from EMR Spark applications. Using this integration, data engineers can ask questions about their Spark workloads, such as “Can you get job bottle neck for spark-<emr-applicationId>? ” The MCP responds with detailed analysis of execution patterns, resource utilization differences, and targeted optimization recommendations, so teams can fine-tune their Spark applications for optimal performance across AWS services.

For comprehensive configuration examples and integration details, refer to the AWS Integration Guides.

Looking ahead: The future of AI-assisted Spark optimization

This open-source release establishes the foundation for enhanced AI-powered Spark capabilities. This project establishes the foundation for deeper integration with AWS Glue and Amazon EMR to simplify the debugging and optimization experience for customers using these Spark environments. The Spark History Server MCP is open source under the Apache 2.0 license. We welcome contributions including new tool extensions, integrations, documentation improvements, and deployment experiences.

Get started today

Transform your Spark monitoring and optimization workflow today by providing AI agents with intelligent access to your performance data.

  • Explore the GitHub repository
  • Review the comprehensive README for setup and integration instructions
  • Join discussions and submit issues for enhancements
  • Contribute new features and deployment patterns

Acknowledgment: A special thanks to everyone who contributed to the development and open-sourcing of the Apache Spark history server MCP: Vaibhav Naik, Akira Ajisaka, Rich Bowen, Savio Dsouza.


About the authors

Manabu McCloskey is a Solutions Architect at Amazon Web Services. He focuses on contributing to open source application delivery tooling and works with AWS strategic customers to design and implement enterprise solutions using AWS resources and open source technologies. His interests include Kubernetes, GitOps, Serverless, and Souls Series.

Vara Bonthu is a Principal Open Source Specialist SA leading Data on EKS and AI on EKS at AWS, driving open source initiatives and helping AWS customers to diverse organizations. He specializes in open source technologies, data analytics, AI/ML, and Kubernetes, with extensive experience in development, DevOps, and architecture. Vara focuses on building highly scalable data and AI/ML solutions on Kubernetes, enabling customers to maximize cutting-edge technology for their data-driven initiatives

Andrew Kim is a Software Development Engineer at AWS Glue, with a deep passion for distributed systems architecture and AI-driven solutions, specializing in intelligent data integration workflows and cutting-edge feature development on Apache Spark. Andrew focuses on re-inventing and simplifying solutions to complex technical problems, and he enjoys creating web apps and producing music in his free time.

Shubham Mehta is a Senior Product Manager at AWS Analytics. He leads generative AI feature development across services such as AWS Glue, Amazon EMR, and Amazon MWAA, using AI/ML to simplify and enhance the experience of data practitioners building data applications on AWS.

Kartik Panjabi is a Software Development Manager on the AWS Glue team. His team builds generative AI features for the Data Integration and distributed system for data integration.

Mohit Saxena is a Senior Software Development Manager on the AWS Data Processing Team (AWS Glue and Amazon EMR). His team focuses on building distributed systems to enable customers with new AI/ML-driven capabilities to efficiently transform petabytes of data across data lakes on Amazon S3, databases and data warehouses on the cloud.
Unifying data insights with Amazon QuickSight and Amazon SageMaker

Post Syndicated from Ramon Lopez original https://aws.amazon.com/blogs/big-data/unifying-data-insights-with-amazon-quicksight-and-amazon-sagemaker/

Amazon SageMaker has announced an integration with Amazon QuickSight, bringing together data in SageMaker seamlessly with QuickSight capabilities like interactive dashboards, pixel perfect reports and generative business intelligence (BI)—all in a governed and automated manner. With this integration users can go from exploring data in SageMaker to visualizing it in QuickSight with a single click.

“The integration between Amazon SageMaker and Amazon QuickSight will help us streamline how our teams move from data exploration to insights. Our analysts can go from data discovery to building and sharing dashboards through a unified, governed experience. Dashboards are no longer siloed, one-off reports. They’re cataloged, discoverable assets that others can find and access. This has made insight delivery faster, more consistent, and far easier to scale across the business.”

– Lingam Chockalingam, Chief Data Architect, Maryland Department of Human Services – MD THINK

About QuickSight

QuickSight is a cloud-powered BI service that revolutionizes data analysis and visualization. It seamlessly integrates data from various sources, including AWS services, third-party applications, and software as a service (SaaS) platforms into a single, intuitive dashboard. As a fully managed service, QuickSight offers enterprise-grade security, global accessibility, and scalability without the hassle of infrastructure management. Amazon Q in QuickSight transforms access to data insights for the entire organization using generative AI. Using Amazon Q, business analysts can generate dashboards and reports using natural language prompts. With Amazon Q, business users can ask and answer questions of data using data Q&A, get natural language executive summaries of data to see trends and insights, and use the powerful new agentic data analysis experience of scenarios to discover patterns and outliers in data and perform what-if analysis.
About SageMaker

Amazon SageMaker Unified Studio provides a unified, end-to-end experience consisting of data, analytics, and AI capabilities. You can use familiar AWS services for model development, generative AI, data processing, and analytics—all within a single, governed environment. Users can now build, deploy, and execute end-to-end workflows from a single interface. SageMaker is built on the foundations of Amazon DataZone, where it uses domains to categorize and structure the data assets, while offering project-based collaboration features that teams can use to securely share artifacts and work together across various compute services. This experience allows multiple personas to seamlessly collaborate, while operating under appropriate access controls and governance policies.

Dashboard and insight workflows simplified

Today administrators can configure SageMaker projects with QuickSight to streamline the flow of building insights from your data lake. After being set up, the integration automatically creates a restricted folders that provides a governed context to share assets and data sources, pre-configured with secure connections to data lake tables. This serves as the foundation for any project member securely building and sharing insights. When exploring data in your project the integration allows for one-click access to building a dashboard from any table. Behind the scenes, SageMaker creates a QuickSight dataset in the project’s restricted folder that’s accessible only to members within the project. Not only do dashboards you build in QuickSight stay within this folder, they’re also automatically added as assets to your SageMaker project. There, you can add custom metadata, publish to the SageMaker Catalog and share with users or groups in your corporate directory for broader access—all within SageMaker Unified Studio. This keeps your dashboards organized, discoverable, shareable, and governed, making cross-team collaboration and asset reuse straightforward.

Configure SageMaker and QuickSight

To get started with SageMaker and QuickSight integration, you enable the QuickSight blueprint and create project profiles in the AWS Management Console.

Note that both your SageMaker Unified Studio domain and QuickSight account must be integrated with AWS IAM Identity Center using the same Identity Center instance. Additionally, your QuickSight account must exist in the same AWS account.

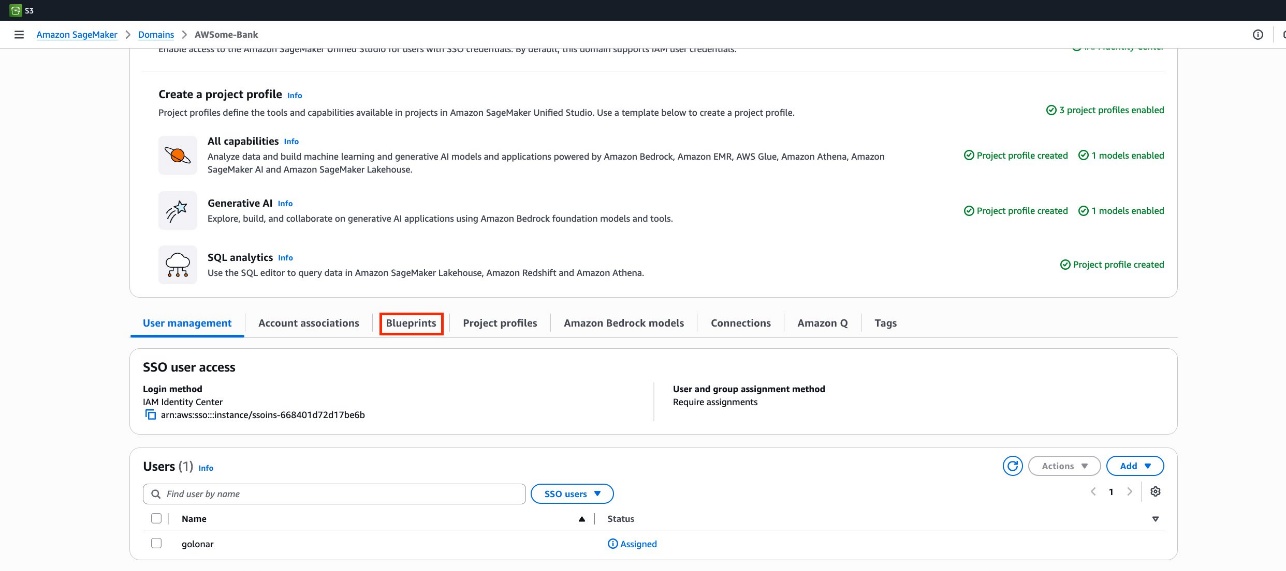
  1. Go to the SageMaker console and choose Domain in the navigation pane.
  2. Select the Blueprints tab.
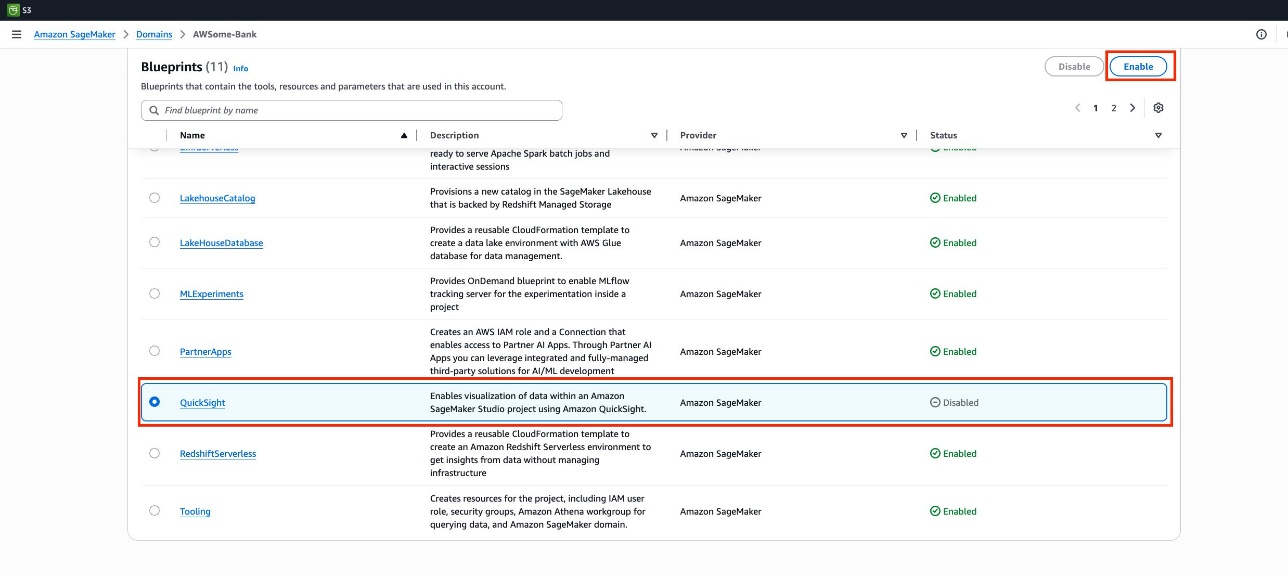
  3. To enable the QuickSight Blueprint, select it from the list, then choose Enable.
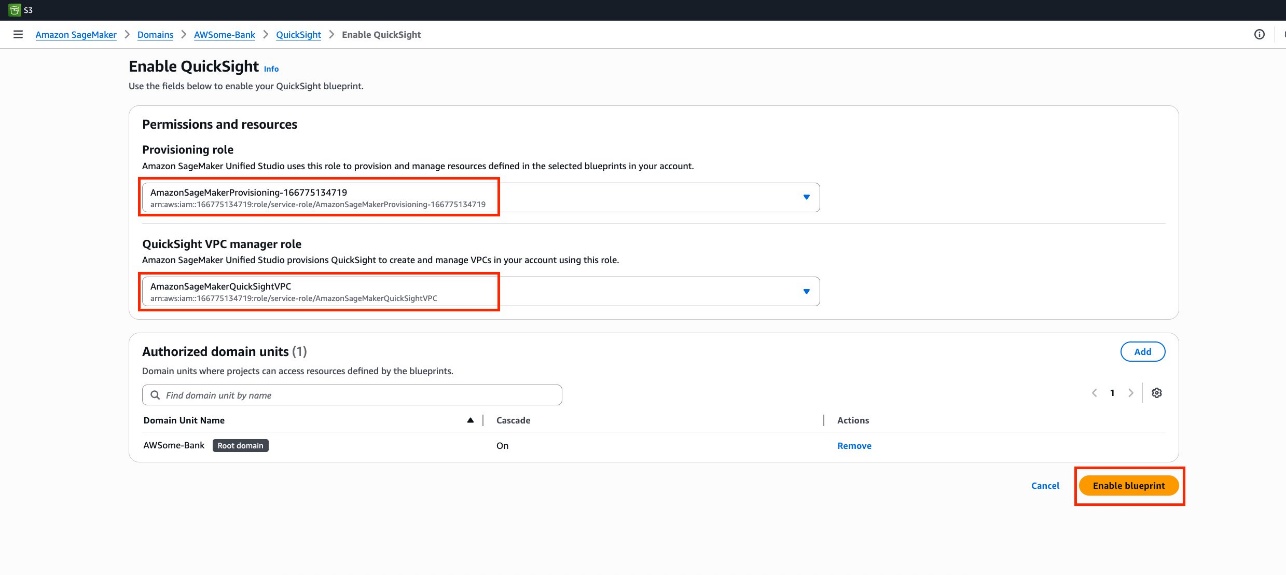
  4. On the Enable QuickSight page:
        1. For Provisioning role, select your provisioning role.
        2. For QuickSight VPC manager role, select the AmazonSageMakerQuickSightVPC role.
  5. Choose Enable blueprint.
  6. A confirmation message will appear after the blueprint is successfully enabled.
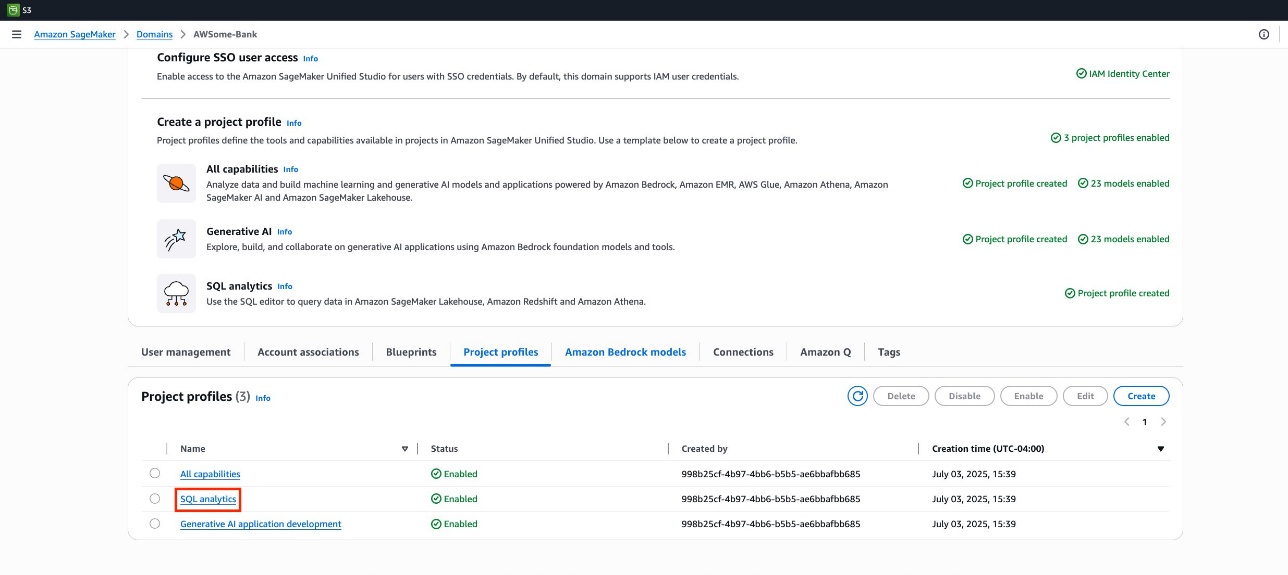
  7. Go back to the Domains page and select the Project profiles tab and then select the SQL analytics project profile.
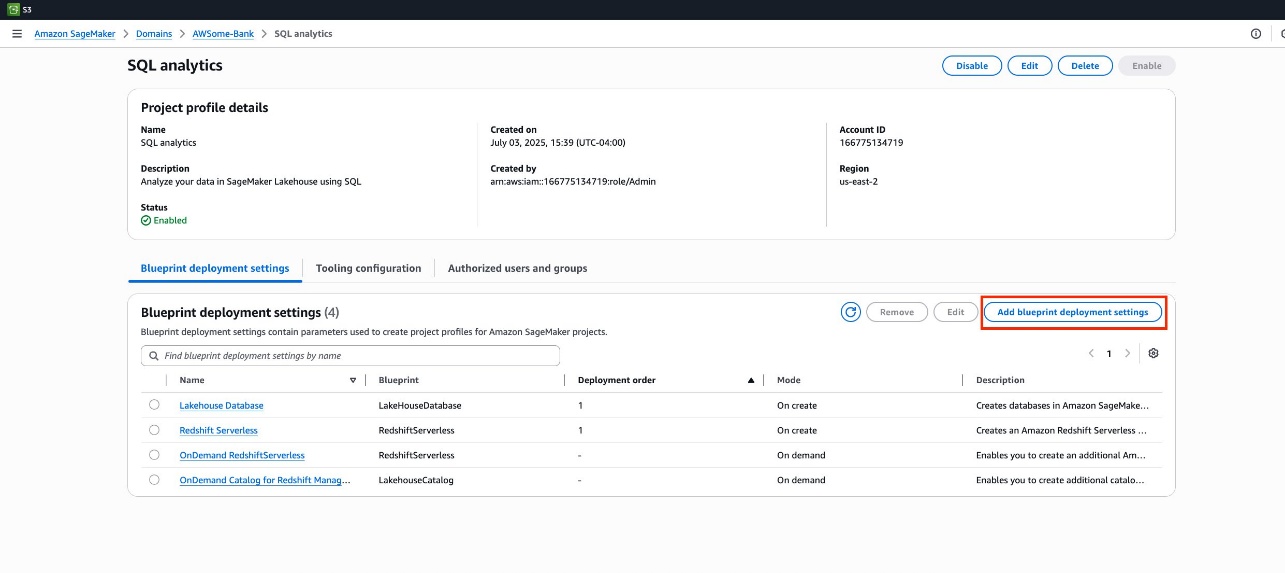
  8. Choose Add blueprint deployment settings.
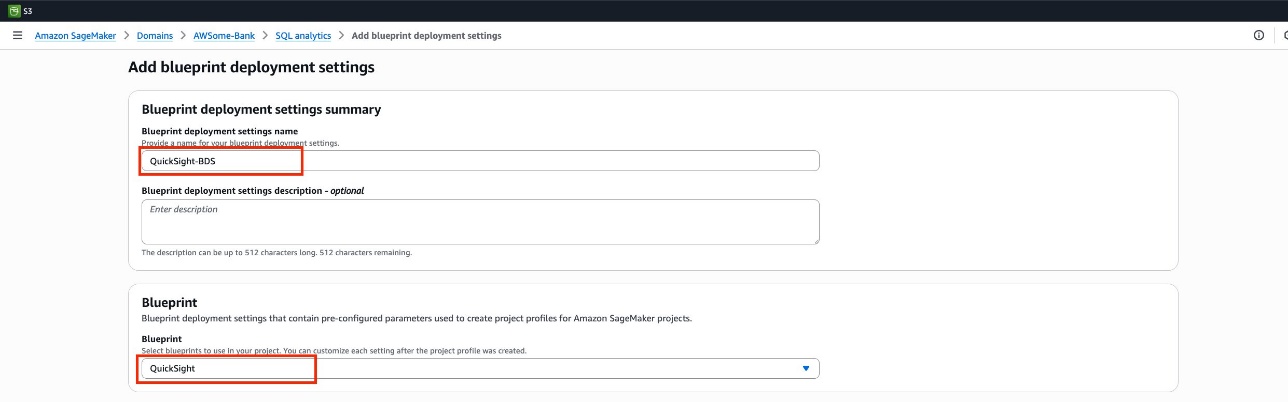
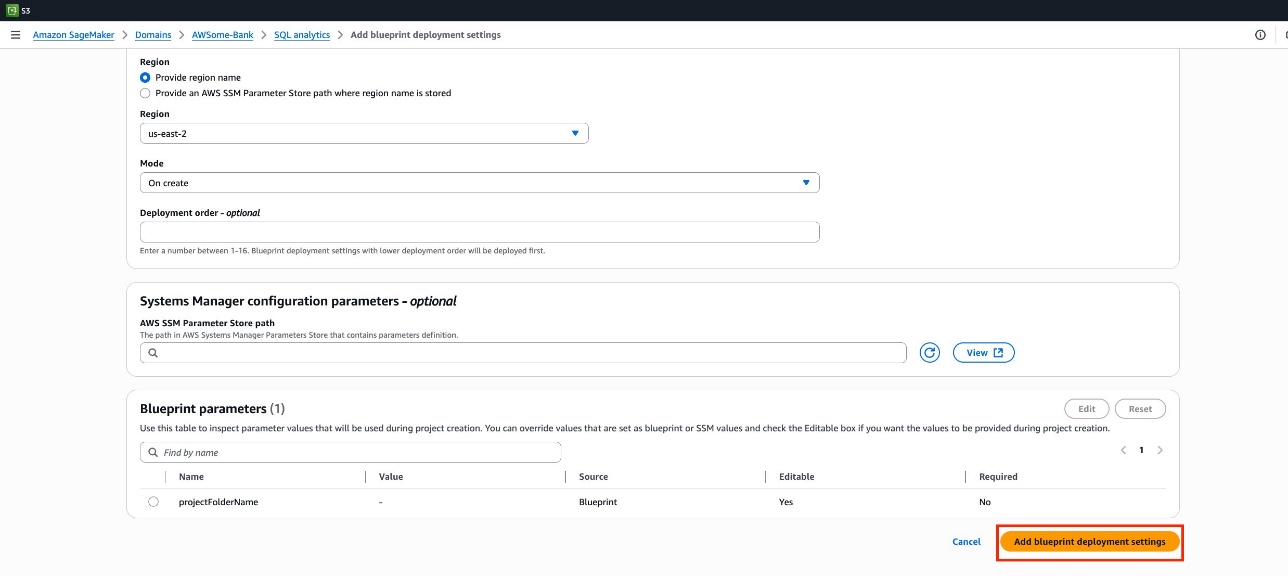
  9. Configure the blueprint deployment settings as follows:
    • Blueprint deployment settings name: Enter a name for your settings. For this post, we used QuickSight-BDS.
    • Blueprint: Select the QuickSight blueprint from the list.
    • Other parameters: Adjust these based on your use case. For this post, we kept the default values.
  10. Scroll down and choose Add blueprint deployment settings to save your configuration.
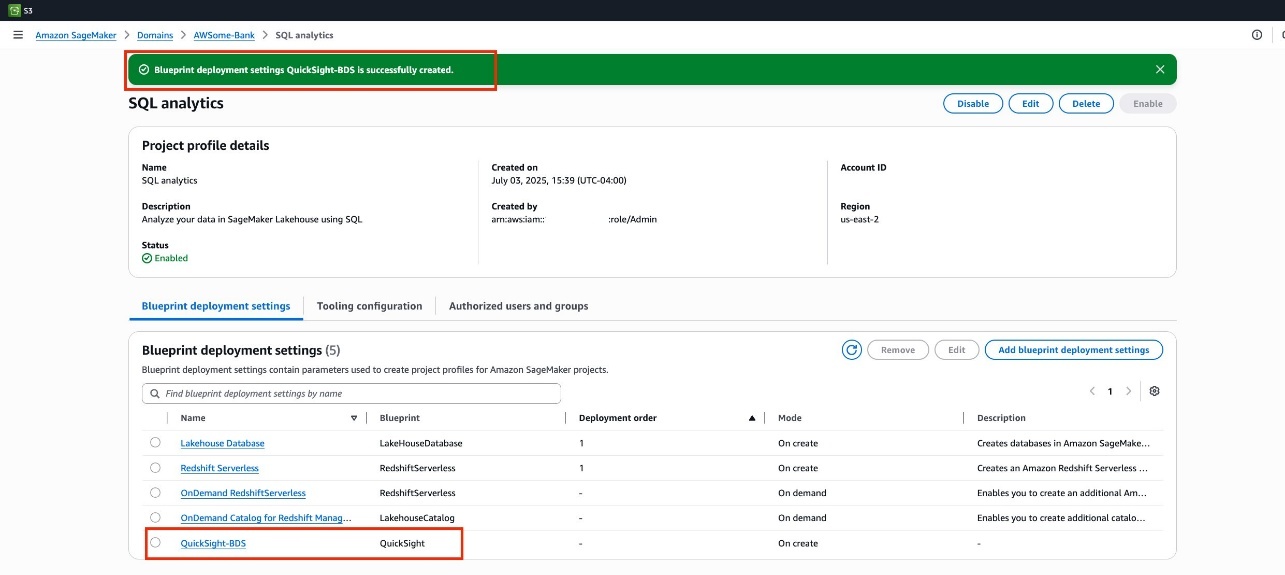
  11. You’ll receive a confirmation message, and you’ll see that the QuickSight Blueprint deployment setting (QuickSight-BDS) has been added to the list.

Create a SageMaker project with QuickSight enabled:

After the QuickSight integration has been set up by the administrator, data consumers such as analysts and data scientists can begin using it in the SageMaker portal by creating a new project.

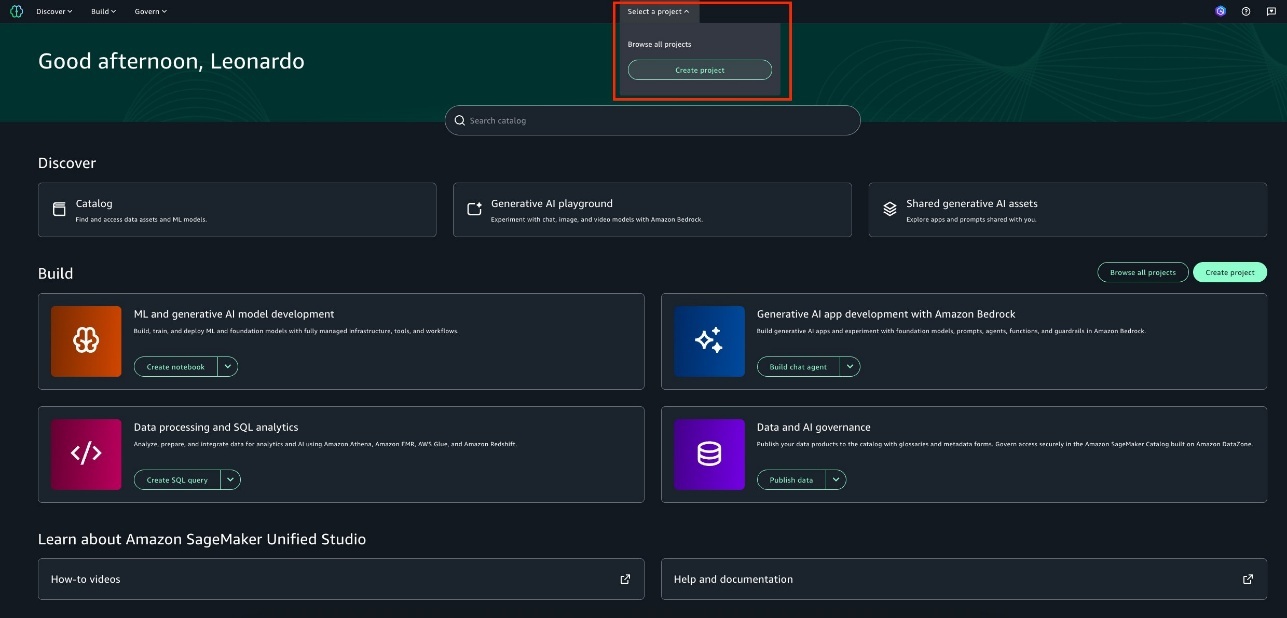
  1. Go to the SageMaker portal.
  2. Choose Select a project, then, choose Create project.
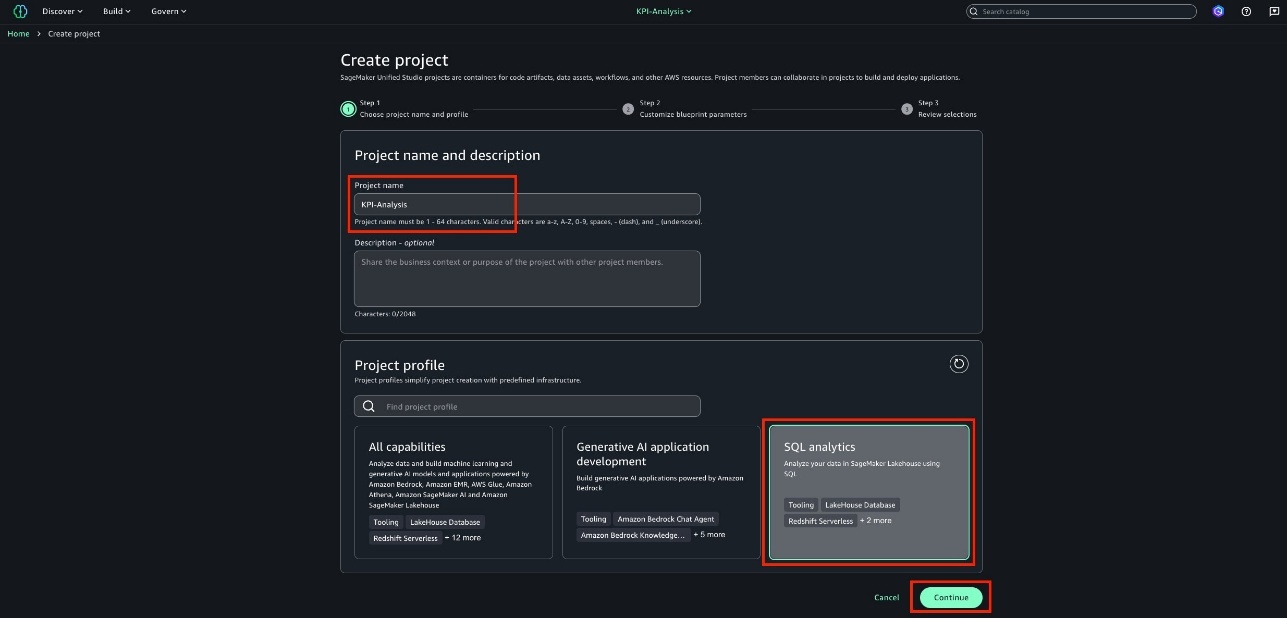
  3. On the Create project page:
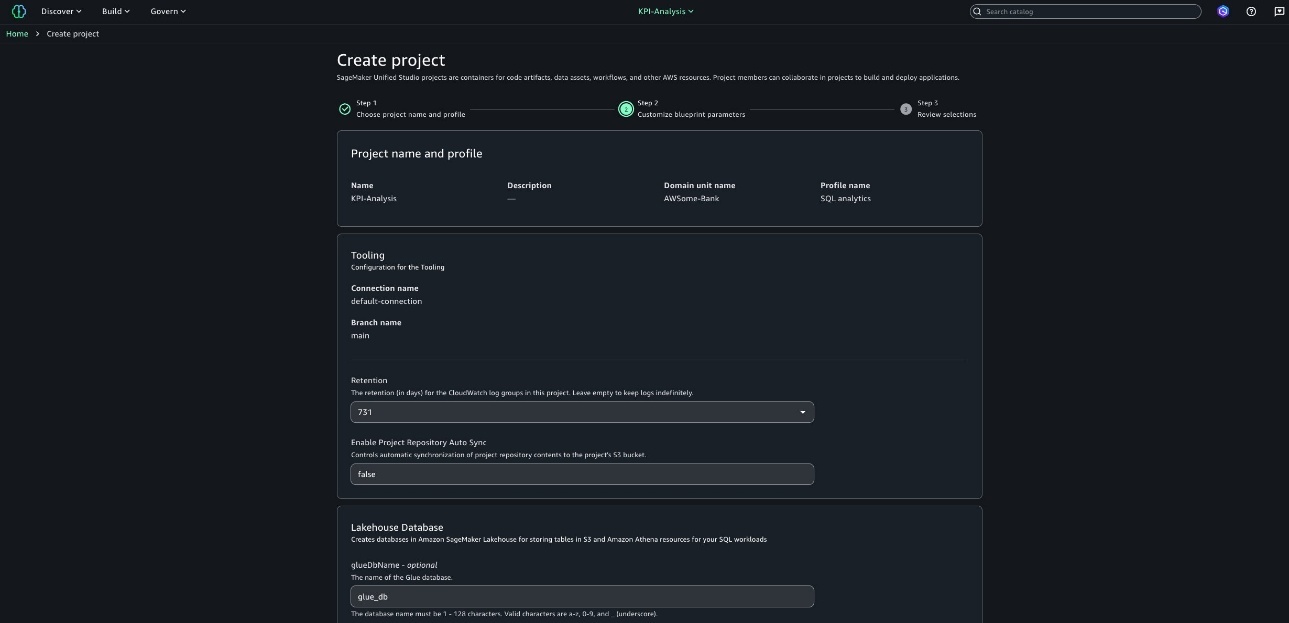
    1. Project name: Enter the name of your project. For this post, we’re using KPI-Analysis.
    2. Project profile: Select the SQL Analytics project profile.
    3. Choose Continue.
  4. Leave the remaining parameters set to their default values and choose Continue.
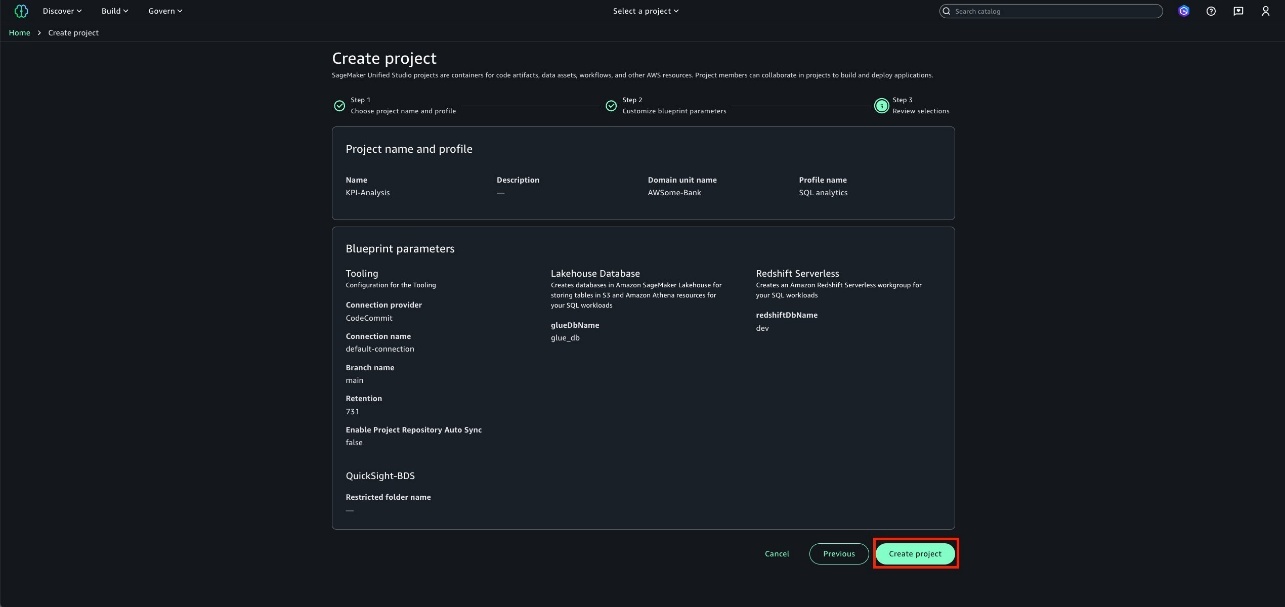
  5. Review the information displayed, then choose Create project.
  6. You’ll be redirected to the Creating new project page. Wait for the process to complete.
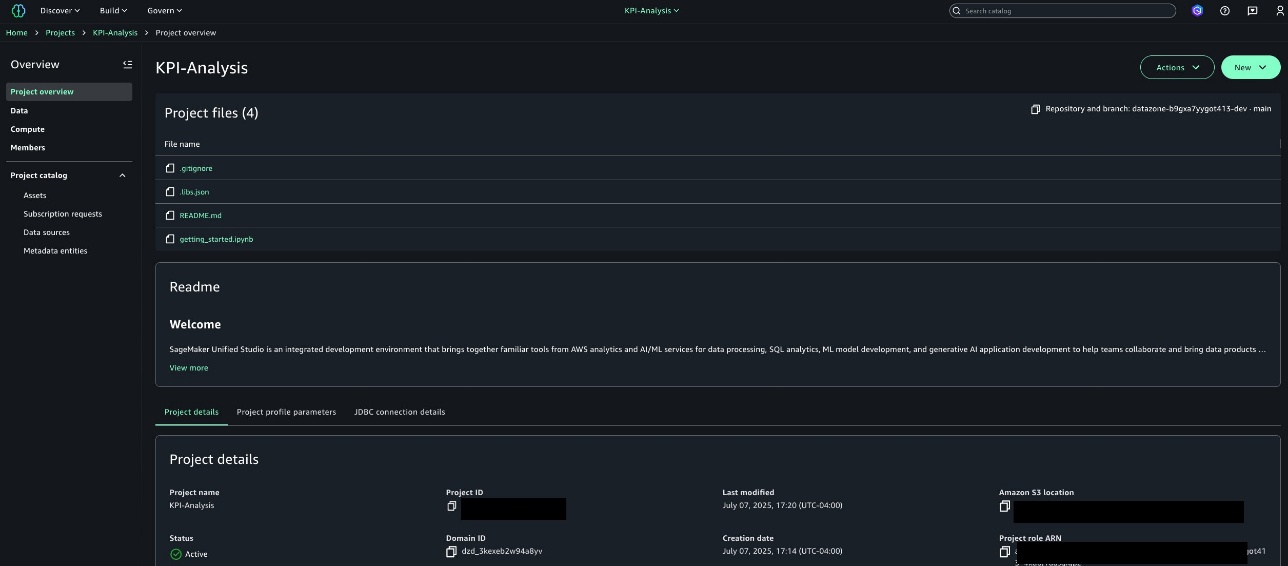
  7. After the project creation process is complete, you’ll be taken to the Project overview page.

Create a data asset to build the analysis

  1. For this post, you’ll use the transactions.csv file, which contains financial transaction data from various departments.
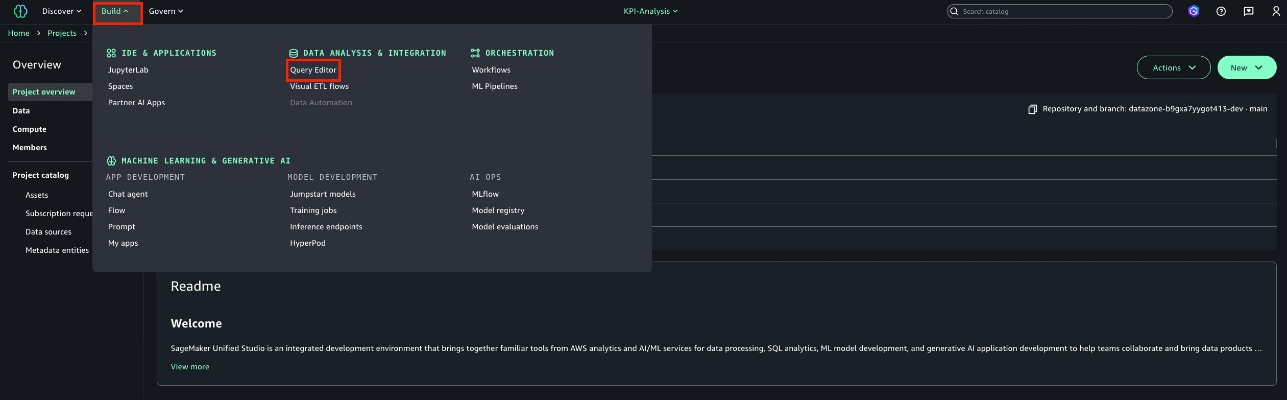
  2. Choose Build in the top-right menu.
  3. Then select Query Editor from the dropdown.
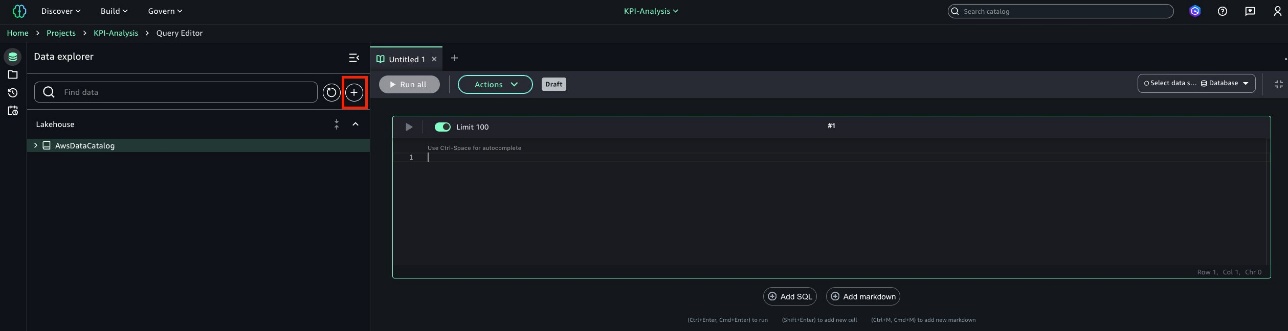
  4. Choose the plus (+) icon
  5. Select Create table, then choose Next.
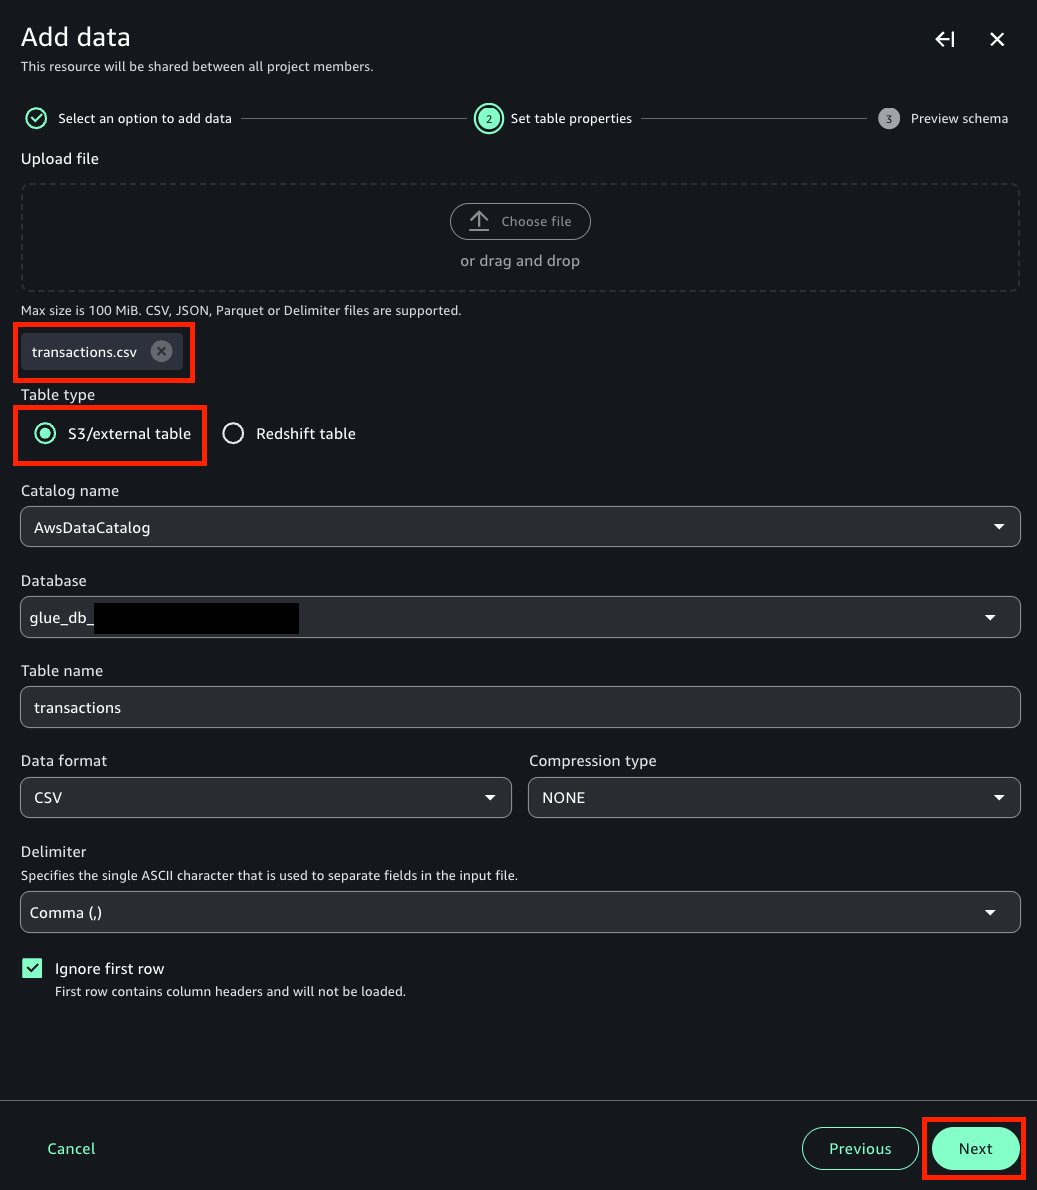
  6. On the Set table properties page:
    1. Upload file: Upload the transactions.csv file.
    2. Table type: Select S3/external table.
    3. Leave the remaining parameters at the default values.
    4. Choose Next.
  7. On the Preview schema page, verify that the schema matches the expected structure, then choose Create table.
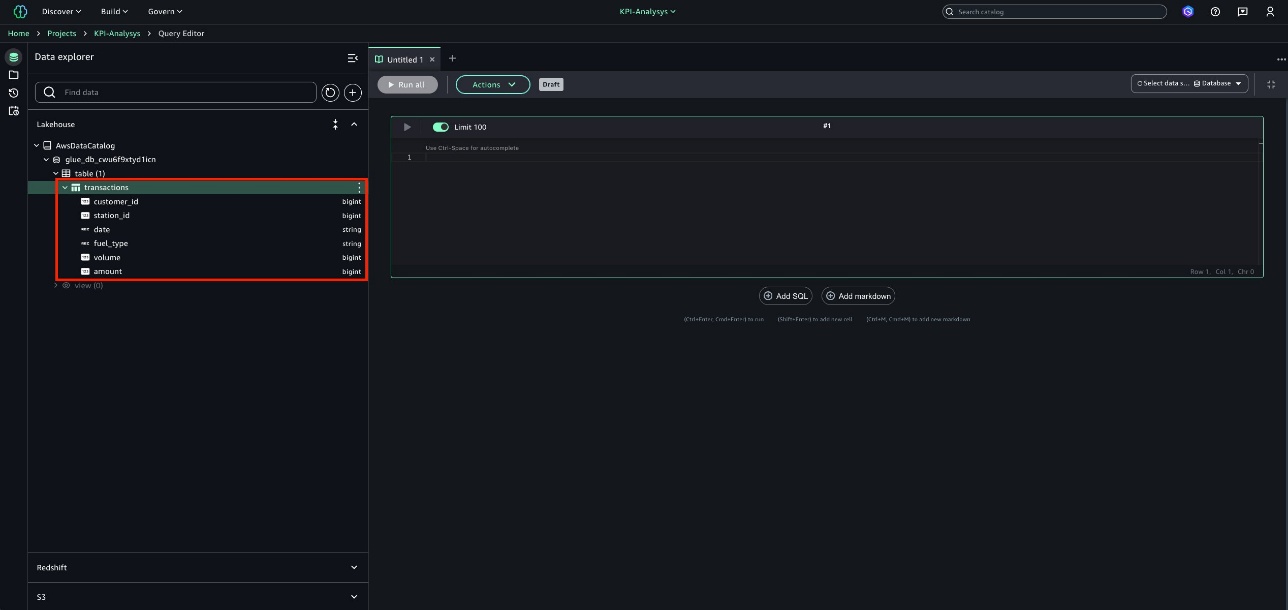
  8. The Transactions table has now been successfully created.

Create a dashboard using QuickSight

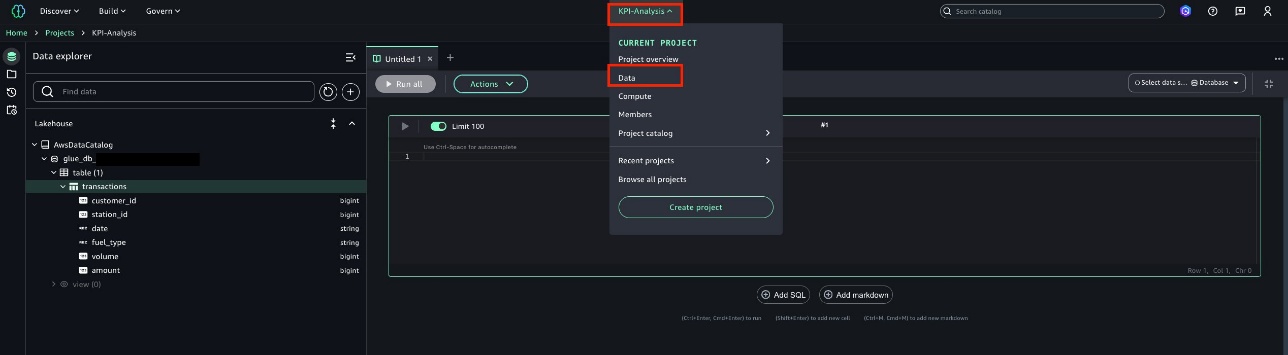
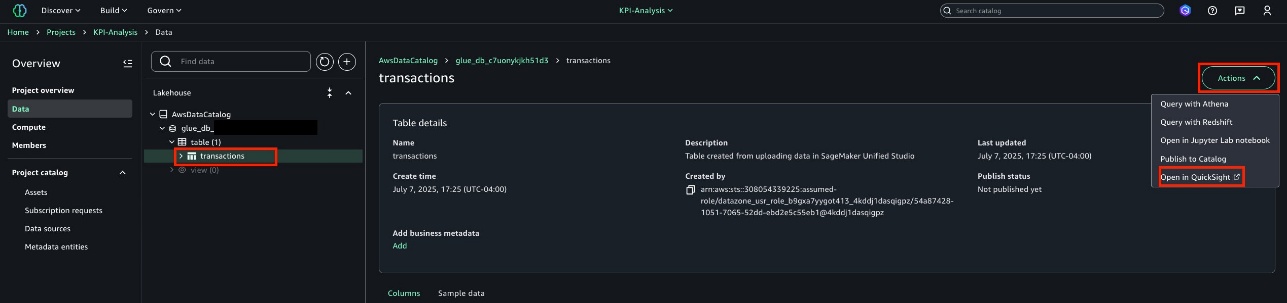
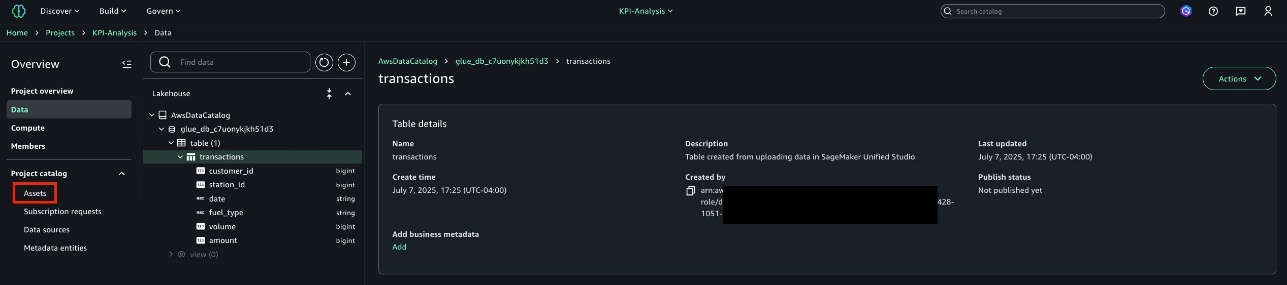
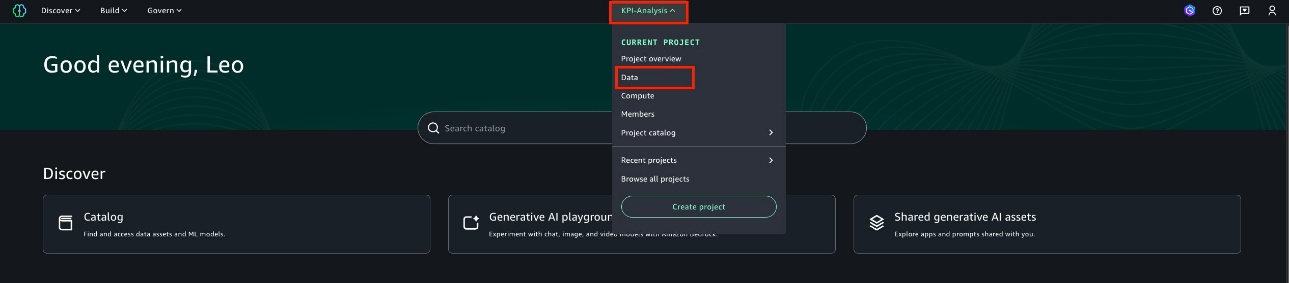
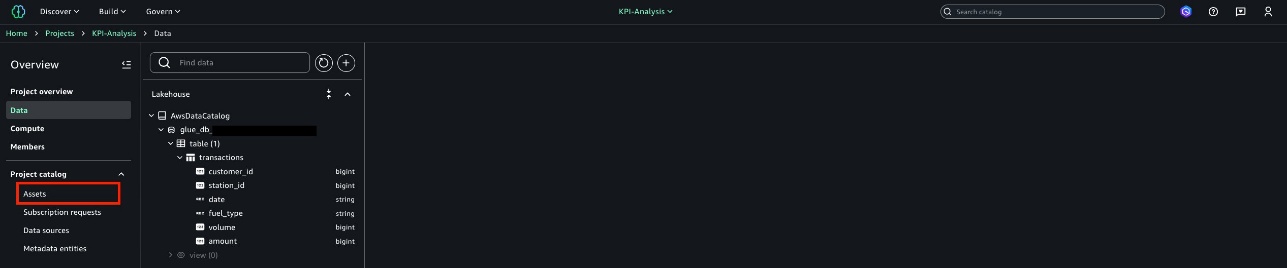
  1. Choose the KPI-Analysis project, then choose Data.
  2. On the Data page: Select the Transactions table, choose Actions, then select Open in QuickSight.
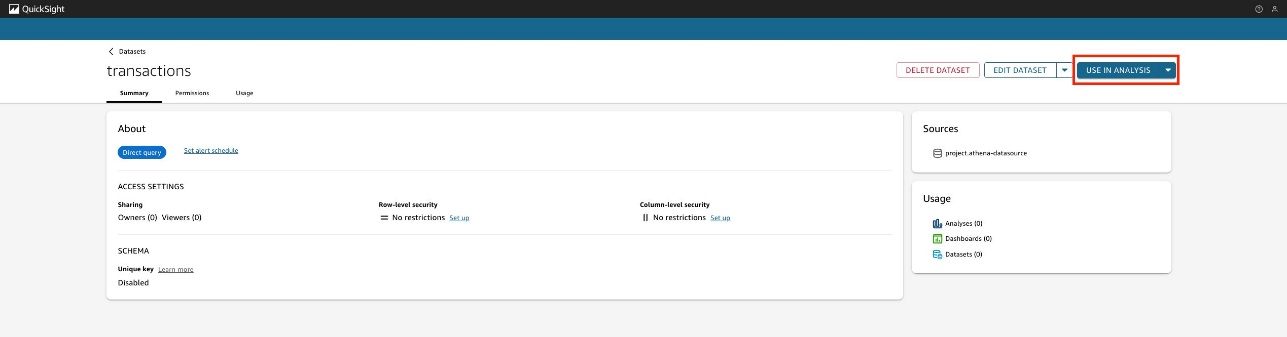
  3. This step redirects you to the QuickSight UI, specifically to the transactions dataset page.
  4. Choose USE IN ANALYSIS to begin exploring the data.
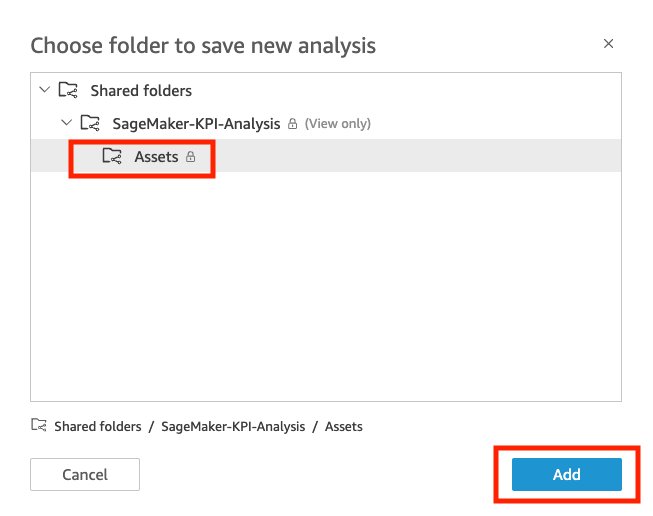
  5. Choose a folder to save your new analysis—for this post, we selected the Assets folder.
  6. Choose Add to save the analysis.
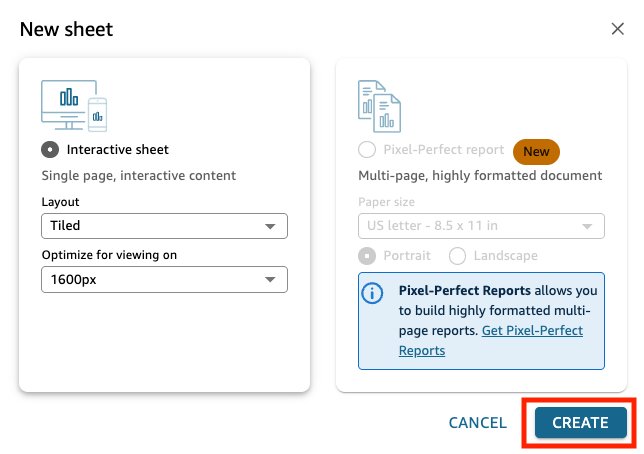
  7. On the New sheet page, leave all parameters at the default values, then choose CREATE.
  8. You’ll now be taken to the Analysis page. In this example, you analyze credit card spending at gas stations, focusing on identifying the most popular fuel type among your cardholders. The goal is to use this insight to design targeted promotions.
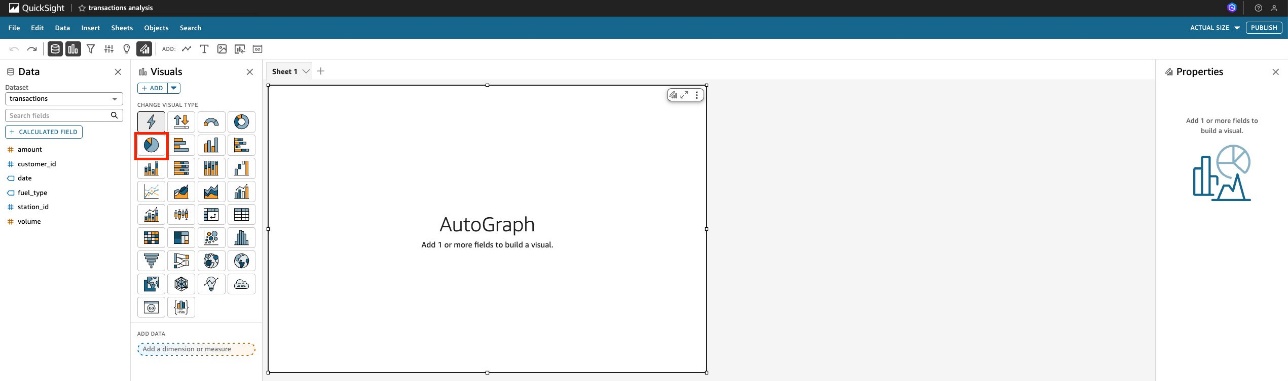
  9. Under Visuals, select Pie chart.
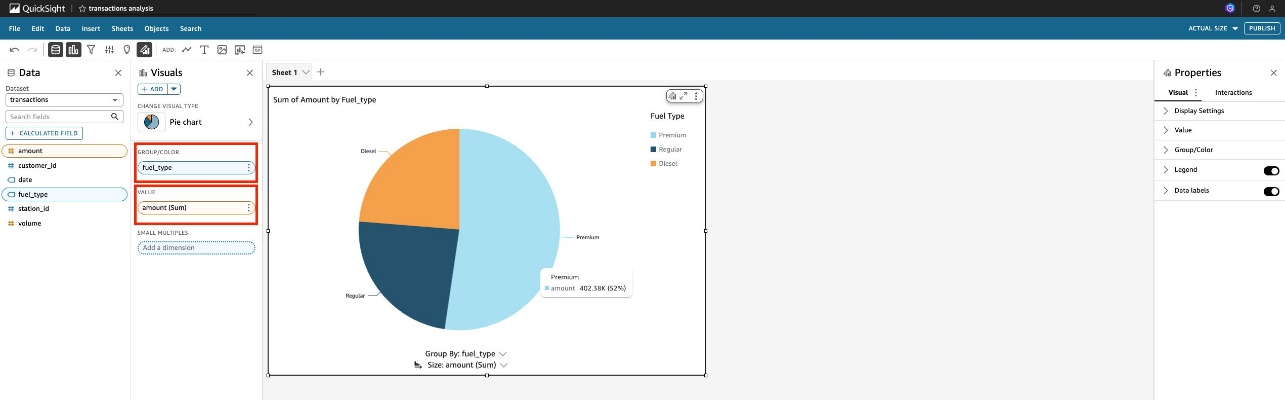
  10. Under GROUP/COLOR, select fuel_type.
  11. Under Value, select amount[Sum].
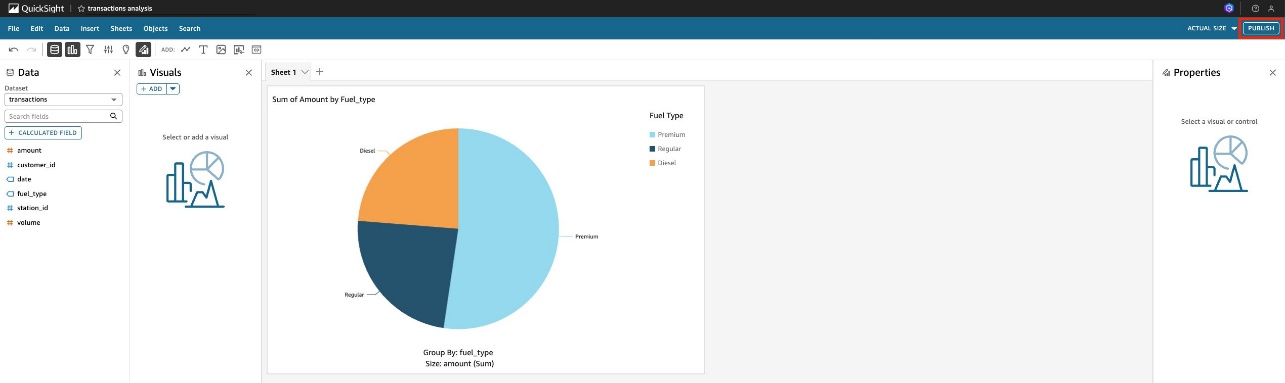
  12. You will see that credit card holders of AWSome-Bank prefer the Premium fuel type.
  13. Publish this new dashboard to the enterprise data catalog. To do that, choose PUBLISH located in the top right corner.
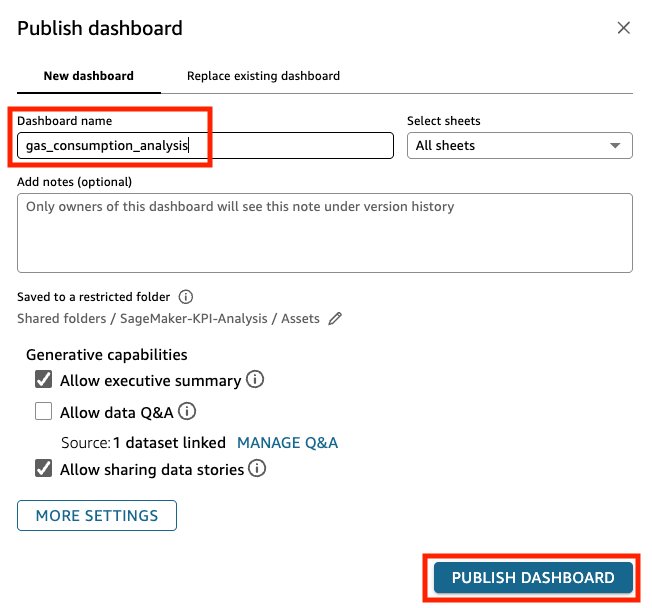
  14. On the Publish Dashboard page:
    1. Enter a name for the dashboard. For this post, we’re using gas_consumption_analysis.
    2. Leave the remaining parameters set to their default values.
    3. Choose PUBLISH DASHBOARD.

Documenting and publishing a QuickSight asset

After the dashboard is created, it’s automatically added to the SageMaker project. From there, analysts or BI engineers can enrich it with business metadata, make it discoverable across the organization, and share it with other users or groups in their corporate directory.

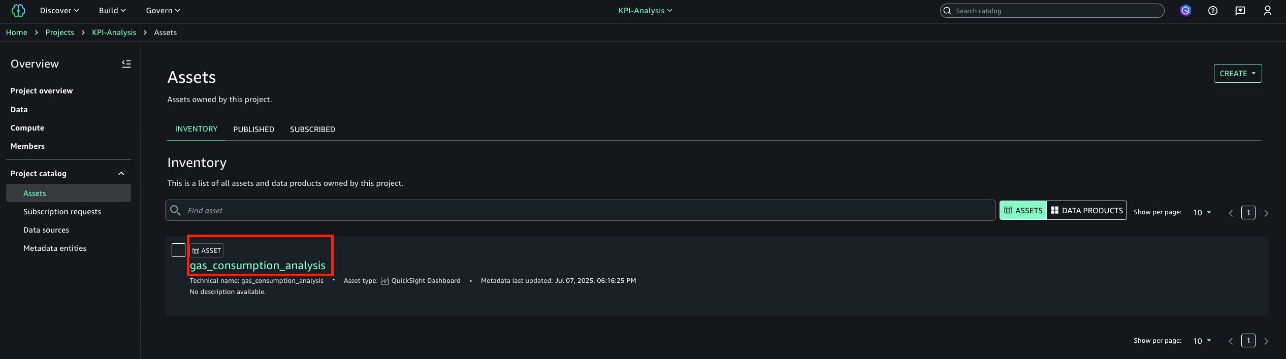
  1. Go back to the Amazon SageMaker portal
  2. Select the Assets tab.
  3. On the Inventory tab, select the gas_consumption_analysis asset.
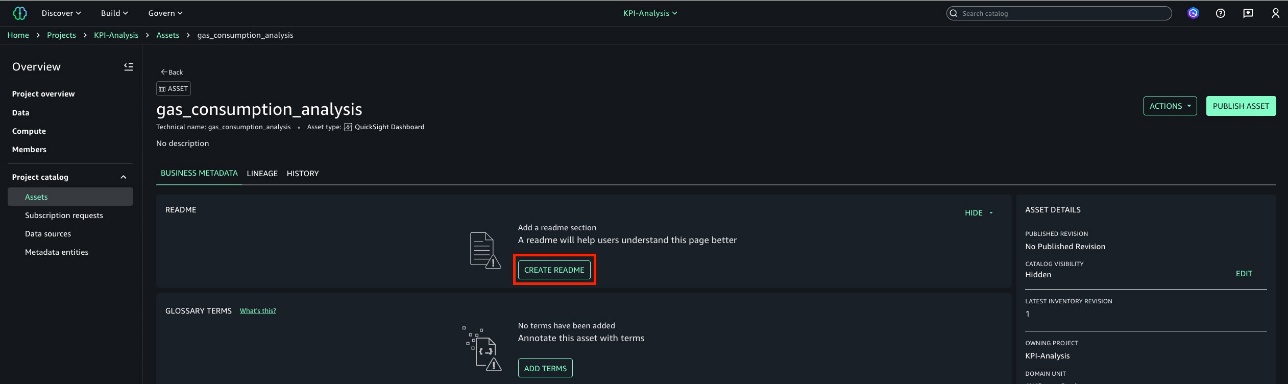
  4. This will take you to the main asset page, where you can add business metadata, view the lineage diagram, and review the asset history.
  5. For this post, you will only add a README section.
  6. Choose CREATE README to get started.
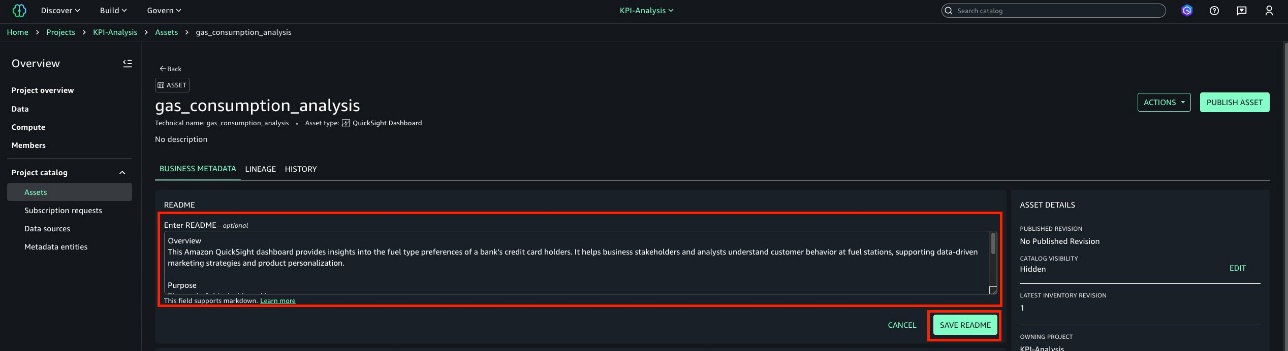
  7. Add a description for the asset. For this POST, we used the following:
Overview
This Amazon QuickSight dashboard provides insights into the fuel type preferences of a bank’s credit card holders. It helps business stakeholders and analysts understand customer behavior at fuel stations, supporting data-driven marketing strategies and product personalization.
Purpose
The goal of this dashboard is to:
Analyze which fuel types (for example, Regular, Premium, Diesel, Electric) are most frequently purchased using the bank’s credit cards.
Identify customer segments (for example, age groups, locations, income brackets) that prefer specific fuel types.
Understand transaction patterns such as frequency, average spend per fuel type, and purchase timeframes.
  1. Choose SAVE README to save the description.
  2. On this page, you can also add glossary terms and metadata forms to provide additional business context to the asset. For this post, leave these fields empty.
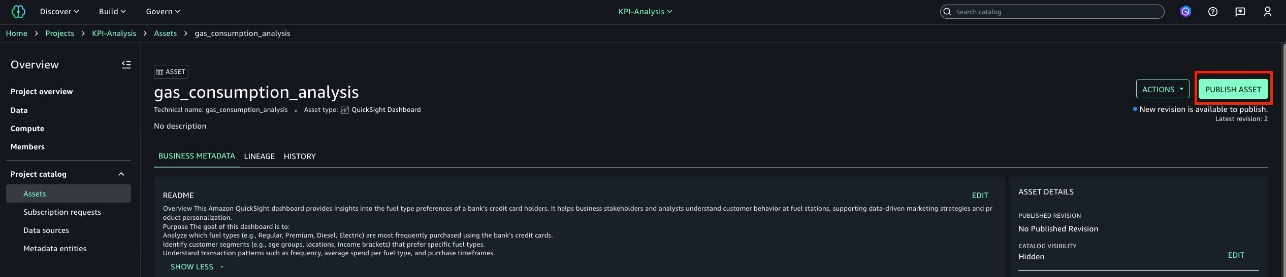
  3. Now you’re ready to publish the QuickSight asset to the enterprise data catalog. To do this, choose PUBLISH ASSET.
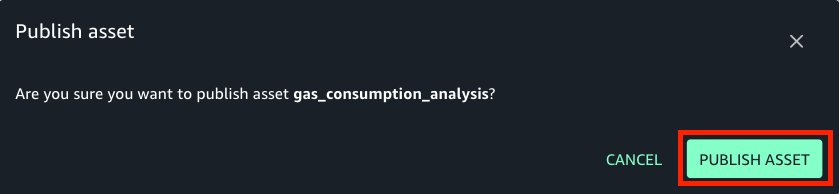
  4. A confirmation prompt will appear. Choose PUBLISH ASSET again to complete the publishing process.

Search for a QuickSight asset

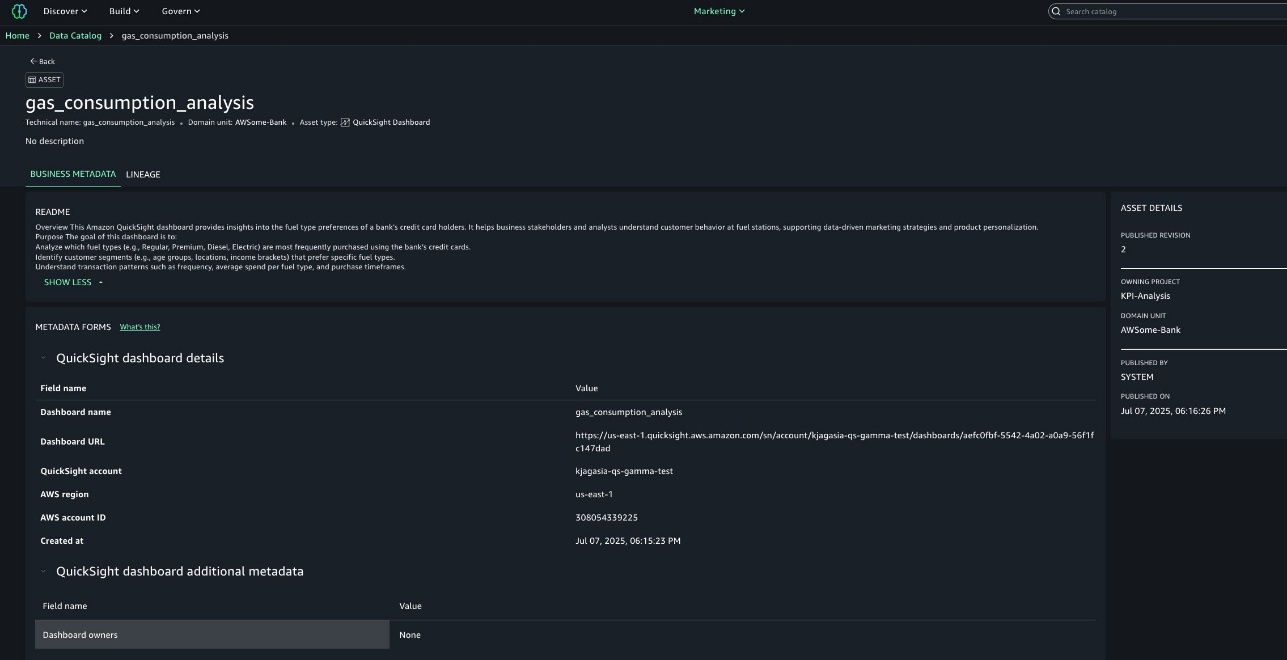
  1. For this post, we created a second project called Marketing, but you can use any other project within your domain or even reuse the one created in the earlier steps.
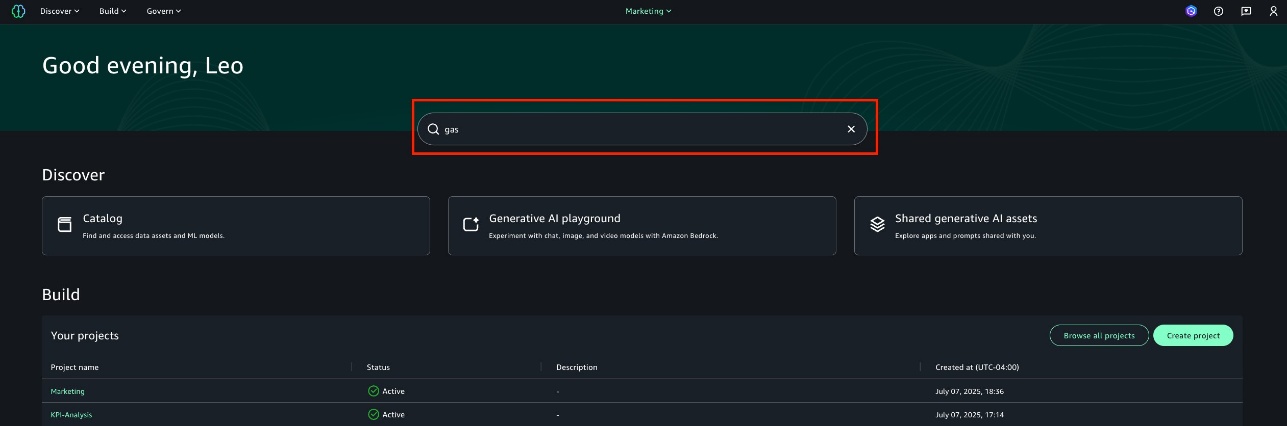
  2. Navigate to the SageMaker home page.
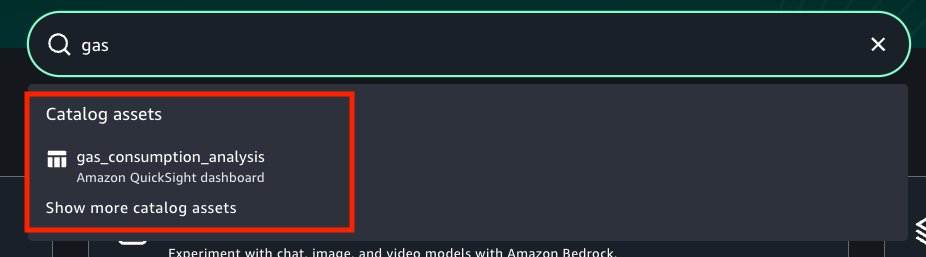
  3. In the catalog search field, enter gas to find the published asset.
  4. Select the relevant result for the published asset from the search results.
  5. This will take you to the asset’s main page, where you can view the metadata added by the producer.

Sharing a QuickSight asset

You can share the QuickSight dashboard with users and groups in your organization directly from within SageMaker.

  1. Go back to the KPI-Analysis project.
  2. Choose the Data tab.
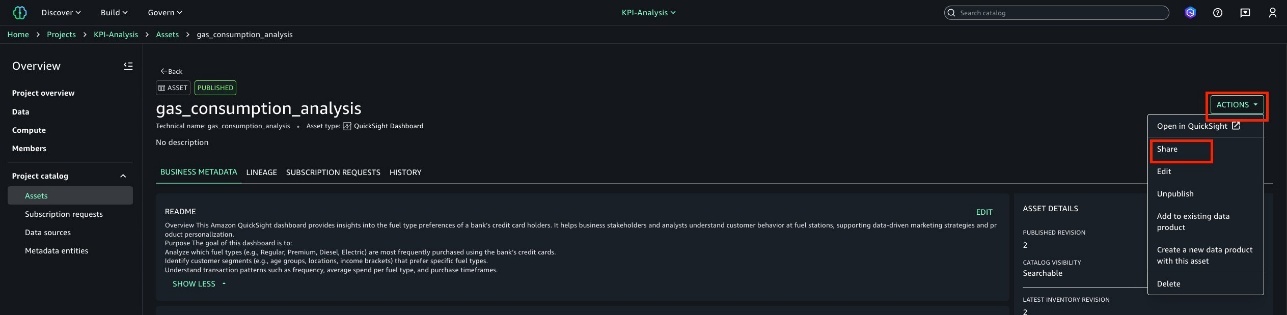
  3. Then, select Assets from the Project catalog.
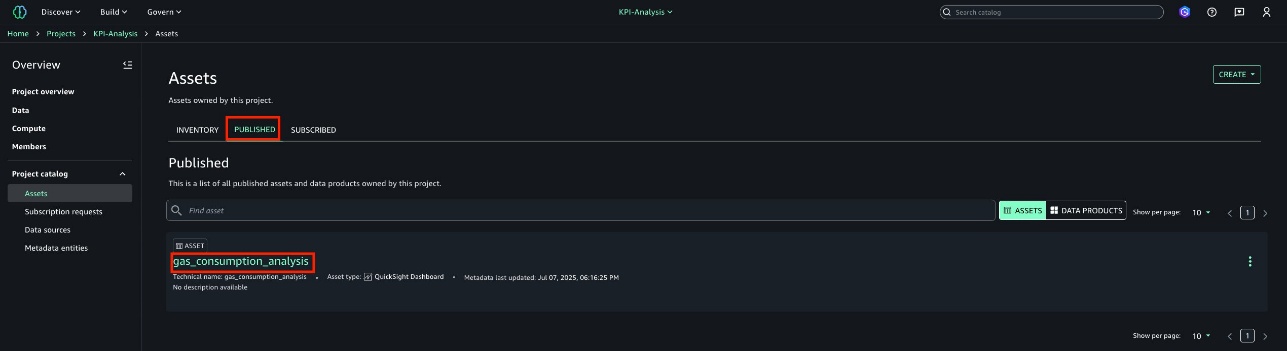
  4. Go to the PUBLISHED tab, then select the gas_consumption_analysis asset.
  5. Choose Actions, then select Share.
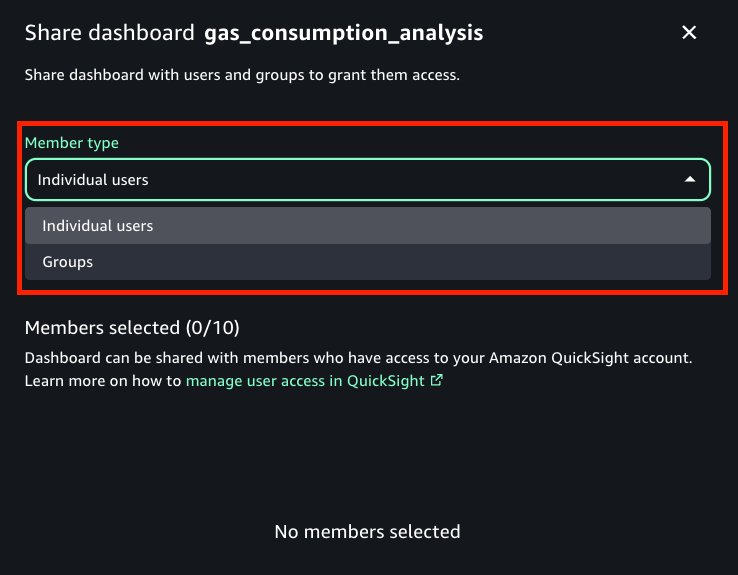
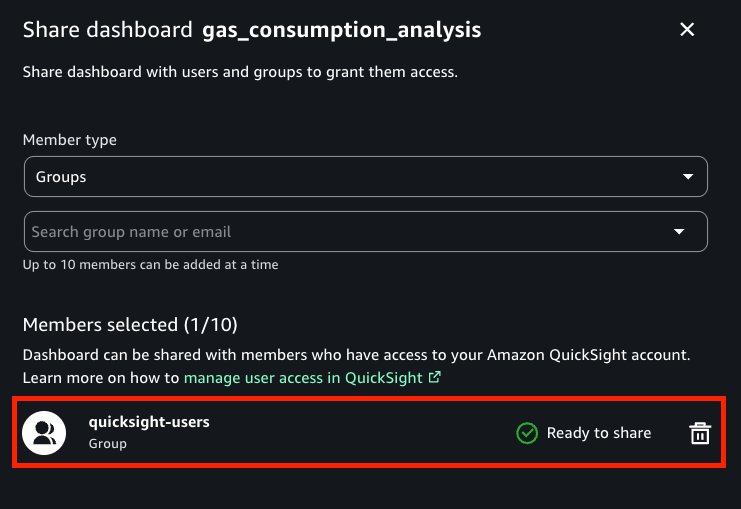
  6. You can share the asset with individual SSO users or with groups. For this post, we selected an SSO group named quicksight-users, but you can choose any user or group you have previously created.
  7. Choose Share.
  8. A confirmation message will appear after the asset has been successfully shared.

Clean up

When you’re done with these exercises, complete the following steps to delete your resources to avoid incurring costs:

  1. Delete the QuickSight assets that you created.
    1. If QuickSight is enabled solely for testing, make sure to cancel the QuickSight account.
  2. Delete the project created in SageMaker.
    1. If SageMaker is enabled solely for testing, make sure to cancel the SageMaker account.

Conclusion

This post walked through the complete process of integrating Amazon QuickSight with Amazon SageMaker Unified Studio, demonstrating how teams can move from raw data to published dashboards in a secure and governed environment. By combining the advanced analytics capabilities of QuickSight with the collaborative project-based structure of SageMaker, organizations can accelerate insight delivery while maintaining clear control over data access and governance.

The integration simplifies creating datasets directly from Amazon Athena or Amazon Redshift tables, enrich them with business metadata, and publish dashboards to the SageMaker Catalog. When published, these dashboards can be shared with users or groups across the organization, making insights both discoverable and actionable.

With the added power of Amazon Q in QuickSight and generative BI, users can ask questions in plain English and receive real-time visualizations and insights. This makes data exploration intuitive and inclusive, empowering more users to make informed decisions. Combined with the unified analytics and AI environment of SageMaker Unified Studio, this solution supports secure, scalable, and collaborative data-driven innovation.


About the authors

Ramon Lopez is a Principal Solutions Architect for Amazon QuickSight. With many years of experience building BI solutions and a background in accounting, he loves working with customers, creating solutions, and making world-class services. When not working, he prefers to be outdoors in the ocean or up on a mountain.

Leonardo Gomez is a Principal Analytics Specialist Solutions Architect at AWS. He has over a decade of experience in data management, helping customers around the globe address their business and technical needs. Connect with him on LinkedIn.
Unifying metadata governance across Amazon SageMaker and Collibra

Post Syndicated from Vasiliki Nikolopoulou original https://aws.amazon.com/blogs/big-data/unifying-metadata-governance-across-amazon-sagemaker-and-collibra/

This post was co-written with Vasiliki Nikolopoulou from Collibra.

Managing metadata across tools and teams is a growing challenge for organizations building modern data and AI platforms. As data volumes grow and generative AI becomes more central to business strategy, teams need a consistent way to define, discover, and govern their datasets, features, and models.

Collibra is a widely adopted data intelligence platform that helps organizations centralize governance workflows, define business glossaries, and enforce policies across data assets. Teams use Collibra to curate business context, classify sensitive data, and manage access to information in line with compliance requirements.

Amazon SageMaker Catalog, part of the next generation of Amazon SageMaker, provides a unified environment where users can register, search, and govern AI and data assets. It allows organizations to organize datasets, trained models, features, and pipelines and apply metadata such as business terms, classifications, ownership, and usage context. Amazon SageMaker Catalog is designed to support collaboration across roles, including data scientists, engineers, and business stakeholders.

As organizations scale their data and AI initiatives, ensuring consistency and trust in metadata becomes increasingly important. Teams need a unified way to manage glossary terms, asset descriptions, classifications, and access governance across platforms. Without this consistency, it becomes difficult to enforce standards, support compliance, and drive collaboration across teams building and consuming data.

To address this challenge, Amazon Web Services (AWS) and Collibra have built a new integrated solution that demonstrates the integration between the Collibra Platform and the next generation of Amazon SageMaker. Developed collaboratively by both companies, the solution is based on the APIs of both products and is designed to help customers explore what’s possible through hands-on testing. It provides a practical example of how metadata synchronization between Collibra and SageMaker can be accomplished in real-world scenarios. With this integration, you can align business and technical metadata across both platforms, so you can extend your governance workflows to AI and analytics assets managed in Amazon SageMaker.

This solution allows metadata to remain consistent across both platforms, regardless of where it was created. It helps reduce duplication, improve metadata quality, and ensure that business context travels with data and AI assets throughout their lifecycle. The integration supports metadata synchronization, glossary term mapping, and access approval workflows using native APIs and automation.

In this post, we take a closer look at the integration, describe the use cases it enables, walk through the architecture, and show how to implement the solution in your environment.

Solution overview

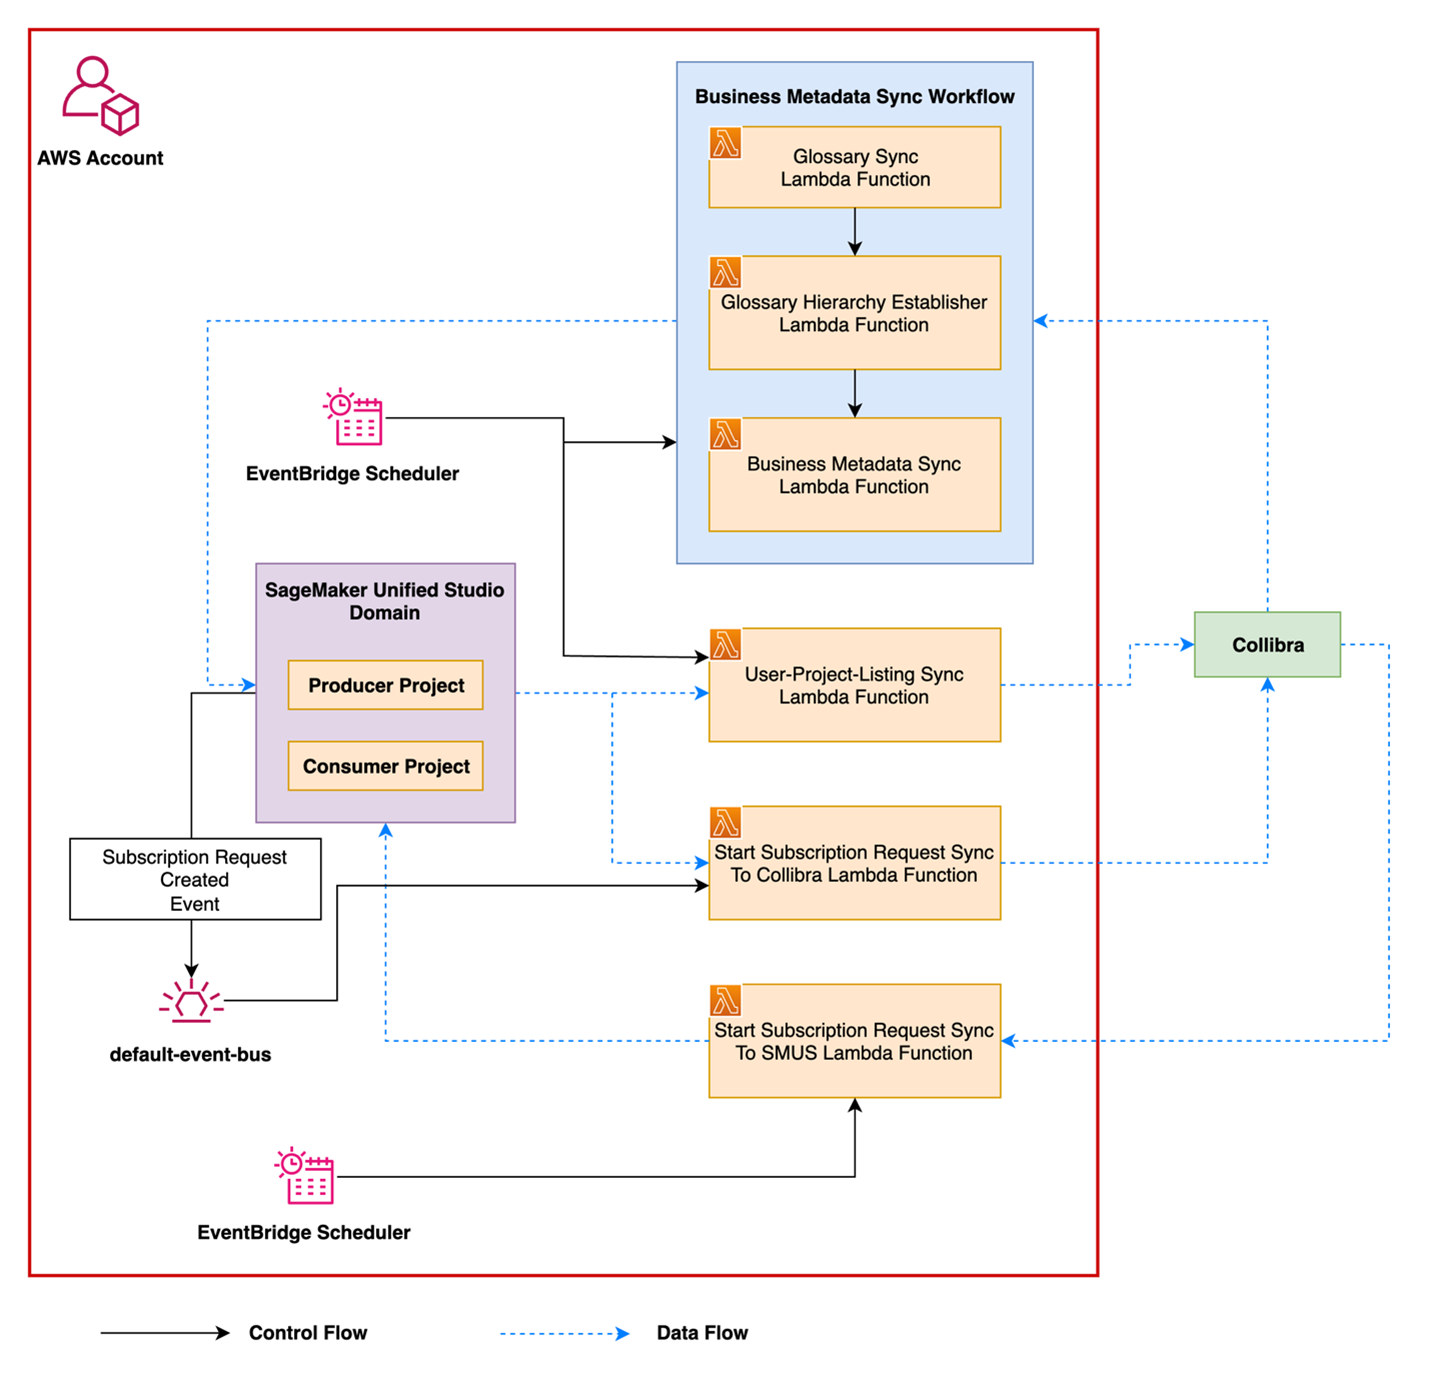
The integration between Amazon SageMaker Catalog and Collibra offers automated, bidirectional metadata synchronization and access governance across both platforms. It’s built using the built-in APIs of Amazon SageMaker and Collibra Data Governance Center (DGC) to provide a scalable and configurable mechanism for metadata exchange. The solution consists of two main capabilities: metadata synchronization and access subscription workflow integration. The following diagram illustrates the solution architecture.

Metadata synchronization

Many organizations manage business and technical metadata across multiple systems. Without synchronization, glossary terms, asset descriptions, and classifications can become inconsistent, leading to duplicated work and misalignment across teams.

This integration allows metadata to flow between Amazon SageMaker Catalog and Collibra, regardless of where it was created. Key elements such as glossary terms, their hierarchy, associated descriptions, and relationships to assets like datasets or columns are automatically synchronized between platforms.

The solution supports:

  • Bidirectional synchronization of glossary terms and descriptions
  • Preservation of glossary structure, including parent-child relationships
  • Association of terms with data assets such as datasets, tables, and columns
  • Synchronization of additional business metadata, such as classifications and data categories
  • Alignment of technical descriptions for datasets and columns between systems

By keeping metadata consistent, the integration reduces manual work, avoids duplication, and provides users in both platforms with the same trusted context.

Subscription and approval flow

Organizations that rely on Collibra for access governance can now extend those workflows to assets cataloged in Amazon SageMaker. After metadata is synchronized, users can discover and request access to datasets directly from within Collibra, using familiar approval processes.

This integration connects Collibra’s workflow engine with the access control mechanism offered by Amazon SageMaker. When an asset is registered in Amazon SageMaker and shared into Collibra, users can initiate a subscription request in Collibra. When it’s approved, access is granted using Amazon the SageMaker built-in access management, which supports multiple AWS services such as AWS Glue and Amazon Redshift.

Key capabilities include:

  • Discovery and access request initiation from Collibra or Amazon SageMaker
  • Centralized review and approval processes managed within Collibra
  • Access provisioning using the Amazon SageMaker grant mechanism
  • Consistent metadata and asset context available throughout the request lifecycle

This flow helps streamline the experience for both business and technical users while keeping access to governed data traceable, auditable, and aligned with organizational policies.

Prerequisites

To perform the solution, you need the following prerequisites:

Walkthrough

The next section provides a walkthrough that shows how the integration works from start to finish. It highlights how a user discovers a data asset, submits a subscription request, and how that request is reviewed, approved, and fulfilled. Throughout the process, metadata and governance policies remain aligned between Collibra and Amazon SageMaker Catalog. This example helps illustrate what the integration enables and how it fits into a typical data access workflow.

Setup on the Collibra environment

To enable this solution, some initial setup is needed in the Collibra environment. This involves configuring the key components that users will need to discover, request, and manage access to data. The following steps outline the basic setup required to support the overall experience.

Operating Model changes and import workflows in Collibra

The operating model of the Collibra instance needs two new asset types and attribute types as well as two new relations and statuses for the scripts and workflows to work properly. These new asset types are recommended because Amazon SageMaker introduces its own concepts and architecture, such as domains and projects. Using the same names in Collibra makes it easier for users to understand and navigate both systems consistently. In the following diagram, the new asset types are shown with dotted lines along with the corresponding new relations, attributes, and statuses.

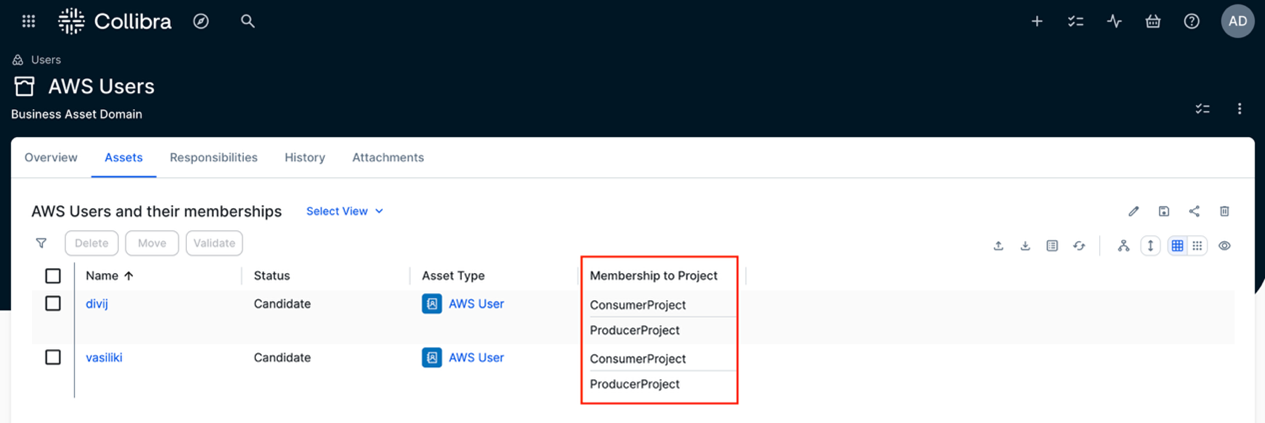
In addition to AWS projects, the implementation requires synchronization of AWS users beyond the standard capabilities. This is necessary because in AWS, a user can’t subscribe to an asset directly as an individual. They can only do so as a member of a project. As a result, when a user subscribes to an asset, they must specify which project they’re subscribing through. To support this behavior, membership to projects information for AWS users needs to be maintained and synchronized within Collibra. AWS project to user mapping needs to be maintained in Collibra, which is accessed by administrative users. The metadata information about AWS user membership to projects can be kept in a Collibra environment or community, which isn’t accessible to anyone except authorized users. Steps for implementation of Collibra operating model changes:

  1. Go to Settings, then Operating model, and add two new asset types, AWS Project and AWS User.
  2. In Settings, navigate to Attribute types and add the new attribute types. The new attribute types are: Project id assigned to the AWS Project asset type, Membership to Project assigned to the AWS User, AWS Project id, Consuming Project and Consuming Project Id to be assigned to the existing asset type Data Usage. Refer to the documentation for more details on how to add new attribute types and how to assign them to asset types
  3. In Settings, go to Relation types and add the Asset to be used relation between asset types data usage and data asset. Refer to the documentation for guidance on how to add a new relation to a pair of asset types.
  4. In Settings, go to Statuses and add the new statuses, which are Access granted and Pending, to be assigned to the asset type data usage.
  5. Go back to the Operating model and, for each new asset type, add the newly created relations, attributes, and statuses. Don’t skip this step. If it isn’t completed, the new configurations will won’t take effect.
  6. Create the following domains:
    1. AWS Users – This is a business asset domain where the metadata for AWS user memberships will be stored. Users and their memberships are automatically imported into Collibra through the solution. An example is shown in the screenshot.
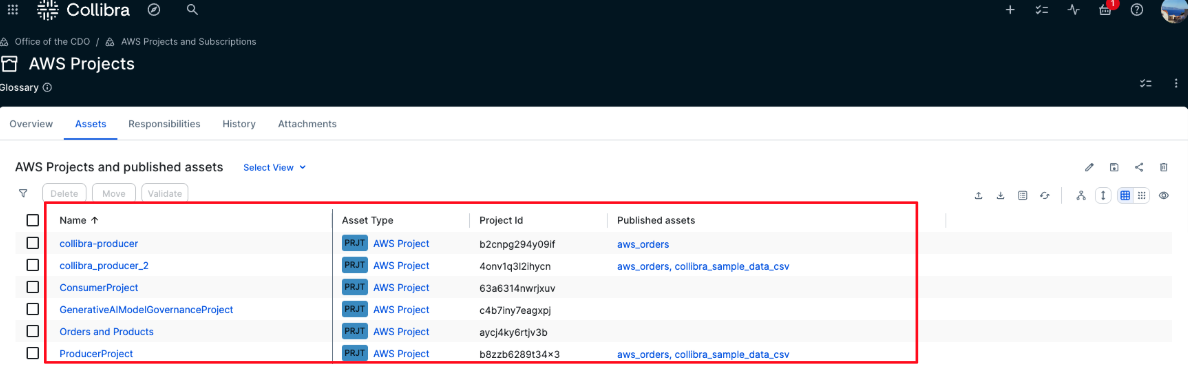
    2. AWS Projects – This is also a business asset domain where AWS projects and their metadata will be automatically imported. The following screenshot shows an example of such a domain. The AWS projects, along with their published assets, are brought into Collibra through the solution.
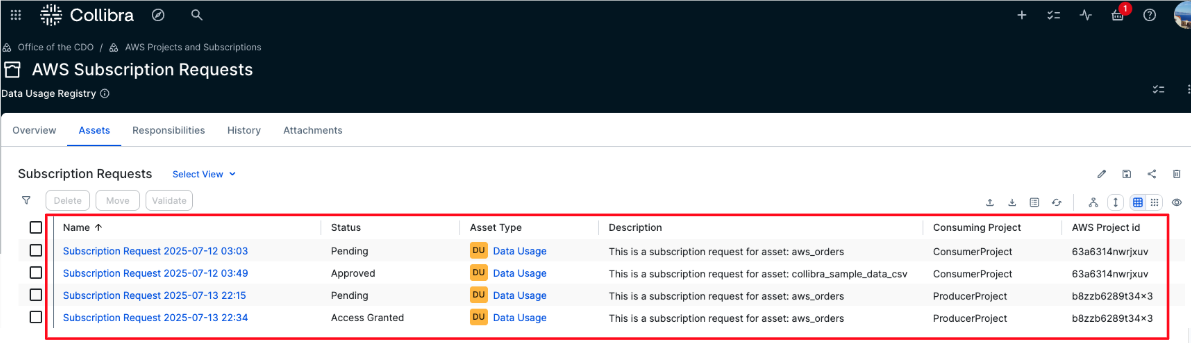
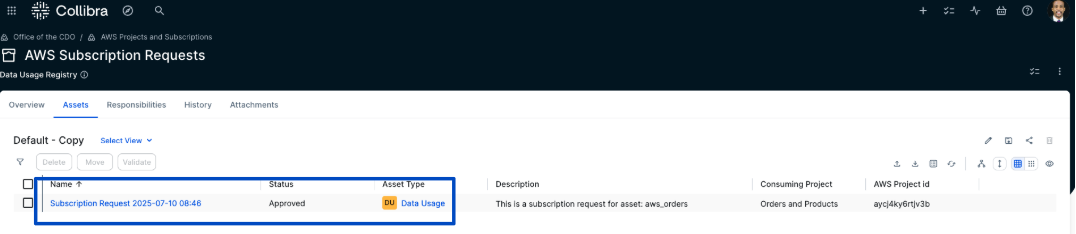
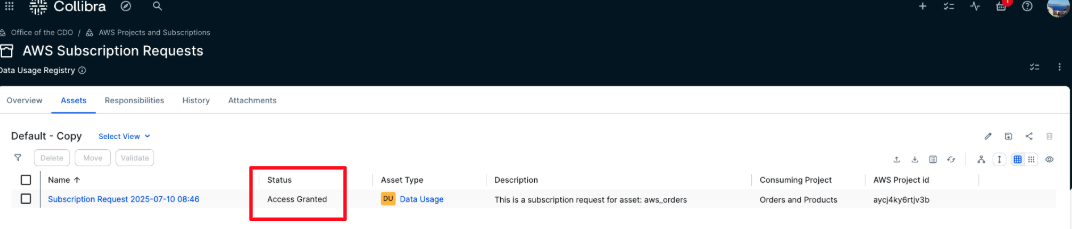
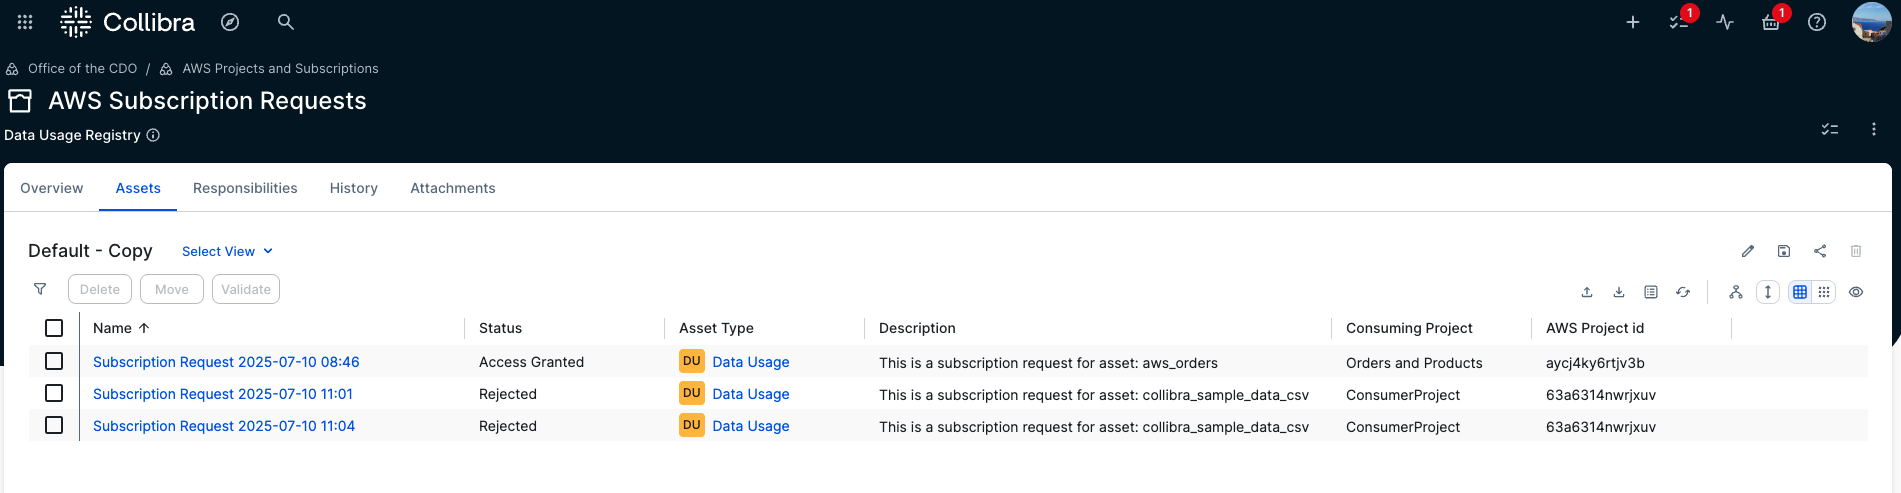
    3. AWS Subscription Requests – This is a domain of type data usage registry. It will hold all new AWS subscription requests along with their context, such as the consuming project and the subscribed data asset. The status of each request is especially important because it drives the integration workflow that users can use to track the current state of their request.

Workflows installation

This solution includes two workflows: one for managing subscription request approvals and another for notifying users when access is granted.

The first workflow handles the full subscription process. It begins by prompting the user to select the consuming project because only projects the user is a member of are eligible for subscriptions. After it’s selected, a new subscription request asset is created in Collibra with a timestamp, the consuming project details, and a status set to Pending.

An approval task is then assigned to the business steward of the requested data asset. If the steward approves the request, the status changes to Approved. This triggers a notification to the requester and signals the AWS solution to pick up the request and grant access. When access is granted, the status is updated to Access granted.

If the steward rejects the request, the status is changed to Rejected and the requester is notified. No further action is taken in that case.

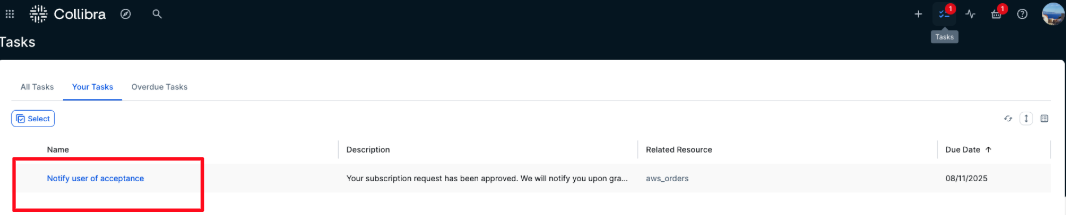
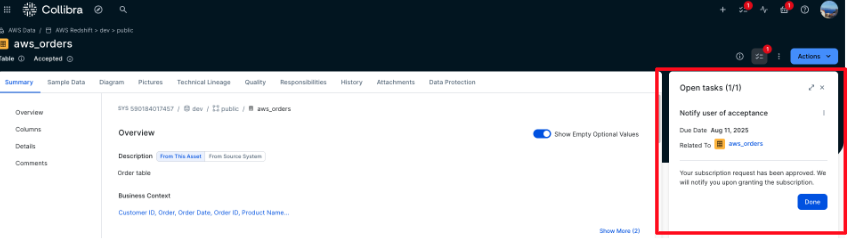
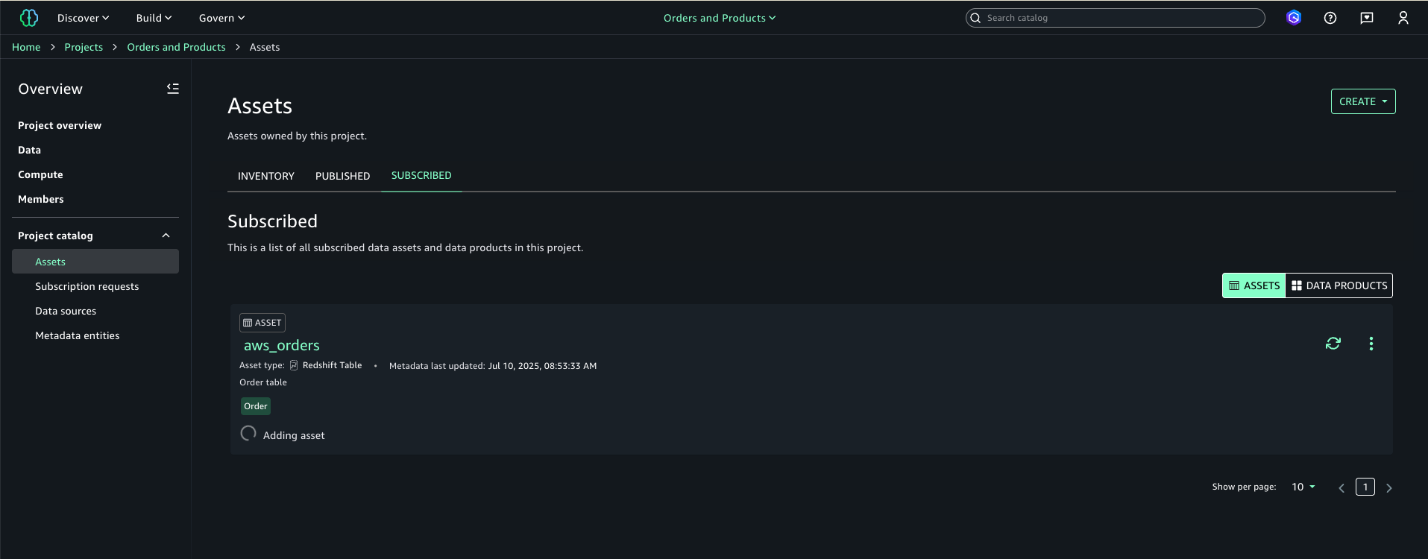
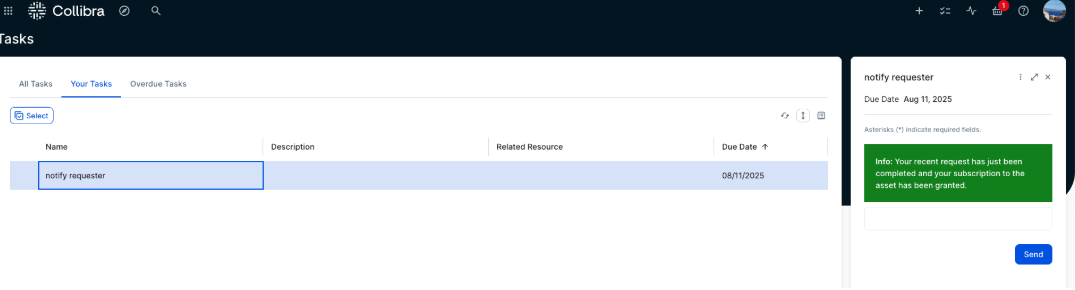
The second workflow notifies the requester that the access was granted. It’s triggered by the functions in AWS when the subscription grant is completed. The steps to deploy the two workflows are as follows:

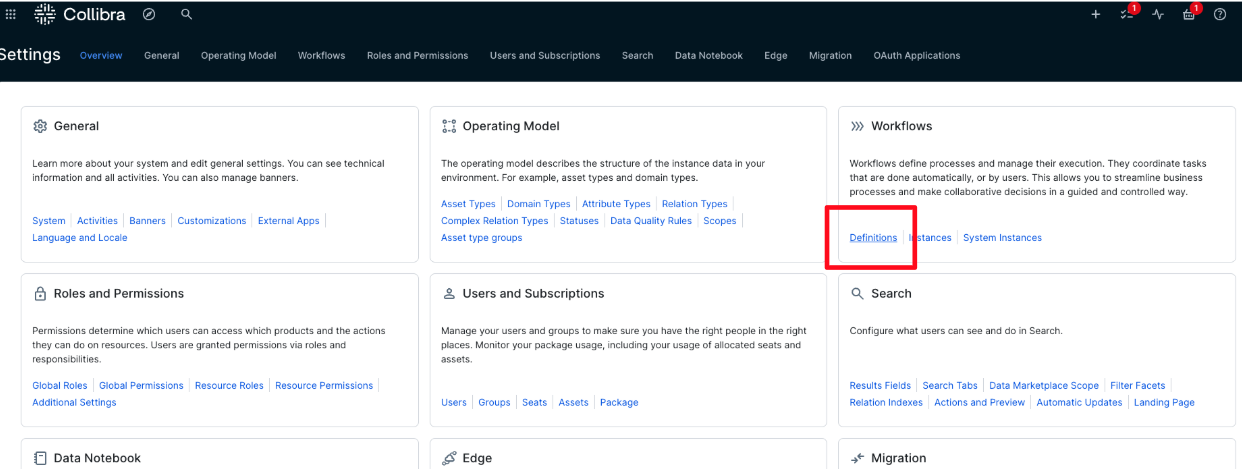
  1. Go to Settings, then select Workflows followed by Definitions, as shown in the following screenshot.

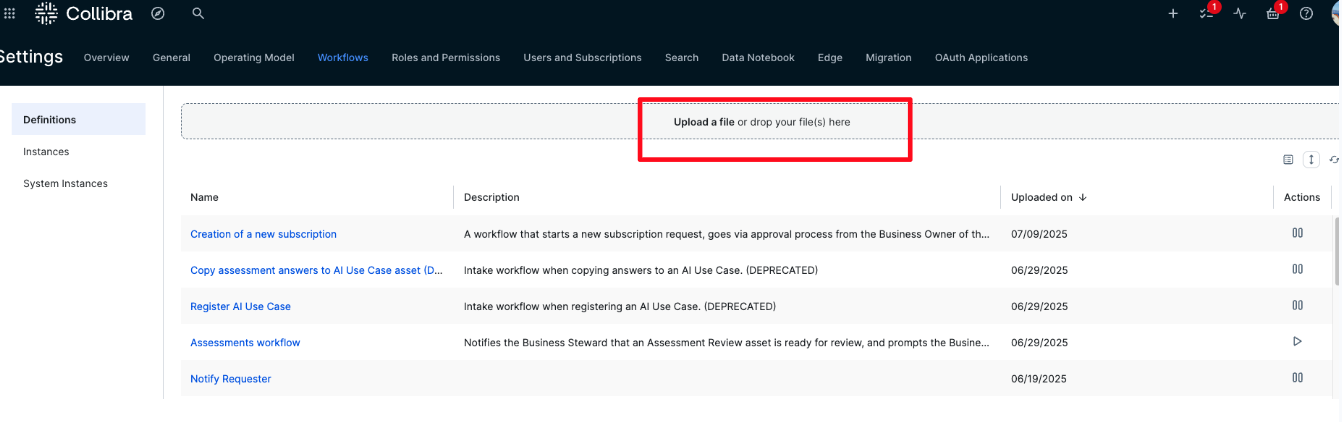
  1. Choose Upload a file, as shown in the following screenshot. Then, upload both workflow files from the GitHub directory where all the files are provided. In that GitHub directory, there is a directory with the workflow files called Workflows.

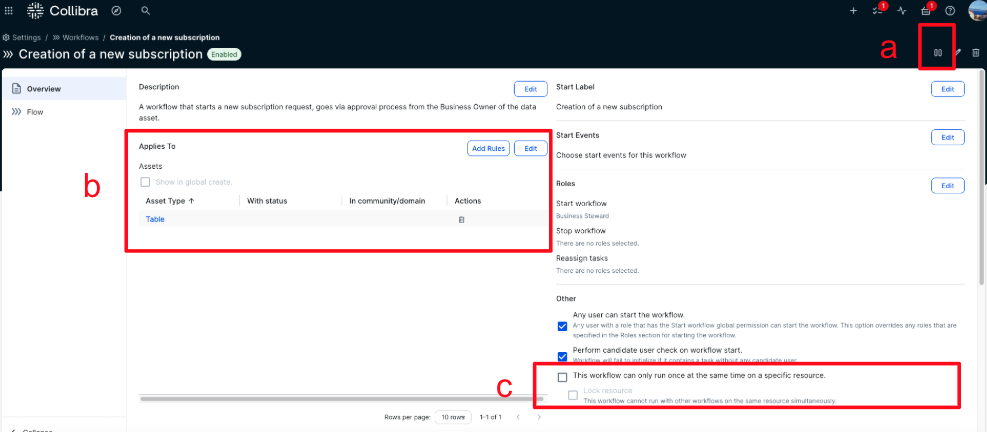
  1. After the workflows are uploaded, complete the following steps for each one, as shown in the following screenshot:
    1. Enable the workflow by choosing Play. When enabled, the button will display a Pause icon.
    2. Under Rules, set it to apply to Assets, then choose Add Rules and choose Asset: Table. You can also use Data Asset for a broader scope, but in this case, published assets in AWS are tables.
    3. Clear This workflow can only run once at the same time on a specific resource. This provides that multiple users can request subscriptions to the same asset simultaneously.

The workflows are now uploaded, enabled, and ready for use.

Add responsibilities

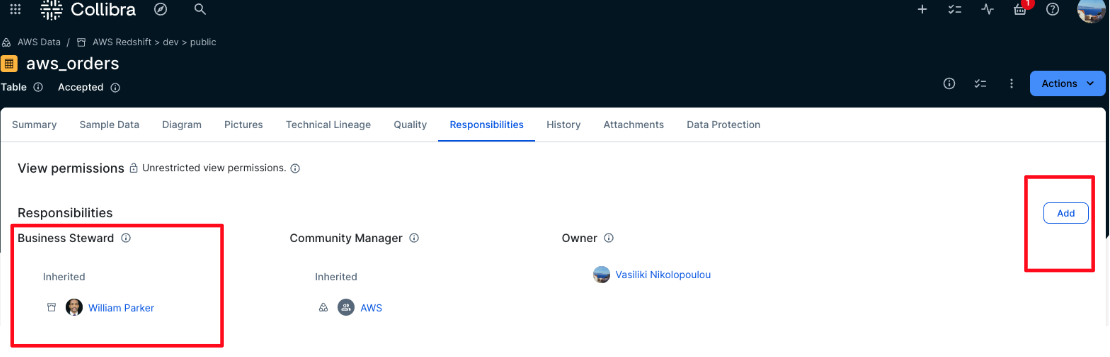
We need to assign business stewards to the ingested AWS assets so that when the workflows are triggered, there is a designated user responsible for approving subscription requests. In this version of the solution, it’s assumed that each asset has only one Business Steward.

To add a Business Steward, follow these steps:

  1. In the domain or community where the AWS data assets have been ingested using the Edge integration, choose Responsibilities. Then choose Add, as shown in the following screenshot

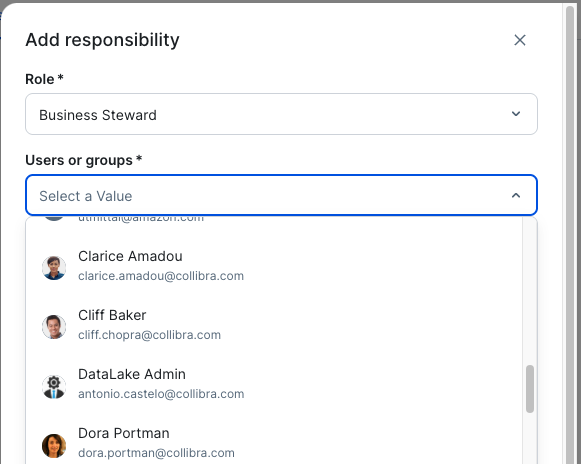
  1. Choose Business Steward from the Role dropdown list, as shown in the following screenshot. From the Users or groups dropdown list, choose the user who will be responsible for approving subscription requests for these assets. This solution allows only one business steward per asset. You can assign a business steward at the community level, and this way this role will be inherited to all assets under this community.

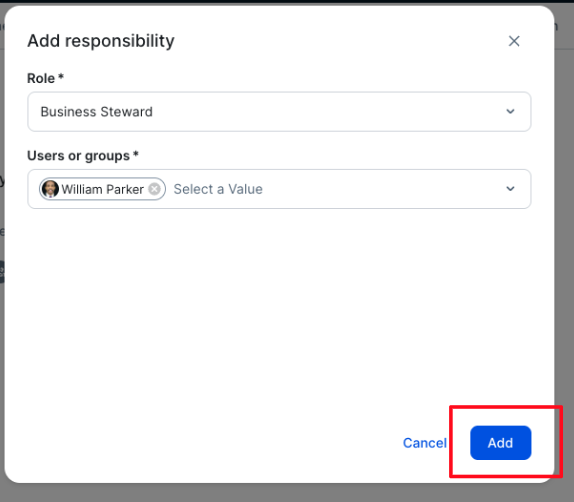
  1. Choose Add, as shown in the following screenshot. This will assign the selected user to the Business Steward role for the specified asset, domain, or community of assets.

Setup on the AWS environment

Now that the configuration on the Collibra side is complete, set up the Amazon SageMaker domain that is used for this walkthrough. We provide the following assets to help users set up this solution

  1. An AWS CloudFormation template in YAML format, called template.yaml
  2. Instructions to generate a lambda zip file that contains all the scripts that the Cloud Formation will run, called lambda_build.zip
  3. Instructions to create a secret using AWS Secrets Manager that will store Collibra credentials.

Create the CloudFormation stack

To support this solution, provision a set of AWS resources that facilitate communication between environments and automate key tasks. In this section, we show how to deploy the foundational infrastructure using AWS CloudFormation, which simplifies resource provisioning and provides consistency across environments.

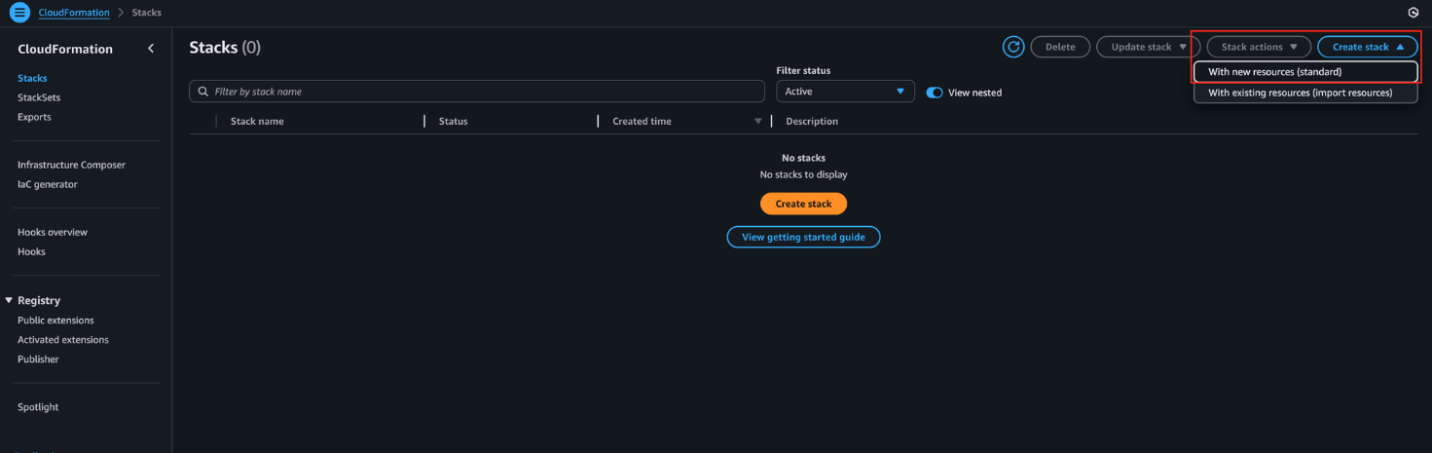
  1. On the AWS Management Console, navigate to CloudFormation and choose Create stack, then choose With new resources (standard), as shown in the following screenshot.

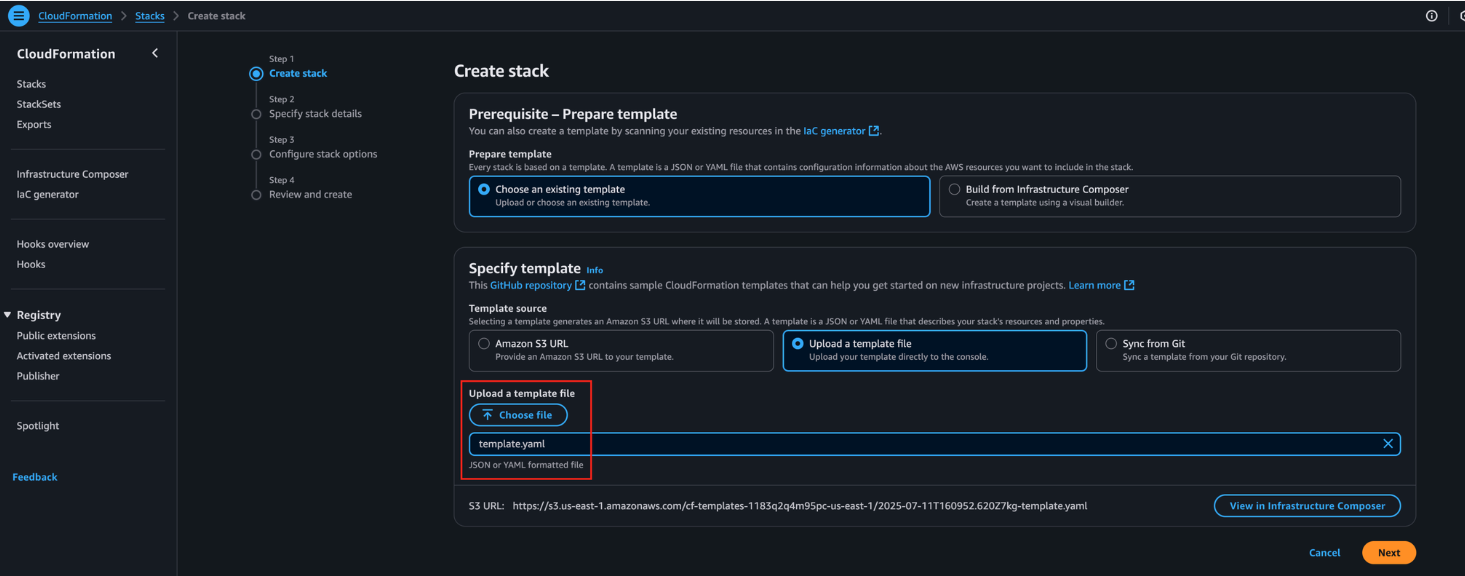
  1. Choose the provided CloudFormation template and choose Next.

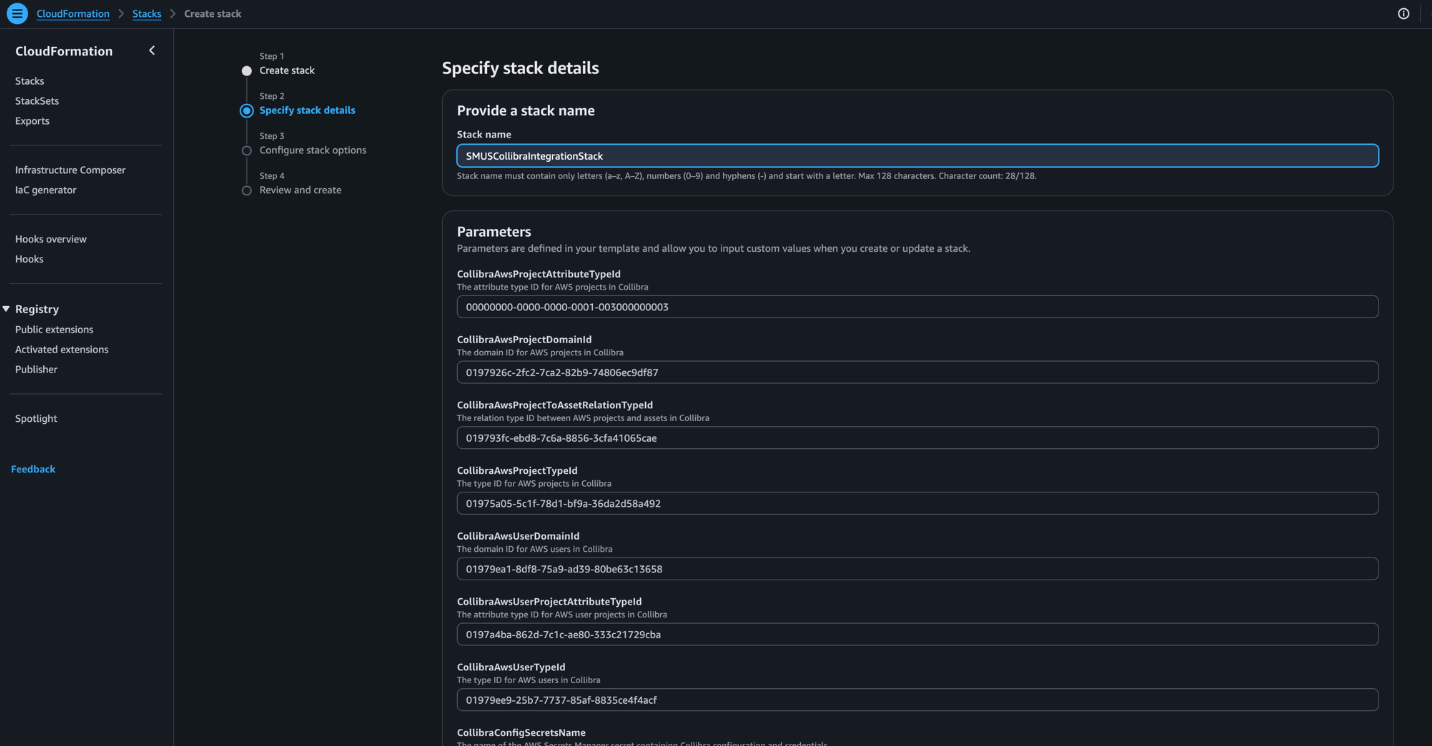
  1. Enter a name for the stack and complete all required parameters below:

  • CollibraAwsProjectAttributeTypeId – The attribute type ID for AWS projects in Collibra.
  • CollibraAwsProjectDomainId – The domain ID for AWS projects in Collibra.
  • CollibraAwsProjectToAssetRelationTypeId – The relation type ID between AWS projects and assets in Collibra.
  • CollibraAwsProjectTypeId – The type ID for AWS projects in Collibra.
  • CollibraAwsUserDomainId – The domain ID for AWS users in Collibra.
  • CollibraAwsUserProjectAttributeTypeId – The attribute type ID for AWS user projects in Collibra.
  • CollibraAwsUserTypeId – The type ID for AWS users in Collibra.
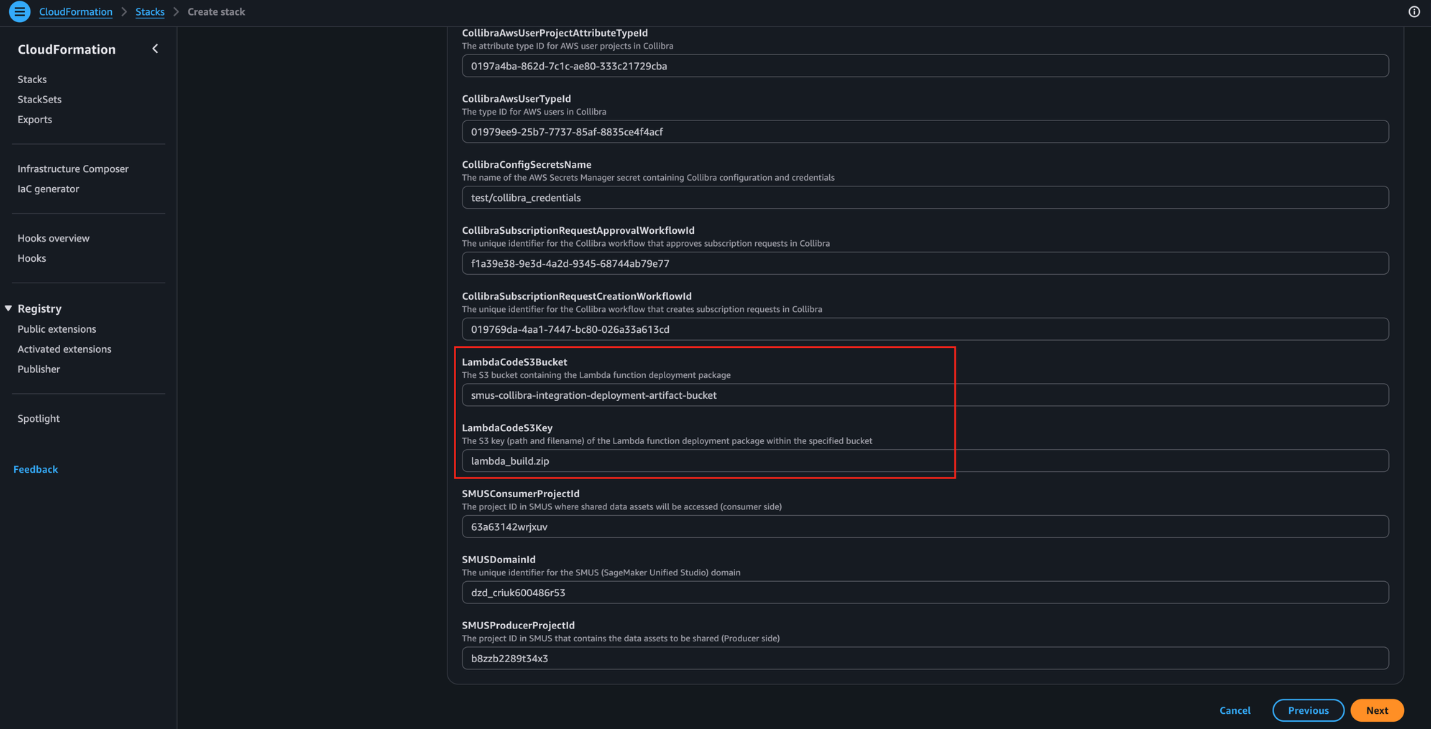
  • CollibraConfigSecretsName – The name of the AWS Secrets Manager secret containing Collibra configuration and credentials.
  • SMUSProducerProjectId – The project ID in SMUS that contains the data assets to be shared (producer side).
  • SMUSConsumerProjectId – The project ID in SMUS where shared data assets will be accessed (consumer side).
  • SMUSDomainId – The unique identifier for the SageMaker Unified Studio (SMUS) domain.
  • CollibraSubscriptionRequestCreationWorkflowId – The unique identifier for the Collibra workflow that creates subscription requests in Collibra.
  • CollibraSubscriptionRequestApprovalWorkflowId – The unique identifier for the Collibra workflow that approves subscription requests in Collibra.
  • LambdaCodeS3Bucket – The S3 bucket containing the Lambda function deployment package.
  • LambdaCodeS3Key – The S3 key (path and filename) of the Lambda function deployment package within the specified bucket.

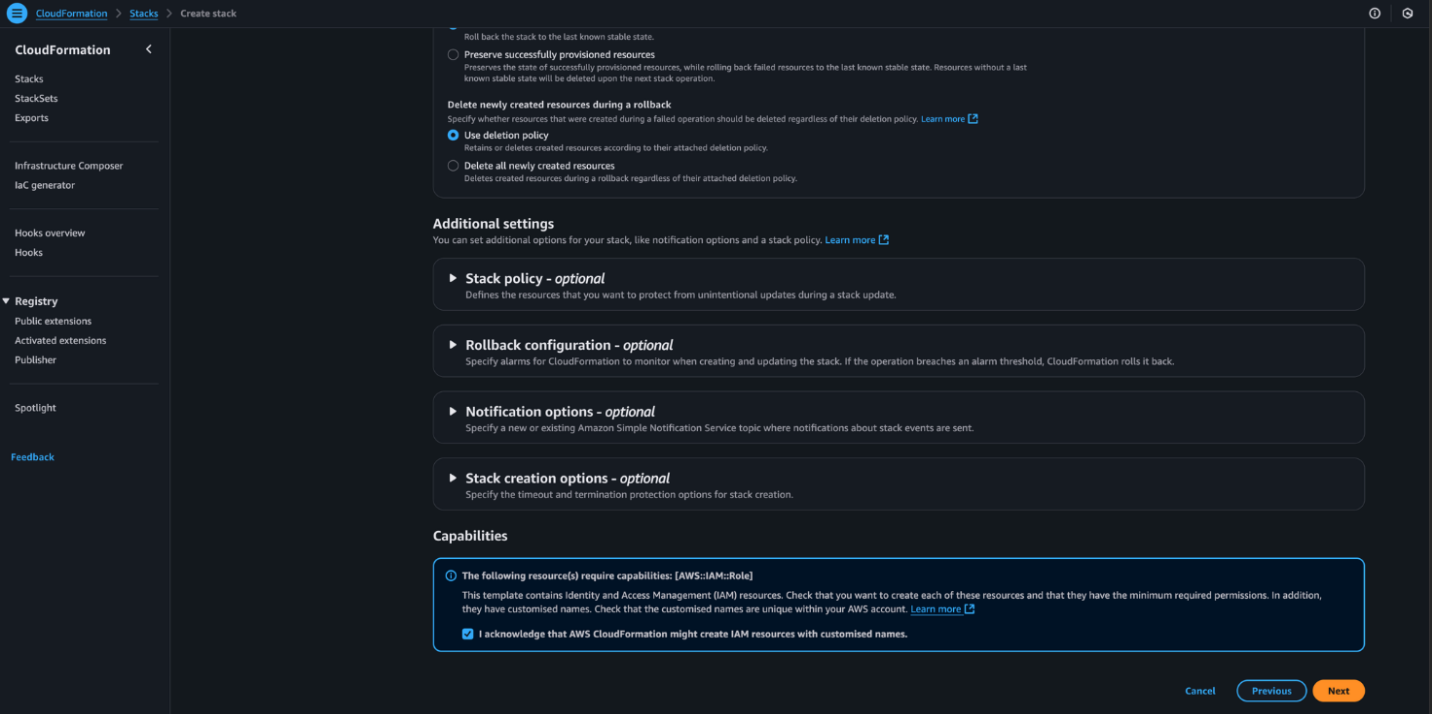
  1. Select the acknowledgement checkbox, then choose Next, as shown in the following screenshot.

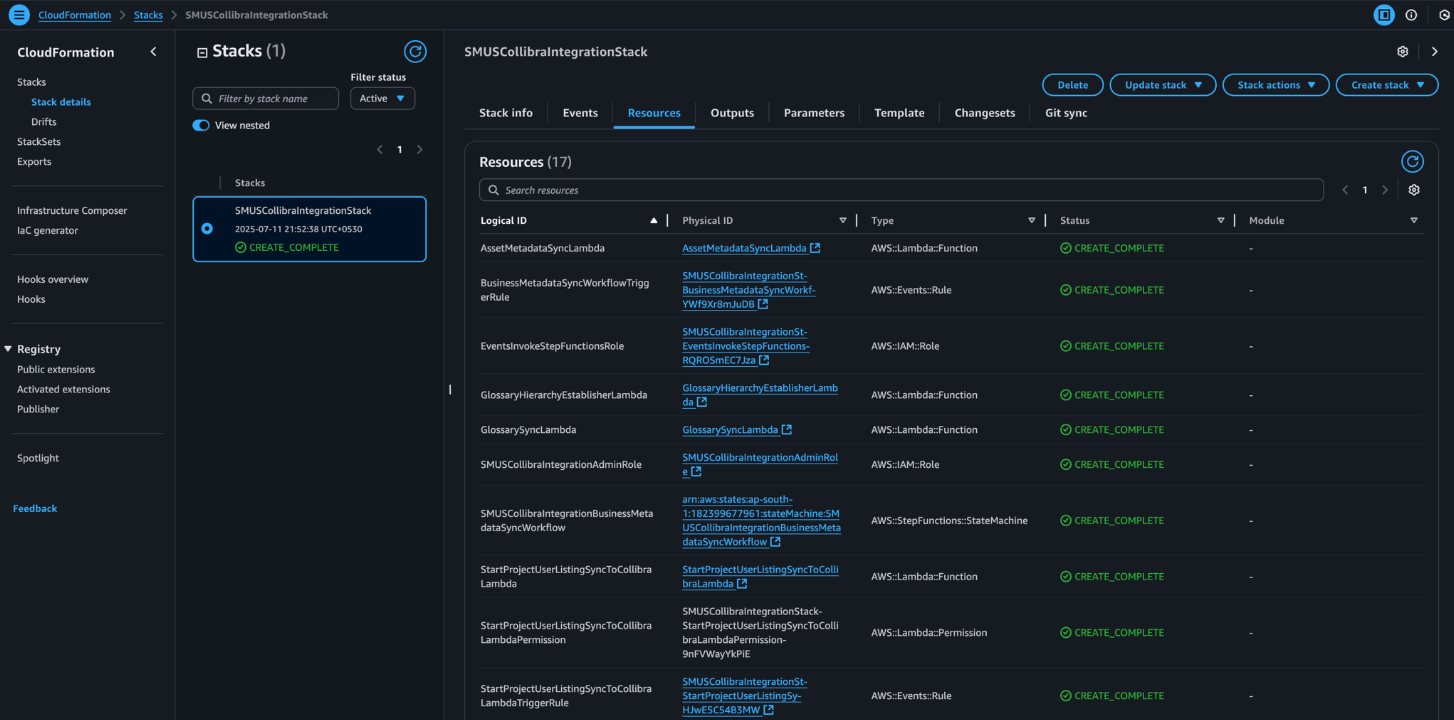
  1. Choose Submit to start the stack deployment. When the process is complete, the stack status will update to CREATE_COMPLETE.

Configure consumer and producer projects

For this post, only two projects are used: one serving as the producer and one as the consumer. Future versions of the solution are planned to support all projects.

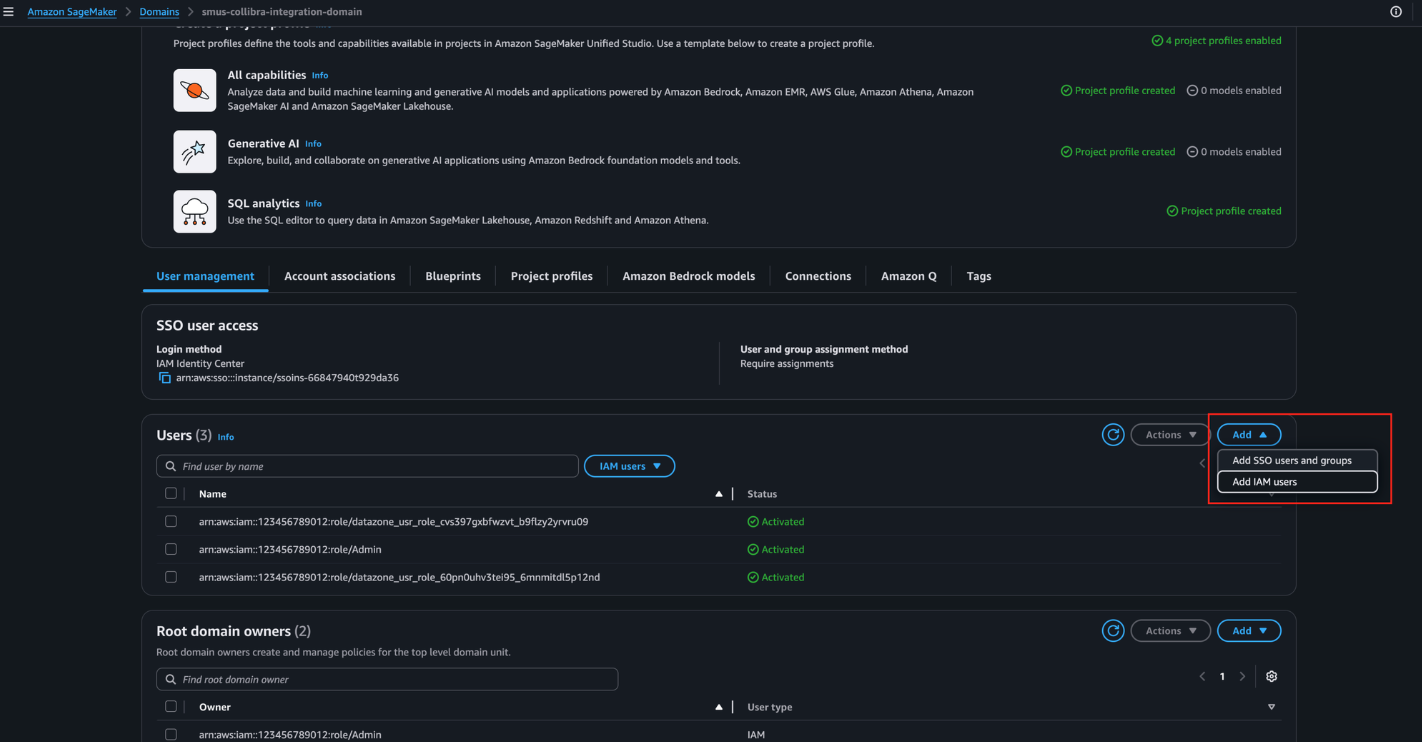
  1. On the AWS Management Console, go to the SMUS Domain detail page. Under the Users section, choose Add, then select Add IAM users.

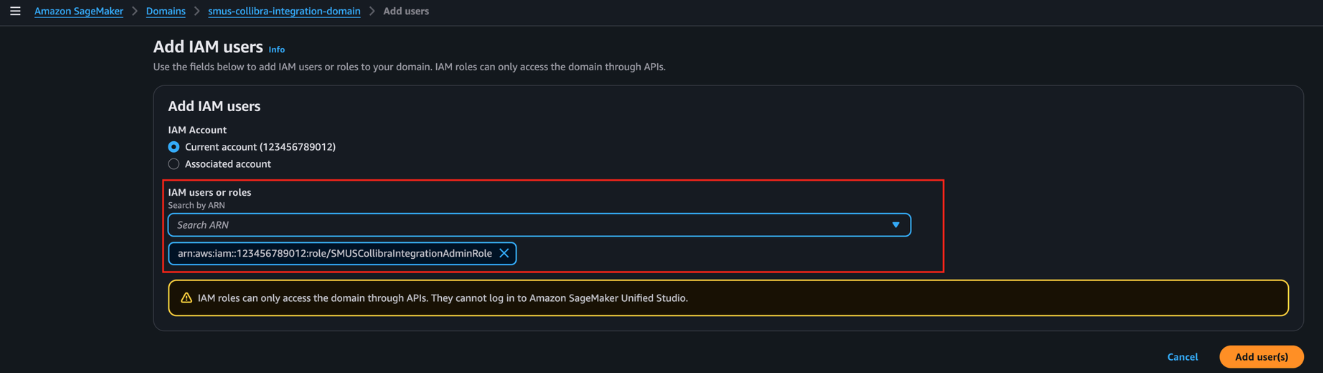
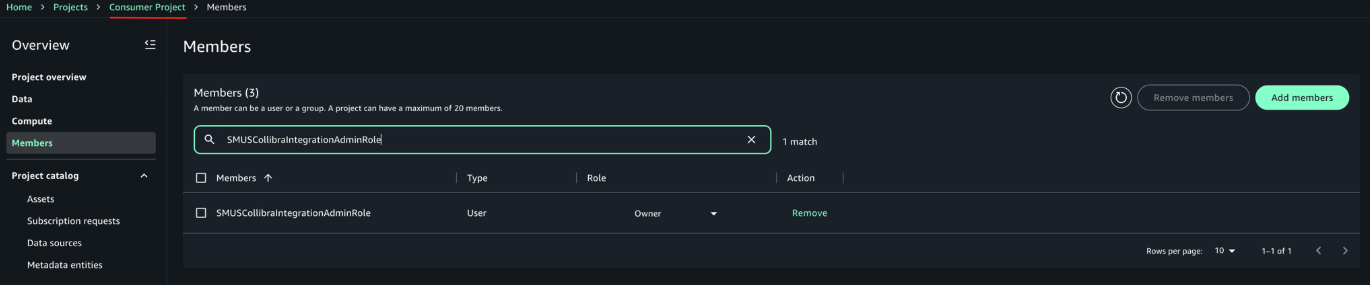
  1. From the dropdown, select the SMUSCollibraIntegrationAdminRole created by the CloudFormation template, then choose Add user(s), as shown in the following screenshot.

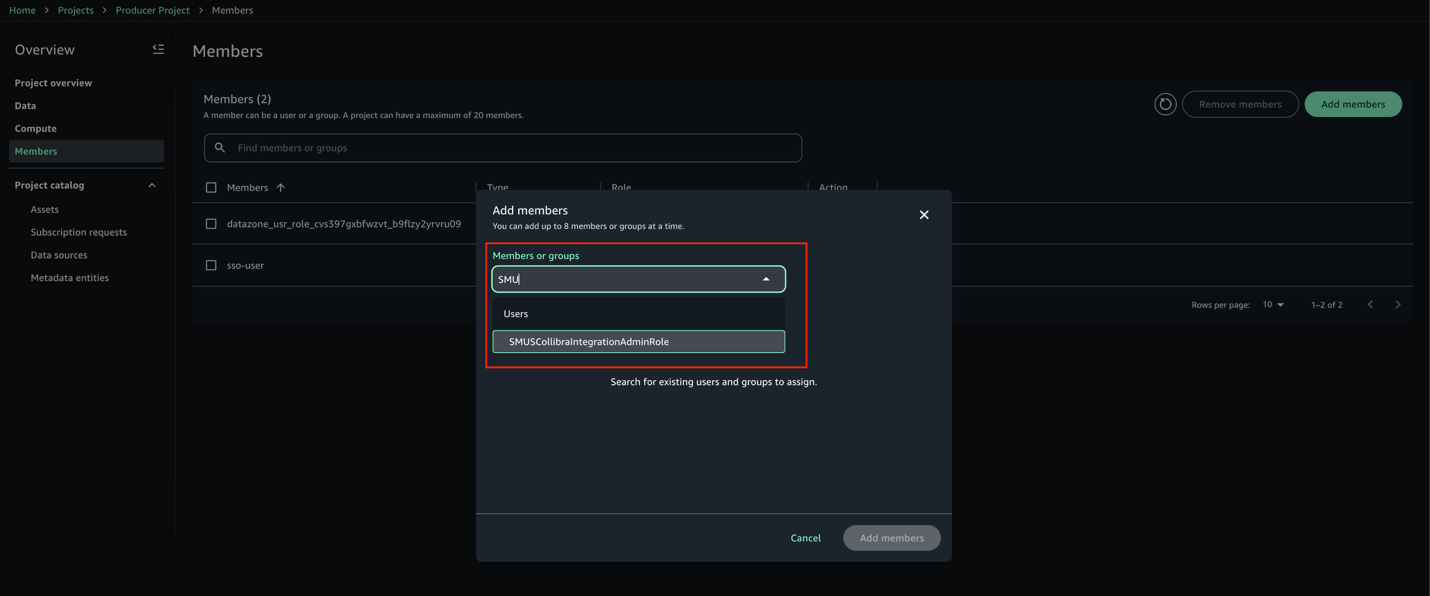
  1. Open the Unified Studio portal for this domain and navigate to the Producer Project. Go to the Members tab and choose Add members.
  2. Search for SMUSCollibraIntegrationAdminRole and select it from the results.

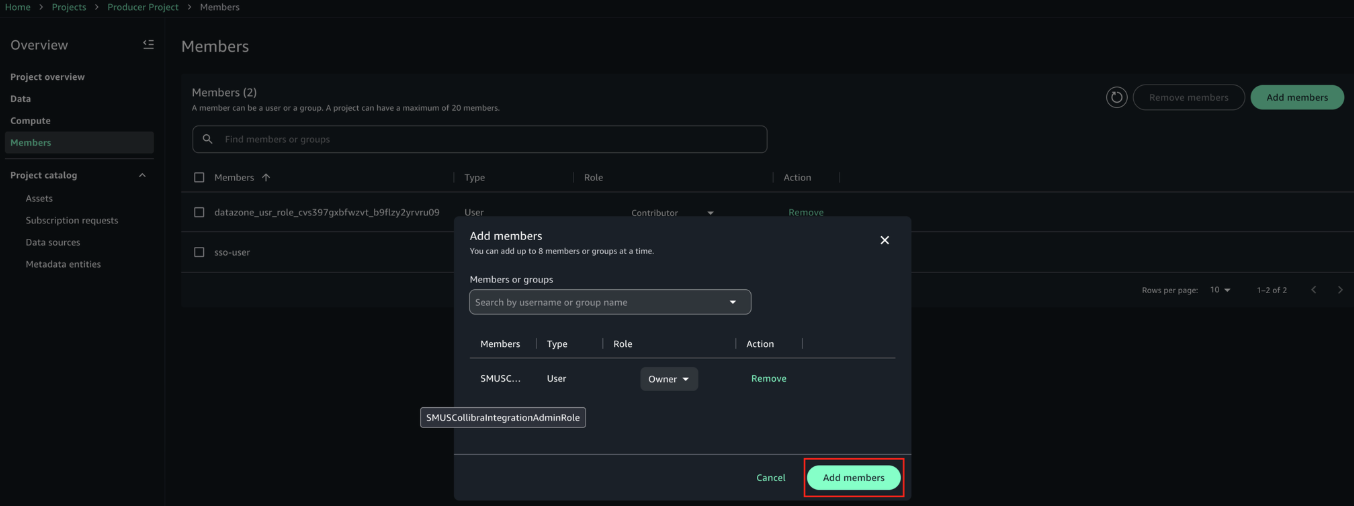
  1. Set the role to Owner, then choose Add members.

  1. Repeat the same steps for the Consumer Project. After adding the member, the configuration should look like the example in the following screenshot.

Make sure the producer project has the necessary authorization to create glossary terms in the domain unit it belongs to. For more information, refer to Domain units and authorization policies in Amazon SageMaker Unified Studio in the Amazon SageMaker Unified Studio documentation.

Synchronization of metadata

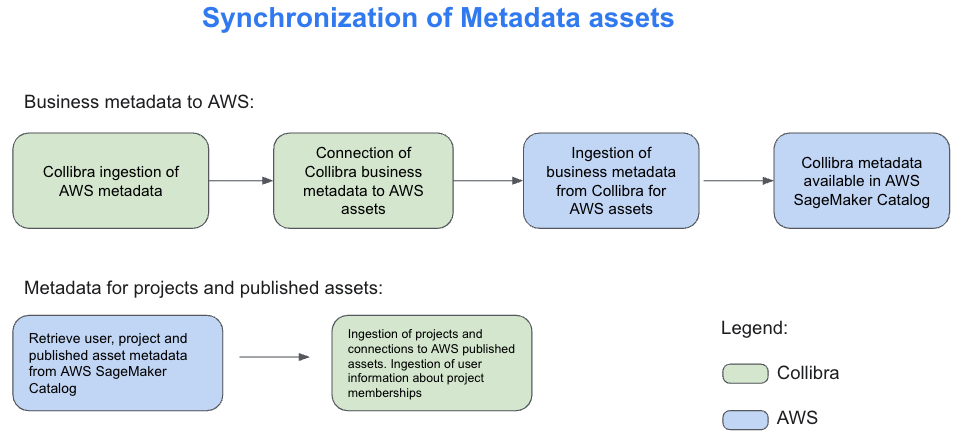
Metadata synchronization between Collibra and SageMaker Catalog happens on two distinct levels, each serving a specific purpose.The first level focuses on technical metadata. Collibra connects to services such as Amazon Redshift and AWS Glue using JDBC and other supported connection methods. Through these connections, it ingests schema details including tables, columns, and data types. This helps technical teams maintain visibility into the structure of the datasets available in SageMaker Catalog.The second level, which is the focus of this solution, handles business metadata synchronization. Using Collibra APIs, SageMaker Catalog retrieves business glossary terms, column descriptions, asset definitions, and the relationships among them. Additionally, Collibra ingests information about SageMaker projects, the assets published within them, and project membership details. This supports approval workflows and helps manage subscriptions based on project-level access. The following diagram illustrates how these two levels of metadata synchronization work together to bridge technical and business perspectives across both platforms.

For the technical metadata ingestion from AWS to Collibra, follow these steps:

  1. Within the Collibra Edge site, create a new connection for each type of AWS data store you want to ingest metadata from. For detailed instructions, refer to the About Edge and Collibra Cloud site connections in the Collibra Documentation.
    1. Depending on the type of connection, especially if it’s JDBC, you might need to add a capability such as JDBC catalog ingestion. Refer to the official documentation for more details.
    2. So the integration works correctly, name all your AWS connections in Edge with “AWS” at the start of the name. The integration script relies on this naming convention to accurately identify assets that originate from AWS.
  2. In Collibra, go to Catalog, select your connection, configure the rules for your schemas (such as which tables to include or exclude), and run the synchronization. You can also schedule the synchronization to run automatically at intervals defined in the user interface.
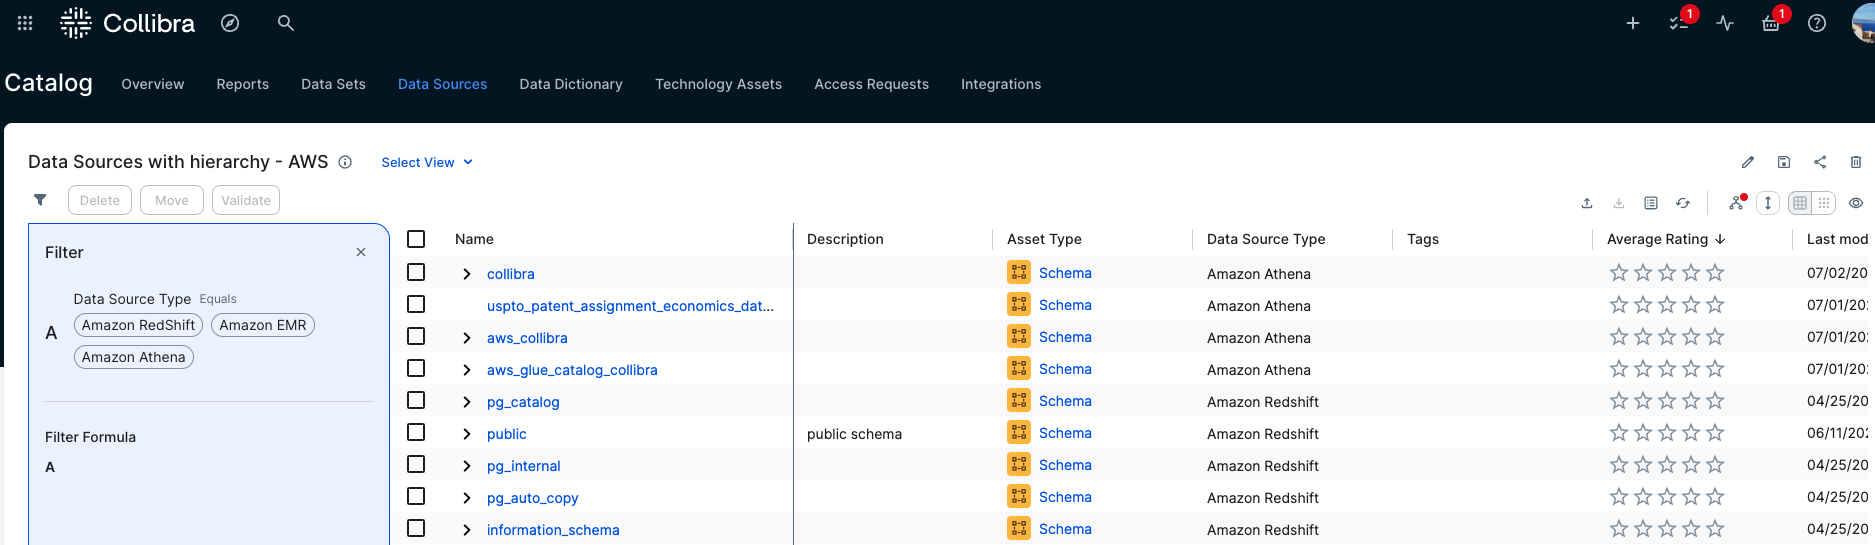
  3. When metadata ingestion is complete, go to Catalog, then Data Sources. You can optionally filter by a specific AWS source or keep the default view to view all sources. From there, you can review the schemas, tables, and other metadata imported from AWS, as shown in the following diagram.

These data assets are imported using the JDBC connections that are available from Collibra Edge. The AWS solution we present here, in addition to these data assets, will import AWS projects and will link them to the assets ingested here that are published in these projects.

Technical and business stewardship in Collibra

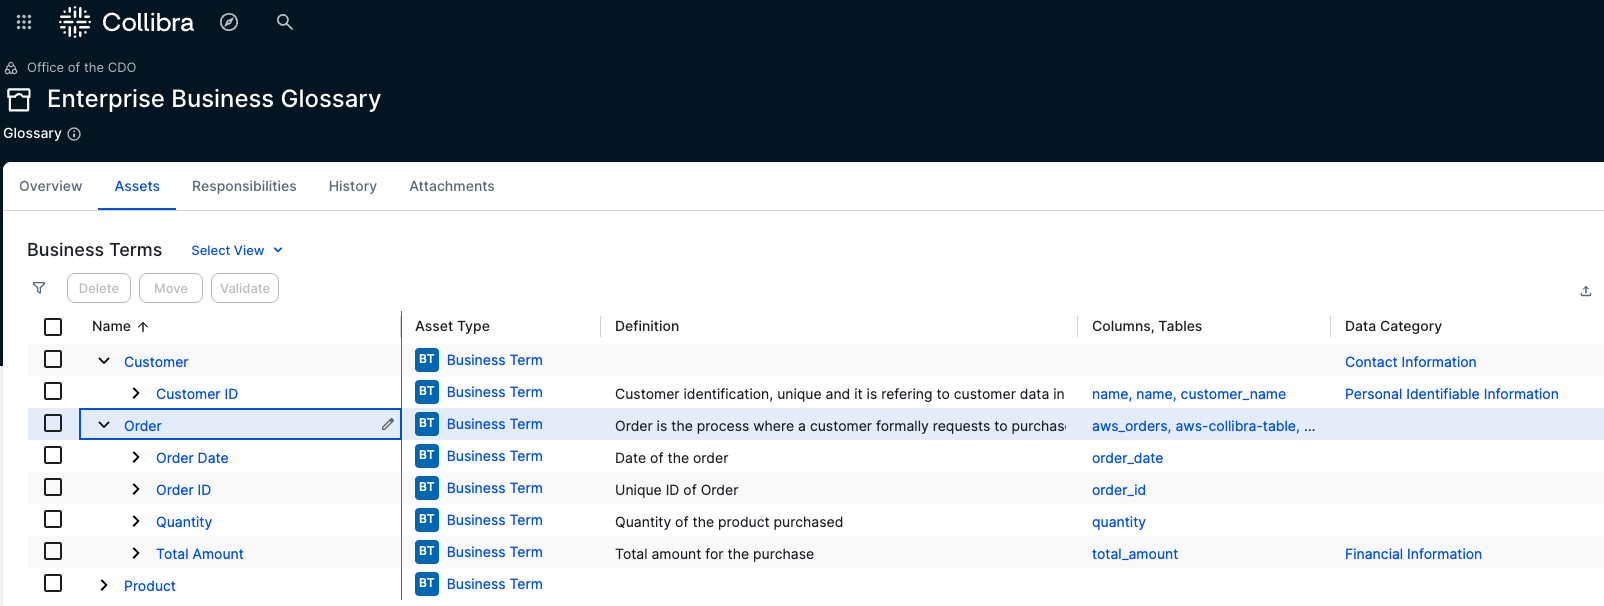
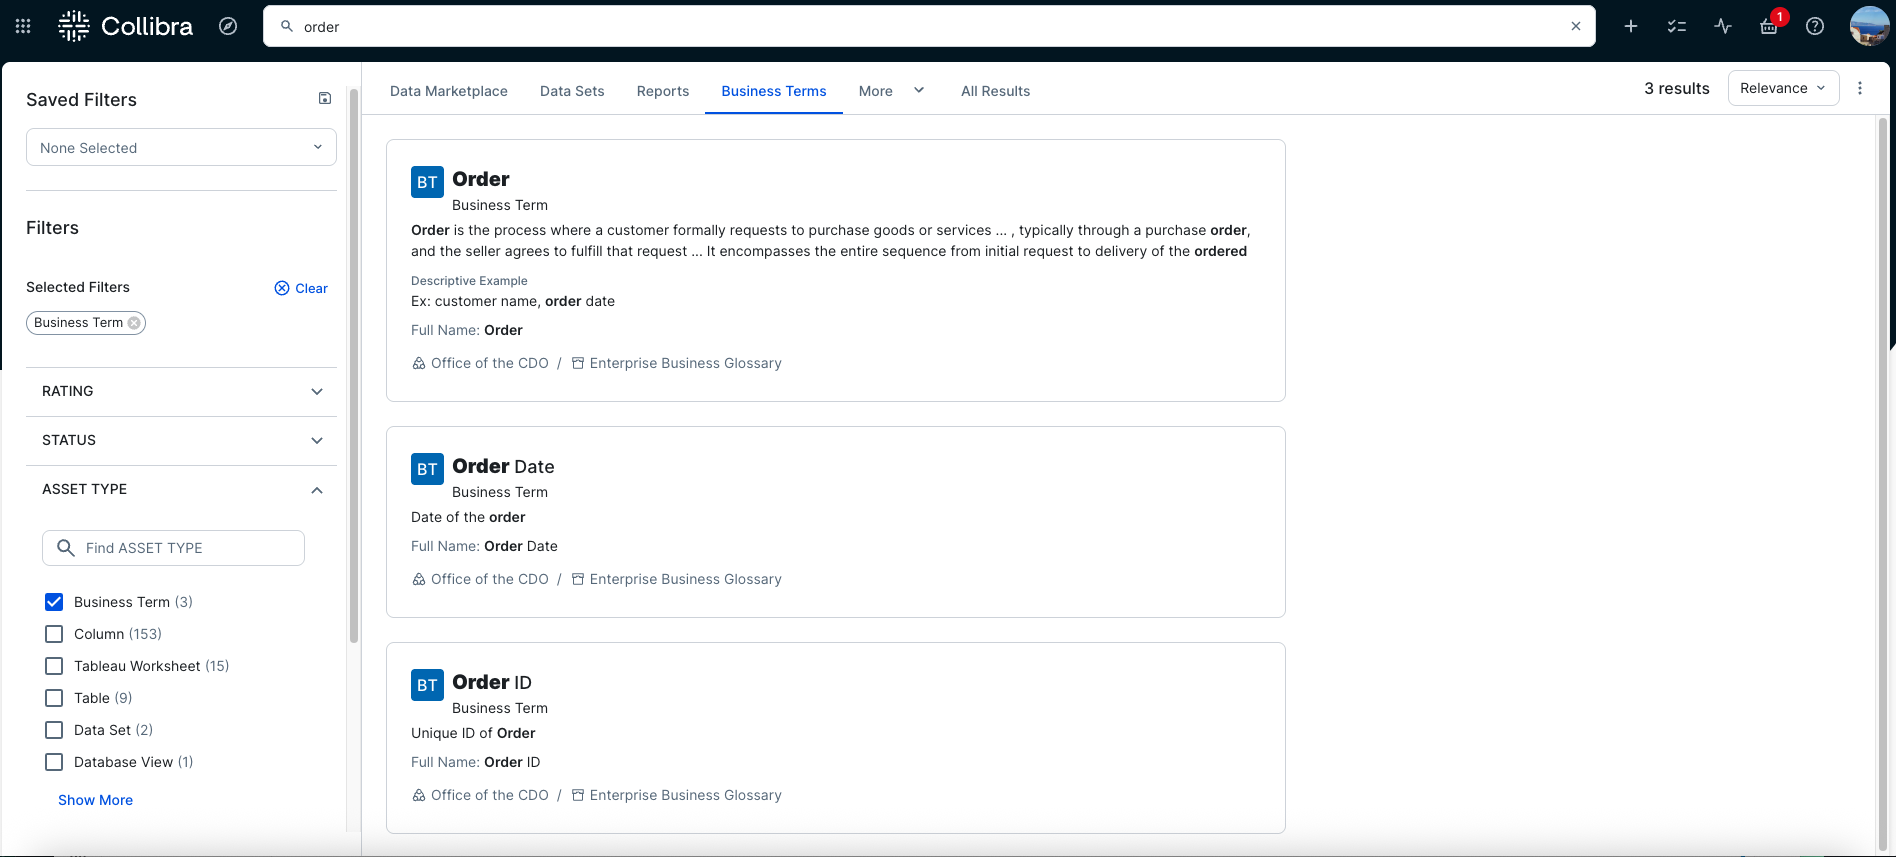
Collibra provides business glossaries to define business context. These glossaries can also include a hierarchy or taxonomy of business terms based on their interdependence. The following is an example of a glossary used for this post.

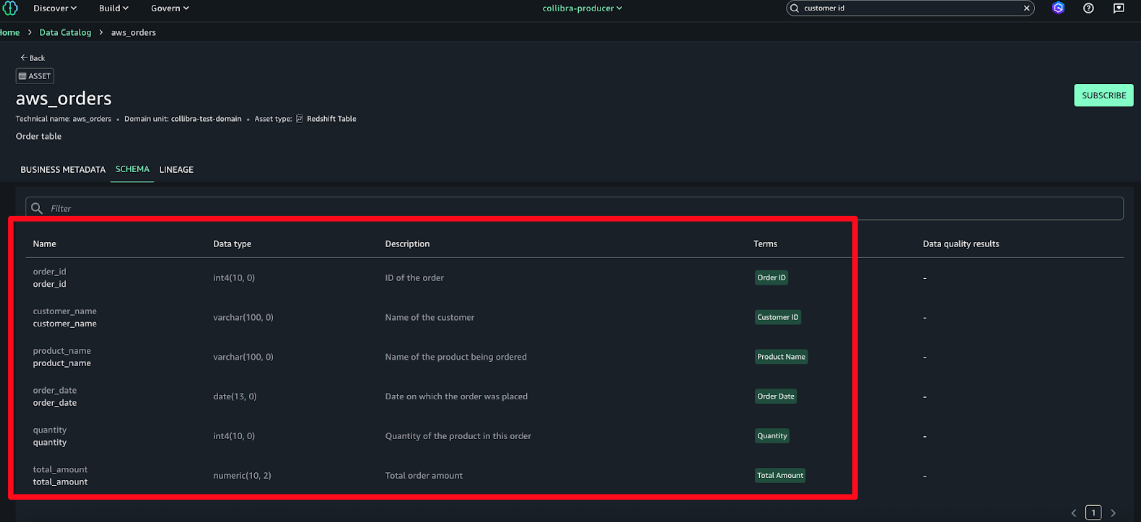
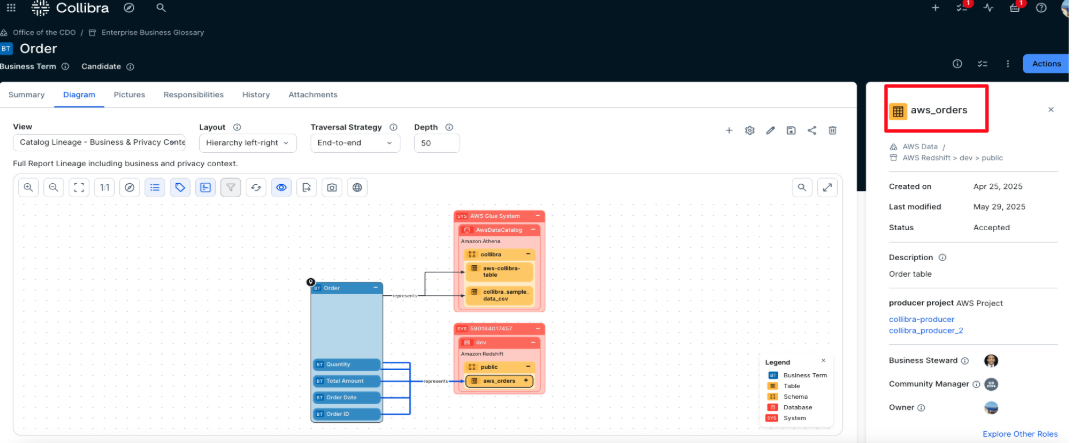
An Order includes components such as Order Date, Order ID, and others. In Collibra, Business and Technical Stewards are responsible for linking Business Terms to the columns and tables ingested from AWS, as shown in the following diagram. For detailed guidance on how to perform stewardship activities, refer to the official Collibra documentation.

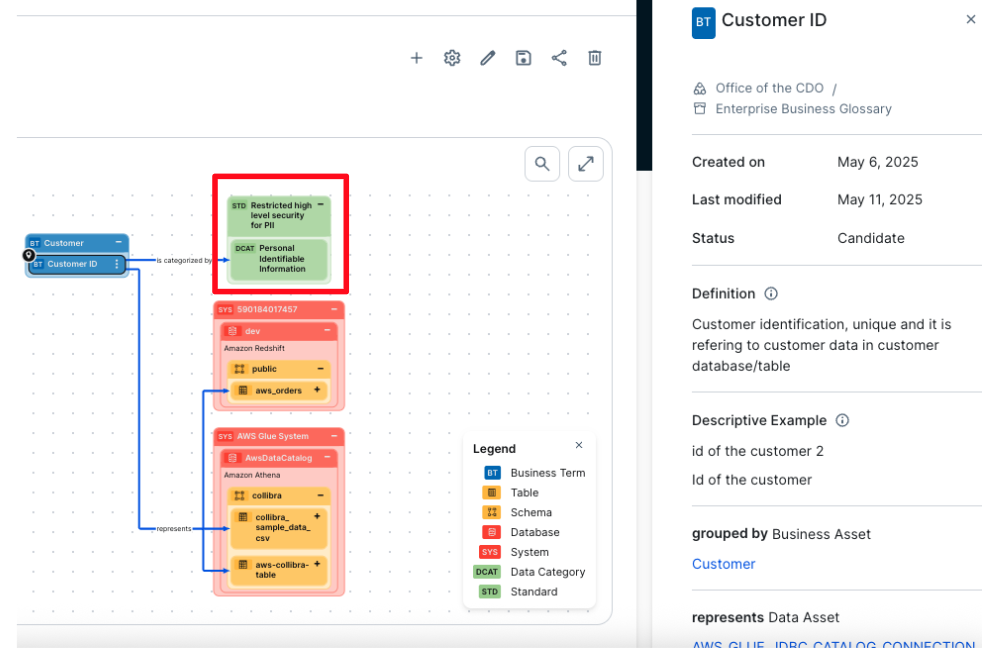
The entire business glossary with its one-level hierarchy is imported into AWS SageMaker Unified Studio automatically with this solution. Some business terms are also linked to data categories that are associated with data privacy, regulatory policies, and standards. In the example in the following screenshot, customer ID is connected to a data category. This connection between business terms and data categories links the associated data to relevant policies and standards. As a result, a table or column connected to a business term that is linked to a data category will also inherit the associated policy or standard.

The business term customer ID is linked to the data category personally identifiable information (PII). With this relation, all columns or tables that are linked to this business term automatically inherit the PII data category, and therefore the policies linked and associated with it.

The metadata is imported into AWS SageMaker Unified Studio at the asset and schema levels.

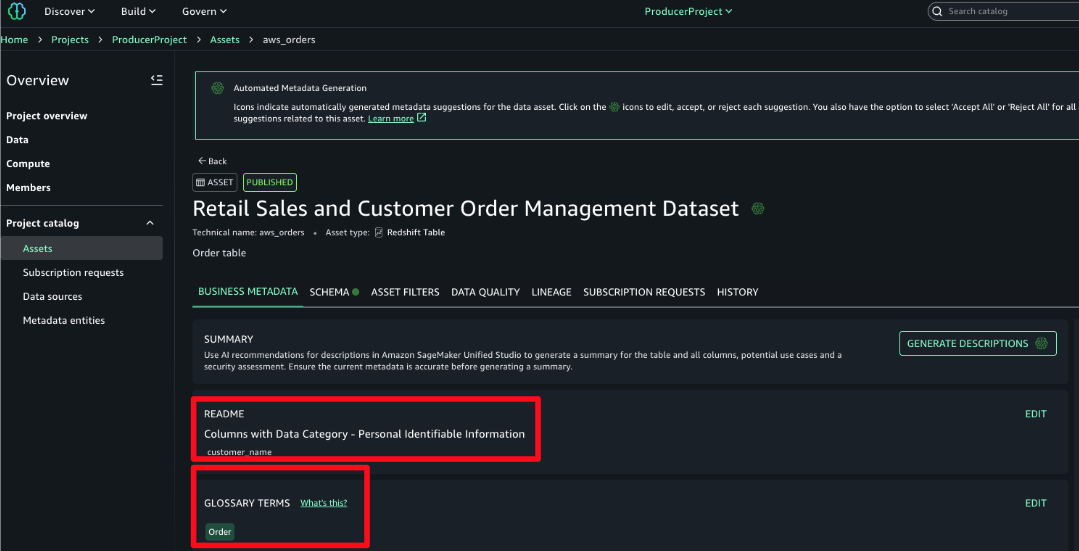
All the business metadata described previously is synchronized with AWS using this solution. Descriptions, data categories, tags, business terms are all imported into AWS and linked to respective assets. In the README, the data category is associated with one of the columns and the business term associated with a table or dataset.From Collibra we import into AWS the following:

  • Business terms and their hierarchies and descriptions
  • The link of the business terms to the technical assets
  • Data category of business terms inherited in the technical assets imported in the README section of the technical asset
  • Tags and descriptions of technical data assets

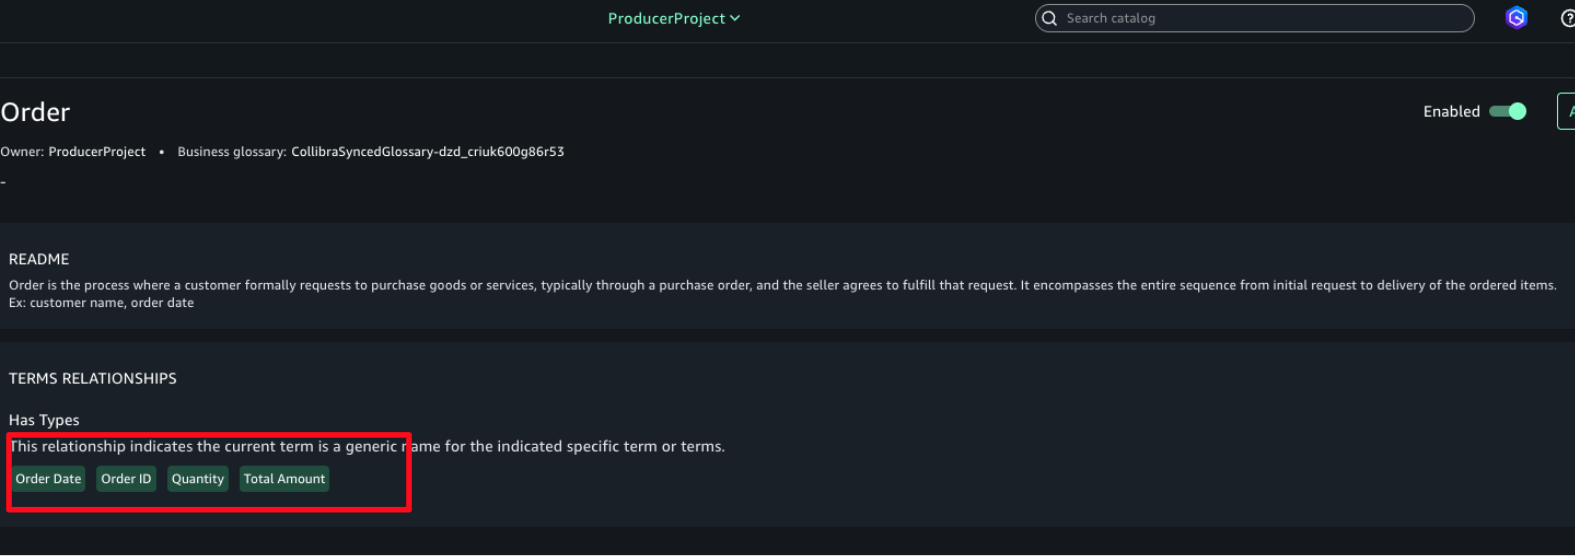
Not only is the business term imported into AWS SageMaker Unified Studio, its taxonomy is imported exactly as it is in Collibra. The following screenshot shows an example where order is imported to have under it the business terms order ID, quantity, and so on.

Subscription to published assets

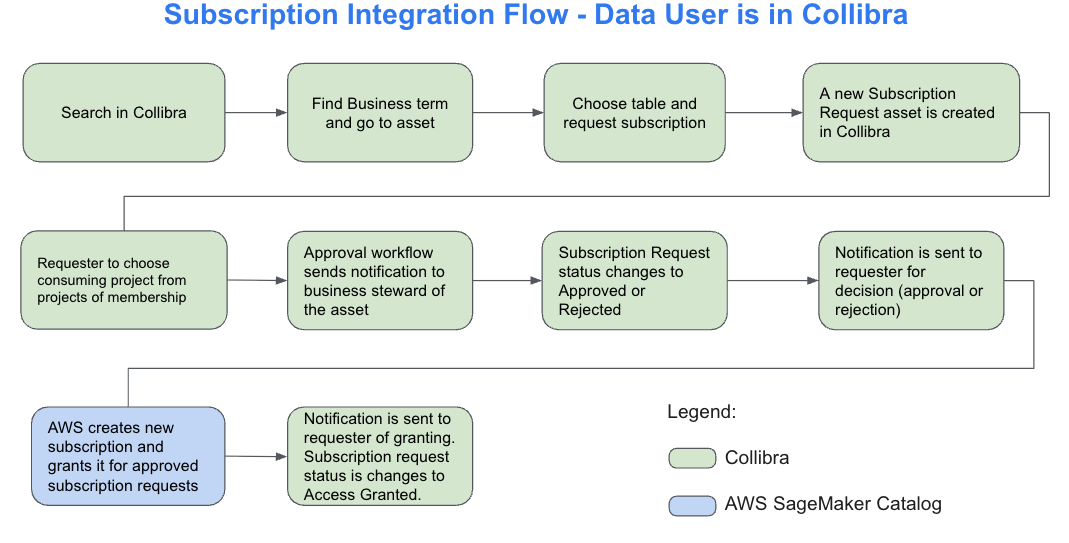
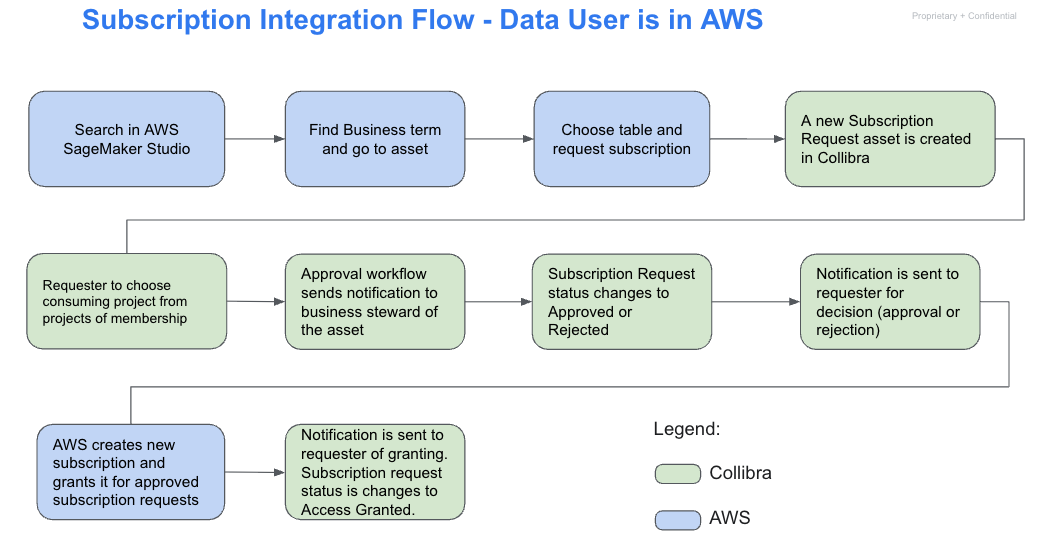
For the subscription process, the same workflows and series of tasks occur whether the request is initiated from AWS or from Collibra. An overview of these tasks and the end-to-end flow from both platforms is shown in the following diagrams:

This diagram outlines the subscription request flow when initiated from Collibra. A user searches for a business term, locates the related asset, and submits a subscription request. The system creates a corresponding request asset in Collibra. The user then selects the destination project for the data. An approval workflow is triggered, notifying the designated business steward. If the request is approved, SageMaker Catalog automatically provisions access and updates the request status to Access Granted. The user receives a final notification confirming access. This process provides controlled, transparent data sharing across platforms.

The following diagram illustrates the end-to-end subscription flow when the data user initiates the process from within SageMaker Studio. The user begins by searching for data using a business term and selecting the relevant asset. After choosing the appropriate table, they request access, which triggers the creation of a subscription request asset in Collibra. The user then selects a destination project based on their memberships. Collibra sends an approval request to the designated business steward, who reviews and either approves or rejects it. If approved, SageMaker Catalog automatically provisions the subscription and notifies the requester. The subscription request status is then updated to Access Granted, completing the workflow.

For this post, the process is described starting from Collibra, although it functions the same way if initiated from AWS. In this example, a data consumer is searching for data related to AWS orders using the Collibra interface.

In Amazon SageMaker Unified Studio, the data consumer is a member of the Orders and Products project. At this stage, the user has no active subscriptions or access to data assets. The following screenshot is included to illustrate the state before the integration takes effect.

  1. In Collibra, navigate to the Search area and enter a business-friendly term describing what the user is looking for. In this example, enter order.

  1. In the Data Marketplace, filters such as Business Terms can be applied to narrow the results by asset type, as shown in the following screenshot. This approach helps users focus on relevant assets by starting from clear business context, which is especially useful when dealing with many similarly named tables or columns.

  1. In the example shown in the following screenshot, the business term Order is selected, and the Diagram view is opened to display its full logical lineage. The diagram shows that the term is linked to the aws_orders table. Selecting the table in the diagram reveals its metadata details, which appear on the right side of the page. From there, users can navigate directly to the table.

  1. In the aws_orders table asset, access can be requested by initiating an AWS subscription request. From the asset view, selecting Actions reveals the list of available workflows. In this example, the Creation of a new subscription workflow is selected to start the approval process.

  1. The user must select the AWS project to use as the consuming project for the subscription. A list of all projects the user is a member of is displayed to facilitate the selection. After choosing the appropriate project, choose Send to submit the request.

  1. After it’s submitted, the workflow is triggered, and a task is assigned to the business steward of the asset for which the subscription is requested. A new subscription request is also created in the AWS Subscription Requests domain with a status of Pending, and it’s automatically linked to the requested asset.

The new subscription request is also reflected in the lineage of the data asset, as shown in the following screenshot.

  1. The business steward assigned to the asset receives an approval notification.
    1. Choose Tasks button in the top right corner.
    2. Locate the most recent task titled Accept or Reject, which is associated with the aws_orders asset.

  1. The business steward opens the task and chooses either Approve or Reject, depending on the request. In this example, Approve is selected. The task is then marked as complete.

  1. After the business steward approves the subscription request, the corresponding Subscription Request asset is automatically updated to the status Approved.

  1. The requester is notified that the subscription request has been approved. To acknowledge, the requester choose Tasks, locates the approval notification, and chooses Done to confirm receipt, as shown in the following screenshot.

  1. After a subscription request is approved, the integration solution automatically process the request by creating and granting the corresponding subscription in AWS using the asset’s metadata. The user can then confirm the new subscription is reflected in Amazon SageMaker, as shown in the following screenshot.

  1. After the subscription is granted, the status of the Subscription Request is updated to Access Granted.

  1. The requester now receives a new task, which is a notification confirming that the subscription request has been granted. Choose the Send button to acknowledge and complete the task.

  1. In the AWS Subscription Requests domain, all requests and their status are visible. In addition to Approved and Access Granted statuses, Rejected requests are also listed. If a request is rejected by the approver, its status changes to Rejected and no subscription is created in AWS.

Synchronization Interval

The solution keeps Collibra and Amazon SageMaker Catalog in sync through regular updates. Core elements including business metadata of Collibra, user profiles, project information & published assets of Amazon SageMaker Catalog, and subscription requests originating in Collibra are synchronized every 5 minutes. However, when subscription requests are created in Amazon SageMaker Catalog, they are instantly synchronized to Collibra.

Cleanup

To avoid incurring unnecessary costs after testing or exploring the solution, delete the provisioned resources. Follow these steps:

  1. Remove the CloudFormation stack – Go to the AWS CloudFormation console, select the stack you created for this solution, and choose Delete. This will automatically remove the associated AWS resources provisioned by the stack.
  2. Clean up Collibra configurations – In the Collibra environment, remove test domains, projects, or workflows created for this solution to ensure a clean slate for future experiments.
  3. Revoke access tokens or credentials – If you used API credentials or access tokens for integration, ensure they’re revoked or deleted if no longer needed.

Performing these steps ensures your environments stay clean and you avoid unintended resource usage.

Conclusion

The solution connecting Amazon SageMaker Catalog and Collibra gives organizations a simple way to unify metadata and streamline access workflows. It helps reduce duplication, improve governance, and build trust in data for both analytics and AI.We demonstrated how to synchronize metadata and manage access requests using APIs, enabling a shared view of data across teams.Learn more by exploring:

We welcome your feedback as you explore what’s possible with this solution.


About the authors

Vasiliki Nikolopoulou is a Principal Integrations Architect at Collibra, where she is working for the past 11 years. Her extensive career includes roles such as Director, Enterprise Architect at AXA Insurance US, Principal Sales Engineer at Oracle, and Certified Senior IT Professional in technical sales at IBM for over 15 years. She holds numerous technical certifications. Connect with her on LinkedIn.

Divij Bhatia is a Software Development Engineer at AWS. He is passionate about building resilient and scalable cloud-native solutions that solve real-world problems for customers. His free time often takes him outdoors, traveling and shooting landscapes. Connect with him on LinkedIn.

Leonardo Gomez is a Principal Analytics Specialist Solutions Architect at AWS. He has over a decade of experience in data management, helping customers around the globe address their business and technical needs. Connect with him on LinkedIn.
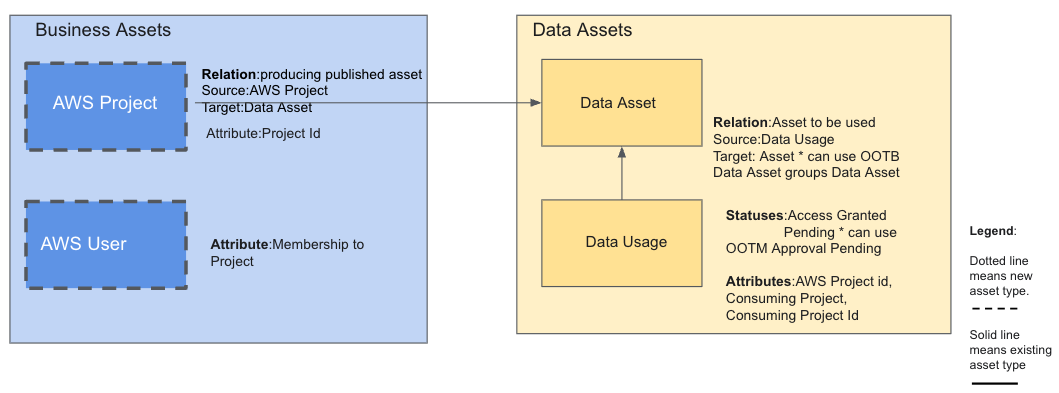
Develop and monitor a Spark application using existing data in Amazon S3 with Amazon SageMaker Unified Studio

Post Syndicated from Amit Maindola original https://aws.amazon.com/blogs/big-data/develop-and-monitor-a-spark-application-using-existing-data-in-amazon-s3-with-amazon-sagemaker-unified-studio/

Organizations face significant challenges managing their big data analytics workloads. Data teams struggle with fragmented development environments, complex resource management, inconsistent monitoring, and cumbersome manual scheduling processes. These issues lead to lengthy development cycles, inefficient resource utilization, reactive troubleshooting, and difficult-to-maintain data pipelines.These challenges are especially critical for enterprises processing terabytes of data daily for business intelligence (BI), reporting, and machine learning (ML). Such organizations need unified solutions that streamline their entire analytics workflow.

The next generation of Amazon SageMaker with Amazon EMR in Amazon SageMaker Unified Studio addresses these pain points through an integrated development environment (IDE) where data workers can develop, test, and refine Spark applications in one consistent environment. Amazon EMR Serverless alleviates cluster management overhead by dynamically allocating resources based on workload requirements, and built-in monitoring tools help teams quickly identify performance bottlenecks. Integration with Apache Airflow through Amazon Managed Workflows for Apache Airflow (Amazon MWAA) provides robust scheduling capabilities, and the pay-only-for-resources-used model delivers significant cost savings.

In this post, we demonstrate how to develop and monitor a Spark application using existing data in Amazon Simple Storage Service (Amazon S3) using SageMaker Unified Studio.

Solution overview

This solution uses SageMaker Unified Studio to execute and oversee a Spark application, highlighting its integrated capabilities. We cover the following key steps:

  1. Create an EMR Serverless compute environment for interactive applications using SageMaker Unified Studio.
  2. Create and configure a Spark application.
  3. Use TPC-DS data to build and run the Spark application using a Jupyter notebook in SageMaker Unified Studio.
  4. Monitor application performance and schedule recurring runs with Amazon MWAA integrated.
  5. Analyze results in SageMaker Unified Studio to optimize workflows.

Prerequisites

For this walkthrough, you must have the following prerequisites:

Add EMR Serverless as compute

Complete the following steps to create an EMR Serverless compute environment to build your Spark application:

  1. In SageMaker Unified Studio, open the project you created as a prerequisite and choose Compute.
  2. Choose Data processing, then choose Add compute.
  3. Choose Create new compute resources, then choose Next.

  1. Choose EMR Serverless, then choose Next.

  1. For Compute name, enter a name.
  2. For Release label, choose emr-7.5.0.
  3. For Permission mode, choose Compatibility.
  4. Choose Add compute.

It takes a few minutes to spin up the EMR Serverless application. After it’s created, you can view the compute in SageMaker Unified Studio.

The preceding steps demonstrate how you can set up an Amazon EMR Serverless application in SageMaker Unified Studio to run interactive PySpark workloads. In subsequent steps, we build and monitor Spark applications in an interactive JupyterLab workspace.

Develop, monitor, and debug a Spark application in a Jupyter notebook within SageMaker Unified Studio

In this section, we build a Spark application using the TPC-DS dataset within SageMaker Unified Studio. With Amazon SageMaker Data Processing, you can focus on transforming and analyzing your data without managing compute capacity or open source applications, saving you time and reducing costs. SageMaker Data Processing provides a unified developer experience from Amazon EMR, AWS Glue, Amazon Redshift, Amazon Athena, and Amazon MWAA in a single notebook and query interface. You can automatically provision your capacity on Amazon EMR on Amazon Elastic Compute Cloud (Amazon EC2) or EMR Serverless. Scaling rules manage changes to your compute demand to optimize performance and runtimes. Integration with Amazon MWAA simplifies workflow orchestration by alleviating infrastructure management needs. For this post, we use EMR Serverless to read and query the TPC-DS dataset within a notebook and run it using Amazon MWAA.

Complete the following steps:

  1. Upon completion of the previous steps and prerequisites, navigate to SageMaker Studio and open your project.
  2. Choose Build and then JupyterLab.

The notebook takes about 30 seconds to initialize and connect to the space.

  1. Under Notebook, choose Python 3 (ipykernel).
  2. In the first cell, next to Local Python, choose the dropdown menu and choose PySpark.
  3. Choose the dropdown menu next to Project.Spark and choose EMR-S Compute.
  4. Run the following code to develop your Spark application. This example reads a 3 TB TPC-DS dataset in Parquet format from a publicly accessible S3 bucket:
spark.read.parquet("s3://blogpost-sparkoneks-us-east-1/blog/BLOG_TPCDS-TEST-3T-partitioned/store/").createOrReplaceTempView("store")

After the Spark session starts and execution logs start to populate, you can explore the Spark UI and driver logs to further debug and troubleshoot Spark progra The following screenshot shows an example of the Spark UI. The following screenshot shows an example of the driver logs. The following screenshot shows the Executors tab, which provides access to the driver and executor logs.

  1. Use the following code to read some more TPC-DS datasets. You can create temporary views and use the Spark UI to see the files being read. Refer to the appendix at the end of this for details on using the TPC-DS dataset within your buckets.
spark.read.parquet("s3://blogpost-sparkoneks-us-east-1/blog/BLOG_TPCDS-TEST-3T-partitioned/item/").createOrReplaceTempView("item")
spark.read.parquet("s3://blogpost-sparkoneks-us-east-1/blog/BLOG_TPCDS-TEST-3T-partitioned/store_sales/").createOrReplaceTempView("store_sales")
spark.read.parquet("s3://blogpost-sparkoneks-us-east-1/blog/BLOG_TPCDS-TEST-3T-partitioned/date_dim/").createOrReplaceTempView("date_dim")
spark.read.parquet("s3://blogpost-sparkoneks-us-east-1/blog/BLOG_TPCDS-TEST-3T-partitioned/customer/").createOrReplaceTempView("customer")
spark.read.parquet("s3://blogpost-sparkoneks-us-east-1/blog/BLOG_TPCDS-TEST-3T-partitioned/catalog_sales/").createOrReplaceTempView("catalog_sales")
spark.read.parquet("s3://blogpost-sparkoneks-us-east-1/blog/BLOG_TPCDS-TEST-3T-partitioned/web_sales/").createOrReplaceTempView("web_sales")

In each cell of your notebook, you can expand Spark Job Progress to view the stages of the job submitted to EMR Serverless for a specific cell. You can see the time taken to complete each stage. In addition, if a failure occurs, you can examine the logs, making troubleshooting a seamless experience.

Because the files are partitioned based on date key column, you can observe that Spark runs parallel tasks for reads.

  1. Next, get the count across the date time keys on data that is partitioned based on the time key using the following code:
select count(1), ss_sold_date_sk from store_sales group by ss_sold_date_sk order by ss_sold_date_sk

Monitor jobs in the Spark UI

On the Jobs tab of the Spark UI, you can see a list of complete or actively running jobs, with the following details:

  • The action that triggered the job
  • The time it took (for this example, 41 seconds, but timing will vary)
  • The number of stages (2) and tasks (3,428); these are for reference and specific to this specific example

You can choose the job to view more details, particularly around the stages. Our job has two stages; a new stage is created whenever there is a shuffle. We have one stage for the initial reading of each dataset, and one for the aggregation. In the following example, we run some TPC-DS SQL statements that are used for performance and benchmarks:

 with frequent_ss_items as
 (select substr(i_item_desc,1,30) itemdesc,i_item_sk item_sk,d_date solddate,count(*) cnt
  from store_sales, date_dim, item
  where ss_sold_date_sk = d_date_sk
    and ss_item_sk = i_item_sk
    and d_year in (2000, 2000+1, 2000+2,2000+3)
  group by substr(i_item_desc,1,30),i_item_sk,d_date
  having count(*) >4),
 max_store_sales as
 (select max(csales) tpcds_cmax
  from (select c_customer_sk,sum(ss_quantity*ss_sales_price) csales
        from store_sales, customer, date_dim
        where ss_customer_sk = c_customer_sk
         and ss_sold_date_sk = d_date_sk
         and d_year in (2000, 2000+1, 2000+2,2000+3)
        group by c_customer_sk) x),
 best_ss_customer as
 (select c_customer_sk,sum(ss_quantity*ss_sales_price) ssales
  from store_sales, customer
  where ss_customer_sk = c_customer_sk
  group by c_customer_sk
  having sum(ss_quantity*ss_sales_price) > (95/100.0) *
    (select * from max_store_sales))
 select sum(sales)
 from (select cs_quantity*cs_list_price sales
       from catalog_sales, date_dim
       where d_year = 2000
         and d_moy = 2
         and cs_sold_date_sk = d_date_sk
         and cs_item_sk in (select item_sk from frequent_ss_items)
         and cs_bill_customer_sk in (select c_customer_sk from best_ss_customer)
      union all
      (select ws_quantity*ws_list_price sales
       from web_sales, date_dim
       where d_year = 2000
         and d_moy = 2
         and ws_sold_date_sk = d_date_sk
         and ws_item_sk in (select item_sk from frequent_ss_items)
         and ws_bill_customer_sk in (select c_customer_sk from best_ss_customer))) x

You can monitor your Spark job in SageMaker Unified Studio using two methods. Jupyter notebooks provide basic monitoring, showing real-time job status and execution progress. For more detailed analysis, use the Spark UI. You can examine specific stages, tasks, and execution plans. The Spark UI is particularly useful for troubleshooting performance issues and optimizing queries. You can track estimated stages, running tasks, and task timing details. This comprehensive view helps you understand resource utilization and track job progress in depth.

In this section, we explained how you can EMR Serverless compute in SageMaker Unified Studio to build an interactive Spark application. Through the Spark UI, the interactive application provides fine-grained task-level status, I/O, and shuffle details, as well as links to corresponding logs of the task for this stage directly from your notebook, enabling a seamless troubleshooting experience.

Clean up

To avoid ongoing charges in your AWS account, delete the resources you created during this tutorial:

  1. Delete the connection.
  2. Delete the EMR job.
  3. Delete the EMR output S3 buckets.
  4. Delete the Amazon MWAA resources, such as workflows and environments.

Conclusion

In this post, we demonstrated how the next generation of SageMaker, combined with EMR Serverless, provides a powerful solution for developing, monitoring, and scheduling Spark applications using data in Amazon S3. The integrated experience significantly reduces complexity by offering a unified development environment, automatic resource management, and comprehensive monitoring capabilities through Spark UI, while maintaining cost-efficiency through a pay-as-you-go model. For businesses, this means faster time-to-insight, improved team collaboration, and reduced operational overhead, so data teams can focus on analytics rather than infrastructure management.

To get started, explore the Amazon SageMaker Unified Studio User Guide, set up a project in your AWS environment, and discover how this solution can transform your organization’s data analytics capabilities.

Appendix

In the following sections, we discuss how to run a workload on a schedule and provide details about the TPC-DS dataset for building the Spark application using EMR Serverless.

Run a workload on a schedule

In this section, we deploy a JupyterLab notebook and create a workflow using Amazon MWAA. You can use workflows to orchestrate notebooks, querybooks, and more in your project repositories. With workflows, you can define a collection of tasks organized as a directed acyclic graph (DAG) that can run on a user-defined schedule.Complete the following steps:

  1. In SageMaker Unified Studio, choose Build, and under Orchestration, choose Workflows.

  1. Choose Create Workflow in Editor.

You will be redirected to the JupyterLab notebook with a new DAG called untitled.py created under the /src/workflows/dag folder.

  1. We rename this notebook to tpcds_data_queries.py.
  2. You can reuse the existing template with the following updates:
    1. Update line 17 with the schedule you want your code to run.
    2. Update line 26 with your NOTEBOOK_PATH. This should be in src/<notebook_name>.ipynb. Note the name of the automatically generated dag_id; you can name it based on your requirements.

  1. Choose File and Save notebook.

To test, you can trigger a manual run of your workload.

  1. In SageMaker Unified Studio, choose Build, and under Orchestration, choose Workflows.
  2. Choose your workflow, then choose Run.

You can monitor the success of your job on the Runs tab.

To debug your notebook job by accessing the Spark UI within your Airflow job console, you must use EMR Serverless Airflow Operators to submit your job. The link is available on the Details tab of your query.

This option has the following key limitations: it’s not available for Amazon EMR on EC2, and SageMaker notebook job operators don’t work.

You can configure the operator to generate one-time links to the application UIs and Spark stdout logs by passing enable_application_ui_links=True as a parameter. After the job starts running, these links are available on the Details tab of the relevant task. If enable_application_ui_links=False, then the links will be present but grayed out.

Make sure you have the emr-serverless:GetDashboardForJobRun AWS Identity and Access Management (IAM) permissions to generate the dashboard link.

Open the Airflow UI for your job. The Spark UI and history server dashboard options are visible on the Details tab, as shown in the following screenshot.

The following screenshot shows the Jobs tab of the Spark UI.

Use the TPC-DS dataset to build the Spark application using EMR Serverless

To use the TPC-DS dataset to run the Spark application against a dataset in an S3 bucket, you need to copy the TPC-DS dataset into your S3 bucket:

  1. Create a new S3 bucket in your test account if needed. In the following code, replace $YOUR_S3_BUCKET with your S3 bucket name. We suggest you export YOUR_S3_BUCKET as an environment variable:
<Your bucket name>
  1. Copy the TPC-DS source data as input to your S3 bucket. If it’s not exported as an environment variable, replace $YOUR_S3_BUCKET with your S3 bucket name:
aws s3 sync s3://blogpost-sparkoneks-us-east-1/blog/BLOG_TPCDS-TEST-3T-partitioned/ s3://$YOUR_S3_BUCKET/blog/BLOG_TPCDS-TEST-3T-partitioned/

About the Authors

Amit Maindola is a Senior Data Architect focused on data engineering, analytics, and AI/ML at Amazon Web Services. He helps customers in their digital transformation journey and enables them to build highly scalable, robust, and secure cloud-based analytical solutions on AWS to gain timely insights and make critical business decisions.

Abhilash is a senior specialist solutions architect at Amazon Web Services (AWS), helping public sector customers on their cloud journey with a focus on AWS Data and AI services. Outside of work, Abhilash enjoys learning new technologies, watching movies, and visiting new places.

Embracing event driven architecture to enhance resilience of data solutions built on Amazon SageMaker

Post Syndicated from Dhrubajyoti Mukherjee original https://aws.amazon.com/blogs/big-data/embracing-event-driven-architecture-to-enhance-resilience-of-data-solutions-built-on-amazon-sagemaker/

Amazon Web Services (AWS) customers value business continuity while building modern data governance solutions. A resilient data solution helps maximize business continuity by minimizing solution downtime and making sure that critical information remains accessible to users. This post provides guidance on how you can use event driven architecture to enhance the resiliency of data solutions built on the next generation of Amazon SageMaker, a unified platform for data, analytics, and AI. SageMaker is a managed service with high availability and durability. If customers want to build a backup and recovery system on their end, we show you how to do this in this blog. It provides three design principles to improve the data solution resiliency of your organization. In addition, it contains guidance to formulate a robust disaster recovery strategy based on event driven architecture. It contains code samples to back up the system metadata of your data solution built on SageMaker, enabling disaster recovery.
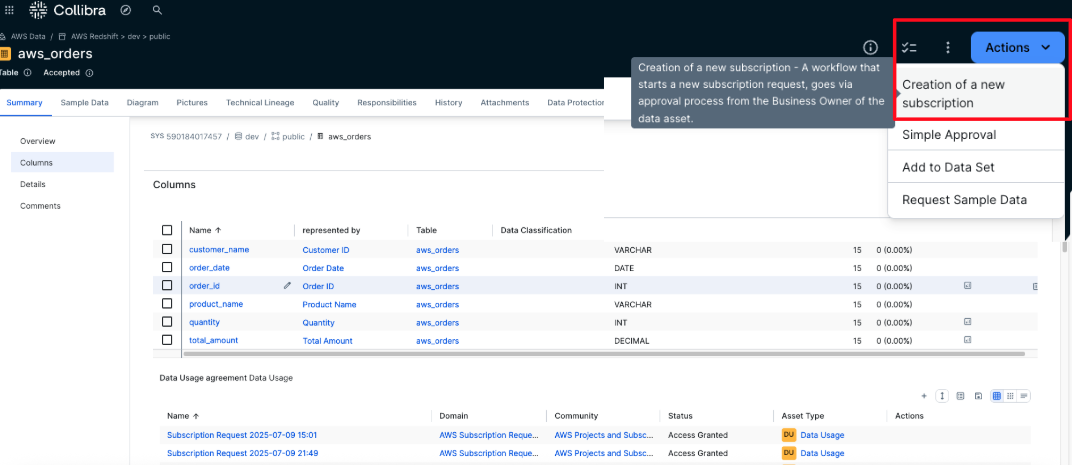
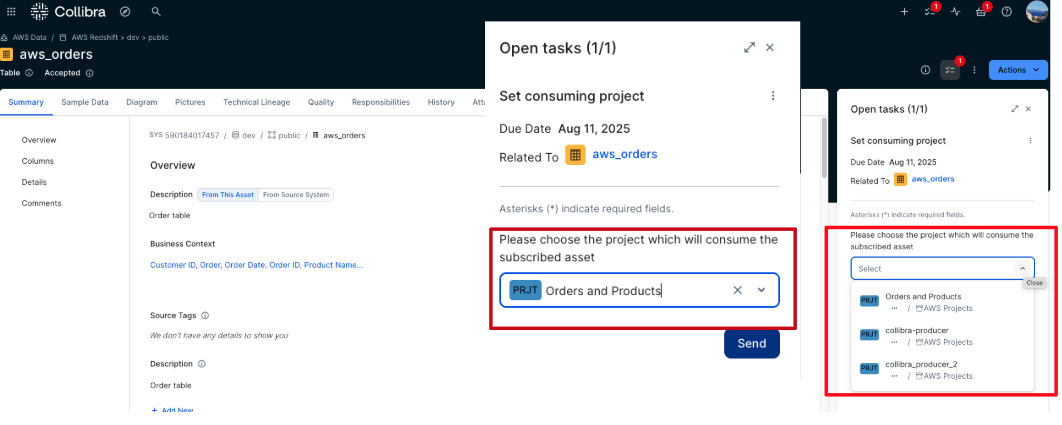
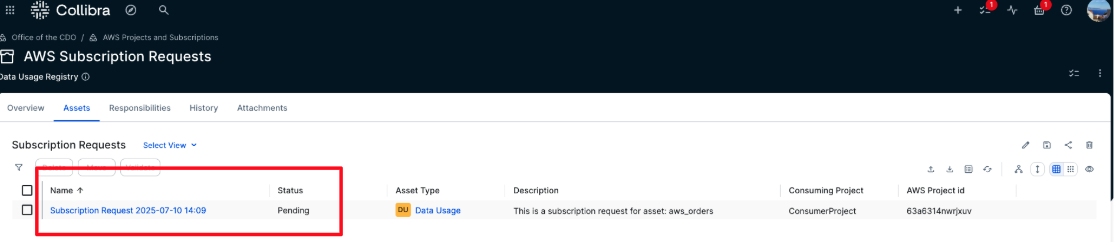
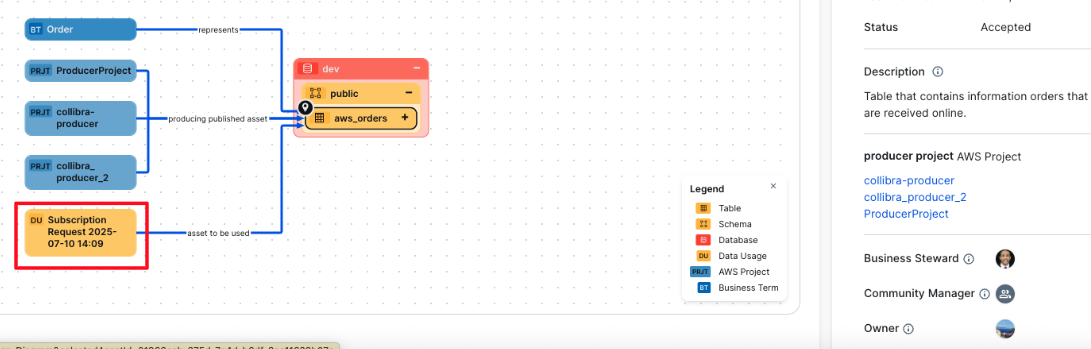
The AWS Well-Architected Framework defines resilience as the ability of a system to recover from infrastructure or service disruptions. You can enhance the resiliency of your data solution by adopting three design principles that are highlighted in this post and by establishing a robust disaster recovery strategy. Recovery point objective (RPO) and recovery time objective (RTO) are industry standard metrics to measure the resilience of a system. RPO indicates how much data loss your organization can accept in case of solution failure. RTO refers to the time for the solution to recover after failure. You can measure these metrics in seconds, minutes, hours, or days. The next section discusses how you can align your data solution resiliency strategy to meet the needs of your organization.

Formulating a strategy to enhance data solution resilience

To develop a robust resiliency strategy for your data solution built on SageMaker, start with how users interact with the data solution. The user interaction influences the data solution architecture, the degree of automation, and determines your resiliency strategy. Here are a few aspects you might consider while designing the resiliency of your data solution.

  • Data solution architecture – The data solution of your organization might follow a centralized, decentralized, or hybrid architecture. This architecture pattern reflects the distribution of responsibilities of the data solution based on the data strategy of your organization. This shift in responsibilities is reflected in the structure of the teams that perform activities in the Amazon DataZone data portal, SageMaker Unified Studio portal, AWS Management Console, and underlying infrastructure. Examples of such activities include configuring and running the data sources, publishing data assets in the data catalog, subscribing to data assets, and assigning members to projects.
  • User persona – The user persona, their data, and cloud maturity influence their preferences for interacting with the data solution. The users of a data governance solution fall into two categories: business users and technical users. Business users of your organization might include data owners, data stewards, and data analysts. They might find the Amazon DataZone data portal and SageMaker Unified Studio portal more convenient for tasks such as approving or rejecting subscription requests and performing one-time queries. Technical users such as data solution administrators, data engineers, and data scientists might opt for automation when making system changes. Examples of such activities include publishing data assets, managing glossary and metadata forms in the Amazon DataZone data portal or in SageMaker Unified Studio portal. A robust resiliency strategy accounts for tasks performed by both user groups.
  • Empowerment of self-service – The data strategy of your organization determines autonomy granted to the users. Increased user autonomy demands a high level of abstraction of the cloud infrastructure powering the data solution. SageMaker empowers self-service by enabling users to perform regular data management activities in the Amazon DataZone data portal and in the SageMaker Unified Studio portal. The level of self-service maturity of the data solution depends on the data strategy and user maturity of your organization. At an early stage, you might limit the self-service features to the use cases for onboarding the data solution. As the data solution scales, consider increasing the self-service capabilities. See Data Mesh Strategy Framework to learn about the different phases of a data mesh-based data solution.

Adopt the following design principles to enhance the resiliency of your data solution:

  • Choose serverless services – Use serverless AWS services to build your data solution. Serverless services scale automatically with increasing system load, provide fault isolation, and have built-in high-availability. Serverless services minimize the need for infrastructure management, reducing the need to design resiliency into the infrastructure. SageMaker seamlessly integrates with several serverless services such Amazon Simple Storage Service (Amazon S3), AWS Glue, AWS Lake Formation, and Amazon Athena.
  • Document system metadata – Document the system metadata of your data solution using infrastructure-as-code (IaC) and automation. Consider how users interact with the data solution. If the users prefer to perform certain activities through the Amazon DataZone data portal and SageMaker Unified Studio portal, implement automation to capture and store the metadata that’s relevant for disaster recovery. Use Amazon Relational Database Service (Amazon RDS) and Amazon DynamoDB to store the system metadata of your data solution.
  • Monitor system health – Implement a monitoring and alerting solution for your data solution so that you can respond to service interruptions and initiate the recovery process. Make sure that system activities are logged so that you can troubleshoot the system interruption. Amazon CloudWatch helps you monitor AWS resources and the applications you run on AWS in real time.

The next section presents disaster recovery strategies to recover your data solution built on SageMaker.

Disaster recovery strategies

Disaster recovery focuses on one-time recovery objectives in response to natural disasters, large-scale technical failures, or human threats such as attack or error. Disaster recovery is a crucial part of your business continuity plan. As shown in the following figure, AWS offers the following options for disaster recovery: Backup and restore, pilot light, warm standby, and multi-site active/active.

The business continuity requirements and cost of recovery should guide your organization’s disaster recovery strategy. As a general guideline, the recovery cost of your data solution increases with reduced RPO and RTO requirements. The next section provides architecture patterns to implement a robust backup and recovery solution for a data solution built on SageMaker.

Solution overview

This section provides event-driven architecture patterns following the backup and restore approach to enhance resiliency of your data solution. This active/passive strategy-based solution stores the system metadata in a DynamoDB table. You can use the system metadata to restore your data solution. The following architecture patterns provide regional resilience. You can simplify the architecture of this solution to restore data in a single AWS Region.

Pattern 1: Point-in-time backup

The point-in-time backup captures and stores system metadata of a data solution built on SageMaker when a user or an automation performs an action. In this pattern, a user activity or an automation initiates an event that captures the system metadata. This pattern is suited for low RPO requirements, ranging from seconds to minutes. The following architecture diagram shows the solution for the point-in-time backup process.

Architecture point-in-time-backup

The steps comprise the following.

  1. User or automation performs an activity on an Amazon DataZone domain or Amazon Unified Studio domain.
  2. This activity creates a new event in AWS CloudTrail.
  3. The CloudTrail event is sent to Amazon EventBridge. Alternatively, you can use Amazon DataZone as the event source for the EventBridge rule.
  4. AWS Lambda transforms and stores this event in a DynamoDB global table where the Amazon DataZone domain is hosted.
  5. The information is replicated into the replica DynamoDB table in a secondary Region. The replica DynamoDB table can be used to restore the data solution based on SageMaker in the secondary Region.

Pattern 2: Scheduled backup

The scheduled backup captures and stores system metadata of a data solution built on SageMaker at regular intervals. In this pattern, an event is initiated based on a defined time schedule. This pattern is suited for RPO requirements in the order of hours. The following architecture diagram displays the solution for point-in-time backup process.

The steps comprise the following.

  1. EventBridge triggers an event at regular interval and sends this event to AWS Step Functions.
  2. The Step Functions state machine contains multiple Lambda functions. These Lambda functions get the system metadata from either a SageMaker Unified Studio domain or an Amazon DataZone domain.
  3. The system metadata is stored in an DynamoDB global table in the primary Region where the Amazon DataZone domain is hosted.
  4. The information is replicated into the replica DynamoDB table in a secondary Region. The data solution can be restored in the secondary Region using the replica DynamoDB table.

The next section provides step by step instructions to deploy a code sample that implements the scheduled backup pattern. This code sample stores asset information of a data solution built on a SageMaker Unified Studio domain and an Amazon DataZone domain in an DynamoDB global table. The data in the DynamoDB table is encrypted at rest using a customer managed key stored in AWS Key Management Service (AWS KMS). A multi-Region replica key encrypts the data in the secondary Region. The asset uses the data lake blueprint that contains the definition for launching and configuring a set of services (AWS Glue, Lake Formation, and Athena) to publish and use data lake assets in the business data catalog. The code sample uses the AWS Cloud Development Kit (AWS CDK) to deploy the cloud infrastructure.

Prerequisites

  • An active AWS account.
  • AWS administrator credentials for the central governance account in your development environment
  • AWS Command Line Interface (AWS CLI) installed to manage your AWS services from the command line (recommended)
  • Node.js and Node Package Manager (npm) installed to manage AWS CDK applications
  • AWS CDK Toolkit installed globally in your development environment by using npm, to synthesize and deploy AWS CDK applications
npm install -g aws-cdk
  • TypeScript installed in your development environment or installed globally by using npm compiler:
npm install -g typescript
  • Docker installed in your development environment (recommended)
  • An integrated development environment (IDE) or text editor with support for Python and TypeScript (recommended)

Walkthrough for data solutions built on a SageMaker Unified Studio domain

This section provides step by step instructions to deploy a code sample that implements the scheduled backup pattern for data solutions built on a SageMaker Unfied Studio domain.

Set up SageMaker Unified Studio

  1. Sign into the IAM console. Create an IAM role that trusts Lambda with the following policy.
{
    "Version": "2012-10-17",
    "Statement": [
        {
            "Sid": "VisualEditor0",
            "Effect": "Allow",
            "Action": "datazone:Search",
            "Resource": "*"
        },
        {
            "Sid": "VisualEditor1",
            "Effect": "Allow",
            "Action": [
                "dynamodb:PutItem"
            ],
            "Resource": "arn:aws:dynamodb:<AWS_REGION>:<AWS_ACCOUNT>:table/*"
        },
        {
            "Sid": "VisualEditor2",
            "Effect": "Allow",
            "Action": [
                "kms:Decrypt",
                "kms:Encrypt",
                "kms:GenerateDataKey",
                "kms:ReEncrypt*",
                "kms:DescribeKey"
            ],
            "Resource": "arn:aws:kms:<AWS_REGION>:<AWS_ACCOUNT>:key/<KMS_KEY_ID>"
        },
        {
            "Sid": "VisualEditor3",
            "Effect": "Allow",
            "Action": [
                "logs:CreateLogGroup",
                "logs:CreateLogStream",
                "logs:PutLogEvents"
            ],
            "Resource": [
                "arn:aws:logs:<AWS_REGION>:<AWS_ACCOUNT>:log-group:*:log-stream:*",
                "arn:aws:logs:<AWS_REGION>:<AWS_ACCOUNT>:log-group:*"
            ]
        }
    ]
}
  1. Note down the Amazon Resource Name (ARN) of the Lambda role. Navigate to SageMaker and choose Create a Unified Studio domain.
  2. Select Quick setup and expand the Quick setup settings section. Enter a domain name, for example, CORP-DEV-SMUS. Select the Virtual private cloud (VPC) and Subnets. Choose Continue.
  3. Enter the email address of the SageMaker Unified Studio user in the Create IAM Identity Center user section. Choose Create domain.
  4. After the domain is created, choose Open unified studio in the top right corner. Screenshot open-smus
  5. Sign in to SageMaker Unified Studio using the single sign-on (SSO) credentials of your user. Choose Create project at the top right corner. Enter a project name and description, choose Continue twice, and choose Create project. Wait unti project creation is complete. Screenshot create-smus-project
  6. After the project is created, go into the project by selecting the project name. Select Query Editor from the Build drop-down menu on the top left. Paste the following create table as select (CTAS) query script in the query editor window and run it to create a new table named mkt_sls_table as described in Produce data for publishing. The script creates a table with sample marketing and sales data.
CREATE TABLE mkt_sls_table AS
SELECT 146776932 AS ord_num, 23 AS sales_qty_sld, 23.4 AS wholesale_cost, 45.0 as lst_pr, 43.0 as sell_pr, 2.0 as disnt, 12 as ship_mode,13 as warehouse_id, 23 as item_id, 34 as ctlg_page, 232 as ship_cust_id, 4556 as bill_cust_id
UNION ALL SELECT 46776931, 24, 24.4, 46, 44, 1, 14, 15, 24, 35, 222, 4551
UNION ALL SELECT 46777394, 42, 43.4, 60, 50, 10, 30, 20, 27, 43, 241, 4565
UNION ALL SELECT 46777831, 33, 40.4, 51, 46, 15, 16, 26, 33, 40, 234, 4563
UNION ALL SELECT 46779160, 29, 26.4, 50, 61, 8, 31, 15, 36, 40, 242, 4562
UNION ALL SELECT 46778595, 43, 28.4, 49, 47, 7, 28, 22, 27, 43, 224, 4555
UNION ALL SELECT 46779482, 34, 33.4, 64, 44, 10, 17, 27, 43, 52, 222, 4556
UNION ALL SELECT 46779650, 39, 37.4, 51, 62, 13, 31, 25, 31, 52, 224, 4551
UNION ALL SELECT 46780524, 33, 40.4, 60, 53, 18, 32, 31, 31, 39, 232, 4563
UNION ALL SELECT 46780634, 39, 35.4, 46, 44, 16, 33, 19, 31, 52, 242, 4557
UNION ALL SELECT 46781887, 24, 30.4, 54, 62, 13, 18, 29, 24, 52, 223, 4561Screenshot create-smus-asset
  1. Navigate to Data sources from the Project. Choose Run in the Actions section next to the project.default_lakehouse connection. Wait until the run is complete.Screeshot run-smus-data-source
  2. Navigate to Assets in the left side bar. Select the mkt_sls_table in the Inventory section and review the metadata that was generated. Choose Accept All if you’re satisfied with the metadata.Screenshot smus-assets
  3. Choose Publish Asset to publish the mkt_sls_table table to the business data catalog, making it discoverable and understandable across your organization.
  4. Choose Members in the navigation pane. Choose Add members and select the IAM role you created in Step 1. Add the role as a Contributor in the project.

Deployment steps

After setting up SageMaker Unified Studio, use the AWS CDK stack provided on GitHub to deploy the solution to back up the asset metadata that is created in the previous section.

  1. Clone the repository from GitHub to your preferred integrated development environment (IDE) using the following commands.
git clone https://github.com/aws-samples/sample-event-driven-resilience-data-solutions-sagemaker.git
cd sample-event-driven-resilience-data-solutions-sagemaker
  1. Export AWS credentials and the primary Region to your development environment for the IAM role with administrative permissions, use the following format
export AWS_REGION=
export AWS_ACCESS_KEY_ID=
export AWS_SECRET_ACCESS_KEY=
export AWS_SESSION_TOKEN=

In a production environment, use AWS Secrets Manager or AWS Systems Manager Parameter Store to manage credentials. Automate the deployment process using a continuous integration and delivery (CI/CD) pipeline.

  1. Bootstrap the AWS account in the primary and secondary Regions by using AWS CDK and running the following command.
cdk bootstrap aws://<AWS_ACCOUNT_ID>/<AWS_REGION>
cdk bootstrap aws://<AWS_ACCOUNT_ID>/<AWS_SECONDARY_REGION>
cd unified-studio
  1. Modify the following parameters in the config/Config.ts file.
SMUS_APPLICATION_NAME – Name of the application.
SMUS_SECONDARY_REGION – Secondary AWS region for backup.
SMUS_BACKUP_INTERVAL_MINUTES – Minutes before each backup interval. 
SMUS_STAGE_NAME – Name of the stage. 
SMUS_DOMAIN_ID – Domain identifier of the Amazon SageMaker Unified Studio. 
SMUS_PROJECT_ID – Project identifier of the Amazon SageMaker Unified Studio. 
SMUS_ASSETS_REGISTRAR_ROLE_ARN – ARN of the AWS Lambda role created in step 1 of the preceding section. 
  1. Install the dependencies by running the following command:

npm install

  1. Synthesize the CloudFormation template by running the following command.

cdk synth

  1. Deploy the solution by running the following command.

cdk deploy –all

  1. After the deployment is complete, sign in to your AWS account and navigate to the CloudFormation console to verify that the infrastructure deployed.

When deployment is complete, wait for the duration of DZ_BACKUP_INTERVAL_MINUTES. Navigate to the <DZ_APPLICATION_NAME >AssetsInfo DynamoDB table. Retrieve the data from the DynamoDB table. The following screenshot shows the data in the Items returned section. Verify the same data in the secondary Region.Screenshot smus-dynamodb

Clean up

Use the following steps to clean up the resources deployed.

  1. Empty the S3 buckets that were created as part of this deployment.
  2. In your local development environment (Linux or macOS):
  3. Navigate to the unified-studio directory of your repository.
  4. Export the AWS credentials for the IAM role that you used to create the AWS CDK stack.
  5. To destroy the cloud resources, run the following command:

cdk destroy --all

  1. Go to the SageMaker Unified Studio and delete the published data assets that were created in the project.
  2. Use the console to delete the SageMaker Unified Studio domain.

Walkthrough for data solutions built on an Amazon DataZone domain

This section provides step by step instructions to deploy a code sample that implements the scheduled backup pattern for data solutions built on an Amazon DataZone domain.

Deployment steps

After completing the prerequisites, use the AWS CDK stack provided on GitHub to deploy the solution to backup system metadata of the data solution built on Amazon DataZone domain

  1. Clone the repository from GitHub to your preferred IDE using the following commands.
git clone https://github.com/aws-samples/sample-event-driven-resilience-data-solutions-sagemaker.git
cd event-driven-resilience-sagemaker
  1. Export AWS credentials and the primary Region information to your development environment for the AWS Identity and Access Management (IAM) role with administrative permissions, use the following format:
export AWS_REGION=
export AWS_ACCESS_KEY_ID=
export AWS_SECRET_ACCESS_KEY=
export AWS_SESSION_TOKEN=

In a production environment, use Secrets Manager or Systems Manager Parameter Store to manage credentials. Automate the deployment process using a CI/CD pipeline.

  1. Bootstrap the AWS account in the primary and secondary Regions by using AWS CDK and running the following command:
cdk bootstrap aws://<AWS_ACCOUNT_ID>/<AWS_REGION>
cdk bootstrap aws://<AWS_ACCOUNT_ID>/<AWS_SECONDARY_REGION>
cd datazone
  1. From the console for IAM, note the Amazon Resource Name (ARN) of the CDK execution role. Update the trust relationship of the IAM role so that Lambda can assume the role.
  1. Modify the following parameters in the config/Config.ts file.
DZ_APPLICATION_NAME – Name of the application.
DZ_SECONDARY_REGION – Secondary Region for backup.
DZ_BACKUP_INTERVAL_MINUTES – Minutes before each backup interval.
DZ_STAGE_NAME – Name of the stage (dev, qa, or prod).
DZ_DOMAIN_NAME – Name of the Amazon DataZone domain
DZ_DOMAIN_DESCRIPTION – Description of the Amazon DataZone domain
DZ_DOMAIN_TAG – Tag of the Amazon DataZone domain
DZ_PROJECT_NAME – Name of the Amazon DataZone project
DZ_PROJECT_DESCRIPTION – Description of the Amazon DataZone project
CDK_EXEC_ROLE_ARN – ARN of the CDK execution role
DZ_ADMIN_ROLE_ARN – ARN of the administrator role
  1. Install the dependencies by running the following command:

npm install

  1. Synthesize the AWS CloudFormation template by running the following command:

cdk synth

  1. Deploy the solution by running the following command:

cdk deploy --all

  1. After the deployment is complete, sign in to your AWS account and navigate to the CloudFormation console to verify that the infrastructure deployed.

Document system metadata

This section provides instructions to create an asset and demonstrates how you can retrive the metadata of the asset. Perform the following steps to retrieve the systems metadata.

  1. Sign in to the Amazon DataZone data portal from the console. Select the project and choose Query data at the upper right.

Screenshot datazone-open-query

  1. Choose Open Athena and make sure that <DZ_PROJECT_NAME>_DataLakeEnvironment is selected in the Amazon DataZone environment dropdown at the upper right and that on the left, and that <DZ_PROJECT_NAME>_datalakeenvironment_pub_db is selected as the Database.
  2. Create a new AWS Glue table for publishing to Amazon DataZone. Paste the following create table as select (CTAS) query script in the Query window and run it to create a new table named mkt_sls_table as described in Produce data for publishing. The script creates a table with sample marketing and sales data.
CREATE TABLE mkt_sls_table AS
SELECT 146776932 AS ord_num, 23 AS sales_qty_sld, 23.4 AS wholesale_cost, 45.0 as lst_pr, 43.0 as sell_pr, 2.0 as disnt, 12 as ship_mode,13 as warehouse_id, 23 as item_id, 34 as ctlg_page, 232 as ship_cust_id, 4556 as bill_cust_id
UNION ALL SELECT 46776931, 24, 24.4, 46, 44, 1, 14, 15, 24, 35, 222, 4551
UNION ALL SELECT 46777394, 42, 43.4, 60, 50, 10, 30, 20, 27, 43, 241, 4565
UNION ALL SELECT 46777831, 33, 40.4, 51, 46, 15, 16, 26, 33, 40, 234, 4563
UNION ALL SELECT 46779160, 29, 26.4, 50, 61, 8, 31, 15, 36, 40, 242, 4562
UNION ALL SELECT 46778595, 43, 28.4, 49, 47, 7, 28, 22, 27, 43, 224, 4555
UNION ALL SELECT 46779482, 34, 33.4, 64, 44, 10, 17, 27, 43, 52, 222, 4556
UNION ALL SELECT 46779650, 39, 37.4, 51, 62, 13, 31, 25, 31, 52, 224, 4551
UNION ALL SELECT 46780524, 33, 40.4, 60, 53, 18, 32, 31, 31, 39, 232, 4563
UNION ALL SELECT 46780634, 39, 35.4, 46, 44, 16, 33, 19, 31, 52, 242, 4557
UNION ALL SELECT 46781887, 24, 30.4, 54, 62, 13, 18, 29, 24, 52, 223, 4561Screenshot datazone-run-query
  1. Go to the Tables and Views section and verify that the mkt_sls_table table was successfully created.
  2. In the Amazon DataZone Data Portal, go to Data sources, select the <DZ_PROJECT_NAME>-DataLakeEnvironment-default-datasource, and choose Run. The mkt_sls_table will be listed in the inventory and available to publish.Screenshot run-data-source
  3. Select the mkt_sls_table table and review the metadata that was generated. Choose Accept All if you’re satisfied with the metadata.Screeshot publish-data-asset
  4. Choose Publish Asset and the mkt_sls_table table will be published to the business data catalog, making it discoverable and understandable across your organization.
  5. After the table is published, wait for the duration of DZ_BACKUP_INTERVAL_MINUTES. Navigate to the <DZ_APPLICATION_NAME >AssetsInfo DynamoDB table and retrieve the data from the table. The following screenshot shows the data in the Items returned section. Verify the same data in the secondary Region.Screenshot datazone-dynamodb

Clean up

Use the following steps to clean up the resources deployed.

  1. Empty the Amazon Simple Storage Service (Amazon S3) buckets that were created as part of this deployment.
  2. Go to the Amazon DataZone domain portal and delete the published data assets that were created in the Amazon DataZone project.
  3. In your local development environment (Linux or macOS):
  • Navigate to the datazone directory of your repository.
  • Export the AWS credentials for the IAM role that you used to create the AWS CDK stack.
  • To destroy the cloud resources, run the following command:

cdk destroy --all

Conclusion

This post explores how to build a resilient data governance solution on Amazon SageMaker. Resilient design principles and a robust disaster recovery strategy are central to the business continuity of AWS customers. The code samples included in this post implement a backup process of the data solution at regular time interval. They store the Amazon SageMaker asset information in Amazon DynamoDB Global tables. You can extend the backup solution by identifying the system metadata that is relevant for the data solution of your organization and by using Amazon SageMaker APIs to capture and store the metadata. The DynamoDB Global table replicates the changes in the DynamoDB table in the primary region to the secondary region in an asynchronous manner. Consider Implementing an additional layer of resiliency by using AWS Backup to back up the DynamoDB table at regular interval. In the next post, we show how you can use the system metadata to restore your data solution in the secondary region.

Adopt the resiliency features offered by Amazon DataZone and Amazon SageMaker Unified Studio. Use AWS Resilience Hub to assess the resilience of your data solution. AWS Resilience Hub helps you to define your resilience goals, assess your resilience posture against those goals, and implement recommendations for improvement based on the AWS Well-Architected Framework.

To build a data mesh based data solution using Amazon DataZone domain, see our GitHub repository. This open source project provides a step-by-step blueprint for constructing a data mesh architecture using the powerful capabilities of Amazon SageMaker, AWS Cloud Development Kit (AWS CDK), and AWS CloudFormation.


About the authors

BDB-4558-DhrubaDhrubajyoti Mukherjee is a Cloud Infrastructure Architect with a strong focus on data strategy, data governance, and artificial intelligence at Amazon Web Services (AWS). He uses his deep expertise to provide guidance to global enterprise customers across industries, helping them build scalable and secure cloud solutions that drive meaningful business outcomes. Dhrubajyoti is passionate about creating innovative, customer-centric solutions that enable digital transformation, business agility, and performance improvement. Outside of work, Dhrubajyoti enjoys spending quality time with his family and exploring nature through his love of hiking mountains.

Connect, share, and query where your data sits using Amazon SageMaker Unified Studio

Post Syndicated from Lakshmi Nair original https://aws.amazon.com/blogs/big-data/connect-share-and-query-where-your-data-sits-using-amazon-sagemaker-unified-studio/

The ability for organizations to quickly analyze data across multiple sources is crucial for maintaining a competitive advantage. Imagine a scenario where the retail analytics team is trying to answer a simple question: Among customers who purchased summer jackets last season, which customers are likely to be interested in the new spring collection?

While the question is straightforward, getting the answer requires piecing together data across multiple data sources such as customer profiles stored in Amazon Simple Storage Service (Amazon S3) from customer relationship management (CRM) systems, historical purchase transactions in an Amazon Redshift data warehouse, and current product catalog information in Amazon DynamoDB. Traditionally, answering this question would involve multiple data exports, complex extract, transform, and load (ETL) processes, and careful data synchronization across systems.

In this blog post, we will demonstrate how business units can use Amazon SageMaker Unified Studio to discover, subscribe to, and analyze these distributed data assets. Through this unified query capability, you can create comprehensive insights into customer transaction patterns and purchase behavior for active products without the traditional barriers of data silos or the need to copy data between systems.

SageMaker Unified Studio provides a unified experience for using data, analytics, and AI capabilities. You can use familiar AWS services for model development, generative AI, data processing, and analytics—all within a single, governed environment. To strike a fine balance of democratizing data and AI access while maintaining strict compliance and regulatory standards, Amazon SageMaker Data and AI Governance is built into SageMaker Unified Studio. With Amazon SageMaker Catalog, teams can collaborate through projects, discover, and access approved data and models using semantic search with generative AI-created metadata, or you can use natural language to ask Amazon Q to find your data. Within SageMaker Unified Studio, organizations can implement a single, centralized permission model with fine-grained access controls, facilitating seamless data and AI asset sharing through streamlined publishing and subscription workflows. Teams can also query the data directly from sources such as Amazon S3 and Amazon Redshift, through Amazon SageMaker Lakehouse.

SageMaker Lakehouse streamlines connecting to, cataloging, and managing permissions on data from multiple sources. Built on AWS Glue Data Catalog and AWS Lake Formation, it organizes data through catalogs that can be accessed through an open, Apache Iceberg REST API to help ensure secure access to data with consistent, fine-grained access controls. SageMaker Lakehouse organizes data access through two types of catalogs: federated catalogs and managed catalogs (shown in the following figure). A catalog is a logical container that organizes objects from a data store, such as schemas, tables, views, or materialized views such as from Amazon Redshift. You can also create nested catalogs to mirror the hierarchical structure of your data sources within SageMaker Lakehouse.

  • Federated catalogs: Through SageMaker Unified Studio, you can create connections to external data sources such as Amazon DynamoDB. See Data connections in Amazon SageMaker Lakehouse for all the supported external data sources. These connections are stored in the AWS Glue Data Catalog (Data Catalog) and registered with Lake Formation, allowing you to create a federated catalog for each available data source.
  • Managed catalogs: A managed catalog refers to the data that resides on Amazon S3 or Redshift Managed Storage (RMS).

The existing Data Catalog becomes the Default catalog (identified by the AWS account number) and is readily available in SageMaker Lakehouse.

If the business units don’t have a data warehouse but need the benefits of one—such as a query result cache and query rewrite optimizations—then, they can create an RMS managed catalog in SageMaker Unified Studio. This is a SageMaker Lakehouse managed catalog backed by RMS storage. The table metadata is managed by Data Catalog. When you create an RMS managed catalog, it deploys an Amazon Redshift managed serverless workgroup. Users can write data to managed RMS tables using Iceberg APIs, Amazon Redshift, or Zero-ETL ingestion from supported data sources.

Functional working model

In SageMaker Unified Studio, the infrastructure team will enable the blueprints and configure the project profiles for tools and technologies to the respective business units to build and monitor their pipelines. They will also onboard the teams to SageMaker Unified Studio, enabling them to build the data products in a single integrated, governed environment. To enforce standardization within the organization, the central governance team can also create hierarchical representations of business units through domain units and dictate certain actions that these teams can perform under a domain unit. Global policies such as data dictionaries (business glossaries), data classification tags, and additional information with metadata forms can be created by the governance team to ensure standardization and consistency within the organization.

Individual business units will use these project profiles based on their needs to process the data using the authorized tool of their choice and create data products. Business units can enjoy the full flexibility to process and consume the data without worrying about the maintenance of the underlying infrastructure. Depending on the nature of the workloads, business units can choose a storage solution that best fits their use case. You can use SageMaker Lakehouse to unify the data across different data sources.

To share the data outside the business unit, the teams will publish the metadata of their data to a SageMaker catalog and make it discoverable and accessible to other business units. Amazon SageMaker Catalog serves as a central repository hub to store both technical and business catalog information of the data product. To establish trust between the data producers and data consumers, SageMaker Catalog also integrates the data quality metrics and data lineage events to track and drive transparency in data pipelines. While sharing the data, data producers of these business units can apply fine grained access control permissions at row and column level to these assets during subscription approval workflows. SageMaker Unified Studio automatically grants subscription access to the subscribed data assets after the subscription request is approved by the data producer. As shown in the following figure, the data sharing capability highlights that the data remains at its origin with the data producer, while consumers from other business units can consume and analyze it using their own compute resources. This approach eliminates any data duplication or data movement.

Solution overview

In this post, we explore two scenarios for sharing data between different teams (retail, marketing, and data analysts). The solution in this post gives you the implementation for a single account use case.

Scenario 1

The retail team needs to create a comprehensive view of customer behavior to optimize their spring collection launch. Their data landscape is diverse:

  • Customer profiles stored in Amazon S3 (default Data Catalog)
  • Historical purchase transactions stored in RMS (SageMaker Lakehouse managed RMS catalog)
  • Inventory information of the product in DynamoDB. (federated catalog)

The team needs to share this unified view with their regional data analysts while maintaining strict data governance protocols. Data analysts discover the data and subscribe to the data. We will also walk through the publishing and subscription workflow as part of the data sharing process. To get a unified view of the customer sales transactions for active products, the data analysts will use Amazon Athena.

Here are the high level steps of the solution implementation as shown in the preceding diagram:

  1. In this post, we take an example of two teams who participate in the collaboration. The retail team has created a project retailsales-sql-project and the data analysts team has created a project dataanalyst-sql-project within SageMaker Unified Studio.
  2. The retail team creates and stores their data in various sources:
    1. customer data in Amazon S3 (contains customer data)
    2. inventory data in a DynamoDB table (contains product catalog information)
    3. store_sales_lakehouse in SageMaker Lakehouse managed RMS (contains purchase history)
  3. The retail team publishes the assets to the project catalog to make them discoverable to other domain members within the organization.
  4. The data analysts team discovers the data and subscribes to the data assets.
  5. An incoming request is sent to the retail team, who then approves the subscription request. After the subscription is approved, data analysts use Athena to create a unified query from all the subscribed data assets to get insights into the data.

In this scenario, we will review how SageMaker Catalog manages the subscription grants to Data Catalog assets (both federated and managed).

For this scenario, we assume that the retail team doesn’t have their own data warehouse and they want to create and manage Amazon Redshift tables using Data Catalog.

Scenario 2

The marketing team needs access to transaction data for campaign optimization. They have campaign performance data stored in an Amazon Redshift data warehouse. However, to have improved campaign ROI and better resource allocation, they need data from the retail team to understand actual customer purchase behavior. To improve the campaign ROI, they need answers to crucial questions such as:

  • What is the true conversion rate across different customer segments?
  • Which customers should be targeted for upcoming promotions?
  • How do seasonal buying patterns affect campaign success?

Here the retail team shares the purchase history data store_sales to the marketing team. In this scenario, shown in the preceding figure, we assume that the retail team has their own data warehouse and uses Amazon Redshift to store the purchase history data.

The high level steps of the solution implementation for this scenario are:

  1. The marketing team has created the project marketing-sql-project within SageMaker Unified Studio.
  2. The retail team has store_sales in Amazon Redshift data warehouse (contains purchase history)
  3. The retail team has published the assets to the project catalog
  4. The marketing team discovers the data and subscribes to the data assets.
  5. An incoming request is sent to the retail team, who then approves the subscription request. After the subscription is approved, the marketing team uses Amazon Redshift to consume the purchase history and identify high-value customer segments.

In this scenario, we will review the process of how SageMaker Catalog grants access to managed Amazon Redshift assets.

Prerequisites

To follow the step by step guide, you must complete the following prerequisites:

Note that the default SQL analytics project profile provides you with a RedshiftServerless blueprint. However, in this post, we want to showcase the data sharing capabilities of different types of SageMaker Lakehouse catalogs (managed and federated).

For the simplicity, we chose the SQL analytics project profile. However, you can also test this by using the Custom project profile by selecting specific blueprints such as LakehouseCatalog and LakeHouseDatabase for scenarios where the business unit doesn’t have their own data warehouse.

Solution walkthrough (Scenario 1)

The first step focuses on preparing the data for each data source for unified access.

Data preparation

In this section, you will create the following data sets:

  • customer data in Amazon S3 (default Data Catalog)
  • inventory data in a DynamoDB table (federated catalog)
  • store_sales_lakehouse in SageMaker Lakehouse managed RMS (managed catalog)
  1. Sign in to SageMaker Unified Studio as a member of the retail team and select the project retailsales-sql-project.
  2. On the top menu, choose Build, and under DATA ANALYSIS & INTEGRATION, select Query Editor.

  1. Select the following options:
    1. Under CONNECTIONS, select Athena (Lakehouse).
    2. Under CATALOGS, select AwsDataCatalog.
    3. Under DATABASES, select glue_db_<environmentid> or the customer glue database name you provided during project creation.
    4. After the options are selected, choose Choose.

When users select a project profile within SageMaker Unified Studio, the system automatically triggers the relevant AWS CloudFormation stack (DataZone-Env-<environmentid>) and deploys the necessary infrastructure resources in the form of environments. Environments are the actual data infrastructure behind a project.

  1. Run the following SQL:
CREATE TABLE customer AS
SELECT 13251813 cust_id,'Joyce Deaton'   cust_name,'Greece'   cust_country, '[email protected]'   cust_email
UNION
SELECT 1581546  ,'Daniel Dow'  ,'India'  , '[email protected]'  
UNION
SELECT 1581536  ,'Marie Lange'  ,'Canada'  , '[email protected]'  
UNION
SELECT 1827661  ,'Wesley Harris'  ,'Rome'  , '[email protected]'  
UNION
SELECT 1581536  ,'Alexander Salyer'  ,'Germany'  , '[email protected]'  
UNION
SELECT 3581536  ,'Jerry Tracy'  ,'Swiss'  , '[email protected]' 
  1. After the SQL is executed, you will find that the customer table has been created in the Lakehouse section under Lakehouse/AwsDataCatalog/glue_db_<environmentid>.

  1. The product catalog is stored in DynamoDB. You can create a new table named inventory in DynamoDB with partition key prod_id through AWS CloudShell with the following command:
aws dynamodb create-table \
    --table-name inventory\
    --attribute-definitions \
AttributeName=prod_id,AttributeType=N \
    --key-schema \
AttributeName=prod_id,KeyType=HASH \
    --provisioned-throughput \
ReadCapacityUnits=5,WriteCapacityUnits=5 \
    --table-class STANDARD
  1. Populate the DynamoDB table using the following commands:
aws dynamodb put-item --table-name inventory --item '{"prod_id": {"N": "1"}, "prod_name": {"S": "Widget A"},"active": {"S": "Y"}}' 

aws dynamodb put-item --table-name inventory --item '{"prod_id": {"N": "2"}, "prod_name": {"S": "Gadget B"},"active": {"S": "Y"}}'

aws dynamodb put-item --table-name inventory --item '{"prod_id": {"N": "3"}, "prod_name": {"S": "Item C"},"active": {"S": "N"}}' 
  1. To use the DynamoDB table in SageMaker Unified Studio, you need to configure a resource-based policy that allows the appropriate actions for the project role.
    1. To create the resource-based policy, navigate to the DynamoDB console and choose Tables from the navigation pane.
    2. Select the Permissions table and choose Create table policy.

  1. The following is an example policy that allows connecting to DynamoDB tables as a federated source. Replace the <aws_region> with the Region you are working on, <aws_account_id> with the AWS Account ID where DynamoDB is deployed, <dynamodb_table> with the DynamoDB table (in this case inventory) that you intend to query from Amazon SageMaker Unified Studio and <datazone_usr_role_xxxxxxxxxxxxxx_yyyyyyyyyyyyyy> with the Project role Amazon Resource Name (ARN) in SageMaker Unified Studio portal. You can get the project role ARN by navigating to the project in SageMaker Unified Studio and then to Project overview.

{
    "Version": "2012-10-17",
    "Statement": [
        {
            "Effect": "Allow",
            "Principal": "*",
            "Action": [
                "dynamodb:Query",
                "dynamodb:Scan",
                "dynamodb:DescribeTable",
                "dynamodb:PartiQLSelect",
                "dynamodb:BatchWriteItem"
            ],
            "Resource": "arn:aws:dynamodb:<aws_region>:<aws_accountid>:table/<dynamodb_table>",
            "Condition": {
                "ArnEquals": {
                    "aws:PrincipalArn": "arn:aws:iam::<aws_accountid>:role/<datazone_usr_role_xxxxxxxxxxxxxx_yyyyyyyyyyyyyy>"
                }
            }
        }
    ]
}

After the policies are incorporated on the DynamoDB table, create an SageMaker Lakehouse connection within SageMaker Unified Studio. As shown in the example, dynamodb-connection-catalogs is created.

  1. After the connection is successfully established, you will see the DynamoDB table inventory under Lakehouse.

The next step is to create a managed catalog for RMS objects using SageMaker Lakehouse.

  1. Choose Data in the navigation pane.
  2. In the data explorer, choose the plus icon to add a data source.
  3. Select Create Lakehouse catalog.
  4. Choose Next.

  1. Enter the name of the catalog. The catalog name provided in the example is redshift-lakehouse-connection-catalogs. Choose Add data.

  1. After the connection is created, you will see the catalog under Lakehouse.

  1. This creates a managed Amazon Redshift Serverless workgroup in your AWS account. You will see a new database dev@<redshift-catalog-name> in the managed Amazon Redshift Serverless workgroup.
    1. On the top menu, choose Build, and under DATA ANALYSIS & INTEGRATION, select Query Editor.
    2. Select Redshift (Lakehouse) from CONNECTIONSdev@<redshift-catalog-name> from DATABASES and public from SCHEMAS

  1. Run the following SQL in order. The SQL creates the store_sales_lakehouse table in the dev database in the public schema. The retail team inserts data into the store_sales_lakehouse table.
CREATE TABLE public.store_sales_lakehouse (
    sale_id INTEGER IDENTITY(1,1) PRIMARY KEY,
    cust_id INTEGER NOT NULL,
    sale_date DATE NOT NULL,
    sale_amount DECIMAL(10, 2) NOT NULL,
    prod_id INTEGER  NOT NULL,
    last_purchase_date DATE
);
INSERT INTO public.store_sales_lakehouse (cust_id, sale_date, sale_amount, prod_id, last_purchase_date)
VALUES
(13251813, '2023-01-15', 150.00, 1, '2023-01-15'),
(29033279, '2023-01-20', 200.00, 4, '2023-01-20'),
(12755125, '2023-02-01', 75.50, 3, '2023-02-01'),
(26009249, '2023-02-10', 300.00, 2, '2023-02-10'),
(3270685, '2023-02-15', 125.00, 2, '2023-02-15'),
(6520539, '2023-03-01', 100.00, 2, '2023-03-01'),
(10251183, '2023-03-10', 250.00, 1, '2023-03-10'),
(10251283, '2023-03-15', 180.00, 1, '2023-03-15'),
(10251383, '2023-04-01', 90.00, 2, '2023-04-01'),
(10251483, '2023-04-10', 220.00, 3, '2023-04-10'),
(10251583, '2023-04-15', 175.00, 3, '2023-04-15'),
(10251683, '2023-05-01', 130.00, 1, '2023-05-01'),
(10251783, '2023-05-10', 280.00, 1, '2023-05-10'),
(10251883, '2023-05-15', 195.00, 4, '2023-05-15'),
(10251983, '2023-06-01', 110.00, 2, '2023-06-01'),
(10251083, '2023-06-10', 270.00, 1, '2023-06-10'),
(10252783, '2023-06-15', 185.00, 2, '2023-06-15'),
(10253783, '2023-07-01', 95.00, 3, '2023-07-01'),
(10254783, '2023-07-10', 240.00, 1, '2023-07-10'),
(10255783, '2023-07-15', 160.00, 3, '2023-07-15');
  1. On successful creation of the table, you should now be able to query the data. Select the table store_sales_lakehouse and select Query with Redshift.

Import assets to the project catalog from various data sources

To share your assets outside your own project to other business units, you must first bring your metadata to SageMaker Catalog. To import the assets into the project’s inventory, you need to create a data source in the project catalog. In this section, we show you how to import the technical metadata from AWS Glue data catalogs. Here, you will import data assets from various sources that you have created as part of your data preparation.

  1. Sign in to SageMaker Unified Studio as a member of the retail team. Select the project retailsales-sql-project, under Project catalog. Choose Data sources and import the assets by choosing Run.

  1. To import the federated catalog, create a new data source and choose Run. This will import the metadata of the inventory data from DynamoDB table.

  1. After successful run of all the data sources, choose Assets under Project catalog in the navigation plane. You will find all the assets in the Inventory of Project catalog.

Publish the assets

To make the assets discoverable to the data analysts team, the retail team must publish their assets.

  1. In the project retailsales-sql-project, choose Project catalog and select Assets.
  2. Select each asset in the INVENTORY tab, enrich the asset with the automated metadata generation and PUBLISH ASSET.

Discover the assets

SageMaker Catalog within SageMaker Unified Studio enables efficient data asset discovery and access management. The data analysts team signs in to SageMaker Unified Studio and selects the project dataanalyst-sql-project. The data analysts team then locates the desired assets in SageMaker Catalog and initiates the subscription request.

In this section, members of dataanalyst-sql-project browse the catalog and find the assets. There are multiple ways to find the desired assets.

  • Sign in to SageMaker Unified Studio as a member of the data analysts team. Choose Discover in the top navigation bar and select Catalog. Find the desired asset by browsing or entering the name of the asset into the search bar.
  • Search for the asset through a conversational interface using Amazon Q.
  • Use the faceted filter search by selecting the desired project in the BROWSE CATALOG.

The data analysts team selects the project retailsales-sql-project.

Subscribe to the assets

The data analysts team submits a subscription request with an appropriate justification for each of these assets.

  1. For each asset, choose SUBSCRIBE.
  2. Select dataanalyst-sql-project in Project.
  3. Provide the Reason for request as “need this data for analysis”.

Note that during the subscription process, the requester sees a message that the asset access control and fulfillment will be Managed. This means that SageMaker Unified Studio automatically manages subscription access grants and permissions for these assets.

Subscription approval workflow

To approve the subscription request, you must be a member of the retail team and select the project that has published the asset.

  1. Sign in to SageMaker Unified Studio as a member of the retail team and select the project retailsales-sql-project.
  2. In the navigation pane, choose Project catalog and then select Subscription requests.
  3. In INCOMING REQUESTS, choose the REQUESTED tab and select View request for each asset to see detailed information of the subscription request.

  • REQUEST DETAILS provides information about the subscribing project, the requestor, and the justification to access the asset.
  • RESPONSE DETAILS provides an option to approve the subscription with full access to the data (Full access) or restricted access to the data (Approve with row or column filters). With restricted access to data, the subscription approval workflow process offers granular access control for sensitive data through row-level filtering and column-level filtering. Using row filters, approvers can restrict access to specific records based on defined criteria. Using column filters, approvers can control access to specific columns within the data sets. This allows excluding sensitive fields while sharing the relevant data. Approvers can implement these filters during the approval process, helping to ensure that the data access aligns with the organization’s security requirements and compliance policies. For this post, select Full access in the RESPONSE DETAILS
  • (Optional) Decision comment is where you can add a comment about accepting or rejecting the subscription request.
  • Choose APPROVE.

  1. Repeat the subscription approval workflow process for all the requested assets.
  2. After all the subscription requests are approved, choose the APPROVED tab to view all the approved assets.

Subscription fulfillment methods

After subscription approval, a fulfillment process manages access to the assets. SageMaker Unified Studio provides fulfillment methods for managed assets and unmanaged assets.

  • Managed assets: SageMaker Unified Studio automatically manages the fulfillment and permissions for assets such as AWS Glue tables and Amazon Redshift tables and views.
  • Unmanaged assets: For unmanaged assets, permissions are handled externally. SageMaker Unified Studio publishes standard events for actions such as approvals through Amazon EventBridge, enabling integration with other AWS services or third-party solutions for custom integrations.

In this scenario 1, because the assets are Data Catalogs, SageMaker Unified Studio grants and manages access to these managed assets on your behalf through Lake Formation. See the SageMaker Unified Studio subscription workflow for updates on sharing options.

Analyze the data

The data analysts team uses the subscribed data assets from varied sources to get unified insights.

  1. As a data analyst, sign in to SageMaker Unified Studio and select the project dataanalyst-sql-project. In the navigation pane, choose Project catalog and select Assets.
  2. Choose the SUBSCRIBED tab to find all the subscribed assets from the retailsales-sql-project.
  3. The status under each asset is Asset accessible. This indicates that the subscription grants are fulfilled and the data analysts team can now consume the assets with the compute of their choice.

Query using Athena (subscription grants fulfilled using Lake Formation)

As a member of the data analysts team, create a unified view to get purchase history with customer information for active products.

  1. In the dataanalyst-sql-project project, go to Build and select Query Editor.
  2. Use the following sample query to get the required information. Replace glue_db_<environmentid> with your subscribed glue database.
select * from "redshift-lakehouse-connection-catalogs/dev"."public"."store_sales_lakehouse" sales 
 left  join "awsdatacatalog"."glue_db_<environmentid>"."customer" customer
 on sales.cust_id=customer.cust_id
 inner  join "dynamodb-connection-catalogs"."default"."inventory" inventory
 on sales.prod_id = inventory.prod_id
 where inventory.active ='Y'

Solution walk-through (Scenario 2)

In this scenario, we assume that the retail team stores the purchase history data in their Amazon Redshift data warehouse. Because you’re using the default SQL analytics project profile to create the project, you will use a Redshift Serverless compute (project.redshift). The purchase history data is shared with the marketing team for enhanced campaign performance.

  1. Sign in to SageMaker Unified Studio as a member of the retail team and select the project retailsales-sql-project.
  2. On the top menu, choose Build, and under DATA ANALYSIS & INTEGRATION, select Query Editor
  3. Select the following options:
    • Under CONNECTIONS, select Redshift(Lakehouse).
    • Under CATALOGS, select dev.
    • Under DATABASES, select public.
  4. Run the following SQL:
CREATE TABLE public.store_sales (
sale_id INTEGER IDENTITY(1,1) PRIMARY KEY,
cust_id INTEGER NOT NULL,
sale_date DATE NOT NULL,
sale_amount DECIMAL(10, 2) NOT NULL,
prod_id INTEGER  NOT NULL,
last_purchase_date DATE
);
INSERT INTO public.store_sales (cust_id, sale_date, sale_amount, prod_id, last_purchase_date)
VALUES
(13251813, '2023-01-15', 150.00, 1, '2023-01-15'),
(29033279, '2023-01-20', 200.00, 4, '2023-01-20'),
(12755125, '2023-02-01', 75.50, 3, '2023-02-01'),
(26009249, '2023-02-10', 300.00, 2, '2023-02-10'),
(3270685, '2023-02-15', 125.00, 2, '2023-02-15'),
(6520539, '2023-03-01', 100.00, 2, '2023-03-01'),
(10251183, '2023-03-10', 250.00, 1, '2023-03-10'),
(10251283, '2023-03-15', 180.00, 1, '2023-03-15'),
(10251383, '2023-04-01', 90.00, 2, '2023-04-01'),
(10251483, '2023-04-10', 220.00, 3, '2023-04-10'),
(10251583, '2023-04-15', 175.00, 3, '2023-04-15'),
(10251683, '2023-05-01', 130.00, 1, '2023-05-01'),
(10251783, '2023-05-10', 280.00, 1, '2023-05-10'),
(10251883, '2023-05-15', 195.00, 4, '2023-05-15'),
(10251983, '2023-06-01', 110.00, 2, '2023-06-01'),
(10251083, '2023-06-10', 270.00, 1, '2023-06-10'),
(10252783, '2023-06-15', 185.00, 2, '2023-06-15'),
(10253783, '2023-07-01', 95.00, 3, '2023-07-01'),
(10254783, '2023-07-10', 240.00, 1, '2023-07-10'),
(10255783, '2023-07-15', 160.00, 3, '2023-07-15');

5. On successful execution of the query, you will see store_sales under Redshift in the navigation pane.

Import the asset to the project catalog inventory

To share your assets outside your own project to other marketing business units, you must first share your metadata to SageMaker Catalog. To import the assets into the project’s inventory, you need to run the data source in the project catalog.

In the project retailsales-sql-project, under Project catalog, select Data sources and import the asset store-sales. Select the highlighted data source and choose Run as shown in the screenshot.

Publish the asset

To make the assets discoverable to the marketing team, the retail team must publish their asset.

  1. Go to the navigation pane and choose Project catalog, and then select Assets.
  2. Select store-sales in the INVENTORY tab, enrich the asset with the automated metadata generation and PUBLISH ASSET as illustrated in the screenshot.

Discover and subscribe the asset

The marketing team discovers and subscribes to the store-sales asset.

  1. Sign in to SageMaker Unified Studio as a member of the marketing team and select marketing-sql-project.
  2. Navigate to the Discover menu in the top navigation bar and choose Catalog. Find the desired asset by browsing or entering the name of the asset into the search bar.
  3. Select the asset and choose SUBSCRIBE.
  4. Enter a justification in Reason for request and choose REQUEST.

Subscription approval workflow

The retail team gets an incoming request in their project to approve the subscription request.

  1. Sign in to the SageMaker Unified Studio and select the project retailsales-sql-project as a member of the retail team. Under Project catalog, select Subscription requests.
  2. In the INCOMING REQUESTS, under the REQUESTED tab, select View request for store-sales.

  1. You will see detailed information for the subscription request.
  2. Select Full access in the RESPONSE DETAILS and choose APPROVE.

Analyze the data

Sign in to SageMaker Unified Studio as a member of the marketing team and select marketing-sql-project.

  1. In the Project catalog, select Assets and choose the SUBSCRIBED tab to find all the subscribed assets from the retailsales-sql-project.
  2. Notice the status under the asset marked as Asset accessible. This indicates that the subscription grants are fulfilled and the marketing team can now consume the asset with the compute of their choice.

Query using Amazon Redshift (subscription grants fulfilled using native Amazon Redshift data sharing)

To query the shared data with Amazon Redshift compute, select Build and then Query Editor. Select the following options

  1. Under CONNECTIONS, select Redshift(Lakehouse).
  2. Under CATALOGS, select dev.
  3. Under DATABASES, select project.
select * from "dev"."project"."store_sales" sales  

When a subscription to an Amazon Redshift table or view is approved, SageMaker Unified Studio automatically adds the subscribed asset to the consumer’s Amazon Redshift Serverless workgroup for the project. Notice the subscribed asset is shared under the folder project. In the Redshift navigation pane, you can also see the datashare created between the source and the target cluster. In this case, because the data is shared in the same account but between different clusters, SageMaker Unified Studio creates a view in the target database and permissions are granted on the view. See Grant access to managed Amazon Redshift assets in Amazon SageMaker Unified Studio for information about data sharing options within Amazon Redshift.

Clean up

Make sure you remove the SageMaker Unified Studio resources to avoid any unexpected costs. Start by deleting the connections, catalogs, underlying data sources, projects, databases, and domain that you created for this post. For additional details, see the Amazon SageMaker Unified Studio Administrator Guide.

Conclusion

In this post, we explored two distinct approaches to data sharing and analytics.

Business units without an existing data warehouse can use a SageMaker Lakehouse managed RMS catalog. In the first scenario, we showcased subscription fulfillment of AWS Glue Data Catalogs using AWS Lake Formation for federated and managed catalogs. The data analysts team was able to connect and subscribe to the data shared by the retail team that resided in Amazon S3, Amazon Redshift, and other data sources such as DynamoDB through SageMaker Lakehouse.

In the second scenario, we demonstrated the native data-sharing capabilities of Amazon Redshift. In this scenario, we assume that the retail team has sales transactions stored in an Amazon Redshift data warehouse. Using the data sharing feature of Amazon Redshift, the asset was shared to the marketing team using Amazon SageMaker Unified Studio.

Both approaches enable unified querying across varied data sources with teams able to efficiently discover, publish, and subscribe to data assets while maintaining strict access controls through Amazon SageMaker Data and AI Governance. Subscription fulfillment is automated, reducing the administrative overhead. Using the query-in-place approach eliminates data redundancy and maintains data consistency while allowing unified analysis across data sources through a single integrated experience.

To learn more, see the Amazon SageMaker Unified Studio Administrator Guide and the following resources:


About the authors

Lakshmi Nair is a Senior Analytics Specialist Solutions Architect at AWS. She specializes in designing advanced analytics systems across industries. She focuses on crafting cloud-based data platforms, enabling real-time streaming, big data processing, and robust data governance. She can be reached through LinkedIn

Ramkumar Nottath is a Principal Solutions Architect at AWS focusing on Analytics services. He enjoys working with various customers to help them build scalable, reliable big data and analytics solutions. His interests extend to various technologies such as analytics, data warehousing, streaming, data governance, and machine learning. He loves spending time with his family and friends.