Tag Archives: Amazon Simple Queue Service (SQS)

Serverless strategies for streaming LLM responses

Post Syndicated from KyungYong Shim original https://aws.amazon.com/blogs/compute/serverless-strategies-for-streaming-llm-responses/

Modern generative AI applications often need to stream large language model (LLM) outputs to users in real-time. Instead of waiting for a complete response, streaming delivers partial results as they become available, which significantly improves the user experience for chat interfaces and long-running AI tasks. This post compares three serverless approaches to handle Amazon Bedrock LLM streaming on Amazon Web Services (AWS), which helps you choose the best fit for your application.

  1. AWS Lambda function URLs with response streaming
  2. Amazon API Gateway WebSocket APIs
  3. AWS AppSync GraphQL subscriptions

We cover how each option works, the implementation details, authentication with Amazon Cognito, and when to choose one over the others.

Lambda function URLs with response streaming

AWS Lambda function URLs provide a direct HTTP(S) endpoint to invoke your Lambda function. Response streaming allows your function to send incremental chunks of data back to the caller without buffering the entire response. This approach is ideal for forwarding the Amazon Bedrock streamed output, providing a faster user experience. Streaming is supported in Node.js 18+. In Node.js, you wrap your handler with awslambda.streamifyResponse(), which provides a stream to write data to, and which sends it immediately to the HTTP response.

Architecture

The following figure shows the architecture.

Lambda function URLs with Amazon Bedrock architecture

  1. The client makes a fetch() call to the Lambda function URL.
  2. Lambda invokes InvokeModelWithResponseStream using the AWS SDK for JavaScript.
  3. As tokens arrive from Amazon Bedrock, they are written to the response stream.

Implementation steps

  1. Create a streaming Lambda function: Use a Node.js 18+ or later runtime (necessary for native streaming). Install the AWS SDK to call Amazon Bedrock. In the handler code, wrap the function with awslambda.streamifyResponse and stream the model output. For example, in Node.js you might do the following:
    const bedrock = new BedrockRuntimeClient({region: “us-east-1”});
    
    // Please consider adding more details when you use it for your application.
    exports.handler = awslambda.streamifyResponse(async (event, responseStream) => 
    {
        // 1. Parse input (e.g., prompt from event)
        const prompt = event.body?.prompt;
        // 2. Call Amazon Bedrock with streaming (using AWS SDK for Amazon Bedrock)
        const command = new InvokeModelWithResponseStreamCommand({ modelId: "YOUR_MODEL_ID", body: { prompt }});
        const response = await bedrock.send(command);
        // 3. Stream Bedrock tokens to client
        for await (const event of response.body) {
            if (event.content) {
                responseStream.write(event.content); // write partial output
            }
        }
        // 4. End stream when done
        responseStream.end();
    });
    

  2. This code snippet uses the Amazon Bedrock SDK’s async iterable to read the event stream of tokens and writes each to the responseStream.
  3. Configure the Lambda role: the execution role must allow the Amazon Bedrock invocation (such as bedrock:InvokeModelWithResponseStream on the LLM model Amazon Resource Name (ARN)).

Authentication with Amazon Cognito

Lambda function URLs can be set to “None” (public) or “AWS_IAM”. Native Cognito User Pool token authentication isn’t supported, thus you need to implement a solution.

  1. JWT verification in Lambda: Allow public access and verify a valid JWT from Amazon Cognito in the request header within your Lambda code. This necessitates development effort.
    // Initialize Cognito JWT Verifier
    const { CognitoJwtVerifier } = require('aws-jwt-verify');
    
    const jwtVerifier = CognitoJwtVerifier.create({
      userPoolId: USER_POOL_ID,
      tokenUse: 'id',
      clientId: USER_POOL_CLIENT_ID
    });
    
    // Verify JWT token from Cognito
    async function verifyToken(token) {
      try {
        if (!token) throw new Error('No authorization token provided');
        
        // Remove 'Bearer ' prefix if present
        if (token.startsWith('Bearer ')) {
          token = token.slice(7);
        }
    
        // Verify the token using Cognito JWT Verifier
        const payload = await jwtVerifier.verify(token);
        logger.info(`Verified token for user: ${payload.sub}`);
        
        return payload;
      } catch (error) {
        logger.error(`Token verification failed: ${error.message}`);
        throw new Error(`Invalid token: ${error.message}`);
      }
    }
    
    //...
    
        // Verify authentication
        let userId;
        try {
          const authHeader = event.headers?.Authorization;
          const payload = await verifyToken(authHeader);
          userId = payload.sub;
          logger.info(`Authenticated user: ${userId}`);
        } catch (error) {
          responseStream.write(`data: ${JSON.stringify({ type: 'error', error: 'Unauthorized', message: error.message })}\n\n`);
          return;
        }
    

  2. IAM authorization with Amazon Cognito identity: Use AWS credentials obtained from Amazon Cognito. A more complex setup, especially for web apps, is potentially overkill for a single function.

Pros and cons of Lambda function URLs

Pros:

  • Clarity: No API Gateway or other services are needed, which minimizes operational overhead.
  • Low latency, high throughput: The response is delivered directly from Lambda to the client. This yields excellent Time To First Byte (TTFB) performance, with no intermediate buffering.
  • Direct implementation: For Node.js developers, enabling streaming is as direct as a wrapper and writing to a stream. This is ideal for quick prototypes or single function microservices.
  • Lower cost for low concurrent usage: You pay only for Lambda execution time. There’s no persistent connection cost, which is the same as with WebSocket or AWS AppSync. If invocations are infrequent or short, then this could be cost-efficient.

Cons:

  • Limited runtime support: Native streaming is only supported in Node.js.
  • No built-in user pool auth: Unlike API Gateway or AWS AppSync, Lambda URLs don’t directly support Amazon Cognito user pool authorizers. You must handle auth either through AWS Identity and Access Management (IAM) or manual token validation, adding some development effort and potential security pitfalls if done incorrectly.
  • Error handling complexity: Streaming makes error propagation trickier. If an error occurs mid-stream, then you need to decide how to inform the client.

API Gateway WebSocket for streaming

API Gateway WebSocket APIs establish persistent, stateful connections between clients and your backend. This is ideal for real-time applications needing server-initiated messages. The client connects once, sends a prompt to Amazon Bedrock through the WebSocket, and the server pushes the streamed response back over the same connection.

Architecture

The following figure shows the architecture.

API Gateway WebSocket with Amazon Bedrock architecture

  1. Client connects through the WebSocket URL and store connectionId.
  2. Client sends a prompt through a custom route to the LLMHandler.
  3. Lambda as LLMHandler invokes Amazon Bedrock and streams back through WebSocket.
  4. Client disconnects through the DisconnectHandler and removes connectionId.

Implementation steps

  1. Create a WebSocket API in API Gateway with routes
    1. $connect: Connected to ConnectHandler Lambda.
    2. $disconnect: Connected to DisconnectHandler Lambda.
    3. $stream: All messages go to StreamHandler Lambda.
  2. Create Lambda Authorizer
    1. Receives the connection request with token in query string.
    2. Validates the JWT token against Amazon Cognito.
    3. Returns Allow/Deny policy for the connection.
      def lambda_handler(event, context):
          # Extract token from querystring
          token = event.get("queryStringParameters", {}).get("token", "")
          
          # Validate JWT token against Cognito
          if validate_token(token):
              return {
                  "isAuthorized": True,
                  # Optionally include context that other handlers can access
                  "context": {
                      "userId": extracted_user_id
                  }
              }
          else:
              return {"isAuthorized": False}
      

  3. Create Connection Handler
    1. Connection Lambda runs after successful authorization.
    2. Receives the new connection’s unique connectionId.
    3. Store connection info in Amazon DynamoDB (optional).
    4. Returns 200 status to complete the connection.
      def lambda_handler(event, context):
          # Extract connectionId
          connection_id = event.get("requestContext", {}).get("connectionId")
          
          # Optionally store in DynamoDB
          # dynamodb.put_item(...)
          
          # Connection established successfully
          return {"statusCode": 200}
      

  4. Create Disconnect Handler
    1. Disconnect Lambda is triggered automatically when clients disconnect.
    2. Receives the terminated connection’s connectionId.
    3. Cleans up any stored connection data.
    4. Returns 200 status
      def lambda_handler(event, context):
          # Extract connectionId
          connection_id = event.get("requestContext", {}).get("connectionId")
          
          # Optionally remove from DynamoDB
          # dynamodb.delete_item(...)
          
          # Disconnection handled successfully
          return {"statusCode": 200}
      

  5. Create LLM Handler
      1. Receives messages sent to the stream route.
      2. Extracts prompt from the message body.
      3. Calls Amazon Bedrock model with streaming response.
      4. Streams tokens back to the client using the connection ID.
        def lambda_handler(event, context):
            # Extract connectionId and domain details for sending responses
            connection_id = event["requestContext"]["connectionId"]
            domain = event["requestContext"]["domainName"]
            stage = event["requestContext"]["stage"]
            
            # Parse message body to get the prompt
            body = json.loads(event.get("body", "{}"))
            prompt = body.get("prompt", "")
            
            # Create API Gateway management client for sending responses
            api_client = boto3.client(
                'apigatewaymanagementapi',
                endpoint_url=f'https://{domain}/{stage}'
            )
            
            # Call Amazon Bedrock with streaming response
            response = bedrock_client.invoke_model_with_response_stream(...)
            
            # Stream tokens back to client
            for chunk in response["body"]:
                # Extract token from chunk
                token = process_chunk(chunk)
                
                # Send token directly back through the WebSocket
                api_client.post_to_connection(
                    ConnectionId=connection_id,
                    Data=json.dumps({"token": token, "isComplete": False})
                )
            
            # Send completion message
            api_client.post_to_connection(
                ConnectionId=connection_id,
                Data=json.dumps({"token": "", "isComplete": True})
            )
            
            return {"statusCode": 200}
        

Authentication with Amazon Cognito

Securing a WebSocket API with Amazon Cognito needs a bit more work. API Gateway WebSocket doesn’t have a built-in Amazon Cognito User Pool authorizer:

  1. Lambda authorizer with JWT authentication: API Gateway invokes your Lambda authorizer upon connection, validating the Amazon Cognito JWT (passed as a query parameter). The Lambda generates an IAM policy granting access and returns it.
  2. IAM authentication for WebSockets: Clients sign requests with SigV4 using AWS credentials from an Amazon Cognito Identity Pool. API Gateway evaluates the request against IAM policies.

Pros and cons of API Gateway WebSocket APIs

Pros:

  • Bidirectional real-time communication: WebSockets are ideal for applications where the server needs to push data such as the LLM’s response without explicit requests.
  • Persistent connection for multi-turn conversations: After the initial handshake, the same connection can be reused for subsequent prompts and responses, avoiding repeated setup latency. This is great for a chat UI where the user asks multiple questions in one session.
  • Scalability: API Gateway is a managed service that can handle 500 connections/second and 10,000 requests/second across APIs, which can be increased by request.

Cons:

  • Higher development complexity: When compared to the clarity of a direct Lambda URL, a WebSocket API involves multiple Lambdas and coordination to manage the connection state.
  • Custom auth implementation: There is no built-in Amazon Cognito user pool integration, thus you must implement a Lambda authorizer.
  • Timeout management: The API Gateway integration timeout is 29 s, thus your Lambda function should return the response promptly.

AWS AppSync GraphQL subscription

AWS AppSync is a fully managed GraphQL service that streamlines building real-time APIs. It handles WebSocket connections and client fan-out automatically. Clients subscribe to a GraphQL subscription, and a Lambda resolver pushes the Amazon Bedrock streamed tokens back.

Architecture

The following figure shows the architecture.

AWS AppSync GraphQL subscription with Amazon Bedrock architecture

  1. Client calls a startStream mutation. AppSync invokes the Request Lambda.
  2. The Request Lambda immediately returns a unique sessionId and sends the processing task to an Amazon Simple Queue Service (Amazon SQS) queue.
  3. Client uses the sessionId to subscribe to an onTokenReceived GraphQL subscription.
  4. The Processing Lambda (triggered by Amazon SQS) invokes Amazon Bedrock and, for each token, calls a publishToken mutation in AWS AppSync.
  5. AWS AppSync automatically pushes the token to all clients subscribed with the matching sessionId.

Implementation steps

  1. Design the GraphQL Schema: define types and operations.
    type StreamResponse {
      sessionId: String!
      status: String!
      message: String
      timestamp: String!
      error: String
    }
    
    type TokenEvent {
      sessionId: String!
      token: String!
      isComplete: Boolean!
      timestamp: String!
    }
    
    type Mutation {
      startStream(prompt: String!): StreamResponse!
      publishToken(sessionId: String!, token: String!, isComplete: Boolean!): TokenEvent!
    }
    
    type Subscription {
      onTokenReceived(sessionId: String!): TokenEvent
    

  2. Create the Request Handler (Request Lambda)
    1. Receives the GraphQL mutation with the prompt.
    2. Generates a unique session ID.
    3. Sends the prompt and session ID to the SQS queue.
    4. Returns the session ID to the client immediately.
      def lambda_handler(event, context):
          # Extract prompt from GraphQL event
          prompt = event["arguments"]["prompt"]
          
          # Generate unique session ID
          session_id = str(uuid.uuid4())
          
          # Send message to SQS queue
          sqs_client.send_message(
              QueueUrl="your-sqs-queue-url",
              MessageBody=json.dumps({
                  "prompt": prompt,
                  "sessionId": session_id
              })
          )
          
          # Return session ID to client
          return {
              "sessionId": session_id,
              "status": "streaming_started",
              "timestamp": datetime.datetime.utcnow().isoformat()
          }
      

  3. Create the Processing Handler (Processing Lambda)
    1. It is triggered by Amazon SQS messages.
    2. It calls Amazon Bedrock with streaming enabled.
    3. For each token generated, it calls the AppSync publishToken mutation.
      def lambda_handler(event, context):
          # Process SQS event records
          for record in event["Records"]:
              body = json.loads(record["body"])
              prompt = body["prompt"]
              session_id = body["sessionId"]
              
              # Call Amazon Bedrock with streaming
              response = bedrock_client.invoke_model_with_response_stream(...)
              
              # Process streaming response
              for chunk in response["body"]:
                  # Extract token from chunk
                  token = process_chunk(chunk)
                  
                  # Publish token to AppSync
                  publish_token_to_appsync(
                      session_id=session_id,
                      token=token,
                      is_complete=False
                  )
              
              # Send completion token
              publish_token_to_appsync(
                  session_id=session_id,
                  token="",
                  is_complete=True
              )
      

  4. Configure GraphQL Resolvers
    1. StartStream resolver: Connect to the Request Lambda.
    2. PublishToken resolver: Trigger subscription with a NONE data source.
  5. Client subscription setup
    1. Make a startStream mutation.
      const { sessionId } = await client.mutate({
        mutation: START_STREAM,
        variables: { prompt }
      });
      

    2. Subscribe to receive tokens.
      client.subscribe({
        query: ON_TOKEN_RECEIVED,
        variables: { sessionId }
      }).subscribe({
        next: ({ data }) => {
          if (data.onTokenReceived.isComplete) {
            // Handle completion
          } else {
            // Append token to UI
            appendToken(data.onTokenReceived.token);
          }
        }
      });
      

Authentication with Amazon Cognito

AWS AppSync integrates seamlessly with Amazon Cognito User Pools. Setting the API’s auth mode to Amazon Cognito User Pool needs a valid JWT for every GraphQL operation. This is the most developer-friendly option for authentication. AWS AppSync handles the handshake and token refresh.

Pros and cons of AWS AppSync subscriptions

Pros:

  • Fully managed real-time protocol: You don’t deal with raw WebSockets or connection IDs at all. AWS AppSync automatically establishes and maintains a secure WebSocket for subscriptions (no need for a connect or disconnect Lambda).
  • Streamlined authentication: Built-in support for Amazon Cognito User Pool tokens means that you can secure the API without writing custom authorizers.

Cons:

  • Potential overhead and complexity: For a direct case (one prompt—one stream), introducing GraphQL and AWS AppSync might be seen as over-engineering if your app doesn’t use GraphQL for other use cases.
  • 30-second resolver limit: AWS AppSync has a 30-second limit for mutation resolvers, thus you need to design the initial request to start the process and immediately return, relying on a subscription to stream the results progressively to avoid blocking the user.

Conclusion

The Amazon Bedrock streaming interface unlocks fluid, low-latency LLM experiences. You can use the right AWS serverless architecture to deliver streamed responses in a secure, scalable, and cost-effective way.

  • Lambda function URLs with streaming: Direct, single-user applications and prototypes.
  • API Gateway WebSocket: Multi-turn conversations, collaborative applications.
  • AppSync: Complex applications already using GraphQL.

Each method is serverless, production-ready, and fully integrated with Amazon Cognito for secure access control. AWS provides the flexibility to design high-quality AI user experiences at scale.

Refer to GitHub sample source code for more details.

Comparative table

Feature LAMBDA FUNCTION URLS API GATEWAY WEBSOCKET APIs APPSYNC GRAPHQL SUBSCRIPTIONS
Complexity Lowest Medium High
Real-time focus Limited Strong Strong
Authentication Needs custom logic Needs custom logic Built-in Amazon Cognito support
Scalability Good Good Excellent
GraphQL support None None Native
Use cases Q&A Chatbots, real-time apps Complex apps, multi-user scenarios
Cost Pay per invocation Connection time and Lambda execution Request/connection-based pricing


AWS Lambda enhances event processing with provisioned mode for SQS event-source mapping

Post Syndicated from Micah Walter original https://aws.amazon.com/blogs/aws/aws-lambda-enhances-sqs-processing-with-new-provisioned-mode-3x-faster-scaling-16x-higher-capacity/

Today, we’re announcing the general availability of provisioned mode for AWS Lambda with Amazon Simple Queue Service (Amazon SQS) Event Source Mapping (ESM), a new feature that customers can use to optimize the throughput of their event-driven applications by configuring dedicated polling resources. Using this new capability, which provides 3x faster scaling, and 16x higher concurrency, you can process events with lower latency, handle sudden traffic spikes more effectively, and maintain precise control over your event processing resources.

Modern applications increasingly rely on event-driven architectures where services communicate through events and messages. Amazon SQS is commonly used as an event source for Lambda functions, so developers can build loosely coupled, scalable applications. Although the SQS ESM automatically handles queue polling and function invocation, customers with stringent performance requirements have asked for more control over the polling behavior to handle spiky traffic patterns and maintain low processing latency.

Provisioned mode for SQS ESM addresses these needs by introducing event pollers, which are dedicated resources that remain ready to handle expected traffic patterns. These event pollers can auto scale up to 1000 per concurrent executions per minute, more than three times faster than before to handle sudden spikes in event traffic and provide up to 20,000 concurrency–16 times higher capacity to process millions of events with Lambda functions. This enhanced scaling behavior helps customers maintain predictable low latency even during traffic surges.

Enterprises across various industries, from financial services to gaming companies, are using AWS Lambda with Amazon SQS to process real-time events for their mission-critical applications. These organizations, which include some of the largest online gaming platforms and financial institutions, require consistent subsecond processing times for their event-driven workloads, particularly during periods of peak usage. Provisioned mode for SQS ESM is a capability you can use to meet your stringent performance requirements while maintaining cost controls.

Enhanced control and performance

With provisioned mode, you can configure both minimum and maximum numbers of event pollers for your SQS ESM. Each event poller represents a unit of compute that handles queue polling, event batching, and filtering before invoking Lambda functions. Each event poller can handle up to 1 MB/sec of throughput, up to 10 concurrent invokes, or up to 10 SQS polling API calls per second. By setting a minimum number of event pollers, you enable your application to maintain a baseline processing capacity that can immediately handle sudden traffic increases. We recommend that you set the minimum event pollers required to handle your known peak workload requirements. The optional maximum setting helps prevent overloading downstream systems by limiting the total processing throughput.

The new mode delivers significant improvements in how your event-driven applications handle varying workloads. When traffic increases, your ESM detects the growing backlog within seconds and dynamically scales event pollers between your configured minimum and maximum values three times faster than before. This enhanced scaling capability is complemented by a substantial increase in processing capacity, with support for up to 2 GBps of aggregate traffic, and up to 20K concurrent requests—16x higher than previously possible. By maintaining a minimum number of ready-to-use event pollers, your application achieves predictable performance, handling sudden traffic spikes without the delay typically associated with scaling up resources. During low traffic periods, your ESM automatically scales down to your configured minimum number of event pollers, which means you can optimize costs while maintaining responsiveness.

Let’s try it out

Enabling provisioned mode is straightforward in the AWS Management Console. You need to already have an SQS queue configured and a Lambda function. To get started, in the Configuration tab for your Lambda function, choose Triggers, then Add trigger. This will bring up a user interface where you can configure your trigger. Choose SQS from the dropdown menu for source and then select the SQS queue you want to use.

Under Event poller configuration, you will now see a new option called Provisioned mode. Select Configure to reveal settings for Minimum event pollers and Maximum event pollers, each with defaults and minimum and maximum values displayed.

Configuration panel for SQS provisioned Mode

After you have configured Provisioned mode, you can save your trigger. If you need to make changes later, you can find the current configuration under the Triggers tab in the AWS Lambda configuration section, and you can modify your current settings there.

SQS Provisioned Poller confiig

Monitoring and observability

You can monitor your provisioned mode usage through Amazon CloudWatch metrics. The ProvisionedPollers metric shows the number of active event pollers processing events in one-minute windows.

Now available

Provisioned mode for Lambda SQS ESM is available today in all commercial AWS Regions. You can start using this feature through the AWS Management Console, AWS Command Line Interface (AWS CLI), or AWS SDKs. Pricing is based on the number of event pollers provisioned and the duration they’re provisioned for, measured in Event Poller Units (EPUs). Each EPU supports up to 1 MB per second throughput capacity per event poller, with minimum 2 event pollers per ESM. See the AWS pricing page for more information on EPU charges.

To learn more about provisioned mode for SQS ESM, visit the AWS Lambda documentation. Start building more responsive event-driven applications today with enhanced control over your event processing resources.

AWS Weekly Roundup: OpenAI models, Automated Reasoning checks, Amazon EVS, and more (August 11, 2025)

Post Syndicated from Veliswa Boya original https://aws.amazon.com/blogs/aws/aws-weekly-roundup-openai-models-automated-reasoning-checks-amazon-evs-and-more-august-11-2025/

AWS Summits in the northern hemisphere have mostly concluded but the fun and learning hasn’t yet stopped for those of us in other parts of the globe. The community, customers, partners, and colleagues enjoyed a day of learning and networking last week at the AWS Summit Mexico City and the AWS Summit Jakarta.


Last week’s launches
These are the launches from last week that caught my attention:

  • OpenAI open weight models on AWSOpenAI open weight models (gpt-oss-120b and gpt-oss-20b) are now available on AWS. These open weight models excel at coding, scientific analysis, and mathematical reasoning, with performance comparable to leading alternatives.
  • Amazon Elastic VMware Service — Amazon Elastic VMware Service (Amazon EVS), a new AWS service that lets you run VMware Cloud Foundation (VCF) environments directly within your Amazon Virtual Private Cloud (Amazon VPC), is now generally available.
  • Automated Reasoning checks — Automated Reasoning checks, a new Amazon Bedrock Guardrails policy that was previewed during AWS re:Invent, is now generally available. Automated Reasoning checks helps you validate the accuracy of content generated by foundation models (FMs) against a domain knowledge. Read more in Danilo’s post on how this can help prevent factual errors that can be caused by AI hallucinations.
  • Multi-Region application recovery service — In this post, Sébastien writes about the announcement of Amazon Application Recovery Controller (ARC) Region switch, a fully managed, highly available capability that enables organizations to plan, practice, and orchestrate Region switches with confidence, eliminating the uncertainty around cross-Region recovery operations.

Additional updates
I thought these projects, blog posts, and news items were also interesting:

Upcoming AWS events
Keep a look out and be sure to sign up for these upcoming events:

AWS re:Invent 2025 (December 1-5, 2025, Las Vegas) — AWS’s flagship annual conference offering collaborative innovation through peer-to-peer learning, expert-led discussions, and invaluable networking opportunities.

AWS Summits — Join free online and in-person events that bring the cloud computing community together to connect, collaborate, and learn about AWS. Coming up soon are the summits at São Paulo (August 13) and Johannesburg (August 20).

AWS Community Days — Join community-led conferences that feature technical discussions, workshops, and hands-on labs led by expert AWS users and industry leaders from around the world: Australia (August 15), Adria (September 5), Baltic (September 10), Aotearoa (September 18), and South Africa (September 20).

Join the AWS Builder Center to learn, build, and connect with builders in the AWS community. Browse here for upcoming in-person and virtual developer-focused events.

That’s all for this week. Check back next Monday for another Weekly Roundup!

Veliswa.

AWS Weekly Roundup: SQS fair queues, CloudWatch generative AI observability, and more (July 28, 2025)

Post Syndicated from Micah Walter original https://aws.amazon.com/blogs/aws/aws-weekly-roundup-sqs-fair-queues-cloudwatch-generative-ai-observability-and-more-july-28-2025/

To be honest, I’m still recovering from the AWS Summit in New York, doing my best to level up on launches like Amazon Bedrock AgentCore (Preview) and Amazon Simple Storage Service (S3) Vectors. There’s a lot of new stuff to learn!

Meanwhile, it’s been an exciting week for AWS builders focused on reliability and observability. The standout announcement has to be Amazon SQS fair queues, which tackles one of the most persistent challenges in multi-tenant architectures: the “noisy neighbor” problem. If you’ve ever dealt with one tenant’s message processing overwhelming shared infrastructure and affecting other tenants, you’ll appreciate how this feature enables more balanced message distribution across your applications.

On the AI front, we’re also seeing AWS continue to enhance our observability capabilities with the preview launch of Amazon CloudWatch generative AI observability. This brings AI-powered insights directly into your monitoring workflows, helping you understand infrastructure and application performance patterns in new ways. And for those managing Amazon Connect environments, the addition of AWS CloudFormation for message template attachments makes it easier to programmatically deploy and manage email campaign assets across different environments.

Last week’s launches

  • Amazon SQS Fair Queues — AWS launched Amazon SQS fair queues to help mitigate the “noisy neighbor” problem in multi-tenant systems, enabling more balanced message processing and improved application resilience across shared infrastructure.
  • Amazon CloudWatch Generative AI Observability (Preview) — AWS launched a preview of Amazon CloudWatch generative AI observability, enabling users to gain AI-powered insights into their cloud infrastructure and application performance through advanced monitoring and analysis capabilities.
  • Amazon Connect CloudFormation Support for Message Template Attachments —AWS has expanded the capabilities of Amazon Connect by introducing support for AWS CloudFormation for Outbound Campaign message template attachments, enabling customers to programmatically manage and deploy email campaign attachments across different environments.
  • Amazon Connect Forecast Editing — Amazon Connect introduces a new forecast editing UI that allows contact center planners to quickly adjust forecasts by percentage or exact values across specific date ranges, queues, and channels for more responsive workforce planning.
  • Bloom Filters for Amazon ElastiCache — Amazon ElastiCache now supports Bloom filters in version 8.1 for Valkey, offering a space-efficient way to quickly check if an item is in a set with over 98% memory efficiency compared to traditional sets.
  • Amazon EC2 Skip OS Shutdown Option — AWS has introduced a new option for Amazon EC2 that allows customers to skip the graceful operating system shutdown when stopping or terminating instances, enabling faster application recovery and instance state transitions.
  • AWS HealthOmics Git Repository Integration — AWS HealthOmics now supports direct Git repository integration for workflow creation, allowing researchers to seamlessly pull workflow definitions from GitHub, GitLab, and Bitbucket repositories while enabling version control and reproducibility.
  • AWS Organizations Tag Policies Wildcard Support — AWS Organizations now supports a wildcard statement (ALL_SUPPORTED) in Tag Policies, allowing users to apply tagging rules to all supported resource types for a given AWS service in a single line, simplifying policy creation and reducing complexity.

Blogs of note

Beyond IAM Access Keys: Modern Authentication Approaches — AWS recommends moving beyond traditional IAM access keys to more secure authentication methods, reducing risks of credential exposure and unauthorized access by leveraging modern, more robust approaches to identity management.

Upcoming AWS events

AWS re:Invent 2025 (December 1-5, 2025, Las Vegas) — AWS’s flagship annual conference offering collaborative innovation through peer-to-peer learning, expert-led discussions, and invaluable networking opportunities.

AWS Summits — Join free online and in-person events that bring the cloud computing community together to connect, collaborate, and learn about AWS. Register in your nearest city: Mexico City (August 6) and Jakarta (August 7).

AWS Community Days — Join community-led conferences that feature technical discussions, workshops, and hands-on labs led by expert AWS users and industry leaders from around the world: Singapore (August 2), Australia (August 15), Adria (September 5), Baltic (September 10), and Aotearoa (September 18).

Building resilient multi-tenant systems with Amazon SQS fair queues

Post Syndicated from Maximilian Schellhorn original https://aws.amazon.com/blogs/compute/building-resilient-multi-tenant-systems-with-amazon-sqs-fair-queues/

Today, AWS introduced Amazon Simple Queue Service (Amazon SQS) fair queues, a new feature that mitigates noisy neighbor impact in multi-tenant systems. With fair queues, your applications become more resilient and easier to operate, reducing operational overhead while improving quality of service for your customers.

In distributed architectures, message queues have become the backbone of resilient system design. They act as buffers between components, allowing services to process work asynchronously and at their own pace. When a sudden traffic spike hits your application, queues prevent cascading failures by buffering work and ensuring that downstream services aren’t overwhelmed. Amazon SQS has long been a go-to solution for developers building scalable applications because it’s a fully managed serverless solution that can seamlessly scale to ingest millions of messages per second.

In this post, you learn how to use Amazon SQS fair queues and understand their inner workings through a practical example.

Overview

Many modern applications follow a multi-tenant architecture, where a single application instance serves multiple tenants. A tenant is any entity that shares resources with others. It could be a customer, client application, or request type. This approach reduces operational costs and simplifies maintenance through efficient resource utilization. One example of such shared resources are queues and their associated consumer capacity.

However, multi-tenant systems face challenges when one tenant becomes a noisy neighbor. This tenant impacts others by overutilizing your system’s resources. With queues, this tenant causes a backlog by sending a large volume of messages or by requiring longer processing time. Regular queues deliver older messages first, which increases message dwell time for all tenants in such scenarios. This makes it difficult to maintain quality of service and forces teams to over-provision resources or build complex custom solutions.

Amazon SQS fair queues help maintain low dwell time for other tenants when there is a noisy neighbor. This happens transparently without requiring changes to your existing message processing logic. You define what constitutes a tenant in your system, and Amazon SQS handles the complex orchestration of mitigating noisy neighbor impact.

How it works

Amazon SQS continually monitors the distribution of messages received but not yet deleted (in-flight) by consumers across all tenants. When the system detects an imbalance:

  1. It identifies the noisy tenant, the one causing the queue to build a backlog.
  2. It automatically adjusts message delivery order to prioritize messages belonging to quiet (non-noisy) tenants.
  3. It maintains overall queue throughput.

Consider the following example that consists of a multi-tenant queue and four different tenants (A, B, C, and D).

In the steady state condition, the queue has no backlog, and in-flight messages are evenly distributed among tenants. All messages are consumed immediately when they land in the queue. The dwell time of messages is low for all tenants. Notice that not all consumer capacity is fully utilized in this steady state. The steady state condition is illustrated in the following diagram.

Figure 1: A multi-tenant queue in steady state condition

Figure 1: A multi-tenant queue in steady state condition

Now consider a noisy tenant scenario in which the number of messages of tenant A increases significantly and creates a backlog in the queue. Consumers are busy processing the messages mostly from tenant A, and messages from other tenants are waiting in the backlog, leading to a higher dwell time for all tenants. This noisy tenant scenario is illustrated in the following screenshot.

Figure 2: A multi-tenant queue with a noisy tenant

Figure 2: A multi-tenant queue with a noisy tenant

When a single tenant starts to occupy a significant portion of consumer resources, Amazon SQS fair queues considers this tenant as a noisy neighbor and prioritizes returning messages belonging to other tenants. This prioritization helps maintain low dwell times for quiet tenants (B, C, D), while the dwell time for tenant A’s messages will be elevated until the queue backlog is consumed—but without impacting other tenants. Fair queues are illustrated in the following diagram.

Figure 3: A multi-tenant queue with fair queues

Figure 3: A multi-tenant queue with fair queues

Amazon SQS doesn’t limit the consumption rate per tenant. Consumers can receive messages from noisy neighbor tenants when there is consumer capacity and the queue has no other messages to return. Like Amazon SQS standard queues, fair queues allow virtually unlimited throughput, and there are no limits on the number of tenants you can have in your queue.

How to use

The following is a quick overview of how to get started with Amazon SQS fair queues in your applications. See the feature documentation for a detailed walkthrough. These are the high-level steps the walkthrough follows:

  1. Enable Amazon SQS fair queues by adding a tenant identifier (MessageGroupId) to your messages
  2. Configure Amazon CloudWatch metrics to monitor Amazon SQS fair queues behavior
  3. You can use the example application to observe the Amazon SQS fair queues behavior with varying message volumes

Enable Amazon SQS fair queues by adding a tenant identifier (MessageGroupId) to your messages

Your message producers can add a tenant identifier by setting a MessageGroupId on an outgoing message:

// Send message with tenant identifier
SendMessageRequest request = new SendMessageRequest()
    .withQueueUrl(queueUrl)
    .withMessageBody(messageBody)
    .withMessageGroupId("tenant-123");  // Tenant identifier
sqs.sendMessage(request);

The new fairness capability will be applied automatically in all Amazon SQS standard queues for messages with the MessageGroupId property. It’s important to mention that it doesn’t require any change in the consumer code. It has no impact on API latency and doesn’t come with any throughput limitations.

Configure Amazon CloudWatch metrics to monitor Amazon SQS fair queues behavior

You can monitor Amazon SQS fair queues with Amazon CloudWatch metrics. The following terms are important in this context:

  • Noisy groups – A noisy message group represents a noisy neighbor tenant of a multi-tenant queue.
  • Quiet groups – Message groups excluding noisy groups.

When you use fair queues, Amazon SQS now emits the following additional metrics:

  • ApproximateNumberOfNoisyGroups
  • ApproximateNumberOfMessagesVisibleInQuietGroups
  • ApproximateNumberOfMessagesNotVisibleInQuietGroups
  • ApproximateNumberOfMessagesDelayedInQuietGroups
  • ApproximateAgeOfOldestMessageInQuietGroups

The new ApproximateNumberOfNoisyGroups metric gives the number of message groups (tenants) that are considered noisy in a fair queue. This metric helps identify the number of potential noisy neighbors in multi-tenant environments by tracking message groups consuming disproportionate resources. Use this metric to set alarms that trigger when the number of noisy groups exceeds your acceptable threshold, indicating potential queue fairness issues.

Amazon SQS already provides several standard queue-level metrics that offer approximate insights into the queue’s state, message processing, and potential bottlenecks. These metrics look at all messages in a queue. With fair queues, there’s a new set of four equivalent metrics, shown in the preceding list, that allow the exclusion of messages from noisy neighbor groups and target only quiet groups (non-noisy tenants). Hence, they all have the InQuietGroups suffix.

To monitor the effect of Amazon SQS fair queues you can compare metrics that have the InQuietGroups suffix with standard queue-level metrics. During traffic surges for a specific tenant, the general queue-level metrics might reveal increasing backlogs or older message ages. However, looking at the quiet groups in isolation, you can identify that most non-noisy message groups or tenants aren’t impacted, and you can estimate the total number of impacted message groups.

The following graph shows how the standard queue backlog metric (ApproximateNumberOfMessagesVisible) increases due to a noisy tenant while the backlog for non-noisy tenants (ApproximateNumberOfMessagesVisibleInQuietGroups) remains low.

Figure 4: Queue backlog for noisy and quiet groups

Figure 4: Queue backlog for noisy and quiet groups

While these new metrics provide a good overview of Amazon SQS fair queues behavior, it can be beneficial to understand which specific tenant is causing the load. Use Amazon CloudWatch Contributor Insights to see metrics about the top-N contributors, the total number of unique contributors, and their usage. This is especially helpful in scenarios where you’re dealing with thousands of tenants that would otherwise lead to high-cardinality data (and cost) when emitting traditional metrics. The following screenshot shows an example of a Contributor Insights dashboard on the AWS console that visualizes the top 10 contributors based on MessageGroupId.

Figure 5: Container Insights ReceivedMessagesPerMessageGroupId dashboard

Figure 5: Container Insights ReceivedMessagesPerMessageGroupId dashboard

Contributor Insights creates these metrics based on data from your application log output. Let your code log the number of messages being processed, and the corresponding MessageGroupId within your application. You can find a full example in the sample application in the next section.

Example application

To make it even more straightforward to get started, we’ve prepared an example application that you can use to observe the Amazon SQS fair queues behavior with varying message volumes. You can find the source code repository, infrastructure as code (IaC), and the instructions to run the sample on the sqs-fair-queues repository on GitHub.

The example application includes a load generator to simulate multi-tenant traffic and provides an Amazon CloudWatch dashboard that displays the most important metrics to visualize fair queue behavior. The following screenshot shows an example of the dashboard.


Figure 6: CloudWatch FairQueuesDashboard

Conclusion

Amazon SQS fair queues automatically mitigates the noisy neighbor impact in multi-tenant queues. Even when one tenant generates high message volumes or requires longer processing times (that is, becomes a noisy neighbor), the feature maintains consistent message dwell times for other tenants. When you add a tenant identifier to your messages, Amazon SQS fair queues will automatically detect and mitigate noisy neighbor impact, providing fair access to the queue for other tenants.

We recommend reviewing the Amazon SQS Developer Guide to get started and exploring the sample applications to test the behavior with varying message volumes.

Introducing AWS Lambda native support for Avro and Protobuf formatted Apache Kafka events

Post Syndicated from Julian Wood original https://aws.amazon.com/blogs/compute/introducing-aws-lambda-native-support-for-avro-and-protobuf-formatted-apache-kafka-events/

AWS Lambda now provides native support for Apache Avro and Protocol Buffers (Protobuf) formatted events with Apache Kafka event source mapping (ESM) when using Provisioned Mode. The support allows you to validate your schema with popular schema registries. This allows you to use and filter the more efficient binary event formats and share data using schema in a centralized and consistent way. This blog post shows how you can use Lambda to process Avro and Protobuf formatted events from Kafka topics using schema registry integration.

This new capability works with both Amazon Managed Streaming for Apache Kafka (Amazon MSK), Confluent Cloud and self-managed Kafka clusters. To get started, update your existing Kafka ESM to Provisioned Mode and add schema registry configuration, or create a new ESM in Provisioned Mode with schema registry integration enabled.

Avro and Protobuf

Many organizations use Avro and Protobuf formats with Apache Kafka because these binary serialization formats offer advantages over JSON. They provide 50-80% smaller message sizes, faster serialization and deserialization performance, robust schema evolution capabilities, and strong typing across multiple programming languages.Working with these formats in Lambda functions previously necessitated custom code. Developers needed to implement schema registry clients, handle authentication and caching, write format-specific deserialization logic, and manage schema evolution scenarios.

What’s new

Lambda’s Kafka Event Source Mapping (ESM) now provides built-in integration with AWS Glue Schema Registry, Confluent Cloud Schema Registry, and self-managed Confluent Schema Registry. When you configure schema registry settings for your Kafka ESM, the service automatically validates incoming JSON Schema, Avro, and Protobuf records against their registered schema. This moves complex schema registry integration logic from your application layer to the managed Lambda service.

You can build your function with Kafka’s open-source ConsumerRecords interface using Powertools for AWS Lambda to get your Avro or Protobuf generated business objects directly. Optionally you can specify to get your records in the JSON format, where your function receives clean, validated JSON data regardless of the original serialization format, removing the need for custom deserialization code in your Lambda functions. This also allows you to create Kafka consumers across multiple programming languages.

Powertools for AWS Lambda is a developer toolkit that provides specific support for Java, .NET, Python, and TypeScript, maintaining consistency with existing Kafka development patterns. You can directly access business objects without custom deserialization code.

You can also setup filtering rules to discard irrelevant, JSON, Avro or Protobuf formatted events before function invocations, which can improve processing performance and reduce costs.

How schema validation works

When you configure schema registry integration for your Kafka ESM, you specify the registry endpoint, authentication details, and which event fields (key, value, or both) to validate. The ESM polls your Kafka topics for records as usual but now performs additional processing before invoking your Lambda function.For each incoming event, the ESM extracts the schema ID embedded in the serialized data. It fetches the corresponding schema from your configured registry. This process happens transparently, with schema definitions cached for up to 24 hours to optimize performance. The ESM identifies the format of your events using schema metadata and validates the event structure. It keeps either the original binary data or deserializes it to JSON format based on your customer configuration and sends it to your function for processing.


Figure 1: Kafka processing flow diagram.

The ESM handles schema evolution automatically. When producers begin using new schema versions, the service detects the updated schema IDs and fetches the latest definitions from your registry. This makes sure that your functions always receive properly deserialized data without requiring code changes.

Event record format

As a part of the ESM schema registry configuration, you need to specify Event Record Format, which Lambda uses to deliver validated records to your function. The schema registry configuration supports SOURCE and JSON.

SOURCE preserves the original binary format of the data as a base64-encoded string with producer-appended schema-id removed. This allows direct conversion to Avro or Protobuf objects so that you can use Kafka’s ConsumerRecords interface for a Kafka-like experience. Use this format when working with strongly typed languages or when you need to maintain the full capabilities of Avro or Protobuf schemas. Then, you can use any Avro or Protobuf deserializer to convert raw bytes to your business object. Powertools provides native support for this deserialization.

With JSON, the ESM deserializes the data ready for direct use in languages with native JSON support. Use this when you don’t need to preserve the original binary format or work with generated classes. You can also use Powertools to convert the base64 to your business object. See the documentation for payload formats and deserialization behavior.

If you configure filtering rules, then they operate on the JSON-formatted events after deserialization. This upstream filtering prevents unnecessary Lambda invocations for events that don’t match your processing criteria, directly reducing your compute costs.

Configuration and setup

To use this feature, you must enable Provisioned Mode for your Kafka ESM, which provides the dedicated compute resources needed for schema registry integration.

You can configure the integration through the AWS Management ConsoleAWS Command Line Interface (AWS CLI)AWS Language SDKs, or infrastructure as code (IaC) tools such as the AWS Serverless Application Model (AWS SAM) or AWS Cloud Development Kit (AWS CDK).

Your schema registry configuration includes the registry endpoint URL, authentication method (AWS Identity and Access Management (IAM) for AWS Glue Schema Registry, or Basic Auth, SASL/SCRAM, or mTLS for Confluent registries), and validation settings. You specify which event attributes to validate and optionally define filtering rules using standard Lambda event filtering syntax.

For error handling, configure Lambda failure destinations where events that fail schema validation or deserialization are sent. This makes sure that problematic events don’t disappear silently but are routed to other services such as Amazon Simple Queue Service (Amazon SQS), Amazon Simple Notification Service (Amazon SNS), and Amazon S3 for debugging and analysis.

Seeing the new features in action

There are a number of Serverless Patterns that you can use to process Kafka streams using Lambda. This example uses the Java pattern.

Deploy a sample Amazon MSK cluster

To set up an Amazon MSK cluster, follow the instructions in the GitHub repo and create a new AWS CloudFormation stack using the MSKAndKafkaClientEC2.yaml template file. The stack creates the Amazon MSK cluster, along with a client Amazon EC2 instance, to manage the Kafka cluster. There are costs involved when running this infrastructure.

  1. Connect to the EC2 instance using EC2 Instance Connect.
  2. Check that the Kafka topic is created by checking the contents of the kafka_topic_creator_output.txt file.
    cat kafka_topic_creator_output.txt

  3. The file should contain the text: “Created topic MskIamJavaLambdaTopic.”

Deploy the Glue schema registry and consumer Lambda function

The EC2 instance contains the software needed to deploy the schema registry and Lambda function.

  1. Change directory to the pattern directory.
    cd serverless-patterns/msk-lambda-iam-java-sam
  2. Build the application using AWS SAM.
    sam build
  3. To deploy your application for the first time, run the following in the EC2 instance shell:
    sam deploy --capabilities CAPABILITY_IAM --no-confirm-changeset \
    	--no-disable-rollback --region $AWS_REGION --stack-name msk-lambda-schema-avro-java-sam --guided

  4. You can accept all the defaults by hitting Enter. You can browse to the AWS Glue schema registry console and view the ContactSchema definition:
    {
      "type": "record",
      "name": "Contact",
      "fields": [
        {"name": "firstname", "type": "string"},
        {"name": "lastname", "type": "string"},
        {"name": "company", "type": "string"},
        {"name": "street", "type": "string"},
        {"name": "city", "type": "string"},
        {"name": "county", "type": "string"},
        {"name": "state", "type": "string"},
        {"name": "zip", "type": "string"},
        {"name": "homePhone", "type": "string"},
        {"name": "cellPhone", "type": "string"},
        {"name": "email", "type": "string"},
        {"name": "website", "type": "string"}
      ]
    }
    

    The consumer Lambda function ESM is configured for Provisioned Mode.

  5. View the ESM configuration from the Lambda console for the Lambda function name prefixed with msk-lambda-schema-avro-ja-LambdaMSKConsumer.
  6. Choose the MSK Lambda trigger which opens the Triggers pane under Configuration.
    Figure 2: View Lambda ESM schema configuration
  7. The configuration specifies using the Event record format SOURCE so your function can use Kafka’s native open-source ConsumerRecords interface. Powertools then deserializes the payload.
  8. The schema validation attribute is VALUE.
  9. The ESM filter configuration only processes the records that match zip codes of 2000.
  10. In your function code, specify the open-source Kafka ConsumersRecords interface by including Powertools for Lambda as a dependency. ConsumerRecords provides metadata about Kafka records and allows you to get direct access to your Avro/Protobuf generated business objects without requiring any additional deserialization code.
package com.amazonaws.services.lambda.samples.events.msk;

import com.amazonaws.services.lambda.runtime.Context;
import com.amazonaws.services.lambda.runtime.RequestHandler;
import org.apache.kafka.clients.consumer.ConsumerRecord;
import org.apache.kafka.clients.consumer.ConsumerRecords;
import org.slf4j.Logger;
import org.slf4j.LoggerFactory;
import software.amazon.lambda.powertools.kafka.Deserialization;
import software.amazon.lambda.powertools.kafka.DeserializationType;
import software.amazon.lambda.powertools.logging.Logging;

public class AvroKafkaHandler implements RequestHandler<ConsumerRecords<String, Contact>, String> {
    private static final Logger LOGGER = LoggerFactory.getLogger(AvroKafkaHandler.class);

    @Override
    @Logging(logEvent = true)
    @Deserialization(type = DeserializationType.KAFKA_AVRO)
    public String handleRequest(ConsumerRecords<String, Contact> records, Context context) {
        LOGGER.info("=== AvroKafkaHandler called ===");
        LOGGER.info("Event object: {}", records);
        LOGGER.info("Number of records: {}", records.count());
        
        for (ConsumerRecord<String, Contact> record : records) {
            LOGGER.info("Processing record - Topic: {}, Partition: {}, Offset: {}", 
                       record.topic(), record.partition(), record.offset());
            LOGGER.info("Record key: {}", record.key());
            LOGGER.info("Record value: {}", record.value());
            
            if (record.value() != null) {
                Contact contact = record.value();
                LOGGER.info("Contact details - firstName: {}, zip: {}", 
                           contact.getFirstname(), contact.getZip());
            }
        }
        
        LOGGER.info("=== AvroKafkaHandler completed ===");
        return "OK";
    }
}
Produce and consumer records

To send messages to Kafka, there is a LambdaMSKProducerJava function.

  1. Invoke the function from the Lambda console or CLI within the EC2 instance.
    sam remote invoke LambdaMSKProducerJavaFunction --region $AWS_REGION \
    	--stack-name msk-lambda-schema-avro-java-sam

  2. You can view the Producer logs to see the 10 records produced.The consumer Lambda function processes the records.
  3. View the consumer Lambda function logs using the Amazon CloudWatch logs console or CLI within the EC2 instance.
    sam logs --name LambdaMSKConsumerJavaFunction \
    	--stack-name msk-lambda-schema-avro-java-sam --region $AWS_REGION

The Lambda function processes and logs only the records that match the filter FILTER. The Avro binary data is deserialized using Powertools for AWS Lambda. You should see the function logs showing each record processed with the decoded keys and values.


Figure 3: Lambda consumer logs showing Avro processing

Cleaning up

You can clean up the example Lambda function by running the sam delete command.

sam delete

If you created the Amazon MSK cluster and EC2 client instance, then navigate to the CloudFormation console, choose the stack, and choose Delete.

Performance and cost considerations

Schema validation and deserialization can add processing time before your function invocation. However, this overhead is typically minimal when compared to the benefits. ESM caching minimizes schema registry API calls. Using filtering allows you to reduce costs, depending on how effectively your filtering rules eliminate irrelevant events. This feature simplifies the operational overhead of managing schema registry integration code so teams can focus on business logic rather than infrastructure concerns.

Error handling and monitoring

If schema registries become temporarily unavailable, then cached schemas allow event processing to continue until the registry is available again. Authentication failures generate error messages with automatic retry logic. Schema evolution happens seamlessly as Lambda automatically detects and fetches new versions.

If events fail validation or deserialization, they are routed to your configured failure destinations. For Amazon SQS and Amazon SNS destinations, the service sends metadata about the failure. For Amazon S3 destinations, both metadata and the original serialized payload are included for detailed analysis.

You can use standard Lambda monitoring, with more CloudWatch metrics providing visibility into schema validation success rates, registry API usage, and filtering effectiveness.

Conclusion

AWS Lambda now supports Avro and Protobuf formats for Kafka event processing in Provisioned Mode for Kafka ESM. This enables schema validation, event filtering, and integration with both Amazon MSK, Confluent, and self-managed Kafka clusters. Whether you’re building new Kafka applications or migrating existing consumers to Lambda, this native schema registry integration streamlines processing pipelines.

For more information about the Lambda Kafka integration capabilities, go to the learning guide, Lambda ESM documentation. To learn about Lambda pricing, such as Provisioned Mode costs, visit the Lambda pricing page.

For more serverless learning resources, visit Serverless Land.

PackScan: Building real-time sort center analytics with AWS Services

Post Syndicated from Sairam Vangapally original https://aws.amazon.com/blogs/big-data/packscan-building-real-time-sort-center-analytics-with-aws-services/

Amazon manages a complex logistics network with multiple touch points, from fulfillment centers to sort centers to final customer delivery. Among these, sort centers play a crucial role in the middle mile, providing faster and more efficient package movement. Within Amazon’s Middle Mile operations, high-volume sort centers process millions of packages daily, making immediate access to operational data essential for optimizing efficiency and decision-making. Real-time visibility into key metrics—such as package movements, container statuses, and associate productivity—is critical for smooth logistics operations. To address the need for real-time operational planning, the Amazon Middle Mile team developed PackScan, a cloud-based platform designed to provide instant insights across the network. By significantly reducing data latency, PackScan enables proactive decision-making, so teams can monitor inbound package flows, optimize outbound shipments based on live data, track associate productivity, identify bottlenecks, and enhance overall operational efficiency—all in real time.

In this post, we explore how PackScan uses Amazon cloud-based services to drive real-time visibility, improve logistics efficiency, and support the seamless movement of packages across Amazon’s Middle Mile network.

Prerequisites

This post assumes a foundational understanding of the following services and concepts:

Although hands-on experience is not required, a conceptual understanding of these services will help in understanding the architecture, design patterns, and components discussed throughout the article.

Business challenges

Amazon’s sort centers handle over 15 million packages daily across more than 120 facilities in North America. Given this scale, even minor delays in operational insights can lead to inefficiencies, increased costs, and escalations. Traditionally, data latencies of up to an hour have restricted the ability to make proactive decisions, directly affecting productivity, resource allocation, and responsiveness—especially during peak periods like holiday seasons and big deal days.

Without immediate visibility into package movements, container statuses, and associate performance, operational teams face challenges in identifying and resolving bottlenecks in real time. The lack of timely insights can disrupt the flow of packages, leading to shipment delays, reduced throughput, and suboptimal facility performance. Addressing these inefficiencies required a solution capable of delivering real-time, high-fidelity data to support rapid decision-making.

To bridge this gap, Amazon’s Middle Mile organization needed a scalable platform that could enhance visibility, minimize latency, and provide up-to-the-minute insights into logistics operations. PackScan was designed to meet these demands, giving teams access to the real-time data necessary to optimize workflows, mitigate bottlenecks, and improve overall efficiency.

Data flow

In 2024, PackScan was deployed across 80 sort centers in the USA, enabling real-time package analytics. The solution powers Grafana dashboards, which refresh every 10 seconds by fetching live package data from OpenSearch Service. With this near real-time visibility, operations teams can monitor package movement and sorting efficiency across sort centers. The following diagram outlines how package scan data is ingested, processed, and made actionable.

Each sort center is equipped with hardware at inbound stations where packages arrive from trailers. Integrated barcode scanners automatically scan each package as it enters the sorting process. Every scan generates an SNS event, capturing key attributes such as the package ID, dimensions, the associate who performed the scan, and the timestamp and location of the scan.

After they’re generated, these SNS events are ingested into Data Firehose through a Lambda function, where the data undergoes real-time enrichment. During this process, additional attributes are appended, including the business logic rules. The enriched data is then streamed into OpenSearch Service, where events are indexed to enable fast and efficient querying. With the indexed package scan events available in OpenSearch Service, real-time analytics and monitoring become possible. The Grafana dashboards query this data every 10 seconds, providing operational insights into package inflow metrics and associate performance.

Solution overview

PackScan was implemented using a structured and scalable approach, using AWS cloud-based services to enable high-frequency data ingestion, real-time processing, and actionable insights. The architecture is designed to minimize latency while providing reliability, scalability, and operational efficiency. The solution is built around a serverless, event-driven architecture that dynamically scales based on data ingestion volumes. The architecture—illustrated in the following figure—enabled us to build a real-time data solution, utilizing the advantages of various AWS services to provide low-latency analytics, high scalability, and real-time operational insights across Amazon’s sort centers.

The following are the key components and features of the solution:

  • Real-time data processing – Lambda functions serve as the processing backbone of the system, handling 500,000 scan events per second. Each incoming event is processed by applying data transformations, enrichment, and validation before passing it downstream.
  • High-frequency data ingestion and streaming – Data Firehose is the primary ingestion pipeline, handling millions of scan events daily from thousands of barcode scanners across multiple sort centers. The Firehose streams handle incoming data of 12,000 PUT requests per second, maintaining smooth ingestion and low-latency streaming. Data retention policies are set to buffer and forward enriched events every 60 seconds or upon reaching 5 MB batch size, optimizing storage and processing efficiency.
  • Optimized querying and operational insights – OpenSearch Service is used to index and store the processed scan events, providing real-time querying and anomaly detection. The OpenSearch cluster consists of 12 data nodes (r5.4xlarge.search) and 3 primary nodes (r5.large.search), processing up to 10 GB of data per day with a rolling index strategy, where indexes are rotated every 24 hours to maintain query performance. The system supports concurrent queries per second, enabling logistics teams to perform rapid lookups and gain instant visibility into package movements.
  • Live visualization and dashboarding – Grafana, hosted on an m5.12xlarge EC2 instance, provides real-time visualization of key logistics metrics. The dashboards refresh every 10 seconds, querying OpenSearch and displaying up-to-the-minute package analytics. The setup includes multiple preconfigured dashboards, monitoring package flow at different inbound stations, and workforce efficiency. These dashboards support concurrent users, enabling supervisors and associates to track and optimize operations proactively. The following screenshot shows one of the real-time dashboards, with details of package flow by different routes within sort centers.

The entire PackScan architecture is designed for automatic scaling, adjusting dynamically based on data ingestion volume to maintain efficiency during peak and off-peak operations. This approach provides cost-effective resource utilization while maintaining high availability and performance.

Business outcomes

The implementation of PackScan has led to measurable improvements in operational efficiency, workforce productivity, and real-time decision-making across Amazon’s sort centers. By reducing data latency and enabling real-time insights, PackScan has transformed logistics operations in meaningful ways:

  • Widespread deployment – PackScan was deployed across 80 sort centers, supporting approximately 1,000 display monitors that provide real-time operational insights.
  • Significant reduction in data latency – Data latency dropped from approximately 1 hour to less than 1 minute, allowing for real-time operational responsiveness and minimizing workflow disruptions.
  • Proactive operational management – With dynamic workload balancing and instant bottleneck identification, supervisors can now address issues as they arise, leading to smoother operations and fewer escalations.
  • Boost in workforce productivity – The real-time performance feedback has enhanced associate engagement, resulting in a 25% increase in throughput per hour and 12% reduction in labor hours.

Overall, PackScan has redefined real-time logistics visibility within Amazon’s Middle Mile operations, empowering operational teams with actionable insights, enhanced workforce efficiency, and a data-driven approach to package movement and sort center performance.

Lessons learned and best practices

The deployment and scaling of PackScan provided valuable insights into optimizing real-time logistics visibility. Several key lessons and best practices emerged from this implementation:

  • Cloud architecture drives efficiency – Adopting Amazon technologies provides seamless scalability, reduced operational overhead, and lower infrastructure costs, while maintaining high reliability. The following table shows an approximate breakdown of monthly service costs observed in production. This is an estimation based on current pricing; we recommend checking the respective AWS service pricing pages to generate the most up-to-date quote. This architecture demonstrates that with combination of provisioned and serverless design, production-ready solutions can be built and scaled at a fraction of the cost of traditional infrastructure.
AWS Service Description Estimated Monthly Cost
Amazon EC2 Three EC2 instances of type m5.12xlarge hosting Grafana $1,700
AWS Lambda Streams SNS events to Data Firehose $4,000
Amazon Data Firehose Real-time data delivery with 12,000 records streaming to OpenSearch Service $1,500
Amazon OpenSearch Service Indexing and querying package scan events $28,000
  • Real-time visibility is a game changer – Immediate access to operational data enhances agility, enabling teams to make timely, data-driven decisions that prevent bottlenecks and improve throughput.
  • Continuous monitoring enhances decision-making – Operational dashboards should evolve with business needs. Regular monitoring and updates provide accuracy, usability, and relevance in driving informed decision-making.

By applying these best practices, PackScan has set a foundation for scalable, real-time logistics management, making sure that Amazon’s Middle Mile operations remain proactive, efficient, and highly responsive to changing business demands.

Conclusion

PackScan has successfully transformed real-time operational visibility within Amazon’s sort centers, addressing critical challenges in data latency, workforce productivity, and logistics efficiency. By using AWS services, particularly Data Firehose for real-time data delivery and OpenSearch Service for analytics, PackScan has enabled proactive decision-making, streamlined operations, and enhanced throughput in high-volume sort environments. Looking ahead, future enhancements will focus on further elevating operational intelligence and scalability, including:

  • Integrating predictive analytics to anticipate workflow bottlenecks and optimize resource allocation
  • Scaling the solution across additional operational scenarios, providing greater resilience and adaptability to dynamic logistics environments

With these advancements, PackScan will continue to drive operational excellence, cost-efficiency, and real-time decision-making capabilities, reinforcing Amazon’s commitment to innovation in logistics and supply chain management.

For those interested in implementing similar solutions, we recommend exploring AWS Serverless Architecture Patterns and the AWS Architecture Blog for additional insights and best practices in building scalable, real-time analytics solutions.


About the authors

Sairam Vangapally is a Data Engineer at Amazon with extensive experience architecting real-time, large-scale data platforms that power critical logistics operations across North America. He has led the design and deployment of end-to-end data pipelines, enabling high-throughput ingestion, transformation, and analytics at scale. He is passionate about building resilient data infrastructure and driving cross-functional collaboration to deliver solutions that accelerate operational insights and business impact.

Nitin Goyal serves as a Data Engineering Manager in Amazon’s Sort Center organization, where he leads initiatives to optimize operational efficiency across North American facilities. With over nine years of tenure at Amazon spanning multiple teams, he specializes in architecting high-performance data systems, with particular emphasis on real-time streaming pipelines, artificial intelligence, and low-latency solutions. His expertise drives the development of sophisticated operational workflows that enhance sort center productivity and effectiveness.

Serverless ICYMI 2025 Q1

Post Syndicated from Julian Wood original https://aws.amazon.com/blogs/compute/serverless-icymi-2025-q1/

Welcome to the 28th edition of the AWS Serverless ICYMI (in case you missed it) quarterly recap. At the end of a quarter, we share the most recent product launches, feature enhancements, blog posts, videos, live streams, and other interesting things that you might have missed!

In case you missed our last ICYMI, check out what happened in Q4 2024 here.

Serverless calendar Q1 2025

Serverless calendar Q1 2025

AWS Step Functions

The AWS Step Functions team continues to improve developer experience. Workflow Studio is now available within Visual Studio Code (VS Code) through the AWS Toolkit extension.

AWS Step Functions in IDE

AWS Step Functions in IDE

You can now design, test, and deploy your Step Functions workflows without leaving your IDE. The extension provides a drag-and-drop interface with all the familiar Workflow Studio capabilities, making it even easier to build state machines locally.

To get started, install the AWS Toolkit for Visual Studio Code and visit the user guide on Workflow Studio integration.

Step Functions private integrations now allows you to integrate applications seamlessly across private networks, on-premises infrastructure, and cloud platforms. Learn more in a blog post and explanation video.

AWS Step Functions private integrations video

AWS Step Functions private integrations video

Step Functions now integrates with 36 more AWS services that support user messaging capabilities. You can orchestrate notifications through Amazon SNS, Amazon SQS, Amazon EventBridge, Amazon Pinpoint, and more, all using the optimized integrations you’re familiar with.

Step Functions has increased the default quota for state machines and activities from 10,000 to 100,000 per AWS account. This tenfold increase means you can create more workflows to automate your business processes without worrying about hitting quota limits.

Distributed Map is expanding capabilities by adding support for JSON Lines (JSONL) format. JSONL, a highly efficient text-based format, stores structured data as individual JSON objects separated by newlines, making it particularly suitable for processing large datasets.

AWS Step Functions Distributed Map

AWS Step Functions Distributed Map

Distributed Map can also process data from a broader range of delimited file formats stored in Amazon S3 and offers new output transformations for greater control over result formatting.

Developer Tools

Serverless Land patterns are now available directly within VS Code.

You no longer need to switch between your IDE and external resources when building serverless architectures. Browse, search, and implement pre-built serverless patterns directly in VS Code.

Example Serverless Pattern

Example Serverless Pattern

AWS Lambda

Learn how AWS Lambda handles billions of invocations.

AWS Lambda asynchronous invocations

AWS Lambda asynchronous invocations

This blog post provides recommendations and insights for implementing highly distributed applications based on the Lambda service team’s experience building its robust asynchronous event processing system. It dives into challenges you might face, solution techniques, and best practices for handling noisy neighbors.

A new video walks through using the enhanced local IDE experience for Lambda developers.

AWS Lambda new IDE experience

AWS Lambda new IDE experience

The VS Code extension for Lambda now supports live tailing of CloudWatch Logs directly in your IDE following on from previous support for Live Tail in the Lambda console. Watch logs in real-time as your functions execute, making debugging and troubleshooting more efficient than ever.

You can now enable Application Performance Monitoring (APM) for Java and .NET runtimes using Amazon CloudWatch Application Signals.

Amazon CloudWatch Application Signals for Java and .NET AWS Lambda runtimes

Amazon CloudWatch Application Signals for Java and .NET AWS Lambda runtimes

This provides deep visibility into your function’s performance, including method-level tracing, memory profiling, and automated anomaly detection.

Amazon Bedrock features

Multi-agent collaboration is now available in Bedrock as a preview, enabling you to create systems where multiple AI agents work together to solve complex problems. Agents can specialize in different domains, share context, and coordinate their actions to achieve goals that would be difficult for a single agent.

RAG evaluation is now generally available. This provides metrics to assess and improve your retrieval augmented generation pipelines. GraphRAG for Bedrock Knowledge Bases is now generally available, allowing you to enhance retrievals with graph-based context.

Amazon Bedrock Flows now supports multi-turn conversations, allowing you to build dynamic AI applications that maintain context across multiple user interactions. Bedrock data automation is now generally available, streamlining the process of preparing, ingesting, and maintaining data for your GenAI applications. Bedrock now offers LLM-as-a-judge capability for model evaluation, providing automated assessment of model outputs without requiring human reviewers. Compare different models or prompt strategies against your specific criteria at scale.

Bedrock’s capabilities are now integrated into the Amazon SageMaker Unified Studio, creating a seamless experience for machine learning practitioners who want to incorporate foundation models into their workflows. Access Bedrock models, fine-tuning, and evaluation directly from SageMaker.

Amazon Nova is a new generation of state-of-the-art foundation models that deliver frontier intelligence and industry leading price-performance. Nova has expanded its tool use and converse API capabilities, making it easier for developers to build AI assistants that can use external tools to complete tasks.

Amazon Bedrock Guardrails image content filters are now generally available. Define and enforce boundaries for your AI applications with controls for both text and image content, ensuring outputs align with your organization’s policies.

Bedrock Knowledge Bases now supports using your existing OpenSearch clusters as the vector storage backend. This integration allows you to leverage your investments in OpenSearch while benefiting from the managed RAG capabilities of Bedrock.

New Amazon Bedrock models

  • Anthropic’s Claude 3.7 Sonnet hybrid reasoning allows you to toggle between standard and extended thinking modes. In standard mode, it functions as an upgraded version of Claude 3.5 Sonnet. While in extended thinking mode, it employs self-reflection to achieve improved results across a wide range of tasks.
  • DeepSeek R1, an advanced model specialized in research and scientific reasoning excels at complex problem-solving tasks and technical content generation.
  • Cohere Embed 3 models are now available in both multilingual and English-specific versions. These embedding models support text and images, providing more accurate representation for multimodal content and improving retrieval augmented generation (RAG) applications.
  • Ray2, Luma AI’s new visual AI model is capable of creating realistic visuals with fluid, natural movement. You can use it for image understanding, 3D scene reconstruction, and visual content generation, opening new possibilities for immersive and visual applications.
  • Bedrock now supports fine-tuning of Meta’s latest Llama 3.2 models. These upgraded models deliver improved performance across reasoning, coding, and multilingual tasks while being more efficient with computational resources.

Amazon Q Developer

Amazon Q Developer is now available as a CLI agent, bringing AI-assisted development to the command line. Get contextual recommendations, generate shell commands, and solve coding problems without leaving your terminal.

Amazon Q CLI

Amazon Q CLI

Amazon Q Developer transformation now supports upgrading Java applications using Maven to Java 21. It offers enhanced code suggestions, refactoring, and optimization recommendations for applications using the latest Java features, like virtual threads and pattern matching.

AWS AppSync

AWS AppSync Events now supports events publishing for WebSocket APIs, enabling real-time publish-subscribe functionality. This feature makes it easier to build applications requiring instant updates, like chat applications, collaborative tools, and real-time dashboards.

AWS AppSync Events

AWS AppSync Events

There are new AWS Cloud Development Kit (AWS CDK) L2 constructs for AppSync WebSocket APIs. These make it simpler to define and deploy real-time APIs using infrastructure as code. These high-level constructs handle the details of WebSocket connections, authorization, and messaging patterns.

Amazon SNS

Amazon SNS now supports high throughput mode for SNS FIFO topics, with default throughput matching SNS standard topics. When you enable high-throughput mode, SNS FIFO topics will maintain order within message group, while reducing the de-duplication scope to the message-group level.

Amazon EventBridge

Amazon EventBridge now supports direct delivery to targets across AWS accounts, simplifying multi-account architectures. This reduces latency and improves reliability when routing events between accounts in your organization.

Amazon EventBridge cross account

Amazon EventBridge cross account

The EventBridge console now features event source discovery, making it easier to find and visualize available event sources in your AWS environment. This tool helps you identify potential event producers and understand the event schemas they emit.

AWS Amplify

AWS Amplify now offers a TypeScript data client optimized for server-side Lambda functions, providing type-safe access to your data sources. This client reduces code complexity and improves reliability when working with databases and APIs in server environments.

Serverless compute blog posts

January

February

March

Serverless Office Hours weekly livestream

February

March

Still looking for more?

The Serverless landing page has more information. The Lambda resources page contains case studies, webinars, whitepapers, customer stories, reference architectures, and even more Getting Started tutorials.

You can also follow the Developer Advocacy team members who work on Serverless to see the latest news, follow conversations, and interact with the team.

And finally, visit the Serverless Land  for all your serverless needs.

Optimizing network footprint in serverless applications

Post Syndicated from Chris McPeek original https://aws.amazon.com/blogs/compute/optimizing-network-footprint-in-serverless-applications/

This post is authored by Anton Aleksandrov, Principal Solution Architect, AWS Serverless and Daniel Abib, Senior Specialist Solutions Architect, AWS

Serverless application developers may commonly encounter scenarios where they need to transport large payloads, especially when building modern cloud applications that need rich data. Examples include analytics services with detailed reports, e-commerce platforms with extensive product catalogs, healthcare applications transmitting patient records, or financial services aggregating transactional data.

Many serverless services have a well-defined maximum payload size. For example, AWS Lambda maximum request/response payload size is 6 MB, and Amazon Simple Queue Service (Amazon SQS) and Amazon EventBridge maximum message size is 256 KB. In this post, you will learn how to use data compression techniques to reduce your network footprint and transport larger payloads under existing constraints.

Overview

Cloud applications evolve continuously and need to be adjusted frequently for new requirements, such as new business features or new Service Level Objectives (SLO) for higher throughput and lower latency. As new use cases and data patterns are added, it is common to see request and response payload sizes increase. At some point, you might hit the maximum service payload size limits, such as 6 MB for synchronous Lambda function invokes, 10 MB for Amazon API Gateway, and 256 KB for Amazon SQS, EventBridge, and asynchronous Lambda invokes.

There are several techniques you can apply when dealing with large payloads. If your payloads are tens of MBs or more, or you need to transport large binary objects with API Gateway, you can store the payload on Amazon Simple Storage Service (Amazon S3) and use pre-signed URLs for clients to directly upload and download from S3.

A sample of architecture for handling large payloads.

Figure 1. A sample of architecture for handling large payloads

Lambda function URLs response streaming supports up to 20 MB responses. For handling large messages with services such as SQS or EventBridge, you can store the message in S3 and pass a reference. The downstream consumer will use the reference to download the message directly from S3. One common characteristic of these techniques is that they introduce architectural complexity and may necessitate modifications to your existing solution architecture and data flow patterns.

Furthermore, as your payloads grow in size, you will see increased data transfer costs, especially if your solution is transporting data through Amazon Virtual Private Cloud (VPC) NAT Gateways, VPC endpoints, or sending data across AWS Regions. For example, it is common for VPC-based solutions to have Lambda functions in their architecture. A container running on Amazon Elastic Kubernetes Service (Amazon EKS) might need to invoke a Lambda function, or a VPC-attached Lambda function might need to reach out to the public internet.

Examples of using virtual network appliances with serverless applications.

Figure 2. Examples of using virtual network appliances with serverless applications

Both NAT Gateway and VPC Endpoint are billed per GB of data processed, which makes data compression a valuable optimization technique. Go to NAT Gateway pricing and VPC Endpoint pricing for details.

The following sections explore data compression techniques and demonstrate how to apply them in your serverless applications. You can learn how to send larger payloads within the existing payload size boundaries and reduce your network footprint without significant architectural changes. This post discusses compression techniques in the context of Lambda and API Gateway, but the same principles can be applied to other services, such as SQS, EventBridge, and AWS AppSync. Understanding compression concepts better equips you to optimize your application’s data-handling capabilities.

What is data compression?

Compression is a widely used approach to reduce data size in order to improve cost-effectiveness and performance for data storage and transmission. Many tools and frameworks incorporate data compression techniques, such as gzip or zstd. It is thoroughly documented in the official IANA specification and IETF RFC 9110. Browsers such as Chrome and Firefox, HTTP toolkits such as curl and Postman, and runtimes such as Node.js and Python natively handle compression, often without user involvement.

Consider HTTP protocol. When a client wants to send a compressed payload, it specifies it in the Content-Type header. To receive a compressed response, the client specifies supported compression methods in the Accept-Encoding request header.

Accept-Encoding request header specifying supported compression methods.

Figure 3. Accept-Encoding request header specifying supported compression methods

The server compresses the response payload using one of the supported methods and uses the Content-Encoding response header to indicate the method to the client.

Content-Encoding response header specifying compression method.

Figure 4. Content-Encoding response header specifying compression method

This mechanism can accelerate client-server communications by reducing the number of bytes transmitted over the network. Compression efficiency depends on the data type. Text-based formats like JSON, XML, HTML, and YAML compress well, while binary data such as PDF and JPEG generally compress less effectively.

Data compression with API Gateway

API Gateway provides built-in compression support. Use the minimumCompressionSize configuration to set the smallest payload size to compress automatically. The value can be between 0 bytes to 10 MB. Compressing very small payloads might actually increase the final payload size, and you should always test with your real payload patterns to determine the optimal threshold.

Handling data compression in API Gateway.

Figure 5. Handling data compression in API Gateway

API Gateway enables clients to interact with your API using compressed payloads through supported content encodings. The compression mechanism works bi-directionally. For JSON payloads, API Gateway seamlessly handles compression and decompression, maintaining compatibility with mapping templates. It decompresses incoming payloads before applying request mapping templates and compresses outgoing responses after applying response mapping templates. This automated compression optimizes data transfer:

  • When sending compressed data, clients supply the appropriate Content-Encoding header. API Gateway handles the decompression and applies configured mapping templates before forwarding the request to the integration.
  • When API Gateway receives an integration response and compression is enabled, it compresses the response payload and returns it to the client, provided that the client has included a matching Accept-Encoding header.

A sample test using the compression technique with API Gateway and JSON payload yielded the following results.

  • Compression disabled. Response size = 1 MB, response latency = 660 ms
  • Compression enabled. Response size = 220 KB, response latency = 550 ms

Compressing data resulted in 78% network footprint reduction and improved latency by 110 ms.

This configuration-based technique uses the API Gateway native compression. However, payloads are decompressed before being delivered to downstream integrations, thus they still remain subject to Lambda’s 6 MB max payload size. To address this, you can configure binaryMediaTypes in the API Gateway to pass compressed payloads to Lambda directly, enabling the function to handle decompression.

CDK code to configure API Gateway for data compression and binary data passthrough.

Figure 6. CDK code to configure API Gateway for data compression and binary data passthrough

Handling compressed data in Lambda functions

The Lambda Invoke API supports payloads in plain-text formats, such as JSON. The maximum payload size is 6 MB for synchronous invocations and 256 KB for asynchronous. Although the Invoke API supports uncompressed text-based payloads, you can introduce data compression in your function code and use API Gateway or Function URLs to facilitate content conversion, as illustrated in the following figure.

Transporting compressed payloads in a serverless applications.

Figure 7. Transporting compressed payloads in a serverless applications

Handling data compression in your Lambda function code can be done through libraries commonly embedded in the runtime. The following code snippet shows the compressing response payload using Node.js. Similar techniques can be applied to other runtimes.

Sample code implementing response payload compression in a Lambda function.

Figure 8. Sample code implementing response payload compression in a Lambda function

  • Line 1: Import gzip functionality from the zlib module.
  • Lines 11: Compress and Base64-encode data. Gzip compression, similar to many other compression methods, produces a binary stream. Base64 encoding converts it to the text-based format expected by the Lambda service
  • Lines 13-21: Response object is created with isBase64Encoded=true and response headers telling the client that the response is a gzip-encoded JSON object.

The following screenshot shows the result: 20 MB uncompressed JSON returned from a Lambda function as a 2.5 MB compressed response body. Network footprint reduced by over 80%.

A screenshot from Postman showing the original and compressed payload size.

Figure 9. A screenshot from Postman showing the original and compressed payload size

Using this technique, you can reduce your network footprint and transport payload sizes several times higher than the Lambda maximum payload size.

Using Function URLs with compressed payloads

Transporting compressed payloads through Lambda Function URLs doesn’t necessitate any extra configuration. For handler responses, your code needs to compress and Base64-encode the data as shown in the preceding figure. For invocation requests, the Function URL endpoint recognizes the incoming compressed payload as binary and passes it to your handler as a Base64 encoded string in the event body.

Sample code implementing request payload decompression in a Lambda function.

Figure 10. Sample code implementing request payload decompression in a Lambda function

Trade-offs and testing results

Compressing data in function code is a CPU-intensive activity, potentially increasing invocation duration and, as a result, function cost. This, however, can be balanced by the benefits of data compression. As you’ve seen in previous sections, while compressing data adds compute latency, transporting smaller payloads over the network reduces network latency. The following section summarizes a series of tests performed to estimate the impact of data compression on Lambda function invocation duration, Lambda function invocation cost, and data transfer savings with both NAT Gateway and VPC Endpoint. The tests were performed with several assumptions and randomly generated JSON data. You can see full testing results in the sample GitHub.com repo.

Test results demonstrated that the impact on function latency and cost primarily depends on two key factors: payload size and allocated memory (which determines vCPU capacity). Using a Node.js runtime with ARM architecture as an example, compressing a 1 MB JSON object in a function with 1 GB of allocated memory resulted in 124 ms of added processing time on average. For 10 million invocations, this extra processing time adds approximately $16. At the same time, the compression yielded a 70% reduction in payload size. With the same number of invocations, this translates to approximately $300 in savings when using NAT Gateway and $70 in savings when using VPC Endpoints (depending on the number of Availability Zones (AZs)).

AWS Service pricing is updated regularly, you should always consult the respective pricing pages for the latest information. Moreover, you should conduct your own performance and cost estimates using payloads that represent your workloads. Compression effectiveness varies significantly depending on the data type: payloads with low compression rates might not benefit from this technique.

Sample application

Follow the instructions in this GitHub repository to provision the sample in your AWS account. The project creates two Lambda functions to demonstrate receiving and returning compressed JSON using Function URLs and API Gateway.

The sample shows how to GET and POST JSON payloads using gzip compression to reduce the network footprint by over 80%.

A screenshot from Postman showing the original and compressed payload size.

Figure 11. A screenshot from Postman showing the original and compressed payload size

Conclusion

Data compression enables larger payload transfers and reduces network footprint. It can help to lower network latencies and optimize data transfer costs. When implementing compression within Lambda functions, it is important to consider its CPU-bound nature, which may increase function duration and costs. You should always evaluate the added compute cost against potential data transfer savings to make sure the technique benefits your use case.

Compression is most effective for handling large text-based payloads and when a slight increase in compute latency balanced by reduced network latency is acceptable.

To learn more about Serverless architectures and asynchronous Lambda invocation patterns, see Serverless Land.

WellRight modernizes to an event-driven architecture to manage bursty and unpredictable traffic

Post Syndicated from John Lee original https://aws.amazon.com/blogs/architecture/wellright-modernizes-to-an-event-driven-architecture-to-manage-bursty-and-unpredictable-traffic/

WellRight is a leading comprehensive corporate wellness platform provider that helps organizations and employees drive meaningful outcomes through personalized wellness programs. The platform increases engagement and benefit utilization by delivering engaging challenges across multiple dimensions of wellness, from physical activities like step tracking to mental health initiatives and team-building exercises.

In this post, we share how WellRight optimized the cost and performance of their application through a ground-up modernization to an event-driven architecture.

The challenge

WellRight’s infrastructure often experiences bursty and unpredictable traffic patterns. For instance, clients can upload bulk user data at any time, which can impact tens of thousands of users, which then cascade into millions of changes. WellRight’s legacy monolithic infrastructure had several challenges when faced with such traffic:

  • Multiple processes such as registration, progress calculation, and reward distribution relied on a single server, leading to a noisy neighbor problem.
  • Certain core services were isolated to avoid the noisy neighbor problem, but with high burst workloads, auto scaling didn’t react fast enough to meet the demand. This led to queues backing up with millions of requests. In addition, the database also had to be overprovisioned to avoid throttling, adding to the overall cost.
  • Parts of the application were not designed with auto scaling in mind, leading to overprovisioning of resources.

The following figure shows the Number of Messages Received metric from a sample Amazon Simple Queue Service (Amazon SQS) queue. WellRight would often receive burst of events at an unpredictable time.

A line graph showing the number of messages received in an SQS queue, with a sharp spike amid otherwise zero activity.

Solution overview

To address the challenges, WellRight made the strategic decision to transition to an event-driven architecture using fully managed AWS services. WellRight’s platform is driven by asynchronous state changes that propagate through multiple wellness programs, which is well suited for an event-driven architecture and can be broken down into microservices. Managed services such as AWS Lambda, Amazon SQS, and Amazon DynamoDB were appealing because they would eliminate the need to manage servers and allow WellRight to focus on core business logic and reduce the operational burden to their engineering team. It also has the added benefit of avoiding overprovisioning of infrastructure or continuously right-sizing resources. Each microservice would scale automatically as needed with no manual efforts, minimizing costs. The loosely coupled architecture would allow the WellRight team to be flexible, being able to add or make modifications to existing programs without affecting existing workflows.

Design

WellRight’s initial event-driven architecture was centered around using serverless and fully managed services. DynamoDB was used as a primary data store for user information. For instance, when a user makes progress on their step challenge, the update in the DynamoDB table would propagate through DynamoDB Streams to Amazon EventBridge. Then, the event would be routed to the appropriate SQS queue, which functions as a buffer and provides fault tolerance to the events. A Lambda function would then process individual user metrics and update the Programs table. The Programs table uses DynamoDB Streams to send out updates using Amazon Simple Notification Service (Amazon SNS), keeping users informed about their progress and rankings.

The following diagram illustrates the flow of an event after a user update.

The first iteration of the event-driven architecture fared better than the monolithic legacy application, but the bursty nature of the traffic was still an issue. Lambda functions triggered by SQS queues scaled rapidly, handling requests in under 15 minutes that previously required 30 servers and took hours to process. Lambda provided WellRight the scalability that they needed, but the rapid scaling introduced a new challenge. This resulted in the throttling of DynamoDB and reaching Lambda concurrency limits during times of extremely high load, which led to many unprocessed messages in the dead-letter queue (DLQ).

Maximum concurrency solution

In January 2023, AWS introduced the maximum concurrency feature for Lambda functions using Amazon SQS as an event source. This new feature allowed WellRight to control the concurrency of their Lambda functions for each SQS queue. Prior to this launch, Lambda functions would continue to scale as long as there were messages in the SQS queue. At times, Lambda functions would scale to its concurrency limits, resulting in it throttling itself. However, with this feature in place, the scaling Lambda functions would not exceed the set maximum concurrency value. This provided WellRight fine-grained control over the overall throughput of the system. WellRight would adjust the maximum concurrency value as needed to protect downstream processes from being overwhelmed, while responding to customer requests in a timely manner.

The following screenshot of the Lambda console shows the maximum concurrency for the function is set to 100 for an SQS trigger.

An AWS Lambda configuration screen showing a trigger from an SQS progress-calculation-queue with maximum concurrency set to 100, alongside a diagram illustrating the SQS to Lambda connection.

WellRight converted all Amazon SQS to Lambda integrations to use this feature. This provided WellRight with full control over the throughput of customer requests while preventing overloading the system. With the maximum concurrency feature, WellRight reduced failed processed messages by 99%, and eliminated DynamoDB throttling events. The feature was enabled for all Amazon SQS and Lambda integrations, including those without scaling issues, as a safeguard for potential future scaling demands.

Performance and cost savings

WellRight’s event-driven architecture significantly improved their ability to handle bursty and unpredictable traffic patterns. The managed serverless services can scale instantaneously to handle these traffic spikes, providing a seamless experience for their clients. With their previous legacy architecture, clients experienced lags in challenge progress, leaderboards, and reward processing.

Now, clients continue to upload updates with over 1 million entries at any time, and WellRight can maintain up-to-the-minute leaderboards and reward processing. The transition to the new architecture has also yielded significant cost savings for WellRight. Prior to the serverless architecture, their baseline architecture required several large Amazon Elastic Compute Cloud (Amazon EC2) instances to handle the initial burst of traffic. After implementing the event-driven architecture, WellRight reduced their costs by 70% on the progress calculation service.

Future plans

WellRight is currently in the process of rolling out the new event-driven architecture to the remaining clients. By the end of 2024, WellRight plans to retire the majority of their remaining servers, further reducing their infrastructure costs.

Conclusion

WellRight’s transition to an event-driven architecture on AWS has been a successful endeavor. By using fully managed services such as Lambda, Amazon SQS, and DynamoDB, they have been able to handle bursty and unpredictable traffic patterns efficiently, while providing a seamless experience for their clients. The introduction of maximum concurrency for Lambda functions has been a game changer, allowing WellRight to control the throughput of their Lambda functions and avoid overwhelming downstream resources.

Overall, the event-driven architecture has enabled WellRight to scale efficiently, improve performance, and reduce costs of their progress calculation service by over 70%. As they continue to optimize their serverless architecture and migrate remaining clients, WellRight is well-positioned to further enhance their platform and provide an exceptional experience to their customers.

To learn more about building event-driven architectures, including key concepts, best practices, AWS services, and getting started resources, visit Serverless Land.


About the authors

Create a serverless custom retry mechanism for stateless queue consumers

Post Syndicated from Kaizad Wadia original https://aws.amazon.com/blogs/architecture/create-a-serverless-custom-retry-mechanism-for-stateless-queue-consumers/

Serverless queue processors like AWS Lambda often exist in architectures where they pull messages from queues such as Amazon Simple Queue Service (Amazon SQS) and interact with downstream services or external APIs in a distributed architecture. Robust retry approaches are necessary to provide reliable message processing due to the susceptibility of these downstream services to short-term outages or throttling. This often requires implementing special retry logic with features like dead-letter queues (DLQs) and exponential backoff to handle these cases gracefully, making sure that the downstream systems don’t get overwhelmed by too many retries.

In this post, we propose a solution that handles serverless retries when the workflow’s state isn’t managed by an additional service.

Solution overview

Some custom retry logic is required when Lambda functions interact with downstream services after consuming messages from SQS queues. This strategy involves the usage of Amazon EventBridge Scheduler and code in Lambda. The core concept is to implement a robust retry mechanism for handling failed message processing attempts using an EventBridge scheduler. When a Lambda function encounters a problem while processing a message, it triggers a specific error. Upon catching this error in a catch block, the function generates an EventBridge schedule. As a result, the message is sent back to the SQS queue and will be available for processing again at a specified future time.

In this approach, the retry mechanism can have a fine-grained level of control over the retry timing that might also support various techniques, including exponential backoff and linear retry intervals. This approach separates the retry logic from the code to process the message itself, making the Lambda function performant. Along with handling messages when all retries are exhausted, this solution interfaces with a DLQ to keep such messages separate from the main queue.

The following diagram illustrates the solution architecture.

The error handling and retry choice logic in the Lambda function code form the basis for how this custom retry mechanism is implemented. If there is an error while processing the message, the function raises a specific exception. Raising the exception then initiates the retry flow. A try-catch block catches this exception and calls a function that interfaces with the EventBridge Scheduler API to build a custom schedule. To configure the schedule, we include the destination SQS queue and the intended timestamp when the message is meant to be retried. We can change the delay with some code modifications depending on a number of parameters, such as error type, number of prior retries, or other custom backoff schemes.

As part of this approach, we use SQS message attributes for idempotency and to track retries. On each retry, the function adds the new timestamp to an array in the message body. If the function consumes the message more times than the maximum retry limit (determined by the array of retry attempts) it sends the message to the DLQ without rescheduling.

The solution also involves the integration of a DLQ so that it doesn’t keep messages in the main processing queue and be retried forever. The Lambda function will register messages with the DLQ in case of either exceeding the maximum retry limit or when certain error scenarios require it to stop early. This queue keeps all communications that have failed until such a time they can be manually reviewed, reprocessed, or even corrected.

Considerations and best practices

There are a few key factors to keep in mind while putting this custom retry system into practice. One aspect is handling partial failures, that is, processing where only part of the steps are complete. In such cases, we could use some form of compensating action or rollback to maintain consistency in data and avoid discrepancies downstream of the queue consumer.

Another crucial factor is controlling retry limits. Although the system design allows for variable retry limits, we must balance resource usage and resilience. Too many retries might cause higher costs and lead to slowdowns or service degradation. That is why we recommend that appropriate retry limits are set, considering probable failure rates, SLAs, and business consequences of failures.

We must also consider that EventBridge Scheduler has a granularity of 1 minute, and there is additional latency between the queue and the function, so the mechanism will not be completely precise. In principle, the scheduler sets the minimum time before which the message can be processed, making sure the Lambda function adheres to the rate limits at a minimum. This could also result in additional delays, so the mechanism would need to be adjusted for time-sensitive applications to account for these delays.

Because the solution might deal with variable volumes of messages and processing loads, scaling issues are also important. For example, the Lambda concurrency and retention period for the queue represent resource configurations we should monitor and adjust for optimal performance and cost.

Finally, we need to consider security as part of the solution. If the downstream service runs in a virtual private cloud (VPC), we would also need to place the Lambda function in the VPC. In this case, we would need to access EventBridge Scheduler through AWS PrivateLink, which enables secure and performant access to services from within a VPC.

Additionally, it is important to implement the AWS Identity and Access Management (IAM) roles (mainly the Lambda function role) with the principal of least privilege, which gives it access to create the EventBridge schedule (and iam:PassRole to give the scheduler the required permissions) as well as pass the scheduler’s IAM role to it. The scheduler’s role only needs permission to place a message into the source queue. We also need to give the function access to place a message in the DLQ and receive messages from the source queue.

Monitoring and troubleshooting

The custom retry mechanism demands efficient monitoring and debugging. With that in mind, we might view various behaviors of the system and identify potential problems by using Amazon CloudWatch logs and metrics.

The number of invocations of Lambda functions, related error rates, runtimes, and use of DLQ are the key indicators that we should monitor. It would be worth setting up alarms in CloudWatch to send an alert or initiate automated actions when the Lambda function’s metrics surpass certain predetermined thresholds. By doing this, we proactively detect and resolve certain issues pertaining to the function.

Also, we can examine logs of the Lambda function for certain error situations, retry patterns, or problems with the downstream services or with the retry logic itself. We can place logging lines judiciously in the function code to record pertinent information, including message attributes, retry attempts, and error details.

Future enhancements

There are some improvements we could consider to enhance the capabilities and flexibility of the suggested approach even further, which provides a foundation to customize retry mechanisms.

A possible improvement would be to introduce dynamic retry intervals depending on the conditions of a downstream service or kinds of errors. Instead of being based on predefined backoff schemes, the system might dynamically adjust the retry intervals based on specific error types detected or in-service health monitoring in real time. This concept’s principal disadvantage is additional complexity, which might cause the failure of the retry process itself.

Another potential enhancement is the integration of the system with external configuration services such as Amazon DynamoDB or Parameter Store, a capability of AWS Systems Manager. That way, we can handle the retry configurations centrally and dynamically to provide ease of maintenance and modification in retry strategies without having to redeploy the Lambda function code.

It would also be possible to build in advanced error analysis and reporting into the system. The system would then have the potential to provide key insights for root cause analysis and proactive remediation through comprehensive reporting, patterns of errors analyzed, and failures correlated with downstream service health.

Conclusion

It is often challenging to build scalable, robust serverless applications that might need to talk with external services. However, the proposed solution using Lambda, Amazon SQS, and EventBridge Scheduler brings a simple yet effective solution to implement customized retry mechanisms. It gives the developer fine-grained control over the retry interval, supports scenarios such as exponential backoff, and works seamlessly with DLQs for persisting failures and EventBridge Scheduler for delayed retries of messages. The mechanism can also be reused more broadly for stateless queue consumers, not only for Lambda functions. This pattern enables developers to implement robust, fault-tolerant serverless systems that handle disruptions in downstream services gracefully.


About the Author

How Nielsen uses serverless concepts on Amazon EKS for big data processing with Spark workloads

Post Syndicated from Shani Adadi Kazaz original https://aws.amazon.com/blogs/architecture/how-nielsen-uses-serverless-concepts-on-amazon-eks-for-big-data-processing-with-spark-workloads/

Nielsen Marketing Cloud, a leading ad tech company, processes in one of their pipelines 25 TB of data and 30 billion events daily. As their data volumes grew, so did the challenges of scaling their Apache Spark workloads efficiently.

Nielsen’s team faced a scenario in which, as they scaled up their cluster by adding more instances, the performance per instance degraded. The degradation resulted in a decrease in the amount of work done per hour by each instance, and drove costs per GB of data processed up.

Furthermore, they encountered occasional data skew issues. Data skew, where data is unevenly distributed across partitions, created processing bottlenecks and further reduced cluster efficiency. In extreme cases, these combined factors led to cluster failures.

In this post, we follow Nielsen’s journey to build a robust and scalable architecture while enjoying linear scaling. We start by examining the initial challenges Nielsen faced and the root causes behind these issues. Then, we explore Nielsen’s solution: running Spark on Amazon Elastic Kubernetes Service (Amazon EKS) while adopting serverless concepts.

Evolving from a Spark cluster to Spark pods on Amazon EKS

Nielsen’s Marketing Cloud architecture began as a typical Spark cluster on Amazon EMR, receiving a constant stream of files of varying sizes to process. As both data volume and cluster size grew, the team noticed a degradation in performance per instance, as illustrated in the following graphs. Beyond the slower processing and the higher costs, Nielsen occasionally suffered production issues caused by data skew.

GB/Instance/Hour Compared to Cluster SizeCost to Process 1 GB of Data

The team realized the problem was the growing number of remote shuffles between instances as the cluster grew. Remote shuffle, a process in Spark where data is redistributed across partitions, involves significant data transfer over the network and can become a major bottleneck. Due to the streaming nature of the data in their scenario, Nielsen realized they could instead process data in smaller batches. This meant they didn’t have to lean on the distributed processing capabilities of Spark by using large Spark clusters, and opt for small ones instead.

To address the performance degradation, the team decided to change its growth strategy: instead of scaling up their single Spark cluster, they scaled out using multiple local mode Spark clusters (a single node cluster) running on Amazon EKS. When compared to Spark cluster mode, local mode provides better performance for small analytics workloads. Each local mode is running a limited, smaller amount of data, requiring no remote shuffle and no interaction with other Spark instances.

Moreover, the pods running on Amazon EKS can scale up and down based on the amount of pending work, meaning Nielsen could stop resources when they are not needed.

The new solution scales linearly, is 55% cheaper, and handles data faster, even under large burst conditions.

Why shuffle matters

Remote shuffle is triggered when data needs to be exchanged between Spark instances. Some transformations, like join or repartition, necessitate a shuffle of data. Remote shuffle is an order of magnitude slower than in-memory computations because it requires moving data over the network. It could slow down processing significantly, sometimes adding 100–200% to the total processing time.

The problem Nielsen ran into was that as cluster size grew, the amount of data shuffled grew proportionally to the cluster size. The following graph shows why this happens. It calculates the amount of data exchanged for a randomly distributed dataset as cluster size grows.

The following graph illustrates that the correlation is to the size of the cluster and not to the size of the data.

% of Data Shuffled vs Cluster Size

Addressing shuffle

The team hypothesized that minimizing shuffle could lead to substantial performance improvements. Nielsen’s engineers decided to implement ideas from serverless patterns by drastically reducing the size of each cluster to a minimum while at the same time adding more of these smaller clusters to compensate for the lower capacity of each one. This approach promised to eliminate remote shuffle entirely for each data work item, as illustrated in the preceding graph.

Although this strategy promised performance gains, it also introduced a constraint: a limit on the amount of data per work item.

Designing the new system based on serverless patterns

Nielsen’s team developed a new architecture that uses two core concepts:

  • A queue of work items to pull from
  • A group of local mode Spark modules pulling work items from the queue

They had the following design goals:

  • Keep the Spark modules busy at all times
  • Stop modules when not needed
  • Make sure all work items are processed successfully

The following diagram illustrates the workflow.

Work items Queue

Final design

The final design includes the following components:

  • File metadata storage – An Amazon Relational Database Service (Amazon RDS) cluster runs the PostgreSQL engine to store and manage statistics about each file entering the system.
  • Work manager – An AWS Lambda function is used to periodically pull waiting files from the database, prepare work items comprised of one or multiple files, and publish the work items to an Amazon Simple Queue Service (Amazon SQS) message queue.
  • Work queue – An SQS message queue is used for work items waiting to be pulled for processing.
  • Processing units – Local mode Spark instances run as pods on an EKS cluster. They pull work items from the SQS queue. As long as there are waiting work items in the queue, the pods are constantly busy.
  • Metrics adaptor – An adaptor (Kubernetes-cloudwatch-adapter) provides Amazon CloudWatch metrics to the Kubernetes Horizontal Pod Autoscaler.
  • Kubernetes Horizontal Pod Autoscaler – Horizontal Pod Autoscaler (HPA) uses a scaling rule to scale pods up or down based on the metrics from CloudWatch. It scales according to the number of messages (work items) visible in the queue, which are proportional to the work waiting to be processed. In Nielsen’s system, HPA scales the pods by targetValue = {SQS length/2}. .
  • Work completion queue – A second SQS message queue is used for reporting completion of work items. The completions get pulled by another Lambda function and get updated in the PostgreSQL database.

The following diagram illustrates the architecture of the final system.

Full architecture

⁠Analyzing the results

The following graphs demonstrate the EKS pods scaling based on the amount of work items. The active pods pick up new work items as soon as they finish their previous ones.

Analyzing - Messages and Spark Pods

The following graph shows a large burst of data coming in. The system reacts quickly and scales up to process the added work. It quickly scales down when work is complete.

Analyzing - Messages, Spark Pods and EC2 Instances

Analyzing the performance achieved per instance, the new system demonstrated a significant improvement. Performance per instance increased by approximately 130% while growing linearly and maintaining close to constant costs per GB processed.

The comparison of performance between the new system and the old system can be seen in the following graph.

Throughput - MB/Hour

The new system’s costs are 55% lower for the same amount of data processed.

The following graphs compare the costs before and after the implementation.

Cost Comparison

Conclusion

Nielsen’s journey from a traditional architecture to a serverless-inspired architecture on Amazon EKS exemplifies the power of rethinking established patterns in big data processing.

By addressing the core challenges of data shuffle and scaling, Nielsen not only achieved performance gains and cost reductions, but also demonstrated the potential for linear scaling in large-scale data operations.

If you have big data processing jobs that that can be broken down into many independent small parts, consider using similar ideas over Amazon EKS to achieve linear scaling and large cost savings.

This post was copyedited for grammar, spelling, capitalization, punctuation, terminology, and legal issues. Other important issues are noted in comments, and you should consider revising the content accordingly before publication.


About the Authors

Introducing cross-account targets for Amazon EventBridge Event Buses

Post Syndicated from Chris McPeek original https://aws.amazon.com/blogs/compute/introducing-cross-account-targets-for-amazon-eventbridge-event-buses/

This post is written by Anton Aleksandrov, Principal Solutions Architect, Serverless and Alexander Vladimirov, Senior Solutions Architect, Serverless

Today, Amazon EventBridge is announcing support for cross-account targets for Event Buses. This new capability allows you to send events directly to targets, such as Amazon Simple Queue Service (Amazon SQS), AWS Lambda, and Amazon Simple Notification Service (Amazon SNS), located in other accounts.

Previously, EventBridge supported cross-account event delivery from an event bus in one account to an event bus in another account. This launch extends that capability and allows you to configure the source event bus to deliver events directly to all EventBridge supported targets in other accounts, not just event buses. This removes the need for an additional event bus in the target account.

Overview

Event-driven architectures built with EventBridge allow you to create solutions spanning many company departments and business domains, while remaining asynchronous and loosely coupled. As solutions grow, you may need to send events across account boundaries.

For example, you may have a set of event buses hosted in multiple accounts that are dispatching security-related events to an Amazon SQS queue hosted in a centralized account for further asynchronous processing and analysis.

Previously, EventBridge rules allowed you to define targets in the same account. The only target type that supported cross-account event delivery was another event bus. If you wanted to send events across account boundaries, you had to create event buses in both source and target accounts. After, you would configure a rule on the source event bus to send events to the target bus, and another rule on the target event bus to deliver the event to a desired target in the target account. Alternatively, a Lambda function or SNS topic could be used as a bridging mechanism to send events across accounts.

The following diagram illustrates what an architecture of cross-account event delivery looked like before the new capability. A “bridging” component, like another event bus, SNS topic, or Lambda function, was required to send events from one account to another.

Delivering cross-account events from source bus to target bus.

Figure 1: Delivering cross-account events from source bus to target bus

With this new EventBridge feature, you can deliver events from the source event bus to the desired targets in different accounts directly. This simplifies the architecture and persmission model. It also reduces latency in your event-driven solutions by having fewer components processing events along the path from source to targets.

Delivering cross-account events to target directly.

Figure 2: Delivering cross-account events to target directly

Configuring EventBridge delivery rule targets for cross-account event delivery

Enabling cross-account event delivery should be done with security in mind. You must establish mutual trust between the source and the target. Source event bus rules must have an AWS Identity and Access Management (IAM) role that allows them to send events to specific targets. This is achieved by attaching an execution role to the delivery rule targets.

Event delivery targets hosted in different accounts must have a resource access policy attached that explicitly allows receiving events from the execution role used in the source account. Due to this requirement, you can enable cross-account event delivery only for targets that support resource access policies, such as Amazon SQS queues, Amazon SNS topics, and AWS Lambda functions.

Having both an IAM role in the source account and resource policy in the target account allows you to have fine-grained control over which principals are allowed to use the PutEvents action and under which conditions. You can define service control policies (SCPs) to set organizational boundaries determining who can send and receive events in your organization.

As illustrated in the following diagram, consider Team A owns the source account (Account A). Team A is responsible for setting up the source event bus, its execution role, rules, and targets. Teams B and C own the target accounts (Account B and Account C, accordingly). Both teams manage their respective target accounts. For example, creating delivery targets, such as SQS queues, and granting permissions to accept events from the event bus in the source account. This approach enables Team A to manage the centralized source event bus for other teams, and Teams B and C to control who can send events to their targets. It provides high degree of overall control and governance.

A cross-team collaboration sending events from source account to target account targets.

Figure 3: A cross-team collaboration sending events from source account to target account targets

The following example describes setting up cross-account event delivery to an SQS queue. You can apply the same technique to other target types as well, such as Lambda functions or SNS topics.

See the following diagram for a conceptual architectural layout and resource creation order.

Permissions required for cross-account event delivery.

Figure 4: Permissions required for cross-account event delivery

Assuming the source event bus already exists, there are three general steps in setting up cross-account event delivery:

  1. Target account – create the delivery target, such as an SQS queue.
  2. Source account – configure a rule for cross-account event delivery. Set the target SQS queue ARN as rule target, and attach an execution role with permissions to send messages to the target SQS Queue.
  3. Target account – apply a resource policy to the target SQS queue allowing the source event bus execution role to send events.

Showing cross-account delivery in action

Follow the instructions in this GitHub repository for provisioning the sample in your AWS accounts using AWS Serverless Application Model (AWS SAM). An event bus rule in the source account sends events directly to an SQS queue, a Lambda function, and an SNS topic in a target account. You must have two accounts for the sample to work.

The sample project architecture, delivering events cross-account to Lambda, SQS, and SNS.

Figure 5: The sample project architecture, delivering events cross-account to Lambda, SQS, and SNS.

Make sure you enter a valid email address as SnsSubscriptionEmail value and confirm your email subscription once target stack is deployed.

After deployment, open the EventBridge console in the source account. Navigate to the newly created event bus, which has “SourceEventBus” in its name. Use the Send Events functionality to publish sample events, as shown in the following screenshot. Make sure that the Source of your events is set to “test”.

Sending test event.

Figure 6: Sending test event

Validate that the events are successfully delivered to all three cross-account targets. Open the target account in a different browser or an incognito window:

  1. Navigate to the SQS console. Open the newly created queue, which has “TargetSqsQueue” in its name.
  2. Choose Send and Receive messages then choose Poll for messages. You can see the events sent in the previous step.Receiving test event with SQS.Figure 7: Receiving test event with SQS
  3. Navigate to Amazon CloudWatch Logs. Open the Log Group for the newly created Lambda function, which has “TargetLambdaFunction” in its name. It shows events sent in the previous step.
    Receiving test event with Lambda.Figure 8: Receiving test event with Lambda
  4. Check your email. If you have confirmed the SNS topic subscription during the sample code deployment, it shows the events sent in the previous step.Receiving test event with SNS.Figure 9: Receiving test event with SNS

Conclusion

The new EventBridge capability allows you to deliver events directly to targets across account boundaries. This capability helps to simplify your event-driven architectures, as well as improve latency by reducing the number of components processing your events as they travel from event buses to their destinations.

Refer to the EventBridge pricing page to learn more about cross-account events delivery costs.

For additional documentation, refer to Amazon EventBridge documentation. Get the sample code used in this blog from this GitHub repository.

For more serverless learning resources, visit Serverless Land.

Serverless ICYMI Q4 2024

Post Syndicated from Eric Johnson original https://aws.amazon.com/blogs/compute/serverless-icymi-q4-2024/

Welcome to the 27th edition of the AWS Serverless ICYMI (in case you missed it) quarterly recap. At the end of a quarter, we share the most recent product launches, feature enhancements, blog posts, webinars, live streams, and other interesting things that you might have missed!

In case you missed our last ICYMI, check out what happened in Q2 here.

Calendar showing October through December 2024

2024 Q4 calender

Serverless at re:Invent 2024

AWS re:Invent 2024 had 60,000 in-person attendees and 400,000 online viewers for the keynotes. The conference delivered 1,900 sessions from 3,500 speakers and included 546 AWS service and feature announcements.

The serverless content consisted of two tracks: Serverless (SVS) and App Integration (API). These tracks included 70 unique sessions and attracted nearly 11,000 attendees. Serverlesspresso, the coffee shop powered by serverless technology, operated in two locations during the event: the Expo Hall and the certification lounge.

Crowd of people standing around the AWS reI:nvent expo hall waiting to order coffee at the Serverlesspresso booth.

Serverlesspresso booth in the expo hall

Videos are available on Serverless Land YouTube.

AWS Lambda and Amazon Elastic Container Service (Amazon ECS) 10-year anniversary.

AWS marked significant milestones in serverless computing, celebrating 10 years of AWS Lambda and Amazon ECS. Lambda now serves over 1.5 million monthly customers and processes tens of trillions of requests each month. Amazon ECS launches more than 2.4 billion container tasks weekly and is used by over 65% of new AWS container customers.

AWS is commemorating this anniversary with insights from AWS Serverless Heroes, product leads, principal engineers, and AWS leadership sharing their perspectives on serverless evolution and future directions. These stories and insights are available at https://aws.amazon.com/serverless/10th-anniversary/.

AWS Lambda

The AWS Lambda team has spent a significant amount of time improving the Lambda development experience. Several enhancements have been made in the console as well as the local development experience.

Screen capture of the new AWS Lambda console with Code-OSS

Code-OSS as the new AWS Lambda inline editor

Lambda has launched a significant upgrade to its console by integrating Code-OSS, the open-source version of Visual Studio Code, delivering a familiar development experience directly in the cloud. The new Lambda Code Editor supports viewing larger function packages up to 50 MB, features a split-screen interface for simultaneous code editing and testing, and includes built-in Amazon Q Developer AI assistance for real-time coding suggestions. This enhancement comes at no additional cost and prioritizes accessibility with features like screen reader support and keyboard navigation. The update bridges the gap between cloud and local development by simplifying the process of downloading function code and AWS SAM templates, ultimately providing developers with a more streamlined and familiar serverless development experience. Watch the video explaining the changes in detail.

Additionally, the Lambda console enhances developer experience with two new features: a built-in CloudWatch Metrics Insights dashboard that surfaces key function metrics, and CloudWatch Logs Live Tail support for real-time log streaming and analysis, enabling faster troubleshooting without leaving the Lambda environment.

Screen capture of the new top 10 functions in the new AWS Lambda console

Top 10 Functions

Lambda now supports native JSON structured logging for .NET managed runtime applications, improving log searchability and analysis capabilities without requiring manual configuration of logging libraries.

Lambda has expanded its runtime support by adding Python 3.13 and Node.js 22 as both managed runtimes and container base images, providing access to the latest language features and ensuring long-term support through October 2029 and April 2027, respectively.

Lambda SnapStart capability is now available for Python and .NET runtimes, delivering sub-second startup performance for latency-sensitive applications by caching initialized execution environments.

Diagram of how SnapStart works compared to not having SnapStart

SnapStart support comparison

New CloudWatch metrics for Lambda Event Source Mappings provide enhanced visibility into event processing states for Amazon Simple Queue Service (SQS), Amazon Kinesis, and Amazon DynamoDB event sources, helping customers monitor and troubleshoot event processing issues.

Lambda introduces Provisioned Mode for Kafka event source mappings, allowing customers to optimize throughput by configuring dedicated event polling resources for applications with stringent performance requirements.

Finally, Lambda introduces an enhanced local development experience through the AWS Toolkit for Visual Studio Code, streamlining the serverless application development workflow. The update features a new Application Builder interface that guides developers through environment setup, offers sample applications, and provides quick-action buttons for common tasks like build, deploy, and invoke operations. Developers can now efficiently iterate on their code with features such as configurable build settings, step-through debugging, and the ability to sync local changes quickly to the cloud or perform full deployments. The toolkit integrates with AWS Infrastructure Composer for visual application building and includes comprehensive local testing capabilities with shareable test events. This enhancement simplifies the Lambda development process by enabling developers to author, test, debug, and deploy serverless applications without leaving their preferred IDE environment.

Screen capture of the getting started experience for serverless in a local IDE

Local IDE getting started

Amazon ECS and AWS Fargate

AWS enhances observability for containerized applications with CloudWatch Application Signals for Amazon ECS, adding infrastructure metrics correlation to existing traces and logs monitoring, enabling operators to identify and resolve performance issues across their application stack.

Amazon ECS adds service revision and deployment history tracking, allowing customers to monitor changes, track ongoing deployments, and debug deployment failures for long-running applications deployed after October 25, 2024.

A graph explaining the flow for service order and history

Service revisions and deployment history

Amazon ECS expands testing capabilities by supporting network fault injection experiments on AWS Fargate through AWS Fault Injection Service, enabling developers to verify application resilience using six different types of fault injection actions, including network disruptions and resource stress testing.

Amazon EventBridge

Amazon EventBridge announces significant performance improvements, reducing end-to-end latency by up to 94% from 2,235ms to 129.33ms at P99, enabling faster event processing for time-sensitive applications like fraud detection and gaming.

Amazon EventBridge and AWS Step Functions now integrate with private APIs through AWS PrivateLink and Amazon VPC Lattice, enabling secure connectivity between cloud and on-premises applications without custom networking code.

Screen capture of the Amazon EventBridge create connection screen showing the new Private option

Connections to Private APIs

EventBridge API destinations introduces proactive OAuth token refresh for public and private authorization endpoints, helping prevent delays and errors by automatically refreshing tokens before expiration.

AWS Step Functions

AWS Step Functions introduces the ability to export workflows as CloudFormation or SAM templates directly from the AWS console, enabling repeatable provisioning across accounts. Developers can export and customize templates from existing workflows, and use AWS Infrastructure Composer to visually connect workflows with other AWS resources.

Step Functions also adds Variables and JSONata support to enhance workflow development. Variables allow data assignment and reference between states, simplifying payload management, while JSONata provides advanced data transformation capabilities, including date formatting and mathematical operations. These features reduce the need for custom code and intermediate states, making it easier to build distributed serverless applications. Watch the in depth video to learn more.

Screen capture of AWS Step Function workflow studio using JSONata and variables in an example

JSONata and variables

Amazon Kinesis

Amazon Kinesis introduces significant updates to its client libraries. The new Kinesis Client Library (KCL) 3.0 reduces compute costs by up to 33% through enhanced load balancing, while the Kinesis Producer Library (KPL) 1.0 improves performance and security. Both libraries now support AWS SDK for Java 2.x and eliminate dependencies on SDK for Java 1.x, enabling seamless upgrades without requiring application code changes.

Screen capture of CPU usage metrics

KCL 3.0 metrics

Amazon MQ

Amazon MQ adds support for AWS PrivateLink, enabling customers to access Amazon MQ API endpoints directly from their VPC through interface VPC endpoints, eliminating the need for internet access and providing enhanced security through AWS’s internal network infrastructure.

Amazon Finch

AWS announces general availability of Linux support for Finch, an open source container development tool that simplifies building, running, and publishing Linux containers across all major operating systems. The release includes support for the Finch Daemon with Docker API compatibility and is available through RPM packages for Amazon Linux 2 and Amazon Linux 2023.

Amazon Simple Queue Service (SQS)

Amazon SQS increases the in-flight message limit for FIFO queues from 20,000 to 120,000 messages, enabling higher concurrent message processing. This enhancement allows customers to scale their receivers and process up to six times more messages simultaneously, provided they have sufficient publish throughput.

Amazon Managed Streaming for Apache Kafka(Amazon MSK)

Amazon MSK now introduces Managed Streaming for Apache Flink blueprints to simplify real-time AI application development. The service enables vector-embedding generation through Amazon Bedrock, streamlining the integration of streaming data with generative AI models. Using a straightforward configuration process, users can generate and index vector embeddings in Amazon OpenSearch, while leveraging LangChain’s data chunking capabilities for enhanced data retrieval efficiency. The service handles all integration aspects between MSK, embedding models, and Amazon OpenSearch vector stores.

AWS Amplify

AWS Amplify launches the Amplify AI kit for Amazon Bedrock, providing fullstack developers with tools to integrate AI capabilities into web applications. The kit includes a customizable React UI component, secure Bedrock access, and context-sharing features, enabling developers to implement chat, search, and summarization functionalities without machine learning expertise.

AWS AppSync

AWS AppSync launches AppSync Events, enabling developers to broadcast real-time data to multiple subscribers through serverless WebSocket APIs. The service eliminates the need to build and manage WebSocket infrastructure while providing secure, scalable event broadcasting capabilities. Developers can create APIs that automatically scale and integrate with services like Amazon EventBridge. The system supports features such as channel namespaces, event handlers, and multiple authorization modes, and is available in all regions where AWS AppSync operates. Users only pay for API operations and real-time connection minutes used.

Screen capture from the AWS AppSync console to create a new Event API.

Creating an AppSunc Event API

Amazon API Gateway

Amazon API Gateway released a significant enhancement to Amazon API Gateway, enabling customers to manage private REST APIs using custom private DNS names. This highly requested feature allows API providers to use user-friendly domain names like private.example.com, while maintaining TLS encryption for security. The implementation process involves creating a private custom domain, configuring certificates through AWS Certificate Manager (ACM), mapping private APIs, and setting resource policies. The feature supports cross-account sharing through AWS Resource Access Manager (AWS RAM) and is now available in all AWS Regions, including AWS GovCloud (US).

Serverless blog posts

October

November

Serverless Office Hours

Image from YouTube from the latest four Serverless Office Hours

Serverless office hours videos

October

November

Still looking for more?

The Serverless landing page has more information. The Lambda resources page contains case studies, webinars, whitepapers, customer stories, reference architectures, and even more Getting Started tutorials.

You can also follow the Serverless Developer Advocacy team on X (formerly Twitter) to see the latest news, follow conversations, and interact with the team.

And finally, visit the Serverless Land  for all your serverless needs.

Efficient satellite imagery supply with AWS Serverless at BASF Digital Farming GmbH

Post Syndicated from Kevin S. Ridolfi original https://aws.amazon.com/blogs/architecture/efficient-satellite-imagery-supply-with-aws-serverless-at-basf-digital-farming-gmbh/

This post was co-written with Dr. Jan Melchior at BASF Digital Farming GmbH and xarvio Digital Farming Solutions.

BASF Digital Farming’s mission is to support farmers worldwide with cutting-edge digital agronomic decision advice by using its main crop optimization platform, xarvio FIELD MANAGER. This necessitates providing the most recent satellite imagery available as quickly as possible. This blog post describes the serverless architecture developed by BASF Digital Farming for efficiently downloading and supplying satellite imagery from various providers to support its xarvio platform.

Screenshot showing the xarvio Field Manager platform

Figure 1. Screenshot showing the xarvio Field Manager platform

Architecture

Figure 2 shows the serverless architecture implemented with AWS services for downloading and processing satellite imagery. The subscription management components handle subscription creation, updates, and deletions, while the actual data downloading and processing occurs in AWS Step Functions.

Serverless implementation of the new imagery service

Figure 2. Serverless implementation of the new imagery service

  1. Subscriptions are created using Amazon API Gateway for external API access, which provides request throttling and can be used to manage API request authorizations.
  2. An AWS Lambda API function manages subscriptions. It implements common create, read, update, and delete operations with request validations and provides an endpoint for replaying failed requests. Subscriptions contain geometry, data provider, as well as start and end date and other parameters, which are stored in the subscription database (Step 7) before a message is sent out for processing.
    Notice that the entire architecture is serverless and thus allows for theoretically unbounded scaling. In case of a bug, this can lead to severe cost impacts, so we implemented a safety buffer, which enables us to prioritize and limit the number of Step Functions executions of the processing pipeline.
  3. All requests (such as the initial request for imagery when a subscription is created) are sent to the Amazon Simple Queue Service (Amazon SQS) processing queue first, which functions as a processing buffer and allows for request prioritization.
  4. Subsequently, Amazon EventBridge Pipes connects the processing buffer with AWS Step Functions. It handles pipe-internal errors automatically; for example, when the Step Functions concurrency limit is reached, the invocation will be retired automatically. This does not handle exceptions raised within Step Functions, such as runtime errors.
  5. AWS Step Functions then performs the actual downloading, processing, and ingestion to the STAC catalog of satellite data from different providers. In case of failure, the request message with error description is sent to the failure queue.
  6. Step Functions uploads the data to Amazon Simple Storage Service (Amazon S3), which stores satellite imagery data.
  7. Following this, Step Functions updates the subscriptions in the Amazon DynamoDB-based subscription database, which stores relevant metadata, such as start and end date, boundary, provider, collection, and last update.
  8. A notification is sent out to inform the user that new data is available through Amazon Simple Notification Service (Amazon SNS), which informs users and services about any updates on a subscription, such as new data being available or subscriptions having been created, deleted, updated, or having failed.
  9. Next, the data is published to our internal STAC catalog, which registers the satellite imagery and makes it directly accessible for subsequent processing.
  10. In case of failed Step Functions execution in Step 5, the Amazon SQS-based failure queue buffers failed executions. Failure messages contain the error message and request body. Depending on error reasons, they can be replayed using the corresponding API endpoint, enabling reprocessing through the replay endpoint on the API Lambda function. The endpoint also allows users to filter messages based on their failure type and to delete messages that cannot be replayed.
  11. An update checker, built on AWS Lambda, regularly checks whether a subscription can be updated. It is triggered in conjunction with an event scheduler every 5 minutes, checks the database for subscriptions that can be updated, and sends update request messages to the processing buffer. Besides actively checking resources, such as API endpoints and STAC catalogs, it also sends out an update message if a notification was received, for example, through an external notification service.
  12. Finally, a delete checker, also built on AWS Lambda, identifies subscriptions that can be deleted. It is triggered in conjunction with an event scheduler every 12 hours. It regularly checks the database for subscriptions that can be deleted and removes them from the database, the S3 bucket, and the STAC catalog. As a safety mechanism, a subscription will first be marked for deletion for 6 months before it gets deleted.

Imagery step function

The actual downloading and processing of data from different providers is handled by the imagery function, illustrated for two different providers (Public and Planet) in Figure 3.

Diagram showing detail state machine for the Imagery Step Function

Figure 3. Diagram showing detail state machine for the Imagery Step Function

  1. When a request arrives, the provider choice state determines the provider from the request body, depending on which the Step Functions flow routes to different Lambda states.
  2. In case a public provider is selected (for example, Earth Search), the Public_Provider Lambda function downloads the data from STAC-based open data providers and directly uploads it to the S3 data bucket, as shown in Figure 2.
  3. In case Planet data is selected, the data retrieval involves an asynchronous call to an external API: First, the Planet_Requester sends an order to the Planet API, together with a task token for pausing Step Functions and the URL of the Planet_Webhook Lambda function.
  4. The Planet_Webhook function is invoked by Planet when the requested order is available for downloading. Given the transmitted task token, Step Functions is resumed with the next state.
  5. Subsequently, the Planet_Provider Lambda function downloads and processes the Planet data.
  6. For both public providers and Planet, the subsequent Public_Provider Lambda function updates the subscription database entries, as shown in Figure 2 (for example, with the latest available timestamp), and adds the download and processed data to the internal STAC catalog, before it ends in the Success state.
  7. If an error occurs in any of the Lambda functions (2, 3, 5, 6), an error message is prepared in the Error_Parsing If an unknown provider is handed in, an error message, including the request body, is prepared in the Error_Provider_Unknown state. In both cases, the error message is pushed to the Failure_Queue (refer to #10 of Figure 2), before it ends in the Failure state.

Conclusion

BASF Digital Farming GmbH developed a serverless architecture on AWS for efficiently downloading and supplying satellite imagery for use by its xarvio platform. This architecture led to a 5x faster delivery rate, an 80% cost reduction through on-demand data downloading, and a 3x accelerated development cycle. Future work will include optimizing the architecture, exploring additional AWS services, and onboarding more satellite imagery providers. Similar serverless architectures using AWS services like AWS Step Functions, AWS Lambda, and Amazon API Gateway can enhance flexibility, scalability, and cost efficiency in imagery provisioning. Learn more about AWS serverless offerings at aws.amazon.com/serverless.

Introducing new Event Source Mapping (ESM) metrics for AWS Lambda

Post Syndicated from Chris McPeek original https://aws.amazon.com/blogs/compute/introducing-new-event-source-mapping-esm-metrics-for-aws-lambda/

This post is written by Tarun Rai Madan, Principal Product Manager –  Serverless, and Rajesh Kumar Pandey, Principal Software Engineer, Serverless

Today, AWS is announcing new opt-in Amazon CloudWatch metrics for AWS Lambda Event Source Mappings that subscribe to Amazon Simple Queue Service (Amazon SQS), Amazon Kinesis, and Amazon DynamoDB event sources. These metrics include PolledEventCount, InvokedEventCount, FilteredOutEventCount, FailedInvokeEventCount, DeletedEventCount, DroppedEventCount, and OnFailureDestinationDeliveredEventCount. The new metrics enable customers to monitor the processing state of events read by Event Source Mappings (ESMs), and helps them diagnose processing issues.

Previously, customers found it challenging to monitor the processing state of events read by an ESM. An ESM is a resource that polls events from an event source and invokes a Lambda function. With the new metrics for ESMs, you can count events by their processing state, which includes events that were polled, invoked, filtered out, deleted, dropped, failed, or sent to on-failure destination.

Overview

Customers building modern event-driven applications use services like SQS, Kinesis, and DynamoDB as fundamental building blocks for developing decoupled architectures, and use a Lambda function as a consumer to benefit from its simplicity, auto-scaling and cost effectiveness. To subscribe to an event source, customers configure a Lambda Event Source Mapping (ESM). An ESM is a fully-managed Lambda resource that runs an event poller which polls, processes (e.g., filters and batches), and delivers the events to a Lambda function. Due to the processing that happens on an ESM, for example, filtering, batching, and delivery to on-failure destinations, events can end up in varying terminal states. As a result, some polled events may not invoke a Lambda function. Previously, the count of polled, filtered, invoked, deleted or dropped events was not visible to customers. This made it challenging for customers to diagnose processing issues with their ESM, resulting from faulty permissions, misconfiguration, or function errors.

What’s new

With today’s announcement, customers can opt-in to CloudWatch metrics to monitor the processing state of events that are read by an ESM configured with SQS, Kinesis and DynamoDB as event sources.

PolledEventCount metric counts the number of events read by an ESM from the event source.

InvokedEventCount metric counts the number of events that invoked your Lambda function. For an event that experiences function errors, this metric may increase the count multiple times for the same polled event, due to retries.

FilteredOutEventCount metric counts the number of events filtered out by your ESM, based on the Filter Criteria defined by you.

FailedInvokeEventCount metric counts the number of events that attempted to invoke a Lambda function, but encountered partial or complete failure.

DeletedEventCount metric counts the events that have been deleted from the SQS queue by Lambda upon successful processing.

DroppedEventCount metric counts the number of events dropped due to event expiry or exhaustion of retry attempts, for Kinesis and DynamoDB ESMs configured with MaximumRecordAgeInSeconds or MaximumRetryAttempts.

OnFailureDestinationDeliveredEventCount metric counts the events sent to an on-failure destination upon reaching the MaximumRecordAgeInSeconds or MaximumRetryAttempts, for ESMs configured with DestinationConfig.

How to use the new ESM metrics

Once an ESM is created and reaches enabled state, it continuously polls the event source for new events. You can monitor the PolledEventCount metric to catch issues with polling due to misconfigured or deleted event source, misconfigured or deleted Lambda function execution role, incorrect permissions, or throttles from the event source. This metric typically increases when there is an increase in traffic in the event source. You can observe the InvokedEventCount metric to catch issues with the Lambda function, and whether the events are properly invoking your Lambda function. In case of Lambda function errors, InvokedEventCount could be more than PolledEventCount due to retries. This metric would also increase when there is an increase in events processed by an ESM. For ESMs that have filter criteria configured, you can monitor the FilteredOutEventCount to count events that were not sent to a Lambda function because they were filtered out per the defined filter criteria.

You can monitor the FailedInvokeEventCount metric to observe the number of events that failed processing when Lambda service tried to invoke your Lambda function. Invocations can fail due to network configuration issues, incorrect permissions, or a deleted Lambda function, version, or alias. If your event source mapping has partial batch responses enabled, this metric includes any event with a non-empty BatchItemFailures in the response. If all events in a batch are successfully processed by your Lambda function, Lambda service emits a 0 value for this metric. You can use the DeletedEventCount metric to ensure that processed events have been successfully deleted from your SQS queue after being processed by the Lambda function. You can use the DroppedEventCount metric to identify issues with message backlogs or misconfigured event expiry rules. You can use the OnFailureDestinationDeliveredEventCount metric to monitor issues such as failed events caused by Lambda function invocation errors.

The classification for available Lambda ESM metrics by event source is presented below:

CloudWatch metric SQS DynamoDB Kinesis Data Stream
PolledEventCount
InvokedEventCount
FilteredOutEventCount
FailedInvokeEventCount
DeletedEventCount
DroppedEventCount
OnFailureDestinationDeliveredEventCount

Activating and testing the new ESM metrics

You can enable the new ESM metrics using AWS Lambda Console, AWS Command Line Interface (CLI), Lambda ESM API, AWS SDK, AWS CloudFormation, and AWS Serverless Application Model (SAM). The metrics will be published under the AWS/Lambda namespace and EventSourceMappingUUID dimension in the CloudWatch console. To learn more, see CloudWatch metrics for Lambda.

Using AWS CLI

To turn on the new metrics using AWS CLI, use the –metrics-config parameter.

aws lambda create-event-source-mapping \
    --region <region-name> \
    --function-name <function-name> \
    --event-source-arn <event-source-arn> \
    --metrics-config '{"Metrics": ["EventCount"]}'

Using AWS Lambda Console

To turn on the new metrics using AWS Lambda Console, click on “Enable metrics” while adding the trigger for your function.

Enabling ESM metrics in AWS Console.

Figure 1: Enabling ESM metrics in AWS Console

A typical scenario where the new ESM metrics can help with better observability is an ESM that uses event filtering. To test the ESM metrics, you can deploy a sample Lambda application with Kinesis as an event source using this serverless pattern, which uses event filtering with a certain criteria to control which events are sent to Lambda. Use this pattern for both the example scenarios; please follow the setup guidelines for this pattern and continue with testing for the scenarios. Running this sample project in your account may incur charges. See AWS Lambda pricing and Amazon Kinesis pricing.

Configuring Lambda function with Kinesis event source.

Figure 2: Configuring Lambda function with Kinesis event source

Example scenario 1: ESM metrics with event filtering configured

The following diagram shows the results for the test scenario with Kinesis ESM, where the total polled events, filtered events, invoked events, and failed events are represented by PolledEventCount, FilteredOutEventCount, InvokedEventCount and FailedInvokeEventCount.

Image of ESM metrics for scenario 1.

Figure 3: ESM metrics for scenario 1

Example Scenario 2: ESM metrics with event filtering and On-Failure Destination configured

Another common scenario is where you want to have visibility around the number of events delivered to Lambda function, events filtered, and additionally, the count of events routed to on-failure destination upon failure. To test this scenario, follow a setup similar to the one in scenario 1. Create or update the ESM with an on-failure destination, and set MaximumRetryCount to 1, as shown below.

aws lambda update-event-source-mapping \
    --uuid <event-source-mapping-uuid> \
    --maximum-retry-attempts 1 \
    --filter-criteria '{"Filters": [{"Pattern": "{\"data\": { \"tire_pressure\": [ { \"numeric\": [ \"<\", 32 ] } ] } }"}]}' \
    --destination-config '{"OnFailure": {"Destination": "<your_SQS_queue_ARN>"}}' \
    --function-name <lambda-function-name>

Publish a sample payload which matches the FilterCriteria defined above. Also generate sample data with different “tire_pressure” < 32 to match the event and invoke the Lambda function.

Sample Data:

{
    "time": "2021-11-09 13:32:04",
    "fleet_id": "fleet-452",
    "vehicle_id": "a42bb15c-43eb-11ec-81d3-0242ac130003",
    "lat": 47.616226213162406,
    "lon": -122.33989110734133,
    "speed": 43,
    "odometer": 43519,
    "tire_pressure": [41, 40, 31, 41],
    "weather_temp": 76,
    "weather_pressure": 1013,
    "weather_humidity": 66,
    "weather_wind_speed": 8,
    "weather_wind_dir": "ne"
}

Once you have published these records to the stream, you should be able to see the CloudWatch metrics under AWS/Lambda namespace with the EventSourceMappingUUID dimension, as shown below. Note that if an event experiences a function error, InvokedEventCount may increase multiple times for the same polled event due to automatic retries.

Image of ESM metrics for scenario 2.

Figure 4: ESM metrics for scenario 2

Available Now

The new ESM metrics are generally available in all commercial regions that Lambda service is available in. Support is also available through AWS Lambda partners like Datadog, Elastic, and Lumigo. The Lambda service sends these new metrics to CloudWatch at no additional cost to you. However, charges apply for CloudWatch metrics at standard CloudWatch metrics pricing for these opt-in metrics, in addition to your AWS Lambda pricing and event source pricing.

Conclusion

With these new CloudWatch metrics, you can gain visibility into the processing state of your events that are polled by Lambda Event Source Mapping (ESM) for queue-based or stream-based applications. The blog explains the new metrics PolledEventCount, InvokedEventCount, FilteredOutEventCount, FailedInvokeEventCount, DeletedEventCount, DroppedEventCount, and OnFailureDestinationDeliveredEventCount, and how to use them to troubleshoot event processing issues for Lambda functions. These metrics help you track the invocation requests sent to Lambda via an ESM, monitor any delays or issues in processing, and take corrective actions if required. To learn more about these metrics, visit Lambda developer guide.

For more serverless learning resources, visit Serverless Land.

The serverless attendee’s guide to AWS re:Invent 2024

Post Syndicated from Julian Wood original https://aws.amazon.com/blogs/compute/the-serverless-attendees-guide-to-aws-reinvent-2024/

AWS re:Invent 2024 offers an extensive selection of serverless and application integration content.

AWS re:Invent Banner

AWS re:Invent Banner

For detailed descriptions and schedule, visit the AWS re:Invent Session Catalog.

Join AWS serverless experts and community members at the AWS Modern Apps and Open Source Zone in the AWS Expo Village. This serves as a hub for serverless discussions at re:Invent. While you are there, enjoy a free coffee and learn about serverless architectures at the Serverlesspresso booth. There are two this year, another one at the Certificate Lounge. The AWS Expo Village also includes Serverless and Serverless Containers booths.

Don’t have a ticket yet? Join us in Las Vegas from November 28-December 2, 2022 by registering for re:Invent 2024.

This guide organizes the sessions into categories to help you find the content this is most relevant to you.

Session Types

  • Breakout Sessions are lecture-style presentations covering architecture, best practices, and deep dives into AWS services.
  • Workshops are 2-hour hands-on sessions where you work through tasks in AWS accounts using AWS services. Laptops are required and AWS credits are provided.
  • Chalk Talks are highly interactive 60-minute sessions with smaller audiences, focused on technical deep dives with whiteboards for architectural discussions.
  • Builders’ Sessions are 60-minute small-group sessions led by an AWS expert who guides you through a technical problem using AWS services.
  • Code Talks are 60-minute live coding sessions where AWS experts show how to build solutions using AWS services.

Leadership session: Nick Coult, Usman Khalid, Kathleen deValk

  • SVS211: Celebrating 10 years of pioneering serverless and containers – Breakout.
    • Explore how serverless has evolved to help organizations drive the highest performance, availability, and security at low costs.

Getting started sessions

Are you new to serverless or taking your first steps? Hear from AWS experts and customers on best practices and strategies for building serverless workloads. Get hands-on with services by attending a workshop or builders session. Create the next great “to do” app or add a new customer experience for a theme park.

  • SVS202: Thinking serverless – Chalk Talk
    • Learn how to approach building solutions with a serverless mindset by breaking down business problems into serverless building blocks.
  • SVS205: Building a serverless web application for a theme park – Workshop
    • Learn how to build a complete serverless web application for a theme park called Innovator Island.
  • SVS201: Getting started with serverless patterns – Workshop
    • Learn how to recognize and apply common serverless patterns by building production-ready code for a serverless application.
  • SVS204: Write less code: Building applications with a serverless mindset – Builders Session
    • Get more value by using built-in integrations between AWS services through configuration rather than writing glue code.
  • SVS207: Effectively model costs for your serverless applications – Chalk Talk
    • Gain insights into modeling the cost of serverless applications on AWS by considering request loads, payload sizes, and service pricing.
  • API201: The AWS Step Functions workshop – Workshop
    • Learn about the features of AWS Step Functions through hands-on interactive modules.
  • API204: Building event-driven architectures – Workshop
    • Learn about the basics of event-driven design using examples involving Amazon SNS, Amazon SQS, AWS Lambda, Amazon EventBridge, and more.
  • API205: Unlock the power of an exceptional serverless developer experience – Code Talk
    • Learn how to accelerate your serverless development with AWS tools, including Amazon Q Developer integrated into IDEs.
  • SEG209: Getting started building serverless SaaS architectures
    • Discover how to build your first serverless application, and learn how to handle multi-tenant architectures for SaaS applications.

Understanding serverless architectures

  • SVS208: Balance consistency and developer freedom with platform engineering – Breakout
    • Learn how platform teams can provide opinionated security, cost, observability, reliability, and sustainability patterns while maintaining developer flexibility.
  • SVS209: Containers or serverless functions: A path for cloud-native success – Breakout
    • Explore the fundamental differences between containers and serverless functions through real-world scenarios and insights into choosing the right approach.
  • OPN301: Level up your serverless applications with Powertools for AWS Lambda – Workshop
    • Learn why Powertools for AWS Lambda can be the developer toolkit of choice for serverless workloads.
  • DEV341: From single to multi-tenant: Scaling a mission-critical serverless app
    • Explore how to transition a mission-critical application from a single-tenant to a multi-tenant architecture
  • DEV337: Zero to production serverless in 8 weeks
    • Hear about a real-world project journey, from concept to production in only eight weeks. Expect practical insights, mistakes, tips, and how using the right technologies and development process can deliver results fast.

Building event-driven applications

  • API204: Building event-driven architectures – Workshop
    • Learn about the basics of event-driven design using examples involving Amazon SNS, Amazon SQS, AWS Lambda, Amazon EventBridge, and more.
  • API206: How event-driven architectures can go wrong and how to fix them – Chalk Talk
    • Explore common event-driven pitfalls including YOLO events, god events, observability soup, event loops, and surprise bills.
  • DEV321: Choosing the right serverless compute services
    • Learn when to use AWS serverless compute services like AWS Lambda and Amazon ECS on AWS Fargate and how to integrate them into your application architectures.
  • API307: Event-driven architectures at scale: Manage millions of events – Breakout
    • Discover proven patterns for building high-scale event-driven systems that can be effectively managed across a distributed organization with Amazon EventBridge.
  • SVS206: Building an event sourcing system using AWS serverless technologies – Chalk Talk
    • Explore strategies for building effective event sourcing architectures using AWS serverless technologies to store application state as an append-only event log.
  • COP408: Coding for serverless observability
    • Join this code talk to learn best practices for collecting signals from your serverless applications. Dive deep into techniques to effectively instrument your applications to provide you with optimal observability.

Incorporating orchestration

  • API201: The AWS Step Functions workshop – Workshop
    • Learn about the features of AWS Step Functions through hands-on interactive modules.
  • API203: Building common orchestrated workflows with AWS Step Functions – Builders Session
    • Build three orchestrated workflows, including streamlined data processing with Distributed Map state, external system integration using callback, and implementing the saga pattern.
  • API207: Optimize data processing with built-in AWS Step Functions features – Chalk Talk
    • Learn to optimize your serverless data processing workflows at scale using AWS Step Functions features, including intrinsic functions and Distributed Map state.
  • API402: Building advanced workflows with AWS Step Functions – Breakout
    • Learn how you can use generative AI to generate state machines automatically from textual descriptions and chat with your workflow to optimize it.

Understanding integration patterns

  • API208: Building an integration strategy for the future – Breakout
    • Boost productivity and create better customer experiences by building a modern integration strategy using AWS application, data, and file integration services.
  • API306: Integration patterns for distributed systems – Breakout
    • Learn about common design trade-offs for distributed systems and how to navigate them with design patterns, illustrated with real-world examples.
  • API311: Application integration for platform builders – Breakout
    • Explore the implementation of application integration using serverless components in enterprise environments.

Building APIs and frontends

  • SVS203: Create your first API from scratch with OpenAPI and Amazon API Gateway – Builders Session
    • Learn how to design and provision complete APIs using infrastructure as code following the OpenAPI specification.
  • API303: Building modern API architectures: Which front door should I use? – Chalk Talk
    • Explore options for building modern APIs including REST, GraphQL, and real-time APIs along with their benefits and drawbacks.
  • API304: Building rate-limited solutions on AWS – Chalk Talk
    • Learn some of the best ways to build rate limiting into your systems for improved reliability.
  • API305: Asynchronous frontends: Building seamless event-driven experiences – Breakout
    • Explore patterns to enable asynchronous, event-driven integrations with the frontend designed for architects and frontend, backend, and full-stack engineers.

Diving deep into advanced topics

  • SVS401: Best practices for serverless developers – Breakout
    • Discover architectural best practices, optimizations, and useful shortcuts for building production-ready serverless workloads.
  • SVS403: From serverful to serverless Java – Workshop
    • Learn how to bring your traditional Java Spring application to AWS Lambda with minimal effort and iteratively apply optimizations.
  • SVS406: Scale streaming workloads with AWS Lambda – Chalk Talk
    • Learn how to implement parallel processing techniques for ordered and unordered use cases to address throughput limitations in streaming data processing.

Processing data

  • SVS404: Building serverless distributed data processing workloads – Workshop
    • Learn how serverless technologies like AWS Step Functions and AWS Lambda can help you simplify management and scaling of distributed data processing.
  • API401: Multi-tenant Amazon SQS queues: Mitigating noisy neighbors – Chalk Talk
    • Explore advanced strategies for managing multi-tenant Amazon SQS queues and effective mitigation techniques, including shuffle sharding and overflow queues.
  • SVS321: AWS Lambda and Apache Kafka for real-time data processing applications – Breakout
    • Gain practical insights into building scalable, serverless data processing applications by integrating AWS Lambda with Apache Kafka.

Incorporating generative AI

  • API209: Generative AI at scale: Serverless workflows for enterprise-ready apps – Workshop
    • Learn to build enterprise-ready, scalable generative AI applications that can scale from serving 100 to 100,000 users.
  • API310: Build a meeting summarization solution with generative AI & serverless – Code Talk
    • See live coding of a serverless application for producing meeting summaries with generative AI using Amazon Transcribe and Amazon Bedrock, orchestrated with AWS Step Functions.
  • SVS319: Unlock the power of generative AI with AWS Serverless – Breakout
    • Learn to harness AWS Serverless to build robust, cost-effective generative AI applications. Explore using AWS Step Functions to orchestrate complex AI workflows.
  • SVS325: Secure access to enterprise generative AI with serverless AI gateway – Chalk Talk
    • Explore how to architect a serverless AI gateway on AWS to securely integrate and consume large language models from multiple providers.

Additional resources

For social activities see the Unofficial list of AWS re:Invent Conference and Vendor Parties.

If you are attending re:Invent, connect at our AWS Modern Apps and Open Source Zone in the AWS Expo Village. The AWS Expo Village also includes Serverless and Serverless Containers booths.

If you can not join us in-person, breakout sessions will be available via our YouTube channel after the event.

We look forward to seeing you at re:Invent 2024! For more serverless learning resources, visit Serverless Land.

Modernize your legacy databases with AWS data lakes, Part 2: Build a data lake using AWS DMS data on Apache Iceberg

Post Syndicated from Shaheer Mansoor original https://aws.amazon.com/blogs/big-data/modernize-your-legacy-databases-with-aws-data-lakes-part-2-build-a-data-lake-using-aws-dms-data-on-apache-iceberg/

This is part two of a three-part series where we show how to build a data lake on AWS using a modern data architecture. This post shows how to load data from a legacy database (SQL Server) into a transactional data lake (Apache Iceberg) using AWS Glue. We show how to build data pipelines using AWS Glue jobs, optimize them for both cost and performance, and implement schema evolution to automate manual tasks. To review the first part of the series, where we load SQL Server data into Amazon Simple Storage Service (Amazon S3) using AWS Database Migration Service (AWS DMS), see Modernize your legacy databases with AWS data lakes, Part 1: Migrate SQL Server using AWS DMS.

Solution overview

In this post, we go over the process of building a data lake, providing the rationale behind the different decisions, and share best practices when building such a solution.

The following diagram illustrates the different layers of the data lake.

Overall Architecture

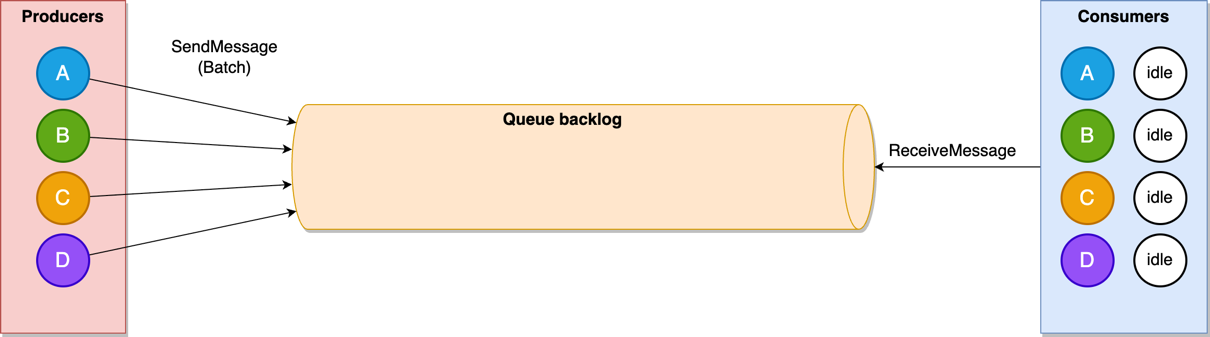
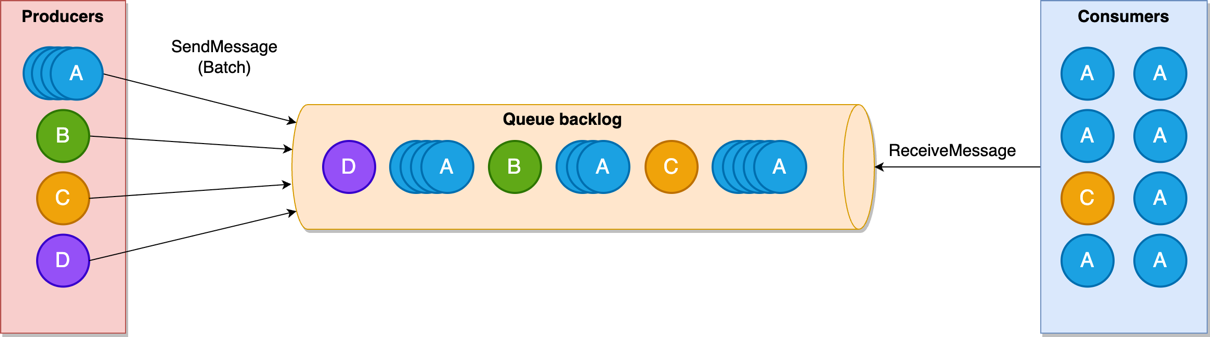
To load data into the data lake, AWS Step Functions can define a workflow, Amazon Simple Queue Service (Amazon SQS) can track the order of incoming files, and AWS Glue jobs and the Data Catalog can be used create the data lake silver layer. AWS DMS produces files and writes these files to the bronze bucket (as we explained in Part 1).

We can turn on Amazon S3 notifications and push the new arriving file names to an SQS first-in-first-out (FIFO) queue. A Step Functions state machine can consume messages from this queue to process the files in the order they arrive.

For processing the files, we need to create two types of AWS Glue jobs:

  • Full load – This job loads the entire table data dump into an Iceberg table. Data types from the source are mapped to an Iceberg data type. After the data is loaded, the job updates the Data Catalog with the table schemas.
  • CDC – This job loads the change data capture (CDC) files into the respective Iceberg tables. The AWS Glue job implements the schema evolution feature of Iceberg to handle schema changes such as addition or deletion of columns.

As in Part 1, the AWS DMS jobs will place the full load and CDC data from the source database (SQL Server) in the raw S3 bucket. Now we process this data using AWS Glue and save it to the silver bucket in Iceberg format. AWS Glue has a plugin for Iceberg; for details, see Using the Iceberg framework in AWS Glue.

Along with moving data from the bronze to the silver bucket, we also create and update the Data Catalog for further processing the data for the gold bucket.

The following diagram illustrates how the full load and CDC jobs are defined inside the Step Functions workflow.

Step Functions for loading data into the lake

In this post, we discuss the AWS Glue jobs for defining the workflow. We recommend using AWS Step Functions Workflow Studio, and setting up Amazon S3 event notifications and an SNS FIFO queue to receive the filename as messages.

Prerequisites

To follow the solution, you need the following prerequisites set up as well as certain access rights and AWS Identity and Access Management (IAM) privileges:

  • An IAM role to run Glue jobs
  • IAM privileges to create AWS DMS resources (this role was created in Part 1 of this series; you can use the same role here)
  • The AWS DMS job from Part 1 working and producing files for the source database on Amazon S3.

Create an AWS Glue connection for the source database

We need to create a connection between AWS Glue and the source SQL Server database so the AWS Glue job can query the source for the latest schema while loading the data files. To create the connection, follow these steps:

  1. On the AWS Glue console, choose Connections in the navigation pane.
  2. Choose Create custom connector.
  3. Give the connection a name and choose JDBC as the connection type.
  4. In the JDBC URL section, enter the following string and replace the name of your source database endpoint and database that was set up in Part 1: jdbc:sqlserver://{Your RDS End Point Name}:1433/{Your Database Name}.
  5. Select Require SSL connection, then choose Create connector.

Clue Connections

Create and configure the full load AWS Glue job

Complete the following steps to create the full load job:

  1. On the AWS Glue console, choose ETL jobs in the navigation pane.
  2. Choose Script editor and select Spark.
  3. Choose Start fresh and select Create script.
  4. Enter a name for the full load job and choose the IAM role (mentioned in the prerequisites) for running the job.
  5. Finish creating the job.
  6. On the Job details tab, expand Advanced properties.
  7. In the Connections section, add the connection you created.
  8. Under Job parameters, pass the following arguments to the job:
    1. target_s3_bucket – The silver S3 bucket name.
    2. source_s3_bucket – The raw S3 bucket name.
    3. secret_id – The ID of the AWS Secrets Manager secret for the source database credentials.
    4. dbname – The source database name.
    5. datalake-formats – This sets the data format to iceberg.

Glue Job Parameters

The full load AWS Glue job starts after the AWS DMS task reaches 100%. The job loops over the files located in the raw S3 bucket and processes them one at time. For each file, the job infers the table name from the file name and gets the source table schema, including column names and primary keys.

If the table has one or more primary keys, the job creates an equivalent Iceberg table. If the job has no primary key, the file is not processed. In our use case, all the tables have primary keys, so we enforce this check. Depending on your data, you might need to handle this scenario differently.

You can use the following code to process the full load files. To start the job, choose Run.

import sys, boto3, json
import boto3
import json
from awsglue.utils import getResolvedOptions
from pyspark.context import SparkContext
from awsglue.context import GlueContext
from awsglue.job import Job
from pyspark.sql import SparkSession

#Get the arguments passed to the script
args = getResolvedOptions(sys.argv, ['JOB_NAME',
                           'target_s3_bucket',
                           'secret_id',
                           'source_s3_bucket'])
dbname = "AdventureWorks"
schema = "HumanResources"

#Initialize parameters
target_s3_bucket = args['target_s3_bucket']
source_s3_bucket = args['source_s3_bucket']
secret_id = args['secret_id']
unprocessed_tables = []
drop_column_list = ['db', 'table_name', 'schema_name', 'Op', 'last_update_time']  # DMS added columns

#Helper Function: Get Credentials from Secrets Manager
def get_db_credentials(secret_id):
    secretsmanager = boto3.client('secretsmanager')
    response = secretsmanager.get_secret_value(SecretId=secret_id)
    secrets = json.loads(response['SecretString'])
    return secrets['host'], int(secrets['port']), secrets['username'], secrets['password']

#Helper Function: Load Iceberg table with Primary key(s)
def load_table(full_load_data_df, dbname, table_name):

    try:
        full_load_data_df = full_load_data_df.drop(*drop_column_list)
        full_load_data_df.createOrReplaceTempView('full_data')

        query = """
        CREATE TABLE IF NOT EXISTS glue_catalog.{0}.{1}
        USING iceberg
        LOCATION "s3://{2}/{0}/{1}"
        AS SELECT * FROM full_data
        """.format(dbname, table_name, target_s3_bucket)
        spark.sql(query)
        
        #Update Table property to accept Schema Changes
        spark.sql("""ALTER TABLE glue_catalog.{0}.{1} SET TBLPROPERTIES (
                      'write.spark.accept-any-schema'='true'
                    )""".format(dbname, table_name))
        
    except Exception as ex:
        print(ex)
        failed_table = {"table_name": table_name, "Reason": ex}
        unprocessed_tables.append(failed_table)
        
def get_table_key(host, port, username, password, dbname):
    
    jdbc_url = "jdbc:sqlserver://{0}:{1};databaseName={2}".format(host, port, dbname)
    
    connectionProperties = {
      "user" : username,
      "password" : password
    }
    
    spark.read.jdbc(url=jdbc_url, table='INFORMATION_SCHEMA.TABLE_CONSTRAINTS', properties=connectionProperties).createOrReplaceTempView("TABLE_CONSTRAINTS")
    spark.read.jdbc(url=jdbc_url, table='INFORMATION_SCHEMA.CONSTRAINT_COLUMN_USAGE', properties=connectionProperties).createOrReplaceTempView("CONSTRAINT_COLUMN_USAGE")
    df_table_pkeys = spark.sql("select c.TABLE_NAME, C.COLUMN_NAME as primary_key FROM TABLE_CONSTRAINTS T JOIN CONSTRAINT_COLUMN_USAGE C ON C.CONSTRAINT_NAME=T.CONSTRAINT_NAME WHERE T.CONSTRAINT_TYPE='PRIMARY KEY'")
    return df_table_pkeys


#Setup Spark configuration for reading and writing Iceberg tables
spark = (
    SparkSession.builder
    .config("spark.sql.extensions", "org.apache.iceberg.spark.extensions.IcebergSparkSessionExtensions")
    .config("spark.sql.catalog.glue_catalog", "org.apache.iceberg.spark.SparkCatalog")
    .config("spark.sql.catalog.glue_catalog.warehouse", "s3://{0}".format(dbname))
    .config("spark.sql.catalog.glue_catalog.catalog-impl", "org.apache.iceberg.aws.glue.GlueCatalog")
    .config("spark.sql.catalog.glue_catalog.io-impl", "org.apache.iceberg.aws.s3.S3FileIO")
    .getOrCreate()
)


#Initialize MSSQL credentials
host, port, username, password = get_db_credentials(secret_id)

#Initialize primary keys for all tables
df_table_pkeys = get_table_key(host, port, username, password, dbname)

#Read Full load csv files from s3
s3 = boto3.client('s3')
full_load_tables = s3.list_objects_v2(Bucket=source_s3_bucket, Prefix="raw/{0}/{1}".format(args['dbname'], args['schema']))

#Loop over files
for item in full_load_tables['Contents']:
    pkey_list = []
    table_name = item["Key"].split("/")[3].lower()
    print("Table name {0}".format(table_name))
    current_table_df = df_table_pkeys.where(df_table_pkeys.TABLE_NAME == table_name)

    # Only Process tables with at least 1 Primary key
    if not current_table_df.isEmpty():
        for i in current_table_df.collect():
            pkey_list.append(i["primary_key"])
    else:
        failed_table = {"table_name": table_name, "Reason": "No primary key"}
        unprocessed_tables.append(failed_table)
        # ToDo Handle these cases

    full_data_path = "s3://{0}/{1}".format(source_s3_bucket, item['Key'])
    full_load_data_df = (spark
                        .read
                        .option("header", True)
                        .option("inferSchema", True)
                        .option("recursiveFileLookup", "true")
                        .csv(full_data_path)
                        )

    primary_key = ",".join(pkey_list)

    if table_name not in unprocessed_tables:
        load_table(full_load_data_df, dbname, table_name)

When the job is complete, it creates the database and tables in the Data Catalog, as shown in the following screenshot.

Data lake silver layer data

Create and configure the CDC AWS Glue job

The CDC AWS Glue job is created similar to the full load job. As with the full load AWS Glue job, you need to use the source database connection and pass the job parameters with one additional parameter, cdc_file, which contains the location of the CDC file to be processed. Because a CDC file can contain data for multiple tables, the job loops over the tables in a file and loads the table metadata from the source table ( RDS column names).

If the CDC operation is DELETE, the job deletes the records from the Iceberg table. If the CDC operation is INSERT or UPDATE, the job merges the data into the Iceberg table.

You can use the following code to process the CDC files. To start the job, choose Run

import sys
import boto3
import json
from awsglue.utils import getResolvedOptions
from pyspark.context import SparkContext
from awsglue.context import GlueContext
from awsglue.job import Job
from pyspark.sql import SparkSession

# Get the arguments passed to the script
args = getResolvedOptions(sys.argv, ['JOB_NAME',
                           'target_s3_bucket',
                           'secret_id',
                           'source_s3_bucket',
                           'cdc_file'])
dbname = "AdventureWorks"
schema = "HumanResources"
target_s3_bucket = args['target_s3_bucket']
source_s3_bucket = args['source_s3_bucket']
secret_id = args['secret_id']
cdc_file = args['cdc_file']
unprocessed_tables = []
drop_column_list = ['db', 'table_name', 'schema_name', 'Op', 'last_update_time']  # DMS added columns
source_s3_cdc_file_key = "raw/AdventureWorks/cdc/" + cdc_file


# Helper Function: Get Credentials from Secrets Manager
def get_db_credentials(secret_id):
    secretsmanager = boto3.client('secretsmanager')
    response = secretsmanager.get_secret_value(SecretId=secret_id)
    secrets = json.loads(response['SecretString'])
    return secrets['host'], int(secrets['port']), secrets['username'], secrets['password']

# Helper Function: Column names from RDS
def get_table_colums(table, host, port, username, password, dbname):

    jdbc_url = "jdbc:sqlserver://{0}:{1};databaseName={2}".format(host, port, dbname)
    
    connectionProperties = {
      "user" : username,
      "password" : password
    }
    
    spark.read.jdbc(url=jdbc_url, table='INFORMATION_SCHEMA.COLUMNS', properties= connectionProperties).createOrReplaceTempView("TABLE_COLUMNS")
    columns = list((row.COLUMN_NAME) for (index, row) in spark.sql("select TABLE_NAME, TABLE_CATALOG, COLUMN_NAME from TABLE_COLUMNS where TABLE_NAME = '{0}' and TABLE_CATALOG = '{1}'".format(table, dbname)).select("COLUMN_NAME").toPandas().iterrows())
    return columns

# Helper Function: Get Colum names and datatypes from RDS
def get_table_colum_datatypes(table, host, port, username, password, dbname):

    jdbc_url = "jdbc:sqlserver://{0}:{1};databaseName={2}".format(host, port, dbname)
    
    connectionProperties = {
      "user" : username,
      "password" : password
    }
    
    spark.read.jdbc(url=jdbc_url, table='INFORMATION_SCHEMA.COLUMNS', properties= connectionProperties).createOrReplaceTempView("TABLE_COLUMNS")
    return spark.sql("select TABLE_NAME, COLUMN_NAME, DATA_TYPE from TABLE_COLUMNS WHERE TABLE_NAME ='{0}'".format(table))

# Helper Function: Setup the primary key condition
def get_iceberg_table_condition(database, tablename):
    
    jdbc_url = "jdbc:sqlserver://{0}:{1};databaseName={2}".format(host, port, database)
    
    connectionProperties = {
      "user" : username,
      "password" : password
    }
    
    spark.read.jdbc(url=jdbc_url, table='INFORMATION_SCHEMA.TABLE_CONSTRAINTS', properties=connectionProperties).createOrReplaceTempView("TABLE_CONSTRAINTS")
    spark.read.jdbc(url=jdbc_url, table='INFORMATION_SCHEMA.CONSTRAINT_COLUMN_USAGE', properties=connectionProperties).createOrReplaceTempView("CONSTRAINT_COLUMN_USAGE")
    
    condition = ''
    
    for key in spark.sql("select C.COLUMN_NAME FROM TABLE_CONSTRAINTS T JOIN CONSTRAINT_COLUMN_USAGE C ON C.CONSTRAINT_NAME=T.CONSTRAINT_NAME WHERE T.CONSTRAINT_TYPE='PRIMARY KEY' AND c.TABLE_NAME = '{0}'".format(table)).collect():
        condition += "target.{0} = source.{0} and".format(key.COLUMN_NAME)
    return condition[:-4]

    
# Read incoming data from Amazon S3
def read_cdc_S3(source_s3_bucket, source_s3_cdc_file_key):
    
    inputDf = (spark
                    .read
                    .option("header", False)
                    .option("inferSchema", True)
                    .option("recursiveFileLookup", "true")
                    .csv("s3://" + source_s3_bucket + "/" + source_s3_cdc_file_key)
                    )
    return inputDf

# Setup Spark configuration for reading and writing Iceberg tables
spark = (
    SparkSession.builder
    .config("spark.sql.extensions", "org.apache.iceberg.spark.extensions.IcebergSparkSessionExtensions")
    .config("spark.sql.catalog.glue_catalog", "org.apache.iceberg.spark.SparkCatalog")
    .config("spark.sql.catalog.glue_catalog.warehouse", "s3://{0}".format(target_s3_bucket))
    .config("spark.sql.catalog.glue_catalog.catalog-impl", "org.apache.iceberg.aws.glue.GlueCatalog")
    .config("spark.sql.catalog.glue_catalog.io-impl", "org.apache.iceberg.aws.s3.S3FileIO")
    .getOrCreate()
)

#Initialize MSSQL credentials
host, port, username, password = get_db_credentials(secret_id)

#Read the cdc file 
cdc_df = read_cdc_S3(source_s3_bucket, source_s3_cdc_file_key)

tables = cdc_df.toPandas()._c1.unique().tolist()

#Loop over tables in the cdc file
for table in tables:
    #Create dataframes for delets and for inserts and updates
    table_df_deletes = cdc_df.where((cdc_df._c1 == table) & (cdc_df._c0 == "D")).drop(cdc_df.columns[0], cdc_df.columns[1], cdc_df.columns[2], cdc_df.columns[3])
    table_df_upserts = cdc_df.where((cdc_df._c1 == table) & ((cdc_df._c0 == "I") | (cdc_df._c0 == "U"))).drop(cdc_df.columns[0], cdc_df.columns[1], cdc_df.columns[2], cdc_df.columns[3])
    
    #Update column names for the dataframes
    columns = get_table_colums(table, host, port, username, password, dbname) 
    selectExpr = [] 

    for column in columns: 
        selectExpr.append(cdc_df.where((cdc_df._c1 == table)).drop(cdc_df.columns[0], cdc_df.columns[1], cdc_df.columns[2], cdc_df.columns[3]).columns[columns.index(column)] + " as " + column)

    table_df_deletes = table_df_deletes.selectExpr(selectExpr) 
    table_df_upserts = table_df_upserts.selectExpr(selectExpr)
    
    #Process Deletes
    if table_df_deletes.count() > 0:
        
        print("Delete Triggered")
        table_df_deletes.createOrReplaceTempView('deleted_rows')
        
        sql_string = """MERGE INTO glue_catalog.{0}.{1} target
                        USING (SELECT * FROM deleted_rows) source
                        ON {2}
                        WHEN MATCHED 
                        THEN DELETE""".format(database, table.lower(), get_iceberg_table_condition(database, table.lower()))
        spark.sql(sql_string)
    
    if table_df_upserts.count() > 0:
        print("Upsert triggered")

        #Upsert Records when there are Schema Changes
        if len(table_df_upserts.columns) != len(columns):

            #Handle column deletes
            if len(table_df_upserts.columns) < len(columns):

                drop_columns = list(set(columns) - set(table_df_upserts.columns))

                for drop_column in drop_columns:
                    sql_string = """
                                    ALTER TABLE glue_catalog.{0}.{1}
                                    DROP COLUMN {2}""".format(dbname.lower(), table.lower(), drop_column)
                    spark.sql(sql_string)

            #Handle column additions
            elif len(table_df_upserts.columns) > len(columns):

                column_datatype_df = get_table_colum_datatypes(table, host, port, username, password, dbname)
                add_columns = list(set(table_df_upserts.columns) - set(columns))

                for add_column in add_columns:

                    #Set Iceberg data type
                    data_type = list((row.DATA_TYPE) for (index, row) in column_datatype_df.filter("COLUMN_NAME='{0}'".format(add_column)).select("DATA_TYPE").toPandas().iterrows())[0]

                    # Convert MSSQL Datatypes to Iceberg supported datatypes
                    if data_type.lower() in ["varchar", "char"]:
                        data_type = "string"

                    if data_type.lower() in ["bigint"]:
                        data_type = "long"

                    if data_type.lower() in ["array"]:
                        data_type = "list"

                    sql_string = """
                                    ALTER TABLE glue_catalog.{0}.{1}
                                    ADD COLUMN {2} {3}""".format(dbname.lower(), table.lower(), add_column, data_type)
                    spark.sql(sql_string)
                    
            #Create statement to update columns
            update_table_column_list = ""
            insert_column_list = ""
            columns = get_table_colums(table, host, port, username, password, dbname)             

            for column in columns:

                update_table_column_list+="""target.{0}=source.{0},""".format(column)
                insert_column_list+="""source.{0},""".format(column)

            table_df_upserts.createOrReplaceTempView('updated_rows')

            sql_string = """MERGE INTO glue_catalog.{0}.{1} target
                            USING (SELECT * FROM updated_rows) source
                            ON {2}
                            WHEN MATCHED 
                            THEN UPDATE SET {3} 
                            WHEN NOT MATCHED THEN INSERT ({4}) VALUES ({5})""".format(dbname.lower(), 
                                                                                      table.lower(), 
                                                                                      get_iceberg_table_condition(dbname.lower(), table.lower()), 
                                                                                      update_table_column_list.rstrip(","), 
                                                                                      ",".join(columns), 
                                                                                      insert_column_list.rstrip(","))

            spark.sql(sql_string)

    
print("CDC job complete")

The Iceberg MERGE INTO syntax can handle cases where a new column is added. For more details on this feature, see the Iceberg MERGE INTO syntax documentation. If the CDC job needs to process many tables in the CDC file, the job can be multi-threaded to process the file in parallel.


Configure EventBridge notifications, SQS queue, and Step Functions state machine

You can use EventBridge notifications to send notifications to EventBridge when certain events occur on S3 buckets, such as when new objects are created and deleted. For this post, we’re interested in the events when new CDC files from AWS DMS arrive in the bronze S3 bucket. You can create event notifications for new objects and insert the file names into an SQS queue. A Lambda function within Step Functions would consume from the queue, extract the file name, start a CDC Glue job, and pass the file name as a parameter to the job.

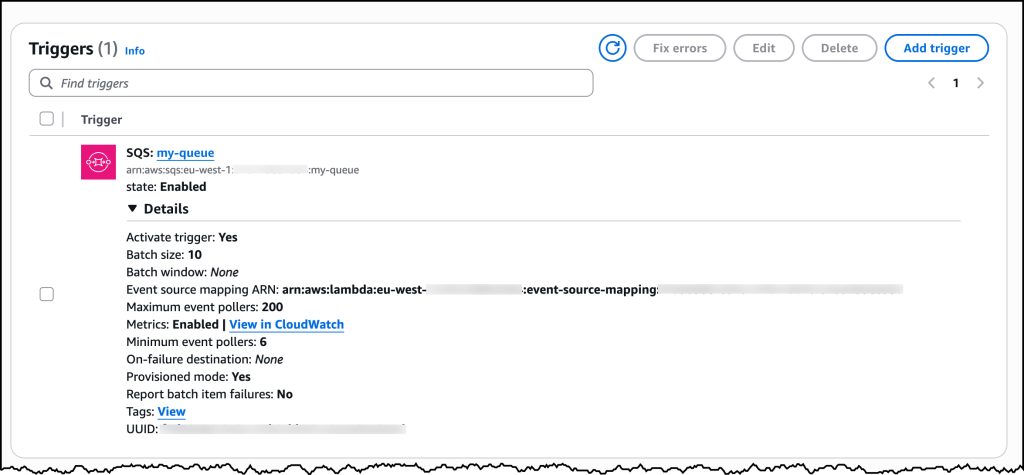
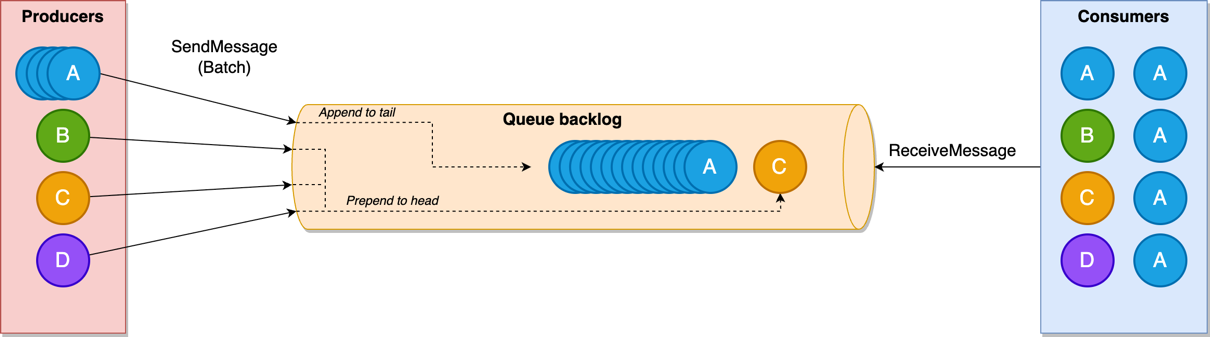
AWS DMS CDC files contain database insert, update, and delete statements. We need to process these in order, so we use an SQS FIFO queue, which preserves the order of messages in which they arrive. You can also configure Amazon SQS to set a time to live (TTL); this parameter defines how long a message stays in the queue before it expires.

Another important parameter to consider when configuring an SQS queue is the message visibility timeout value. While a message is being processed, it disappears from the queue to make sure that the message isn’t consumed by multiple consumers (AWS Glue jobs in our case). If the message is consumed successfully, it should be deleted from the queue before the visibility timeout. However, if the visibility timeout expires and the message isn’t deleted, the message reappears in the queue. In our solution, this timeout must be greater than the time it takes for the CDC job to process a file.

Lastly, we recommend using Step Functions to define a workflow for handling the full load and CDC files. Step Functions has built-in integrations to other AWS services like Amazon SQS, AWS Glue, and Lambda, which makes it a good candidate for this use case.

The Step Functions state machine starts with checking the status of the AWS DMS task. The AWS DMS tasks can be queried to check the status of the full load, and we check the value of the parameter FullLoadProgressPercent. When this value gets to 100%, we can start processing the full load files. After the AWS Glue job processes the full load files, we start polling the SQS queue to check the size of the queue. If the queue size is greater than 0, this means new CDC files have arrived and we can start the AWS Glue CDC job to process these files. The AWS Glue jobs processes the CDC files and deletes the messages from the queue. When the queue size reaches 0, the AWS Glue job exits and we loop in the Step Functions workflow to check the SQS queue size.

Because the Step Functions state machine is supposed to run indefinitely, it’s good to keep in mind that there will be service limits you need to adhere to. Namely, the maximum runtime, which is 1 year, and maximum run history size, i.e., state transitions or events for a state machine which is 25,000. We recommend adding an additional step at the end to check if either of these conditions are being met to stop the current state machine run and start a new one.

The following diagram illustrates how you can use Step Functions state machine history size to monitor and start a new Step Functions state machine run.

Step Functions Workflow

Configure the pipeline

The pipeline needs to be configured to address cost, performance, and resilience goals. You might want a pipeline that can load fresh data into the data lake and make it available quickly, and you might also want to optimize costs by loading large chunks of data into the data lake. At the same time, you should make the pipeline resilient and be able to recover in case of failures. In this section, we cover the different parameters and recommended settings to achieve these goals.

Step Functions is designed to process incoming AWS DMS CDC files by running AWS Glue jobs. AWS Glue jobs can take a couple of minutes to boot up, and when they’re running, it’s efficient to process large chunks of data. You can configure AWS DMS to write CSV files to Amazon S3 by configuring the following AWS DMS task parameters:

  • CdcMaxBatchInterval – Defines the maximum time limit AWS DMS will wait before writing a batch to Amazon S3
  • CdcMinFileSize – Defines the minimum file size AWS DMS will write to Amazon S3

Whichever condition is met first will invoke the write operation. If you want to prioritize data freshness, you should have a short CdcMaxBatchInterval value (10 seconds) and a small CdcMinFileSize value (1–5 MB). This will result in many small CSV files being written to Amazon S3 and will invoke a lot of AWS Glue jobs to process the data, making the extract, transform, and load (ETL) process faster. If you want to optimize costs, you should have a moderate CdcMaxBatchInterval (minutes) and a large CdcMinFileSize value (100–500 MB). In this scenario, we start a few AWS Glue jobs that will process large chunks of data, making the ETL flow more efficient. In a real-world use case, the required values for these parameters might fall somewhere that’s a good compromise between throughput and cost. You can configure these parameters when creating a target endpoint using the AWS DMS console, or by using the create-endpoint command in the AWS Command Line Interface (AWS CLI).

For the full list of parameters, see Using Amazon S3 as a target for AWS Database Migration Service.

Choosing the right AWS Glue worker types for the full load and CDC jobs is also crucial for performance and cost optimization. The AWS Glue (Spark) workers range from G1X to G8X, which have an increasing number of data processing units (DPUs). Full load files are usually much larger in size compared to CDC files, and therefore it’s more cost- and performance-effective to select a larger worker. For CDC files, it would be more cost-effective to select a smaller worker because files sizes are smaller.

You should design the Step Functions state machine in such a way that if anything fails, the pipeline can be redeployed after repair and resume processing from where it left off. One important parameter here is TTL for the messages in the SQS queue. This parameter defines how long a message stays in the queue before expiring. In case of failures, we want this parameter to be long enough for us to deploy a fix. Amazon SQS has a maximum of 14 days for a message’s TTL. We recommend setting this to a large enough value to minimize messages being expired in case of pipeline failures.

Clean up

Complete the following steps to clean up the resources you created in this post:

  1. Delete the AWS Glue jobs:
    1. On the AWS Glue console, choose ETL jobs in the navigation pane.
    2. Select the full load and CDC jobs and on the Actions menu, choose Delete.
    3. Choose Delete to confirm.
  2. Delete the Iceberg tables:
    1. On the AWS Glue console, under Data Catalog in the navigation pane, choose Databases.
    2. Choose the database in which the Iceberg tables reside.
    3. Select the tables to delete, choose Delete, and confirm the deletion.
  3. Delete the S3 bucket:
    1. On the Amazon S3 console, choose Buckets in the navigation pane.
    2. Choose the silver bucket and empty the files in the bucket.
    3. Delete the bucket.

Conclusion

In this post, we showed how to use AWS Glue jobs to load AWS DMS files into a transactional data lake framework such as Iceberg. In our setup, AWS Glue provided highly scalable and simple-to-maintain ETL jobs. Furthermore, we share a proposed solution using Step Functions to create an ETL pipeline workflow, with Amazon S3 notifications and an SQS queue to capture newly arriving files. We shared how to design this system to be resilient towards failures and to automate one of the most time-consuming tasks in maintaining a data lake: schema evolution.

In Part 3, we will share how to process the data lake to create data marts.


About the Authors

Shaheer Mansoor is a Senior Machine Learning Engineer at AWS, where he specializes in developing cutting-edge machine learning platforms. His expertise lies in creating scalable infrastructure to support advanced AI solutions. His focus areas are MLOps, feature stores, data lakes, model hosting, and generative AI.

Anoop Kumar K M is a Data Architect at AWS with focus in the data and analytics area. He helps customers in building scalable data platforms and in their enterprise data strategy. His areas of interest are data platforms, data analytics, security, file systems and operating systems. Anoop loves to travel and enjoys reading books in the crime fiction and financial domains.

Sreenivas Nettem is a Lead Database Consultant at AWS Professional Services. He has experience working with Microsoft technologies with a specialization in SQL Server. He works closely with customers to help migrate and modernize their databases to AWS.

How CyberArk is streamlining serverless governance by codifying architectural blueprints

Post Syndicated from Anton Aleksandrov original https://aws.amazon.com/blogs/architecture/how-cyberark-is-streamlining-serverless-governance-by-codifying-architectural-blueprints/

This post was co-written with Ran Isenberg, Principal Software Architect at CyberArk and an AWS Serverless Hero.

Serverless architectures enable agility and simplified cloud resource management. Organizations embracing serverless architectures build robust, distributed cloud applications. As organizations grow and the number of development teams increases, maintaining architectural consistency, standardization, and governance across projects becomes crucial.

In this post, you will discover how CyberArk, a leading identity security company, efficiently implements serverless architecture governance, reduces duplicative efforts, and saves months of development time by codifying architectural blueprints. This approach helps to prevent redundant efforts and promotes uniform architectural standards, facilitating the seamless adoption of organizational best practices and governance across diverse teams.

Overview

The risk of duplicative efforts and architectural inconsistencies is particularly pronounced in large organizations, especially for requirements unrelated to specific business domains owned by individual teams. Diverse approaches to Infrastructure-as-Code, CI/CD, observability, and security can lead to inconsistent implementations across teams. Application developers should focus on delivering business value efficiently, rather than navigating the complexities of building and operating distributed architectures while adhering to organizational best practices. To achieve this, you need an approach that empowers developers and provides guardrails to ensure vetted architectural patterns are consistently applied. This solution should enable accelerated delivery without sacrificing agility and innovation.

Some organizations implement internal wiki consolidating architectural guidance. While well-intentioned, relying solely on documentation assumes development teams diligently follow the guidelines, which often requires manual validation and limits scalability. To overcome this limitation, organizations should adopt a scalable approach that codifies, automates, and promotes architectural best practices. This mechanism allows developers to focus on delivering business-domain value and drives standardized operational excellence, governance, and organizational policies adherence.

Introducing serverless blueprints

CyberArk engineering team had over 900 developers. It was looking for ways to ensure they build their serverless services based on vetted architectural and security best practices with fully automated governance controls enforcement. The solution came in the form of codified architecture blueprints and automated tooling.

Serverless architectures are composed using loosely coupled services, integrated based on the application requirements. Application developers use IaC tools such as AWS CDK and HashiCorp Terraform to define their serverless architectures and integration patterns. CyberArk has augmented the IaC with governance tools, such as cdk-nag, AWS Config, and AWS Control Tower. With these complementary tools in place, they’ve built serverless blueprints which include architectural definitions based on organizational best practices, as well as automatically applied governance controls

To illustrate this, consider a simple serverless architecture pattern. In this common pattern, an SQS queue serves as the event source for a Lambda function, which parses incoming messages and updates an Amazon S3 bucket.

A simple serverless architecture with SQS Queue, Lambda function, and S3 Bucket

Figure 1. A simple serverless architecture with SQS Queue, Lambda function, and S3 Bucket

While this pattern seems simple, turning it into an enterprise-ready service requires additional effort. You must consider aspects like resiliency, security, governance, observability, and coding best practices. Let’s examine several examples codified in architectural blueprints at CyberArk.

Error-handling best practices

Your services should be resilient. Retries can help to overcome occasional network hiccups, but you also need to handle scenarios when your function consistently fails to process particular messages (known as poison message) – for example, because of a code bug. This can lead to endless processing loops, data loss, and potential extra charges. To address this, a blueprint can implement a failure handling mechanism with a dead letter queue, alerting, and redrive. This pattern is straightforward to implement and adds extra resiliency to your architecture. It is also generic and does not contain any business domain code. This is a typical example of an architectural pattern that can be codified in a blueprint and reused across development teams.

The simple serverless architecture with added resiliency best practices

Figure 2. The simple serverless architecture with added resiliency best practices

Security best practices

Another example is securing S3 buckets. Organizations must enforce S3 security best practices, such as enabling access logs, blocking public access, and enabling encryption at rest. Codifying these guardrails in architectural blueprints adds an extra layer that allows your developers to comply with organization standards without having to explicitly implement adherence to each best practice and policy on their own.

The simple serverless architecture with added security best practices

Figure 3. The simple serverless architecture with added security best practices

The following code snippet uses AWS CDK to create an S3 bucket with common best practices:

def _create_bucket(self, server_access_logs_bucket: s3.Bucket, is_production_env: bool) -> s3.Bucket:
    # Create an S3 bucket with AWS-managed keys encryption
    bucket = s3.Bucket(
        self,
        constants.BUCKET_NAME,
        versioned=True if is_production_env else False,
        encryption=s3.BucketEncryption.S3_MANAGED,
        block_public_access=s3.BlockPublicAccess.BLOCK_ALL,
        enforce_ssl=True,
        server_access_logs_bucket=server_access_logs_bucket, 
        # redacted
    )

Additional security best practices you can codify in your blueprints include the principle of least privilege access, VPC-attachment, and code signing for sensitive Lambda functions, and using KMS keys for encryption.

Lambda best practices

Your Lambda functions are another example of where blueprints can help. By providing a function blueprint implementing the baseline for capabilities like observability, idempotency, and batch processing out-of-the-box, you enable developers to focus on their business domain code.

Layered view of a Lambda function in CyberArk’s serverless architecture blueprint

Figure 4. Layered view of a Lambda function in CyberArk’s serverless architecture blueprint

CyberArk embeds Powertools for AWS Lambda, a toolkit that implements serverless best practices to increase developer velocity, into their blueprints. The following code snippets embed Powertools for enabling enhanced observability and implementing batch processing.

# CDK code
lambda_function = lambda.Function(
    environment={
        constants.POWERTOOLS_SERVICE_NAME: constants.SERVICE_NAME,
        constants.POWER_TOOLS_LOG_LEVEL: 'INFO',  
    },
    tracing=lambda.Tracing.ACTIVE,
    layers=["powertools-layer"],
    log_format=lambda.LogFormat.JSON.value,
    system_log_level=lambda.SystemLogLevel.INFO.value
    # redacted
)

# Function handler code
processor = BatchProcessor(event_type=EventType.SQS, model=OrderSqsRecord)

@logger.inject_lambda_context
@metrics.log_metrics
@tracer.capture_lambda_handler(capture_response=False)
def lambda_handler(event, context: LambdaContext):
    return process_partial_response(
        event=event,
        record_handler=record_handler,
        processor=processor,
        context=context,
)

Governance controls

Blueprints are not static; they evolve as you adopt new best practices and governance policies. Developers start with a vetted blueprint but can deviate as they evolve their serverless apps. To enable continuous adherence, it is important to use a combination of organizational governance tools, such as AWS Control Tower and Service Control Policies, and architecture blueprints that embed governance controls automatically enforced by CI/CD. This ensures that any architectural modification will be validated for adhering to organizational standards.

AWS defines proactive controls as mechanisms that prevent developers from deploying resources that violate governance policies. Detective controls are mechanisms that detect, log, and alert on resource or configuration changes that violate governance policies.

Applying governance controls at all stages of CI/CD

Figure 5. Applying governance controls at all stages of CI/CD

Depending on the IaC tool, you can leverage different types of governance tools for proactive control enforcement. The following screenshot shows a proactive control violation identified during CI/CD via the cdk-nag framework. You can see cdk-nag throwing an error for the stack deployment due to Lambda execution role being assigned wild-card permissions.

Exception thrown by cdk-nag for using wildcard permissions

Figure 6. Exception thrown by cdk-nag for using wildcard permissions

See the practical guide for implementing serverless governance.

Sample code

Ran Isenberg has open-sourced a sample Lambda Handler Cookbook blueprint illustrating some of the patterns CyberArk has adopted.

Additional serverless architecture patterns you might consider implementing in your blueprints are server-side encryption for an Amazon SNS topic with an encrypted Amazon SQS queue subscribed, auto-adjusting provisioned concurrency for Lambda functions, secure Serverless Aurora Cluster with bastion host, and more.

See more patterns implemented at serverlessland.com and cdkpatterns.com

Conclusion

Translating architectural and security best practices into modular IaC definitions, such as CDK constructs or Terraform modules, is a scalable and reusable technique that allows CyberArk to reduce duplicative efforts and save months of development time. Using IaC tools like AWS CDK or Terraform, augmented with governance tools like cdk-nag or checkov, enabled CyberArk to share implementation best practices and encode governance policies into architectural blueprints. Development teams adopting these blueprints do not need to reinvent the wheel, each trying to solve the same problem on their own. Instead, they leverage the knowledge codified in the blueprint.

Further reading

Efficiently processing batched data using parallelization in AWS Lambda

Post Syndicated from Chris Munns original https://aws.amazon.com/blogs/compute/efficiently-processing-batched-data-using-parallelization-in-aws-lambda/

This post is written by Anton Aleksandrov, Principal Solutions Architect, AWS Serverless

Efficient message processing is crucial when handling large data volumes. By employing batching, distribution, and parallelization techniques, you can optimize the utilization of resources allocated to your AWS Lambda function. This post will demonstrate how to implement parallel data processing within the Lambda function handler, maximizing resource utilization and potentially reducing invocation duration and function concurrency requirements.

Overview

AWS Lambda integrates with various event sources, such as Amazon SQSApache Kafka, or Amazon Kinesis, using event-source mappings. When you configure an event-source mapping, Lambda continuously polls the event source and automatically invokes your function to process the retrieved data. Lambda makes more invocations of your function as the number of messages it reads from the event source increases. This can increase the utilized function concurrency and consume the available concurrency in your account. Click the links to learn more about how Lambda consumes messages from SQS queues and Kinesis streams.

To improve the data processing throughput, you can configure event-source mapping batch window and batch size. These settings ensure that your function is invoked only when a sufficient number of messages have accumulated in the event source. For example, if you configure a batch size of 100 messages and a batch window of 10 seconds, Lambda will invoke your function when either 100 messages have accumulated or 10 seconds have elapsed, whichever happens first.

Event source mapping event batching

Event source mapping event batching

By processing messages in batches, rather than individually, you can improve throughput and optimize costs by reducing the number of polling requests to event sources and the number of function invocations. For instance, processing a million messages without batching would require one million function invocations, but configuring a batch size of 100 messages can reduce the number of invocations to 10,000.

Optimizing batch processing within the Lambda execution environment

Each Lambda execution environment processes one event per invocation. With batching enabled, the event object Lambda sends to the function handler contains an array of messages retrieved and batched by the event-source mapping. Once an execution environment starts processing an event object containing a batch of messages, it won’t handle additional invocations until the current one is complete. However, simply iterating over the array of messages and processing them one by one may not fully utilize the allocated compute resources. This can lead to underutilized or idle compute resources, like CPU capacity, and hence longer overall processing times.

Underutilized Lambda environments

Underutilized Lambda environments

Underutilization of compute resources can be generally caused by two things – non-CPU-intensive blocking tasks, such as sending HTTP requests and waiting for responses, and single-threaded processing when you have more than one vCPU core. To address these concerns and maximize resource utilization, you can implement your functions to process data in parallel. This allows more efficient utilization of the allocated compute capacity, reducing invocation duration, time spent idle, and the total concurrency required. In addition, when you allocate more than 1.8GB of memory to your function, it also gets more than one vCPU, which allows threads to land on separate cores for even better performance and true parallel processing.

Improved concurrency in Lambda environment

Improved concurrency in Lambda environment

When processing messages sequentially with a low compute utilization rate, reducing memory allocation may seem intuitive to save costs. This, however, can result in slower performance due to less CPU capacity being allocated. When your function is parallelizing data processing within the execution environment, you’re getting a higher compute utilization rate, and since raising the memory allocation also provides additional CPU capacity, it can lead to better performance. Use the Lambda Power Tuning tool to find the optimal memory configuration, balancing cost with performance.

Understanding the Lambda execution environment lifecycle

After processing an invocation, the Lambda execution environment is “frozen” by the Lambda service. Lambda runtime considers the invocation complete and “freezes” the execution environment when your function handler returns.

When the Lambda service is looking for an execution environment to process a new incoming invocation, it will first try to “thaw” and use any available execution environments that were previously “frozen”. This cycle repeats until the execution environment is eventually shut down.

Lambda worker lifecycle over time

Lambda worker lifecycle over time

Implementing parallel processing within the Lambda execution environment

You can implement parallel processing by running multiple threads in your function handler, but if those threads are still running when the handler returns, then they will be “frozen” together with the execution environment until the next invocation. This can lead to unexpected behavior, where the execution environment is “thawed” to process a new invocation, however, it still has background threads running and processing data from previous invocations. If you do not handle this properly, the behavior can cascade across multiple invocations, leading to delayed or unfinished processing and complicated debugging.

Threads frozen before finishing

Threads frozen before finishing

To address this concern, you need to ensure that the background threads you spawn in the function handler are done processing data before returning from the handler. All threads spawned within a particular invocation must complete within the same invocation in order not to spill over to subsequent invocations. This is illustrated in the following diagram. You can see threads start and end within the same invocation, and only once all threads have finished, the function handler returns.

Threads returning before end of invoke

Threads returning before end of invoke

Sample code

Programming languages offer diverse techniques and terminology for parallel and concurrent processing. Java employs multi-threading and thread pools. Node.js, though single-threaded, provides event loop and promises (for async programming), as well as child processes and worker threads (for actual multi-threading). Python supports both multi-threading (subject to Global Interpreter Lock) and multi-processing. Concurrent routines is another technique gaining attention.

The following sample is provided for illustration purposes only and is based on Node.js promises running concurrently. The sample code uses a language-agnostic term “worker” to denote a unit of parallel processing. Your specific parallelization implementation depends on your choice of runtime language and frameworks. AWS recommends you use battle-tested frameworks like Powertools for AWS Lambda that implement concurrent batch processing when possible. Regardless of the programming language, it is crucial to ensure all background threads/workers/promises/routines/tasks spawned by the function handler are completed within the same invocation before the handler returns.

Sample implementation with Node.js

const NUMBER_OF_WORKERS = 4;

export const handler = async (event) => {
    const workers = []; 
    const messages = event.Records;
    
    // For handling partial batch processing errors
    const batchItemFailures = [];

    for (let i=0; i<NUMBER_OF_WORKERS;i++){
        // No await here! The waiting will happen later
        const worker = spawnWorker(i, messages, batchItemFailures);
        workers.push(worker);
    }
    
    // This line is crucial. This is where the handler
    // waits for all workers to complete their tasks
    const processingResults = await Promise.allSettled(workers);
    console.log('All done!');

    // Return messageIds of all messages that failed 
    // to process in order to retry
    return {batchItemFailures};
};

async function spawnWorker(id, messages, batchItemFailures){
    console.log(`worker.id=${id} spawning`);
    while (messages.length>0){
        const msg = messages.shift();
        console.log(`worker.id=${id} processing message`);
        try {
            // A blocking, but not CPU-intensive operation 
            await processMessage(msg);
        } catch (err){
            // If message processing failed, add it to 
            // the list of batch item failures
            batchItemFailures.push({ itemIdentifier: msg.messageId});
        }
    }
}

See the sample code and AWS Cloud Development Kit (CDK) stack at github.com.

Testing results

The following chart illustrates a Lambda function processing messages using an SQS event-source mapping. After enabling message processing with 4 workers, the invocation duration and concurrent executions dropped to 1/4th of the previous value, while still processing the same number of messages per second. Thanks to parallelization, the new function is faster and requires less concurrency.

Function performance dashboard

Function performance dashboard

Looking at the invocation log, you can see that the function handler has spawned four workers, and all of them were completed before the handler returned the result. You can also see that although the handler received 20 items, with each item taking 200ms to process, the overall duration is only 1000ms. This is because items were processed in parallel (20 items * 200ms / 4 workers = 1000ms total processing time).

START RequestId: (redacted)  Version: $LATEST
2024-06-18T03:18:03.049Z    INFO    Got messages from SQS
2024-06-18T03:18:03.049Z    INFO    messages.length=20
2024-06-18T03:18:03.049Z    INFO    worker.id=0 spawning
2024-06-18T03:18:03.049Z    INFO    worker.id=0 processing message
2024-06-18T03:18:03.049Z    INFO    worker.id=1 spawning
2024-06-18T03:18:03.049Z    INFO    worker.id=1 processing message
2024-06-18T03:18:03.050Z    INFO    worker.id=2 spawning
2024-06-18T03:18:03.050Z    INFO    worker.id=2 processing message
2024-06-18T03:18:03.050Z    INFO    worker.id=3 spawning
2024-06-18T03:18:03.050Z    INFO    worker.id=3 processing message
2024-06-18T03:18:03.250Z    INFO    worker.id=0 processing message
2024-06-18T03:18:03.250Z    INFO    worker.id=1 processing message
(redacted for brevity)
2024-06-18T03:18:03.852Z    INFO    worker.id=1 processing message
2024-06-18T03:18:03.852Z    INFO    worker.id=2 processing message
2024-06-18T03:18:03.852Z    INFO    worker.id=3 processing message
2024-06-18T03:18:04.052Z    INFO    All done!
END RequestId: (redacted)
REPORT RequestId: (redacted) Duration: 1004.48 ms

Considerations

  • The technique and samples described in this post assume unordered message processing. In case you use ordered event sources, such as SQS FIFO Queues, and require preserving message order, you will need to address that in your implementation code. One technique might be creating a separate thread for each messageGroupId.
  • While providing performance and cost benefits, multi-threading and parallel processing is an advanced technique that requires proper error handling. Lambda supports partial batch responses, where you can report back to the event source that specific messages from the batch failed to be processed so they can be retried. You can collect failed message IDs from each thread and return them as your function handler response. This is illustrated in the sample above. See Handling errors for an SQS event source in Lambda and Best Practices for implementing partial batch responses for additional details.

Conclusion

Efficiently processing large volumes of data implies efficient resource utilization. When processing batches of messages from event sources, validate whether your function would benefit from parallel or concurrent processing within the function handler thus increasing the compute capacity utilization rate. With a high compute capacity utilization rate, you can allocate more memory to your function, thus getting more CPU allocated as well, for faster and more efficient processing. Use frameworks like Powertools for AWS Lambda that implement concurrent batch processing when possible, and use the Lambda Power Tuning tool to find the best memory configuration for your functions, balancing performance and cost.

For more serverless learning resources, visit Serverless Land.