Tag Archives: cli

Building a more accessible GitHub CLI

Post Syndicated from Ryan Hecht original https://github.blog/engineering/user-experience/building-a-more-accessible-github-cli/


At GitHub, we’re committed to making our tools truly accessible for every developer, regardless of ability or toolset. The command line interface (CLI) is a vital part of the developer experience, and the GitHub CLI is our product that brings the power of GitHub to your terminal.

When it comes to accessibility, the terminal is fundamentally different from a web browser or a graphical user interface, with a lineage that predates the web itself. While standards like the Web Content Accessibility Guidelines (WCAG) provide a clear path for making web and graphical applications accessible, there is no equivalent, comprehensive standard for the terminal and CLIs. The W3C offers some high-level guidance for non-web software, but it stops short of prescribing concrete techniques, leaving much open to interpretation and innovation.

This gap has challenged us to think creatively and purposefully about what accessibility should look like in the terminal. Our recent Public Preview is focused on addressing the needs of three key groups: users who rely on screen readers, users who need high contrast between background and text, and users who require customizable color options. Our work aims to make the GitHub CLI more inclusive for all, regardless of how you interact with your terminal. Run gh a11y in the latest version of the GitHub CLI to enable these features, or read on to learn about our path to designing and implementing them.

Understanding the terminal landscape

Text-based and command-line applications differ fundamentally from graphical or web applications. On a web page, assistive technologies like screen readers make use of the document object model (DOM) to infer structure and context of the page. Web pages can be designed such that the DOM’s structure is friendly to these technologies without impacting the visual design of the page.  By contrast, CLI’s primary output is plain text, without hidden markup. A terminal emulator acts as the “user agent” for text apps, rendering characters as directed by the server application. Assistive technologies access this matrix of characters, analyze its layout, and try to infer structure. As the WCAG2ICT guidance notes, accessibility in this space means ensuring that all text output is available to assistive technologies, and that structural information is conveyed in a way that’s programmatically determinable—even if no explicit markup is present.

In our quest to improve the GitHub CLI’s usability for blind, low-vision, and colorblind users, we found ourselves navigating a landscape with lots of guidance, but few concrete techniques for implementing accessible experiences. We studied how assistive technology interacts with terminals: how screen readers review output, how color and contrast can be customized, and how structural cues can be inferred from plain text. Our recent Public Preview contains explorations into various use cases in these spaces. 

Rethinking prompts and progress for screen readers

One of the GitHub CLI’s strengths as a command-line application is its rich prompting experience, which gives our users an interactive interface to enter command options. However, this rich interactive experience poses a hurdle for speech synthesis screen readers: Non-alphanumeric visual cues and uses of constant screen redraws for visual or other effects can be tricky to correctly interpret as speech.


A demo video with sound of screen reader reading legacy prompter.

To reduce confusion and make it easier for blind and low vision users to confidently answer questions and navigate choices, we’re introducing a prompting experience that allows speech synthesis screen readers to accurately convey prompts to users. Our new prompter is built using Charm’s open source charmbracelet/huh prompting library.

A demo of a screenreader correctly reading a prompt.

Another use case where the terminal is redrawn for visual effect is when showing progress bars. Our existing implementation uses a “spinner” made by redrawing the screen to display different braille characters (yes, we appreciate the irony) to give the user the indication that their command is executing. Speech synthesis screen readers do not handle this well:

A demo of a screenreader and an old spinner.

This has been replaced with a static text progress indicator (with a relevant message to the action being taken where possible, falling back to a general “Working…” message). We’re working on identifying other areas we can further improve the contextual text.

A demo video of the new progress indicator experience.

Color, contrast, and customization

Color is more than decoration in the terminal: It’s a vital tool for highlighting information, signaling errors, and guiding workflows. But color can also be a barrier—if contrast between the color of the terminal background and the text displayed on it is too low, some users will have difficulty discerning the displayed information. Unlike in a web browser, a terminal’s background color is not set by the application. That task is handled by the user’s terminal emulator. In order to maintain contrast, it is important that a command line application takes into account this variable.

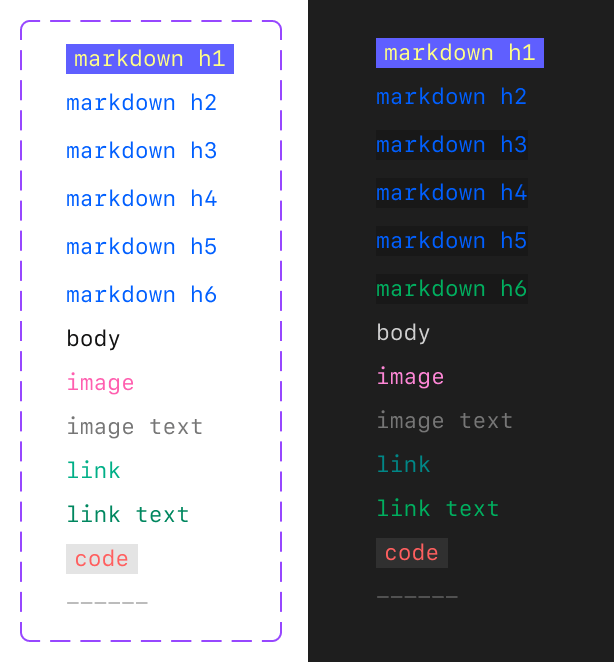
Our legacy color palette used for rendering Markdown did not take the terminal’s background color into account, leading to low contrast in some cases.

A screenshot of the legacy Markdown palette.

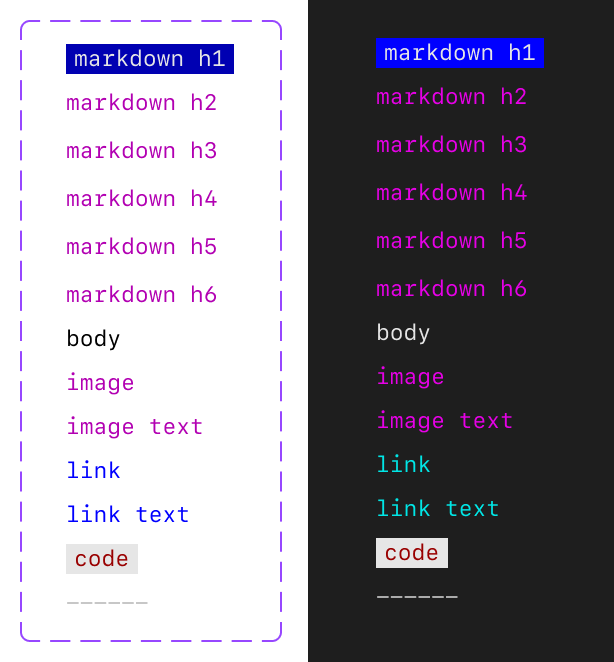
The colors themselves also matter. Different terminal environments have varied color capabilities (some support 4-bit, some 8-bit, some 24-bit, etc). No matter the capability, terminals enable users to customize their color preferences, choosing how different hues are displayed. However, most terminals only support changing a limited subset of colors: namely, the sixteen colors in the ANSI 4-bit color table. The GitHub CLI has made extensive efforts to align our color palettes to 4-bit colors so our users can completely customize their experience using their terminal preferences. We built on top of the accessibility foundations pioneered by Primer when deciding which 4-bit colors to use.

A screenshot showing the improved Markdown palette.

Building for the CLI community

Our improvements aim to support a wide range of developer needs, from blind users who need screen readers, to low vision users who need high contrast, to colorblind users who require customizable color options. But this Public Preview does not mark the end of our team’s commitment to enabling all developers to use the GitHub CLI. We intend to make it easier for our extension authors to implement the same accessibility improvements that we’ve made to the core CLI. This will allow users to have a cohesive experience across all GitHub CLI commands, official or community-maintained, and so that more workflows can be made accessible by default. We’re also looking into experiences to customize the formatting of tables output by commands to be more easily read/interpreted by screen readers. We’re excited to continue our accessibility journey.

We couldn’t have come this far without collaboration with our friends at Charm and our colleagues on the GitHub Accessibility team. 

A call for feedback

We invite you to help us in our goal to make the GitHub CLI an experience for all developers:

  • Try it out: Update the GitHub CLI to v2.72.0 and run gh a11y in your terminal to learn more about enabling these new accessible features.
  • Share your experience: Join our GitHub CLI accessibility discussion to provide feedback or suggestions.
  • Connect with us: If you have a lived experience relevant to our accessibility personas, reach out to the accessibility team or get involved in our discussion panel.

Looking forward

Adapting accessibility standards for the command line is a challenge—and an opportunity. We’re committed to sharing our approach, learning from the community, and helping set a new standard for accessible CLI tools.

Thank you for building a more accessible GitHub with us.

Want to help us make GitHub the home for all developers? Learn more about GitHub’s accessibility efforts.

The post Building a more accessible GitHub CLI appeared first on The GitHub Blog.

Streamlining evidence collection with AWS Audit Manager

Post Syndicated from Nicholas Parks original https://aws.amazon.com/blogs/security/streamlining-evidence-collection-with-aws-audit-manager/

In this post, we will show you how to deploy a solution into your Amazon Web Services (AWS) account that enables you to simply attach manual evidence to controls using AWS Audit Manager. Making evidence-collection as seamless as possible minimizes audit fatigue and helps you maintain a strong compliance posture.

As an AWS customer, you can use APIs to deliver high quality software at a rapid pace. If you have compliance-focused teams that rely on manual, ticket-based processes, you might find it difficult to document audit changes as those changes increase in velocity and volume.

As your organization works to meet audit and regulatory obligations, you can save time by incorporating audit compliance processes into a DevOps model. You can use modern services like Audit Manager to make this easier. Audit Manager automates evidence collection and generates reports, which helps reduce manual auditing efforts and enables you to scale your cloud auditing capabilities along with your business.

AWS Audit Manager uses services such as AWS Security Hub, AWS Config, and AWS CloudTrail to automatically collect and organize evidence, such as resource configuration snapshots, user activity, and compliance check results. However, for controls represented in your software or processes without an AWS service-specific metric to gather, you need to manually create and provide documentation as evidence to demonstrate that you have established organizational processes to maintain compliance. The solution in this blog post streamlines these types of activities.

Solution architecture

This solution creates an HTTPS API endpoint, which allows integration with other software development lifecycle (SDLC) solutions, IT service management (ITSM) products, and clinical trial management systems (CTMS) solutions that capture trial process change amendment documentation (in the case of pharmaceutical companies who use AWS to build robust pharmacovigilance solutions). The endpoint can also be a backend microservice to an application that allows contract research organizations (CRO) investigators to add their compliance supporting documentation.

In this solution’s current form, you can submit an evidence file payload along with the assessment and control details to the API and this solution will tie all the information together for the audit report. This post and solution is directed towards engineering teams who are looking for a way to accelerate evidence collection. To maximize the effectiveness of this solution, your engineering team will also need to collaborate with cross-functional groups, such as audit and business stakeholders, to design a process and service that constructs and sends the message(s) to the API and to scale out usage across the organization.

To download the code for this solution, and the configuration that enables you to set up auto-ingestion of manual evidence, see the aws-audit-manager-manual-evidence-automation GitHub repository.

Architecture overview

In this solution, you use AWS Serverless Application Model (AWS SAM) templates to build the solution and deploy to your AWS account. See Figure 1 for an illustration of the high-level architecture.

Figure 1. The architecture of the AWS Audit Manager automation solution

Figure 1. The architecture of the AWS Audit Manager automation solution

The SAM template creates resources that support the following workflow:

  1. A client can call an Amazon API Gateway endpoint by sending a payload that includes assessment details and the evidence payload.
  2. An AWS Lambda function implements the API to handle the request.
  3. The Lambda function uploads the evidence to an Amazon Simple Storage Service (Amazon S3) bucket (3a) and uses AWS Key Management Service (AWS KMS) to encrypt the data (3b).
  4. The Lambda function also initializes the AWS Step Functions workflow.
  5. Within the Step Functions workflow, a Standard Workflow calls two Lambda functions. The first looks for a matching control within an assessment, and the second updates the control within the assessment with the evidence.
  6. When the Step Functions workflow concludes, it sends a notification for success or failure to subscribers of an Amazon Simple Notification Service (Amazon SNS) topic.

Deploy the solution

The project available in the aws-audit-manager-manual-evidence-automation GitHub repository contains source code and supporting files for a serverless application you can deploy with the AWS SAM command line interface (CLI). It includes the following files and folders:

src Code for the application’s Lambda implementation of the Step Functions workflow.
It also includes a Step Functions definition file.
template.yml A template that defines the application’s AWS resources.

Resources for this project are defined in the template.yml file. You can update the template to add AWS resources through the same deployment process that updates your application code.

Prerequisites

This solution assumes the following:

  1. AWS Audit Manager is enabled.
  2. You have already created an assessment in AWS Audit Manager.
  3. You have the necessary tools to use the AWS SAM CLI (see details in the table that follows).

For more information about setting up Audit Manager and selecting a framework, see Getting started with Audit Manager in the blog post AWS Audit Manager Simplifies Audit Preparation.

The AWS SAM CLI is an extension of the AWS CLI that adds functionality for building and testing Lambda applications. The AWS SAM CLI uses Docker to run your functions in an Amazon Linux environment that matches Lambda. It can also emulate your application’s build environment and API.

To use the AWS SAM CLI, you need the following tools:

AWS SAM CLI Install the AWS SAM CLI
Node.js Install Node.js 14, including the npm package management tool
Docker Install Docker community edition

To deploy the solution

  1. Open your terminal and use the following command to create a folder to clone the project into, then navigate to that folder. Be sure to replace <FolderName> with your own value.

    mkdir Desktop/<FolderName> && cd $_

  2. Clone the project into the folder you just created by using the following command.

    git clone https://github.com/aws-samples/aws-audit-manager-manual-evidence-automation.git

  3. Navigate into the newly created project folder by using the following command.

    cd aws-audit-manager-manual-evidence-automation

  4. In the AWS SAM shell, use the following command to build the source of your application.

    sam build

  5. In the AWS SAM shell, use the following command to package and deploy your application to AWS. Be sure to replace <DOC-EXAMPLE-BUCKET> with your own unique S3 bucket name.

    sam deploy –guided –parameter-overrides paramBucketName=<DOC-EXAMPLE-BUCKET>

  6. When prompted, enter the AWS Region where AWS Audit Manager was configured. For the rest of the prompts, leave the default values.
  7. To activate the IAM authentication feature for API gateway, override the default value by using the following command.

    paramUseIAMwithGateway=AWS_IAM

To test the deployed solution

After you deploy the solution, run an invocation like the one below for an assessment (using curl). Be sure to replace <YOURAPIENDPOINT> and <AWS REGION> with your own values.

curl –location –request POST
‘https://<YOURAPIENDPOINT>.execute-api.<AWS REGION>.amazonaws.com/Prod’ \
–header ‘x-api-key: ‘ \
–form ‘payload=@”<PATH TO FILE>”‘ \
–form ‘AssessmentName=”GxP21cfr11″‘ \
–form ‘ControlSetName=”General requirements”‘ \
–form ‘ControlIdName=”11.100(a)”‘

Check to see that your file is correctly attached to the control for your assessment.

Form-data interface parameters

The API implements a form-data interface that expects four parameters:

  1. AssessmentName: The name for the assessment in Audit Manager. In this example, the AssessmentName is GxP21cfr11.
  2. ControlSetName: The display name for a control set within an assessment. In this example, the ControlSetName is General requirements.
  3. ControlIdName: this is a particular control within a control set. In this example, the ControlIdName is 11.100(a).
  4. Payload: this is the file representing evidence to be uploaded.

As a refresher of Audit Manager concepts, evidence is collected for a particular control. Controls are grouped into control sets. Control sets can be grouped into a particular framework. The assessment is considered an implementation, or an instance, of the framework. For more information, see AWS Audit Manager concepts and terminology.

To clean up the deployed solution

To clean up the solution, use the following commands to delete the AWS CloudFormation stack and your S3 bucket. Be sure to replace <YourStackId> and <DOC-EXAMPLE-BUCKET> with your own values.

aws cloudformation delete-stack –stack-name <YourStackId>
aws s3 rb s3://<DOC-EXAMPLE-BUCKET> –force

Conclusion

This solution provides a way to allow for better coordination between your software delivery organization and compliance professionals. This allows your organization to continuously deliver new updates without overwhelming your security professionals with manual audit review tasks.

Next steps

There are various ways to extend this solution.

  1. Update the API Lambda implementation to be a webhook for your favorite software development lifecycle (SDLC) or IT service management (ITSM) solution.
  2. Modify the steps within the Step Functions state machine to more closely match your unique compliance processes.
  3. Use AWS CodePipeline to start Step Functions state machines natively, or integrate a variation of this solution with any continuous compliance workflow that you have.

Learn more AWS Audit Manager, DevOps, and AWS for Health and start building!

 
If you have feedback about this post, submit comments in the Comments section below. If you have questions about this post, contact AWS Support.

Want more AWS Security news? Follow us on Twitter.

Nicholas Parks

Nicholas Parks

Nicholas has been using AWS since 2010 across various enterprise verticals including healthcare, life sciences, financial, retail, and telecommunications. Nicholas focuses on modernizations in pursuit of new revenue as well as application migrations. He specializes in Lean, DevOps cultural change, and Continuous Delivery.

Brian Tang

Brian Tang

Brian Tang is an AWS Solutions Architect based out of Boston, MA. He has 10 years of experience helping enterprise customers across a wide range of industries complete digital transformations by migrating business-critical workloads to the cloud. His core interests include DevOps and serverless-based solutions. Outside of work, he loves rock climbing and playing guitar.

Slicing and Dicing Instant Logs: Real-time Insights on the Command Line

Post Syndicated from Cole MacKenzie original https://blog.cloudflare.com/instant-logs-on-the-command-line/

Slicing and Dicing Instant Logs: Real-time Insights on the Command Line

Slicing and Dicing Instant Logs: Real-time Insights on the Command Line

During Speed Week 2021 we announced a new offering for Enterprise customers, Instant Logs. Since then, the team has not slowed down and has been working on new ways to enable our customers to consume their logs and gain powerful insights into their HTTP traffic in real time.

Slicing and Dicing Instant Logs: Real-time Insights on the Command Line

We recognize that as developers, UIs are useful but sometimes there is the need for a more powerful alternative. Today, I am going to introduce you to Instant Logs in your terminal! In order to get started we need to install a few open-source tools to help us:

  • Websocat – to connect to WebSockets.
  • Angle Grinder – a utility to slice-and-dice a stream of logs on the command line.

Creating an Instant Log’s Session

For enterprise zones with access to Instant Logs, you can create a new session by sending a POST request to our jobs’ endpoint. You will need:

  • Your Zone Tag / ID
  • An Authentication Key or an API Token with at least the Zone Logs Read permission

curl -X POST 'https://api.cloudflare.com/client/v4/zones/${ZONE_ID}/logpush/edge/jobs' \
-H 'X-Auth-Key: <KEY>' \
-H 'X-Auth-Email: <EMAIL>' \
-H 'Content-Type: application/json' \
--data-raw '{
    "fields": "ClientIP,ClientRequestHost,ClientRequestMethod,ClientRequestPath,EdgeEndTimestamp,EdgeResponseBytes,EdgeResponseStatus,EdgeStartTimestamp,RayID",
    "sample": 1,
    "filter": "",
    "kind": "instant-logs"
}'

Response

The response will include a new field called destination_conf. The value of this field is your unique WebSocket address that will receive messages directly from our network!

{
    "errors": [],
    "messages": [],
    "result": {
        "id": 401,
        "fields": "ClientIP,ClientRequestHost,ClientRequestMethod,ClientRequestPath,EdgeEndTimestamp,EdgeResponseBytes,EdgeResponseStatus,EdgeStartTimestamp,RayID",
        "sample": 1,
        "filter": "",
        "destination_conf": "wss://logs.cloudflare.com/instant-logs/ws/sessions/949f9eb846f06d8f8b7c91b186a349d2",
        "kind": "instant-logs"
    },
    "success": true
}

Connect to WebSocket

Using a CLI utility like Websocat, you can connect to the WebSocket and start immediately receiving logs of line-delimited JSON.

websocat wss://logs.cloudflare.com/instant-logs/ws/sessions/949f9eb846f06d8f8b7c91b186a349d2
{"ClientRequestHost":"example.com","ClientRequestMethod":"GET","ClientRequestPath":"/","EdgeEndTimestamp":"2022-01-25T17:23:05Z","EdgeResponseBytes":363,"EdgeResponseStatus":200,"EdgeStartTimestamp":"2022-01-25T17:23:05Z","RayID":"6d332ff74fa45fbe","sampleInterval":1}
{"ClientRequestHost":"example.com","ClientRequestMethod":"GET","ClientRequestPath":"/","EdgeEndTimestamp":"2022-01-25T17:23:06Z","EdgeResponseBytes":363,"EdgeResponseStatus":200,"EdgeStartTimestamp":"2022-01-25T17:23:06Z","RayID":"6d332fffe9c4fc81","sampleInterval":1}

The Scenario

Now that you are able to create a new Instant Logs session let’s give it a purpose! Say you just recently deployed a new firewall rule blocking users from downloading a specific asset that is only available to users in Canada. For the purpose of this example, the asset is available at the path /canadians-only.

Specifying Fields

In order to see what firewall actions (if any) were taken, we need to make sure that we include ClientRequestCountry, ​​FirewallMatchesActions and FirewallMatchesRuleIDs fields when creating our session.

Additionally, any field available in our HTTP request dataset is usable by Instant Logs. You can view the entire list of HTTP Request fields on our developer docs.

Choosing a Sample Rate

Instant Logs users also have the ability to choose a sample rate. The sample parameter is the inverse probability of selecting a log. This means that "sample": 1 is 100% of records, "sample": 10 is 10% and so on.

Going back to our example of validating that our newly deployed firewall rule is working as expected, in this case, we are choosing not to sample the data by setting "sample": 1.

Please note that Instant Logs has a maximum data rate supported. For high volume domains, we sample server side as indicated in the “sampleInterval” parameter returned in the logs. For example, “sampleInterval”: 10 indicates this log message is just one out of 10 logs received.

Defining the Filters

Since we are only interested in requests with the path of /canadians-only, we can use filters to remove any logs that do not match that specific path. The filters consist of three parts: key, operator and value. The key can be any field specified in the "fields": "" list when creating the session. The complete list of supported operators can be found on our Instant Logs documentation.

To only get the logs of requests destined to /canadians-only, we can specify the following filter:

{
  "filter": "{\"where\":{\"and\":[{\"key\":\"ClientRequestPath\",\"operator\":\"eq\",\"value\":\"/canadians-only\"}]}}"
}

Creating an Instant Logs Session: Canadians Only

Using the information above, we can now craft the request for our custom Instant Logs session.

curl -X POST 'https://api.cloudflare.com/client/v4/zones/${ZONE_ID}/logpush/edge/jobs' \
-H 'X-Auth-Key: <KEY>' \
-H 'X-Auth-Email: <EMAIL>' \
-H 'Content-Type: application/json' \
--data-raw '{
  "fields": "ClientIP,ClientRequestHost,ClientRequestMethod,ClientRequestPath,ClientCountry,EdgeEndTimestamp,EdgeResponseBytes,EdgeResponseStatus,EdgeStartTimestamp,RayID,FirewallMatchesActions,FirewallMatchesRuleIDs",
  "sample": 1,
  "kind": "instant-logs",
  "filter": "{\"where\":{\"and\":[{\"key\":\"ClientRequestPath\",\"operator\":\"eq\",\"value\":\"/canadians-only\"}]}}"
}'

Angle Grinder

Now that we have a connection to our WebSocket and are receiving logs that match the request path /canadians-only, we can start slicing and dicing the logs to see that the rule is working as expected. A handy tool to use for this is Angle Grinder. Angle Grinder lets you apply filtering, transformations and aggregations on stdin with first class JSON support. For example, to get the number of visitors from each country we can sum the number of events by the ClientCountry field.

websocat wss://logs.cloudflare.com/instant-logs/ws/sessions/949f9eb846f06d8f8b7c91b186a349d2 | agrind '* | json | sum(sampleInterval) by ClientCountry'
ClientCountry    	_sum
---------------------------------
pt               	4
fr               	3
us               	3

Using Angle Grinder, we can create a query to count the firewall actions by each country.

websocat wss://logs.cloudflare.com/instant-logs/ws/sessions/949f9eb846f06d8f8b7c91b186a349d2 |  agrind '* | json | sum(sampleInterval) by ClientCountry,FirewallMatchesActions'
ClientCountry        FirewallMatchesActions        _sum
---------------------------------------------------------------
ca                   []                            5
us                   [block]                       1

Looks like our newly deployed firewall rule is working 🙂

Happy Logging!