Tag Archives: integration

Cloudflare Workers database integration with Upstash

Post Syndicated from Joaquin Gimenez original http://blog.cloudflare.com/cloudflare-workers-database-integration-with-upstash/

Cloudflare Workers database integration with Upstash

Cloudflare Workers database integration with Upstash

During Developer Week we announced Database Integrations on Workers  a new and seamless way to connect with some of the most popular databases. You select the provider, authorize through an OAuth2 flow and automatically get the right configuration stored as encrypted environment variables to your Worker.

Today we are thrilled to announce that we have been working with Upstash to expand our integrations catalog. We are now offering three new integrations: Upstash Redis, Upstash Kafka and Upstash QStash. These integrations allow our customers to unlock new capabilities on Workers. Providing them with a broader range of options to meet their specific requirements.

Add the integration

We are going to show the setup process using the Upstash Redis integration.

Select your Worker, go to the Settings tab, select the Integrations tab to see all the available integrations.

Cloudflare Workers database integration with Upstash

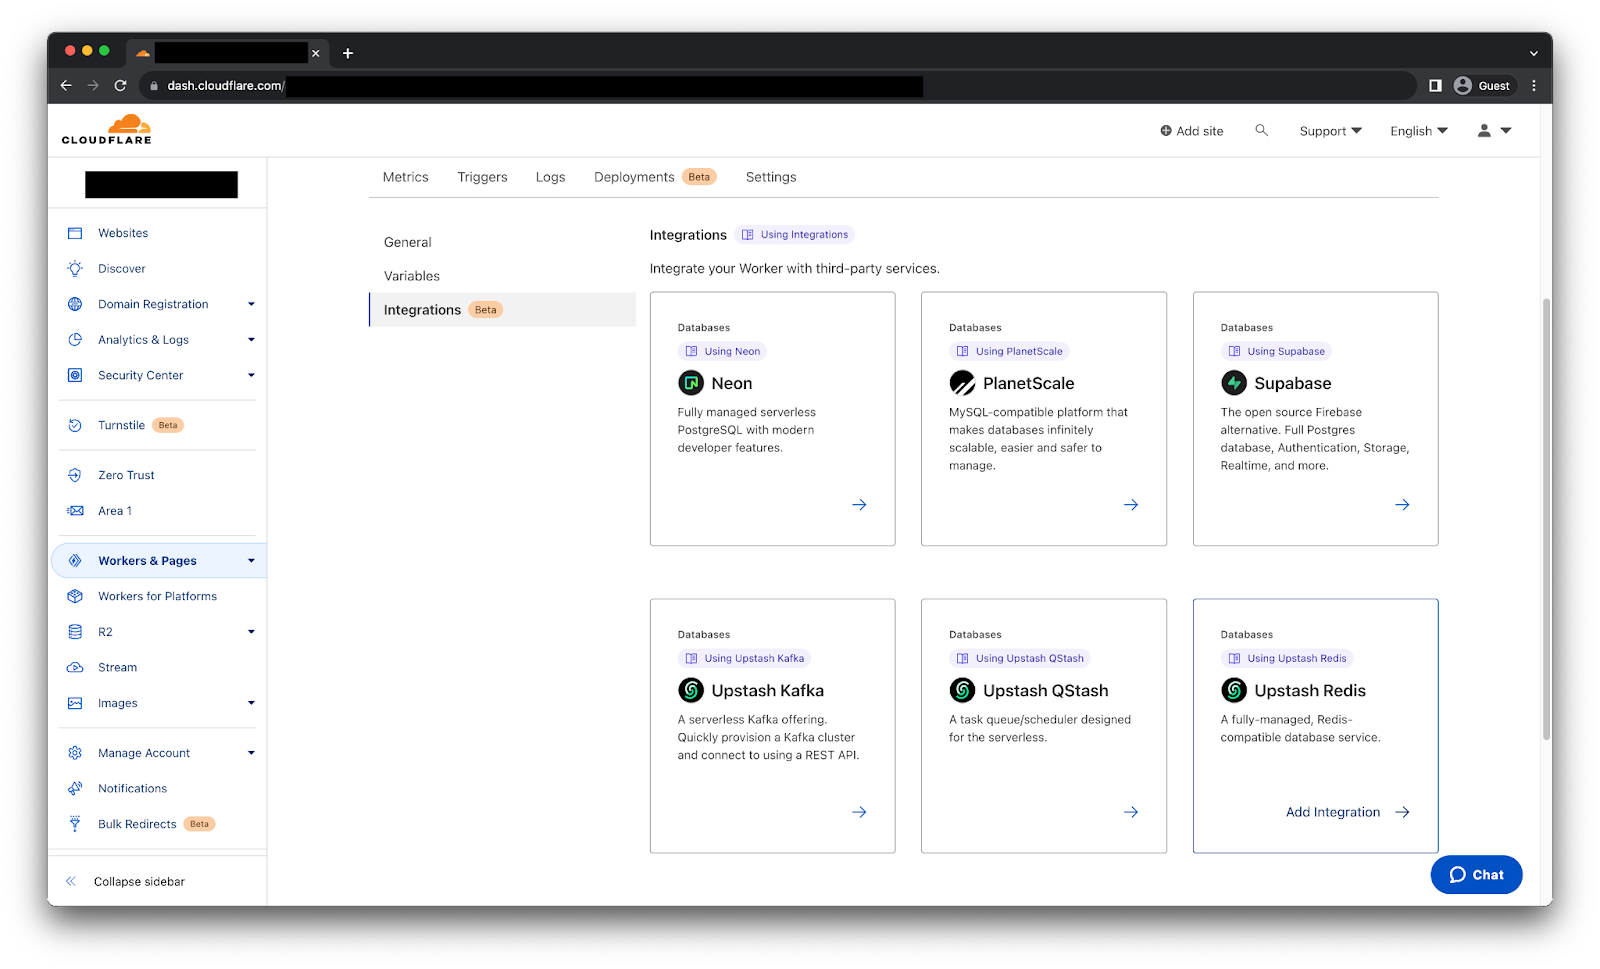
After selecting the Upstash Redis integration we will get the following page.

Cloudflare Workers database integration with Upstash

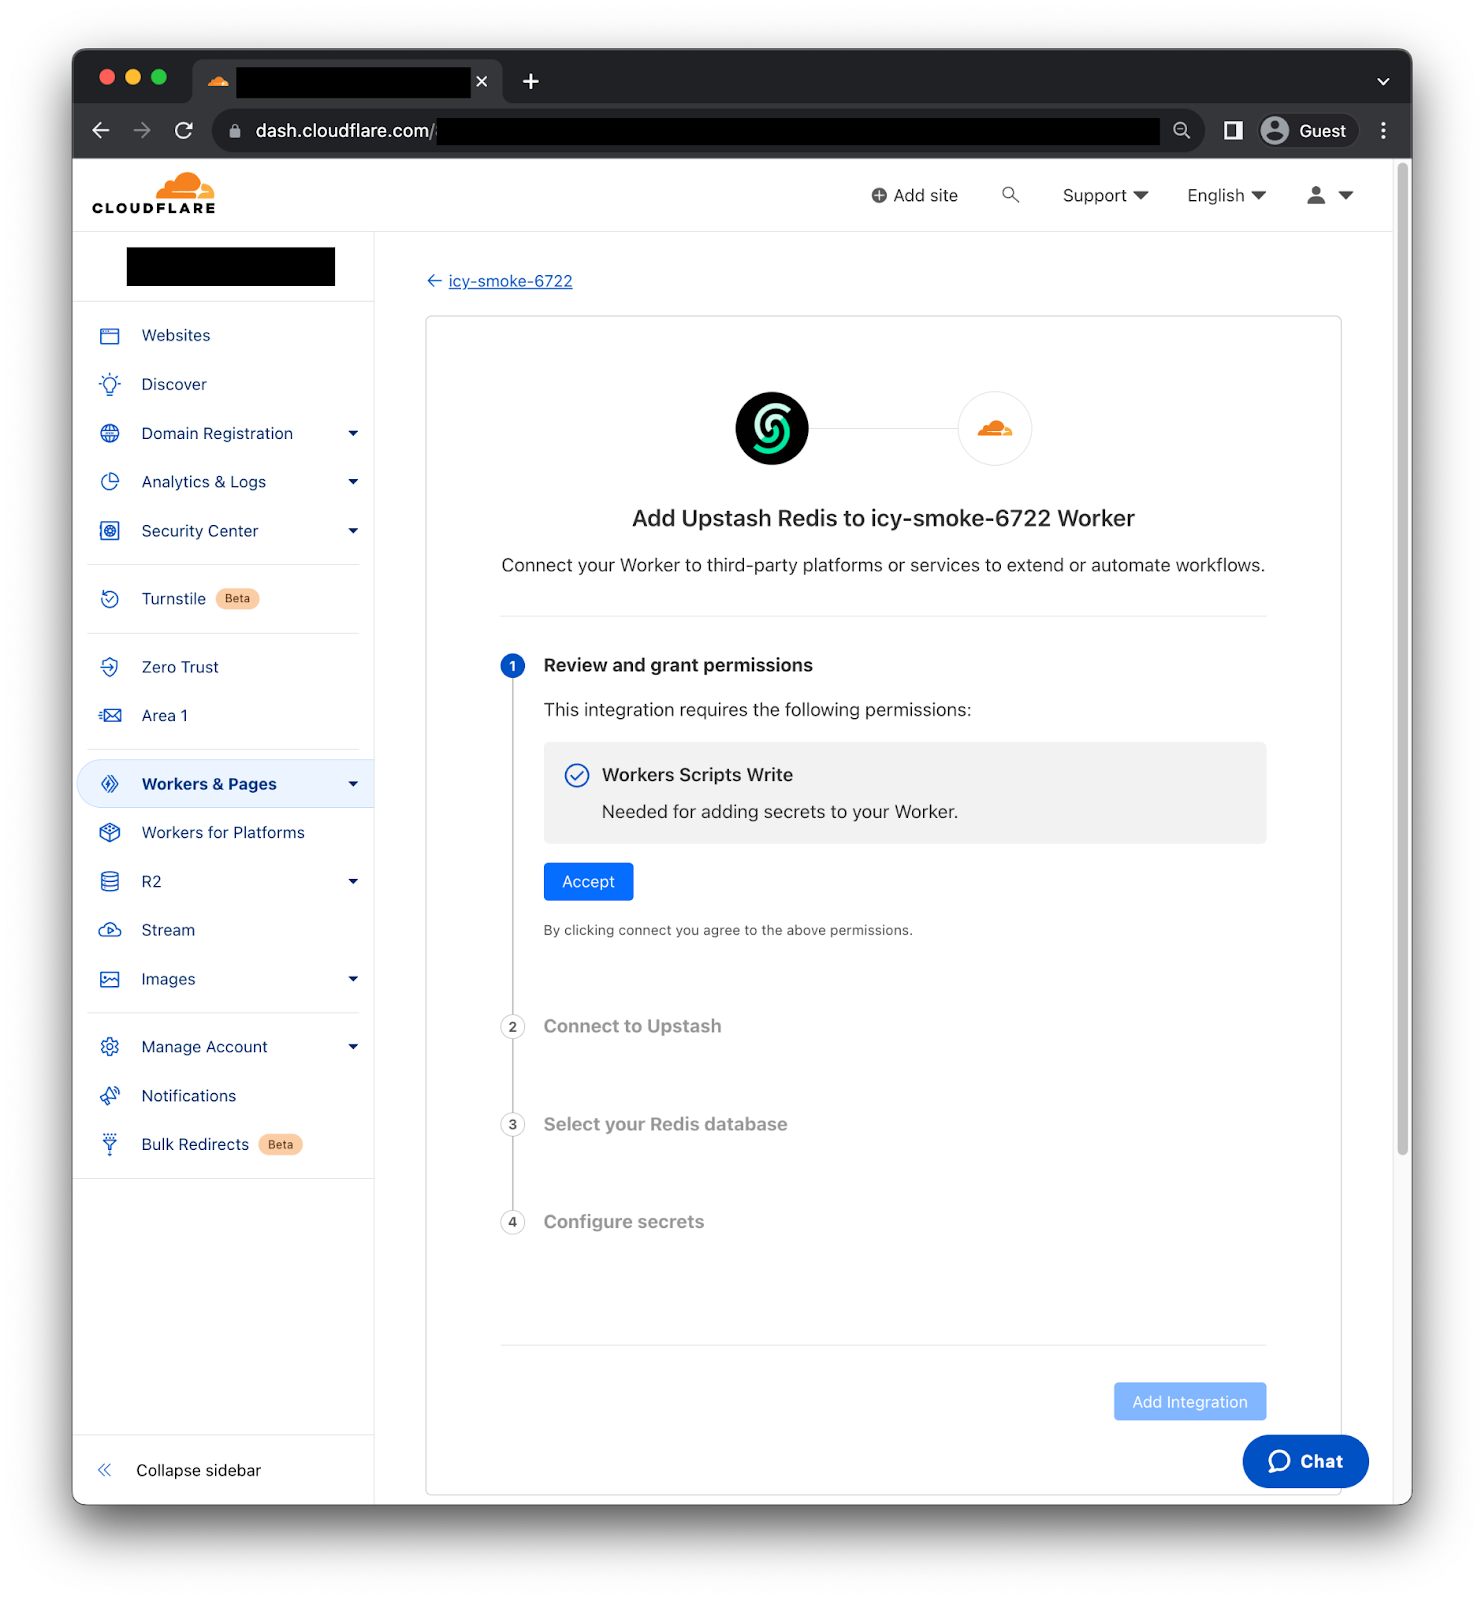
First, you need to review and grant permissions, so the Integration can add secrets to your Worker. Second, we need to connect to Upstash using the OAuth2 flow. Third, select the Redis database we want to use. Then, the Integration will fetch the right information to generate the credentials. Finally, click “Add Integration” and it's done! We can now use the credentials as environment variables on our Worker.

Implementation example

On this occasion we are going to use the CF-IPCountry  header to conditionally return a custom greeting message to visitors from Paraguay, United States, Great Britain and Netherlands. While returning a generic message to visitors from other countries.

To begin we are going to load the custom greeting messages using Upstash’s online CLI tool.

➜ set PY "Mba'ẽichapa 🇵🇾"
OK
➜ set US "How are you? 🇺🇸"
OK
➜ set GB "How do you do? 🇬🇧"
OK
➜ set NL "Hoe gaat het met u? 🇳🇱"
OK

We also need to install @upstash/redis package on our Worker before we upload the following code.

import { Redis } from '@upstash/redis/cloudflare'
 
export default {
  async fetch(request, env, ctx) {
    const country = request.headers.get("cf-ipcountry");
    const redis = Redis.fromEnv(env);
    if (country) {
      const localizedMessage = await redis.get(country);
      if (localizedMessage) {
        return new Response(localizedMessage);
      }
    }
    return new Response("👋👋 Hello there! 👋👋");
  },
};

Just like that we are returning a localized message from the Redis instance depending on the country which the request originated from. Furthermore, we have a couple ways to improve performance, for write heavy use cases we can use Smart Placement with no replicas, so the Worker code will be executed near the Redis instance provided by Upstash. Otherwise, creating a Global Database on Upstash to have multiple read replicas across regions will help.

Try it now

Upstash Redis, Kafka and QStash are now available for all users! Stay tuned for more updates as we continue to expand our Database Integrations catalog.

Easy Postgres integration on Cloudflare Workers with Neon.tech

Post Syndicated from Erwin van der Koogh original https://blog.cloudflare.com/neon-postgres-database-from-workers/

Easy Postgres integration on Cloudflare Workers with Neon.tech

Easy Postgres integration on Cloudflare Workers with Neon.tech

It’s no wonder that Postgres is one of the world’s favorite databases. It’s easy to learn, a pleasure to use, and can scale all the way up from your first database in an early-stage startup to the system of record for giant organizations. Postgres has been an integral part of Cloudflare’s journey, so we know this fact well. But when it comes to connecting to Postgres from environments like Cloudflare Workers, there are unfortunately a bunch of challenges, as we mentioned in our Relational Database Connector post.

Neon.tech not only solves these problems; it also has other cool features such as branching databases — being able to branch your database in exactly the same way you branch your code: instant, cheap and completely isolated.

How to use it

It’s easy to get started. Neon’s client library @neondatabase/serverless is a drop-in replacement for node-postgres, the npm pg package with which you may already be familiar. After going through the getting started process to set up your Neon database, you can easily create a Worker to ask Postgres for the current time like so:

  1. Create a new Worker — Run npx wrangler init neon-cf-demo and accept all the defaults. Enter the new folder with cd neon-cf-demo.
  2. Install the Neon package — Run npm install @neondatabase/serverless.
  3. Provide connection details — For deployment, run npx wrangler secret put DATABASE_URL and paste in your connection string when prompted (you’ll find this in your Neon dashboard: something like postgres://user:[email protected]/main). For development, create a new file .dev.vars with the contents DATABASE_URL= plus the same connection string.
  4. Write the code — Lastly, replace src/index.ts with the following code:

import { Client } from '@neondatabase/serverless';
interface Env { DATABASE_URL: string; }

export default {
  async fetch(request: Request, env: Env, ctx: ExecutionContext) {
    const client = new Client(env.DATABASE_URL);
    await client.connect();
    const { rows: [{ now }] } = await client.query('select now();');
    ctx.waitUntil(client.end());  // this doesn’t hold up the response
    return new Response(now);
  }
}

To try this locally, type npm start. To deploy it around the globe, type npx wrangler publish.

You can also check out the source for a slightly more complete demo app. This shows your nearest UNESCO World Heritage sites using IP geolocation in Cloudflare Workers and nearest-neighbor sorting in PostGIS.

Easy Postgres integration on Cloudflare Workers with Neon.tech

How does this work? In this case, we take the coordinates supplied to our Worker in request.cf.longitude and request.cf.latitude. We then feed these coordinates to a SQL query that uses the PostGIS distance operator <-> to order our results:

const { longitude, latitude } = request.cf
const { rows } = await client.query(`
  select 
    id_no, name_en, category,
    st_makepoint($1, $2) <-> location as distance
  from whc_sites_2021
  order by distance limit 10`,
  [longitude, latitude]
);

Since we created a spatial index on the location column, the query is blazing fast. The result (rows) looks like this:

[{
  "id_no": 308,
  "name_en": "Yosemite National Park",
  "category": "Natural",
  "distance": 252970.14782223428
},
{
  "id_no": 134,
  "name_en": "Redwood National and State Parks",
  "category": "Natural",
  "distance": 416334.3926827573
},
/* … */
]

For even lower latencies, we could cache these results at a slightly coarser geographical resolution — rounding, say, to one sixtieth of a degree (one arc minute) of longitude and latitude, which is a little under a mile.

Sign up to Neon using the invite code serverless and try the @neondatabase/serverless driver with Cloudflare Workers.

Why we did it

Cloudflare Workers has enormous potential to improve back-end development and deployment. It’s cost-effective, admin-free, and radically scalable.

The use of V8 isolates means Workers are now fast and lightweight enough for nearly any use case. But it has a key drawback: Cloudflare Workers don’t yet support raw TCP communication, which has made database connections a challenge.

Even when Workers eventually support raw TCP communication, we will not have fully solved our problem, because database connections are expensive to set up and also have quite a bit of memory overhead.

This is what the solution looks like:

Easy Postgres integration on Cloudflare Workers with Neon.tech

It consists of three parts:

  1. Connection pooling built into the platform — Given Neon’s serverless compute model, splitting storage and compute operations, it is not recommended to rely on a one-to-one mapping between external clients and Postgres connections. Instead, you can turn on connection pooling simply by flicking a switch (it’s in the Settings area of your Neon dashboard).
  2. WebSocket proxy — We deploy our own WebSocket-to-TCP proxy, written in Go. The proxy simply accepts WebSocket connections from Cloudflare Worker clients, relays message payloads to a requested (Neon-only) host over plain TCP, and relays back the responses.
  3. Client library — Our driver library is based on node-postgres but provides the necessary shims for Node.js features that aren’t present in Cloudflare Workers. Crucially, we replace Node’s net.Socket and tls.connect with code that redirects network reads and writes via the WebSocket connection. To support end-to-end TLS encryption between Workers and the database, we compile WolfSSL to WebAssembly with emscripten. Then we use esbuild to bundle it all together into an easy-to-use npm package.

The @neondatabase/serverless package is currently in public beta. We have plans to improve, extend, and explain it further in the near future on the Neon blog. In line with our commitment to open source, you can configure our serverless driver and/or run our WebSocket proxy to provide access to Postgres databases hosted anywhere — just see the respective repos for details.

So try Neon using invite code serverless, sign up and connect to it with Cloudflare Workers, and you’ll have a fully flexible back-end service running in next to no time.

Streamlining evidence collection with AWS Audit Manager

Post Syndicated from Nicholas Parks original https://aws.amazon.com/blogs/security/streamlining-evidence-collection-with-aws-audit-manager/

In this post, we will show you how to deploy a solution into your Amazon Web Services (AWS) account that enables you to simply attach manual evidence to controls using AWS Audit Manager. Making evidence-collection as seamless as possible minimizes audit fatigue and helps you maintain a strong compliance posture.

As an AWS customer, you can use APIs to deliver high quality software at a rapid pace. If you have compliance-focused teams that rely on manual, ticket-based processes, you might find it difficult to document audit changes as those changes increase in velocity and volume.

As your organization works to meet audit and regulatory obligations, you can save time by incorporating audit compliance processes into a DevOps model. You can use modern services like Audit Manager to make this easier. Audit Manager automates evidence collection and generates reports, which helps reduce manual auditing efforts and enables you to scale your cloud auditing capabilities along with your business.

AWS Audit Manager uses services such as AWS Security Hub, AWS Config, and AWS CloudTrail to automatically collect and organize evidence, such as resource configuration snapshots, user activity, and compliance check results. However, for controls represented in your software or processes without an AWS service-specific metric to gather, you need to manually create and provide documentation as evidence to demonstrate that you have established organizational processes to maintain compliance. The solution in this blog post streamlines these types of activities.

Solution architecture

This solution creates an HTTPS API endpoint, which allows integration with other software development lifecycle (SDLC) solutions, IT service management (ITSM) products, and clinical trial management systems (CTMS) solutions that capture trial process change amendment documentation (in the case of pharmaceutical companies who use AWS to build robust pharmacovigilance solutions). The endpoint can also be a backend microservice to an application that allows contract research organizations (CRO) investigators to add their compliance supporting documentation.

In this solution’s current form, you can submit an evidence file payload along with the assessment and control details to the API and this solution will tie all the information together for the audit report. This post and solution is directed towards engineering teams who are looking for a way to accelerate evidence collection. To maximize the effectiveness of this solution, your engineering team will also need to collaborate with cross-functional groups, such as audit and business stakeholders, to design a process and service that constructs and sends the message(s) to the API and to scale out usage across the organization.

To download the code for this solution, and the configuration that enables you to set up auto-ingestion of manual evidence, see the aws-audit-manager-manual-evidence-automation GitHub repository.

Architecture overview

In this solution, you use AWS Serverless Application Model (AWS SAM) templates to build the solution and deploy to your AWS account. See Figure 1 for an illustration of the high-level architecture.

Figure 1. The architecture of the AWS Audit Manager automation solution

Figure 1. The architecture of the AWS Audit Manager automation solution

The SAM template creates resources that support the following workflow:

  1. A client can call an Amazon API Gateway endpoint by sending a payload that includes assessment details and the evidence payload.
  2. An AWS Lambda function implements the API to handle the request.
  3. The Lambda function uploads the evidence to an Amazon Simple Storage Service (Amazon S3) bucket (3a) and uses AWS Key Management Service (AWS KMS) to encrypt the data (3b).
  4. The Lambda function also initializes the AWS Step Functions workflow.
  5. Within the Step Functions workflow, a Standard Workflow calls two Lambda functions. The first looks for a matching control within an assessment, and the second updates the control within the assessment with the evidence.
  6. When the Step Functions workflow concludes, it sends a notification for success or failure to subscribers of an Amazon Simple Notification Service (Amazon SNS) topic.

Deploy the solution

The project available in the aws-audit-manager-manual-evidence-automation GitHub repository contains source code and supporting files for a serverless application you can deploy with the AWS SAM command line interface (CLI). It includes the following files and folders:

src Code for the application’s Lambda implementation of the Step Functions workflow.
It also includes a Step Functions definition file.
template.yml A template that defines the application’s AWS resources.

Resources for this project are defined in the template.yml file. You can update the template to add AWS resources through the same deployment process that updates your application code.

Prerequisites

This solution assumes the following:

  1. AWS Audit Manager is enabled.
  2. You have already created an assessment in AWS Audit Manager.
  3. You have the necessary tools to use the AWS SAM CLI (see details in the table that follows).

For more information about setting up Audit Manager and selecting a framework, see Getting started with Audit Manager in the blog post AWS Audit Manager Simplifies Audit Preparation.

The AWS SAM CLI is an extension of the AWS CLI that adds functionality for building and testing Lambda applications. The AWS SAM CLI uses Docker to run your functions in an Amazon Linux environment that matches Lambda. It can also emulate your application’s build environment and API.

To use the AWS SAM CLI, you need the following tools:

AWS SAM CLI Install the AWS SAM CLI
Node.js Install Node.js 14, including the npm package management tool
Docker Install Docker community edition

To deploy the solution

  1. Open your terminal and use the following command to create a folder to clone the project into, then navigate to that folder. Be sure to replace <FolderName> with your own value.

    mkdir Desktop/<FolderName> && cd $_

  2. Clone the project into the folder you just created by using the following command.

    git clone https://github.com/aws-samples/aws-audit-manager-manual-evidence-automation.git

  3. Navigate into the newly created project folder by using the following command.

    cd aws-audit-manager-manual-evidence-automation

  4. In the AWS SAM shell, use the following command to build the source of your application.

    sam build

  5. In the AWS SAM shell, use the following command to package and deploy your application to AWS. Be sure to replace <DOC-EXAMPLE-BUCKET> with your own unique S3 bucket name.

    sam deploy –guided –parameter-overrides paramBucketName=<DOC-EXAMPLE-BUCKET>

  6. When prompted, enter the AWS Region where AWS Audit Manager was configured. For the rest of the prompts, leave the default values.
  7. To activate the IAM authentication feature for API gateway, override the default value by using the following command.

    paramUseIAMwithGateway=AWS_IAM

To test the deployed solution

After you deploy the solution, run an invocation like the one below for an assessment (using curl). Be sure to replace <YOURAPIENDPOINT> and <AWS REGION> with your own values.

curl –location –request POST
‘https://<YOURAPIENDPOINT>.execute-api.<AWS REGION>.amazonaws.com/Prod’ \
–header ‘x-api-key: ‘ \
–form ‘payload=@”<PATH TO FILE>”‘ \
–form ‘AssessmentName=”GxP21cfr11″‘ \
–form ‘ControlSetName=”General requirements”‘ \
–form ‘ControlIdName=”11.100(a)”‘

Check to see that your file is correctly attached to the control for your assessment.

Form-data interface parameters

The API implements a form-data interface that expects four parameters:

  1. AssessmentName: The name for the assessment in Audit Manager. In this example, the AssessmentName is GxP21cfr11.
  2. ControlSetName: The display name for a control set within an assessment. In this example, the ControlSetName is General requirements.
  3. ControlIdName: this is a particular control within a control set. In this example, the ControlIdName is 11.100(a).
  4. Payload: this is the file representing evidence to be uploaded.

As a refresher of Audit Manager concepts, evidence is collected for a particular control. Controls are grouped into control sets. Control sets can be grouped into a particular framework. The assessment is considered an implementation, or an instance, of the framework. For more information, see AWS Audit Manager concepts and terminology.

To clean up the deployed solution

To clean up the solution, use the following commands to delete the AWS CloudFormation stack and your S3 bucket. Be sure to replace <YourStackId> and <DOC-EXAMPLE-BUCKET> with your own values.

aws cloudformation delete-stack –stack-name <YourStackId>
aws s3 rb s3://<DOC-EXAMPLE-BUCKET> –force

Conclusion

This solution provides a way to allow for better coordination between your software delivery organization and compliance professionals. This allows your organization to continuously deliver new updates without overwhelming your security professionals with manual audit review tasks.

Next steps

There are various ways to extend this solution.

  1. Update the API Lambda implementation to be a webhook for your favorite software development lifecycle (SDLC) or IT service management (ITSM) solution.
  2. Modify the steps within the Step Functions state machine to more closely match your unique compliance processes.
  3. Use AWS CodePipeline to start Step Functions state machines natively, or integrate a variation of this solution with any continuous compliance workflow that you have.

Learn more AWS Audit Manager, DevOps, and AWS for Health and start building!

 
If you have feedback about this post, submit comments in the Comments section below. If you have questions about this post, contact AWS Support.

Want more AWS Security news? Follow us on Twitter.

Nicholas Parks

Nicholas Parks

Nicholas has been using AWS since 2010 across various enterprise verticals including healthcare, life sciences, financial, retail, and telecommunications. Nicholas focuses on modernizations in pursuit of new revenue as well as application migrations. He specializes in Lean, DevOps cultural change, and Continuous Delivery.

Brian Tang

Brian Tang

Brian Tang is an AWS Solutions Architect based out of Boston, MA. He has 10 years of experience helping enterprise customers across a wide range of industries complete digital transformations by migrating business-critical workloads to the cloud. His core interests include DevOps and serverless-based solutions. Outside of work, he loves rock climbing and playing guitar.

Continuous runtime security monitoring with AWS Security Hub and Falco

Post Syndicated from Rajarshi Das original https://aws.amazon.com/blogs/security/continuous-runtime-security-monitoring-with-aws-security-hub-and-falco/

Customers want a single and comprehensive view of the security posture of their workloads. Runtime security event monitoring is important to building secure, operationally excellent, and reliable workloads, especially in environments that run containers and container orchestration platforms. In this blog post, we show you how to use services such as AWS Security Hub and Falco, a Cloud Native Computing Foundation project, to build a continuous runtime security monitoring solution.

With the solution in place, you can collect runtime security findings from multiple AWS accounts running one or more workloads on AWS container orchestration platforms, such as Amazon Elastic Kubernetes Service (Amazon EKS) or Amazon Elastic Container Service (Amazon ECS). The solution collates the findings across those accounts into a designated account where you can view the security posture across accounts and workloads.


Solution overview

Security Hub collects security findings from other AWS services using a standardized AWS Security Findings Format (ASFF). Falco provides the ability to detect security events at runtime for containers. Partner integrations like Falco are also available on Security Hub and use ASFF. Security Hub provides a custom integrations feature using ASFF to enable collection and aggregation of findings that are generated by custom security products.

The solution in this blog post uses AWS FireLens, Amazon CloudWatch Logs, and AWS Lambda to enrich logs from Falco and populate Security Hub.

Figure : Architecture diagram of continuous runtime security monitoring

Figure 1: Architecture diagram of continuous runtime security monitoring

Here’s how the solution works, as shown in Figure 1:

  1. An AWS account is running a workload on Amazon EKS.
    1. Runtime security events detected by Falco for that workload are sent to CloudWatch logs using AWS FireLens.
    2. CloudWatch logs act as the source for FireLens and a trigger for the Lambda function in the next step.
    3. The Lambda function transforms the logs into the ASFF. These findings can now be imported into Security Hub.
    4. The Security Hub instance that is running in the same account as the workload running on Amazon EKS stores and processes the findings provided by Lambda and provides the security posture to users of the account. This instance also acts as a member account for Security Hub.
  2. Another AWS account is running a workload on Amazon ECS.
    1. Runtime security events detected by Falco for that workload are sent to CloudWatch logs using AWS FireLens.
    2. CloudWatch logs acts as the source for FireLens and a trigger for the Lambda function in the next step.
    3. The Lambda function transforms the logs into the ASFF. These findings can now be imported into Security Hub.
    4. The Security Hub instance that is running in the same account as the workload running on Amazon ECS stores and processes the findings provided by Lambda and provides the security posture to users of the account. This instance also acts as another member account for Security Hub.
  3. The designated Security Hub administrator account combines the findings generated by the two member accounts, and then provides a comprehensive view of security alerts and security posture across AWS accounts. If your workloads span multiple regions, Security Hub supports aggregating findings across Regions.


Prerequisites

For this walkthrough, you should have the following in place:

  1. Three AWS accounts.

    Note: We recommend three accounts so you can experience Security Hub’s support for a multi-account setup. However, you can use a single AWS account instead to host the Amazon ECS and Amazon EKS workloads, and send findings to Security Hub in the same account. If you are using a single account, skip the following account specific-guidance. If you are integrated with AWS Organizations, the designated Security Hub administrator account will automatically have access to the member accounts.

  2. Security Hub set up with an administrator account on one account.
  3. Security Hub set up with member accounts on two accounts: one account to host the Amazon EKS workload, and one account to host the Amazon ECS workload.
  4. Falco set up on the Amazon EKS and Amazon ECS clusters, with logs routed to CloudWatch Logs using FireLens. For instructions on how to do this, see:

    Important: Take note of the names of the CloudWatch Logs groups, as you will need them in the next section.

  5. AWS Cloud Development Kit (CDK) installed on the member accounts to deploy the solution that provides the custom integration between Falco and Security Hub.


Deploying the solution

In this section, you will learn how to deploy the solution and enable the CloudWatch Logs group. Enabling the CloudWatch Logs group is the trigger for running the Lambda function in both member accounts.

To deploy this solution in your own account

  1. Clone the aws-securityhub-falco-ecs-eks-integration GitHub repository by running the following command.
    $git clone https://github.com/aws-samples/aws-securityhub-falco-ecs-eks-integration
  2. Follow the instructions in the README file provided on GitHub to build and deploy the solution. Make sure that you deploy the solution to the accounts hosting the Amazon EKS and Amazon ECS clusters.
  3. Navigate to the AWS Lambda console and confirm that you see the newly created Lambda function. You will use this function in the next section.
Figure : Lambda function for Falco integration with Security Hub

Figure 2: Lambda function for Falco integration with Security Hub

To enable the CloudWatch Logs group

  1. In the AWS Management Console, select the Lambda function shown in Figure 2—AwsSecurityhubFalcoEcsEksln-lambdafunction—and then, on the Function overview screen, select + Add trigger.
  2. On the Add trigger screen, provide the following information and then select Add, as shown in Figure 3.
    • Trigger configuration – From the drop-down, select CloudWatch logs.
    • Log group – Choose the Log group you noted in Step 4 of the Prerequisites. In our setup, the log group for the Amazon ECS and Amazon EKS clusters, deployed in separate AWS accounts, was set with the same value (falco).
    • Filter name – Provide a name for the filter. In our example, we used the name falco.
    • Filter pattern – optional – Leave this field blank.
    Figure 3: Lambda function trigger - CloudWatch Log group

    Figure 3: Lambda function trigger – CloudWatch Log group

  3. Repeat these steps (as applicable) to set up the trigger for the Lambda function deployed in other accounts.


Testing the deployment

Now that you’ve deployed the solution, you will verify that it’s working.

With the default rules, Falco generates alerts for activities such as:

  • An attempt to write to a file below the /etc folder. The /etc folder contains important system configuration files.
  • An attempt to open a sensitive file (such as /etc/shadow) for reading.

To test your deployment, you will attempt to perform these activities to generate Falco alerts that are reported as Security Hub findings in the same account. Then you will review the findings.

To test the deployment in member account 1

  1. Run the following commands to trigger an alert in member account 1, which is running an Amazon EKS cluster. Replace <container_name> with your own value.
    kubectl exec -it <container_name> /bin/bash
    touch /etc/5
    cat /etc/shadow > /dev/null
  2. To see the list of findings, log in to your Security Hub admin account and navigate to Security Hub > Findings. As shown in Figure 4, you will see the alerts generated by Falco, including the Falco-generated title, and the instance where the alert was triggered.

    Figure 4: Findings in Security Hub

    Figure 4: Findings in Security Hub

  3. To see more detail about a finding, check the box next to the finding. Figure 5 shows some of the details for the finding Read sensitive file untrusted.
    Figure 5: Sensitive file read finding - detail view

    Figure 5: Sensitive file read finding – detail view

    Figure 6 shows the Resources section of this finding, that includes the instance ID of the Amazon EKS cluster node. In our example this is the Amazon Elastic Compute Cloud (Amazon EC2) instance.

    Figure 6: Resource Detail in Security Hub finding

To test the deployment in member account 2

  1. Run the following commands to trigger a Falco alert in member account 2, which is running an Amazon ECS cluster. Replace <<container_id> with your own value.
    docker exec -it <container_id> bash
    touch /etc/5
    cat /etc/shadow > /dev/null
  2. As in the preceding example with member account 1, to view the findings related to this alert, navigate to your Security Hub admin account and select Findings.

To view the collated findings from both member accounts in Security Hub

  1. In the designated Security Hub administrator account, navigate to Security Hub > Findings. The findings from both member accounts are collated in the designated Security Hub administrator account. You can use this centralized account to view the security posture across accounts and workloads. Figure 7 shows two findings, one from each member account, viewable in the Single Pane of Glass administrator account.

    Figure 7: Write below /etc findings in a single view

    Figure 7: Write below /etc findings in a single view

  2. To see more information and a link to the corresponding member account where the finding was generated, check the box next to the finding. Figure 8 shows the account detail associated with a specific finding in member account 1.
    Figure 8: Write under /etc detail view in Security Hub admin account

    Figure 8: Write under /etc detail view in Security Hub admin account

    By centralizing and enriching the findings from Falco, you can take action more quickly or perform automated remediation on the impacted resources.


Cleaning up

To clean up this demo:

  1. Delete the CloudWatch Logs trigger from the Lambda functions that were created in the section To enable the CloudWatch Logs group.
  2. Delete the Lambda functions by deleting the CloudFormation stack, created in the section To deploy this solution in your own account.
  3. Delete the Amazon EKS and Amazon ECS clusters created as part of the Prerequisites.


Conclusion

In this post, you learned how to achieve multi-account continuous runtime security monitoring for container-based workloads running on Amazon EKS and Amazon ECS. This is achieved by creating a custom integration between Falco and Security Hub.

You can extend this solution in a number of ways. For example:

  • You can forward findings across accounts using a single source to security information and event management (SIEM) tools such as Splunk.
  • You can perform automated remediation activities based on the findings generated, using Lambda.

To learn more about managing a centralized Security Hub administrator account, see Managing administrator and member accounts. To learn more about working with ASFF, see AWS Security Finding Format (ASFF) in the documentation. To learn more about the Falco engine and rule structure, see the Falco documentation.

If you have feedback about this post, submit comments in the Comments section below.

Want more AWS Security news? Follow us on Twitter.

Rajarshi Das

Rajarshi Das

Rajarshi is a Solutions Architect at Amazon Web Services. He focuses on helping Public Sector customers accelerate their security and compliance certifications and authorizations by architecting secure and scalable solutions. Rajarshi holds 4 AWS certifications including AWS Certified Solutions Architect – Professional and AWS Certified Security – Specialist.

Author

Adam Cerini

Adam is a Senior Solutions Architect with Amazon Web Services. He focuses on helping Public Sector customers architect scalable, secure, and cost effective systems. Adam holds 5 AWS certifications including AWS Certified Solutions Architect – Professional and AWS Certified Security – Specialist.

Advanced Zabbix API – 5 API use cases to improve your API workfows

Post Syndicated from Arturs Lontons original https://blog.zabbix.com/advanced-zabbix-api-5-api-use-cases-to-improve-your-api-workfows/16801/

As your monitoring infrastructures evolve, you might hit a point when there’s no avoiding using the Zabbix API. The Zabbix API can be used to automate a particular part of your day-to-day workflow, troubleshoot your monitoring or to simply analyze or get statistics about a specific set of entities.

In this blog post, we will take a look at some of the more advanced API methods and specific method parameters and learn how they can be used to improve your API workflows.

1. Count entities with CountOutput

Let’s start with gathering some statistics. Let’s say you have to count the number of some matching entities – here we can use the CountOutput parameter. For a more advanced use case – what if we have to count the number of events for some time period? Let’s combine countOutput with time_from and time_till (in unixtime) and get the number of events created for the month of November. Let’s get all of the events for the month of November that have the Disaster severity:

{
"jsonrpc": "2.0",
"method": "event.get",
"params": {
"output": "extend",
"time_from": "1635717600",
"time_till": "1638223200",
"severities": "5",
"countOutput": "true"
},
"auth": "xxxxxx",
"id": 1
}

2. Use API to perform Configuration export/import

Next, let’s take a look at how we can use the configuration.export method to export one of our templates in yaml:

{
"jsonrpc": "2.0",
"method": "configuration.export",
"params": {
"options": {
"templates": [
"10001"
]
},
"format": "yaml"
},
"auth": "xxxxxx",
"id": 1
}

Now let’s copy and paste the result of the export and import the template into another environment. It’s extremely important to remember that for this method to work exactly as we intend to, we need to include the parameters that specify the behavior of particular entities contained in the configuration string, such as items/value maps/templates, etc. For example, if I exclude the templates parameter here, no templates will be imported.

{
"jsonrpc": "2.0",
"method": "configuration.import",
"params": {
"format": "yaml",
"rules": {
"valueMaps": {
"createMissing": true,
"updateExisting": true
},
"items": {
"createMissing": true,
"updateExisting": true,
"deleteMissing": true
},
"templates": {
"createMissing": true,
"updateExisting": true
},

"templateLinkage": {
"createMissing": true
}
},
"source": "zabbix_export:\n version: '5.4'\n date: '2021-11-13T09:31:29Z'\n groups:\n -\n uuid: 846977d1dfed4968bc5f8bdb363285bc\n name: 'Templates/Operating systems'\n templates:\n -\n uuid: e2307c94f1744af7a8f1f458a67af424\n template: 'Linux by Zabbix agent active'\n name: 'Linux by Zabbix agent active'\n 
...
},
"auth": "xxxxxx",
"id": 1
}

3. Expand trigger functions and macros with expand parameters

Using trigger.get to obtain information about a particular set of triggers is a relatively common practice. One particular caveat that we have to consider is that by default macros in trigger name, expression or descriptions are not expanded. To expand the available macros we need to use the expand parameters:

{
"jsonrpc": "2.0",
"method": "trigger.get",
"params": {
"triggerids": "18135",
"output": "extend",
"expandExpression":"1",
"selectFunctions": "extend"
},
"auth": "xxxxxx",
"id": 1
}

4. Obtaining additional LLD information for a discovered item

If we wish to display additional LLD information for a discovered entity, in this case – an item, we can use the selectDiscoveryRule and selectItemDiscovery parameters.
While selectDiscoveryRule will provide the ID of the LLD rule that created the item, selectItemDiscovery can point us at the parent item prototype id from which the item was created, last discovery time, item prototype key, and more.

The example below will return the item details and will also provide the LLD rule and Item prototype IDs, the time when the lost item will be deleted and the last time the item was discovered:

{
"jsonrpc": "2.0",
"method": "item.get",
"params": {
"itemids":"36717",
"selectDiscoveryRule":"1",
"selectItemDiscovery":["lastcheck","ts_delete","parent_itemid"]
}, "auth":"xxxxxx",
"id": 1
}

5. Searching through the matched entities with search parameters

Zabbix API provides a couple of standard parameters for performing a search. With search parameter, we can search string or text fields and try to find objects based on a single or multiple entries. searchByAny parameter is capable of extending the search – if you set this as true, we will search by ANY of the criteria in the search array, instead of trying to find an entity that matches ALL of them (default behavior).

The following API call will find items that match agent and Zabbix keys on a particular template:

{
"jsonrpc": "2.0",
"method": "item.get",
"params": {
"output": "extend",
"templateids": "10001",
"search": {
"key_": ["agent.","zabbix"]
},
"searchByAny":"true",
"sortfield": "name"
},
"auth": "xxxxxx",
"id": 1
}

Feel free to take the above examples, change them around so they fit your use case and you should be able to quite easily implement them in your environment. There are many other use cases that we might potentially cover down the line – if you have a specific API use case that you wish for us to cover, feel free to leave a comment under this post and we just might cover it in one of the upcoming blog posts!

Integrating Amazon Connect and Amazon Lex with Third-party Systems

Post Syndicated from Steven Warwick original https://aws.amazon.com/blogs/architecture/integrating-amazon-connect-and-amazon-lex-with-third-party-systems/

AWS customers who provide software solutions that integrate with AWS often require design patterns that offer some flexibility. They must build, support, and expand products and solutions to meet their end user business requirements. These design patterns must use the underlying services and infrastructure through API operations. As we will show, third-party solutions can integrate with Amazon Connect to initiate customer-specific workflows. You don’t need specific utterances when using Amazon Lex to convert speech to text.

Introduction to Amazon Connect workflows

Platform as a service (PaaS) systems are built to handle a variety of use cases with various inputs. These inputs are provided by upstream systems and sometimes result in complex integrations. For example, when creating a call center management solution, these workflows may require opaque transcription data to be sent to downstream third-party system. This pattern allows the caller to interact with a third-party system with an Amazon Connect flow. The solution allows for communication to occur multiple times. Opaque transcription data is transferred between the Amazon Connect contact flow, through Amazon Lex, and then to the third-party system. The third-party system can modify and update workflows without affecting the Amazon Connect or Amazon Lex systems.

API workflow use case

AnyCompany Tech (our hypothetical company) is a PaaS company that allows other companies to quickly build workflows with their tools. It provides the ability to take customer calls with a request-response style interaction. AnyCompany built an API into the Amazon Connect flow to allow their end users to return various response types. Examples of the response types are “disconnect,” “speak,” and “failed.”

Using Amazon Connect, AnyCompany allows their end users to build complex workflows using a basic question-response API. Each customer of AnyCompany can build workflows that respond to a voice input. It is processed via the high-quality speech recognition and natural language understanding capabilities of Amazon Lex. The caller is prompted by “What is your question?” Amazon Lex processes the audio input then invokes a Lambda function that connects to AnyCompany Tech. They in turn initiate their customer’s unique workflow. The customer’s workflow may change over time without requiring any further effort from AnyCompany Tech.

Questions graph database use case

AnyCompany Storage is a company that has a graph database that stores documents and information correlating the business to its inventory, sales, marketing, and employees. Accessing this database will be done via a question-response API. For example, such questions might be: “What are our third quarter earnings?”, “Do we have product X in stock?”, or “When was Jane Doe hired?” The company wants the ability to have their employees call in and after proper authentication, ask any question of the system and receive a response. Using the architecture in Figure 1, the company can link their Amazon Connect implementation up to this API. The output from Amazon Lex is passed into the API, a response is received, and it is then passed to Amazon Connect.

Amazon Connect third-party system architecture

Figure 1. End-customer call flow

Figure 1. End-customer call flow

  1. User calls Amazon Connect using the telephone number for the connect instance.
  2. Amazon Connect receives the incoming call and starts an Amazon Connect contact flow. This Amazon Connect flow captures the caller’s utterance and forwards it to Amazon Lex.
  3. Amazon Lex starts the requested bot. The Amazon Lex bot translates the caller’s utterance into text and sends it to AWS Lambda via an event.
  4. AWS Lambda accepts the incoming data, transforms or enhances it as needed, and calls out to the external API via some transport
  5. The external API processes the content sent to it from AWS Lambda.
  6. The external API returns a response back to AWS Lambda.
  7. AWS Lambda accepts the response from the external API, then forwards this response to Amazon Lex.
  8. Amazon Lex returns the response content to Amazon Connect.
  9. Amazon Connect processes the response.

Solution components

Amazon Connect

Amazon Connect allows customer calls to get information from the third-party system. An Amazon Connect contact flow is required to get the callers input, which is then sent to Amazon Lex. The Amazon Lex bot must be granted permission to interact with an Amazon Connect contact flow. As shown in Figure 2, the Get customer input block must call the fallback intent of the Amazon Lex bot. Figure 2 demonstrates a basic flow used to get input, check the response, and perform an action.

Figure 2. Basic Amazon Connect contact flow to integrate with Amazon Lex

Figure 2. Basic Amazon Connect contact flow to integrate with Amazon Lex

Amazon Lex

Amazon Lex converts the voice given by a caller into text, which is then processed by a Lambda function. When setting up the Amazon Lex bot you will require one fallback intent (Figure 3), one unused intent (Figure 4), and one clarification prompts disabled (Figure 5).

Figure 3. Amazon Lex fallback intent

Figure 3. Amazon Lex fallback intent

The fallback intent is created by using the pre-defined AMAZON.FallbackIntent and must be set up to call a Lambda function in the Fulfillment section. Using the fallback intent and Lambda fulfillment causes the system to ignore any utterance pattern and pass any translation directly to the Lambda function.

Figure 4. Amazon Lex unused intent

Figure 4. Amazon Lex unused intent

The unused intent is only created to satisfy Amazon Lex’s requirement for a bot to have at least one custom intent with a valid utterance.

Figure 5. Amazon Lex error handling clarification prompts

Figure 5. Amazon Lex error handling clarification prompts

In the error handling section of the Amazon Lex bot, the clarification prompts must be disabled. Disabling the clarification prompts stops the Amazon Lex bot from asking the caller to clarify the input.

AWS Lambda

AWS Lambda is called by Amazon Lex, which is used to interact with the third-party system. The third-party system will return values, which the Lambda will add to its session attributes resulting object. The resulting object from AWS Lambda requires the dialog action to be set up with the type set to “Close,” fulfillmentState set to “Fulfilled,” and the message contentType set to “CustomPayload”. This will allow Amazon Lex to pass the values to Amazon Connect without speaking the results to the caller.

Conclusion

In this blog we showed how Amazon Connect, Amazon Lex, and AWS Lambda functions can be used together to create common interactions with third-party systems. This is a flexible architecture and requires few changes to the Amazon Connect contact flow. You don’t have to set up pre-defined utterances that limit the allowed inputs. Using this solution, AWS customers can provide flexible solutions that interact with third-party systems.

Related information