On the week of Black Friday, Cloudflare automatically detected and mitigated a unique ACK DDoS attack, which we’ve codenamed “Beat”, that targeted a Magic Transit customer. Usually, when attacks make headlines, it’s because of their size. However, in this case, it’s not the size that is unique but the method that appears to have been borrowed from the world of acoustics.
Acoustic inspired attack
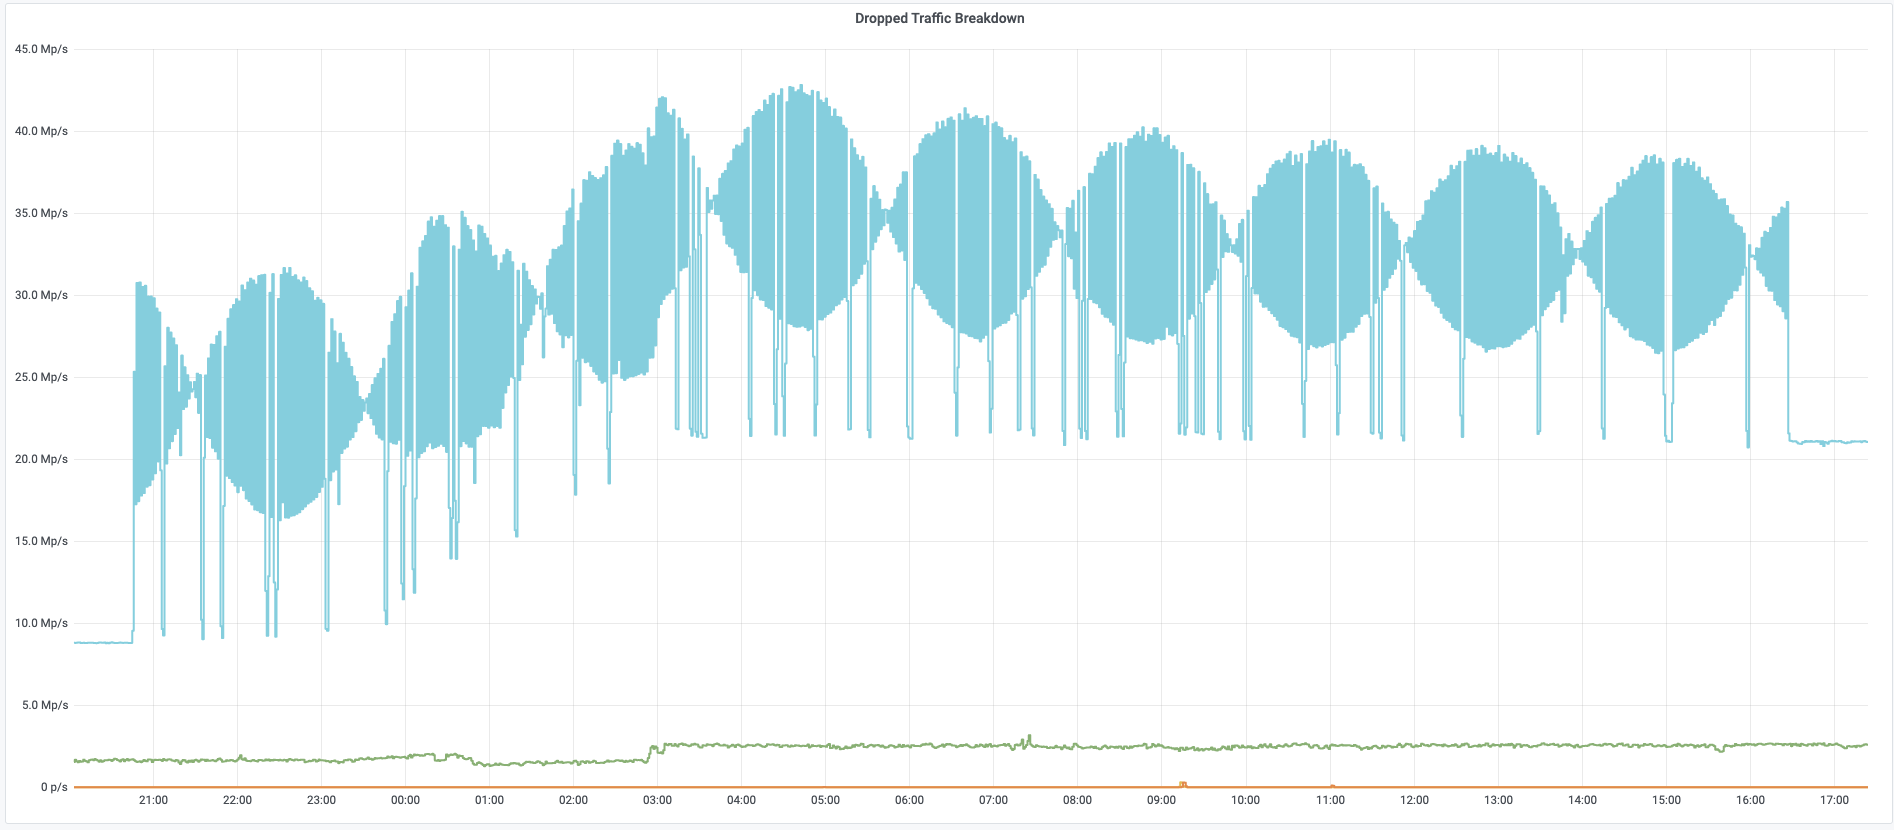
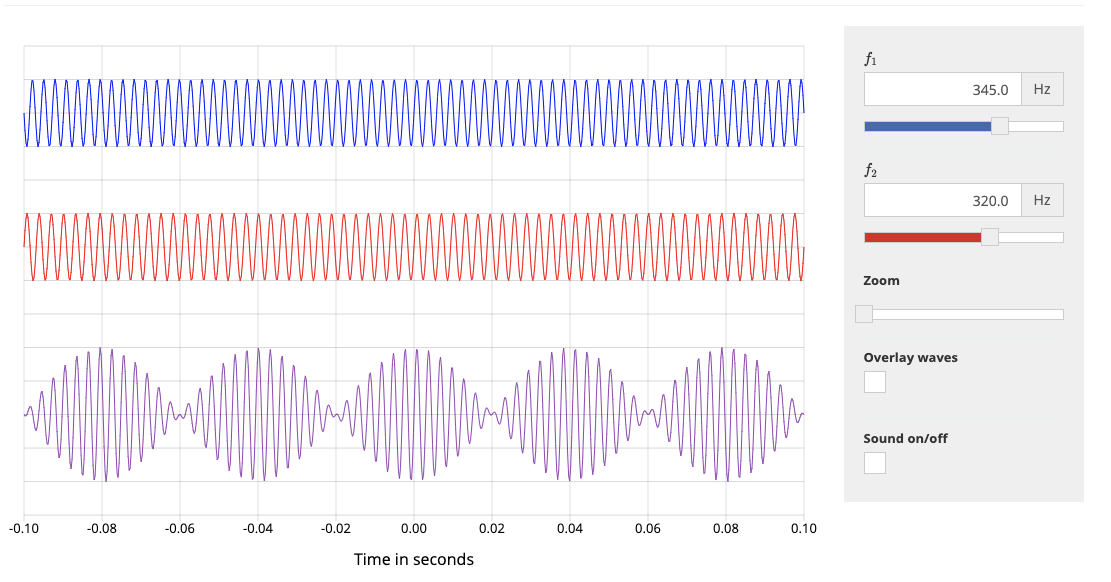
As can be seen in the graph below, the attack’s packet rate follows a wave-shaped pattern for over 8 hours. It seems as though the attacker was inspired by an acoustics concept called beat. In acoustics, a beat is a term that is used to describe an interference of two different wave frequencies. It is the superposition of the two waves. When the two waves are nearly 180 degrees out of phase, they create the beating phenomenon. When the two waves merge they amplify the sound and when they are out of sync they cancel one another, creating the beating effect.
Beat DDoS Attack
Acedemo.org has a nice tool where you can create your own beat wave. As you can see in the screenshot below, the two waves in blue and red are out of phase and the purple wave is their superposition, the beat wave.
It looks like the attacker launched a flood of packets where the rate of the packets is determined by the equation of the beat wave: y‘beat=y1+y2. The two equations y1 and y2 represent the two waves.
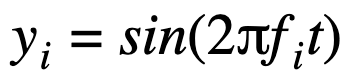
Each equation is expressed as
where fi is the frequency of each wave and t is time.
Therefore, the packet rate of the attack is determined by manipulation of the equation
to achieve a packet rate that ranges from ~18M to ~42M pps.
To get to the scale of this attack we will need to multiply y‘beat by a certain variable a and also add a constant c, giving us ybeat=ay‘beat+c. Now, it’s been a while since I played around with equations, so I’m only going to try and get an approximation of the equation.
By observing the attack graph, we can guesstimate that
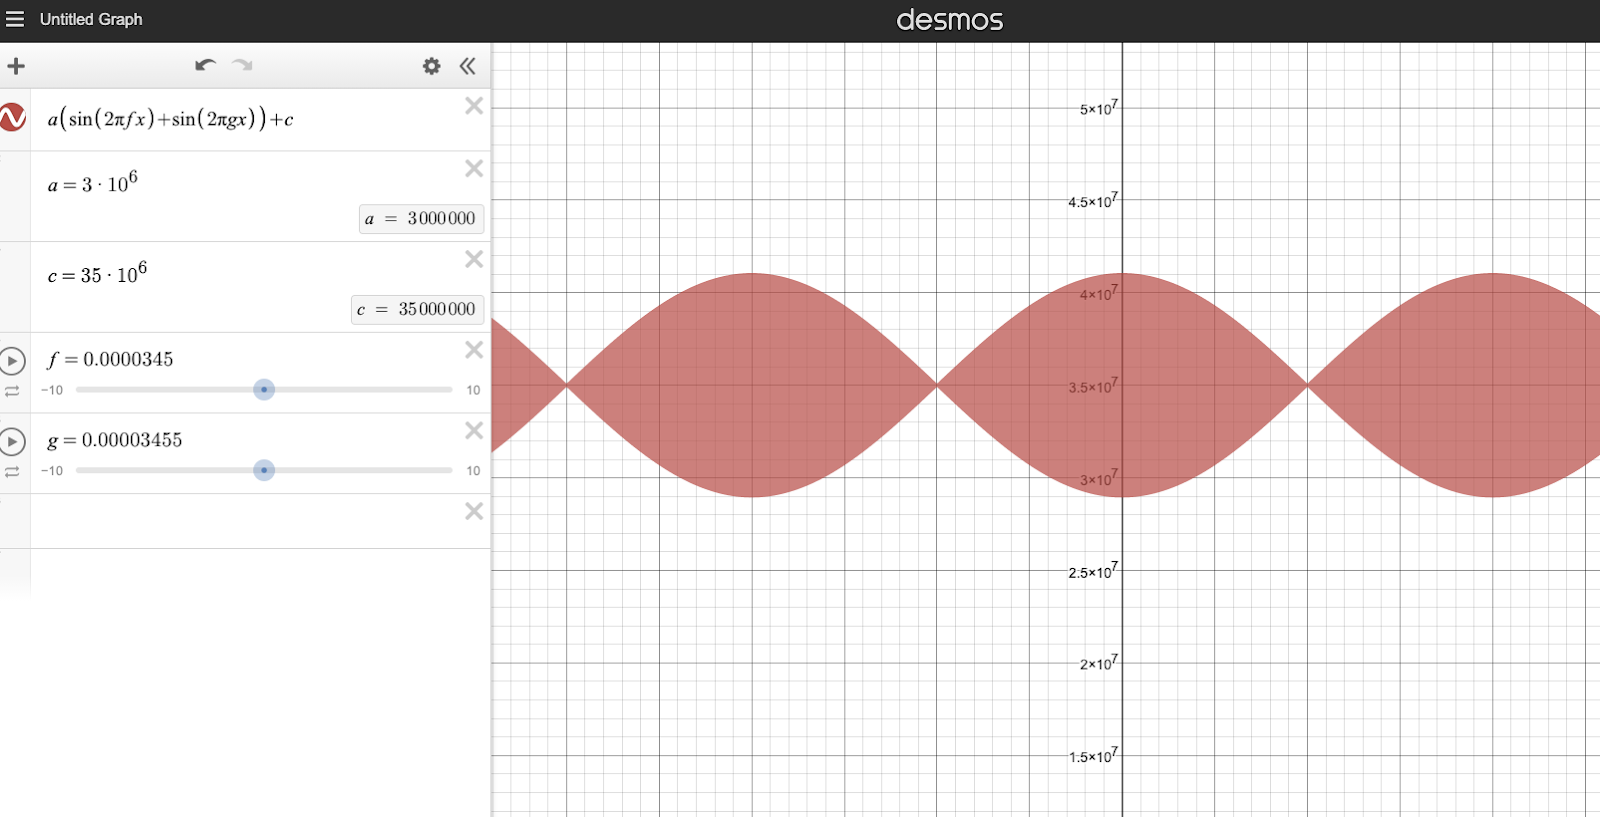
by playing around with desmos’s cool graph visualizer tool, if we set f1=0.0000345 and f2=0.00003455 we can generate a graph that resembles the attack graph. Plotting in those variables, we get:
Now this formula assumes just one node firing the packets. However, this specific attack was globally distributed, and if we assume that each node, or bot in this botnet, was firing an equal amount of packets at an equal rate, then we can divide the equation by the size of the botnet; the number of bots b. Then the final equation is something in the form of:
In the screenshot below, g = f 1. You can view this graph here.
Beating the drum
The attacker may have utilized this method in order to try and overcome our DDoS protection systems (perhaps thinking that the rhythmic rise and fall of the attack would fool our systems). However, flowtrackd, our unidirectional TCP state tracking machine, detected it as being a flood of ACK packets that do not belong to any existing TCP connection. Therefore, flowtrackd automatically dropped the attack packets at Cloudflare’s edge.
The attacker was beating the drum for over 19 hours with an amplitude of ~7 Mpps, a wavelength of ~4 hours, and peaking at ~42 Mpps. During the two days in which the attack took place, Cloudflare systems automatically detected and mitigated over 700 DDoS attacks that targeted this customer. The attack traffic accumulated at almost 500 Terabytes out of a total of 3.6 Petabytes of attack traffic that targeted this single customer in November alone. During those two days, the attackers utilized mainly ACK floods, UDP floods, SYN floods, Christmas floods (where all of the TCP flags are ‘lit’), ICMP floods, and RST floods.
The challenge of TCP based attacks
TCP is a stateful protocol, which means that in some cases, you’d need to keep track of a TCP connection’s state in order to know if a packet is legitimate or part of an attack, i.e. out of state. We were able to provide protection against out-of-state TCP packet attacks for our “classic” WAF/CDN service and Spectrum service because in both cases Cloudflare serves as a reverse-proxy seeing both ingress and egress traffic.
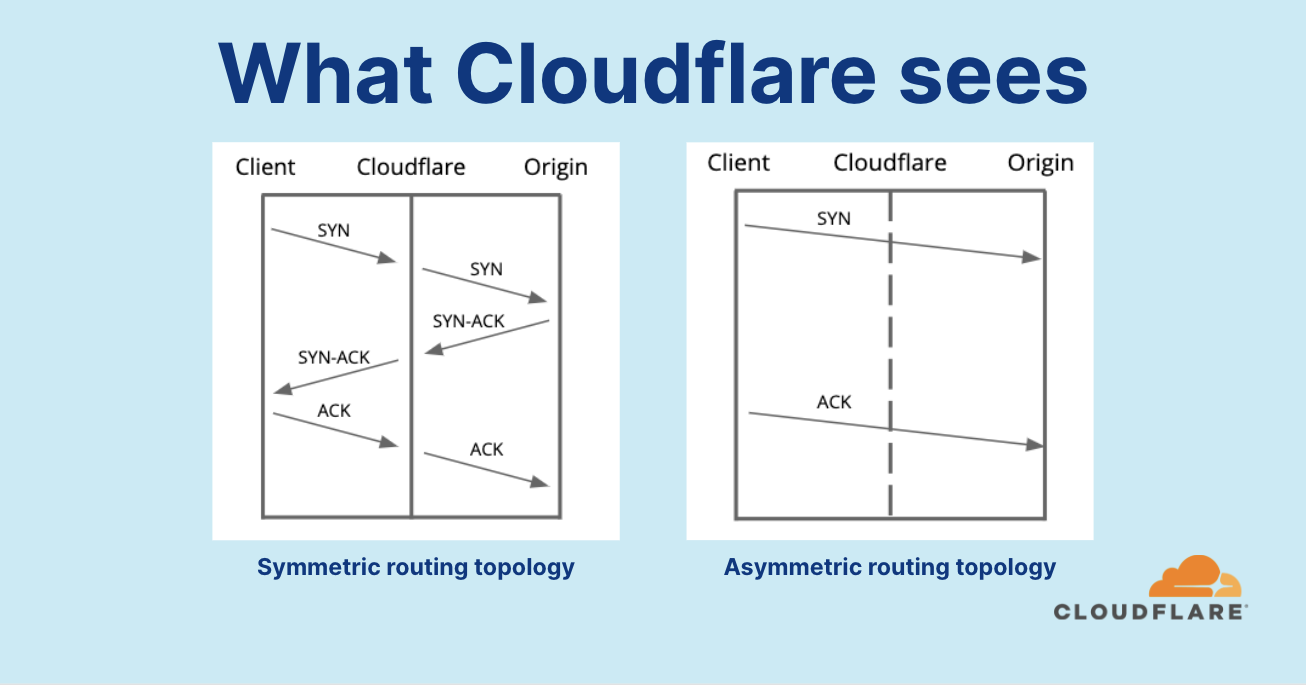
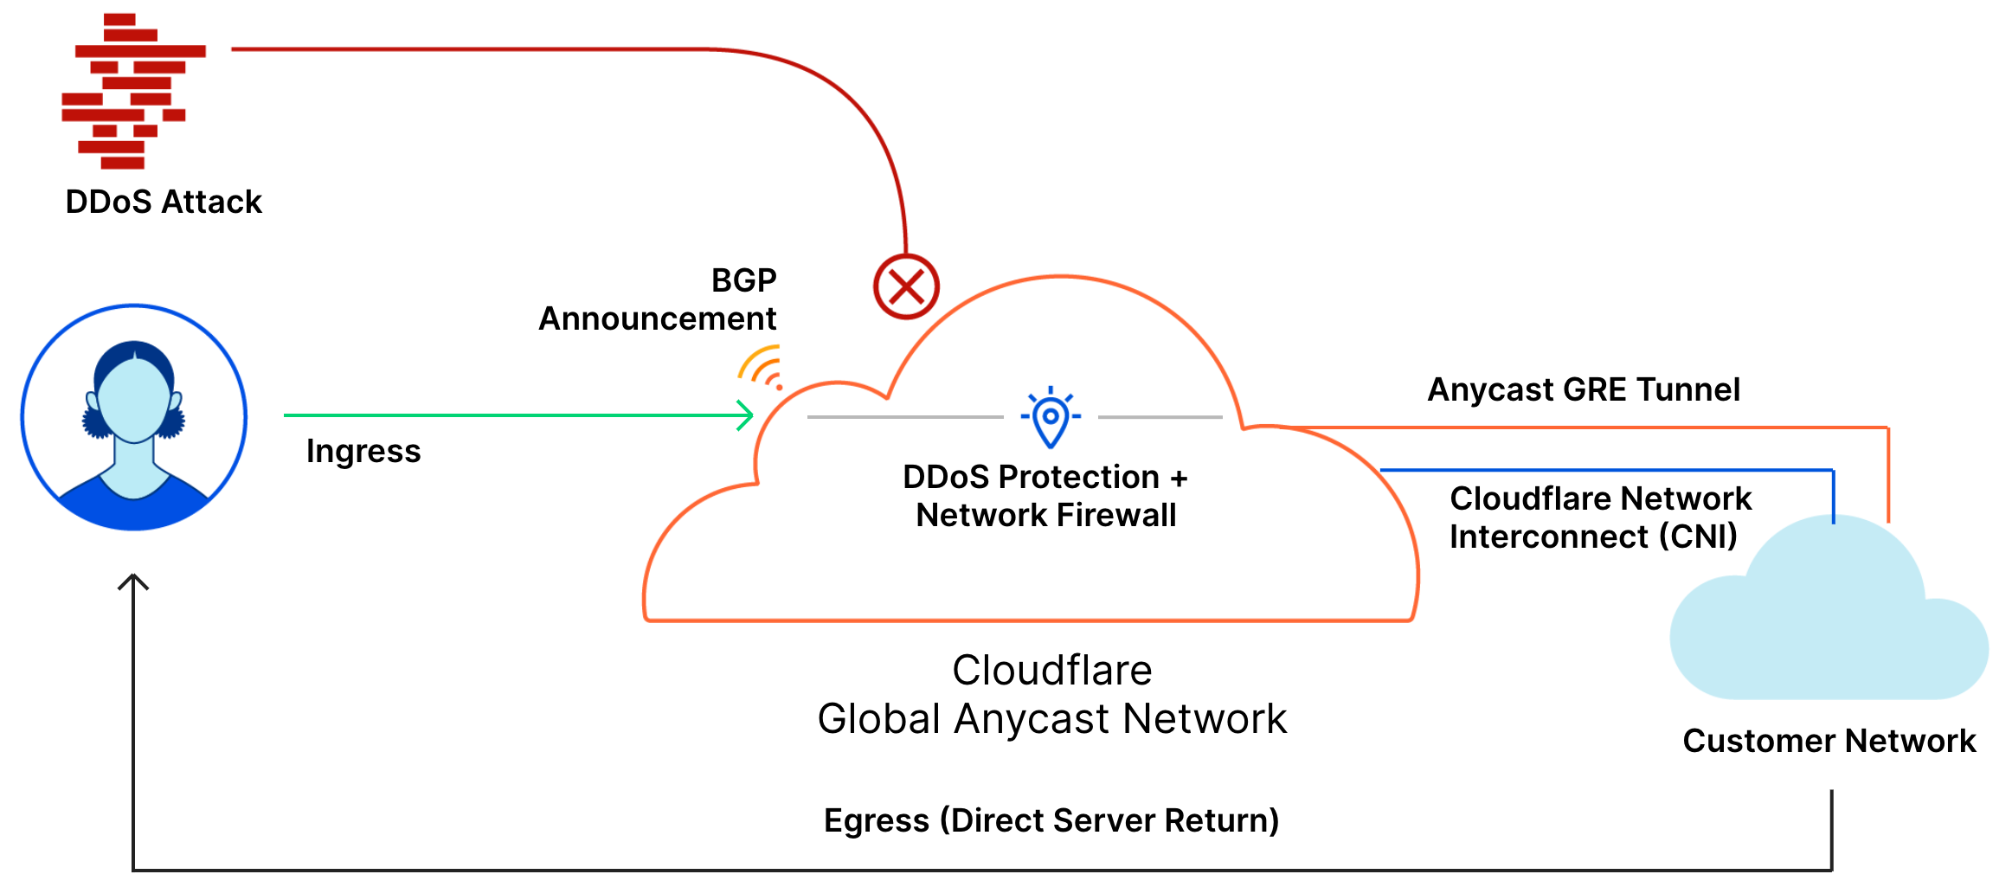
However, when we launched Magic Transit, which relies on an asymmetric routing topology with a direct server return (DSR), we couldn’t utilize our existing TCP connection tracking systems.
And so, being a software-defined company, we’re able to write code and spin up software when and where needed — as opposed to vendors that utilize dedicated DDoS protection hardware appliances. And that is what we did. We built flowtrackd, which runs autonomously on each server at our network’s edge. flowtrackd is able to classify the state of TCP flows by analyzing only the ingress traffic, and then drops, challenges, or rate-limits attack packets that do not correspond to an existing flow.
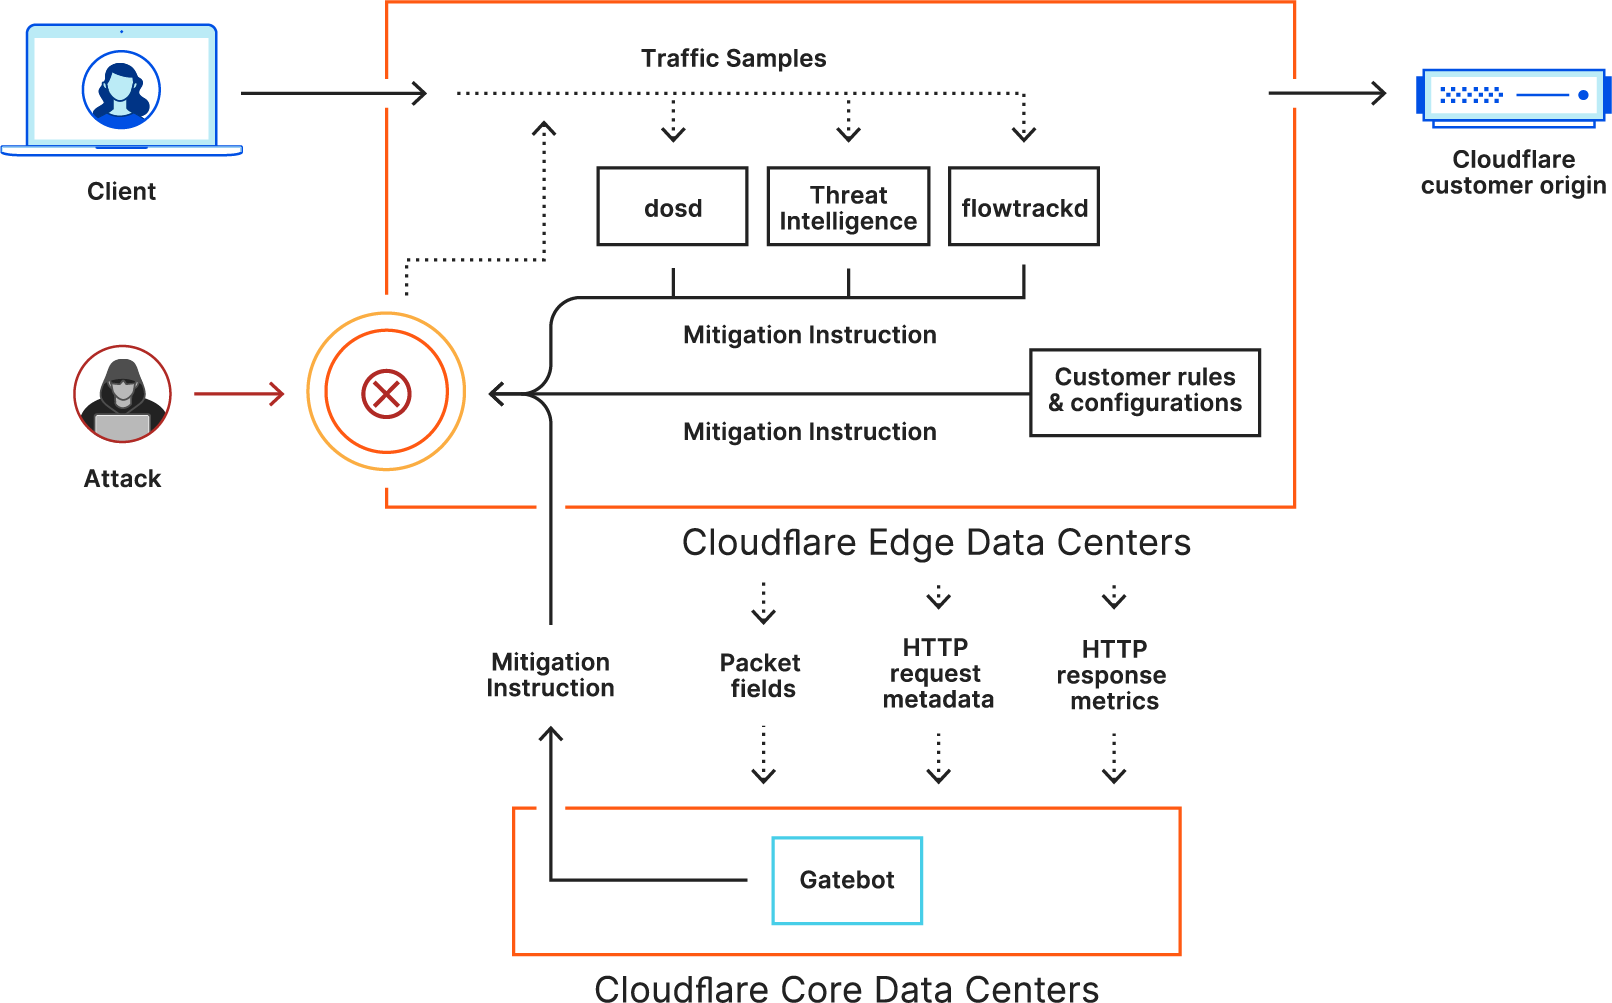
flowtrackd works together with our two additional DDoS protection systems, dosd and Gatebot, to assure our customers are protected against DDoS attacks, regardless of their size or sophistication — in this case, serving as a noise-canceling system to the Beat attack; reducing the headaches for our customers.
Read more about how our DDoS protection systems work here.
When you build applications on Amazon Web Services (AWS), it’s a common security practice to isolate production resources from non-production resources by logically grouping them into functional units or organizational units. There are many benefits to this approach, such as making it easier to implement the principal of least privilege, or reducing the scope of adversely impactful activities that may occur in non-production environments. After building these applications, setting up monitoring for resource compliance and security risks, such as distributed denial of service (DDoS) attacks across your AWS accounts, is just as important. The recommended best practice to perform this type of monitoring involves using AWS Shield Advanced with AWS Firewall Manager, and integrating these with AWS Security Hub.
In this blog post, I show you how to set up centralized monitoring for Shield Advanced–protected resources across multiple AWS accounts by using Firewall Manager and Security Hub. This enables you to easily manage resources that are out of compliance from your security policy and to view DDoS events that are detected across multiple accounts in a single view.
Shield Advanced is a managed application security service that provides DDoS protection for your workloads against infrastructure layer (Layer 3–4) attacks, as well as application layer (Layer 7) attacks, by using AWS WAF. Firewall Manager is a security management service that enables you to centrally configure and manage firewall rules across your accounts and applications in an organization in AWS. Security Hub consumes, analyzes, and aggregates security events produced by your application running on AWS by consuming security findings. Security Hub integrates with Firewall Manager without the need for any action to be taken by you.
I’m going to cover two different scenarios that show you how to use Firewall Manager for:
Centralized visibility into Shield Advanced DDoS events
Automatic remediation of noncompliant resources
Scenario 1: Centralized visibility of DDoS detected events
This scenario represents a fully native and automated integration, where Shield Advanced DDoSDetected events (indicates whether a DDoS event is underway for a particular Amazon Resource Name (ARN)) are made visible as a security finding in Security Hub, through Firewall Manager.
Solution overview
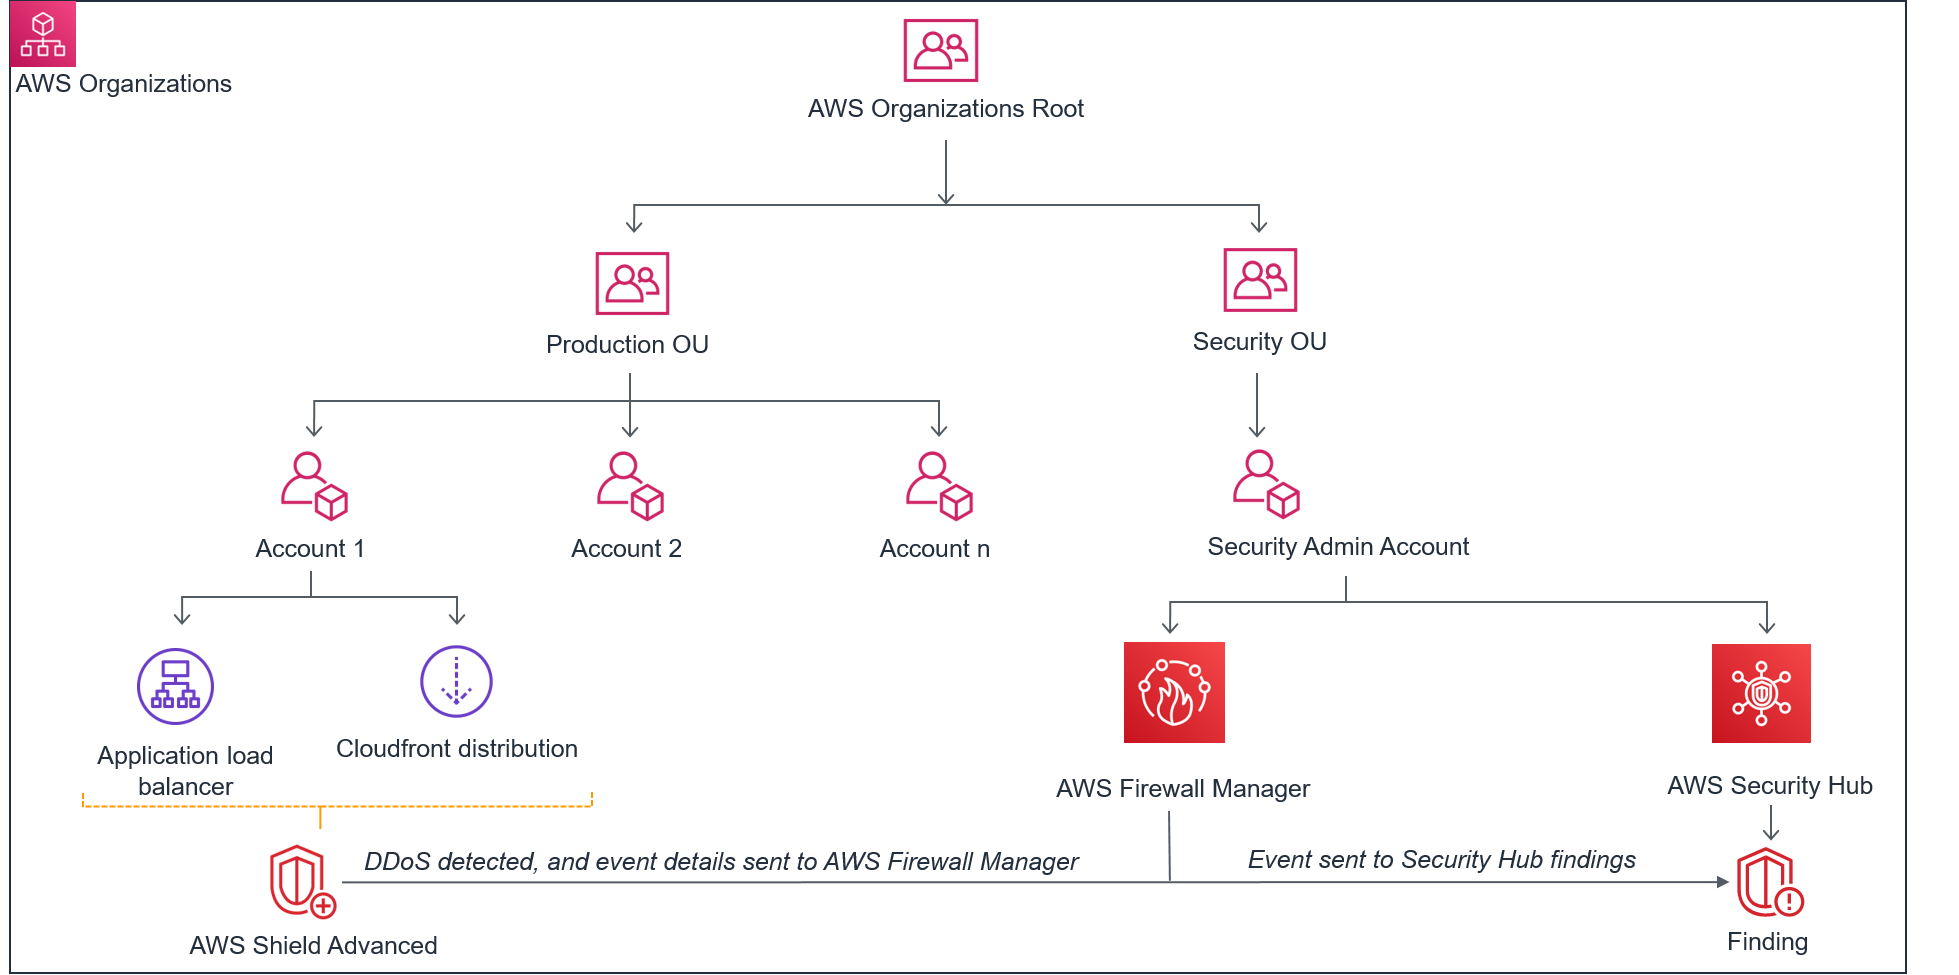
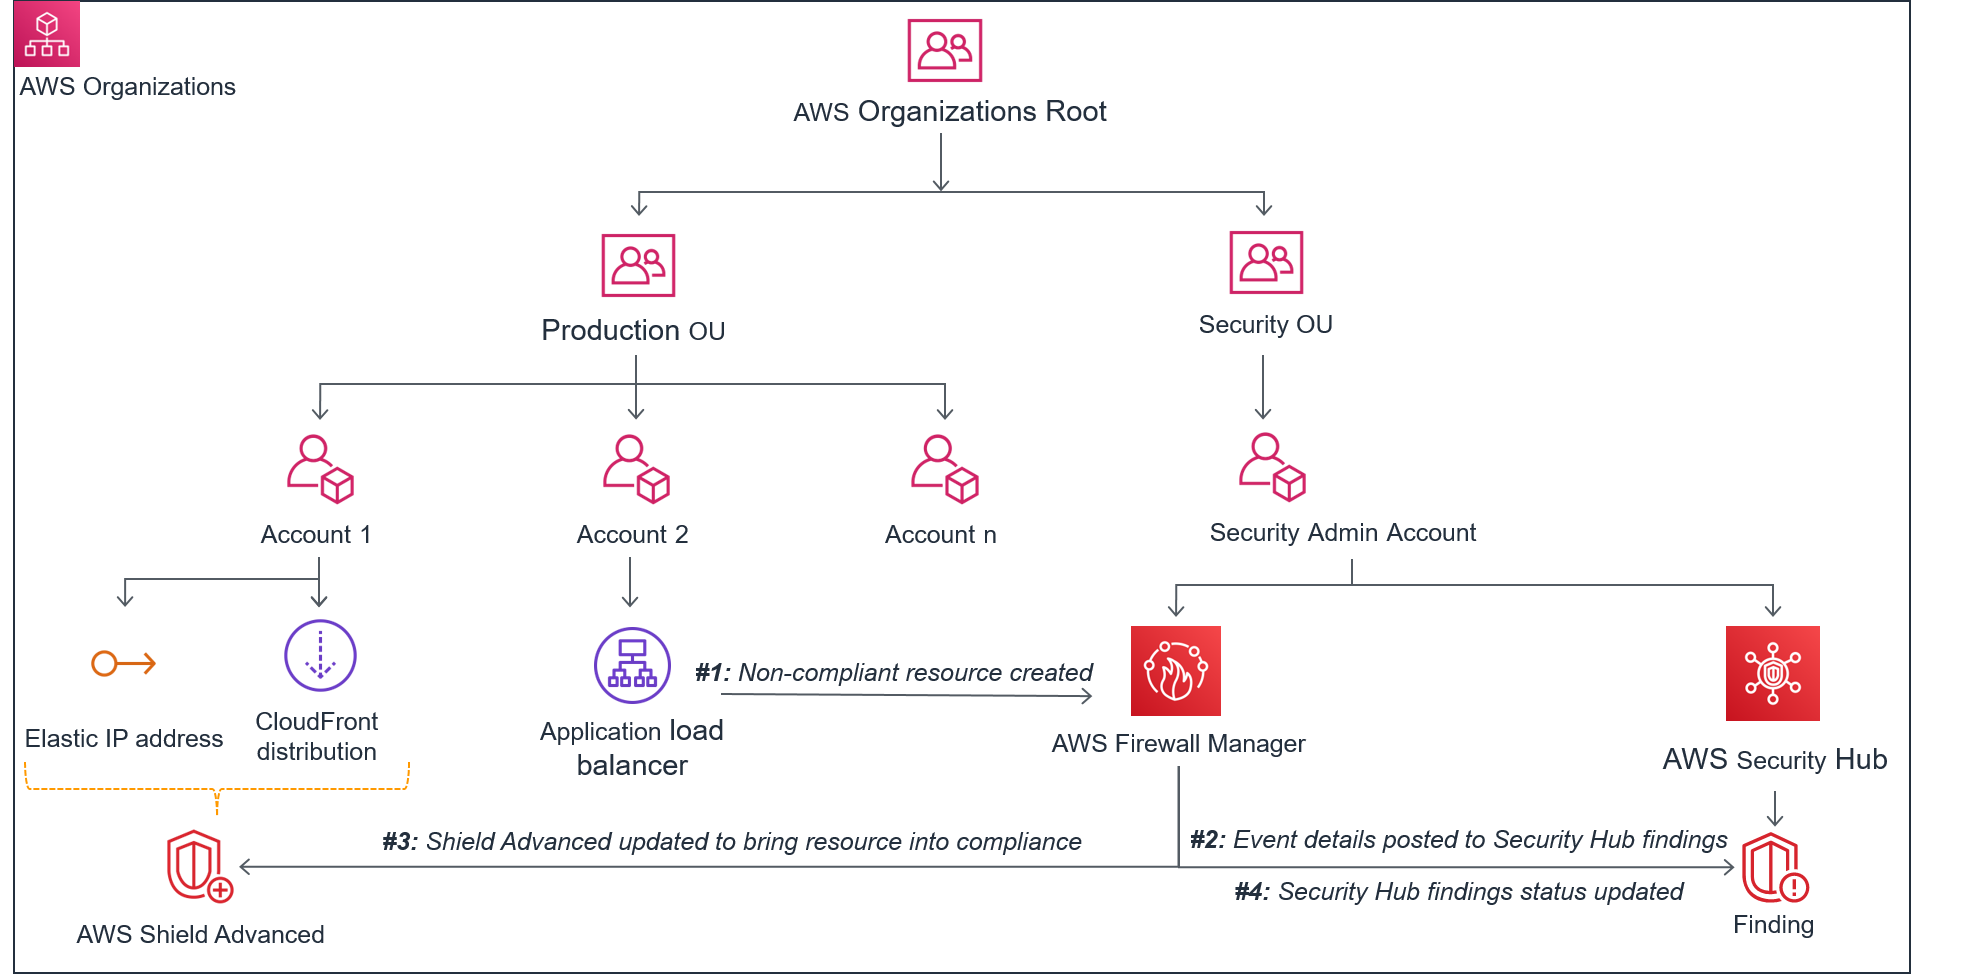
Figure 1 shows the solution architecture for scenario 1.
The diagram illustrates a customer using AWS Organizations to isolate their production resources into the Production Organizational Unit (OU), with further separation into multiple accounts for each of the mission-critical applications. The resources in Account 1 are protected by Shield Advanced. The Security OU was created to centralize security functions across all AWS accounts and OUs, obscuring the visibility of the production environment resources from the Security Operations Center (SOC) engineers and other security staff. The Security OU is home to the designated administrator account for Firewall Manager and the Security Hub dashboard.
Scenario 1 implementation
You will be setting up Security Hub in an account that has the prerequisite services configured in it as explained below. Before you proceed, see the architecture requirements in the next section. Once Security Hub is enabled for your organization, you can simulate a DDoS event in strict accordance with the AWS DDoS Simulation Testing Policy or use one of AWS DDoS Test Partners.
Architecture requirements
In order to implement these steps, you must have the following:
AWS Config must be enabled in the accounts and Region where you have Shield Advanced–protected resources that you want to manage by using Firewall Manager. For managing Shield Advanced protected resources, you can choose to have AWS Config enabled on selected resource types, such as a Shield Advanced–supported resource.
Shield Advanced must be enabled in all accounts you want to monitor using Security Hub and Firewall Manager.
Once you have all these requirements completed, you can move on to enable Security Hub.
Enable Security Hub
Note: If you plan to protect resources with Shield Advanced across multiple accounts and in multiple Regions, we recommend that you use the AWS Security Hub Multiaccount Scripts from AWS Labs. Security Hub needs to be enabled in all the Regions and all the accounts where you have Shield protected resources. For global resources, like Amazon CloudFront, you should enable Security Hub in the us-east-1 Region.
To enable Security Hub
In the AWS Security Hub console, switch to the account you want to use as the designated Security Hub administrator account.
Select the security standard or standards that are applicable to your application’s use-case, and choose Enable Security Hub.
Figure 2: Enabling Security Hub
From the designated Security Hub administrator account, go to the Settings – Account tab, and add accounts by sending invites to all the accounts you want added as member accounts. The invited accounts become associated as member accounts once the owner of the invited account has accepted the invite and Security Hub has been enabled. It’s possible to upload a comma-separated list of accounts you want to send to invites to.
Figure 3: Designating a Security Hub administrator account by adding member accounts
View detected events in Shield and Security Hub
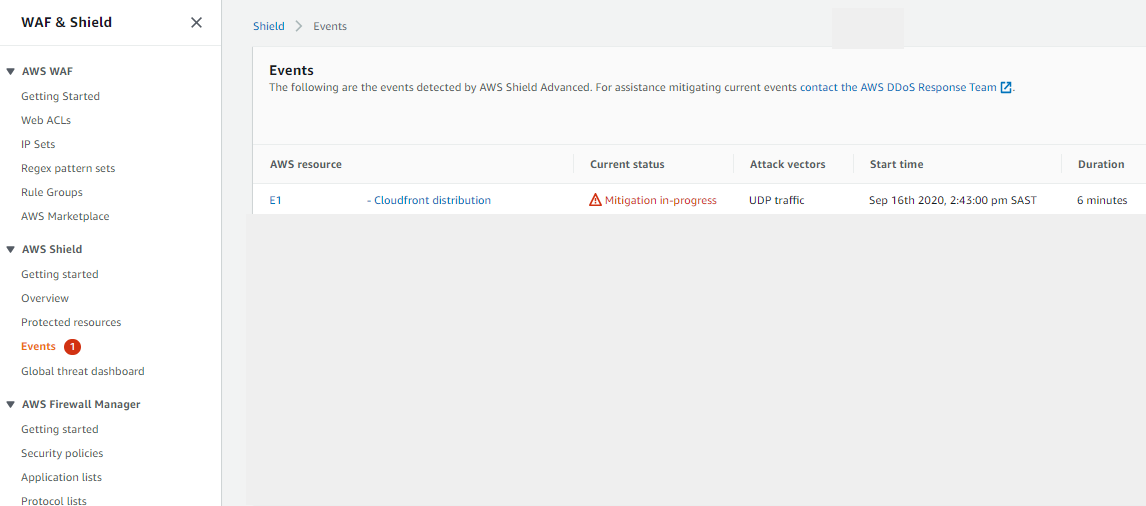
When Shield Advanced detects signs of DDoS traffic that is destined for a protected resource, the Events tab in the Shield console displays information about the event detected and provides a status on the mitigation that has been performed. Following is an example of how this looks in the Shield console.
Figure 4: Scenario 1 – The Events tab on the Shield console showing a Shield event in progress
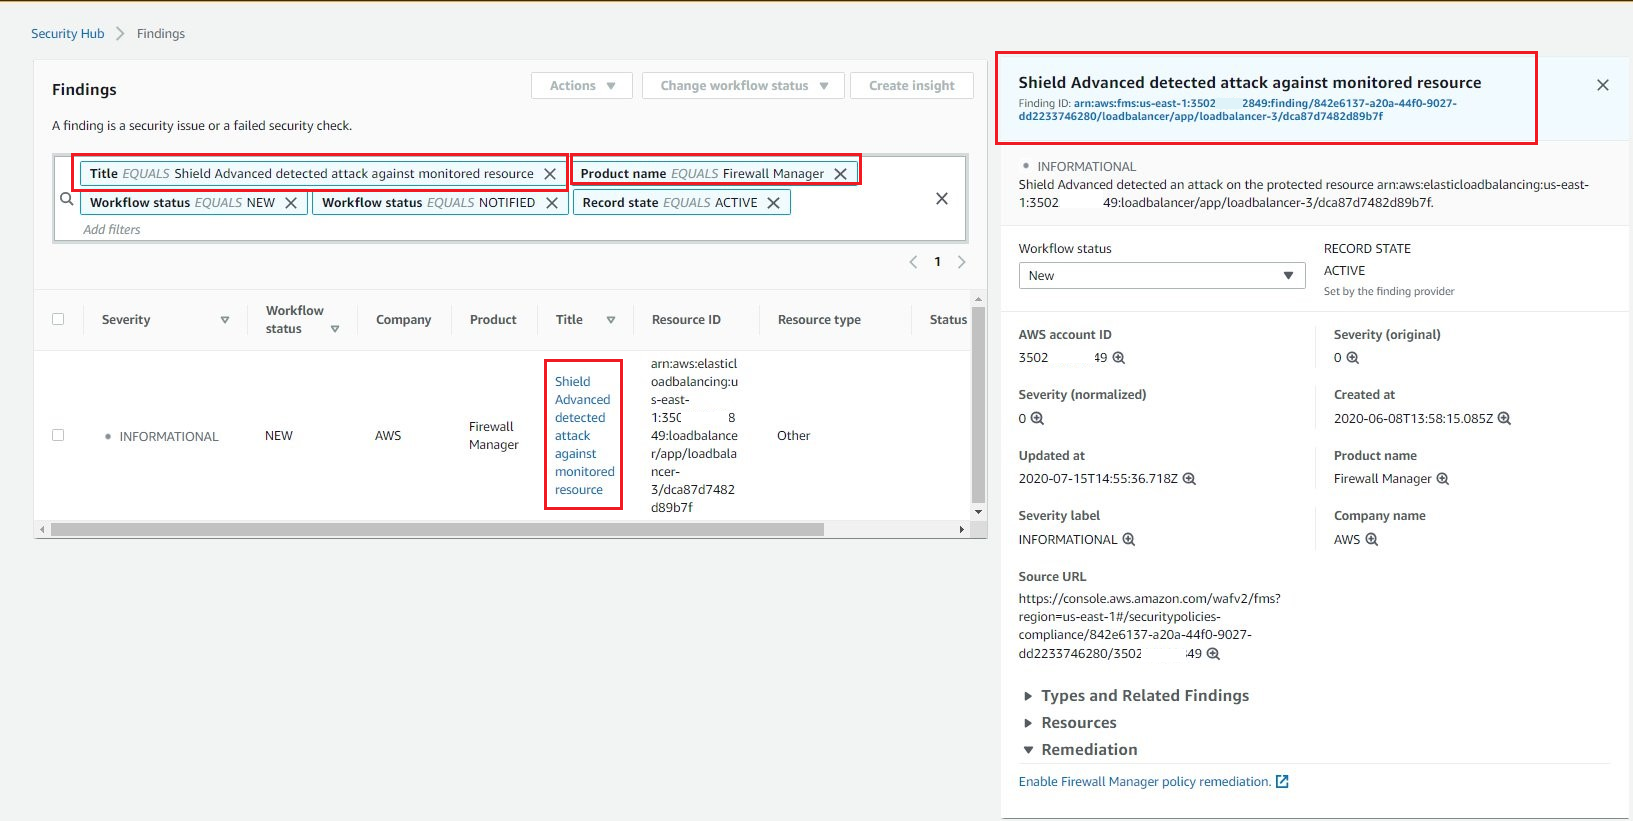
If you’re managing multiple accounts, switching between these accounts to view the Shield console to keep track of DDoS incidents can be cumbersome. Using the Amazon CloudWatch metrics that Shield Advanced reports for Shield events, visibility across multiple accounts and Regions is easier through a custom CloudWatch dashboard or by consuming these metrics in a third-party tool. For example, the DDoSDetected CloudWatch metric has a binary value, where a value of 1 indicates that an event that might be a DDoS has been detected. This metric is automatically updated by Shield when the DDoS event starts and ends. You only need permissions to access the Security Hub dashboard in order to monitor all events on production resources. Following is an example of what you see in the Security Hub console.
Configure Shield event notification in Firewall Manager
In order to increase your visibility into possible Shield events across your accounts, you must configure Firewall Manager to monitor your protected resources by using Amazon Simple Notification Service (Amazon SNS). With this configuration, Firewall Manager sends you notifications of possible attacks by creating an Amazon SNS topic in Regions where you might have protected resources.
Under Amazon SNS Topic Configuration, select a Region.
Choose Configure SNS Topic.
Figure 6: The Firewall Manager Settings page for configuring SNS topics
Select an existing topic or create a new topic, and then choose Configure SNS Topic.
Figure 7: Configure an SNS topic in a Region
Scenario 2: Automatic remediation of noncompliant resources
The second scenario is an example in which a new production resource is created, and Security Hub has full visibility of the compliance state of the resource.
Solution overview
Figure 8 shows the solution architecture for scenario 2.
Figure 8: Scenario 2 – Visibility of Shield Advanced noncompliant resources in Security Hub
Firewall Manager identifies that the resource is out of compliance with the defined policy for Shield Advanced and posts a finding to Security Hub, notifying your operations team that a manual action is required to bring the resource into compliance. If configured, Firewall Manager can automatically bring the resource into compliance by creating it as a Shield Advanced–protected resource, and then update Security Hub when the resource is in a compliant state.
Scenario 2 implementation
The following steps describe how to use Firewall Manager to enforce Shield Advanced protection compliance of an application that is deployed to a member account within AWS Organizations. This implementation assumes that you set up Security Hub as described for scenario 1.
Create a Firewall Manager security policy for Shield Advanced protected resources
In this step, you create a Shield Advanced security policy that will be enforced by Firewall Manager. For the purposes of this walkthrough, you’ll choose to automatically remediate noncompliant resources and apply the policy to Application Load Balancer (ALB) resources.
In the left navigation pane, choose Security policies, and then choose Create a security policy.
Select AWS Shield Advanced as the policy type, and select the Region where your protected resources are. Choose Next.
Note: You will need to create a security policy for each Region where you have regional resources, such as Elastic Load Balancers and Elastic IP addresses, and a security policy for global resources such as CloudFront distributions.
Figure 9: Select the policy type and Region
On the Describe policy page, for Policy name, enter a name for your policy.
For Policy action, you have the option to configure automatic remediation of noncompliant resources or to only send alerts when resources are noncompliant. You can change this setting after the policy has been created. For the purposes of this blog post, I’m selecting Auto remediate any noncompliant resources. Select your option, and then choose Next.
Important: It’s a best practice to first identify and review noncompliant resources before you enable automatic remediation.
On the Define policy scope page, define the scope of the policy by choosing which AWS accounts, resource type, or resource tags the policy should be applied to. For the purposes of this blog post, I’m selecting to manage Application Load Balancer (ALB) resources across all accounts in my organization, with no preference for resource tags. When you’re finished defining the policy scope, choose Next.
Figure 10: Define the policy scope
Review and create the policy. Once you’ve reviewed and created the policy in the Firewall Manager designated administrator account, the policy will be pushed to all the Firewall Manager member accounts for enforcement. The new policy could take up to 5 minutes to appear in the console. Figure 11 shows a successful security policy propagation across accounts.
Figure 11: View security policies in an account
Test the Firewall Manager and Security Hub integration
You’ve now defined a policy to cover only ALB resources, so the best way to test this configuration is to create an ALB in one of the Firewall Manager member accounts. This policy causes resources within the policy scope to be added as protected resources.
To test the policy
Switch to the Security Hub administrator account and open the Security Hub console in the same Region where you created the ALB. On the Findings page, set the Title filter to Resource lacks Shield Advanced protection and set the Product name filter to Firewall Manager.
Figure 12: Security Hub findings filter
You should see a new security finding flagging the ALB as a noncompliant resource, according to the Shield Advanced policy defined in Firewall Manager. This confirms that Security Hub and Firewall Manager have been enabled correctly.
Figure 13: Security Hub with a noncompliant resource finding
With the automatic remediation feature enabled, you should see the “Updated at” time reflect exactly when the automatic remediation actions were completed. The completion of the automatic remediation actions can take up to 5 minutes to be reflected in Security Hub.
Figure 14: Security Hub with an auto-remediated compliance finding
Go back to the account where you created the ALB, and in the Shield Protected Resources console, navigate to the Protected Resources page, where you should see the ALB listed as a protected resource.
Figure 15: Shield console in the member account shows that the new ALB is a protected resource
Confirming that the ALB has been added automatically as a Shield Advanced–protected resource means that you have successfully configured the Firewall Manager and Security Hub integration.
(Optional): Send a custom action to a third-party provider
You can send all regional Security Hub findings to a ticketing system, Slack, AWS Chatbot, a Security Information and Event Management (SIEM) tool, a Security Orchestration Automation and Response (SOAR), incident management tools, or to custom remediation playbooks by using Security Hub Custom Actions.
Conclusion
In this blog post I showed you how to set up a Firewall Manager security policy for Shield Advanced so that you can monitor your applications for DDoS events, and their compliance to DDoS protection policies in your multi-account environment from the Security Hub findings console. In line with best practices for account governance, organizations should have a centralized security account that performs monitoring for multiple accounts. Security Hub and Firewall Manager provide a centralized solution to help you achieve your compliance and monitoring goals for DDoS protection.
If you’re interested in exploring how Shield Advanced and AWS WAF help to improve the security posture of your application, have a look at the following resources:
If you have feedback about this post, submit comments in the Comments section below. If you have questions about this post, start a new thread on the AWS Security Hub forum or contact AWS Support.
Want more AWS Security how-to content, news, and feature announcements? Follow us on Twitter.
DDoS attacks are surging — both in frequency and sophistication. After doubling from Q1 to Q2, the total number of network layer attacks observed in Q3 doubled again — resulting in a 4x increase in number compared to the pre-COVID levels in the first quarter. Cloudflare also observed more attack vectors deployed than ever — in fact, while SYN, RST, and UDP floods continue to dominate the landscape, we saw an explosion in protocol specific attacks such as mDNS, Memcached, and Jenkins DoS attacks.
Here are other key network layer DDoS trends we observed in Q3:
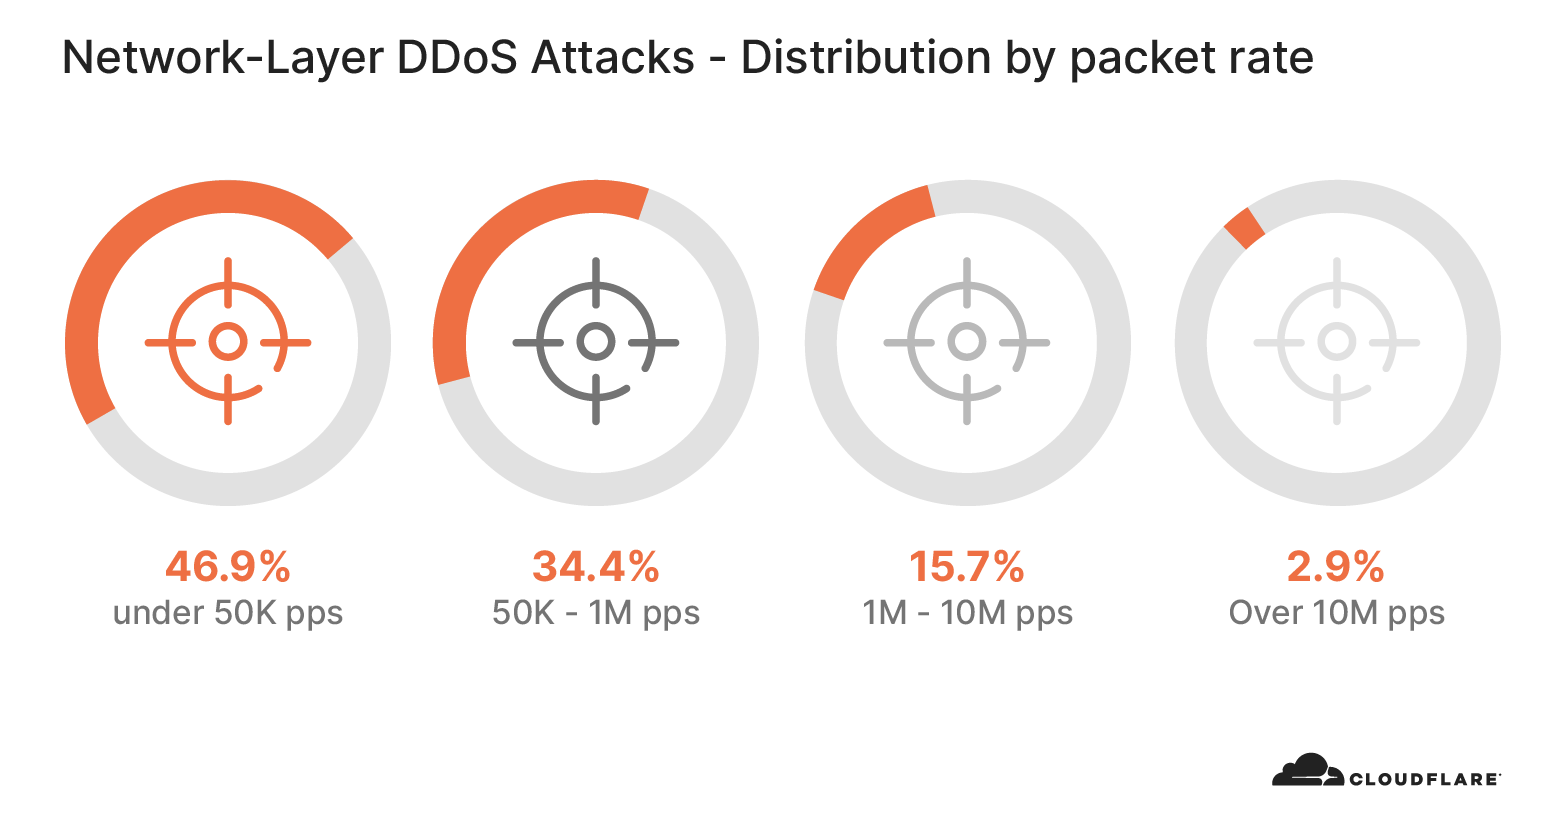
Majority of the attacks are under 500 Mbps and 1 Mpps — both still suffice to cause service disruptions
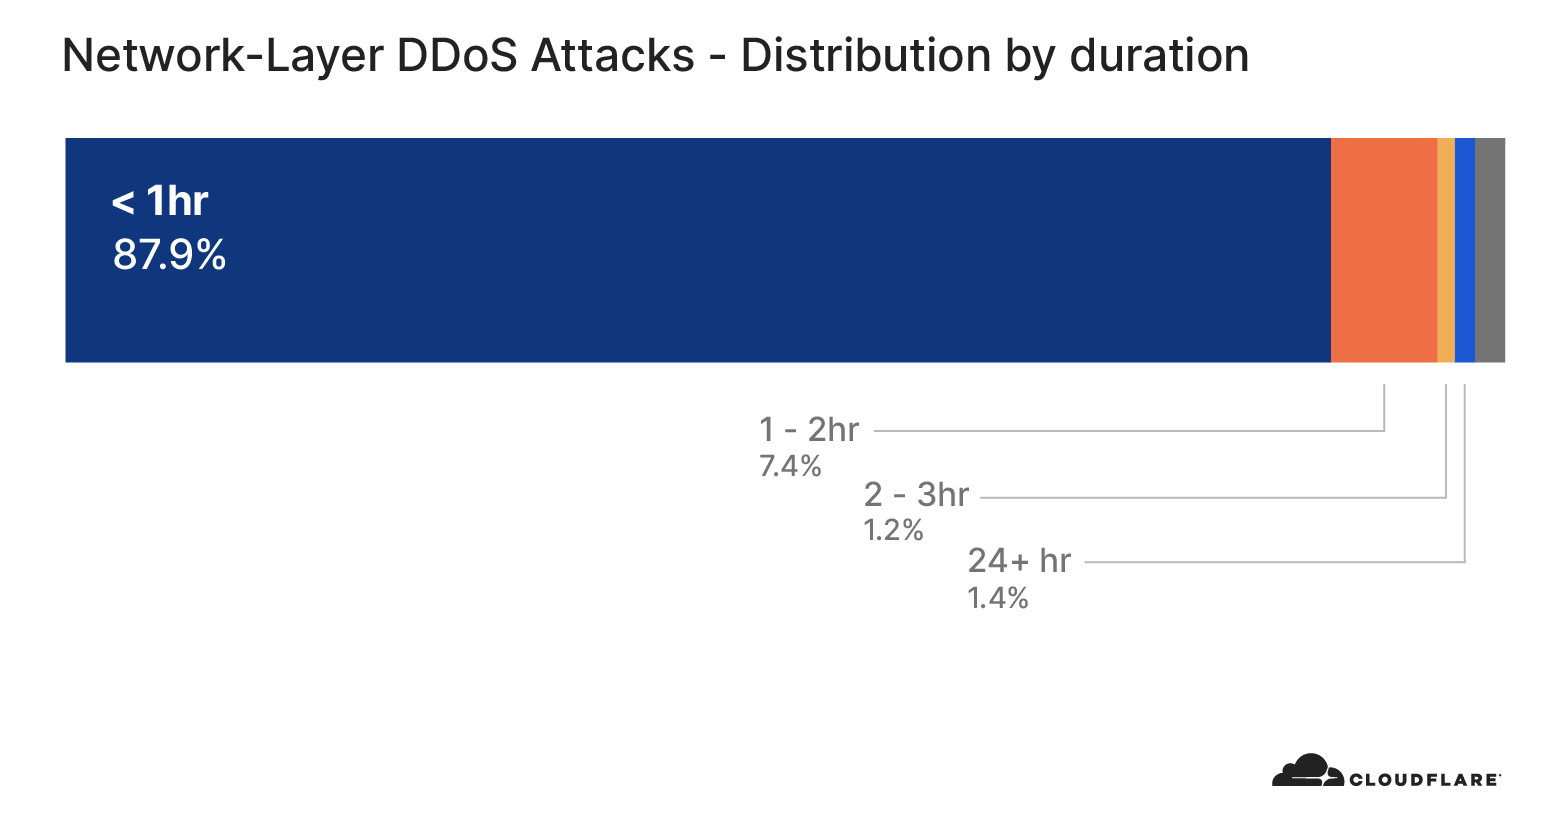
We continue to see a majority of attacks be under 1 hr in duration
Ransom-driven DDoS attacks (RDDoS) are on the rise as groups claiming to be Fancy Bear, Cozy Bear and the Lazarus Group extort organizations around the world. As of this writing, the ransom campaign is still ongoing. See a special note on this below.
Number of attacks
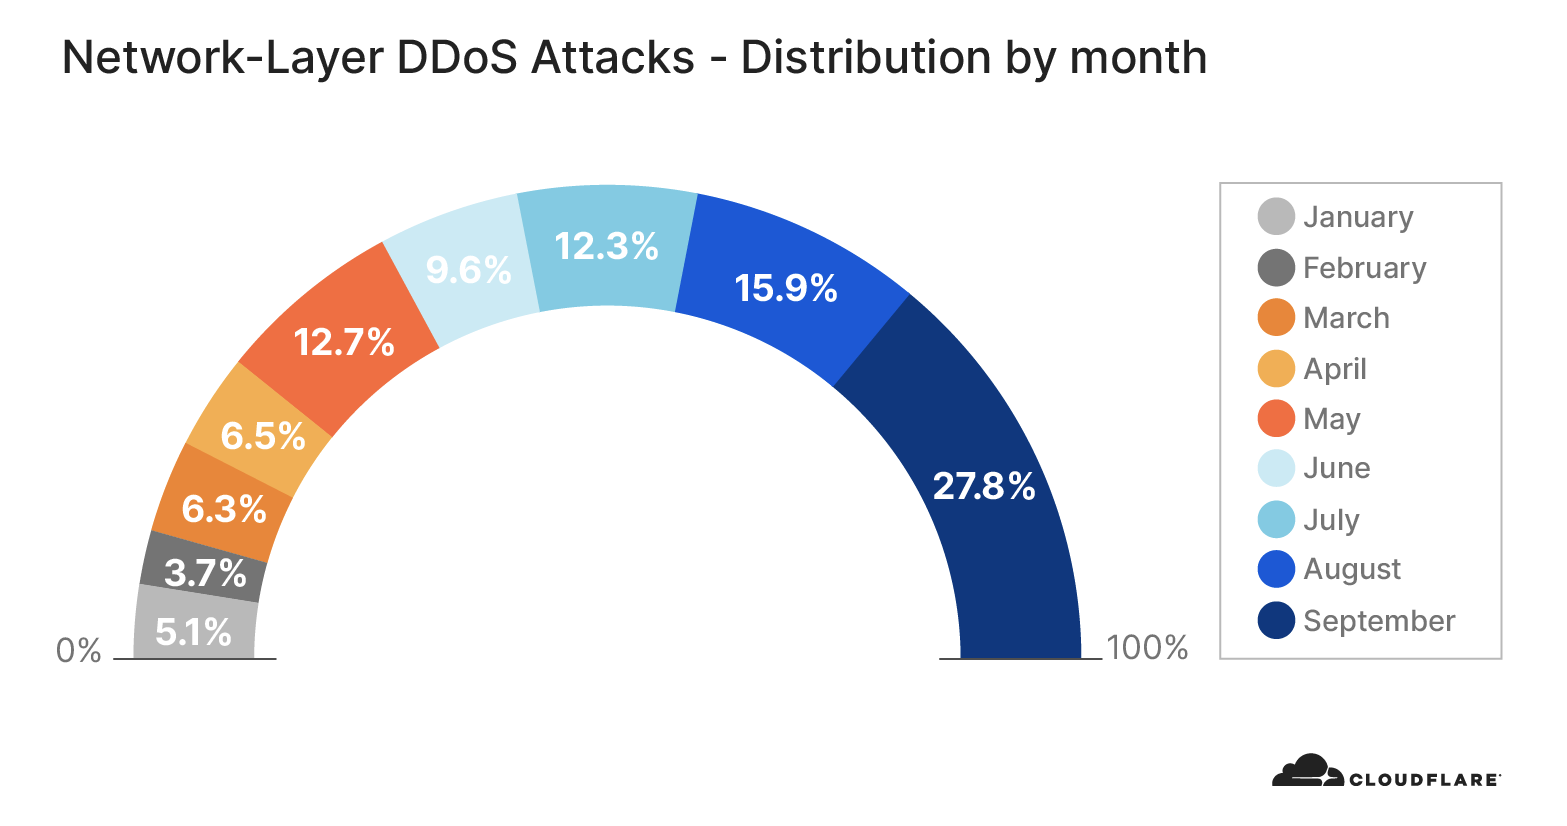
The total number of L3/4 DDoS attacks we observe on our network continues to increase substantially, as indicated in the graph below. All in all, Q3 saw over 56% of all attacks this year — double that of Q2, and four times that of Q1. In addition, the number of attacks per month increased throughout the quarter.
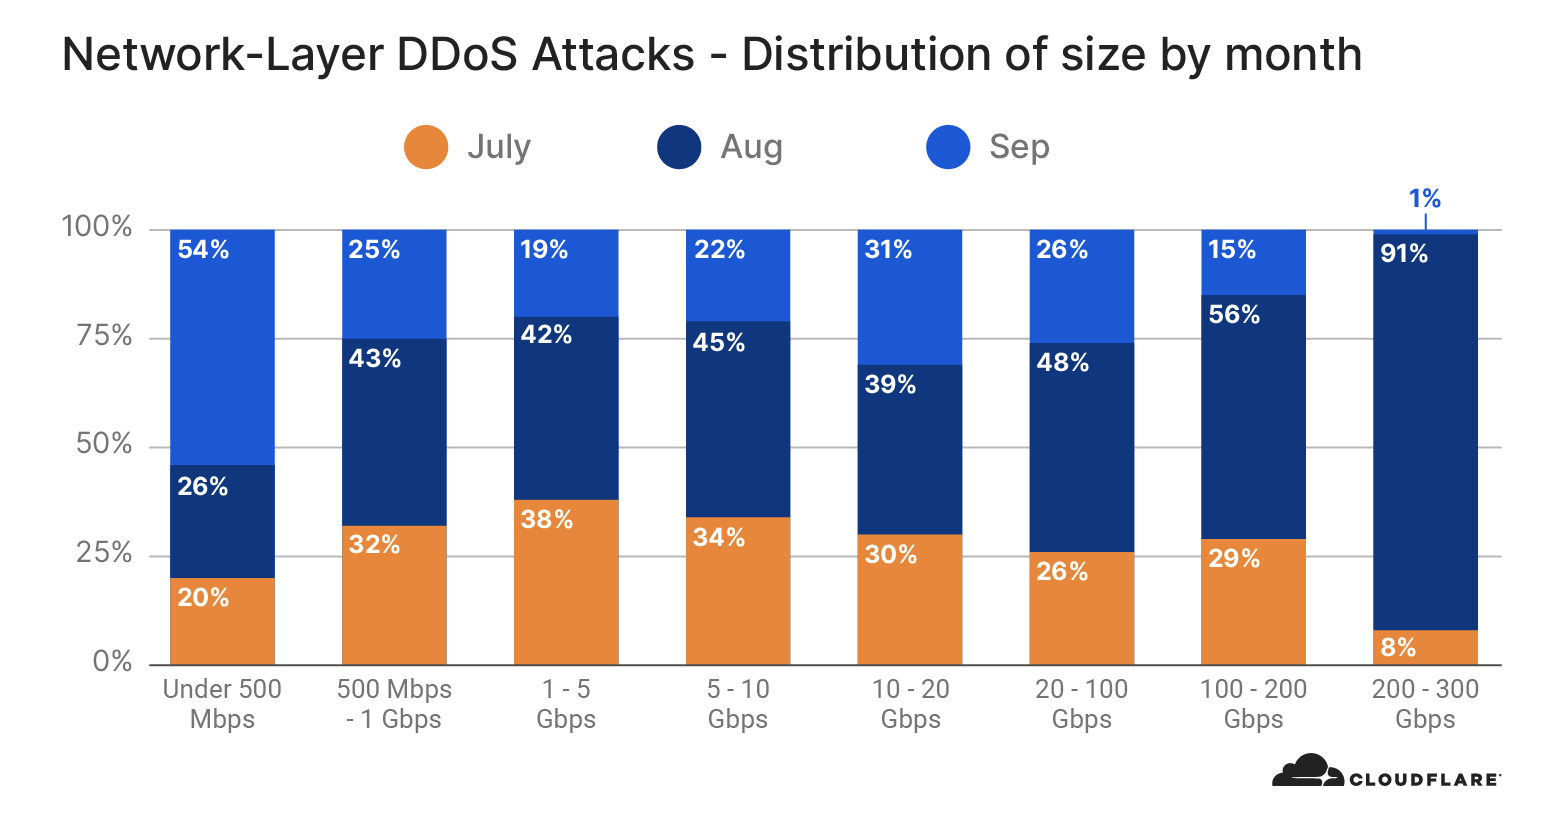
While September witnessed the largest number of attacks overall, August saw the most large attacks (over 500Mbps). Ninety-one percent of large attacks in Q3 took place in that month—while monthly distribution of other attack sizes was far more even.
While the total number of attacks between 200-300 Gbps decreased in September, we saw more global attacks on our network in Q3. This suggests the increase in the use of distributed botnets to launch attacks. In fact, in early July, Cloudflare witnessed one of the largest-ever attacks on our network — generated by Moobot, a Mirai-based botnet. The attack peaked at 654 Mbps and originated from 18,705 unique IP addresses, each believed to be a Moobot-infected IoT device. The attack campaign lasted nearly 10 days, but the customer was protected by Cloudflare, so they observed no downtime or service degradation.
Attack size (bit rate and packet rate)
There are different ways of measuring a L3/4 DDoS attack’s size. One is the volume of traffic it delivers, measured as the bit rate (specifically, Gigabits-per-second). Another is the number of packets it delivers, measured as the packet rate (specifically, packets-per-second). Attacks with high bit rates attempt to saturate the Internet link, and attacks with high packet rates attempt to overwhelm the routers or other in-line hardware devices.
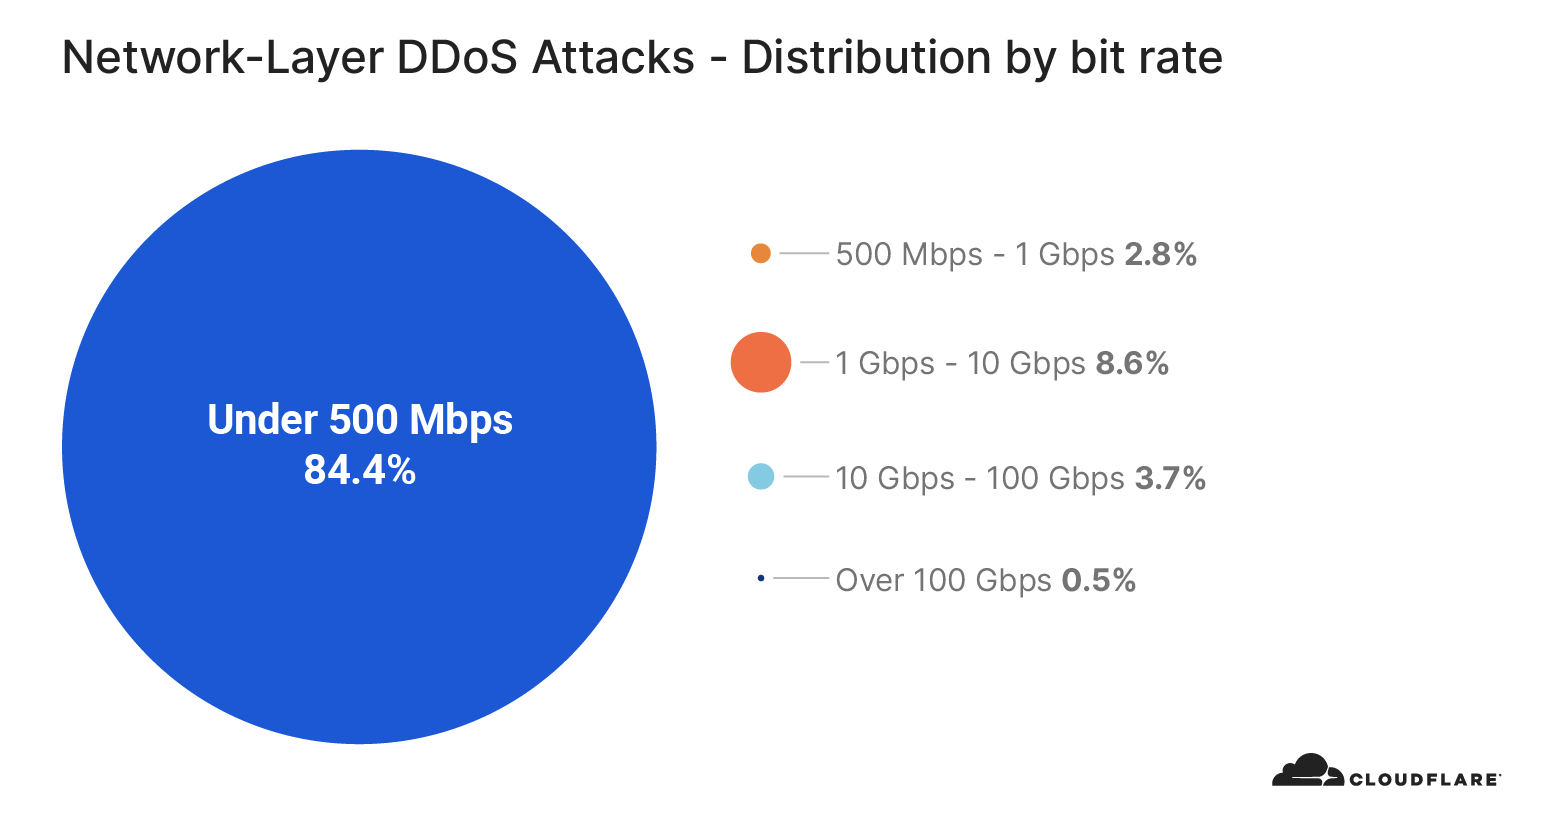
In Q3, most of the attacks we observed were smaller in size. In fact, over 87% of all attacks were under 1 Gbps. This represents a significant increase from Q2, when roughly 52% of attacks were that small. Note that, even ‘small’ attacks of under 500 Mbps are many times sufficient to create major disruptions for Internet properties that are not protected by a Cloud based DDoS protection service. Many organizations have uplinks provided by their ISPs that are far less than 1 Gbps. Assuming their public facing network interface also serves legitimate traffic, you can see how even these ‘small’ DDoS attacks can easily take down Internet properties.
This trend holds true for attack packet rates. In Q3, 47% of attacks were under 50k pps — compared to just 19% in Q2.
Smaller attacks can indicate that amateur attackers may be behind the attacks — using tools easily available to generate attacks on exposed IPs/ networks. Alternatively, small attacks may serve as a smokescreen to distract security teams from other kinds of cyberattacks that might be taking place simultaneously.
Attack duration
In terms of length, very short attacks were the most common attack type observed in Q3, accounting for nearly 88% of all attacks. This observation is in line with our prior reports — in general, Layer 3/4 DDoS attacks are getting shorter in duration.
Short burst attacks may attempt to cause damage without being detected by DDoS detection systems. DDoS services that rely on manual analysis and mitigation may prove to be useless against these types of attacks because they are over before the analyst even identifies the attack traffic.
Alternatively, the use of short attacks may be used to probe the cyber defenses of the target. Load-testing tools and automated DDoS tools, that are widely available on the dark web, can generate short bursts of, say, a SYN flood, and then following up with another short attack using an alternate attack vector. This allows attackers to understand the security posture of their targets before they decide to potentially launch larger attacks at larger rates and longer durations – which come at a cost.
In other cases, attackers generate small DDoS attacks as proof and warning to the target organization of the attacker’s ability to cause real damage later on. It’s often followed by a ransom note to the target organization, demanding payment so as to avoid suffering an attack that could more thoroughly cripple network infrastructure.
Whatever their motivation, DDoS attacks of any size or duration are not going away anytime soon. Even short DDoS attacks cause harm, and having an automated real-time defense mechanism in place is critical for any online business.
Attack vectors
SYN floods constituted nearly 65% of all attacks observed in Q3, followed by RST floods and UDP floods in second and third places. This is relatively consistent with observations from previous quarters, highlighting the DDoS attack vector of choice by attackers.
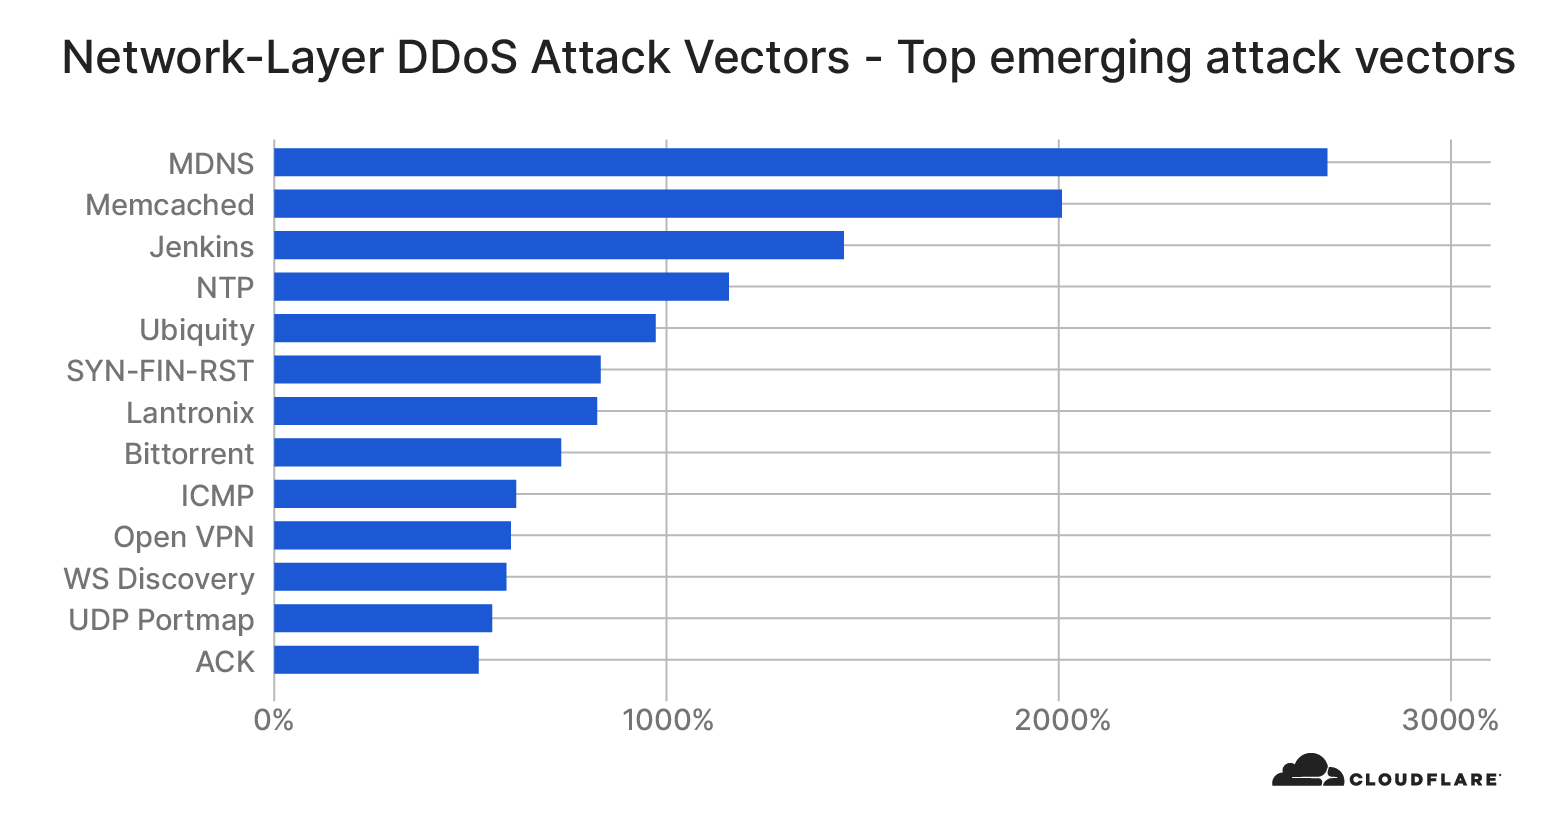
While TCP based attacks like SYN and RST floods continue to be popular, UDP-protocol specific attacks such as mDNS, Memcached, and Jenkins are seeing an explosion compared to the prior quarter.
Multicast DNS (mDNS) is a UDP-based protocol that is used in local networks for service/device discovery. Vulnerable mDNS servers respond to unicast queries originating outside of the local network, which are ‘spoofed’ (altered) with the victim’s source address. This results in amplification attacks. In Q3, we noticed an explosion of mDNS attacks — specifically, we saw a 2,680% increase compared to the previous quarter.
This was followed by Memcached and Jenkins attacks. Memcached is a Key Value database. Requests can be made over the UDP protocol with a spoofed source address of the target. The size of the Value stored in the requested Key will affect the amplification factor, resulting in a DDoS amplification attack. Similarly, Jenkins, NTP, Ubiquity and the other UDP based protocols have seen a dramatic increase over the quarter due to its UDP stateless nature. A vulnerability in the older version (Jenkins 2.218 and earlier) aided the launch of DDoS attacks. This vulnerability was fixed in Jenkins 2.219 by disabling UDP multicast/ broadcast messages by default. However there are still many vulnerable and exposed devices that run UDP based services which are being harnessed to generate volumetric amplification attacks.
Attack by country
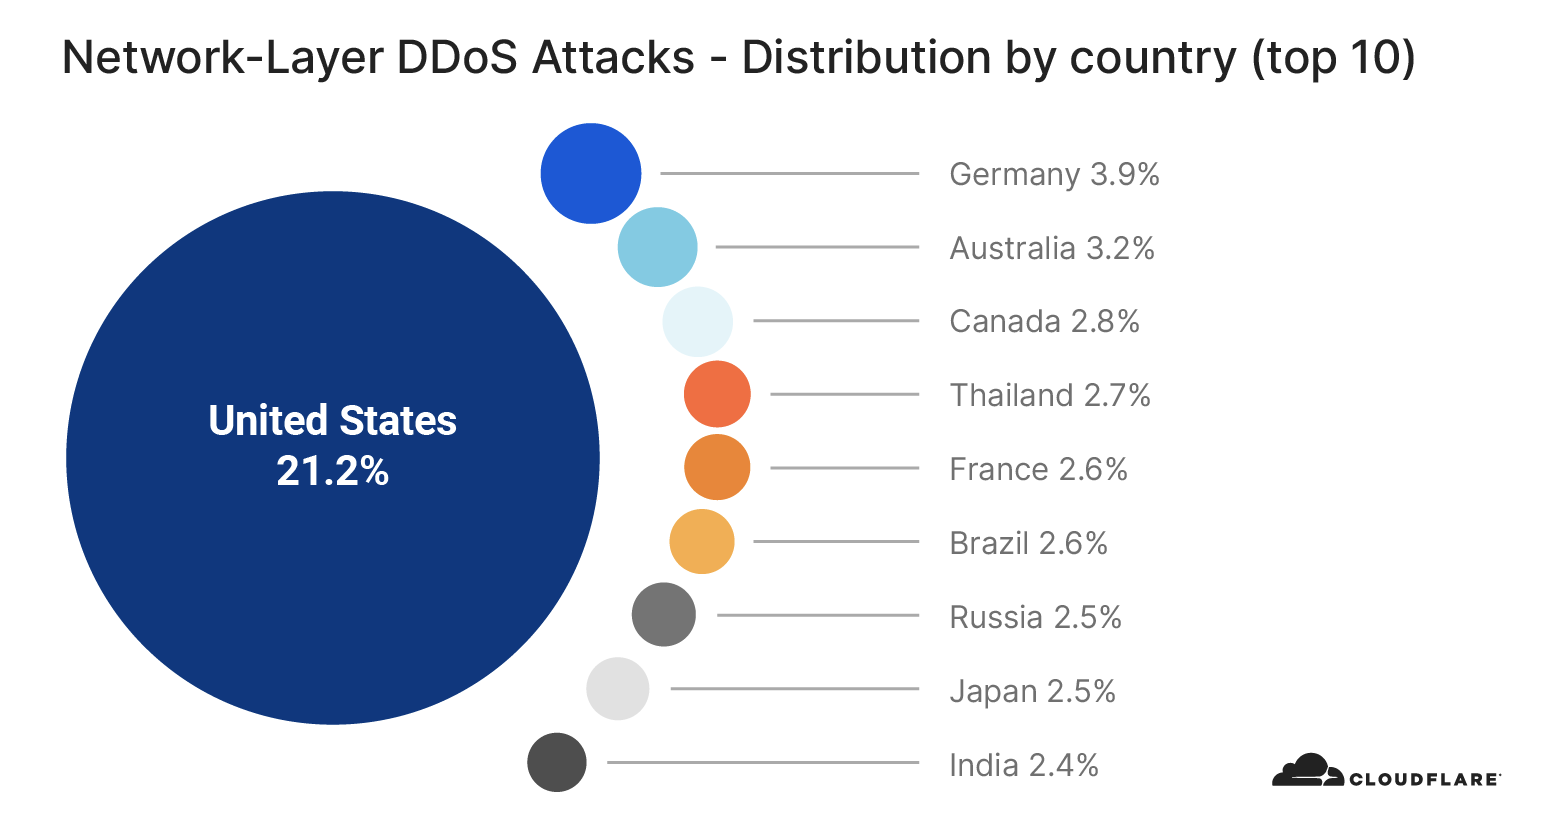
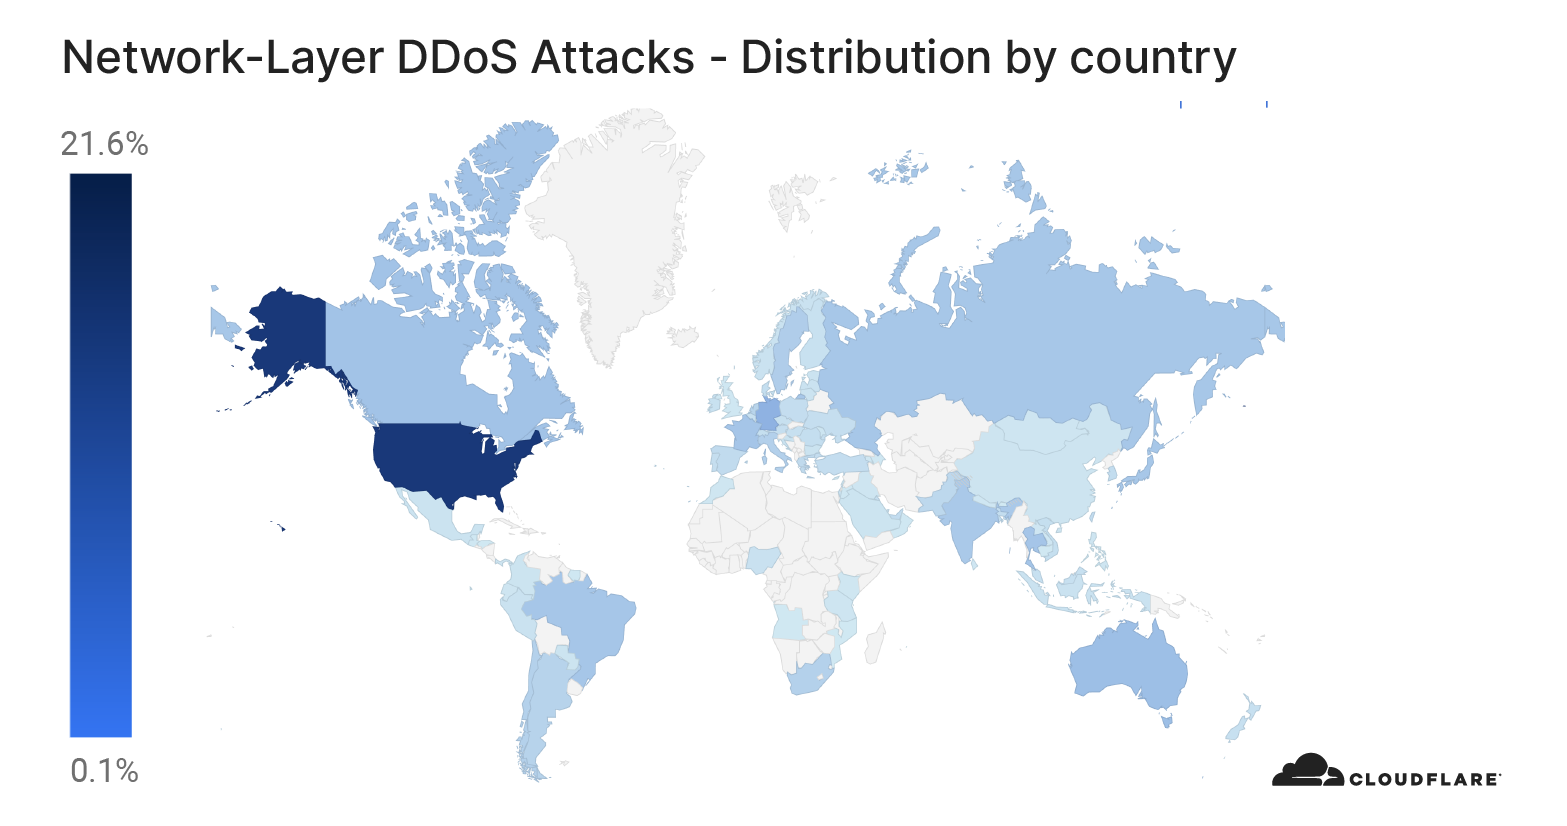
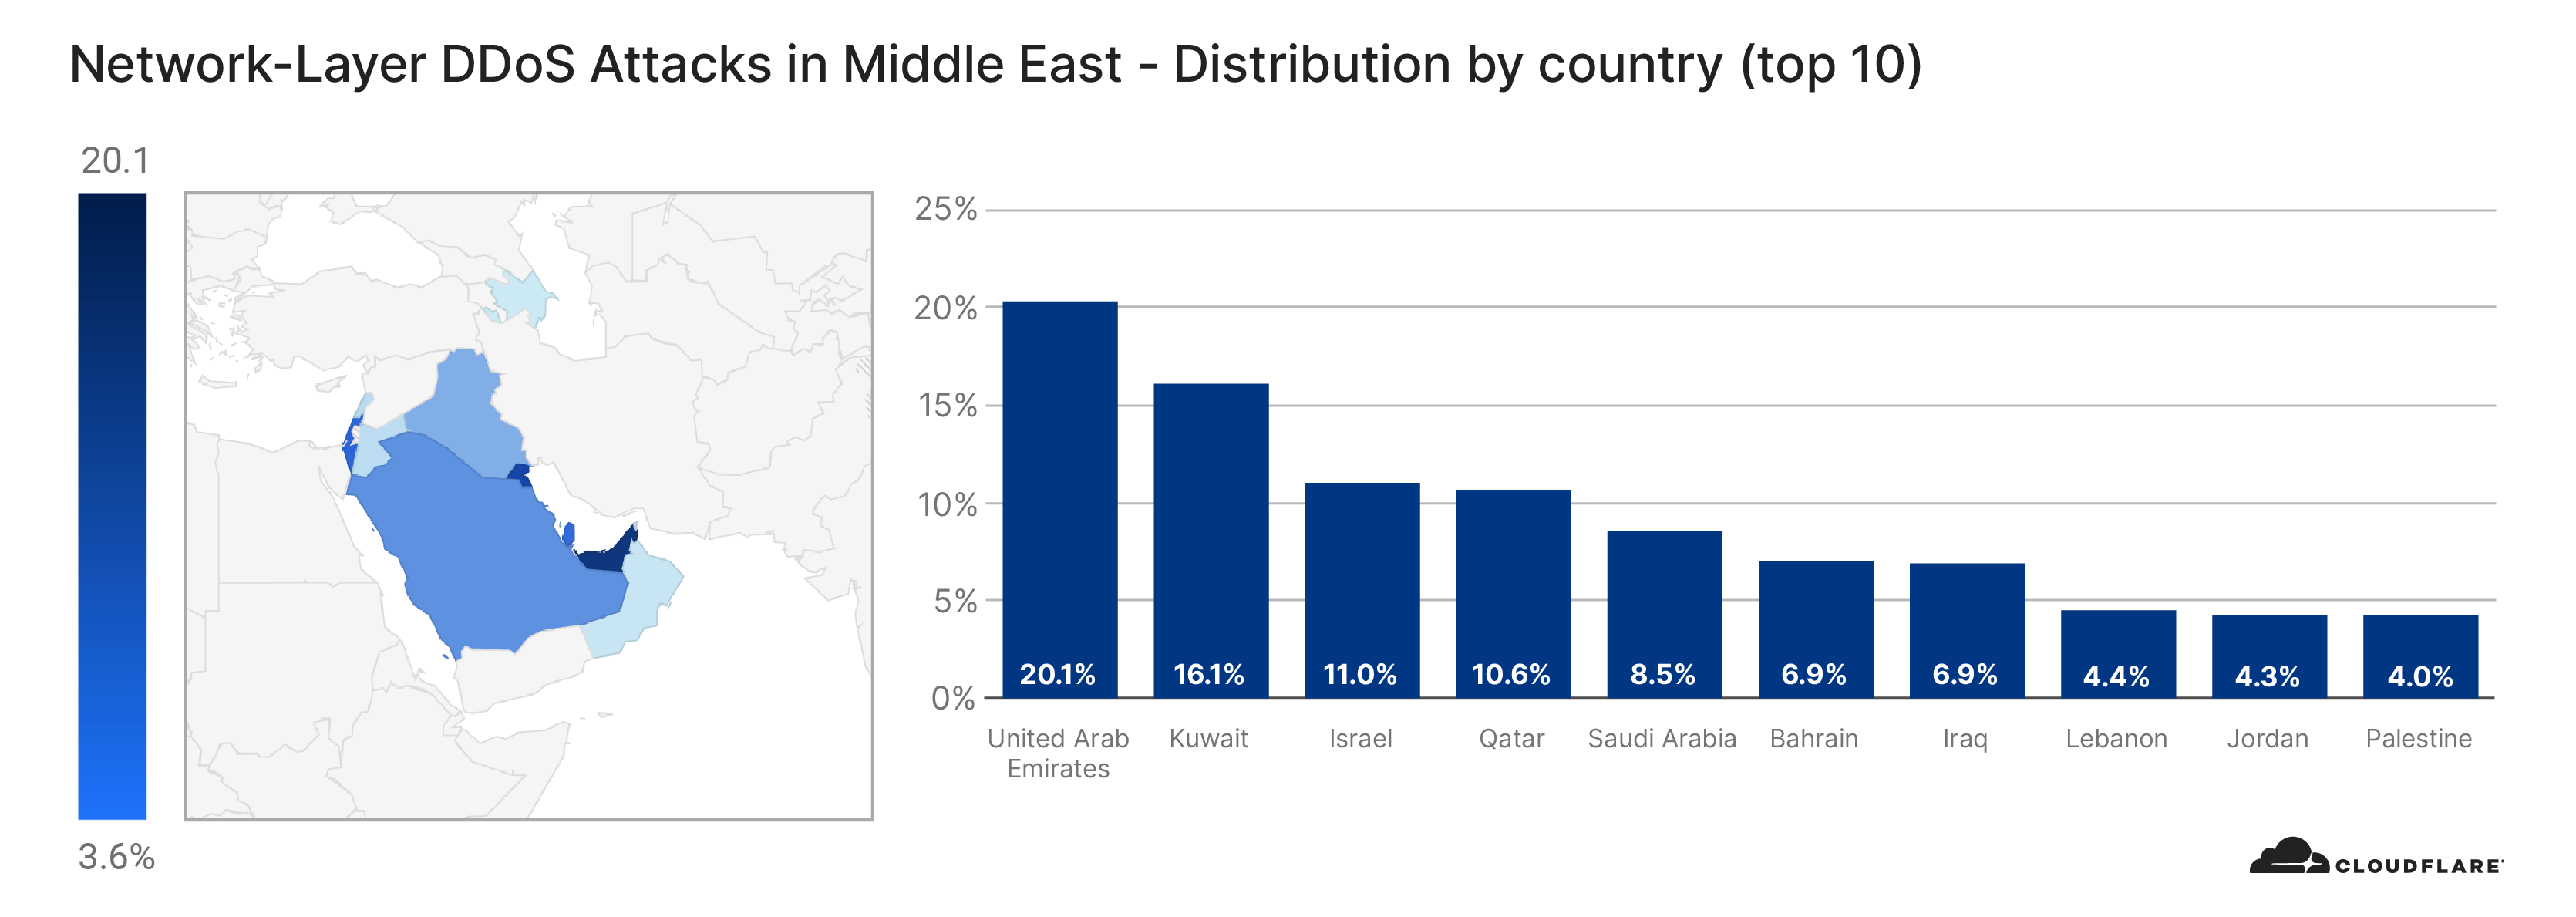
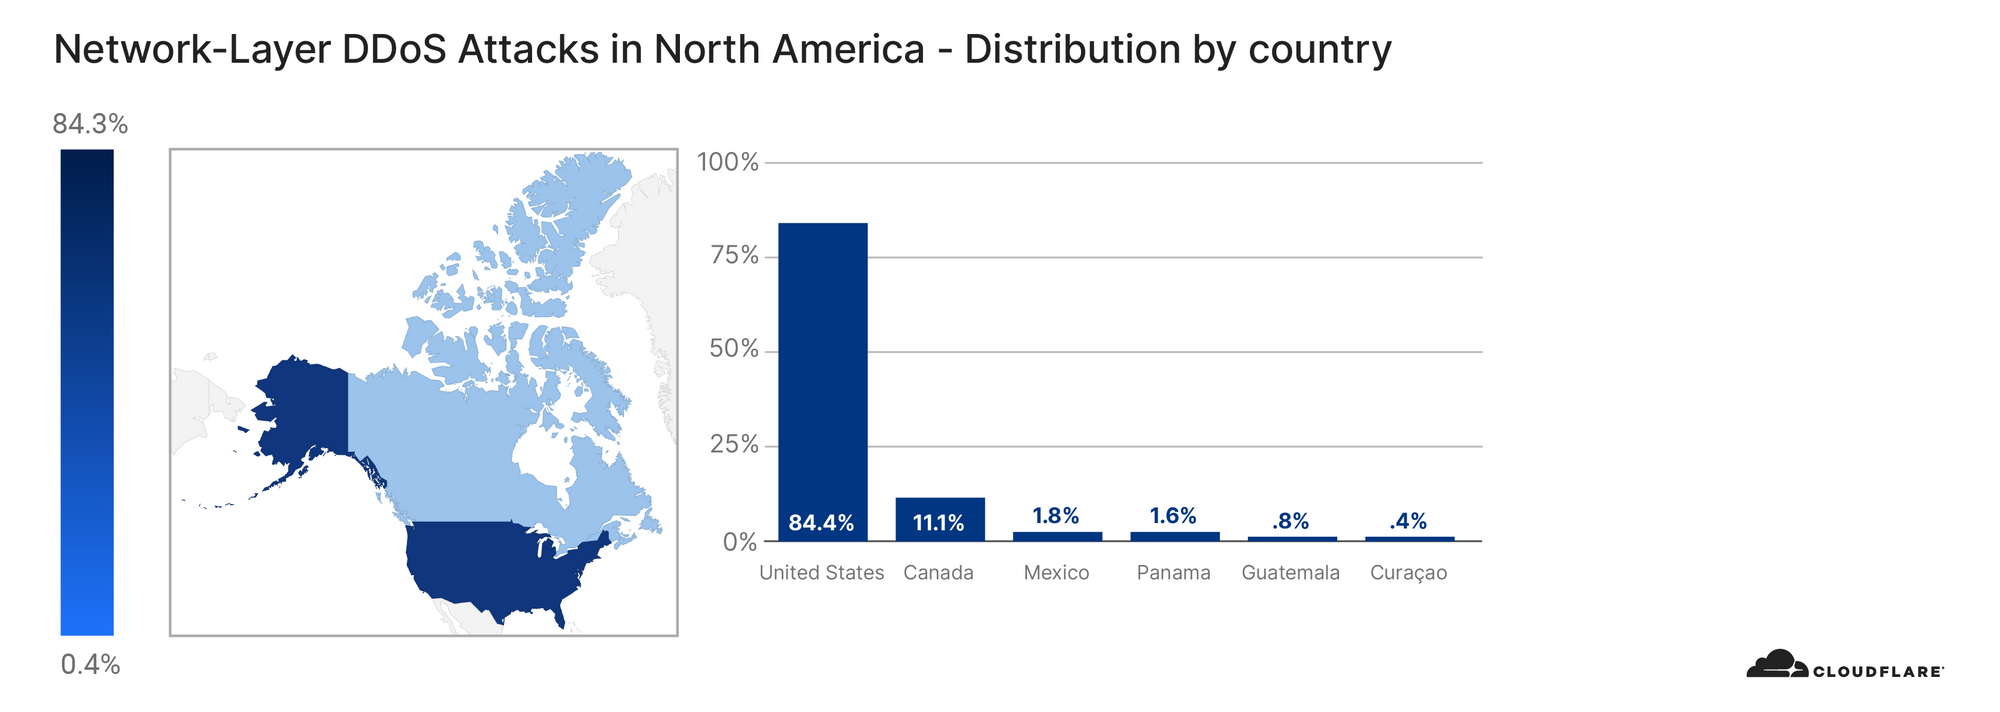
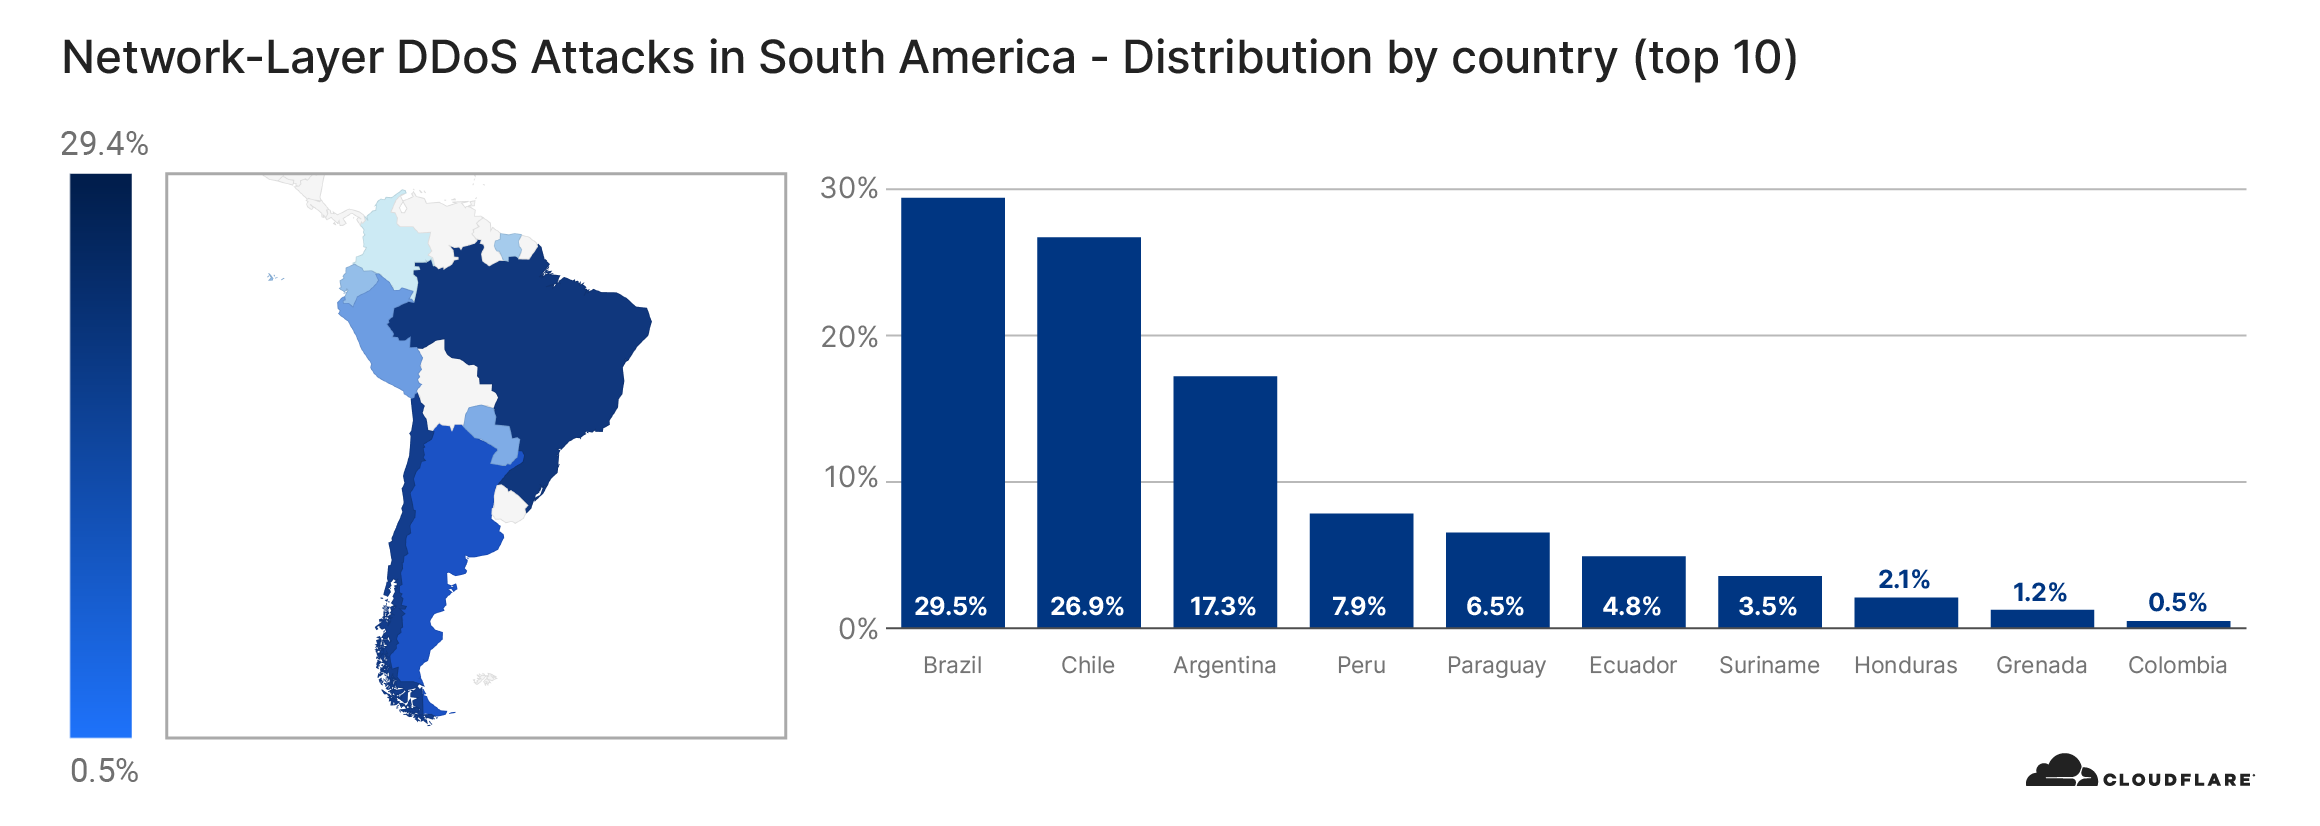
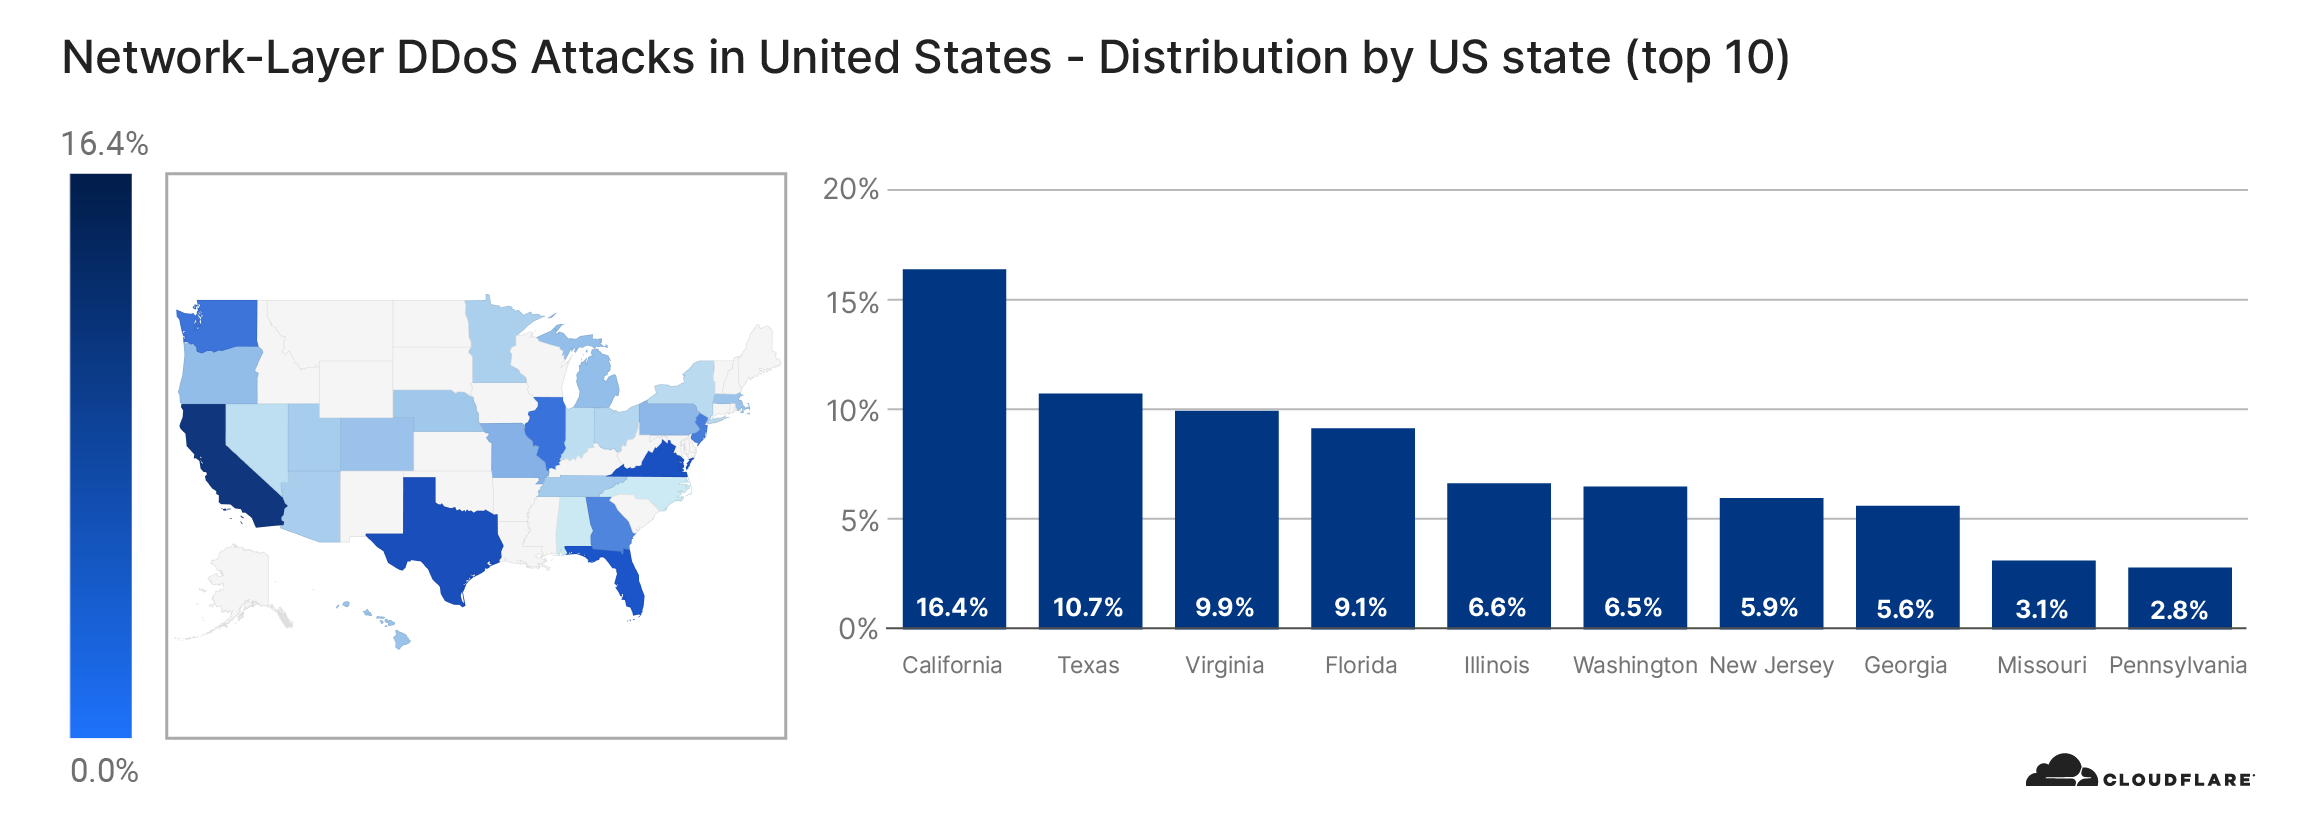
Looking at country-based distribution, the United States observed the most number of L3/4 DDoS attacks, followed by Germany and Australia. Note that when analyzing L3/4 DDoS attacks, we bucket the traffic by the Cloudflare edge data center locations where the traffic was ingested, and not by the location of the source IP. The reason is when attackers launch L3/4 attacks they can spoof the source IP address in order to obfuscate the attack source. If we were to derive the country based on a spoofed source IP, we would get a spoofed country. Cloudflare is able to overcome the challenges of spoofed IPs by displaying the attack data by the location of Cloudflare’s data center in which the attack was observed. We’re able to achieve geographical accuracy in our report because we have data centers in over 200 cities around the world.
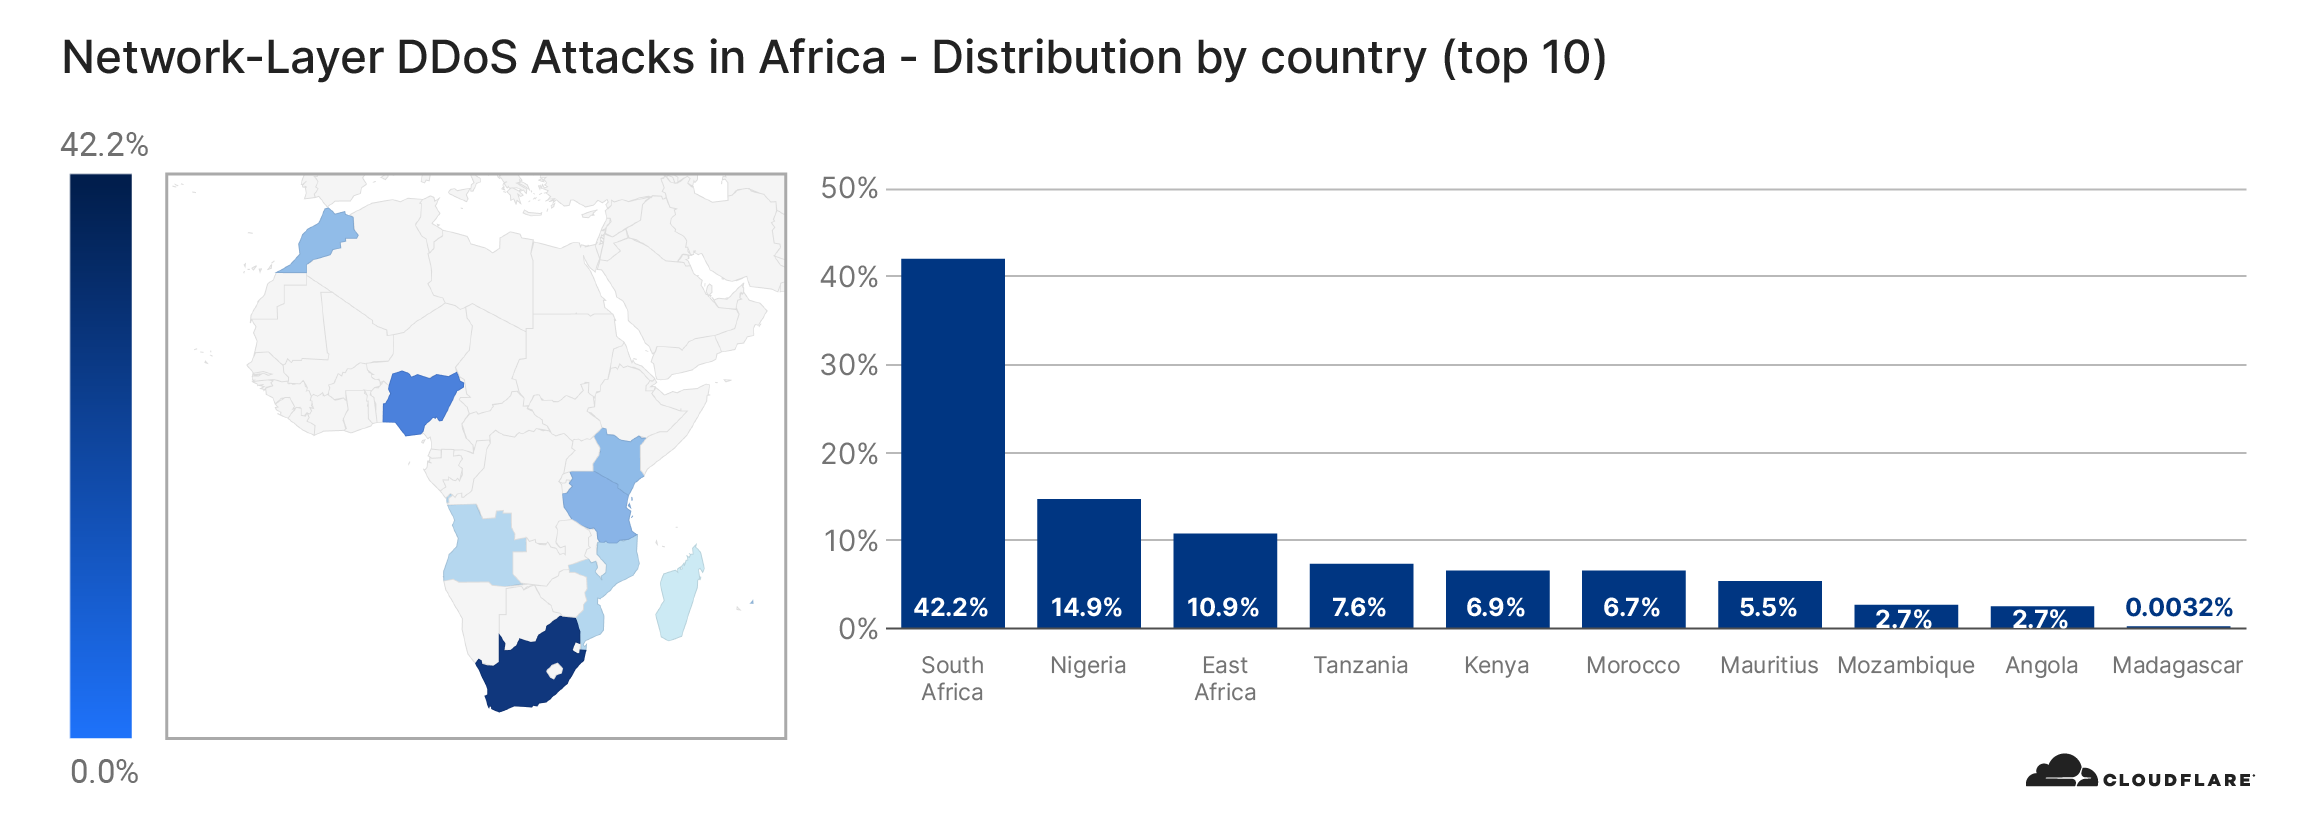
Africa
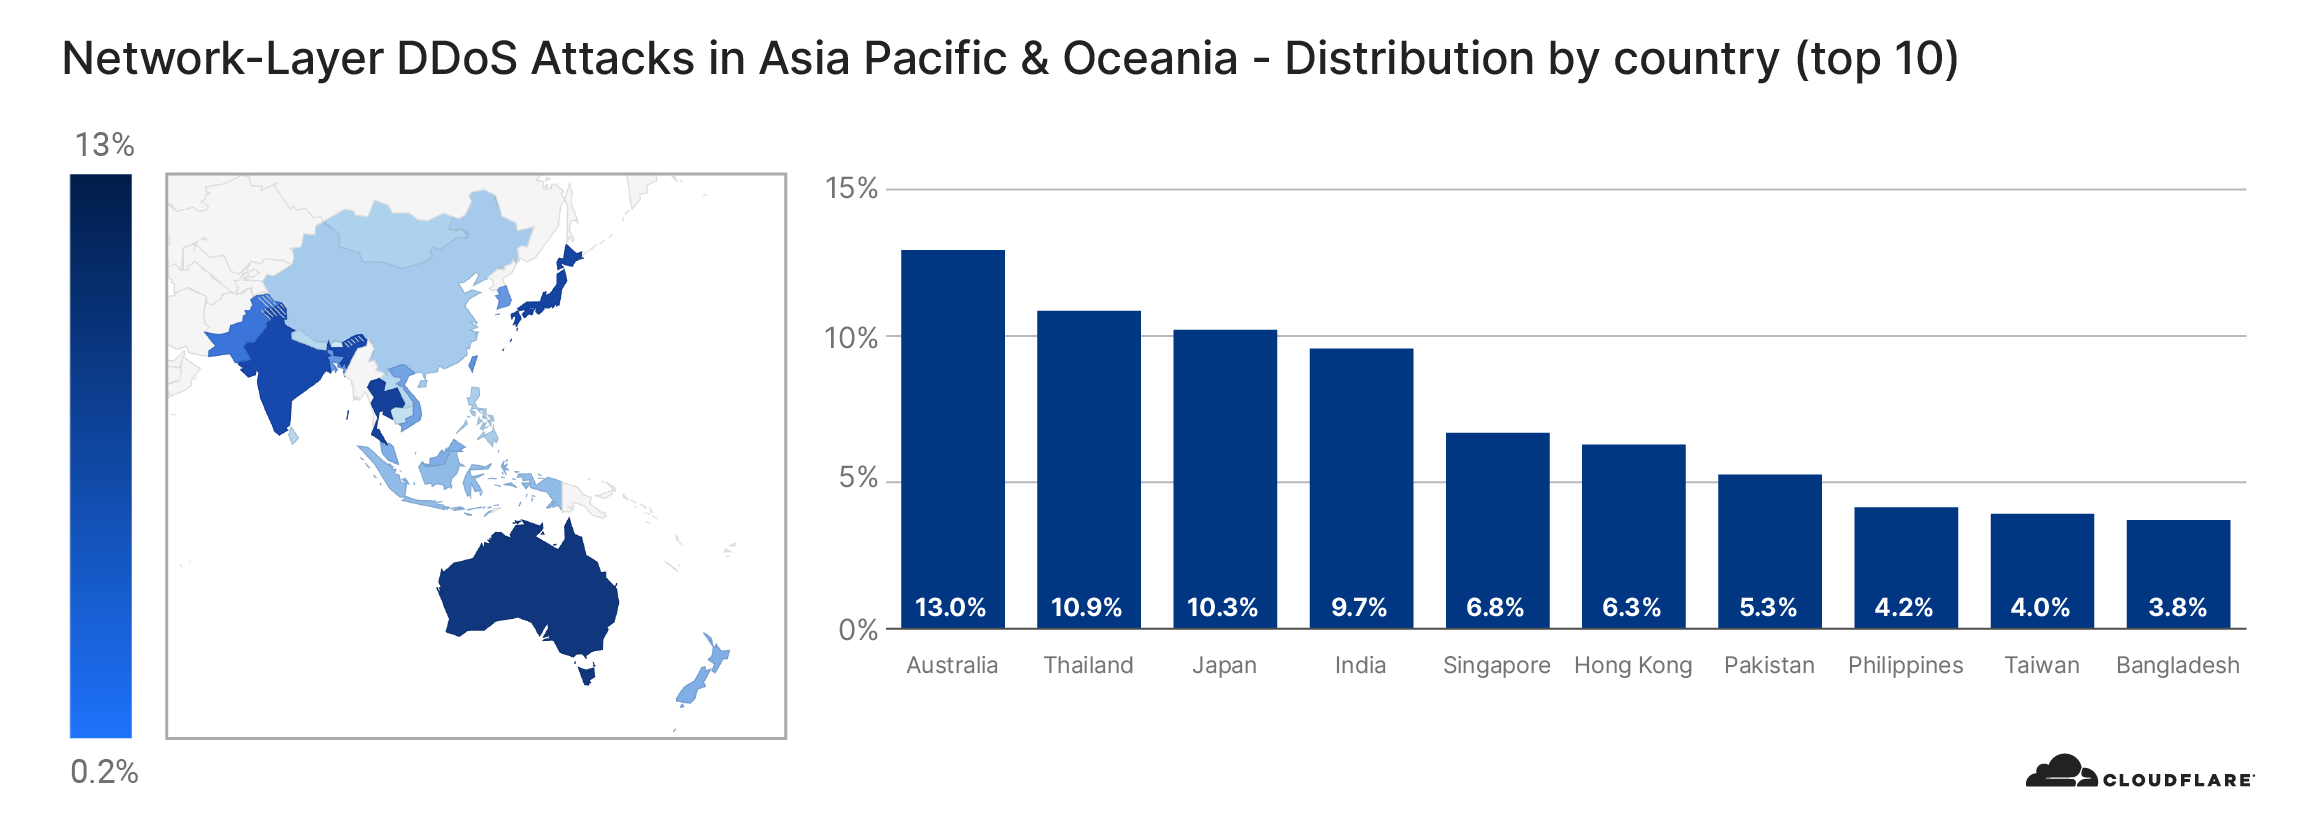
Asia Pacific & Oceania
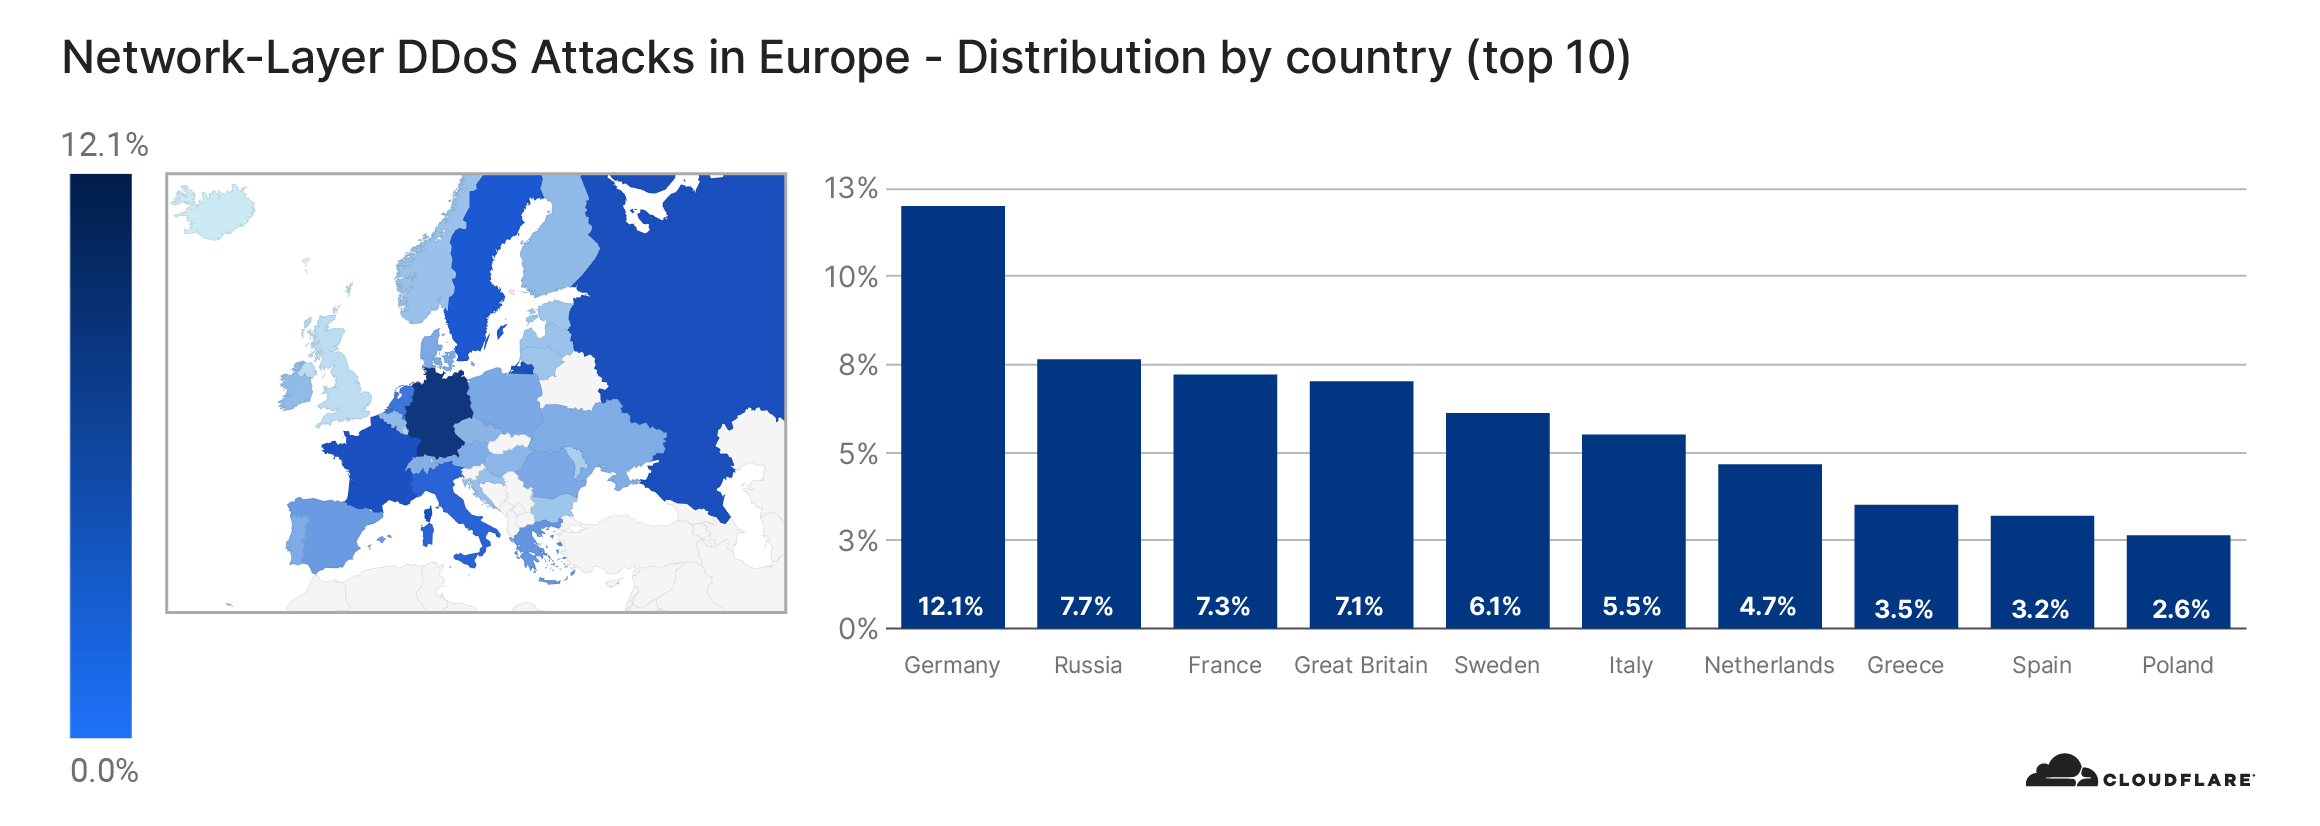
Europe
Middle East
North America
South America
United States
A note on recent ransom-driven DDoS attacks
Over the past months, Cloudflare has observed another disturbing trend — a rise in extortion and ransom-based DDoS (RDDoS) attacks targeting organizations around the world. While RDDoS threats do not always result in an actual attack, the cases seen in recent months show that attacker groups are willing to carry out the threat, launching large scale DDoS attacks that can overwhelm organizations that lack adequate protection. In some cases, the initial teaser attack may be sufficient to cause impact if not protected by a Cloud based DDoS protection service.
In a RDDoS attack, a malicious party threatens a person or organization with a cyberattack that could knock their networks, websites, or applications offline for a period of time, unless the person or organization pays a ransom. You can read more about RDDoS attacks here.
Entities claiming to be Fancy Bear, Cozy Bear, and Lazarus have been threatening to launch DDoS attacks against organizations’ websites and network infrastructure unless a ransom is paid before a given deadline. Additionally, an initial ‘teaser’ DDoS attack is usually launched as a form of demonstration before parallel to the ransom email. The demonstration attack is typically a UDP reflection attack using a variety of protocols, lasting roughly 30 minutes in duration (or less).
What to do if you receive a threat:
Do not panic and we recommend you to not pay the ransom: Paying the ransom only encourages bad actors, finances illegal activities —and there’s no guarantee that they won’t attack your network now or later.
Notify local law enforcement: They will also likely request a copy of the ransom letter that you received.
Contact Cloudflare: We can help ensure your website and network infrastructure are safeguarded from these ransom attacks.
Cloudflare DDoS protection is different
On-prem hardware/cloud-scrubbing centers can’t address the challenges of modern volumetric DDoS attacks. Appliances are easily overwhelmed by large DDoS attacks, Internet links quickly saturate, and rerouting traffic to cloud scrubbing centers introduces unacceptable latency penalties. Our cloud-native, always-on, automated DDoS protection approach solves problems that traditional cloud signaling approaches were originally created to address.
Cloudflare’s mission is to help build a better Internet, which grounds our DDoS approach and is why in 2017, we pioneered unmetered DDoS mitigation for all of our customers on all plans including the free plan. We are able to provide this level of protection because every server on our network can detect & block threats, enabling us to absorb attacks of any size/kind, with no latency impact. This architecture gives us unparalleled advantages compared to any other vendor.
51 Tbps of DDoS mitigation capacity and under 3 sec TTM: Every data center in Cloudflare’s network detects and mitigates DDoS attacks. Once an attack is identified, the Cloudflare’s local data center mitigation system (dosd) generates and applies a dynamically crafted rule with a real-time signature — and mitigates attacks in under 3 seconds globally on average. This 3-second Time To Mitigate (TTM) is one of the fastest in the industry. Firewall rules and “proactive”/static configurations take effect immediately.
Fast performance included: Cloudflare is architected so that customers do not incur a latency penalty as a result of attacks. We deliver DDoS protection from every Cloudflare data center (instead of legacy scrubbing centers or on-premise hardware boxes) which allows us to mitigate attacks closest to the source. Cloudflare analyzes traffic out-of-path ensuring that our DDoS mitigation solution doesn’t add any latency to legitimate traffic. The rule is applied at the most optimal place in the Linux stack for a cost efficient mitigation, ensuring no performance penalty.
Global Threat Intelligence: Like an immune system, our network learns from/mitigates attacks against any customer to protect them all. With threat intelligence (TI), it automatically blocks attacks and is employed in customer facing features (Bot Fight mode, Firewall Rules & Security Level). Users create custom rules to mitigate attacks based on traffic attribute filters, threat & bot scores generated using ML models (protecting against bots/botnets/DDoS).
We’re excited to announce the expansion of the Network Analytics dashboard to Spectrum customers on the Enterprise plan. Additionally, this announcement introduces two major dashboard improvements for easier reporting and investigation.
Network Analytics
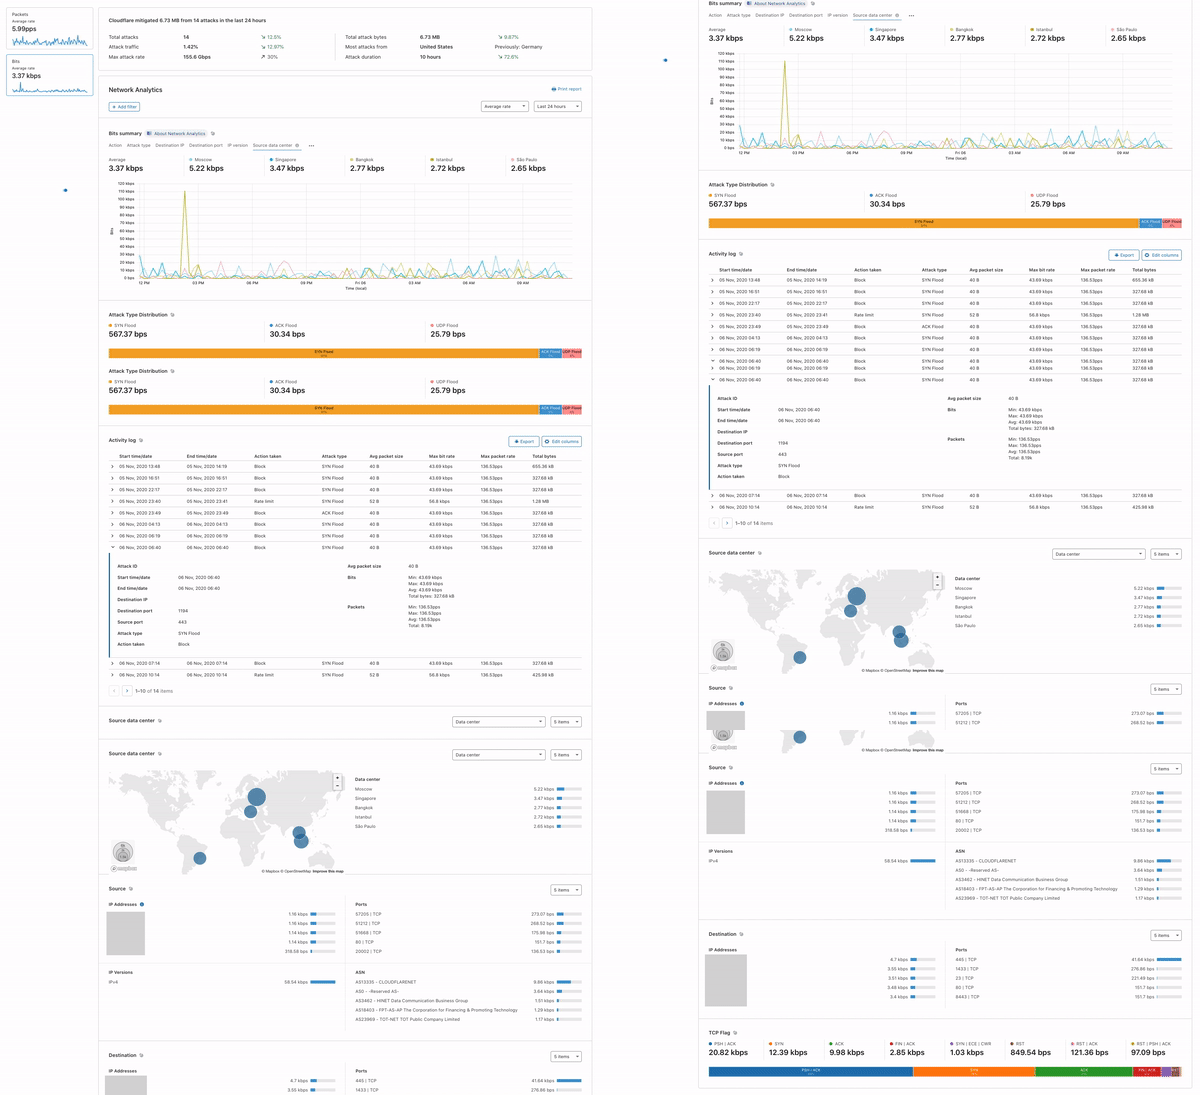
Cloudflare’s packet and bit oriented dashboard, Network Analytics, provides visibility into Internet traffic patterns and DDoS attacks in Layers 3 and 4 of the OSI model. This allows our users to better understand the traffic patterns and DDoS attacks as observed at the Cloudflare edge.
When the dashboard was first released in January, these capabilities were only available to Bring Your Own IP customers on the Spectrum and Magic Transit services, but now Spectrum customers using Cloudflare’s Anycast IPs are also supported.
Protecting L4 applications
Spectrum is Cloudflare’s L4 reverse-proxy service that offers unmetered DDoS protection and traffic acceleration for TCP and UDP applications. It provides enhanced traffic performance through faster TLS, optimized network routing, and high speed interconnection. It also provides encryption to legacy protocols and applications that don’t come with embedded encryption. Customers who typically use Spectrum operate services in which network performance and resilience to DDoS attacks are of utmost importance to their business, such as email, remote access, and gaming.
Spectrum customers can now view detailed traffic reports on DDoS attacks on their configured TCP/ UDP applications, including size of attacks, attack vectors, source location of attacks, and permitted traffic. What’s more, users can also configure and receive real-time alerts when their services are attacked.
Network Analytics: Rebooted
Since releasing the Network Analytics dashboard in January, we have been constantly improving its capabilities. Today, we’re announcing two major improvements that will make both reporting and investigation easier for our customers: DDoS Insights & Trend and Group-byFiltering for grouping-based traffic analysis.
DDoS Trends Insights
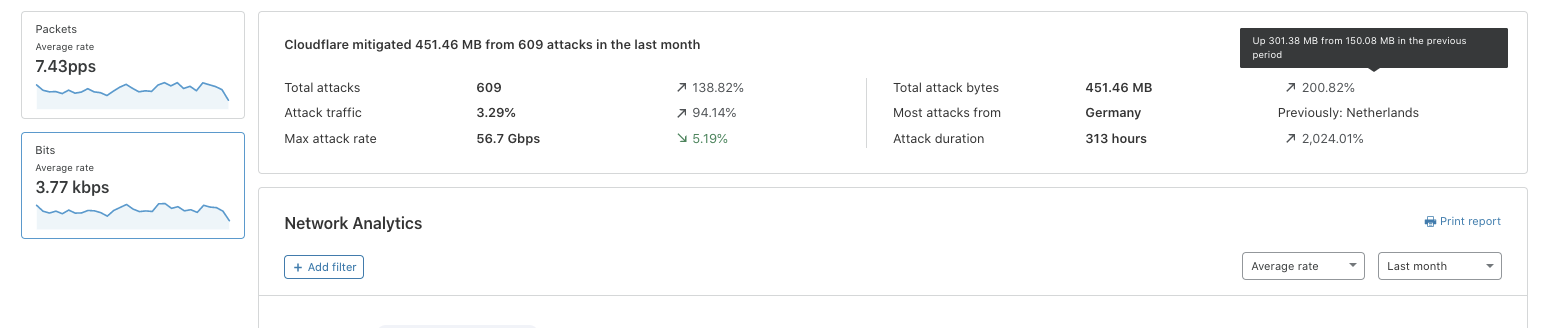
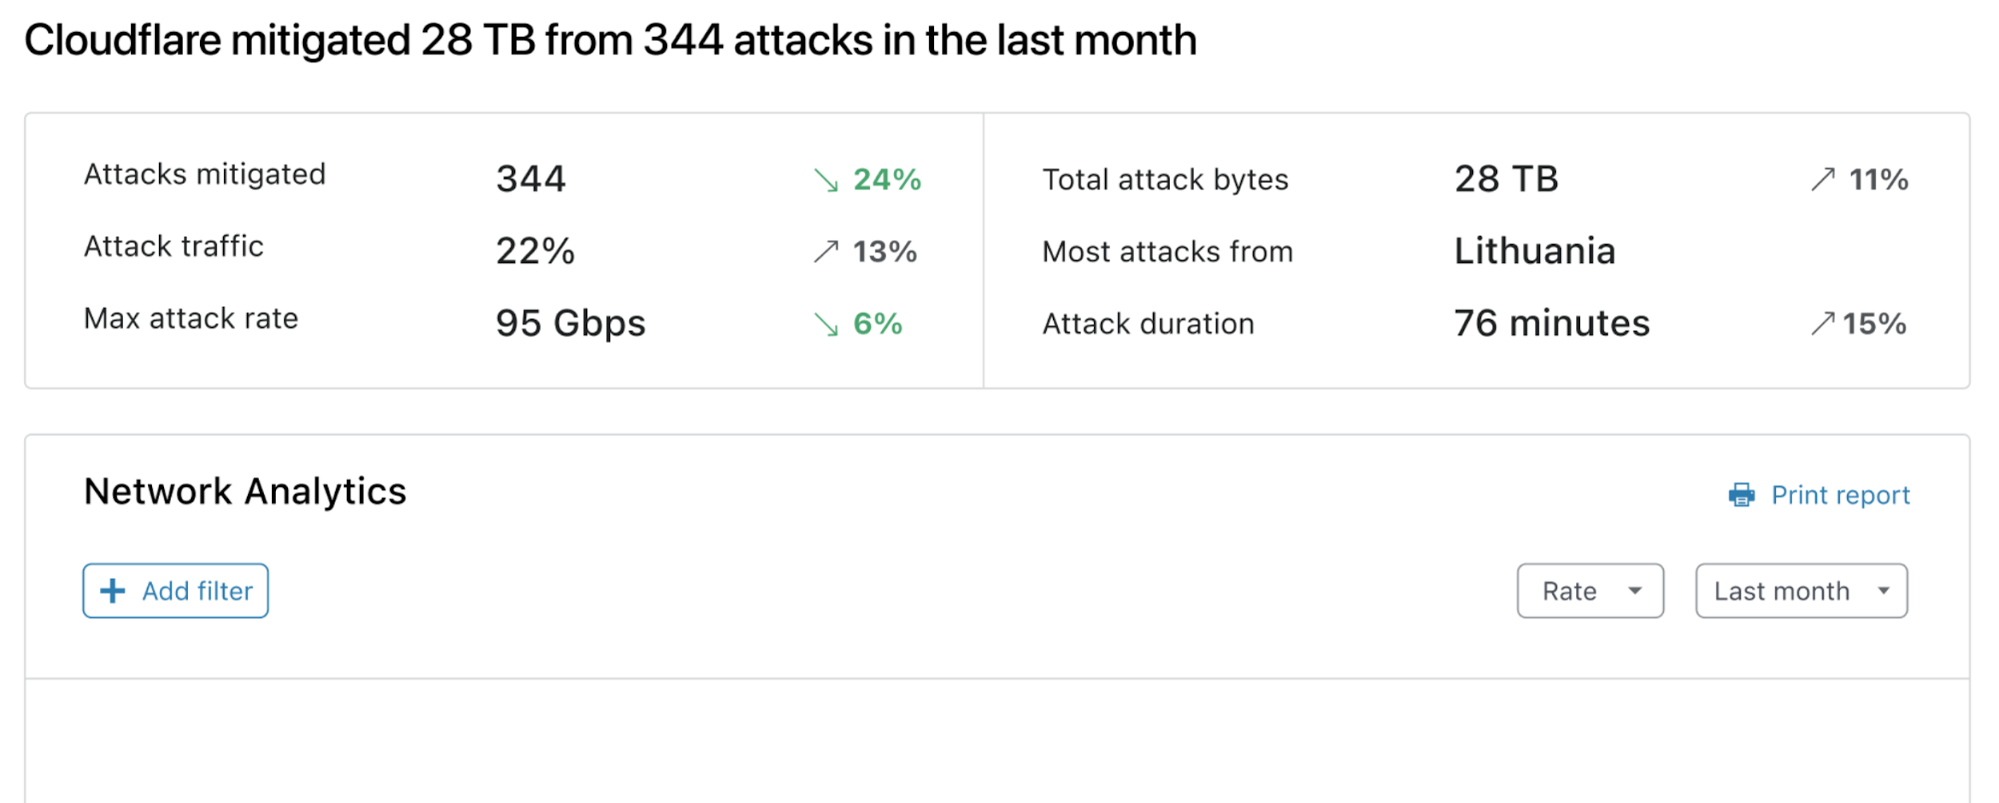
First and foremost, we are adding a new DDoS Insights & Trends card, which provides dynamic insights into your attack trends over time. This feature provides a real-time view of the number of attacks, the percentage of attack traffic, the maximum attack rates, the total mitigated bytes, the main attack origin country, and the total duration of attacks, which can indicate the potential downtime that was prevented. These data points were surfaced as the most crucial ones by our customers in the feedback sessions. Along with the percentage of change period-over-period, our customers can easily understand how their security landscape evolves.
Trends Insights
Troubleshooting made easy
In the main time series chart seen in the dashboard, we added an ability for users to change the Group-by field which enables users to customize the Y axis. This way, a user can quickly identify traffic anomalies and sudden changes in traffic based on criteria such as IP protocols, TCP flags, source country, and take action if needed with Magic Firewall, Spectrum or BYOIP.
Time Series Group-By Filtering
Harnessing Cloudflare’s edge to empower our users
The DDoS Insights & Trends, the new investigation tools and the additional user interface enhancements can assist your organization to better understand your security landscape and take more meaningful actions as needed. We have more updates in Network Analytics dashboard, which are not covered in the scope of this post, including:
Export logs as a CSV
Zoom-in feature in the time series chart
Drop-down view option for average rate and total volume
Increased Top N views for source and destination values
Addition of country and data center for source values
New visualisation of the TCP flag distribution
Details on these updates can be found in our Help Center, which you can now access via the dashboard as well.
In the near future, we will also expand Network Analytics to Spectrum customers on the Business plan, and WAF customers on the Enterprise and Business plans. Stay tuned!
If you are a customer in Magic Transit, Spectrum or BYOIP, go try out the Network Analytics dashboard yourself today.
In July 2020, I joined Cloudflare as a Product Management Intern on the DDoS (Distributed Denial of Service) team to enhance the benefits that Network Analytics brings to our customers. In the following, I am excited to share with you my experience with remote working as an intern, and how I acclimatized into Cloudflare. I also give details about what my work entailed and how we approached the process of Product Management.
Onboarding to Cloudflare during COVID19
As a long-time user of Cloudflare’s Free CDN plan myself, I was thrilled to join the company and learn what was happening behind the scenes while making its products. The entering internship class consisted of students and recent graduates from various backgrounds around the world – all with a mutual passion in helping build a better Internet.
The catch here was that 2020 would make the experience of being an intern very different. As it was the case with many other fellow interns, it was the first time I had taken up work remotely from scratch. The initial challenge was to integrate into the working environment without ever meeting colleagues in a physical office. Because everything took place online, it was much harder to pick up non-verbal cues that play a key role in communication, such as eye contact and body language.
To face this challenge, Cloudflare introduced creative and active ways in which we could better interact with one another. From the very first day, I was welcomed to an abundance of knowledge sharing talks and coffee chats with new and existing colleagues in different offices across the world. Whether it was data protection from the Legal team or going serverless with Workers, we were welcomed to afternoon seminars every week on a new area that was being pursued within Cloudflare.
Cloudflare not only retained the summer internship scheme, but in fact doubled the size of the class; this reinforced an optimistic mood within the entering class and a sense of personal responsibility. I was paired up with a mentor, a buddy, and a manager who helped me find my way quickly within Cloudflare, and without which my experience would not have been the same. Thanks to Omer, Pat, Val and countless others for all your incredible support!
Social interactions took various forms and were scheduled for all global time zones. I was invited to weekly virtual yoga sessions and intern meetups to network and discover what other interns across the world were working on. We got to virtually mingle at an “Intern Mixer” where we shared answers to philosophical prompts – what’s more, this was accompanied by an UberEats coupon for us to enjoy refreshments in our work-from-home setting. We also had Pub Quizzes with colleagues in the EMEA region to brush up on our trivia skills. At this uncertain time of the year, part of which I spent in complete self-isolation, these gatherings helped create a sense of belonging within the community, as well as an affinity towards the colleagues I interacted with.
Product Management at Cloudflare
My internship also offered a unique learning experience from the Product Management perspective. I took on the task of increasing the value of Network Analytics by giving customers and internal stakeholders improved transparency in the traffic patterns and attacks taking place. Network Analytics is Cloudflare’s packet- and bit-oriented dashboard that provides visibility into network- and transport-layer attacks which are mitigated across the world. Among various updates I led in visibility features is the new trends insights. During this time the dashboard was also extended to Enterprise customers on the Spectrum service, Cloudflare’s L4 reverse-proxy that provides DDoS protection against attacks and facilitates network performance.
I was at the intersection of multiple teams that contributed to Network Analytics from different angles, including user interface, UX research, product design, product content and backend engineering, among many others. The key to a successful delivery of Network Analytics as a product, given its interdisciplinary nature, meant that I actively facilitated communication and collaboration across experts in these teams as well as reflected the needs of the users.
I spent the first month of the internship approaching internal stakeholders, namely Customer Support engineers, Solutions Engineers, Customer Success Managers, and Product Managers, to better understand the common pain points. Given their past experience with customers, their insights revealed how Network Analytics could both leverage the existing visibility features to reduce overhead costs on the internal support side and empower users with actionable insights. This process also helped ensure that I didn’t reinvent wheels that had already been explored by existing Product Managers.
I then approached customers to enquire about desired areas for improvements. An example of such a desired improvement was that the display of data in the dashboard was not helping users infer any meaning regarding next steps. It did not answer questions like: What do these numbers represent in retrospect, and should I be concerned? Discussing these aspects helped validate the needs, and we subsequently came up with rough solutions to address them, such as dynamic trends view. Over the calls, we confirmed that – especially from those who rarely accessed the dashboard – having an overview of these numbers in the form of a trends card would incentivize users to log in more often and get more value from the product.
Trends Insights
The 1:1 dialogues were incredibly helpful in understanding how Network Analytics could be more effectively utilized, and guided ways for us to better surface the performance of our DDoS mitigation tools to our customers. In the first few weeks of the internship, I shadowed customer calls of other products; this helped me gain the confidence, knowledge, and language appropriate in Cloudflare’s user research. I did a run-through of the interview questions with a UX Researcher, and was informed on the procedure for getting in touch with appropriate customers. We even had bilingual calls where the Customer Success Manager helped translate the dialogues real-time.
In the following weeks, I synthesized these findings into a Product Requirements Document and lined up the features according to quarterly goals that could now be addressed in collaboration with other teams. After a formal review and discussion with Product Managers, engineers, and designers, we developed and rolled out each feature to the customers on a bi-weekly basis. We always welcomed feedback before and after the feature releases, as the goal wasn’t to have an ultimate final product, but to deliver incremental enhancements to meet the evolving needs of our customers.
Of course, all my interactions, including customer and internal stakeholder calls, were all held remotely. We all embraced video conferencing and instant chat messengers to make it feel as though we were physically close. I had weekly check-ins with various colleagues including my managers, Network Analytics team, DDoS engineering team, and DDoS reports team, to ensure that things were on track. For me, the key to working remotely was the instant chat function, which was not as intrusive as a fully fledged meeting, but a quick and considerate way to communicate in a tightly-knit team.
Looking Back
Product Management is a growth process – both for the corresponding individual and the product. As an individual, you grow fast through creative thinking, problem solving and incessant curiosity to better understand a product in the shoes of a customer. At the same time, the product continues to evolve and grow as a result of synergy between experts from diverse fields and customer feedback. Products are used and experienced by people, so it is a no-brainer that maintaining constant and direct feedback from our customers and internal stakeholders are what bolsters their quality.
It was an incredible opportunity to have been a part of an organization that represents one of the largest networks. Network Analytics is a window into the efforts led by Cloudflare engineers and technicians to help secure the Internet, and we are ambitious to scale the transparency across further mitigation systems in the future.
The internship was a successful immersive experience into the world of Network Analytics and Product Management, even in the face of a pandemic. Owing to Cloudflare’s flexibility and ready access to resources for remote work, I was able to adapt to the work environment from the first day onwards and gain an authentic learning experience into how products work. As I now return to university, I look back on an internship that significantly added to my personal and professional growth. I am happy to leave behind the latest evolution of Network Analytics dashboard with hopefully many more to come. Thanks to Cloudflare and all my colleagues for making this possible!
Today we’re announcing the availability of DDoS attack alerts. The alerts are available for free for all Cloudflare’s customers on paid plans.
Unmetered DDoS protection
Last week we celebrated Cloudflare’s 10th birthday in what we call Birthday Week. Every year, on each day of Birthday Week, we announce a new product with the goal of helping make the Internet a better place — one that is safer and faster. To do that, over the years we’ve democratized many products that were previously only available to large enterprises by making them available for free (or at very low cost) to all. For example, on Cloudflare’s 7th birthday in 2017, we announced free unmetered DDoS protection as part of every Cloudflare product and every plan, including the free plan.
DDoS attacks aim to take down websites or online services and make them unavailable to the public. We wanted to make sure that every organization and every website is available and accessible, regardless if they can or can’t afford enterprise-grade DDoS protection. This has been a core part of our mission. We’ve been heavily investing in our DDoS protection capabilities over the last 10 years, and we will continue to do so in the future.
Real-time DDoS attack alerts
I’ve recently published a few blogs that provide a look under the hood of our DDoS protection systems. These systems run autonomously, they detect and mitigate attacks without any human intervention. As was the case with the 654 Gbps attack in July, and the 754 Mpps attack in June. We’ve been successful at blocking DDoS attacks and also providing our users with important analytics and insights about the attacks, but our customers also want to be notified in real-time when they are targeted by DDoS attacks.
So today, we’re excited to announce the availability of DDoS alerts. The current delivery methods by Cloudflare plan type are listed in the table below. Additional delivery methods will be made available in the future.
Delivery methods by plan
Delivery method
Plan
Free
Pro
Business
Enterprise
Email
❌
✅
✅
✅
PagerDuty
❌
❌
✅
✅
There are two types of DDoS alerts: HTTP DDoS alerts and L3/4 DDoS alerts. Whether you are eligible to one or both depends on the Cloudflare services that you are subscribed to. The table below lists the alert types by the Cloudflare service.
Alert types by service
Alert type
Service
WAF/CDN
Spectrum
Spectrum BYOIP
Magic Transit
HTTP DDoS alerts
✅
❌
❌
❌
L3/4 DDoS alerts
Coming soon
Coming soon
✅
✅
Creating a DDoS alert policy
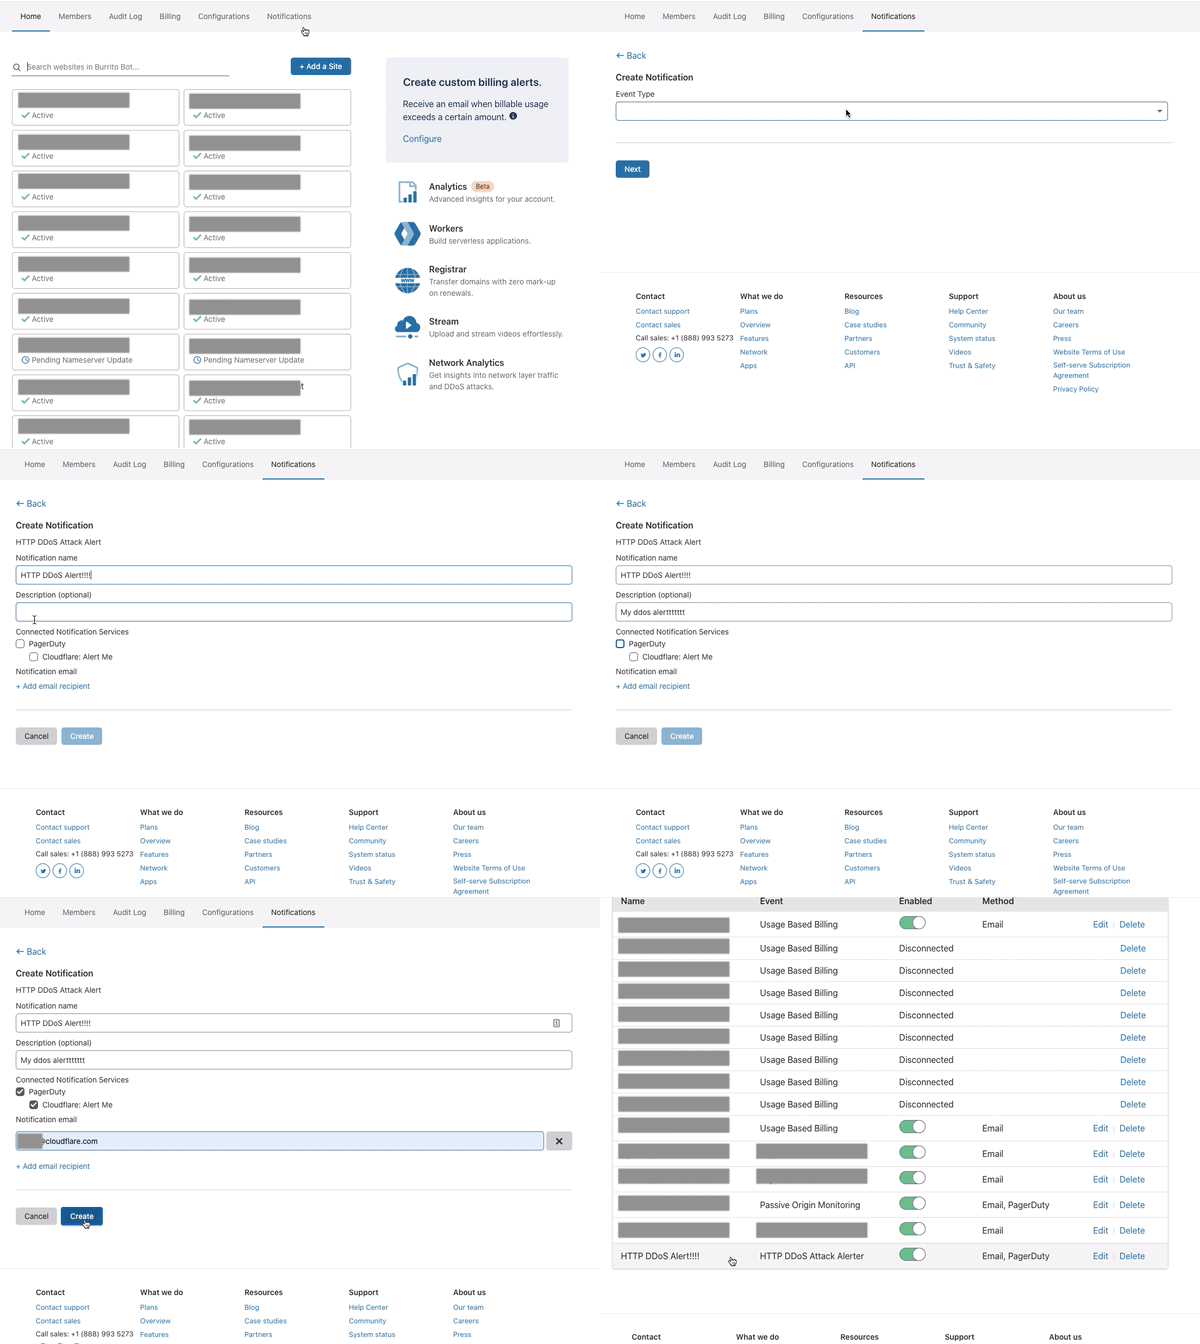
In order to receive alerts on DDoS attacks that target your Cloudflare-protected Internet property, you must first create a notification policy. That’s fast and easy:
In the Account Home page, navigate to the Notifications tab
In the Notifications card, click Create
Give your notification a name, add an optional description, and the email addresses of the recipients.
If you are on the Business plan or higher, you’ll need to connect to PagerDuty before creating the alert policy. Once you’ve done so, you’ll have the option to send the alert to your PagerDuty service.
Receive the alert, view the attack, and give feedback
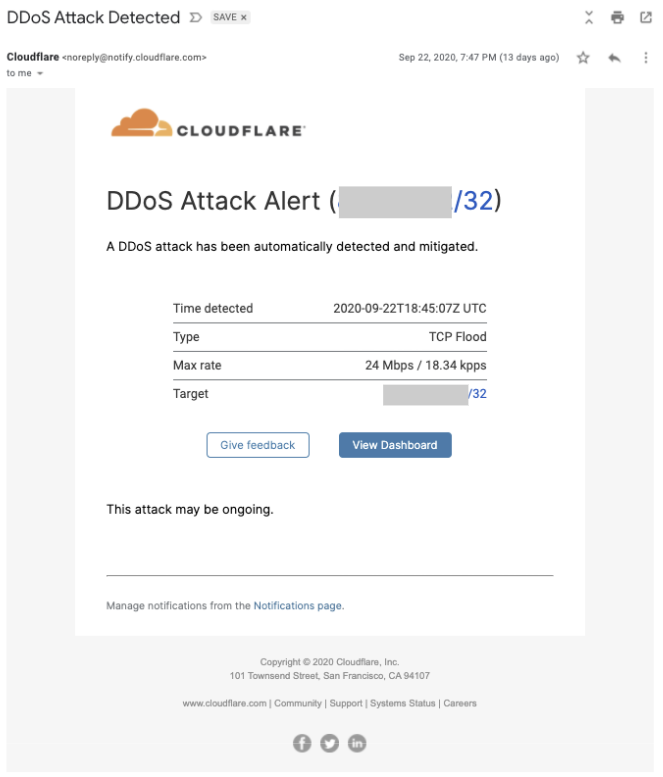
When developing and designing the alert template, we interviewed many of our customers to understand what information is important to them, what would make the alert useful and easy to understand. We’ve intentionally made the alert short. The email subject is also straightforward: DDoS Attack Detected, and it will only be sent from our official email address: [email protected][dot]com. Add this email to your list of trusted email addresses to assure you don’t miss the alerts.
The alert includes the following information:
A short description of what happened
The date and time the attack was initially detected and mitigated by our systems
The attack type
The max rate of the attack when the alert was triggered
The attack target
The attack may be ongoing when you receive the alert and so we also include a link to view the attack in the Cloudflare dashboard and also a link to provide feedback on the protection and visibility.
We’d love to get your feedback!
We’d love your feedback on our DDoS protection solution. When you receive a DDoS alert, you’ll be provided with a link to submit your feedback. Measuring user satisfaction helps us build better products. Your feedback helps us measure user satisfaction for Cloudflare’s DDoS protection and the attack analytics that we provide in the dashboard. User satisfaction rates are one of the main Key Performance Indicators (KPIs) for our DDoS protection service that we monitor closely. So give your feedback, and help us make DDoS protection better for everyone.
Not a Cloudflare customer yet? Sign up to get started.
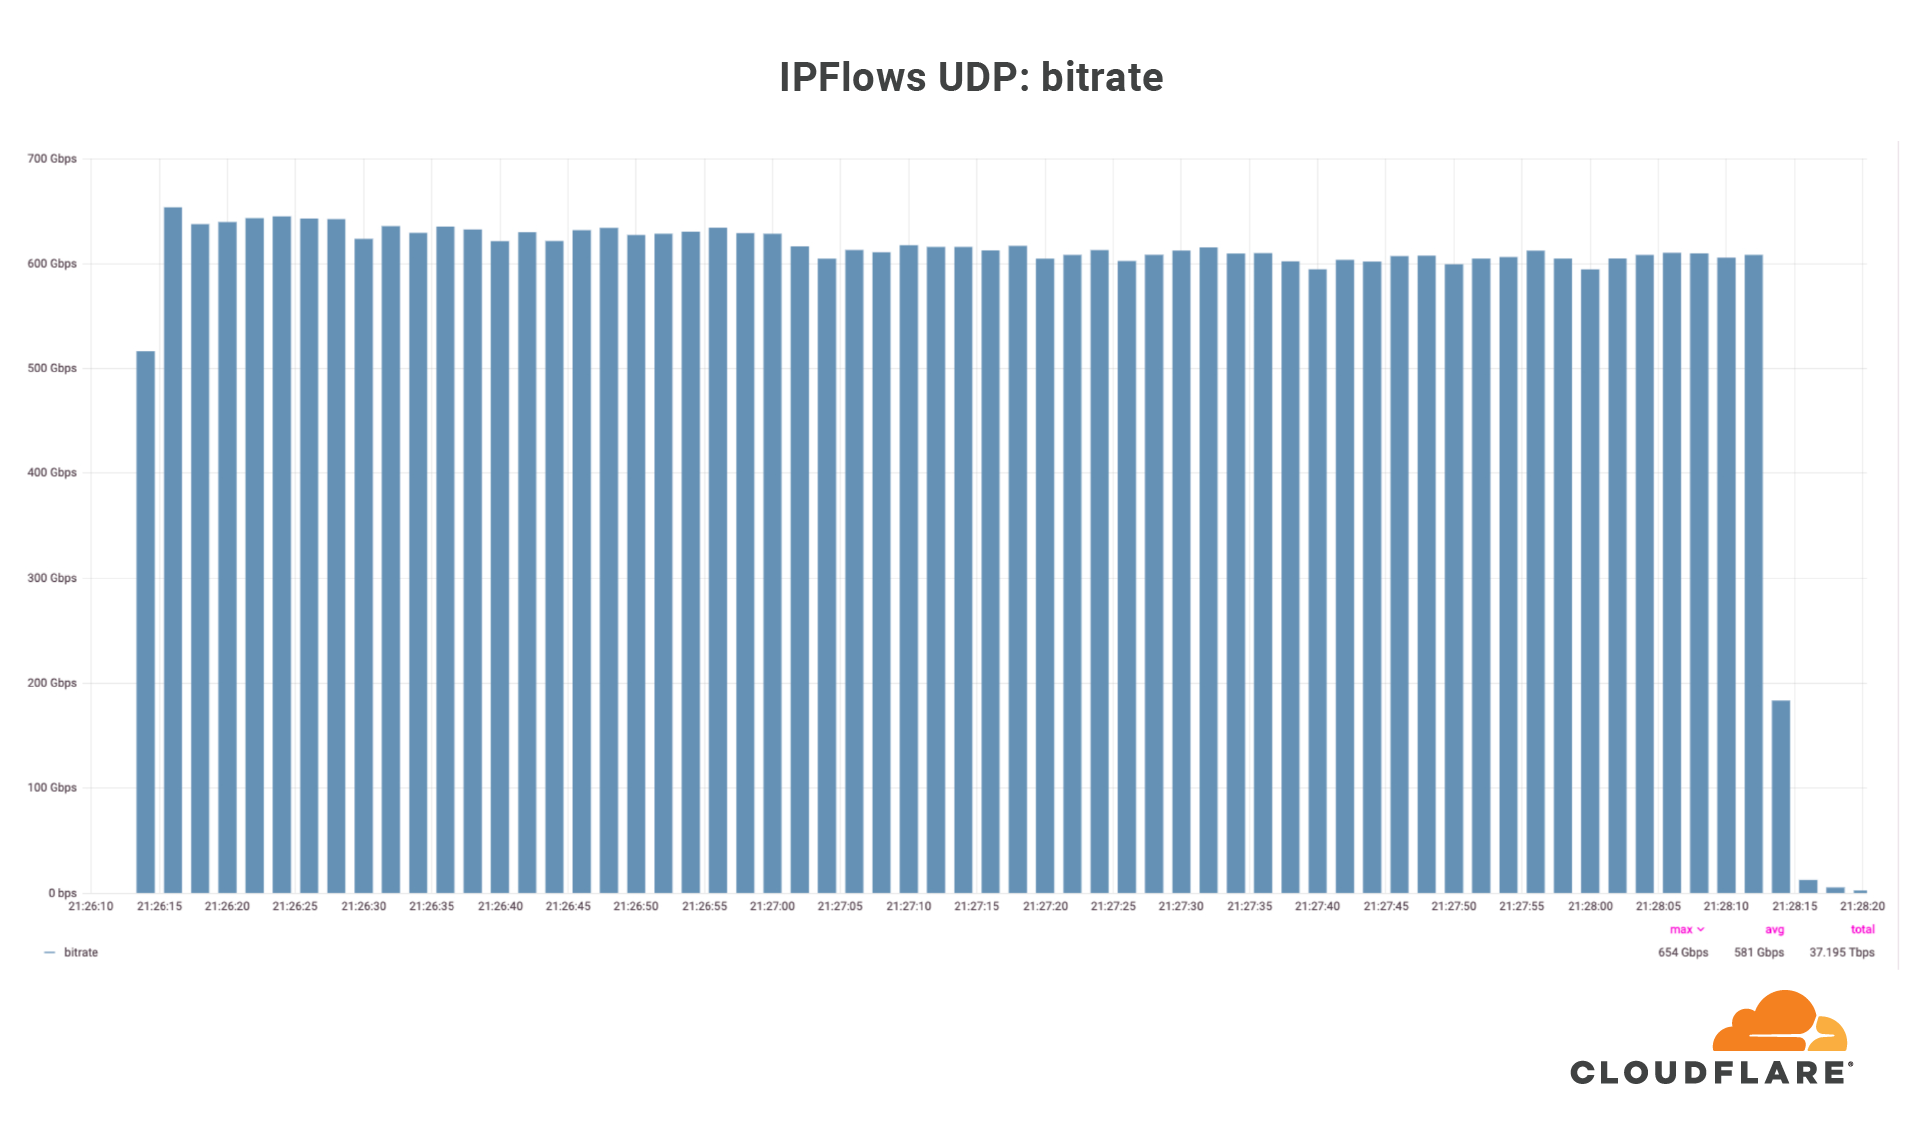
On July 3, Cloudflare’s global DDoS protection system, Gatebot, automatically detected and mitigated a UDP-based DDoS attack that peaked at 654 Gbps. The attack was part of a ten-day multi-vector DDoS campaign targeting a Magic Transit customer and was mitigated without any human intervention. The DDoS campaign is believed to have been generated by Moobot, a Mirai-based botnet. No downtime, service degradation, or false positives were reported by the customer.
Moobot Targets 654 Gbps towards a Magic Transit Customer
Over those ten days, our systems automatically detected and mitigated over 5,000 DDoS attacks against this one customer, mainly UDP floods, SYN floods, ACK floods, and GRE floods. The largest DDoS attack was a UDP flood and lasted a mere 2 minutes. This attack targeted only one IP address but hit multiple ports. The attack originated from 18,705 unique IP addresses, each believed to be a Moobot-infected IoT device.
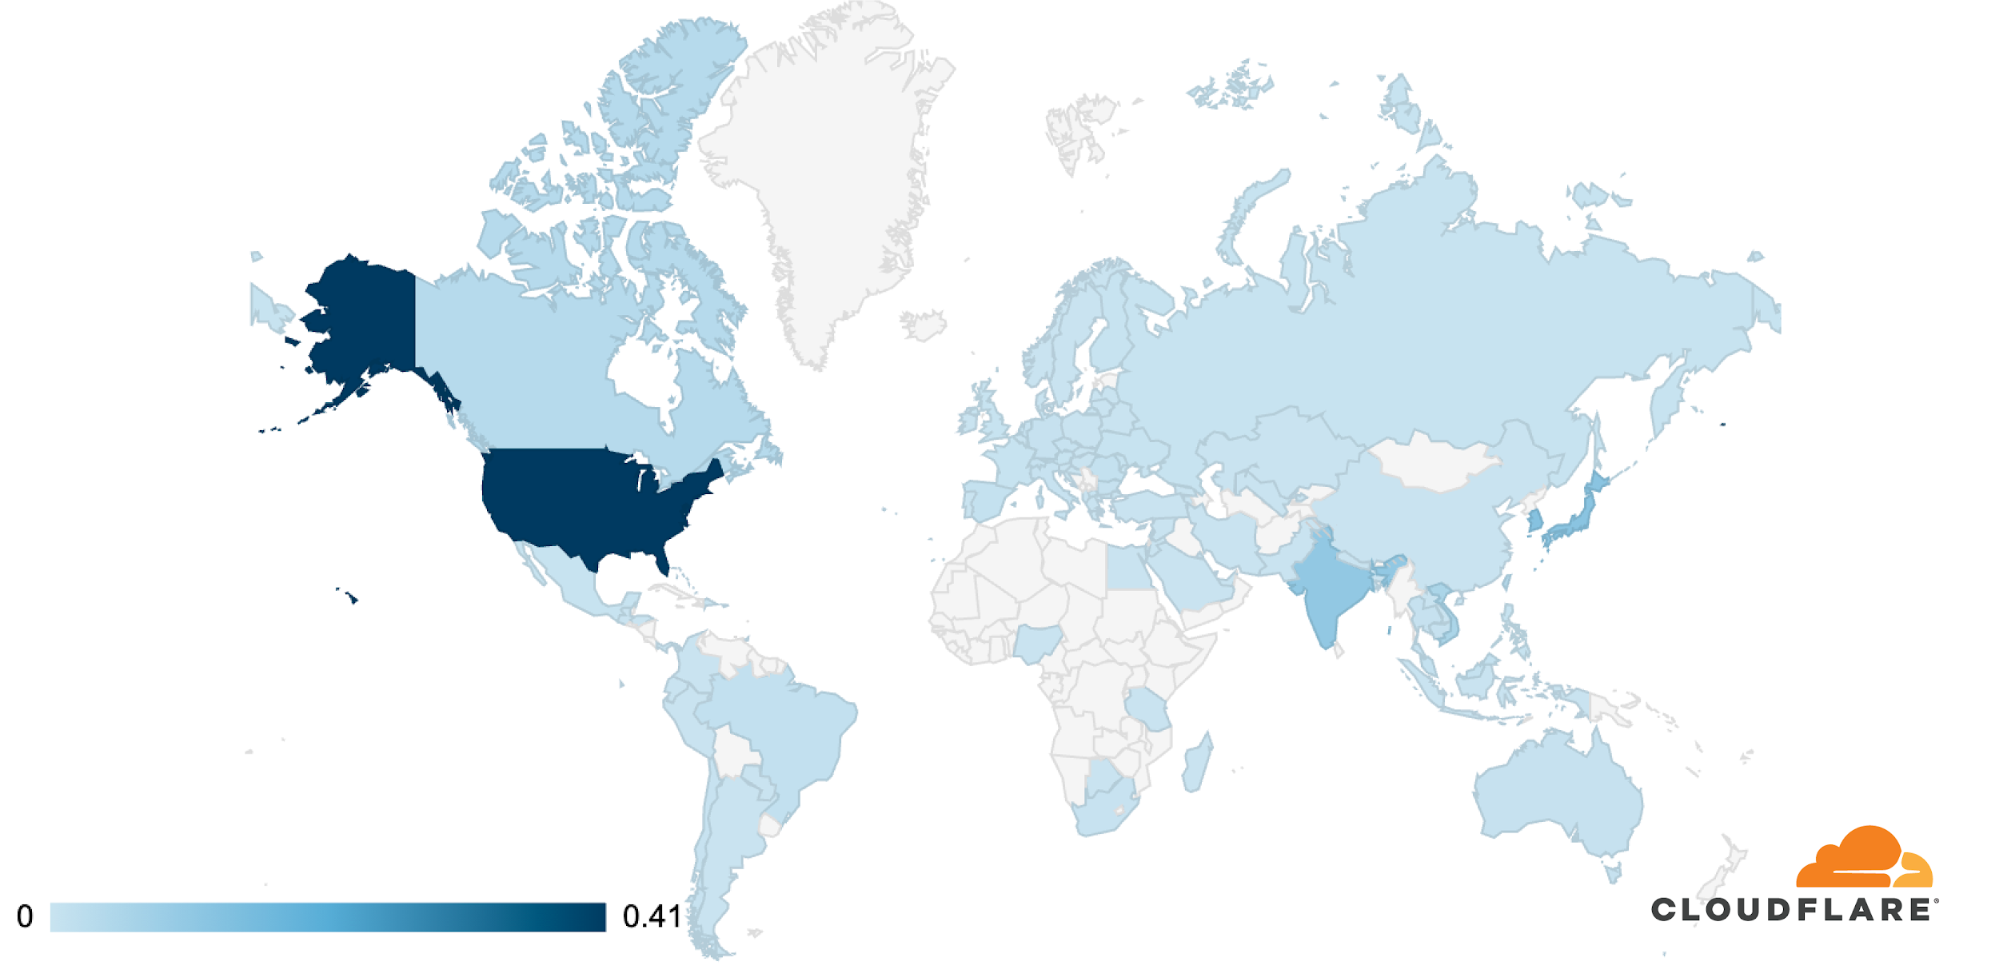
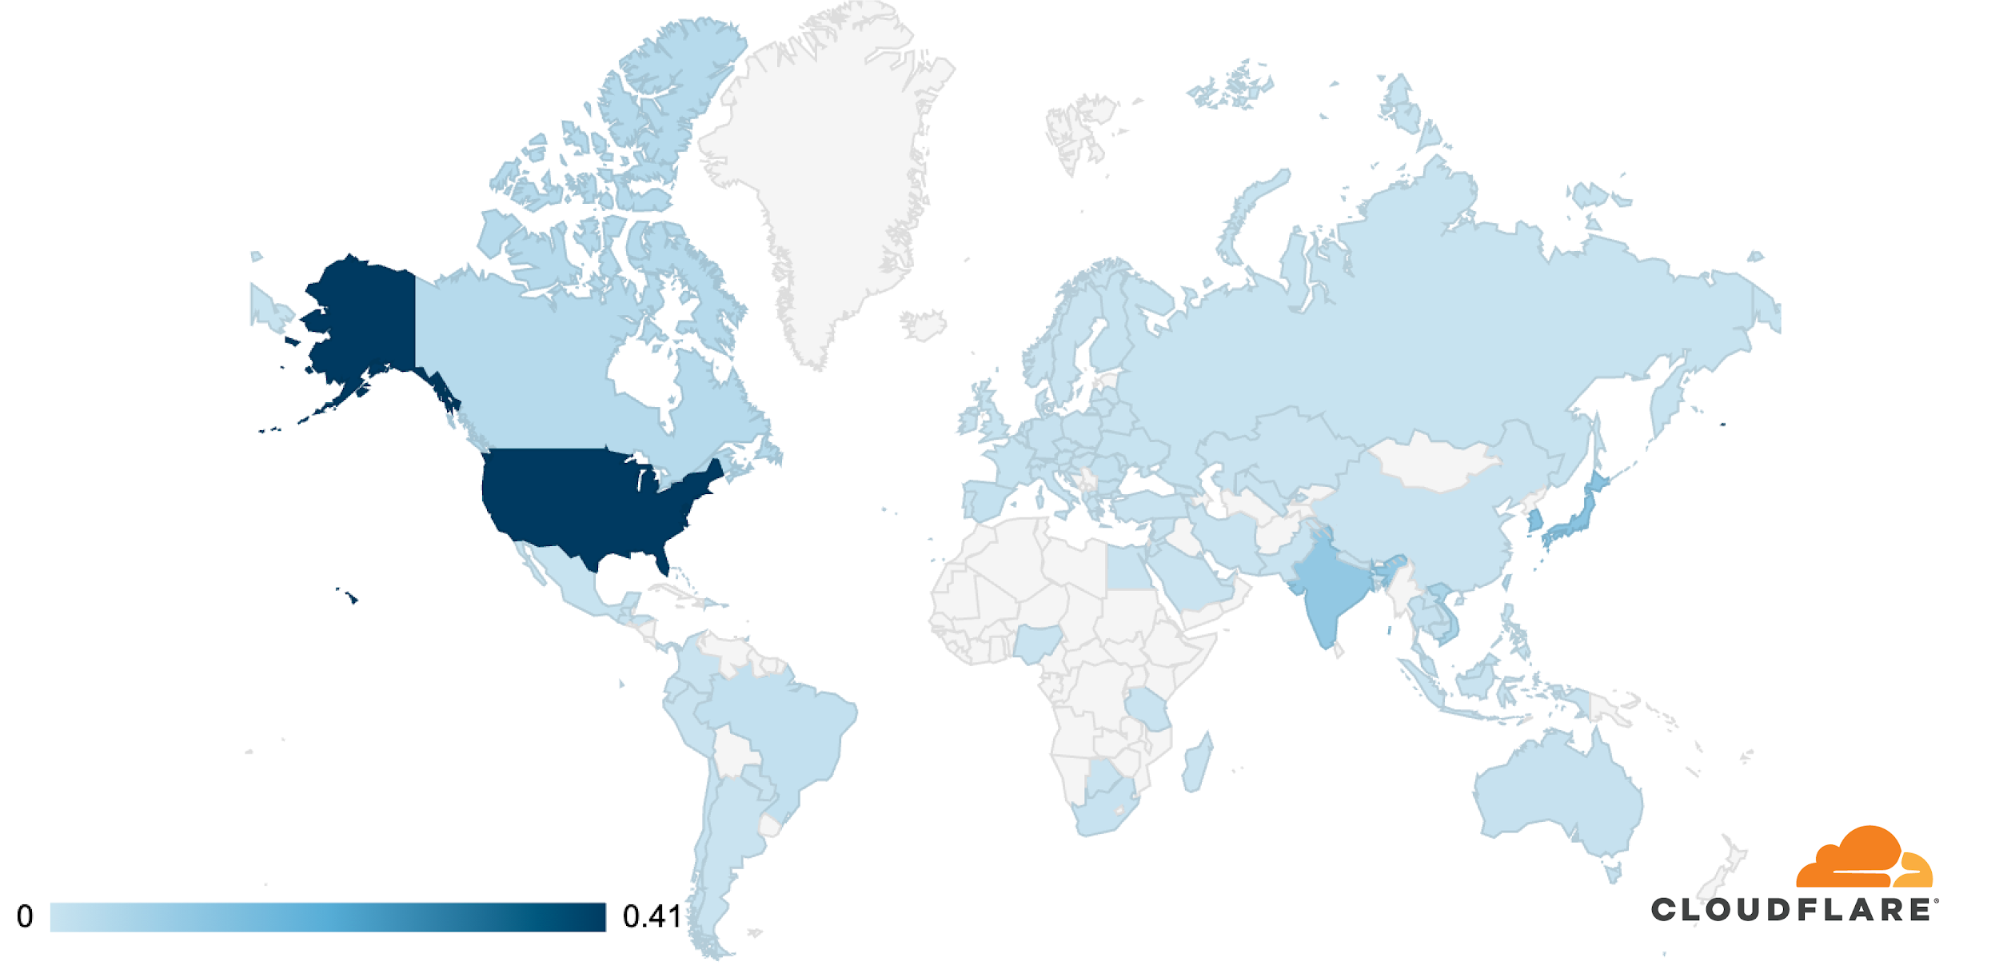
Attack Distribution by Country – From 100 countries
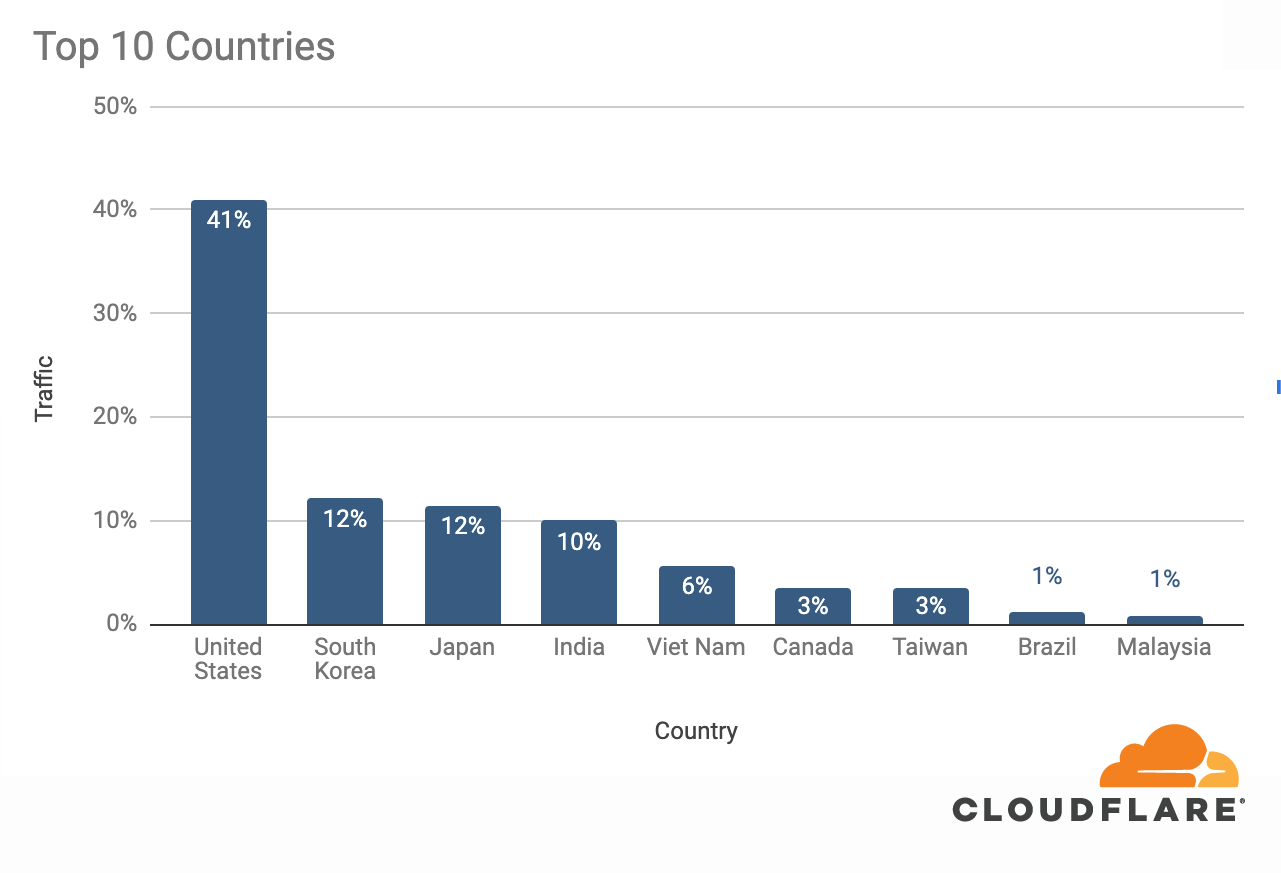
The attack was observed in Cloudflare’s data centers in 100 countries around the world. Approximately 89% of the attack traffic originated from just 10 countries with the US leading at 41%, followed by South Korea and Japan in second place (12% each), and India in third (10%). What this likely means is that the malware has infected at least 18,705 devices in 100 countries around the world.
Attack Distribution by Country – Top 10
Moobot – Self Propagating Malware
‘Moobot’ sounds like a cute name, but there’s nothing cute about it. According to Netlab 360, Moobot is the codename of a self-propagating Mirai-based malware first discovered in 2019. It infects IoT (Internet of Things) devices using remotely exploitable vulnerabilities or weak default passwords. IoT is a term used to describe smart devices such as security hubs and cameras, smart TVs, smart speakers, smart lights, sensors, and even refrigerators that are connected to the Internet.
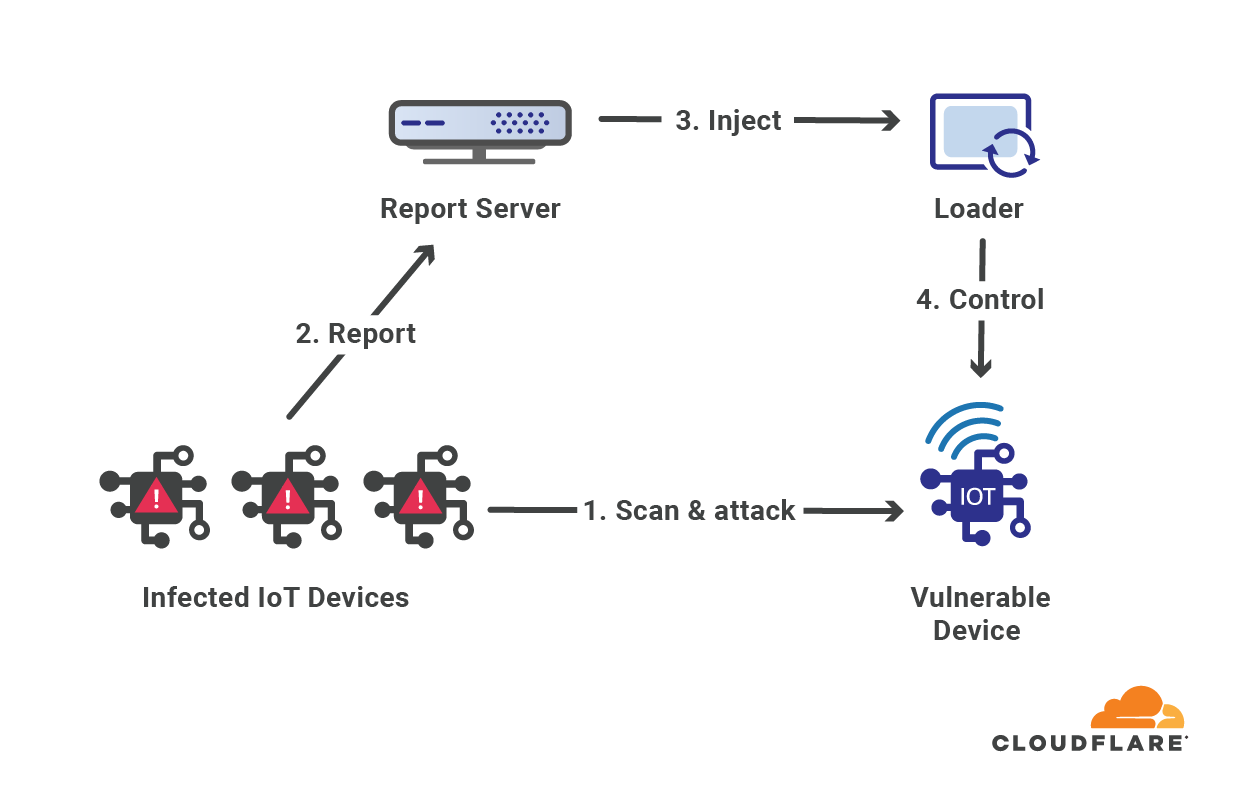
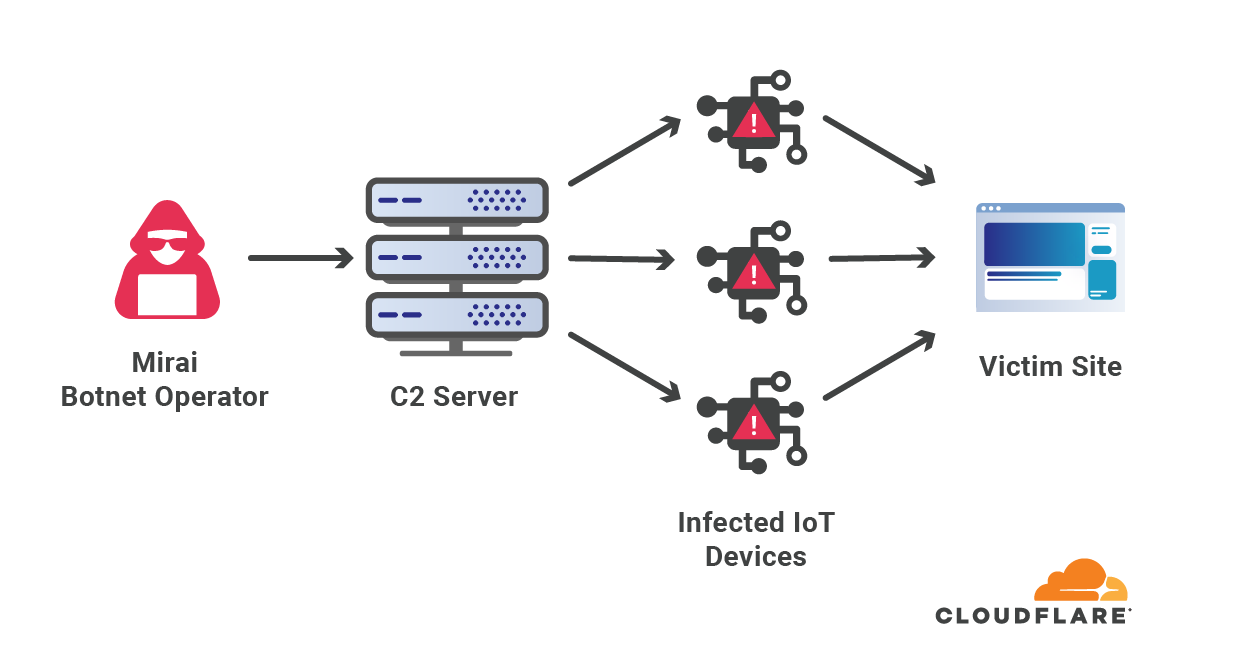
Once a device is infected by Moobot, control of the device is transferred to the operator of the command and control (C2) server, who can issue commands remotely such as attacking a target and locating additional vulnerable IoT devices to infect (self-propagation).
Self-propagation – The self-propagation module is in charge of the botnet’s growth. After an IoT device is infected, it randomly scans the Internet for open telnet ports and reports back to the C2 server. Once the C2 server gains knowledge of open telnet ports around the world, it tries to leverage known vulnerabilities or brute force its way into the IoT devices with common or default credentials.
Self-propagation
Synchronized attacks – The C2 server orchestrates a coordinated flood of packets or HTTP requests with the goal of creating a denial of service event for the target’s website or service.
Synchronized attacks
The botnet operator may use multiple C2 servers in various locations around the world in order to reduce the risk of exposure. Infected devices may be assigned to different C2 servers varying by region and module; one server for self-propagation and another for launching attacks. Thus if a C2 server is compromised and taken down by law enforcement authorities, only parts of the botnet are deactivated.
Why this attack was not successful
This is the second large scale attack in the past few months that we observed on Cloudflare’s network. The previous one peaked at 754M packets per second and attempted to take down our routers with a high packet rate. Despite the high packet rate, the 754Mpps attack peaked at a mere 253 Gbps.
As opposed to the high packet rate attack, this attack was a high bit rate attack, peaking at 654 Gbps. Due to the high bit rates of this attack, it seems as though the attacker tried (and failed) to cause a denial of service event by saturating our Internet link capacity. So let’s explore why this attack was not successful.
Avoiding link saturation & keeping appliances running
Cloudflare’s global network capacity is over 42 Tbps and growing. Our network spans more than 200 cities in over 100 countries, including 17 cities in mainland China. It interconnects with over 8,800 networks globally, including major ISPs, cloud services, and enterprises. This level of interconnectivity along with the use of Anycast ensures that our network can easily absorb even the largest attacks.
The Cloudflare Network
After traffic arrives at an edge data center, it is then load-balanced efficiently using our own Layer 4 load-balancer that we built, Unimog, which uses our appliances’ health and other metrics to load-balance traffic intelligently within a data center to avoid overwhelming any single server.
Besides the use of Anycast for inter-data center load balancing and Unimog for intra-data center load balancing, we also utilize various forms of traffic engineering in order to deal with sudden changes in traffic loads across our network. We utilize both automatic and manual traffic engineering methods that can be employed by our 24/7/365 Site Reliability Engineering (SRE) team.
These combined factors significantly reduce the likelihood of a denial of service event due to link saturation or appliances being overwhelmed — and as seen in this attack, no link saturation occurred.
Detecting & Mitigating DDoS attacks
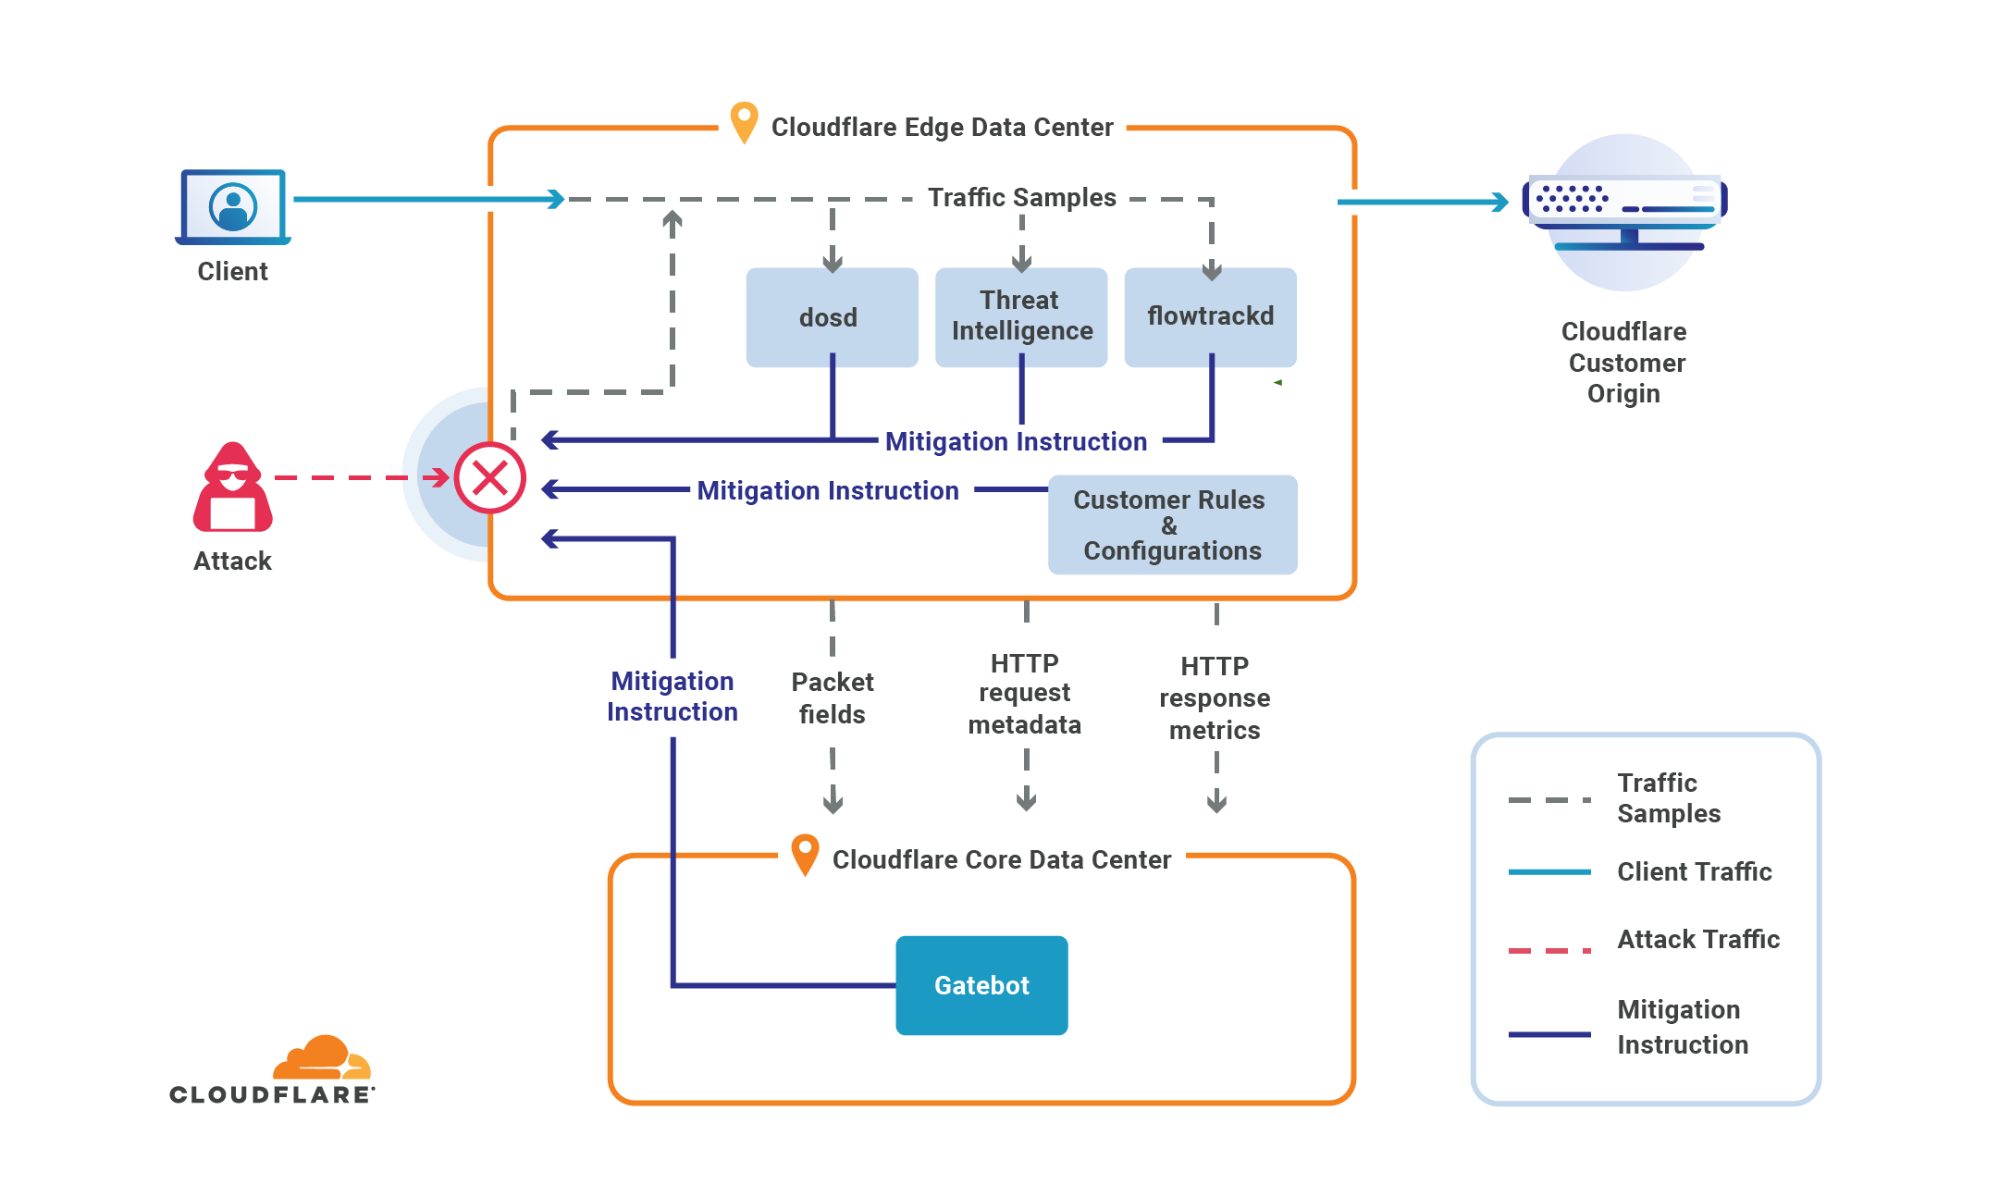
Once traffic arrives at our edge, it encounters our three software-defined DDoS protection systems:
Gatebot – Cloudflare’s centralized DDoS protection systems for detecting and mitigating globally distributed volumetric DDoS attacks. Gatebot runs in our network’s core data center. It receives samples from every one of our edge data centers, analyzes them, and automatically sends mitigation instructions when attacks are detected. Gatebot is also synchronized to each of our customers’ web servers to identify its health and triggers mitigation accordingly.
dosd (denial of service daemon) – Cloudflare’s decentralized DDoS protection systems. dosd runs autonomously in each server in every Cloudflare data center around the world, analyzing traffic and applying local mitigation rules when needed. Besides being able to detect and mitigate attacks at super-fast speeds, dosd significantly improves our network resilience by delegating the detection and mitigation capabilities to the edge.
flowtrackd (flow tracking daemon) – Cloudflare’s TCP state tracking machine for detecting and mitigating the most randomized and sophisticated TCP-based DDoS attacks in unidirectional routing topologies (such as the case for Magic Transit). flowtrackd is able to identify the state of a TCP connection and then drops, challenges, or rate-limits packets that don’t belong to a legitimate connection.
Cloudflare DDoS Protection Lifecycle
The three DDoS protection systems collect traffic samples in order to detect DDoS attacks. The types of traffic data that they sample include:
Packet fields such as the source IP, source port, destination IP, destination port, protocol, TCP flags, sequence number, options, and packet rate.
HTTP request metadata such as HTTP headers, user agent, query-string, path, host, HTTP method, HTTP version, TLS cipher version, and request rate.
HTTP response metrics such as error codes returned by customers’ origin servers and their rates.
Our systems then crunch these sample data points together to form a real-time view of our network’s security posture and our customer’s origin server health. They look for attack patterns and traffic anomalies. When found, a mitigation rule with a dynamically crafted attack signature is generated in real-time. Rules are propagated to the most optimal place for cost-effective mitigation. For example, an L7 HTTP flood might be dropped at L4 to reduce the CPU consumption.
Rules that are generated by dosd and flowtrackd are propagated within a single data center for rapid mitigation. Gatebot’s rules are propagated to all of the edge data centers which then take priority over dosd’s rules for an even and optimal mitigation. Even if the attack is detected in a subset of edge data centers, Gatebot propagates the mitigation instructions to all of Cloudflare’s edge data centers — effectively sharing the threat intelligence across our network as a form of proactive protection.
In the case of this attack, in each edge data center, dosd generated rules to mitigate the attack promptly. Then as Gatebot received and analyzed samples from the edge, it determined that this was a globally distributed attack. Gatebot propagated unified mitigation instructions to the edge, which prepared each and every one of our 200+ data centers to tackle the attack as the attack traffic may shift to a different data center due to Anycast or traffic engineering.
No inflated bills
DDoS attacks obviously pose the risk of an outage and service disruption. But there is another risk to consider — the cost of mitigation. During these ten days, more than 65 Terabytes of attack traffic were generated by the botnet. However, as part of Cloudflare’s unmetered DDoS protection guarantee, Cloudflare mitigated and absorbed the attack traffic without billing the customer. The customer doesn’t need to submit a retroactive credit request. Attack traffic is automatically excluded from our billing system. We eliminated the financial risk.
The collective thoughts of the interwebz
Manage Consent
To provide the best experiences, we use technologies like cookies to store and/or access device information. Consenting to these technologies will allow us to process data such as browsing behavior or unique IDs on this site. Not consenting or withdrawing consent, may adversely affect certain features and functions.
Functional
Always active
The technical storage or access is strictly necessary for the legitimate purpose of enabling the use of a specific service explicitly requested by the subscriber or user, or for the sole purpose of carrying out the transmission of a communication over an electronic communications network.
Preferences
The technical storage or access is necessary for the legitimate purpose of storing preferences that are not requested by the subscriber or user.
Statistics
The technical storage or access that is used exclusively for statistical purposes.The technical storage or access that is used exclusively for anonymous statistical purposes. Without a subpoena, voluntary compliance on the part of your Internet Service Provider, or additional records from a third party, information stored or retrieved for this purpose alone cannot usually be used to identify you.
Marketing
The technical storage or access is required to create user profiles to send advertising, or to track the user on a website or across several websites for similar marketing purposes.