Welcome back for a special bonus edition of The Lost Bots, a vlog series where Rapid7 Detection and Response Practice Advisor Jeffrey Gardner talks all things security with fellow industry experts. In this extra installment, Jeffrey chats with Mike Cohen, Digital Paleontologist for Velociraptor, an open source endpoint visibility tool that Rapid7 acquired earlier this year.
Mike fills us in on Velociraptor’s very first Contributor Competition, a friendly hackathon-style event that invites entrants to get their hands dirty and build the best extension to the Velociraptor platform that they can. Check out the episode to hear more about the competition, who’s judging, what they’re looking for, and what’s coming your way if you win — spoiler: there’s a cool $5,000 waiting for you if you nab the No. 1 spot, plus a range of other monetary and merchandise prizes. Jeffrey himself even plans to put his name in the ring!
Welcome back to The Lost Bots, a vlog series where Rapid7 Detection and Response Practice Advisor Jeffrey Gardner talks all things security with fellow industry experts. In this third episode, Jeffrey is joined by Stephen Davis, a Technical Lead and Customer Advisor on Rapid7’s Managed Detection and Response team. Stephen shares a story about a phishing attack on an organization, possibly by an advanced persistent threat (APT) — insert spooky “dun dun dun” sound effect — through a malicious Excel document. Watch below to hear about how our MDR team caught this attack, lessons learned, and tips for how teams can stay ahead of these types of threats in their environment.
Stay tuned for future episodes of The Lost Bots! Coming soon: Jeffrey tackles deception technology — what it is, how you can use it, and why it matters.
As penetration testers, we spend most of our time working with different types of networks, applications, and hardware devices. Physical security is another fun area we get to work in during physical social engineering penetration tests and red team engagements, which sometimes includes attempts to gain entry into facilities or sensitive areas within them.
Just like when we’re testing a virtual network’s defenses against intruders, pentesters need to put themselves in the mindset of attackers when testing physical security — and that means thinking creatively.
One classic method of gaining physical access is “tailgating,” where you wait for someone else to be going into or coming out of where you want to go, so you can follow them in before a door closes. To help pentesters simulate an attacker who can tailgate without suspiciously hovering around the door, we’ve come up with a neat little device to help with outward-opening doors with ferromagnetic metal frames, like steel entry doors. This tool is one more way pentesters can recreate the thought process of attackers — and help organizations outsmart them.
But first, of course, we want to caution that this is something that should only be used for legitimate purposes, when you have authorization or authority to do so. While we encourage other testers to try this out themselves and use it for customer engagements, this device is patent pending, and we request that you not manufacture, sell, or monetize it.
It’s it! What is it?
We start by placing our little door holder on the door frame, on the side of the door that opens:
When someone opens the door, it will push the long leaf of the hinge forward:
As the door opens further than the long leaf of the hinge, it falls back down behind the door:
And while the person who was exiting the door is hopefully on their merry way and not looking back to see if the door will close behind them, our little device will make sure it doesn’t:
More than one way to peel an orange
We’ve made a few versions of this using lock hasps. Another common hinge with a longer side would be your standard t-hinge. This one was made with a few bar-style neodymium magnets:
We’ve also made a miniature version using cup-style neodymium magnets:
Important tips
Neodymium magnets can slide around a good bit on smooth surfaces. Putting some grippy tape on the back of the magnet can help keep it from sliding around or scratching paint. Electrical tape and gorilla tape have worked well.
Likewise, having some padding on the leaf that contacts the door is important to prevent it from scratching paint.
Countermeasures
This tool makes it easier to enter a building or secure area by tailgating. By simulating an attacker with a high level of skill and ingenuity, the tool can help reveal weaknesses in organizations’ physical security protocols — and what countermeasures might be more effective.
If you have an electronic access control system, consider configuring it to trigger alerts if a door has been left open for too long. But the best place to start is to make sure your physical security policies and security awareness training educates staff about tailgating, encourages them not to let someone follow them in, and emphasizes making sure that doors close behind them.
NEVER MISS A BLOG
Get the latest stories, expertise, and news about security today.
We have some concerns with the CMA in its current form, as well as recommendations for how to address them. Additionally, because Rapid7 has addressed similar issues relating to U.S. laws — particularly as relates to the U.S. equivalent of the CMA, the Computer Fraud and Abuse Act (CFAA) — for each section below, we’ve included a short comparison with U.S. law for those who are interested.
Restrictions on security testing tools and proof-of-concept code
One of the most concerning issues with the CMA is that it imperils dual-use open-source security testing tools and the sharing of proof-of-concept code.
Section 3A(2) of the CMA states:
(2) A person is guilty of an offence if he supplies or offers to supply any article believing that it is likely to be used to commit, or to assist in the commission of, an offence under section 1, 3 or 3ZA.
Security professionals rely on open source and other widely available security testing tools that let them emulate the activity of attackers, and exploiting proof-of-concept code helps organizations test whether their assets are vulnerable. These highly valued parts of robust security testing enable organizations to build defenses and understand the impacts of attacks.
Making these products open source helps keep them up-to-date with the latest attacker methodologies and ensures a broad range of organizations (not just well-resourced organizations) have access to tools to defend themselves. However, because they’re open source and widely available, these defensive tools could still be used by malicious actors for nefarious purposes.
The same issue applies to proof-of-concept exploit code. While the intent of the development and sharing of the code is defensive, there’s always a risk that malicious actors could access exploit code. But this makes the wide availability of testing tools all the more important, so organizations can identify and mitigate their exposure.
Rapid7’s recommendation
Interestingly, this is not an unknown issue — the Crown Prosecution Service (CPS) acknowledges it on their website. We’ve drawn from their guidance, as well as their Fraud Act guidelines, in drafting our recommended response, proposing that the Home Office consider modifying section 3A(2) of the CMA to exempt “articles” that are:
Capable of being used for legitimate purposes; and
Intended by the creator or supplier of the article to be used for a legitimate purpose; and
Widely available; unless
The article is deliberately developed or supplied for the sole purpose of committing a CMA offense.
If you’re concerned about creating a loophole in the law that can be exploited by malicious actors, rest assured the CMA would still retain 3A(1) as a means to prosecute those who supply articles with intent to commit CMA offenses.
Comparison with the CFAA
This issue doesn’t arise in the CFAA; however, the U.S. is subject to various export control rules that also restrict the sharing of dual-use security testing tools and proof-of-concept code.
Independent security research aims to reveal vulnerabilities in technical systems so organizations can deploy better defenses and mitigations. This offers a significant benefit to society, but the CMA makes no provision for legitimate, good-faith testing. While Section 1(1) acknowledges that you must have intent to access the computer without authorization, it doesn’t mention that the motive to do so must be malicious, only that the actor intended to gain access without authorization. The CMA states:
(1) A person is guilty of an offence if—
a) he causes a computer to perform any function with intent to secure access to any program or data held in any computer, or to enable any such access to be secured;
b) the access he intends to secure, or to enable to be secured, is unauthorised; and
c) he knows at the time when he causes the computer to perform the function that that is the case.
Many types of independent security research, including port scanning and vulnerability investigations, could meet that description. As frequently noted in the context of the CFAA, it’s often not clear what qualifies as authorization to access assets connected to the internet, and independent security researchers often aren’t given explicit authorization to access a system.
It’s worth noting that neither the National Crime Agency (NCA) or the CPS seem to be recklessly pursuing frivolous investigations or prosecutions of good-faith security research. Nonetheless, the current legal language does expose researchers to legal risk and uncertainty, and it would be good to see some clarity on the topic.
Rapid7’s recommendation
Creating effective legal protections for good-faith, legitimate security research is challenging. We must avoid inadvertently creating a backdoor in the law that provides a defense for malicious actors or permits activities that can create unintended harm. As legislators consider options on this, we strongly recommend considering the following questions:
How do you determine whether research is legitimate and justified? Some considerations include whether sensitive information was accessed, and if so, how much – is there a threshold for what might be acceptable? Was any damage or disruption caused by the action? Did the researcher demand financial compensation from the technology manufacturer or operator?
The term “good faith security research” means good faith testing or investigation to detect one or more security flaws or vulnerabilities in software, hardware, or firmware of a protected computer for the purpose of promoting the security or safety of the software, hardware, or firmware.
(A) The person carrying out such activity shall
(i) carry out such activity in a manner reasonably designed to minimize and avoid unnecessary damage or loss to property or persons;
(ii) take reasonable steps, with regard to any information obtained without authorization, to minimize the information the person obtains, retains, and discloses to only that information which the person reasonably believes is directly necessary to test, investigate, or mitigate a security flaw or vulnerability;
(iii) take reasonable steps to disclose any security vulnerability derived from such activity to the owner of the protected computer or the Cybersecurity and Infrastructure Security Agency prior to disclosure to any other party
(iv) wait a reasonable amount of time before publicly disclosing any security flaw or vulnerability derived from such activity, taking into consideration the following:
(I) the severity of the vulnerability,
(II) the difficulty of mitigating the vulnerability,
(III) industry best practices, and
(IV) the willingness and ability of the owner of the protected computer to mitigate the vulnerability;
(v) not publicly disclose information obtained without authorization that is
(I) a trade secret without the permission of the owner of the trade secret; or
(II) the personally identifiable information of another individual, without the permission of that individual; and
(vi) does not use a nonpublic security flaw or vulnerability derived from such activity for any primarily commercial purpose prior to disclosing the flaw or vulnerability to the owner of the protected computer or the [government vulnerability coordination body].
(B) For purposes of subsection (A), it is not a public disclosure to disclose a vulnerability or other information derived from good faith security research to the [government vulnerability coordination body].
What happens if a researcher does not find anything to report? Some proposals for reforming the CMA have suggested requiring coordinated disclosure as a predicate for a research carve out. This only works if the researcher actually finds something worth reporting. What happens if they do not? Is the research then not defensible?
Are we balancing the rights and safety of others with the need for security? For example, easing restrictions for threat intel investigators and security researchers may create a misalignment with existing privacy legislation. This may require balancing controls to protect the rights and safety of others.
The line between legitimate research and hack back
In discussions on CMA reform, we often hear the chilling effect on security research being lumped in with arguments for expanding authorities for threat intelligence gathering and operations. The latter sound alarmingly like requests for private-sector hack back (despite assertions otherwise). We believe it is critical that policymakers understand the distinction between acknowledging the importance of good-faith security research on the one hand and authorizing private-sector hack back on the other.
We understand private-sector hack back to mean an organization taking intrusive action against a cyber-attacker on technical assets or systems not owned or leased by the entity taking action or their client. While threat intel campaigners may disclaim hack back, in asking for authorization to take intrusive action on third-party systems — whether to better understand attacks, disrupt them, or even recapture lost data — they’re certainly satisfying the description of hack back and raising a number of concerns.
Rapid7 is strongly opposed to private-sector hack back. While we view both independent, good-faith security research and threat intelligence investigations as critical for security, we believe the two categories of activity need separate and distinct legal restrictions.
Good-faith security research is typically performed independently of manufacturers and operators in order to identify flaws or exposures in systems that provide opportunities for attackers. The goal is to remediate or mitigate these issues so that we reduce opportunities for attackers and decrease the risk for technology users. These activities often need to be undertaken without authorization to avoid blowback from manufacturers or operators that prioritize their reputation or profit above the security of their customers.
This activity is about protecting the safety and privacy of the many, and while researchers may take actions without authorization, they only do so on the technology of those ultimately responsible for both creating and mitigating the exposure. Without becoming aware of the issue, the technology provider and their users would continue to be exposed to risk.
In contrast, threat intel activities that involve interrogating or interacting with third-party assets prioritize the interests of a specific entity over those of other potential victims, whose compromised assets may have been leveraged in the attack. While threat intelligence can be very valuable in helping us understand how attackers behave — which can help others identify or prepare for attacks — data gathering and operations should be limited to assessing threats to assets that are owned or operated by the authorizing entity, or to non-invasive activities such as port scanning. More invasive activities can result in unintended consequences, including escalation of aggression, disruption or destruction for innocent third parties, and a quagmire of legal liability.
Because cyber attacks are criminal activity, if more investigation is needed, it should be undertaken with appropriate law enforcement involvement and oversight. We see no practical way to provide appropriate oversight or standards for the private sector to engage in this kind of activity.
Comparison to the CFAA
This issue also arises in the CFAA. In fact, it’s exacerbated by the CFAA enabling private entities to pursue civil causes of action, which mean technology manufacturers and operators can seek to apply the CFAA in private cases against researchers. This is often done to protect corporate reputations, likely at the expense of technology users who are being exposed to risk. These private civil actions chill security research and account for the vast majority of CFAA cases and lawsuit threats focused on research. One of Rapid7’s recommendations to the UK Home Office was that the CMA should not be updated to include civil liability.
Washington State has helped protect good-faith security research in its Cybercrime Act (Chapter 9A.90 RCW), which both addresses the issue of defining authorization and exempts white-hat security research.
At its core, the CMA effectively operates as a law prohibiting digital trespass and hinges on the concept of authorization. Four of the five classes of offenses laid out in the CMA involve “unauthorized” activities:
1. Unauthorised access to computer material.
2. Unauthorised access with intent to commit or facilitate commission of further offences.
3. Unauthorised acts with intent to impair, or with recklessness as to impairing, operation of computer, etc.
3ZA.Unauthorised acts causing, or creating risk of, serious damage
Unfortunately, the CMA does not define authorization (or the lack thereof), nor detail what authorization should look like. As a result, it can be hard to know with certainty where the legal line is truly being drawn in the context of the internet, where many users don’t read or understand lengthy terms of service, and data and services are often publicly accessible for a wide variety of novel uses.
Many people take the view that if something is accessible in public spaces on the internet, authorization to access it is inherently granted. In this view, the responsibility lies with the owner or operator to ensure that if they don’t want to grant access to something, they don’t make it publicly available.
That being the case, the question becomes how systems owners and operators can indicate a lack of authorization for accessing systems or information in a way that scales, while still enabling broad access and innovative use of online services. In the physical world, we have an expectation that both public and private spaces exist. If a space is private and the owners don’t want others to access it, they can indicate this through signage or physical barriers (walls, fences, or gates). Currently, there is no accepted, standard way for owners and operators to set out a “No Trespassing” sign for publicly accessible data or systems on the internet that truly serves the intended purpose.
Rapid7’s recommendation
While a website’s Terms of Service (TOS) can be legally enforceable in some contexts, in our opinion the Home Office should not take the position that violations of TOS alone qualify as “unauthorized acts.” TOS are almost always ignored by the vast majority of internet users, and ordinary internet behavior may routinely violate TOS (such as using a pseudonym where a real name is required).
Reading TOS also does not scale for internet-wide scanning, as in the case of automated port scanning and other services that analyze the status of millions of publicly accessible websites and online assets. In addition, if TOS is “authorization” for the purposes of the CMA, it gives the author of the TOS the power to define what is and isn’t a hacking crime under CMA section 1.
To address this lack of clarity, the CMA needs a clearer explanation of what constitutes authorization for accessing technical systems or information through the internet and other forms of connected communications.
Comparison with the CFAA
This issue absolutely exists with the CFAA and is at the core of many of the criticisms of the law. Multiple U.S. cases have rejected the notion that TOS violations alone qualify as “exceeding authorization” under the CFAA, creating a split in the courts. The U.S. Supreme Court’s recent decision on Van Buren v. United States confirmed TOS is an insufficient standard, noting that if TOS violations alone qualify as unauthorized act for computer crime purposes, “then millions of otherwise law-abiding citizens are criminals.”
Next steps
We hope the Home Office will take these concerns into consideration, both in terms of ensuring the necessary support for security testing tools and security research, and also in being cautious not to go so far with authorities that we open the door to abuses. We’ll continue to engage on these topics wherever possible to help policymakers navigate the nuances and keep advancing security.
Here we are again, back for another day of Rapid7 expert debriefings and analysis for some of the most talked-about Black Hat sessions of this year. So without further delay, let’s take it away!
Get more DEF CON 2021 insights from our Research team on Tuesday, August 10
How do human behaviors — learned or learning — factor into incident response? Depending on the volume of stakeholders, your team may be under varying extremes of action bias. As in, are speedy actions being prioritized on vulnerabilities that don’t present a high risk profile? Is speed even possible if mitigating actions must suddenly be learned? Vendors have caught on, practicing “Security Theater”— peddling solutions to problems that might not present real risks.
Tangential to the previous topic, a question arises when exploring the weaponization of C2 channels: Due to the unlikelihood of an attack via, say, LDAP attributes when establishing C2, does it make sense to roll out an entirely new detection-and-response plan? Many different conditions must be met for an attacker to gain access in the wild, but teams might already have similar responses in place, on the off chance it happens.
Zooming out to a topic with broader public appeal, let’s consider how companies use — and abuse — our personal data. An 18-month test run by a professor and a group of students at Virginia Tech revealed how unlikely it is we’ll be able to predict which companies will abuse personal information after someone, say, creates login credentials for a TikTok account and the company launches cookie tracking for that person.
Vulnerability Risk Management
Key takeaways
Are Microsoft Exchange Servers creating an entirely new attack surface via Client Access Services (CAS)? Exchange architecture is incredibly complex, so it contains multitudes when it comes to vulnerabilities. CAS ties front-end and back-end services together, receiving the front-end request through a variety of protocols, including some extremely geriatric ones like POP3 and IMAP4. These legacy protocols are contributing to expanded attack surfaces.
Vulnerability Exploitability eXchange (VEX) helps teams rethink security advisories and what it means to be vulnerable. Essentially, it enables software providers to communicate they’re not affected by a vulnerability. Two advantages of VEX are 1) that creation and management of vulnerabilities are automated, and 2) that its results are machine-readable.
Open-source software (OSS) is incredible… and incredibly vulnerable. There are so many risks with OSS that a vendor might even put off patching a vulnerability — for whatever business reason — if alerted to it. There’s currently no mechanism to secure so many classes of vulnerabilities in OSS, but maybe there should be. Researchers should work together to create those class-eliminating mechanisms, ultimately reducing the lift when it comes to risk management.
Research and Policy
Key takeaways
What is Electromagnetic Fault Injection (EMFI)? It’s when hardware attackers use electromagnetism to hack hardware chips. When it comes to something like a car’s modern combustion engine, EMFI can be leveraged to change a vehicle’s performance, slithering past manufacturer-imposed security protocols. Some owners are beginning to “tune” chips with EMFI in order to push the limits of their vehicles.
There’s cause for concern that AI security products are simply repeating back to us the tables on which they were trained. If this is the case, can someone create more nefarious tables to sway AI security entities away from actual security? Attackers can now train explainable AI models on private data, turning them into the latest tool in their arsenals. Consider your attack surface expanded.
When companies export their technology beyond their own borders, it isn’t as easy as it sounds in a press release. Whereas policy constantly lagged behind technology, it’s starting to catch up as companies realize the cost of doing business with both digital authoritarians and digital democracies. Is proprietary tech compromised when entering a new country where it must adhere to each and every law imposed on it by local regulators?
Thanks for joining the Rapid7 team at another round of Black Hat debriefings. We hope to see you live and in person in Vegas next year. Until then, stay secure and stay safe!
The casino floor at Bally’s is a thrilling place, one that loads of hackers are familiar with from our time at DEF CON. One feature of these casinos is the unmistakable song of slots being played. Imagine a slot machine that costs a dollar to play, and pays out $75 if you win — what probability of winning would it take for you to play?
Naively, I’d guess most people’s answers are around “1 in 75” or maybe “1 in 74” if they want to turn a profit. One in 74 is a payout probability of about 1.37%. Now, at 1.37%, you turn a profit, on average, of $1 for 74 games — so how many times do you play? Probably not that many. You’re basically playing for free — but you’re not pulling much off $1 profit per 74 pulls. At least on average.
But what if that slot machine paid out about half the time, giving you $75 every other time you played? How many times would you play?
This is the game that ransomware operators are playing.
Playing Against the Profiteers
Between Wannacry, the Colonial Pipeline hack, and the recent Kaseya incident, everyone is now familiar with supply chain attacks — particularly those that use ransomware. As a result, ransomware has entered the public consciousness, and a natural question is: why ransomware? From an attacker’s perspective, the answer is simple: why not?
For the uninitiated, ransomware is a family of malware that encrypts files on a system and demands a payment to decrypt the files. Proof-of-concept ransomware has existed since at least 1996, but the attack vector really hit its stride with CryptoLocker’s innovative use of Bitcoin as a payment method. This allowed ransomware operators to perpetuate increasingly sophisticated attacks, including the 2017 WannaCry attack — the effects of which, according to the ransomware payment tracker Ransomwhere, are still being felt today.
Between the watering hole attacks and exploit kits of the Angler EK era and the recent spate of ransomware attacks targeting high-profile companies, the devastation of ransomware is being felt even by those outside of infosec. The topic of whether or not to pay ransoms — and whether or not to ban them — has sparked heated debate and commentary from folks like Tarah Wheeler and Ciaran Martin at the Brookings Institute, the FBI, and others in both industrial and academic circles. One noteworthy academic paper by Cartwright, Castro, and Cartwright uses game theory to ask the question of whether or not to pay.
Ransomware operators aren’t typically strategic actors with a long-term plan; rather, they’re profiteers who seek targets of opportunity. No target is too big or too small for these groups. Although these analyses differ in the details, they get the message right — if the ransomware operators don’t get paid, they won’t want to play the game anymore.
Warning: Math Ahead
According to Kaspersky, 56% of ransomware victims pay the ransom. Most other analyses put it around 50%, so we’ll use Kaspersky’s. In truth, it’s unlikely we have an accurate number for this, as many organizations specifically choose to pay the ransom in order to avoid public exposure of the incident.
If a ransomware attack costs some amount of money to launch and is successful some percentage of the time, the amount of money made from each attack is:
We call this the expected value of an attack.
It’s hard to know how many attacks are launched — and how many of those launched attacks actually land. Attackers use phishing, RDP exploits, and all kinds of other methods to gain initial access. For the moment, let’s ignore that problem and assume that every attack that gets launched lands. Ransomware that lands on a machine is successful about 54% of the time, and the probability of payment is 56%. Together, this means that the expected value of an attack is:
Given the average ransom payment is up to $312,493 as of 2020 — or using Sophos’s more conservative estimate, $170,404 — that means ransomware authors are turning a profit as long as the cost of an attack is less than $127,747.14 (or the more conservative $51,530.17). Based on some of the research that’s been done on the cost of attacks, where high-end estimates put it at around $4,200, we can start to see how a payout of almost 75 times the cost to play becomes an incentive.
In fact, because expected values are linear and the expected value is only for one play, we can see pretty quickly that in general, two attacks will give us double the value of one, and three will triple it. This means that if we let our payout be a random variable X, a ransomware operator’s expected value over an infinite number of attacks is… infinite.
Obviously, an infinite number of ransomware attacks is not reasonable, and there is a limit to the amount that any individual or business can pay over time before they just give up. But from an ideal market standpoint, the message is clear: While ransoms are being paid at these rates and sizes, the problem is only going to grow. Just like you’d happily play a slot machine that paid out almost half the time, attackers are happy to play a game that gets them paid more than 40% of the time, especially because the profits are so large.
Removing Incentives
So why would ransomware operators ever stop if, in an idealized model, there’s potentially infinite incentive to keep playing? A few reasons:
The value of payments is lower
The cost becomes prohibitive
The attacks don’t work
Nobody is paying
Out of the gate, we can more or less dismiss the notion that payment values will get lower. The only way to lower the value of the payment is to lower the value of Bitcoin to nearly zero. We’ve seen attempts to ban and regulate cryptocurrencies, but none of those have been successful.
In terms of the monetary cost, this is also pretty much a dead end for us. Even if we could remove all of the efficiencies and resilience of darknet markets, that would only remove the lowest-skill attackers from the equation. Other groups would still be capable of developing their own exploits and ransomware.
Ultimately, what our first two options have in common is that they deal, in a pretty direct way, with adversary capabilities. They leave room for adversaries to adapt and respond, ultimately trying to affect things that are in the control of attackers. This makes them much less desirable avenues for response.
So let’s look at the things that victims have control over: defenses and payments.
Defending Against Ransomware
Defending against ransomware is quite similar to defending against other attack types. In general, ransomware is not the first-stage payload delivered by an exploit; instead, it’s dropped by a loader. So the name of the game is to prevent code execution on endpoints. As security professionals, this is something we know quite well.
For ransomware, the majority of attacks come via a handful of vectors, which will be familiar to most security practitioners:
Phishing
Vulnerable services
Weak passwords, especially on Remote Desktop Protocol
Exploit kits
Many of these initial access vectors are things that can be kept in check with user training, vulnerability scans, and sound patching practices. Once initial access is established, many of these ransomware operators use software like WMI, PSExec, Powershell, and Cobalt Strike, in addition to commodity malware like Trickbot, to move laterally before hitting the entire network with ransomware.
Looking for these indicators of compromise is one way to limit the potential impact of ransomware. But of course, these techniques are hard to detect, and no organization is able to catch 100% of the bad things that are coming at them. So what do victims do when the worst happens?
Choosing Not to Pay
When ransomware attacks are successful, victims have two primary choices: pay or don’t. There are many follow-on decisions from each of these decisions, but the first and most critical decision (for the attacker) is whether or not to pay the ransom.
When people pay the ransom, they’re likely — though not guaranteed — to get their files back. However, because of the significant amounts of first stage implants and lateral movement associated with ransomware attacks, there’s still a lot of incident response work to be done beyond the return of the files. For many organizations, if they don’t have a suitable off-site backup in place, this may feel like an inevitable impact of this type of attack. As Tarah Wheeler pointed out, this is often something that can simply be written off as a business expense. Consequently, hackers get paid, companies get to write off the loss, and nobody learns a lesson.
As we discussed above, when you pay a ransom, you’re paying for the next attack, and according to reports from the UK’s NCSC, you may also be paying for human trafficking. None of us wants to be funding these attackers, but we want to protect our data. So how do we get away from paying?
As we mentioned before, preventing the attacks in the first place is the optimal outcome for us as defenders, but security solutions are never 100% effective. The easiest way not to pay is to have an off-site backup. That will let you invoke your normal incident response process but have your data intact. In many cases, this isn’t any more expensive than paying, and you’re guaranteed to get your data back.
In some cases, a decrypter is available for the ransomware. The decrypters can be used by victims to restore their files without paying the ransom. Organizations like No More Ransomware make decrypters available for free, saving organizations significant amounts of money paying for decryption keys.
Having a network configuration that makes lateral movement difficult will also reduce the “blast radius” of the attack and can help mitigate the spread. In these cases, you may be able to get away with reimaging a handful of employee laptops and accepting the loss. Ultimately, letting people write off their backups instead of their ransom payments encourages the switch to having sensible backup policies and discouraging these ransomware operators.
Why the Wheel Keeps Spinning
Ransomware remains a significant problem, and I hope we’ve demonstrated why: the incentives for everyone, including victims, are there to increase the number of ransomware attacks. Attackers who do more attacks will see more profits, which fund subsequent attacks. While victims can write off their payments, there’s no incentive to take steps to mitigate the impact of ransomware, so the problem will continue.
Crucially, ransomware attackers aren’t picky about their victims. They’re not nation-state actors who seek to target only the largest companies with the most intellectual property. Rather, they’re attackers of opportunity — their victim is anyone who lets their lever be pulled, and as long as the victims keep paying out often enough, attackers are happy to play.
NEVER MISS A BLOG
Get the latest stories, expertise, and news about security today.
OK, no big deal, we know how this goes. Once again, many of us are attending Black Hat in a virtual capacity as COVID-19 meanders its way out of our lives. The good news is that there’s an actual live component again this year in Las Vegas, and that’s progress. Here’s hoping that next year the pandemic will be more firmly in the rearview and any remaining travel trepidation will be a “2021 thing.”
So flip the on-switch to some neon lights if you got ‘em, and let’s get into what our Rapid7 experts thought were the biggest takeaways from a busy Day 1 of new tools, techniques, and up-to-the-minute information.
Want our daily Black Hat takeaways sent directly to your inbox?
Does it make sense for an organization to “roll its own SIEM”? Yes and no (because of course that’s the answer). For very specific use cases outside of the norm, it might make sense to start the often-herculean, cost-prohibitive task of building that cloud-native SIEM to best serve hyper-specific needs. But is it worth it to miss out on the high-quality, actionable intel a commercial vendor brings to the table?
When it comes to distributed malware, attackers are bypassing traditional detection. Return Oriented Programming (ROP — pronounced “rope”) grants attackers a bypass route through initial access points to get onto an endpoint faster and easier. However, the real endgame is to bypass that endpoint agent and hack the network at large.
Just how easy is it to hack a hotel? If you were the victim of a hotel hack, you might think a ghost had taken up residence in your room as your IoT-connected bed suddenly moves up and down. However, the proliferation of unprotected networks and IoT devices in modern hotels has created unprecedented opportunities for attackers to gain nefarious access. A back-to-basics approach might be the best way forward for the hospitality industry.
Vulnerability Risk Management
Key takeaways
Open Platform Communications (OPC) standards are a wondrous thing, allowing products across many industries to interact and exchange data efficiently. But is security a priority? When commercial vendors all along a supply chain start making their own customizations to the common legacy protocol, well, security isn’t so secure anymore.
Find an active-directory certificate vulnerability? Good luck getting it patched. These configuration-related instances are flaws that larger organizations might be hesitant to acknowledge. Check out this (extremely long, but informative) whitepaper on the subject — and the accompanying blog — from SpecterOps.
Printer vulnerabilities aren’t paper-thin. Windows Printer Spooler can offer up an attack surface that leads to an instance like the PrintDemon incident. Some of the larger vulnerabilities see attackers and exploit authors leveraging printer path names.
Research and Policy
Key takeaways
Let’s talk lasers — specifically, how attackers can use them to exploit vulnerabilities in hardware like bitcoin wallets. One would hope that the key material they’re storing in that wallet is secure. However, with a laser you can “look through” a silicon chip to confuse the CPU and bypass security checks.
Wondering how future information wars will be fought? By bots. Advanced bots, that is — those that leverage Generative Pre-Trained Transformer (GPT) language models like GPT-3. With this powerful tool, a small group of people could generate misinformation at scale, quickly spinning up thousands of fake social accounts creating individual posts that sound like actual human language. That’s scary.
As far as we know, AI cannot yet be arrested. However, threat actors can still run afoul of digital crime laws like the Computer Fraud and Abuse Act (CFAA) when they employ adversarial machine learning. This “poisoned data” results in systems learning things they shouldn’t. Current federal and state computer-crime laws need to reflect these more sophisticated AI attack methods so that, you know, the machines don’t win.
We’ll see you right back here tomorrow for Black Hat Day 2 insights and takeaways from the Rapid7 team!
Want our daily Black Hat takeaways sent directly to your inbox?
Late last month (July 2021), security researcher Topotam published a proof-of-concept (PoC) implementation of a novel NTLM relay attack christened “PetitPotam.” The technique used in the PoC allows a remote, unauthenticated attacker to completely take over a Windows domain with the Active Directory Certificate Service (AD CS) running — including domain controllers.
PetitPotam works by abusing Microsoft’s Encrypting File System Remote Protocol (MS-EFSRPC) to trick one Windows host into authenticating to another over LSARPC on TCP port 445. Successful exploitation means that the target server will perform NTLM authentication to an arbitrary server, allowing an attacker who is able to leverage the technique to do… pretty much anything they want with a Windows domain (e.g., deploy ransomware, create nefarious new group policies, and so on). The folks over at SANS ISC have a great write-up here.
According to Microsoft’s ADV210003 advisory, Windows users are potentially vulnerable to this attack if they are using Active Directory Certificate Services (AD CS) with any of the following services:
Certificate Authority Web Enrollment
Certificate Enrollment Web Service
NTLM relay attacks aren’t new — they’ve been around for decades. However, a few things make PetitPotam and its variants of higher interest than your more run-of-the-mill NTLM relay attack. As noted above, remote attackers don’t need credentials to make this thing work, but more importantly, there’s no user interaction required to coerce a target domain controller to authenticate to a threat actor’s server. Not only is this easier to do — it’s faster (though admittedly, well-known tools like Mimikatz are also extremely effective for gathering domain administrator-level service accounts). PetitPotam is the latest attack vector to underscore the fundamental fragility of the Active Directory privilege model.
Microsoft released an advisory with a series of updates in response to community concern about the attack — which, as they point out, is “a classic NTLM relay attack” that abuses intended functionality. Users concerned about the PetitPotam attack should review Microsoft’s guidance on mitigating NTLM relay attacks against Active Directory Certificate Services in KB500413. Since it looks like Microsoft will not issue an official fix for this vector, community researchers have added PetitPotam to a running list of “won’t fix” exploitable conditions in Microsoft products.
In general, to prevent NTLM relay attacks on networks with NTLM enabled, domain administrators should ensure that services that permit NTLM authentication make use of protections such as Extended Protection for Authentication (EPA) coupled with “Require SSL” for affected virtual sites, or signing features such as SMB signing. Implementing “Require SSL” is a critical step: Without it, EPA is ineffective.
As an NTLM relay attack, PetitPotam takes advantage of servers on which Active Directory Certificate Services (AD CS) is not configured with the protections mentioned above. Microsoft’s KB5005413: Mitigating NTLM Relay Attacks on Active Directory Certificate Services (AD CS) emphasizes that the primary mitigation for PetitPotam consists of three configuration changes (and an IIS restart). In addition to primary mitigations, Microsoft also recommends disabling NTLM authentication where possible, starting with domain controllers.
Disabling NTLM for Internet Information Services (IIS) on AD CS Servers in your domain running the “Certificate Authority Web Enrollment” or “Certificate Enrollment Web Service” services.
While not included in Microsoft’s official guidance, community researchers have tested using NETSH RPC filtering to block PetitPotam attacks with apparent success. Rapid7 research teams have not verified this behavior, but it may be an option for blocking the attack vector without negatively impacting local EFS functionality.
Rapid7 Customers
We are investigating approaches for adding assessment capabilities to InsightVM and Nexpose to determine exposure to PetitPotam relay attacks.
NEVER MISS A BLOG
Get the latest stories, expertise, and news about security today.
Recognizing this, the Institute for Security and Technology put together a comprehensive Ransomware Task Force (RTF) to identify new approaches to shift the dynamics of ransomware and reduce opportunities for attackers. The Ransomware Task Force involved more than 60 participants representing a wide range of expertise and experience, including from multiple governments, law enforcement, civil society and public policy nonprofits, and security advancement groups. From the private sector, organizations of all sizes participated, including many that have experienced ransomware attacks firsthand or that are involved in dealing with the fallout, such as cybersecurity companies, law firms, and cyber insurers. Rapid7 was among those that participated — I was one of the co-chairs, and my amazing colleagues, Bob Rudis, Tod Beardsley, and Scott King participated as well.
From the outset, the intent of the Task Force was to look at the issue holistically and come up with a comprehensive set of recommendations to deter and disrupt ransomware attackers, thereby helping organizations prepare for and respond to attacks at scale. Recognizing the scale and severity of the issue — and the need for systemic and societal responses — our target audience was policymakers and government leaders.
The Task Force recognized that ransomware is not a new topic, and we had no desire to rehash previous efforts. Instead, we sought to learn from them and, where appropriate, amplify and extend them, supporting the next period of growth on this thorny issue. Ransomware’s reach and impact are increasing, which has a serious impact on society. The effects are only likely to worsen without significant action from governments and other leaders.
Key recommendations
The final report issued by the Task Force makes 48 recommendations, broken into actions to deter, disrupt, prepare for, and respond to ransomware attacks. The recommendations are designed to work in concert with each other, though we recognize there are a large number of them, and many will take time to implement. In reality, though, there truly is no silver bullet for addressing ransomware, no one thing that will magically solve this problem. If we want to shift the dynamics in a meaningful way that makes it harder for attackers to succeed, we need to make adjustments in a range of areas. It’s also worth noting that the Task Force’s goal was to provide recommendations to government and other leaders, not to provide tactical, technical guidance.
Given there are 48 recommendations, and they are well set out in the report, I won’t go over them now. I’ll just highlight a few of the big themes and, where relevant, what’s happened since the launch of the report.
Make it a top priority
One of the biggest challenges we face with any discussion around cybercrime is that it’s often viewed as a niche technical problem, not as a broad societal issue. This has made it harder to get the required attention and investment in solutions. The Task Force called for senior political leaders to recognize ransomware for what it is: a national security issue and a major threat to our ways of life (Action 1.2.5, page 26). We also called for a whole-of-government approach whereby leaders would engage various stakeholders across the government to help ensure necessary action is taking place collaboratively across the board (Actions 1.2.1 and 1.2.2, page 23).
To take meaningful action to reduce ransomware attacks, we must acknowledge the geopolitical aspects. Firstly, the issue affects countries all around the world. Governments taking action should do so in coordination and cooperation in order to amplify the impact and hit attackers on multiple fronts at once (Actions 1.1.1 – 1.1.4, 1.2.6, pages 21-22, 26).
Secondly, and perhaps more crucially, one of the main advantages for attackers is the existence of nations that provide safe havens, because they’re either unwilling or unable to prosecute cybercriminals. This also makes it much harder for other countries to prosecute these criminals, and as such, ransomware attackers rarely seem to fear consequences for their actions.
The Task Force recommended that governments work together to tackle the issue of safe havens and adopt key practices to protect their citizens — or help them better protect themselves (Actions 1.3.1 and 1.3.2, page 27).
We’ve already seen some progress in this regard, as ransomware was raised at the recent G7 Summit, and the resulting communique included the following commitment from members:
“We also commit to work together to urgently address the escalating shared threat from criminal ransomware networks. We call on all states to urgently identify and disrupt ransomware criminal networks operating from within their borders, and hold those networks accountable for their actions.”
It will be interesting to see whether and how the G7 members will follow through on this commitment. I hope they’ll take action, build momentum, and recruit participation from other nations.
Reducing paths to revenue
As mentioned above, we’re seeing attackers demand higher and higher ransoms, which likely attracts other criminals to enter the market. Hopefully, the opposite is also true; if we reduce the opportunity to make money from ransomware, the number of attacks will decrease.
This rationale, coupled with discomfort over the idea of ransom payments being used to fund other types of organized crime — including human trafficking, child exploitation, and weapons trafficking — resulted in a great deal of discussion around the notion of banning ransom payments.
While the Task Force agreed that payments should be discouraged, the idea of a legal prohibition was challenging. Given the lack of real risk or friction for attackers, it’s likely that if payments were outlawed, attackers wouldn’t simply give up. Rather, they’d first play a game of chicken against victims, focusing on the organizations least likely to resist paying — namely providers of critical functions that can’t be disrupted without profound impact on society, or small-to-medium businesses that aren’t financially able to prepare for and weather an attack.
Given the concerns over these practicalities, the Task Force did not recommend banning payments. Rather, we looked at alternative ways of reducing the ease with which attackers realize a profit. There are two main paths to this: reducing the likelihood of victims making a payment, and making it technically harder for attackers to get their payment.
In terms of making victims think twice before making a payment, the RTF recommended a few measures:
Requiring the disclosure of payments(Action 4.2.4, page 46): This will help to build greater understanding of what is happening in the attack landscape and may enable law enforcement to build more information on attackers, or even recapture payments.
Requiring organizations to conduct cost-benefit analysis prior to making payments (Action 4.3.1 and 4.3.2, pages 47 and 48): This will encourage organizations to look into alternative options for resolution — for example, turning to the No More Ransom Project to seek decryption keys.
Creating a fund to assist certain organizations in recovery (Action 4.1.2, page 43): Often, organizations say the cost of recovery significantly outsizes that of the ransom, leaving them no choice but to give into their attacker’s demands. For qualifying organizations, this fund would rebalance the scales and give them a pragmatic alternative to paying the ransom.
On the other track — disrupting the system that facilitates the payment of ransoms — the RTF recommended that cryptocurrency exchanges, kiosks, and over-the-counter trading desks be required to comply with existing laws, such as Know Your Customer (KYC), Anti-Money Laundering (AML), and Combatting Financing of Terrorism (CFT) (Action 2.1.2, pages 29 and 30).
Better preparation, better response
During the explorations of the Task Force, it became apparent that part of the reason ransomware attacks are so successful is that many organizations don’t truly understand the threat, believe it’s relevant to them, or understand how to protect themselves. We repeatedly heard that, while there is a lot of information on ransomware, it’s overwhelming and often unhelpful. Many organizations don’t know what to focus on, and guidance may be oversimplified, overcomplicated, or insufficient.
With this in mind, one of our top recommendations was for the development of a ransomware framework that would cover measures for both preparing for and responding to attacks (Action 3.1.1, pages 35 and 36). The framework would need to be pragmatic, actionable, and address varying levels of sophistication and capability (Action 3.1.2, page 36). And because one of our main themes was around international cooperation, we also recommended there be a single source of truth adopted and promoted by multiple governments around the world. In fact, we recommended the framework be developed through both international and public-private collaboration. It should also be kept up to date to react to evolving ransomware attack trends.
Creating the framework is a lift, but it’s only part of the battle — you can’t drive adoption if you don’t also tackle the lack of awareness and understanding. As such, we also recommend that governments run high-profile awareness campaigns, partnering with organizations with reach into audiences that aren’t being well addressed today (Actions 3.2.1 and 3.2.2, pages 37 and 38). For example, many governments have toolkits or content aimed at small-to-medium businesses, but most leaders of these organizations seem largely unaware of the risk — until someone they know personally is hit by an attack.
The path forward
Unfortunately, ransomware continues to dominate headlines and harm organizations around the world. As a result, many governments are paying a great deal of attention to this issue and looking for solutions. I’m relieved to say the Ransomware Task Force’s report and recommendations have seen a fair bit of interest and support. For us, the next challenge is to keep the momentum going and help governments translate interest into action.
In the meantime, my colleagues at Rapid7 and I will continue to try to help our customers and community prepare for and respond to attacks. We’re working on some other content to help people better understand the dynamics of the issue, as well as the steps they can take to protect themselves or get involved in broader response efforts.
Welcome to The Lost Bots, a new vlog series where Rapid7 resident expert and former CISO Jeffrey Gardner (virtually) sits down with fellow industry experts to spill the tea on current events and trends in the security space. They’ll also share security best practices and trade war stories with the Rapid7 SOC team. The best part? Each episode is short, sweet, and to the (end)point – so you gain insights from the industry’s brightest in just 15 minutes.
For this inaugural episode, Jeffrey sits down with Rapid7 Insight Platform SVP Pete Rubio and IntSights Cofounder and CPO Alon Arvats to discuss how teams can successfully leverage external threat intelligence to identify and mitigate lurking attacks. They tackle the “what”, “why”, and “how” of external threat intelligence. They also share how security teams can effectively put external threat intel into action and what behaviors and telemetry are the most useful to find advanced threats.
Stay tuned for future episodes of The Lost Bots! For our second installment, Jeffrey will be back to discuss a topic we’ve all been hearing a lot about in recent months: Extended Detection and Response, or XDR.
When we talk to customers about the Insight Platform and how to best support their evolving needs, they’re often not asking for another product, but rather a capability that enhances a current experience. Our customers have the core ingredients of a robust security program, but as their attack surfaces endlessly sprawl, they’re looking for ways to double down on the efficiency and streamlining of security operations they’re already experiencing from the platform today. Efficiency and streamlined operations are 2 areas where our team will continue to focus efforts in order to deliver value across Rapid7’s growing best-in-class portfolio, while enabling cross-capability experiences that improve security-team effectiveness.
Responding to emerging threats and vulnerabilities: Alerts are not enough
One of Rapid7’s greatest strengths is the fact that we have market-leading products in detection and response, cloud security, and vulnerability management. As we increasingly see customers leveraging our products, there are many similar expectations from those user bases. One that stands out is the expectation/demand that Rapid7 quickly respond to emerging threats and new vulnerabilities in a way that provides actionable context. We refer to this program as Emergent Threat Response. We spend a lot of time on this today, though we need to do more here for our customers to help them combat emerging threats. We’re often addressing and detailing out what we know and what we’re doing about high-profile threats (e.g. SolarWinds SUNBURST, Microsoft Exchange Zero-Day), and while our customers have responded very positively to this type of outreach, they have also asked for more of it!
We have a unique opportunity with customers to enable a 2-way conversation. Our customers need to improve signal-to-noise, and our Emergent Threat Response approach does help to accomplish that. We can do a lot more though, and with more intelligence on the internal and external threat landscape we can offer more context and treat more threats with Emergent Threat Response. We’re constantly obsessing over improving signal-to-noise, so we’re careful to pick our spots. However, while an emerging threat may only impact a very small percentage of machines across our customer base, impacted customers may categorize those machines as high-value assets. Customers may also have a lot of interest in a specific threat group and are eager to learn more about them and the detections we have available for their known techniques. In both of these use cases — whether we’re pushing our intelligence or allowing customers to pull it — we can maintain our high standards for signal-to-noise as long as we’re always prioritizing relevancy.
The Insight Platform + IntSights: Enriching alerts and driving contextualized intelligence
When customers are battling emergent threats, core alerts and vulnerability information is important; but our customers are increasingly looking to understand more about adversary groups, tactics and techniques, and why they were targeted. Today we have a very comprehensive view of our customers’ internal networks. This is incredibly helpful to power every product we provide, but investing in more scalable ways to connect this internal profile to an external view of the world increases our ability to deliver timely, relevant, and actionable intelligence. With IntSights joining the Rapid7 family, this aspiration has become a reality. Beyond the Emergent Threat Response use case we drilled into here, the platform will leverage IntSights’ contextualized external threat intelligence to power and strengthen our threat library, risk scoring, and vulnerability prioritization. We believe we can add/enhance capabilities across the portfolio to not only help our customers solve the security concerns of today, but also take a proactive approach to defend against the security concerns of tomorrow.
Learn more about what’s in store for the Insight Platform as Rapid7 welcomes IntSights.
“Estragon: I’m like that. Either I forget right away or I never forget.” – Samuel Beckett, Waiting for Godot
Hacking and Automation
As hackers, we spend a lot of time making things easier for ourselves.
For example, you might be aware of a tool called Metasploit, which can be used to make getting into a target easier. We’ve also built internet-scale scanning tools, allowing us to easily view data about open ports across the internet. Some of our less ethical comrades-in-arms build worms and botnets to automate the process of doing whatever they want to do.
If the heart of hacking is making things do what they shouldn’t, then perhaps the lungs are automation.
Over the years, we’ve seen security in general and vulnerability discovery in particular move from a risky, shady business to massive corporate-sponsored activities with open marketplaces for bug bounties. We’ve also seen a concomitant improvement in the techniques of hacking.
If hackers had known in 1996 that we’d go from Stack-based buffer overflows to chaining ROP gadgets, perhaps we’d have asserted “no free bugs” earlier on. This maturity has allowed us to find a number of bugs that would have been unbelievable in the early 2000s, and exploits for those bugs are quickly packaged into tools like Metasploit.
Now that we’ve automated the process of running our exploits once they’ve been written, why is it so hard to get machines to find the bugs for us?
This is, of course, not for lack of trying. Fuzzing is a powerful technique that turns up a ton of bugs in an automated way. In fact, fuzzing is powerful enough that loads of folks turn up 0-days while they’re learning how to do fuzzing!
However, the trouble with fuzzing is that you never know what you’re going to turn up, and once you get a crash, there is a lot of work left to be done to craft an exploit and understand how and why the crash occurred — and that’s on top of all the work needed to craft a reliable exploit.
Automated bug finding, like we saw in the DARPA Cyber Grand Challenge, takes this to another level by combining fuzzing and symbolic execution with other program analysis techniques, like reachability and input dependence. But fuzzers and SMT solvers — a program that solves particular types of logic problems — haven’t found all the bugs, so what are we missing?
As with many problems in the last few years, organizations are hoping the answer lies in artificial intelligence and machine learning. The trouble with this hope is that AI is good at some tasks, and bug finding may simply not be one of them — at least not yet.
Learning to Find Bugs
Academic literature is rich with papers aiming to find bugs with machine learning. A quick Google Scholar search turns up over 140,000 articles on the topic as of this writing, and many of these articles seem to promise that, any day now, machine learning algorithms will turn up bugs in your source code.
There are a number of developer tools that suggest this could be true. Tools like Codota, Tabnine, and Kite will help auto-complete your code and are quite good. In fact, Microsoft has used GPT-3 to write code from natural language.
But creating code and finding bugs is sadly an entirely different problem. A 2017 paper written by Chappell et al — a collaboration between Australia’s Queensland University of Technology and the technology giant Oracle — found that a variety of machine learning approaches vastly underperformed Oracle’s Parfait system, which uses more traditional symbolic analysis techniques on the intermediate representations used by the compiler.
Another paper, out of the University of Oslo in Norway, Simulated SQL injection using Q-Learning, a form of Reinforcement Learning. This paper caused a stir in the MLSec community and especially within the DEF CON AI village (full disclosure: I am an officer for the AI village and helped cause the stir). The possibility of using a roomba-like method to find bugs was deeply enticing, and Erdodi et al. did great work.
However, their method requires a very particular environment, and although the agent learned to exploit the specific simulation, the method does not seem to generalize well. So, what’s a hacker to do?
Blaming Our Boots
“Vladimir: There’s man all over for you, blaming on his boots the faults of his feet.” – Samuel Beckett, Waiting for Godot
One of the fundamental problems with throwing machine learning at security problems is that many ML techniques have been optimized for particular types of data. This is particularly important for deep learning techniques.
Images are tensors — a sort of matrix with not just height and width but also color channels — of rectangular bit maps with a range of possible values for each pixel. Natural language is tokenized, and those tokens are mapped into a word embedding, like GloVe or Word2Vec.
This is not to downplay the tremendous accomplishments of these machine learning techniques but to demonstrate that, in order for us to repurpose them, we must understand why they were built this way.
Unfortunately, the properties we find important for computer vision — shift invariance and orientation invariance — are not properties that are important for tasks like vulnerability detection or malware analysis. There is, likewise, a heavy dependence in log analysis and similar tasks on tokens that are unlikely to be in our vocabulary — oddly encoded strings, weird file names, and unusual commands. This makes these techniques unsuitable for many of our defensive tasks and, for similar reasons, mostly useless for generating net-new exploits.
Why doesn’t this work? A few issues are at play here. First, the machine does not understand what it is learning. Machine learning algorithms are ultimately function approximators — systems that see some inputs and some outputs, and figure out what function generated them.
For example, if our dataset is:
X = {1, 3, 7, 11, 2}
Y = {3, 7, 15, 23, 5}
Our algorithm might see the first input and output: 3 = f(1) and guess that f(x) = 3x.
By the second input, it would probably be able to figure out that y = f(x) = 2x + 1.
By the fifth, there would be a lot of good evidence that f(x) = 2x + 1. But this is a simple linear model, with one weight term and one bias term. Once we have to account for a large number of dimensions and a function that turns a label like “cat” into a 32 x 32 image with 3 color channels, approximating that function becomes much harder.
It stands to reason then that the function which maps a few dozen lines of code that spread across several files into a particular class of vulnerability will be harder still to approximate.
Ultimately, the problem is neither the technology on its own nor the data representation on its own. It is that we are trying to use the data we have to solve a hard problem without addressing the underlying difficulties of that problem.
In our case, the challenge is not identifying vulnerabilities that look like others we’ve found before. The challenge is in capturing the semantic meaning of the code and the code flow at a point, and using that information to generate an output that tells us whether or not a certain condition is met.
This is what SAT solvers are trying to do. It is worth noting then that, from a purely theoretical perspective, this is the problem SAT, the canonical NP-Complete problem. It explains why the problem is so hard — we’re trying to solve one of the most challenging problems in computer science!
Waiting for Godot
The Samuel Beckett play, Waiting for Godot, centers around the characters of Vladimir and Estragon. The two characters are, as the title suggests, waiting for a character named Godot. To spoil a roughly 70-year-old play, I’ll give away the punchline: Godot never comes.
Today, security researchers who are interested in using artificial intelligence and machine learning to move the ball forward are in a similar position. We sit or stand by the leafless tree, waiting for our AI Godot. Like Vladimir and Estragon, our Godot will never come if we wait.
If we want to see more automation and applications of machine learning to vulnerability discovery, it will not suffice to repurpose convolutional neural networks, gradient-boosted decision trees, and transformers. Instead, we need to think about the way we represent data and how to capture the relevant details of that data. Then, we need to develop algorithms that can capture, learn, and retain that information.
We cannot wait for Godot — we have to find him ourselves.
Supply chain attacks are all the rage these days. While they’re not a new part of the threat landscape, they are growing in popularity among more sophisticated threat actors, and they can create significant system-wide disruption, expense, and loss of confidence across multiple organizations, sectors, or regions. The compromise of Codecov’s Bash Uploader script is one of the latest such attacks. While much is still unknown about the full impact of this incident on organizations around the world, it’s been another wake up call for the world that cybersecurity problems are getting more complex by the day.
This blog post is meant to provide the security community with defensive knowledge and techniques to protect against supply chain attacks involving continuous integration (CI) systems, such as Jenkins, Bamboo, etc., and version control systems, such as GitHub, GitLab, etc. It covers prevention techniques — for software suppliers and consumers — as well as detection and response techniques in the form of a playbook.
It has been co-developed by our Information Security, Security Research, and Managed Detection & Response teams. We believe one of the best ways for organizations to close their security achievement gap and outpace attackers is by openly sharing knowledge about ever-evolving security best practices.
Defending CI systems and source code repositories from similar supply chain attacks
Below are some of the security best practices defenders can use to prevent, detect, and respond to incidents like the Codecov compromise.
Figure 1: High-level overview of known Codecov supply chain compromise stages
Prevention techniques
Provide and perform integrity checks for executable code
If you’re a software consumer
Use collision-resistant checksum hashes, such as with SHA-256 and SHA-512, provided by your vendor to validate checksums for all executable files or code they provide. Likewise, verify digital signatures for all executable files or code they provide.
If either of these integrity checks fail, notify your vendor ASAP as this could be a sign of compromised code.
If you’re a software supplier
Provide collision-resistant hashes, such as with SHA-256 and SHA-512, and store checksums out-of-band from their corresponding files (i.e. make it so that an attacker has to successfully carry out two attacks to compromise your code: one against the system hosting your checksum data and another against your content delivery systems). Provide users with easy-to-use instructions, including sample code, for performing checksum validation.
Additionally, digitally sign all executable code using tamper-resistant code signing frameworks such as in-toto and secure software update frameworks such as The Update Framework (TUF) (see DataDog’s blog post about using these tools for reference). Simply signing code with a private key is insufficient since attackers have demonstrated ways to compromise static signing keys stored on servers to forge authentic digital signatures.
Relevant for the following Codecov compromise attack stages:
Customers’ CI jobs dynamically load Bash Uploader
Version control third-party software components
Store and load local copies of third-party components in a version control system to track changes over time. Only update them after comparing code differences between versions, performing checksum validation, and authenticating digital signatures.
Relevant for the following Codecov compromise attack stages:
Bash Uploader script modified and replaced in GCS
Implement egress filtering
Identify trusted internet-accessible systems and apply host-based or network-based firewall rules to only allow egress network traffic to those trusted systems. Use specific IP addresses and fully qualified domain names whenever possible, and fallback to using IP ranges, subdomains, or domains only when necessary.
Relevant for the following Codecov compromise attack stages:
Environment variables, including creds, exfiltrated
Implement IP address safelisting
While zero-trust-networking (ZTN) doubts have been cast on the effectiveness of network perimeter security controls, such as IP address safelisting, they are still one of the easiest and most effective ways to mitigate attacks targeting internet routable systems. IP address safelisting is especially useful in the context of protecting service account access to systems when ZTN controls like hardware-backed device authentication certificates aren’t feasible to implement.
Popular source code repository services, such as GitHub, provide this functionality, although it may require you to host your own server or, if using their cloud hosted option, have multiple organizations in place to host your private repositories separately from your public repositories.
Relevant for the following Codecov compromise attack stages:
Creds used to access source code repos
Bash Uploader script modified and replaced in GCS
Apply least privilege permissions for CI jobs using job-specific credentials
For any credentials a CI job uses, provide a credential for that specific job (i.e. do not reuse a single credential across multiple CI jobs). Only provision permissions to each credential that are needed for the CI job to execute successfully: no more, no less. This will shrink the blast radius of a credential compromise
Relevant for the following Codecov compromise attack stages:
Creds used to access source code repos
Use encrypted secrets management for safe credential storage
If you absolutely cannot avoid storing credentials in source code, use cryptographic tooling such as AWS KMS and the AWS Encryption SDK to encrypt credentials before storing them in source code. Otherwise, store them in a secrets management solution, such as Vault, AWS Secrets Manager, or GitHub Actions Encrypted Secrets (if you’re using GitHub Actions as your CI service, that is).
Relevant for the following Codecov compromise attack stages:
Creds used to access source code repos
Block plaintext secrets from code commits
Implement pre-commit hooks with tools like git-secrets to detect and block plaintext credentials before they’re committed to your repositories.
Relevant for the following Codecov compromise attack stages:
Creds used to access source code repos
Use automated frequent service account credential rotation
Rotate credentials that are used programmatically (e.g. service account passwords, keys, tokens, etc.) to ensure that they’re made unusable at some point in the future if they’re exposed or obtained by an attacker.
If you’re able to automate credential rotation, rotate them as frequently as hourly. Also, create two “credential rotator” credentials that can both rotate all service account credentials and rotate each other. This ensures that the credential that is used to rotate other credentials is also short lived.
Relevant for the following Codecov compromise attack stages:
Creds used to access source code repos
Detection techniques
While we strongly advocate for adopting multiple layers of prevention controls to make it harder for attackers to compromise software supply chains, we also recognize that prevention controls are imperfect by themselves. Having multiple layers of detection controls is essential for catching suspicious or malicious activity that you can’t (or in some cases shouldn’t) have prevention controls for.
Identify Dependencies
You’ll need these in place to create detection rules and investigate suspicious activity:
Process execution logs, including full command line data, or CI job output logs
Network logs (firewall, network flow, etc.), including source and destination IP address
Authentication logs (on-premise and cloud-based applications), including source IP and identity/account name
Activity audit logs (on-premise and cloud-based applications), including source IP and identity/account name
Indicators of compromise (IOCs), including IPs, commands, file hashes, etc.
Ingress from atypical IP addresses or regions
Whether or not you’re able to implement IP address safelisting for accessing certain systems/environments, use an IP address safelist to detect when atypical IP addresses are accessing critical systems that should only be accessed by trusted IPs.
Relevant for the following Codecov compromise attack stages:
Bash Uploader script modified and replaced in GCS
Creds used to access source code repos
Egress to atypical IP addresses or regions
Whether or not you’re able to implement egress filtering for certain systems/environments, use an IP address safelist to detect when atypical IP addresses are being connected to.
Relevant for the following Codecov compromise attack stages:
Environment variables, including creds, exfiltrated
Environment variables being passed to network connectivity processes
It’s unusual for a system’s local environment variables to be exported and passed into processes used to communicate over a network (curl, wget, nc, etc.), regardless of the IP address or domain being connected to.
Relevant for the following Codecov compromise attack stages:
Environment variables, including creds, exfiltrated
Response techniques
The response techniques outlined below are, in some cases, described in the context of the IOCs that were published by Codecov. Dependencies identified in “Detection techniques” above are also dependencies for response steps outlined below.
Data exfiltration response steps: CI servers
Identify and contain affected systems and data
Search CI systems’ process logs, job output, and job configuration files to identify usage of compromised third-party components (in regex form). This will identify potentially affected CI systems that have been using the third-party component that is in scope. This is useful for getting a full inventory of potentially affected systems and examining any local logs that might not be in your SIEM
4. Create forensic image of affected system(s) identified in steps 1 – 3
5. Network quarantine and/or power off affected system(s)
6. Replace affected system(s) with last known good backup, image snapshot, or clean rebuild
7. Analyze forensic image and historical CI system process, job output, and/or network traffic data to identify potentially exposed sensitive data, such as credentials
Search for malicious usage of potentially exposed credentials
Search authentication and activity audit logs for IP address IOCs
Search authentication and activity audit logs for potentially compromised account events originating from IP addresses outside of organization’s known IP addresses
This could potentially uncover new IP address IOCs
Clone full historical source code repository content
Note: This content is based on git-based version control systems
Version control systems such as git coincidentally provide forensics-grade information by virtue of them tracking all changes over time. In order to be able to fully search all data from a given repository, certain git commands must be run in sequence.
Set git config to get full commit history for all references (branches, tags), including pull requests, and clone repositories that need to be analyzed (*nix shell script)
git config --global remote.origin.fetch '+refs/pull/*:refs/remotes/origin/pull/*'
# Space delimited list of repos to clone
declare -a repos=("repo1" "repo2" "repo3")
git_url="https://myGitServer.biz/myGitOrg"
# Loop through each repo and clone it locally
for r in ${repos[@]}; do
echo "Cloning $git_url/$r"
git clone "$git_url/$r"
done
2. In the same directory where repositories were cloned from the step above, export full git commit history in text format for each repository. List git committers at top of each file in case they need to be contacted to gather context (*nix shell script)
git fetch --all
for dir in *(/) ; do
(rm $dir.commits.txt
cd $dir
git fetch --all
echo "******COMMITTERS FOR THIS REPO********" >> ../$dir.commits.txt
git shortlog -s -n >> ../$dir.commits.txt
echo "**************************************" >> ../$dir.commits.txt
git log --all --decorate --oneline --graph -p >> ../$dir.commits.txt
cd ..)
done
a. Note: the below steps can be done with tools such as Atom, Visual Studio Code, and Sublime Text and extensions/plugins you can install in them.
If performing manual reviews of these commit history text files, create copies of those files and use the regex below to find and replace git’s log graph formatting that prepends each line of text
^(\|\s*)*(\+|-|\\|/\||\*\|*)*\s*
b. Then, sort the text in ascending or descending order and de-duplicate/unique-ify it. This will make it easier to manually parse.
Search for binary files and content in repositories
Exporting commit history to text files does not export data from any binary files (e.g. ZIP files, XLSX files, etc.). In order to thoroughly analyze source code repository content, binary files need to be identified and reviewed.
Find binary files in folder containing all cloned git repositories based on file extension (*nix shell script)
Search for plaintext credentials: passwords, API keys, tokens, certificate private keys, etc.
Search commit history text files for known credential patterns using tools such as TruffleHog and GitLeaks
Search binary file contents identified in Search for binary files and content in repositories for credentials
Search logs for malicious access to discovered credentials
Follow steps from Data exfiltration response (Searching for malicious usage of potentially exposed credentials) using logs from systems associated with credentials discovered in Search for plaintext credentials
New findings about attacker behavior from Project Sonar
We are fortunate to have a tremendous amount of data at our fingertips thanks to Project Sonar which conducts internet-wide surveys across more than 70 different services and protocols to gain insights into global exposure to common vulnerabilities. We analyzed data from Project Sonar to see if we could gain any additional context about the IP address IOCs associated with Codecov’s Bash Uploader script compromise. What we found was interesting, to say the least:
The threat actor set up the first exfiltration server (178.62.86[.]114) on or about February 1, 2021
Historical DNS records from remotly[.]ru and seasonver[.]ru have, and continue to, point to this server
The threat actor configured a simple HTTP redirect on the exfiltration server to about.codecov.io to avoid detection { “http_code”: 301, “http_body”: “”, “server”: “nginx”, “alt-svc”: “clear”, “location”: “http://about.codecov.io/“, “via”: “1.1 google” }
The redirect was removed from the exfiltration server on or before February 22, 2021, presumably by the server owner having detected these changes
The threat actor set up new infrastructure (104.248.94[.]23) that more closely mirrored Codecov’s GCP setup as their new exfiltration server on or about March 7, 2021 { “http_code”: 301, “http_body”: “”, “server”: “envoy”, “alt-svc”: “clear”, “location”: “http://about.codecov.io/“, “via”: “1.1 google” }
The new exfiltration server was last seen on April 1, 2021
We hope the content in this blog will help defenders prevent, detect, and respond to these types of supply chain attacks going forward.
This year, we’re focusing on providing customers with more extensibility and customization in InsightIDR — from adding new event sources to completely refreshing our Dashboard and Reporting experience, we’ve made some strides over the last few months.
This post offers a closer look at some of the recent updates and releases in InsightIDR, our SaaS SIEM, from Q2 2021.
Rapid7 Named a Leader in the Gartner Magic Quadrant for SIEM for the Second Year in a Row
We credit this achievement to our deep partnership with customers and our uncompromising commitment to delivering a solution that is intuitive and easy to execute for our users. You can read the full report for free here.
New and Improved Dashboards and Reporting Experience
We’re so excited to announce the release of our updated Dashboards and Reporting experience in InsightIDR! We’ve made some big improvements to our Card Library and Card Builder (including the addition of new visualizations), as well as a more customizable Reporting experience.
Card Library and Builder updates:
Users can now set different time ranges or use different log sets across multiple queries
Cards can be created from log sets, so you won’t need to manually update your dashboards if new logs get added
More flexibility to create the visualizations that best capture the dynamics of your network with the new Stacked Area, Word Cloud, and Packed Bubble visualizations
Reporting updates:
New functionality where users can now set multiple different reporting schedules, as well as email reports to any address for easier sharing
InsightIDR’s intuitive new Dashboard interface, featuring the new Word Cloud visualization.
Rapid7 and Velociraptor Join Forces
In April, Rapid7 acquired Velociraptor, an open-source technology and community used for endpoint monitoring, digital forensics, and incident response. We are committed to helping the Velociraptor community grow and thrive, and also plan to embed the Velociraptor Project into the Rapid7 Insight Platform, allowing our customers to benefit from this amazing technology and community.
Open source projects like Velociraptor enable the greater security community to move the industry forward. We have a track record of investing in, contributing to, and building on open source projects, dating as far back as 12 years ago with Metasploit, and in more recent years with Recog and AttackerKB. Supporting and learning from these open-source projects helps Rapid7 innovate, strengthen our product and service offerings, and bring greater value to our customers.
See more on our Velociraptor acquisition and what it means for Rapid7 customers in our blog post here.
Multi-Theme Support in InsightIDR
We’re excited to announce the release of the new dark theme in InsightIDR! This new theme will increase contrast and legibility, as well as reduce eye strain for users engaging with the screen for longer periods of time. It also provides more accessible options to those with color vision deficiency, enabling all users to have an optimal experience with our UI.
You can easily toggle between light and dark themes based on your needs for the task at hand by updating your Visual Preference within Profile Settings.
Switch between light and dark themes in InsightIDR in Profile Settings.
SCADAfence + InsightIDR for Broader OT Coverage
Joint customers of InsightIDR and SCADAfence can now configure SCADAfence to create and forward alerts to InsightIDR via syslog to generate third-party alerts.
For InsightIDR customers leveraging Enhanced Network Traffic Analysis, this integration will provide a broader picture of device activity. If a SCADAfence alert fires, Network Sensor data can show customers that not only is this device on their network, but also which network applications it’s associated with, as well as connections coming to and from that device.
Custom Parsing Tool Introduces the New RegEx Editor
The new Regex Editor provides increased flexibility for customers to extract out fields and custom parse their logs by enabling them to write their own regular expression. Users can use the RegEx Editor from the start, or start out in guided mode and switch over at any time.
See details and step-by-step instructions on how to leverage the new RegEx Editor in our updated documentation here.
Extracting out fields with the new Regex Editor in InsightIDR.
Improvements for Better Visibility into the Health of Your Network Sensors
View the number of deployed network sensors in your environment and related errors from the Data Collection Health page.
Identify Network Sensor errors more easily within InsightIDR. Network Sensor errors are now rolled into the Data Collection Issues KPI on the InsightIDR Home page overview and in the Data Collection Health menu item in the top menu bar.
Easily view Network Sensor health from the InsightIDR homepage via Data Collection Health.
Insight Agent Updates
Rapid7’s Threat Intelligence and Detection Engineering (TIDE) Team recently released a detection that identifies if Insight Agents are not properly sending data back to the InsightIDR Platform. For more information, see our help documentation here.
Stay Tuned for More!
As always, we’re continuing to work on exciting product enhancements and releases throughout the year. Keep an eye on our blog and release notes as we continue to highlight the latest in detection and response at Rapid7.
I have logs on my mind right now, because every spring, as trees that didn’t survive the winter are chopped down, my neighbor has truckloads of them delivered to his house. All the logs are eventually burned up in his sugar house and used to make maple syrup, and it reminds me that I have some logs I’d like to burn to the ground, as well!
If you’re reading this blog, chances are you probably have some of these ugly logs that are messy, unstructured, and consequently, difficult to parse. Rather than destroy your ugly logs, however tempting, you can instead use the Custom Parsing tool in InsightIDRto break them up into usable fields.
Specifically, I will discuss here how to use Regex Editor mode, which assumes a general understanding of regular expression. If you aren’t familiar with regular expression or would like a short refresher, you may want to start with “Introducing the Manual Regex Editor in IDR’s Parsing Tool: Part 1.”
Many logs follow a standard format and can be easily parsed with the Custom Parsing tool using the default guided mode, which is quite easy to use and requires no regular expression. You can read more about using guided mode here.
If the logs parse well with guided mode, you will likely use it to parse your logs. However, for those logs that lack good structure, common fields, or just do not parse correctly using guided mode, you may need to switch to Regex Editor mode to parse them.
Example 1: Key-Value Pair Logs Separated With Keys
Let’s start by looking at some logs in a classic format, which may not be obvious at first glance.
The first part of these logs has the fields separated by pipes (“|”). Logs that have a common field, like a pipe, colon, space, etc., separating the values are usually easy to parse and can be parsed out in guided mode.
However, the problem with these logs is that the last part contains a string that’s separated by literal strings of text rather than a set character type. For example, if you look at the “msg” field, it is an unstructured string that might contain many different characters — the end of the value is determined by the start of the next key name, “rt”.
May 26 08:25:37 SECRETSERVER CEF:0|Thycotic Software|Secret Server|10.9.000033|500|System Log|3|msg=Login Failure - ts2000.com\hfinn - AuthenticationFailed rt=May 26 2021 08:25:37 src=10.15.4.56 Raw Log/Thycotic Secret Server
May 26 08:25:37 SECRETSERVER CEF:0|Thycotic Software|Secret Server|10.9.000033|500|System Log|3|msg=Login attempt on node SECRETSERVER by user hfinn failed: Login failed. rt=May 26 2021 08:25:37 src=10.15.4.56
Let’s see how parsing these logs with the Custom Parsing Tool works. I have followed the instructions at https://docs.rapid7.com/insightidr/custom-parsing-tool/ and started parsing out my fields. Right away, you can see I’m having a problem parsing out the “msg” field in guided mode. It’s not working like I want it to!
This is where it is a good idea to switch to Regex Editor mode rather than continuing in guided mode. As such, I have selected the Regex Editor, and you can see that displayed here:
Whoa! This regex might look daunting at first, but just remember from our previous lesson that you can use an online regex cheat sheet or expression builder to make sense of any parts you find confusing or unclear.
Here is what the Regex Editor has so far, based on the two fields I added from guided mode (date and message):
The regular expression for the field I decided to name “message” is the part that’s not working like I want. So, I need to edit this part: (?P<message>[^d]*d).
Remember, this is a capture group, so the regular expression following the field name, “<message>”, will be used to read the logs and extract the values for each one. In other words, in Log Search, the key-value pair will be extracted out from the logs as follows:
(?P<key>regex that will extract the value)
“[^d]*d” is not working, so let’s figure out how to replace that. There are a lot of ways to go about crafting a regular expression that will extract the field. For example, one option might be to extract every character until you get to the next literal string:
This works, but it is somewhat inefficient for parsing. It’s outside our scope here to discuss why, but in general, you should not use the dot star, “.*”, for parsing rules. It is much more efficient to define what to match rather than what to not match, so whenever possible, use a character class to define what should be matched.
Create the character class and put all possible characters that appear in the field into it:
These Thycotic logs have a lot of different characters appearing in the “msg” field, so defining a character class like I’m doing here, “[\w\s\.-\\]”, is a bit like playing pin the tail on the donkey, in that I hope I get them all!
Let’s look at another way to extract a text string when it does not have a standard format. Remember that “\d” will match any digit character. Its opposite is “\D”, which matches any non-digit character. Therefore, “[\d\D]+” matches any digit or non-digit character:
One thing to point out here is that, although defining the specific values in the character class was a bit futzy to extract the “msg” field, this method works very well when parsing out host and user names.
In most cases, host and user names will contain only letters, numbers, and the “-” symbol, so a character class of “[\w\d-]” works well to extract them. If the names also contain a FQDN, such as “hfinn.widgets.com”, then you also need to extract the period: “[\w\d\.-]”.
Example 2: Unstructured Logs
Let’s look at some logs that are challenging to parse due to the field structure.
Logs that do not have the same fields in every log and that do not have standard breaks to delineate the fields, while nicely human readable, are more difficult for a machine to parse.
<14>May 27 16:25:31 tkxr7san01.widgets.local MSWinEventLog	1	 Microsoft-Windows-PrintService/Operational	5793	Mon May 27 16:25:31 2021 	805	Microsoft-Windows-PrintService	hfinn	User	Information	 tkxr7san01.widgets.local	Print job diagnostics		Rendering job 71.	 2447840
<14>May 27 16:25:31 tkxr7san01.widgets.local MSWinEventLog	1	 Microsoft-Windows-PrintService/Operational	5794	Mon May 27 16:25:31 2021 	307	Microsoft-Windows-PrintService	hfinn	User	Information	 tkxr7san01.widgets.local	Printing a document		Document 71, Print Document owned by hfinn on lpt-hfinn01 was printed on XEROX1001 through port XEROX1001. Size in bytes: 891342. Pages printed: 2. No user action is required.	2447841
Let’s take a look at how we can parse out the fields in this log using guided mode. When you are using the Custom Parsing Tool, one of the first things you need to decide is if you want to create a filter for the rule:
With logs, the device vendor decides what fields to create and how the logs will be structured. Some vendors create their logs so all have the same fields in every log line, no matter what the event. If your logs look like this, then you will not need to use a filter.
Other vendors define different fields depending on the type of event. In this case, you will probably need to use a filter and create a separate rule for each type of event you want to parse. Another reason to use a filter is that you just want to parse out one type of event.
Looking at my Microsoft print server logs closely, you can see that the second log has quite a few more fields than the first one: document name printed, the document owner, what printer it was printed on, size, pages printed, and if any user action is required. As such, I’m going to need to use filters and create more than one rule here.
The filter should be a literal string that is part of the logs I want to parse. In other words, how can the parsing tool know which logs to apply this rule to? Let’s start with the first type of log:
<14>May 27 16:25:31 tkxr7san01.widgets.local MSWinEventLog 1 Microsoft-Windows-PrintService/Operational 5793 Mon May 27 16:25:31 2021 805 Microsoft-Windows-PrintService hfinn User Information tkxr7san01.widgets.local Print job diagnostics Rendering job 71. 2447840
Its type is “Print job diagnostics”, so that seems like a good string to match on. I will use that for my filter.
Still in the default guided mode, I’ll start extracting out the fields I want to parse. I don’t need to parse them all, just the ones I care about. As I am working my way through the log, I find that I am not able to extract the username like I want:
I am going to continue for the moment, however, using guided mode to define the last field I need to add.
Let’s pause for a moment. I’ve created four fields. Three of them are fine, but the “source_user” field is not parsing correctly. I am going to switch now to Regex Editor mode to fix it.
The regex created by the Custom Parsing Tool in guided mode is:
The only part I need to look at is the capture group for the field I called “source_user”:
(?P<source_user>[^ ]+)
With that said, the issue with the rule could be somewhere else in the parsing rules. However, let’s just start with the one capture group. Let’s interpret the character class first: “[^ ]”.
When the hat symbol (“^”) appears in a character class, it means “not”. The hat is followed by a space, so the character class is “not a space”. Therefore, “[^ ]+” means “read in values that are not spaces” or “read until you get to a space”.
Looking at the entire parsing rule, you can see it is counting the number of spaces to define what goes into each field. This would work out fine if spaces were the field delimiters, but that’s not how these logs work. The logs are a bit unstructured in the sense that some of the fields are defined by literal strings and others are just literal strings themselves.
Also, guided mode had a few too many beers while trying to cope with these silly logs and decided that the “source_user” field should always start with the letter “m”:
[^m]+(?P<source_user>[^ ]+)
Oops! We don’t want that! Let’s get rid of it, plus the “[^P]+”, which means to read to a literal capital P: this is how it is rolling past everything to the “Print job diagnostics”, but we can do better than that.
As humans, we know that we want the “action” field to be the literal string “Print job diagnostics”, which the Custom Parsing Tool doesn’t know. Let’s just fix these few things first. I made these changes, clicked on Apply to test them, and got an error:
This error means I’ve goofed, and the rule does not match my logs. I know I’m on the right path, though, so I’m going to continue. The problem here is with how the regex is going from “datetime” to “source_user” and then to “action”.
Let’s stop for a moment to look at this regex:
(?:[^ ]*){3}
The “(?P<keyname>)” structure that we’ve been using is a capture group. The “(?:)” structure is a non-capture group. It means that regex should read this but not actually capture it or do anything with it. It’s also how we are going to skip past the fields we don’t want to parse. The “{3}” means “three times”. Of course, we have already seen that “[^ ]*” means “not a space” or “read until you get to a space”. So, the whole non-capture group “(?:[^ ]*){3}“ means “read everything to the next space, three times” or “skip past everything that is in the log until you have read past three spaces”.
Now, let’s look at an actual log:
The last field we read in was “datetime”, and then, we need to skip over to the “source_user” field. Let’s try to do that by skipping past the three spaces until we get there.
Next, from the “source_user” to the last field, “action”, there are four spaces. Here is my regex:
I have added “(?:[^ ]* ){3}“ to skip past 3 spaces and done the same thing later to skip past 4 spaces, using a “{4}” to denote 4 spaces. Let’s see if it works:
The tool seems to be happy with this, as all the fields appear correctly, so I will go ahead with applying and saving this rule.
If you are at this spot with your logs except the tool is not happy and you are getting an error, I have a couple of tips for you to try:
Sometimes, the tool works better if you do parse every field, even if you do not particularly care about them. Try parsing every field to see if that works better for you.
Occasionally, it is easier to just parse out one (or maybe two or three) fields per rule. This is especially true if the logs are very messy and the fields have little structure. If you are really stuck, try to parse out just one field at a time. It is okay to have several parsing rules per log type, if necessary.
Try to proceed one field at a time, if possible. Get the one field extracted correctly, and then proceed to the next one.
When you create a parsing rule, it will apply to new logs that are collected. I have waited a bit for more logs to come in, and I can see they are now parsing as expected.
Now, I need to create a second rule for the next type of log. Here is what those logs look like
<14>May 27 16:25:31 tkxr7san01.widgets.local MSWinEventLog 1 Microsoft-Windows-PrintService/Operational 5794 Mon May 27 16:25:31 2021 307 Microsoft-Windows-PrintService hfinn User Information tkxr7san01.widgets.local Printing a document Document 71, Print Document owned by hfinn on lpt-hfinn01 was printed on XEROX1001 through port XEROX1001. Size in bytes: 891342. Pages printed: 2. No user action is required. 2447841
When you create a second (or third, fourth, etc.) parsing rule for the same logs, the Custom Parsing Tool does not know about the previous rules. You will need to start any additional rules just as you did the first one.
Also, just like before, as I am creating the parsing rule, I will need to apply a filter to match these logs. The type of log is “Printing a document”, so I will use that as the filter.
Again, I will start in guided mode and define the fields I want to start parsing out — it isn’t required to start in guided mode but, sometimes, that is easier. I defined a few fields, and as you can see, the parsing is not working like I need.
Now that I have the fields defined, I’ll switch to Regex Editor mode.
Just like before, I am going to clean this up a bit, starting with the first field and working from left to right, modifying the regex to parse out the keys like I want.
The first part of the regex, “^(?:[^ ]* ){4}(?P<datetime>[^ ]+)”, says to skip past the first four spaces and read the next part into the datetime key until a fifth space is read. This first part is fine and parsing out the field as needed, so let’s move on to the next part, “[^h]{36}(?P<source_user>[^ ]+)”.
For simplicity and functionality, I am going to swap out the way the regex is skipping over to the username, “[^h]{36}”, with “(?:[^ ]* ){3}”. This is using the same logic as the first rule: skip past three spaces to find the next value to read in.
These first two fields are working, so let’s move to the next one, “source_host”. The regex for skipping over to this field and parsing it is: “\D{18}(?P<source_host>[^ ]+)”.
While this might look odd, the “\D{18}” part is how regex skips over the literal string “User Information”. We looked at “\D” previously; the “\D” means to match “any non-digit character”, and the “{18}” means “18 times”. In other words, skip forward 18 non-digit characters. This is working well, and there is no need for any tinkering.
The next field is “(?P<action>[^ ]+)”, and just like the previous one, this field is properly parsed out. If a field is properly parsed, then there is no need to make any changes.
Now, I am getting to the messiest field in the logs, which is the name of the document that was printed. You can see that the field should contain all the text between “Printing a document” and “owned by”, and it is not being correctly parsed with the auto-generated regex.
Hey, we humans are still better at some things than machines! While this field is easy for us to make out, machine-generated regex has difficulty with these types of fields.
Let’s look at the current method that regex is using. The field is parsed with “(?P<printed_document>(?:[^ ]* ){3}[^ ]+)”, which means the parser is counting spaces to try to determine the field, and that just doesn’t work here. We need to craft a regular expression that will parse everything until we get to “owned by”, no matter what it is.
The best way to do this is to create a character class that includes all the possible characters that might be in the field to be extracted. Because a document can contain any possible character, I am going to use the class “[\d\D]”, which I used previously. To say “followed by the literal string owned by”, I need to be careful and take into account the spaces.
Spaces can be a little tricky in that, sometimes, what your eyes perceive as one space are several. To be on the safe side, instead of specifying one space with “\s” you might want to use “\s+”. You could also put an actual space there. That is what the auto-generated regex has; however, I prefer to use the “\s+” notation as it makes it clear that I want to match one or more spaces.
(?P<printed_document>[\d\D]+)\s+owned\s+by\s+
Before continuing, I am checking to make sure the “printed_document” field is parsed properly.
It all looks good! If it didn’t, I would fiddle with the parsing until it did. The last field owner is parsing correctly, as well
Drat! I need to extract one more field, and I forgot to define it in guided mode. That’s okay, however, because I can go ahead and add it right now. All I need to do is to create a named capture group for it.
We looked at the syntax for a named capture group earlier:
(?P<key>regex that will extract the value)
I want to collect how many pages were printed, so let’s look at our logs again. I’m working on this part of the log:
owned by mstewart on \\L-mstewart03 was printed on Adobe PDF through port Documents\*.pdf. Size in bytes: 0. Pages printed: 13.
I need to skip forward from the “owned by” value all the way over to “Pages printed”. The fields in between might have different numbers of spaces, characters, etc., which means I can’t count spaces like I did before. I can’t count the number of characters, either.
The tool seems happy with this, as there are no errors when I click on Apply, and the fields in the Log Preview appear to be correct.
When I apply and save this rule, I wait for a few more logs to come in to see if the parsing rule is working like I want. In Log Search, here is a parsed log line:
You might be wondering what the “\t” is all about. The “\t” is a tab or space character, and I’m not quite satisfied with my parsing rule. I didn’t spot when I saved it that there is a space being captured at the beginning of the field. If you find, after you save a rule, that it isn’t working like you want, you can either delete it and start over or just modify the existing rule.
I am going to modify my rule and fix it. Here is my final regex with the extra spaces accounted for:
New to writing regular expressions? No problem. In this two-part blog series, we’ll cover the basics of regular expressions and how to write regular expression statements (regex) to extract fields from your logs while using the custom parsing tool. Like learning any new language, getting started can be the hardest part, so we want to make it as easy as possible for you to get the most out of this new capability quickly and seamlessly.
The ability to analyze and visualize log data — regardless of whether it’s critical for security analytics or not — has been available in InsightIDRfor some time. If you prefer to create custom fields from your logs in a non-technical way, you can simply head over to the custom parsing tool, navigate through the parsing tool wizard to find the “extract fields” step, and drag your cursor over the log data you’d like to extract to begin defining field names.
The following guide will give you the basic skills and knowledge you need to write parsing rules with regular expressions.
What Are Regular Expressions?
In technical applications, you occasionally need a way to search through text strings for certain patterns. For example, let’s say you have these log lines, which are text strings:
May 10 12:43:12 SECRETSERVERHOST CEF:0|Thycotic Software|Secret Server|10.9.000002|500|System Log|7|msg=The server could not be contacted. rt=May 10 2021 12:43:12
May 10 12:43:41 SECRETSERVERHOST CEF:0|Thycotic Software|Secret Server|10.9.000002|500|System Log|7|msg=The RPC Server is unavailable. rt=May 10 2021 12:43:41
You need to find the message part of the log lines, which is everything between “msg=” and “rt=”. With these two log lines, I might hit the easy button and just copy the text manually, but clearly, this approach won’t work if I have hundreds or thousands of lines from which I need to pull the field out.
This is where regular expression, often shortened to regex, comes in. Regex gives you a way to search through text to match patterns, like “msg=”, so you can easily pull out the text you need.
How Does It Work?
I have a secret to share with you about regular expression: It’s really not that hard. If you want to learn it in great depth and understand every feature, that’s a story for another day. However, if you want to learn enough to parse out some fields and get on with your life, these simple tips will help you do just that.
Before we get started, you need to understand that regex has some rules that must be followed. The best mindset to get the hang of regex, at least for a little while, is to follow the rules without worrying about why.
Here are some of the basic regular expression rules:
The entire regular expression is wrapped with forward slashes (“/”).
Pattern matches start with backslashes (“\”).
It is case-sensitive.
It requires you to match every character of the text you are searching.
It requires you to learn its special language for matching characters.
The special language of regular expression is how the text you are searching is matched. You need to start the pattern match with a backslash (“\”). After that, you should use a special character to denote what you want to match. For example, a letter or “word character” is matched with “\w” and a number or “digit character” is matched with “\d”.
If we want to match all the characters in a string like:
cat
We can use “\w”, as “\w” matches any “word character” or letter, so:
\w\w\w
This matches the three characters “c”, “a”, and “t”. In other words, the first “\w” matches the “c” character; “\w\w” matches “ca”; and “\w\w\w” matches “cat”.
As you can see, “\w” matches any single letter from “a” to “z” and also matches letters from “A” to “Z”. Remember: Regex is case sensitive.
“\w” also matches any number. However, “\w” does NOT match spaces or other special characters, like “-”, “:”, etc. To match other characters, you need to use their special regex symbols or other methods, which we’ll explore here.
Getting Started With Regex
Before we keep going, now is a good time to take a few minutes to find a regex “cheat sheet” you like.
Rapid7 has one you can use: https://docs.rapid7.com/insightops/regular-expression-search/, or you may have a completely different one you prefer. Whatever the case is for you, these guides are helpful in keeping track of all your matching options.
While we’re at it, let’s also find a regex testing tool we can use to practice our regex. https://regex101.com/ is very popular, as it is a tool and cheat sheet in one, although you may find another tool you want to use instead.
InsightIDR supports the version of regex called RE2, so if your parsing tool supports the Golang/RE2 flavor, you might want to select it to practice the specific flavor InsightIDR uses.
To follow along with me, open your preferred tool for testing regex. Enter in some text to match and some regex, and see what happens!
Let’s look at another way to match the string “cat”. You can use literals, which means you just enter the character you want to match:
This means you literally want to match the string “cat”. It matches “cat” and nothing else.
Let’s look at another example. Say I need to match the string:
san-dc01
As we saw earlier, you can use “\w” to match the word characters. To match a number, you can use “\w” or “\d”. “\d” will match any number or “digit”. However, how can you match the “-”?
The dash (“-”) is not a word character, so “\w” does not match it. In this case, we can tell regex we want to match the “-” literally:
\w\w\w-\w\w\d\d
There are other options, as well. The dot or period character (“.”) in regex means to match any single character. This works to parse out the string “san-dc01”, as well:
\w\w\w.\w\w\d\d
While this works, it is tedious typing all these “\w”s. This is where wildcards, sometimes called regex quantifiers, come in handy.
The two most common are:
* match 0 or more characters
+ match 1 or more characters
“\w*” means “match 0 or more word characters”, and “\w+” means “match 1 or more word characters”.
Let’s use these new wildcards to match some text. Say we have these two strings:
cat
san-dc01
I want one regex pattern that will match both strings. Let’s match “cat” first. The regex we used previously:
\w\w\w
matches the string, so you can see that using this wildcard would work, too:
\w+
Now, let’s look at matching “san-dc01”. I can use this:
\w+-\w+
This means “match as many word characters as there are, followed by a dash, and then followed by as many word characters as there are”. However, while this matches “san-dc01”, it does not match “cat”. The string “cat” has no “-” followed by characters.
The regex we added, “-\w+”, only matches a string if the “-” character is part of the string. In addition, “\w+” means “match one or more numbers”. In other words, “\w+” means “match at least one word character up to as many as there are”. As such, we need to use “\w*” here instead to specify that the “dc01” part of the string might not always exist. We also need to use “-*” to specify that the “-” might not always exist in the string we need to match, either.
Therefore, this should work to parse both strings:
\w+-*\w*
By now, you may have noticed something else important about regex: There are usually many different patterns that will match the same text.
Sometimes, I find that people get snooty about their regex, and these people might mock you if they think you could have crafted a shorter pattern or a more efficient one. A pox on their house! Don’t worry about that right now. It’s more important that your regex pattern works than it is that it be short or impressively intricate.
Let’s look at another way to match our strings: You can use a character class for matching.
The character class is defined by using the square brackets “[“ and “]”. It simply means you want regex to match anything included in your defined class.
This is easier than it sounds! Since our strings “cat” and “san-dc01” contain characters that match either “\w” or the literal “-”, our character class is “[\w-]”.
Now, we can use the “+” to specify that our string has one or more characters from the character class:
[\w-]+
Additional Regular Expressions for Log Parsing
Besides “\w” and “\d”, I have a few more regular expressions I want you to pay close attention to. The first one is “\s”, which is how you match whitespaces.
“\s” will match any whitespace character, and “\s+” will match one or more whitespace characters.
Next, remember that the dot (“.”) will match any character. The dot becomes especially powerful when you combine it with the star (“*”). Remember: The star means to match 0 or more characters. Therefore, the “dot star” (“.*”) will match any characters as many times as they appear, including matching nothing. In other words, “.*” matches anything.
Finally, let’s look at special uses of the circumflex character, which is often just called the hat (“^”).
The hat has two completely different uses, which should not be confused. First, when used by itself, the hat in regex designates where the beginning of the line starts. For example, “^\w+” means that the line must start with a word.
The second use of the hat is when it appears in a character class. If you use the hat character when defining a character class, it means “everything except” as in “match everything except these characters”. In other words, “[\d]+” would match any digit character, while “[^\d]+” means to do the opposite or match everything except for any digit character!
Log Parsing Examples
Let’s go back to where we started, trying to parse out the msg field from our logs:
May 10 12:43:12 SECRETSERVERHOST CEF:0|Thycotic Software|Secret Server|10.9.000002|500|System Log|7|msg=The server could not be contacted. rt=May 10 2021 12:43:12
May 10 12:43:41 SECRETSERVERHOST CEF:0|Thycotic Software|Secret Server|10.9.000002|500|System Log|7|msg=The RPC Server is unavailable. rt=May 10 2021 12:43:41
Have you copied and pasted these log lines into your regex tester? If not, go ahead and do so now.
We need to parse a literal string “msg=”. These literals in log lines are often the “key” part of a key-value pair and are sometimes called anchors instead of literals, since they are the same in every log line. To parse them, you would usually specify the literal string to match on.
Next, we need to read the value that follows. You have a few different approaches you can use here. A common way to parse the value is to read everything that follows until the next literal or anchor. Remember: There are many ways to do this, but your regex might look like this:
msg=.*rt=
By the way, if you are familiar with regex, you know that the greedy “*” creates inefficient parsing rules, but let’s not worry too much about that right now. The skinny on this, however, is that you should never use the dot star (“.*”) for parsing rules. It is useful for searches and trying to figure out log structure, though.
Another way to read the value is to use a character class:
msg=[\w\s\.]+rt=
Let’s break the character class down to determine exactly what is specified. “\w” means match any word character. “\s” means to match any space. We also need to match a literal period, since that appears in the msg value, but the period or dot has a special meaning in regex. When characters have special meaning in regex, like the slashes, brackets, dot, etc, they need to be “escaped”, which you do by putting a backslash (“\”) in front of them. Therefore, to match the period, we need to use “\.” in the character class.
Remember: Defining a character class means you want to match any character defined in the class, and the “+” at the end of the class means to “match one or more of these characters”. In that case, “[\w\s\.]+” means “match any word character, any space, or a period as many times as it occurs”. The matching will stop when the next character in the sequence is not a word character, a space, or a period OR when the next part of the regex is matched. The next part of the regex is the literal string “rt=”, so the regex will extract the “[\w\s\.]+” characters until it gets to “rt=”.
Finally, there is just one more regex syntax that is helpful to understand when using regex with InsightIDR, and that is the use of capture groups. A capture group is how you define key names in regex. Capture groups are actually much more than this, but let’s narrow our focus to just what we need to know for using them with InsightIDR. To specify a named capture group for our purposes, use this syntax:
(?P<keyname>putyourregexhere)
The regex you put into the capture group is what is used to read the value that is going to match the “keyname”. Let’s see how this works with our logs.
Say we have some logs in key-value pair (KVP) format, and we want to both define and parse out the “msg” key. We know this regex works to match our logs: “msg=[\w\s\.]+rt=”. Now, we need to take this one step further and define the “msg” key and its values. We can do that with a named capture group:
msg=(?P<msg>[\w\s\.]+)rt
Let’s break this down. We want to read in the literal string “msg=” and then place everything after it into a capture group, stopping at the literal string “rt=”. The capture group defines the key, which you can also think of as a “field name”, as “msg”: “(?P<msg>”.
If we wanted to parse the field name as something else, we could specify that in between the “<>”. For example, if we wanted the field name to be “message” instead of “msg”, we would use: “(?P<message>”.
The regex that follows is what we want to read for the value part of our key-value pair. In other words, it is what we want to extract for the “msg”. We already know from our previous work that the character class “[\w\s\.]” matches our logs, so that’s what is used for this regex.
In this blog, we explored the regex syntax we need for InsightIDR and used a generic tool to test our regular expressions. In the next blog, we’ll use what we covered here to write our own parsing rules in InsightIDR using the Custom Parsing Tool in Regex Editor mode.
The Gartner Magic Quadrant reports provide a matrix for evaluating technology vendors in a given space. The framework looks at vendors on two axes: completeness of vision and ability to execute. In the case of SIEM, “Gartner defines the security and information event management (SIEM) market by the customer’s need to analyze event data in real time for early detection of targeted attacks and data breaches, and to collect, store, investigate and report on log data for incident response, forensics and regulatory compliance.”
As the detection and response market becomes more competitive, and the demands and challenges of this space grow more complex, we are honored to be recognized as one of the 6 2021 Magic Quadrant Leaders named in this report. We believe we are recognized for our usability and customer experience, as these are areas we’ve invested heavily in and recognize as critical to the success of today’s detection and response programs.
First and foremost, we want to thank our Rapid7 InsightIDR customers and partners for being on this journey with us. Your ongoing feedback, partnership, and trust have fueled our innovation and uncompromising commitment to delivering sophisticated security outcomes that are accessible to all.
Accelerated change escalates challenges around modern detection and response
The last year has brought a swell of change for many organizations, including rapid cloud adoption, increased use of web applications, a significant shift to remote working, and new threats brought on by attackers exploiting circumstances around the pandemic. While these challenges weren’t new, their increased urgency highlighted cracks in an already fragile security ecosystem:
Increased cybersecurity demands widened the already growing skills gap
Uptime trumped security, often leaving SecOps professionals scrambling to keep up
The combination of these stresses drove many teams to a breaking point with alert fatigue
These market dynamics prompted a lot of Security Operations Center (SOC) teams to reevaluate current processes and systems, and push for change.
Rapid7 InsightIDR helps teams focus on what matters most to drive effective threat detection and response across modern IT environments
Our approach to detection and response has always been directed by what we hear from customers. This includes industry engagement and insights gathered through Rapid7’s research and open source communities, our firsthand experience with Rapid7 MDR (Managed Detection and Response) and services engagements, and of course, direct customer feedback. These collective learnings have enabled us to deeply understand the challenges facing SOC teams today, and pushed us to develop innovative solutions to anticipate and address their needs.
Rapid7 InsightIDR is not another log-aggregation-focused SIEM that sits on the shelf, or one that leaves the difficult and tedious work for security analysts to figure out on their own. Rather, our focus has always been to provide immediate, actionable insights and alerts that teams can feel confident responding to so they can extinguish threats quickly. With Rapid7 InsightIDR, security analysts are no longer fighting just to keep up. They’re empowered to scale and transform their security programs, however and wherever their environments evolve.
We are thrilled about this recognition, but like everything in cybersecurity, what’s most exciting is what happens next. We are committed to continually raising the bar and making it easier for SOC teams to accelerate their detection and response programs, while removing the distractions and noise that get in the way. Thank you again to our customers and partners for joining this journey with us. And stay tuned for more updates ahead soon!
"InsightIDR is my favorite SIEM because the preloaded detections for attacker tactics and techniques. The threat community within the platform is always providing new detections for IOCs. The team is always pleasant to work with, and I love all the feature updates we received this year!" – Information Security Engineer ★★★★★
This graphic was published by Gartner, Inc. as part of a larger research document and should be evaluated in the context of the entire document. The Gartner document is available upon request from Rapid7.
Gartner does not endorse any vendor, product or service depicted in its research publications, and does not advise technology users to select only those vendors with the highest ratings or other designation. Gartner research publications consist of the opinions of Gartner’s research organization and should not be construed as statements of fact. Gartner disclaims all warranties, expressed or implied, with respect to this research, including any warranties of merchantability or fitness for a particular purpose. Gartner Magic Quadrant for Security Information and Event Management (SIEM), Kelly Kavanagh, Toby Bussa, John Collins, 29 June 2021.
This entry will be the last in our series based on The 4 Levels of Automated Remediation. After the previous 3 steps—where we discussed everything from logging to best practices to account hygiene—it’s time to talk about the actions that really let you calibrate and control the kind of remediation you’re looking to get out of the process. We’ll once again use AWS as our case study and jumping-off point for keeping your cloud environments clean and (as) free (as possible) of misconfigurations at this “classic” level of automated remediation.
Key off on APIs
Deactivate them. If they’re old, that is. Since API keys essentially authenticate traffic for 2 things that really need to talk to each other, it’s a good rule of thumb to regularly and continually “rotate” your API keys so that anyone—or anything—with malicious intent is kept guessing. This is probably the most obvious hygiene action we’ll discuss here. The AWS Secrets Manager platform enables:
Creation and protection of “secrets” that manage API keys
Rotation of API keys
Auditing of credential rotation for your cloud resources
Scheduled/automatic rotation of keys, aka secrets
Delete the nondescriptors
Those newly provisioned Security Group (SG) rules may not have a description. Why would that be? When found, it doesn’t really matter. They’re liabilities and they should be deleted. SG rules allow you to really get into the fine-grained nitty gritty of control over the traffic moving in and out of instances on your cloud infrastructure.
If an SG rule is indeed newly provisioned and lacks a descriptor, odds are it isn’t a priority and workflow isn’t dependent on it. Security Group rules are supposed to simplify operations, so if it does the opposite of that by being a mystery, then simplify it by getting rid of it.
Tear up the untagged
More to the point, it’s another good hygiene rule of thumb to delete instances that aren’t properly tagged. The whole point of tagging, much like adding descriptions, is to quickly categorize and find all of your many resources. Thus, if something isn’t tagged as it should be or you stumble upon an instance that is wholly untagged, then it’s time for it to go. But as stated in this AWS tagging guide, you must be specific about your deletion process:
You can’t terminate, stop, or delete a resource based solely on its tags; you must specify the resource identifier. For example, to delete snapshots that you tagged with a tag key called DeleteMe, you must use the DeleteSnapshots action with the resource identifiers of the snapshots, such as snap-1234567890abcdef0.
Privatize public buckets
As AWS also states, new S3 buckets do not allow public access. However, much like the context surrounding the suggestions above, somewhere along the way public access was granted for one reason or another, and vulnerabilities were created. So here’s another good hygiene rule of thumb: zero out Access Control Lists (ACLs); they’re what you would use to grant public access to buckets. It’s also a good idea to activate all “block public access” settings.
Ready to rock (automated) remediation?
If your team is ready to activate automated remediation, good for you. Learning all 4 levels of automated remediation will also allow your organization to gradually become acquainted with the process and ultimately strengthen your cloud security.
At a quick glance, it seems like the title of this blog is “government hygiene.” Most likely, that wouldn’t be a particularly exciting read, but we’re hoping you might be engaged enough to gain a few takeaways from this fourth piece in our series on automating remediation and how it can benefit your team and cost center.
The best way to mold a solution that makes sense for your company and cloud security is by adding actions that cause the fewest deviations in your day-to-day operations. Of course, there are several best-practice use cases that can make sense for your organization. Let’s take a look at a few so you can decide which one(s) work(s) for you.
Environment enforcement
Sandboxes are designed to be safe spaces, so they should also be clean spaces. As Software Development Life Cycles (SDLC) accelerate and security posture moves increasingly left into the hands of the developers spinning things up, it’s important to not only isolate and lock down your sandbox space, but to create a repeat cleaning schedule. Your software release cycle can also act as regularly scheduled sandbox maintenance.
No exemptions for expensive instances
Spinning up instances that suck up resources from other critical applications can cost you. Sometimes they’re necessary, often they’re not. Whether it’s by cost, family type, or hardware specs, continuous monitoring is key so that even when unnecessarily resource-intensive processes aren’t automatically killed, you still have a good idea of what’s costing too much time and too much money. AWS CloudWatch, for instance, can help you monitor EC2 instances by stopping and starting them at scheduled intervals.
Cleanliness ≠ costliness
Properly automating anything in cloud security is ultimately going to save money for the organization. But, as we’ve discussed to some extent above and throughout this series, you’ll want to make sure automation isn’t creating unnecessary instances, orphaning outdated resources, or stagnating old snapshots and unused databases. Yep, there are a lot of things that can start to add up and begin puffing out a budget. Creating more efficient data pipelines and discovering which parts of the remediation process are the most labor-intensive can help identify where you should focus effort and resources. In this way, you can begin to target those areas that will require the most regular hygiene and cleanup.
Put a cork in the port (exposure)
Since everything on the internet is communicated and transferred via ports, it’s probably a good idea to think about locking down exposed ports that may be running protocols like Secure Shell (SSH) or Remote Desktop (RDP). Automating this type of cleanup will require knowing, similar to the above section, which ports do most of the heavy lifting in the daily rhythms of your cloud -security operations. If a port isn’t being used in a meaningful way — or you simply don’t have any idea what its use is — best to shut it down.
Stay vigilant while basking in benefits
Ensuring you’re getting the most organized automation framework as possible takes work, but it’s considerably less work than if you had no framework at all. Automating good governance and hygiene practices can add time saved to the overall benefits gained from this work. But, we must all be good monitors of these processes and put checks in place to ensure your automation framework actually works for you and continues to save time and effort for years to come.
With that, we’re ready for a deep-dive into the final of 4 Levels of Automated Remediation. You can also read the previous entry in this series here.
In an effort to save time (and your sanity) I’ve created the following graph to illustrate the differences between the different kill chains:
What’s the bottom line? To paraphrase a line from the film The Gentlemen, “for (almost) every use case there is a kill chain, and for every kill chain a strategy.” Focused on malware defense or security awareness? The Cyber Kill Chain is worth a look. Need to assess your operational capabilities? MITRE ATT&CK. Looking to accurately model the behavior of attackers? Unified Kill Chain is “the way” (#mandalorian).
The Future
The kill chains of today (Lockheed Martin Cyber Kill Chain, MITRE ATT&CK, Unified Kill Chain) can trace their origins to a model first proposed by the military in the late 1990’s known as F2T2EA (find, fix, track, target, engage, and assess). However, as we all know, attackers and their attacks evolve over time—and the rate at which they are evolving continues to accelerate. Since our kill chains evolved from military strategy, it only makes sense to look at what’s happened in military strategy since the 90s to get a glimpse of where the evolution of the cyber kill chains may be heading.
A newer model used by special operators is F3EAD (find, fix, finish, exploit, analyze, and disseminate). Let’s take a quick look at how this applies to cyber operations:
Find: Ask “who, what, where, when, why” when looking at an event
Fix: Verify what was discovered in the previous phase (true positive / false positive)
Finish: Use the information from the previous 2 phases to determine a course of action and degrade/eliminate the threat
Exploit: Identify IOCs using information from the previous phases
Analyze: Fuse your self-generated intelligence with third-party sources to identify any additional anomalous activity occurring in the environment
Disseminate: Distribute the results of the previous phases within the Security Operations Center (SOC) and to additional key stakeholders
One thing missing from the F3EAD model when applied to cyber operations is the inclusion of automation, aka Security Orchestration and Automation and Response (SOAR). The gains in efficiency can greatly increase the speed at which the finish, exploit, and analyze phases can be completed. The first two phases, find and fix, are something I believe still requires the human touch due to the “fuzzy” (aka contextual) nature of events occurring within an organization.
The TLDR of the above? The future of kill chains must include the fusion of intelligence and automation without removing the human element from the equation. Until the equivalent of Skynet is invented, e.g. a truly sentient version of artificial intelligence capable of thinking in abstract ways, the “gut feeling” an analyst or incident responder gets when examining data will continue to be an advantage for us regular humans. Pairing this with the unmatched efficiency and speed gained by utilizing SOAR = winning!
The Verdict
Kill chains represent a comprehensive way to think about and visualize cyber attacks. Being able to communicate using a common lexicon (i.e. the terms and concepts in a kill chain) is critical to helping all levels of your organization understand the importance of security. However, I fear another fracturing of our lexicon will occur as more and newer versions of kill chains are introduced. Additionally, there appears to be an overreliance on only detecting and preventing the Tactics, Techniques, and Procedures (TTPs) found within these frameworks. Attackers have proven to be incredibly creative and endlessly resourceful, so their TTPs are going to change and evolve in ways we cannot yet imagine. This doesn’t mean we should discount the importance of using kill chains as part of our toolkit, but it should remain a part of our kit, and not the gold standard by which we judge the effectiveness of the security programs we have created.
——————
Jeffrey Gardner, Practice Advisor for Detection and Response at Rapid7, recently presented a deep dive into all things kill chain. In it, he discusses how these methodologies can help your security organization cut down on threats and drastically reduce breach response times. You can also read the previous entries in this series for a general overview of kill chains and the specific frameworks we’ve discussed.
To provide the best experiences, we use technologies like cookies to store and/or access device information. Consenting to these technologies will allow us to process data such as browsing behavior or unique IDs on this site. Not consenting or withdrawing consent, may adversely affect certain features and functions.
Functional
Always active
The technical storage or access is strictly necessary for the legitimate purpose of enabling the use of a specific service explicitly requested by the subscriber or user, or for the sole purpose of carrying out the transmission of a communication over an electronic communications network.
Preferences
The technical storage or access is necessary for the legitimate purpose of storing preferences that are not requested by the subscriber or user.
Statistics
The technical storage or access that is used exclusively for statistical purposes.The technical storage or access that is used exclusively for anonymous statistical purposes. Without a subpoena, voluntary compliance on the part of your Internet Service Provider, or additional records from a third party, information stored or retrieved for this purpose alone cannot usually be used to identify you.
Marketing
The technical storage or access is required to create user profiles to send advertising, or to track the user on a website or across several websites for similar marketing purposes.
![[The Lost Bots] Bonus Episode: Velociraptor Contributor Competition](https://blog.rapid7.com/content/images/2021/08/-The-Lost-Bots--Episode-1--External-Threat-Intelligence.jpeg)
![[The Lost Bots] Bonus Episode: Velociraptor Contributor Competition](https://play.vidyard.com/tC7WWX8eRJPYnf9uMaGdum.jpg)
![[The Lost Bots] Episode 3: Stories From the SOC](https://blog.rapid7.com/content/images/2021/08/-The-Lost-Bots--Episode-1--External-Threat-Intelligence.jpg)
![[The Lost Bots] Episode 3: Stories From the SOC](https://play.vidyard.com/rsZ9K24A4WTaHncmaZv4rr.jpg)


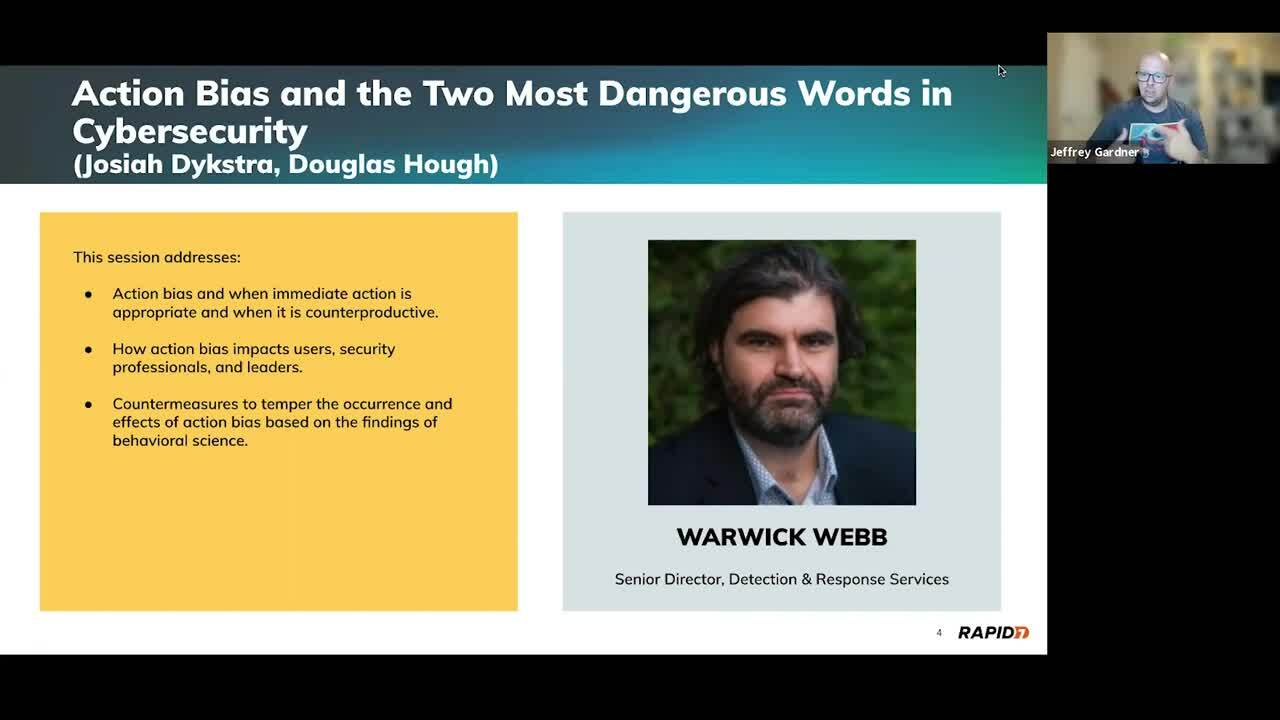
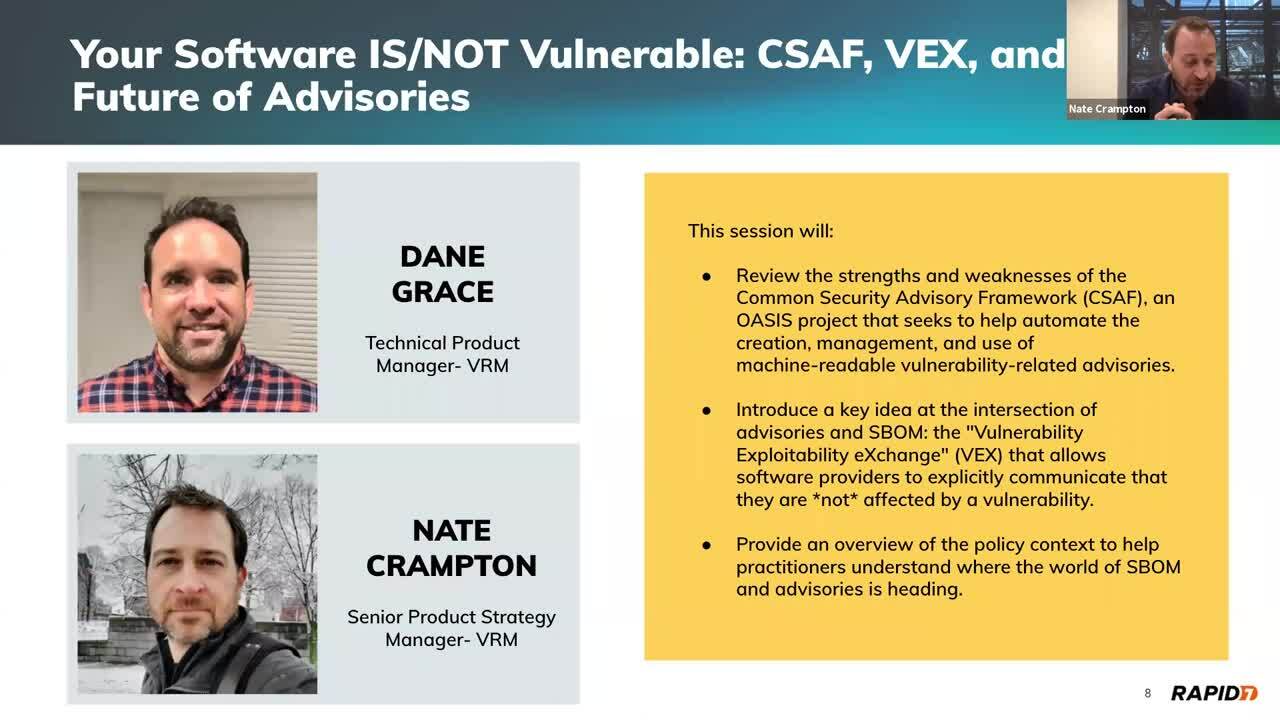


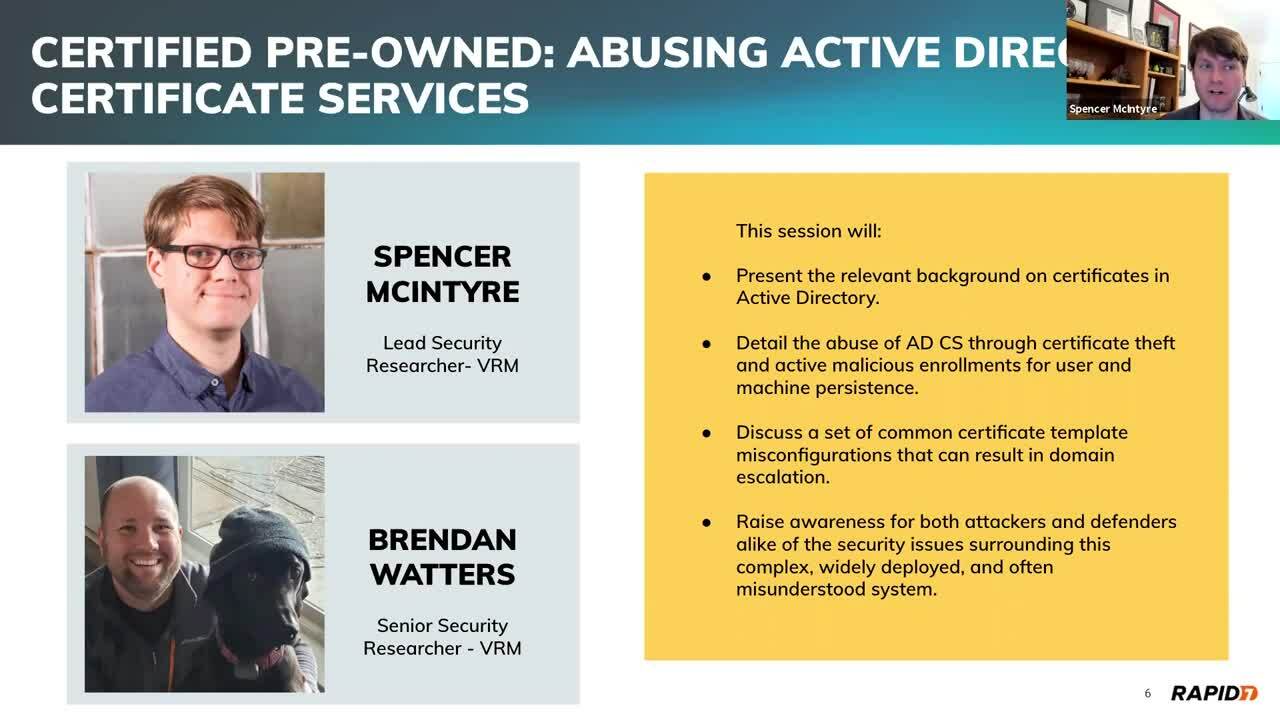


![[The Lost Bots] Episode 1: External Threat Intelligence](https://blog.rapid7.com/content/images/2021/07/-The-Lost-Bots--Episode-1--External-Threat-Intelligence.png)
![[The Lost Bots] Episode 1: External Threat Intelligence](https://play.vidyard.com/CWfxAaUmZV248bvr4yKaK2.jpg)