Tag Archives: DevSecOps

Strengthen the DevOps pipeline and protect data with AWS Secrets Manager, AWS KMS, and AWS Certificate Manager

Post Syndicated from Magesh Dhanasekaran original https://aws.amazon.com/blogs/security/strengthen-the-devops-pipeline-and-protect-data-with-aws-secrets-manager-aws-kms-and-aws-certificate-manager/

In this blog post, we delve into using Amazon Web Services (AWS) data protection services such as Amazon Secrets Manager, AWS Key Management Service (AWS KMS), and AWS Certificate Manager (ACM) to help fortify both the security of the pipeline and security in the pipeline. We explore how these services contribute to the overall security of the DevOps pipeline infrastructure while enabling seamless integration of data protection measures. We also provide practical insights by demonstrating the implementation of these services within a DevOps pipeline for a three-tier WordPress web application deployed using Amazon Elastic Kubernetes Service (Amazon EKS).

DevOps pipelines involve the continuous integration, delivery, and deployment of cloud infrastructure and applications, which can store and process sensitive data. The increasing adoption of DevOps pipelines for cloud infrastructure and application deployments has made the protection of sensitive data a critical priority for organizations.

Some examples of the types of sensitive data that must be protected in DevOps pipelines are:

  • Credentials: Usernames and passwords used to access cloud resources, databases, and applications.
  • Configuration files: Files that contain settings and configuration data for applications, databases, and other systems.
  • Certificates: TLS certificates used to encrypt communication between systems.
  • Secrets: Any other sensitive data used to access or authenticate with cloud resources, such as private keys, security tokens, or passwords for third-party services.

Unintended access or data disclosure can have serious consequences such as loss of productivity, legal liabilities, financial losses, and reputational damage. It’s crucial to prioritize data protection to help mitigate these risks effectively.

The concept of security of the pipeline encompasses implementing security measures to protect the entire DevOps pipeline—the infrastructure, tools, and processes—from potential security issues. While the concept of security in the pipeline focuses on incorporating security practices and controls directly into the development and deployment processes within the pipeline.

By using Secrets Manager, AWS KMS, and ACM, you can strengthen the security of your DevOps pipelines, safeguard sensitive data, and facilitate secure and compliant application deployments. Our goal is to equip you with the knowledge and tools to establish a secure DevOps environment, providing the integrity of your pipeline infrastructure and protecting your organization’s sensitive data throughout the software delivery process.

Sample application architecture overview

WordPress was chosen as the use case for this DevOps pipeline implementation due to its popularity, open source nature, containerization support, and integration with AWS services. The sample architecture for the WordPress application in the AWS cloud uses the following services:

  • Amazon Route 53: A DNS web service that routes traffic to the correct AWS resource.
  • Amazon CloudFront: A global content delivery network (CDN) service that securely delivers data and videos to users with low latency and high transfer speeds.
  • AWS WAF: A web application firewall that protects web applications from common web exploits.
  • AWS Certificate Manager (ACM): A service that provides SSL/TLS certificates to enable secure connections.
  • Application Load Balancer (ALB): Routes traffic to the appropriate container in Amazon EKS.
  • Amazon Elastic Kubernetes Service (Amazon EKS): A scalable and highly available Kubernetes cluster to deploy containerized applications.
  • Amazon Relational Database Service (Amazon RDS): A managed relational database service that provides scalable and secure databases for applications.
  • AWS Key Management Service (AWS KMS): A key management service that allows you to create and manage the encryption keys used to protect your data at rest.
  • AWS Secrets Manager: A service that provides the ability to rotate, manage, and retrieve database credentials.
  • AWS CodePipeline: A fully managed continuous delivery service that helps to automate release pipelines for fast and reliable application and infrastructure updates.
  • AWS CodeBuild: A fully managed continuous integration service that compiles source code, runs tests, and produces ready-to-deploy software packages.
  • AWS CodeCommit: A secure, highly scalable, fully managed source-control service that hosts private Git repositories.

Before we explore the specifics of the sample application architecture in Figure 1, it’s important to clarify a few aspects of the diagram. While it displays only a single Availability Zone (AZ), please note that the application and infrastructure can be developed to be highly available across multiple AZs to improve fault tolerance. This means that even if one AZ is unavailable, the application remains operational in other AZs, providing uninterrupted service to users.

Figure 1: Sample application architecture

Figure 1: Sample application architecture

The flow of the data protection services in the post and depicted in Figure 1 can be summarized as follows:

First, we discuss securing your pipeline. You can use Secrets Manager to securely store sensitive information such as Amazon RDS credentials. We show you how to retrieve these secrets from Secrets Manager in your DevOps pipeline to access the database. By using Secrets Manager, you can protect critical credentials and help prevent unauthorized access, strengthening the security of your pipeline.

Next, we cover data encryption. With AWS KMS, you can encrypt sensitive data at rest. We explain how to encrypt data stored in Amazon RDS using AWS KMS encryption, making sure that it remains secure and protected from unauthorized access. By implementing KMS encryption, you add an extra layer of protection to your data and bolster the overall security of your pipeline.

Lastly, we discuss securing connections (data in transit) in your WordPress application. ACM is used to manage SSL/TLS certificates. We show you how to provision and manage SSL/TLS certificates using ACM and configure your Amazon EKS cluster to use these certificates for secure communication between users and the WordPress application. By using ACM, you can establish secure communication channels, providing data privacy and enhancing the security of your pipeline.

Note: The code samples in this post are only to demonstrate the key concepts. The actual code can be found on GitHub.

Securing sensitive data with Secrets Manager

In this sample application architecture, Secrets Manager is used to store and manage sensitive data. The AWS CloudFormation template provided sets up an Amazon RDS for MySQL instance and securely sets the master user password by retrieving it from Secrets Manager using KMS encryption.

Here’s how Secrets Manager is implemented in this sample application architecture:

  1. Creating a Secrets Manager secret.
    1. Create a Secrets Manager secret that includes the Amazon RDS database credentials using CloudFormation.
    2. The secret is encrypted using an AWS KMS customer managed key.
    3. Sample code:
      RDSMySQL:
          Type: AWS::RDS::DBInstance
          Properties: 
      		ManageMasterUserPassword: true
      		MasterUserSecret:
              		KmsKeyId: !Ref RDSMySqlSecretEncryption

    The ManageMasterUserPassword: true line in the CloudFormation template indicates that the stack will manage the master user password for the Amazon RDS instance. To securely retrieve the password for the master user, the CloudFormation template uses the MasterUserSecret parameter, which retrieves the password from Secrets Manager. The KmsKeyId: !Ref RDSMySqlSecretEncryption line specifies the KMS key ID that will be used to encrypt the secret in Secrets Manager.

    By setting the MasterUserSecret parameter to retrieve the password from Secrets Manager, the CloudFormation stack can securely retrieve and set the master user password for the Amazon RDS MySQL instance without exposing it in plain text. Additionally, specifying the KMS key ID for encryption adds another layer of security to the secret stored in Secrets Manager.

  2. Retrieving secrets from Secrets Manager.
    1. The secrets store CSI driver is a Kubernetes-native driver that provides a common interface for Secrets Store integration with Amazon EKS. The secrets-store-csi-driver-provider-aws is a specific provider that provides integration with the Secrets Manager.
    2. To set up Amazon EKS, the first step is to create a SecretProviderClass, which specifies the secret ID of the Amazon RDS database. This SecretProviderClass is then used in the Kubernetes deployment object to deploy the WordPress application and dynamically retrieve the secrets from the secret manager during deployment. This process is entirely dynamic and verifies that no secrets are recorded anywhere. The SecretProviderClass is created on a specific app namespace, such as the wp namespace.
    3. Sample code:
      apiVersion: secrets-store.csi.x-k8s.io/v1
      kind: SecretProviderClass
      spec:
        provider: aws
        parameters:
          objects: |
              - objectName: 'rds!db-0x0000-0x0000-0x0000-0x0000-0x0000'
      

When using Secrets manager, be aware of the following best practices for managing and securing Secrets Manager secrets:

  • Use AWS Identity and Access Management (IAM) identity policies to define who can perform specific actions on Secrets Manager secrets, such as reading, writing, or deleting them.
  • Secrets Manager resource policies can be used to manage access to secrets at a more granular level. This includes defining who has access to specific secrets based on attributes such as IP address, time of day, or authentication status.
  • Encrypt the Secrets Manager secret using an AWS KMS key.
  • Using CloudFormation templates to automate the creation and management of Secrets Manager secrets including rotation.
  • Use AWS CloudTrail to monitor access and changes to Secrets Manager secrets.
  • Use CloudFormation hooks to validate the Secrets Manager secret before and after deployment. If the secret fails validation, the deployment is rolled back.

Encrypting data with AWS KMS

Data encryption involves converting sensitive information into a coded form that can only be accessed with the appropriate decryption key. By implementing encryption measures throughout your pipeline, you make sure that even if unauthorized individuals gain access to the data, they won’t be able to understand its contents.

Here’s how data at rest encryption using AWS KMS is implemented in this sample application architecture:

  1. Amazon RDS secret encryption
    1. Encrypting secrets: An AWS KMS customer managed key is used to encrypt the secrets stored in Secrets Manager to ensure their confidentiality during the DevOps build process.
    2. Sample code:
      RDSMySQL:
          Type: AWS::RDS::DBInstance
          Properties:
            ManageMasterUserPassword: true
            MasterUserSecret:
              KmsKeyId: !Ref RDSMySqlSecretEncryption
      
      RDSMySqlSecretEncryption:
          Type: "AWS::KMS::Key"
          Properties:
            KeyPolicy:
              Id: rds-mysql-secret-encryption
              Statement:
                - Sid: Allow administration of the key
                  Effect: Allow
                  "Action": [
                      "kms:Create*",
                      "kms:Describe*",
                      "kms:Enable*",
                      "kms:List*",
                      "kms:Put*",
      					.
      					.
      					.
                  ]
                - Sid: Allow use of the key
                  Effect: Allow
                  "Action": [
                      "kms:Decrypt",
                      "kms:GenerateDataKey",
                      "kms:DescribeKey"
                  ]

  2. Amazon RDS data encryption
    1. Enable encryption for an Amazon RDS instance using CloudFormation. Specify the KMS key ARN in the CloudFormation stack and RDS will use the specified KMS key to encrypt data at rest.
    2. Sample code:
      RDSMySQL:
          Type: AWS::RDS::DBInstance
          Properties:
        KmsKeyId: !Ref RDSMySqlDataEncryption
              StorageEncrypted: true
      
      RDSMySqlDataEncryption:
          Type: "AWS::KMS::Key"
          Properties:
            KeyPolicy:
              Id: rds-mysql-data-encryption
              Statement:
                - Sid: Allow administration of the key
                  Effect: Allow
                  "Action": [
                      "kms:Create*",
                      "kms:Describe*",
                      "kms:Enable*",
                      "kms:List*",
                      "kms:Put*",
      .
      .
      .
                  ]
                - Sid: Allow use of the key
                  Effect: Allow
                  "Action": [
                      "kms:Decrypt",
                      "kms:GenerateDataKey",
                      "kms:DescribeKey"
                  ]

  3. Kubernetes Pods storage
    1. Use encrypted Amazon Elastic Block Store (Amazon EBS) volumes to store configuration data. Create a managed encrypted Amazon EBS volume using the following code snippet, and then deploy a Kubernetes pod with the persistent volume claim (PVC) mounted as a volume.
    2. Sample code:
      kind: StorageClass
      provisioner: ebs.csi.aws.com
      parameters:
        csi.storage.k8s.io/fstype: xfs
        encrypted: "true"
      
      kind: Deployment
      spec:
        volumes:      
            - name: persistent-storage
              persistentVolumeClaim:
                claimName: ebs-claim

  4. Amazon ECR
    1. To secure data at rest in Amazon Elastic Container Registry (Amazon ECR), enable encryption at rest for Amazon ECR repositories using the AWS Management Console or AWS Command Line Interface (AWS CLI). ECR uses AWS KMS to encrypt the data at rest.
    2. Create a KMS key for Amazon ECR and use that key to encrypt the data at rest.
    3. Automate the creation of encrypted ECR repositories and enable encryption at rest using a DevOps pipeline, use CodePipeline to automate the deployment of the CloudFormation stack.
    4. Define the creation of encrypted Amazon ECR repositories as part of the pipeline.
    5. Sample code:
      ECRRepository:
          Type: AWS::ECR::Repository
          Properties: 
            EncryptionConfiguration: 
              EncryptionType: KMS
              KmsKey: !Ref ECREncryption
      
      ECREncryption:
          Type: AWS::KMS::Key
          Properties:
            KeyPolicy:
              Id: ecr-encryption-key
              Statement:
                - Sid: Allow administration of the key
                  Effect: Allow
                  "Action": [
                      "kms:Create*",
                      "kms:Describe*",
                      "kms:Enable*",
                      "kms:List*",
                      "kms:Put*",
      .
      .
      .
       ]
                - Sid: Allow use of the key
                  Effect: Allow
                  "Action": [
                      "kms:Decrypt",
                      "kms:GenerateDataKey",
                      "kms:DescribeKey"
                  ]

AWS best practices for managing encryption keys in an AWS environment

To effectively manage encryption keys and verify the security of data at rest in an AWS environment, we recommend the following best practices:

  • Use separate AWS KMS customer managed KMS keys for data classifications to provide better control and management of keys.
  • Enforce separation of duties by assigning different roles and responsibilities for key management tasks, such as creating and rotating keys, setting key policies, or granting permissions. By segregating key management duties, you can reduce the risk of accidental or intentional key compromise and improve overall security.
  • Use CloudTrail to monitor AWS KMS API activity and detect potential security incidents.
  • Rotate KMS keys as required by your regulatory requirements.
  • Use CloudFormation hooks to validate KMS key policies to verify that they align with organizational and regulatory requirements.

Following these best practices and implementing encryption at rest for different services such as Amazon RDS, Kubernetes Pods storage, and Amazon ECR, will help ensure that data is encrypted at rest.

Securing communication with ACM

Secure communication is a critical requirement for modern environments and implementing it in a DevOps pipeline is crucial for verifying that the infrastructure is secure, consistent, and repeatable across different environments. In this WordPress application running on Amazon EKS, ACM is used to secure communication end-to-end. Here’s how to achieve this:

  1. Provision TLS certificates with ACM using a DevOps pipeline
    1. To provision TLS certificates with ACM in a DevOps pipeline, automate the creation and deployment of TLS certificates using ACM. Use AWS CloudFormation templates to create the certificates and deploy them as part of infrastructure as code. This verifies that the certificates are created and deployed consistently and securely across multiple environments.
    2. Sample code:
      DNSDomainCertificate:
          Type: AWS::CertificateManager::Certificate
          Properties:
            DomainName: !Ref DNSDomainName
            ValidationMethod: 'DNS'
      
      DNSDomainName:
          Description: dns domain name 
          TypeM: String
          Default: "example.com"

  2. Provisioning of ALB and integration of TLS certificate using AWS ALB Ingress Controller for Kubernetes
    1. Use a DevOps pipeline to create and configure the TLS certificates and ALB. This verifies that the infrastructure is created consistently and securely across multiple environments.
    2. Sample code:
      kind: Ingress
      metadata:
        annotations:
          alb.ingress.kubernetes.io/scheme: internet-facing
          alb.ingress.kubernetes.io/certificate-arn: arn:aws:acm:us-east-1:000000000000:certificate/0x0000-0x0000-0x0000-0x0000-0x0000
          alb.ingress.kubernetes.io/listen-ports: '[{"HTTPS":443}]'
          alb.ingress.kubernetes.io/security-groups:  sg-0x00000x0000,sg-0x00000x0000
      spec:
        ingressClassName: alb

  3. CloudFront and ALB
    1. To secure communication between CloudFront and the ALB, verify that the traffic from the client to CloudFront and from CloudFront to the ALB is encrypted using the TLS certificate.
    2. Sample code:
      CloudFrontDistribution:
          Type: AWS::CloudFront::Distribution
          Properties:
            DistributionConfig:
              Origins:
                - DomainName: !Ref ALBDNSName
                  Id: !Ref ALBDNSName
                  CustomOriginConfig:
                    HTTPSPort: '443'
                    OriginProtocolPolicy: 'https-only'
                    OriginSSLProtocols:
                      - LSv1
      	    ViewerCertificate:
      AcmCertificateArn: !Sub 'arn:aws:acm:${AWS::Region}:${AWS::AccountId}:certificate/${ACMCertificateIdentifier}'
                  SslSupportMethod:  'sni-only'
                  MinimumProtocolVersion: 'TLSv1.2_2021'
      
      ALBDNSName:
          Description: alb dns name
          Type: String
          Default: "k8s-wp-ingressw-x0x0000x000-x0x0000x000.us-east-1.elb.amazonaws.com"

  4. ALB to Kubernetes Pods
    1. To secure communication between the ALB and the Kubernetes Pods, use the Kubernetes ingress resource to terminate SSL/TLS connections at the ALB. The ALB sends the PROTO metadata http connection header to the WordPress web server. The web server checks the incoming traffic type (http or https) and enables the HTTPS connection only hereafter. This verifies that pod responses are sent back to ALB only over HTTPS.
    2. Additionally, using the X-Forwarded-Proto header can help pass the original protocol information and help avoid issues with the $_SERVER[‘HTTPS’] variable in WordPress.
    3. Sample code:
      define('WP_HOME','https://example.com/');
      define('WP_SITEURL','https://example.com/');
      
      define('FORCE_SSL_ADMIN', true);
      if (isset($_SERVER['HTTP_X_FORWARDED_PROTO']) && strpos($_SERVER['HTTP_X_FORWARDED_PROTO'], 'https') !== false) {
          $_SERVER['HTTPS'] = 'on';

  5. Kubernetes Pods to Amazon RDS
    1. To secure communication between the Kubernetes Pods in Amazon EKS and the Amazon RDS database, use SSL/TLS encryption on the database connection.
    2. Configure an Amazon RDS MySQL instance with enhanced security settings to verify that only TLS-encrypted connections are allowed to the database. This is achieved by creating a DB parameter group with a parameter called require_secure_transport set to ‘1‘. The WordPress configuration file is also updated to enable SSL/TLS communication with the MySQL database. Then enable the TLS flag on the MySQL client and the Amazon RDS public certificate is passed to ensure that the connection is encrypted using the TLS_AES_256_GCM_SHA384 protocol. The sample code that follows focuses on enhancing the security of the RDS MySQL instance by enforcing encrypted connections and configuring WordPress to use SSL/TLS for communication with the database.
    3. Sample code:
      RDSDBParameterGroup:
          Type: 'AWS::RDS::DBParameterGroup'
          Properties:
            DBParameterGroupName: 'rds-tls-custom-mysql'
            Parameters:
              require_secure_transport: '1'
      
      RDSMySQL:
          Type: AWS::RDS::DBInstance
          Properties:
            DBName: 'wordpress'
            DBParameterGroupName: !Ref RDSDBParameterGroup
      
      wp-config-docker.php:
      // Enable SSL/TLS between WordPress and MYSQL database
      define('MYSQL_CLIENT_FLAGS', MYSQLI_CLIENT_SSL);//This activates SSL mode
      define('MYSQL_SSL_CA', '/usr/src/wordpress/amazon-global-bundle-rds.pem');

In this architecture, AWS WAF is enabled at CloudFront to protect the WordPress application from common web exploits. AWS WAF for CloudFront is recommended and use AWS managed WAF rules to verify that web applications are protected from common and the latest threats.

Here are some AWS best practices for securing communication with ACM:

  • Use SSL/TLS certificates: Encrypt data in transit between clients and servers. ACM makes it simple to create, manage, and deploy SSL/TLS certificates across your infrastructure.
  • Use ACM-issued certificates: This verifies that your certificates are trusted by major browsers and that they are regularly renewed and replaced as needed.
  • Implement certificate revocation: Implement certificate revocation for SSL/TLS certificates that have been compromised or are no longer in use.
  • Implement strict transport security (HSTS): This helps protect against protocol downgrade attacks and verifies that SSL/TLS is used consistently across sessions.
  • Configure proper cipher suites: Configure your SSL/TLS connections to use only the strongest and most secure cipher suites.

Monitoring and auditing with CloudTrail

In this section, we discuss the significance of monitoring and auditing actions in your AWS account using CloudTrail. CloudTrail is a logging and tracking service that records the API activity in your AWS account, which is crucial for troubleshooting, compliance, and security purposes. Enabling CloudTrail in your AWS account and securely storing the logs in a durable location such as Amazon Simple Storage Service (Amazon S3) with encryption is highly recommended to help prevent unauthorized access. Monitoring and analyzing CloudTrail logs in real-time using CloudWatch Logs can help you quickly detect and respond to security incidents.

In a DevOps pipeline, you can use infrastructure-as-code tools such as CloudFormation, CodePipeline, and CodeBuild to create and manage CloudTrail consistently across different environments. You can create a CloudFormation stack with the CloudTrail configuration and use CodePipeline and CodeBuild to build and deploy the stack to different environments. CloudFormation hooks can validate the CloudTrail configuration to verify it aligns with your security requirements and policies.

It’s worth noting that the aspects discussed in the preceding paragraph might not apply if you’re using AWS Organizations and the CloudTrail Organization Trail feature. When using those services, the management of CloudTrail configurations across multiple accounts and environments is streamlined. This centralized approach simplifies the process of enforcing security policies and standards uniformly throughout the organization.

By following these best practices, you can effectively audit actions in your AWS environment, troubleshoot issues, and detect and respond to security incidents proactively.

Complete code for sample architecture for deployment

The complete code repository for the sample WordPress application architecture demonstrates how to implement data protection in a DevOps pipeline using various AWS services. The repository includes both infrastructure code and application code that covers all aspects of the sample architecture and implementation steps.

The infrastructure code consists of a set of CloudFormation templates that define the resources required to deploy the WordPress application in an AWS environment. This includes the Amazon Virtual Private Cloud (Amazon VPC), subnets, security groups, Amazon EKS cluster, Amazon RDS instance, AWS KMS key, and Secrets Manager secret. It also defines the necessary security configurations such as encryption at rest for the RDS instance and encryption in transit for the EKS cluster.

The application code is a sample WordPress application that is containerized using Docker and deployed to the Amazon EKS cluster. It shows how to use the Application Load Balancer (ALB) to route traffic to the appropriate container in the EKS cluster, and how to use the Amazon RDS instance to store the application data. The code also demonstrates how to use AWS KMS to encrypt and decrypt data in the application, and how to use Secrets Manager to store and retrieve secrets. Additionally, the code showcases the use of ACM to provision SSL/TLS certificates for secure communication between the CloudFront and the ALB, thereby ensuring data in transit is encrypted, which is critical for data protection in a DevOps pipeline.

Conclusion

Strengthening the security and compliance of your application in the cloud environment requires automating data protection measures in your DevOps pipeline. This involves using AWS services such as Secrets Manager, AWS KMS, ACM, and AWS CloudFormation, along with following best practices.

By automating data protection mechanisms with AWS CloudFormation, you can efficiently create a secure pipeline that is reproducible, controlled, and audited. This helps maintain a consistent and reliable infrastructure.

Monitoring and auditing your DevOps pipeline with AWS CloudTrail is crucial for maintaining compliance and security. It allows you to track and analyze API activity, detect any potential security incidents, and respond promptly.

By implementing these best practices and using data protection mechanisms, you can establish a secure pipeline in the AWS cloud environment. This enhances the overall security and compliance of your application, providing a reliable and protected environment for your deployments.

 
If you have feedback about this post, submit comments in the Comments section below. If you have questions about this post, contact AWS Support.

Want more AWS Security news? Follow us on Twitter.

Magesh Dhanasekaran

Magesh Dhanasekaran

Magesh has significant experience in the cloud security space especially in data protection, threat detection and security governance, risk & compliance domain. Magesh has a track record in providing Information Security consulting service to financial industry and government agencies in Australia. He is using his extensive experience in cloud security architecture, digital transformation, and secure application development practice to provide security advisory on AWS products and services to WWPS Federal Financial Customers. Magesh currently holds cybersecurity industry certifications such as ISC2’s CISSP, ISACA’s CISM, CompTIA Security+ and AWS Solution Architect / Security Specialty Certification.

Karna Thandapani

Karna Thandapani

Karna is a Cloud Consultant with extensive experience in DevOps/DevSecOps and application development activities as a Developer. Karna has in-depth knowledge and hands-on experience in the major AWS services (Cloudformation, EC2, Lambda, Serverless, Step Functions, Glue, API Gateway, ECS, EKS, LB, AutoScaling, Route53, etc.,)and holding Developer Associate, Solutions Architect Associate, and DevOps Engineer Professional.

Automate Cedar policy validation with AWS developer tools

Post Syndicated from Pontus Palmenäs original https://aws.amazon.com/blogs/security/automate-cedar-policy-validation-with-aws-developer-tools/

Cedar is an open-source language that you can use to authorize policies and make authorization decisions based on those policies. AWS security services including AWS Verified Access and Amazon Verified Permissions use Cedar to define policies. Cedar supports schema declaration for the structure of entity types in those policies and policy validation with that schema.

In this post, we show you how to use developer tools on AWS to implement a build pipeline that validates the Cedar policy files against a schema and runs a suite of tests to isolate the Cedar policy logic. As part of the walkthrough, you will introduce a subtle policy error that impacts permissions to observe how the pipeline tests catch the error. Detecting errors earlier in the development lifecycle is often referred to as shifting left. When you shift security left, you can help prevent undetected security issues during the application build phase.

Scenario

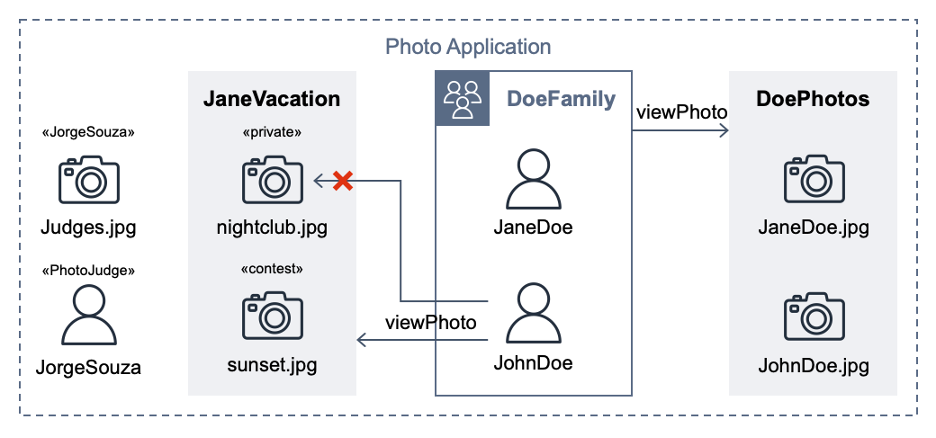
This post extends a hypothetical photo sharing application from the Cedar policy language in action workshop. By using that app, users organize their photos into albums and share them with groups of users. Figure 1 shows the entities from the photo application.

Figure 1: Photo application entities

Figure 1: Photo application entities

For the purpose of this post, the important requirements are that user JohnDoe has view access to the album JaneVacation, which contains two photos that user JaneDoe owns:

  • Photo sunset.jpg has a contest label (indicating that the role PhotoJudge has view access)
  • Photo nightclub.jpg has a private label (indicating that only the owner has access)

Cedar policies separate application permissions from the code that retrieves and displays photos. The following Cedar policy explicitly permits the principal of user JohnDoe to take the action viewPhoto on resources in the album JaneVacation.

permit (
  principal == PhotoApp::User::"JohnDoe",
  action == PhotoApp::Action::"viewPhoto",
  resource in PhotoApp::Album::"JaneVacation"
);

The following Cedar policy forbids non-owners from accessing photos labeled as private, even if other policies permit access. In our example, this policy prevents John Doe from viewing the nightclub.jpg photo (denoted by an X in Figure 1).

forbid (
  principal,
  action,
  resource in PhotoApp::Application::"PhotoApp"
)
when { resource.labels.contains("private") }
unless { resource.owner == principal };

A Cedar authorization request asks the question: Can this principal take this action on this resource in this context? The request also includes attribute and parent information for the entities. If an authorization request is made with the following test data, against the Cedar policies and entity data described earlier, the authorization result should be DENY.

{
  "principal": "PhotoApp::User::\"JohnDoe\"",
  "action": "PhotoApp::Action::\"viewPhoto\"",
  "resource": "PhotoApp::Photo::\"nightclub.jpg\"",
  "context": {}
}

The project test suite uses this and other test data to validate the expected behaviors when policies are modified. An error intentionally introduced into the preceding forbid policy lets the first policy satisfy the request and ALLOW access. That unexpected test result compared to the requirements fails the build.

Developer tools on AWS

With AWS developer tools, you can host code and build, test, and deploy applications and infrastructure. AWS CodeCommit hosts the Cedar policies and a test suite, AWS CodeBuild runs the tests, and AWS CodePipeline automatically runs the CodeBuild job when a CodeCommit repository state change event occurs.

In the following steps, you will create a pipeline, commit policies and tests, run a passing build, and observe how a policy error during validation fails a test case.

Prerequisites

To follow along with this walkthrough, make sure to complete the following prerequisites:

Set up the local environment

The first step is to set up your local environment.

To set up the local environment

  1. Using Git, clone the GitHub repository for this post:
  2. git clone [email protected]:aws-samples/cedar-policy-validation-pipeline.git

  3. Before you commit this source code to a CodeCommit repository, run the test suite locally; this can help you shorten the feedback loop. To run the test suite locally, choose one of the following options:
  4. Option 1: Install Rust and compile the Cedar CLI binary

    1. Install Rust by using the rustup tool.
    2. curl --proto '=https' --tlsv1.2 -sSf https://sh.rustup.rs | sh -s -- -y

    3. Compile the Cedar CLI (version 2.4.2) binary by using cargo.
    4. cargo install [email protected]

    5. Run the cedar_testrunner.sh script, which tests authorize requests by using the Cedar CLI.
    6. cd policystore/tests && ./cedar_testrunner.sh

    Option 2: Run the CodeBuild agent

    1. Locally evaluate the buildspec.yml inside a CodeBuild container image by using the codebuild_build.sh script from aws-codebuild-docker-images with the following parameters:
    2. ./codebuild_build.sh -i public.ecr.aws/codebuild/amazonlinux2-x86_64-standard:5.0 -a .codebuild

Project structure

The policystore directory contains one Cedar policy for each .cedar file. The Cedar schema is defined in the cedarschema.json file. A tests subdirectory contains a cedarentities.json file that represents the application data; its subdirectories (for example, album JaneVacation) represent the test suites. The test suite directories contain individual tests inside their ALLOW and DENY subdirectories, each with one or more JSON files that contain the authorization request that Cedar will evaluate against the policy set. A README file in the tests directory provides a summary of the test cases in the suite.

The cedar_testrunner.sh script runs the Cedar CLI to perform a validate command for each .cedar file against the Cedar schema, outputting either PASS or ERROR. The script also performs an authorize command on each test file, outputting either PASS or FAIL depending on whether the results match the expected authorization decision.

Set up the CodePipeline

In this step, you use AWS CloudFormation to provision the services used in the pipeline.

To set up the pipeline

  1. Navigate to the directory of the cloned repository.

    cd cedar-policy-validation-pipeline

  2. Create a new CloudFormation stack from the template.
    aws cloudformation deploy \
    --template-file template.yml \
    --stack-name cedar-policy-validation \
    --capabilities CAPABILITY_NAMED_IAM

  3. Wait for the message Successfully created/updated stack.

Invoke CodePipeline

The next step is to commit the source code to a CodeCommit repository, and then configure and invoke CodePipeline.

To invoke CodePipeline

  1. Add an additional Git remote named codecommit to the repository that you previously cloned. The following command points the Git remote to the CodeCommit repository that CloudFormation created. The CedarPolicyRepoCloneUrl stack output is the HTTPS clone URL. Replace it with CedarPolicyRepoCloneGRCUrl to use the HTTPS (GRC) clone URL when you connect to CodeCommit with git-remote-codecommit.

    git remote add codecommit $(aws cloudformation describe-stacks --stack-name cedar-policy-validation --query 'Stacks[0].Outputs[?OutputKey==`CedarPolicyRepoCloneUrl`].OutputValue' --output text)

  2. Push the code to the CodeCommit repository. This starts a pipeline run.

    git push codecommit main

  3. Check the progress of the pipeline run.
    aws codepipeline get-pipeline-execution \
    --pipeline-name cedar-policy-validation \
    --pipeline-execution-id $(aws codepipeline list-pipeline-executions --pipeline-name cedar-policy-validation --query 'pipelineExecutionSummaries[0].pipelineExecutionId' --output text) \
    --query 'pipelineExecution.status' --output text

The build installs Rust in CodePipeline in your account and compiles the Cedar CLI. After approximately four minutes, the pipeline run status shows Succeeded.

Refactor some policies

This photo sharing application sample includes overlapping policies to simulate a refactoring workflow, where after changes are made, the test suite continues to pass. The DoePhotos.cedar and JaneVacation.cedar static policies are replaced by the logically equivalent viewPhoto.template.cedar policy template and two template-linked policies defined in cedartemplatelinks.json. After you delete the extra policies, the passing tests illustrate a successful refactor with the same expected application permissions.

To refactor policies

  1. Delete DoePhotos.cedar and JaneVacation.cedar.
  2. Commit the change to the repository.
    git add .
    git commit -m "Refactor some policies"
    git push codecommit main

  3. Check the pipeline progress. After about 20 seconds, the pipeline status shows Succeeded.

The second pipeline build runs quicker because the build specification is configured to cache a version of the Cedar CLI. Note that caching isn’t implemented in the local testing described in Option 2 of the local environment setup.

Break the build

After you confirm that you have a working pipeline that validates the Cedar policies, see what happens when you commit an invalid Cedar policy.

To break the build

  1. Using a text editor, open the file policystore/Photo-labels-private.cedar.
  2. In the when clause, change resource.labels to resource.label (removing the “s”). This policy syntax is valid, but no longer validates against the Cedar schema.
  3. Commit the change to the repository.
    git add .
    git commit -m "Break the build"
    git push codecommit main

  4. Sign in to the AWS Management Console and open the CodePipeline console.
  5. Wait for the Most recent execution field to show Failed.
  6. Select the pipeline and choose View in CodeBuild.
  7. Choose the Reports tab, and then choose the most recent report.
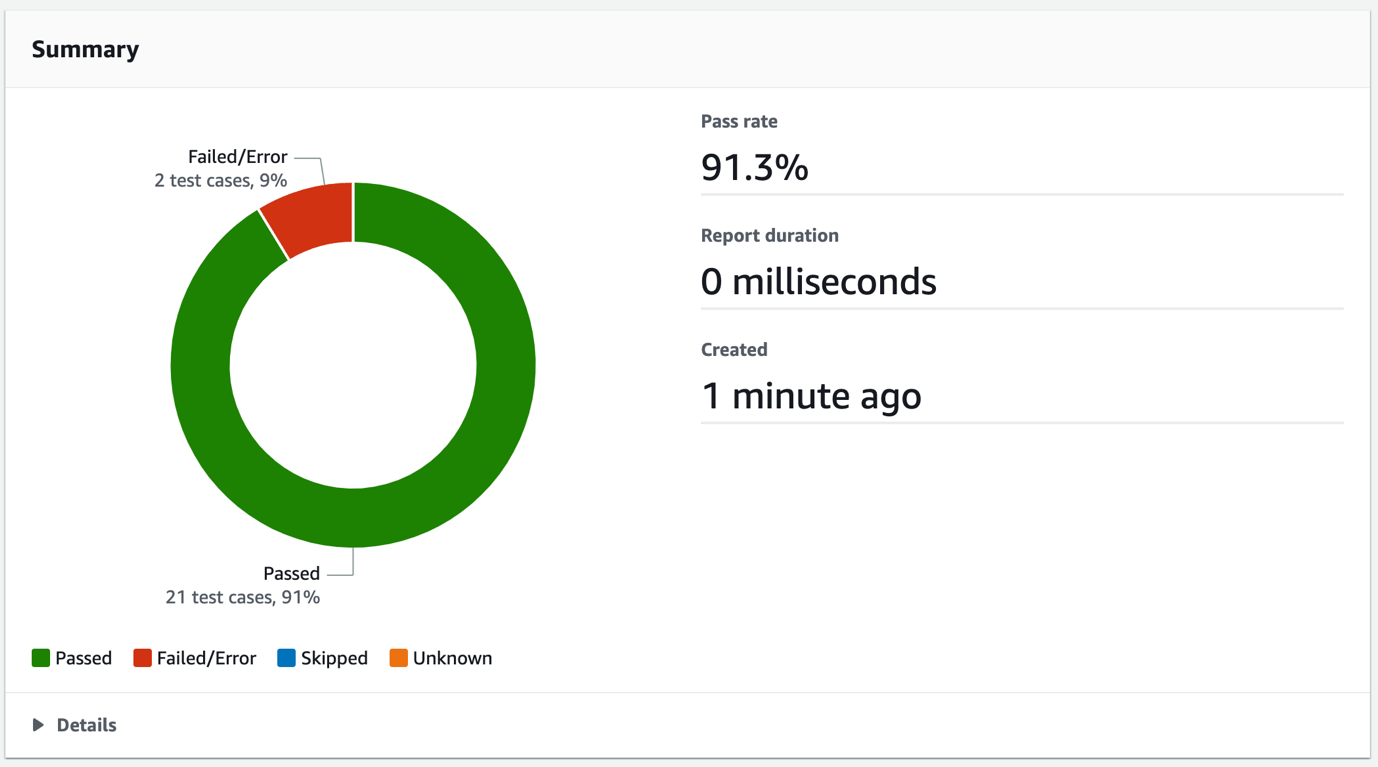
  8. Review the report summary, which shows details such as the total number of Passed and Failed/Error test case totals, and the pass rate, as shown in Figure 2.
  9. Figure 2: CodeBuild test report summary

    Figure 2: CodeBuild test report summary

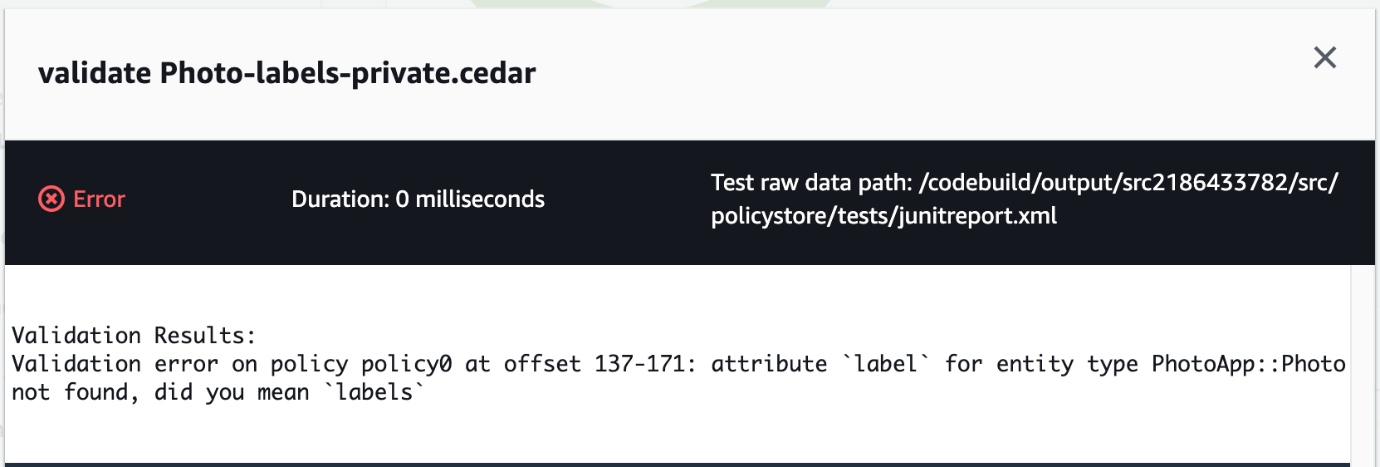
  10. To get the error details, in the Details section, select the Test case called validate Photo-labels-private.cedar that has a Status of Error.
  11. Figure 3: CodeBuild test report test cases

    Figure 3: CodeBuild test report test cases

    That single policy change resulted in two test cases that didn’t pass. The detailed error message shown in Figure 4 is the output from the Cedar CLI. When the policy was validated against the schema, Cedar found the invalid attribute label on the entity type PhotoApp::Photo. The Failed message of unexpected ALLOW occurred because the label attribute typo prevented the forbid policy from matching and producing a DENY result. Each of these tests helps you avoid deploying invalid policies.

    Figure 4: CodeBuild test case error message

    Figure 4: CodeBuild test case error message

Clean up

To avoid ongoing costs and to clean up the resources that you deployed in your AWS account, complete the following steps:

To clean up the resources

  1. Open the Amazon S3 console, select the bucket that begins with the phrase cedar-policy-validation-codepipelinebucket, and Empty the bucket.
  2. Open the CloudFormation console, select the cedar-policy-validation stack, and then choose Delete.
  3. Open the CodeBuild console, choose Build History, filter by cedar-policy-validation, select all results, and then choose Delete builds.

Conclusion

In this post, you learned how to use AWS developer tools to implement a pipeline that automatically validates and tests when Cedar policies are updated and committed to a source code repository. Using this approach, you can detect invalid policies and potential application permission errors earlier in the development lifecycle and before deployment.

To learn more about the Cedar policy language, see the Cedar Policy Language Reference Guide or browse the source code at the cedar-policy organization on GitHub. For real-time validation of Cedar policies and schemas, install the Cedar policy language for Visual Studio Code extension.

If you have feedback about this post, submit comments in the Comments section below. If you have questions about this post, start a new thread on the Amazon Verified Permissions re:Post or contact AWS Support.

Pontus Palmenas

Pontus Palmenäs

Pontus is a Startup Solutions Architect based in Stockholm, Sweden, where he is helping customers in healthcare and life sciences and FinTech. He is passionate about all things security. Outside of work, he enjoys making electronic music in his home studio and spending quality time with his family.

Kevin Hakanson

Kevin Hakanson

Kevin is a Senior Solutions Architect for AWS World Wide Public Sector based in Minnesota. He works with EdTech and GovTech customers to ideate, design, validate, and launch products using cloud-native technologies and modern development practices. When not staring at a computer screen, he is probably staring at another screen, either watching TV or playing video games with his family.

Introducing IAM Access Analyzer custom policy checks

Post Syndicated from Mitch Beaumont original https://aws.amazon.com/blogs/security/introducing-iam-access-analyzer-custom-policy-checks/

AWS Identity and Access Management (IAM) Access Analyzer was launched in late 2019. Access Analyzer guides customers toward least-privilege permissions across Amazon Web Services (AWS) by using analysis techniques, such as automated reasoning, to make it simpler for customers to set, verify, and refine IAM permissions. Today, we are excited to announce the general availability of IAM Access Analyzer custom policy checks, a new IAM Access Analyzer feature that helps customers accurately and proactively check IAM policies for critical permissions and increases in policy permissiveness.

In this post, we’ll show how you can integrate custom policy checks into builder workflows to automate the identification of overly permissive IAM policies and IAM policies that contain permissions that you decide are sensitive or critical.

What is the problem?

Although security teams are responsible for the overall security posture of the organization, developers are the ones creating the applications that require permissions. To enable developers to move fast while maintaining high levels of security, organizations look for ways to safely delegate the ability of developers to author IAM policies. Many AWS customers implement manual IAM policy reviews before deploying developer-authored policies to production environments. Customers follow this practice to try to prevent excessive or unwanted permissions finding their way into production. Depending on the volume and complexity of the policies that need to be reviewed; these reviews can be intensive and take time. The result is a slowdown in development and potential delay in deployment of applications and services. Some customers write custom tooling to remove the manual burden of policy reviews, but this can be costly to build and maintain.

How do custom policy checks solve that problem?

Custom policy checks are a new IAM Access Analyzer capability that helps security teams accurately and proactively identify critical permissions in their policies. Custom policy checks can also tell you if a new version of a policy is more permissive than the previous version. Custom policy checks use automated reasoning, a form of static analysis, to provide a higher level of security assurance in the cloud. For more information, see Formal Reasoning About the Security of Amazon Web Services.

Custom policy checks can be embedded in a continuous integration and continuous delivery (CI/CD) pipeline so that checks can be run against policies without having to deploy the policies. In addition, developers can run custom policy checks from their local development environments and get fast feedback about whether or not the policies they are authoring are in line with your organization’s security standards.

How to analyze IAM policies with custom policy checks

In this section, we provide step-by-step instructions for using custom policy checks to analyze IAM policies.

Prerequisites

To complete the examples in our walkthrough, you will need the following:

  1. An AWS account, and an identity that has permissions to use the AWS services, and create the resources, used in the following examples. For more information, see the full sample code used in this blog post on GitHub.
  2. An installed and configured AWS CLI. For more information, see Configure the AWS CLI.
  3. The AWS Cloud Development Kit (AWS CDK). For installation instructions, refer to Install the AWS CDK.

Example 1: Use custom policy checks to compare two IAM policies and check that one does not grant more access than the other

In this example, you will create two IAM identity policy documents, NewPolicyDocument and ExistingPolicyDocument. You will use the new CheckNoNewAccess API to compare these two policies and check that NewPolicyDocument does not grant more access than ExistingPolicyDocument.

Step 1: Create two IAM identity policy documents

  1. Use the following command to create ExistingPolicyDocument.
    cat << EOF > existing-policy-document.json
    {
        "Version": "2012-10-17",
        "Statement": [
            {
                "Effect": "Allow",
                "Action": [
                    "ec2:StartInstances",
                    "ec2:StopInstances"
                ],
                "Resource": "arn:aws:ec2:*:*:instance/*",
                "Condition": {
                    "StringEquals": {
                        "aws:ResourceTag/Owner": "\${aws:username}"
                    }
                }
            }
        ]
    }
    EOF

  2. Use the following command to create NewPolicyDocument.
    cat << EOF > new-policy-document.json
    {
        "Version": "2012-10-17",
        "Statement": [
            {
                "Effect": "Allow",
                "Action": [
                    "ec2:StartInstances",
                    "ec2:StopInstances"
                ],
                "Resource": "arn:aws:ec2:*:*:instance/*"
            }
        ]
    }
    EOF

Notice that ExistingPolicyDocument grants access to the ec2:StartInstances and ec2:StopInstances actions if the condition key aws:ResourceTag/Owner resolves to true. In other words, the value of the tag matches the policy variable aws:username. NewPolicyDocument grants access to the same actions, but does not include a condition key.

Step 2: Check the policies by using the AWS CLI

  1. Use the following command to call the CheckNoNewAccess API to check whether NewPolicyDocument grants more access than ExistingPolicyDocument.
    aws accessanalyzer check-no-new-access \
    --new-policy-document file://new-policy-document.json \
    --existing-policy-document file://existing-policy-document.json \
    --policy-type IDENTITY_POLICY

After a moment, you will see a response from Access Analyzer. The response will look similar to the following.

{
    "result": "FAIL",
    "message": "The modified permissions grant new access compared to your existing policy.",
    "reasons": [
        {
            "description": "New access in the statement with index: 1.",
            "statementIndex": 1
        }
    ]
}

In this example, the validation returned a result of FAIL. This is because NewPolicyDocument is missing the condition key, potentially granting any principal with this identity policy attached more access than intended or needed.

Example 2: Use custom policy checks to check that an IAM policy does not contain sensitive permissions

In this example, you will create an IAM identity-based policy that contains a set of permissions. You will use the CheckAccessNotGranted API to check that the new policy does not give permissions to disable AWS CloudTrail or delete any associated trails.

Step 1: Create a new IAM identity policy document

  • Use the following command to create IamPolicyDocument.
    cat << EOF > iam-policy-document.json
    {
        "Version": "2012-10-17",
        "Statement": [
            {
                "Effect": "Allow",
                "Action": [
                    "cloudtrail:StopLogging",
                    "cloudtrail:Delete*"
                ],
                "Resource": ["*"] 
            }
        ]
    }
    EOF

Step 2: Check the policy by using the AWS CLI

  • Use the following command to call the CheckAccessNotGranted API to check if the new policy grants permission to the set of sensitive actions. In this example, you are asking Access Analyzer to check that IamPolicyDocument does not contain the actions cloudtrail:StopLogging or cloudtrail:DeleteTrail (passed as a list to the access parameter).
    aws accessanalyzer check-access-not-granted \
    --policy-document file://iam-policy-document.json \
    --access actions=cloudtrail:StopLogging,cloudtrail:DeleteTrail \
    --policy-type IDENTITY_POLICY

Because the policy that you created contains both cloudtrail:StopLogging and cloudtrail:DeleteTrail actions, Access Analyzer returns a FAIL.

{
    "result": "FAIL",
    "message": "The policy document grants access to perform one or more of the listed actions.",
    "reasons": [
        {
            "description": "One or more of the listed actions in the statement with index: 0.",
            "statementIndex": 0
        }
    ]
}

Example 3: Integrate custom policy checks into the developer workflow

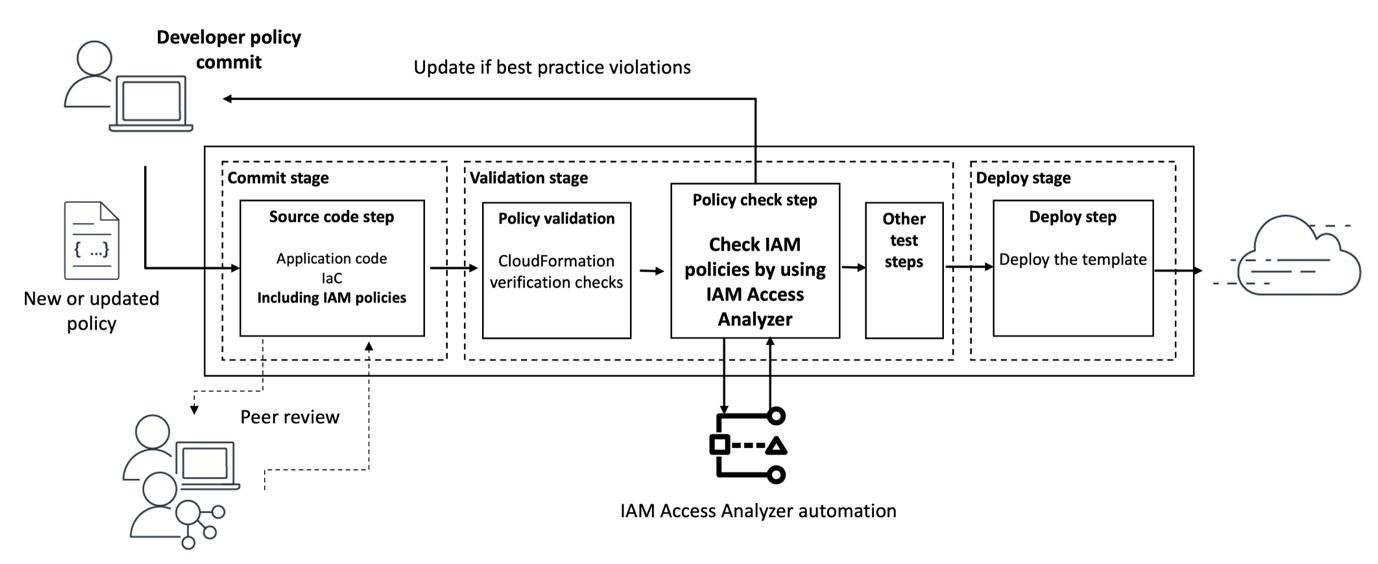
Building on the previous two examples, in this example, you will automate the analysis of the IAM policies defined in an AWS CloudFormation template. Figure 1 shows the workflow that will be used. The workflow will initiate each time a pull request is created against the main branch of an AWS CodeCommit repository called my-iam-policy (the commit stage in Figure 1). The first check uses the CheckNoNewAccess API to determine if the updated policy is more permissive than a reference IAM policy. The second check uses the CheckAccessNotGranted API to automatically check for critical permissions within the policy (the validation stage in Figure 1). In both cases, if the updated policy is more permissive, or contains critical permissions, a comment with the results of the validation is posted to the pull request. This information can then be used to decide whether the pull request is merged into the main branch for deployment (the deploy stage is shown in Figure 1).

Figure 1: Diagram of the pipeline that will check policies

Figure 1: Diagram of the pipeline that will check policies

Step 1: Deploy the infrastructure and set up the pipeline

  1. Use the following command to download and unzip the Cloud Development Kit (CDK) project associated with this blog post.
    git clone https://github.com/aws-samples/access-analyzer-automated-policy-analysis-blog.git
    cd ./access-analyzer-automated-policy-analysis-blog

  2. Create a virtual Python environment to contain the project dependencies by using the following command.
    python3 -m venv .venv

  3. Activate the virtual environment with the following command.
    source .venv/bin/activate

  4. Install the project requirements by using the following command.
    pip install -r requirements.txt

  5. Use the following command to update the CDK CLI to the latest major version.
    npm install -g aws-cdk@2 --force

  6. Before you can deploy the CDK project, use the following command to bootstrap your AWS environment. Bootstrapping is the process of creating resources needed for deploying CDK projects. These resources include an Amazon Simple Storage Service (Amazon S3) bucket for storing files and IAM roles that grant permissions needed to perform deployments.
    cdk bootstrap

  7. Finally, use the following command to deploy the pipeline infrastructure.
    cdk deploy --require-approval never

    The deployment will take a few minutes to complete. Feel free to grab a coffee and check back shortly.

    When the deployment completes, there will be two stack outputs listed: one with a name that contains CodeCommitRepo and another with a name that contains ConfigBucket. Make a note of the values of these outputs, because you will need them later.

    The deployed pipeline is displayed in the AWS CodePipeline console and should look similar to the pipeline shown in Figure 2.

    Figure 2: AWS CodePipeline and CodeBuild Management Console view

    Figure 2: AWS CodePipeline and CodeBuild Management Console view

    In addition to initiating when a pull request is created, the newly deployed pipeline can also be initiated when changes to the main branch of the AWS CodeCommit repository are detected. The pipeline has three stages, CheckoutSources, IAMPolicyAnalysis, and deploy. The CheckoutSource stage checks out the contents of the my-iam-policy repository when the pipeline is triggered due to a change in the main branch.

    The IAMPolicyAnalysis stage, which runs after the CheckoutSource stage or when a pull request has been created against the main branch, has two actions. The first action, Check no new access, verifies that changes to the IAM policies in the CloudFormation template do not grant more access than a pre-defined reference policy. The second action, Check access not granted, verifies that those same updates do not grant access to API actions that are deemed sensitive or critical. Finally, the Deploy stage will deploy the resources defined in the CloudFormation template, if the actions in the IAMPolicyAnalysis stage are successful.

    To analyze the IAM policies, the Check no new access and Check access not granted actions depend on a reference policy and a predefined list of API actions, respectively.

  8. Use the following command to create the reference policy.
    cd ../ 
    cat << EOF > cnna-reference-policy.json
    {
        "Version": "2012-10-17",
        "Statement": [
            {
                "Effect": "Allow",
                "Action": "*",
                "Resource": "*"
            },
            {
                "Effect": "Deny",
                "Action": "iam:PassRole",
                "Resource": "arn:aws:iam::*:role/my-sensitive-roles/*"
            }
        ]
    }	
    EOF

    This reference policy sets out the maximum permissions for policies that you plan to validate with custom policy checks. The iam:PassRole permission is a permission that allows an IAM principal to pass an IAM role to an AWS service, like Amazon Elastic Compute Cloud (Amazon EC2) or AWS Lambda. The reference policy says that the only way that a policy is more permissive is if it allows iam:PassRole on this group of sensitive resources: arn:aws:iam::*:role/my-sensitive-roles/*”.

    Why might a reference policy be useful? A reference policy helps ensure that a particular combination of actions, resources, and conditions is not allowed in your environment. Reference policies typically allow actions and resources in one statement, then deny the problematic permissions in a second statement. This means that a policy that is more permissive than the reference policy allows access to a permission that the reference policy has denied.

    In this example, a developer who is authorized to create IAM roles could, intentionally or unintentionally, create an IAM role for an AWS service (like EC2 for AWS Lambda) that has permission to pass a privileged role to another service or principal, leading to an escalation of privilege.

  9. Use the following command to create a list of sensitive actions. This list will be parsed during the build pipeline and passed to the CheckAccessNotGranted API. If the policy grants access to one or more of the sensitive actions in this list, a result of FAIL will be returned. To keep this example simple, add a single API action, as follows.
    cat << EOF > sensitive-actions.file
    dynamodb:DeleteTable
    EOF

  10. So that the CodeBuild projects can access the dependencies, use the following command to copy the cnna-reference-policy.file and sensitive-actions.file to an S3 bucket. Refer to the stack outputs you noted earlier and replace <ConfigBucket> with the name of the S3 bucket created in your environment.
    aws s3 cp ./cnna-reference-policy.json s3://<ConfgBucket>/cnna-reference-policy.json
    aws s3 cp ./sensitive-actions.file s3://<ConfigBucket>/sensitive-actions.file

Step 2: Create a new CloudFormation template that defines an IAM policy

With the pipeline deployed, the next step is to clone the repository that was created and populate it with a CloudFormation template that defines an IAM policy.

  1. Install git-remote-codecommit by using the following command.
    pip install git-remote-codecommit

    For more information on installing and configuring git-remote-codecommit, see the AWS CodeCommit User Guide.

  2. With git-remote-codecommit installed, use the following command to clone the my-iam-policy repository from AWS CodeCommit.
    git clone codecommit://my-iam-policy && cd ./my-iam-policy

    If you’ve configured a named profile for use with the AWS CLI, use the following command, replacing <profile> with the name of your named profile.

    git clone codecommit://<profile>@my-iam-policy && cd ./my-iam-policy

  3. Use the following command to create the CloudFormation template in the local clone of the repository.
    cat << EOF > ec2-instance-role.yaml
    ---
    AWSTemplateFormatVersion: 2010-09-09
    Description: CloudFormation Template to deploy base resources for access_analyzer_blog
    Resources:
      EC2Role:
        Type: AWS::IAM::Role
        Properties:
          AssumeRolePolicyDocument:
            Version: 2012-10-17
            Statement:
            - Effect: Allow
              Principal:
                Service: ec2.amazonaws.com
              Action: sts:AssumeRole
          Path: /
          Policies:
          - PolicyName: my-application-permissions
            PolicyDocument:
              Version: 2012-10-17
              Statement:
              - Effect: Allow
                Action:
                  - 'ec2:RunInstances'
                  - 'lambda:CreateFunction'
                  - 'lambda:InvokeFunction'
                  - 'dynamodb:Scan'
                  - 'dynamodb:Query'
                  - 'dynamodb:UpdateItem'
                  - 'dynamodb:GetItem'
                Resource: '*'
              - Effect: Allow
                Action:
                  - iam:PassRole 
                Resource: "arn:aws:iam::*:role/my-custom-role"
            
      EC2InstanceProfile:
        Type: AWS::IAM::InstanceProfile
        Properties:
          Path: /
          Roles:
            - !Ref EC2Role
    EOF

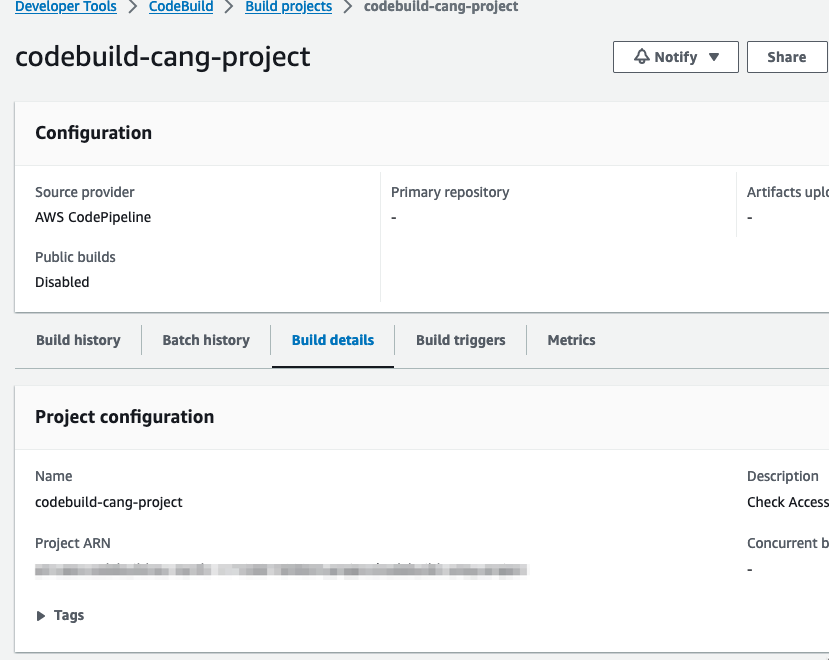
The actions in the IAMPolicyValidation stage are run by a CodeBuild project. CodeBuild environments run arbitrary commands that are passed to the project using a buildspec file. Each project has already been configured to use an inline buildspec file.

You can inspect the buildspec file for each project by opening the project’s Build details page as shown in Figure 3.

Figure 3: AWS CodeBuild console and build details

Figure 3: AWS CodeBuild console and build details

Step 3: Run analysis on the IAM policy

The next step involves checking in the first version of the CloudFormation template to the repository and checking two things. First, that the policy does not grant more access than the reference policy. Second, that the policy does not contain any of the sensitive actions defined in the sensitive-actions.file.

  1. To begin tracking the CloudFormation template created earlier, use the following command.
    git add ec2-instance-role.yaml 

  2. Commit the changes you have made to the repository.
    git commit -m 'committing a new CFN template with IAM policy'

  3. Finally, push these changes to the remote repository.
    git push

  4. Pushing these changes will initiate the pipeline. After a few minutes the pipeline should complete successfully. To view the status of the pipeline, do the following:
    1. Navigate to https://<region>.console.aws.amazon.com/codesuite/codepipeline/pipelines (replacing <region> with your AWS Region).
    2. Choose the pipeline called accessanalyzer-pipeline.
    3. Scroll down to the IAMPolicyValidation stage of the pipeline.
    4. For both the check no new access and check access not granted actions, choose View Logs to inspect the log output.
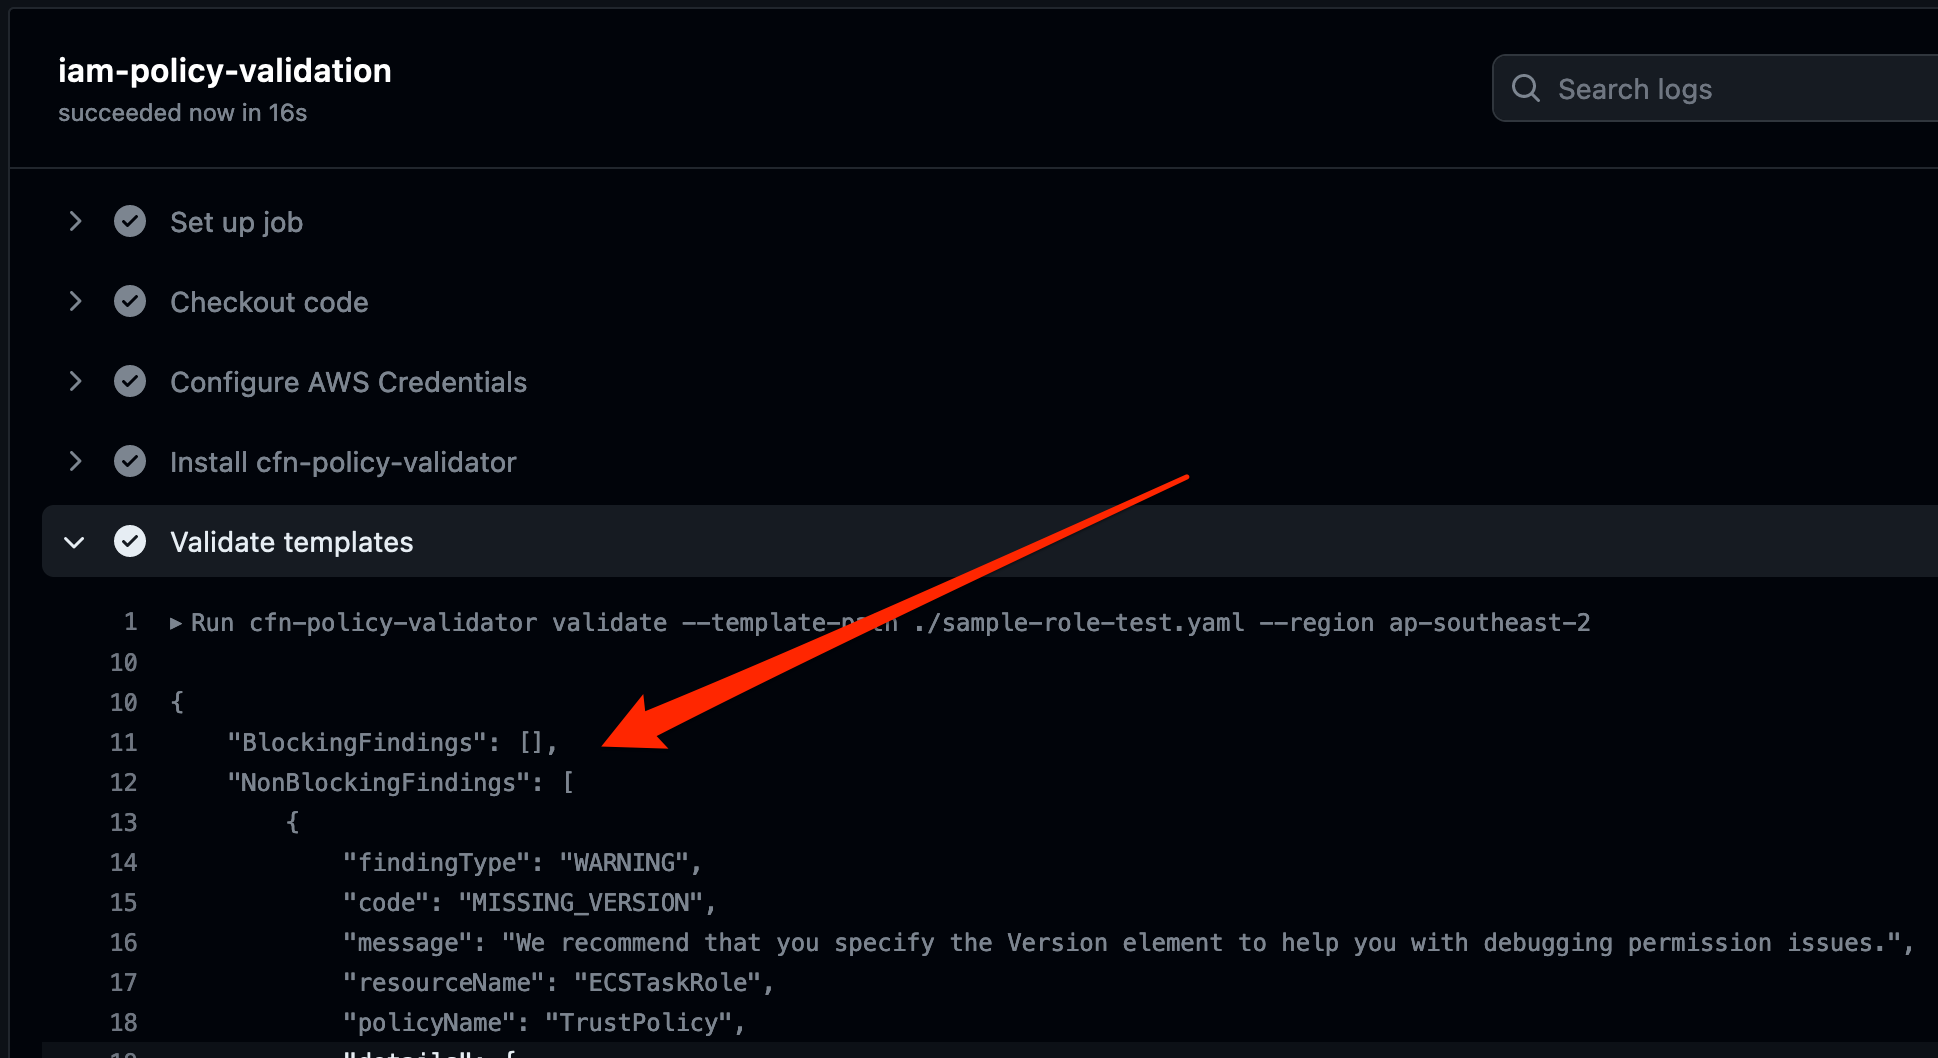
  5. If you inspect the build logs for both the check no new access and check access not granted actions within the pipeline, you should see that there were no blocking or non-blocking findings, similar to what is shown in Figure 4. This indicates that the policy was validated successfully. In other words, the policy was not more permissive than the reference policy, and it did not include any of the critical permissions.
    Figure 4: CodeBuild log entry confirming that the IAM policy was successfully validated

    Figure 4: CodeBuild log entry confirming that the IAM policy was successfully validated

Step 4: Create a pull request to merge a new update to the CloudFormation template

In this step, you will make a change to the IAM policy in the CloudFormation template. The change deliberately makes the policy grant more access than the reference policy. The change also includes a critical permission.

  1. Use the following command to create a new branch called add-new-permissions in the local clone of the repository.
    git checkout -b add-new-permissions

  2. Next, edit the IAM policy in ec2-instance-role.yaml to include an additional API action, dynamodb:Delete* and update the resource property of the inline policy to use an IAM role in the /my-sensitive-roles/*” path. You can copy the following example, if you’re unsure of how to do this.
    ---
    AWSTemplateFormatVersion: 2010-09-09
    Description: CloudFormation Template to deploy base resources for access_analyzer_blog
    Resources:
      EC2Role:
        Type: AWS::IAM::Role
        Properties:
          AssumeRolePolicyDocument:
            Version: 2012-10-17
            Statement:
            - Effect: Allow
              Principal:
                Service: ec2.amazonaws.com
              Action: sts:AssumeRole
          Path: /
          Policies:
          - PolicyName: my-application-permissions
            PolicyDocument:
              Version: 2012-10-17
              Statement:
              - Effect: Allow
                Action:
                  - 'ec2:RunInstances'
                  - 'lambda:CreateFunction'
                  - 'lambda:InvokeFunction'
                  - 'dynamodb:Scan'
                  - 'dynamodb:Query'
                  - 'dynamodb:UpdateItem'
                  - 'dynamodb:GetItem'
                  - 'dynamodb:Delete*'
                Resource: '*'
              - Effect: Allow
                Action:
                  - iam:PassRole 
                Resource: "arn:aws:iam::*:role/my-sensitive-roles/my-custom-admin-role"
            
      EC2InstanceProfile:
        Type: AWS::IAM::InstanceProfile
        Properties:
          Path: /
          Roles:
            - !Ref EC2Role

  3. Commit the policy change and push the updated policy document to the repo by using the following commands.
    git add ec2-instance-role.yaml 
    git commit -m "adding new permission and allowing my ec2 instance to assume a pass sensitive IAM role"

  4. The add-new-permissions branch is currently a local branch. Use the following command to push the branch to the remote repository. This action will not initiate the pipeline, because the pipeline only runs when changes are made to the repository’s main branch.
    git push -u origin add-new-permissions

  5. With the new branch and changes pushed to the repository, follow these steps to create a pull request:
    1. Navigate to https://console.aws.amazon.com/codesuite/codecommit/repositories (don’t forget to the switch to the correct Region).
    2. Choose the repository called my-iam-policy.
    3. Choose the branch add-new-permissions from the drop-down list at the top of the repository screen.
      Figure 5: my-iam-policy repository with new branch available

      Figure 5: my-iam-policy repository with new branch available

    4. Choose Create pull request.
    5. Enter a title and description for the pull request.
    6. (Optional) Scroll down to see the differences between the current version and new version of the CloudFormation template highlighted.
    7. Choose Create pull request.
  6. The creation of the pull request will Initiate the pipeline to fetch the CloudFormation template from the repository and run the check no new access and check access not granted analysis actions.
  7. After a few minutes, choose the Activity tab for the pull request. You should see a comment from the pipeline that contains the results of the failed validation.
    Figure 6: Results from the failed validation posted as a comment to the pull request

    Figure 6: Results from the failed validation posted as a comment to the pull request

Why did the validations fail?

The updated IAM role and inline policy failed validation for two reasons. First, the reference policy said that no one should have more permissions than the reference policy does. The reference policy in this example included a deny statement for the iam:PassRole permission with a resource of /my-sensitive-role/*. The new created inline policy included an allow statement for the iam:PassRole permission with a resource of arn:aws:iam::*:role/my-sensitive-roles/my-custom-admin-role. In other words, the new policy had more permissions than the reference policy.

Second, the list of critical permissions included the dynamodb:DeleteTable permission. The inline policy included a statement that would allow the EC2 instance to perform the dynamodb:DeleteTable action.

Cleanup

Use the following command to delete the infrastructure that was provisioned as part of the examples in this blog post.

cdk destroy 

Conclusion

In this post, I introduced you to two new IAM Access Analyzer APIs: CheckNoNewAccess and CheckAccessNotGranted. The main example in the post demonstrated one way in which you can use these APIs to automate security testing throughout the development lifecycle. The example did this by integrating both APIs into the developer workflow and validating the developer-authored IAM policy when the developer created a pull request to merge changes into the repository’s main branch. The automation helped the developer to get feedback about the problems with the IAM policy quickly, allowing the developer to take action in a timely way. This is often referred to as shifting security left — identifying misconfigurations early and automatically supporting an iterative, fail-fast model of continuous development and testing. Ultimately, this enables teams to make security an inherent part of a system’s design and architecture and can speed up product development workflow.

You can find the full sample code used in this blog post on GitHub.

To learn more about IAM Access Analyzer and the new custom policy checks feature, see the IAM Access Analyzer documentation.

If you have feedback about this post, submit comments in the Comments section below. If you have questions about this post, contact AWS Support.

Want more AWS Security news? Follow us on Twitter.

Mitch Beaumont

Mitch Beaumont

Mitch is a Principal Solutions Architect for AWS, based in Sydney, Australia. Mitch works with some of Australia’s largest financial services customers, helping them to continually raise the security bar for the products and features that they build and ship. Outside of work, Mitch enjoys spending time with his family, photography, and surfing.

Author

Matt Luttrell

Matt is a Principal Solutions Architect on the AWS Identity Solutions team. When he’s not spending time chasing his kids around, he enjoys skiing, cycling, and the occasional video game.

Validate IAM policies by using IAM Policy Validator for AWS CloudFormation and GitHub Actions

Post Syndicated from Mitch Beaumont original https://aws.amazon.com/blogs/security/validate-iam-policies-by-using-iam-policy-validator-for-aws-cloudformation-and-github-actions/

In this blog post, I’ll show you how to automate the validation of AWS Identity and Access Management (IAM) policies by using a combination of the IAM Policy Validator for AWS CloudFormation (cfn-policy-validator) and GitHub Actions. Policy validation is an approach that is designed to minimize the deployment of unwanted IAM identity-based and resource-based policies to your Amazon Web Services (AWS) environments.

With GitHub Actions, you can automate, customize, and run software development workflows directly within a repository. Workflows are defined using YAML and are stored alongside your code. I’ll discuss the specifics of how you can set up and use GitHub actions within a repository in the sections that follow.

The cfn-policy-validator tool is a command-line tool that takes an AWS CloudFormation template, finds and parses the IAM policies that are attached to IAM roles, users, groups, and resources, and then runs the policies through IAM Access Analyzer policy checks. Implementing IAM policy validation checks at the time of code check-in helps shift security to the left (closer to the developer) and shortens the time between when developers commit code and when they get feedback on their work.

Let’s walk through an example that checks the policies that are attached to an IAM role in a CloudFormation template. In this example, the cfn-policy-validator tool will find that the trust policy attached to the IAM role allows the role to be assumed by external principals. This configuration could lead to unintended access to your resources and data, which is a security risk.

Prerequisites

To complete this example, you will need the following:

  1. A GitHub account
  2. An AWS account, and an identity within that account that has permissions to create the IAM roles and resources used in this example

Step 1: Create a repository that will host the CloudFormation template to be validated

To begin with, you need to create a GitHub repository to host the CloudFormation template that is going to be validated by the cfn-policy-validator tool.

To create a repository:

  1. Open a browser and go to https://github.com.
  2. In the upper-right corner of the page, in the drop-down menu, choose New repository. For Repository name, enter a short, memorable name for your repository.
  3. (Optional) Add a description of your repository.
  4. Choose either the option Public (the repository is accessible to everyone on the internet) or Private (the repository is accessible only to people access is explicitly shared with).
  5. Choose Initialize this repository with: Add a README file.
  6. Choose Create repository. Make a note of the repository’s name.

Step 2: Clone the repository locally

Now that the repository has been created, clone it locally and add a CloudFormation template.

To clone the repository locally and add a CloudFormation template:

  1. Open the command-line tool of your choice.
  2. Use the following command to clone the new repository locally. Make sure to replace <GitHubOrg> and <RepositoryName> with your own values.
    git clone [email protected]:<GitHubOrg>/<RepositoryName>.git

  3. Change in to the directory that contains the locally-cloned repository.
    cd <RepositoryName>

    Now that the repository is locally cloned, populate the locally-cloned repository with the following sample CloudFormation template. This template creates a single IAM role that allows a principal to assume the role to perform the S3:GetObject action.

  4. Use the following command to create the sample CloudFormation template file.

    WARNING: This sample role and policy should not be used in production. Using a wildcard in the principal element of a role’s trust policy would allow any IAM principal in any account to assume the role.

    cat << EOF > sample-role.yaml
    
    AWSTemplateFormatVersion: "2010-09-09"
    Description: Base stack to create a simple role
    Resources:
      SampleIamRole:
        Type: AWS::IAM::Role
        Properties:
          AssumeRolePolicyDocument:
            Statement:
              - Effect: Allow
                Principal:
                  AWS: "*"
                Action: ["sts:AssumeRole"]
          Path: /      
          Policies:
            - PolicyName: root
              PolicyDocument:
                Version: 2012-10-17
                Statement:
                  - Resource: "*"
                    Effect: Allow
                    Action:
                      - s3:GetObject
    EOF

Notice that AssumeRolePolicyDocument refers to a trust policy that includes a wildcard value in the principal element. This means that the role could potentially be assumed by an external identity, and that’s a risk you want to know about.

Step 3: Vend temporary AWS credentials for GitHub Actions workflows

In order for the cfn-policy-validator tool that’s running in the GitHub Actions workflow to use the IAM Access Analyzer API, the GitHub Actions workflow needs a set of temporary AWS credentials. The AWS Credentials for GitHub Actions action helps address this requirement. This action implements the AWS SDK credential resolution chain and exports environment variables for other actions to use in a workflow. Environment variable exports are detected by the cfn-policy-validator tool.

AWS Credentials for GitHub Actions supports four methods for fetching credentials from AWS, but the recommended approach is to use GitHub’s OpenID Connect (OIDC) provider in conjunction with a configured IAM identity provider endpoint.

To configure an IAM identity provider endpoint for use in conjunction with GitHub’s OIDC provider:

  1. Open the AWS Management Console and navigate to IAM.
  2. In the left-hand menu, choose Identity providers, and then choose Add provider.
  3. For Provider type, choose OpenID Connect.
  4. For Provider URL, enter
    https://token.actions.githubusercontent.com
  5. Choose Get thumbprint.
  6. For Audiences, enter sts.amazonaws.com
  7. Choose Add provider to complete the setup.

At this point, make a note of the OIDC provider name. You’ll need this information in the next step.

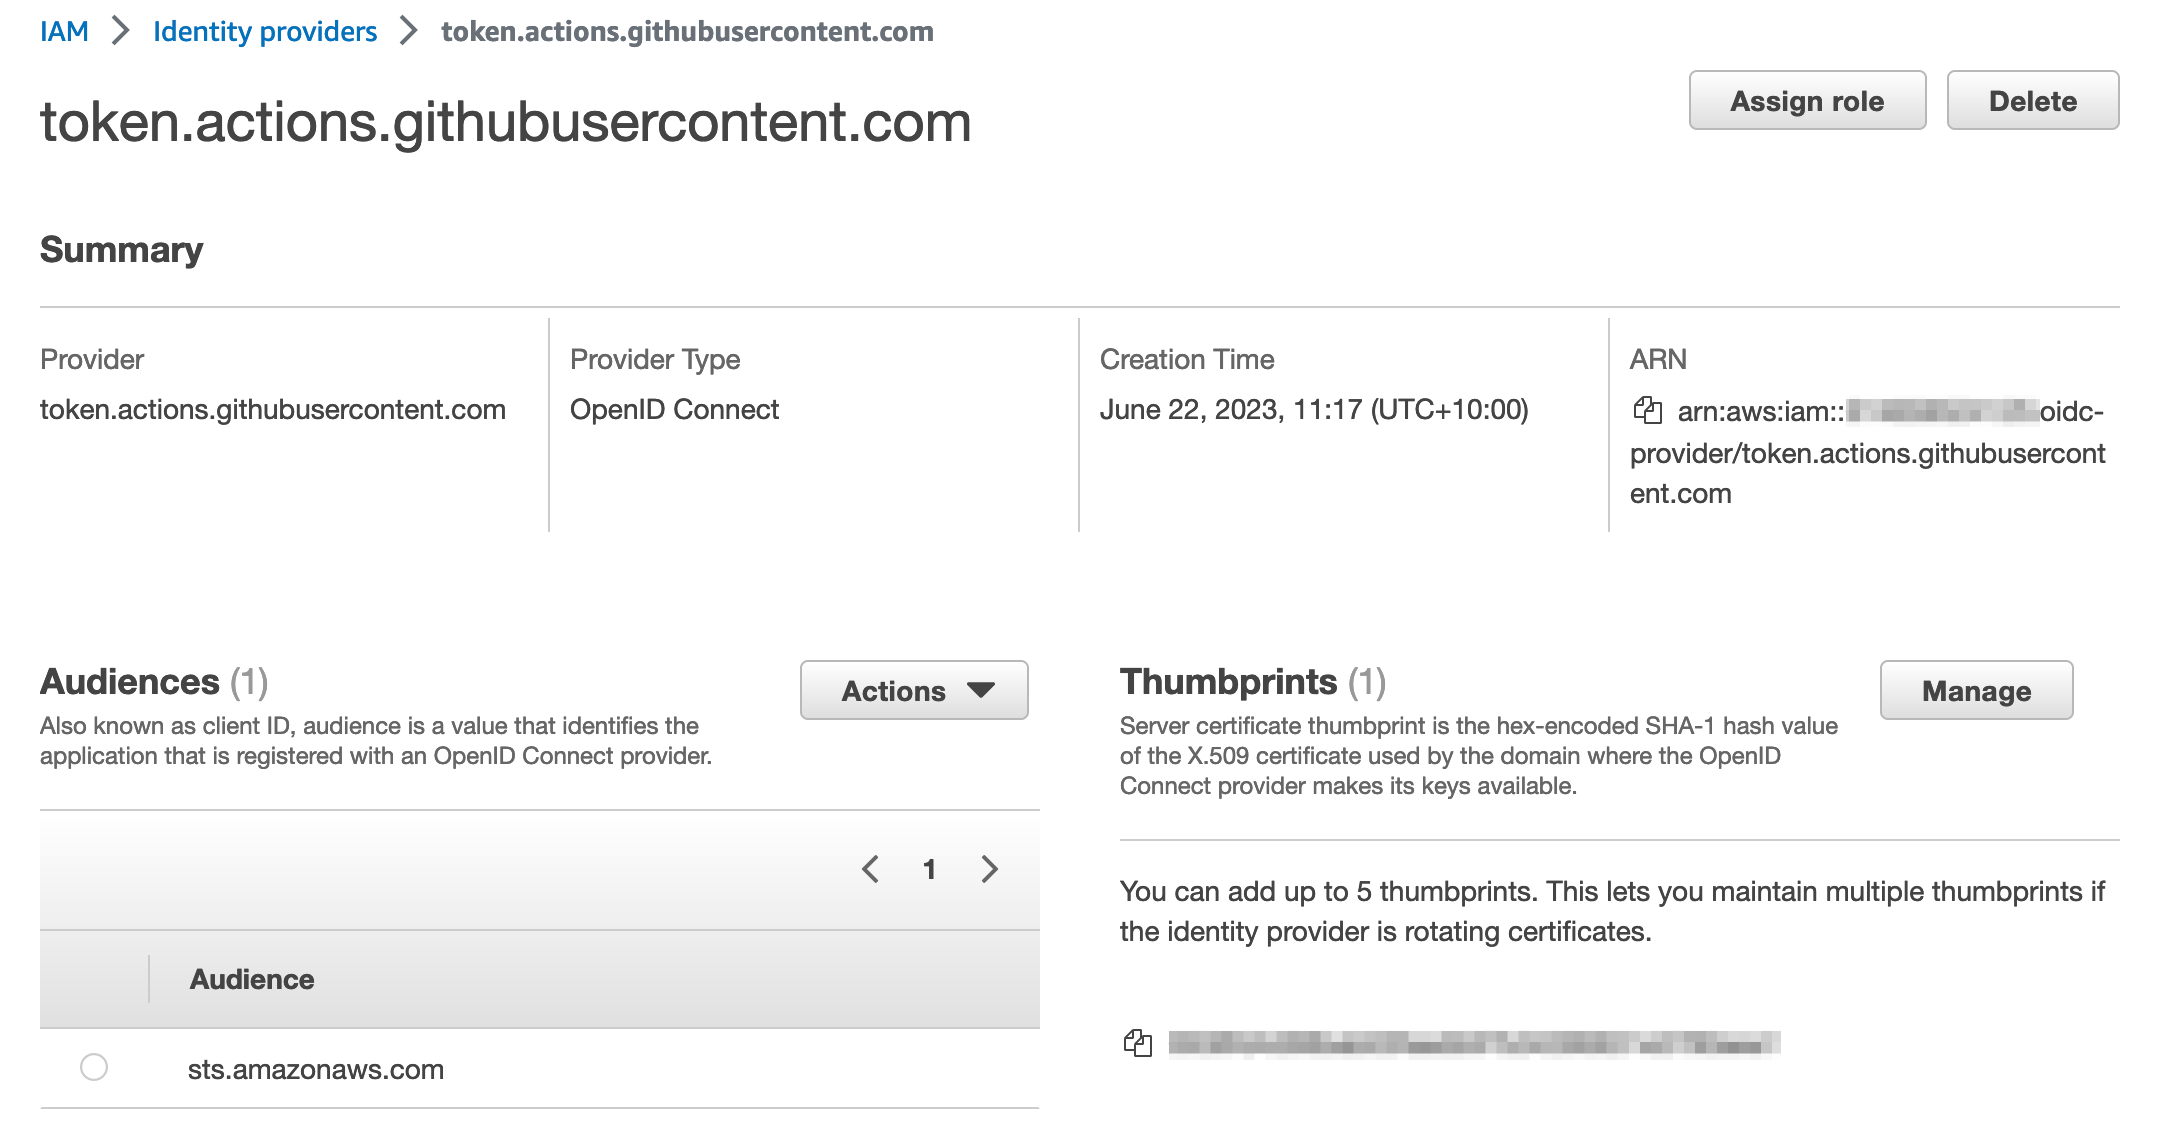
After it’s configured, the IAM identity provider endpoint should look similar to the following:

Figure 1: IAM Identity provider details

Figure 1: IAM Identity provider details

Step 4: Create an IAM role with permissions to call the IAM Access Analyzer API

In this step, you will create an IAM role that can be assumed by the GitHub Actions workflow and that provides the necessary permissions to run the cfn-policy-validator tool.

To create the IAM role:

  1. In the IAM console, in the left-hand menu, choose Roles, and then choose Create role.
  2. For Trust entity type, choose Web identity.
  3. In the Provider list, choose the new GitHub OIDC provider that you created in the earlier step. For Audience, select sts.amazonaws.com from the list.
  4. Choose Next.
  5. On the Add permission page, choose Create policy.
  6. Choose JSON, and enter the following policy:
    
        "Version": "2012-10-17",
        "Statement": [
            {
                "Effect": "Allow",
                "Action": [
                  "iam:GetPolicy",
                  "iam:GetPolicyVersion",
                  "access-analyzer:ListAnalyzers",
                  "access-analyzer:ValidatePolicy",
                  "access-analyzer:CreateAccessPreview",
                  "access-analyzer:GetAccessPreview",
                  "access-analyzer:ListAccessPreviewFindings",
                  "access-analyzer:CreateAnalyzer",
                  "s3:ListAllMyBuckets",
                  "cloudformation:ListExports",
                  "ssm:GetParameter"
                ],
                "Resource": "*"
            },
            {
              "Effect": "Allow",
              "Action": "iam:CreateServiceLinkedRole",
              "Resource": "*",
              "Condition": {
                "StringEquals": {
                  "iam:AWSServiceName": "access-analyzer.amazonaws.com"
                }
              }
            } 
        ]
    }

  7. After you’ve attached the new policy, choose Next.

    Note: For a full explanation of each of these actions and a CloudFormation template example that you can use to create this role, see the IAM Policy Validator for AWS CloudFormation GitHub project.

  8. Give the role a name, and scroll down to look at Step 1: Select trusted entities.

    The default policy you just created allows GitHub Actions from organizations or repositories outside of your control to assume the role. To align with the IAM best practice of granting least privilege, let’s scope it down further to only allow a specific GitHub organization and the repository that you created earlier to assume it.

  9. Replace the policy to look like the following, but don’t forget to replace {AWSAccountID}, {GitHubOrg} and {RepositoryName} with your own values.
    {
        "Version": "2012-10-17",
        "Statement": [
            {
                "Effect": "Allow",
                "Principal": {
                    "Federated": "arn:aws:iam::{AWSAccountID}:oidc-provider/token.actions.githubusercontent.com"
                },
                "Action": "sts:AssumeRoleWithWebIdentity",
                "Condition": {
                    "StringEquals": {
                        "token.actions.githubusercontent.com:aud": "sts.amazonaws.com"
                    },
                    "StringLike": {
                        "token.actions.githubusercontent.com:sub": "repo:${GitHubOrg}/${RepositoryName}:*"
                    }
                }
            }
        ]
    }

For information on best practices for configuring a role for the GitHub OIDC provider, see Creating a role for web identity or OpenID Connect Federation (console).

Checkpoint

At this point, you’ve created and configured the following resources:

  • A GitHub repository that has been locally cloned and filled with a sample CloudFormation template.
  • An IAM identity provider endpoint for use in conjunction with GitHub’s OIDC provider.
  • A role that can be assumed by GitHub actions, and a set of associated permissions that allow the role to make requests to IAM Access Analyzer to validate policies.

Step 5: Create a definition for the GitHub Actions workflow

The workflow runs steps on hosted runners. For this example, we are going to use Ubuntu as the operating system for the hosted runners. The workflow runs the following steps on the runner:

  1. The workflow checks out the CloudFormation template by using the community actions/checkout action.
  2. The workflow then uses the aws-actions/configure-aws-credentials GitHub action to request a set of credentials through the IAM identity provider endpoint and the IAM role that you created earlier.
  3. The workflow installs the cfn-policy-validator tool by using the python package manager, PIP.
  4. The workflow runs a validation against the CloudFormation template by using the cfn-policy-validator tool.

The workflow is defined in a YAML document. In order for GitHub Actions to pick up the workflow, you need to place the definition file in a specific location within the repository: .github/workflows/main.yml. Note the “.” prefix in the directory name, indicating that this is a hidden directory.

To create the workflow:

  1. Use the following command to create the folder structure within the locally cloned repository:
    mkdir -p .github/workflows

  2. Create the sample workflow definition file in the .github/workflows directory. Make sure to replace <AWSAccountID> and <AWSRegion> with your own information.
    cat << EOF > .github/workflows/main.yml
    name: cfn-policy-validator-workflow
    
    on: push
    
    permissions:
      id-token: write
      contents: read
    
    jobs: 
      cfn-iam-policy-validation: 
        name: iam-policy-validation
        runs-on: ubuntu-latest
        steps:
          - name: Checkout code
            uses: actions/checkout@v3
    
          - name: Configure AWS Credentials
            uses: aws-actions/configure-aws-credentials@v2
            with:
              role-to-assume: arn:aws:iam::<AWSAccountID>:role/github-actions-access-analyzer-role
              aws-region: <AWSRegion>
              role-session-name: GitHubSessionName
            
          - name: Install cfn-policy-validator
            run: pip install cfn-policy-validator
    
          - name: Validate templates
            run: cfn-policy-validator validate --template-path ./sample-role-test.yaml --region <AWSRegion>
    EOF
    

Step 6: Test the setup

Now that everything has been set up and configured, it’s time to test.

To test the workflow and validate the IAM policy:

  1. Add and commit the changes to the local repository.
    git add .
    git commit -m ‘added sample cloudformation template and workflow definition’

  2. Push the local changes to the remote GitHub repository.
    git push

    After the changes are pushed to the remote repository, go back to https://github.com and open the repository that you created earlier. In the top-right corner of the repository window, there is a small orange indicator, as shown in Figure 2. This shows that your GitHub Actions workflow is running.

    Figure 2: GitHub repository window with the orange workflow indicator

    Figure 2: GitHub repository window with the orange workflow indicator

    Because the sample CloudFormation template used a wildcard value “*” in the principal element of the policy as described in the section Step 2: Clone the repository locally, the orange indicator turns to a red x (shown in Figure 3), which signals that something failed in the workflow.

    Figure 3: GitHub repository window with the red cross workflow indicator

    Figure 3: GitHub repository window with the red cross workflow indicator

  3. Choose the red x to see more information about the workflow’s status, as shown in Figure 4.
    Figure 4: Pop-up displayed after choosing the workflow indicator

    Figure 4: Pop-up displayed after choosing the workflow indicator

  4. Choose Details to review the workflow logs.

    In this example, the Validate templates step in the workflow has failed. A closer inspection shows that there is a blocking finding with the CloudFormation template. As shown in Figure 5, the finding is labelled as EXTERNAL_PRINCIPAL and has a description of Trust policy allows access from external principals.

    Figure 5: Details logs from the workflow showing the blocking finding

    Figure 5: Details logs from the workflow showing the blocking finding

    To remediate this blocking finding, you need to update the principal element of the trust policy to include a principal from your AWS account (considered a zone of trust). The resources and principals within your account comprises of the zone of trust for the cfn-policy-validator tool. In the initial version of sample-role.yaml, the IAM roles trust policy used a wildcard in the Principal element. This allowed principals outside of your control to assume the associated role, which caused the cfn-policy-validator tool to generate a blocking finding.

    In this case, the intent is that principals within the current AWS account (zone of trust) should be able to assume this role. To achieve this result, replace the wildcard value with the account principal by following the remaining steps.

  5. Open sample-role.yaml by using your preferred text editor, such as nano.
    nano sample-role.yaml

    Replace the wildcard value in the principal element with the account principal arn:aws:iam::<AccountID>:root. Make sure to replace <AWSAccountID> with your own AWS account ID.

    AWSTemplateFormatVersion: "2010-09-09"
    Description: Base stack to create a simple role
    Resources:
      SampleIamRole:
        Type: AWS::IAM::Role
        Properties:
          AssumeRolePolicyDocument:
            Statement:
              - Effect: Allow
                Principal:
                  AWS: "arn:aws:iam::<AccountID>:root"
                Action: ["sts:AssumeRole"]
          Path: /      
          Policies:
            - PolicyName: root
              PolicyDocument:
                Version: 2012-10-17
                Statement:
                  - Resource: "*"
                    Effect: Allow
                    Action:
                      - s3:GetObject

  6. Add the updated file, commit the changes, and push the updates to the remote GitHub repository.
    git add sample-role.yaml
    git commit -m ‘replacing wildcard principal with account principal’
    git push

After the changes have been pushed to the remote repository, go back to https://github.com and open the repository. The orange indicator in the top right of the window should change to a green tick (check mark), as shown in Figure 6.

Figure 6: GitHub repository window with the green tick workflow indicator

Figure 6: GitHub repository window with the green tick workflow indicator

This indicates that no blocking findings were identified, as shown in Figure 7.

Figure 7: Detailed logs from the workflow showing no more blocking findings

Figure 7: Detailed logs from the workflow showing no more blocking findings

Conclusion

In this post, I showed you how to automate IAM policy validation by using GitHub Actions and the IAM Policy Validator for CloudFormation. Although the example was a simple one, it demonstrates the benefits of automating security testing at the start of the development lifecycle. This is often referred to as shifting security left. Identifying misconfigurations early and automatically supports an iterative, fail-fast model of continuous development and testing. Ultimately, this enables teams to make security an inherent part of a system’s design and architecture and can speed up product development workflows.

In addition to the example I covered today, IAM Policy Validator for CloudFormation can validate IAM policies by using a range of IAM Access Analyzer policy checks. For more information about these policy checks, see Access Analyzer reference policy checks.

 
If you have feedback about this post, submit comments in the Comments section below. If you have questions about this post, contact AWS Support.

Want more AWS Security news? Follow us on Twitter.

Mitch Beaumont

Mitch Beaumont

Mitch is a Principal Solutions Architect for Amazon Web Services, based in Sydney, Australia. Mitch works with some of Australia’s largest financial services customers, helping them to continually raise the security bar for the products and features that they build and ship. Outside of work, Mitch enjoys spending time with his family, photography, and surfing.

Integrating with GitHub Actions – Amazon CodeGuru in your DevSecOps Pipeline

Post Syndicated from Mahesh Biradar original https://aws.amazon.com/blogs/devops/integrating-with-github-actions-amazon-codeguru-in-your-devsecops-pipeline/

Many organizations have adopted DevOps practices to streamline and automate software delivery and IT operations. A DevOps model can be adopted without sacrificing security by using automated compliance policies, fine-grained controls, and configuration management techniques. However, one of the key challenges customers face is analyzing code and detecting any vulnerabilities in the code pipeline due to a lack of access to the right tool. Amazon CodeGuru addresses this challenge by using machine learning and automated reasoning to identify critical issues and hard-to-find bugs during application development and deployment, thus improving code quality.

We discussed how you can build a CI/CD pipeline to deploy a web application in our previous post “Integrating with GitHub Actions – CI/CD pipeline to deploy a Web App to Amazon EC2”. In this post, we will use that pipeline to include security checks and integrate it with Amazon CodeGuru Reviewer to analyze and detect potential security vulnerabilities in the code before deploying it.

Amazon CodeGuru Reviewer helps you improve code security and provides recommendations based on common vulnerabilities (OWASP Top 10) and AWS security best practices. CodeGuru analyzes Java and Python code and provides recommendations for remediation. CodeGuru Reviewer detects a deviation from best practices when using AWS APIs and SDKs, and also identifies concurrency issues, resource leaks, security vulnerabilities and validates input parameters. For every workflow run, CodeGuru Reviewer’s GitHub Action copies your code and build artifacts into an S3 bucket and calls CodeGuru Reviewer APIs to analyze the artifacts and provide recommendations. Refer to the code detector library here for more information about CodeGuru Reviewer’s security and code quality detectors.

With GitHub Actions, developers can easily integrate CodeGuru Reviewer into their CI workflows, conducting code quality and security analysis. They can view CodeGuru Reviewer recommendations directly within the GitHub user interface to quickly identify and fix code issues and security vulnerabilities. Any pull request or push to the master branch will trigger a scan of the changed lines of code, and scheduled pipeline runs will trigger a full scan of the entire repository, ensuring comprehensive analysis and continuous improvement.

Solution overview

The solution comprises of the following components:

  1. GitHub Actions – Workflow Orchestration tool that will host the Pipeline.
  2. AWS CodeDeploy – AWS service to manage deployment on Amazon EC2 Autoscaling Group.
  3. AWS Auto Scaling – AWS service to help maintain application availability and elasticity by automatically adding or removing Amazon EC2 instances.
  4. Amazon EC2 – Destination Compute server for the application deployment.
  5. Amazon CodeGuru – AWS Service to detect security vulnerabilities and automate code reviews.
  6. AWS CloudFormation – AWS infrastructure as code (IaC) service used to orchestrate the infrastructure creation on AWS.
  7. AWS Identity and Access Management (IAM) OIDC identity provider – Federated authentication service to establish trust between GitHub and AWS to allow GitHub Actions to deploy on AWS without maintaining AWS Secrets and credentials.
  8. Amazon Simple Storage Service (Amazon S3) – Amazon S3 to store deployment and code scan artifacts.

The following diagram illustrates the architecture:

Figure 1. Architecture Diagram of the proposed solution in the blog.

Figure 1. Architecture Diagram of the proposed solution in the blog

  1. Developer commits code changes from their local repository to the GitHub repository. In this post, the GitHub action is triggered manually, but this can be automated.
  2. GitHub action triggers the build stage.
  3. GitHub’s Open ID Connector (OIDC) uses the tokens to authenticate to AWS and access resources.
  4. GitHub action uploads the deployment artifacts to Amazon S3.
  5. GitHub action invokes Amazon CodeGuru.
  6. The source code gets uploaded into an S3 bucket when the CodeGuru scan starts.
  7. GitHub action invokes CodeDeploy.
  8. CodeDeploy triggers the deployment to Amazon EC2 instances in an Autoscaling group.
  9. CodeDeploy downloads the artifacts from Amazon S3 and deploys to Amazon EC2 instances.

Prerequisites

This blog post is a continuation of our previous post – Integrating with GitHub Actions – CI/CD pipeline to deploy a Web App to Amazon EC2. You will need to setup your pipeline by following instructions in that blog.

After completing the steps, you should have a local repository with the below directory structure, and one completed Actions run.

Figure 2. Directory structure

Figure 2. Directory structure

To enable automated deployment upon git push, you will need to make a change to your .github/workflow/deploy.yml file. Specifically, you can activate the automation by modifying the following line of code in the deploy.yml file:

From:

workflow_dispatch: {}

To:

  #workflow_dispatch: {}
  push:
    branches: [ main ]
  pull_request:

Solution walkthrough

The following steps provide a high-level overview of the walkthrough:

  1. Create an S3 bucket for the Amazon CodeGuru Reviewer.
  2. Update the IAM role to include permissions for Amazon CodeGuru.
  3. Associate the repository in Amazon CodeGuru.
  4. Add Vulnerable code.
  5. Update GitHub Actions Job to run the Amazon CodeGuru Scan.
  6. Push the code to the repository.
  7. Verify the pipeline.
  8. Check the Amazon CodeGuru recommendations in the GitHub user interface.

1. Create an S3 bucket for the Amazon CodeGuru Reviewer

    • When you run a CodeGuru scan, your code is first uploaded to an S3 bucket in your AWS account.

Note that CodeGuru Reviewer expects the S3 bucket name to begin with codeguru-reviewer-.

    • You can create this bucket using the bucket policy outlined in this CloudFormation template (JSON or YAML) or by following these instructions.

2.  Update the IAM role to add permissions for Amazon CodeGuru

  • Locate the role created in the pre-requisite section, named “CodeDeployRoleforGitHub”.
  • Next, create an inline policy by following these steps. Give it a name, such as “codegurupolicy” and add the following permissions to the policy.
{
    “Version”: “2012-10-17",
    “Statement”: [
        {
            “Action”: [
                “codeguru-reviewer:ListRepositoryAssociations”,
                “codeguru-reviewer:AssociateRepository”,
                “codeguru-reviewer:DescribeRepositoryAssociation”,
                “codeguru-reviewer:CreateCodeReview”,
                “codeguru-reviewer:DescribeCodeReview”,
                “codeguru-reviewer:ListRecommendations”,
                “iam:CreateServiceLinkedRole”
            ],
            “Resource”: “*”,
            “Effect”: “Allow”
        },
        {
            “Action”: [
                “s3:CreateBucket”,
                “s3:GetBucket*“,
                “s3:List*“,
                “s3:GetObject”,
                “s3:PutObject”,
                “s3:DeleteObject”
            ],
            “Resource”: [
                “arn:aws:s3:::codeguru-reviewer-*“,
                “arn:aws:s3:::codeguru-reviewer-*/*”
            ],
            “Effect”: “Allow”
        }
    ]
}

3.  Associate the repository in Amazon CodeGuru

Figure 3. associate the repository

Figure 3. Associate the repository

At this point, you will have completed your initial full analysis run. However, since this is a simple “helloWorld” program, you may not receive any recommendations. In the following steps, you will incorporate vulnerable code and trigger the analysis again, allowing CodeGuru to identify and provide recommendations for potential issues.

4.  Add Vulnerable code

  • Create a file application.conf
    at /aws-codedeploy-github-actions-deployment/spring-boot-hello-world-example
  • Add the following content in application.conf file.
db.default.url="postgres://test-ojxarsxivjuyjc:ubKveYbvNjQ5a0CU8vK4YoVIhl@ec2-54-225-223-40.compute-1.amazonaws.com:5432/dcectn1pto16vi?ssl=true&sslfactory=org.postgresql.ssl.NonValidatingFactory"

db.default.url=${?DATABASE_URL}

db.default.port="3000"

db.default.datasource.username="root"

db.default.datasource.password="testsk_live_454kjkj4545FD3434Srere7878"

db.default.jpa.generate-ddl="true"

db.default.jpa.hibernate.ddl-auto="create"

5. Update GitHub Actions Job to run Amazon CodeGuru Scan

  • You will need to add a new job definition in the GitHub Actions’ yaml file. This new section should be inserted between the Build and Deploy sections for optimal workflow.
  • Additionally, you will need to adjust the dependency in the deploy section to reflect the new flow: Build -> CodeScan -> Deploy.
  • Review sample GitHub actions code for running security scan on Amazon CodeGuru Reviewer.
codescan:
    needs: build
    runs-on: ubuntu-latest
    permissions:
      id-token: write
      contents: read
      security-events: write

    steps:
    
    - name: Download an artifact
      uses: actions/download-artifact@v2
      with:
          name: build-file 
    
    - name: Configure AWS credentials
      id: iam-role
      continue-on-error: true
      uses: aws-actions/configure-aws-credentials@v1
      with:
          role-to-assume: ${{ secrets.IAMROLE_GITHUB }}
          role-session-name: GitHub-Action-Role
          aws-region: ${{ env.AWS_REGION }}
    
    - uses: actions/checkout@v2
      if: steps.iam-role.outcome == 'success'
      with:
        fetch-depth: 0 

    - name: CodeGuru Reviewer
      uses: aws-actions/[email protected]
      if: ${{ always() }} 
      continue-on-error: false
      with:          
        s3_bucket: ${{ env.S3bucket_CodeGuru }} 
        build_path: .

    - name: Store SARIF file
      if: steps.iam-role.outcome == 'success'
      uses: actions/upload-artifact@v2
      with:
        name: SARIF_recommendations
        path: ./codeguru-results.sarif.json

    - name: Upload review result
      uses: github/codeql-action/upload-sarif@v2
      with:
        sarif_file: codeguru-results.sarif.json
    

    - run: |
          
          echo "Check for critical volnurability"
          count=$(cat codeguru-results.sarif.json | jq '.runs[].results[] | select(.level == "error") | .level' | wc -l)
          if (( $count > 0 )); then
            echo "There are $count critical findings, hence stopping the pipeline."
            exit 1
          fi
  • Refer to the complete file provided below for your reference. It is important to note that you will need to replace the following environment variables with your specific values.
    • S3bucket_CodeGuru
    • AWS_REGION
    • S3BUCKET
name: Build and Deploy

on:
    #workflow_dispatch: {}
  push:
    branches: [ main ]
  pull_request:

env:
  applicationfolder: spring-boot-hello-world-example
  AWS_REGION: us-east-1 # <replace this with your AWS region>
  S3BUCKET: *<Replace your bucket name here>*
  S3bucket_CodeGuru: codeguru-reviewer-<*replacebucketnameher*> # S3 Bucket with "codeguru-reviewer-*" prefix


jobs:
  build:
    name: Build and Package
    runs-on: ubuntu-latest
    permissions:
      id-token: write
      contents: read
    steps:
      - uses: actions/checkout@v2
        name: Checkout Repository

      - uses: aws-actions/configure-aws-credentials@v1
        with:
          role-to-assume: ${{ secrets.IAMROLE_GITHUB }}
          role-session-name: GitHub-Action-Role
          aws-region: ${{ env.AWS_REGION }}

      - name: Set up JDK 1.8
        uses: actions/setup-java@v1
        with:
          java-version: 1.8

      - name: chmod
        run: chmod -R +x ./.github

      - name: Build and Package Maven
        id: package
        working-directory: ${{ env.applicationfolder }}
        run: $GITHUB_WORKSPACE/.github/scripts/build.sh

      - name: Upload Artifact to s3
        working-directory: ${{ env.applicationfolder }}/target
        run: aws s3 cp *.war s3://${{ env.S3BUCKET }}/
      
      - name: Artifacts for codescan action
        uses: actions/upload-artifact@v2
        with:
          name: build-file
          path: ${{ env.applicationfolder }}/target/*.war           

  codescan:
    needs: build
    runs-on: ubuntu-latest
    permissions:
      id-token: write
      contents: read
      security-events: write

    steps:
    
    - name: Download an artifact
      uses: actions/download-artifact@v2
      with:
          name: build-file 
    
    - name: Configure AWS credentials
      id: iam-role
      continue-on-error: true
      uses: aws-actions/configure-aws-credentials@v1
      with:
          role-to-assume: ${{ secrets.IAMROLE_GITHUB }}
          role-session-name: GitHub-Action-Role
          aws-region: ${{ env.AWS_REGION }}
    
    - uses: actions/checkout@v2
      if: steps.iam-role.outcome == 'success'
      with:
        fetch-depth: 0 

    - name: CodeGuru Reviewer
      uses: aws-actions/[email protected]
      if: ${{ always() }} 
      continue-on-error: false
      with:          
        s3_bucket: ${{ env.S3bucket_CodeGuru }} 
        build_path: .

    - name: Store SARIF file
      if: steps.iam-role.outcome == 'success'
      uses: actions/upload-artifact@v2
      with:
        name: SARIF_recommendations
        path: ./codeguru-results.sarif.json

    - name: Upload review result
      uses: github/codeql-action/upload-sarif@v2
      with:
        sarif_file: codeguru-results.sarif.json
    

    - run: |
          
          echo "Check for critical volnurability"
          count=$(cat codeguru-results.sarif.json | jq '.runs[].results[] | select(.level == "error") | .level' | wc -l)
          if (( $count > 0 )); then
            echo "There are $count critical findings, hence stopping the pipeline."
            exit 1
          fi
  deploy:
    needs: codescan
    runs-on: ubuntu-latest
    environment: Dev
    permissions:
      id-token: write
      contents: read
    steps:
    - uses: actions/checkout@v2
    - uses: aws-actions/configure-aws-credentials@v1
      with:
        role-to-assume: ${{ secrets.IAMROLE_GITHUB }}
        role-session-name: GitHub-Action-Role
        aws-region: ${{ env.AWS_REGION }}
    - run: |
        echo "Deploying branch ${{ env.GITHUB_REF }} to ${{ github.event.inputs.environment }}"
        commit_hash=`git rev-parse HEAD`
        aws deploy create-deployment --application-name CodeDeployAppNameWithASG --deployment-group-name CodeDeployGroupName --github-location repository=$GITHUB_REPOSITORY,commitId=$commit_hash --ignore-application-stop-failures

6.  Push the code to the repository:

  • Remember to save all the files that you have modified.
  • To ensure that you are in your git repository folder, you can run the command:
git remote -v
  • The command should return the remote branch address, which should be similar to the following:
username@3c22fb075f8a GitActionsDeploytoAWS % git remote -v
 origin	[email protected]:<username>/GitActionsDeploytoAWS.git (fetch)
 origin	[email protected]:<username>/GitActionsDeploytoAWS.git (push)
  • To push your code to the remote branch, run the following commands:

git add . 
git commit -m “Adding Security Scan” 
git push

Your code has been pushed to the repository and will trigger the workflow as per the configuration in GitHub Actions.

7.  Verify the pipeline

  • Your pipeline is set up to fail upon the detection of a critical vulnerability. You can also suppress recommendations from CodeGuru Reviewer if you think it is not relevant for setup. In this example, as there are two critical vulnerabilities, the pipeline will not proceed to the next step.
  • To view the status of the pipeline, navigate to the Actions tab on your GitHub console. You can refer to the following image for guidance.
Figure 4. github actions pipeline

Figure 4. GitHub Actions pipeline

  • To view the details of the error, you can expand the “codescan” job in the GitHub Actions console. This will provide you with more information about the specific vulnerabilities that caused the pipeline to fail and help you to address them accordingly.
Figure 5. Codescan actions logs

Figure 5. Codescan actions logs

8. Check the Amazon CodeGuru recommendations in the GitHub user interface

Once you have run the CodeGuru Reviewer Action, any security findings and recommendations will be displayed on the Security tab within the GitHub user interface. This will provide you with a clear and convenient way to view and address any issues that were identified during the analysis.

Figure 6. security tab with results

Figure 6. Security tab with results

Clean up

To avoid incurring future charges, you should clean up the resources that you created.

  1. Empty the Amazon S3 bucket.
  2. Delete the CloudFormation stack (CodeDeployStack) from the AWS console.
  3. Delete codeguru Amazon S3 bucket.
  4. Disassociate the GitHub repository in CodeGuru Reviewer.
  5. Delete the GitHub Secret (‘IAMROLE_GITHUB’)
    1. Go to the repository settings on GitHub Page.
    2. Select Secrets under Actions.
    3. Select IAMROLE_GITHUB, and delete it.

Conclusion

Amazon CodeGuru is a valuable tool for software development teams looking to improve the quality and efficiency of their code. With its advanced AI capabilities, CodeGuru automates the manual parts of code review and helps identify performance, cost, security, and maintainability issues. CodeGuru also integrates with popular development tools and provides customizable recommendations, making it easy to use within existing workflows. By using Amazon CodeGuru, teams can improve code quality, increase development speed, lower costs, and enhance security, ultimately leading to better software and a more successful overall development process.

In this post, we explained how to integrate Amazon CodeGuru Reviewer into your code build pipeline using GitHub actions. This integration serves as a quality gate by performing code analysis and identifying challenges in your code. Now you can access the CodeGuru Reviewer recommendations directly within the GitHub user interface for guidance on resolving identified issues.

About the author:

Mahesh Biradar

Mahesh Biradar is a Solutions Architect at AWS. He is a DevOps enthusiast and enjoys helping customers implement cost-effective architectures that scale.

Suresh Moolya

Suresh Moolya is a Senior Cloud Application Architect with Amazon Web Services. He works with customers to architect, design, and automate business software at scale on AWS cloud.

Shikhar Mishra

Shikhar is a Solutions Architect at Amazon Web Services. He is a cloud security enthusiast and enjoys helping customers design secure, reliable, and cost-effective solutions on AWS.

Use Amazon Inspector to manage your build and deploy pipelines for containerized applications

Post Syndicated from Scott Ward original https://aws.amazon.com/blogs/security/use-amazon-inspector-to-manage-your-build-and-deploy-pipelines-for-containerized-applications/

Amazon Inspector is an automated vulnerability management service that continually scans Amazon Web Services (AWS) workloads for software vulnerabilities and unintended network exposure. Amazon Inspector currently supports vulnerability reporting for Amazon Elastic Compute Cloud (Amazon EC2) instances and container images stored in Amazon Elastic Container Registry (Amazon ECR).

With the emergence of Docker in 2013, container technology has quickly moved from the experimentation phase into a viable production tool. Many customers are using containers to modernize their existing applications or as the foundations for new applications or services that they build. In this blog post, we’ll explore the process that Amazon Inspector takes to scan container images. We’ll also show how you can integrate Amazon Inspector into your containerized application build and deployment pipeline, and control pipeline steps based on the results of an Amazon Inspector container image scan.

Solution overview and walkthrough

The solution outlined in this post covers a deployment pipeline modeled in AWS CodePipeline. The source for the pipeline is AWS CodeCommit, and the build of the container image is performed by AWS CodeBuild. The solution uses a collection of AWS Lambda functions and an Amazon DynamoDB table to evaluate the container image status and make an automated decision about deploying the container image. Finally, the pipeline has a deploy stage that will deploy the container image into an Amazon Elastic Container Service (Amazon ECS) cluster. In this section, I’ll outline the key components of the solution and how they work. In the following section, Deploy the solution, I’ll walk you through how to actually implement the solution.

Although this solution uses AWS continuous integration and continuous delivery (CI/CD) services such as CodePipeline and CodeBuild, you can also build similar capabilities by using third-party CI/CD solutions. In addition to CodeCommit, other third-party code repositories such as GitHub or Amazon Simple Storage Service (Amazon S3) can be substituted in as a source for the pipeline.

Solution architecture

Figure 1 shows the high-level architecture of the solution, which integrates Amazon Inspector into a container build and deploy pipeline.

Figure 1: Overall container build and deploy architecture

Figure 1: Overall container build and deploy architecture

The high-level workflow is as follows:

  1. You commit the image definition to a CodeCommit repository.
  2. An Amazon EventBridge rule detects the repository commit and initiates the container pipeline.
  3. The source stage of the pipeline pulls the image definition and build instructions from the CodeCommit repository.
  4. The build stage of the pipeline creates the container image and stores the final image in Amazon ECR.
  5. The ContainerVulnerabilityAssessment stage sends out a request for approval by using an Amazon Simple Notification Service (Amazon SNS) topic. A Lambda function associated with the topic stores the details about the container image and the active pipeline, which will be needed in order to send a response back to the pipeline stage.
  6. Amazon Inspector scans the Amazon ECR image for vulnerabilities.
  7. The Lambda function receives the Amazon Inspector scan summary message, through EventBridge, and makes a decision on allowing the image to be deployed. The function retrieves the pipeline approval details so that the approve or reject message is sent to the correct active pipeline stage.
  8. The Lambda function submits an Approved or Rejected status to the deployment pipeline.
  9. CodePipeline deploys the container image to an Amazon ECS cluster and completes the pipeline successfully if an approval is received. The pipeline status is set to Failed if the image is rejected.

Container image build stage

Let’s now review the build stage of the pipeline that is associated with the Amazon Inspector container solution. When a new commit is made to the CodeCommit repository, an EventBridge rule, which is configured to look for updates to the CodeCommit repository, initiates the CodePipeline source action. The source action then collects files from the source repository and makes them available to the rest of the pipeline stages. The pipeline then moves to the build stage.

In the build stage, CodeBuild extracts the Dockerfile that holds the container definition and the buildspec.yaml file that contains the overall build instructions. CodeBuild creates the final container image and then pushes the container image to the designated Amazon ECR repository. As part of the build, the image digest of the container image is stored as a variable in the build stage so that it can be used by later stages in the pipeline. Additionally, the build process writes the name of the container URI, and the name of the Amazon ECS task that the container should be associated with, to a file named imagedefinitions.json. This file is stored as an artifact of the build and will be referenced during the deploy phase of the pipeline.

Now that the image is stored in an Amazon ECR repository, Amazon Inspector scanning begins to check the image for vulnerabilities.

The details of the build stage are shown in Figure 2.

Figure 2: The container build stage

Figure 2: The container build stage

Container image approval stage

After the build stage is completed, the ContainerVulnerabilityAssessment stage begins. This stage is lightweight and consists of one stage action that is focused on waiting for an Approved or Rejected message for the container image that was created in the build stage. The ContainerVulnerabilityAssessment stage is configured to send an approval request message to an SNS topic. As part of the approval request message, the container image digest, from the build stage, will be included in the comments section of the message. The image digest is needed so that approval for the correct container image can be submitted later. Figure 3 shows the comments section of the approval action where the container image digest is referenced.

Figure 3: Container image digest reference in approval action configuration

Figure 3: Container image digest reference in approval action configuration

The SNS topic that the pipeline approval message is sent to is configured to invoke a Lambda function. The purpose of this Lambda function is to pull key details from the SNS message. Details retrieved from the SNS message include the pipeline name and stage, stage approval token, and the container image digest. The pipeline name, stage, and approval token are needed so that an approved or rejected response can be sent to the correct pipeline. The container image digest is the unique identifier for the container image and is needed so that it can be associated with the correct active pipeline. This information is stored in a DynamoDB table so that it can be referenced later when the step that assesses the result of an Amazon Inspector scan submits an approved or rejected decision for the container image. Figure 4 illustrates the flow from the approval stage through storing the pipeline approval data in DynamoDB.

Figure 4: Flow to capture container image approval details

Figure 4: Flow to capture container image approval details

This approval action will remain in a pending status until it receives an Approved or Rejected message or the timeout limit of seven days is reached. The seven-day timeout for approvals is the default for CodePipeline and cannot be changed. If no response is received in seven days, the stage and pipeline will complete with a Failed status.

Amazon Inspector and container scanning

When the container image is pushed to Amazon ECR, Amazon Inspector scans it for vulnerabilities.

In order to show how you can use the findings from an Amazon Inspector container scan in a build and deploy pipeline, let’s first review the workflow that occurs when Amazon Inspector scans a container image located in Amazon ECR.

Figure 5: Image push, scan, and notification workflow

Figure 5: Image push, scan, and notification workflow

The workflow diagram in Figure 5 outlines the steps that happen after an image is pushed to Amazon ECR all the way to messaging that the image has been successfully scanned and what the final scan results are. The steps in this workflow are as follows:

  1. The final container image is pushed to Amazon ECR by an individual or as part of a build.
  2. Amazon ECR sends a message indicating that a new image has been pushed.
  3. The message about the new image is received by Amazon Inspector.
  4. Amazon Inspector pulls a copy of the container image from Amazon ECR and performs a vulnerability scan.
  5. When Amazon Inspector is done scanning the image, a message summarizing the severity of vulnerabilities that were identified during the container image scan is sent to Amazon EventBridge. You can create EventBridge rules that match the vulnerability summary message to route the message onto a target for notifications or to enable further action to be taken.

Here’s a sample EventBridge pattern that matches the scan summary message from Amazon Inspector.

{
  "detail-type": ["Inspector2 Scan"],
  "source": ["aws.inspector2"]
}

This entire workflow, from ingesting the initial image to sending out the status on the Amazon Inspector scan, is fully managed. You just focus on how you want to use the Amazon Inspector scan status message to govern the approval and deployment of your container image.

The following is a sample of what the Amazon Inspector vulnerability summary message looks like. Note, in bold, the container image Amazon Resource Name (ARN), image repository ARN, message detail type, image digest, and the vulnerability summary.

{
    "version": "0",
    "id": "bf67fc08-f522-f598-6946-8e7b372ba426",
    "detail-type": "Inspector2 Scan",
    "source": "aws.inspector2",
    "account": "<account id>",
    "time": "2022-05-25T16:08:17Z",
    "region": "us-east-2",
    "resources":
    [
        "arn:aws:ecr:us-east-2:<account id>:repository/vuln-images/vulhub/rsync"
    ],
    "detail":
    {
        "scan-status": "INITIAL_SCAN_COMPLETE",
        "repository-name": "arn:aws:ecr:us-east-2:<account id>:repository/vuln-images/vulhub/rsync",
        "finding-severity-counts": { "CRITICAL": 3, "HIGH": 16, "MEDIUM": 4, "TOTAL": 24 },
        "image-digest": "sha256:21ae0e3b7b7xxxx",
        "image-tags":
        [
            "latest"
        ]
    }
}

Processing Amazon Inspector scan results

After Amazon Inspector sends out the scan status event, a Lambda function receives and processes that event. This function needs to consume the Amazon Inspector scan status message and make a decision about whether the image can be deployed.

The eval_container_scan_results Lambda function serves two purposes: The first is to extract the findings from the Amazon Inspector scan message that invoked the Lambda function. The second is to evaluate the findings based on thresholds that are defined as parameters in the Lambda function definition. Based on the threshold evaluation, the container image will be flagged as either Approved or Rejected. Figure 6 shows examples of thresholds that are defined for different Amazon Inspector vulnerability severities, as part of the Lambda function.

Figure 6: Vulnerability thresholds defined in Lambda environment variables

Figure 6: Vulnerability thresholds defined in Lambda environment variables

Based on the container vulnerability image results, the Lambda function determines whether the image should be approved or rejected for deployment. The function will retrieve the details about the current pipeline that the image is associated with from the DynamoDB table that was populated by the image approval action in the pipeline. After the details about the pipeline are retrieved, an Approved or Rejected message is sent to the pipeline approval action. If the status is Approved, the pipeline continues to the deploy stage, which will deploy the container image into the defined environment for that pipeline stage. If the status is Rejected, the pipeline status is set to Rejected and the pipeline will end.

Figure 7 highlights the key steps that occur within the Lambda function that evaluates the Amazon Inspector scan status message.

Figure 7: Amazon Inspector scan results decision

Figure 7: Amazon Inspector scan results decision

Image deployment stage

If the container image is approved, the final image is deployed to an Amazon ECS cluster. The deploy stage of the pipeline is configured with Amazon ECS as the action provider. The deploy action contains the name of the Amazon ECS cluster and stage that the container image should be deployed to. The image definition file (imagedefinitions.json) that was created in the build stage is also listed in the deploy configuration. When the deploy stage runs, it will create a revision to the existing Amazon ECS task definition. This task definition contains the name of the Amazon ECR image that has been approved for deployment. The task definition is then deployed to the Amazon ECS cluster and service.

Deploy the solution

Now that you have an understanding of how the container pipeline solution works, you can deploy the solution to your own AWS account. This section will walk you through the steps to deploy the container approval pipeline, and show you how to verify that each of the key steps is working.

Step 1: Activate Amazon Inspector in your AWS account

The sample solution provided by this blog post requires that you activate Amazon Inspector in your AWS account. If this service is not activated in your account, learn more about the free trial and pricing for this service, and follow the steps in Getting started with Amazon Inspector to set up the service and start monitoring your account.

Step 2: Deploy the AWS CloudFormation template

For this next step, make sure you deploy the template within the AWS account and AWS Region where you want to test this solution.

To deploy the CloudFormation stack

  1. Choose the following Launch Stack button to launch a CloudFormation stack in your account. Use the AWS Management Console navigation bar to choose the region you want to deploy the stack in.

    Select this image to open a link that starts building the CloudFormation stack

  2. Review the stack name and the parameters for the template. The parameters are pre-populated with the necessary values, and there is no need to change them.
  3. Scroll to the bottom of the Quick create stack screen and select the checkbox next to I acknowledge that AWS CloudFormation might create IAM resources.
  4. Choose Create stack. The deployment of this CloudFormation stack will take 3–5 minutes.

After the CloudFormation stack has deployed successfully, you can proceed to reviewing and interacting with the deployed solution.

Step 3: Review the container pipeline and supporting resources

The CloudFormation stack is designed to deploy a collection of resources that will be used for an initial container build. When the CodePipeline resource is created, it will automatically pull the assets from the CodeCommit repository and start the pipeline for the container image.

To review the pipeline and resources

  1. In the CodePipeline console, navigate to the Region that the stack was deployed in.
  2. Choose the pipeline named ContainerBuildDeployPipeline to show the full pipeline details.
  3. Review the Source and Build stage, which will show a status of Succeeded.
  4. Review the ContainerVulnerabilityAssessment stage, which will show as failed with a Rejected status in the Manual Approval step.

    Figure 8 shows the full completed pipeline.

    Figure 8: Rejected container pipeline

    Figure 8: Rejected container pipeline

  5. Choose the Details link in the Manual Approval stage to reveal the reasons for the rejection. An example review summary is shown in Figure 9.
    Figure 9: Container pipeline approval rejection

    Figure 9: Container pipeline approval rejection

Review findings in Amazon Inspector (Optional)

You can use the Amazon Inspector console to see the full findings detail for this container image, if needed.

To view the findings in Amazon Inspector

  1. In the Amazon Inspector console, under Findings, choose By repository.
  2. From the list of repositories, choose the inspector-blog-images repository.
  3. Choose the Image tag link to bring up a list of the individual vulnerabilities that were found within the container image. Figure 10 shows an example of the vulnerabilities list in the findings details.
    Figure 10: Container image findings in Amazon Inspector

    Figure 10: Container image findings in Amazon Inspector

Step 4: Adjust the Amazon ECS desired count for the cluster service

Up to this point, you’ve deployed a pipeline to build and validate the container image, and you’ve seen an example of how the pipeline handles a container image that did not meet the defined vulnerability thresholds. Now you’ll deploy a new container image that will pass a vulnerability assessment and complete the pipeline.

The Amazon ECS service that the CloudFormation template deploys is initially created with the number of desired tasks set to 0. In order to allow the container pipeline to successfully deploy a container, you need to update the desired tasks value.

To adjust the task count in Amazon ECS (console)

  1. In the Amazon ECS console, choose the link for the cluster, in this case InspectorBlogCluster.
  2. On the Services tab, choose the link for the service named InspectorBlogService.
  3. Choose the Update button. On the Configure service page, set Number of tasks to 1.
  4. Choose Skip to review, and then choose Update Service.

To adjust the task count in Amazon ECS (AWS CLI)

Alternatively, you can run the following AWS CLI command to update the desired task count to 1. In order to run this command, you need the ARN of the Amazon ECS cluster, which you can retrieve from the Output tab of the CloudFormation stack that you created. You can run this command from the command line of an environment of your choosing, or by using AWS CloudShell. Make sure to replace <Cluster ARN> with your own value.

$ aws ecs update-service --cluster <Cluster ARN> --service InspectorBlogService --desired-count 1

Step 5: Build and deploy a new container image

Deploying a new container image will involve pushing an updated Dockerfile to the ContainerComponentsRepo repository in CodeCommit. With CodeCommit you can interact by using standard Git commands from a command line prompt, and there are multiple approaches that you can take to connect to the AWS CodeCommit repository from the command line. For this post, in order to simplify the interactions with CodeCommit, you will be shown how to add an updated file directly through the CodeCommit console.

To add an updated Dockerfile to CodeCommit

  1. In the CodeCommit console, choose the repository named ContainerComponentsRepo.
  2. In the screen listing the repository files, choose the Dockerfile file link and choose Edit.
  3. In the Edit a file form, overwrite the existing file contents with the following command:
    FROM public.ecr.aws/amazonlinux/amazonlinux:latest
  4. In the Commit changes to main section, fill in the following fields.
    1. Author name: your name
    2. Email address: your email
    3. Commit message: ‘Updated Dockerfile’

    Figure 11 shows what the completed form should look like.

    Figure 11: Complete CodeCommit entry for an updated Dockerfile

    Figure 11: Complete CodeCommit entry for an updated Dockerfile

  5. Choose Commit changes to save the new Dockerfile.

This update to the Dockerfile will immediately invoke a new instance of the container pipeline, where the updated container image will be pulled and evaluated by Amazon Inspector.

Step 6: Verify the container image approval and deployment

With a new pipeline initiated through the push of the updated Dockerfile, you can now review the overall pipeline to see that the container image was approved and deployed.

To see the full details in CodePipeline

  1. In the CodePipeline console, choose the container-build-deploy pipeline. You should see the container pipeline in an active status. In about five minutes, you should see the ContainerVulnerabilityAssessment stage move to completed with an Approved status, and the deploy stage should show a Succeeded status.
  2. To confirm that the final image was deployed to the Amazon ECS cluster, from the Deploy stage, choose Details. This will open a new browser tab for the Amazon ECS service.
  3. In the Amazon ECS console, choose the Tasks tab. You should see a task with Last status showing RUNNING. This is confirmation that the image was successfully approved and deployed through the container pipeline. Figure 12 shows where the task definition and status are located.
    Figure 12: Task status after deploying the container image

    Figure 12: Task status after deploying the container image

  4. Choose the task definition to bring up the latest task definition revision, which was created by the deploy stage of the container pipeline.
  5. Scroll down in the task definition screen to the Container definitions section. Note that the task is tied to the image you deployed, providing further verification that the approved container image was successfully deployed. Figure 13 shows where the container definition can be found and what you should expect to see.
    Figure 13: Container associated with revised task definition

    Figure 13: Container associated with revised task definition

Clean up the solution

When you’re finished deploying and testing the solution, use the following steps to remove the solution stack from your account.

To delete images from the Amazon ECR repository

  1. In the Amazon ECR console, navigate to the AWS account and Region where you deployed the solution.
  2. Choose the link for the repository named inspector-blog-images.
  3. Delete all of the images that are listed in the repository.

To delete objects in the CodePipeline artifact bucket

  1. In the Amazon S3 console in your AWS account, locate the bucket whose name starts with blog-base-setup-codepipelineartifactstorebucket.
  2. Delete the ContainerBuildDeploy folder that is in the bucket.

To delete the CloudFormation stack

  • In the CloudFormation console, delete the CloudFormation stack that was created to perform the steps in this post.

Conclusion

This post describes a solution that allows you to build your container images, have the images scanned for vulnerabilities by Amazon Inspector, and use the output from Amazon Inspector to determine whether the image should be allowed to be deployed into your environments.

This solution represents a pipeline with very simple build and deploy stages. Your pipeline will vary and may consist of multiple test stages and deployment stages for multiple environments. Additionally, the logic you use to determine whether a container image should be deployed may be different. The contents of this blog post are intended to help serve as a foundation that you can build on as you decide how to use Amazon Inspector for container vulnerability scanning. Feel free to use this guidance, and the example we provided, to extend the solution into your specific deployment pipeline.

 
If you have questions, contact AWS Support, or start a new thread on the AWS re:Post Amazon Inspector Forum. If you have feedback about this post, submit comments in the Comments section below.

Want more AWS Security news? Follow us on Twitter.

Scott Ward

Scott Ward

Scott is a Principal Solutions Architect with the External Security Services (ESS) product team and has been with Amazon for over 20 years. Scott provides technical guidance to customers on how to use security services to protect their AWS environments. Past roles included technical lead for the AWS security partner segment and member of the technical team for Amazon.com’s global financial systems.

Integrating Cloud Security With DevOps and CI/CD Tools

Post Syndicated from Clint Merrill original https://blog.rapid7.com/2022/09/09/integrating-cloud-security-with-devops-and-ci-cd-tools/

Integrating Cloud Security With DevOps and CI/CD Tools

This is the latest post in our blog series on shifting left in cloud security. In our last post, we kicked off the series with a high-level overview about Rapid7’s approach to shifting cloud security into the application development lifecycle. For this post, we’ll dive into a key aspect of our approach: integrating cloud security with developer and DevOps tooling.

Incentivizing adoption by reducing friction

When integrating security into any part of the development lifecycle there are some important factors to consider, including the security tools you’ll integrate, the processes you’ll ask developers to follow, and how aggressively you intend to enforce certain policies. When making these decisions, it’s important to consider the goals of adopting DevOps practices and infrastructure as code (IaC) respectively: to improve the velocity of application development and delivery, and to empower development teams to provision cloud infrastructure resources on a self-service basis.  

Infusing security into these goals requires guardrails and routine checks to make sure the need for speed doesn’t create vulnerabilities or potentially exploitable misconfigurations. For IaC development, this is accomplished by having individual developers scan templates and plans as early as possible, and at key points in the CI/CD pipeline, before they’re considered for use in staging or production deployment. This is much easier said than done, as it relies on organizational buy-in, particularly from the developers who are typically laser-focused on bringing new products and features to market as fast as possible with the highest quality possible.

As with anything that relies on multiple teams collaborating in a process, the goal is to make it as easy as possible to adopt and demonstrate tangible value to all involved. Shifting security left into the software development lifecycle (SDLC) via developers and CI/CD tool integrations is a perfect application of this. One common example is allowing developers to execute scans on IaC templates or plans prior to a push or pull request, using a local command-line interface (CLI) tool.

The comfort of the CLI

In this context, a CLI tool allows a developer to interact with IaC security scanning features via a terminal prompt for familiarity and convenience. This comfortable experience will encourage adoption by using the CLI rather than engaging with a security product interface or API directly. In late 2021, we released our first CLI tool to initiate IaC scans in InsightCloudSec (ICS): mimics.

mimics has many intended uses that will expand over the time, but for now, the primary goals are:

  1. Enabling developers to execute on-demand security scans of their IaC plans and templates with results delivered directly in the CLI, thereby shortening the discovery and feedback loop for security and compliance issues to the point of immediate remediation
  2. Enabling DevOps teams to easily integrate IaC security scans at any point in the CI/CD workflow, thereby standardizing the process and enforcing security compliance checks and remediation as needed before progressing to the next integration or deployment step

In all cases, the mimics CLI simplifies integration and doesn’t require more costly script-based integration with the ICS API.  In some cases, unique IaC security capabilities are exclusively available via mimics.

Introducing GitHub Actions integration

InsightCloudSec recently launched a GitHub Action to facilitate a bidirectional integration with our IaC scanning feature. Our goal is to streamline the incorporation of IaC security scans into your cloud application CI/CD process governed by GitHub. If you’re not familiar with GitHub Actions, they allow you to automate, customize, and execute workflow steps, including security and compliance checks. In doing so, users can discover, create, and share Actions with other community members.

A great use of the mimics CLI is to integrate with GitHub using our Action to trigger an ICS IaC scan at defined points in your workflow. Upon completion of the scan, you’ll receive an overall pass/fail result in reply, as well as detailed findings, if any, in SARIF format for display in the GitHub Advanced Security module as security alerts. If you don’t subscribe to the GitHub Advance Security module, you can still trigger IaC security scans and receive an overall pass/fail result to govern the workflow step, plus a detailed findings report in one of various readable formats.

More DevOps tool integrations on the way

As you can see, Rapid7’s InsightCloudSec is meeting developers and DevOps teams where they are today and expanding in the near future. We want to make integrating security controls by development teams easier. And we aren’t stopping there. We have a deep roadmap of additional integrations that will be coming soon. However, it’s important to note that you’re not limited by our formal integrations. The mimics CLI makes your custom integrations a snap, and we have examples in our product documents.

We understand the profound impact shifting security left can have on organizational buy-in, overall team efficiency, and of course, cloud security outcomes. Keep an eye out for upcoming enhancements that will further help you seamlessly integrate security throughout the entire SDLC.

If you’re interested in learning more about how InsightCloudSec helps your team get contextualized insight into your cloud security and risk posture, be sure to check out our bi-weekly demo series Gaining Layered Context in Cloud Security, which goes live every other Wednesday at 1pm EST.

Additional reading:

NEVER MISS A BLOG

Get the latest stories, expertise, and news about security today.

What It Takes to Securely Scale Cloud Environments at Tech Companies Today

Post Syndicated from Ben Austin original https://blog.rapid7.com/2022/05/25/what-it-takes-to-securely-scale-cloud-environments-at-tech-companies-today/

What It Takes to Securely Scale Cloud Environments at Tech Companies Today

In January 2021, foreign trade marketing platform SocialArks was the target of a massive cyberattack. Security Magazine reported that the rapidly growing startup experienced a breach of over 214 million social media profiles and 400GB of data, exposing users’ names, phone numbers, email addresses, subscription data, and other sensitive information across Facebook, Instagram, and LinkedIn. According to Safety Detectives, the breach affected more than 318 million records in total, including those of high-profile influencers in the United States, China, the Netherlands, South Korea, and more.

The cause? A misconfigured database.

SocialArks’s Elasticsearch database contained scraped data from hundreds of millions of social media users from all around the world. The database was publicly exposed without password encryption or protection, meaning that any bad actor in possession of the company’s server IP address could easily access the private data.

What can tech companies learn from what happened to SocialArks?

One wrong misconfiguration can lead to major consequences — from reputational damage to revenue loss. As the cloud becomes increasingly pervasive and complex, tech companies know they must take advantage of innovative services to scale up. At the same time, DevOps and security teams must work together to ensure that they are using the cloud securely, from development to production.

Here are three ways to help empower your teams to take advantage of the many benefits of public cloud infrastructure without sacrificing security.

1. Improve visibility

Tech companies – probably more than those in any other industry – are keen to take advantage of the endless stream of new and innovative services coming from public cloud providers like AWS, Azure, and GCP. From more traditional cloud offerings like containers and databases to advanced machine learning, data analytics, and remote application delivery, developers at tech companies love to explore new cloud services as a means to spur innovation.

The challenge for security, of course, is that the sheer complexity of the average enterprise tech company’s cloud footprint is dizzying, not to mention the rapid rate of change. For example, a cloud environment with 10,000 compute instances can expect a daily churn of 20%, including auto-scaling groups, new and re-deployments of infrastructure and workloads, ongoing changes, and more. That means over the course of a year, security teams must monitor and apply guardrails to over 700,000 individual instances.

It’s easy for security (and operations) teams to wind up without unified visibility into what cloud services their development teams are using at any given point in time. Without a purpose-built multicloud security solution in place, there’s just no way to continuously monitor cloud and container services and maintain insight into potential risks.

It is entirely possible, however, to gain visibility. More than that, it’s necessary if you want to continue to scale. In the cloud world, the old security adage applies: You can’t secure what you can’t see. Total visibility into all cloud resources can help security teams quickly detect changes that could open the organization up to risk. With visibility in place, you can more readily assess risks, identify and remediate issues, and ensure continuous compliance with relevant regulations.

2. Create a culture of security

No one wants their DevOps and security teams to be working in opposition, especially in a rapid growth period. When you uphold DevSecOps principles, you eliminate the friction between DevOps and security professionals. There’s no need to “circle back” after an initial release or “push pause” on a scheduled deployment when securing the cloud throughout the CI/CD pipeline is just part of how the business operates. A culture that values security is vital when it comes to rapid scaling. You can’t rely on each individual to “do the right thing,” so you’re much better off building security into your culture on a deep level.

When it comes to timing your culture shift, all signs point to now. Fortune notes that while the pandemic-era adoption of hybrid work provides unprecedented flexibility and accessibility, it also can create a “nightmare scenario” with “hundreds (or thousands) of new vectors through which malicious actors can gain a foothold in your network.” Gartner reports that cloud security saw the largest spending increase of all other information security and risk management segments in 2021, ticking up by 41%. Yet, a survey by Cloud Security Alliance revealed that 76% of professionals polled fear that the risk of cloud misconfigurations will stay the same or increase.

Given these numbers, encouraging a culture of security is a present necessity, not a future concern. But how do you know when you’ve successfully created one?

The answer: When all parts of your team see cybersecurity as just another part of their job.

Of course, that’s easier said than done. Creating a culture of security requires processes that provide context and early feedback to developers, meaning that command and control is no longer security’s fallback position. Instead, collaboration should be the name of the game. Making security easy is what bridges the historical cultural divide between security and DevOps.

The utopia version of DevSecOps promises seamless collaboration – but each team has plenty on their own plates to worry about. How can tech companies foster a culture of security while optimizing their existing resources and workflows?

3. Focus on security by design

TrendMicro reports that simple cloud infrastructure misconfigurations account for 65% to 70% of all cloud security challenges. The Ponemon Institute and IBM found that the average cost of a data breach in 2021 was $4.24 million – the highest average cost ever recorded in the report’s 17-year history. That same report found that organizations with more mature cloud security practices were able to contain breaches on average 77 days faster than those with less mature strategies.

Security professionals are human, too. They can only be in so many places at once. With talent already scarce, you want your security team to focus on creating new strategies, without getting bogged down by simple fixes.

That’s why integrating security measures into the dev cycle framework can help you move towards achieving that balance between speed and security. Embedding checks within the development process is one way to empower early detection, saving your team’s time and resources.

This approach helps catch problems like policy violations or misconfigurations without sacrificing the speed that developers love or the safety that security professionals need. Plus, building security into your development processes will empower your dev teams to correct issues right away as they’re alerted, making that last deployment the breath of relief it should be.

When you integrate security and compliance checks early in the dev lifecycle, you can prevent the majority of vulnerabilities from cropping up in the first place — meaning your dev and sec teams can rest easy knowing that their infrastructure as code (IaC) templates are secure from the beginning.

How to get started: Empower secure development

Get your developers implementing security without having to onboard them to an entirely new role. By integrating and automating security checks into the workflows and tools your DevOps teams already know and love, you empower them to prioritize both speed and security.

Taking on even one of the three strategies described above can be intimidating. We suggest getting started by focusing on actionable steps, which we cover in depth in our eBook below.

Scaling securely is possible. Want to learn more? Read up on 6 Strategies to Empower Secure Innovation at Enterprise Tech Companies to tackle the unique cloud security challenges facing the tech industry.

Additional reading:

NEVER MISS A BLOG

Get the latest stories, expertise, and news about security today.

Continuous runtime security monitoring with AWS Security Hub and Falco

Post Syndicated from Rajarshi Das original https://aws.amazon.com/blogs/security/continuous-runtime-security-monitoring-with-aws-security-hub-and-falco/

Customers want a single and comprehensive view of the security posture of their workloads. Runtime security event monitoring is important to building secure, operationally excellent, and reliable workloads, especially in environments that run containers and container orchestration platforms. In this blog post, we show you how to use services such as AWS Security Hub and Falco, a Cloud Native Computing Foundation project, to build a continuous runtime security monitoring solution.

With the solution in place, you can collect runtime security findings from multiple AWS accounts running one or more workloads on AWS container orchestration platforms, such as Amazon Elastic Kubernetes Service (Amazon EKS) or Amazon Elastic Container Service (Amazon ECS). The solution collates the findings across those accounts into a designated account where you can view the security posture across accounts and workloads.


Solution overview

Security Hub collects security findings from other AWS services using a standardized AWS Security Findings Format (ASFF). Falco provides the ability to detect security events at runtime for containers. Partner integrations like Falco are also available on Security Hub and use ASFF. Security Hub provides a custom integrations feature using ASFF to enable collection and aggregation of findings that are generated by custom security products.

The solution in this blog post uses AWS FireLens, Amazon CloudWatch Logs, and AWS Lambda to enrich logs from Falco and populate Security Hub.

Figure : Architecture diagram of continuous runtime security monitoring

Figure 1: Architecture diagram of continuous runtime security monitoring

Here’s how the solution works, as shown in Figure 1:

  1. An AWS account is running a workload on Amazon EKS.
    1. Runtime security events detected by Falco for that workload are sent to CloudWatch logs using AWS FireLens.
    2. CloudWatch logs act as the source for FireLens and a trigger for the Lambda function in the next step.
    3. The Lambda function transforms the logs into the ASFF. These findings can now be imported into Security Hub.
    4. The Security Hub instance that is running in the same account as the workload running on Amazon EKS stores and processes the findings provided by Lambda and provides the security posture to users of the account. This instance also acts as a member account for Security Hub.
  2. Another AWS account is running a workload on Amazon ECS.
    1. Runtime security events detected by Falco for that workload are sent to CloudWatch logs using AWS FireLens.
    2. CloudWatch logs acts as the source for FireLens and a trigger for the Lambda function in the next step.
    3. The Lambda function transforms the logs into the ASFF. These findings can now be imported into Security Hub.
    4. The Security Hub instance that is running in the same account as the workload running on Amazon ECS stores and processes the findings provided by Lambda and provides the security posture to users of the account. This instance also acts as another member account for Security Hub.
  3. The designated Security Hub administrator account combines the findings generated by the two member accounts, and then provides a comprehensive view of security alerts and security posture across AWS accounts. If your workloads span multiple regions, Security Hub supports aggregating findings across Regions.


Prerequisites

For this walkthrough, you should have the following in place:

  1. Three AWS accounts.

    Note: We recommend three accounts so you can experience Security Hub’s support for a multi-account setup. However, you can use a single AWS account instead to host the Amazon ECS and Amazon EKS workloads, and send findings to Security Hub in the same account. If you are using a single account, skip the following account specific-guidance. If you are integrated with AWS Organizations, the designated Security Hub administrator account will automatically have access to the member accounts.

  2. Security Hub set up with an administrator account on one account.
  3. Security Hub set up with member accounts on two accounts: one account to host the Amazon EKS workload, and one account to host the Amazon ECS workload.
  4. Falco set up on the Amazon EKS and Amazon ECS clusters, with logs routed to CloudWatch Logs using FireLens. For instructions on how to do this, see:

    Important: Take note of the names of the CloudWatch Logs groups, as you will need them in the next section.

  5. AWS Cloud Development Kit (CDK) installed on the member accounts to deploy the solution that provides the custom integration between Falco and Security Hub.


Deploying the solution

In this section, you will learn how to deploy the solution and enable the CloudWatch Logs group. Enabling the CloudWatch Logs group is the trigger for running the Lambda function in both member accounts.

To deploy this solution in your own account

  1. Clone the aws-securityhub-falco-ecs-eks-integration GitHub repository by running the following command.
    $git clone https://github.com/aws-samples/aws-securityhub-falco-ecs-eks-integration
  2. Follow the instructions in the README file provided on GitHub to build and deploy the solution. Make sure that you deploy the solution to the accounts hosting the Amazon EKS and Amazon ECS clusters.
  3. Navigate to the AWS Lambda console and confirm that you see the newly created Lambda function. You will use this function in the next section.
Figure : Lambda function for Falco integration with Security Hub

Figure 2: Lambda function for Falco integration with Security Hub

To enable the CloudWatch Logs group

  1. In the AWS Management Console, select the Lambda function shown in Figure 2—AwsSecurityhubFalcoEcsEksln-lambdafunction—and then, on the Function overview screen, select + Add trigger.
  2. On the Add trigger screen, provide the following information and then select Add, as shown in Figure 3.
    • Trigger configuration – From the drop-down, select CloudWatch logs.
    • Log group – Choose the Log group you noted in Step 4 of the Prerequisites. In our setup, the log group for the Amazon ECS and Amazon EKS clusters, deployed in separate AWS accounts, was set with the same value (falco).
    • Filter name – Provide a name for the filter. In our example, we used the name falco.
    • Filter pattern – optional – Leave this field blank.
    Figure 3: Lambda function trigger - CloudWatch Log group

    Figure 3: Lambda function trigger – CloudWatch Log group

  3. Repeat these steps (as applicable) to set up the trigger for the Lambda function deployed in other accounts.


Testing the deployment

Now that you’ve deployed the solution, you will verify that it’s working.

With the default rules, Falco generates alerts for activities such as:

  • An attempt to write to a file below the /etc folder. The /etc folder contains important system configuration files.
  • An attempt to open a sensitive file (such as /etc/shadow) for reading.

To test your deployment, you will attempt to perform these activities to generate Falco alerts that are reported as Security Hub findings in the same account. Then you will review the findings.

To test the deployment in member account 1

  1. Run the following commands to trigger an alert in member account 1, which is running an Amazon EKS cluster. Replace <container_name> with your own value.
    kubectl exec -it <container_name> /bin/bash
    touch /etc/5
    cat /etc/shadow > /dev/null
  2. To see the list of findings, log in to your Security Hub admin account and navigate to Security Hub > Findings. As shown in Figure 4, you will see the alerts generated by Falco, including the Falco-generated title, and the instance where the alert was triggered.

    Figure 4: Findings in Security Hub

    Figure 4: Findings in Security Hub

  3. To see more detail about a finding, check the box next to the finding. Figure 5 shows some of the details for the finding Read sensitive file untrusted.
    Figure 5: Sensitive file read finding - detail view

    Figure 5: Sensitive file read finding – detail view

    Figure 6 shows the Resources section of this finding, that includes the instance ID of the Amazon EKS cluster node. In our example this is the Amazon Elastic Compute Cloud (Amazon EC2) instance.

    Figure 6: Resource Detail in Security Hub finding

To test the deployment in member account 2

  1. Run the following commands to trigger a Falco alert in member account 2, which is running an Amazon ECS cluster. Replace <<container_id> with your own value.
    docker exec -it <container_id> bash
    touch /etc/5
    cat /etc/shadow > /dev/null
  2. As in the preceding example with member account 1, to view the findings related to this alert, navigate to your Security Hub admin account and select Findings.

To view the collated findings from both member accounts in Security Hub

  1. In the designated Security Hub administrator account, navigate to Security Hub > Findings. The findings from both member accounts are collated in the designated Security Hub administrator account. You can use this centralized account to view the security posture across accounts and workloads. Figure 7 shows two findings, one from each member account, viewable in the Single Pane of Glass administrator account.

    Figure 7: Write below /etc findings in a single view

    Figure 7: Write below /etc findings in a single view

  2. To see more information and a link to the corresponding member account where the finding was generated, check the box next to the finding. Figure 8 shows the account detail associated with a specific finding in member account 1.
    Figure 8: Write under /etc detail view in Security Hub admin account

    Figure 8: Write under /etc detail view in Security Hub admin account

    By centralizing and enriching the findings from Falco, you can take action more quickly or perform automated remediation on the impacted resources.


Cleaning up

To clean up this demo:

  1. Delete the CloudWatch Logs trigger from the Lambda functions that were created in the section To enable the CloudWatch Logs group.
  2. Delete the Lambda functions by deleting the CloudFormation stack, created in the section To deploy this solution in your own account.
  3. Delete the Amazon EKS and Amazon ECS clusters created as part of the Prerequisites.


Conclusion

In this post, you learned how to achieve multi-account continuous runtime security monitoring for container-based workloads running on Amazon EKS and Amazon ECS. This is achieved by creating a custom integration between Falco and Security Hub.

You can extend this solution in a number of ways. For example:

  • You can forward findings across accounts using a single source to security information and event management (SIEM) tools such as Splunk.
  • You can perform automated remediation activities based on the findings generated, using Lambda.

To learn more about managing a centralized Security Hub administrator account, see Managing administrator and member accounts. To learn more about working with ASFF, see AWS Security Finding Format (ASFF) in the documentation. To learn more about the Falco engine and rule structure, see the Falco documentation.

If you have feedback about this post, submit comments in the Comments section below.

Want more AWS Security news? Follow us on Twitter.

Rajarshi Das

Rajarshi Das

Rajarshi is a Solutions Architect at Amazon Web Services. He focuses on helping Public Sector customers accelerate their security and compliance certifications and authorizations by architecting secure and scalable solutions. Rajarshi holds 4 AWS certifications including AWS Certified Solutions Architect – Professional and AWS Certified Security – Specialist.

Author

Adam Cerini

Adam is a Senior Solutions Architect with Amazon Web Services. He focuses on helping Public Sector customers architect scalable, secure, and cost effective systems. Adam holds 5 AWS certifications including AWS Certified Solutions Architect – Professional and AWS Certified Security – Specialist.

Forensic investigation environment strategies in the AWS Cloud

Post Syndicated from Sol Kavanagh original https://aws.amazon.com/blogs/security/forensic-investigation-environment-strategies-in-the-aws-cloud/

When a deviation from your secure baseline occurs, it’s crucial to respond and resolve the issue quickly and follow up with a forensic investigation and root cause analysis. Having a preconfigured infrastructure and a practiced plan for using it when there’s a deviation from your baseline will help you to extract and analyze the information needed to determine the impact, scope, and root cause of an incident and return to operations confidently.

Time is of the essence in understanding the what, how, who, where, and when of a security incident. You often hear of automated incident response, which has repeatable and auditable processes to standardize the resolution of incidents and accelerate evidence artifact gathering.

Similarly, having a standard, pristine, pre-configured, and repeatable forensic clean-room environment that can be automatically deployed through a template allows your organization to minimize human interaction, keep the larger organization separate from contamination, hasten evidence gathering and root cause analysis, and protect forensic data integrity. The forensic analysis process assists in data preservation, acquisition, and analysis to identify the root cause of an incident. This approach can also facilitate the presentation or transfer of evidence to outside legal entities or auditors. AWS CloudFormation templates—or other infrastructure as code (IaC) provisioning tools—help you to achieve these goals, providing your business with consistent, well-structured, and auditable results that allow for a better overall security posture. Having these environments as a permanent part of your infrastructure allows them to be well documented and tested, and gives you opportunities to train your teams in their use.

This post provides strategies that you can use to prepare your organization to respond to secure baseline deviations. These strategies take the form of best practices around Amazon Web Services (AWS) account structure, AWS Organizations organizational units (OUs) and service control policies (SCPs), forensic Amazon Virtual Private Cloud (Amazon VPC) and network infrastructure, evidence artifacts to be collected, AWS services to be used, forensic analysis tool infrastructure, and user access and authorization to the above. The specific focus is to provide an environment where Amazon Elastic Compute Cloud (Amazon EC2) instances with forensic tooling can be used to examine evidence artifacts.

This post presumes that you already have an evidence artifact collection procedure or that you are implementing one and that the evidence can be transferred to the accounts described here. If you are looking for advice on how to automate artifact collection, see How to automate forensic disk collection for guidance.

Infrastructure overview

A well-architected multi-account AWS environment is based on the structure provided by Organizations. As companies grow and need to scale their infrastructure with multiple accounts, often in multiple AWS Regions, Organizations offers programmatic creation of new AWS accounts combined with central management and governance that helps them to do so in a controlled and standardized manner. This programmatic, centralized approach should be used to create the forensic investigation environments described in the strategy in this blog post.

The example in this blog post uses a simplified structure with separate dedicated OUs and accounts for security and forensics, shown in Figure 1. Your organization’s architecture might differ, but the strategy remains the same.

Note: There might be reasons for forensic analysis to be performed live within the compromised account itself, such as to avoid shutting down or accessing the compromised instance or resource; however, that approach isn’t covered here.

Figure 1: AWS Organizations forensics OU example

Figure 1: AWS Organizations forensics OU example

The most important components in Figure 1 are:

  • A security OU, which is used for hosting security-related access and services. The security OU and the associated AWS accounts should be owned and managed by your security organization.
  • A forensics OU, which should be a separate entity, although it can have some similarities and crossover responsibilities with the security OU. There are several reasons for having it within a separate OU and account. Some of the more important reasons are that the forensics team might be a different team than the security team (or a subset of it), certain investigations might be under legal hold with additional access restrictions, or a member of the security team could be the focus of an investigation.

When speaking about Organizations, accounts, and the permissions required for various actions, you must first look at SCPs, a core functionality of Organizations. SCPs offer control over the maximum available permissions for all accounts in your organization. In the example in this blog post, you can use SCPs to provide similar or identical permission policies to all the accounts under the forensics OU, which is being used as a resource container. This policy overrides all other policies, and is a crucial mechanism to ensure that you can explicitly deny or allow any API calls desired. Some use cases of SCPs are to restrict the ability to disable AWS CloudTrail, restrict root user access, and ensure that all actions taken in the forensic investigation account are logged. This provides a centralized way to avoid changing individual policies for users, groups, or roles. Accessing the forensic environment should be done using a least-privilege model, with nobody capable of modifying or compromising the initially collected evidence. For an investigation environment, denying all actions except those you want to list as exceptions is the most straightforward approach. Start with the default of denying all, and work your way towards the least authorizations needed to perform the forensic processes established by your organization. AWS Config can be a valuable tool to track the changes made to the account and provide evidence of these changes.

Keep in mind that once the restrictive SCP is applied, even the root account or those with administrator access won’t have access beyond those permissions; therefore, frequent, proactive testing as your environment changes is a best practice. Also, be sure to validate which principals can remove the protective policy, if required, to transfer the account to an outside entity. Finally, create the environment before the restrictive permissions are applied, and then move the account under the forensic OU.

Having a separate AWS account dedicated to forensic investigations is best to keep your larger organization separate from the possible threat of contamination from the incident itself, ensure the isolation and protection of the integrity of the artifacts being analyzed, and keeping the investigation confidential. Separate accounts also avoid situations where the threat actors might have used all the resources immediately available to your compromised AWS account by hitting service quotas and so preventing you from instantiating an Amazon EC2 instance to perform investigations.

Having a forensic investigation account per Region is also a good practice, as it keeps the investigative capabilities close to the data being analyzed, reduces latency, and avoids issues of the data changing regulatory jurisdictions. For example, data residing in the EU might need to be examined by an investigative team in North America, but the data itself cannot be moved because its North American architecture doesn’t align with GDPR compliance. For global customers, forensics teams might be situated in different locations worldwide and have different processes. It’s better to have a forensic account in the Region where an incident arose. The account as a whole could also then be provided to local legal institutions or third-party auditors if required. That said, if your AWS infrastructure is contained within Regions only in one jurisdiction or country, then a single re-creatable account in one Region with evidence artifacts shared from and kept in their respective Regions could be an easier architecture to manage over time.

An account created in an automated fashion using a CloudFormation template—or other IaC methods—allows you to minimize human interaction before use by recreating an entirely new and untouched forensic analysis instance for each separate investigation, ensuring its integrity. Individual people will only be given access as part of a security incident response plan, and even then, permissions to change the environment should be minimal or none at all. The post-investigation environment would then be either preserved in a locked state or removed, and a fresh, blank one created in its place for the subsequent investigation with no trace of the previous artifacts. Templating your environment also facilitates testing to ensure your investigative strategy, permissions, and tooling will function as intended.

Accessing your forensics infrastructure

Once you’ve defined where your investigative environment should reside, you must think about who will be accessing it, how they will do so, and what permissions they will need.

The forensic investigation team can be a separate team from the security incident response team, the same team, or a subset. You should provide precise access rights to the group of individuals performing the investigation as part of maintaining least privilege.

You should create specific roles for the various needs of the forensic procedures, each with only the permissions required. As with SCPs and other situations described here, start with no permissions and add authorizations only as required while establishing and testing your templated environments. As an example, you might create the following roles within the forensic account:

Responder – acquire evidence

Investigator – analyze evidence

Data custodian – manage (copy, move, delete, and expire) evidence

Analyst – access forensics reports for analytics, trends, and forecasting (threat intelligence)

You should establish an access procedure for each role, and include it in the response plan playbook. This will help you ensure least privilege access as well as environment integrity. For example, establish a process for an owner of the Security Incident Response Plan to verify and approve the request for access to the environment. Another alternative is the two-person rule. Alert on log-in is an additional security measure that you can add to help increase confidence in the environment’s integrity, and to monitor for unauthorized access.

You want the investigative role to have read-only access to the original evidence artifacts collected, generally consisting of Amazon Elastic Block Store (Amazon EBS) snapshots, memory dumps, logs, or other artifacts in an Amazon Simple Storage Service (Amazon S3) bucket. The original sources of evidence should be protected; MFA delete and S3 versioning are two methods for doing so. Work should be performed on copies of copies if rendering the original immutable isn’t possible, especially if any modification of the artifact will happen. This is discussed in further detail below.

Evidence should only be accessible from the roles that absolutely require access—that is, investigator and data custodian. To help prevent potential insider threat actors from being aware of the investigation, you should deny even read access from any roles not intended to access and analyze evidence.

Protecting the integrity of your forensic infrastructures

Once you’ve built the organization, account structure, and roles, you must decide on the best strategy inside the account itself. Analysis of the collected artifacts can be done through forensic analysis tools hosted on an EC2 instance, ideally residing within a dedicated Amazon VPC in the forensics account. This Amazon VPC should be configured with the same restrictive approach you’ve taken so far, being fully isolated and auditable, with the only resources being dedicated to the forensic tasks at hand.

This might mean that the Amazon VPC’s subnets will have no internet gateways, and therefore all S3 access must be done through an S3 VPC endpoint. VPC flow logging should be enabled at the Amazon VPC level so that there are records of all network traffic. Security groups should be highly restrictive, and deny all ports that aren’t related to the requirements of the forensic tools. SSH and RDP access should be restricted and governed by auditable mechanisms such as a bastion host configured to log all connections and activity, AWS Systems Manager Session Manager, or similar.

If using Systems Manager Session Manager with a graphical interface is required, RDP or other methods can still be accessed. Commands and responses performed using Session Manager can be logged to Amazon CloudWatch and an S3 bucket, this allows auditing of all commands executed on the forensic tooling Amazon EC2 instances. Administrative privileges can also be restricted if required. You can also arrange to receive an Amazon Simple Notification Service (Amazon SNS) notification when a new session is started.

Given that the Amazon EC2 forensic tooling instances might not have direct access to the internet, you might need to create a process to preconfigure and deploy standardized Amazon Machine Images (AMIs) with the appropriate installed and updated set of tooling for analysis. Several best practices apply around this process. The OS of the AMI should be hardened to reduce its vulnerable surface. We do this by starting with an approved OS image, such as an AWS-provided AMI or one you have created and managed yourself. Then proceed to remove unwanted programs, packages, libraries, and other components. Ensure that all updates and patches—security and otherwise—have been applied. Configuring a host-based firewall is also a good precaution, as well as host-based intrusion detection tools. In addition, always ensure the attached disks are encrypted.

If your operating system is supported, we recommend creating golden images using EC2 Image Builder. Your golden image should be rebuilt and updated at least monthly, as you want to ensure it’s kept up to date with security patches and functionality.

EC2 Image Builder—combined with other tools—facilitates the hardening process; for example, allowing the creation of automated pipelines that produce Center for Internet Security (CIS) benchmark hardened AMIs. If you don’t want to maintain your own hardened images, you can find CIS benchmark hardened AMIs on the AWS Marketplace.

Keep in mind the infrastructure requirements for your forensic tools—such as minimum CPU, memory, storage, and networking requirements—before choosing an appropriate EC2 instance type. Though a variety of instance types are available, you’ll want to ensure that you’re keeping the right balance between cost and performance based on your minimum requirements and expected workloads.

The goal of this environment is to provide an efficient means to collect evidence, perform a comprehensive investigation, and effectively return to safe operations. Evidence is best acquired through the automated strategies discussed in How to automate incident response in the AWS Cloud for EC2 instances. Hashing evidence artifacts immediately upon acquisition is highly recommended in your evidence collection process. Hashes, and in turn the evidence itself, can then be validated after subsequent transfers and accesses, ensuring the integrity of the evidence is maintained. Preserving the original evidence is crucial if legal action is taken.

Evidence and artifacts can consist of, but aren’t limited to:

Access to the control plane logs mentioned above—such as the CloudTrail logs—can be accessed in one of two ways. Ideally, the logs should reside in a central location with read-only access for investigations as needed. However, if not centralized, read access can be given to the original logs within the source account as needed. Read access to certain service logs found within the security account, such as AWS Config, Amazon GuardDuty, Security Hub, and Amazon Detective, might be necessary to correlate indicators of compromise with evidence discovered during the analysis.

As previously mentioned, it’s imperative to have immutable versions of all evidence. This can be achieved in many ways, including but not limited to the following examples:

  • Amazon EBS snapshots, including hibernation generated memory dumps:
    • Original Amazon EBS disks are snapshotted, shared to the forensics account, used to create a volume, and then mounted as read-only for offline analysis.
  • Amazon EBS volumes manually captured:
    • Linux tools such as dc3dd can be used to stream a volume to an S3 bucket, as well as provide a hash, and then made immutable using an S3 method from the next bullet point.
  • Artifacts stored in an S3 bucket, such as memory dumps and other artifacts:
    • S3 Object Lock prevents objects from being deleted or overwritten for a fixed amount of time or indefinitely.
    • Using MFA delete requires the requestor to use multi-factor authentication to permanently delete an object.
    • Amazon S3 Glacier provides a Vault Lock function if you want to retain immutable evidence long term.
  • Disk volumes:
    • Linux: Mount in read-only mode.
    • Windows: Use one of the many commercial or open-source write-blocker applications available, some of which are specifically made for forensic use.
  • CloudTrail:
  • AWS Systems Manager inventory:
  • AWS Config data:
    • By default, AWS Config stores data in an S3 bucket, and can be protected using the above methods.

Note: AWS services such as KMS can help enable encryption. KMS is integrated with AWS services to simplify using your keys to encrypt data across your AWS workloads.

An example use case of Amazon EBS disks being shared as evidence to the forensics account, the following figure—Figure 2—is a simplified S3 bucket folder structure you could use to store and work with evidence.

Figure 2 shows an S3 bucket structure for a forensic account. An S3 bucket and folder is created to hold incoming data—for example, from Amazon EBS disks—which is streamed to Incoming Data > Evidence Artifacts using dc3dd. The data is then copied from there to a folder in another bucket—Active Investigation > Root Directory > Extracted Artifacts—to be analyzed by the tooling installed on your forensic Amazon EC2 instance. Also, there are folders under Active Investigation for any investigation notes you make during analysis, as well as the final reports, which are discussed at the end of this blog post. Finally, a bucket and folders for legal holds, where an object lock will be placed to hold evidence artifacts at a specific version.

Figure 2: Forensic account S3 bucket structure

Figure 2: Forensic account S3 bucket structure

Considerations

Finally, depending on the severity of the incident, your on-premises network and infrastructure might also be compromised. Having an alternative environment for your security responders to use in case of such an event reduces the chance of not being able to respond in an emergency. Amazon services such as Amazon Workspaces—a fully managed persistent desktop virtualization service—can be used to provide your responders a ready-to-use, independent environment that they can use to access the digital forensics and incident response tools needed to perform incident-related tasks.

Aside from the investigative tools, communications services are among the most critical for coordination of response. You can use Amazon WorkMail and Amazon Chime to provide that capability independent of normal channels.

Conclusion

The goal of a forensic investigation is to provide a final report that’s supported by the evidence. This includes what was accessed, who might have accessed it, how it was accessed, whether any data was exfiltrated, and so on. This report might be necessary for legal circumstances, such as criminal or civil investigations or situations requiring breach notifications. What output each circumstance requires should be determined in advance in order to develop an appropriate response and reporting process for each. A root cause analysis is vital in providing the information required to prepare your resources and environment to help prevent a similar incident in the future. Reports should not only include a root cause analysis, but also provide the methods, steps, and tools used to arrive at the conclusions.

This article has shown you how you can get started creating and maintaining forensic environments, as well as enable your teams to perform advanced incident resolution investigations using AWS services. Implementing the groundwork for your forensics environment, as described above, allows you to use automated disk collection to begin iterating on your forensic data collection capabilities and be better prepared when security events occur.

If you have feedback about this post, submit comments in the Comments section below. If you have questions about this post, start a new thread on one of the AWS Security, Identity, and Compliance forums or contact AWS Support.

Want more AWS Security how-to content, news, and feature announcements? Follow us on Twitter.

Author

Sol Kavanagh

Sol is a senior solutions architect and CISSP with 20+ years of experience in the enterprise space. He is passionate about security and helping customers build solutions in the AWS Cloud. In his spare time he enjoys distance cycling, adventure travelling, Buddhist philosophy, and Muay Thai.

Use the Snyk CLI to scan Python packages using AWS CodeCommit, AWS CodePipeline, and AWS CodeBuild

Post Syndicated from BK Das original https://aws.amazon.com/blogs/devops/snyk-cli-scan-python-codecommit-codepipeline-codebuild/

One of the primary advantages of working in the cloud is achieving agility in product development. You can adopt practices like continuous integration and continuous delivery (CI/CD) and GitOps to increase your ability to release code at quicker iterations. Development models like these demand agility from security teams as well. This means your security team has to provide the tooling and visibility to developers for them to fix security vulnerabilities as quickly as possible.

Vulnerabilities in cloud-native applications can be roughly classified into infrastructure misconfigurations and application vulnerabilities. In this post, we focus on enabling developers to scan vulnerable data around Python open-source packages using the Snyk Command Line Interface (CLI).

The world of package dependencies

Traditionally, code scanning is performed by the security team; they either ship the code to the scanning instance, or in some cases ship it to the vendor for vulnerability scanning. After the vendor finishes the scan, the results are provided to the security team and forwarded to the developer. The end-to-end process of organizing the repositories, sending the code to security team for scanning, getting results back, and remediating them is counterproductive to the agility of working in the cloud.

Let’s take an example of package A, which uses package B and C. To scan package A, you scan package B and C as well. Similar to package A having dependencies on B and C, packages B and C can have their individual dependencies too. So the dependencies for each package get complex and cumbersome to scan over time. The ideal method is to scan all the dependencies in one go, without having manual intervention to understand the dependencies between packages.

Building on the foundation of GitOps and Gitflow

GitOps was introduced in 2017 by Weaveworks as a DevOps model to implement continuous deployment for cloud-native applications. It focuses on the developer ability to ship code faster. Because security is a non-negotiable piece of any application, this solution includes security as part of the deployment process. We define the Snyk scanner as declarative and immutable AWS Cloud Development Kit (AWS CDK) code, which instructs new Python code committed to the repository to be scanned.

Another continuous delivery practice that we base this solution on is Gitflow. Gitflow is a strict branching model that enables project release by enforcing a framework for managing Git projects. As a brief introduction on Gitflow, typically you have a main branch, which is the code sent to production, and you have a development branch where new code is committed. After the code in development branch passes all tests, it’s merged to the main branch, thereby becoming the code in production. In this solution, we aim to provide this scanning capability in all your branches, providing security observability through your entire Gitflow.

AWS services used in this solution

We use the following AWS services as part of this solution:

  • AWS CDK – The AWS CDK is an open-source software development framework to define your cloud application resources using familiar programming languages. In this solution, we use Python to write our AWS CDK code.
  • AWS CodeBuild – CodeBuild is a fully managed build service in the cloud. CodeBuild compiles your source code, runs unit tests, and produces artifacts that are ready to deploy. CodeBuild eliminates the need to provision, manage, and scale your own build servers.
  • AWS CodeCommit – CodeCommit is a fully managed source control service that hosts secure Git-based repositories. It makes it easy for teams to collaborate on code in a secure and highly scalable ecosystem. CodeCommit eliminates the need to operate your own source control system or worry about scaling its infrastructure. You can use CodeCommit to securely store anything from source code to binaries, and it works seamlessly with your existing Git tools.
  • AWS CodePipeline – CodePipeline is a continuous delivery service you can use to model, visualize, and automate the steps required to release your software. You can quickly model and configure the different stages of a software release process. CodePipeline automates the steps required to release your software changes continuously.
  • Amazon EventBridge – EventBridge rules deliver a near-real-time stream of system events that describe changes in AWS resources. With simple rules that you can quickly set up, you can match events and route them to one or more target functions or streams.
  • AWS Systems Manager Parameter Store – Parameter Store, a capability of AWS Systems Manager, provides secure, hierarchical storage for configuration data management and secrets management. You can store data such as passwords, database strings, Amazon Machine Image (AMI) IDs, and license codes as parameter values.

Prerequisites

Before you get started, make sure you have the following prerequisites:

  • An AWS account (use a Region that supports CodeCommit, CodeBuild, Parameter Store, and CodePipeline)
  • A Snyk account
  • An existing CodeCommit repository you want to test on

Architecture overview

After you complete the steps in this post, you will have a working pipeline that scans your Python code for open-source vulnerabilities.

We use the Snyk CLI, which is available to customers on all plans, including the Free Tier, and provides the ability to programmatically scan repositories for vulnerabilities in open-source dependencies as well as base image recommendations for container images. The following reference architecture represents a general workflow of how Snyk performs the scan in an automated manner. The design uses DevSecOps principles of automation, event-driven triggers, and keeping humans out of the loop for its run.

As developers keep working on their code, they continue to commit their code to the CodeCommit repository. Upon each commit, a CodeCommit API call is generated, which is then captured using the EventBridge rule. You can customize this event rule for a specific event or feature branch you want to trigger the pipeline for.

When the developer commits code to the specified branch, that EventBridge event rule triggers a CodePipeline pipeline. This pipeline has a build stage using CodeBuild. This stage interacts with the Snyk CLI, and uses the token stored in Parameter Store. The Snyk CLI uses this token as authentication and starts scanning the latest code committed to the repository. When the scan is complete, you can review the results on the Snyk console.

This code is built for Python pip packages. You can edit the buildspec.yml to incorporate for any other language that Snyk supports.

The following diagram illustrates our architecture.

snyk architecture codepipeline

Code overview

The code in this post is written using the AWS CDK in Python. If you’re not familiar with the AWS CDK, we recommend reading Getting started with AWS CDK before you customize and deploy the code.

Repository URL: https://github.com/aws-samples/aws-cdk-codecommit-snyk

This AWS CDK construct uses the Snyk CLI within the CodeBuild job in the pipeline to scan the Python packages for open-source package vulnerabilities. The construct uses CodePipeline to create a two-stage pipeline: one source, and one build (the Snyk scan stage). The construct takes the input of the CodeCommit repository you want to scan, the Snyk organization ID, and Snyk auth token.

Resources deployed

This solution deploys the following resources:

For the deployment, we use the AWS CDK construct in the codebase cdk_snyk_construct/cdk_snyk_construct_stack.py in the AWS CDK stack cdk-snyk-stack. The construct requires the following parameters:

  • ARN of the CodeCommit repo you want to scan
  • Name of the repository branch you want to be monitored
  • Parameter Store name of the Snyk organization ID
  • Parameter Store name for the Snyk auth token

Set up the organization ID and auth token before deploying the stack. Because these are confidential and sensitive data, you should deploy them as a separate stack or manual process. In this solution, the parameters have been stored as a SecureString parameter type and encrypted using the AWS-managed KMS key.

You create the organization ID and auth token on the Snyk console. On the Settings page, choose General in the navigation page to add these parameters.

snyk settings console


You can retrieve the names of the parameters on the Systems Manager console by navigating to Parameter Store and finding the name on the Overview tab.

SSM Parameter Store

Create a requirements.txt file in the CodeCommit repository

We now create a repository in CodeCommit to store the code. For simplicity, we primarily store the requirements.txt file in our repository. In Python, a requirements file stores the packages that are used. Having clearly defined packages and versions makes it easier for development, especially in virtual environments.

For more information on the requirements file in Python, see Requirement Specifiers.

To create a CodeCommit repository, run the following AWS Command Line Interface (AWS CLI) command in your AWS accounts:

aws codecommit create-repository --repository-name snyk-repo \
--repository-description "Repository for Snyk to scan Python packages"

Now let’s create a branch called main in the repository using the following command:

aws codecommit create-branch --repository-name snyk-repo \
--branch-name main

After you create the repository, commit a file named requirements.txt with the following content. The following packages are pinned to a particular version that they have a vulnerability with. This file is our hypothetical vulnerable set of packages that have been committed into your development code.

PyYAML==5.3.1
Pillow==7.1.2
pylint==2.5.3
urllib3==1.25.8


For instructions on committing files in CodeCommit, see Connect to an AWS CodeCommit repository.

When you store the Snyk auth token and organization ID in Parameter Store, note the parameter names—you need to pass them as parameters during the deployment step.

Now clone the CDK code from the GitHub repository with the command below:

git clone https://github.com/aws-samples/aws-cdk-codecommit-snyk.git

After the cloning is complete you should see a directory named aws-cdk-codecommit-snyk on your machine.

When you’re ready to deploy, enter the aws-cdk-codecommit-snyk directory, and run the following command with the appropriate values:

cdk deploy cdk-snyk-stack \
--parameters RepoName=<name-of-codecommit-repo> \
--parameters RepoBranch=<branch-to-be-scanned>  \
--parameters SnykOrgId=<value> \
--parameters SnykAuthToken=<value>

After the stack deployment is complete, you can see a new pipeline in your AWS account, which is configured to be triggered every time a commit occurs on the main branch.

You can view the results of the scan on the Snyk console. After the pipeline runs, log in to snyk.io and you should see a project named as per your repository (see the following screenshot).

snyk dashboard


Choose the repo name to get a detailed view of the vulnerabilities found. Depending on what packages you put in your requirements.txt, your report will differ from the following screenshot.

snyk-vuln-details


To fix the vulnerability identified, you can change the version of these packages in the requirements.txt file. The edited requirements file should look like the following:

PyYAML==5.4
Pillow==8.2.0
pylint==2.6.1
urllib3==1.25.9

After you update the requirements.txt file in your repository, push your changes back to the CodeCommit repository you created earlier on the main branch. The push starts the pipeline again.

After the commit is performed to the targeted branch, you don’t see the vulnerability reported on the Snyk dashboard because the pinned version 5.4 doesn’t contain that vulnerability.

Clean up

To avoid accruing further cost for the resources deployed in this solution, run cdk destroy to remove all the AWS resources you deployed through CDK.

As the CodeCommit repository was created using AWS CLI, the following command deletes the CodeCommit repository:

aws codecommit delete-repository --repository-name snyk-repo

Conclusion

In this post, we provided a solution so developers can self- remediate vulnerabilities in their code by monitoring it through Snyk. This solution provides observability, agility, and security for your Python application by following DevOps principles.

A similar architecture has been used at NFL to shift-left the security of their code. According to the shift-left design principle, security should be moved closer to the developers to identify and remediate security issues earlier in the development cycle. NFL has implemented a similar architecture which made the total process, from committing code on the branch to remediating 15 times faster than their previous code scanning setup.

Here’s what NFL has to say about their experience:

“NFL used Snyk to scan Python packages for a service launch. Traditionally it would have taken 10days to scan the packages through our existing process but with Snyk we were able to follow DevSecOps principles and get the scans completed, and reviewed within matter of days. This simplified our time to market while maintaining visibility into our security posture.” – Joe Steinke (Director, Data Solution Architect)

Building an end-to-end Kubernetes-based DevSecOps software factory on AWS

Post Syndicated from Srinivas Manepalli original https://aws.amazon.com/blogs/devops/building-an-end-to-end-kubernetes-based-devsecops-software-factory-on-aws/

DevSecOps software factory implementation can significantly vary depending on the application, infrastructure, architecture, and the services and tools used. In a previous post, I provided an end-to-end DevSecOps pipeline for a three-tier web application deployed with AWS Elastic Beanstalk. The pipeline used cloud-native services along with a few open-source security tools. This solution is similar, but instead uses a containers-based approach with additional security analysis stages. It defines a software factory using Kubernetes along with necessary AWS Cloud-native services and open-source third-party tools. Code is provided in the GitHub repo to build this DevSecOps software factory, including the integration code for third-party scanning tools.

DevOps is a combination of cultural philosophies, practices, and tools that combine software development with information technology operations. These combined practices enable companies to deliver new application features and improved services to customers at a higher velocity. DevSecOps takes this a step further by integrating and automating the enforcement of preventive, detective, and responsive security controls into the pipeline.

In a DevSecOps factory, security needs to be addressed from two aspects: security of the software factory, and security in the software factory. In this architecture, we use AWS services to address the security of the software factory, and use third-party tools along with AWS services to address the security in the software factory. This AWS DevSecOps reference architecture covers DevSecOps practices and security vulnerability scanning stages including secret analysis, SCA (Software Composite Analysis), SAST (Static Application Security Testing), DAST (Dynamic Application Security Testing), RASP (Runtime Application Self Protection), and aggregation of vulnerability findings into a single pane of glass.

The focus of this post is on application vulnerability scanning. Vulnerability scanning of underlying infrastructure such as the Amazon Elastic Kubernetes Service (Amazon EKS) cluster and network is outside the scope of this post. For information about infrastructure-level security planning, refer to Amazon Guard Duty, Amazon Inspector, and AWS Shield.

You can deploy this pipeline in either the AWS GovCloud (US) Region or standard AWS Regions. All listed AWS services are authorized for FedRamp High and DoD SRG IL4/IL5.

Security and compliance

Thoroughly implementing security and compliance in the public sector and other highly regulated workloads is very important for achieving an ATO (Authority to Operate) and continuously maintain an ATO (c-ATO). DevSecOps shifts security left in the process, integrating it at each stage of the software factory, which can make ATO a continuous and faster process. With DevSecOps, an organization can deliver secure and compliant application changes rapidly while running operations consistently with automation.

Security and compliance are shared responsibilities between AWS and the customer. Depending on the compliance requirements (such as FedRamp or DoD SRG), a DevSecOps software factory needs to implement certain security controls. AWS provides tools and services to implement most of these controls. For example, to address NIST 800-53 security controls families such as access control, you can use AWS Identity Access and Management (IAM) roles and Amazon Simple Storage Service (Amazon S3) bucket policies. To address auditing and accountability, you can use AWS CloudTrail and Amazon CloudWatch. To address configuration management, you can use AWS Config rules and AWS Systems Manager. Similarly, to address risk assessment, you can use vulnerability scanning tools from AWS.

The following table is the high-level mapping of the NIST 800-53 security control families and AWS services that are used in this DevSecOps reference architecture. This list only includes the services that are defined in the AWS CloudFormation template, which provides pipeline as code in this solution. You can use additional AWS services and tools or other environmental specific services and tools to address these and the remaining security control families on a more granular level.

# NIST 800-53 Security Control Family – Rev 5 AWS Services Used (In this DevSecOps Pipeline)
1 AC – Access Control

AWS IAM, Amazon S3, and Amazon CloudWatch are used.

AWS::IAM::ManagedPolicy
AWS::IAM::Role
AWS::S3::BucketPolicy
AWS::CloudWatch::Alarm

2 AU – Audit and Accountability

AWS CloudTrail, Amazon S3, Amazon SNS, and Amazon CloudWatch are used.

AWS::CloudTrail::Trail
AWS::Events::Rule
AWS::CloudWatch::LogGroup
AWS::CloudWatch::Alarm
AWS::SNS::Topic

3 CM – Configuration Management

AWS Systems Manager, Amazon S3, and AWS Config are used.

AWS::SSM::Parameter
AWS::S3::Bucket
AWS::Config::ConfigRule

4 CP – Contingency Planning

AWS CodeCommit and Amazon S3 are used.

AWS::CodeCommit::Repository
AWS::S3::Bucket

5 IA – Identification and Authentication

AWS IAM is used.

AWS:IAM:User
AWS::IAM::Role

6 RA – Risk Assessment

AWS Config, AWS CloudTrail, AWS Security Hub, and third party scanning tools are used.

AWS::Config::ConfigRule
AWS::CloudTrail::Trail
AWS::SecurityHub::Hub
Vulnerability Scanning Tools (AWS/AWS Partner/3rd party)

7 CA – Assessment, Authorization, and Monitoring

AWS CloudTrail, Amazon CloudWatch, and AWS Config are used.

AWS::CloudTrail::Trail
AWS::CloudWatch::LogGroup
AWS::CloudWatch::Alarm
AWS::Config::ConfigRule

8 SC – System and Communications Protection

AWS KMS and AWS Systems Manager are used.

AWS::KMS::Key
AWS::SSM::Parameter
SSL/TLS communication

9 SI – System and Information Integrity

AWS Security Hub, and third party scanning tools are used.

AWS::SecurityHub::Hub
Vulnerability Scanning Tools (AWS/AWS Partner/3rd party)

10 AT – Awareness and Training N/A
11 SA – System and Services Acquisition N/A
12 IR – Incident Response Not implemented, but services like AWS Lambda, and Amazon CloudWatch Events can be used.
13 MA – Maintenance N/A
14 MP – Media Protection N/A
15 PS – Personnel Security N/A
16 PE – Physical and Environmental Protection N/A
17 PL – Planning N/A
18 PM – Program Management N/A
19 PT – PII Processing and Transparency N/A
20 SR – SupplyChain Risk Management N/A

Services and tools

In this section, we discuss the various AWS services and third-party tools used in this solution.

CI/CD services

For continuous integration and continuous delivery (CI/CD) in this reference architecture, we use the following AWS services:

  • AWS CodeBuild – A fully managed continuous integration service that compiles source code, runs tests, and produces software packages that are ready to deploy.
  • AWS CodeCommit – A fully managed source control service that hosts secure Git-based repositories.
  • AWS CodeDeploy – A fully managed deployment service that automates software deployments to a variety of compute services such as Amazon Elastic Compute Cloud (Amazon EC2), AWS Fargate, AWS Lambda, and your on-premises servers.
  • AWS CodePipeline – A fully managed continuous delivery service that helps you automate your release pipelines for fast and reliable application and infrastructure updates.
  • AWS Lambda – A service that lets you run code without provisioning or managing servers. You pay only for the compute time you consume.
  • Amazon Simple Notification Service – Amazon SNS is a fully managed messaging service for both application-to-application (A2A) and application-to-person (A2P) communication.
  • Amazon S3 – Amazon S3 is storage for the internet. You can use Amazon S3 to store and retrieve any amount of data at any time, from anywhere on the web.
  • AWS Systems Manager Parameter Store – Parameter Store provides secure, hierarchical storage for configuration data management and secrets management.

Continuous testing tools

The following are open-source scanning tools that are integrated in the pipeline for the purpose of this post, but you could integrate other tools that meet your specific requirements. You can use the static code review tool Amazon CodeGuru for static analysis, but at the time of this writing, it’s not yet available in AWS GovCloud and currently supports Java and Python.

  • Anchore (SCA and SAST) – Anchore Engine is an open-source software system that provides a centralized service for analyzing container images, scanning for security vulnerabilities, and enforcing deployment policies.
  • Amazon Elastic Container Registry image scanning – Amazon ECR image scanning helps in identifying software vulnerabilities in your container images. Amazon ECR uses the Common Vulnerabilities and Exposures (CVEs) database from the open-source Clair project and provides a list of scan findings.
  • Git-Secrets (Secrets Scanning) – Prevents you from committing sensitive information to Git repositories. It is an open-source tool from AWS Labs.
  • OWASP ZAP (DAST) – Helps you automatically find security vulnerabilities in your web applications while you’re developing and testing your applications.
  • Snyk (SCA and SAST) – Snyk is an open-source security platform designed to help software-driven businesses enhance developer security.
  • Sysdig Falco (RASP) – Falco is an open source cloud-native runtime security project that detects unexpected application behavior and alerts on threats at runtime. It is the first runtime security project to join CNCF as an incubation-level project.

You can integrate additional security stages like IAST (Interactive Application Security Testing) into the pipeline to get code insights while the application is running. You can use AWS partner tools like Contrast Security, Synopsys, and WhiteSource to integrate IAST scanning into the pipeline. Malware scanning tools, and image signing tools can also be integrated into the pipeline for additional security.

Continuous logging and monitoring services

The following are AWS services for continuous logging and monitoring used in this reference architecture:

Auditing and governance services

The following are AWS auditing and governance services used in this reference architecture:

  • AWS CloudTrail – Enables governance, compliance, operational auditing, and risk auditing of your AWS account.
  • AWS Config – Allows you to assess, audit, and evaluate the configurations of your AWS resources.
  • AWS Identity and Access Management – Enables you to manage access to AWS services and resources securely. With IAM, you can create and manage AWS users and groups, and use permissions to allow and deny their access to AWS resources.

Operations services

The following are the AWS operations services used in this reference architecture:

  • AWS CloudFormation – Gives you an easy way to model a collection of related AWS and third-party resources, provision them quickly and consistently, and manage them throughout their lifecycles, by treating infrastructure as code.
  • Amazon ECR – A fully managed container registry that makes it easy to store, manage, share, and deploy your container images and artifacts anywhere.
  • Amazon EKS – A managed service that you can use to run Kubernetes on AWS without needing to install, operate, and maintain your own Kubernetes control plane or nodes. Amazon EKS runs up-to-date versions of the open-source Kubernetes software, so you can use all of the existing plugins and tooling from the Kubernetes community.
  • AWS Security Hub – Gives you a comprehensive view of your security alerts and security posture across your AWS accounts. This post uses Security Hub to aggregate all the vulnerability findings as a single pane of glass.
  • AWS Systems Manager Parameter Store – Provides secure, hierarchical storage for configuration data management and secrets management. You can store data such as passwords, database strings, Amazon Machine Image (AMI) IDs, and license codes as parameter values.

Pipeline architecture

The following diagram shows the architecture of the solution. We use AWS CloudFormation to describe the pipeline as code.

Containers devsecops pipeline architecture

Kubernetes DevSecOps Pipeline Architecture

The main steps are as follows:

    1. When a user commits the code to CodeCommit repository, a CloudWatch event is generated, which triggers CodePipeline to orchestrate the events.
    2. CodeBuild packages the build and uploads the artifacts to an S3 bucket.
    3. CodeBuild scans the code with git-secrets. If there is any sensitive information in the code such as AWS access keys or secrets keys, CodeBuild fails the build.
    4. CodeBuild creates the container image and perform SCA and SAST by scanning the image with Snyk or Anchore. In the provided CloudFormation template, you can pick one of these tools during the deployment. Please note, CodeBuild is fully enabled for a “bring your own tool” approach.
      • (4a) If there are any vulnerabilities, CodeBuild invokes the Lambda function. The function parses the results into AWS Security Finding Format (ASFF) and posts them to Security Hub. Security Hub helps aggregate and view all the vulnerability findings in one place as a single pane of glass. The Lambda function also uploads the scanning results to an S3 bucket.
      • (4b) If there are no vulnerabilities, CodeBuild pushes the container image to Amazon ECR and triggers another scan using built-in Amazon ECR scanning.
    5. CodeBuild retrieves the scanning results.
      • (5a) If there are any vulnerabilities, CodeBuild invokes the Lambda function again and posts the findings to Security Hub. The Lambda function also uploads the scan results to an S3 bucket.
      • (5b) If there are no vulnerabilities, CodeBuild deploys the container image to an Amazon EKS staging environment.
    6. After the deployment succeeds, CodeBuild triggers the DAST scanning with the OWASP ZAP tool (again, this is fully enabled for a “bring your own tool” approach).
      • (6a) If there are any vulnerabilities, CodeBuild invokes the Lambda function, which parses the results into ASFF and posts it to Security Hub. The function also uploads the scan results to an S3 bucket (similar to step 4a).
    7. If there are no vulnerabilities, the approval stage is triggered, and an email is sent to the approver for action via Amazon SNS.
    8. After approval, CodeBuild deploys the code to the production Amazon EKS environment.
    9. During the pipeline run, CloudWatch Events captures the build state changes and sends email notifications to subscribed users through Amazon SNS.
    10. CloudTrail tracks the API calls and sends notifications on critical events on the pipeline and CodeBuild projects, such as UpdatePipeline, DeletePipeline, CreateProject, and DeleteProject, for auditing purposes.
    11. AWS Config tracks all the configuration changes of AWS services. The following AWS Config rules are added in this pipeline as security best practices:
      1. CODEBUILD_PROJECT_ENVVAR_AWSCRED_CHECK – Checks whether the project contains environment variables AWS_ACCESS_KEY_ID and AWS_SECRET_ACCESS_KEY. The rule is NON_COMPLIANT when the project environment variables contain plaintext credentials. This rule ensures that sensitive information isn’t stored in the CodeBuild project environment variables.
      2. CLOUD_TRAIL_LOG_FILE_VALIDATION_ENABLED – Checks whether CloudTrail creates a signed digest file with logs. AWS recommends that the file validation be enabled on all trails. The rule is noncompliant if the validation is not enabled. This rule ensures that pipeline resources such as the CodeBuild project aren’t altered to bypass critical vulnerability checks.

Security of the pipeline is implemented using IAM roles and S3 bucket policies to restrict access to pipeline resources. Pipeline data at rest and in transit is protected using encryption and SSL secure transport. We use Parameter Store to store sensitive information such as API tokens and passwords. To be fully compliant with frameworks such as FedRAMP, other things may be required, such as MFA.

Security in the pipeline is implemented by performing the Secret Analysis, SCA, SAST, DAST, and RASP security checks. Applicable AWS services provide encryption at rest and in transit by default. You can enable additional controls on top of these wherever required.

In the next section, I explain how to deploy and run the pipeline CloudFormation template used for this example. As a best practice, we recommend using linting tools like cfn-nag and cfn-guard to scan CloudFormation templates for security vulnerabilities. Refer to the provided service links to learn more about each of the services in the pipeline.

Prerequisites

Before getting started, make sure you have the following prerequisites:

  • An EKS cluster environment with your application deployed. In this post, we use PHP WordPress as a sample application, but you can use any other application.
  • Sysdig Falco installed on an EKS cluster. Sysdig Falco captures events on the EKS cluster and sends those events to CloudWatch using AWS FireLens. For implementation instructions, see Implementing Runtime security in Amazon EKS using CNCF Falco. This step is required only if you need to implement RASP in the software factory.
  • A CodeCommit repo with your application code and a Dockerfile. For more information, see Create an AWS CodeCommit repository.
  • An Amazon ECR repo to store container images and scan for vulnerabilities. Enable vulnerability scanning on image push in Amazon ECR. You can enable or disable the automatic scanning on image push via the Amazon ECR
  • The provided buildspec-*.yml files for git-secrets, Anchore, Snyk, Amazon ECR, OWASP ZAP, and your Kubernetes deployment .yml files uploaded to the root of the application code repository. Please update the Kubernetes (kubectl) commands in the buildspec files as needed.
  • A Snyk API key if you use Snyk as a SAST tool.
  • The Lambda function uploaded to an S3 bucket. We use this function to parse the scan reports and post the results to Security Hub.
  • An OWASP ZAP URL and generated API key for dynamic web scanning.
  • An application web URL to run the DAST testing.
  • An email address to receive approval notifications for deployment, pipeline change notifications, and CloudTrail events.
  • AWS Config and Security Hub services enabled. For instructions, see Managing the Configuration Recorder and Enabling Security Hub manually, respectively.

Deploying the pipeline

To deploy the pipeline, complete the following steps:

  1. Download the CloudFormation template and pipeline code from the GitHub repo.
  2. Sign in to your AWS account if you have not done so already.
  3. On the CloudFormation console, choose Create Stack.
  4. Choose the CloudFormation pipeline template.
  5. Choose Next.
  6. Under Code, provide the following information:
    1. Code details, such as repository name and the branch to trigger the pipeline.
    2. The Amazon ECR container image repository name.
  7. Under SAST, provide the following information:
    1. Choose the SAST tool (Anchore or Snyk) for code analysis.
    2. If you select Snyk, provide an API key for Snyk.
  8. Under DAST, choose the DAST tool (OWASP ZAP) for dynamic testing and enter the API token, DAST tool URL, and the application URL to run the scan.
  9. Under Lambda functions, enter the Lambda function S3 bucket name, filename, and the handler name.
  10. For STG EKS cluster, enter the staging EKS cluster name.
  11. For PRD EKS cluster, enter the production EKS cluster name to which this pipeline deploys the container image.
  12. Under General, enter the email addresses to receive notifications for approvals and pipeline status changes.
  13. Choose Next.
  14. Complete the stack.
  15. After the pipeline is deployed, confirm the subscription by choosing the provided link in the email to receive notifications.
Pipeline-CF-Parameters.png

Pipeline CloudFormation Parameters

The provided CloudFormation template in this post is formatted for AWS GovCloud. If you’re setting this up in a standard Region, you have to adjust the partition name in the CloudFormation template. For example, change ARN values from arn:aws-us-gov to arn:aws.

Running the pipeline

To trigger the pipeline, commit changes to your application repository files. That generates a CloudWatch event and triggers the pipeline. CodeBuild scans the code and if there are any vulnerabilities, it invokes the Lambda function to parse and post the results to Security Hub.

When posting the vulnerability finding information to Security Hub, we need to provide a vulnerability severity level. Based on the provided severity value, Security Hub assigns the label as follows. Adjust the severity levels in your code based on your organization’s requirements.

  • 0 – INFORMATIONAL
  • 1–39 – LOW
  • 40– 69 – MEDIUM
  • 70–89 – HIGH
  • 90–100 – CRITICAL

The following screenshot shows the progression of your pipeline.

DevSecOps-Pipeline.png

DevSecOps Kubernetes CI/CD Pipeline


Secrets analysis scanning

In this architecture, after the pipeline is initiated, CodeBuild triggers the Secret Analysis stage using git-secrets and the buildspec-gitsecrets.yml file. Git-Secrets looks for any sensitive information such as AWS access keys and secret access keys. Git-Secrets allows you to add custom strings to look for in your analysis. CodeBuild uses the provided buildspec-gitsecrets.yml file during the build stage.

SCA and SAST scanning

In this architecture, CodeBuild triggers the SCA and SAST scanning using Anchore, Snyk, and Amazon ECR. In this solution, we use the open-source versions of Anchore and Snyk. Amazon ECR uses open-source Clair under the hood, which comes with Amazon ECR for no additional cost. As mentioned earlier, you can choose Anchore or Snyk to do the initial image scanning.

Scanning with Anchore

If you choose Anchore as a SAST tool during the deployment, the build stage uses the buildspec-anchore.yml file to scan the container image. If there are any vulnerabilities, it fails the build and triggers the Lambda function to post those findings to Security Hub. If there are no vulnerabilities, it proceeds to next stage.

Anchore-lambda-codesnippet.png

Anchore Lambda Code Snippet

Scanning with Snyk

If you choose Snyk as a SAST tool during the deployment, the build stage uses the buildspec-snyk.yml file to scan the container image. If there are any vulnerabilities, it fails the build and triggers the Lambda function to post those findings to Security Hub. If there are no vulnerabilities, it proceeds to next stage.

Snyk-lambda-codesnippet.png

Snyk Lambda Code Snippet

Scanning with Amazon ECR

If there are no vulnerabilities from Anchore or Snyk scanning, the image is pushed to Amazon ECR, and the Amazon ECR scan is triggered automatically. Amazon ECR lists the vulnerability findings on the Amazon ECR console. To provide a single pane of glass view of all the vulnerability findings and for easy administration, we retrieve those findings and post them to Security Hub. If there are no vulnerabilities, the image is deployed to the EKS staging cluster and next stage (DAST scanning) is triggered.

ECR-lambda-codesnippet.png

ECR Lambda Code Snippet


DAST scanning with OWASP ZAP

In this architecture, CodeBuild triggers DAST scanning using the DAST tool OWASP ZAP.

After deployment is successful, CodeBuild initiates the DAST scanning. When scanning is complete, if there are any vulnerabilities, it invokes the Lambda function, similar to SAST analysis. The function parses and posts the results to Security Hub. The following is the code snippet of the Lambda function.

Zap-lambda-codesnippet.png

Zap Lambda Code Snippet

The following screenshot shows the results in Security Hub. The highlighted section shows the vulnerability findings from various scanning stages.

SecurityHub-vulnerabilities.png

Vulnerability Findings in Security Hub

We can drill down to individual resource IDs to get the list of vulnerability findings. For example, if we drill down to the resource ID of SASTBuildProject*, we can review all the findings from that resource ID.

Anchore-Vulnerability.png

SAST Vulnerabilities in Security Hub


If there are no vulnerabilities in the DAST scan, the pipeline proceeds to the manual approval stage and an email is sent to the approver. The approver can review and approve or reject the deployment. If approved, the pipeline moves to next stage and deploys the application to the production EKS cluster.

Aggregation of vulnerability findings in Security Hub provides opportunities to automate the remediation. For example, based on the vulnerability finding, you can trigger a Lambda function to take the needed remediation action. This also reduces the burden on operations and security teams because they can now address the vulnerabilities from a single pane of glass instead of logging into multiple tool dashboards.

Along with Security Hub, you can send vulnerability findings to your issue tracking systems such as JIRA, Systems Manager SysOps, or can automatically create an incident management ticket. This is outside the scope of this post, but is one of the possibilities you can consider when implementing DevSecOps software factories.

RASP scanning

Sysdig Falco is an open-source runtime security tool. Based on the configured rules, Falco can detect suspicious activity and alert on any behavior that involves making Linux system calls. You can use Falco rules to address security controls like NIST SP 800-53. Falco agents on each EKS node continuously scan the containers running in pods and send the events as STDOUT. These events can be then sent to CloudWatch or any third-party log aggregator to send alerts and respond. For more information, see Implementing Runtime security in Amazon EKS using CNCF Falco. You can also use Lambda to trigger and automatically remediate certain security events.

The following screenshot shows Falco events on the CloudWatch console. The highlighted text describes the Falco event that was triggered based on the default Falco rules on the EKS cluster. You can add additional custom rules to meet your security control requirements. You can also trigger responsive actions from these CloudWatch events using services like Lambda.

Falco alerts in CloudWatch

Falco alerts in CloudWatch

Cleanup

This section provides instructions to clean up the DevSecOps pipeline setup:

  1. Delete the EKS cluster.
  2. Delete the S3 bucket.
  3. Delete the CodeCommit repo.
  4. Delete the Amazon ECR repo.
  5. Disable Security Hub.
  6. Disable AWS Config.
  7. Delete the pipeline CloudFormation stack.

Conclusion

In this post, I presented an end-to-end Kubernetes-based DevSecOps software factory on AWS with continuous testing, continuous logging and monitoring, auditing and governance, and operations. I demonstrated how to integrate various open-source scanning tools, such as Git-Secrets, Anchore, Snyk, OWASP ZAP, and Sysdig Falco for Secret Analysis, SCA, SAST, DAST, and RASP analysis, respectively. To reduce operations overhead, I explained how to aggregate and manage vulnerability findings in Security Hub as a single pane of glass. This post also talked about how to implement security of the pipeline and in the pipeline using AWS Cloud-native services. Finally, I provided the DevSecOps software factory as code using AWS CloudFormation.

To get started with DevSecOps on AWS, see AWS DevOps and the DevOps blog.

Srinivas Manepalli is a DevSecOps Solutions Architect in the U.S. Fed SI SA team at Amazon Web Services (AWS). He is passionate about helping customers, building and architecting DevSecOps and highly available software systems. Outside of work, he enjoys spending time with family, nature and good food.

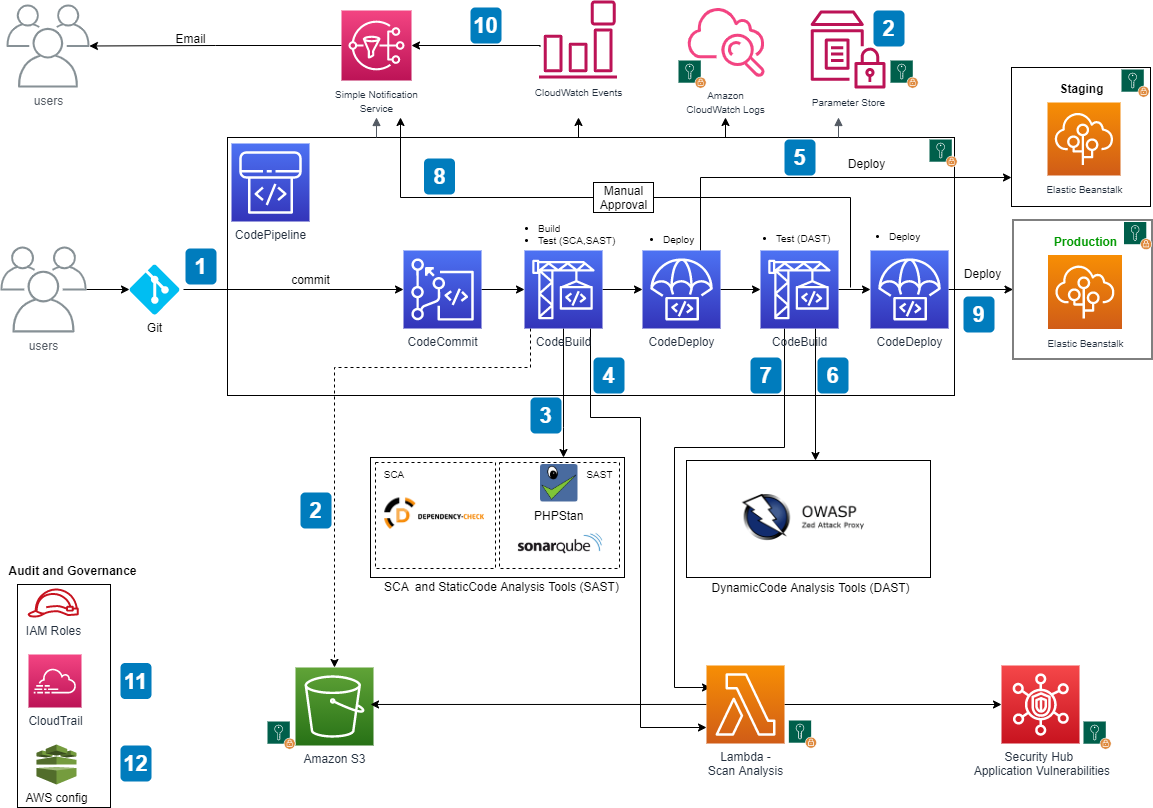
GitLab Watchman – Audit Gitlab For Sensitive Data & Credentials

Post Syndicated from original https://www.darknet.org.uk/2021/02/gitlab-watchman-audit-gitlab-for-sensitive-data-credentials/?utm_source=rss&utm_medium=social&utm_campaign=darknetfeed

GitLab Watchman – Audit Gitlab For Sensitive Data & Credentials

GitLab Watchman is an application that uses the GitLab API to audit GitLab for sensitive data and credentials exposed internally – this includes code, commits, wiki pages and more.

GitLab Watchman searches GitLab for internally shared projects and looks at:

  • Code
  • Commits
  • Wiki pages
  • Issues
  • Merge requests
  • Milestones

For the following data:

  • GCP keys and service account files
  • AWS keys
  • Azure keys and service account files
  • Google API keys
  • Slack API tokens & webhooks
  • Private keys (SSH, PGP, any other misc private key)
  • Exposed tokens (Bearer tokens, access tokens, client_secret etc.)
  • S3 config files
  • Passwords in plaintext
  • CICD variables exposed publicly
  • and more

Using GitLab Watchman to Audit Gitlab For Sensitive Data

GitLab Watchman will be installed as a global command, use as follows:

usage: gitlab-watchman [-h] –timeframe {d,w,m,a} –output
{file,stdout,stream} [–version] [–all] [–blobs]
[–commits] [–wiki-blobs] [–issues] [–merge-requests]
[–milestones] [–comments]

Monitoring GitLab for sensitive data shared publicly

optional arguments:
-h, –help show this help message and exit
–version show program’s version number and exit
–all Find everything
–blobs Search code blobs
–commits Search commits
–wiki-blobs Search wiki blobs
–issues Search issues
–merge-requests Search merge requests
–milestones Search milestones
–comments Search comments

required arguments:
–timeframe {d,w,m,a}
How far back to search: d = 24 hours w = 7 days, m =
30 days, a = all time
–output {file,stdout,stream}
Where to send results

You can run GitLab Watchman to look for everything, and output to default Stdout:

gitlab-watchman –timeframe a –all

Or arguments can be grouped together to search more granularly.

Read the rest of GitLab Watchman – Audit Gitlab For Sensitive Data & Credentials now! Only available at Darknet.

Finding Results at the Intersection of Security and Engineering

Post Syndicated from Chaim Mazal original https://blog.rapid7.com/2021/01/25/finding-results-at-the-intersection-of-security-and-engineering/

Finding Results at the Intersection of Security and Engineering

As vice president and head of global security at ActiveCampaign, I’m fortunate to be able to draw on a multitude of experiences and successes in my career. I started in general network security, where I was involved in pen testing and security research. I worked at several multibillion-dollar SaaS organizations—including three of the largest startups in Chicago—building out end-to-end application security programs, secure software-development lifecycles, and comprehensive security platforms.

From a solution-focused standpoint, I’ve learned that collaborating with teams to build a security culture is way more effective than simply identifying and assigning tasks.

Our “team up” approach

At ActiveCampaign, security is a full-fledged member of the technology organization. We adopt an engineering-first approach, eschewing traditional “just-throw-it-over-the-wall” actions. So, we certainly consider ourselves to be more than simply an advisory or compliance team. I’m proud of the fact that we roll up our sleeves and are right there with other parts of the tech organization, leading innovation and helping maintain compliance and deployment. The earlier you can build security into the process, the better (and the more money you’ll eventually save). We never want DevOps to feel like they need to complete tasks in a vacuum—instead, we’re partners.  

This extends to how we secure and deploy our cloud-based fleet. We don’t feel that we need to constantly maintain assets—rather, we look at them holistically and integrate solutions across the quarter. To achieve this view, we rely on Rapid7 solutions like InsightIDR dashboards. They help us to see whether anything has gone outside of our established parameters, serving as a continuous validation that procedures within our cloud-based policies are working without variance. They act as a last line of defense, if you will. So, when alerts for cloud-based tools do come in, security teams can draft project plans to help alleviate risk, create guardrails to deploy assets across environments, and then partner up to get it all done. This is an untraditional approach, but one where we’ve seen a ton of success in strengthening partnerships across the organization.

What we’ve achieved

During my time at ActiveCampaign, our approach has yielded what I believe are strong results and achievements. In this industry, we all have similar challenges, so it demands tailored solutions. There’s risk in convincing stakeholders to continually integrate new processes in the hope that it will all pay off at some future date. But this team believed in that work. So, here are just a few of our successes:

  • The security team has ramped up to a hands-on role in the development of templates, solutions, and real-time cloud-based policy. This has helped to enable our DevOps and engineering orgs to take a more efficient, security-first approach.
  • We now have the ability to execute one-click deployments across 90% of our fleet through automations and managed instances.
  • You can’t fix what you don’t have visibility into, so we put in the effort to get to a place where we have full uniform deployments of logging and security tooling across our fleet.
  • For greater transparency, we created parity across different asset types. This meant developing multiple classifications as well as asset-based safeguards and controls. From there, we had a clearer understanding of organizational limitations that enabled us to collaborate efficiently across teams to resolve issues.
  • We can take steps to get to a future state, even if something doesn’t work today. As such, we’ve become extremely flexible at developing stop-gap measures while simultaneously working on long-term paths to upgrade or resolve issues.

Some key tips and takeaways

I don’t believe there is any one perfect path, and no doubt your path will be different than ours here at ActiveCampaign. In my view, it’s about leveraging teamwork and partnerships to achieve your DevSecOps goals. That being said, let’s discuss a few learnings that might be helpful.  

  • If you have to do something more than once, see if there is a way to automate that process going forward. Being more efficient doesn’t cost a thing.
  • Convincing stakeholders and potential partners that the security org is more than, well, a security org, can go a long way in gaining support from decision-makers beyond or above your teams. Security can be an engineering partner that helps to power profit and value.
  • Get to your future state by proactively creating project plans that add insight into or address current investment limitations on your security team(s).
  • When it comes to partnering, there is also the other side of the proverbial coin. And that is not to assume everyone will have the same enthusiasm to work together across orgs. So, the takeaway here would be to communicate that DevSecOps is a shared responsibility, and not meant to be an inefficient detractor from a mission statement. In this way, everyone’s path to that shared responsibility will be different, but always remember that partnering—especially earlier in the process—is meant to create efficiencies.

The future state

Security, in its ideal form, is something for which we’ll always strive. At ActiveCampaign, we try to continuously make strides toward that “engineering org” situation. Time and again with efforts to align security to the customer value, I’m happy to see stakeholders—from the C-suite to board members—ultimately start to see how customers benefit. Then, it gets easier to obtain additional support so that we can get to that future state of protection, production, and value.    

I love highlighting efforts like those of our security product-engineering team. They’re building authentication features like SSO and MFA into our platform, on behalf of customers. When we can translate more security initiatives into operational and customer value, I get excited about the future of our industry and what we can do to protect and accelerate the pace of business.

Building end-to-end AWS DevSecOps CI/CD pipeline with open source SCA, SAST and DAST tools

Post Syndicated from Srinivas Manepalli original https://aws.amazon.com/blogs/devops/building-end-to-end-aws-devsecops-ci-cd-pipeline-with-open-source-sca-sast-and-dast-tools/

DevOps is a combination of cultural philosophies, practices, and tools that combine software development with information technology operations. These combined practices enable companies to deliver new application features and improved services to customers at a higher velocity. DevSecOps takes this a step further, integrating security into DevOps. With DevSecOps, you can deliver secure and compliant application changes rapidly while running operations consistently with automation.

Having a complete DevSecOps pipeline is critical to building a successful software factory, which includes continuous integration (CI), continuous delivery and deployment (CD), continuous testing, continuous logging and monitoring, auditing and governance, and operations. Identifying the vulnerabilities during the initial stages of the software development process can significantly help reduce the overall cost of developing application changes, but doing it in an automated fashion can accelerate the delivery of these changes as well.

To identify security vulnerabilities at various stages, organizations can integrate various tools and services (cloud and third-party) into their DevSecOps pipelines. Integrating various tools and aggregating the vulnerability findings can be a challenge to do from scratch. AWS has the services and tools necessary to accelerate this objective and provides the flexibility to build DevSecOps pipelines with easy integrations of AWS cloud native and third-party tools. AWS also provides services to aggregate security findings.

In this post, we provide a DevSecOps pipeline reference architecture on AWS that covers the afore-mentioned practices, including SCA (Software Composite Analysis), SAST (Static Application Security Testing), DAST (Dynamic Application Security Testing), and aggregation of vulnerability findings into a single pane of glass. Additionally, this post addresses the concepts of security of the pipeline and security in the pipeline.

You can deploy this pipeline in either the AWS GovCloud Region (US) or standard AWS Regions. As of this writing, all listed AWS services are available in AWS GovCloud (US) and authorized for FedRAMP High workloads within the Region, with the exception of AWS CodePipeline and AWS Security Hub, which are in the Region and currently under the JAB Review to be authorized shortly for FedRAMP High as well.

Services and tools

In this section, we discuss the various AWS services and third-party tools used in this solution.

CI/CD services

For CI/CD, we use the following AWS services:

  • AWS CodeBuild – A fully managed continuous integration service that compiles source code, runs tests, and produces software packages that are ready to deploy.
  • AWS CodeCommit – A fully managed source control service that hosts secure Git-based repositories.
  • AWS CodeDeploy – A fully managed deployment service that automates software deployments to a variety of compute services such as Amazon Elastic Compute Cloud (Amazon EC2), AWS Fargate, AWS Lambda, and your on-premises servers.
  • AWS CodePipeline – A fully managed continuous delivery service that helps you automate your release pipelines for fast and reliable application and infrastructure updates.
  • AWS Lambda – A service that lets you run code without provisioning or managing servers. You pay only for the compute time you consume.
  • Amazon Simple Notification Service – Amazon SNS is a fully managed messaging service for both application-to-application (A2A) and application-to-person (A2P) communication.
  • Amazon Simple Storage Service – Amazon S3 is storage for the internet. You can use Amazon S3 to store and retrieve any amount of data at any time, from anywhere on the web.
  • AWS Systems Manager Parameter Store – Parameter Store gives you visibility and control of your infrastructure on AWS.

Continuous testing tools

The following are open-source scanning tools that are integrated in the pipeline for the purposes of this post, but you could integrate other tools that meet your specific requirements. You can use the static code review tool Amazon CodeGuru for static analysis, but at the time of this writing, it’s not yet available in GovCloud and currently supports Java and Python (available in preview).

  • OWASP Dependency-Check – A Software Composition Analysis (SCA) tool that attempts to detect publicly disclosed vulnerabilities contained within a project’s dependencies.
  • SonarQube (SAST) – Catches bugs and vulnerabilities in your app, with thousands of automated Static Code Analysis rules.
  • PHPStan (SAST) – Focuses on finding errors in your code without actually running it. It catches whole classes of bugs even before you write tests for the code.
  • OWASP Zap (DAST) – Helps you automatically find security vulnerabilities in your web applications while you’re developing and testing your applications.

Continuous logging and monitoring services

The following are AWS services for continuous logging and monitoring:

Auditing and governance services

The following are AWS auditing and governance services:

  • AWS CloudTrail – Enables governance, compliance, operational auditing, and risk auditing of your AWS account.
  • AWS Identity and Access Management – Enables you to manage access to AWS services and resources securely. With IAM, you can create and manage AWS users and groups, and use permissions to allow and deny their access to AWS resources.
  • AWS Config – Allows you to assess, audit, and evaluate the configurations of your AWS resources.

Operations services

The following are AWS operations services:

  • AWS Security Hub – Gives you a comprehensive view of your security alerts and security posture across your AWS accounts. This post uses Security Hub to aggregate all the vulnerability findings as a single pane of glass.
  • AWS CloudFormation – Gives you an easy way to model a collection of related AWS and third-party resources, provision them quickly and consistently, and manage them throughout their lifecycles, by treating infrastructure as code.
  • AWS Systems Manager Parameter Store – Provides secure, hierarchical storage for configuration data management and secrets management. You can store data such as passwords, database strings, Amazon Machine Image (AMI) IDs, and license codes as parameter values.
  • AWS Elastic Beanstalk – An easy-to-use service for deploying and scaling web applications and services developed with Java, .NET, PHP, Node.js, Python, Ruby, Go, and Docker on familiar servers such as Apache, Nginx, Passenger, and IIS. This post uses Elastic Beanstalk to deploy LAMP stack with WordPress and Amazon Aurora MySQL. Although we use Elastic Beanstalk for this post, you could configure the pipeline to deploy to various other environments on AWS or elsewhere as needed.

Pipeline architecture

The following diagram shows the architecture of the solution.

AWS DevSecOps CICD pipeline architecture

AWS DevSecOps CICD pipeline architecture


The main steps are as follows:

  1. When a user commits the code to a CodeCommit repository, a CloudWatch event is generated which, triggers CodePipeline.
  2. CodeBuild packages the build and uploads the artifacts to an S3 bucket. CodeBuild retrieves the authentication information (for example, scanning tool tokens) from Parameter Store to initiate the scanning. As a best practice, it is recommended to utilize Artifact repositories like AWS CodeArtifact to store the artifacts, instead of S3. For simplicity of the workshop, we will continue to use S3.
  3. CodeBuild scans the code with an SCA tool (OWASP Dependency-Check) and SAST tool (SonarQube or PHPStan; in the provided CloudFormation template, you can pick one of these tools during the deployment, but CodeBuild is fully enabled for a bring your own tool approach).
  4. If there are any vulnerabilities either from SCA analysis or SAST analysis, CodeBuild invokes the Lambda function. The function parses the results into AWS Security Finding Format (ASFF) and posts it to Security Hub. Security Hub helps aggregate and view all the vulnerability findings in one place as a single pane of glass. The Lambda function also uploads the scanning results to an S3 bucket.
  5. If there are no vulnerabilities, CodeDeploy deploys the code to the staging Elastic Beanstalk environment.
  6. After the deployment succeeds, CodeBuild triggers the DAST scanning with the OWASP ZAP tool (again, this is fully enabled for a bring your own tool approach).
  7. If there are any vulnerabilities, CodeBuild invokes the Lambda function, which parses the results into ASFF and posts it to Security Hub. The function also uploads the scanning results to an S3 bucket (similar to step 4).
  8. If there are no vulnerabilities, the approval stage is triggered, and an email is sent to the approver for action.
  9. After approval, CodeDeploy deploys the code to the production Elastic Beanstalk environment.
  10. During the pipeline run, CloudWatch Events captures the build state changes and sends email notifications to subscribed users through SNS notifications.
  11. CloudTrail tracks the API calls and send notifications on critical events on the pipeline and CodeBuild projects, such as UpdatePipeline, DeletePipeline, CreateProject, and DeleteProject, for auditing purposes.
  12. AWS Config tracks all the configuration changes of AWS services. The following AWS Config rules are added in this pipeline as security best practices:
  13. CODEBUILD_PROJECT_ENVVAR_AWSCRED_CHECK – Checks whether the project contains environment variables AWS_ACCESS_KEY_ID and AWS_SECRET_ACCESS_KEY. The rule is NON_COMPLIANT when the project environment variables contains plaintext credentials.
  14. CLOUD_TRAIL_LOG_FILE_VALIDATION_ENABLED – Checks whether CloudTrail creates a signed digest file with logs. AWS recommends that the file validation be enabled on all trails. The rule is noncompliant if the validation is not enabled.

Security of the pipeline is implemented by using IAM roles and S3 bucket policies to restrict access to pipeline resources. Pipeline data at rest and in transit is protected using encryption and SSL secure transport. We use Parameter Store to store sensitive information such as API tokens and passwords. To be fully compliant with frameworks such as FedRAMP, other things may be required, such as MFA.

Security in the pipeline is implemented by performing the SCA, SAST and DAST security checks. Alternatively, the pipeline can utilize IAST (Interactive Application Security Testing) techniques that would combine SAST and DAST stages.

As a best practice, encryption should be enabled for the code and artifacts, whether at rest or transit.

In the next section, we explain how to deploy and run the pipeline CloudFormation template used for this example. Refer to the provided service links to learn more about each of the services in the pipeline. If utilizing CloudFormation templates to deploy infrastructure using pipelines, we recommend using linting tools like cfn-nag to scan CloudFormation templates for security vulnerabilities.

Prerequisites

Before getting started, make sure you have the following prerequisites:

Deploying the pipeline

To deploy the pipeline, complete the following steps: Download the CloudFormation template and pipeline code from GitHub repo.

  1. Log in to your AWS account if you have not done so already.
  2. On the CloudFormation console, choose Create Stack.
  3. Choose the CloudFormation pipeline template.
  4. Choose Next.
  5. Provide the stack parameters:
    • Under Code, provide code details, such as repository name and the branch to trigger the pipeline.
    • Under SAST, choose the SAST tool (SonarQube or PHPStan) for code analysis, enter the API token and the SAST tool URL. You can skip SonarQube details if using PHPStan as the SAST tool.
    • Under DAST, choose the DAST tool (OWASP Zap) for dynamic testing and enter the API token, DAST tool URL, and the application URL to run the scan.
    • Under Lambda functions, enter the Lambda function S3 bucket name, filename, and the handler name.
    • Under STG Elastic Beanstalk Environment and PRD Elastic Beanstalk Environment, enter the Elastic Beanstalk environment and application details for staging and production to which this pipeline deploys the application code.
    • Under General, enter the email addresses to receive notifications for approvals and pipeline status changes.

CF Deploymenet - Passing parameter values

CloudFormation deployment - Passing parameter values

CloudFormation template deployment

After the pipeline is deployed, confirm the subscription by choosing the provided link in the email to receive the notifications.

The provided CloudFormation template in this post is formatted for AWS GovCloud. If you’re setting this up in a standard Region, you have to adjust the partition name in the CloudFormation template. For example, change ARN values from arn:aws-us-gov to arn:aws.

Running the pipeline

To trigger the pipeline, commit changes to your application repository files. That generates a CloudWatch event and triggers the pipeline. CodeBuild scans the code and if there are any vulnerabilities, it invokes the Lambda function to parse and post the results to Security Hub.

When posting the vulnerability finding information to Security Hub, we need to provide a vulnerability severity level. Based on the provided severity value, Security Hub assigns the label as follows. Adjust the severity levels in your code based on your organization’s requirements.

  • 0 – INFORMATIONAL
  • 1–39 – LOW
  • 40– 69 – MEDIUM
  • 70–89 – HIGH
  • 90–100 – CRITICAL

The following screenshot shows the progression of your pipeline.

CodePipeline stages

CodePipeline stages

SCA and SAST scanning

In our architecture, CodeBuild trigger the SCA and SAST scanning in parallel. In this section, we discuss scanning with OWASP Dependency-Check, SonarQube, and PHPStan. 

Scanning with OWASP Dependency-Check (SCA)

The following is the code snippet from the Lambda function, where the SCA analysis results are parsed and posted to Security Hub. Based on the results, the equivalent Security Hub severity level (normalized_severity) is assigned.

Lambda code snippet for OWASP Dependency-check

Lambda code snippet for OWASP Dependency-check

You can see the results in Security Hub, as in the following screenshot.

SecurityHub report from OWASP Dependency-check scanning

SecurityHub report from OWASP Dependency-check scanning

Scanning with SonarQube (SAST)

The following is the code snippet from the Lambda function, where the SonarQube code analysis results are parsed and posted to Security Hub. Based on SonarQube results, the equivalent Security Hub severity level (normalized_severity) is assigned.

Lambda code snippet for SonarQube

Lambda code snippet for SonarQube

The following screenshot shows the results in Security Hub.

SecurityHub report from SonarQube scanning

SecurityHub report from SonarQube scanning

Scanning with PHPStan (SAST)

The following is the code snippet from the Lambda function, where the PHPStan code analysis results are parsed and posted to Security Hub.

Lambda code snippet for PHPStan

Lambda code snippet for PHPStan

The following screenshot shows the results in Security Hub.

SecurityHub report from PHPStan scanning

SecurityHub report from PHPStan scanning

DAST scanning

In our architecture, CodeBuild triggers DAST scanning and the DAST tool.

If there are no vulnerabilities in the SAST scan, the pipeline proceeds to the manual approval stage and an email is sent to the approver. The approver can review and approve or reject the deployment. If approved, the pipeline moves to next stage and deploys the application to the provided Elastic Beanstalk environment.

Scanning with OWASP Zap

After deployment is successful, CodeBuild initiates the DAST scanning. When scanning is complete, if there are any vulnerabilities, it invokes the Lambda function similar to SAST analysis. The function parses and posts the results to Security Hub. The following is the code snippet of the Lambda function.

Lambda code snippet for OWASP-Zap

Lambda code snippet for OWASP-Zap

The following screenshot shows the results in Security Hub.

SecurityHub report from OWASP-Zap scanning

SecurityHub report from OWASP-Zap scanning

Aggregation of vulnerability findings in Security Hub provides opportunities to automate the remediation. For example, based on the vulnerability finding, you can trigger a Lambda function to take the needed remediation action. This also reduces the burden on operations and security teams because they can now address the vulnerabilities from a single pane of glass instead of logging into multiple tool dashboards.

Conclusion

In this post, I presented a DevSecOps pipeline that includes CI/CD, continuous testing, continuous logging and monitoring, auditing and governance, and operations. I demonstrated how to integrate various open-source scanning tools, such as SonarQube, PHPStan, and OWASP Zap for SAST and DAST analysis. I explained how to aggregate vulnerability findings in Security Hub as a single pane of glass. This post also talked about how to implement security of the pipeline and in the pipeline using AWS cloud native services. Finally, I provided the DevSecOps pipeline as code using AWS CloudFormation. For additional information on AWS DevOps services and to get started, see AWS DevOps and DevOps Blog.


Srinivas Manepalli is a DevSecOps Solutions Architect in the U.S. Fed SI SA team at Amazon Web Services (AWS). He is passionate about helping customers, building and architecting DevSecOps and highly available software systems. Outside of work, he enjoys spending time with family, nature and good food.

Shifting Security Right: How Cloud-Based SecOps Can Speed Processes While Maintaining Integrity

Post Syndicated from Aaron Wells original https://blog.rapid7.com/2021/01/04/shifting-security-right-how-cloud-based-secops-can-speed-processes-while-maintaining-integrity/

Shifting Security Right: How Cloud-Based SecOps Can Speed Processes While Maintaining Integrity

When it comes to offloading security controls to the cloud, it may seem counterintuitive to the notion of “securing” things. But, when we consider the efficiency to be gained by shifting right with some security controls, it makes sense to send more granular, ground-up responsibilities to a trusted managed services cloud partner. This could help to increase development-and-deployment velocity, without compromising the integrity of your bespoke process.  

Building a true DevSecOps ecosystem is probably a common goal for most teams. However, uncommonality most often enters the picture in the forms of both technical and organizational roadblocks. Let’s take a look at some key insights from a 2020 SANS Institute survey on current industry efforts to more closely integrate DevOps and SecOps—and how you can plot your best path forward.

NEVER MISS A BLOG

Get the latest stories, expertise, and news about security today.
The security landscape

In more traditional environments, security teams often feel they’ve been left behind by the pace of DevOps. Vulnerabilities are introduced faster than SecOps can likely find them. The shift is with teams that are building continuous delivery frameworks, with compliance checks at every stage of the game. It becomes a matter of defending the environment as it’s being built.

Currently, about 74% of organizations are deploying changes more than once per month, according to SANS. Often, these are weekly or daily instances. So, velocity is increasing, primarily out of a need to get customers what they need, faster. Traditional change approvals and security controls are becoming more guardrail-style checks. The challenge, however, lies in optimizing the process and keeping it as secure as possible.

Increasing cloud adoption

From a security perspective, transitioning to a cloud provider’s responsibility model can better match the pace of DevOps and increase delivery speed. When both of these velocities are increasing, albeit responsibly, that’s better for business.

  • Cloud-hosted VM platforms allow teams to spin up processes more quickly compared to a traditional setup.
  • Adoption is accelerating for cloud-hosted container services and serverless platforms because providers are doing more provisioning, patching, and upgrading for many existing execution environments.
  • More organizations are running on cloud-hosted VMs versus container services and serverless platforms, but that could change because the latter two options allow you to further reduce your responsibility model.

Multi-cloud motivations

About 92% of organizations run on at least one public cloud provider. But for about 60% of those companies, the main motivations behind spreading services out between multiple providers are not quite as technical as one might imagine.

Mergers and acquisitions can cause obvious complexity, as companies link up and potentially run similar processes in different cloud environments like AWS, Azure, or GCP. There are also decision-makers and teams that prioritize a task-based approach and pick the best environment to get a particular job done. The benefits of a multi-cloud environment could then become drawbacks, as security becomes more difficult to plan for and understand. And no one wants complexity in an approach that is essentially supposed to offload responsibilities and make things easier.

Risk doesn’t translate for SecOps

As more DevOps teams increase their use of JavaScript, traditional security controls don’t support the popular format as well as other legacy languages. In this situation, there is greater risk. However, an older web app that hasn’t been updated in a while could be the tip of the iceberg in terms of the technical debt sitting out there.

Apps built on older languages like Java, .NET, and C++ could leave exposures open as teams roll over to newer languages. So, this situation also presents risk. Security teams may not even be aware they’re in the dark about vulnerabilities those legacy apps present, as they try to keep pace with DevOps.

The future of shifting left

When it comes to security testing phases, there’s still a heavy tendency toward QA. More is being done to integrate those protocols in the process, but the sea change of baking testing into earlier phases largely has yet to occur.  

  • Over the next decade, teams will likely adopt more cloud-based integration tools like AWS CodePipeline, Microsoft Azure DevOps, GitHub Actions, and GitLab CI. In these instances, the cloud provider is managing more for you, minimizing attack surfaces and providing more built-in security. GitHub and GitLab, in particular, are trending toward greater baked-in security.
  • Jenkins has been the continuous integration tool of choice for about the last decade. However, the 24/7 nature of running on-premises or in the cloud to manage builds, releases, and patches can increase the attack surface.
  • When it comes to container orchestration tools, cloud-managed services like AWS Fargate and Azure Container are beginning to pull even with cloud-hosted services like Docker and Kubernetes. It’s becoming more attractive to outsource control-point and hardening responsibilities, so that security can shift further left into containers; it simplifies testing and helps ease deployment.

The future of shifting right

Security-testing responsibility lies with actual security teams about 65% of the time. Yet, managing corrective actions lies with development teams about 63% of the time, according to SANS. These numbers indicate largely siloed actions blocking the path to a true DevSecOps approach.

The biggest success measurement of DevSecOps is the time it takes to fix an issue. Aligning teams to tackle an issue in a speedy manner can make or break. Additionally, identifying post-deployment issues can help to improve shift-left controls to prevent those issues from ever escaping into production.

A 100% cross-functional effort most likely will not be achieved by every organization. However, moving closer to this goal could help strengthen teams, boost morale, and feed back key learnings to ultimately increase the speed of success.

In conclusion

Ironically, the biggest challenge of all isn’t technical in nature. Red tape within organizations can present challenges like lack of buy-in from management, insufficient budget (open-source tools can help here!), and siloed efforts. Additionally, a shortage of skilled workers could reinforce the same old  decision-making patterns at those management levels.  

When it comes to closely aligning teams and getting more time back to innovate, it’s often a cyclical dance of shifting right to improve your efforts in shifting left. For example, can you move further right into the cloud rather than building do-it-yourself, comprehensive solutions to security? Offloading could help to create more controls for enforcing security in tandem with DevOps.

No one wants to compromise the integrity of deploying on time, particularly as it relates to customers and your company’s bottom line. Co-sponsored by Rapid7, this recent SANS webinar presents an in-depth look at key statistics from a recent survey of companies and their advancements—or lack thereof—in DevSecOps.

For more insights, access the full 2020 SANS Institute survey on Extending DevSecOps Security Controls into the Cloud.

Use Macie to discover sensitive data as part of automated data pipelines

Post Syndicated from Brandon Wu original https://aws.amazon.com/blogs/security/use-macie-to-discover-sensitive-data-as-part-of-automated-data-pipelines/

Data is a crucial part of every business and is used for strategic decision making at all levels of an organization. To extract value from their data more quickly, Amazon Web Services (AWS) customers are building automated data pipelines—from data ingestion to transformation and analytics. As part of this process, my customers often ask how to prevent sensitive data, such as personally identifiable information, from being ingested into data lakes when it’s not needed. They highlight that this challenge is compounded when ingesting unstructured data—such as files from process reporting, text files from chat transcripts, and emails. They also mention that identifying sensitive data inadvertently stored in structured data fields—such as in a comment field stored in a database—is also a challenge.

In this post, I show you how to integrate Amazon Macie as part of the data ingestion step in your data pipeline. This solution provides an additional checkpoint that sensitive data has been appropriately redacted or tokenized prior to ingestion. Macie is a fully managed data security and privacy service that uses machine learning and pattern matching to discover sensitive data in AWS.

When Macie discovers sensitive data, the solution notifies an administrator to review the data and decide whether to allow the data pipeline to continue ingesting the objects. If allowed, the objects will be tagged with an Amazon Simple Storage Service (Amazon S3) object tag to identify that sensitive data was found in the object before progressing to the next stage of the pipeline.

This combination of automation and manual review helps reduce the risk that sensitive data—such as personally identifiable information—will be ingested into a data lake. This solution can be extended to fit your use case and workflows. For example, you can define custom data identifiers as part of your scans, add additional validation steps, create Macie suppression rules to archive findings automatically, or only request manual approvals for findings that meet certain criteria (such as high severity findings).

Solution overview

Many of my customers are building serverless data lakes with Amazon S3 as the primary data store. Their data pipelines commonly use different S3 buckets at each stage of the pipeline. I refer to the S3 bucket for the first stage of ingestion as the raw data bucket. A typical pipeline might have separate buckets for raw, curated, and processed data representing different stages as part of their data analytics pipeline.

Typically, customers will perform validation and clean their data before moving it to a raw data zone. This solution adds validation steps to that pipeline after preliminary quality checks and data cleaning is performed, noted in blue (in layer 3) of Figure 1. The layers outlined in the pipeline are:

  1. Ingestion – Brings data into the data lake.
  2. Storage – Provides durable, scalable, and secure components to store the data—typically using S3 buckets.
  3. Processing – Transforms data into a consumable state through data validation, cleanup, normalization, transformation, and enrichment. This processing layer is where the additional validation steps are added to identify instances of sensitive data that haven’t been appropriately redacted or tokenized prior to consumption.
  4. Consumption – Provides tools to gain insights from the data in the data lake.


Figure 1: Data pipeline with sensitive data scan

Figure 1: Data pipeline with sensitive data scan

The application runs on a scheduled basis (four times a day, every 6 hours by default) to process data that is added to the raw data S3 bucket. You can customize the application to perform a sensitive data discovery scan during any stage of the pipeline. Because most customers do their extract, transform, and load (ETL) daily, the application scans for sensitive data on a scheduled basis before any crawler jobs run to catalog the data and after typical validation and data redaction or tokenization processes complete.

You can expect that this additional validation will add 5–10 minutes to your pipeline execution at a minimum. The validation processing time will scale linearly based on object size, but there is a start-up time per job that is constant.

If sensitive data is found in the objects, an email is sent to the designated administrator requesting an approval decision, which they indicate by selecting the link corresponding to their decision to approve or deny the next step. In most cases, the reviewer will choose to adjust the sensitive data cleanup processes to remove the sensitive data, deny the progression of the files, and re-ingest the files in the pipeline.

Additional considerations for deploying this application for regular use are discussed at the end of the blog post.

Application components

The following resources are created as part of the application:

Note: the application uses various AWS services, and there are costs associated with these resources after the Free Tier usage. See AWS Pricing for details. The primary drivers of the solution cost will be the amount of data ingested through the pipeline, both for Amazon S3 storage and data processed for sensitive data discovery with Macie.

The architecture of the application is shown in Figure 2 and described in the text that follows.
 

Figure 2: Application architecture and logic

Figure 2: Application architecture and logic

Application logic

  1. Objects are uploaded to the raw data S3 bucket as part of the data ingestion process.
  2. A scheduled EventBridge rule runs the sensitive data scan Step Functions workflow.
  3. triggerMacieScan Lambda function moves objects from the raw data S3 bucket to the scan stage S3 bucket.
  4. triggerMacieScan Lambda function creates a Macie sensitive data discovery job on the scan stage S3 bucket.
  5. checkMacieStatus Lambda function checks the status of the Macie sensitive data discovery job.
  6. isMacieStatusCompleteChoice Step Functions Choice state checks whether the Macie sensitive data discovery job is complete.
    1. If yes, the getMacieFindingsCount Lambda function runs.
    2. If no, the Step Functions Wait state waits 60 seconds and then restarts Step 5.
  7. getMacieFindingsCount Lambda function counts all of the findings from the Macie sensitive data discovery job.
  8. isSensitiveDataFound Step Functions Choice state checks whether sensitive data was found in the Macie sensitive data discovery job.
    1. If there was sensitive data discovered, run the triggerManualApproval Lambda function.
    2. If there was no sensitive data discovered, run the moveAllScanStageS3Files Lambda function.
  9. moveAllScanStageS3Files Lambda function moves all of the objects from the scan stage S3 bucket to the scanned data S3 bucket.
  10. triggerManualApproval Lambda function tags and moves objects with sensitive data discovered to the manual review S3 bucket, and moves objects with no sensitive data discovered to the scanned data S3 bucket. The function then sends a notification to the ApprovalRequestNotification Amazon SNS topic as a notification that manual review is required.
  11. Email is sent to the email address that’s subscribed to the ApprovalRequestNotification Amazon SNS topic (from the application deployment template) for the manual review user with the option to Approve or Deny pipeline ingestion for these objects.
  12. Manual review user assesses the objects with sensitive data in the manual review S3 bucket and selects the Approve or Deny links in the email.
  13. The decision request is sent from the Amazon API Gateway to the receiveApprovalDecision Lambda function.
  14. manualApprovalChoice Step Functions Choice state checks the decision from the manual review user.
    1. If denied, run the deleteManualReviewS3Files Lambda function.
    2. If approved, run the moveToScannedDataS3Files Lambda function.
  15. deleteManualReviewS3Files Lambda function deletes the objects from the manual review S3 bucket.
  16. moveToScannedDataS3Files Lambda function moves the objects from the manual review S3 bucket to the scanned data S3 bucket.
  17. The next step of the automated data pipeline will begin with the objects in the scanned data S3 bucket.

Prerequisites

For this application, you need the following prerequisites:

You can use AWS Cloud9 to deploy the application. AWS Cloud9 includes the AWS CLI and AWS SAM CLI to simplify setting up your development environment.

Deploy the application with AWS SAM CLI

You can deploy this application using the AWS SAM CLI. AWS SAM uses AWS CloudFormation as the underlying deployment mechanism. AWS SAM is an open-source framework that you can use to build serverless applications on AWS.

To deploy the application

  1. Initialize the serverless application using the AWS SAM CLI from the GitHub project in the aws-samples repository. This will clone the project locally which includes the source code for the Lambda functions, Step Functions state machine definition file, and the AWS SAM template. On the command line, run the following:
    sam init --location gh: aws-samples/amazonmacie-datapipeline-scan
    

    Alternatively, you can clone the Github project directly.

  2. Deploy your application to your AWS account. On the command line, run the following:
    sam deploy --guided
    

    Complete the prompts during the guided interactive deployment. The first deployment prompt is shown in the following example.

    Configuring SAM deploy
    ======================
    
            Looking for config file [samconfig.toml] :  Found
            Reading default arguments  :  Success
    
            Setting default arguments for 'sam deploy'
            =========================================
            Stack Name [maciepipelinescan]:
    

  3. Settings:
    • Stack Name – Name of the CloudFormation stack to be created.
    • AWS RegionRegion—for example, us-west-2, eu-west-1, ap-southeast-1—to deploy the application to. This application was tested in the us-west-2 and ap-southeast-1 Regions. Before selecting a Region, verify that the services you need are available in those Regions (for example, Macie and Step Functions).
    • Parameter StepFunctionName – Name of the Step Functions state machine to be created—for example, maciepipelinescanstatemachine).
    • Parameter BucketNamePrefix – Prefix to apply to the S3 buckets to be created (S3 bucket names are globally unique, so choosing a random prefix helps ensure uniqueness).
    • Parameter ApprovalEmailDestination – Email address to receive the manual review notification.
    • Parameter EnableMacie – Whether you need Macie enabled in your account or Region. You can select yes or no; select yes if you need Macie to be enabled for you as part of this template, select no, if you already have Macie enabled.
  4. Confirm changes and provide approval for AWS SAM CLI to deploy the resources to your AWS account by responding y to prompts, as shown in the following example. You can accept the defaults for the SAM configuration file and SAM configuration environment prompts.
    #Shows you resources changes to be deployed and require a 'Y' to initiate deploy
    Confirm changes before deploy [y/N]: y
    #SAM needs permission to be able to create roles to connect to the resources in your template
    Allow SAM CLI IAM role creation [Y/n]: y
    ReceiveApprovalDecisionAPI may not have authorization defined, Is this okay? [y/N]: y
    ReceiveApprovalDecisionAPI may not have authorization defined, Is this okay? [y/N]: y
    Save arguments to configuration file [Y/n]: y
    SAM configuration file [samconfig.toml]: 
    SAM configuration environment [default]:
    

    Note: This application deploys an Amazon API Gateway with two REST API resources without authorization defined to receive the decision from the manual review step. You will be prompted to accept each resource without authorization. A token (Step Functions taskToken) is used to authenticate the requests.

  5. This creates an AWS CloudFormation changeset. Once the changeset creation is complete, you must provide a final confirmation of y to Deploy the changeset? [y/N] when prompted as shown in the following example.
    Changeset created successfully. arn:aws:cloudformation:ap-southeast-1:XXXXXXXXXXXX:changeSet/samcli-deploy1605213119/db681961-3635-4305-b1c7-dcc754c7XXXX
    
    
    Previewing CloudFormation changeset before deployment
    ======================================================
    Deploy this changeset? [y/N]:
    

Your application is deployed to your account using AWS CloudFormation. You can track the deployment events in the command prompt or via the AWS CloudFormation console.

After the application deployment is complete, you must confirm the subscription to the Amazon SNS topic. An email will be sent to the email address entered in Step 3 with a link that you need to select to confirm the subscription. This confirmation provides opt-in consent for AWS to send emails to you via the specified Amazon SNS topic. The emails will be notifications of potentially sensitive data that need to be approved. If you don’t see the verification email, be sure to check your spam folder.

Test the application

The application uses an EventBridge scheduled rule to start the sensitive data scan workflow, which runs every 6 hours. You can manually start an execution of the workflow to verify that it’s working. To test the function, you will need a file that contains data that matches your rules for sensitive data. For example, it is easy to create a spreadsheet, document, or text file that contains names, addresses, and numbers formatted like credit card numbers. You can also use this generated sample data to test Macie.

We will test by uploading a file to our S3 bucket via the AWS web console. If you know how to copy objects from the command line, that also works.

Upload test objects to the S3 bucket

  1. Navigate to the Amazon S3 console and upload one or more test objects to the <BucketNamePrefix>-data-pipeline-raw bucket. <BucketNamePrefix> is the prefix you entered when deploying the application in the AWS SAM CLI prompts. You can use any objects as long as they’re a supported file type for Amazon Macie. I suggest uploading multiple objects, some with and some without sensitive data, in order to see how the workflow processes each.

Start the Scan State Machine

  1. Navigate to the Step Functions state machines console. If you don’t see your state machine, make sure you’re connected to the same region that you deployed your application to.
  2. Choose the state machine you created using the AWS SAM CLI as seen in Figure 3. The example state machine is maciepipelinescanstatemachine, but you might have used a different name in your deployment.
     
    Figure 3: AWS Step Functions state machines console

    Figure 3: AWS Step Functions state machines console

  3. Select the Start execution button and copy the value from the Enter an execution name – optional box. Change the Input – optional value replacing <execution id> with the value just copied as follows:
    {
        “id”: “<execution id>”
    }
    

    In my example, the <execution id> is fa985a4f-866b-b58b-d91b-8a47d068aa0c from the Enter an execution name – optional box as shown in Figure 4. You can choose a different ID value if you prefer. This ID is used by the workflow to tag the objects being processed to ensure that only objects that are scanned continue through the pipeline. When the EventBridge scheduled event starts the workflow as scheduled, an ID is included in the input to the Step Functions workflow. Then select Start execution again.
     

    Figure 4: New execution dialog box

    Figure 4: New execution dialog box

  4. You can see the status of your workflow execution in the Graph inspector as shown in Figure 5. In the figure, the workflow is at the pollForCompletionWait step.
     
    Figure 5: AWS Step Functions graph inspector

    Figure 5: AWS Step Functions graph inspector

The sensitive discovery job should run for about five to ten minutes. The jobs scale linearly based on object size, but there is a start-up time per job that is constant. If sensitive data is found in the objects uploaded to the <BucketNamePrefix>-data-pipeline-upload S3 bucket, an email is sent to the address provided during the AWS SAM deployment step, notifying the recipient requesting of the need for an approval decision, which they indicate by selecting the link corresponding to their decision to approve or deny the next step as shown in Figure 6.
 

Figure 6: Sensitive data identified email

Figure 6: Sensitive data identified email

When you receive this notification, you can investigate the findings by reviewing the objects in the <BucketNamePrefix>-data-pipeline-manual-review S3 bucket. Based on your review, you can either apply remediation steps to remove any sensitive data or allow the data to proceed to the next step of the data ingestion pipeline. You should define a standard response process to address discovery of sensitive data in the data pipeline. Common remediation steps include review of the files for sensitive data, deleting the files that you do not want to progress, and updating the ETL process to redact or tokenize sensitive data when re-ingesting into the pipeline. When you re-ingest the files into the pipeline without sensitive data, the files will not be flagged by Macie.

The workflow performs the following:

  • If you select Approve, the files are moved to the <BucketNamePrefix>-data-pipeline-scanned-data S3 bucket with an Amazon S3 SensitiveDataFound object tag with a value of true.
  • If you select Deny, the files are deleted from the <BucketNamePrefix>-data-pipeline-manual-review S3 bucket.
  • If no action is taken, the Step Functions workflow execution times out after five days and the file will automatically be deleted from the <BucketNamePrefix>-data-pipeline-manual-review S3 bucket after 10 days.

Clean up the application

You’ve successfully deployed and tested the sensitive data pipeline scan workflow. To avoid ongoing charges for resources you created, you should delete all associated resources by deleting the CloudFormation stack. In order to delete the CloudFormation stack, you must first delete all objects that are stored in the S3 buckets that you created for the application.

To delete the application

  1. Empty the S3 buckets created in this application (<BucketNamePrefix>-data-pipeline-raw S3 bucket, <BucketNamePrefix>-data-pipeline-scan-stage, <BucketNamePrefix>-data-pipeline-manual-review, and <BucketNamePrefix>-data-pipeline-scanned-data).
  2. Delete the CloudFormation stack used to deploy the application.

Considerations for regular use

Before using this application in a production data pipeline, you will need to stop and consider some practical matters. First, the notification mechanism used when sensitive data is identified in the objects is email. Email doesn’t scale: you should expand this solution to integrate with your ticketing or workflow management system. If you choose to use email, subscribe a mailing list so that the work of reviewing and responding to alerts is shared across a team.

Second, the application is run on a scheduled basis (every 6 hours by default). You should consider starting the application when your preliminary validations have completed and are ready to perform a sensitive data scan on the data as part of your pipeline. You can modify the EventBridge Event Rule to run in response to an Amazon EventBridge event instead of a scheduled basis.

Third, the application currently uses a 60 second Step Functions Wait state when polling for the Macie discovery job completion. In real world scenarios, the discovery scan will take 10 minutes at a minimum, likely several orders of magnitude longer. You should evaluate the typical execution times for your application execution and tune the polling period accordingly. This will help reduce costs related to running Lambda functions and log storage within CloudWatch Logs. The polling period is defined in the Step Functions state machine definition file (macie_pipeline_scan.asl.json) under the pollForCompletionWait state.

Fourth, the application currently doesn’t account for false positives in the sensitive data discovery job results. Also, the application will progress or delete all objects identified based on the decision by the reviewer. You should consider expanding the application to handle false positives through automation rather than manual review / intervention (such as deleting the files from the manual review bucket or removing the sensitive data tags applied).

Last, the solution will stop the ingestion of a subset of objects into your pipeline. This behavior is similar to other validation and data quality checks that most customers perform as part of the data pipeline. However, you should test to ensure that this will not cause unexpected outcomes and address them in your downstream application logic accordingly.

Conclusion

In this post, I showed you how to integrate sensitive data discovery using Macie as an additional validation step in an automated data pipeline. You’ve reviewed the components of the application, deployed it using the AWS SAM CLI, tested to validate that the application functions as expected, and cleaned up by removing deployed resources.

You now know how to integrate sensitive data scanning into your ETL pipeline. You can use automation and—where required—manual review to help reduce the risk of sensitive data, such as personally identifiable information, being inadvertently ingested into a data lake. You can take this application and customize it to fit your use case and workflows, such as using custom data identifiers as part of your scans, adding additional validation steps, creating Macie suppression rules to define cases to archive findings automatically, or only request manual approvals for findings that meet certain criteria (such as high severity findings).

If you have feedback about this post, submit comments in the Comments section below. If you have questions about this post, start a new thread on the Amazon Macie forum.

Want more AWS Security how-to content, news, and feature announcements? Follow us on Twitter.

Author

Brandon Wu

Brandon is a security solutions architect helping financial services organizations secure their critical workloads on AWS. In his spare time, he enjoys exploring outdoors and experimenting in the kitchen.

How to deploy the AWS Solution for Security Hub Automated Response and Remediation

Post Syndicated from Ramesh Venkataraman original https://aws.amazon.com/blogs/security/how-to-deploy-the-aws-solution-for-security-hub-automated-response-and-remediation/

In this blog post I show you how to deploy the Amazon Web Services (AWS) Solution for Security Hub Automated Response and Remediation. The first installment of this series was about how to create playbooks using Amazon CloudWatch Events, AWS Lambda functions, and AWS Security Hub custom actions that you can run manually based on triggers from Security Hub in a specific account. That solution requires an analyst to directly trigger an action using Security Hub custom actions and doesn’t work for customers who want to set up fully automated remediation based on findings across one or more accounts from their Security Hub master account.

The solution described in this post automates the cross-account response and remediation lifecycle from executing the remediation action to resolving the findings in Security Hub and notifying users of the remediation via Amazon Simple Notification Service (Amazon SNS). You can also deploy these automated playbooks as custom actions in Security Hub, which allows analysts to run them on-demand against specific findings. You can deploy these remediations as custom actions or as fully automated remediations.

Currently, the solution includes 10 playbooks aligned to the controls in the Center for Internet Security (CIS) AWS Foundations Benchmark standard in Security Hub, but playbooks for other standards such as AWS Foundational Security Best Practices (FSBP) will be added in the future.

Solution overview

Figure 1 shows the flow of events in the solution described in the following text.

Figure 1: Flow of events

Figure 1: Flow of events

Detect

Security Hub gives you a comprehensive view of your security alerts and security posture across your AWS accounts and automatically detects deviations from defined security standards and best practices.

Security Hub also collects findings from various AWS services and supported third-party partner products to consolidate security detection data across your accounts.

Ingest

All of the findings from Security Hub are automatically sent to CloudWatch Events and Amazon EventBridge and you can set up CloudWatch Events and EventBridge rules to be invoked on specific findings. You can also send findings to CloudWatch Events and EventBridge on demand via Security Hub custom actions.

Remediate

The CloudWatch Event and EventBridge rules can have AWS Lambda functions, AWS Systems Manager automation documents, or AWS Step Functions workflows as the targets of the rules. This solution uses automation documents and Lambda functions as response and remediation playbooks. Using cross-account AWS Identity and Access Management (IAM) roles, the playbook performs the tasks to remediate the findings using the AWS API when a rule is invoked.

Log

The playbook logs the results to the Amazon CloudWatch log group for the solution, sends a notification to an Amazon Simple Notification Service (Amazon SNS) topic, and updates the Security Hub finding. An audit trail of actions taken is maintained in the finding notes. The finding is updated as RESOLVED after the remediation is run. The security finding notes are updated to reflect the remediation performed.

Here are the steps to deploy the solution from this GitHub project.

  • In the Security Hub master account, you deploy the AWS CloudFormation template, which creates an AWS Service Catalog product along with some other resources. For a full set of what resources are deployed as part of an AWS CloudFormation stack deployment, you can find the full set of deployed resources in the Resources section of the deployed AWS CloudFormation stack. The solution uses the AWS Service Catalog to have the remediations available as a product that can be deployed after granting the users the required permissions to launch the product.
  • Add an IAM role that has administrator access to the AWS Service Catalog portfolio.
  • Deploy the CIS playbook from the AWS Service Catalog product list using the IAM role you added in the previous step.
  • Deploy the AWS Security Hub Automated Response and Remediation template in the master account in addition to the member accounts. This template establishes AssumeRole permissions to allow the playbook Lambda functions to perform remediations. Use AWS CloudFormation StackSets in the master account to have a centralized deployment approach across the master account and multiple member accounts.

Deployment steps for automated response and remediation

This section reviews the steps to implement the solution, including screenshots of the solution launched from an AWS account.

Launch AWS CloudFormation stack on the master account

As part of this AWS CloudFormation stack deployment, you create custom actions to configure Security Hub to send findings to CloudWatch Events. Lambda functions are used to provide remediation in response to actions sent to CloudWatch Events.

Note: In this solution, you create custom actions for the CIS standards. There will be more custom actions added for other security standards in the future.

To launch the AWS CloudFormation stack

  1. Deploy the AWS CloudFormation template in the Security Hub master account. In your AWS console, select CloudFormation and choose Create new stack and enter the S3 URL.
  2. Select Next to move to the Specify stack details tab, and then enter a Stack name as shown in Figure 2. In this example, I named the stack SO0111-SHARR, but you can use any name you want.
     
    Figure 2: Creating a CloudFormation stack

    Figure 2: Creating a CloudFormation stack

  3. Creating the stack automatically launches it, creating 21 new resources using AWS CloudFormation, as shown in Figure 3.
     
    Figure 3: Resources launched with AWS CloudFormation

    Figure 3: Resources launched with AWS CloudFormation

  4. An Amazon SNS topic is automatically created from the AWS CloudFormation stack.
  5. When you create a subscription, you’re prompted to enter an endpoint for receiving email notifications from Amazon SNS as shown in Figure 4. To subscribe to that topic that was created using CloudFormation, you must confirm the subscription from the email address you used to receive notifications.
     
    Figure 4: Subscribing to Amazon SNS topic

    Figure 4: Subscribing to Amazon SNS topic

Enable Security Hub

You should already have enabled Security Hub and AWS Config services on your master account and the associated member accounts. If you haven’t, you can refer to the documentation for setting up Security Hub on your master and member accounts. Figure 5 shows an AWS account that doesn’t have Security Hub enabled.
 

Figure 5: Enabling Security Hub for first time

Figure 5: Enabling Security Hub for first time

AWS Service Catalog product deployment

In this section, you use the AWS Service Catalog to deploy Service Catalog products.

To use the AWS Service Catalog for product deployment

  1. In the same master account, add roles that have administrator access and can deploy AWS Service Catalog products. To do this, from Services in the AWS Management Console, choose AWS Service Catalog. In AWS Service Catalog, select Administration, and then navigate to Portfolio details and select Groups, roles, and users as shown in Figure 6.
     
    Figure 6: AWS Service Catalog product

    Figure 6: AWS Service Catalog product

  2. After adding the role, you can see the products available for that role. You can switch roles on the console to assume the role that you granted access to for the product you added from the AWS Service Catalog. Select the three dots near the product name, and then select Launch product to launch the product, as shown in Figure 7.
     
    Figure 7: Launch the product

    Figure 7: Launch the product

  3. While launching the product, you can choose from the parameters to either enable or disable the automated remediation. Even if you do not enable fully automated remediation, you can still invoke a remediation action in the Security Hub console using a custom action. By default, it’s disabled, as highlighted in Figure 8.
     
    Figure 8: Enable or disable automated remediation

    Figure 8: Enable or disable automated remediation

  4. After launching the product, it can take from 3 to 5 minutes to deploy. When the product is deployed, it creates a new CloudFormation stack with a status of CREATE_COMPLETE as part of the provisioned product in the AWS CloudFormation console.

AssumeRole Lambda functions

Deploy the template that establishes AssumeRole permissions to allow the playbook Lambda functions to perform remediations. You must deploy this template in the master account in addition to any member accounts. Choose CloudFormation and create a new stack. In Specify stack details, go to Parameters and specify the Master account number as shown in Figure 9.
 

Figure 9: Deploy AssumeRole Lambda function

Figure 9: Deploy AssumeRole Lambda function

Test the automated remediation

Now that you’ve completed the steps to deploy the solution, you can test it to be sure that it works as expected.

To test the automated remediation

  1. To test the solution, verify that there are 10 actions listed in Custom actions tab in the Security Hub master account. From the Security Hub master account, open the Security Hub console and select Settings and then Custom actions. You should see 10 actions, as shown in Figure 10.
     
    Figure 10: Custom actions deployed

    Figure 10: Custom actions deployed

  2. Make sure you have member accounts available for testing the solution. If not, you can add member accounts to the master account as described in Adding and inviting member accounts.
  3. For testing purposes, you can use CIS 1.5 standard, which is to require that the IAM password policy requires at least one uppercase letter. Check the existing settings by navigating to IAM, and then to Account Settings. Under Password policy, you should see that there is no password policy set, as shown in Figure 11.
     
    Figure 11: Password policy not set

    Figure 11: Password policy not set

  4. To check the security settings, go to the Security Hub console and select Security standards. Choose CIS AWS Foundations Benchmark v1.2.0. Select CIS 1.5 from the list to see the Findings. You will see the Status as Failed. This means that the password policy to require at least one uppercase letter hasn’t been applied to either the master or the member account, as shown in Figure 12.
     
    Figure 12: CIS 1.5 finding

    Figure 12: CIS 1.5 finding

  5. Select CIS 1.5 – 1.11 from Actions on the top right dropdown of the Findings section from the previous step. You should see a notification with the heading Successfully sent findings to Amazon CloudWatch Events as shown in Figure 13.
     
    Figure 13: Sending findings to CloudWatch Events

    Figure 13: Sending findings to CloudWatch Events

  6. Return to Findings by selecting Security standards and then choosing CIS AWS Foundations Benchmark v1.2.0. Select CIS 1.5 to review Findings and verify that the Workflow status of CIS 1.5 is RESOLVED, as shown in Figure 14.
     
    Figure 14: Resolved findings

    Figure 14: Resolved findings

  7. After the remediation runs, you can verify that the Password policy is set on the master and the member accounts. To verify that the password policy is set, navigate to IAM, and then to Account Settings. Under Password policy, you should see that the account uses a password policy, as shown in Figure 15.
     
    Figure 15: Password policy set

    Figure 15: Password policy set

  8. To check the CloudWatch logs for the Lambda function, in the console, go to Services, and then select Lambda and choose the Lambda function and within the Lambda function, select View logs in CloudWatch. You can see the details of the function being run, including updating the password policy on both the master account and the member account, as shown in Figure 16.
     
    Figure 15: Lambda function log

    Figure 16: Lambda function log

Conclusion

In this post, you deployed the AWS Solution for Security Hub Automated Response and Remediation using Lambda and CloudWatch Events rules to remediate non-compliant CIS-related controls. With this solution, you can ensure that users in member accounts stay compliant with the CIS AWS Foundations Benchmark by automatically invoking guardrails whenever services move out of compliance. New or updated playbooks will be added to the existing AWS Service Catalog portfolio as they’re developed. You can choose when to take advantage of these new or updated playbooks.

If you have feedback about this post, submit comments in the Comments section below. If you have questions about this post, start a new thread on the AWS Security Hub forum or contact AWS Support.

Want more AWS Security how-to content, news, and feature announcements? Follow us on Twitter.

Author

Ramesh Venkataraman

Ramesh is a Solutions Architect who enjoys working with customers to solve their technical challenges using AWS services. Outside of work, Ramesh enjoys following stack overflow questions and answers them in any way he can.

How to automate incident response in the AWS Cloud for EC2 instances

Post Syndicated from Ben Eichorst original https://aws.amazon.com/blogs/security/how-to-automate-incident-response-in-aws-cloud-for-ec2-instances/

One of the security epics core to the AWS Cloud Adoption Framework (AWS CAF) is a focus on incident response and preparedness to address unauthorized activity. Multiple methods exist in Amazon Web Services (AWS) for automating classic incident response techniques, and the AWS Security Incident Response Guide outlines many of these methods. This post demonstrates one specific method for instantaneous response and acquisition of infrastructure data from Amazon Elastic Compute Cloud (Amazon EC2) instances.

Incident response starts with detection, progresses to investigation, and then follows with remediation. This process is no different in AWS. AWS services such as Amazon GuardDuty, Amazon Macie, and Amazon Inspector provide detection capabilities. Amazon Detective assists with investigation, including tracking and gathering information. Then, after your security organization decides to take action, pre-planned and pre-provisioned runbooks enable faster action towards a resolution. One principle outlined in the incident response whitepaper and the AWS Well-Architected Framework is the notion of pre-provisioning systems and policies to allow you to react quickly to an incident response event. The solution I present here provides a pre-provisioned architecture for an incident response system that you can use to respond to a suspect EC2 instance.

Infrastructure overview

The architecture that I outline in this blog post automates these standard actions on a suspect compute instance:

  1. Capture all the persistent disks.
  2. Capture the instance state at the time the incident response mechanism is started.
  3. Isolate the instance and protect against accidental instance termination.
  4. Perform operating system–level information gathering, such as memory captures and other parameters.
  5. Notify the administrator of these actions.

The solution in this blog post accomplishes these tasks through the following logical flow of AWS services, illustrated in Figure 1.
 

Figure 1: Infrastructure deployed by the accompanying AWS CloudFormation template and associated task flow when invoking the main API

Figure 1: Infrastructure deployed by the accompanying AWS CloudFormation template and associated task flow when invoking the main API

  1. A user or application calls an API with an EC2 instance ID to start data collection.
  2. Amazon API Gateway initiates the core logic of the process by instantiating an AWS Lambda function.
  3. The Lambda function performs the following data gathering steps before making any changes to the infrastructure:
    1. Save instance metadata to the SecResponse Amazon Simple Storage Service (Amazon S3) bucket.
    2. Save a snapshot of the instance console to the SecResponse S3 bucket.
    3. Initiate an Amazon Elastic Block Store (Amazon EBS) snapshot of all persistent block storage volumes.
  4. The Lambda function then modifies the infrastructure to continue gathering information, by doing the following steps:
    1. Set the Amazon EC2 termination protection flag on the instance.
    2. Remove any existing EC2 instance profile from the instance.
    3. If the instance is managed by AWS Systems Manager:
      1. Attach an EC2 instance profile with minimal privileges for operating system–level information gathering.
      2. Perform operating system–level information gathering actions through Systems Manager on the EC2 instance.
      3. Remove the instance profile after Systems Manager has completed its actions.
    4. Create a quarantine security group that lacks both ingress and egress rules.
    5. Move the instance into the created quarantine security group for isolation.
  5. Send an administrative notification through the configured Amazon Simple Notification Service (Amazon SNS) topic.

Solution features

By using the mechanisms outlined in this post to codify your incident response runbooks, you can see the following benefits to your incident response plan.

Preparation for incident response before an incident occurs

Both the AWS CAF and Well-Architected Framework recommend that customers formulate known procedures for incident response, and test those runbooks before an incident. Testing these processes before an event occurs decreases the time it takes you to respond in a production environment. The sample infrastructure shown in this post demonstrates how you can standardize those procedures.

Consistent incident response artifact gathering

Codifying your processes into set code and infrastructure prepares you for the need to collect data, but also standardizes the collection process into a repeatable and auditable sequence of What information was collected when and how. This reduces the likelihood of missing data for future investigations.

Walkthrough: Deploying infrastructure and starting the process

To implement the solution outlined in this post, you first need to deploy the infrastructure, and then start the data collection process by issuing an API call.

The code example in this blog post requires that you provision an AWS CloudFormation stack, which creates an S3 bucket for storing your event artifacts and a serverless API that uses API Gateway and Lambda. You then execute a query against this API to take action on a target EC2 instance.

The infrastructure deployed by the AWS CloudFormation stack is a set of AWS components as depicted previously in Figure 1. The stack includes all the services and configurations to deploy the demo. It doesn’t include a target EC2 instance that you can use to test the mechanism used in this post.

Cost

The cost for this demo is minimal because the base infrastructure is completely serverless. With AWS, you only pay for the infrastructure that you use, so the single API call issued in this demo costs fractions of a cent. Artifact storage costs will incur S3 storage prices, and Amazon EC2 snapshots will be stored at their respective prices.

Deploy the AWS CloudFormation stack

In future posts and updates, we will show how to set up this security response mechanism inside a separate account designated for security, but for the purposes of this post, your demo stack must reside in the same AWS account as the target instance that you set up in the next section.

First, start by deploying the AWS CloudFormation template to provision the infrastructure.

To deploy this template in the us-east-1 region

  1. Choose the Launch Stack button to open the AWS CloudFormation console pre-loaded with the template:
     
    Select the Launch Stack button to launch the template
  2. (Optional) In the AWS CloudFormation console, on the Specify Details page, customize the stack name.
  3. For the LambdaS3BucketLocation and LambdaZipFileName fields, leave the default values for the purposes of this blog. Customizing this field allows you to customize this code example for your own purposes and store it in an S3 bucket of your choosing.
  4. Customize the S3BucketName field. This needs to be a globally unique S3 bucket name. This bucket is where gathered artifacts are stored for the demo in this blog. You must customize it beyond the default value for the template to instantiate properly.
  5. (Optional) Customize the SNSTopicName field. This name provides a meaningful label for the SNS topic that notifies the administrator of the actions that were performed.
  6. Choose Next to configure the stack options and leave all default settings in place.
  7. Choose Next to review and scroll to the bottom of the page. Select all three check boxes under the Capabilities and Transforms section, next to each of the three acknowledgements:
    • I acknowledge that AWS CloudFormation might create IAM resources.
    • I acknowledge that AWS CloudFormation might create IAM resources with custom names.
    • I acknowledge that AWS CloudFormation might require the following capability: CAPABILITY_AUTO_EXPAND.
  8. Choose Create Stack.

Set up a target EC2 instance

In order to demonstrate the functionality of this mechanism, you need a target host. Provision any EC2 instance in your account to act as a target for the security response mechanism to act upon for information collection and quarantine. To optimize affordability and demonstrate full functionality, I recommend choosing a small instance size (for example, t2.nano) and optionally joining the instance into Systems Manager for the ability to later execute Run Command API queries. For more details on configuring Systems Manager, refer to the AWS Systems Manager User Guide.

Retrieve required information for system initiation

The entire security response mechanism triggers through an API call. To successfully initiate this call, you first need to gather the API URI and key information.

To find the API URI and key information

  1. Navigate to the AWS CloudFormation console and choose the stack that you’ve instantiated.
  2. Choose the Outputs tab and save the value for the key APIBaseURI. This is the base URI for the API Gateway. It will resemble https://abcdefgh12.execute-api.us-east-1.amazonaws.com.
  3. Next, navigate to the API Gateway console and choose the API with the name SecurityResponse.
  4. Choose API Keys, and then choose the only key present.
  5. Next to the API key field, choose Show to reveal the key, and then save this value to a notepad for later use.

(Optional) Configure administrative notification through the created SNS topic

One aspect of this mechanism is that it sends notifications through SNS topics. You can optionally subscribe your email or another notification pipeline mechanism to the created SNS topic in order to receive notifications on actions taken by the system.

Initiate the security response mechanism

Note that, in this demo code, you’re using a simple API key for limiting access to API Gateway. In production applications, you would use an authentication mechanism such as Amazon Cognito to control access to your API.

To kick off the security response mechanism, initiate a REST API query against the API that was created in the AWS CloudFormation template. You first create this API call by using a curl command to be run from a Linux system.

To create the API initiation curl command

  1. Copy the following example curl command.
    curl -v -X POST -i -H "x-api-key: 012345ABCDefGHIjkLMS20tGRJ7othuyag" https://abcdefghi.execute-api.us-east-1.amazonaws.com/DEMO/secresponse -d '{
      "instance_id":"i-123457890"
    }'
    

  2. Replace the placeholder API key specified in the x-api-key HTTP header with your API key.
  3. Replace the example URI path with your API’s specific URI. To create the full URI, concatenate the base URI listed in the AWS CloudFormation output you gathered previously with the API call path, which is /DEMO/secresponse. This full URI for your specific API call should closely resemble this sample URI path: https://abcdefghi.execute-api.us-east-1.amazonaws.com/DEMO/secresponse
  4. Replace the value associated with the key instance_id with the instance ID of the target EC2 instance you created.

Because this mechanism initiates through a simple API call, you can easily integrate it with existing workflow management systems. This allows for complex data collection and forensic procedures to be integrated with existing incident response workflows.

Review the gathered data

Note that the following items were uploaded as objects in the security response S3 bucket:

  1. A console screenshot, as shown in Figure 2.
  2. (If Systems Manager is configured) stdout information from the commands that were run on the host operating system.
  3. Instance metadata in JSON form.


Figure 2: Example outputs from a successful completion of this blog post's mechanism

Figure 2: Example outputs from a successful completion of this blog post’s mechanism

Additionally, if you load the Amazon EC2 console and scroll down to Elastic Block Store, you can see that EBS snapshots are present for all persistent disks as shown in Figure 3.
 

Figure 3: Evidence of an EBS snapshot from a successful run

Figure 3: Evidence of an EBS snapshot from a successful run

You can also verify that the previously outlined security controls are in place by viewing the instance in the Amazon EC2 console. You should see the removal of AWS Identity and Access Management (IAM) roles from the target EC2 instances and that the instance has been placed into network isolation through a newly created quarantine security group.

Note that for the purposes of this demo, all information that you gathered is stored in the same AWS account as the workload. As a best practice, many AWS customers choose instead to store this information in an AWS account that’s specifically designated for incident response and analysis. A dedicated account provides clear isolation of function and restriction of access. Using AWS Organizations service control policies (SCPs) and IAM permissions, your security team can limit access to adhere to security policy, legal guidance, and compliance regulations.

Clean up and delete artifacts

To clean up the artifacts from the solution in this post, first delete all information in your security response S3 bucket. Then delete the CloudFormation stack that was provisioned at the start of this process in order to clean up all remaining infrastructure.

Conclusion

Placing workloads in the AWS Cloud allows for pre-provisioned and explicitly defined incident response runbooks to be codified and quickly executed on suspect EC2 instances. This enables you to gather data in minutes that previously took hours or even days using manual processes.

If you have feedback about this post, submit comments in the Comments section below. If you have questions about this post, start a new thread on the Amazon EC2 forum or contact AWS Support.

Want more AWS Security how-to content, news, and feature announcements? Follow us on Twitter.

Author

Ben Eichorst

Ben is a Senior Solutions Architect, Security, Cryptography, and Identity Specialist for AWS. He works with AWS customers to efficiently implement globally scalable security programs while empowering development teams and reducing risk. He holds a BA from Northwestern University and an MBA from University of Colorado.

OWASP APICheck – HTTP API DevSecOps Toolset

Post Syndicated from original https://www.darknet.org.uk/2020/10/owasp-apicheck-http-api-devsecops-toolset/?utm_source=rss&utm_medium=social&utm_campaign=darknetfeed

OWASP APICheck – HTTP API DevSecOps Toolset

APICheck is an HTTP API DevSecOps toolset, it integrates existing HTTP APIs tools, creates execution chains easily and is designed for integration with third-party tools in mind.

APICheck is comprised of a set of tools that can be connected to each other to achieve different functionalities, depending on how they are connected. It allows you to create execution chains and it can not only integrate self-developed tools but also can leverage existing tools in order to take advantage of them to provide new functionality.

Read the rest of OWASP APICheck – HTTP API DevSecOps Toolset now! Only available at Darknet.