On June 27, the United Nations celebrates Micro-, Small, and Medium-sized Enterprises Day (MSME) to recognize the critical role these businesses play in the global economy and economic development. According to the World Bank and the UN, small and medium-sized businesses make up about 90 percent of all businesses, between 50-70 percent of global employment, and 50 percent of global GDP. They not only drive local and national economies, but also sustain the livelihoods of women, youth, and other groups in vulnerable situations.
As part of MSME Day, we wanted to highlight some of the amazing startups and small businesses that are using Cloudflare to not only secure and improve their websites, but also build, scale, and deploy new serverless applications (and businesses) directly on Cloudflare’s global network.
A startup for startups
Cloudflare started as an idea to provide better security and performance tools for everyone. Back in 2010, if you were a large enterprise and wanted better performance and security for your website, you could buy an expensive piece of on-premise hardware or contract with a large, global Content Delivery Network (CDN) provider. Those same types of services were not only unaffordable for most website owners or smaller businesses, but also generally unavailable, as they typically demanded expensive on-premise hardware or direct server access that most smaller operations lacked. Cloudflare launched, fittingly at a startup competition, with the goal of making those same types of tools available to everyone.
As Cloudflare has grown, we have continued to highlight how our millions of free customers, many of them individual developers, startups, and small businesses, drive our network, company, and mission. They help keep our costs low, allow us to interconnect with more networks, and help us build better products.
Over the last 12 months, we have put even more of an emphasis on supporting startup and small business communities by expanding free developer tools, which make it easier for anyone to build full stack, AI-enabled applications directly on Cloudflare’s network, and investing in programs like Cloudflare for Startups, Workers Launchpad, and the Dev Alliance. For example:
More than 3,000 startups are receiving free credits to build and scale their applications directly on Cloudflare’s global network using our developer services.
In 2024 alone, 122 startups in 22 countries were accepted into Cloudflare’s Launchpad Program, which provides additional infrastructure, tools, and community support to help entrepreneurs scale their applications and businesses, including access to Cloudflare demo days.
Since 2022, Cloudflare has worked with over 40 venture capital partners to secure more than $2 billion in potential financing for companies participating in our startup programs.
With the right tools in hand, entrepreneurs are turning ideas into real world impact, and we’re honored to support them.
Spotlighting innovation across the globe
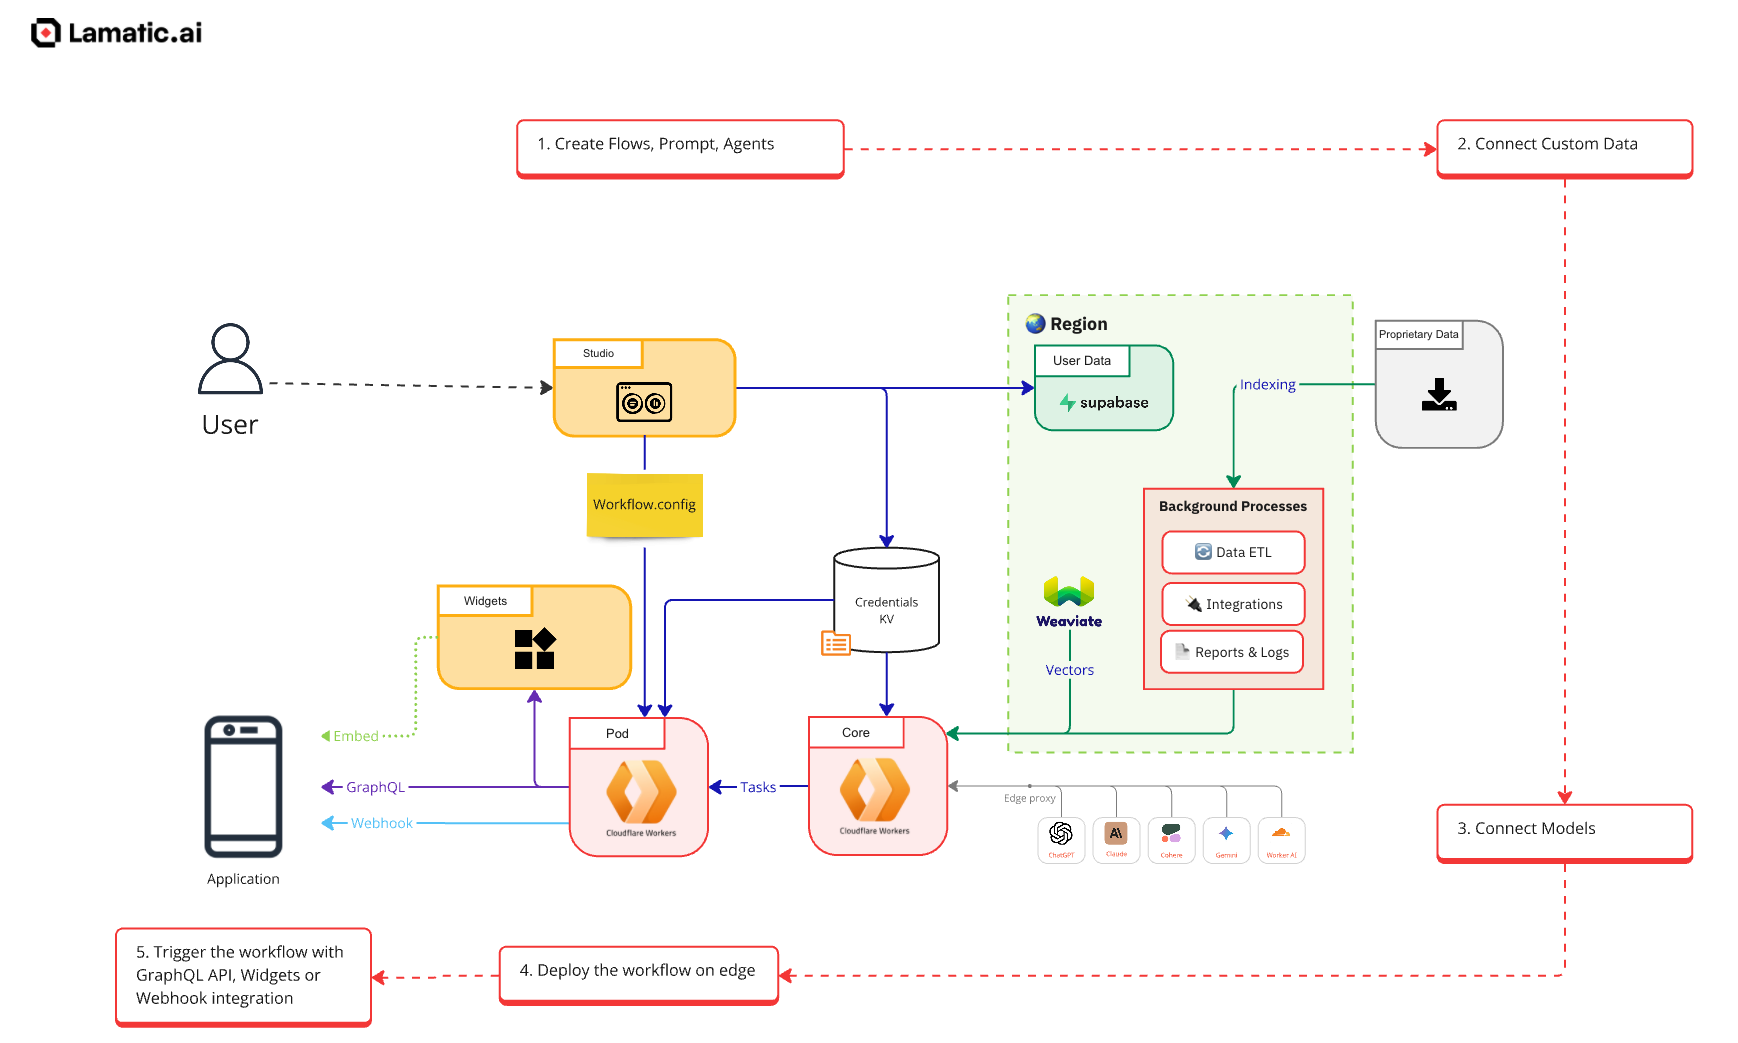
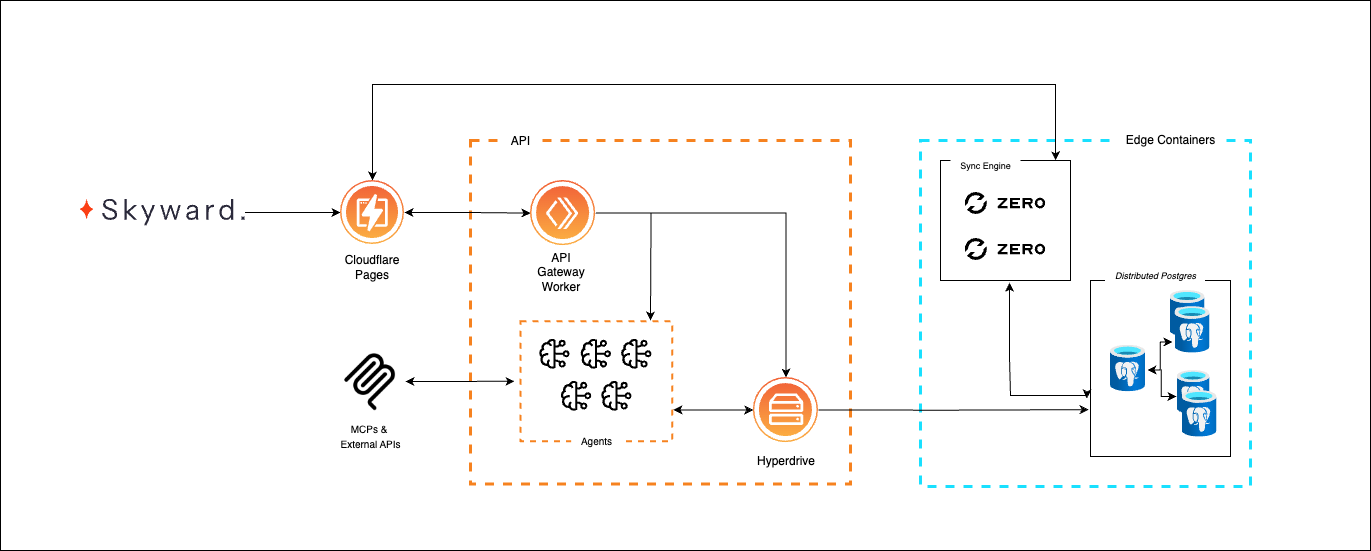
Cloudflare proudly supports over hundreds of thousands of small businesses that are using our services, including SaaS startups, health and wellness providers, real estate firms, local retailers, and global service providers. Here are just a few examples of these amazing new companies.
Mobile-friendly mini websites from Instagram bios, powered by Workers for routing and Pages for hosting.
Cloudflare is also working with our civil society partners in the Asia-Pacific region to help provide security training for new businesses. For example, in 2025, we partnered with Cyberpeace, a leading nonprofit organization in India, to host a webinar focused on building cyber resilience. The session included a live onboarding session, training on security services, and information on the most common cyber threats. Our first session attracted over 95 participants, and due to the high demand, Cloudflare is planning to host an additional in-person training session later this year. Stay tuned for more details!
Helping protect small businesses (and a new security guide!)
It is incredible to see all the innovative ways companies are building new ideas with Cloudflare. However, as a startup originally designed to protect other startups, we know security remains one of the most pressing concerns for any small business. According to the U.S. Federal Communications Commission, theft of digital information has surpassed physical theft as the most commonly reported fraud for small businesses. In 2025 so far, Cloudflare has mitigated over three million Layer 3 (network layer) DDoS attacks targeting small businesses protected by our network.
This year, to help celebrate MSME day, Cloudflare is continuing our efforts to provide training and capacity building for our small business partners by releasing a brand new Cloudflare Small Business Security Guide. The guide includes step-by-step instructions that will allow anyone to better understand cyber security services and protect their business and customers from common cyberattacks. For more information, visit the Cloudflare for Small Businesses page to download the guide today.
Cloudflare will always make robust security services available to any small business that needs them, free of charge. It is a fundamental part of our mission to help build a better Internet and our identity as a company.
If you are building a small business and need access to better developer or security services, getting started with Cloudflare is simple, fast, and straightforward. Signing up for a Free plan takes only minutes and can instantly provide access to the tools you need to secure and accelerate your web presence and keep your small business thriving.
The AI landscape is evolving at an incredible pace, and with it, the tools and platforms available to developers are becoming more powerful and interconnected than ever. Here at Cloudflare, we’re genuinely passionate about empowering you to build the next generation of applications, and that absolutely includes intelligent agents that can reason, act, and interact with the world.
When we talk about “Agents SDKs“, it can sometimes feel a bit… fuzzy. Some SDKs (software development kits) described as ‘agent’ SDKs are really about providing frameworks for tool calling and interacting with models. They’re fantastic for defining an agent’s “brain” – its intelligence, its ability to reason, and how it uses external tools. Here’s the thing: all these agents need a place to actually run. Then there’s what we offer at Cloudflare: an SDK purpose-built to provide a seamless execution layer for agents. While orchestration frameworks define how agents think, our SDK focuses on where they run, abstracting away infrastructure to enable persistent, scalable execution across our global network.
Think of it as the ultimate shell, the place where any agent, defined by any agent SDK (like the powerful new OpenAI Agents SDK), can truly live, persist, and run at global scale.
We’ve chosen OpenAI’s Agents SDK for this example, but the infrastructure is not specific to it. The execution layer is designed to integrate with any agent runtime.
That’s what this post is about: what we built, what we learned, and the design patterns that emerged from fusing these two pieces together.
Why use two SDKs?
OpenAI’s Agents SDK gives you the agent: a reasoning loop, tool definitions, and memory abstraction. But it assumes you bring your own runtime and state.
Cloudflare’s Agents SDK gives you the environment: a persistent object on our network with identity, state, and built-in concurrency control. But it doesn’t tell you how your agent should behave.
By combining them, we get a clear split:
OpenAI: cognition, planning, tool orchestration
Cloudflare: location, identity, memory, execution
This separation of concerns let us stay focused on logic, not glue code.
What you can build with persistent agents
Cloudflare Durable Objects let agents go beyond simple, stateless functions. They can persist memory, coordinate across workflows, and respond in real time. Combined with the OpenAI Agents SDK, this enables systems that reason, remember, and adapt over time.
Here are three architectural patterns that show how agents can be composed, guided, and connected:
Multi-agent systems: Divide responsibilities across specialized agents that collaborate on tasks.
Human-in-the-loop: Let agents plan independently but wait for human input at key decision points.
Addressable agents: Make agents reachable through real-world interfaces like phone calls or WebSockets.
Multi-agent systems
Multi-agent systems let you break down a task into specialized agents that handle distinct responsibilities. In the example below, a triage agent routes questions to either a history or math tutor based on the query. Each agent has its own memory, logic, and instructions. With Cloudflare Durable Objects, these agents persist across sessions and can coordinate responses, making it easy to build systems that feel modular but work together intelligently.
export class MyAgent extends Agent {
  async onRequest() {
    const historyTutorAgent = new Agent({
      instructions:
        "You provide assistance with historical queries. Explain important events and context clearly.",
      name: "History Tutor",
    });

    const mathTutorAgent = new Agent({
      instructions:
        "You provide help with math problems. Explain your reasoning at each step and include examples",
      name: "Math Tutor",
    });

    const triageAgent = new Agent({
      handoffs: [historyTutorAgent, mathTutorAgent],
      instructions:
        "You determine which agent to use based on the user's homework question",
      name: "Triage Agent",
    });

    const result = await run(triageAgent, "What is the capital of France?");
    return Response.json(result.finalOutput);
  }
}
Human-in-the-loop
We implemented ahuman-in-the-loop agent example using these two SDKs together. The goal: run an OpenAI agent with a planning loop, allow human decisions to intercept the plan, and preserve state across invocations via Durable Objects.
The architecture looked like this:
An OpenAI Agent instance runs inside a Durable Object
User submits a prompt
The agent plans multiple steps
After each step, it yields control and waits for a human to approve or intervene
State (including memory and intermediate steps) is persisted in this.state
This design lets us intercept the agent’s plan at every step and store it. The client could then:
Fetch the pending step via another route
Review or modify it
Send approval or rejection back to the agent to resume execution
This is only possible because the agent lives inside a Durable Object. It has persistent memory and identity, allowing multi-turn interaction even across sessions
Addressable agents: “Call my Agent”
One of the most interesting takeaways from this pattern is that agents are not just HTTP endpoints. Yes, you can fetch() them via Durable Objects, but conceptually, agents are addressable entities — and there’s no reason those addresses have to be tied to URLs.
You could imagine agents reachable by phone call, by email, or via pub/sub systems. Durable Objects give each agent a global identity that can be referenced however you want.
In this design:
External sources of input connect to the Cloudflare network; via email, HTTP, or any network interface. In this demo, we use Twilio to route a phone call to a WebSocket input on the Agent.
The call is routed through Cloudflare’s infrastructure, so latency is low and identity is preserved.
We also store the real-time state updates within the agent, so we can view it on a website (served by the agent itself). This is great for use cases like customer service and education.
export class MyAgent extends Agent {
  // receive phone calls via websocket
  async onConnect(connection: Connection, ctx: ConnectionContext) {
    if (ctx.request.url.includes("media-stream")) {
      const agent = new RealtimeAgent({
        instructions:
          "You are a helpful assistant that starts every conversation with a creative greeting.",
        name: "Triage Agent",
      });

      connection.send(`Welcome! You are connected with ID: ${connection.id}`);

      const twilioTransportLayer = new TwilioRealtimeTransportLayer({
        twilioWebSocket: connection,
      });

      const session = new RealtimeSession(agent, {
        transport: twilioTransportLayer,
      });

      await session.connect({
        apiKey: process.env.OPENAI_API_KEY as string,
      });

      session.on("history_updated", (history) => {
        this.setState({ history });
      });
    }
  }
}
This lets an agent become truly multimodal, accepting and outputting data as audio, video, text, email. This pattern opened up exciting possibilities for modular agents and long-running workflows where each agent focuses on a specific domain.
What we learned (and what you should know)
1. OpenAI assumes you bring your own state — Cloudflare gives you one
OpenAI’s SDK is stateless by default. You can attach memory abstractions, but the SDK doesn’t tell you where or how to persist it. Cloudflare’s Durable Objects, by contrast, are persistent — that’s the whole point. Every instance has a unique identity and storage API (this.ctx.storage). This means we can:
Store long-term memory across invocations
Hydrate the agent’s memory before run()
Save any updates after run() completes
2. Durable Object routing isn’t just routing — it’s your agent factory
At first glance, routeAgentRequest looks like a simple dispatcher: map a request to a Durable Object based on a URL. But it plays a deeper role — it defines the identity boundary for your agents. We realized this while trying to scope agent instances per user and per task.
In Durable Objects, identity is tied to an ID. When you call idFromName(), you get a stable, name-based ID that always maps to the same object. This means repeated calls with the same name return the same agent instance — along with its memory and state. In contrast, calling .newUniqueId() creates a new, isolated object each time.
This is where routing becomes critical: it’s where you decide how long an agent should live, and what it should remember.
This lets us:
Spin up multiple agents per user (e.g. one per session or task)
Co-locate memory and logic
Avoid unintended memory sharing between conversations
Gotcha: If you forget to use idFromName() and just call .newUniqueId(), you’ll get a new agent each time, and your memory will never persist. This is a common early bug that silently kills statefulness.
3. Agents are composable — and that’s powerful
Agents can invoke each other using Durable Object routing, forming workflows where each agent owns its own memory and logic. This enables composition — building systems from specialized parts that cooperate.
This makes agent architecture more like microservices — composable, stateful, and distributed.
Final thoughts: building agents that think and live
This pattern — OpenAI cognition + Cloudflare execution — worked better than we expected. It let us:
Write agents with full planning and memory
Pause and resume them asynchronously
Avoid building orchestration from scratch
Compose multiple agents into larger systems
The hardest parts:
Correctly scoping agent architecture
Persisting only valid state
Debugging with good observability
At Cloudflare, we are incredibly excited to see what you build with this powerful combination. The future of AI agents is intelligent, distributed, and incredibly capable. Get started today by exploring the OpenAI Agents SDK and diving into the Cloudflare Agents SDK documentation (which leverages Cloudflare Workers and Durable Objects).
We’re just getting started, and we love to see all that you build. Please join our Discord, ask questions, and tell us what you’re building.
We’re excited to announce that Cloudflare Containers are now available in beta for all users on paid plans.
You can now run new kinds of applications alongside your Workers. From media and data processing at the edge, to backend services in any language, to CLI tools in batch workloads — Containers open up a world of possibilities.
Containers are tightly integrated with Workers and the rest of the developer platform, which means that:
Your workflow stays simple: just define a Container in a few lines of code, and run wrangler deploy, just like you would with a Worker.
Containers are global: as with Workers, you just deploy to Region:Earth. No need to manage configs across 5 different regions for a global app.
You can use the right tool for the job: routing requests between Workers and Containers is easy. Use a Worker when you need to be ultra light-weight and scalable. Use a Container when you need more power and flexibility.
Containers are programmable: container instances are spun up on-demand and controlled by Workers code. If you need custom logic, just write some JavaScript instead of spending time chaining together API calls or writing Kubernetes operators.
Want to try it today? Deploy your first Container-enabled Worker:
A tour of Containers
Let’s take a deeper look at Containers, using an example use case: code sandboxing.
Let’s imagine that you want to run user-generated (or AI-generated) code as part of a platform you’re building. To do this, you want to spin up containers on demand. Each user needs their own isolated container, the users are distributed globally, and you need to start each container quickly so the users aren’t waiting.
You can set this up easily on Cloudflare Containers.
Configuring a Container
In your Worker, use the Container class and wrangler.jsonc to declare some basic configuration, such as your Container’s default port, a sleep timeout, and which image to use, then route to it via the Worker.
For each unique ID passed to the Container’s binding, Cloudflare will spin up a new Container instance and route requests to it. When a new instance is requested, Cloudflare picks the best location across our global network where we’ve pre-provisioned a ready-to-go container. This means that you can deploy a container close to an end user no matter where they are. And the initial container start takes just a few seconds. You don’t have to worry about routing, provisioning, or scaling.
This example Worker will route requests to a unique container instance for each sandbox ID given at the path /sandbox/ID and will be handled by standard Worker JavaScript otherwise:
export class MyContainer extends Container {
  defaultPort = 8080; // The default port for the container to listen on
  sleepAfter = '5m'; // Sleep the container if no requests are made in this timeframe
}

export default {
  async fetch(request, env) {
    const pathname = new URL(request.url).pathname;

    // handle request with an on-demand container instance
    if (pathname.startsWith('/sandbox/')) {
      const sessionId = pathname.split("/")[2]
      const containerInstance = getContainer(env.CONTAINER_SANDBOX, sessionId)
      return await containerInstance.fetch(request);
    }

    // handle request with my Worker code otherwise
    return myWorkerRequestHandler(request);
  },
};
Familiar and easy development workflow with wrangler dev
To configure which container image to use, you can provide an image URL in wrangler config or a path to a local Dockerfile.
This config tells wrangler to use a locally defined image:
When developing your application, you just run wrangler dev and the container image will be automatically built and routable via your local Worker. This makes it easy to iterate on container code while making changes to your Worker at the same time. When you want to rebuild your image, just press “R” on your keyboard from your terminal running wrangler dev, and the Container is rebuilt and restarted.
Shipping your Container-enabled Worker to production with wrangler deploy
When it’s time to deploy, just run wrangler deploy. Wrangler will push your image to your account, then it will be provisioned in various locations across Cloudflare’s global network.
You don’t have to worry about “artifact management”, or distribution, or auth, or jump through hoops to integrate your container with Workers. You just write your code and deploy it.
Observability is built-in
Once your Container is in production, you have the visibility you need into how things are going, with end-to-end observability.
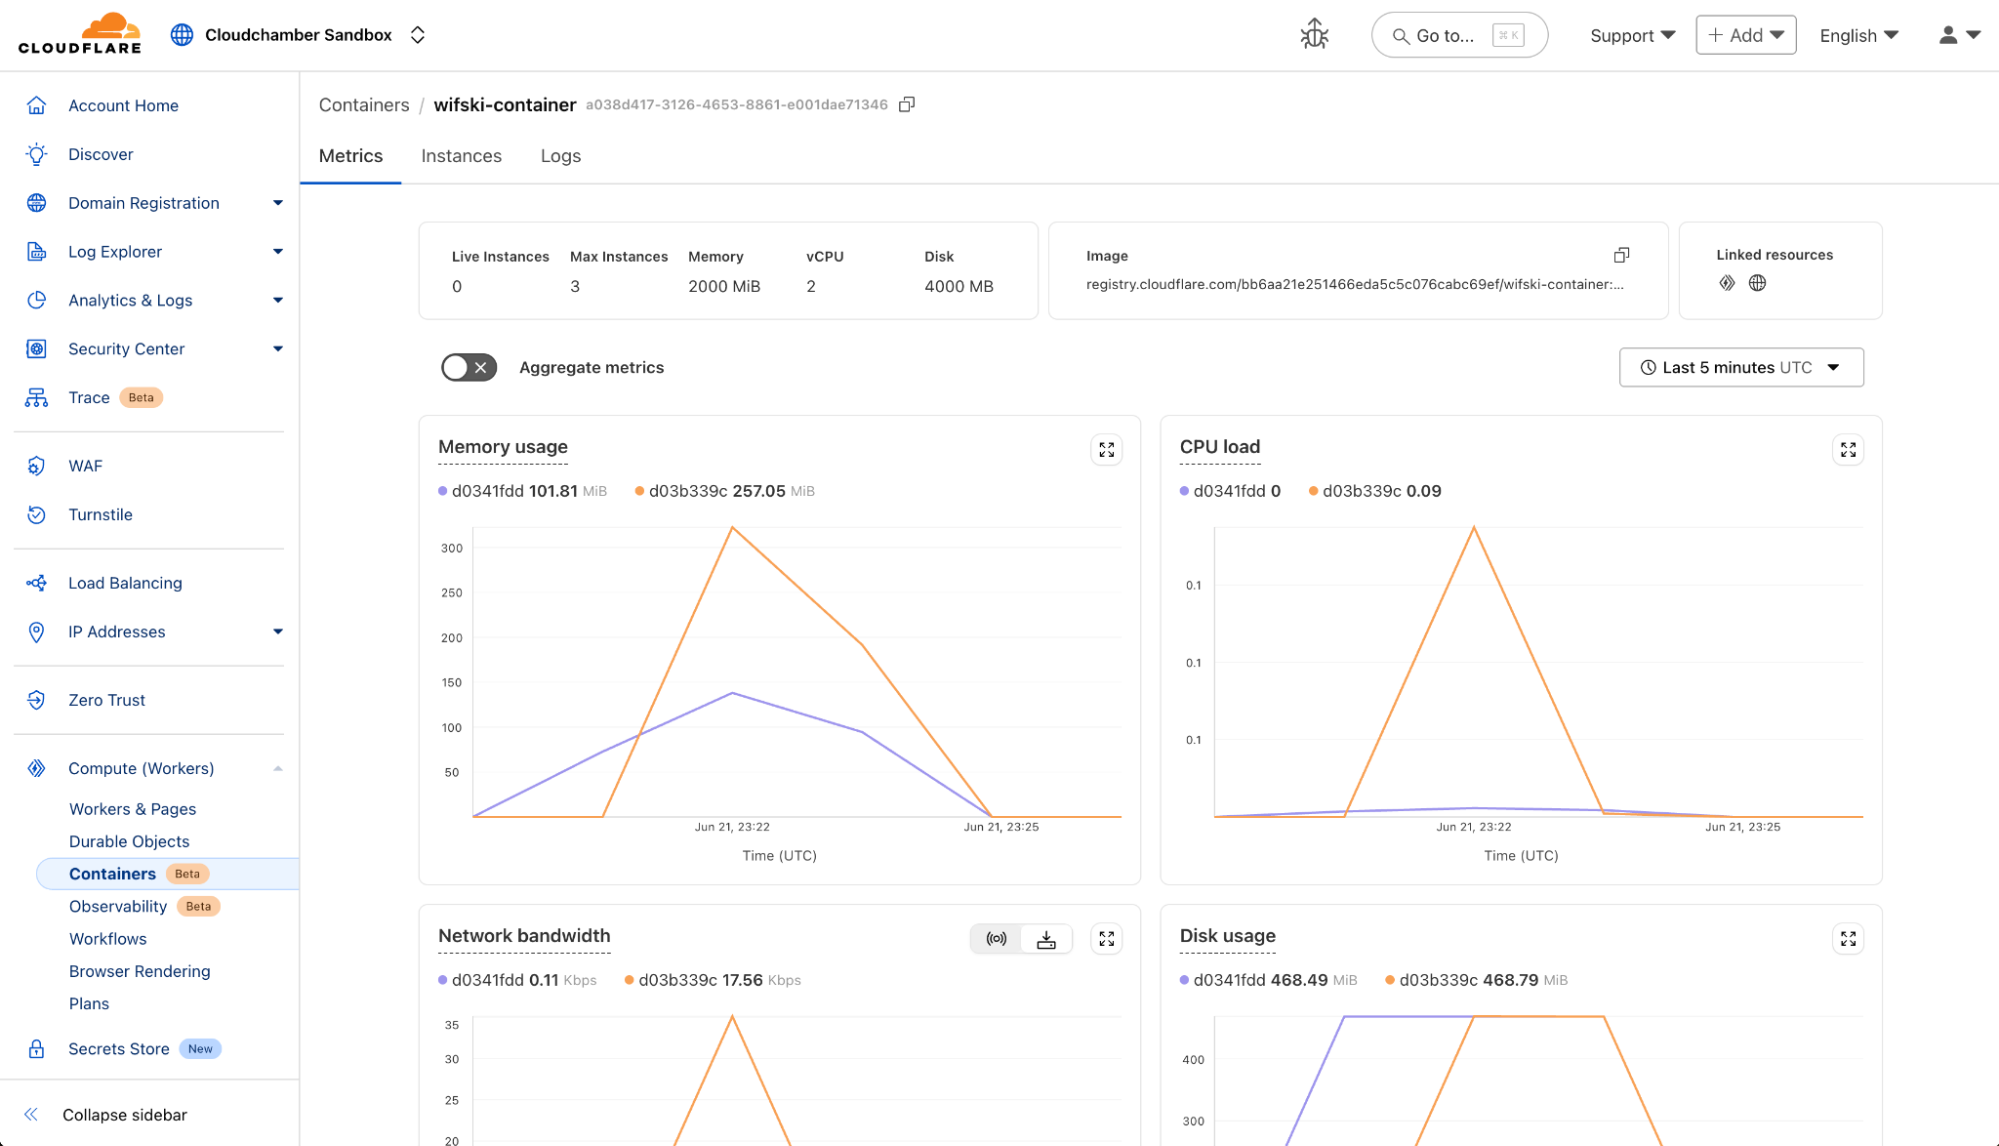
From the Cloudflare dashboard, you can easily track status and resource usage across Container instances with built-in metrics:
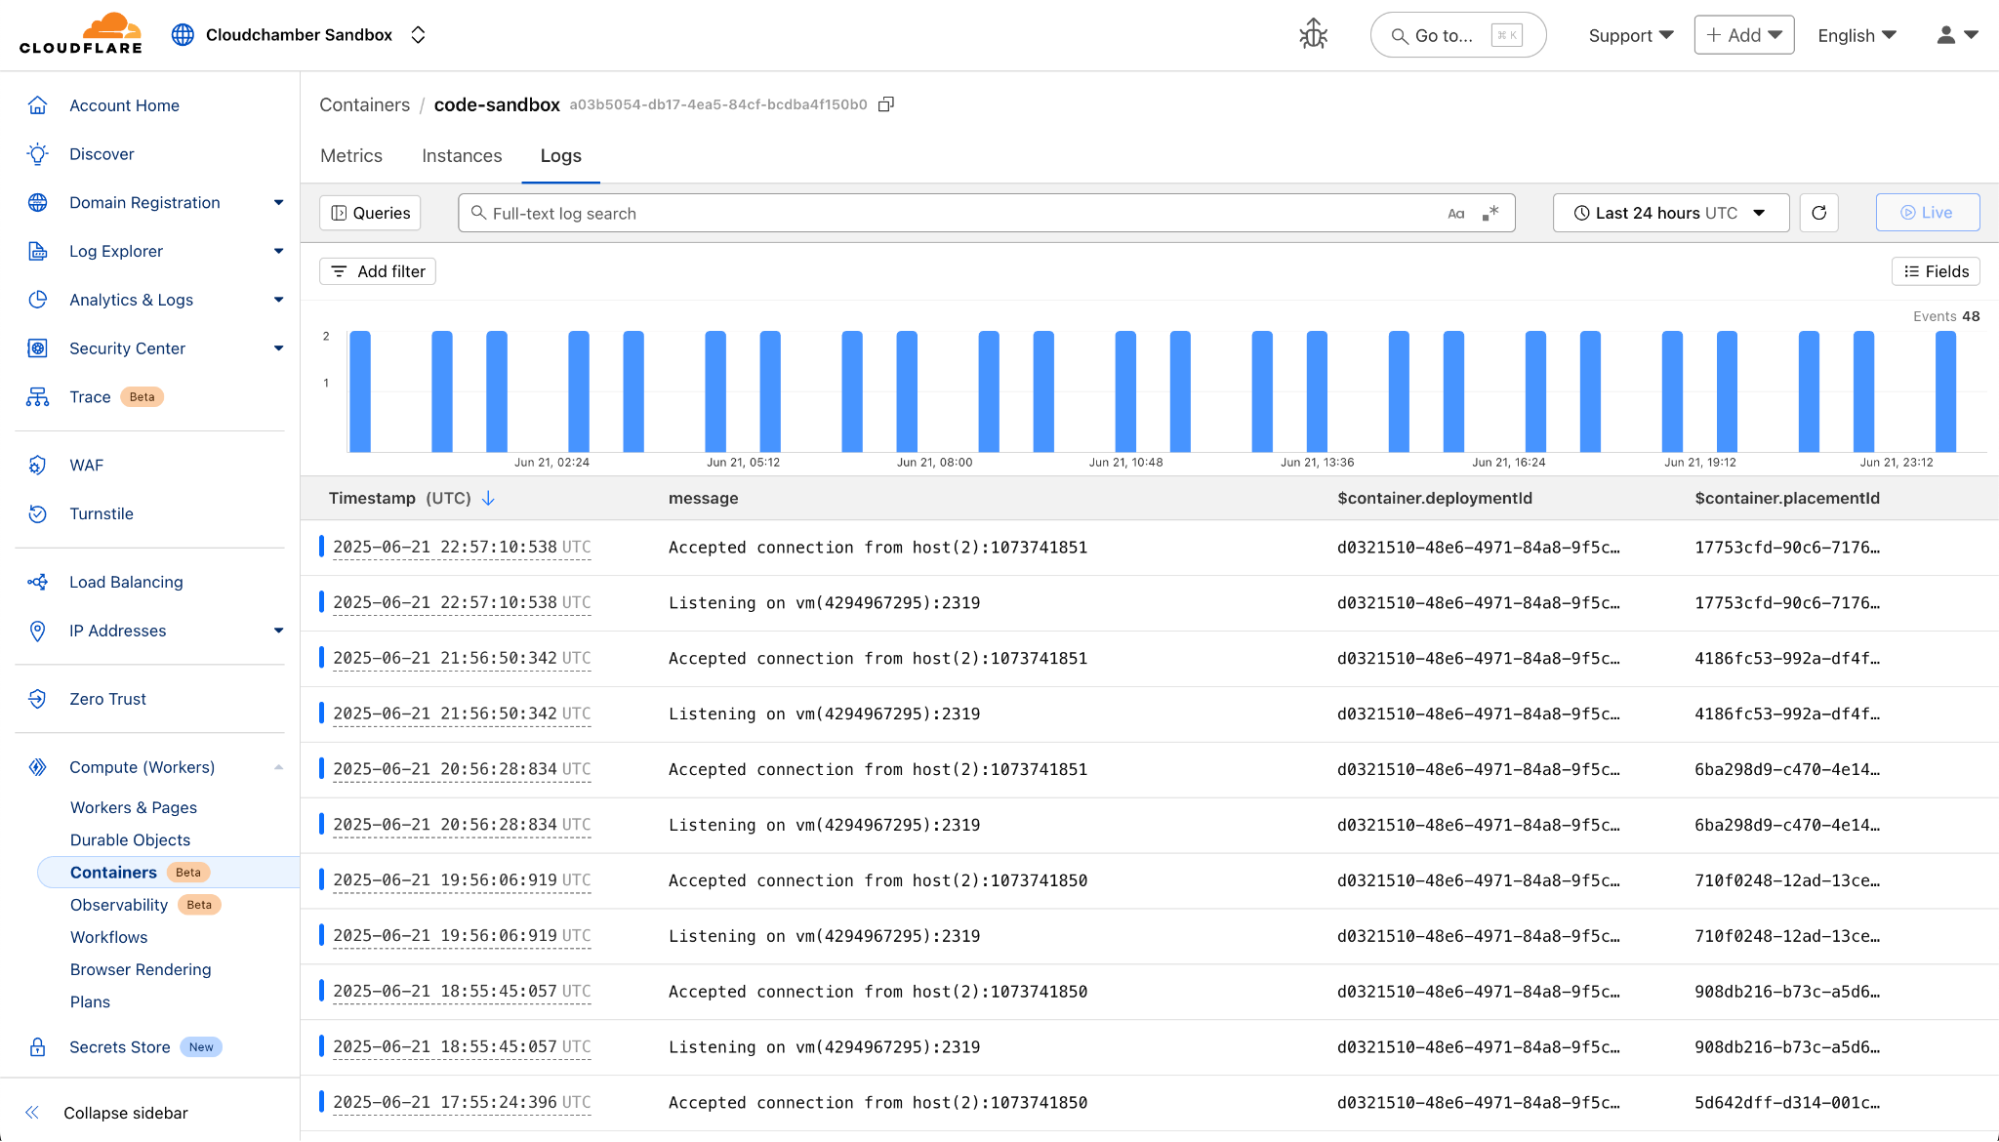
And if you need to dive deeper, you can dig into logs, which will be retained in the Cloudflare UI for seven days or pushed to an external sink of your choice:
Or better yet, if you have an image sitting around that you’ve been dying to deploy to Cloudflare, you can get started with our docs here.
A world of possibilities
We’re excited about all the new types of applications that are now possible to build on Workers. We’ve heard many of you tell us over the years that you would love to run your entire application on Cloudflare, if only you could deploy this one piece that needs to run in a container.
As with the rest of our Cloudflare developer products, we wanted to apply the same principles to our developer platform with transparent pricing that scales up and down with your usage.
Today, you can select from the following instances at launch (and yes, we plan to add larger instances over time):
Name
Memory
CPU
Disk
dev
256 MiB
1/16 vCPU
2 GB
basic
1 GiB
1/4 vCPU
4 GB
standard
4 GiB
1/2 vCPU
4 GB
You only pay for what you use — charges start when a request is sent to the container or when it is manually started. Charges stop after the container instance goes to sleep, which can happen automatically after a timeout. This makes it easy to scale to zero, and allows you to get high utilization even with bursty traffic.
Containers are billed for every 10ms that they are actively running at the following rates, with monthly amounts included in Workers Standard:
Memory: $0.0000025 per GiB-second, with 25 GiB-hours included
CPU: $0.000020 per vCPU-second, with 375 vCPU-minutes included
Disk $0.00000007 per GB-second, with 200 GB-hours included
Egress from Containers is priced at the following rates, with monthly amounts included in Workers Standard:
North America and Europe: $0.025 per GB with 1 TB included
Australia, New Zealand, Taiwan, and Korea: $0.050 per GB with 500 GB included
Everywhere else: $0.040 per GB with 500 GB included
With today’s release, we’ve only just begun to scratch the surface of what Containers will do on Workers. This is the first step of many towards our vision of a simple, global, and highly programmable Container platform.
We’re already thinking about what’s next, and wanted to give you a preview:
Higher limits and larger instances – We currently limit your concurrent instances to 40 total GiB of memory and 40 total vCPU. This is enough for some workloads, but many users will want to go higher — a lot higher. Select customers are already scaling well into the thousands of concurrent containers, and we want to bring this ability to more users. We will be raising our limits over the coming months to allow for more total containers and larger instance sizes.
Global autoscaling and latency-aware routing – Currently, containers are addressed by ID and started on-demand. For many use cases, users want to route to one of many stateless container instances deployed across the globe, then autoscale live instances automatically. Autoscaling will be activated with a single line of code, and will enable easy routing to the nearest ready instance.
class MyBackend extends Container {
  defaultPort = 8080;
  autoscale = true; // global autoscaling on - new instances spin up when memory or CPU utilization is high
}

// routes requests to the nearest ready container and load balance globally
async fetch(request, env) {
  return getContainer(env.MY_BACKEND).fetch(request);
}
More ways to communicate between Containers and Workers – We will be adding more ways for your Worker to communicate with your container and vice versa. We will add an exec command to run shell commands in your instance and handlers for HTTP requests from the container to Workers. This will allow you to more easily extend your containers with functionality from the entire developer platform, reach out to other containers, and programmatically set up each container instance.
class MyContainer extends Container {
  // sets up container-to-worker communication with handlers
  handlers = {
    "example.cf": "handleRequestFromContainer"
  };

  handleRequestFromContainer(req) {
    return new Response("You are responding from Workers to a Container request to a specific hostname")
  }

  // use exec to run commands in your container instance
  async cloneRepo(repoUrl) {
    let command = this.exec(`git clone ${repoUrl}`)
    await command.print()
  }
}
Further integrations with the Developer Platform – We will continue to integrate with the developer platform with first-party APIs for our various services. We want it to be dead simple to mount R2 buckets, reach Hyperdrive, access KV, and more.
And we are just getting started. Stay tuned for more updates this summer and over the course of the entire year.
Try Containers today
The first step is to deploy your own container. Run npm create cloudflare@latest -- --template=cloudflare/templates/containers-template or click the button below to deploy your first Container to Workers.
We’re excited to see all the ways you will use Containers. From new languages and tools, to simplified Cloudflare-only architectures, to advanced programmatic control over container creation, you now have the ability to do even more on the Developer Platform. It is just a wrangler deploy away.
We are thrilled to announce the General Availability of Cloudflare Log Explorer, a powerful new product designed to bring observability and forensics capabilities directly into your Cloudflare dashboard. Built on the foundation of Cloudflare’s vast global network, Log Explorer leverages the unique position of our platform to provide a comprehensive and contextualized view of your environment.
Security teams and developers use Cloudflare to detect and mitigate threats in real-time and to optimize application performance. Over the years, users have asked for additional telemetry with full context to investigate security incidents or troubleshoot application performance issues without having to forward data to third party log analytics and Security Information and Event Management (SIEM) tools. Besides avoidable costs, forwarding data externally comes with other drawbacks such as: complex setups, delayed access to crucial data, and a frustrating lack of context that complicates quick mitigation.
Log Explorer has been previewed by several hundred customers over the last year, and they attest to its benefits:
“Having WAF logs (firewall events) instantly available in Log Explorer with full context — no waiting, no external tools — has completely changed how we manage our firewall rules. I can spot an issue, adjust the rule with a single click, and immediately see the effect. It’s made tuning for false positives faster, cheaper, and far more effective.”
“While we use Logpush to ingest Cloudflare logs into our SIEM, when our development team needs to analyze logs, it can be more effective to utilize Log Explorer. SIEMs make it difficult for development teams to write their own queries and manipulate the console to see the logs they need. Cloudflare’s Log Explorer, on the other hand, makes it much easier for dev teams to look at logs and directly search for the information they need.”
With Log Explorer, customers have access to Cloudflare logs with all the context available within the Cloudflare platform. Compared to external tools, customers benefit from:
Reduced cost and complexity: Drastically reduce the expense and operational overhead associated with forwarding, storing, and analyzing terabytes of log data in external tools.
Faster detection and triage: Access Cloudflare-native logs directly, eliminating cumbersome data pipelines and the ingest lags that delay critical security insights.
Accelerated investigations with full context: Investigate incidents with Cloudflare’s unparalleled contextual data, accelerating your analysis and understanding of “What exactly happened?” and “How did it happen?”
Minimal recovery time: Seamlessly transition from investigation to action with direct mitigation capabilities via the Cloudflare platform.
Log Explorer is available as an add-on product for customers on our self serve or Enterprise plans. Read on to learn how each of the capabilities of Log Explorer can help you detect and diagnose issues more quickly.
Monitor security and performance issues with custom dashboards
Custom dashboards allow you to define the specific metrics you need in order to monitor unusual or unexpected activity in your environment.
Getting started is easy, with the ability to create a chart using natural language. A natural language interface is integrated into the chart create/edit experience, enabling you to describe in your own words the chart you want to create. Similar to the AI Assistant we announced during Security Week 2024, the prompt translates your language to the appropriate chart configuration, which can then be added to a new or existing custom dashboard.
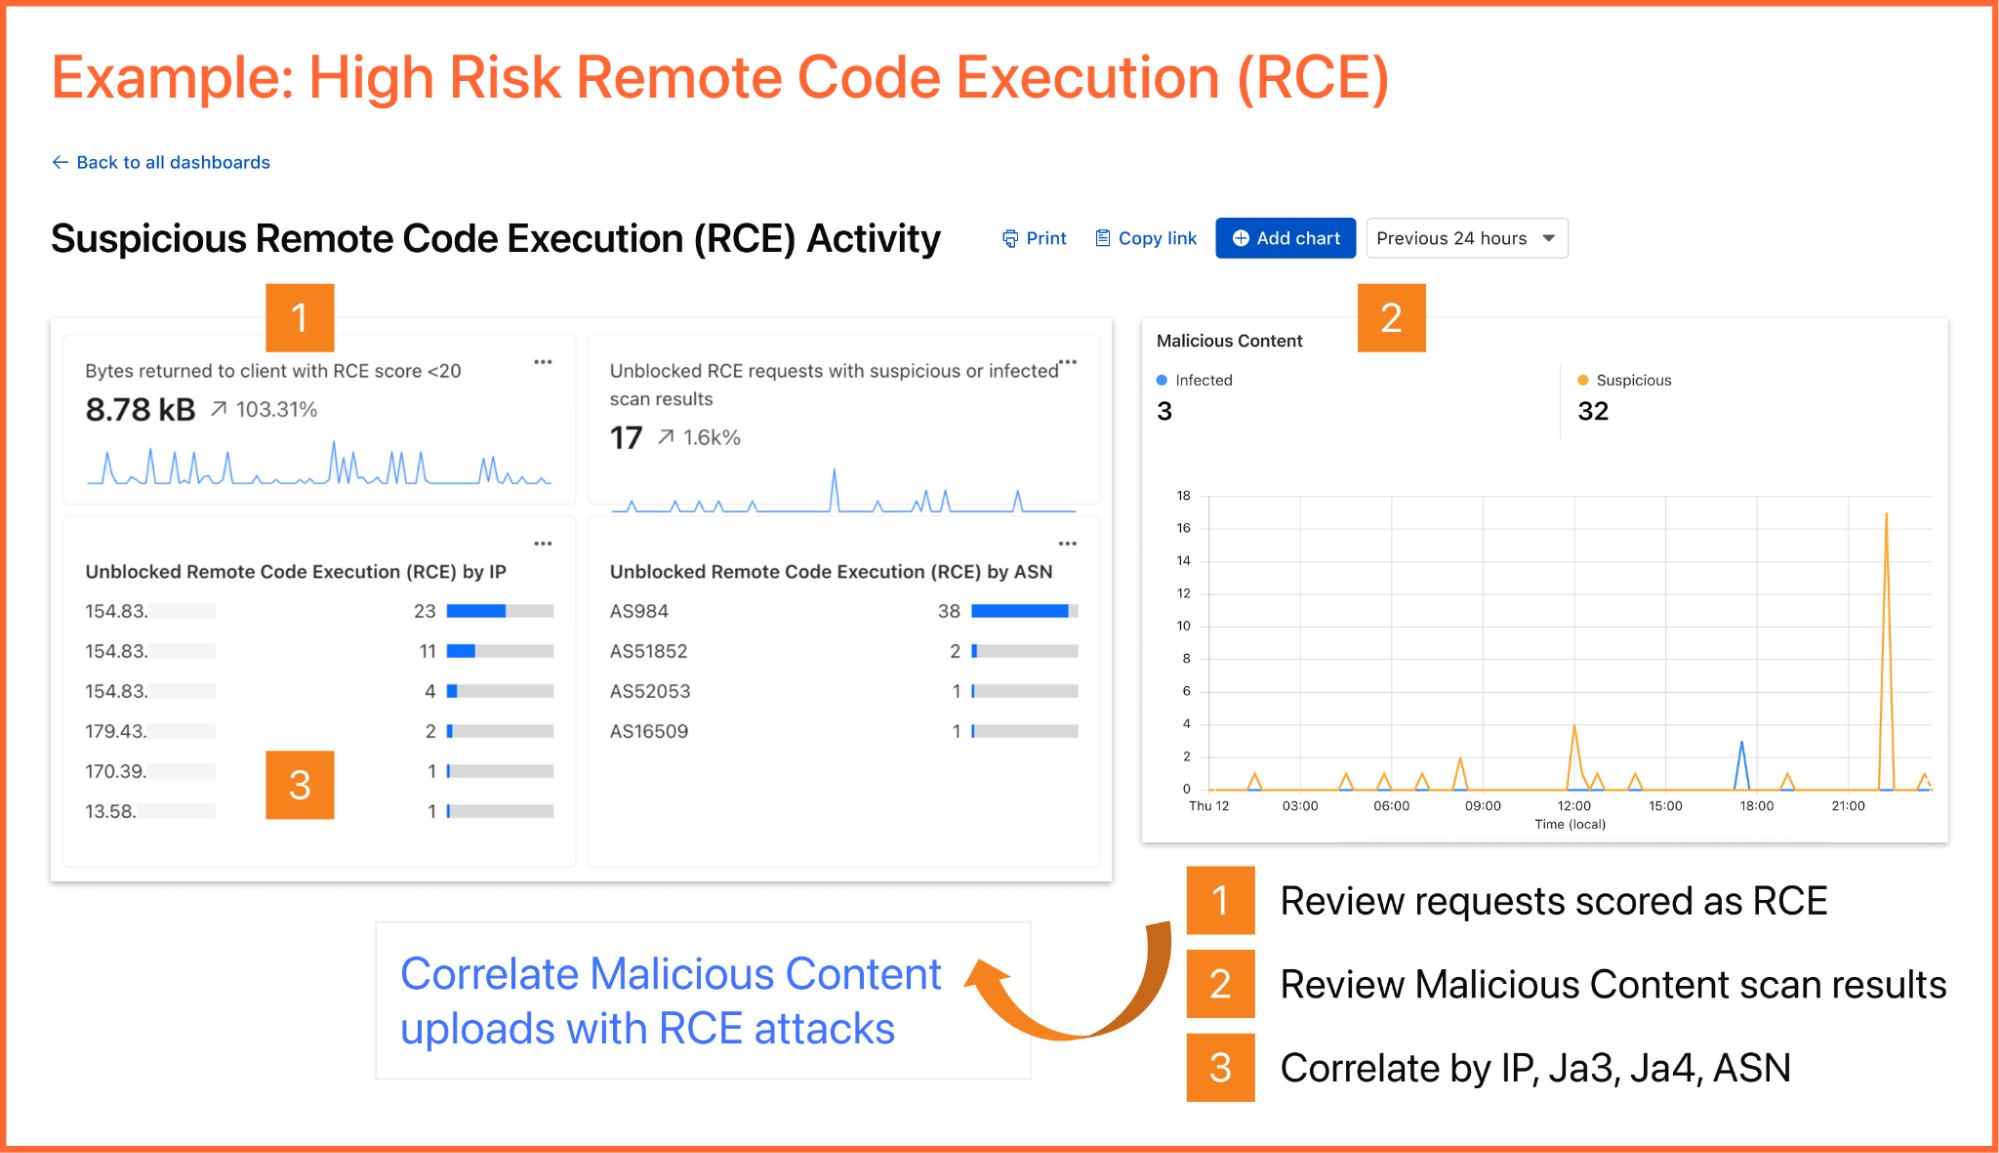
As an example, you can create a dashboard for monitoring for the presence of Remote Code Execution (RCE) attacks happening in your environment. An RCE attack is where an attacker is able to compromise a machine in your environment and execute commands. The good news is that RCE is a detection available in Cloudflare WAF. In the dashboard example below, you can not only watch for RCE attacks, but also correlate them with other security events such as malicious content uploads, source IP addresses, and JA3/JA4 fingerprints. Such a scenario could mean one or more machines in your environment are compromised and being used to spread malware — surely, a very high risk incident!
A reliability engineer might want to create a dashboard for monitoring errors. They could use the natural language prompt to enter a query like “Compare HTTP status code ranges over time.” The AI model then decides the most appropriate visualization and constructs their chart configuration.
While you can create custom dashboards from scratch, you could also use an expert-curated dashboard template to jumpstart your security and performance monitoring.
Available templates include:
Bot monitoring: Identify automated traffic accessing your website
API Security: Monitor the data transfer and exceptions of API endpoints within your application
API Performance: See timing data for API endpoints in your application, along with error rates
Account Takeover: View login attempts, usage of leaked credentials, and identify account takeover attacks
Performance Monitoring: Identify slow hosts and paths on your origin server, and view time to first byte (TTFB) metrics over time
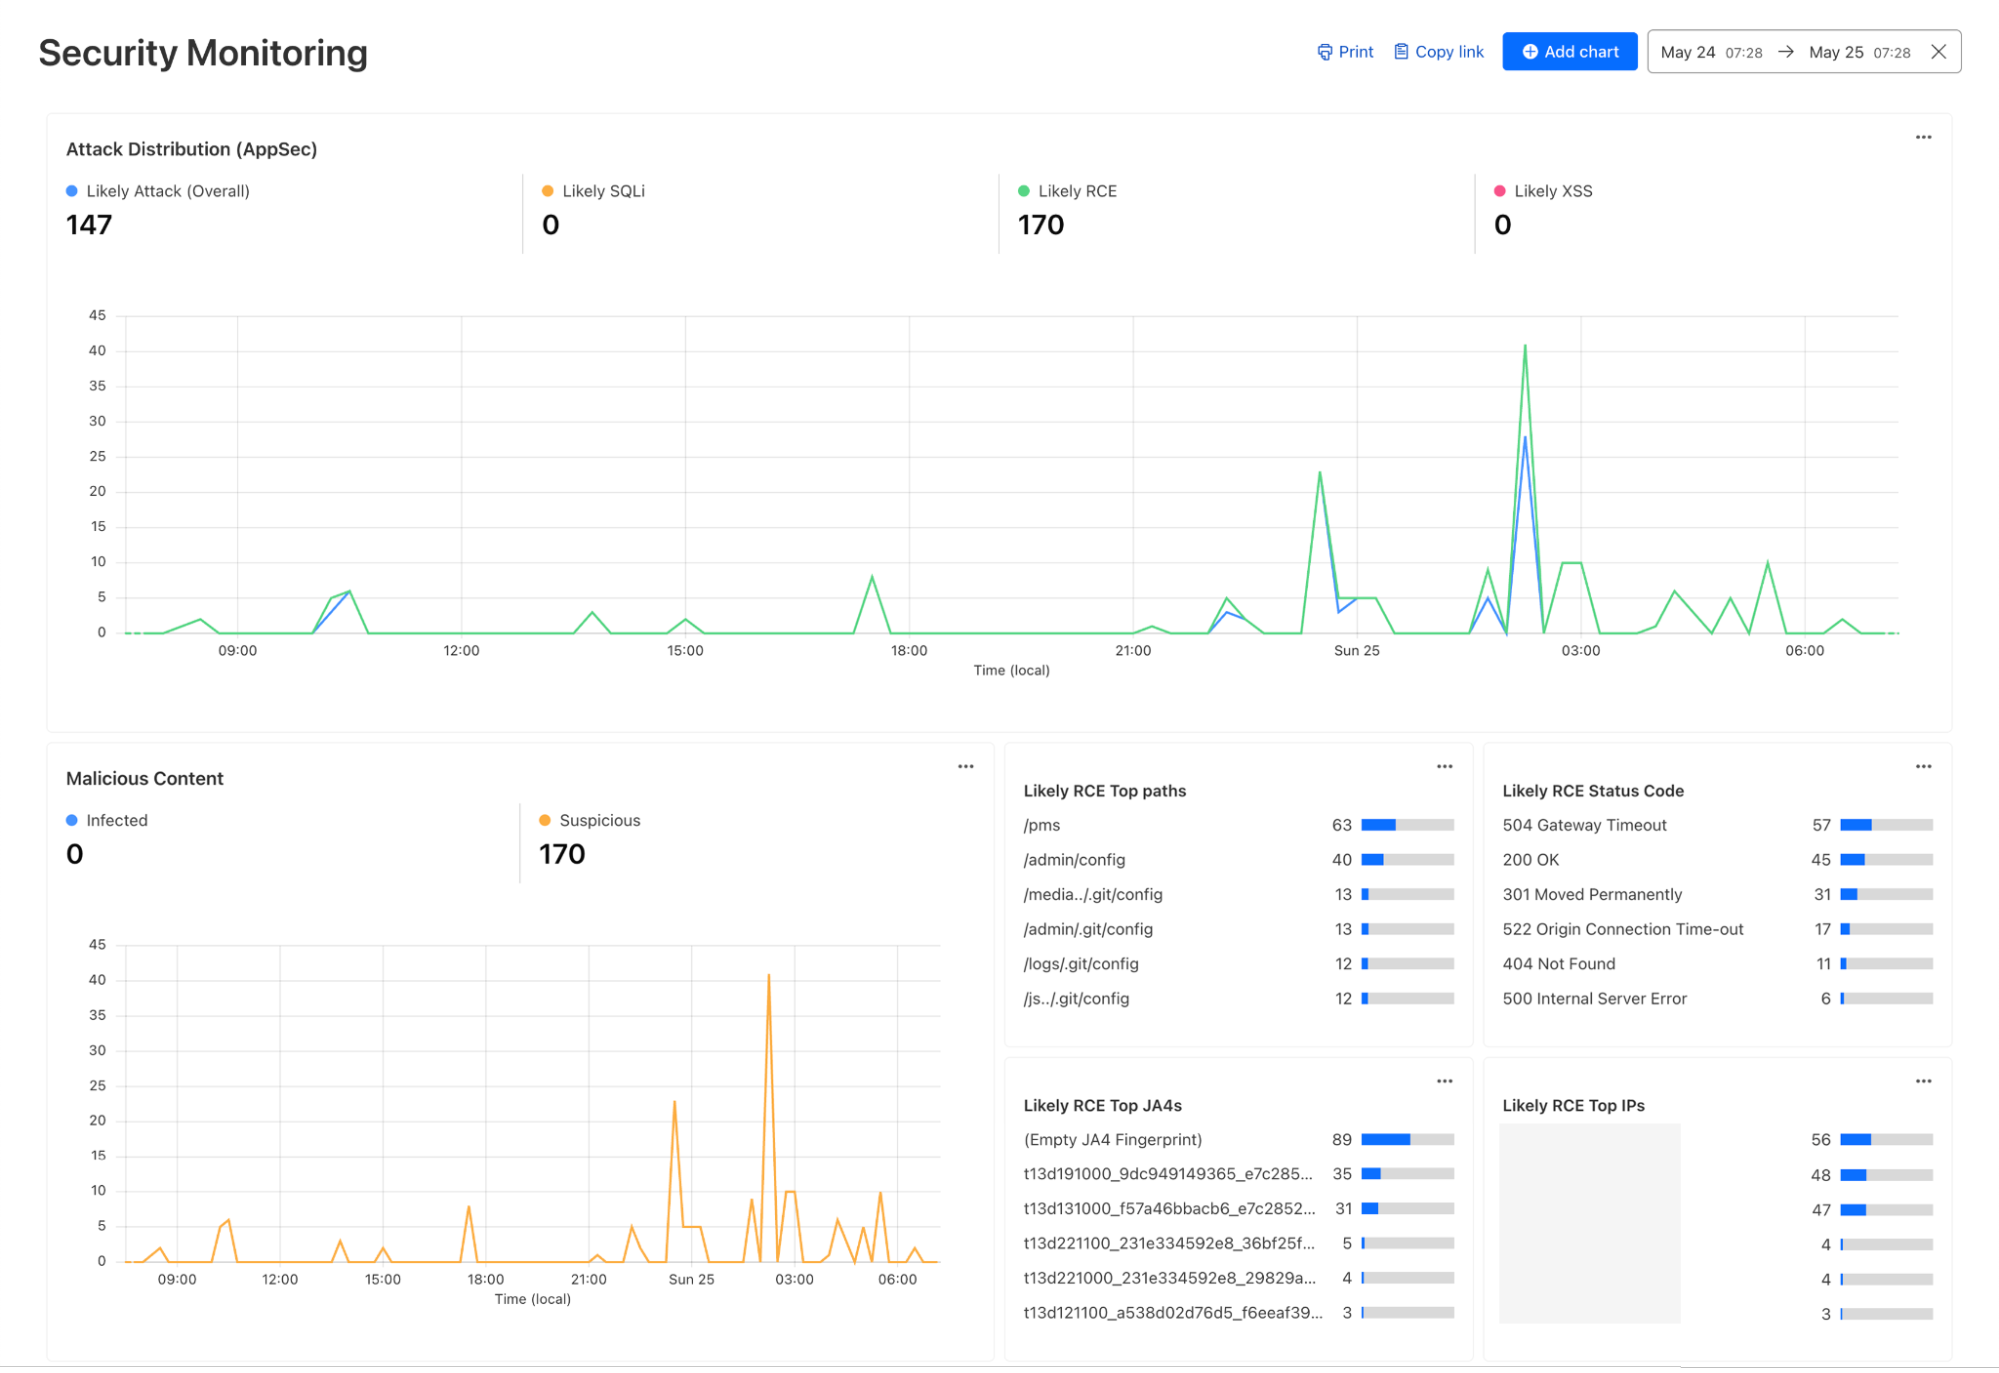
Security Monitoring: monitor attack distribution across top hosts and paths, correlate DDoS traffic with origin Response time to understand the impact of DDoS attacks.
Investigate and troubleshoot issues with Log Search
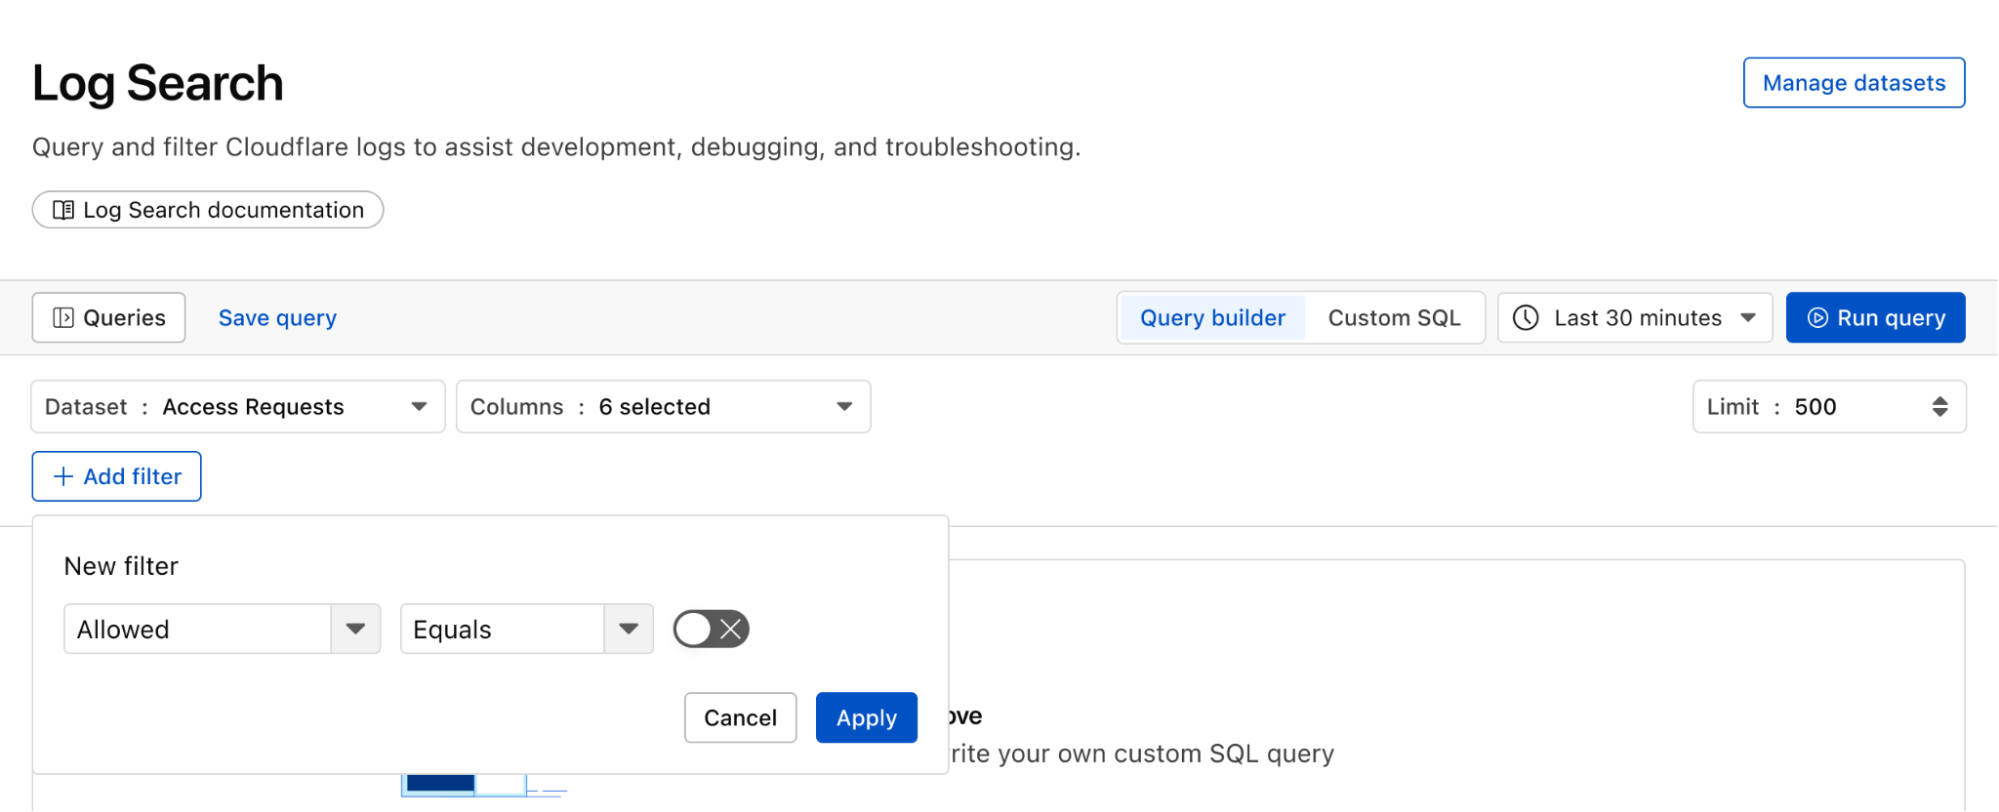
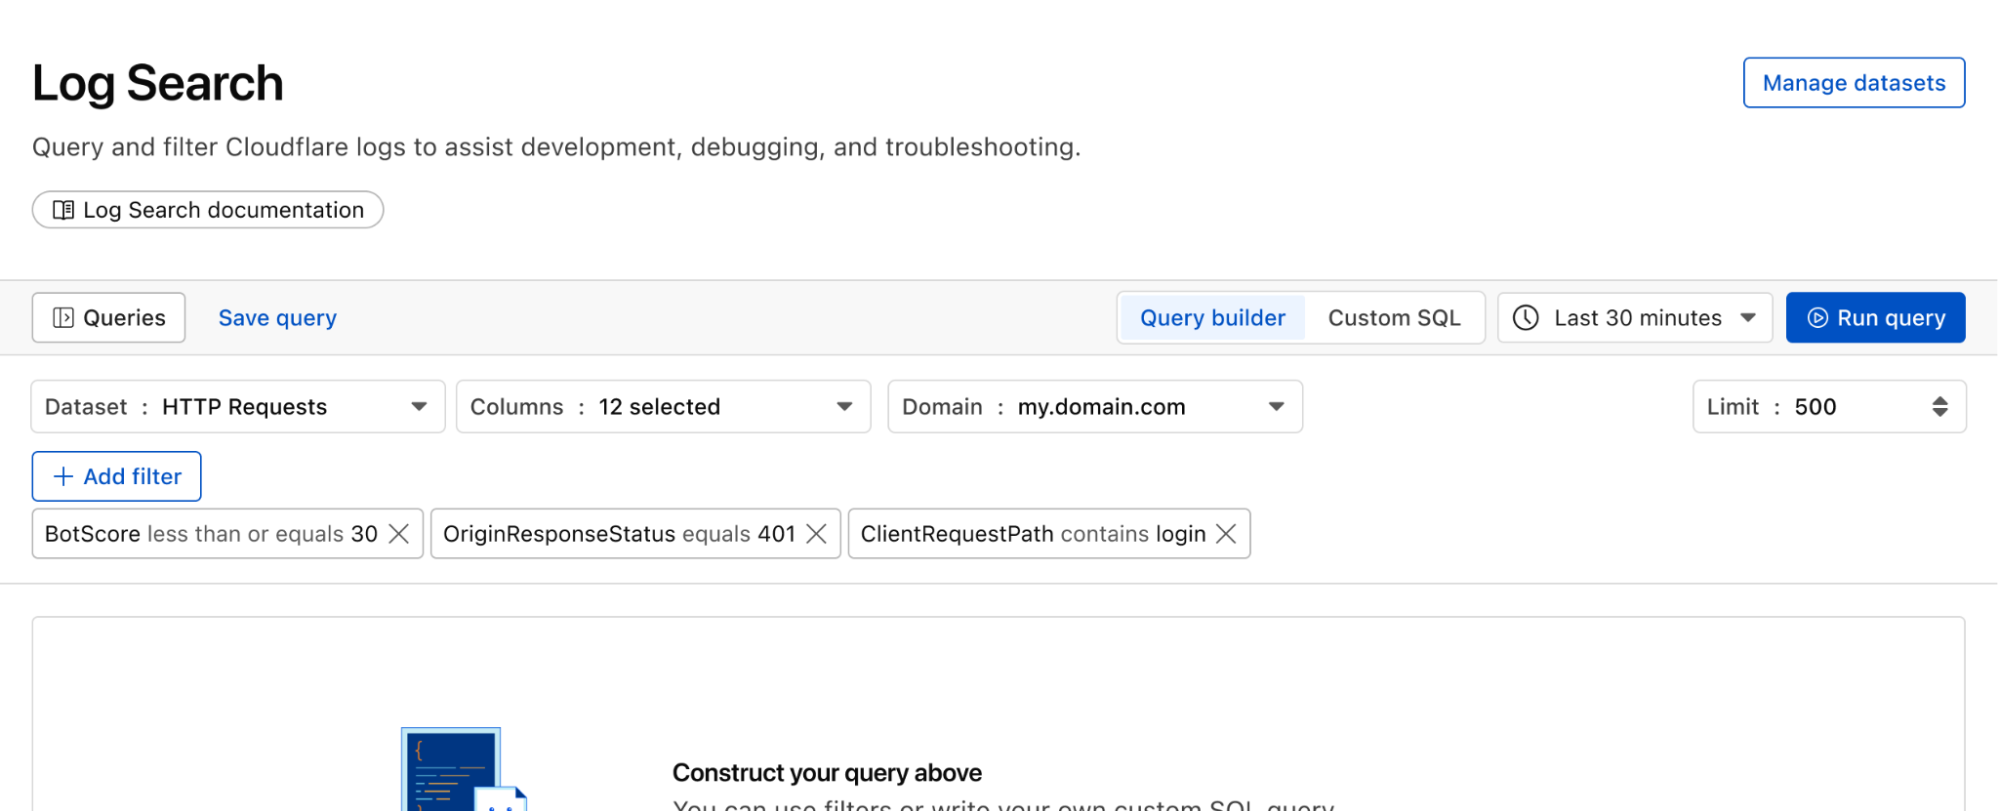
Continuing with the example from the prior section, after successfully diagnosing that some machines were compromised through the RCE issue, analysts can pivot over to Log Search in order to investigate whether the attacker was able to access and compromise other internal systems. To do that, the analyst could search logs from Zero Trust services, using context, such as compromised IP addresses from the custom dashboard, shown in the screenshot below:
Log Search is a streamlined experience including data type-aware search filters, or the ability to switch to a custom SQL interface for more powerful queries. Log searches are also available via a public API.
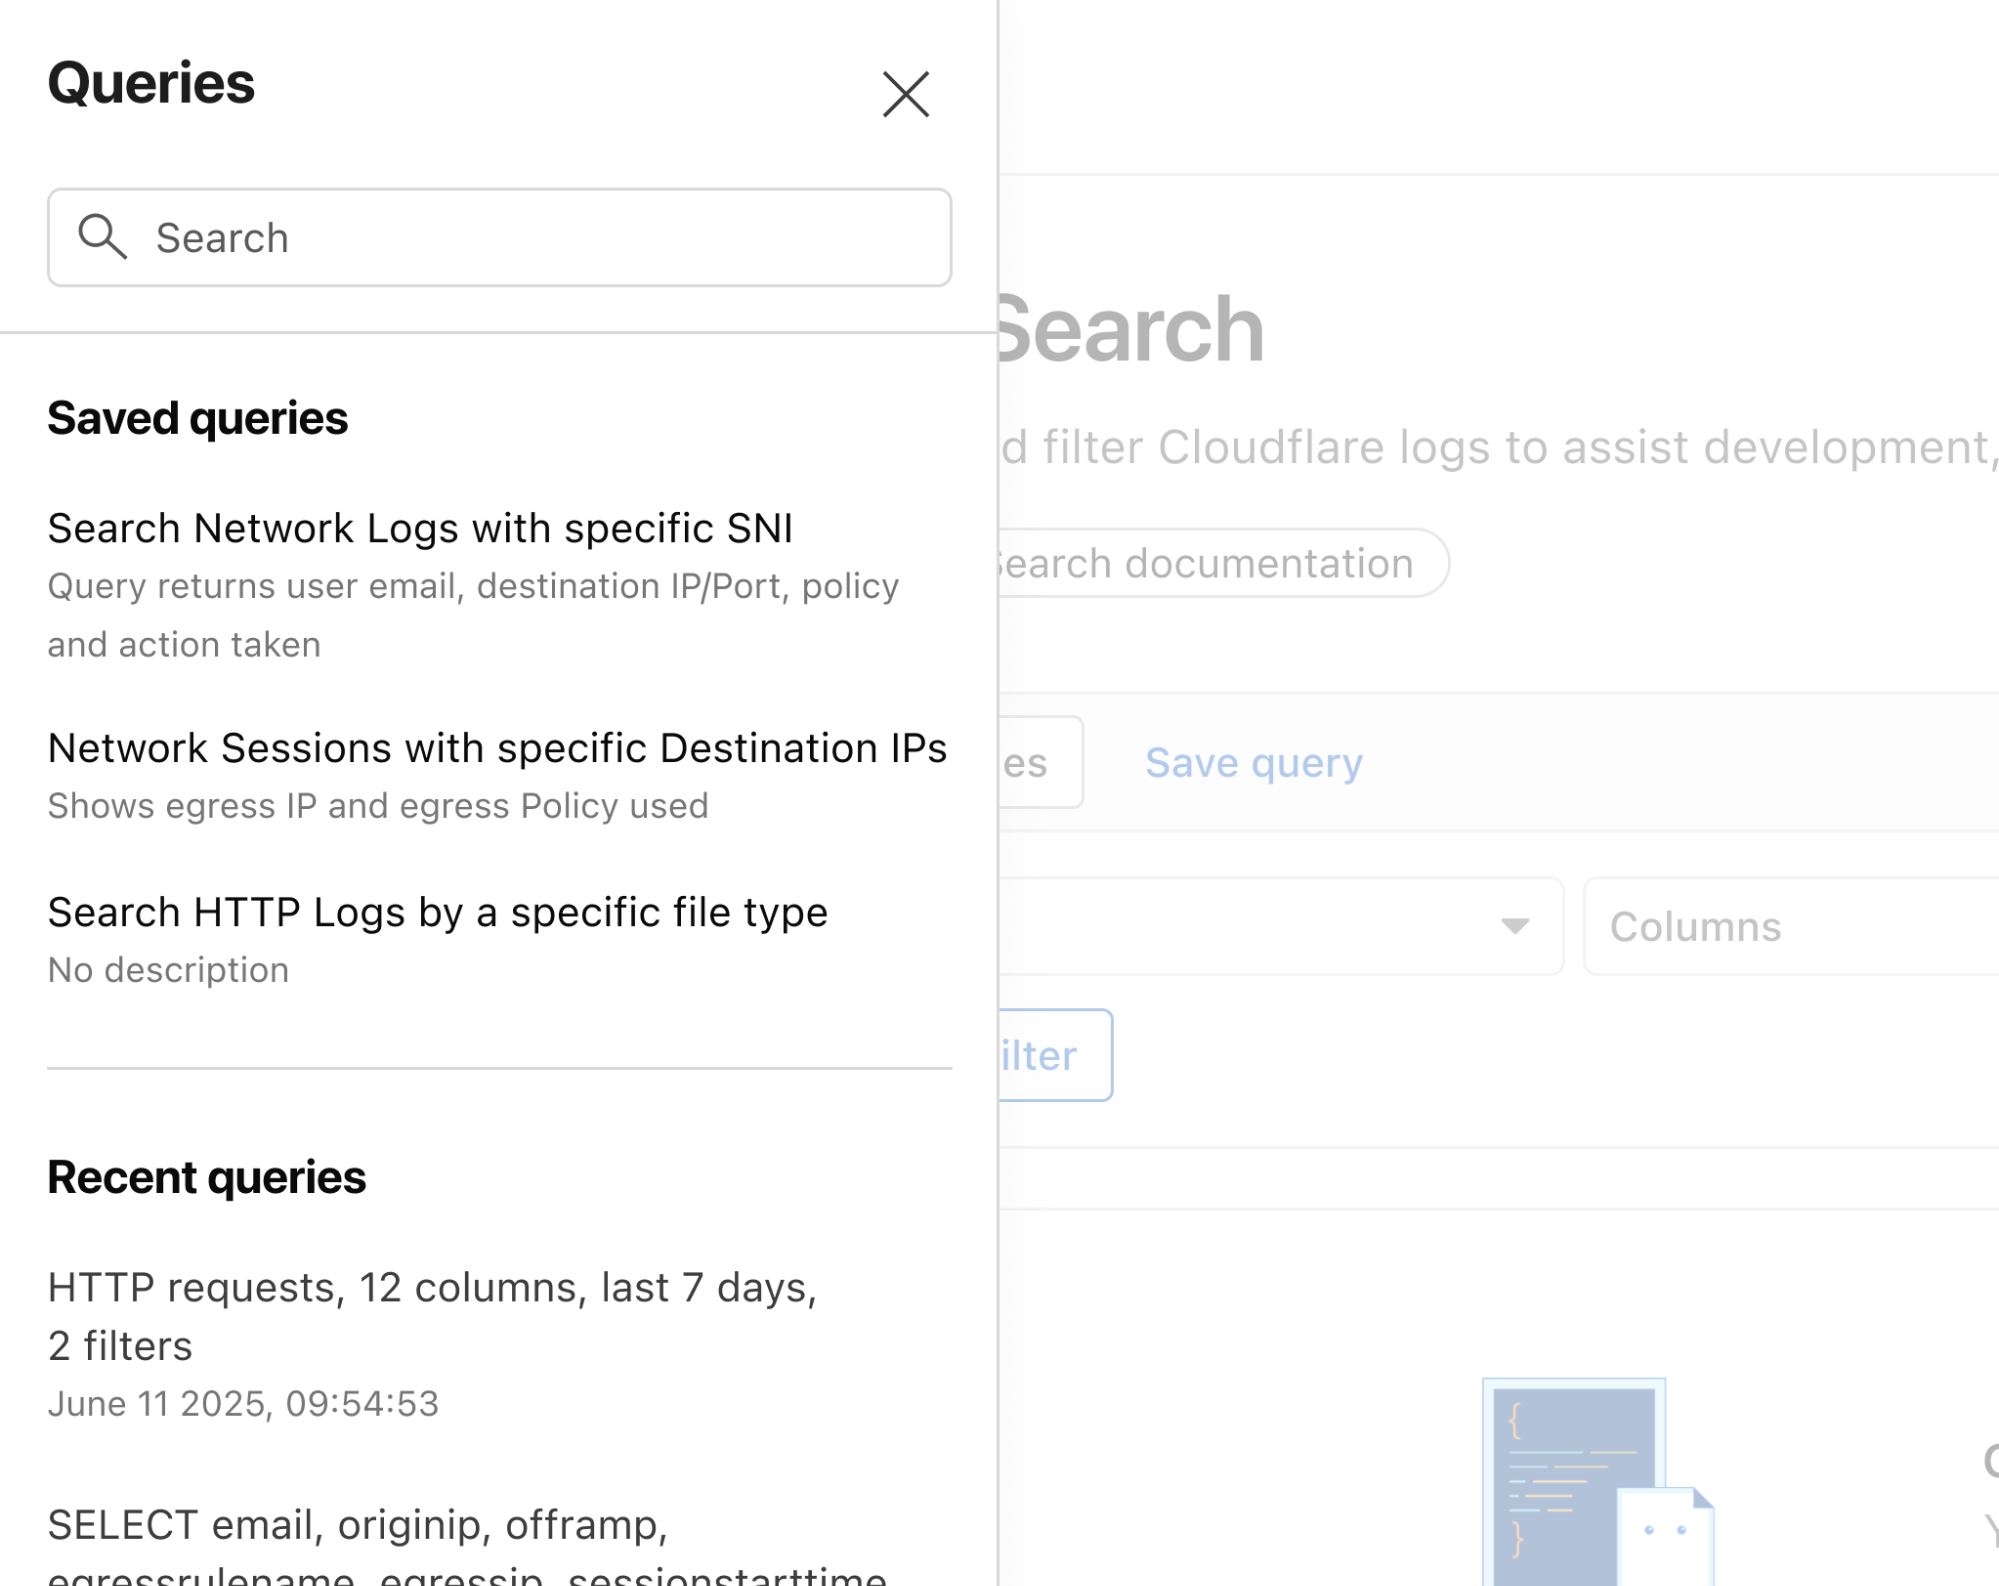
Save time and collaborate with saved queries
Queries built in Log Search can now be saved for repeated use and are accessible to other Log Explorer users in your account. This makes it easier than ever to investigate issues together.
Monitor proactively with Custom Alerting (coming soon)
With custom alerting, you can configure custom alert policies in order to proactively monitor the indicators that are important to your business.
Starting from Log Search, define and test your query. From here you can opt to save and configure a schedule interval and alerting policy. The query will run automatically on the schedule you define.
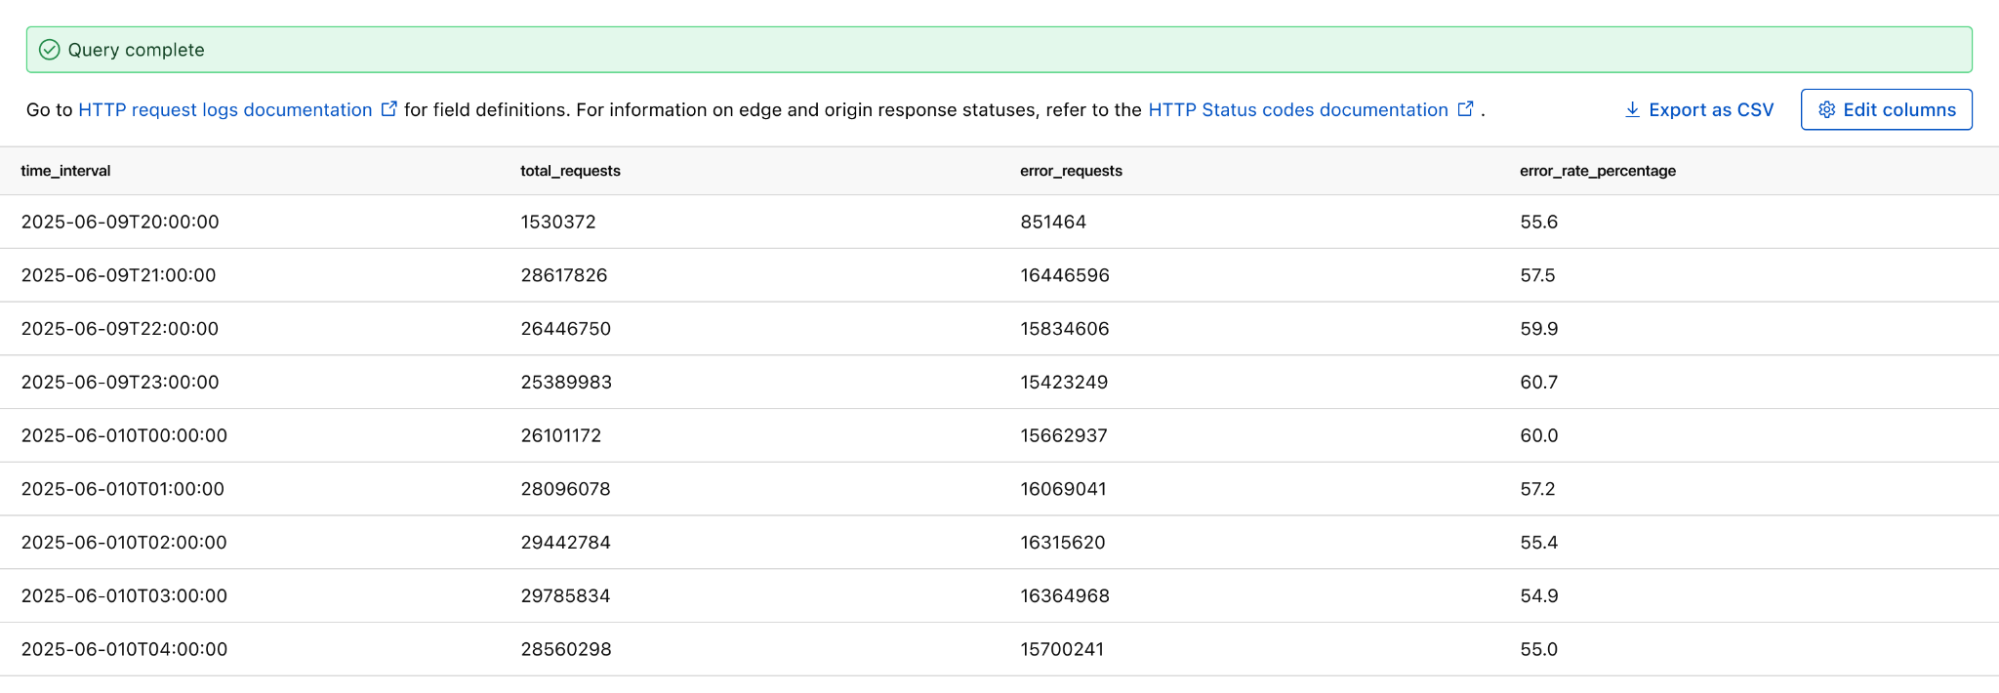
Tracking error rate for a custom hostname
If you want to monitor the error rate for a particular host, you can use this Log Search query to calculate the error rate per time interval:
SELECT SUBSTRING(EdgeStartTimeStamp, 1, 14) || '00:00' AS time_interval,
       COUNT() AS total_requests,
       COUNT(CASE WHEN EdgeResponseStatus >= 500 THEN 1 ELSE NULL END) AS error_requests,
       COUNT(CASE WHEN EdgeResponseStatus >= 500 THEN 1 ELSE NULL END) * 100.0 / COUNT() AS error_rate_percentage
 FROM http_requests
WHERE EdgeStartTimestamp >= '2025-06-09T20:56:58Z'
  AND EdgeStartTimestamp <= '2025-06-10T21:26:58Z'
  AND ClientRequestHost = 'customhostname.com'
GROUP BY time_interval
ORDER BY time_interval ASC;
Running the above query returns the following results. You can see the overall error rate percentage in the far right column of the query results.
Proactively detect malware
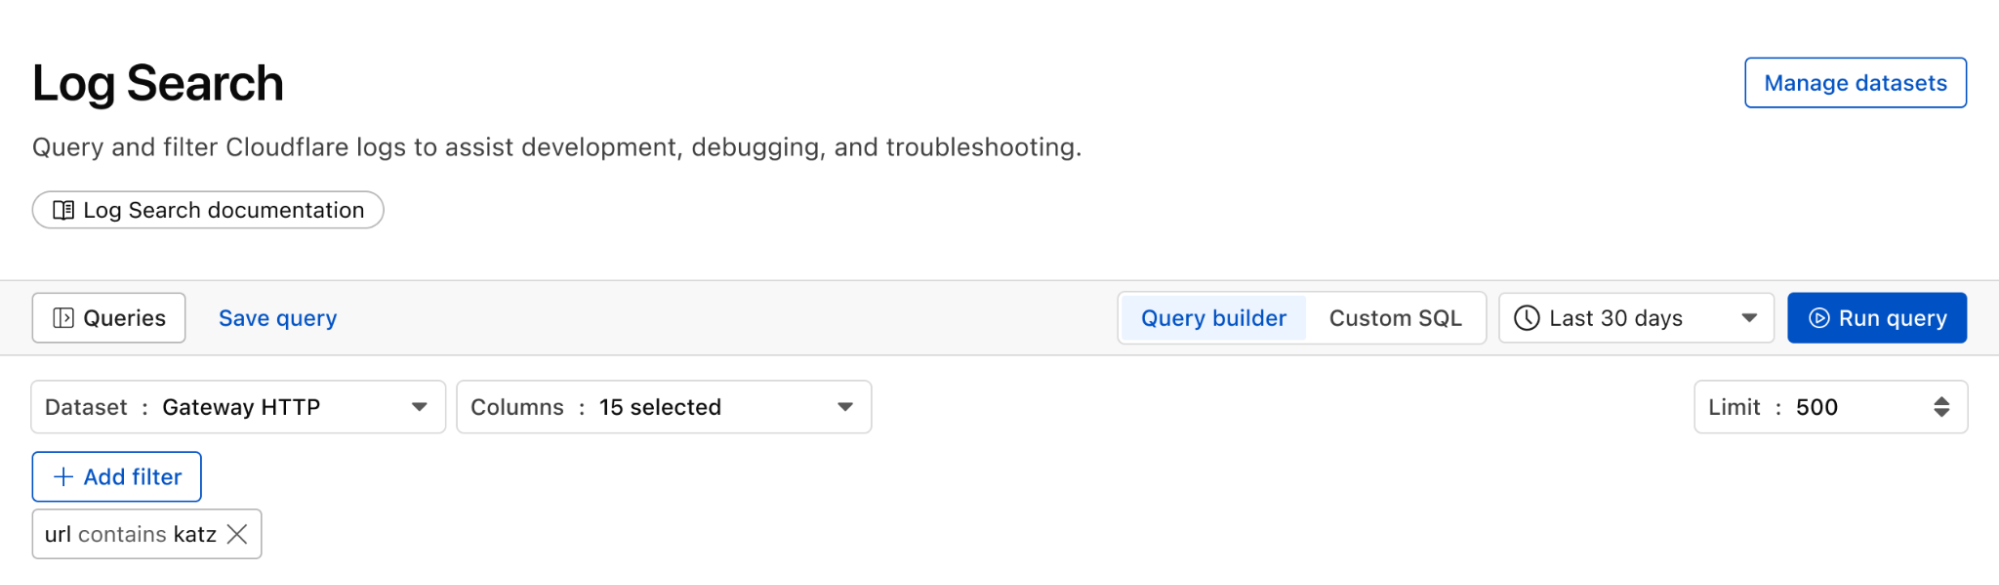
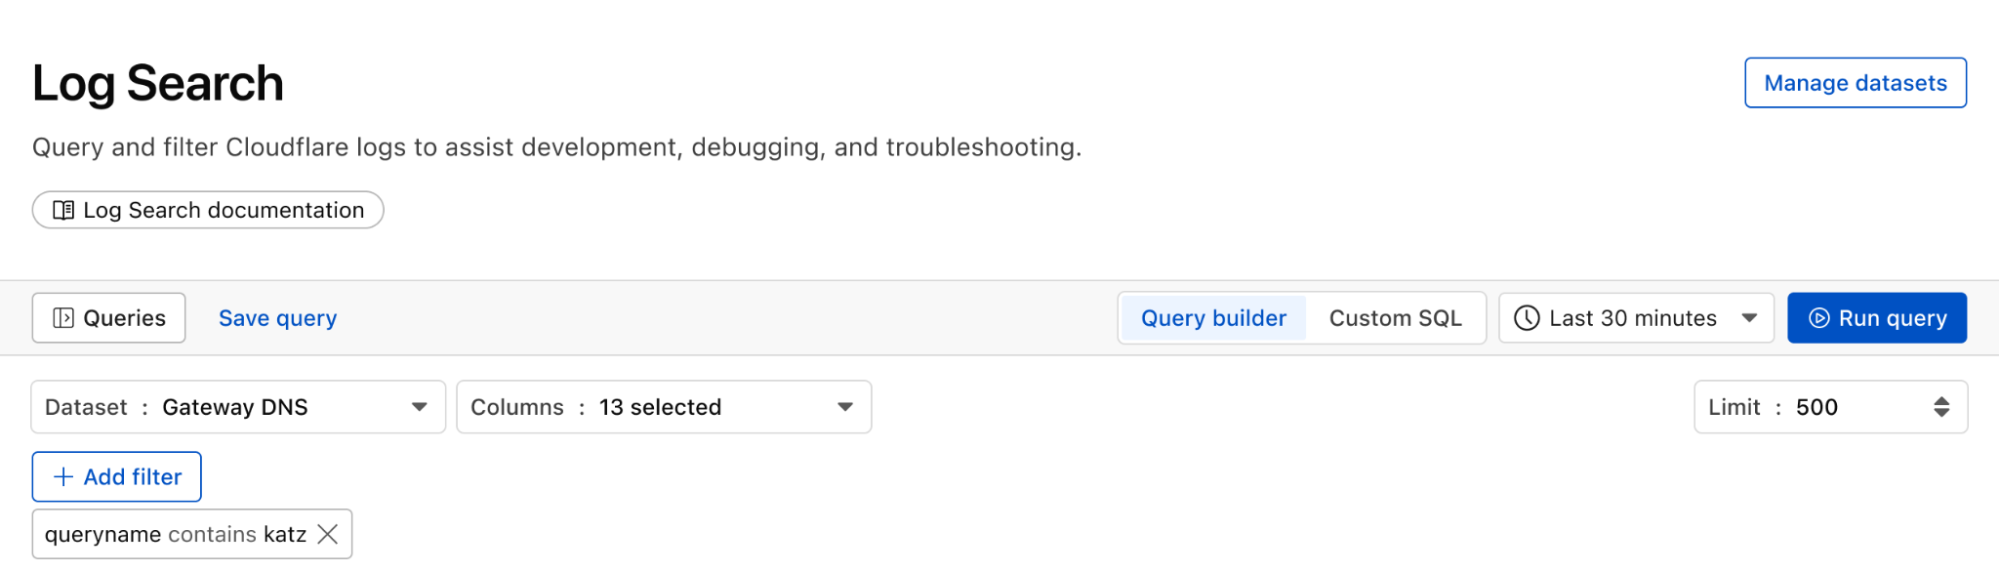
We can identify malware in the environment by monitoring logs from Cloudflare Secure Web Gateway. As an example, Katz Stealer is malware-as-a-service designed for stealing credentials. We can monitor DNS queries and HTTP requests from users within the company in order to identify any machines that may be infected with Katz Stealer malware.
And with custom alerts, you can configure an alert policy so that you can be notified via webhook or PagerDuty.
Maintain audit & compliance with flexible retention (coming soon)
With flexible retention, you can set the precise length of time you want to store your logs, allowing you to meet specific compliance and audit requirements with ease. Other providers require archiving or hot and cold storage, making it difficult to query older logs. Log Explorer is built on top of our R2 storage tier, so historical logs can be queried as easily as current logs.
How we built Log Explorer to run at Cloudflare scale
With Log Explorer, we have built a scalable log storage platform on top of Cloudflare R2 that lets you efficiently search your Cloudflare logs using familiar SQL queries. In this section, we’ll look into how we did this and how we solved some technical challenges along the way.
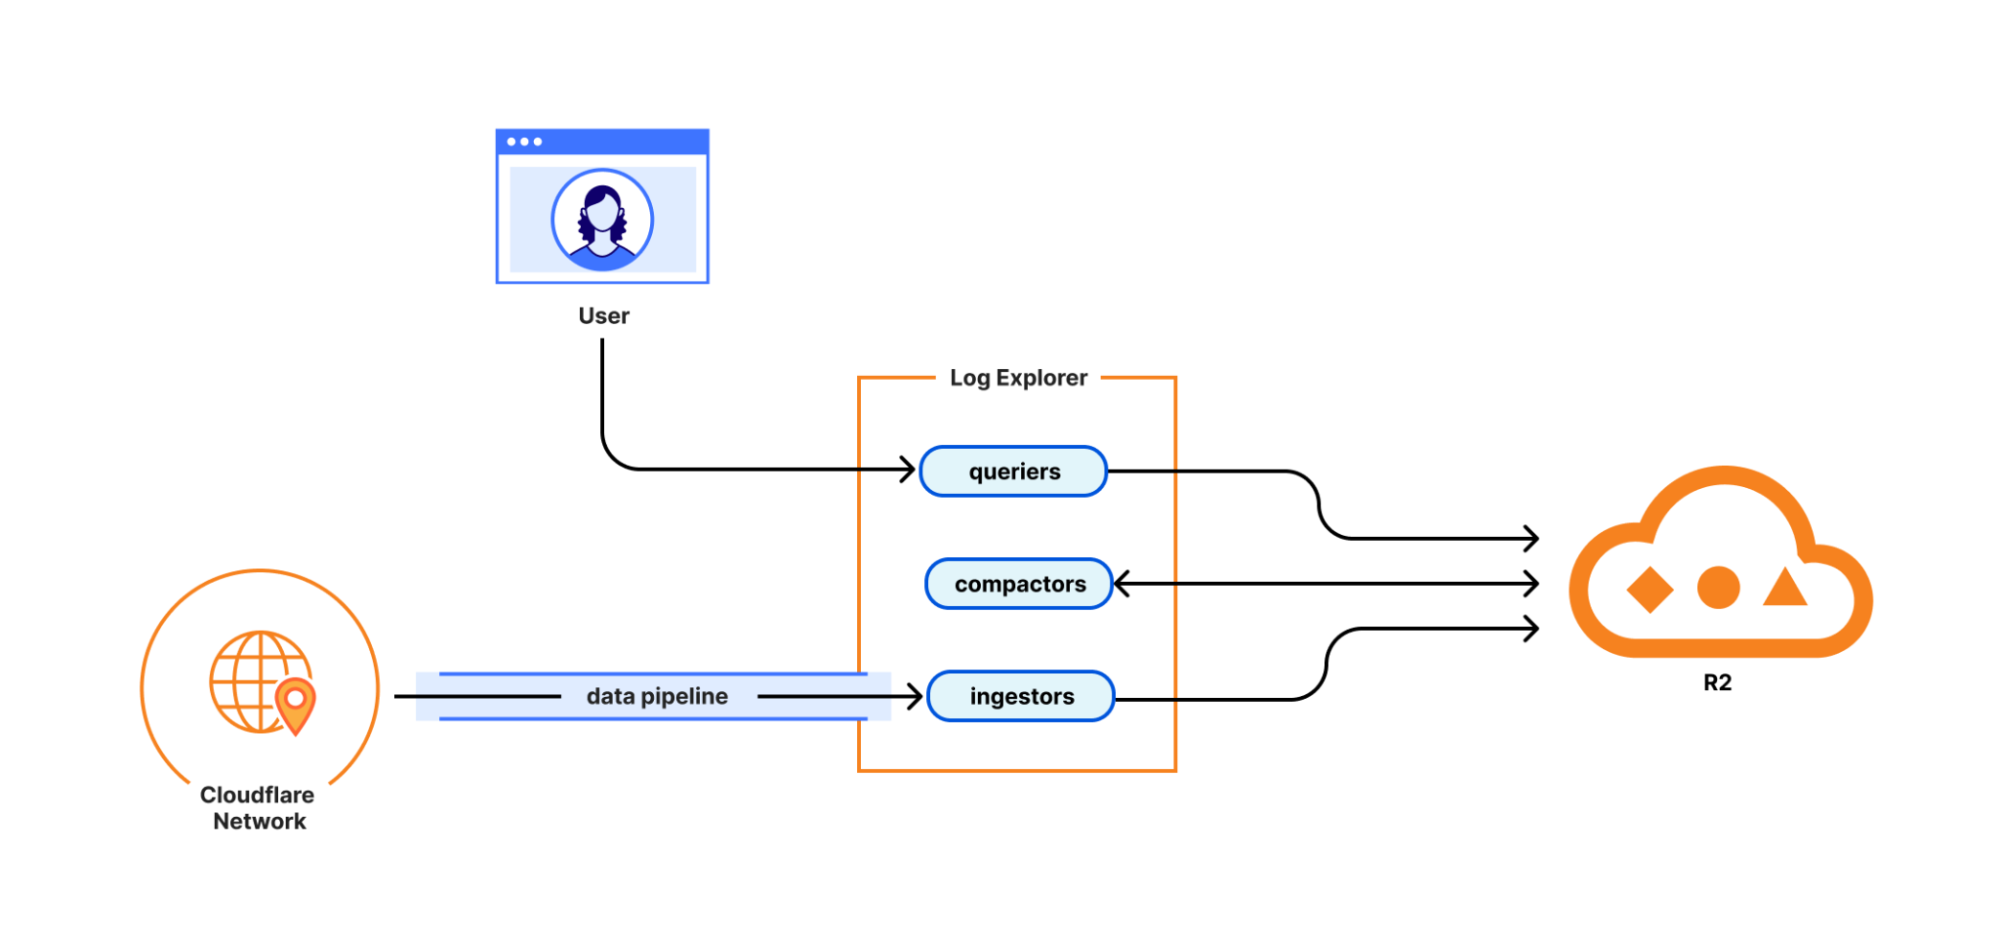
Log Explorer consists of three components: ingestors, compactors, and queriers. Ingestors are responsible for writing logs from Cloudflare’s data pipeline to R2. Compactors optimize storage files, so they can be queried more efficiently. Queriers execute SQL queries from users by fetching, transforming, and aggregating matching logs from R2.
During ingestion, Log Explorer writes each batch of log records to a Parquet file in R2. Apache Parquet is an open-source columnar storage file format, and it was an obvious choice for us: it’s optimized for efficient data storage and retrieval, such as by embedding metadata like the minimum and maximum values of each column across the file which enables the queriers to quickly locate the data needed to serve the query.
Log Explorer stores logs on a per-customer level, just like Cloudflare D1, so that your data isn’t mixed with that of other customers. In Q3 2025, per-customer logs will allow you the flexibility to create your own retention policies and decide in which regions you want to store your data.
But how does Log Explorer find those Parquet files when you query your logs? Log Explorer leverages the Delta Lake open table format to provide a database table abstraction atop R2 object storage. A table in Delta Lake pairs data files in Parquet format with a transaction log. The transaction log registers every addition, removal, or modification of a data file for the table – it’s stored right next to the data files in R2.
Given a SQL query for a particular log dataset such as HTTP Requests or Gateway DNS, Log Explorer first has to load the transaction log of the corresponding Delta table from R2. Transaction logs are checkpointed periodically to avoid having to read the entire table history every time a user queries their logs.
Besides listing Parquet files for a table, the transaction log also includes per-column min/max statistics for each Parquet file. This has the benefit that Log Explorer only needs to fetch files from R2 that can possibly satisfy a user query. Finally, queriers use the min/max statistics embedded in each Parquet file to decide which row groups to fetch from the file.
Log Explorer processes SQL queries using Apache DataFusion, a fast, extensible query engine written in Rust, and delta-rs, a community-driven Rust implementation of the Delta Lake protocol. While standing on the shoulders of giants, our team had to solve some unique problems to provide log search at Cloudflare scale.
Log Explorer ingests logs from across Cloudflare’s vast global network, spanning more than 330 cities in over 125 countries. If Log Explorer were to write logs from our servers straight to R2, its storage would quickly fragment into a myriad of small files, rendering log queries prohibitively expensive.
Log Explorer’s strategy to avoid this fragmentation is threefold. First, it leverages Cloudflare’s data pipeline, which collects and batches logs from the edge, ultimately buffering each stream of logs in an internal system named Buftee. Second, log batches ingested from Buftee aren’t immediately committed to the transaction log; rather, Log Explorer stages commits for multiple batches in an intermediate area and “squashes” these commits before they’re written to the transaction log. Third, once log batches have been committed, a process called compaction merges them into larger files in the background.
While the open-source implementation of Delta Lake provides compaction out of the box, we soon encountered an issue when using it for our workloads. Stock compaction merges data files to a desired target size S by sorting the files in reverse order of their size and greedily filling bins of size S with them. By merging logs irrespective of their timestamps, this process distributed ingested batches randomly across merged files, destroying data locality. Despite compaction, a user querying for a specific time frame would still end up fetching hundreds or thousands of files from R2.
For this reason, we wrote a custom compaction algorithm that merges ingested batches in order of their minimum log timestamp, leveraging the min/max statistics mentioned previously. This algorithm reduced the number of overlaps between merged files by two orders of magnitude. As a result, we saw a significant improvement in query performance, with some large queries that had previously taken over a minute completing in just a few seconds.
Follow along for more updates
We’re just getting started! We’re actively working on even more powerful features to further enhance your experience with Log Explorer. Subscribe to the blog and keep an eye out for more updates in our Change Log to our observability and forensics offering soon.
Get access to Log Explorer
To get access to Log Explorer, reach out for a consultation or contact your account manager. Additionally, you can read more in our Developer Documentation.
This will get you started with a remote MCP server that supports the latest MCP standards and is the reason why thousands of remote MCP servers have been deployed on Cloudflare, including ones from companies like Atlassian, Linear, PayPal, and more.
But deploying servers is only half of the equation — we also wanted to make it just as easy to build and deploy remote MCP clients that can connect to these servers to enable new AI-powered service integrations. That’s why we built use-mcp, a React library for connecting to remote MCP servers, and we’re excited to contribute it to the MCP ecosystem to enable more developers to build remote MCP clients.
Today, we’re open-sourcing two tools that make it easy to build and deploy MCP clients:
use-mcp — A React library that connects to any remote MCP server in just 3 lines of code, with transport, authentication, and session management automatically handled. We’re excited to contribute this library to the MCP ecosystem to enable more developers to build remote MCP clients.
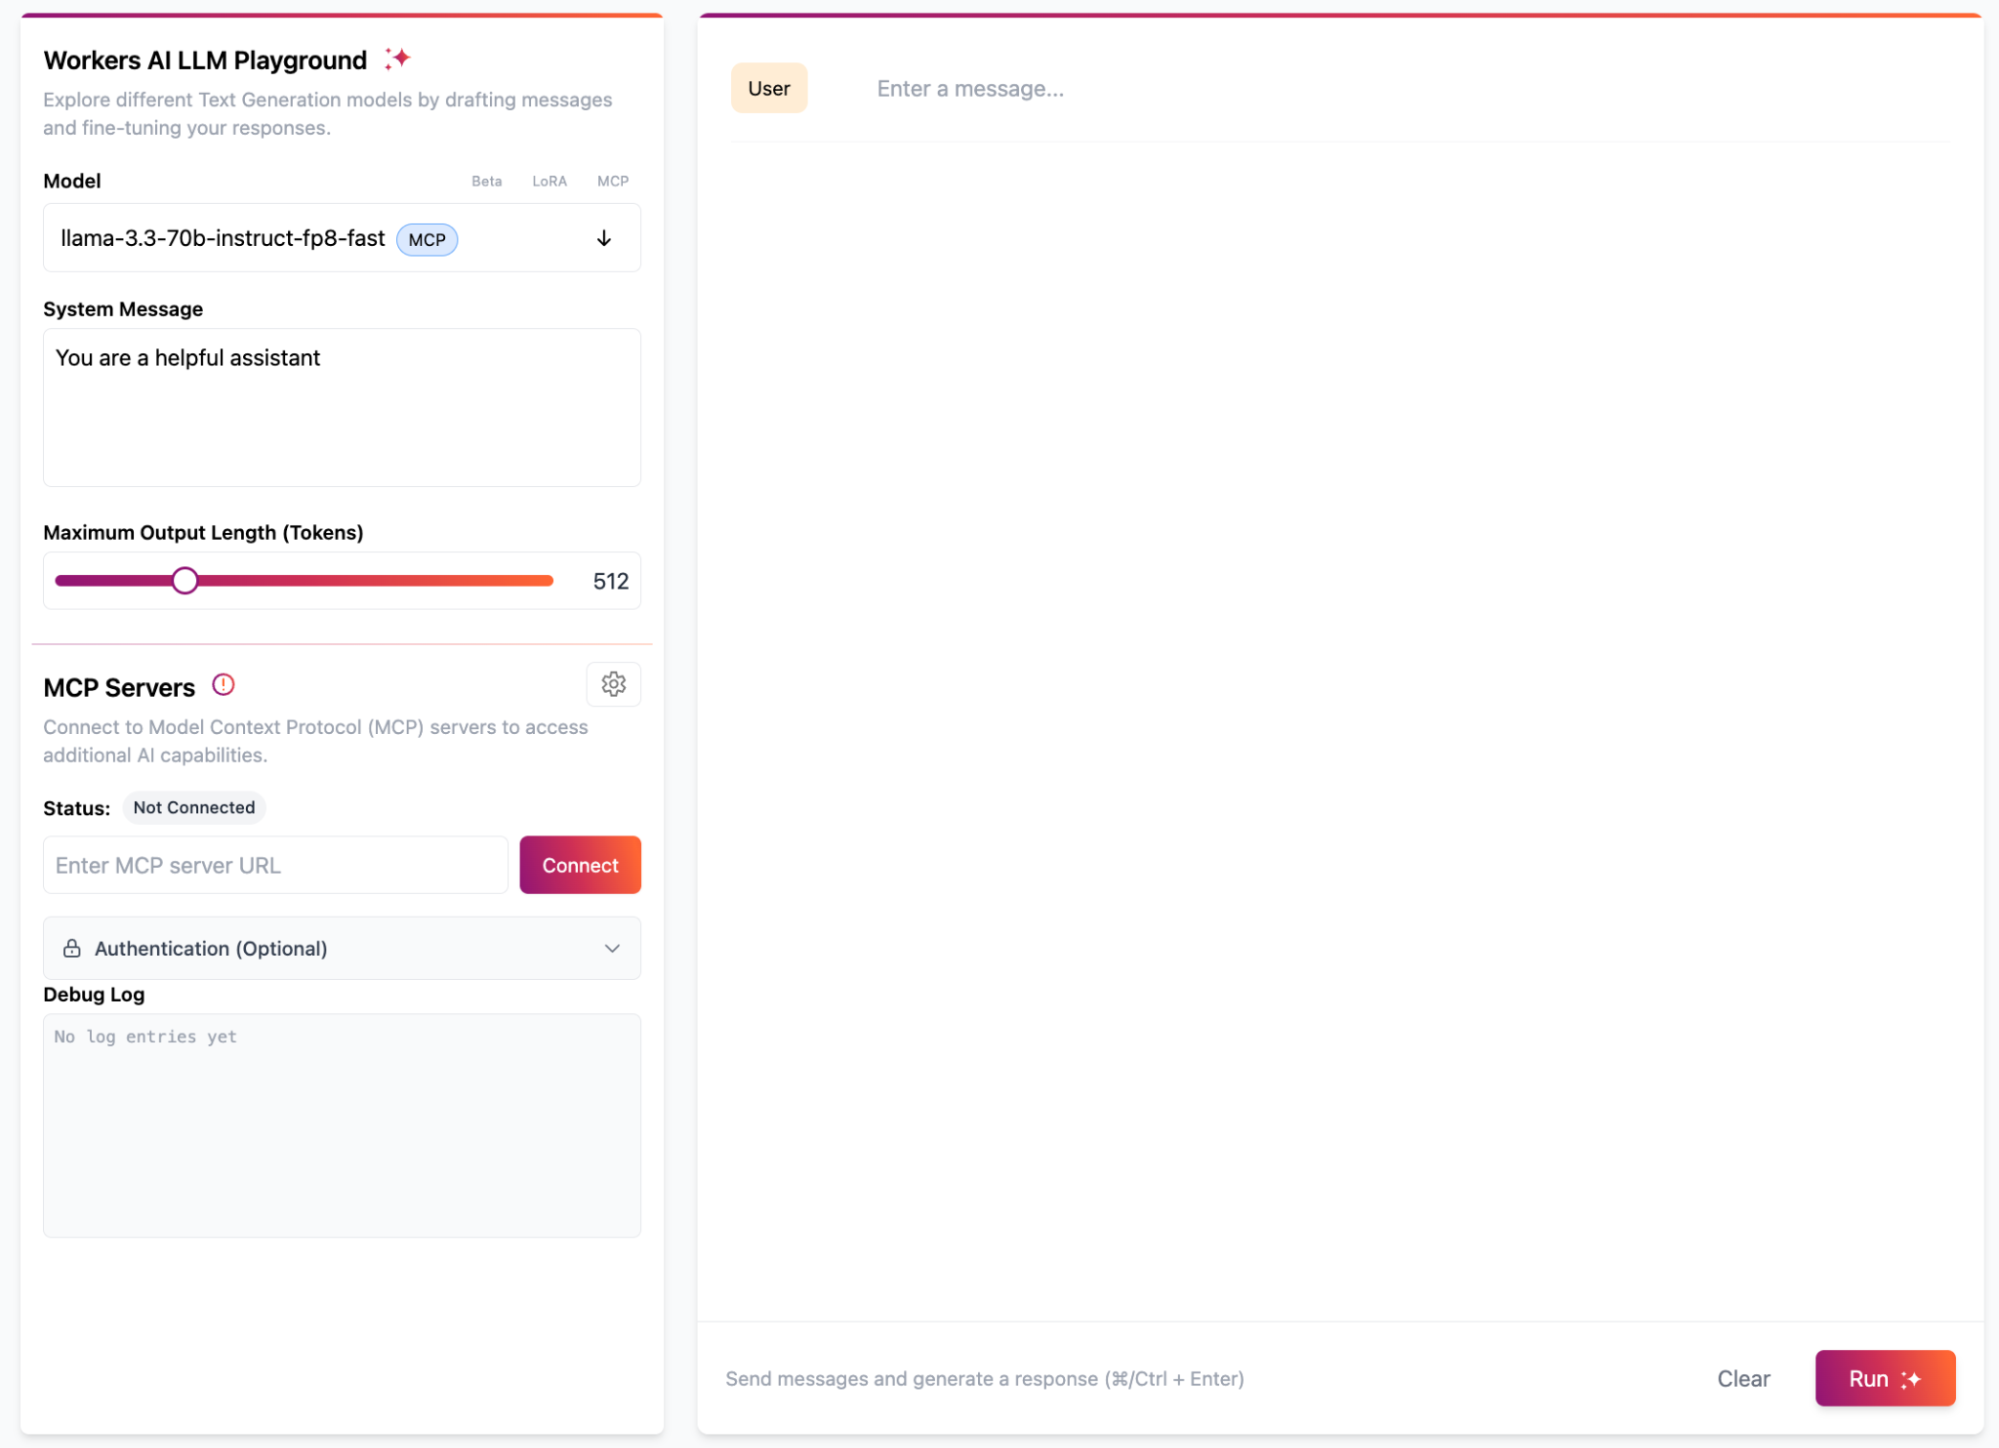
The AI Playground — Cloudflare’s AI chat interface platform that uses a number of LLM models to interact with remote MCP servers, with support for the latest MCP standard, which you can now deploy yourself.
Whether you’re building an AI-powered chat bot, a support agent, or an internal company interface, you can leverage these tools to connect your AI agents and applications to external services via MCP.
Ready to get started? Click on the button below to deploy your own instance of Cloudflare’s AI Playground to see it in action.
use-mcp: a React library for building remote MCP clients
use-mcp is a React library that abstracts away all the complexity of building MCP clients. Add the useMCP() hook into any React application to connect to remote MCP servers that users can interact with.
Here’s all the code you need to add to connect to a remote MCP server:
mport { useMcp } from 'use-mcp/react'
function MyComponent() {
  const { state, tools, callTool } = useMcp({
    url: 'https://mcp-server.example.com'
  })
  return <div>Your actual UI code</div>
}
Just specify the URL, and you’re instantly connected.
Behind the scenes, use-mcp handles the transport protocols (both Streamable HTTP and Server-Sent Events), authentication flows, and session management. It also includes a number of features to help you build reliable, scalable, and production-ready MCP clients.
Connection management
Network reliability shouldn’t impact user experience. use-mcp manages connection retries and reconnections with a backoff schedule to ensure your client can recover the connection during a network issue and continue where it left off. The hook exposes real-time connection states (“connecting”, “ready”, “failed”), allowing you to build responsive UIs that keep users informed without requiring you to write any custom connection handling logic.
const { state } = useMcp({ url: 'https://mcp-server.example.com' })

if (state === 'connecting') {
  return <div>Establishing connection...</div>
}
if (state === 'ready') {
  return <div>Connected and ready!</div>
}
if (state === 'failed') {
  return <div>Connection failed</div>
}
Authentication & authorization
Many MCP servers require some form of authentication in order to make tool calls. use-mcp supports OAuth 2.1 and handles the entire OAuth flow. It redirects users to the login page, allows them to grant access, securely stores the access token returned by the OAuth provider, and uses it for all subsequent requests to the server. The library also provides methods for users to revoke access and clear stored credentials. This gives you a complete authentication system that allows you to securely connect to remote MCP servers, without writing any of the logic.
const { clearStorage } = useMcp({ url: 'https://mcp-server.example.com' })

// Revoke access and clear stored credentials
const handleLogout = () => {
  clearStorage() // Removes all stored tokens, client info, and auth state
}
Dynamic tool discovery
When you connect to an MCP server, use-mcp fetches the tools it exposes. If the server adds new capabilities, your app will see them without any code changes. Each tool provides type-safe metadata about its required inputs and functionality, so your client can automatically validate user input and make the right tool calls.
Debugging & monitoring capabilities
To help you troubleshoot MCP integrations, use-mcp exposes a log array containing structured messages at debug, info, warn, and error levels, with timestamps for each one. You can enable detailed logging with the debug option to track tool calls, authentication flows, connection state changes, and errors. This real-time visibility makes it easier to diagnose issues during development and production.
Future-proofed & backwards compatible
MCP is evolving rapidly, with recent updates to transport mechanisms and upcoming changes to authorization. use-mcp supports both Server-Sent Events (SSE) and the newer Streamable HTTP transport, automatically detecting and upgrading to newer protocols, when supported by the MCP server.
As the MCP specification continues to evolve, we’ll keep the library updated with the latest standards, while maintaining backwards compatibility. We are also excited to contribute use-mcp to the MCP project, so it can grow with help from the wider community.
MCP Inspector, built with use-mcp
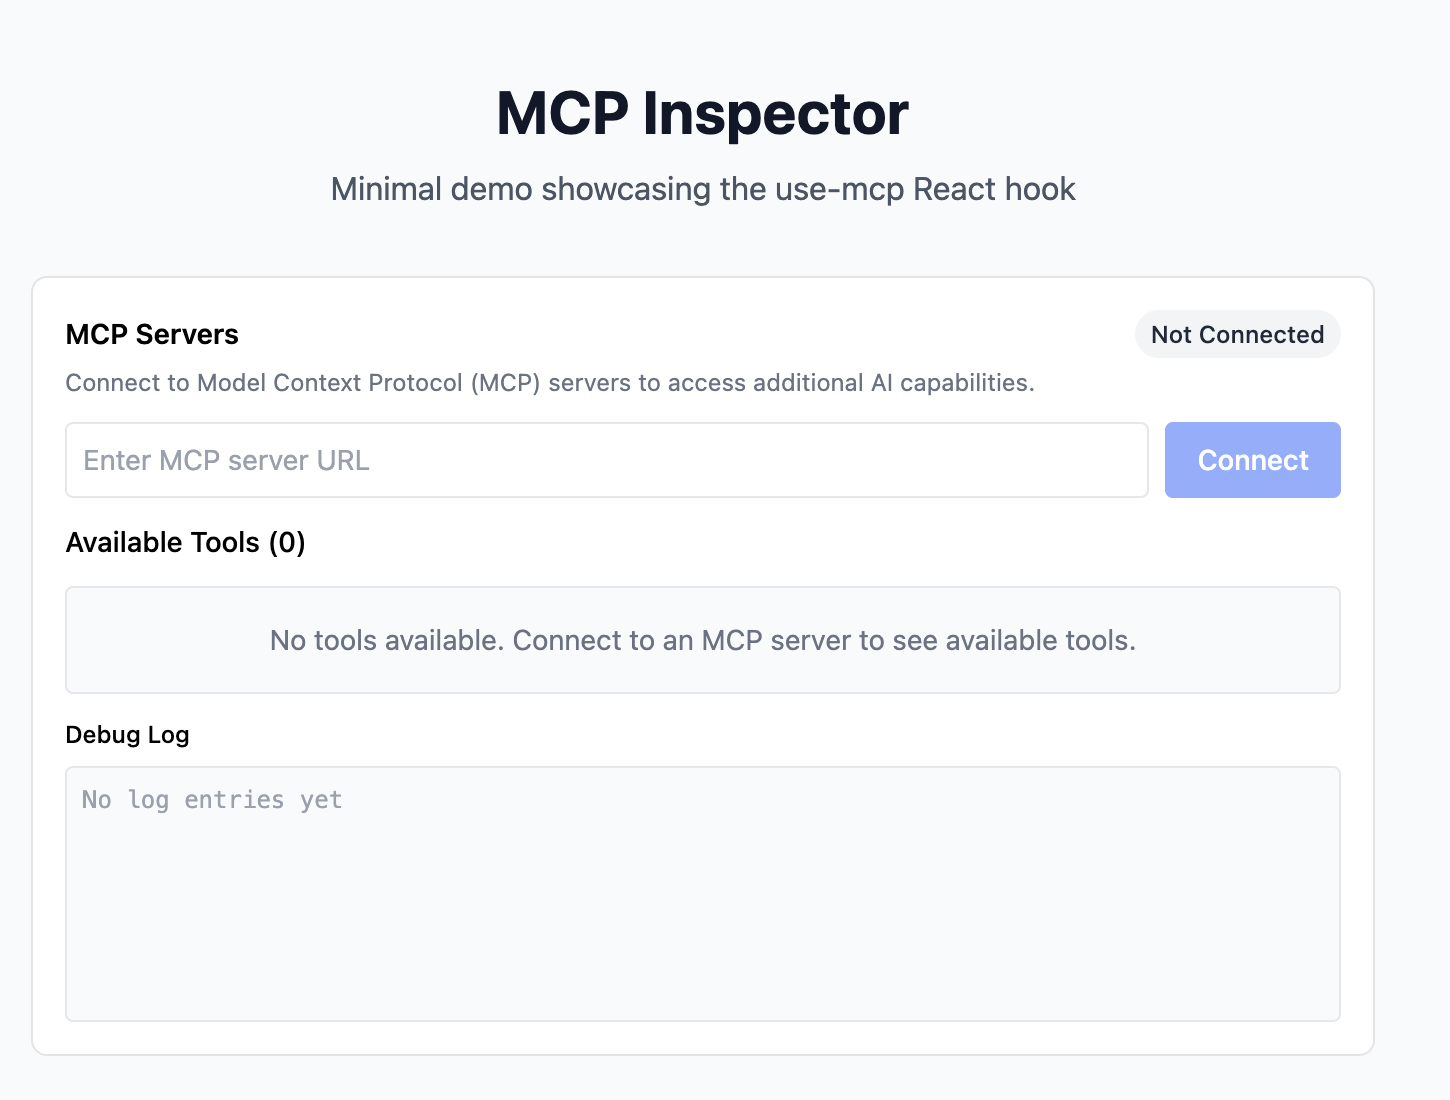
In use-mcp’s examples directory, you’ll see a minimal MCP Inspector that was built with the use-mcp hook. . Enter any MCP server URL to test connections, see available tools, and monitor interactions through the debug logs. It’s a great starting point for building your own MCP clients or something you can use to debug connections to your MCP server.
Open-sourcing the AI Playground
We initially built the AI Playground to give users a chat interface for testing different AI models supported by Workers AI. We then added MCP support, so it could be used as a remote MCP client to connect to and test MCP servers. Today, we’re open-sourcing the playground, giving you the complete chat interface with the MCP client built in, so you can deploy it yourself and customize it to fit your needs.
The playground comes with built-in support for the latest MCP standards, including both Streamable HTTP and Server-Sent Events transport methods, OAuth authentication flows that allow users to sign-in and grant permissions, as well as support for bearer token authentication for direct MCP server connections.
How the AI Playground works
The AI Playground is built on Workers AI, giving you access to a full catalog of large language models (LLMs) running on Cloudflare’s network, combined with the Agents SDK and use-mcp library for MCP server connections.
The AI Playground uses the use-mcp library to manage connections to remote MCP servers. When the playground starts up, it initializes the MCP connection system with const{tools: mcpTools} = useMcp(), which provides access to all tools from connected servers. At first, this list is empty because it’s not connected to any MCP servers, but once a connection to a remote MCP server is established, the tools are automatically discovered and populated into the list.
Once connected, the playground immediately has access to any tools that the MCP server exposes. The use-mcp library handles all the protocol communication and tool discovery, and maintains the connection state. If the MCP server requires authentication, the playground handles OAuth flows through a dedicated callback page that uses onMcpAuthorization from use-mcp to complete the authentication process.
When a user sends a chat message, the playground takes the mcpTools from the use-mcp hook and passes them directly to Workers AI, enabling the model to understand what capabilities are available and invoke them as needed.
To monitor and debug connections to MCP servers, we’ve added a Debug Log interface to the playground. This displays real-time information about the MCP server connections, including connection status, authentication state, and any connection errors.
During the chat interactions, the debug interface will show the raw message exchanged between the playground and the MCP server, including the tool invocation and its result. This allows you to monitor the JSON payload being sent to the MCP server, the raw response returned, and track whether the tool call succeeded or failed. This is especially helpful for anyone building remote MCP servers, as it allows you to see how your tools are behaving when integrated with different language models.
Contributing to the MCP ecosystem
One of the reasons why MCP has evolved so quickly is that it’s an open source project, powered by the community. We’re excited to contribute the use-mcp library to the MCP ecosystem to enable more developers to build remote MCP clients.
If you’re looking for examples of MCP clients or MCP servers to get started with, check out theCloudflare AI GitHub repository for working examples you can deploy and modify. This includes the complete AI Playground source code, a number of remote MCP servers that use different authentication & authorization providers, and the MCP Inspector.
We’re also building the Cloudflare MCP servers in public and welcome contributions to help make them better.
Whether you’re building your first MCP server, integrating MCP into an existing application, or contributing to the broader ecosystem, we’d love to hear from you. If you have any questions, feedback, or ideas for collaboration, you can reach us via email at [email protected].
There’s a lot of talk right now about building AI agents, but not a lot out there about what it takes to make those agents truly useful.
An Agent is an autonomous system designed to make decisions and perform actions to achieve a specific goal or set of goals, without human input.
No matter how good your agent is at making decisions, you will need a person to provide guidance or input on the agent’s path towards its goal. After all, an agent that cannot interact or respond to the outside world and the systems that govern it will be limited in the problems it can solve.
That’s where the “human-in-the-loop” interaction pattern comes in. You’re bringing a human into the agent’s loop and requiring an input from that human before the agent can continue on its task.
In this blog post, we’ll useKnock and the CloudflareAgents SDK to build an AI Agent for a virtual card issuing workflow that requires human approval when a new card is requested.
Knock is messaging infrastructure you can use to send multi-channel messages across in-app, email, SMS, push, and Slack, without writing any integration code.
With Knock, you gain complete visibility into the messages being sent to your users while also handling reliable delivery, user notification preferences, and more.
You can use Knock to power human-in-the-loop flows for your agents using Knock’sAgent Toolkit, which is a set of tools that expose Knock’s APIs and messaging capabilities to your AI agents.
Using the Agent SDK as the foundation of our AI Agent
The Agents SDK provides an abstraction for building stateful, real-time agents on top of Durable Objects that are globally addressable and persist state using an embedded, zero-latency SQLite database.
Building an AI agent outside of using the Agents SDK and the Cloudflare platform means we need to consider WebSocket servers, state persistence, and how to scale our service horizontally. Because a Durable Object backs the Agents SDK, we receive these benefits for free, while having a globally addressable piece of compute with built-in storage, that’s completely serverless and scales to zero.
In the example, we’ll use these features to build an agent that users interact with in real-time via chat, and that can be paused and resumed as needed. The Agents SDK is the ideal platform for powering asynchronous agentic workflows, such as those required in human-in-the-loop interactions.
Setting up our Knock messaging workflow
Within Knock, we design our approval workflow using the visual workflow builder to create the cross-channel messaging logic. We then make the notification templates associated with each channel to which we want to send messages.
Knock will automatically apply theuser’s preferences as part of the workflow execution, ensuring that your user’s notification settings are respected.
You can find an example workflow that we’ve already created for this demo in the repository. You can use this workflow template via theKnock CLI to import it into your account.
Building our chat UI
We’ve built the AI Agent as a chat interface on top of the AIChatAgent abstraction from Cloudflare’s Agents SDK (docs). The Agents SDK here takes care of the bulk of the complexity, and we’re left to implement our LLM calling code with our system prompt.
// src/index.ts

import { AIChatAgent } from "agents/ai-chat-agent";
import { openai } from "@ai-sdk/openai";
import { createDataStreamResponse, streamText } from "ai";

export class AIAgent extends AIChatAgent {
  async onChatMessage(onFinish) {
    return createDataStreamResponse({
      execute: async (dataStream) => {
        try {
          const stream = streamText({
            model: openai("gpt-4o-mini"),
            system: `You are a helpful assistant for a financial services company. You help customers with credit card issuing.`,
            messages: this.messages,
            onFinish,
            maxSteps: 5,
          });

          stream.mergeIntoDataStream(dataStream);
        } catch (error) {
          console.error(error);
        }
      },
    });
  }
}
On the client side, we’re using the useAgentChat hook from the agents/ai-react package to power the real-time user-to-agent chat.
We’ve modeled our agent as a chat per user, which we set up using the useAgent hook by specifying the name of the process as the userId.
This means we have an agent process, and therefore a durable object, per-user. For our human-in-the-loop use case, this becomes important later on as we talk about resuming our deferred tool call.
Deferring the tool call to Knock
We give the agent our card issuing capability through exposing an issueCard tool. However, instead of writing the approval flow and cross-channel logic ourselves, we delegate it entirely to Knock by wrapping the issue card tool in our requireHumanInput method.
Now when the user asks to request a new card, we make a call out to Knock to initiate our card request, which will notify the appropriate admins in the organization to request an approval.
To set this up, we need to use Knock’s Agent Toolkit, which exposes methods to work with Knock in our AI agent and power cross-channel messaging.
import { createKnockToolkit } from "@knocklabs/agent-toolkit/ai-sdk";
import { tool } from "ai";
import { z } from "zod";

import { AIAgent } from "./index";
import { issueCard } from "./api";
import { BASE_URL } from "./constants";

async function initializeToolkit(agent: AIAgent) {
  const toolkit = await createKnockToolkit({ serviceToken: agent.env.KNOCK_SERVICE_TOKEN });

  const issueCardTool = tool({
    description: "Issue a new credit card to a customer.",
    parameters: z.object({
      customerId: z.string(),
    }),
    execute: async ({ customerId }) => {
      return await issueCard(customerId);
    },
  });

  const { issueCard } = toolkit.requireHumanInput(
    { issueCard: issueCardTool },
    {
      workflow: "approve-issued-card",
      actor: agent.name,
      recipients: ["admin_user_1"],
      metadata: {
        approve_url: `${BASE_URL}/card-issued/approve`,
        reject_url: `${BASE_URL}/card-issued/reject`,
      },
    }
  );

  return { toolkit, tools: { issueCard } };
}
There’s a lot going on here, so let’s walk through the key parts:
We wrap our issueCard tool in the requireHumanInput method, exposed from the Knock Agent Toolkit
We want the messaging workflow to be invoked to be our approve-issued-card workflow
We pass the agent.name as the actor of the request, which translates to the user ID
We set the recipient of this workflow to be the user admin_user_1
We pass the approve and reject URLs so that they can be used in our message templates
The wrapped tool is then returned as issueCard
Under the hood, these options are passed to theKnock workflow trigger API to invoke a workflow per-recipient. The set of the recipients listed here could be dynamic, or go to a group of users throughKnock’s subscriptions API.
We can then pass the wrapped issue card tool to our LLM call in the onChatMessage method on the agent so that the tool call can be called as part of the interaction with the agent.
export class AIAgent extends AIChatAgent {
  // ... other methods

  async onChatMessage(onFinish) {
    const { tools } = await initializeToolkit(this);

    return createDataStreamResponse({
      execute: async (dataStream) => {
        const stream = streamText({
          model: openai("gpt-4o-mini"),
          system: "You are a helpful assistant for a financial services company. You help customers with credit card issuing.",
          messages: this.messages,
          onFinish,
          tools,
          maxSteps: 5,
        });

        stream.mergeIntoDataStream(dataStream);
      },
    });
  }
}
Now when the agent calls the issueCardTool, we invoke Knock to send our approval notifications, deferring the tool call to issue the card until we receive an approval. Knock’s workflows take care of sending out the message to the set of recipient’s specified, generating and delivering messages according to each user’s preferences.
Using Knockworkflows for our approval message makes it easy to build cross-channel messaging to reach the user according to their communicationpreferences. We can also leveragedelays,throttles,batching, andconditions to orchestrate more complex messaging.
Handling the approval
Once the message has been sent to our approvers, the next step is to handle the approval coming back, bringing the human into the agent’s loop.
The approval request is asynchronous, meaning that the response can come at any point in the future. Fortunately, Knock takes care of the heavy lifting here for you, routing the event to the agent worker via awebhook that tracks the interaction with the underlying message. In our case, that’s a click to the “approve” or “reject” button.
First, we set up a message.interacted webhook handler within the Knock dashboard to forward the interactions to our worker, and ultimately to our agent process.
In our example here, we route the approval click back to the worker to handle, appending a Knock message ID to the end of the approve_url and reject_url to track engagement against the specific message sent. We do this via liquid inside of our message templates in Knock: {{ data.approve_url }}?messageId={{ current_message.id }} . One caveat here is that if this were a production application, we’re likely going to handle our approval click in a different application than this agent is running. We co-located it here for the purposes of this demo only.
Once the link is clicked, we have a handler in our worker to mark the message as interacted using Knock’smessage interaction API, passing through the status as metadata so that it can be used later.
import Knock from '@knocklabs/node';
import { Hono } from "hono";

const app = new Hono();
const client = new Knock();

app.get("/card-issued/approve", async (c) => {
  const { messageId } = c.req.query();

  if (!messageId) return c.text("No message ID found", { status: 400 });

  await client.messages.markAsInteracted(messageId, {
    status: "approved",
  });

  return c.text("Approved");
});
The message interaction will flow from Knock to our worker via the webhook we set up, ensuring that the process is fully asynchronous. The payload of the webhook includes the full message, including metadata about the user that generated the original request, and keeps details about the request itself, which in our case contains the tool call.
import { getAgentByName, routeAgentRequest } from "agents";
import { Hono } from "hono";

const app = new Hono();

app.post("/incoming/knock/webhook", async (c) => {
  const body = await c.req.json();
  const env = c.env as Env;

  // Find the user ID from the tool call for the calling user
  const userId = body?.data?.actors[0];

  if (!userId) {
    return c.text("No user ID found", { status: 400 });
  }

  // Find the agent DO for the user
  const existingAgent = await getAgentByName(env.AIAgent, userId);

  if (existingAgent) {
    // Route the request to the agent DO to process
    const result = await existingAgent.handleIncomingWebhook(body);

    return c.json(result);
  } else {
    return c.text("Not found", { status: 404 });
  }
});
We leverage the agent’s ability to be addressed by a named identifier to route the request from the worker to the agent. In our case, that’s the userId. Because the agent is backed by a durable object, this process of going from incoming worker request to finding and resuming the agent is trivial.
Resuming the deferred tool call
We then use the context about the original tool call, passed through to Knock and round tripped back to the agent, to resume the tool execution and issue the card.
export class AIAgent extends AIChatAgent {
  // ... other methods

  async handleIncomingWebhook(body: any) {
    const { toolkit } = await initializeToolkit(this);

    const deferredToolCall = toolkit.handleMessageInteraction(body);

    if (!deferredToolCall) {
      return { error: "No deferred tool call given" };
    }

    // If we received an "approved" status then we know the call was approved
    // so we can resume the deferred tool call execution
    if (result.interaction.status === "approved") {
      const toolCallResult =
	      await toolkit.resumeToolExecution(result.toolCall);

      const { response } = await generateText({
        model: openai("gpt-4o-mini"),
        prompt: `You were asked to issue a card for a customer. The card is now approved. The result was: ${JSON.stringify(toolCallResult)}.`,
      });

      const message = responseToAssistantMessage(
        response.messages[0],
        result.toolCall,
        toolCallResult
      );

      // Save the message so that it's displayed to the user
      this.persistMessages([...this.messages, message]);
    }

    return { status: "success" };
  }
}
Again, there’s a lot going on here, so let’s step through the important parts:
We attempt to transform the body, which is the webhook payload from Knock, into a deferred tool call via the handleMessageInteraction method
If the metadata status we passed through to the interaction call earlier has an “approved” status then we resume the tool call via the resumeToolExecution method
Finally, we generate a message from the LLM and persist it, ensuring that the user is informed of the approved card
With this last piece in place, we can now request a new card be issued, have an approval request be dispatched from the agent, send the approval messages, and route those approvals back to our agent to be processed. The agent will asynchronously process our card issue request and the deferred tool call will be resumed for us, with very little code.
Protecting against duplicate approvals
One issue with the above implementation is that we’re prone to issuing multiple cards if someone clicks on the approve button more than once. To rectify this, we want to keep track of the tool calls being issued, and ensure that the call is processed at most once.
To power this we leverage theagent’s built-in state, which can be used to persist information without reaching for another persistence store like a database or Redis, although we could absolutely do so if we wished. We can track the tool calls by their ID and capture their current status, right inside the agent process.
Here, we create the initial state for the tool calls as an empty object. We also add a quick setter helper method to make interactions easier.
Next up, we need to record the tool call being made. To do so, we can use the onAfterCallKnock option in the requireHumanInput helper to capture that the tool call has been requested for the user.
const { issueCard }  = toolkit.requireHumanInput(
  { issueCard: issueCardTool },
  {
    // Keep track of the tool call state once it's been sent to Knock
    onAfterCallKnock: async (toolCall) =>
      agent.setToolCallStatus(toolCall.id, "requested"),
    // ... as before
  }
);
Finally, we then need to check the state when we’re processing the incoming webhook, and mark the tool call as approved (some code omitted for brevity).
export class AIAgent extends AIChatAgent {
  async handleIncomingWebhook(body: any) {
    const { toolkit } = await initializeToolkit(this);
    const deferredToolCall = toolkit.handleMessageInteraction(body);
    const toolCallId = result.toolCall.id;

    // Make sure this is a tool call that can be processed
    if (this.state.toolCalls[toolCallId] !== "requested") {
      return { error: "Tool call is not requested" };
    }

    if (result.interaction.status === "approved") {
      const toolCallResult = await toolkit.resumeToolExecution(result.toolCall);
      this.setToolCallStatus(toolCallId, "approved");
      // ... rest as before
    }
  }
}
Conclusion
Using the Agents SDK and Knock, it’s easy to build advanced human-in-the-loop experiences that defer tool calls.
Knock’s workflow builder and notification engine gives you building blocks to create sophisticated cross-channel messaging for your agents. You can easily create escalation flows that send messages through SMS, push, email, or Slack that respect the notification preferences of your users. Knock also gives you complete visibility into the messages your users are receiving.
The Durable Object abstraction underneath the Agents SDK means that we get a globally addressable agent process that’s easy to yield and resume back to. The persistent storage in the Durable Object means we can retain the complete chat history per-user, and any other state that’s required in the agent process to resume the agent with (like our tool calls). Finally, the serverless nature of the underlying Durable Object means we’re able to horizontally scale to support a large number of users with no effort.
If you’re looking to build your own AI Agent chat experience with a multiplayer human-in-the-loop experience, you’ll find the complete code from this guideavailable in GitHub.
Quickly identify any security misconfigurations for SaaS applications to safeguard applications, users, and data
… all through a natural language interface!
Today, we also announced our collaboration with Anthropic to bring remote MCP to Claude users, and showcased how other leading companies such as Atlassian, PayPal, Sentry, and Webflow have built remote MCP servers on Cloudflare to extend their service to their users. We’ve also been using the same infrastructure and tooling to build out our own suite of remote servers, and today we’re excited to show customers what’s ready for use and share what we’ve learned along the way.
Cloudflare’s MCP servers available today:
These MCP servers allow your MCP Client to read configurations from your account, process information, make suggestions based on data, and even make those suggested changes for you. All of these actions can happen across Cloudflare’s many services including application development, security, and performance.
Cloudflare Documentation Server: Get up to date reference information on Cloudflare
Our Cloudflare Documentation server enables any MCP Client to access up-to-date documentation in real-time, rather than relying on potentially outdated information from the model’s training data. If you’re new to building with Cloudflare, this server synthesizes information right from our documentation and exposes it to your MCP Client, so you can get reliable, up-to-date responses to any complex question like “Search Cloudflare for the best way to build an AI Agent”.
Workers Bindings server: Build with developer resources
Connecting to the Bindings MCP server lets you leverage application development primitives like D1 databases, R2 object storage and Key Value stores on the fly as you build out a Workers application. If you’re leveraging your MCP Client to generate code, the bindings server provides access to read existing resources from your account or create fresh resources to implement in your application. In combination with our base prompt designed to help you build robust Workers applications, you can add the Bindings MCP server to give your client all it needs to start generating full stack applications from natural language.
Full example output using the Workers Bindings MCP server can be found here.
Workers Observability server: Debug your application
The Workers Observability MCP server integrates with Workers Logs to browse invocation logs and errors, compute statistics across invocations, and find specific invocations matching specific criteria. By querying logs across all of your Workers, this MCP server can help isolate errors and trends quickly. The telemetry data that the MCP server returns can also be used to create new visualizations and improve observability.
Container server: Spin up a development environment
The Container MCP server provides any MCP client with access to a secure, isolated execution environment running on Cloudflare’s network where it can run and test code if your MCP client does not have a built in development environment (e.g. claude.ai). When building and generating application code, this lets the AI run its own commands and validate its assumptions in real time.
Browser Rendering server: Fetch and convert web pages, take screenshots
The Browser Rendering MCP server provides AI friendly tools from our RESTful interface for common browser actions such as capturing screenshots, extracting HTML content, and converting pages to Markdown. These are particularly useful when building agents that require interacting with a web browser.
Radar server: Ask questions about how we see the Internet and Scan URLs
Logpush server: Get quick summaries for Logpush job health
Logpush jobs deliver comprehensive logs to your destination of choice, allowing near real-time information processing. The Logpush MCP server can help you analyze your Logpush job results and understand your job health at a high level, allowing you to filter and narrow down for jobs or scenarios you care about. For example, you can ask “provide me with a list of recently failed jobs.” Now, you can quickly find out which jobs are failing with which error message and when, summarized in a human-readable format.
AI Gateway server: Check out your AI Gateway logs
Use this MCP server to inspect your AI Gateway logs and get details about the data from your prompts and the AI models responses. In this example we ask our agent “What is my average latency for my AI Gateway logs in the Cloudflare Radar account?”
AutoRAG server: List and search documents on your AutoRAGs
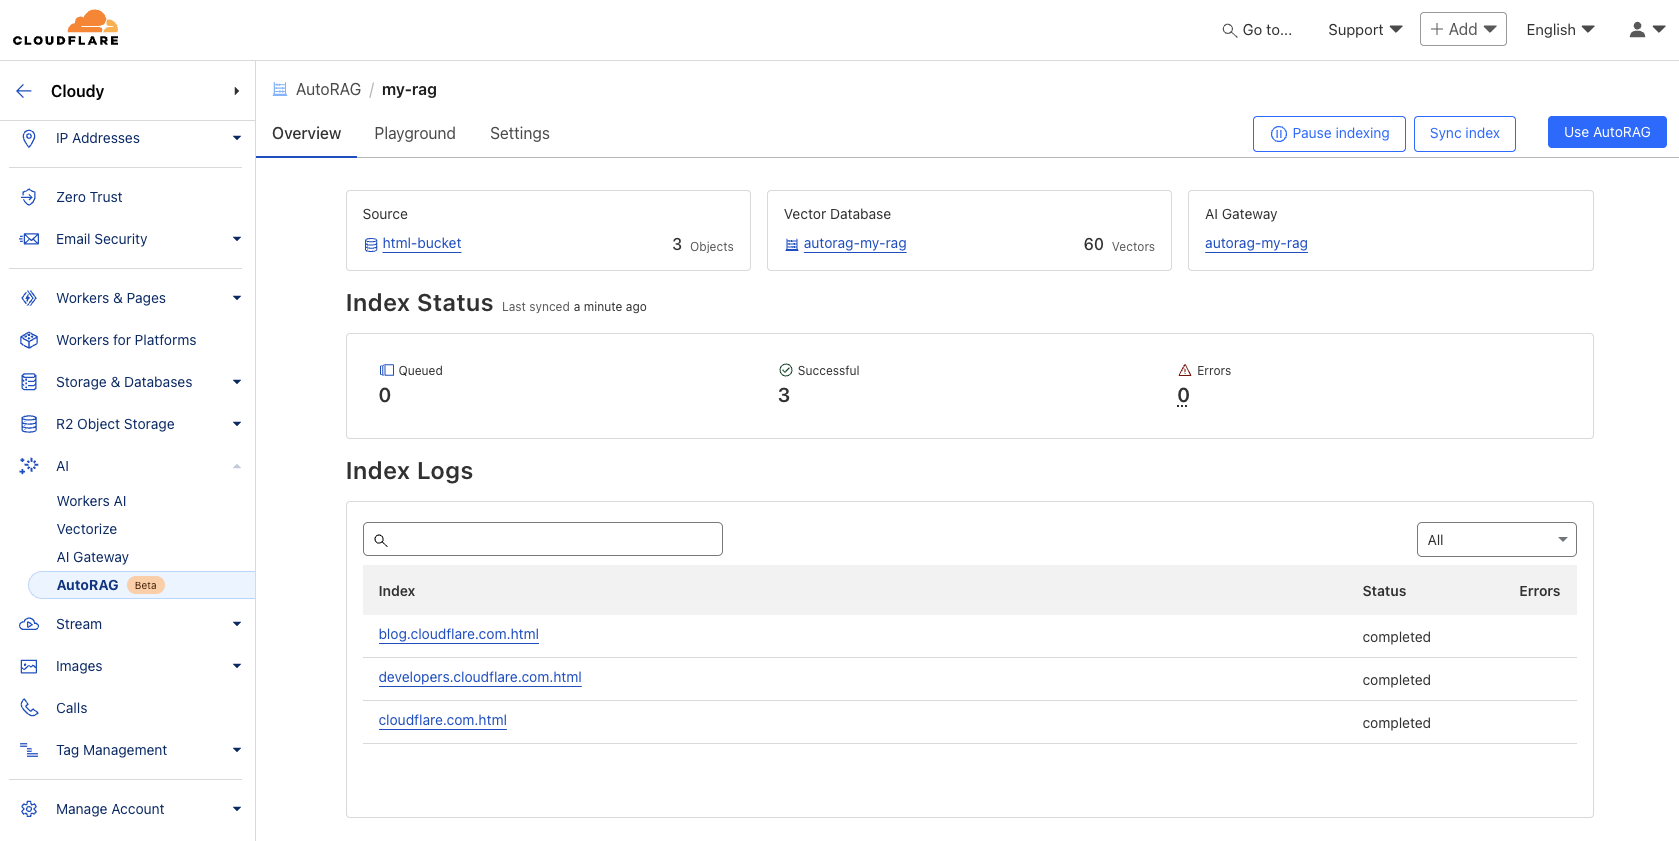
Having AutoRAG RAGs available to query as MCP tools greatly expands the typical static one-shot retrieval and opens doors to use cases where the agent can dynamically decide if and when to retrieve information from one or more RAGs, combine them with other tools and APIs, cross-check information and generate a much more rich and complete final answer.
Here we have a RAG that has a few blog posts that talk about retrocomputers. If we ask “tell me about restoring an amiga 1000 using the blog-celso autorag” the agent will go into a sequence of reasoning steps:
“Now that I have some information about Amiga 1000 restoration from blog-celso, let me search for more specific details.”
“Let me get more specific information about hardware upgrades and fixes for the Amiga 1000.”
“Let me get more information about the DiagROM and other tools used in the restoration.”
“Let me search for information about GBA1000 and other expansions mentioned in the blog.”
And finally, “Based on the comprehensive information I’ve gathered from the blog-celso AutoRAG, I can now provide you with a detailed guide on restoring an Amiga 1000.”
And at the end, it generates a very detailed answer based on all of the data from all of the queries:
Audit Logs server: Query audit logs and generate reports for review
Audit Logs record detailed information about actions and events within a system, providing a transparent history of all activity. However, because these logs can be large and complex, it may take effort to query and reconstruct a clear sequence of events. The Audit Logs MCP server helps by allowing you to query audit logs and generate reports. Common queries include if anything notable happened in a Cloudflare account under a user around a particular time of the day, or identifying whether any users used API keys to perform actions on the account. For example, you can ask “Were there any suspicious changes made to my Cloudflare account yesterday around lunch time?” and obtain the following response:
DNS Analytics server: Optimize DNS performance and debug issues based on current set up
Cloudflare’s DNS Analytics provides detailed insights into DNS traffic, which helps you monitor, analyze, and troubleshoot DNS performance and security across your domains. With Cloudflare’s DNS Analytics MCP server, you can review DNS configurations across all domains in your account, access comprehensive DNS performance reports, and receive recommendations for performance improvements. By leveraging documentation, the MCP server can help identify opportunities for improving performance.
Digital Experience Monitoring server: Get quick insight on critical applications for your organization
Cloudflare Digital Experience Monitoring (DEM) was built to help network professionals understand the performance and availability of their critical applications from self-hosted applications like Jira and Bitbucket to SaaS applications like Figma or Salesforce. The Digital Experience Monitoring MCP server fetches DEM test results to surface performance and availability trends within your Cloudflare One deployment, providing quick insights on users, applications, and the networks they are connected to. You can ask questions like: Which users had the worst experience? What times of the day were applications most and least performant? When do I see the most HTTP status errors? When do I see the shortest, longest, or most instability in the network path?
CASB server: Insights from SaaS Integrations
Cloudflare CASB provides the ability to integrate with your organization’s SaaS and cloud applications to discover assets and surface any security misconfigurations that may be present. A core task is helping security teams understand information about users, files, and other assets they care about that transcends any one SaaS application. The CASB MCP server can explore across users, files, and the many other asset categories to help understand relationships from data that can exist across many different integrations. A common query may include “Tell me about “Frank Meszaros” and what SaaS tools they appear to have accessed”.
Get started with our MCP servers
You can start using our Cloudflare MCP servers today! If you’d like to read more about specific tools available in each server, you can find them in our public GitHub repository. Each server is deployed to a server URL, such as
https://observability.mcp.cloudflare.com/sse.
If your MCP client has first class support for remote MCP servers, the client will provide a way to accept the server URL directly within its interface. For example, if you are using claude.ai, you can:
Navigate to your settings and add a new “Integration” by entering the URL of your MCP server
Authenticate with Cloudflare
Select the tools you’d like claude.ai to be able to call
If your client does not yet support remote MCP servers, you will need to set up its respective configuration file (mcp_config.json) using mcp-remote to specify which servers your client can access.
While we’re launching with these initial 13 MCP servers, we are just getting started! We want to hear your feedback as we shape existing and build out more Cloudflare MCP servers that unlock the most value for your teams leveraging AI in their daily workflows. If you’d like to provide feedback, request a new MCP server, or report bugs, please raise an issue on our GitHub repository.
Building your own MCP server?
If you’re interested in building your own servers, we’ve discovered valuable best practices that we’re excited to share with you as we’ve been building ours. While MCP is really starting to gain momentum and many organizations are just beginning to build their own servers, these principals should help guide you as you start building out MCP servers for your customers.
An MCP server is not our entire API schema: Our goal isn’t to build a large wrapper around all of Cloudflare’s API schema, but instead focus on optimizing for specific jobs to be done and reliability of the outcome. This means while one tool from our MCP server may map to one API, another tool may map to many. We’ve found that fewer but more powerful tools may be better for the agent with smaller context windows, less costs, a faster output, and likely more valid answers from LLMs. Our MCP servers were created directly by the product teams who are responsible for each of these areas of Cloudflare – application development, security and performance – and are designed with user stories in mind. This is a pattern you will continue to see us use as we build out more Cloudflare servers.
Specialize permissions with multiple servers: We built out several specialized servers rather than one for a critical reason: security through precise permission scoping. Each MCP server operates with exactly the permissions needed for its specific task – nothing more. By separating capabilities across multiple servers, each with its own authentication scope, we prevent the common security pitfall of over-privileged access.
Add robust server descriptions within parameters: Tool descriptions were core to providing helpful context to the agent. We’ve found that more detailed descriptions help the agent understand not just the expected data type, but also the parameter’s purpose, acceptable value ranges, and impact on server behavior. This context allows agents to make intelligent decisions about parameter values rather than providing arbitrary and potentially problematic inputs, allowing your natural language to go further with the agent.
Using evals at each iteration: For each server, we implemented evaluation tests or “evals” to assess the model’s ability to follow instructions, select appropriate tools, and provide correct arguments to those tools. This gave us a programmatic way to understand if any regressions occurred through each iteration, especially when tweaking tool descriptions.
Ready to start building? Click the button below to deploy your first remote MCP server to production:
Or check out our documentation to learn more! If you have any questions or feedback for us, you can reach us via email at [email protected] or join the chatter in the Cloudflare Developers Discord.
Today, we’re excited to collaborate with Anthropic, Asana, Atlassian, Block, Intercom, Linear, PayPal, Sentry, Stripe, and Webflow to bring a whole new set of remote MCP servers, all built on Cloudflare, to enable Claude users to manage projects, generate invoices, query databases, and even deploy full stack applications — without ever leaving the chat interface.
Since Anthropic’s introduction of the Model Context Protocol (MCP) in November, there’s been more and more excitement about it, and it seems like a new MCP server is being released nearly every day. And for good reason! MCP has been the missing piece to make AI agents a reality, and helped define how AI agents interact with tools to take actions and get additional context.
But to date, end-users have had to install MCP servers on their local machine to use them. Today, with Anthropic’s announcement of Integrations, you can access an MCP server the same way you would a website: type a URL and go.
At Cloudflare, we’ve been focused on building out the tooling that simplifies the development of remote MCP servers, so that our customers’ engineering teams can focus their time on building out the MCP tools for their application, rather than managing the complexities of the protocol. And if you’re wondering just how easy is it to deploy a remote MCP server on Cloudflare, we’re happy to tell you that it only takes one click to get an MCP server — pre-built with support for the latest MCP standards — deployed.
But you don’t have to take our word for it, see it for yourself! Industry leaders are taking advantage of the ease of use to deliver new AI-powered experiences to their users by building their MCP servers on Cloudflare and now, you can do the same — just click “Deploy to Cloudflare” to get started.
Keep reading to learn more about the new capabilities that these companies are unlocking for their users and how they were able to deliver them. Or, see it in action by joining us for Demo Day on May 1 (today) at 10:00 AM PST.
We’re also making Cloudflare’s remote MCP servers available to customers today and sharing what we learned from building them out.
MCP: Powering the next generation of applications
It wasn’t always the expectation that every service, whether a store, real estate agent, or service would have a website. But as more people gained access to an Internet connection, that quickly became the case.
We’re in the midst of a similar transition now to every web user having access to AI tools, turning to them for many tasks. If you’re a developer, it’s likely the case that the first place you turn when you go to write code now is to a tool like Claude. It seems reasonable then, that if Claude helped you write the code, it would also help you deploy it.
Or if you’re not a developer, if Claude helped you come up with a recipe, that it would also help you order the required groceries.
With remote MCP, all of these scenarios are now possible. And just like the first businesses built on the web had a first mover advantage, the first businesses to be built in an MCP-forward way are likely to reap the benefits.
The faster a user can experience the value of your product, the more likely they will be to succeed, upgrade, and continue to use your product. By connecting services to agents through MCP, users can simply ask for what they need and the agent will handle the rest, getting them to that “aha” moment faster.
Making your service AI-first with MCP
Businesses that adopt MCP will quickly see the impact:
Lower the barrier to entry
Not every user has the time to learn your dashboard or read through documentation to understand your product. With MCP, they don’t need to. They just describe what they want, and the agent figures out the rest.
Create personalized experiences
MCP can keep track of a user’s requests and interactions, so future tool calls can be adapted to their usage patterns and preferences. This makes it easy to deliver more personalized, relevant experiences based on how each person actually uses your product.
Drive upgrades naturally
Rather than relying on feature comparison tables, the AI agent can explain how a higher-tier plan helps a specific user accomplish their goals.
Ship new features and integrations
You don’t need to build every integration or experience in-house. By exposing your tools via MCP, you let users connect your product to the rest of their stack. Agents can combine tools across providers, enabling integrations without requiring you to support every third-party service directly.
We’re continuing to ship updates regularly — adding support for the latest changes to the MCP standard and making it even easier to get your server to production:
Supporting the new Streamable HTTP transport: Your MCP servers can now use the latest Streamable HTTP transport alongside SSE, ensuring compatibility with the latest standards. We’ve updated the AI Playground and mcp-remote proxy as well, giving you a remote MCP client to easily test the new transport.
Python support for MCP servers: You can now build MCP servers on Cloudflare using Python, not just JavaScript/TypeScript.
Improved docs, starter templates, and deploy flows: We’ve added new quickstart templates, expanded our documentation to cover the new transport method, and shared best practices for building MCP servers based on our learnings.
But rather than telling you, we thought it would be better to show you what our customers have built and why they chose Cloudflare for their MCP deployment.
Remote MCP servers you can connect to today
Asana
Today, work lives across many different apps and services. By investing in MCP, Asana can meet users where they are, enabling agent-driven interoperability across tools and workflows. Users can interact with the Asana Work Graph using natural language to get project updates, search for tasks, manage projects, send comments, and update deadlines from an MCP client.
Users will be able to orchestrate and integrate different pieces of work seamlessly — for example, turning a project plan or meeting notes from another app into a fully assigned set of tasks in Asana, or pulling Asana tasks directly into an MCP-enabled IDE for implementation. This flexibility makes managing work across systems easier, faster, and more natural than ever before.
To accelerate the launch of our first-party MCP server, Asana built on Cloudflare’s tooling, taking advantage of the foundational infrastructure to move quickly and reliably in this fast-evolving space.
“At Asana, we’ve always focused on helping teams coordinate work effortlessly. MCP connects our Work Graph directly to AI tools like Claude.ai, enabling AI to become a true teammate in work management. Our integration transforms natural language into structured work – creating projects from meeting notes or pulling updates into AI. Building on Cloudflare’s infrastructure allowed us to deploy quickly, handling authentication and scaling while we focused on creating the best experience for our users.” – Prashant Pandey, Chief Technology Officer, Asana
Jira and Confluence Cloud customers can now securely interact with their data directly from Anthropic’s Claude app via the Atlassian Remote MCP Server in beta. Hosted on Cloudflare infrastructure, users can summarize work, create issues or pages, and perform multi-step actions, all while keeping data secure and within permissioned boundaries.
Users can access information from Jira and Confluence wherever they use Claude to:
Summarize Jira work items or Confluence pages
Create Jira work items or Confluence pages directly from Claude
Get the model to take multiple actions in one go, like creating issues or pages in bulk
Enrich Jira work items with context from many different sources to which Claude has access
And so much more!
“AI is not one-size-fits-all and we believe that it needs to be embedded within a team’s jobs to be done. That’s why we’re so excited to invest in MCP and meet teams in more places where they already work. Hosting on Cloudflare infrastructure means we can bring this powerful integration to our customers faster and empower them to do more than ever with Jira and Confluence, all while keeping their enterprise data secure. Cloudflare provided everything from OAuth to out-of-the-box remote MCP support so we could quickly build, secure, and scale a fully operational setup.” — Taroon Mandhana, Head of Product Engineering, Atlassian
At Intercom, the transformative power of AI is becoming increasingly clear. Fin, Intercom’s AI Agent, is now autonomously resolving over 50% of customer support conversations for leading companies such as Anthropic. With MCP, connecting AI to internal tools and systems is easier than ever, enabling greater business value.
Customer conversations, for instance, offer valuable insights into how products are being used and the experiences customers are having. However, this data is often locked within the support platform. The Intercom MCP server unlocks this rich source of customer data, making it accessible to anyone in the organization using AI tools. Engineers, for example, can leverage conversation history and user data from Intercom in tools like Cursor or Claude Code to diagnose and resolve issues more efficiently.
“The momentum behind MCP is exciting. It’s making it easier and easier to connect assistants like Claude.ai and agents like Fin to your systems and get real work done. Cloudflare’s toolkit is accelerating that movement even faster. Their clear documentation, purpose-built tools, and developer-first platform helped Intercom go from concept to production in under a day, making the Intercom MCP server launch effortless. We’ll be encouraging our customers to leverage Cloudflare to build and deploy their own MCP servers to securely and reliably connect their internal systems to Fin and other clients.” — Jordan Neill, SVP Engineering, Intercom
Linear
The Linear MCP server allows users to bring the context of their issues and product development process directly into AI assistants when it’s needed. Whether that is refining a product spec in Claude, collaborating on fixing a bug with Cursor, or creating issues on the fly from an email.
“We’re building on Cloudflare to take advantage of their frameworks in this fast-moving space and flexible, fast, compute at the edge. With MCP, we’re bringing Linear’s issue tracking and product development workflows directly into their AI tools of choice, eliminating context switching for teams. Our goal is simple: let developers and product teams access their work where they already are—whether refining specs in Claude, debugging in Cursor, or creating issues from conversations. This seamless integration helps our customers stay in flow and focused on building great products” — Tom Moor, Head of US Engineering, Linear
“MCPs represent a new paradigm for software development. With PayPal’s remote MCP server on Cloudflare, now developers can delegate to an agent with natural language to seamlessly integrate with PayPal’s portfolio of commerce capabilities. Whether it’s managing inventory, processing payments, tracking shipping, handling refunds, AI agents via MCP can tap into these capabilities to autonomously execute and optimize commerce workflows. This is a revolutionary development for commerce, and the best part is, developers can begin integrating with our MCP server on Cloudflare today.” – Prakhar Mehrotra, SVP of Artificial Intelligence, PayPal
With the Sentry MCP server, developers are able to query Sentry’s context right from their IDE, or an assistant like Claude, to get errors and issue information across projects or even for individual files.
Developers can also use the MCP to create projects, capture setup information, and query project and organization information – and use the information to set up their applications for Sentry. As we continue to build out the MCP further, we’ll allow teams to bring in root cause analysis and solution information from Seer, our Agent, and also look at simplifying instrumentation for sentry functionality like traces, and exception handling.
Hosting this on Cloudflare and using Remote MCP, we were able to sidestep a number of the complications of trying to run locally, like scaling or authentication. Remote MCP lets us leverage Sentry’s own OAuth configuration directly. Durable Object support also lets us maintain state within the MCP, which is important when you’re not running locally.
“Sentry’s commitment has always been to the developer, and making it easier to keep production software running stable, and that’s going to be even more true in the AI era. Developers are utilizing tools like MCP to integrate their stack with AI models and data sources. We chose to build our MCP on Cloudflare because we share a vision of making it easier for developers to ship software, and are both invested in ensuring teams can build and safely run the next generation of AI agents. Debugging the complex interactions arising from these integrations is increasingly vital, and Sentry provides the essential visibility needed to rapidly diagnose and resolve issues. MCP integrates this crucial Sentry context directly into the developer workflow, empowering teams to consistently build and deploy reliable applications.” — David Cramer, CPO and Co-Founder, Sentry
Square’s APIs are a comprehensive set of tools that help sellers take payments, create and track orders, manage inventory, organize customers, and more. Now, with a dedicated Square MCP server, sellers can enlist the help of an AI agent to build their business on Square’s entire suite of API resources and endpoints. By integrating with AI agents like Claude and codename goose, sellers can craft sophisticated, customized use cases that fully utilize Square’s capabilities, at a lower technical barrier.
“MCP is emerging as a new AI interface. In the near-future, MCP may become the default way, or in some cases the only way, people, businesses, and code discover and interact with services. With Stripe’s agent toolkit and Cloudflare’s Agent SDK, developers can now monetize their MCPs with just a few lines of code.” — Jeff Weinstein, Product Lead at Stripe
Webflow
The Webflow MCP server supports CMS management, auditing and improving SEO, content localization, site publishing, and more. This enables users to manage and improve their site directly from their AI agent.
“We see MCP as a new way to interact with Webflow that aligns well with our mission of bringing development superpowers to everyone. MCP is not just a different surface over our APIs, instead we’re thinking of it in terms of the actions it supports: publish a website, create a CMS collection, update content, and more. MCP lets us expose those actions in a way that’s discoverable, secure, and deeply contextual. It opens the door to new workflows where AI and humans can work side-by-side, without needing to cobble together solutions or handle low-level API details. Cloudflare supports this aim by offering the reliability, performance, and developer tooling we need to build modern web infrastructure. Their support for remote MCP servers is mature and well-integrated, and their approach to authentication and durability aligns with how we think about the scale and security of these offerings.” — Utkarsh Sengar, VP of Engineering, Webflow
If you’re looking to build a remote MCP server for your service, get started with our documentation, watch the tutorial below, or use the button below to get a starter remote MCP server deployed to production. Once the remote MCP server is deployed, it can be used from Claude, Cloudflare’s AI playground, or any remote MCP client.
In addition, we launched a new YouTube video walking you through building MCP servers, using two of our MCP templates.
If you have any questions or feedback for us, you can reach us via email at [email protected].
As we conclude Developer Week 2025, we’re proud to reflect upon the capabilities we’ve added to our developer platform. It’s so rewarding to deliver products, features and tools that help developers build smarter and ship faster, and even more so hearing your responses throughout the week!
Our VP of Product, Rita Kozlov, kicked off Developer Week 2025 discussing the ever-evolving landscape of development, particularly in the age of AI. AI is no longer just a buzzword or a trope for a science-fiction future — in the realm of modern development, it’s a core tenet (and utility) of how we build, innovate, and solve problems. It’s influencing how and how frequently we ship code, as well as enabling anyone to write it.
It’s exciting to not only witness this technical revolution, but also to be building a platform that enables developers to be part of it. We want to hear your feedback and see what you build with the new capabilities — reach out to us on Discord or X.
Here’s a recap of our Developer Week 2025 announcements:
Toolkit for AI agents includes new Agents SDK support for MCP (Model Context Protocol) clients, authentication/authorization/hibernation for MCP servers, and Durable Objects free tier.
Fully managed Retrieval-Augmented Generation (RAG) pipelines powered by Cloudflare’s global network and developer platform simplifies how you build and scale RAG pipelines to power your context-aware AI and search applications.
Workflows — a durable execution engine built directly on top of Workers — is Generally Available and production-ready with new human-in-the-loop capabilities, more scale, and more metrics.
Workers connect to your MySQL databases with Hyperdrive to deliver optimal performance for regional databases, with support for your favorite drivers and ORMs.
The Cloudflare Vite plugin integrates Vite, one of the most popular build tools for web development, with the Workers runtime. We announced the 1.0 release and official support for React Router v7.
You can now deploy static sites, full-stack, and stateful applications on Cloudflare Workers — the primitives are all here. Framework support for React Router v7, Astro, Vue, and more are generally available today, as is the Cloudflare Vite plugin.
We announced Cloudflare Realtime and RealtimeKit, a complete toolkit for shipping real-time audio and video apps in days with SDKs for Kotlin, React Native, Swift, JavaScript, and Flutter.
Securely store, manage, and deploy account level secrets to Cloudflare Workers through Cloudflare Secrets Store, available in beta — with role-based access control, audit logging, and Wrangler support.
Workers Observability powers up with General Availability of Workers Logs and new Query Builder to help you investigate log events across all of your Workers.
Cloudflare has been tracking and comparing our speed with other top networks since 2021. We take a look at how things have changed since our last update.
We’ve just shipped our new streaming ingestion service, Pipelines. And, we’ve acquired Arroyo, enabling us to bring new SQL-based, stateful transformations to Pipelines and R2.
We re-architected Super Slurper from the ground up using our Developer Platform — leveraging Cloudflare Workers, Durable Objects, and Queues — and improved transfer speeds to R2 by up to 5x.
We’re announcing Workers VPC: a global private network that allows applications deployed on Cloudflare Workers to connect to your legacy cloud infrastructure. Now, you can unlock access to your existing APIs and data in external clouds and build global, modern, cross-cloud apps on Workers.
Cloudflare’s Startup Program offers up to \$250,000 in credits for companies building on our Developer Platform across 4 tiers: \$5,000, \$25,000, \$100,000, and \$250,000.
Cloudflare Containers are coming this June. Run new types of workloads on our network with an experience that is simple, scalable, global and deeply integrated with Workers.
Workers AI inference is faster with speculative decoding & prefix caching. Use our new batch inference for handling large request volumes seamlessly. Build tailored AI apps with more LoRA options. Lastly, new models and a refreshed dashboard round out this Developer Week update for Workers AI.
Cloudflare replaced a queues-based architecture in our National Center for Missing & Exploited Children (NCMEC) reporting system with Cloudflare Workflows for a structured, retryable workflow that’s easier to debug and maintain.
With recent developments in Certificate Transparency (CT), Cloudflare built a next-generation CT log on top of Cloudflare’s Developer Platform.
Even though 2025 Developer Week has come to a close, we can’t wait to hear what you’re building and hope you’ll share it with us on X or Discord. If you’re looking to get started, check out our developer documentation.
During Cloudflare’s Birthday Week in September 2024, we introduced a revamped Startup Program designed to make it easier for startups to adopt Cloudflare through a new credits system. This update focused on better aligning the program with how startups and developers actually consume Cloudflare, by providing them with clearer insight into their projected usage, especially as they approach graduation from the program.
Today, we’re excited to announce an expansion to that program: new credit tiers that better match startups at every stage of their journey. But before we dive into what’s new, let’s take a quick look at what the Startup Program is and why it exists.
A refresher: what is the Startup Program?
Cloudflare for Startups provides credits to help early-stage companies build the next big idea on our platform. Startups accepted into the program receive credits valid for one year or until they’re fully used, whichever comes first.
Beyond credits, the program includes access to up to three domains with enterprise-level services, giving startups the same advanced tools we provide to large companies to protect and accelerate their most critical applications.
We know that building a startup is expensive, and Cloudflare is uniquely positioned to support the full-stack needs of modern applications. Our goal is simple: ensure that you have access to the best of Cloudflare’s global network, without the barriers of cost or availability.
Since launching the revamped credits system in September, we’ve learned a lot from the startups in our program, including what they’re building, what they need, and where they need more flexibility. One of the most common requests was more credit tier options.
That’s why we’re introducing new tiers that provide even more options to startups as they scale.
Introducing additional credit tiers
The Cloudflare for Startups Program now offers four credit tiers:
Credit Amount
$5,000
$25,000
$100,000
$250,000
Stage
Bootstrapped, stealth startups
Up-and-coming startups
Seed-funded startups
Tier 1 startups
Description
For startups who are just getting started. This tier is great for building, testing, and iterating your product.
For startups with early adopters and proving product market fit.
For startups that have raised capital, and are experiencing high growth.
For scaling startups that belong to our Tier 1 VC and accelerator network, are building a mission-critical AI application, or are participating in our Workers Launchpad Program.
Criteria
Building a software-based product or service
Founded in the last 5 years
Valid and matching email address
$5,000 criteria plus:
Active LinkedIn
Funded up to $1M
$25,000 criteria plus:
Funded between $1M and $5M
Belong to any of our 250+ approved VC or Accelerator partners
$100,000 criteria plus:
High growth / AI companies, OR
Tier 1 VC & Accelerators
These tiers are designed to offer simplicity and clarity by aligning with where you are in your growth journey. (You can check out eligibility criteria and apply to the Startup Program here). These tiers are still subject to the same Cloudflare for Startups Terms of Service. Credits are valid for up to one year or when all credits are consumed (whichever comes first).
Why are we adding additional credit tiers?
We understand that each startup may have different needs depending on where they’re at in their journey. Some are just getting off the ground, others are scaling rapidly, and each has unique infrastructure needs. With this expansion, we’re reaffirming Cloudflare’s commitment to startups of all sizes, making it easier for you to access the right level of support and resources, exactly when you need them.
Whether you’re launching your MVP or preparing for your next funding round, Cloudflare is here to help you grow.
What can I use the credit tiers for?
The vast majority of Cloudflare products (including all products found on the pay-as-you-go plans) can be used on the Startup Program. Beyond going to the website to see what products are included, below are a few examples of what you can use your credits for:
Build AI applications
Store your training data in R2, build AI-powered agents (via Agents SDK) that autonomously perform tasks with Durable Objects and Workers, or use one of over 50 models to run inference tasks on Cloudflare’s global network.
Create immersive realtime experiences
Deliver live audio and video via our Realtime Kit, enhance the experience with an AI-powered chatbot running on Workers AI to transcribe the call, broadcast to large audiences with Stream.
Build durable multi-step applications
Design and run long-lived, multi-step processes like onboarding flows, document processing, or order fulfillment. Use Workflows to coordinate logic across Workers, Durable Objects, Queues, and AI tasks. Easily handle retries, timeouts, and state management without complex orchestration infrastructure.
What are startups saying about Cloudflare?
Webstudio’s no-code platform is powered by Cloudflare’s Developer Platform
“From a modern design tool, you’d expect real-time collaborative features and would like to have resources as close to users as possible. Since betting on the Developer Platform architecture, Cloudflare has done more for us than any other vendor out there!” – Oleg Isonen (Founder & CEO)
GrackerAI’s cybersecurity research engine runs on Cloudflare’s AI and serverless architecture
“Cloudflare’s fusion of edge computing and AI empowers developers to deploy and utilize AI models with unprecedented efficiency and scale, marking a significant leap forward in how we build and interact with intelligent systems.” – Deepak Gupta (Co-founder & CEO)
Render Better powers faster ecommerce experiences with Cloudflare Workers
“Each month Render Better optimizes billions of monthly requests for ecommerce visitors, delivering faster loading sites that make top brands millions more in revenue. We’re able to scale up with Cloudflare’s serverless workers, handling every request at the network edge within milliseconds, thanks to the rock solid, DX-friendly scope of the Developer Platform.” – James Koshigoe (Co-founder & CEO)
What will you build on Cloudflare?
We can’t wait to see what you will build on Cloudflare. Apply here to take advantage of the Cloudflare for Startups Program.
With quick access to flexible infrastructure and innovative AI tools, startups are able to deploy production-ready applications with speed and efficiency. Cloudflare plays a pivotal role for countless applications, empowering founders and engineering teams to build, scale, and accelerate their innovations with ease — and without the burden of technical overhead. And when applicable, initiatives like our Startup Program and Workers Launchpad offer the tooling and resources that further fuel these ambitious projects.
Cloudflare recently announcedAI agents, allowing developers to leverage Cloudflare to deploy agents to complete autonomous tasks. We’re already seeing some great examples of startups leveraging Cloudflare as their platform of choice to invest in building their agent infrastructure. Read on to see how a few up-and-coming startups are building their AI agent platforms, powered by Cloudflare.
Lamatic AI built a scalable AI agent platform using Workers for Platform
Founded in 2023, Lamatic.ai empowers SaaS startups to seamlessly integrate intelligent AI agents into their products. Lamatic.ai simplifies the deployment of AI agents by offering a fully managed lifecycle with scalability and security in mind. SaaS providers have been leveraging Lamatic to replatform their AI workflows via a no-code visual builder to reduce technical debt and ship products faster. Designed for high availability, scalability, and low latency, Lamatic’s architecture enables developers to build AI-driven applications that remain performant under heavy load. After acquiring a high amount of users in a short amount of time on Product Hunt, Lamatic identified there was real interest to solve complex problems with AI Agents, and the team knew they needed to build a solution with scalability and performance in mind.
Cloudflare plays a key role in supporting Lamatic’s growth. Powered by Cloudflare Workers, Lamatic ensures requests process closer to end users, minimizing latency while offloading computational strain from centralized servers. In just a few months, Lamatic.ai has efficiently scaled to over three million serverless requests per month, supporting over 1,000 customers — all managed by a lean three-person team.
Customers design their Agent Flows through a no-code visual builder, which generates an interoperable YAML configuration. Sensitive credentials such as API keys and model access tokens are securely encrypted and stored in Workers KV, ensuring they are only decrypted at runtime for enhanced security. All YAML configurations are then compiled into a Workers-compatible JavaScript bundle. When a project is deployed, Lamatic orchestrates critical components like sync jobs for scheduled data ETL operations and incoming webhooks to handle event-driven workflows via Cloudflare Queues. Once deployed, the project is fully operational as a Cloudflare Worker with an exposed API endpoint, allowing customers to integrate AI-powered automation directly into their applications with minimal friction.
To scale out their platform, Lamatic.ai built their architecture isolating serverless and AI logic on a per-customer basis. Rather than batching requests into a centralized cluster, Lamatic.ai distributes workloads across Cloudflare’s global network, ensuring each customer and endpoint is served by its own Worker executing dedicated logic. This per-customer deployment model — enabled by Workers for Platforms— allows Lamatic.ai to deliver customer-specific serverless functions at scale, and reduces technical overhead as they onboard additional customers. Each customer gets a dedicated Worker whose request and rate limits are enabled based on their level of subscription.
Beyond request processing, Lamatic uses Cloudflare Workers KV as a distributed config store to ensure high availability and security. All values are encrypted at rest with AES-256-GCM and decrypted only at runtime, keeping operations both secure and low-latency. Tokens and user credentials are encrypted and stored in the database and KV.
To further enhance performance, Cloudflare Queues plays a key role in orchestrating task completion. Lamatic uses Queues to offload work from Workers requests, and handle tasks such as webhooks and coordinating distributed processes, both essential for maintaining system consistency and reliability at scale. While Workers handle sync requests at point of execution, longer running jobs process via Queues. For example, during a scheduled ETL sync, new data records generated are stored as a message queue on Cloudflare Pub/Sub. A consumer Worker collects these messages and makes an API request to the pod using the Workers Queue. The consumer Worker consumes more messages as each queue is finished processing.
Another example of where this has been optimal is for managing AI workflows. Many AI workflows involve concurrent requests to multiple data sources, Queues streamlines data processing and efficiently feeds information into customers’ Retrieval Augmented Generation (RAG) workflows. This approach smooths out workload spikes, reduces bottlenecks, and ensures that AI agents can reliably aggregate and process data without delays.
Beyond this, Lamatic.ai offers Workers AI as one of the support inference providers that customers can use across their platform. Customers can choose to run one of the many open source models hosted on Workers AI, depending on their use case (chatbot, image generation, voice, etc.). Together, these layers solve the challenges of scaling AI agents by handling high volumes of data, maintaining low-latency responses, and ensuring robust security. With Cloudflare’s infrastructure as its backbone, Lamatic.ai has built a resilient and high-performing platform that meets the rigorous demands of modern AI applications, making it an ideal choice for startups embedding AI-driven features into their products.
Skyward AI automates compliance using AI agents with Durable Objects and agents
Skyward AI is transforming compliance operations by leveraging Cloudflare’s serverless computing capabilities to build AI-driven compliance agents that streamline critical tasks like evidence collection, real-time risk analysis, and policy updates. Compliance teams in fintech, supply chain, and other highly regulated industries use these AI Agents to extract and organize evidence, provide real-time recommendations, and orchestrate policy and procedural updates automatically. By handling document parsing, risk monitoring, and policy enforcement, these AI Agents reduce the risk of human error while allowing compliance professionals to focus on high-value tasks.
Skyward has built an AI agents platform designed with a serverless-first approach, avoiding the constraints of centralized cloud computing. To achieve this, the company leverages Cloudflare’s Developer Platform to create and maintain a highly responsive and scalable infrastructure. Workers handle incoming requests like chat inputs, compliance checks, or authentication, and route them efficiently across multiple geographies. Skyward initially built their AI agents infrastructure using Durable Objects,Workflows and JavaScript-native RPC for AI coordination, but has recently transitioned to Cloudflare’s new AI agents framework. Given that agents provides a framework for building and orchestrating AI agents, the migration has helped Skyward abstract the need to manage Durable Objects manually, significantly reducing time spent on managing these tools. While this release is fairly recent, the transition has helped simplify the way that agents communicate, but it also preserved the benefits of their original design like data privacy, isolation, and concurrency management. This has also made it easier to provide real-time feedback and responses to their end users.
Skyward optimizes real-time compliance automation by achieving sub-100 ms response times for AI agent queries. Workloads are structured to minimize unnecessary network round-trips, and a sync-engine approach proactively preloads and pushes data to clients, delivering a highly responsive user experience. To proxy AI inference, Skyward uses AI Gateway to provide observability into usage, performance, and costs across multiple vendors, improving their AI operational efficiency. Leveraging Cloudflare’s serverless Developer Platform has allowed Skyward to simplify their architecture while supporting global availability, avoiding the need for Kubernetes clusters or complex locking mechanisms. The team also avoids the burden of managing regional deployments, as Cloudflare’s multi-region support ensures consistent performance worldwide without added operational complexity.
State management is a critical component to execute agentic workflows. Each compliance session runs within a dedicated Durable Object, which keeps relevant data close to the execution layer. This setup minimizes database round-trips and ensures that tasks like Anti-Money Laundering (AML) checks, Know Your Business (KYB) validation, and document processing remain efficient. Once a compliance session is complete, the system summarizes and stores the relevant information in Postgres and R2, optimizing memory usage without requiring persistent cloud infrastructure.
To balance low-latency operations with long-term storage, Skyward employs a multi-layered data management strategy. The Skyward team, using Hyperdrive, has been able to reduce query latency by nearly 50%, allowing compliance teams to receive immediate feedback. At the company’s core, Skyward’s goal is to offer a platform that is “streamlined for compliance teams”. The team maintains that a speedy feedback loop ensures end customers get the data and responses needed to act. Whether there’s one agent or hundreds of agents processing tasks in parallel, Hyperdrive ensures that database requests to assets like extensive company documentation (i.e. regulations, policies, procedures, internal documents), complex regulatory knowledge graphs, and on-demand context information for conversational workflows are all as performant as possible.
Durable Objects facilitate real-time session state, ensuring AI agents function smoothly without complex locking mechanisms. For larger compliance-related documents, such as legal PDFs and archived data, Cloudflare R2 provides long-term storage, ensuring only frequently accessed information remains readily available. This approach enhances performance while keeping storage management efficient and cost-effective.
Security and scalability remain priorities for compliance-focused AI applications. Skyward enforces strict access controls, ensuring that only authorized users can access development and production environments. Each AI session maintains an auditable log of key events, user actions, and approvals, supporting the ability to export these insights for compliance and legal requirements. Because each agent is deployed in its own instance and has its own database, Skyward ensures that there is a detailed record of every required user, agent interaction, and auditing requirements. On top of this, the ability to deploy and scale globally with Cloudflare’s network has allowed Skyward to maintain consistent, high-performance operations across multiple regions without extensive infrastructure overhead.
Looking ahead, Skyward plans to further enhance AI agent responsiveness by running select models directly on Cloudflare Workers AI, reducing reliance on external inference providers. The team plans to further integrate Workers for Platforms in an effort to better isolate customer data and workflows, giving end users greater control over their compliance automation. As Cloudflare continues to evolve its AI capabilities, Skyward aims to push the boundaries of distributed AI compliance solutions, making regulatory adherence more automated, scalable, and secure.
Building on Cloudflare
We’re inspired by how startups like Lamatic AI and Skyward AI are building their AI agent platforms on Cloudflare. This kind of innovation is why we’re proud to see so many startups trust Cloudflare for a scalable, reliable, and efficient foundation.
We’re also thrilled to share that both Lamatic AI and Skyward AI have been invited to join Cloudflare’s upcoming Workers Launchpad Cohort #5. Speaking of Workers Launchpad, it’s been a few months since our last update — let’s take a look at what’s new.
Thank you to Workers Launchpad Cohort #4, and a warm welcome to Cohort #5
The Workers Launchpad team is blown away by what customers are demonstrating on the Developer Platform. Members of Cohort #4 presented at our bi-annual Demo Day. We had customers demonstrate what they’re building across a multitude of industries, including (of course) AI / ML, developer tools, 3D design, cloud infrastructure, adtech, media, and beyond. It’s incredibly encouraging to see what all these amazing companies are building on the Cloudflare network, and we look forward to continuing to partner with them throughout their startup journey.
Following the Demo Day for Workers Launchpad Cohort #4, we’ve seen the largest influx of applications from startups across the globe eager to join Cohort #5. This next wave of founders is pushing the boundaries of what’s possible, building in areas like AI agents, developer tooling, MCP, media, and beyond. With each new cohort, we’re continually inspired by the caliber of founding teams, the bold ideas they bring to life, and the real-world problems they’re tackling with technology.
Help us give some love and a warm welcome to the participants of Cohort #5:
We can’t wait to share more about what Cohort #5 achieves. Be sure to follow @CloudflareDev on X and join our Developer Discord server to hear updates on the cohorts.
If you’re developing your application on our Developer Platform, we’d love to learn how Cloudflare is powering your journey. Please share more about what you’re building, and our team will be sure to review your submission. And if you’re a startup and interested in joining Workers Launchpad, feel free to apply for Cohort 6 — applications are now open!
Since the launch of Workers AI in September 2023, our mission has been to make inference accessible to everyone.
Over the last few quarters, our Workers AI team has been heads down on improving the quality of our platform, working on various routing improvements, GPU optimizations, and capacity management improvements. Managing a distributed inference platform is not a simple task, but distributed systems are also what we do best. You’ll notice a recurring theme from all these announcements that has always been part of the core Cloudflare ethos — we try to solve problems through clever engineering so that we are able to do more with less.
Today, we’re excited to introduce speculative decoding to bring you faster inference, an asynchronous batch API for large workloads, and expanded LoRA support for more customized responses. Lastly, we’ll be recapping some of our newly added models, updated pricing, and unveiling a new dashboard to round out the usability of the platform.
Speeding up inference by 2-4x with speculative decoding and more
We’re excited to roll out speed improvements to models in our catalog, starting with the Llama 3.3 70b model. These improvements include speculative decoding, prefix caching, an updated inference backend, and more. We’ve previously done a technical deep dive on speculative decoding and how we’re making Workers AI faster, which you can read about here. With these changes, we’ve been able to improve inference times by 2-4x, without any significant change to the quality of answers generated. We’re planning to incorporate these improvements into more models in the future as we release them. Today, we’re starting to roll out these changes so all Workers AI users of @cf/meta/llama-3.3-70b-instruct-fp8-fast will enjoy this automatic speed boost.
What is speculative decoding?
The way LLMs work is by generating text by predicting the next token in a sentence given the previous tokens. Typically, an LLM is able to predict a single future token (n+1) with one forward pass through the model. These forward passes can be computationally expensive, since they need to work through all the parameters of a model to generate one token (e.g., 70 billion parameters for Llama 3.3 70b).
With speculative decoding, we put a small model (known as the draft model) in front of the original model that helps predict n+x future tokens. The draft model generates a subset of candidate tokens, and the original model just has to evaluate and confirm if they should be incorporated into the generation. Evaluating tokens is less computationally expensive, as the model can evaluate multiple tokens concurrently in a forward pass. As such, inference times can be sped up by 2-4x — meaning that users can get responses much faster.
What makes speculative decoding particularly efficient is that it’s able to use unused GPU compute left behind due to the GPU memory bottleneck LLMs create. Speculative decoding takes advantage of the unused compute by squeezing in a draft model to generate tokens faster. This means we’re able to improve the utilization of our GPUs by using them to their full extent without having parts of the GPU sit idle.
What is prefix caching?
With LLMs, there are usually two stages of generation – the first is known as “pre-fill”, which processes the user’s input tokens such as the prompt and context. Prefix caching is aimed at reducing the pre-fill time of a request. As an example, if you were asking a model to generate code based on a given file, you might insert the whole file into the context window of a request. Then, if you want to make a second request to generate the next line of code, you might send us the whole file again in the second request. Prefix caching allows us to cache the pre-fill tokens so we don’t have to process the context twice. With the same example, we would only do the pre-fill stage once for both requests, rather than doing it per request. This method is especially useful for requests that reuse the same context, such as Retrieval Augmented Generation (RAG), code generation, chatbots with memory, and more. Skipping the pre-fill stage for similar requests means faster responses for our users and more efficient usage of resources.
How did you validate that quality is preserved through these optimizations?
Since this is an in-place update to an existing model, we were particularly cautious in ensuring that we would not break any existing applications with this update. We did extensive A/B testing through a blind arena with internal employees to validate the model quality, and we asked internal and external customers to test the new version of the model to ensure that response formats were compatible and model quality was acceptable. Our testing concluded that the model performed up to standards, with people being extremely excited about the speed of the model. Most LLMs are not perfectly deterministic even with the same set of inputs, but if you do notice something off, please let us know through Discord or X.
Asynchronous batch API
Next up, we’re announcing an asynchronous (async) batch API which is helpful for users of large workloads. This feature allows customers to receive their inference responses asynchronously, with the promise that the inference will be completed at a later time rather than immediately erroring out due to capacity.
An example use case of batch workloads is people generating summaries of a large number of documents. You probably don’t need to use those summaries immediately, as you’ll likely use them once the whole document is complete versus one paragraph at a time. For these use cases, we’ve made it super simple for you to start sending us these requests in batches.
Why batch requests?
From talking to our customers, the most common use case we hear about is people creating embeddings or summarizing a large number of documents. Unfortunately, this is also one of the hardest use cases to manage capacity for as a serverless platform.
To illustrate this, imagine that you want to summarize a 70 page PDF. You typically chunk the document and then send an inference request for each chunk. If each chunk is a few paragraphs on a page, that means that we receive around 4 requests per page multiplied by 70 pages, which is about 280 requests. Multiply that by tens or hundreds of documents, and multiply that by a handful of concurrent users — this means that we get a sudden massive influx of thousands of requests when users start these large workloads.
The way we originally built Workers AI was to handle incoming requests as quickly as possible, assuming there’s a human on the other side that needed an immediate response. The unique thing about batch workloads is that while they’re not latency sensitive, they do require completeness guarantees — you don’t want to come back the next day to realize none of your inference requests actually executed.
With the async API, you send us a batch of requests, and we promise to fulfill them as fast as possible and return them to you as a batch. This guarantees that your inference request will be fulfilled, rather than immediately (or eventually) erroring out. The async API also benefits users who have real-time use cases, as the model instances won’t be immediately consumed by these batch requests that can wait for a response. Inference times will be faster since there won’t be a bunch of competing requests in a queue waiting to reach the inference servers.
We have select models that support batch inference today, which include:
Users can send a batch request to supported models by passing a flag:
let res = await env.AI.run("@cf/meta/llama-3.3-70b-instruct-batch", {
  "requests": [{
    "prompt": "Explain mechanics of wormholes"
  }, {
    "prompt": "List different plant species found in America"
  }]
}, {
  queueRequest: true
});
Check out our developer docs to learn more about the batch API, or use our template to deploy a worker that implements the batch API.
Today, our batch API can be used by sending us an array of requests, and we’ll return your responses in an array. This is helpful for use cases like summarizing large amounts of data that you know beforehand. This means you can send us a single HTTP request with all of your requests, and receive a single HTTP request back with your responses. You can check on the status of the batch by polling it with the request ID we return when your batch is submitted. For the next iteration of our async API, we plan to allow queue-based inputs and outputs, where you push requests and pull responses from a queue. This will integrate tightly with Event Notifications and Workflows, so you can execute subsequent actions upon receiving a response.
iterated on this and now support 8 models as well as larger ranks of up to 32 and LoRA files up to 500 MB. Models that support LoRA inference now include:
In essence, a Low Rank Adaptation (LoRA) adapter allows people to take a trained adapter file and use it in conjunction with a model to alter the response of a model. We did a deep dive on LoRAs in our Birthday Week blog post, which goes into further technical detail. LoRA adapters are great alternatives to fine-tuning a model, as it isn’t as expensive to train and adapters are much smaller and more portable. They are also effective enough to tweak the output of a model to fit a certain style of response.
How do I get started?
To get started, you first need to train your own LoRA adapter or find a public one on HuggingFace. Then, you’ll upload the adapter_model.safetensors and adapter_config.json to your account with the documented wrangler commands or through the REST API. LoRA files are private and scoped to your own account. After that, you can start running fine-tuned inference — check out our LoRA developer docs to get started.
const response = await env.AI.run(
  "@cf/qwen/qwen2.5-coder-32b-instruct", //the model supporting LoRAs
  {
      messages: [{"role": "user", "content": "Hello world"}],
      raw: true, //skip applying the default chat template
      lora: "00000000-0000-0000-0000-000000000", //the finetune id OR finetune name
  }
);
Quality of life improvements: updated pricing and a new dashboard for Workers AI
While the team has been focused on large engineering milestones, we’ve also landed some quality of life improvements over the last few months. In case you missed it, we’ve announced an updated pricing model where usage will be shown in units such as tokens, audio seconds, image size/steps, etc. but still billed in neurons in the backend.
Today, we’re unveiling a new dashboard that allows users to see their usage in both units as well as neurons (built on new Workers Observability components!). Model pricing is also available via dashboard and developer docs on the models page. And if you use AI Gateway, Workers AI usage will also be displayed as metrics now.
New models available in Workers AI
Lastly, we’ve steadily been adding new models on Workers AI, with over 10 new models and a few updates on existing models. Pricing is also now listed directly on the model page in the developer docs. To summarize, here are the new models we’ve added on Workers AI, including four new ones we’re releasing today:
@cf/baai/bge-m3: a multi-lingual embeddings model that supports over 100 languages. It can also simultaneously perform dense retrieval, multi-vector retrieval, and sparse retrieval, with the ability to process inputs of different granularities.
@cf/baai/bge-reranker-base: our first reranker model! Rerankers are a type of text classification model that takes a query and context, and outputs a similarity score between the two. When used in RAG systems, you can use a reranker after the initial vector search to find the most relevant documents to return to a user by reranking the outputs.
@cf/openai/whisper-large-v3-turbo: a faster, more accurate speech-to-text model. This model was added earlier but is graduating out of beta with pricing included today.
@cf/myshell-ai/melotts: our first text-to-speech model that allows users to generate an MP3 with voice audio from text input.
@cf/meta/llama-4-scout-17b-16e-instruct: 17 billion parameter MoE model with 16 experts that is natively multimodal. Offers industry-leading performance in text and image understanding.
[NEW] @cf/mistralai/mistral-small-3.1-24b-instruct: a 24B parameter model achieving state-of-the-art capabilities comparable to larger models, with support for vision and tool calling.
[NEW] @cf/google/gemma-3-12b-it: well-suited for a variety of text generation and image understanding tasks, including question answering, summarization and reasoning, with a 128K context window, and multilingual support in over 140 languages.
[NEW] @cf/qwen/qwq-32b: a medium-sized reasoning model, which is capable of achieving competitive performance against state-of-the-art reasoning models, e.g., DeepSeek-R1, o1-mini.
[NEW] @cf/qwen/qwen2.5-coder-32b-instruct: the current state-of-the-art open-source code LLM, with its coding abilities matching those of GPT-4o.
In addition, we are rolling out some in-place updates to existing models in our catalog:
As we release these new models, we’ll be deprecating old models to encourage use of the state-of-the-art models and make room in our catalog. We will send out an email notice on this shortly. Stay up to date with our model releases and deprecation announcements by subscribing to our Developer Docs changelog.
We’re (still) just getting started
Workers AI is one of Cloudflare’s newer products in a nascent industry, but we still operate with very traditional Cloudflare principles – learning how we can do more with less. Our engineering team is focused on solving the difficult problems that come with growing a distributed inference platform at a global scale, and we’re excited to release these new features today that we think will improve the platform as a whole for all our users. With faster inference times, better reliability, more customization possibilities, and better usability, we’re excited to see what you can do with more Workers AI — let us know what you think!
We’re excited to announce Workers Observability – a new section in the Cloudflare Dashboard that allows you to query detailed log events across all Workers in your account to extract deeper insights.
In 2024, we set out to build the best first-party observability for any cloud platform. Since then, we’ve improved metrics reporting for all resources, launched Workers Logs to automatically ingest and store logs for Workers, and rebuilt real-time logs with improved filtering. However, observability insights have been limited to a single Worker.
Starting today, you can use Workers Observability to understand what is happening across all of your Workers:
Workers Metrics Dashboard (Beta): A single dashboard to view metrics and logs from all of your Workers
Query Builder (Beta): Construct structured queries to explore your logs, extract metrics from logs, create graphical and tabular visualizations, and save queries for faster future investigations.
Workers Logs: Now Generally Available, with a public API and improved invocation-based grouping.
Building queries
The Query Builder allows you to interact with your logs, and answer the “why” to any question you have. You can find it by navigating to Workers & Pages > Observability in the dashboard.
Using the Query Builder, you can now answer more questions than ever. For example, this query shows the p90 wall time for 200 OK responses from the /reference endpoint is 6 milliseconds.
The key components to structuring a query in the Query Builder are:
Visualizations: An aggregate function like average, count, percentile, or unique that performs a calculation on a group of values to return a single value. Each aggregate function returns a graph visualization and a summary table.
Filters: A condition that allows you to exclude data not matching the criteria.
Search: A condition that only returns the data matching the specified string.
Group by: A function to collapse a field into only its distinct values, allowing you to more granularly apply aggregate functions.
Order by: A sorting function to order the returned rows.
Limits: A cap on the number of returned rows, allowing you to focus on what is important.
The Query Builder relies on structured logs for efficient indexed queries and extracting metrics from logs. Workers Observability natively supports and encourages structured logs. Structured logs store context-rich metadata as key-value pairs in the form of distinct fields (high dimensionality), each with many potential unique values (high cardinality). Invocation Logs, which can be enabled in your Worker, contain deep insights from Cloudflare’s network, and are a great example of a structured log. By logging important metadata as a structured log, you empower yourself to answer questions about your system that you couldn’t predict when writing the code.
Internally at Cloudflare, we’ve already found tremendous value from this new product. During development, the Workers Observability team was able to use the Query Builder to discover a bug in the Workers Observability team’s staging environment. A query on the number of the events per script returned the following response:
After mapping this drop in recorded events against recent staging deployments, the team was able to isolate and root cause the introduction of the bug. Along with fixing the bug, the team also introduced new staging alerts to prevent errors like this from going unnoticed.
Queries built with the Query Builder or Workers Logs can be saved with a custom name and description. You can star your favorite queries, and also share them with your teammates using a shareable link, making it easier than ever to debug together and invest in developing visualizations from your telemetry data.
CPU time and wall time
You can now monitor CPU time and wall time for every Workers invocation across all of our observability offerings, including Tail Workers, Workers Logpush, and Workers Logs. These metrics help show how much time is spent executing code compared to the total elapsed time for the invocation, including I/O time.
For example, using the CPU time and wall time surfaced in the Invocation Log, you can use the Query Builder to show the p90 CPU time and wall time traffic for a single Worker script.
Revamped Workers metrics
In February, we released a new view into your Workers’ metrics to help you monitor your gradual deployments with improved visualizations. Today, we are also launching a new Workers Metrics overview page in the Observability tab. Now you can easily compare metrics across Workers and understand the current state of your deployments, all from a single view.
Invocations view
Invocations are mechanisms to trigger the execution of a Worker or Durable Object in response to an event, such as an alarm, cron job, or a fetch.
When the Worker or Durable Object executes, log events are emitted. To date, we have surfaced logs in an events view where each log is ordered by the time it was published.
We’re now introducing an Invocations View, so you can group and view all logs from each invocation. These views are available in each Worker’s view and the Workers Observability tab.
Workers Observability API
You can now use the Workers Observability API to programmatically retrieve your telemetry data and populate the tool of your choice.
The API allows you to automate, integrate, and customize in ways that our dashboard may not. For example, you may want to analyze your logs in a notebook or correlate your Workers logs with logs from a different source. Leveraging the Workers Observability API can help you optimize your monitoring strategy, automate repetitive tasks, and improve flexibility in how you interact with your telemetry data.
Enable Workers Logs today
To use Workers Logs, enable it in your Workers’ settings in the dashboard or add the following configuration to your Workers’ wrangler file:
We’re just getting started. We have lots in store to help make Cloudflare’s developer observability best-in-class. Join us in Discord in the #workers-observability channel for feedback and feature requests.
Program your traffic at the edge — fast, flexible, and free
Cloudflare Snippets are now generally available (GA) for all paid plans, giving you a fast, flexible way to control HTTP traffic using lightweight JavaScript “code rules” — at no extra cost.
Need to transform headers dynamically, fine-tune caching, rewrite URLs, retry failed requests, replace expired links, throttle suspicious traffic, or validate authentication tokens? Snippets provide a production-ready solution built for performance, security, and control.
With GA, we’re introducing a new code editor to streamline writing and testing logic. This summer, we’re also rolling out an integration with Secrets Store — enabling you to bind and manage sensitive values like API keys directly in Snippets, securely and at scale.
What are Snippets?
Snippets bring the power of JavaScript to Cloudflare Rules, letting you write logic that runs before a request reaches your origin or after a response returns from upstream. They’re ideal when built-in rule actions aren’t quite enough. While Cloudflare Rules let you define traffic logic without code, Snippets extend that model with greater flexibility for advanced scenarios.
Automated deployment and versioning via Terraform.
Best of all? Snippets are included at no extra cost for Pro, Business, and Enterprise plans — with no usage-based fees.
The journey to GA: How Snippets became production-grade
Cloudflare Snippets started as a bold idea: bring the power of JavaScript-based logic to Cloudflare Rules, without the complexity of a full-stack developer platform.
Over the past two years, Snippets have evolved into a production-ready “code rules” solution, shaping the future of HTTP traffic control.
2022: Cloudflare Snippets were announced during Developer Week as a solution for users needing flexible HTTP traffic modifications without a full Worker.
2023:Alpha launch — hundreds of users tested Snippets for high-performance traffic logic.
2024:7x traffic growth, processing 17,000 requests per second. Terraform support and production-grade backend were released.
2025:General Availability — Snippets introduces a new code editor, increased limits alongside other Cloudflare Rules products, integration with Trace, and a production-grade experience built for scale, handling over 2 million requests per second at peak. Integration with the Secrets Store is rolling out this summer.
New: Snippets + Trace
Cloudflare Trace now shows exactly which Snippets were triggered on a request. This makes it easier to debug traffic behavior, verify logic execution, and understand how your Snippets interact with other products in the request pipeline.
Whether you’re fine-tuning header logic or troubleshooting a routing issue, Trace gives you real-time insight into how your edge logic behaves in production.
Coming soon: Snippets + Secrets Store
In the third quarter, you’ll be able to securely access API keys, authentication tokens, and other sensitive values from Secrets Store directly in your Snippets. No more plaintext secrets in your code, no more workarounds.
Once rolled out, secrets can be configured for Snippets via the dashboard or API under the new “Settings” button.
When to use Snippets vs. Cloudflare Workers
Snippets are fast, flexible, and free, but how do they compare to Cloudflare Workers? Both allow you to programmatically control traffic. However, they solve different problems:
Feature
Snippets
Workers
Execute scripts based on request attributes (headers, geolocation, cookies, etc.)
✅
❌
Modify HTTP requests/responses or serve a different response
✅
✅
Add, remove, or rewrite headers dynamically
✅
✅
Cache assets at the edge
✅
✅
Route traffic dynamically between origins
✅
✅
Authenticate requests, pre-sign URLs, run A/B testing
✅
✅
Perform compute-intensive tasks (e.g., AI inference, image processing)
❌
✅
Store persistent data (e.g., KV, Durable Objects, D1)
❌
✅
Deploy via CLI (Wrangler)
❌
✅
Use TypeScript, Python, Rust or other programming languages
❌
✅
Use Snippets when:
You need ultra-fast conditional traffic modifications directly on Cloudflare’s network.
You want to extend Cloudflare Rules beyond built-in actions.
You need free, unlimited invocations within the execution limits.
You are migrating from VCL, Akamai’s EdgeWorkers, or on-premise logic.
Use Workers when:
Your application requires state management, Developer Platform product integrations, or high compute limits.
You are building APIs, full-stack applications, or complex workflows.
You need logging, debugging tools, CLI support, and gradual rollouts.
Still unsure? Check out our detailed guide for best practices.
Snippets in action: real-world use cases
Below are practical use cases demonstrating Snippets. Each script can be dynamically triggered using our powerful Rules language, so you can granularly control which requests your Snippets will be applied to.
1. Dynamically modify headers
Inject custom headers, remove unnecessary ones, and tweak values on the fly:
export default {
  async fetch(request) {
    const timestamp = Date.now().toString(16); // convert timestamp to HEX
    const modifiedRequest = new Request(request, { headers: new Headers(request.headers) });
    modifiedRequest.headers.set("X-Hex-Timestamp", timestamp); // send HEX timestamp to upstream

    const response = await fetch(modifiedRequest);
    const newResponse = new Response(response.body, response); // make response from upstream immutable

    newResponse.headers.append("x-snippets-hello", "Hello from Cloudflare Snippets"); // add new response header
    newResponse.headers.delete("x-header-to-delete"); // delete response header
    newResponse.headers.set("x-header-to-change", "NewValue"); // replace the value of existing response header

    return newResponse;
  },
};
2. Serve a custom maintenance page
Route traffic to a maintenance page when your origin is undergoing planned maintenance:
export default {
    async fetch(request) { // for all matching requests, return predefined HTML response with 503 status code
        return new Response(`
            <!DOCTYPE html>
            <html lang="en">
            <head>
                <meta charset="UTF-8">
                <title>We'll Be Right Back!</title>
                <style> body { font-family: Arial, sans-serif; text-align: center; padding: 20px; } </style>
            </head>
            <body>
                <h1>We'll Be Right Back!</h1>
                <p>Our site is undergoing maintenance. Check back soon!</p>
            </body>
            </html>
        `, { status: 503, headers: { "Content-Type": "text/html" } });
    }
};
3. Retry failed requests to a backup origin
Ensure reliability by automatically rerouting requests when your primary origin returns an unexpected response:
export default {
  async fetch(request) {
    const response = await fetch(request); // send original request to the origin

    if (!response.ok && !response.redirected) { // if response is not 200 OK or a redirect, send to another origin
      const newRequest = new Request(request); // clone the original request to construct a new request
      newRequest.headers.set("X-Rerouted", "1"); // add a header to identify a re-routed request at the new origin
      const url = new URL(request.url); // clone the original URL
      url.hostname = "backup.example.com"; // send request to a different origin / hostname
      return await fetch(url, newRequest); // serve response from the backup origin
    }

    return response; // otherwise, serve response from the primary origin
  },
};
4. Redirect users based on their location
Send visitors to region-specific sites for better localization:
export default {
    async fetch(request) {
        const country = request.cf.country; // identify visitor's country using request.cf property
        const redirectMap = { US: "https://example.com/us", EU: "https://example.com/eu" }; // define redirects for each country
        if (redirectMap[country]) return Response.redirect(redirectMap[country], 301); // redirect on match
        return fetch(request); // otherwise, proceed to upstream normally
    }
};
Getting started with Snippets
Snippets are available right now in the Cloudflare dashboard under Rules > Snippets:
Go to Rules → Snippets.
Use prebuilt templates or write your own JavaScript code.
Configure a flexible rule to trigger your Snippet.
Cloudflare Snippets are now generally available, bringing fast, cost-free, and intelligent HTTP traffic control to all paid plans.
With native integration into Cloudflare Rules and Terraform — and Secrets Store integration coming this summer — Snippets provide the most efficient way to manage advanced traffic logic at scale.
Explore Snippets in the Cloudflare Dashboard and start optimizing your traffic with lightweight, flexible rules that enhance performance and reduce complexity.
Today, we are announcing the 1.0 release of the Cloudflare Vite plugin, as well as official support for React Router v7!
Over the past few years, Vite’s meteoric rise has seen it become one of the most popular build tools for web development, with a large ecosystem and vibrant community. The Cloudflare Vite plugin brings the Workers runtime right into its beating heart! Previously, the Vite dev server would always run your server code in Node.js, even if you were deploying to Cloudflare Workers. By using the new Environment API, released experimentally in Vite 6, your Worker code can now run inside the native Cloudflare Workers runtime (workerd). This means that the dev server matches the production behavior as closely as possible, and provides confidence as you develop and deploy your applications.
Vite 6 includes the most significant changes to Vite’s architecture since its inception and unlocks many new possibilities for the ecosystem. Fundamental to this is the Environment API, which enables the Vite dev server to interact with any number of custom runtime environments. This means that it is now possible to run server code in alternative JavaScript runtimes, such as our own workerd.
We are grateful to have collaborated closely with the Vite team on its design and implementation. When you see first-hand the thoughtful and generous way in which they go about their work, it’s no wonder that Vite and its ecosystem are in such great shape!
Vite 6 with a Cloudflare Worker environment
Here you can see how it all fits together. The user views a page in the browser (1), which triggers a request to the Vite Dev Server (2). Vite processes the request, resolving, loading, and transforming source files into modules that are added to the client and Worker environments. The client modules are downloaded to the browser to be run as client-side JavaScript, and the Worker modules are sent to the Cloudflare Workers runtime to handle server-side requests. The request is handled by the Worker (3 and 4) and the Vite Dev Server returns the response to the browser (5), which displays the result to the user (6).
Single-page applications
Vite has become the go-to choice for developing single-page applications (SPAs), whether your preferred frontend framework is React, Vue, Svelte, or one of many others.
Create a new app
Let’s try out the new Cloudflare Vite plugin by creating a new React SPA using the create-cloudflare CLI.
This command runs create-vite and then makes the necessary changes to incorporate the Cloudflare Vite plugin.
Using the button below, you can also create a React SPA project on Cloudflare Workers, connected to a git repository of your choice, configured with Cloudflare Workers Builds to automatically deploy, and set up to use the new Vite plugin for local development.
Update an existing app
If you would instead like to update an existing Vite SPA project in the same way, you can follow these two steps:
Add the @cloudflare/vite-plugin dependency to the list of plugins:
import { defineConfig } from "vite";
import react from "@vitejs/plugin-react";
import { cloudflare } from "@cloudflare/vite-plugin";

// https://vite.dev/config/
export default defineConfig({
  plugins: [react(), cloudflare()],
});
Add a wrangler.jsonc configuration file alongside your Vite config:
For a purely front-end application, the Cloudflare plugin integrates the Vite dev server with Workers Assets to ensure that settings such as html_handling and not_found_handling behave the same way as they do in production. This is just the beginning, however. The real magic happens when you add a Worker backend that is seamlessly integrated into your development and deployment workflow.
Develop the app
To see this in action, start the Vite development server, which will run your Worker in the Cloudflare Workers runtime:
npm run dev
In your browser, click the first displayed button a few times to increment the counter. This is a classic SPA running JavaScript in your browser. Next, click the second button to fetch the response from the API. Notice that it displays Name from API is: Cloudflare. This is making an API request to a Cloudflare Worker running inside Vite.
Have a look at api/index.ts. This file contains a Worker that is invoked for any request not matching a static asset. It returns a JSON response if the pathname starts with /api/.
Edit api/index.ts by changing the name it returns to ’Cloudflare Workers’ and save your changes. If you click the second button in the browser again, it will now display the new name while preserving the previously set counter value. Vite tracked your changes and updated the Worker environment without affecting the client environment. With Vite and the Cloudflare plugin, you can iterate on the client and server parts of your app together, without losing UI state between edits.
The Cloudflare Vite integration doesn’t end with the dev server. vite build outputs the client and server parts of your application with a single command. vite preview allows you to preview your build output in the Workers runtime prior to deployment. Finally, wrangler deploy recognises that you have generated a Vite build and deploys your application directly without any additional bundling.
React Router v7
While Vite began its life primarily as a build tool for single-page applications, it has since become the foundation for the current generation of full-stack frameworks. Astro, Qwik, React Router, SvelteKit and others have all adopted Vite, drawing on its development server, build pipeline, and phenomenal developer experience. In addition to working with the Vite team on the Environment API, we have also partnered closely with the Remix team on their adoption of Vite Environments. Today, we are announcing first-class support for React Router v7 (the successor to Remix) in the Cloudflare Vite plugin.
You can use the create-cloudflare CLI to create a new React Router application configured with the Cloudflare Vite plugin.
Run npm run dev to start the dev server. You can also try building (npm run build), previewing (npm run preview), and deploying (npm run deploy) your application.
Have a look at the code below, taken from workers/app.ts. This is the file referenced in the main field in wrangler.jsonc:
This single file defines your Worker at both dev and build time and puts you in full control. No more build-time adapters! Notice how the env and ctx are passed down directly in the request handler. These are then accessible in your loaders and actions, which are running inside the Workers runtime along with the rest of your server code. You can add other exports to this file to suit your needs and then reference them in your Worker config. Want to add a Durable Object or a Workflow? Go for it!
This will be the first in a series of full-stack frameworks to be supported and we look forward to continuing discussion and collaboration with a range of teams over the coming months. If you are a framework contributor looking to improve integration with Cloudflare and/or the Vite Environment API, then please feel free to explore the code and reach out on GitHub or Discord.
Workers
While this post has focused thus far on using Vite to build web applications, the Cloudflare plugin enables you to use Vite to build anything you can build with Workers. The full Cloudflare Developer Platform is supported, including KV, D1, Service Bindings, RPC, Durable Objects, Workflows, Workers AI, etc. In fact, in most cases, taking an existing Worker and developing it with Vite is as simple as following these two steps:
Install the dependencies:
npm install –save-dev vite @cloudflare/vite-plugin
And add a Vite config:
// vite.config.ts

import { defineConfig } from "vite";
import { cloudflare } from "@cloudflare/vite-plugin";

export default defineConfig({
  plugins: [cloudflare()],
});
That’s it! By default, the plugin will look for a wrangler.json, wrangler.jsonc, or wrangler.toml config file in the root of your Vite project. By using Vite, you can draw on its rich ecosystem of plugins and integrations and easily customize your build output.
Wrapping up
In 2024, we announcedgetPlatformProxy() as a way to access Cloudflare bindings from development servers running in Node. At the end of that post, we imagined a future where it would instead be possible to develop directly in the Workers runtime. This would eliminate the many subtle ways that development and production behavior could differ. Today, that future is a reality, and we can’t wait for you to try it out!
Start a new project with our React Router, React, or Vue templates using the create-cloudflare CLI, use the “Deploy to Cloudflare” button below, or try adding @cloudflare/vite-plugin to your existing Vite applications. We’re excited to see what you build!
Today, we’re announcing support for MySQL in Cloudflare Workers and Hyperdrive. You can now build applications on Workers that connect to your MySQL databases directly, no matter where they’re hosted, with native MySQL drivers, and with optimal performance.
Connecting to MySQL databases from Workers has been an area we’ve been focusing on for quite some time. We want you to build your apps on Workers with your existing data, even if that data exists in a SQL database in us-east-1. But connecting to traditional SQL databases from Workers has been challenging: it requires making stateful connections to regional databases with drivers that haven’t been designed for the Workers runtime.
After multiple attempts at solving this problem for Postgres, Hyperdrive emerged as our solution that provides the best of both worlds: it supports existing database drivers and libraries while also providing best-in-class performance. And it’s such a critical part of connecting to databases from Workers that we’re making it free (check out the Hyperdrive free tier announcement).
With new Node.js compatibility improvements and Hyperdrive support for the MySQL wire protocol, we’re happy to say MySQL support for Cloudflare Workers has been achieved. If you want to jump into the code and have a MySQL database on hand, this “Deploy to Cloudflare” button will get you setup with a deployed project and will create a repository so you can dig into the code.
Read on to learn more about how we got MySQL to work on Workers, and why Hyperdrive is critical to making connectivity to MySQL databases fast.
Getting MySQL to work on Workers
Until recently, connecting to MySQL databases from Workers was not straightforward. While it’s been possible to make TCP connections from Workers for some time, MySQL drivers had many dependencies on Node.js that weren’t available on the Workers runtime, and that prevented their use.
This led to workarounds being developed. PlanetScale provided a serverless driver for JavaScript, which communicates with PlanetScale servers using HTTP instead of TCP to relay database messages. In a separate effort, a fork of the mysql package was created to polyfill the missing Node.js dependencies and modify the mysql package to work on Workers.
These solutions weren’t perfect. They required using new libraries that either did not provide the level of support expected for production applications, or provided solutions that were limited to certain MySQL hosting providers. They also did not integrate with existing codebases and tooling that depended on the popular MySQL drivers (mysql and mysql2). In our effort to enable all JavaScript developers to build on Workers, we knew that we had to support these drivers.
Improving our Node.js compatibility story was critical to get these MySQL drivers working on our platform. We first identified net and stream as APIs that were needed by both drivers. This, complemented by Workers’ nodejs_compat to resolve unused Node.js dependencies with unenv, enabled the mysql package to work on Workers:
Further work was required to get mysql2 working: dependencies on Node.js timers and the JavaScript eval API remained. While we were able to land support for timers in the Workers runtime, eval was not an API that we could securely enable in the Workers runtime at this time.
mysql2 uses eval to optimize the parsing of MySQL results containing large rows with more than 100 columns (see benchmarks). This blocked the driver from working on Workers, since the Workers runtime does not support this module. Luckily, prior effort existed to get mysql2 working on Workers using static parsers for handling text and binary MySQL data types without using eval(), which provides similar performance for a majority of scenarios.
In mysql2 version 3.13.0, a new option to disable the use of eval() was released to make it possible to use the driver in Cloudflare Workers:
import { createConnection  } from 'mysql2/promise';

export default {
 async fetch(request, env, ctx): Promise<Response> {
    const connection = await createConnection({
     host: env.DB_HOST,
     user: env.DB_USER,
     password: env.DB_PASSWORD,
     database: env.DB_NAME,
     port: env.DB_PORT

     // The following line is needed for mysql2 to work on Workers (as explained above)
     // mysql2 uses eval() to optimize result parsing for rows with > 100 columns
     // eval() is not available in Workers due to runtime limitations
     // Configure mysql2 to use static parsing with disableEval
     disableEval: true
   });

   const [results, fields] = await connection.query(
     'SHOW tables;'
   );

   return new Response(JSON.stringify({ results, fields }), {
     headers: {
       'Content-Type': 'application/json',
       'Access-Control-Allow-Origin': '*',
     },
   });
 },
} satisfies ExportedHandler<Env>;
So, with these efforts, it is now possible to connect to MySQL from Workers. But, getting the MySQL drivers working on Workers was only half of the battle. To make MySQL on Workers performant for production uses, we needed to make it possible to connect to MySQL databases with Hyperdrive.
Supporting MySQL in Hyperdrive
If you’re a MySQL developer, Hyperdrive may be new to you. Hyperdrive solves a core problem: connecting from Workers to regional SQL databases is slow. Database drivers require many roundtrips to establish a connection to a database. Without the ability to reuse these connections between Worker invocations, a lot of unnecessary latency is added to your application.
Hyperdrive solves this problem by pooling connections to your database globally and eliminating unnecessary roundtrips for connection setup. As a plus, Hyperdrive also provides integrated caching to offload popular queries from your database. We wrote an entire deep dive on how Hyperdrive does this, which you should definitely check out.
Getting Hyperdrive to support MySQL was critical for us to be able to say “Connect from Workers to MySQL databases”. That’s easier said than done. To support a new database type, Hyperdrive needs to be able to parse the wire protocol of the database in question, in this case, the MySQL protocol. Once this is accomplished, Hyperdrive can extract queries from protocol messages, cache results across Cloudflare locations, relay messages to a datacenter close to your database, and pool connections reliably close to your origin database.
Adapting Hyperdrive to parse a new language, MySQL protocol, is a challenge in its own right. But it also presented some notable differences with Postgres. While the intricacies are beyond the scope of this post, the differences in MySQL’s authentication plugins across providers and how MySQL’s connection handshake uses capability flags required some adaptation of Hyperdrive. In the end, we leveraged the experience we gained in building Hyperdrive for Postgres to iterate on our support for MySQL. And we’re happy to announce MySQL support is available for Hyperdrive, with all of the performanceimprovements we’ve made to Hyperdrive available from the get-go!
Now, you can create new Hyperdrive configurations for MySQL databases hosted anywhere (we’ve tested MySQL and MariaDB databases from AWS (including AWS Aurora), GCP, Azure, PlanetScale, and self-hosted databases). You can create Hyperdrive configurations for your MySQL databases from the dashboard or the Wrangler CLI:
In your Wrangler configuration file, you’ll need to set your Hyperdrive binding to the ID of the newly created Hyperdrive configuration as well as set Node.js compatibility flags:
From your Cloudflare Worker, the Hyperdrive binding provides you with custom connection credentials that connect to your Hyperdrive configuration. From there onward, all of your queries and database messages will be routed to your origin database by Hyperdrive, leveraging Cloudflare’s network to speed up routing.
import { createConnection  } from 'mysql2/promise';

export interface Env {
 HYPERDRIVE: Hyperdrive;
}

export default {
 async fetch(request, env, ctx): Promise<Response> {

   // Hyperdrive provides new connection credentials to use with your existing drivers
   const connection = await createConnection({
     host: env.HYPERDRIVE.host,
     user: env.HYPERDRIVE.user,
     password: env.HYPERDRIVE.password,
     database: env.HYPERDRIVE.database,
     port: env.HYPERDRIVE.port,

     // Configure mysql2 to use static parsing (as explained above in Part 1)
     disableEval: true
   });

   const [results, fields] = await connection.query(
     'SHOW tables;'
   );

   return new Response(JSON.stringify({ results, fields }), {
     headers: {
       'Content-Type': 'application/json',
       'Access-Control-Allow-Origin': '*',
     },
   });
 },
} satisfies ExportedHandler<Env>;
As you can see from this code snippet, you only need to swap the credentials in your JavaScript code for those provided by Hyperdrive to migrate your existing code to Workers. No need to change the ORMs or drivers you’re using!
Get started building with MySQL and Hyperdrive
MySQL support for Workers and Hyperdrive has been long overdue and we’re excited to see what you build. We published a template for you to get started building your MySQL applications on Workers with Hyperdrive:
As for what’s next, we’re going to continue iterating on our support for MySQL during the beta to support more of the MySQL protocol and MySQL-compatible databases. We’re also going to continue to expand the feature set of Hyperdrive to make it more flexible for your full-stack workloads and more performant for building full-stack global apps on Workers.
Finally, whether you’re using MySQL, PostgreSQL, or any of the other compatible databases, we think you should be using Hyperdrive to get the best performance. And because we want to enable you to build on Workers regardless of your preferred database, we’re making Hyperdrive available to the Workers free plan.
We want to hear your feedback on MySQL, Hyperdrive, and building global applications with Workers. Join the #hyperdrive channel in our Developer Discord to ask questions, share what you’re building, and talk to our Product & Engineering teams directly.
In September 2024, we introduced beta support for hosting, storing, and serving static assets for free on Cloudflare Workers — something that was previously only possible on Cloudflare Pages. Being able to host these assets — your client-side JavaScript, HTML, CSS, fonts, and images — was a critical missing piece for developers looking to build a full-stack application within a single Worker.
Today we’re announcing ten big improvements to building apps on Cloudflare. All together, these new additions allow you to build and host projects ranging from simple static sites to full-stack applications, all on Cloudflare Workers:
You can build complete full-stack apps on Workers without a framework: you can “just use Vite” and React together, and build a backend API in the same Worker. See our Vite + React template for an example.
The Cloudflare Vite plugin is now v1.0 and generally available. The Vite plugin allows you to run Vite’s development server in the Workers runtime (workerd), meaning you get all the benefits of Vite, including Hot Module Replacement, while still being able to use features that are exclusive to Workers (like Durable Objects).
You can now use static _headers and _redirects configuration files for your applications on Workers, something that was previously only available on Pages. These files allow you to add simple headers and configure redirects without executing any Worker code.
In addition to PostgreSQL, you can now connect to MySQL databases in addition from Cloudflare Workers, via Hyperdrive. Bring your existing Planetscale, AWS, GCP, Azure, or other MySQL database, and Hyperdrive will take care of pooling connections to your database and eliminating unnecessary roundtrips by caching queries.
More Node.js APIs are available in the Workers Runtime — including APIs from the crypto, tls, net, and dns modules. We’ve also increased the maximum CPU time for a Workers request from 30 seconds to 5 minutes.
The Images binding in Workers is generally available, allowing you to build more flexible, programmatic workflows.
These improvements allow you to build both simple static sites and more complex server-side rendered applications. Like Pages, you only get charged when your Worker code runs, meaning you can host and serve static sites for free. When you want to do any rendering on the server or need to build an API, simply add a Worker to handle your backend. And when you need to read or write data in your app, you can connect to an existing database with Hyperdrive, or use any of our storage solutions: Workers KV, R2, Durable Objects, or D1.
If you’d like to dive straight into code, you can deploy a single-page application built with Vite and React, with the option to connect to a hosted database with Hyperdrive, by clicking this “Deploy to Cloudflare” button:
Start with Workers
Previously, you needed to choose between building on Cloudflare Pages or Workers (or use Pages for one part of your app, and Workers for another) just to get started. This meant figuring out what your app needed from the start, and hoping that if your project evolved, you wouldn’t be stuck with the wrong platform and architecture. Workers was designed to be a flexible platform, allowing developers to evolve projects as needed — and so, we’ve worked to bring pieces of Pages into Workers over the years.
Now that Workers supports both serving static assets and server-side rendering, you should start with Workers. Cloudflare Pages will continue to be supported, but, going forward, all of our investment, optimizations, and feature work will be dedicated to improving Workers. We aim to make Workers the best platform for building full-stack apps, building upon your feedback of what went well with Pages and what we could improve.
Before, building an app on Pages meant you got a really easy, opinionated on-ramp, but you’d eventually hit a wall if your application got more complex. If you wanted to use Durable Objects to manage state, you would need to set up an entirely separate Worker to do so, ending up with a complicated deployment and more overhead. You also were limited to real-time logs, and could only roll out changes all in one go.
When you build on Workers, you can immediately bind to any other Developer Platform service (including Durable Objects, Email Workers, and more), and manage both your front end and back end in a single project — all with a single deployment. You also get the whole suite of Workers observability tooling built into the platform, such as Workers Logs. And if you want to rollout changes to only a certain percentage of traffic, you can do so with Gradual Deployments.
These latest improvements are part of our goal to bring the best parts of Pages into Workers. For example, we now support static _headers and _redirects config files, so that you can easily take an existing project from Pages (or another platform) and move it over to Workers, without needing to change your project. We also directly integrate with GitHub and GitLab with Workers Builds, providing automatic builds and deployments. And starting today, Preview URLs are posted back to your repository as a comment, with feature branch aliases and environments coming soon.
To learn how to migrate an existing project from Pages to Workers, read our migration guide.
Next, let’s talk about how you can build applications with different rendering modes on Workers.
Building static sites, SPAs, and SSR on Workers
As a quick primer, here are all the architectures and rendering modes we’ll be discussing that are supported on Workers:
Static sites: When you visit a static site, the server immediately returns pre-built static assets — HTML, CSS, JavaScript, images, and fonts. There’s no dynamic rendering happening on the server at request-time. Static assets are typically generated at build-time and served directly from a CDN, making static sites fast and easily cacheable. This approach works well for sites with content that rarely changes.
Single-Page Applications (SPAs): When you load an SPA, the server initially sends a minimal HTML shell and a JavaScript bundle (served as static assets). Your browser downloads this JavaScript, which then takes over to render the entire user interface client-side. After the initial load, all navigation occurs without full-page refreshes, typically via client-side routing. This creates a fast, app-like experience.
Server-Side Rendered (SSR) applications: When you first visit a site that uses SSR, the server generates a fully-rendered HTML page on-demand for that request. Your browser immediately displays this complete HTML, resulting in a fast first page load. Once loaded, JavaScript “hydrates” the page, adding interactivity. Subsequent navigations can either trigger new server-rendered pages or, in many modern frameworks, transition into client-side rendering similar to an SPA.
Next, we’ll dive into how you can build these kinds of applications on Workers, starting with setting up your development environment.
Setup: build and dev
Before uploading your application, you need to bundle all of your client-side code into a directory of static assets. Wrangler bundles and builds your code when you run wrangler dev, but we also now support Vite with our new Vite plugin. This is a great option for those already using Vite’s build tooling and development server — you can continue developing (and testing with Vitest) using Vite’s development server, all using the Workers runtime.
To get started using the Cloudflare Vite plugin, you can scaffold a React application using Vite and our plugin, by running:
The Vite plugin informs Wrangler that this /dist directory contains the project’s built static assets — which, in this case, includes client-side code, some CSS files, and images.
Once deployed, this single-page application (SPA) architecture will look something like this:
When a request comes in, Cloudflare looks at the pathname and automatically serves any static assets that match that pathname. For example, if your static assets directory includes a blog.html file, requests for example.com/blog get that file.
Static sites
If you have a static site created by a static site generator (SSG) like Astro, all you need to do is create a wrangler.jsonc file (or wrangler.toml) and tell Cloudflare where to find your built assets:
Once you’ve added this configuration, you can simply build your project and run wrangler deploy. Your entire site will then be uploaded and ready for traffic on Workers. Once deployed and requests start flowing in, your static site will be cached across Cloudflare’s network.
You can try starting a fresh Astro project on Workers today by running:
By enabling this, the platform assumes that any navigation request (requests which include a Sec-Fetch-Mode: navigate header) are intended for static assets and will serve up index.html whenever a matching static asset match cannot be found. For non-navigation requests (such as requests for data) that don’t match a static asset, Cloudflare will invoke the Worker script. With this setup, you can render the frontend with React, use a Worker to handle back-end operations, and use Vite to help stitch the two together. This is a great option for porting over older SPAs built with create-react-app, which was recently sunset.
Another thing to note in this Wrangler configuration file: we’ve defined a Hyperdrive binding and enabled Smart Placement. Hyperdrive lets us use an existing database and handles connection pooling. This solves a long-standing challenge of connecting Workers (which run in a highly distributed, serverless environment) directly to traditional databases. By design, Workers operate in lightweight V8 isolates with no persistent TCP sockets and a strict CPU/memory limit. This isolation is great for security and speed, but it makes it difficult to hold open database connections. Hyperdrive addresses these constraints by acting as a “bridge” between Cloudflare’s network and your database, taking care of the heavy lifting of maintaining stable connections or pools so that Workers can reuse them. By turning on Smart Placement, we also ensure that if requests to our Worker originate far from the database (causing latency), Cloudflare can choose to relocate both the Worker—which handles the database connection—and the Hyperdrive “bridge” to a location closer to the database, reducing round-trip times.
SPA example: Worker code
Let’s look at the “Deploy to Cloudflare” example at the top of this blog. In api/index.js, we’ve defined an API (using Hono) which connects to a hosted database through Hyperdrive.
import { Hono } from "hono";
import postgres from "postgres";
import booksRouter from "./routes/books";
import bookRelatedRouter from "./routes/book-related";

const app = new Hono();

// Setup SQL client middleware
app.use("*", async (c, next) => {
 // Create SQL client
 const sql = postgres(c.env.HYPERDRIVE.connectionString, {
   max: 5,
   fetch_types: false,
 });

 c.env.SQL = sql;

 // Process the request
 await next();

 // Close the SQL connection after the response is sent
 c.executionCtx.waitUntil(sql.end());
});

app.route("/api/books", booksRouter);
app.route("/api/books/:id/related", bookRelatedRouter);


export default {
 fetch: app.fetch,
};
When deployed, our app’s architecture looks something like this:
If Smart Placement moves the placement of my Worker to run closer to my database, it could look like this:
Server-Side Rendering (SSR)
If you want to handle rendering on the server, we support a number of popular full-stack frameworks.
Here’s a version of our previous example, now using React Router v7’s server-side rendering:
Deploy to Workers, with as few changes as possible
Node.js compatibility
We’ve also continued to make progress supporting Node.js APIs, recently adding support for the crypto, tls, net, and dns modules. This allows existing applications and libraries that rely on these Node.js modules to run on Workers. Let’s take a look at an example:
Previously, if you tried to use the mongodb package, you encountered the following error:
Error: [unenv] dns.resolveTxt is not implemented yet!
This occurred when mongodb used the node:dns module to do a DNS lookup of a hostname. Even if you avoided that issue, you would have encountered another error when mongodb tried to use node:tls to securely connect to a database.
Now, you can use mongodb as expected because node:dns and node:tls are supported. The same can be said for libraries relying on node:crypto and node:net.
Additionally, Workers now expose environment variables and secrets on the process.env object when the nodejs_compat compatibility flag is on and the compatibility date is set to 2025-04-01 or beyond. Some libraries (and developers) assume that this object will be populated with variables, and rely on it for top-level configuration. Without the tweak, libraries may have previously broken unexpectedly and developers had to write additional logic to handle variables on Cloudflare Workers.
Now, you can just access your variables as you would in Node.js.
We have also raised the maximum CPU time per Worker request from 30 seconds to 5 minutes. This allows for compute-intensive operations to run for longer without timing out. Say you want to use the newly supported node:crypto module to hash a very large file, you can now do this on Workers without having to rely on external compute for CPU-intensive operations.
Workers Builds
We’ve also made improvements to Workers Builds, which allows you to connect a Git repository to your Worker, so that you can have automatic builds and deployments on every pushed change. Workers Builds was introduced during Builder Day 2024, and initially only allowed you to connect a repository to an existing Worker. Now, you can bring a repository and immediately deploy it as a new Worker, reducing the amount of setup and button clicking needed to bring a project over. We’ve improved the performance of Workers Builds by reducing the latency of build starts by 6 seconds — they now start within 10 seconds on average. We also boosted API responsiveness, achieving a 7x latency improvement thanks to Smart Placement.
Note: On April 2, 2025, Workers Builds transitioned to a new pricing model, as announced during Builder Day 2024. Free plan users are now capped at 3,000 minutes of build time, and Workers Paid subscription users will have a new usage-based model with 6,000 free minutes included and $0.005 per build minute pricing after. To better support concurrent builds, Paid plans will also now get six (6) concurrent builds, making it easier to work across multiple projects and monorepos. For more information on pricing, see the documentation.
Last week, we wrote a blog post that covers how the Images binding enables more flexible, programmatic workflows for image optimization.
Previously, you could access image optimization features by calling fetch() in your Worker. This method requires the original image to be retrievable by URL. However, you may have cases where images aren’t accessible from a URL, like when you want to compress user-uploaded images before they are uploaded to your storage. With the Images binding, you can directly optimize an image by operating on its body as a stream of bytes.
We’re excited to see what you’ll build, and are focused on new features and improvements to make it easier to create any application on Workers. Much of this work was made even better by community feedback, and we encourage everyone to join our Discord to participate in the discussion.
You can now add a Deploy to Cloudflare button to the README of your Git repository containing a Workers application — making it simple for other developers to quickly set up and deploy your project!
The Deploy to Cloudflare button:
Creates a new Git repository on your GitHub/ GitLab account: Cloudflare will automatically clone and create a new repository on your account, so you can continue developing.
Automatically provisions resources the app needs: If your repository requires Cloudflare primitives like a Workers KV namespace, a D1 database, or an R2 bucket, Cloudflare will automatically provision them on your account and bind them to your Worker upon deployment.
Configures Workers Builds (CI/CD): Every new push to your production branch on your newly created repository will automatically build and deploy courtesy of Workers Builds.
There is nothing more frustrating than struggling to kick the tires on a new project because you don’t know where to start. Over the past couple of months, we’ve launched some improvements to getting started on Workers, including a gallery of Git-connected templates that help you kickstart your development journey.
But we think there’s another part of the story. Everyday, we see new Workers applications being built and open-sourced by developers in the community, ranging from starter projects to mission critical applications. These projects are designed to be shared, deployed, customized, and contributed to. But first and foremost, they must be simple to deploy.
Ditch the setup instructions
If you’ve open-sourced a new Workers application before, you may have listed in your README the following in order to get others going with your repository:
“Clone this repo”
“Install these packages”
“Install Wrangler”
“Create this database”
“Paste the database ID back into your config file”
“Run this command to deploy”
“Push to a new Git repo”
“Set up CI”
And the list goes on the more complicated your application gets, deterring other developers and making your project feel intimidating to deploy. Now, your project can be up and running in one shot — which means more traction, more feedback, and more contributions.
Self-hosting made easy
We’re not just talking about building and sharing small starter apps but also complex pieces of software. If you’ve ever self-hosted your own instance of an application on a traditional cloud provider before, you’re likely familiar with the pain of tedious setup, operational overhead, or hidden costs of your infrastructure.
Self-hosting with traditional cloud provider
Self-hosting with Cloudflare
Setup a VPC
Install tools and dependencies
Set up and provision storage
Manually configure CI/CD pipeline to automate deployments
Scramble to manually secure your environment if a runtime vulnerability is discovered
Configure autoscaling policies and manage idle servers
✅Serverless
✅Highly-available global network
✅Automatic provisioning of datastores like D1 databases and R2 buckets
✅Built-in CI/CD workflow configured out of the box
✅Automatic runtime updates to keep your environment secure
✅Scale automatically and only pay for what you use.
By making your open-source repository accessible with a Deploy to Cloudflare button, you can allow other developers to deploy their own instance of your app without requiring deep infrastructure expertise.
From starter projects to full-stack applications
We’re inviting all Workers developers looking to open-source their project to add Deploy to Cloudflare buttons to their projects and help others get up and running faster. We’ve already started working with open-source app developers! Here are a few great examples to explore:
Test and explore your APIs with Fiberplane
Fiberplane helps developers build, test and explore Hono APIs and AI Agents in an embeddable playground. This Developer Week, Fiberplane released a set of sample Worker applications built on the ‘HONC‘ stack — Hono, Drizzle ORM, D1 Database, and Cloudflare Workers — that you can use as the foundation for your own projects. With an easy one-click Deploy to Cloudflare, each application comes preconfigured with the open source Fiberplane API Playground, making it easy to generate OpenAPI docs, test your handlers, and explore your API, all within one embedded interface.
Deploy your first remote MCP server
You can now build and deploy remote Model Context Protocol (MCP) servers on Cloudflare Workers! MCP servers provide a standardized way for AI agents to interact with services directly, enabling them to complete actions on users’ behalf. Cloudflare’s remote MCP server implementation supports authentication, allowing users to login to their service from the agent to give it scoped permissions. This gives users the ability to interact with services without navigating dashboards or learning APIs — they simply tell their AI agent what they want to accomplish.
Start building your first agent
AI agents are intelligent systems capable of autonomously executing tasks by making real-time decisions about which tools to use and how to structure their workflows. Unlike traditional automation (which follows rigid, predefined steps), agents dynamically adapt their strategies based on context and evolving inputs. This template serves as a starting point for building AI-driven chat agents on Cloudflare’s Agent platform. Powered by Cloudflare’s Agents SDK, it provides a solid foundation for creating interactive AI chat experiences with a modern UI and tool integrations capabilities.
Be sure to make your Git repository public and add the following snippet including your Git repository URL.
[](https://deploy.workers.cloudflare.com/?url=<YOUR_GIT_REPO_URL>)
When another developer clicks your Deploy to Cloudflare button, Cloudflare will parse the Wrangler configuration file, provision any resources detected, and create a new repo on their account that’s updated with information about newly created resources. For example:
{
  "compatibility_date": "2024-04-03",

  "d1_databases": [
    {
      "binding": "MY_D1_DATABASE",

	//will be updated with newly created database ID
      "database_id": "1234567890abcdef1234567890abcdef"
    }
  ]
}
Check out our documentation for more information on how to set up a deploy button for your application and best practices to ensure a successful deployment for other developers.
Start building
For new Cloudflare developers, keep an eye out for “Deploy to Cloudflare” buttons across the web, or simply paste the URL of any public GitHub or GitLab repository containing a Workers application into the Cloudflare dashboard to get started.
During Developer Week, tune in to our blog as we unveil new features and announcements — many including Deploy to Cloudflare buttons — so you can jump right in and start building!
Today we’re excited to announce AutoRAG in open beta, a fully managed Retrieval-Augmented Generation (RAG) pipeline powered by Cloudflare, designed to simplify how developers integrate context-aware AI into their applications. RAG is a method that improves the accuracy of AI responses by retrieving information from your own data, and providing it to the large language model (LLM) to generate more grounded responses.
Building a RAG pipeline is a patchwork of moving parts. You have to stitch together multiple tools and services — your data storage, a vector database, an embedding model, LLMs, and custom indexing, retrieval, and generation logic — all just to get started. Maintaining it is even harder. As your data changes, you have to manually reindex and regenerate embeddings to keep the system relevant and performant. What should be a simple “ask a question, get a smart answer” experience becomes a brittle pipeline of glue code, fragile integrations, and constant upkeep.
AutoRAG removes that complexity. With just a few clicks, it delivers a fully-managed RAG pipeline end-to-end: from ingesting your data and automatically chunking and embedding it, to storing vectors in Cloudflare’s Vectorize database, performing semantic retrieval, and generating high-quality responses using Workers AI. AutoRAG continuously monitors your data sources and indexes in the background so your AI stays fresh without manual effort. It abstracts away the mess, letting you focus on building smarter, faster applications on Cloudflare’s developer platform. Get started today in the Cloudflare Dashboard!
Why use RAG in the first place?
LLMs like Llama 3.3 from Meta are powerful, but they only know what they’ve been trained on. They often struggle to produce accurate answers when asked about new, proprietary, or domain-specific information. System prompts providing relevant information can help, but they bloat input size and are limited by context windows. Fine-tuning a model is expensive and requires ongoing retraining to keep up to date.
RAG solves this by retrieving relevant information from your data source at query time, combining it with the user’s input query, and feeding both into the LLM to generate responses grounded with your data. This makes RAG a great fit for AI-driven support bots, internal knowledge assistants, semantic search across documentation, and other use cases where the source of truth is always evolving.
What’s under the hood of AutoRAG?
AutoRAG sets up a RAG pipeline for you, using the building blocks of Cloudflare’s developer platform. Instead of you having to write code to create a RAG system using Workers AI, Vectorize, and AI Gateway, you just create an AutoRAG instance and point it at a data source, like an R2 storage bucket.
Behind the scenes, AutoRAG is powered by two processes: indexing and querying.
Indexing is an asynchronous process that runs in the background. It kicks off as soon as you create an AutoRAG, and automatically continues in cycles — reprocessing new or updated files after each previous job completes. During indexing, your content is transformed into vectors optimized for semantic search.
Querying is a synchronous process triggered when a user sends a search request. AutoRAG takes the query, retrieves the most relevant content from your vector database, and uses it to generate a context-aware response using an LLM.
Let’s take a closer look at how they work.
Indexing process
When you connect a data source, AutoRAG automatically ingests, transforms, and stores it as vectors, optimizing it for semantic search when querying:
File ingestion from data source: AutoRAG reads directly from your data source. Today, it supports integration with Cloudflare R2, where you can store documents like PDFs, images, text, HTML, CSV, and more for processing. Check out the RAG to riches in 5 minutes tutorial below to learn how you can use Browser Rendering to parse webpages to use within your AutoRAG.
Markdown conversion: AutoRAG uses Workers AI’s Markdown Conversion to convert all files into structured Markdown. This ensures consistency across diverse file types. For images, Workers AI is used to perform object detection followed by vision-to-language transformation to convert images into Markdown text.
Chunking: The extracted text is chunked into smaller pieces to improve retrieval granularity.
Embedding: Each chunk is embedded using Workers AI’s embedding model to transform the content into vectors.
Vector storage: The resulting vectors, along with metadata like source location and file name, are stored in a Cloudflare’s Vectorize database created on your account.
Querying process
When an end user makes a request, AutoRAG orchestrates the following:
Receive query from AutoRAG API: The query workflow begins when you send a request to either the AutoRAG’s AI Search or Search endpoint.
Query rewriting (optional): AutoRAG provides the option to rewrite the input query using one of Workers AI’s LLMs to improve retrieval quality by transforming the original query into a more effective search query.
Embedding the query: The rewritten (or original) query is transformed into a vector via the same embedding model used to embed your data so that it can be compared against your vectorized data to find the most relevant matches.
Vector search in Vectorize: The query vector is searched against stored vectors in the associated Vectorize database for your AutoRAG.
Metadata + content retrieval: Vectorize returns the most relevant chunks and their metadata. And the original content is retrieved from the R2 bucket. These are passed to a text-generation model.
Response generation: A text-generation model from Workers AI is used to generate a response using the retrieved content and the original user’s query.
The end result is an AI-powered answer grounded in your private data — accurate, and up to date.
RAG to riches in under 5 minutes
Most of the time, getting started with AutoRAG is as simple as pointing it to an existing R2 bucket — just drop in your content, and you’re ready to go. But what if your content isn’t already in a bucket? What if it’s still on a webpage or needs to first be rendered dynamically by a frontend UI? You’re in luck, because with the Browser Rendering API, you can crawl your own websites to gather information that powers your RAG. The Browser Rendering REST API is now generally available, offering endpoints for common browser actions including extracting HTML content, capturing screenshots, and generating PDFs. Additionally, a crawl endpoint is coming soon, making it even easier to ingest websites.
In this walkthrough, we’ll show you how to take your website and feed it into AutoRAG for Q&A. We’ll use a Cloudflare Worker to render web pages in a headless browser, upload the content to R2, and hook that into AutoRAG for semantic search and generation.
Step 1. Create a Worker to fetch webpages and upload into R2
We’ll create a Cloudflare Worker that uses Puppeteer to visit your URL, render it, and store the full HTML in your R2 bucket. If you already have an R2 bucket with content you’d like to build a RAG for then you can skip this step.
Create a new Worker project named browser-r2-worker by running:
npm create cloudflare@latest -- browser-r2-worker
For setup, select the following options:
What would you like to start with? Choose Hello World Starter.
Which template would you like to use? Choose Worker only.
Which language do you want to use? Choose TypeScript.
2. Install @cloudflare/puppeteer, which allows you to control the Browser Rendering instance:
npm i @cloudflare/puppeteer
3. Create a new R2 bucket named html-bucket by running:
npx wrangler r2 bucket create html-bucket
4. Add the following configurations to your Wrangler configuration file, so your Worker can use browser rendering and your new R2 bucket:
5. Replace the contents of src/index.ts with the following skeleton script:
import puppeteer from "@cloudflare/puppeteer";

// Define our environment bindings
interface Env {
	MY_BROWSER: any;
	HTML_BUCKET: R2Bucket;
}

// Define request body structure
interface RequestBody {
	url: string;
}

export default {
	async fetch(request: Request, env: Env): Promise<Response> {
		// Only accept POST requests
		if (request.method !== 'POST') {
return new Response('Please send a POST request with a target URL', { status: 405 });
		}

		// Get URL from request body
		const body = await request.json() as RequestBody;
		// Note: Only use this parser for websites you own
		const targetUrl = new URL(body.url);

		// Launch browser and create new page
		const browser = await puppeteer.launch(env.MY_BROWSER);
		const page = await browser.newPage();

		// Navigate to the page and fetch its html
		await page.goto(targetUrl.href);
		const htmlPage = await page.content();

		// Create filename and store in R2
		const key = targetUrl.hostname + '_' + Date.now() + '.html';
		await env.HTML_BUCKET.put(key, htmlPage);

		// Close browser
		await browser.close();

		// Return success response
		return new Response(JSON.stringify({
			success: true,
			message: 'Page rendered and stored successfully',
			key: key
		}), {
			headers: { 'Content-Type': 'application/json' }
		});
	}
} satisfies ExportedHandler<Env>;
6. Once the code is ready, you can deploy it to your Cloudflare account by running:
npx wrangler deploy
7. To test your Worker, you can use the following cURL request to fetch the HTML file of a page. In this example we are fetching this blog page to upload into the html-bucket bucket:
Select Create AutoRAG and complete the setup process:
Select the R2 bucket which contains your knowledge base, in this case, select the html-bucket.
Select an embedding model used to convert your data to vector representation. It is recommended to use the Default.
Select an LLM to use to generate your responses. It is recommended to use the Default.
Select or create an AI Gateway to monitor and control your model usage.
Name your AutoRAG as my-rag.
Select or create a Service API token to grant AutoRAG access to create and access resources in your account.
Select Create to spin up your AutoRAG.
Once you’ve created your AutoRAG, it will automatically create a Vectorize database in your account and begin indexing the data. You can view the progress of your indexing job in the Overview page of your AutoRAG. The indexing time may vary depending on the number and type of files you have in your data source.
Step 3. Test and add to your application
Once AutoRAG finishes indexing your content, you’re ready to start asking it questions. You can open up your AutoRAG instance, navigate to the Playground tab, and ask a question based on your uploaded content, like “What is AutoRAG?”.
Once you’re happy with the results in the Playground, you can integrate AutoRAG directly into the application that you are building. If you are using a Worker to build your application, then you can use the AI binding to directly call your AutoRAG:
{
  "ai": {
    "binding": "AI"
  }
}
Then, query your AutoRAG instance from your Worker code by calling the aiSearch() method. Alternatively you can use the Search() method to get a list of retrieved results without an AI generated response.
const answer = await env.AI.autorag('my-rag').aiSearch({
   query: 'What is AutoRAG?'
});
For more information on how to add AutoRAG into your application, go to your AutoRAG then navigate to Use AutoRAG for more instructions.
Start building today
During the open beta, AutoRAG is free to enable. Compute operations for indexing, retrieval and augmentation incur no additional cost during this phase.
AutoRAG is built entirely on top of Cloudflare’s Developer Platform, using the same tools you’d reach for if you were building a RAG pipeline yourself. When you create an AutoRAG instance, it provisions and runs on top of Cloudflare services within your own account, giving you full visibility into performance, cost, and behavior with fewer black boxes.
Vectorize: stores vector embeddings and powers semantic retrieval.
Workers AI: converts images to markdown, generates embeddings, rewrites queries, and generates responses.
AI Gateway: tracks and controls your model’s usage.
To help manage resources during the beta, each account is limited to 10 AutoRAG instances, with up to 100,000 filesper AutoRAG.
What’s on the roadmap?
We’re just getting started with AutoRAG and we have more planned throughout 2025 to make it more powerful and flexible. Here are a few things we’re actively working on:
More data source integrations: We’re expanding beyond R2, with support for new input types like direct website URL parsing (powered by browser rendering) and structured data sources like Cloudflare D1.
Smarter, higher-quality responses: We’re exploring built-in reranking, recursive chunking, and other processing techniques to improve the quality and relevance of generated answers.
These features will roll out incrementally, and we’d love your feedback as we shape what’s next. AutoRAG is built to evolve with your use cases so stay tuned.
Try it out today!
Get started with AutoRAG today by visiting the Cloudflare Dashboard, navigate to AI > AutoRAG, and select Create AutoRAG. Whether you’re building an AI-powered search experience, an internal knowledge assistant, or just experimenting with LLMs, AutoRAG gives you a fast and flexible way to get started with RAG on Cloudflare’s global network. For more details, refer to the Developer Docs. Also, try out the Browser Rendering API that is now generally available for your browser action needs.
We’re excited to see what you build and we’re here to help. Have questions or feedback? Join the conversation on the Cloudflare Developers Discord.
It’s not a secret that at Cloudflare we are bullish on the future of agents. We’re excited about a future where AI can not only co-pilot alongside us, but where we can actually start to delegate entire tasks to AI.
While it hasn’t been too long since we first announced our Agents SDK to make it easier for developers to build agents, building towards an agentic future requires continuous delivery towards this goal. Today, we’re making several announcements to help accelerate agentic development, including:
New Agents SDK capabilities: Build remote MCP clients, with transport and authentication built-in, to allow AI agents to connect to external services.
Hibernation for McpAgent: Automatically sleep stateful, remote MCP servers when inactive and wake them when needed. This allows you to maintain connections for long-running sessions while ensuring you’re not paying for idle time.
Durable Objects free tier: We view Durable Objects as a key component for building agents, and if you’re using our Agents SDK, you need access to it. Until today, Durable Objects was only accessible as part of our paid plans, and today we’re excited to include it in our free tier.
Workflows GA: Enables you to ship production-ready, long-running, multi-step actions in agents.
AutoRAG: Helps you integrate context-aware AI into your applications, in just a few clicks
AI agents can now connect to and interact with external services through MCP (Model Context Protocol). We’ve updated the Agents SDK to allow you to build a remote MCP client into your AI agent, with all the components — authentication flows, tool discovery, and connection management — built-in for you.
This allows you to build agents that can:
Prompt the end user to grant access to a 3rd party service (MCP server).
Use tools from these external services, acting on behalf of the end user.
Call MCP servers from Workflows, scheduled tasks, or any part of your agent.
Connect to multiple MCP servers and automatically discover new tools or capabilities presented by the 3rd party service.
MCP (Model Context Protocol) — first introduced by Anthropic — is quickly becoming the standard way for AI agents to interact with external services, with providers like OpenAI, Cursor, and Copilot adopting the protocol.
We recently announced support for building remote MCP servers on Cloudflare, and added an McpAgent class to our Agents SDK that automatically handles the remote aspects of MCP: transport and authentication/authorization. Now, we’re excited to extend the same capabilities to agents acting as MCP clients.
Want to see it in action? Use the button below to deploy a fully remote MCP client that can be used to connect to remote MCP servers.
AI Agents can now act as remote MCP clients, with transport and auth included
AI agents need to connect to external services to access tools, data, and capabilities beyond their built-in knowledge. That means AI agents need to be able to act as remote MCP clients, so they can connect to remote MCP servers that are hosting these tools and capabilities.
We’ve added a new class, MCPClientManager, into the Agents SDK to give you all the tooling you need to allow your AI agent to make calls to external services via MCP. The MCPClientManager class automatically handles:
Transport: Connect to remote MCP servers over SSE and HTTP, with support for Streamable HTTP coming soon.
Connection management: The client tracks the state of all connections and automatically reconnects if a connection is lost.
Capability discovery: Automatically discovers all capabilities, tools, resources, and prompts presented by the MCP server.
Real-time updates: When a server’s tools, resources, or prompts change, the client automatically receives notifications and updates its internal state.
Namespacing: When connecting to multiple MCP servers, all tools and resources are automatically namespaced to avoid conflicts.
Granting agents access to tools with built-in auth check for MCP Clients
We’ve integrated the complete OAuth authentication flow directly into the Agents SDK, so your AI agents can securely connect and authenticate to any remote MCP server without you having to build authentication flow from scratch.
This allows you to give users a secure way to log in and explicitly grant access to allow the agent to act on their behalf by automatically:
Supporting the OAuth 2.1 protocol.
Redirecting users to the service’s login page.
Generating the code challenge and exchanging an authorization code for an access token.
Using the access token to make authenticated requests to the MCP server.
Here is an example of an agent that can securely connect to MCP servers by initializing the client manager, adding the server, and handling the authentication callbacks:
async onStart(): Promise<void> {
  // initialize MCPClientManager which manages multiple MCP clients with optional auth
  this.mcp = new MCPClientManager("my-agent", "1.0.0", {
    baseCallbackUri: `${serverHost}/agents/${agentNamespace}/${this.name}/callback`,
    storage: this.ctx.storage,
  });
}

async addMcpServer(url: string): Promise<string> {
  // Add one MCP client to our MCPClientManager
  const { id, authUrl } = await this.mcp.connect(url);
  // Return authUrl to redirect the user to if the user is unauthorized
  return authUrl
}

async onRequest(req: Request): Promise<void> {
  // handle the auth callback after being finishing the MCP server auth flow
  if (this.mcp.isCallbackRequest(req)) {
    await this.mcp.handleCallbackRequest(req);
    return new Response("Authorized")
  }

  // ...
}
Connecting to multiple MCP servers and discovering what capabilities they offer
You can use the Agents SDK to connect an MCP client to multiple MCP servers simultaneously. This is particularly useful when you want your agent to access and interact with tools and resources served by different service providers.
The MCPClientManager class maintains connections to multiple MCP servers through the mcpConnections object, a dictionary that maps unique server names to their respective MCPClientConnection instances.
When you register a new server connection using connect(), the manager:
Creates a new connection instance with server-specific authentication.
Initializes the connections and registers for server capability notifications.
async onStart(): Promise<void> {
  // Connect to an image generation MCP server
  await this.mcp.connect("https://image-gen.example.com/mcp/sse");

  // Connect to a code analysis MCP server
  await this.mcp.connect("https://code-analysis.example.org/sse");

  // Now we can access tools with proper namespacing
  const allTools = this.mcp.listTools();
  console.log(`Total tools available: ${allTools.length}`);
}
Each connection manages its own authentication context, allowing one AI agent to authenticate to multiple servers simultaneously. In addition, MCPClientManager automatically handles namespacing to prevent collisions between tools with identical names from different servers.
For example, if both an “Image MCP Server” and “Code MCP Server” have a tool named “analyze”, they will both be independently callable without any naming conflicts.
Use Stytch, Auth0, and WorkOS to bring authentication & authorization to your MCP server
With MCP, users will have a new way of interacting with your application, no longer relying on the dashboard or API as the entrypoint. Instead, the service will now be accessed by AI agents that are acting on a user’s behalf. To ensure users and agents can connect to your service securely, you’ll need to extend your existing authentication and authorization system to support these agentic interactions, implementing login flows, permissions scopes, consent forms, and access enforcement for your MCP server.
We’re adding integrations with Stytch, Auth0, and WorkOS to make it easier for anyone building an MCP server to configure authentication & authorization for their MCP server.
You can leverage our MCP server integration with Stytch, Auth0, and WorkOS to:
Allow users to authenticate to your MCP server through email, social logins, SSO (single sign-on), and MFA (multi-factor authentication).
Define scopes and permissions that directly map to your MCP tools.
Present users with a consent page corresponding with the requested permissions.
Enforce the permissions so that agents can only invoke permitted tools.
Get started with the examples below by using the “Deploy to Cloudflare” button to deploy the demo MCP servers in your Cloudflare account. These demos include pre-configured authentication endpoints, consent flows, and permission models that you can tailor to fit your needs. Once you deploy the demo MCP servers, you can use the Workers AI playground, a browser-based remote MCP client, to test out the end-to-end user flow.
Stytch
Get started with a remote MCP server that uses Stytch to allow users to sign in with email, Google login or enterprise SSO and authorize their AI agent to view and manage their company’s OKRs on their behalf. Stytch will handle restricting the scopes granted to the AI agent based on the user’s role and permissions within their organization. When authorizing the MCP Client, each user will see a consent page that outlines the permissions that the agent is requesting that they are able to grant based on their role.
For more consumer use cases, deploy a remote MCP server for a To Do app that uses Stytch for authentication and MCP client authorization. Users can sign in with email and immediately access the To Do lists associated with their account, and grant access to any AI assistant to help them manage their tasks.
Regardless of use case, Stytch allows you to easily turn your application into an OAuth 2.0 identity provider and make your remote MCP server into a Relying Party so that it can easily inherit identity and permissions from your app. To learn more about how Stytch is enabling secure authentication to remote MCP servers, read their blog post.
“One of the challenges of realizing the promise of AI agents is enabling those agents to securely and reliably access data from other platforms. Stytch Connected Apps is purpose-built for these agentic use cases, making it simple to turn your app into an OAuth 2.0 identity provider to enable secure access to remote MCP servers. By combining Cloudflare Workers with Stytch Connected Apps, we’re removing the barriers for developers, enabling them to rapidly transition from AI proofs-of-concept to secure, deployed implementations.” — Julianna Lamb, Co-Founder & CTO, Stytch.
Auth0
Get started with a remote MCP server that uses Auth0 to authenticate users through email, social logins, or enterprise SSO to interact with their todos and personal data through AI agents. The MCP server securely connects to API endpoints on behalf of users, showing exactly which resources the agent will be able to access once it gets consent from the user. In this implementation, access tokens are automatically refreshed during long running interactions.
To set it up, first deploy the protected API endpoint:
Then, deploy the MCP server that handles authentication through Auth0 and securely connects AI agents to your API endpoint.
“Cloudflare continues to empower developers building AI products with tools like AI Gateway, Vectorize, and Workers AI. The recent addition of Remote MCP servers further demonstrates that Cloudflare Workers and Durable Objects are a leading platform for deploying serverless AI. We’re very proud that Auth0 can help solve the authentication and authorization needs for these cutting-edge workloads.” — Sandrino Di Mattia, Auth0 Sr. Director, Product Architecture.
WorkOS
Get started with a remote MCP server that uses WorkOS’s AuthKit to authenticate users and manage the permissions granted to AI agents. In this example, the MCP server dynamically exposes tools based on the user’s role and access rights. All authenticated users get access to the add tool, but only users who have been assigned the image_generation permission in WorkOS can grant the AI agent access to the image generation tool. This showcases how MCP servers can conditionally expose capabilities to AI agents based on the authenticated user’s role and permission.
“MCP is becoming the standard for AI agent integration, but authentication and authorization are still major gaps for enterprise adoption. WorkOS Connect enables any application to become an OAuth 2.0 authorization server, allowing agents and MCP clients to securely obtain tokens for fine-grained permission authorization and resource access. With Cloudflare Workers, developers can rapidly deploy remote MCP servers with built-in OAuth and enterprise-grade access control. Together, WorkOS and Cloudflare make it easy to ship secure, enterprise-ready agent infrastructure.” — Michael Grinich, CEO of WorkOS.
Hibernate-able WebSockets: put AI agents to sleep when they’re not in use
Starting today, a new improvement is landing in the McpAgent class: support for the WebSockets Hibernation API that allows your MCP server to go to sleep when it’s not receiving requests and instantly wake up when it’s needed. That means that you now only pay for compute when your agent is actually working.
We recently introduced the McpAgent class, which allows developers to build remote MCP servers on Cloudflare by using Durable Objects to maintain stateful connections for every client session. We decided to build McpAgent to be stateful from the start, allowing developers to build servers that can remember context, user preferences, and conversation history. But maintaining client connections means that the session can remain active for a long time, even when it’s not being used.
MCP Agents are hibernate-able by default
You don’t need to change your code to take advantage of hibernation. With our latest SDK update, all McpAgent instances automatically include hibernation support, allowing your stateful MCP servers to sleep during inactive periods and wake up with their state preserved when needed.
How it works
When a request comes in on the Server-Sent Events endpoint, /sse, the Worker initializes a WebSocket connection to the appropriate Durable Object for the session and returns an SSE stream back to the client. All responses flow over this stream.
The implementation leverages the WebSocket Hibernation API within Durable Objects. When periods of inactivity occur, the Durable Object can be evicted from memory while keeping the WebSocket connection open. If the WebSocket later receives a message, the runtime recreates the Durable Object and delivers the message to the appropriate handler.
Durable Objects on free tier
To help you build AI agents on Cloudflare, we’re making Durable Objects available on the free tier, so you can start with zero commitment. With Agents SDK, your AI agents deploy to Cloudflare running on Durable Objects.
Durable Objects offer compute alongside durable storage, that when combined with Workers, unlock stateful, serverless applications. Each Durable Object is a stateful coordinator for handling client real-time interactions, making requests to external services like LLMs, and creating agentic “memory” through state persistence in zero-latency SQLite storage — all tasks required in an AI agent. Durable Objects scale out to millions of agents effortlessly, with each agent created near the user interacting with their agent for fast performance, all managed by Cloudflare.
Zero-latency SQLite storage in Durable Objects was introduced in public beta September 2024 for Birthday Week. Since then, we’ve focused on missing features and robustness compared to pre-existing key-value storage in Durable Objects. We are excited to make SQLite storage generally available, with a 10 GB SQLite database per Durable Object, and recommend SQLite storage for all new Durable Object classes. Durable Objects free tier can only access SQLite storage.
Cloudflare’s free tier allows you to build real-world applications. On the free plan, every Worker request can call a Durable Object. For usage-based pricing, Durable Objects incur compute and storage usage with the following free tier limits.
Workers Free
Workers Paid
Compute: Requests
100,000 / day
1 million / month included
+ $0.15 / million
Compute: Duration
13,000 GB-s / day
400,000 GB-s / month included
+ $12.50 / million GB-s
Storage: Rows read
5 million / day
25 billion / month included
+ $0.001 / million
Storage: Rows written
100,000 / day
50 million / month included
+ $1.00 / million
Storage: SQL stored data
5 GB (total)
5 GB-month included
+ $0.20 / GB-month
Find us at agents.cloudflare.com
We realize this is a lot of information to take in, but don’t worry. Whether you’re new to agents as a whole, or looking to learn more about how Cloudflare can help you build agents, today we launched a new site to help get you started — agents.cloudflare.com.
Let us know what you build!
The collective thoughts of the interwebz
Manage Consent
To provide the best experiences, we use technologies like cookies to store and/or access device information. Consenting to these technologies will allow us to process data such as browsing behavior or unique IDs on this site. Not consenting or withdrawing consent, may adversely affect certain features and functions.
Functional
Always active
The technical storage or access is strictly necessary for the legitimate purpose of enabling the use of a specific service explicitly requested by the subscriber or user, or for the sole purpose of carrying out the transmission of a communication over an electronic communications network.
Preferences
The technical storage or access is necessary for the legitimate purpose of storing preferences that are not requested by the subscriber or user.
Statistics
The technical storage or access that is used exclusively for statistical purposes.The technical storage or access that is used exclusively for anonymous statistical purposes. Without a subpoena, voluntary compliance on the part of your Internet Service Provider, or additional records from a third party, information stored or retrieved for this purpose alone cannot usually be used to identify you.
Marketing
The technical storage or access is required to create user profiles to send advertising, or to track the user on a website or across several websites for similar marketing purposes.