Tag Archives: ios

DarkSword Malware

Post Syndicated from Bruce Schneier original https://www.schneier.com/blog/archives/2026/05/darksword-malware.html

DarkSword is a sophisticated piece of malware—probably government designed—that targets iOS.

Google Threat Intelligence Group (GTIG) has identified a new iOS full-chain exploit that leveraged multiple zero-day vulnerabilities to fully compromise devices. Based on toolmarks in recovered payloads, we believe the exploit chain to be called DarkSword. Since at least November 2025, GTIG has observed multiple commercial surveillance vendors and suspected state-sponsored actors utilizing DarkSword in distinct campaigns. These threat actors have deployed the exploit chain against targets in Saudi Arabia, Turkey, Malaysia, and Ukraine.

DarkSword supports iOS versions 18.4 through 18.7 and utilizes six different vulnerabilities to deploy final-stage payloads. GTIG has identified three distinct malware families deployed following a successful DarkSword compromise: GHOSTBLADE, GHOSTKNIFE, and GHOSTSABER. The proliferation of this single exploit chain across disparate threat actors mirrors the previously discovered Coruna iOS exploit kit. Notably, UNC6353, a suspected Russian espionage group previously observed using Coruna, has recently incorporated DarkSword into their watering hole campaigns.

A week after it was identified, a version of it leaked onto the internet, where it is being used more broadly.

This news is a month old. Your devices are safe, assuming you patch regularly.

Record, generate, run: AI-powered UI test generation for iOS

Post Syndicated from Grab Tech original https://engineering.grab.com/ios

Introduction

In our recent AutoTrack SDK blog post, we shared how we solved the challenge of capturing complete user journeys across our mobile app. One of the most promising applications we highlighted was automating iOS UI (User Interface) test case generation using the rich interaction data to automatically create test scripts that mimic real-world usage patterns.

Our vision has become a reality with the development of the Mobile UI Testing AI Workflow for iOS. This system lets developers record their interactions with the app and, within minutes, receive complete, executable UI test code. This code includes essential components such as mocks, feature flags, and analytics verification. In this post, we will explore how we brought this system to life, the architecture we selected, and the valuable lessons we learned throughout the process.

The problem: UI tests are expensive to write

Writing UI tests manually is time-consuming and repetitive. Developers typically spend days:

  • Writing test code line by line.
  • Creating mock data and API responses.
  • Configuring feature flags and test environments.
  • Maintaining tests when the UI changes.

Even more concerning is that this effort often leads to incomplete coverage. Teams prioritise critical flows and leave edge cases untested. When bugs surface in production, reproducing them requires piecing together user journeys from fragmented data, which is exactly the problem AutoTrack was designed to solve.

This prompts us to ask: What if we could turn AutoTrack’s recorded user journeys directly into UI tests?

The solution: From recording to an automatically AI-Generated test

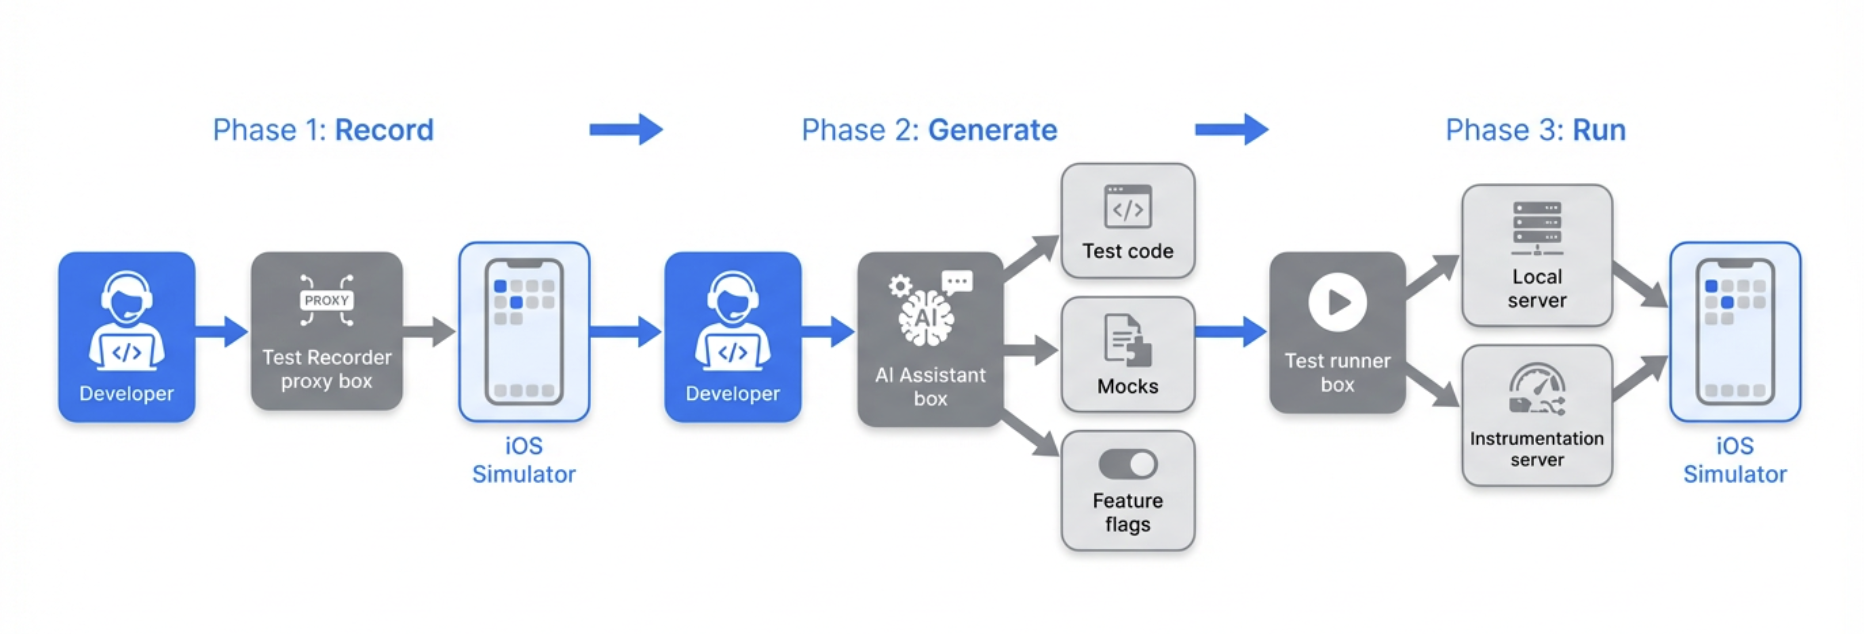
The core idea is simple: Record what you do → AI writes the test code → Run your tests.

Instead of manually instrumenting every tap and swipe, developers interact with the app on a simulator while a Test recorder captures their actions. An AI assistant then analyses the recording and generates:

  1. Test files: Xcode test-based UI test code that replays the recorded flow.
  2. API mocks: Simulated backend responses based on network requests captured during recording.
  3. Feature flag configuration: Exact feature flag state from the recording session.
  4. Analytics expectations: Verification that expected events are triggered during the test.

All of this is generated in the correct directories and formats, ready to run against the existing test infrastructure.

How we built it: Architecture overview

The workflow combines four main components:

1. Test recorder (simple proxy server)

A simple proxy that runs locally during recording. It captures all API requests and responses as the developer interacts with the app, and exposes this data for the AI to use when generating mocks.

2. AI-Powered code generation

We use an AI-assisted development environment with a custom workflow prompt. The prompt instructs the AI to:

  • Reset the recorder before each recording session.
  • Fetch and analyse the recorded flow data.
  • Generate Swift test code following our project’s conventions.
  • Create mock expectation classes for captured API calls.
  • Produce feature flag configuration files.
  • Add analytics event expectations where applicable.

The AI comprehends our test structure, including the “Given-When-Then” organization, base test classes, and helper utilities, ensuring that the generated code integrates seamlessly into the existing codebase.

3. Test execution infrastructure

Generated tests run against our existing UI test stack:

  • Local server: Mocks API responses during UI test execution.
  • Instrumentation server: Validates that expected analytics events are triggered during test runs.
  • Build system: Compiles and organises the iOS project.

No new infrastructure was required as we designed the workflow to plug into what we already have.

4. Developer workflow integration

The workflow is designed to fit into a developer’s normal flow:

  1. Setup: Start the recorder and required services (one-time or per session).
  2. Record: Interact with the app on a simulator while the recorder captures actions.
  3. Generate: Ask the AI to generate the test; it fetches recording data and produces the files.
  4. Verify: Review the generated code, run the test locally, and iterate.

The entire cycle from “I want to test this flow” to “I have a passing test” typically takes 10–20 minutes, compared to days for manual test writing.

Figure 1. Developer testing workflow.

What gets generated

The AI produces exactly three linked files per test:

File Purpose
Test expectations Mocks all network API requests captured during recording with JSON response bodies
Feature flags Recreates the exact feature flag state from the recording session
UI test class Complete test that replays the recorded user flow with analytics validation

The files are placed in the correct directories for our project structure and use our standard base classes and helpers.
The AI also uses an AIUITestUtils (Common AI Utilities functions) helper that supports:

  • Coordinate-based tapping: When accessibility IDs are unavailable, taps use recorded coordinates.
  • Swipe gestures: Pan and scroll interactions.
  • Keyboard input: Text entry for search fields and forms.

Example: API Mock (JSON response)

When the Test Recorder captures an API call during your session, the AI generates mock data from the actual response. Here’s a simplified template of the structure:


{
  "endpoint": "/api/v1/example-resource",
  "method": "GET",
  "statusCode": 200,
  "response": {
    "items": [
      {
        "id": "item-001",
        "title": "Example Item",
        "metadata": {}
      }
    ]
  }
}

Example: User steps (recorded interactions)


{
  "steps": [
    {
      "action": "tap",
      "timestamp": "2025-01-15T10:30:01.000Z",
      "element": {
        "accessibilityId": "button_primary",
        "screenName": "home"
      }
    },
    {
      "action": "type",
      "timestamp": "2025-01-15T10:30:02.500Z",
      "text": "sample input",
      "element": {
        "accessibilityId": "input_field",
        "screenName": "form"
      }
    },
    {
      "action": "swipe",
      "timestamp": "2025-01-15T10:30:05.000Z",
      "direction": "up",
      "element": {
        "accessibilityId": "scroll_view",
        "screenName": "list"
      }
    }
  ]
}

Example: Generated test structure

func testSearchFlow() {
    // GIVEN: Backend expectations (mocks from recording)
    let expectations = SearchTestExpectations()
    composer.setupExpectations(factories: [expectations])

    // WHEN: Launch app and execute recorded flow
    let app = launchApp(featureFlags: SearchFeatureFlags.capturedFlags)
    let utils = TestUtils(app: app)

    utils.tapElement(identifier: "searchBar")
    utils.typeText("pizza")
    utils.tapElement(identifier: "searchButton")

    // THEN: Add assertions
    let resultsList = app.tables["searchResults"]
    XCTAssertTrue(resultsList.waitForExistence(timeout: 5.0))
    XCTAssertGreaterThan(resultsList.cells.count, 0)
}

Enabling event verification

A key requirement was verifying that analytics events fire correctly during tests. We extended the workflow to support instrumentation testing. This ensures that tests validate not only on UI behaviour but also that the right analytics are emitted for product and data teams. The process of instrumentation testing is as follows:

  1. The instrumentation server runs locally and receives analytics events from the app during test execution.
  2. The AI captures expected events from the recording and adds them to the generated test.
  3. The test uses our event validation helper to assert that all expected events are triggered within a timeout.

Lessons learned and best practices

AI generates a starting point, not production-ready tests

The AI produces sample code that demonstrates mocking patterns, user interactions, and element identification. Developers are required to:

  • Add UI assertions: The AI often leaves assertion sections empty; you need to verify expected outcomes.
  • Replace Thread.sleep(): Generated code may include fixed delays; these should be replaced with waitForExistence() to avoid flakiness.
  • Improve element identification: When accessibility IDs are missing, the AI falls back to coordinates; adding proper IDs in the app improves reliability.
  • Validate locally: Run tests multiple times (5–10 runs) before pushing to CI to catch flakiness.

These practices have been documented to ensure teams know exactly what to review before committing their code.

Recording quality matters

Clean recordings produce better tests. We recommend these best practices:

  • Record one flow at a time: Avoid mixing multiple flows in a single session.
  • Proceed deliberately: Allow screens to load fully before interacting; unintentional clicks get recorded.
  • Use two simulators: One for recording (including login), one for running tests, since the login state can reset between runs.
  • Configure feature flags beforehand: Set flags on the experiment portal before recording so mocks match the intended state.

The human-in-the-loop is essential

We explicitly advise against pushing AI-generated tests directly to CI. The workflow accelerates test creation. However, human review ensures:

  • Assertions are meaningful.
  • Tests are not flaky.
  • Code follows team standards.
  • Edge cases and error scenarios are covered.

Key takeaways

As we reflect on our journey, several critical insights have emerged:

  • Leverage AutoTrack’s data: User journey recordings are rich enough to drive automated test generation when combined with the right tooling and prompts.
  • Streamlined workflow: The “Record → Generate → Review” process significantly reduces the need for manual coding, though human oversight remains essential to ensure quality and reliability.
  • Integration with existing systems: By aligning with our current testing infrastructure, like the local API mocking server, instrumentation server, and build system, we avoided the need to develop new systems, thereby speeding up adoption.
  • Establish clear guidelines: Providing explicit instructions on what to add, replace, and validate ensures that teams can utilize AI-generated tests safely and effectively.

In conclusion, the Mobile UI Testing AI Workflow is now available to our iOS teams, enhancing our testing capabilities and efficiency.

Join us

Grab is a leading superapp in Southeast Asia, operating across the deliveries, mobility, and digital financial services sectors, serving over 900 cities in eight Southeast Asian countries: Cambodia, Indonesia, Malaysia, Myanmar, the Philippines, Singapore, Thailand, and Vietnam. Grab enables millions of people every day to order food or groceries, send packages, hail a ride or taxi, pay for online purchases or access services such as lending and insurance, all through a single app. We operate supermarkets in Malaysia under Jaya Grocer and Everrise, which enables us to bring the convenience of on-demand grocery delivery to more consumers in the country. As part of our financial services offerings, we also provide digital banking services through GXS Bank in Singapore and GXBank in Malaysia. Grab was founded in 2012 with the mission to drive Southeast Asia forward by creating economic empowerment for everyone. Grab strives to serve a triple bottom line. We aim to simultaneously deliver financial performance for our shareholders and have a positive social impact, which includes economic empowerment for millions of people in the region, while mitigating our environmental footprint.

Powered by technology and driven by heart, our mission is to drive Southeast Asia forward by creating economic empowerment for everyone. If this mission speaks to you, join our team today!

Record, generate, run: AI-powered UI test generation for iOS

Post Syndicated from Grab Tech original https://engineering.grab.com/ai-test-generation-ios

Introduction

In our recent AutoTrack SDK blog post, we shared how we solved the challenge of capturing complete user journeys across our mobile app. One of the most promising applications we highlighted was automating iOS UI (User Interface) test case generation using the rich interaction data to automatically create test scripts that mimic real-world usage patterns.

Our vision has become a reality with the development of the Mobile UI Testing AI Workflow for iOS. This system lets developers record their interactions with the app and, within minutes, receive complete, executable UI test code. This code includes essential components such as mocks, feature flags, and analytics verification. In this post, we will explore how we brought this system to life, the architecture we selected, and the valuable lessons we learned throughout the process.

The problem: UI tests are expensive to write

Writing UI tests manually is time-consuming and repetitive. Developers typically spend days:

  • Writing test code line by line.
  • Creating mock data and API responses.
  • Configuring feature flags and test environments.
  • Maintaining tests when the UI changes.

Even more concerning is that this effort often leads to incomplete coverage. Teams prioritise critical flows and leave edge cases untested. When bugs surface in production, reproducing them requires piecing together user journeys from fragmented data, which is exactly the problem AutoTrack was designed to solve.

This prompts us to ask: What if we could turn AutoTrack’s recorded user journeys directly into UI tests?

The solution: From recording to an automatically AI-Generated test

The core idea is simple: Record what you do → AI writes the test code → Run your tests.

Instead of manually instrumenting every tap and swipe, developers interact with the app on a simulator while a Test recorder captures their actions. An AI assistant then analyses the recording and generates:

  1. Test files: Xcode test-based UI test code that replays the recorded flow.
  2. API mocks: Simulated backend responses based on network requests captured during recording.
  3. Feature flag configuration: Exact feature flag state from the recording session.
  4. Analytics expectations: Verification that expected events are triggered during the test.

All of this is generated in the correct directories and formats, ready to run against the existing test infrastructure.

How we built it: Architecture overview

The workflow combines four main components:

1. Test recorder (simple proxy server)

A simple proxy that runs locally during recording. It captures all API requests and responses as the developer interacts with the app, and exposes this data for the AI to use when generating mocks.

2. AI-Powered code generation

We use an AI-assisted development environment with a custom workflow prompt. The prompt instructs the AI to:

  • Reset the recorder before each recording session.
  • Fetch and analyse the recorded flow data.
  • Generate Swift test code following our project’s conventions.
  • Create mock expectation classes for captured API calls.
  • Produce feature flag configuration files.
  • Add analytics event expectations where applicable.

The AI comprehends our test structure, including the “Given-When-Then” organization, base test classes, and helper utilities, ensuring that the generated code integrates seamlessly into the existing codebase.

3. Test execution infrastructure

Generated tests run against our existing UI test stack:

  • Local server: Mocks API responses during UI test execution.
  • Instrumentation server: Validates that expected analytics events are triggered during test runs.
  • Build system: Compiles and organises the iOS project.

No new infrastructure was required as we designed the workflow to plug into what we already have.

4. Developer workflow integration

The workflow is designed to fit into a developer’s normal flow:

  1. Setup: Start the recorder and required services (one-time or per session).
  2. Record: Interact with the app on a simulator while the recorder captures actions.
  3. Generate: Ask the AI to generate the test; it fetches recording data and produces the files.
  4. Verify: Review the generated code, run the test locally, and iterate.

The entire cycle from “I want to test this flow” to “I have a passing test” typically takes 10–20 minutes, compared to days for manual test writing.

Figure 1. Developer testing workflow.

What gets generated

The AI produces exactly three linked files per test:

File Purpose
Test expectations Mocks all network API requests captured during recording with JSON response bodies
Feature flags Recreates the exact feature flag state from the recording session
UI test class Complete test that replays the recorded user flow with analytics validation

The files are placed in the correct directories for our project structure and use our standard base classes and helpers.
The AI also uses an AIUITestUtils (Common AI Utilities functions) helper that supports:

  • Coordinate-based tapping: When accessibility IDs are unavailable, taps use recorded coordinates.
  • Swipe gestures: Pan and scroll interactions.
  • Keyboard input: Text entry for search fields and forms.

Example: API Mock (JSON response)

When the Test Recorder captures an API call during your session, the AI generates mock data from the actual response. Here’s a simplified template of the structure:


{
  "endpoint": "/api/v1/example-resource",
  "method": "GET",
  "statusCode": 200,
  "response": {
    "items": [
      {
        "id": "item-001",
        "title": "Example Item",
        "metadata": {}
      }
    ]
  }
}

Example: User steps (recorded interactions)


{
  "steps": [
    {
      "action": "tap",
      "timestamp": "2025-01-15T10:30:01.000Z",
      "element": {
        "accessibilityId": "button_primary",
        "screenName": "home"
      }
    },
    {
      "action": "type",
      "timestamp": "2025-01-15T10:30:02.500Z",
      "text": "sample input",
      "element": {
        "accessibilityId": "input_field",
        "screenName": "form"
      }
    },
    {
      "action": "swipe",
      "timestamp": "2025-01-15T10:30:05.000Z",
      "direction": "up",
      "element": {
        "accessibilityId": "scroll_view",
        "screenName": "list"
      }
    }
  ]
}

Example: Generated test structure

func testSearchFlow() {
    // GIVEN: Backend expectations (mocks from recording)
    let expectations = SearchTestExpectations()
    composer.setupExpectations(factories: [expectations])

    // WHEN: Launch app and execute recorded flow
    let app = launchApp(featureFlags: SearchFeatureFlags.capturedFlags)
    let utils = TestUtils(app: app)

    utils.tapElement(identifier: "searchBar")
    utils.typeText("pizza")
    utils.tapElement(identifier: "searchButton")

    // THEN: Add assertions
    let resultsList = app.tables["searchResults"]
    XCTAssertTrue(resultsList.waitForExistence(timeout: 5.0))
    XCTAssertGreaterThan(resultsList.cells.count, 0)
}

Enabling event verification

A key requirement was verifying that analytics events fire correctly during tests. We extended the workflow to support instrumentation testing. This ensures that tests validate not only on UI behaviour but also that the right analytics are emitted for product and data teams. The process of instrumentation testing is as follows:

  1. The instrumentation server runs locally and receives analytics events from the app during test execution.
  2. The AI captures expected events from the recording and adds them to the generated test.
  3. The test uses our event validation helper to assert that all expected events are triggered within a timeout.

Lessons learned and best practices

AI generates a starting point, not production-ready tests

The AI produces sample code that demonstrates mocking patterns, user interactions, and element identification. Developers are required to:

  • Add UI assertions: The AI often leaves assertion sections empty; you need to verify expected outcomes.
  • Replace Thread.sleep(): Generated code may include fixed delays; these should be replaced with waitForExistence() to avoid flakiness.
  • Improve element identification: When accessibility IDs are missing, the AI falls back to coordinates; adding proper IDs in the app improves reliability.
  • Validate locally: Run tests multiple times (5–10 runs) before pushing to CI to catch flakiness.

These practices have been documented to ensure teams know exactly what to review before committing their code.

Recording quality matters

Clean recordings produce better tests. We recommend these best practices:

  • Record one flow at a time: Avoid mixing multiple flows in a single session.
  • Proceed deliberately: Allow screens to load fully before interacting; unintentional clicks get recorded.
  • Use two simulators: One for recording (including login), one for running tests, since the login state can reset between runs.
  • Configure feature flags beforehand: Set flags on the experiment portal before recording so mocks match the intended state.

The human-in-the-loop is essential

We explicitly advise against pushing AI-generated tests directly to CI. The workflow accelerates test creation. However, human review ensures:

  • Assertions are meaningful.
  • Tests are not flaky.
  • Code follows team standards.
  • Edge cases and error scenarios are covered.

Key takeaways

As we reflect on our journey, several critical insights have emerged:

  • Leverage AutoTrack’s data: User journey recordings are rich enough to drive automated test generation when combined with the right tooling and prompts.
  • Streamlined workflow: The “Record → Generate → Review” process significantly reduces the need for manual coding, though human oversight remains essential to ensure quality and reliability.
  • Integration with existing systems: By aligning with our current testing infrastructure, like the local API mocking server, instrumentation server, and build system, we avoided the need to develop new systems, thereby speeding up adoption.
  • Establish clear guidelines: Providing explicit instructions on what to add, replace, and validate ensures that teams can utilize AI-generated tests safely and effectively.

In conclusion, the Mobile UI Testing AI Workflow is now available to our iOS teams, enhancing our testing capabilities and efficiency.

Join us

Grab is a leading superapp in Southeast Asia, operating across the deliveries, mobility, and digital financial services sectors, serving over 900 cities in eight Southeast Asian countries: Cambodia, Indonesia, Malaysia, Myanmar, the Philippines, Singapore, Thailand, and Vietnam. Grab enables millions of people every day to order food or groceries, send packages, hail a ride or taxi, pay for online purchases or access services such as lending and insurance, all through a single app. We operate supermarkets in Malaysia under Jaya Grocer and Everrise, which enables us to bring the convenience of on-demand grocery delivery to more consumers in the country. As part of our financial services offerings, we also provide digital banking services through GXS Bank in Singapore and GXBank in Malaysia. Grab was founded in 2012 with the mission to drive Southeast Asia forward by creating economic empowerment for everyone. Grab strives to serve a triple bottom line. We aim to simultaneously deliver financial performance for our shareholders and have a positive social impact, which includes economic empowerment for millions of people in the region, while mitigating our environmental footprint.

Powered by technology and driven by heart, our mission is to drive Southeast Asia forward by creating economic empowerment for everyone. If this mission speaks to you, join our team today!

Possible US Government iPhone Hacking Tool Leaked

Post Syndicated from Bruce Schneier original https://www.schneier.com/blog/archives/2026/04/possible-us-government-iphone-hacking-tool-leaked.html

Wired writes (alternate source):

Security researchers at Google on Tuesday released a report describing what they’re calling “Coruna,” a highly sophisticated iPhone hacking toolkit that includes five complete hacking techniques capable of bypassing all the defenses of an iPhone to silently install malware on a device when it visits a website containing the exploitation code. In total, Coruna takes advantage of 23 distinct vulnerabilities in iOS, a rare collection of hacking components that suggests it was created by a well-resourced, likely state-sponsored group of hackers.

[…]

Coruna’s code also appears to have been originally written by English-speaking coders, notes iVerify’s cofounder Rocky Cole. “It’s highly sophisticated, took millions of dollars to develop, and it bears the hallmarks of other modules that have been publicly attributed to the US government,” Cole tells WIRED. “This is the first example we’ve seen of very likely US government tools­based on what the code is telling us­spinning out of control and being used by both our adversaries and cybercriminal groups.”

TechCrunch reports that Coruna is definitely of US origin:

Two former employees of government contractor L3Harris told TechCrunch that Coruna was, at least in part, developed by the company’s hacking and surveillance tech division, Trenchant. The two former employees both had knowledge of the company’s iPhone hacking tools. Both spoke on condition of anonymity because they weren’t authorized to talk about their work for the company.

It’s always super interesting to see what malware looks like when it’s created through a professional software development process. And the TechCrunch article has some speculation as to how the US lost control of it. It seems that an employee of L3Harris’s surviellance tech division, Trenchant, sold it to the Russian government.

Demystifying user journeys: Revolutionizing troubleshooting with auto tracking

Post Syndicated from Grab Tech original https://engineering.grab.com/auto-track-sdk

Introduction

Troubleshooting critical issues by deciphering a user’s journey on the Grab app is an extremely challenging task. With countless user journeys and multiple paths through the User Interface (UI), it’s akin to searching for a needle in a vast haystack. This challenge frequently resonates with us, the dedicated developers at Grab, as we strive to understand user behaviors, views, and interactions.

The challenge

The distinction between resolving an issue effectively versus spending hours on a wild goose chase is understanding our user journey in real-time.

The development team initially attempted to address the issue of the incomplete user journey tracking by implementing a system where a click stream event would be sent with every user interaction. However, this approach presented significant challenges due to the sheer volume of UI components—often numbering in the hundreds—and the reliance on individual developers to correctly instrument each one.

A common pitfall was that developers would occasionally overlook or forget to instrument certain user interactions, leading to breaks in the recorded user journey. This created a highly frustrating situation for both the development and product teams, as the integrity of the user journey data was consistently compromised. Despite continuous efforts to patch these bugs and address the omissions, the team found themselves in a perpetual state of reaction, constantly trying to catch up with newly discovered breaches rather than proactively preventing them. This reactive approach consumed valuable resources and hindered the ability to gain a complete and accurate understanding of user behavior.

Diagnosing system failures, application bugs, or poor user experiences in complex applications becomes inefficient without real-time performance metrics and detailed session tracking. When engineering teams rely on outdated or fragmented data, they are forced to piece together issue narratives reactively, long after the issues occur. This significantly delays the Mean Time To Resolution (MTTR). Such a reactive approach leads to increased downtime, higher operational costs, customer dissatisfaction, and a waste of developers’ time, as they spend more time “hunting” for clues rather than deploying solutions or new features.

Our ‘Eureka’ moment: AutoTrack SDK

The pivotal breakthrough that provides our unique advantage was the creation of auto tracking user journeys—our “Eureka” moment. To deliver this, we developed the new Software Development Kit (SDK) called AutoTrack.

AutoTrack is system that comprehensively records application state, UI view state, as well as user interactions – a solution that pieces together a chronicle of the user journey, from launch to interactions, as they navigate through the screens. AutoTrack SDK is built on the three core pillars:

  1. Application state
  2. User interactions
  3. UI screens

Let’s delve deeper into the mechanics of how this operates.

Application state

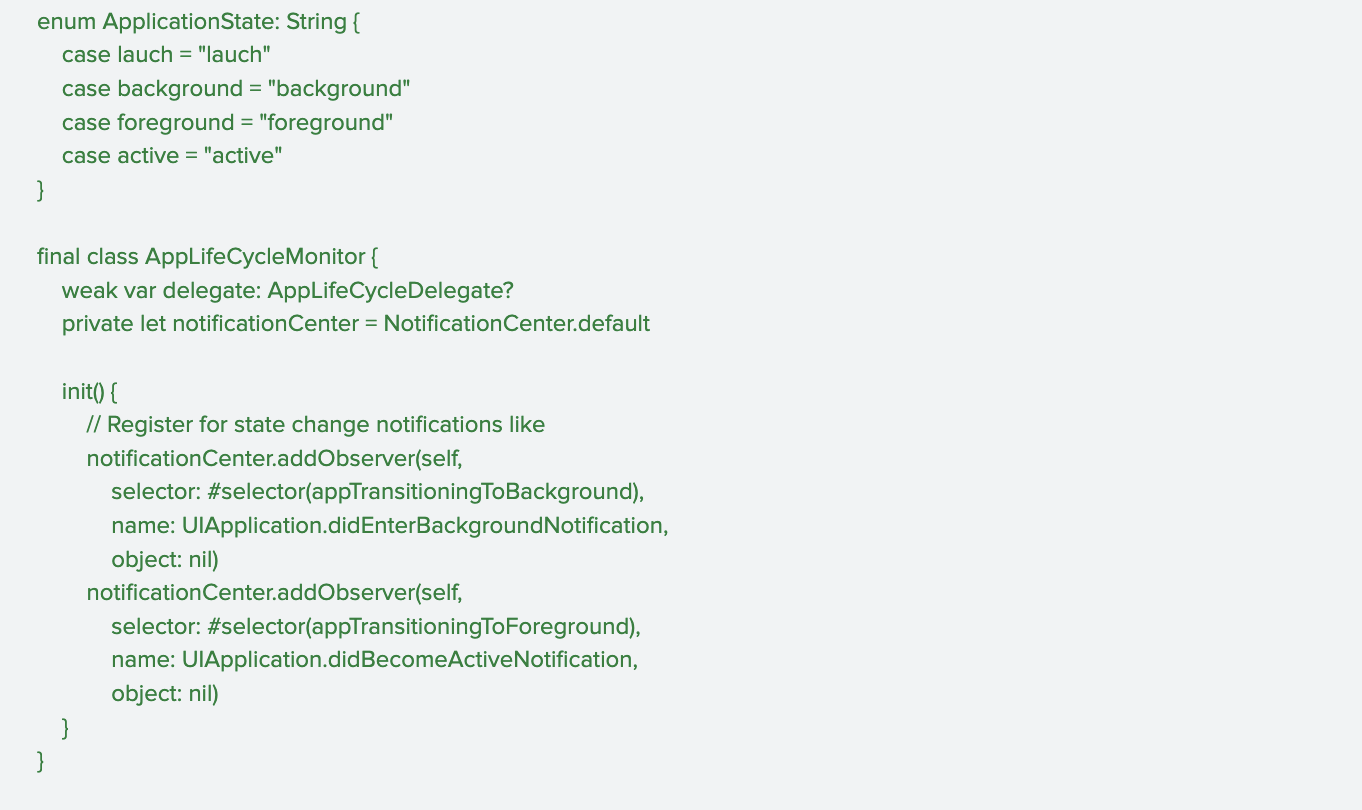
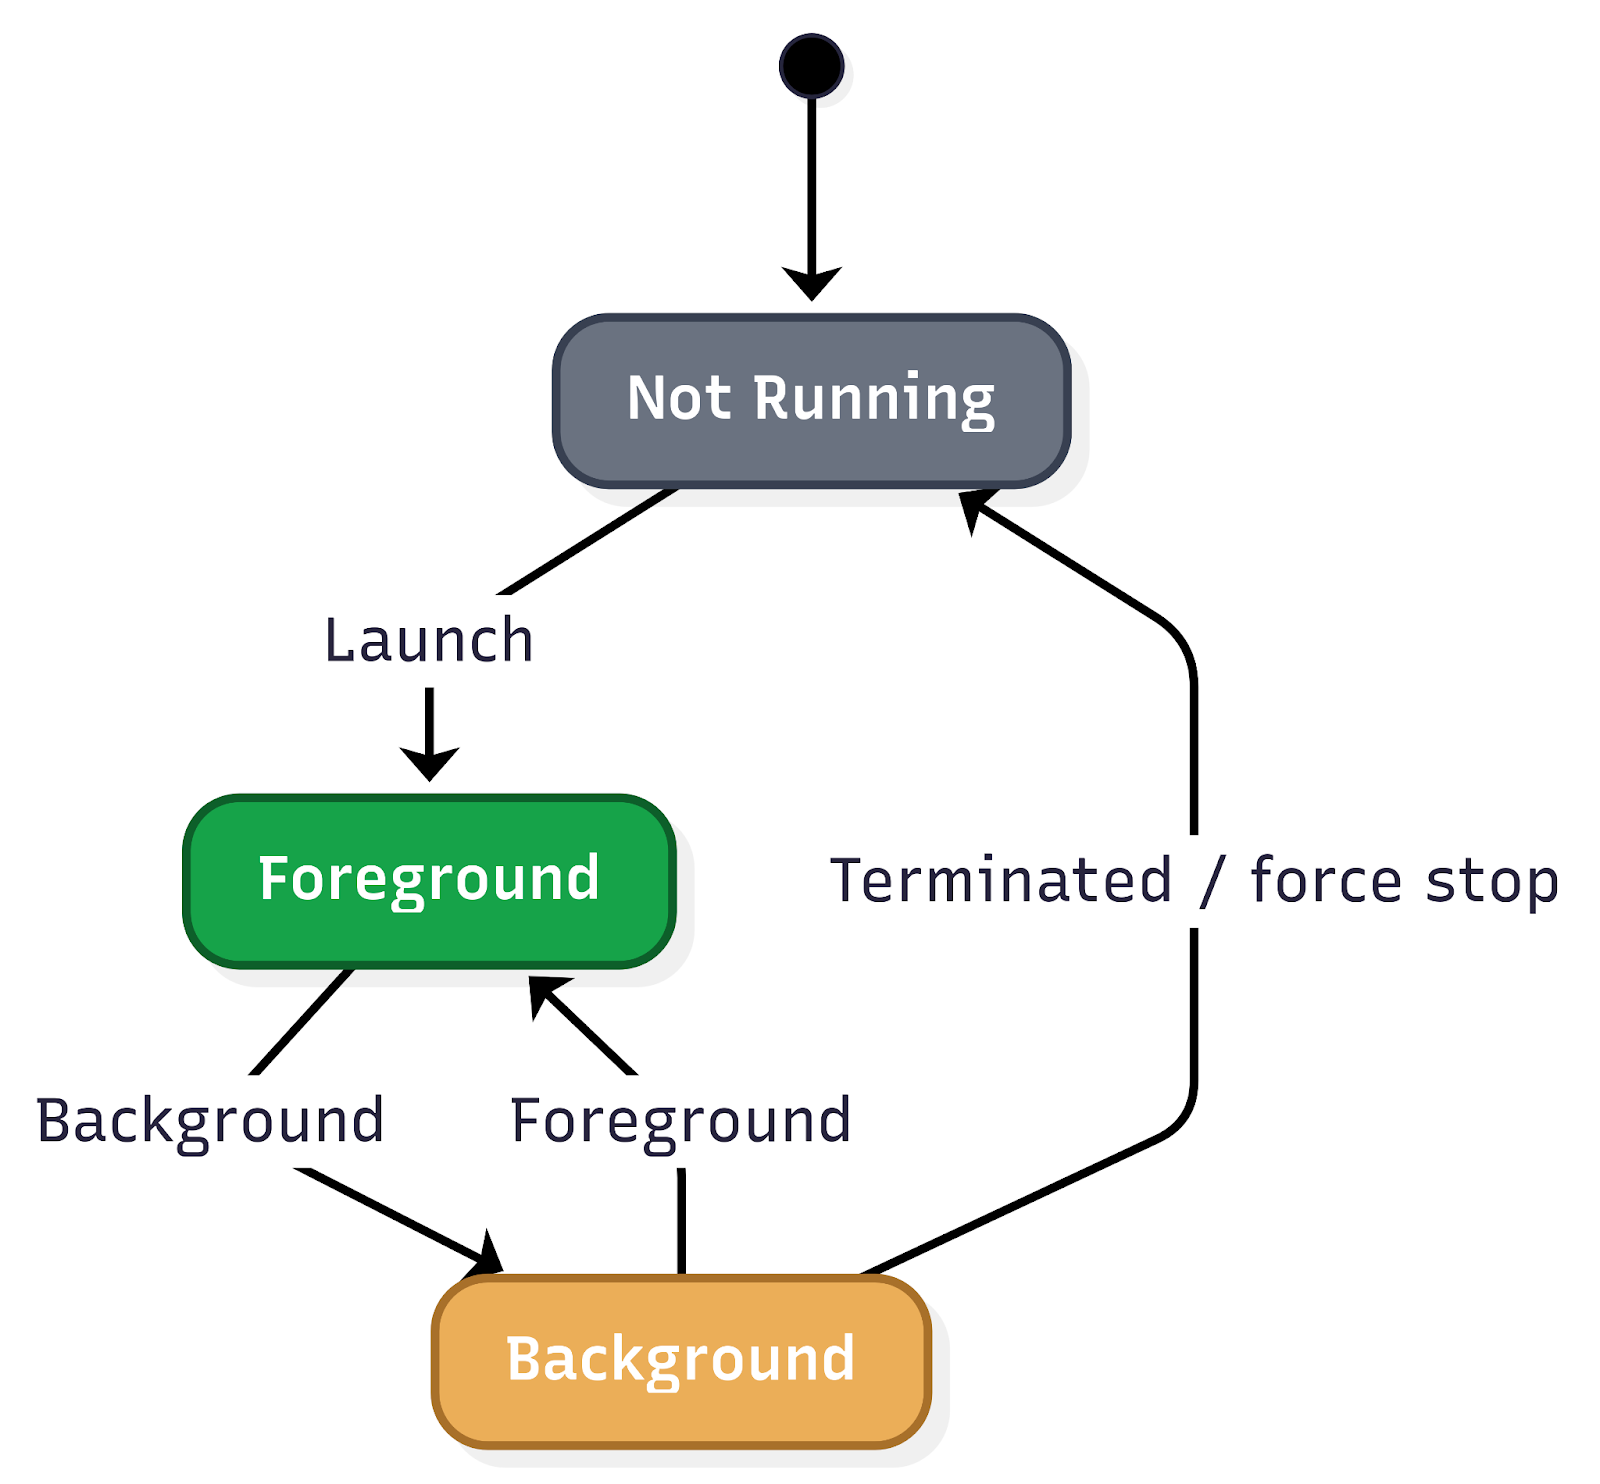
Understanding the application state is fundamental to comprehending user behavior and, consequently, executing effective troubleshooting. The application state provides crucial insights into how a user interacts with the app, particularly concerning its visibility and how it was initiated. This encompasses tracking when the app moves between the background and foreground, as well as the various launch mechanisms.

Figure 1. Application state user flow.

Key aspects of application state that are vital to monitor include:
Application lifecycle transitions:

  • Background state: When the app is running but not actively displayed to the user (e.g., the user switches to another app, or the device is locked). Understanding how frequently and for how long an app resides in the background can inform power consumption analysis and the effectiveness of background tasks.
  • Foreground state: When the app is actively in use and displayed to the user. Monitoring transitions into and out of the foreground provides a real-time view of user engagement.
  • Inactive state: A temporary state where the app is in the foreground but not receiving events (e.g., an incoming call temporarily interrupts the app).
  • Suspended state: An app that is in the background and has been explicitly suspended by the operating system to free up resources.
  • Terminated state: When the app has been completely closed or crashed. Differentiating between intentional termination and crashes is critical for identifying stability issues.

Application launch mechanisms:

The way an app is launched significantly impacts the initial user experience and can influence subsequent interactions. Tracking these different launch types is essential for understanding user entry points and for debugging issues that might be specific to a particular launch method.

  • Explicit user launch: This is the most straightforward launch mechanism, where the user directly taps on the app icon from their device’s home screen or app drawer. This indicates a deliberate intent to use the app and often signifies a primary entry point for regular users.
  • Deeplinks: Deeplinks are URLs that, when clicked, open a specific page or section within a mobile app rather than a web page. They are powerful tools for enhancing user experience and engagement by providing direct access to relevant content.
  • Push notifications: Push notifications are messages sent by an app to a user’s device even when the app is not actively in use. Tapping on a push notification often launches the app and directs the user to a specific context related to the notification’s content.
Figure 2. Code sample for tracking application lifecycle transition.

User interactions

Real-time session tracking is a crucial component in understanding user behavior and optimizing app performance. By meticulously tracking a wide array of user interactions, the system provides invaluable insights into how users navigate and engage with the app. This granular data forms the bedrock for constructing comprehensive user journeys, allowing development teams to visualise the path a user takes from their initial entry point to achieving their goals within the app.

This deep understanding of user interactions is the most important pillar in creating accurate and insightful user journey maps. These maps, in turn, are instrumental in identifying patterns of user behavior, both positive and negative. For instance, tracking helps to identify pain points, bugs, or areas of confusion that might lead to user frustration or abandonment.

Figure 3. Sample code for real-time session tracking.

UI screen

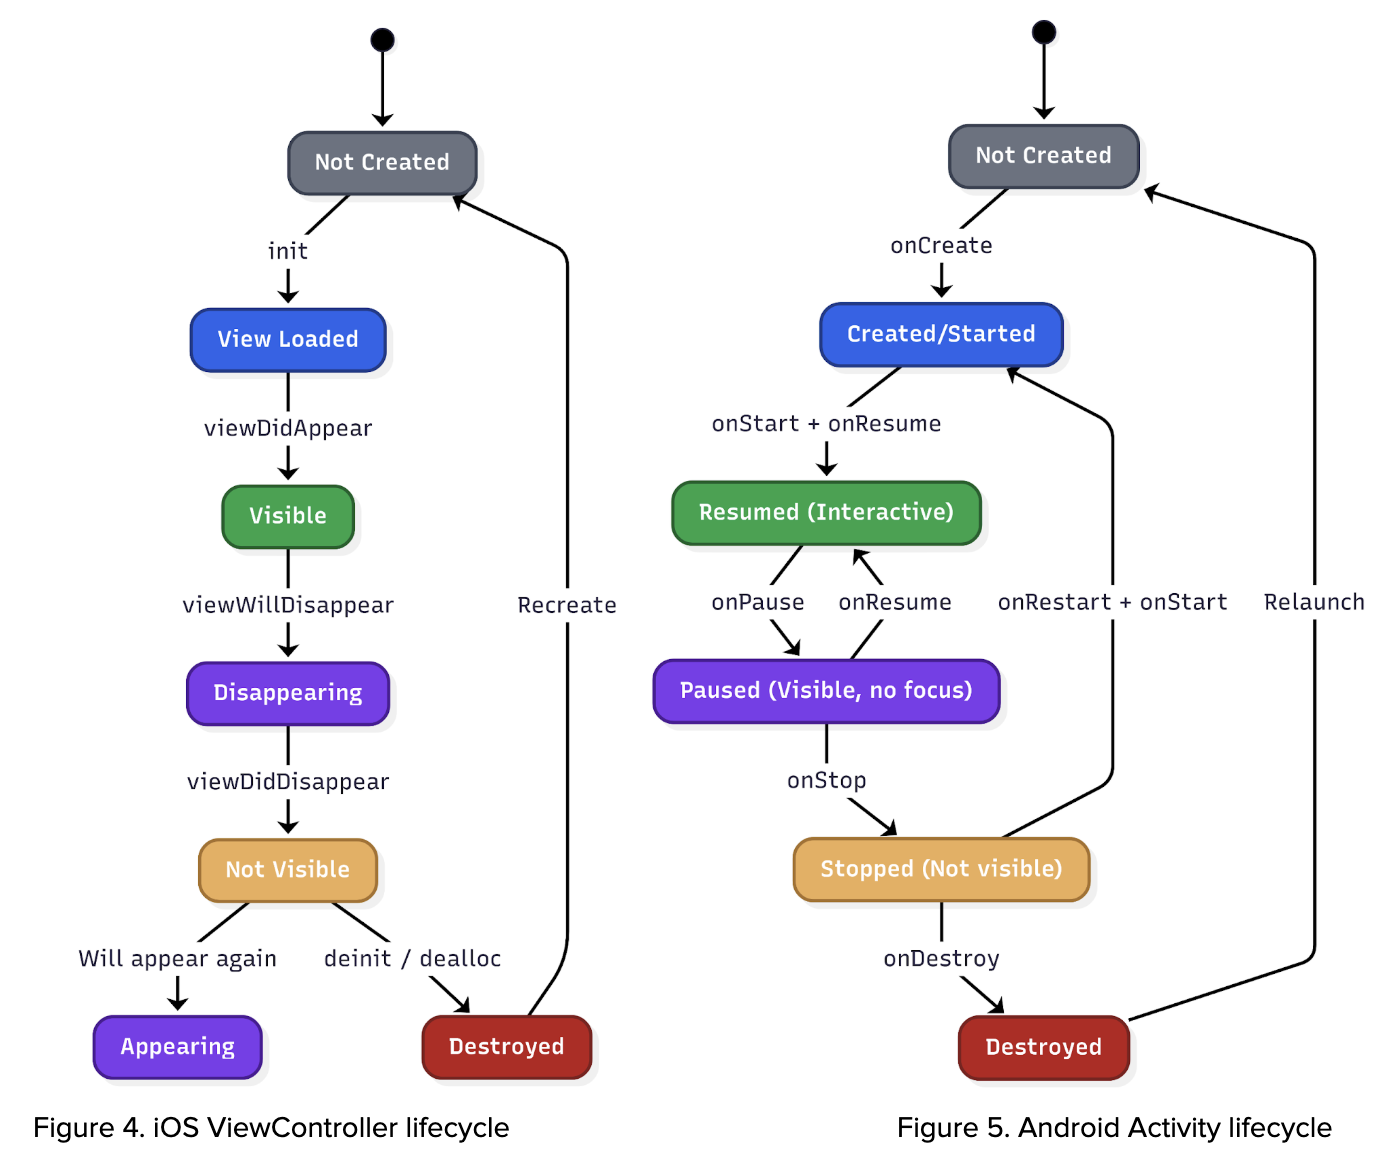
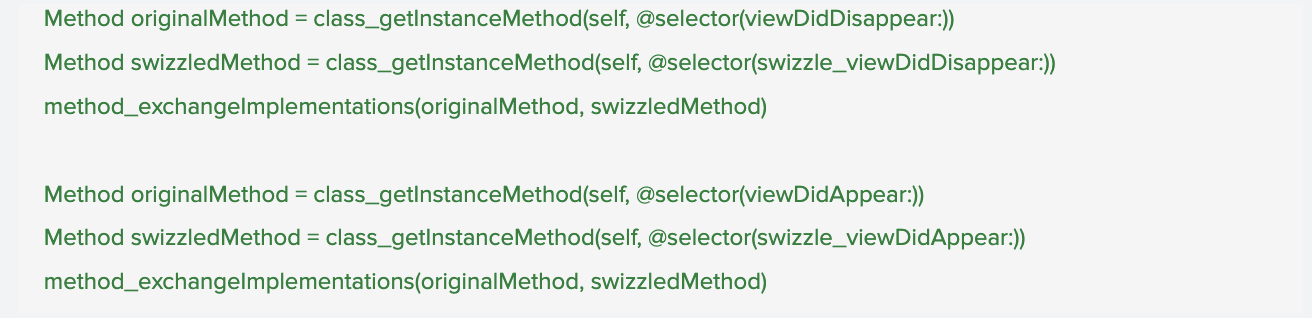
The system leverages lifecycle events from UIViewController (iOS), Activity (Android), and Fragments (Android) to accurately identify and track which specific screen is currently displayed to the user. This granular level of screen tracking is crucial because it significantly enriches the contextual information available to us. By understanding the precise UI that users are interacting with, we can account for the dynamic nature of our app. Different geographical regions, diverse user segments, and varying operational scenarios can lead to distinct user interfaces being presented. This capability ensures that our analysis and troubleshooting efforts are always based on the actual user experience, allowing for more precise problem identification and more effective solutions.

Figure 6. Sample code of UIViewController configuration.

UI screen data

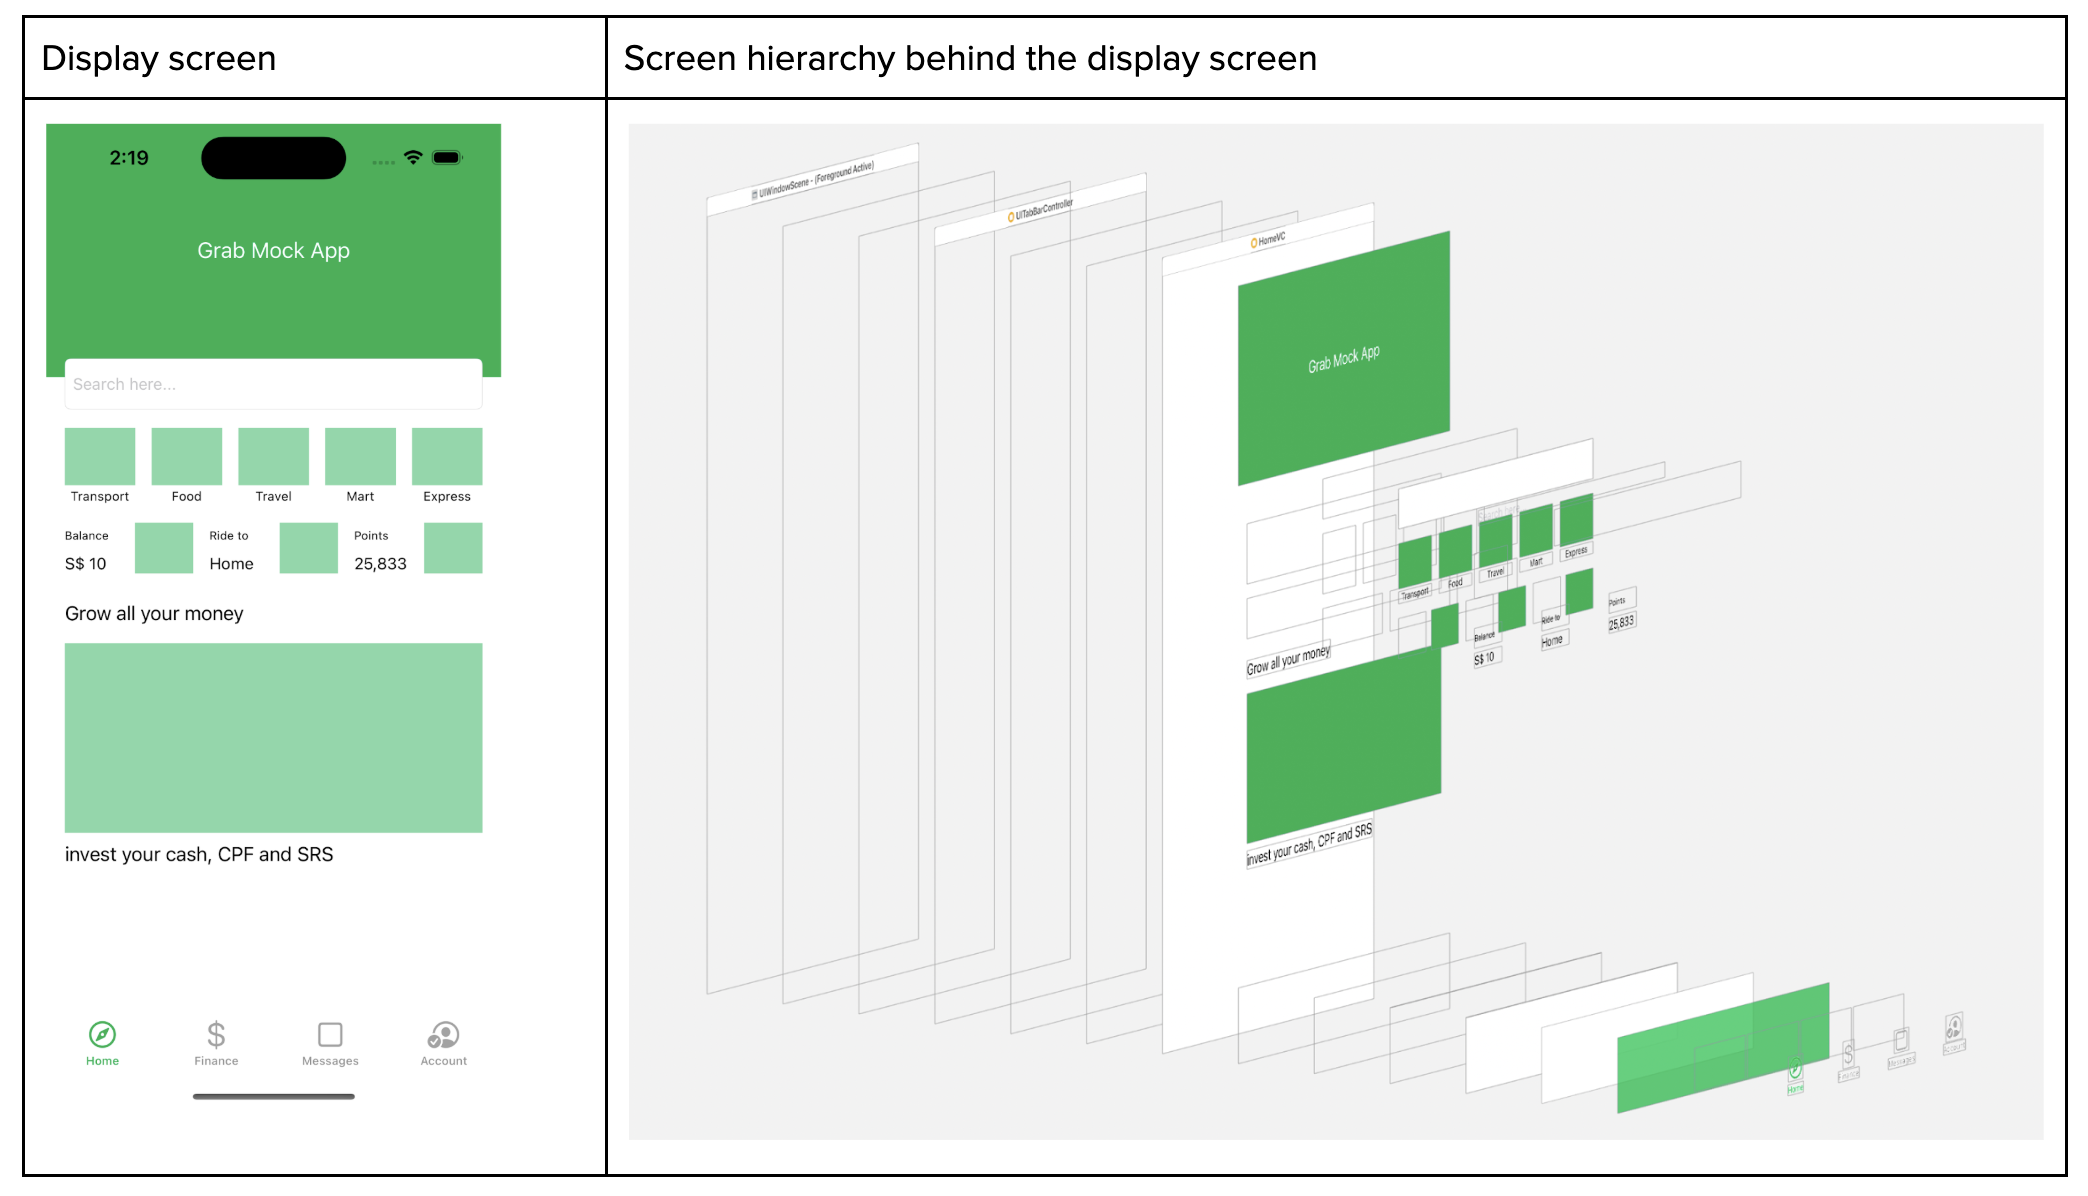
On top of that, whenever the screen appears, we capture the screen metadata where we read the full screen hierarchy. With the Screen hierarchy JSON data at hand, we employ it to train an AI model. This model, consequently, can generate an HTML file, which mirrors the user’s screen and interaction.

Disclaimer: information is redacted in compliance with GDPR/PDPA, personal data protection laws.

Figure 7. Screen hierarchy.

Applications of AutoTrack

Key applications of AutoTrack data:

  • Reconstructing user journeys and reproducing elusive bugs: One of the most significant benefits of AutoTrack is its ability to meticulously record user interactions within the app. This detailed session data allows our teams to precisely recreate the user journey that led to a reported issue. For bugs that are notoriously difficult to reproduce, this capability is a game-changer, eliminating hours of manual guesswork and dramatically accelerating the identification and resolution of underlying problems.
  • Automated issue assignment: When an issue is reported, AutoTrack data can be leveraged to automatically assign it to the most relevant team. By analysing the context of the issue within the recorded session, including the specific features or modules involved, the system can intelligently route the problem to the engineers best equipped to address it. This automation reduces triage time, ensures issues are handled by subject matter experts, and improves overall response efficiency.
  • Automating UI test case generation: The rich dataset provided by AutoTrack offers a powerful foundation for automating the creation of UI test cases. By observing how users interact with the interface, we can automatically generate test scripts that mimic real-world usage patterns. This not only speeds up the testing phase but also leads to more comprehensive test coverage, identifying edge cases and user flows that might otherwise be missed by manually written tests.
  • Understanding analytics event triggers: AutoTrack data provides a granular view into when and why specific analytics events are triggered within the application. This allows us to validate the accuracy of our analytics instrumentation, ensure that events are firing as expected, and gain deeper insights into user behavior. By understanding the precise context surrounding event triggers, we can refine our data collection strategies and derive more meaningful insights from our analytics.

Key takeaways and what’s next

AutoTrack replaces fragile manual instrumentation with a unified, real-time view of application state, screen context, and user interactions. That end-to-end trace makes elusive bugs reproducible, routes issues to the right owners, and seeds reliable UI tests—turning guesswork into grounded evidence so teams can ship fixes faster and with greater confidence.

Looking ahead, we are expanding AutoTrack across surfaces and deepening the context it captures—pairing sessions with network and performance signals, strengthening privacy guardrails, and integrating with automated triage and test generation. Look forward to reading more of our deep dives on auto-generated UI tests and how these journeys will power proactive quality across Grab’s app.

Join us

Grab is a leading superapp in Southeast Asia, operating across the deliveries, mobility and digital financial services sectors. Serving over 800 cities in eight Southeast Asian countries, Grab enables millions of people everyday to order food or groceries, send packages, hail a ride or taxi, pay for online purchases or access services such as lending and insurance, all through a single app. Grab was founded in 2012 with the mission to drive Southeast Asia forward by creating economic empowerment for everyone. Grab strives to serve a triple bottom line – we aim to simultaneously deliver financial performance for our shareholders and have a positive social impact, which includes economic empowerment for millions of people in the region, while mitigating our environmental footprint.

Powered by technology and driven by heart, our mission is to drive Southeast Asia forward by creating economic empowerment for everyone. If this mission speaks to you, join our team today!

Put Zabbix at your Fingertips with the IntelliTrend Mobile App

Post Syndicated from Wolfgang Alper original https://blog.zabbix.com/put-zabbix-at-your-fingertips-with-the-intellitrend-mobile-app/31830/

The official Zabbix frontend works great on desktop, but it isn’t built for mobile. Monitoring doesn’t end when you step away from your workstation, and a reliable Zabbix mobile app keeps you connected to your Zabbix environment, gives you instant notifications, and allows you to react to problems or just check your host configuration at any time.

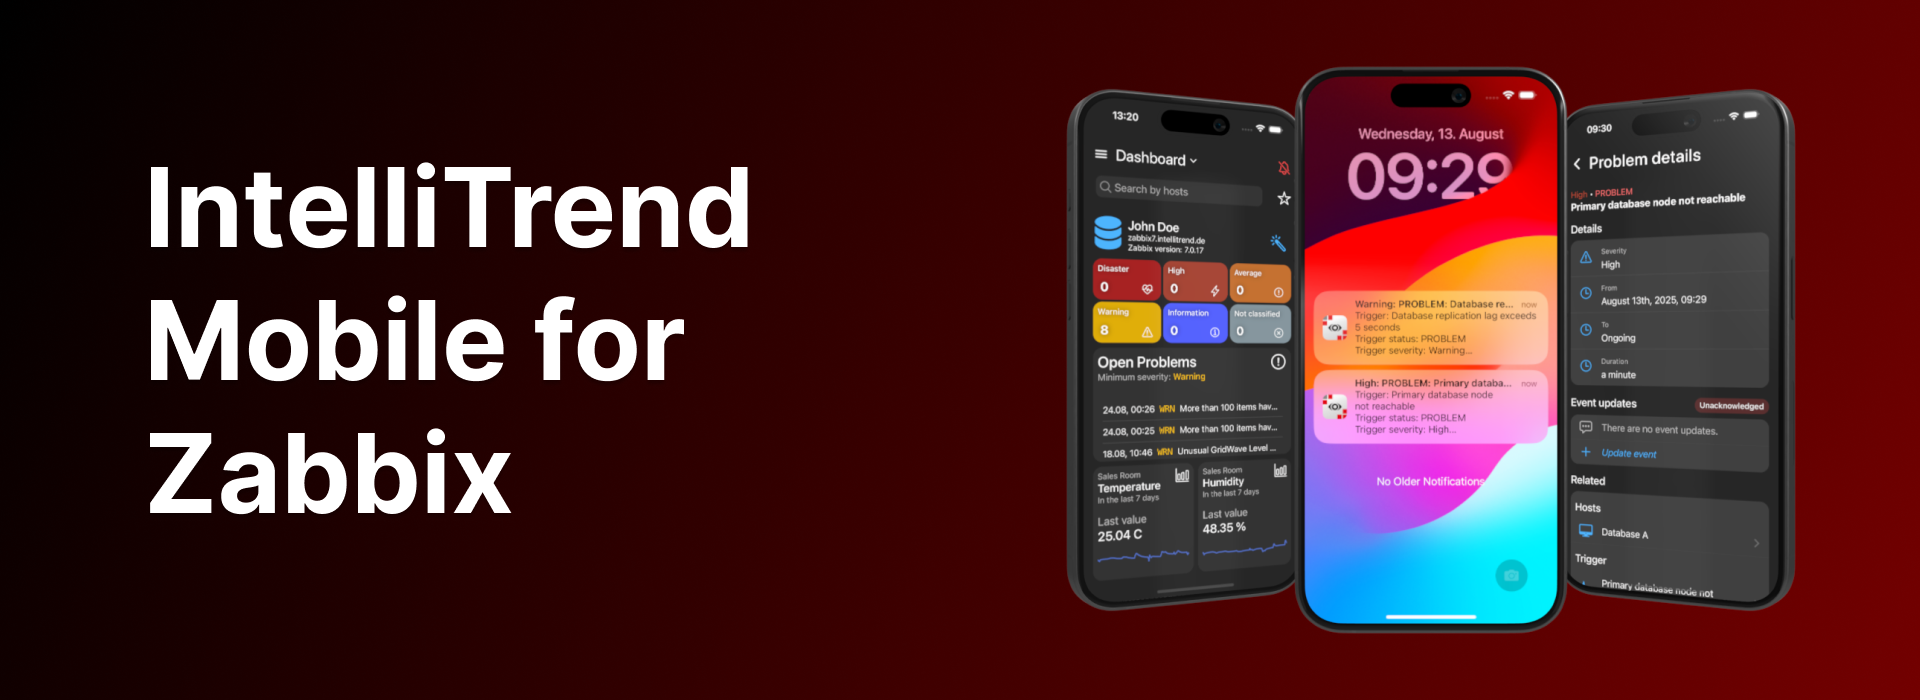
With IntelliTrend Mobile for Zabbix, you get a free, feature-rich mobile app for Zabbix, including real-time push notifications, custom mobile dashboards with unique widgets, built-in responsive host and item graphs, a detailed host viewer, and much more!


Mobile-optimized dashboards

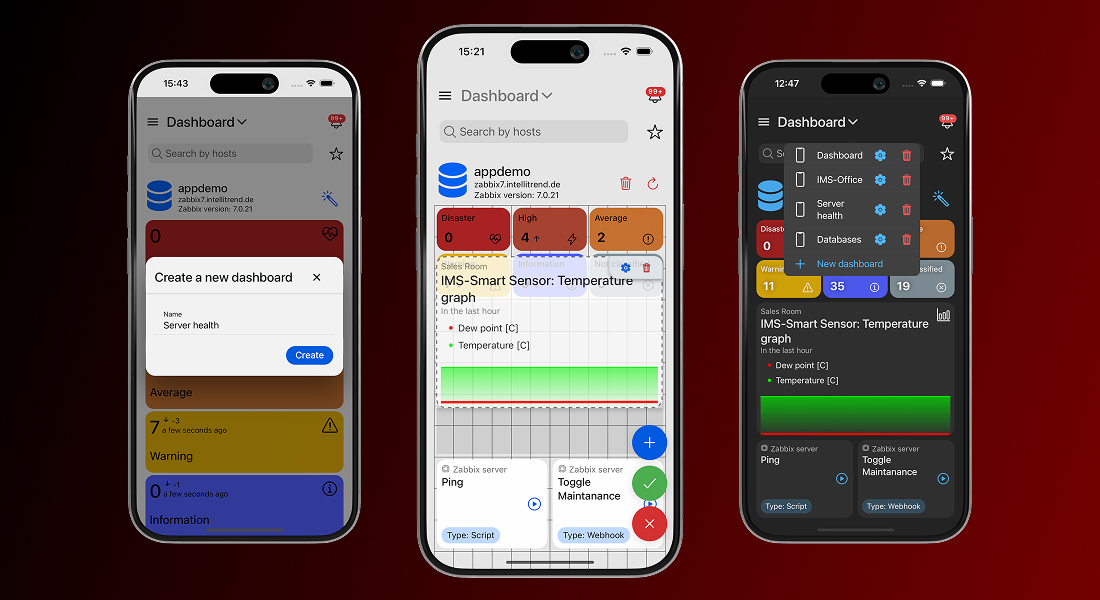
Zabbix dashboards are great and powerful, but they are built for desktop screens and don’t always scale well on mobile devices. IntelliTrend Mobile solves that by giving you the ability to build as many dashboards as you need, each tailored to a specific purpose.

One dashboard can focus on infrastructure health, another on critical issues, and another on a single customer or environment. Every dashboard is an independent workspace, featuring its own layout, collection of widgets, and set of filter criteria.

Grid-based dashboard layout

Every IntelliTrend Mobile dashboard is powered by a grid-based layout system that gives you full control over how your dashboard looks and feels. You are not stuck with fixed widget sizes or a predefined structure – you can place widgets exactly where you want them, drag them around freely, and resize them to give each widget the space it really needs.

This grid system keeps everything orderly without boxing you in. Whether you build a clean, minimal dashboard or pack it with data-rich widgets, the editor helps you shape a layout that looks intentional and stays easy to work with.

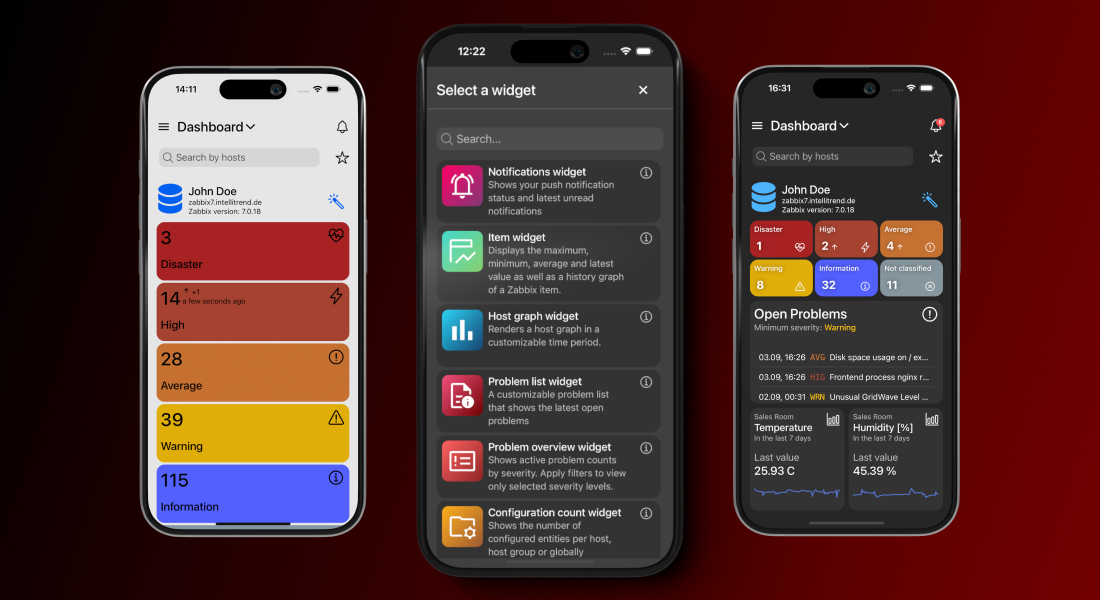
Highly customizable widgets

The app offers a variety of unique and customizable widgets, each designed to display key monitoring information clearly and efficiently. Each widget comes with its own set of configuration options, so you can decide what it shows and how it shows it. You can filter widgets by hosts, host groups, severities, and much more in order to keep the view focused on what matters the most to you.

Besides that, widgets let you adjust their appearance by hiding or revealing extra details, switching between compact and extended modes or adjusting how much data they present. The result is a dashboard that is fine-tuned to the way you work.

Smart problem management

When issues happen, speed and context are everything. That’s why problem management is the most important part of any Zabbix mobile app. IntelliTrend Mobile is built to keep you informed the moment something goes wrong and to let you take action without wasting time or switching devices.

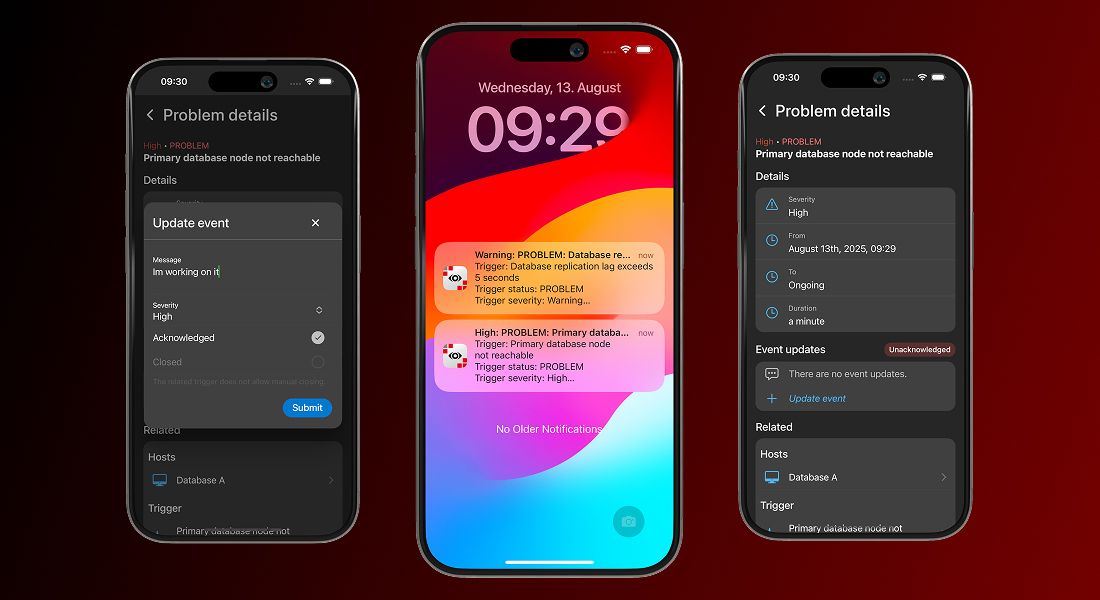
The problem view in the app gives you complete visibility into open and resolved issues, with filtering, sorting, and search options that let you quickly focus on the problems that require your attention. From the same interface, you can update and acknowledge problems without leaving the app.

Opening a problem takes you straight to a detailed view containing all the relevant information – severity, duration, related hosts, triggers, items, and historical data. What makes this view especially powerful is the ability to jump directly from the problem to the related host, item, or trigger within the app.

With a single tap, you can inspect the affected host, review item metrics, or analyze trigger history, all without leaving the mobile environment. This seamless navigation transforms problem management from a static list of alerts into a fully integrated, on-the-go investigation and resolution workflow.

Real-time response with Smart Alerts

The real game-changer, however, is IntelliTrend Mobile’s Smart Alerts feature. This isn’t just push notifications – it’s intelligent, actionable routing straight to the exact problem view in the app.

The moment a problem occurs, you’re notified in real time. Tap the alert and you’re immediately taken to the detailed problem screen. From there, you can analyze the issue, review metrics and history, acknowledge it, or take corrective action without ever opening the Zabbix web interface. No delays, no barriers, no switching devices!

With Smart Alerts, your team reacts faster, stays informed, and keeps systems running smoothly, turning mobile monitoring from passive alerts into active, on-the-go problem management.

Flexible problem list views

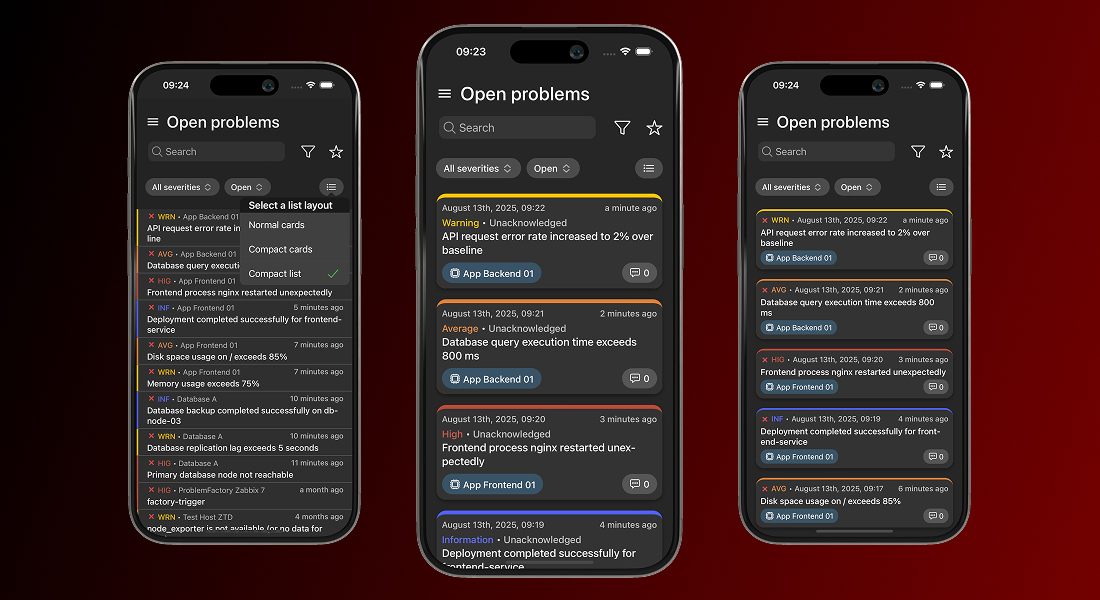
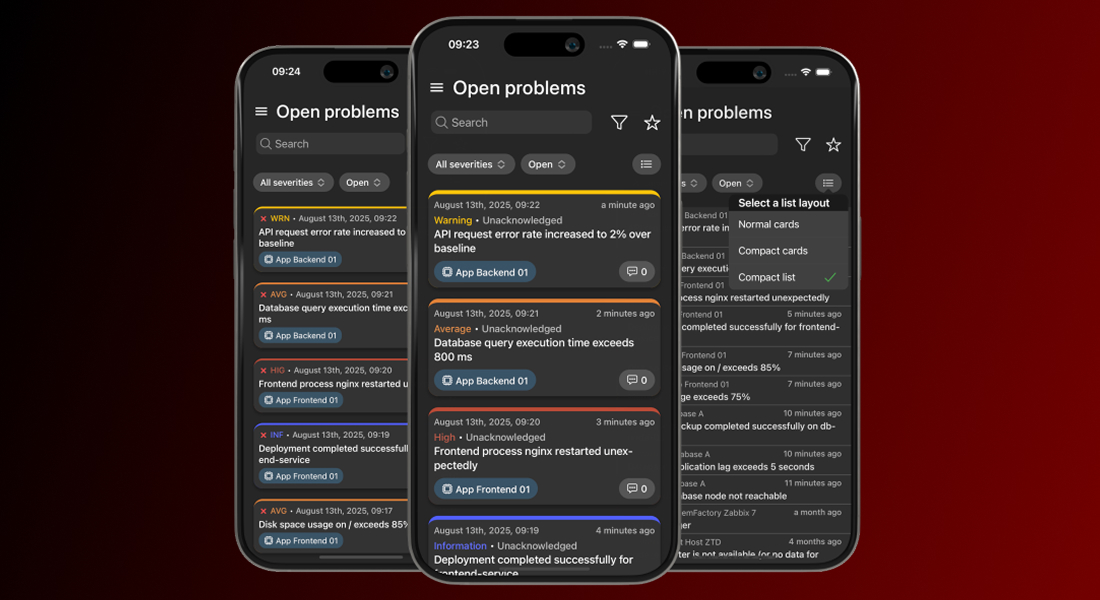
IntelliTrend Mobile lets you choose how problems are displayed in the list. By default, each problem appears as a detailed card showing all relevant information. If you prefer a cleaner overview, you can switch to a compact card view or even a compact list view, for maximum information density.

This flexibility is especially helpful when your Zabbix server generates many problems, allowing you to scan large numbers of problems at a glance while keeping the interface tidy and manageable.

View item and host graphs with mobile-optimized charts

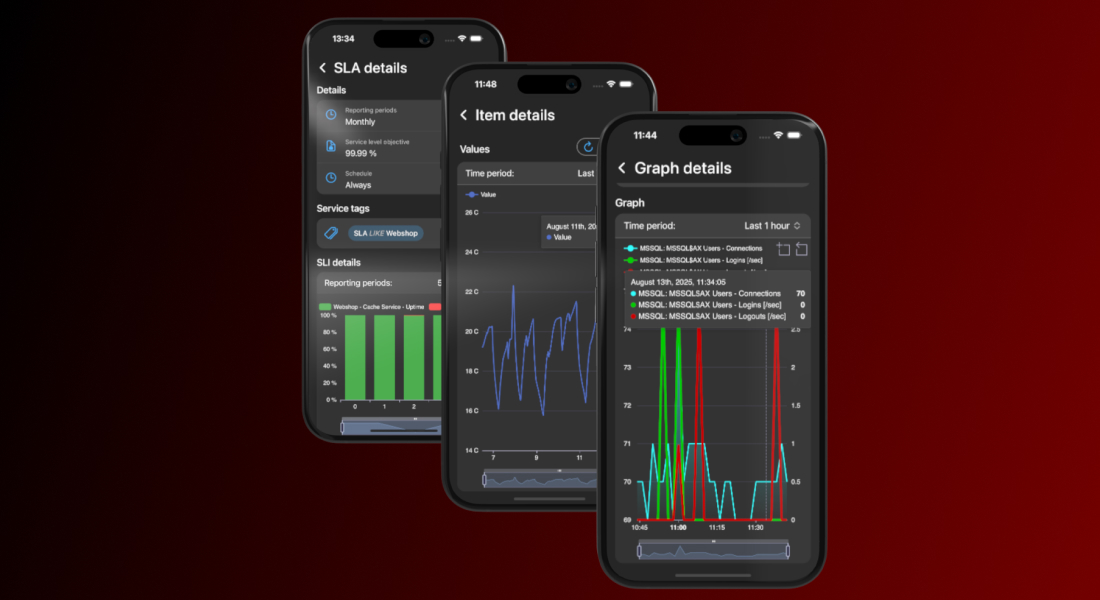
IntelliTrend Mobile reshapes the way you view Zabbix data while you’re on the move. Instead of relying on Zabbix’s static, desktop-focused graphs, the app renders item histories, host graphs, service uptimes, and SLA metrics using fully native, mobile-friendly charts. These charts are responsive, adapting seamlessly to your screen size and orientation for a smooth and clear viewing experience, whether you’re on a phone or tablet.

Every graph is interactive. You can zoom in to inspect a specific time window, pan across the timeline, or hover with your finger to see precise data points. Multiple data series can be toggled on or off, making it easy to focus on the metrics that matter.

You can quickly switch between time periods and pinpoint when an issue started, track its progression, or confirm when it was resolved – without ever opening the Zabbix web interface.

Complete host overview

You can also view all the essential details about any host right from the mobile app. Every host has a detailed view that puts all relevant information at your fingertips, making management simple, efficient, and fully mobile.

For each host, you can quickly see its visible and technical names, current status (enabled or disabled), and maintenance state, including whether data collection continues during maintenance. If the host is monitored by a proxy, you see the proxy that monitors it.

The host details view gives you instant access to all related configurations and objects:

Templates and host groups

You can view all templates assigned to a host and dive into any template’s full details with a single tap, making it easy to understand the monitoring configuration at a glance. Host groups work the same way – just tap a group to see every host it contains, giving you instant insight into related systems.

Host interfaces

IntelliTrend Mobile gives you a complete view of each host interface, including agent, SNMP, JMX, and IPMI types. For every interface, you can see its IP address, DNS name, port, and the interface type configured in Zabbix.

The app also shows the current availability status, highlighting interfaces that are unreachable or experiencing errors. This makes it easy to quickly identify connectivity problems, verify which monitoring protocols are active, and troubleshoot issues with data collection.

Macros

Macros are displayed with full detail (including type, value, and description) so you can verify configuration settings quickly or troubleshoot dynamically, all without leaving the host view.

Inventory

The host inventory view in IntelliTrend Mobile gives you full access to the complete Zabbix host inventory. All inventory fields configured in Zabbix are displayed directly in the app, giving you a complete overview of the host’s recorded details. You can also see the inventory mode for the host (Disabled, Manual, or Automatic) so it’s immediately clear how the inventory is being managed.

Open and resolved problems

From the host details page, you can jump straight into all open or resolved problems related to that specific host. One tap takes you directly to a filtered problem list, making it effortless to review recent problems or check the current state of the host without navigating through multiple menus.

Items, triggers, and graphs

All items, triggers, and graphs tied to the host are just one step away. Each entry opens a filtered list focused solely on that host, letting you move from the host view into any related object instantly. Whether you need to inspect a value, review a trigger, or explore a graph, the app keeps the entire chain of information connected.

Scripts

Execute host scripts directly from your mobile device, whether you’re restarting a service, collecting diagnostics, or triggering an automated workflow. It’s a fast, practical way to take action remotely, enabling real operations work even when you’re away from your desk.

With all these features combined, the host details view becomes a powerful, fully mobile workflow. Everything you need to monitor, analyze, and take action is right at your fingertips, making host management faster, more efficient, and truly on-the-go.

Customize your views

Favorites

You can create favorites for specific hosts or host groups and quickly switch your global scope to focus on them. Once a favorite is active, the app automatically filters all dashboards and list pages to show only data related to that host or host group.

Favorites make it easier to concentrate on the systems you manage most often, so you don’t have to reapply filters or navigate through long lists every time. You can switch between favorites at any time, giving you a fast way to move between different parts of your environment.

Layout modes

Everyone works differently, so the app comes with useful customization options. In addition to the filtering and sorting available on every list page, you can switch between different layout modes for all list pages.

Choose from the standard layout, a compact card layout, or a compact list layout for maximum information density. This lets you decide how much information you want to see at once and allows you to apply layout preferences individually for each page or set them globally in the app settings.

Many more features

The app already supports a wide range of features designed to give you full visibility into your Zabbix environment. Beyond the previously mentioned features, the app includes many more features, such as accessing services and SLAs to keep track of service performance and availability, explore templates, and view triggers, items, and graphs in detail.

But our development doesn’t stop here. We are constantly expanding app functionality and improving existing features based on user feedback. If you haven’t tried the app yet, now is a great time! We’d love to hear your honest thoughts about what works well, what could be better, and which features you’d like to see next. Your feedback helps to shape the future of IntelliTrend Mobile, and we take every suggestion seriously.


Submit feedback

The post Put Zabbix at your Fingertips with the IntelliTrend Mobile App appeared first on Zabbix Blog.
Security Vulnerabilities in ICEBlock

Post Syndicated from Bruce Schneier original https://www.schneier.com/blog/archives/2025/07/security-vulnerabilities-in-iceblock.html

The ICEBlock tool has vulnerabilities:

The developer of ICEBlock, an iOS app for anonymously reporting sightings of US Immigration and Customs Enforcement (ICE) officials, promises that it “ensures user privacy by storing no personal data.” But that claim has come under scrutiny. ICEBlock creator Joshua Aaron has been accused of making false promises regarding user anonymity and privacy, being “misguided” about the privacy offered by iOS, and of being an Apple fanboy. The issue isn’t what ICEBlock stores. It’s about what it could accidentally reveal through its tight integration with iOS.

Details about the iOS Inactivity Reboot Feature

Post Syndicated from Bruce Schneier original https://www.schneier.com/blog/archives/2024/12/details-about-the-ios-inactivity-reboot-feature.html

I recently wrote about the new iOS feature that forces an iPhone to reboot after it’s been inactive for a longish period of time.

Here are the technical details, discovered through reverse engineering. The feature triggers after seventy-two hours of inactivity, even it is remains connected to Wi-Fi.

Critical Vulnerability in libwebp Library

Post Syndicated from Bruce Schneier original https://www.schneier.com/blog/archives/2023/09/critical-vulnerability-in-libwebp-library.html

Both Apple and Google have recently reported critical vulnerabilities in their systems—iOS and Chrome, respectively—that are ultimately the result of the same vulnerability in the libwebp library:

On Thursday, researchers from security firm Rezillion published evidence that they said made it “highly likely” both indeed stemmed from the same bug, specifically in libwebp, the code library that apps, operating systems, and other code libraries incorporate to process WebP images.

Rather than Apple, Google, and Citizen Lab coordinating and accurately reporting the common origin of the vulnerability, they chose to use a separate CVE designation, the researchers said. The researchers concluded that “millions of different applications” would remain vulnerable until they, too, incorporated the libwebp fix. That, in turn, they said, was preventing automated systems that developers use to track known vulnerabilities in their offerings from detecting a critical vulnerability that’s under active exploitation.

Zero-Click Exploit in iPhones

Post Syndicated from Bruce Schneier original https://www.schneier.com/blog/archives/2023/09/zero-click-exploit-in-iphones.html

Make sure you update your iPhones:

Citizen Lab says two zero-days fixed by Apple today in emergency security updates were actively abused as part of a zero-click exploit chain (dubbed BLASTPASS) to deploy NSO Group’s Pegasus commercial spyware onto fully patched iPhones.

The two bugs, tracked as CVE-2023-41064 and CVE-2023-41061, allowed the attackers to infect a fully-patched iPhone running iOS 16.6 and belonging to a Washington DC-based civil society organization via PassKit attachments containing malicious images.

“We refer to the exploit chain as BLASTPASS. The exploit chain was capable of compromising iPhones running the latest version of iOS (16.6) without any interaction from the victim,” Citizen Lab said.

“The exploit involved PassKit attachments containing malicious images sent from an attacker iMessage account to the victim.”

Operation Triangulation: Zero-Click iPhone Malware

Post Syndicated from Bruce Schneier original https://www.schneier.com/blog/archives/2023/06/operation-triangulation-zero-click-iphone-malware.html

Kaspersky is reporting a zero-click iOS exploit in the wild:

Mobile device backups contain a partial copy of the filesystem, including some of the user data and service databases. The timestamps of the files, folders and the database records allow to roughly reconstruct the events happening to the device. The mvt-ios utility produces a sorted timeline of events into a file called “timeline.csv,” similar to a super-timeline used by conventional digital forensic tools.

Using this timeline, we were able to identify specific artifacts that indicate the compromise. This allowed to move the research forward, and to reconstruct the general infection sequence:

  • The target iOS device receives a message via the iMessage service, with an attachment containing an exploit.
  • Without any user interaction, the message triggers a vulnerability that leads to code execution.
  • The code within the exploit downloads several subsequent stages from the C&C server, that include additional exploits for privilege escalation.
  • After successful exploitation, a final payload is downloaded from the C&C server, that is a fully-featured APT platform.
  • The initial message and the exploit in the attachment is deleted

The malicious toolset does not support persistence, most likely due to the limitations of the OS. The timelines of multiple devices indicate that they may be reinfected after rebooting. The oldest traces of infection that we discovered happened in 2019. As of the time of writing in June 2023, the attack is ongoing, and the most recent version of the devices successfully targeted is iOS 15.7.

No attribution as of yet.

How we improved our iOS CI infrastructure with observability tools

Post Syndicated from Grab Tech original https://engineering.grab.com/iOS-CI-infrastructure-with-observability-tools

Note: Timestamps used in this article are in UTC+8 Singapore time, unless stated otherwise.

Background

When we upgraded to Xcode 13.1 in April 2022, we noticed a few issues such as instability of the CI tests and other problems related to the switch to Xcode 13.1. 

After taking a step back, we investigated this issue by integrating some observability tools into our iOS CI development process. This gave us a comprehensive perspective of the entire process, from the beginning to the end of the UITest job. In this article, we share the improvements we made, the insights we gathered, and the impact of these improvements on the overall process and resource utilisation.

Solution

In the following sections, we elaborate the various steps we took to investigate the issues, like unstable CI tests and high CPU utilisation, and the improvements we made to make our iOS CI infrastructure more reliable.

Analyse Xcode 13.1 CPU utilisation

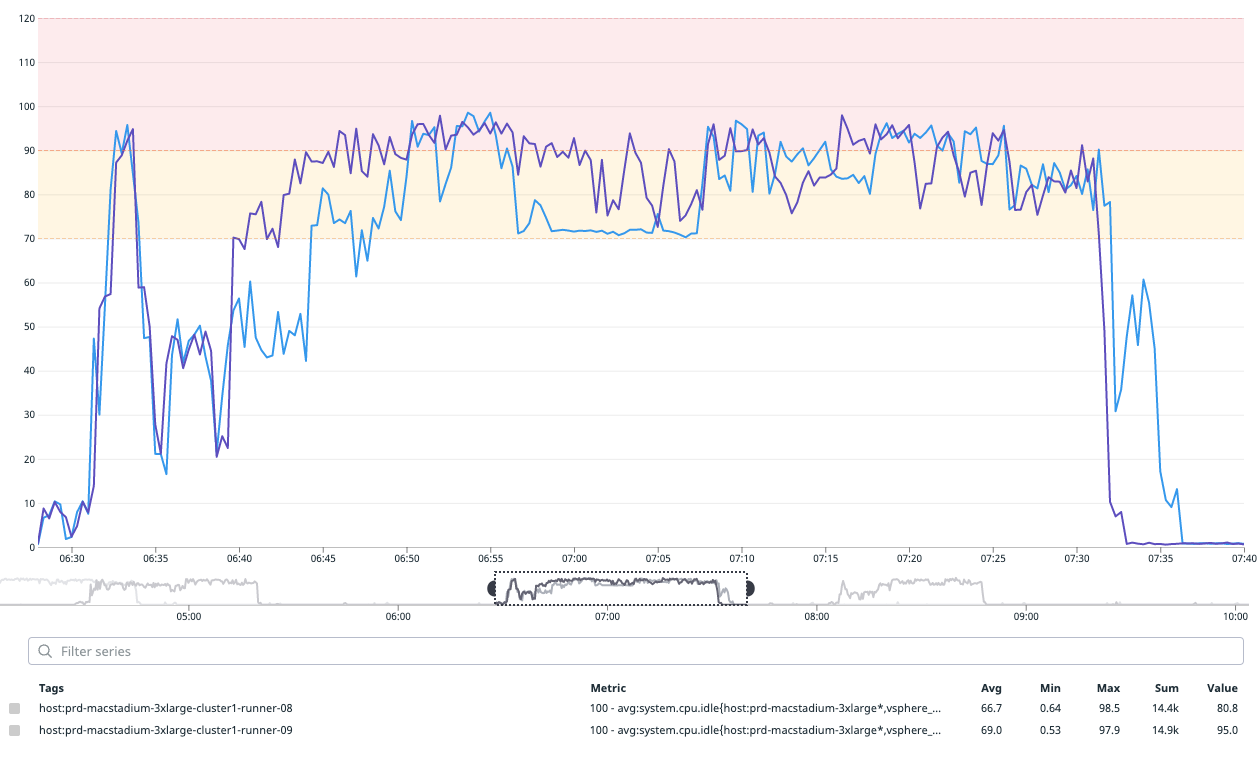
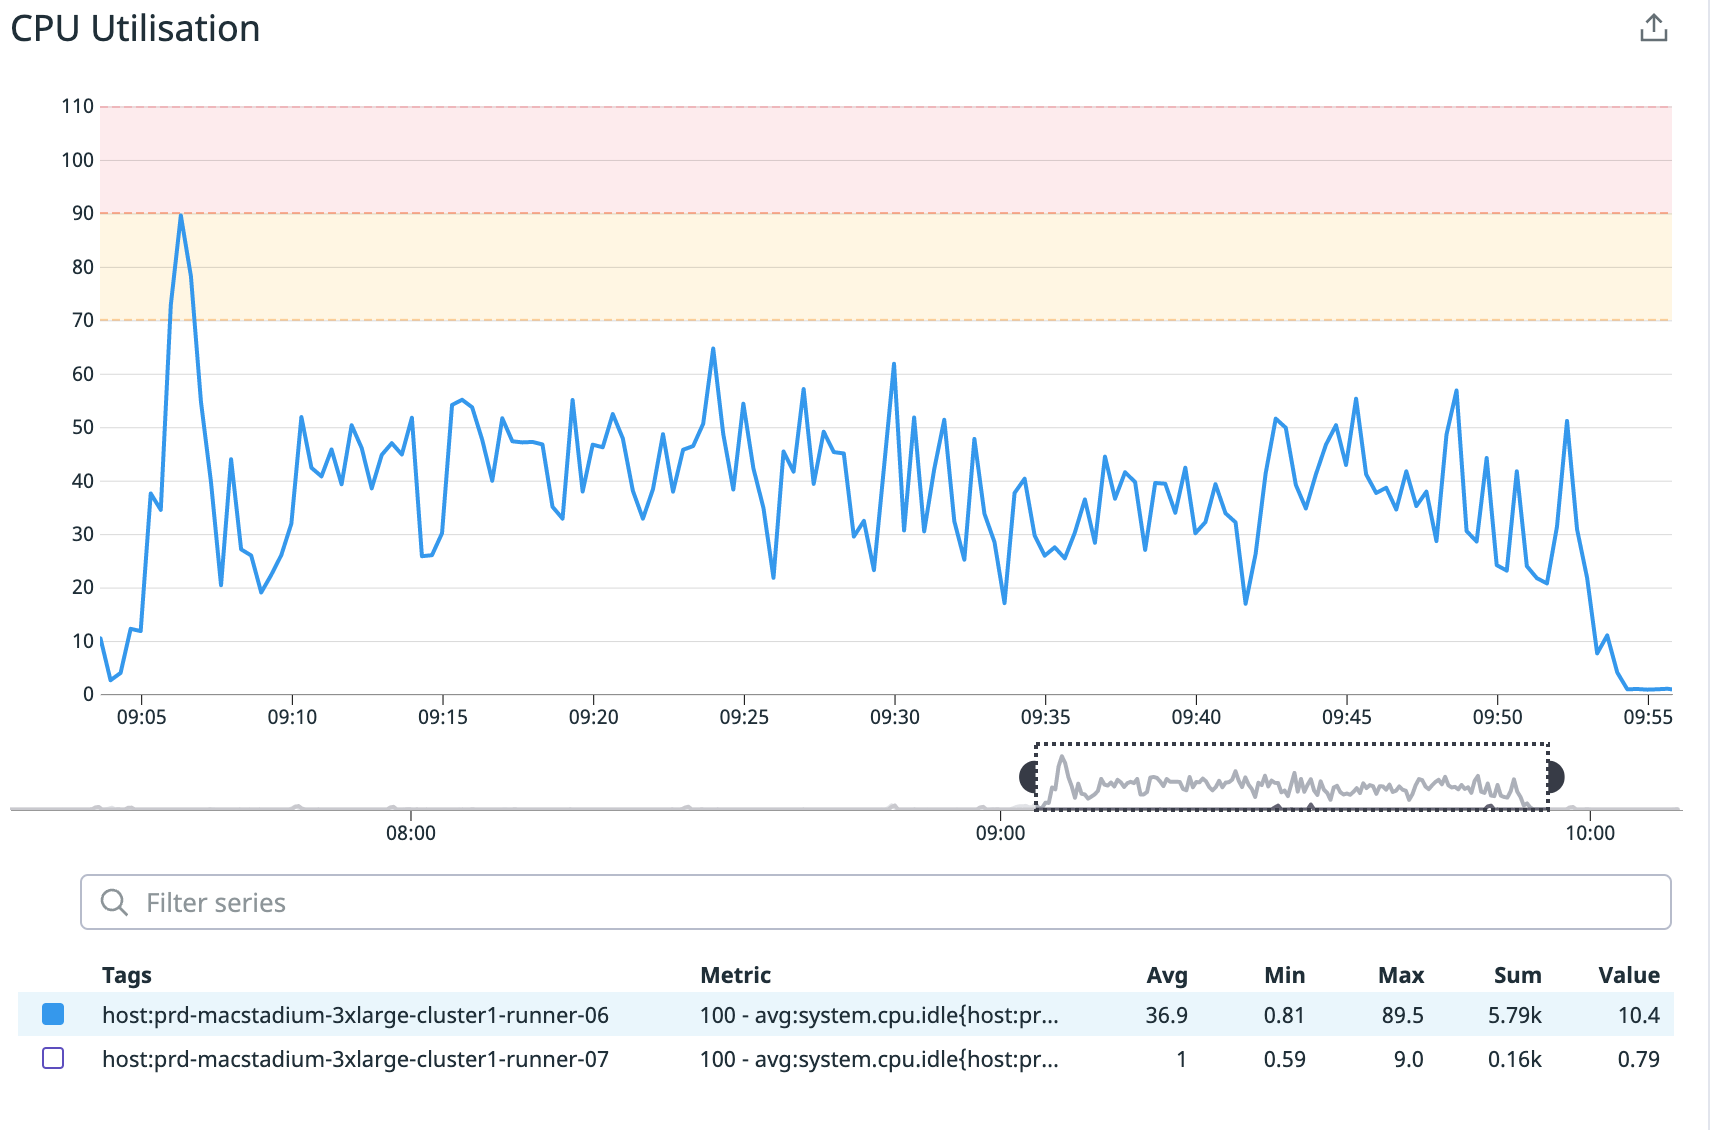
As an iOS developer, we are certain that you have also experienced Spotlight process-related CPU usage problems with Xcode 13.1, which have since been resolved in Xcode 13.2. After investigating, we found that the CPU usage issues were one of the root causes of UITest’s instability and it was something we needed to fix urgently. We decided not to wait for Apple’s update as it would cost us more time to perform another round of migration.

Before we started UITest, we moved the spotlight.app into a new folder. When the test was complete, we restored the application to its original location. This significantly decreased CPU utilisation by more than 50%.

This section helps you better visualise how the different versions of Xcode affected CPU utilisation.

Xcode 12.1
Xcode 13.1 before fix
Xcode 13.1 after fix

As a superapp, there are countless scenarios that need to be thoroughly tested at Grab before the feature is released in production. One of these tests is deep link testing.

More than 10% of the total number of tests are deep link tests. Typically, it is advised to mock the dependencies throughout the test to ensure that it runs quickly and reliably. However, this creates another reliance on iOS Safari.

As a result, we created a mock browser in UITest. We used the URL to the mock browser as the launch argument, and the same URL is then called back. This method results in a 20% reduction in CI time and more stable tests.

Boot the iOS simulator with permission

It is always a good idea to reset the simulator before running UITest so that there are no residual presets or simulated data from a different test. Additionally, using any of the simulator’s services (location, ATT, contacts, etc.) will prompt the simulator to request permission, which slows down execution. We used UIInterruptionHandler (a handler block for managing alerts and other dialogues) to manage asynchronous UI interruptions during the test.

We wanted to reduce the time taken for test execution, which we knew includes many permissions. Therefore, in order to speed up execution, we boot the simulator with permissions. This removes the need for permissions during UITest, which speeds up performance by 5%.

Monitor HTTP traffic during the UITest

When writing tests, it is important to mock all resources as this enables us to focus on the code that’s being tested and not how external dependencies interact or respond. However, with a large team working concurrently, it can be challenging to ensure that nothing is actually downloaded from the internet.

Developers often make changes to code, and UITests are essential for ensuring that these modifications do not adversely affect existing functionality. It is advised to mock all dependencies while writing tests to simulate all possible behavior. We discovered that a significant number of resources were being downloaded each time we ran the tests, which was highly inefficient.

In large teams working simultaneously, preventing downloads from the internet can be quite challenging. To tackle this issue, we devised a custom tool that tracks all URLs accessed throughout the UITest. This enabled us to identify resources being downloaded from the internet during the testing process.

By using our custom tool to analyse network traffic, we were able to ensure that no resources were being downloaded during testing. Instead, we relied on mocked dependencies, resulting in reduced testing times and improved stability.

GitLab load runner analysis

At Grab, we have many teams of developers who maintain the app, make code changes, and raise merge requests (MRs) on a daily basis. To make sure that new changes don’t conflict with existing code, these MRs are integrated with CI.

Additionally, to manage the number of MRs, we maintain a list of clusters that run test runners concurrently for better resource utilisation and performance. We frequently run these tests to determine how many parallel processors are required for stable results.

####Return HTTP responses to the local mock server

We have a tool that we use to mock API requests, which we improved to also support HTML responses. This increases the scope of testing and ensures the HTML response sequences work properly.

Use explicit waiting commands

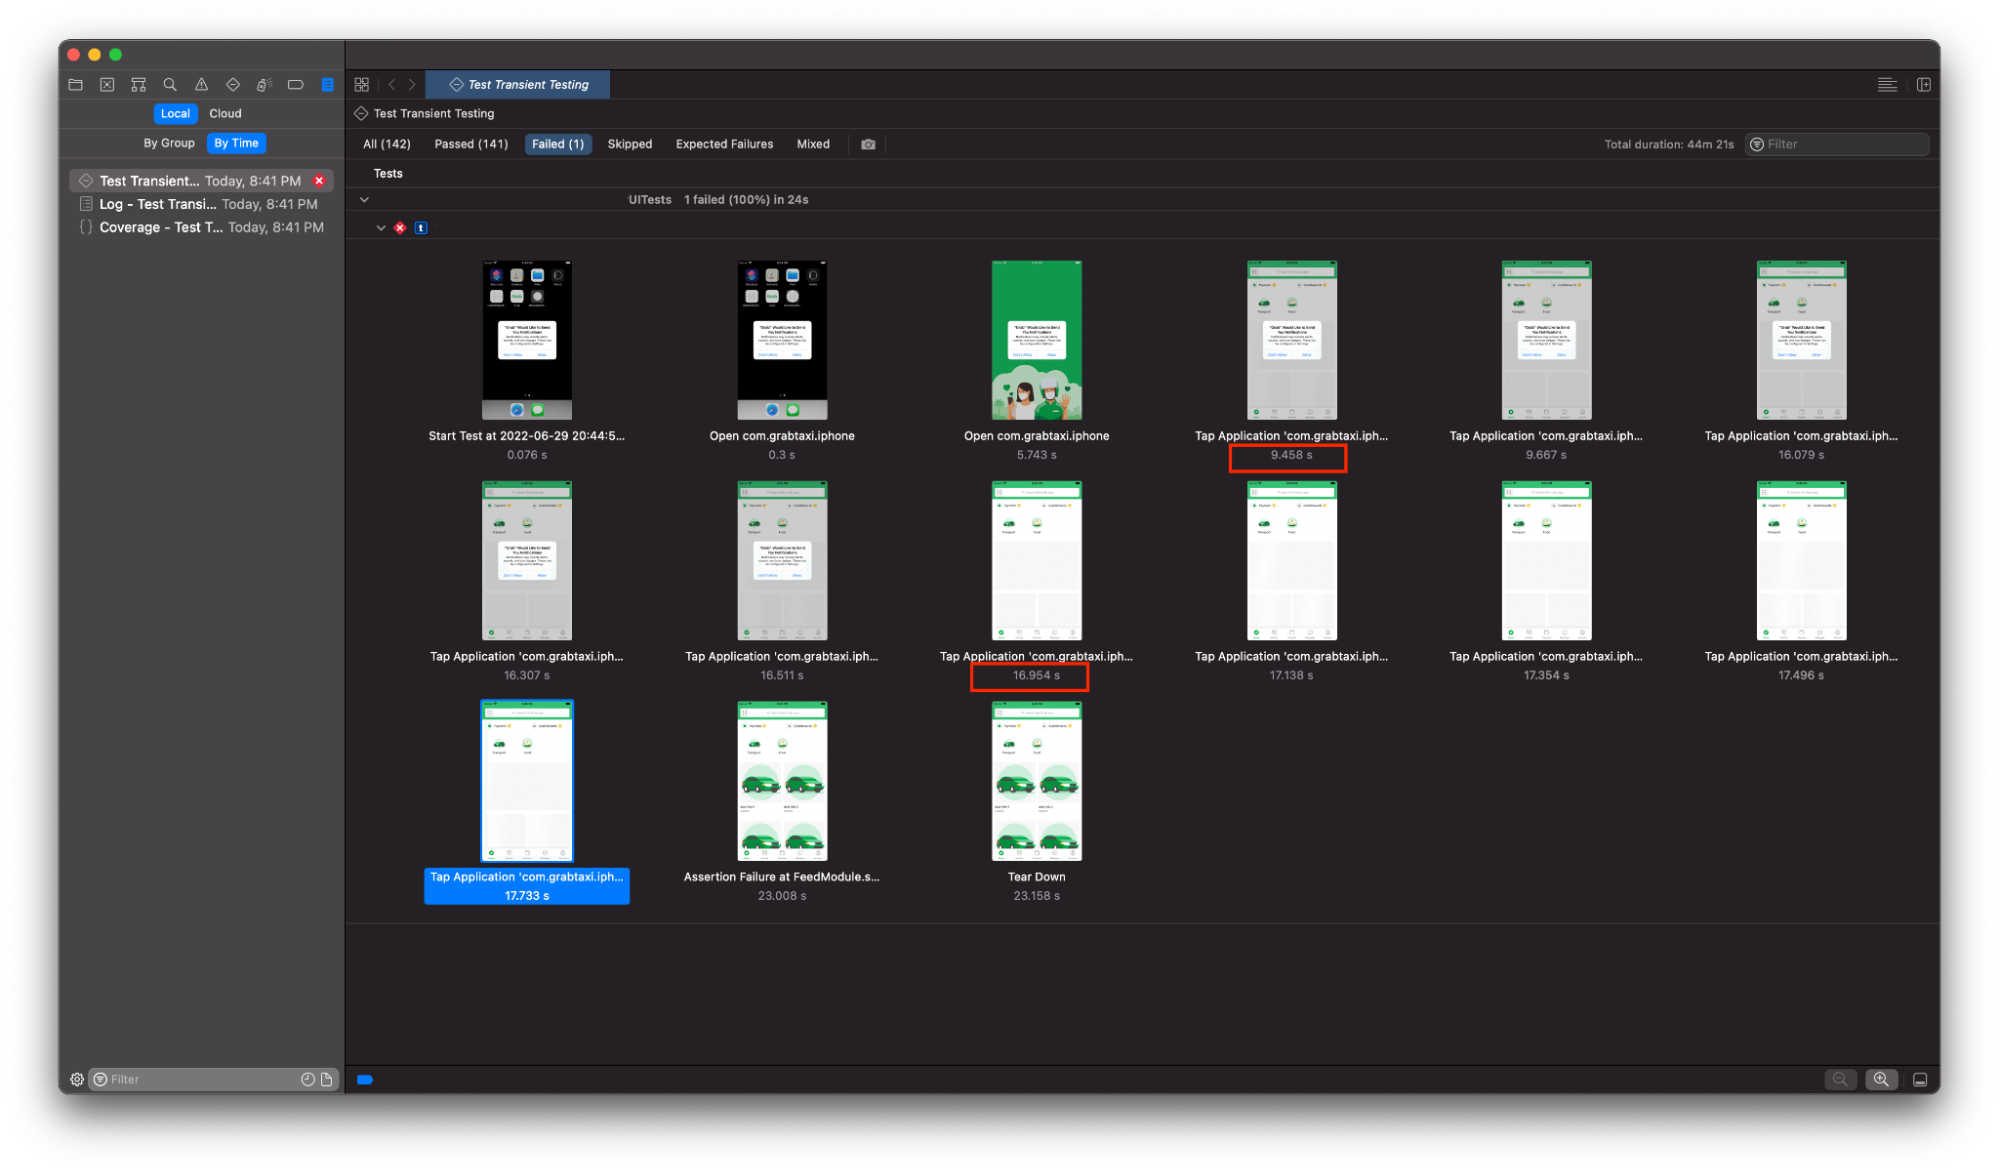
When running multiple tests, timing issues are inevitable and they cause tests to occasionally pass and fail. To mitigate this, most of the developers prefer to add a sleep command so there is time for the element to render properly before we verify it – but this slows down execution. In order to improve CI execution, we introduced a link that allows us to track sleep function usage and suggest developers use waitForExistence wrappers in UI tests.

Track each failure state

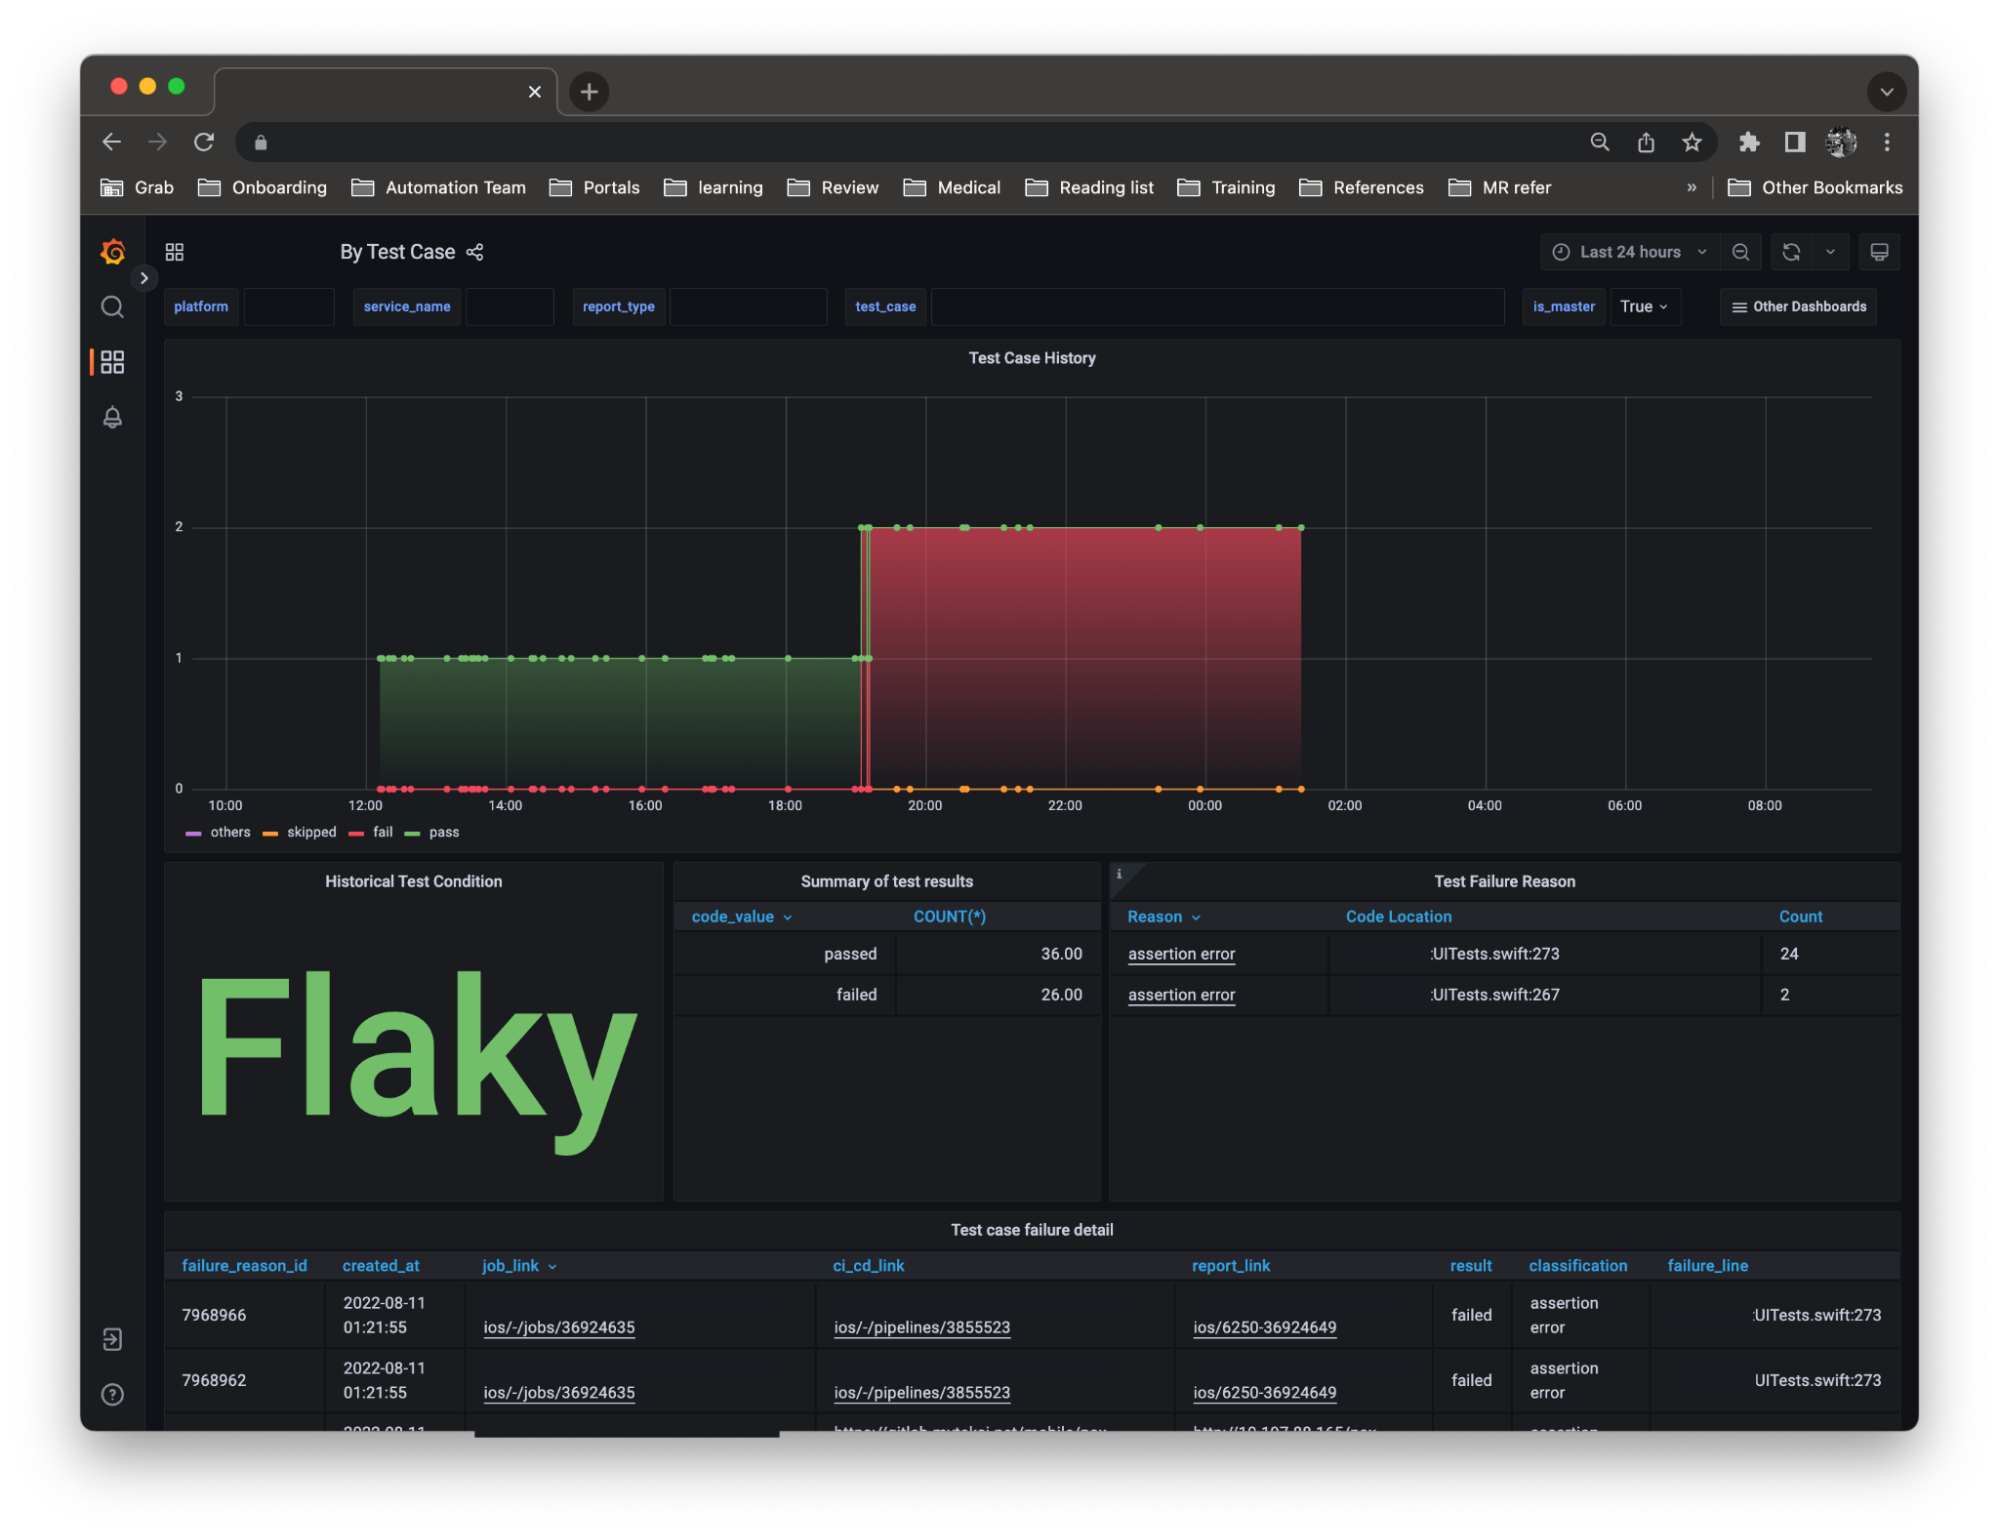
With large codebases, it is quite common to see flakiness in UITests, where tests occasionally succeed and fail without any code changes. This means that test results can be inconsistent and in some cases, faulty. Faulty testing can be frustrating, and quite expensive. This is because engineers need to re-trigger entire builds, which ends up consuming more time.

Initially, we used an internal tool that required all tests to pass on the first run, before merging was allowed. However, we realised that this significantly increased engineers’ manual retry time, hence, we modified the rules to allow merging as long as a subsequent retry passes the tests. This minor change improved our engineers’ CI overall experience and did not result in more flaky tests.

Learnings/Conclusion

Our journey to improve iOS CI infrastructure is still ongoing, but from this experience, we learnt several things:

  • Focus on the feature being tested by ensuring all external responses are mocked.
  • A certain degree of test flakiness is expected, but you should monitor past trends. If flakiness increases, there’s probably a deeper lying issue within your code.
  • Regularly monitor resource utilisation and performance – detecting a sudden spike early could save you a lot of time and money.

New Zero-Click Exploits against iOS

Post Syndicated from Bruce Schneier original https://www.schneier.com/blog/archives/2023/04/new-zero-click-exploits-against-ios.html

Citizen Lab has identified three zero-click exploits against iOS 15 and 16. These were used by NSO Group’s Pegasus spyware in 2022, and deployed by Mexico against human rights defenders. These vulnerabilities have all been patched.

One interesting bit is that Apple’s Lockdown Mode (part of iOS 16) seems to have worked to prevent infection.

News article.

EDITED TO ADD (4/21): News article. Good Twitter thread.

Apple Patches iPhone Zero-Day

Post Syndicated from Bruce Schneier original https://www.schneier.com/blog/archives/2022/12/apple-patches-iphone-zero-day.html

The most recent iPhone update—to version 16.1.2—patches a zero-day vulnerability that “may have been actively exploited against versions of iOS released before iOS 15.1.”

News:

Apple said security researchers at Google’s Threat Analysis Group, which investigates nation state-backed spyware, hacking and cyberattacks, discovered and reported the WebKit bug.

WebKit bugs are often exploited when a person visits a malicious domain in their browser (or via the in-app browser). It’s not uncommon for bad actors to find vulnerabilities that target WebKit as a way to break into the device’s operating system and the user’s private data. WebKit bugs can be “chained” to other vulnerabilities to break through multiple layers of a device’s defenses.

Apple’s Device Analytics Can Identify iCloud Users

Post Syndicated from Bruce Schneier original https://www.schneier.com/blog/archives/2022/11/apples-device-analytics-can-identify-icloud-users.html

Researchers claim that supposedly anonymous device analytics information can identify users:

On Twitter, security researchers Tommy Mysk and Talal Haj Bakry have found that Apple’s device analytics data includes an iCloud account and can be linked directly to a specific user, including their name, date of birth, email, and associated information stored on iCloud.

Apple has long claimed otherwise:

On Apple’s device analytics and privacy legal page, the company says no information collected from a device for analytics purposes is traceable back to a specific user. “iPhone Analytics may include details about hardware and operating system specifications, performance statistics, and data about how you use your devices and applications. None of the collected information identifies you personally,” the company claims.

Apple was just sued for tracking iOS users without their consent, even when they explicitly opt out of tracking.

Apple Only Commits to Patching Latest OS Version

Post Syndicated from Bruce Schneier original https://www.schneier.com/blog/archives/2022/10/apple-only-commits-to-patching-latest-os-version.html

People have suspected this for a while, but Apple has made it official. It only commits to fully patching the latest version of its OS, even though it claims to support older versions.

From ArsTechnica:

In other words, while Apple will provide security-related updates for older versions of its operating systems, only the most recent upgrades will receive updates for every security problem Apple knows about. Apple currently provides security updates to macOS 11 Big Sur and macOS 12 Monterey alongside the newly released macOS Ventura, and in the past, it has released security updates for older iOS versions for devices that can’t install the latest upgrades.

This confirms something that independent security researchers have been aware of for a while but that Apple hasn’t publicly articulated before. Intego Chief Security Analyst Joshua Long has tracked the CVEs patched by different macOS and iOS updates for years and generally found that bugs patched in the newest OS versions can go months before being patched in older (but still ostensibly “supported”) versions, when they’re patched at all.

Apple’s Lockdown Mode

Post Syndicated from Bruce Schneier original https://www.schneier.com/blog/archives/2022/07/apples-lockdown-mode-2.html

I haven’t written about Apple’s Lockdown Mode yet, mostly because I haven’t delved into the details. This is how Apple describes it:

Lockdown Mode offers an extreme, optional level of security for the very few users who, because of who they are or what they do, may be personally targeted by some of the most sophisticated digital threats, such as those from NSO Group and other private companies developing state-sponsored mercenary spyware. Turning on Lockdown Mode in iOS 16, iPadOS 16, and macOS Ventura further hardens device defenses and strictly limits certain functionalities, sharply reducing the attack surface that potentially could be exploited by highly targeted mercenary spyware.

At launch, Lockdown Mode includes the following protections:

  • Messages: Most message attachment types other than images are blocked. Some features, like link previews, are disabled.
  • Web browsing: Certain complex web technologies, like just-in-time (JIT) JavaScript compilation, are disabled unless the user excludes a trusted site from Lockdown Mode.
  • Apple services: Incoming invitations and service requests, including FaceTime calls, are blocked if the user has not previously sent the initiator a call or request.
  • Wired connections with a computer or accessory are blocked when iPhone is locked.
  • Configuration profiles cannot be installed, and the device cannot enroll into mobile device management (MDM), while Lockdown Mode is turned on.

What Apple has done here is really interesting. It’s common to trade security off for usability, and the results of that are all over Apple’s operating systems—and everywhere else on the Internet. What they’re doing with Lockdown Mode is the reverse: they’re trading usability for security. The result is a user experience with fewer features, but a much smaller attack surface. And they aren’t just removing random features; they’re removing features that are common attack vectors.

There aren’t a lot of people who need Lockdown Mode, but it’s an excellent option for those who do.

News article.

EDITED TO ADD (7/31): An analysis of the effect of Lockdown Mode on Safari.

Faking an iPhone Reboot

Post Syndicated from Bruce Schneier original https://www.schneier.com/blog/archives/2022/01/faking-an-iphone-reboot.html

Researchers have figured how how to intercept and fake an iPhone reboot:

We’ll dissect the iOS system and show how it’s possible to alter a shutdown event, tricking a user that got infected into thinking that the phone has been powered off, but in fact, it’s still running. The “NoReboot” approach simulates a real shutdown. The user cannot feel a difference between a real shutdown and a “fake shutdown.” There is no user-interface or any button feedback until the user turns the phone back “on.”

It’s a complicated hack, but it works.

Uses are obvious:

Historically, when malware infects an iOS device, it can be removed simply by restarting the device, which clears the malware from memory.

However, this technique hooks the shutdown and reboot routines to prevent them from ever happening, allowing malware to achieve persistence as the device is never actually turned off.

I see this as another manifestation of the security problems that stem from all controls becoming software controls. Back when the physical buttons actually did things — like turn the power, the Wi-Fi, or the camera on and off — you could actually know that something was on or off. Now that software controls those functions, you can never be sure.

Apple’s NeuralHash Algorithm Has Been Reverse-Engineered

Post Syndicated from Bruce Schneier original https://www.schneier.com/blog/archives/2021/08/apples-neuralhash-algorithm-has-been-reverse-engineered.html

Apple’s NeuralHash algorithm — the one it’s using for client-side scanning on the iPhone — has been reverse-engineered.

Turns out it was already in iOS 14.3, and someone noticed:

Early tests show that it can tolerate image resizing and compression, but not cropping or rotations.

We also have the first collision: two images that hash to the same value.

The next step is to generate innocuous images that NeuralHash classifies as prohibited content.

This was a bad idea from the start, and Apple never seemed to consider the adversarial context of the system as a whole, and not just the cryptography.