Tag Archives: R2 Storage

Announcing the Cloudflare Data Platform: ingest, store, and query your data directly on Cloudflare

Post Syndicated from Micah Wylde original https://blog.cloudflare.com/cloudflare-data-platform/

For Developer Week in April 2025, we announced the public beta of R2 Data Catalog, a fully managed Apache Iceberg catalog on top of Cloudflare R2 object storage. Today, we are building on that foundation with three launches:

  • Cloudflare Pipelines receives events sent via Workers or HTTP, transforms them with SQL, and ingests them into Iceberg or as files on R2

  • R2 Data Catalog manages the Iceberg metadata and now performs ongoing maintenance, including compaction, to improve query performance

  • R2 SQL is our in-house distributed SQL engine, designed to perform petabyte-scale queries over your data in R2

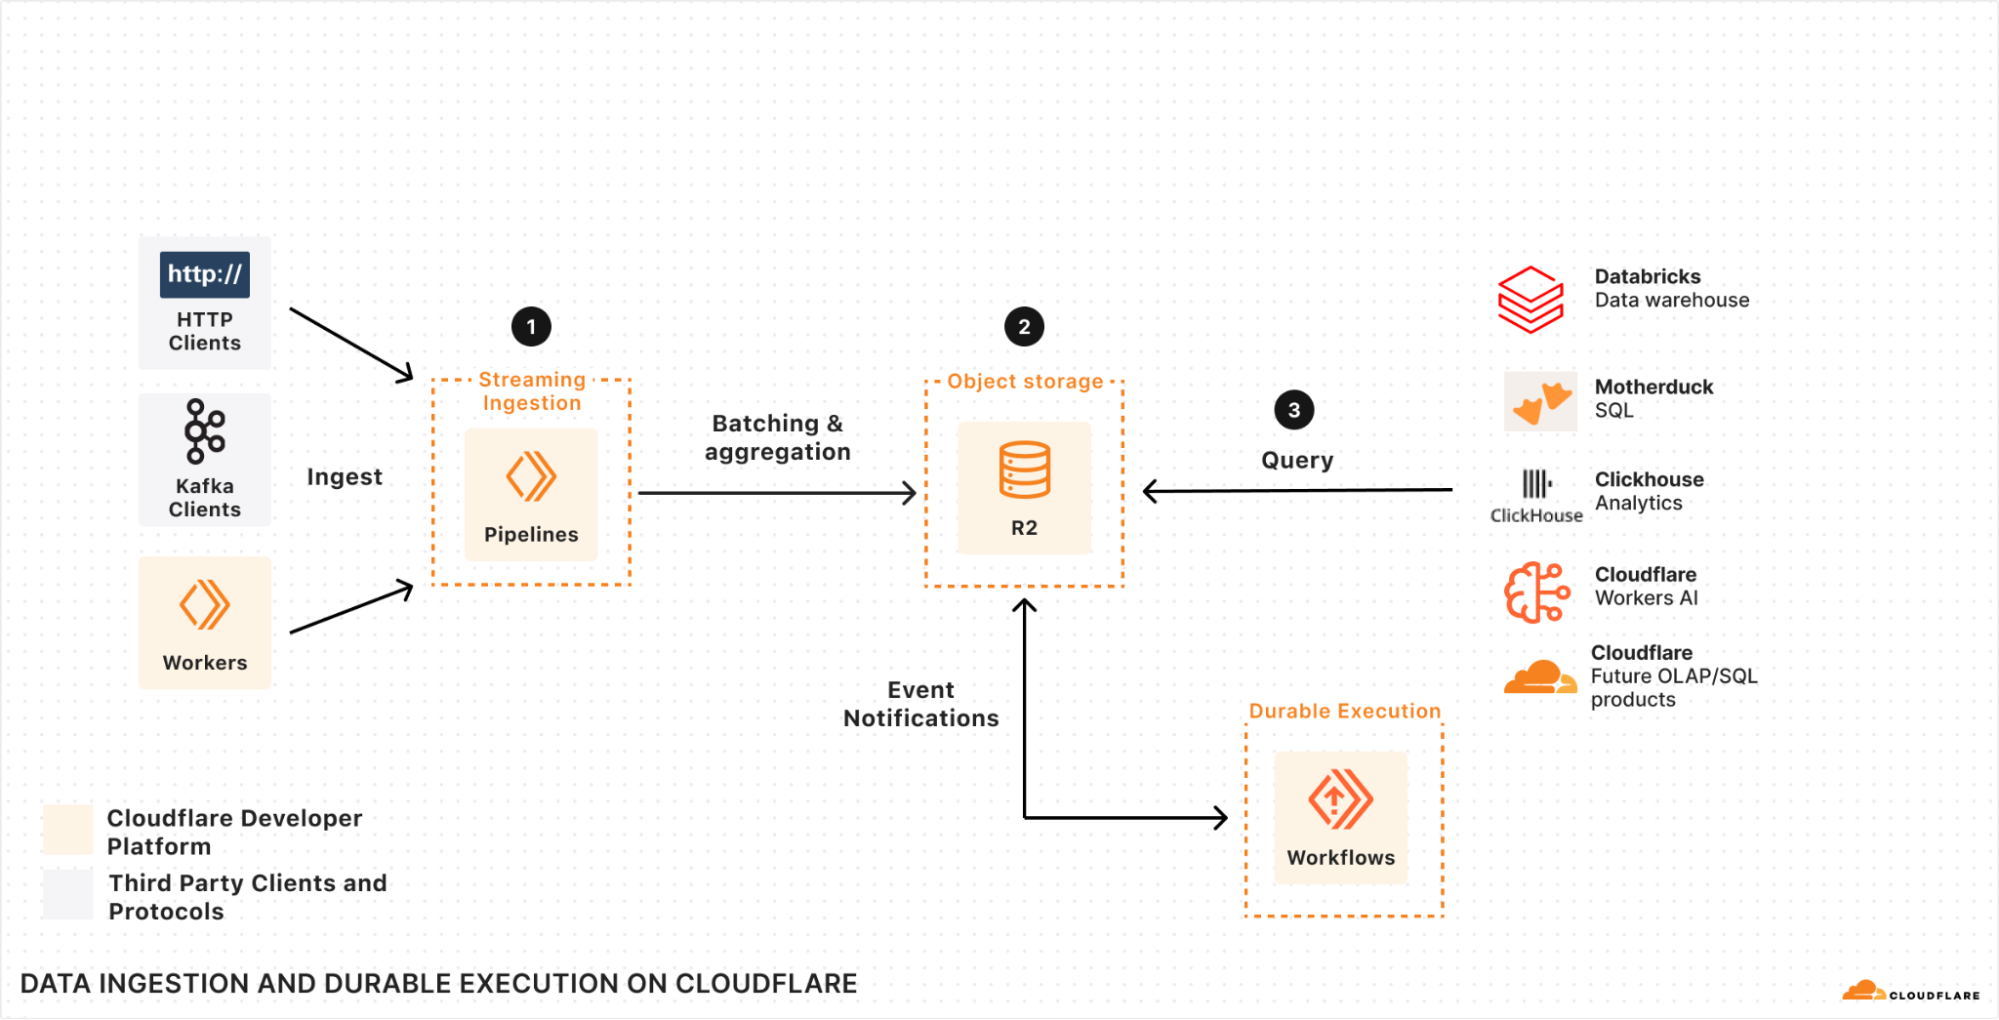
Together, these products make up the Cloudflare Data Platform, a complete solution for ingesting, storing, and querying analytical data tables.

Like all Cloudflare Developer Platform products, they run on our global compute infrastructure. They’re built around open standards and interoperability. That means that you can bring your own Iceberg query engine — whether that’s PyIceberg, DuckDB, or Spark — connect with other platforms like Databricks and Snowflake — and pay no egress fees to access your data.

Analytical data is critical for modern companies. It allows you to understand your user’s behavior, your company’s performance, and alerts you to issues. But traditional data infrastructure is expensive and hard to operate, requiring fixed cloud infrastructure and in-house expertise. We built the Cloudflare Data Platform to be easy enough for anyone to use with affordable, usage-based pricing.

If you’re ready to get started now, follow the Data Platform tutorial for a step-by-step guide through creating a Pipeline that processes and delivers events to an R2 Data Catalog table, which can then be queried with R2 SQL. Or read on to learn about how we got here and how all of this works.

How did we end up building a Data Platform?

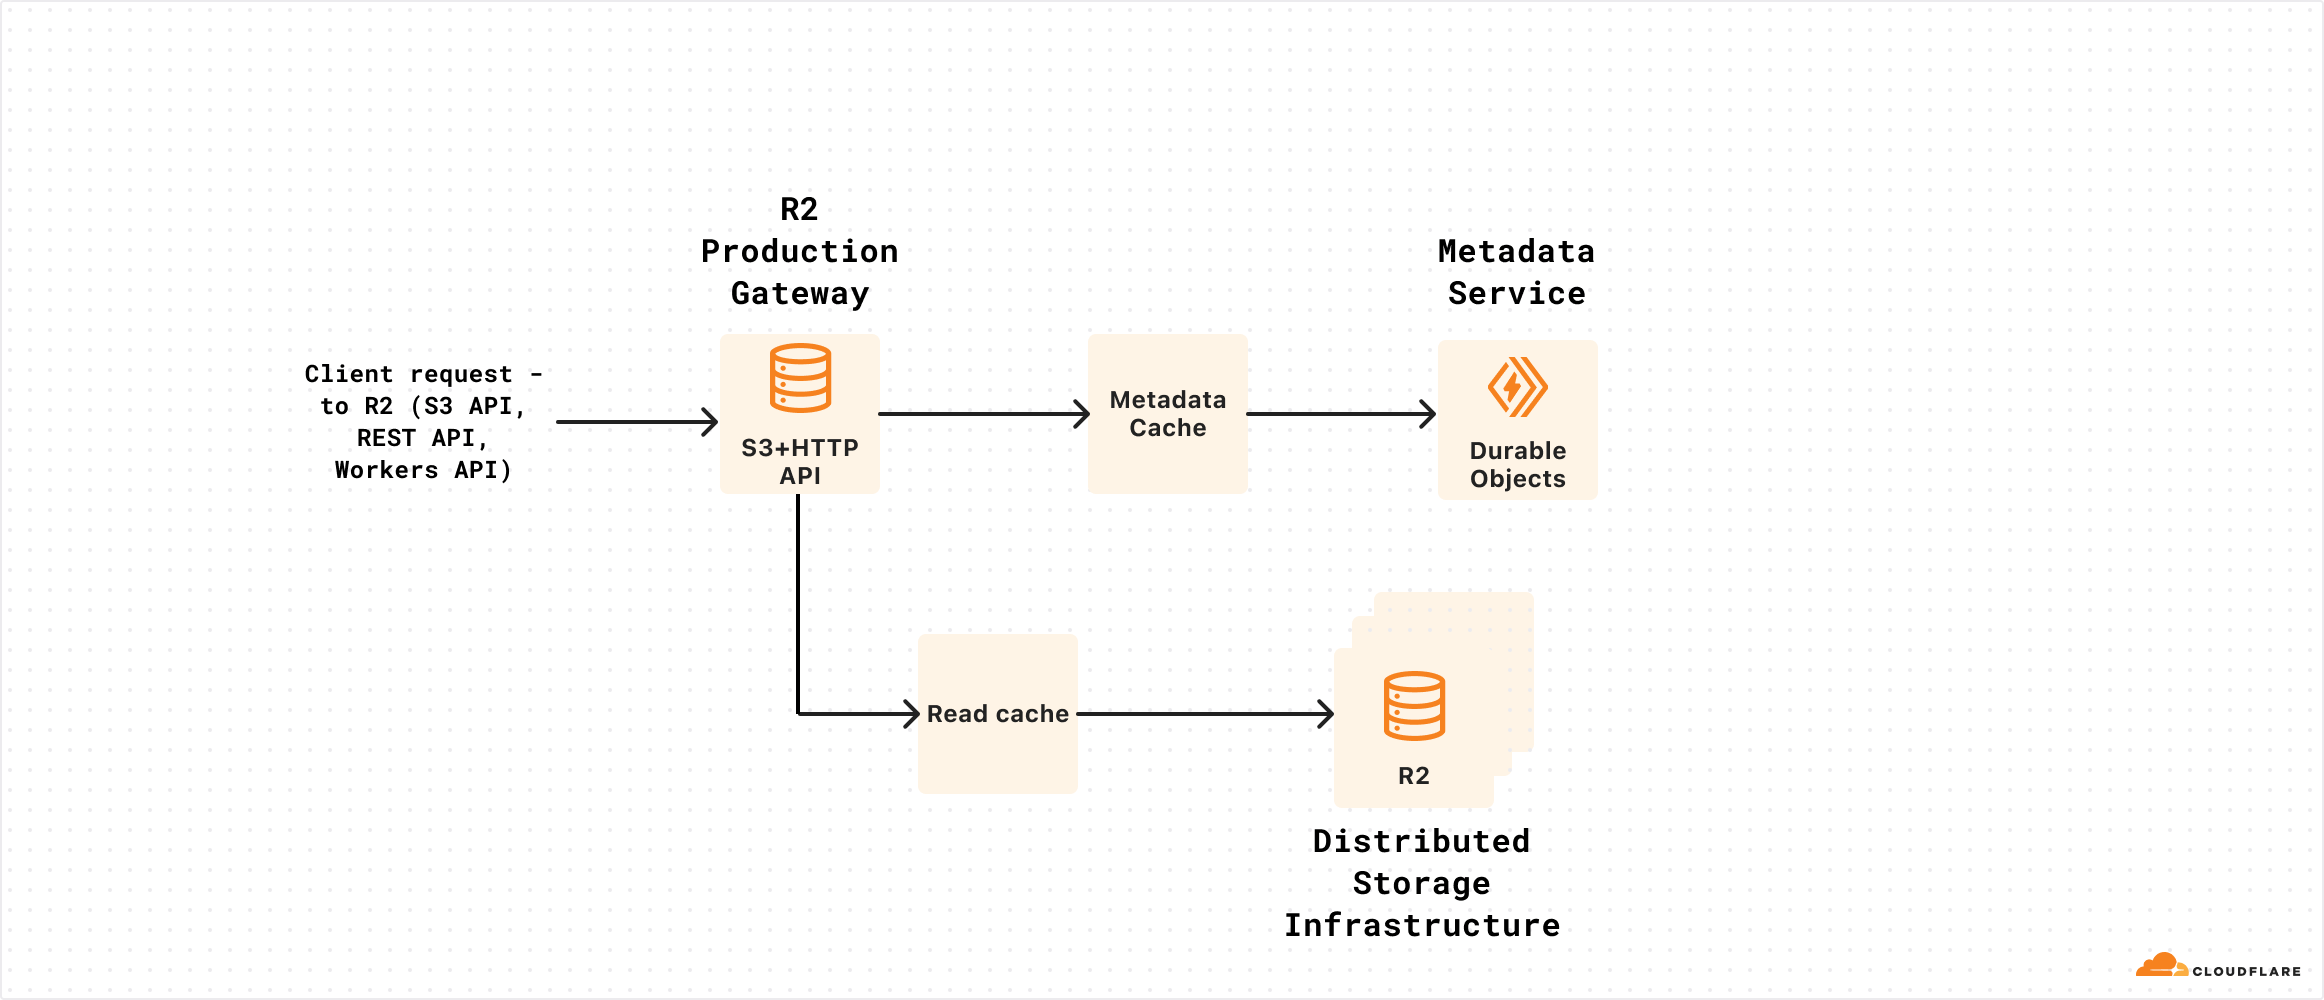
We launched R2 Object Storage in 2021 with a radical pricing strategy: no egress fees — the bandwidth costs that traditional cloud providers charge to get data out — effectively ransoming your data. This was possible because we had already built one of the largest global networks, interconnecting with thousands of ISPs, cloud services, and other enterprises.

Object storage powers a wide range of use cases, from media to static assets to AI training data. But over time, we’ve seen an increasing number of companies using open data and table formats to store their analytical data warehouses in R2.

The technology that enables this is Apache Iceberg. Iceberg is a table format, which provides database-like capabilities (including updates, ACID transactions, and schema evolution) on top of data files in object storage. In other words, it’s a metadata layer that tells clients which data files make up a particular logical table, what the schemas are, and how to efficiently query them.

The adoption of Iceberg across the industry meant users were no longer locked-in to one query engine. But egress fees still make it cost-prohibitive to query data across regions and clouds. R2, with zero-cost egress, solves that problem — users would no longer be locked-in to their clouds either. They could store their data in a vendor-neutral location and let teams use whatever query engine made sense for their data and query patterns.

But users still had to manage all of the metadata and other infrastructure themselves. We realized there was an opportunity for us to solve a major pain point and reduce the friction of storing data lakes on R2. This became R2 Data Catalog, our managed Iceberg catalog.

With the data stored on R2 and metadata managed, that still left a few gaps for users to solve.

How do you get data into your Iceberg tables? Once it’s there, how do you optimize for query performance? And how do you actually get value from your data without needing to self-host a query engine or use another cloud platform?

In the rest of this post, we’ll walk through how the three products that make up the Data Platform solve these challenges.

Cloudflare Pipelines

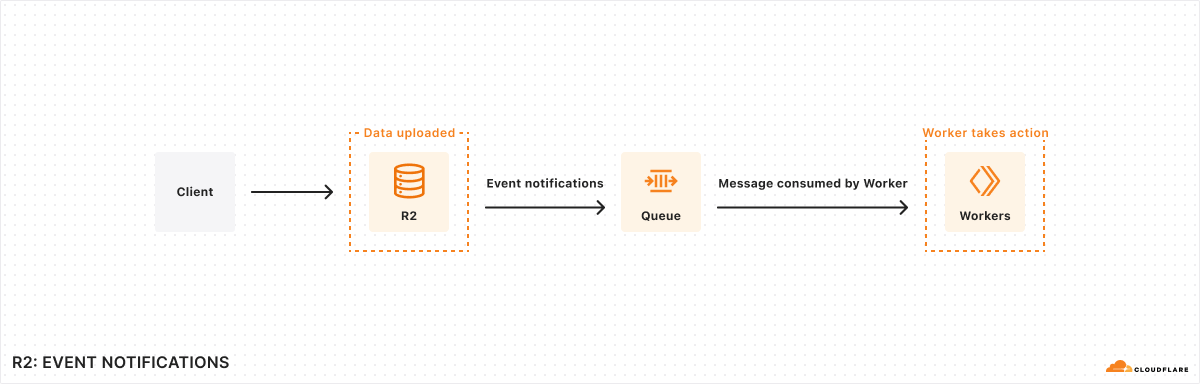
Analytical data tables are made up of events, things that happened at a particular point in time. They might come from server logs, mobile applications, or IoT devices, and are encoded in data formats like JSON, Avro, or Protobuf. They ideally have a schema — a standardized set of fields — but might just be whatever a particular team thought to throw in there.

But before you can query your events with Iceberg, they need to be ingested, structured according to a schema, and written into object storage. This is the role of Cloudflare Pipelines.

Built on top of Arroyo, a stream processing engine we acquired earlier this year, Pipelines receives events, transforms them with SQL queries, and sinks them to R2 and R2 Data Catalog.

Pipelines is organized around three central objects:

Streams are how you get data into Cloudflare. They’re durable, buffered queues that receive events and store them for processing. Streams can accept events in two ways: via an HTTP endpoint or from a Cloudflare Worker binding.

Sinks define the destination for your data. We support ingesting into R2 Data Catalog, as well as writing raw files to R2 as JSON or Apache Parquet. Sinks can be configured to frequently write files, prioritizing low-latency ingestion, or to write less frequent, larger files to get better query performance. In either case, ingestion is exactly-once, which means that we will never duplicate or drop events on their way to R2.

Pipelines connect streams and sinks via SQL transformations, which can modify events before writing them to storage. This enables you to shift left, pushing validation, schematization, and processing to your ingestion layer to make your queries easy, fast, and correct.


For example, here’s a pipeline that ingests events from a clickstream data source and writes them to Iceberg:

INSERT into events_table
SELECT
  user_id,
  lower(event) AS event_type,
  to_timestamp_micros(ts_us) AS event_time,
  regexp_match(url, '^https?://([^/]+)')[1]  AS domain,
  url,
  referrer,
  user_agent
FROM events_json
WHERE event = 'page_view'
  AND NOT regexp_like(user_agent, '(?i)bot|spider');

SQL transformations are very powerful and give you full control over how data is structured and written into the table. For example, you can

  • Schematize and normalize your data, even using JSON functions to extract fields from arbitrary JSON

  • Filter out events or split them into separate tables with their own schemas

  • Redact sensitive information before storage with regexes

  • Unroll nested arrays and objects into separate events

Initially, Pipelines supports stateless transformations. In the future, we’ll leverage more of Arroyo’s stateful processing capabilities to support aggregations, incrementally-updated materialized views, and joins.

Cloudflare Pipelines is available today in open beta. You can create a pipeline using the dashboard, Wrangler, or the REST API. To get started, check out our developer docs.

We aren’t currently billing for Pipelines during the open beta. However, R2 storage and operations incurred by sinks writing data to R2 are billed at standard rates. When we start billing, we anticipate charging based on the amount of data read, the amount of data processed via SQL transformations, and data delivered.

R2 Data Catalog

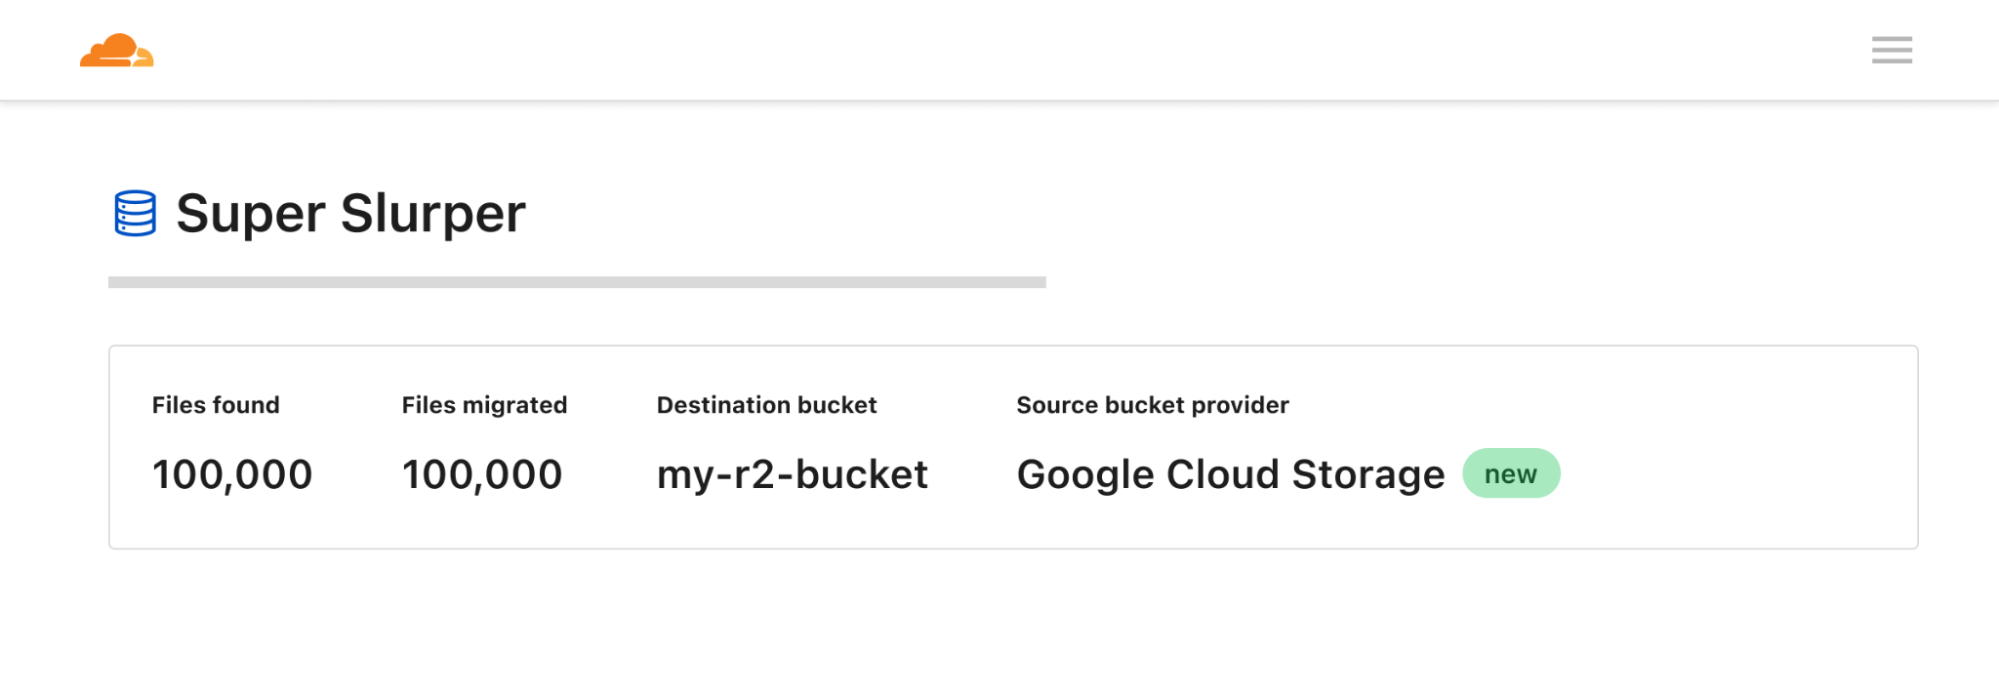
We launched the open beta of R2 Data Catalog in April and have been amazed by the response. Query engines like DuckDB have added native support, and we’ve seen useful integrations like marimo notebooks.

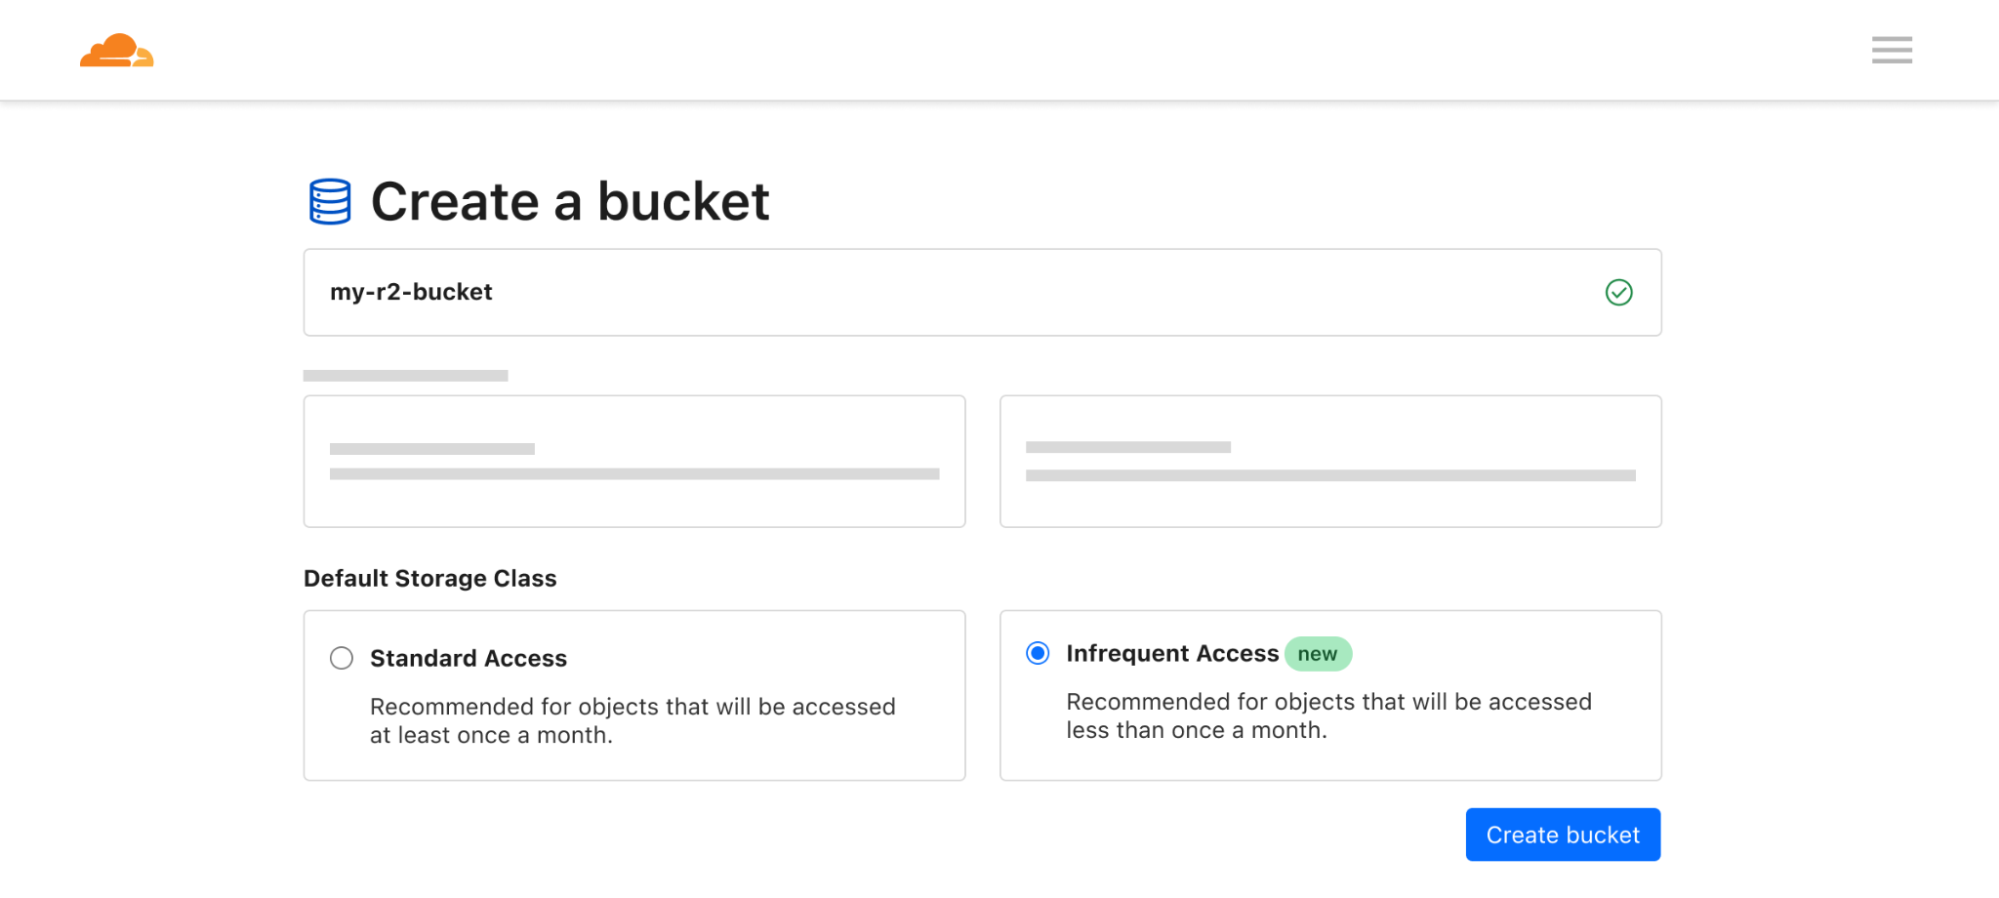
It makes getting started with Iceberg easy. There’s no need to set up a database cluster, connect to object storage, or manage any infrastructure. You can create a catalog with a couple of Wrangler commands:

$ npx wrangler bucket create mycatalog 
$ npx wrangler r2 bucket catalog enable mycatalog

This provisions a data lake that can scale to petabytes of storage, queryable by whatever engine you want to use with zero egress fees.

But just storing the data isn’t enough. Over time, as data is ingested, the number of underlying data files that make up a table will grow, leading to slower and slower query performance.

This is a particular problem with low-latency ingestion, where the goal is to have events queryable as quickly as possible. Writing data frequently means the files are smaller, and there are more of them. Each file needed for a query has to be listed, downloaded, and read. The overhead of too many small files can dominate the total query time.

The solution is compaction, a periodic maintenance operation performed automatically by the catalog. Compaction rewrites small files into larger files which reduces metadata overhead and increases query performance. 

Today we are launching compaction support in R2 Data Catalog. Enabling it for your catalog is as easy as:

$ npx wrangler r2 bucket catalog compaction enable mycatalog

We’re starting with support for small-file compaction, and will expand to additional compaction strategies in the future. Check out the compaction documentation to learn more about how it works and how to enable it.

At this time, during open beta, we aren’t billing for R2 Data Catalog. Below is our current thinking on future pricing:

Pricing*

R2 storage

For standard storage class

$0.015 per GB-month (no change)

R2 Class A operations

$4.50 per million operations (no change)

R2 Class B operations

$0.36 per million operations (no change)

Data Catalog operations

e.g., create table, get table metadata, update table properties

$9.00 per million catalog operations

Data Catalog compaction data processed

$0.005 per GB processed

$2.00 per million objects processed

Data egress

$0 (no change, always free)

*prices subject to change prior to General Availability

We will provide at least 30 days notice before billing starts or if anything changes.

R2 SQL

Having data in R2 Data Catalog is only the first step; the real goal is getting insights and value from it. Traditionally, that means setting up and managing DuckDB, Spark, Trino, or another query engine, adding a layer of operational overhead between you and those insights. What if instead you could run queries directly on Cloudflare?

Now you can. We’ve built a query engine specifically designed for R2 Data Catalog and Cloudflare’s edge infrastructure. We call it R2 SQL, and it’s available today as an open beta.

With Wrangler, running a query on an R2 Data Catalog table is as easy as

$ npx wrangler r2 sql query "{WAREHOUSE}" "\
  SELECT user_id, url FROM events \
  WHERE domain = 'mywebsite.com'"

Cloudflare’s ability to schedule compute anywhere on its global network is the foundation of R2 SQL’s design. This lets us process data directly where it lives, instead of requiring you to manage centralized clusters for your analytical workloads.

R2 SQL is tightly integrated with R2 Data Catalog and R2, which allows the query planner to go beyond simple storage scanning and make deep use of the rich statistics stored in the R2 Data Catalog metadata. This provides a powerful foundation for a new class of query optimizations, such as auxiliary indexes or enabling more complex analytical functions in the future.

The result is a fully serverless experience for users. You can focus on your SQL without needing a deep understanding of how the engine operates. If you are interested in how R2 SQL works, the team has written a deep dive into how R2 SQL’s distributed query engine works at scale.

The open beta is an early preview of R2 SQL querying capabilities, and is initially focused around filter queries. Over time, we will be expanding its capabilities to cover more SQL features, like complex aggregations.

We’re excited to see what our users do with R2 SQL. To try it out, see the documentation and tutorials. During the beta, R2 SQL usage is not currently billed, but R2 storage and operations incurred by queries are billed at standard rates. We plan to charge for the volume of data scanned by queries in the future and will provide notice before billing begins.

Wrapping up

Today, you can use the Cloudflare Data Platform to ingest events into R2 Data Catalog and query them via R2 SQL. In the first half of 2026, we’ll be expanding on the capabilities in all of these products, including:

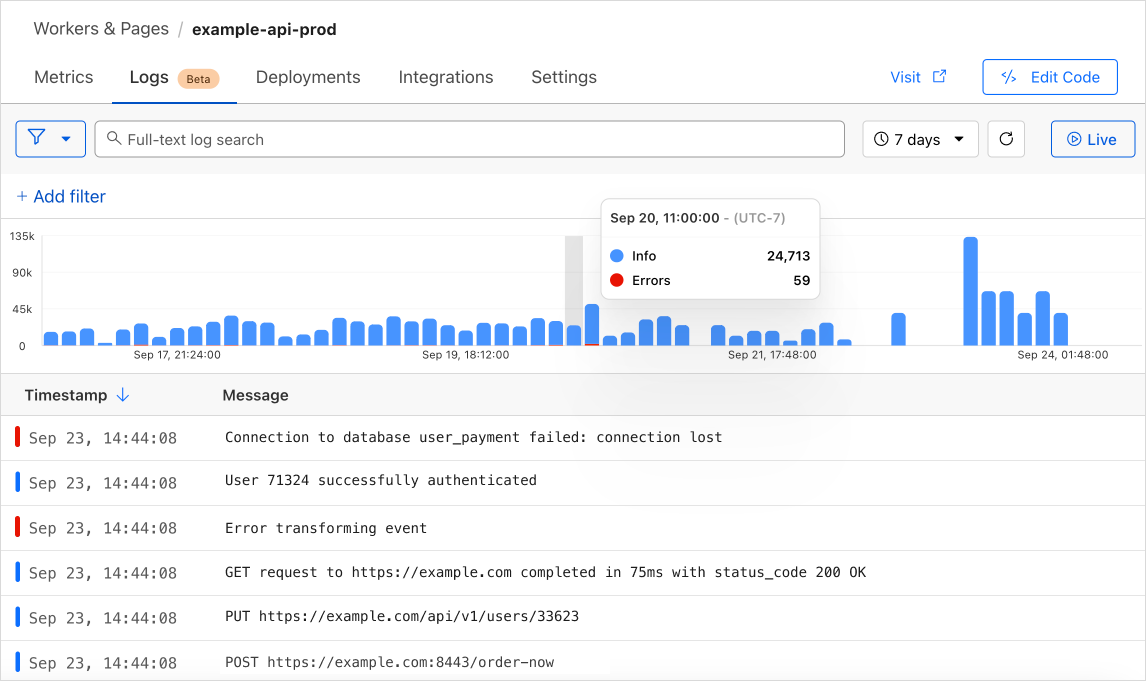
  • Integration with Logpush, so you can transform, store, and query your logs directly within Cloudflare

  • User-defined functions via Workers, and stateful processing support for streaming transformations

  • Expanding the featureset of R2 SQL to cover aggregations and joins

In the meantime, you can get started with the Cloudflare Data Platform by following the tutorial to create an end-to-end analytical data system, from ingestion with Pipelines, through storage in R2 Data Catalog, and querying with R2 SQL. 

We’re excited to see what you build! Come share your feedback with us on our Developer Discord.

Cloudflare Log Explorer is now GA, providing native observability and forensics

Post Syndicated from Jen Sells original https://blog.cloudflare.com/logexplorer-ga/

We are thrilled to announce the General Availability of Cloudflare Log Explorer, a powerful new product designed to bring observability and forensics capabilities directly into your Cloudflare dashboard. Built on the foundation of Cloudflare’s vast global network, Log Explorer leverages the unique position of our platform to provide a comprehensive and contextualized view of your environment.

Security teams and developers use Cloudflare to detect and mitigate threats in real-time and to optimize application performance. Over the years, users have asked for additional telemetry with full context to investigate security incidents or troubleshoot application performance issues without having to forward data to third party log analytics and Security Information and Event Management (SIEM) tools. Besides avoidable costs, forwarding data externally comes with other drawbacks such as: complex setups, delayed access to crucial data, and a frustrating lack of context that complicates quick mitigation. 

Log Explorer has been previewed by several hundred customers over the last year, and they attest to its benefits: 

“Having WAF logs (firewall events) instantly available in Log Explorer with full context — no waiting, no external tools — has completely changed how we manage our firewall rules. I can spot an issue, adjust the rule with a single click, and immediately see the effect. It’s made tuning for false positives faster, cheaper, and far more effective.” 

“While we use Logpush to ingest Cloudflare logs into our SIEM, when our development team needs to analyze logs, it can be more effective to utilize Log Explorer. SIEMs make it difficult for development teams to write their own queries and manipulate the console to see the logs they need. Cloudflare’s Log Explorer, on the other hand, makes it much easier for dev teams to look at logs and directly search for the information they need.”

With Log Explorer, customers have access to Cloudflare logs with all the context available within the Cloudflare platform. Compared to external tools, customers benefit from: 

  • Reduced cost and complexity: Drastically reduce the expense and operational overhead associated with forwarding, storing, and analyzing terabytes of log data in external tools.

  • Faster detection and triage: Access Cloudflare-native logs directly, eliminating cumbersome data pipelines and the ingest lags that delay critical security insights.

  • Accelerated investigations with full context: Investigate incidents with Cloudflare’s unparalleled contextual data, accelerating your analysis and understanding of “What exactly happened?” and “How did it happen?”

  • Minimal recovery time: Seamlessly transition from investigation to action with direct mitigation capabilities via the Cloudflare platform.

Log Explorer is available as an add-on product for customers on our self serve or Enterprise plans. Read on to learn how each of the capabilities of Log Explorer can help you detect and diagnose issues more quickly.

Monitor security and performance issues with custom dashboards

Custom dashboards allow you to define the specific metrics you need in order to monitor unusual or unexpected activity in your environment.

Getting started is easy, with the ability to create a chart using natural language. A natural language interface is integrated into the chart create/edit experience, enabling you to describe in your own words the chart you want to create. Similar to the AI Assistant we announced during Security Week 2024, the prompt translates your language to the appropriate chart configuration, which can then be added to a new or existing custom dashboard.

As an example, you can create a dashboard for monitoring for the presence of Remote Code Execution (RCE) attacks happening in your environment. An RCE attack is where an attacker is able to compromise a machine in your environment and execute commands. The good news is that RCE is a detection available in Cloudflare WAF.  In the dashboard example below, you can not only watch for RCE attacks, but also correlate them with other security events such as malicious content uploads, source IP addresses, and JA3/JA4 fingerprints. Such a scenario could mean one or more machines in your environment are compromised and being used to spread malware — surely, a very high risk incident!


A reliability engineer might want to create a dashboard for monitoring errors. They could use the natural language prompt to enter a query like “Compare HTTP status code ranges over time.” The AI model then decides the most appropriate visualization and constructs their chart configuration.

While you can create custom dashboards from scratch, you could also use an expert-curated dashboard template to jumpstart your security and performance monitoring. 

Available templates include: 

  • Bot monitoring: Identify automated traffic accessing your website

  • API Security: Monitor the data transfer and exceptions of API endpoints within your application

  • API Performance: See timing data for API endpoints in your application, along with error rates

  • Account Takeover: View login attempts, usage of leaked credentials, and identify account takeover attacks

  • Performance Monitoring: Identify slow hosts and paths on your origin server, and view time to first byte (TTFB) metrics over time

  • Security Monitoring: monitor attack distribution across top hosts and paths, correlate DDoS traffic with origin Response time to understand the impact of DDoS attacks.


Investigate and troubleshoot issues with Log Search 

Continuing with the example from the prior section, after successfully diagnosing that some machines were compromised through the RCE issue, analysts can pivot over to Log Search in order to investigate whether the attacker was able to access and compromise other internal systems. To do that, the analyst could search logs from Zero Trust services, using context, such as compromised IP addresses from the custom dashboard, shown in the screenshot below: 


Log Search is a streamlined experience including data type-aware search filters, or the ability to switch to a custom SQL interface for more powerful queries. Log searches are also available via a public API


Save time and collaborate with saved queries

Queries built in Log Search can now be saved for repeated use and are accessible to other Log Explorer users in your account. This makes it easier than ever to investigate issues together. 


Monitor proactively with Custom Alerting (coming soon)

With custom alerting, you can configure custom alert policies in order to proactively monitor the indicators that are important to your business. 

Starting from Log Search, define and test your query. From here you can opt to save and configure a schedule interval and alerting policy. The query will run automatically on the schedule you define.

Tracking error rate for a custom hostname

If you want to monitor the error rate for a particular host, you can use this Log Search query to calculate the error rate per time interval:

SELECT SUBSTRING(EdgeStartTimeStamp, 1, 14) || '00:00' AS time_interval,
       COUNT() AS total_requests,
       COUNT(CASE WHEN EdgeResponseStatus >= 500 THEN 1 ELSE NULL END) AS error_requests,
       COUNT(CASE WHEN EdgeResponseStatus >= 500 THEN 1 ELSE NULL END) * 100.0 / COUNT() AS error_rate_percentage
 FROM http_requests
WHERE EdgeStartTimestamp >= '2025-06-09T20:56:58Z'
  AND EdgeStartTimestamp <= '2025-06-10T21:26:58Z'
  AND ClientRequestHost = 'customhostname.com'
GROUP BY time_interval
ORDER BY time_interval ASC;

Running the above query returns the following results. You can see the overall error rate percentage in the far right column of the query results.


Proactively detect malware

We can identify malware in the environment by monitoring logs from Cloudflare Secure Web Gateway. As an example, Katz Stealer is malware-as-a-service designed for stealing credentials. We can monitor DNS queries and HTTP requests from users within the company in order to identify any machines that may be infected with Katz Stealer malware. 


And with custom alerts, you can configure an alert policy so that you can be notified via webhook or PagerDuty.

Maintain audit & compliance with flexible retention (coming soon)

With flexible retention, you can set the precise length of time you want to store your logs, allowing you to meet specific compliance and audit requirements with ease. Other providers require archiving or hot and cold storage, making it difficult to query older logs. Log Explorer is built on top of our R2 storage tier, so historical logs can be queried as easily as current logs. 

How we built Log Explorer to run at Cloudflare scale

With Log Explorer, we have built a scalable log storage platform on top of Cloudflare R2 that lets you efficiently search your Cloudflare logs using familiar SQL queries. In this section, we’ll look into how we did this and how we solved some technical challenges along the way.

Log Explorer consists of three components: ingestors, compactors, and queriers. Ingestors are responsible for writing logs from Cloudflare’s data pipeline to R2. Compactors optimize storage files, so they can be queried more efficiently. Queriers execute SQL queries from users by fetching, transforming, and aggregating matching logs from R2.


During ingestion, Log Explorer writes each batch of log records to a Parquet file in R2. Apache Parquet is an open-source columnar storage file format, and it was an obvious choice for us: it’s optimized for efficient data storage and retrieval, such as by embedding metadata like the minimum and maximum values of each column across the file which enables the queriers to quickly locate the data needed to serve the query.

Log Explorer stores logs on a per-customer level, just like Cloudflare D1, so that your data isn’t mixed with that of other customers. In Q3 2025, per-customer logs will allow you the flexibility to create your own retention policies and decide in which regions you want to store your data.

But how does Log Explorer find those Parquet files when you query your logs? Log Explorer leverages the Delta Lake open table format to provide a database table abstraction atop R2 object storage. A table in Delta Lake pairs data files in Parquet format with a transaction log. The transaction log registers every addition, removal, or modification of a data file for the table – it’s stored right next to the data files in R2.

Given a SQL query for a particular log dataset such as HTTP Requests or Gateway DNS, Log Explorer first has to load the transaction log of the corresponding Delta table from R2. Transaction logs are checkpointed periodically to avoid having to read the entire table history every time a user queries their logs.

Besides listing Parquet files for a table, the transaction log also includes per-column min/max statistics for each Parquet file. This has the benefit that Log Explorer only needs to fetch files from R2 that can possibly satisfy a user query. Finally, queriers use the min/max statistics embedded in each Parquet file to decide which row groups to fetch from the file.

Log Explorer processes SQL queries using Apache DataFusion, a fast, extensible query engine written in Rust, and delta-rs, a community-driven Rust implementation of the Delta Lake protocol. While standing on the shoulders of giants, our team had to solve some unique problems to provide log search at Cloudflare scale.

Log Explorer ingests logs from across Cloudflare’s vast global network, spanning more than 330 cities in over 125 countries. If Log Explorer were to write logs from our servers straight to R2, its storage would quickly fragment into a myriad of small files, rendering log queries prohibitively expensive.

Log Explorer’s strategy to avoid this fragmentation is threefold. First, it leverages Cloudflare’s data pipeline, which collects and batches logs from the edge, ultimately buffering each stream of logs in an internal system named Buftee. Second, log batches ingested from Buftee aren’t immediately committed to the transaction log; rather, Log Explorer stages commits for multiple batches in an intermediate area and “squashes” these commits before they’re written to the transaction log. Third, once log batches have been committed, a process called compaction merges them into larger files in the background.

While the open-source implementation of Delta Lake provides compaction out of the box, we soon encountered an issue when using it for our workloads. Stock compaction merges data files to a desired target size S by sorting the files in reverse order of their size and greedily filling bins of size S with them. By merging logs irrespective of their timestamps, this process distributed ingested batches randomly across merged files, destroying data locality. Despite compaction, a user querying for a specific time frame would still end up fetching hundreds or thousands of files from R2.

For this reason, we wrote a custom compaction algorithm that merges ingested batches in order of their minimum log timestamp, leveraging the min/max statistics mentioned previously. This algorithm reduced the number of overlaps between merged files by two orders of magnitude. As a result, we saw a significant improvement in query performance, with some large queries that had previously taken over a minute completing in just a few seconds.

Follow along for more updates

We’re just getting started! We’re actively working on even more powerful features to further enhance your experience with Log Explorer. Subscribe to the blog and keep an eye out for more updates in our Change Log to our observability and forensics offering soon.

Get access to Log Explorer

To get access to Log Explorer, reach out for a consultation or contact your account manager. Additionally, you can read more in our Developer Documentation.

Cloudflare incident on March 21, 2025

Post Syndicated from Phillip Jones original https://blog.cloudflare.com/cloudflare-incident-march-21-2025/

Multiple Cloudflare services, including R2 object storage, experienced an elevated rate of errors for 1 hour and 7 minutes on March 21, 2025 (starting at 21:38 UTC and ending 22:45 UTC). During the incident window, 100% of write operations failed and approximately 35% of read operations to R2 failed globally. Although this incident started with R2, it impacted other Cloudflare services including Cache Reserve, Images, Log Delivery, Stream, and Vectorize.

While rotating credentials used by the R2 Gateway service (R2’s API frontend) to authenticate with our storage infrastructure, the R2 engineering team inadvertently deployed the new credentials (ID and key pair) to a development instance of the service instead of production. When the old credentials were deleted from our storage infrastructure (as part of the key rotation process), the production R2 Gateway service did not have access to the new credentials. This ultimately resulted in R2’s Gateway service being able to authenticate with our storage backend. There was no data loss or corruption that occurred as part of this incident: any in-flight uploads or mutations that returned successful HTTP status codes were persisted.

Once the root cause was identified and we realized we hadn’t deployed the new credentials to the production R2 Gateway service, we deployed the updated credentials and service availability was restored. 

This incident happened because of human error and lasted longer than it should have because we didn’t have proper visibility into which credentials were being used by the Gateway Worker to authenticate with our storage infrastructure. 

We’re deeply sorry for this incident and the disruption it may have caused to you or your users. We hold ourselves to a high standard and this is not acceptable. This blog post exactly explains the impact, what happened and when, and the steps we are taking to make sure this failure (and others like it) doesn’t happen again.

What was impacted?

The primary incident window occurred between 21:38 UTC and 22:45 UTC.

The following table details the specific impact to R2 and Cloudflare services that depend on, or interact with, R2:

Product/Service Impact
R2 All customers using Cloudflare R2 would have experienced an elevated error rate during the primary incident window. Specifically:

* Object write operations had a 100% error rate.

* Object reads had an approximate error rate of 35% globally. Individual customer error rate varied during this window depending on access patterns. Customers accessing public assets through custom domains would have seen a reduced error rate as cached object reads were not impacted.

* Operations involving metadata only (e.g., head and list operations) were not impacted.

There was no data loss or risk to data integrity within R2’s storage subsystem. This incident was limited to a temporary authentication issue between R2’s API frontend and our storage infrastructure.

Billing Billing uses R2 to store customer invoices. During the primary incident window, customers may have experienced errors when attempting to download/access past Cloudflare invoices.
Cache Reserve Cache Reserve customers observed an increase in requests to their origin during the incident window as an increased percentage of reads to R2 failed. This resulted in an increase in requests to origins to fetch assets unavailable in Cache Reserve during this period.

User-facing requests for assets to sites with Cache Reserve did not observe failures as cache misses failed over to the origin.

Email Security Email Security depends on R2 for customer-facing metrics. During the primary incident window, customer-facing metrics would not have updated.
Images All (100% of) uploads failed during the primary incident window. Successful delivery of stored images dropped to approximately 25%.
Key Transparency Auditor All (100% of) operations failed during the primary incident window due to dependence on R2 writes and/or reads. Once the incident was resolved, service returned to normal operation immediately.
Log Delivery Log delivery (for Logpush and Logpull) was delayed during the primary incident window, resulting in significant delays (up to 70 minutes) in log processing. All logs were delivered after incident resolution.
Stream All (100% of) uploads failed during the primary incident window. Successful Stream video segment delivery dropped to 94%. Viewers may have seen video stalls every minute or so, although actual impact would have varied.

Stream Live was down during the primary incident window as it depends on object writes.

Vectorize Queries and operations against Vectorize indexes were impacted during the incident window. During the incident window, Vectorize customers would have seen an increased error rate for read queries to indexes and all (100% of) insert and upsert operation failed as Vectorize depends on R2 for persistent storage.

Incident timeline

All timestamps referenced are in Coordinated Universal Time (UTC).

Time Event
Mar 21, 2025 – 19:49 UTC The R2 engineering team started the credential rotation process. A new set of credentials (ID and key pair) for storage infrastructure was created. Old credentials were maintained to avoid downtime during credential change over.
Mar 21, 2025 – 20:19 UTC Set updated production secret (wrangler secret put) and executed wrangler deploy command to deploy R2 Gateway service with updated credentials.

Note: We later discovered the –env parameter was inadvertently omitted for both Wrangler commands. This resulted in credentials being deployed to the Worker assigned to the default environment instead of the Worker assigned to the production environment.

Mar 21, 2025 – 20:20 UTC The R2 Gateway service Worker assigned to the default environment is now using the updated storage infrastructure credentials.

Note: This was the wrong Worker, the production environment should have been explicitly set. But, at this point, we incorrectly believed the credentials were updated on the correct production Worker.

Mar 21, 2025 – 20:37 UTC Old credentials were removed from our storage infrastructure to complete the credential rotation process.
Mar 21, 2025 – 21:38 UTC – IMPACT BEGINS –

R2 availability metrics begin to show signs of service degradation. The impact to R2 availability metrics was gradual and not immediately obvious because there was a delay in the propagation of the previous credential deletion to storage infrastructure.

Mar 21, 2025 – 21:45 UTC R2 global availability alerts are triggered (indicating 2% of error budget burn rate).

The R2 engineering team began looking at operational dashboards and logs to understand impact.

Mar 21, 2025 – 21:50 UTC Internal incident declared.
Mar 21, 2025 – 21:51 UTC R2 engineering team observes gradual but consistent decline in R2 availability metrics for both read and write operations. Operations involving metadata only (e.g., head and list operations) were not impacted.

Given gradual decline in availability metrics, R2 engineering team suspected a potential regression in propagation of new credentials in storage infrastructure.

Mar 21, 2025 – 22:05 UTC Public incident status page published.
Mar 21, 2025 – 22:15 UTC R2 engineering team created a new set of credentials (ID and key pair) for storage infrastructure in an attempt to force re-propagation.

Continued monitoring operational dashboards and logs.

Mar 21, 2025 – 22:20 UTC R2 engineering team saw no improvement in availability metrics. Continued investigating other potential root causes.
Mar 21, 2025 – 22:30 UTC R2 engineering team deployed a new set of credentials (ID and key pair) to R2 Gateway service Worker. This was to validate whether there was an issue with the credentials we had pushed to gateway service.

Environment parameter was still omitted in the deploy and secret put commands, so this deployment was still to the wrong non-production Worker.

Mar 21, 2025 – 22:36 UTC – ROOT CAUSE IDENTIFIED –

The R2 engineering team discovered that credentials had been deployed to a non-production Worker by reviewing production Worker release history.

Mar 21, 2025 – 22:45 UTC – IMPACT ENDS –

Deployed credentials to correct production Worker. R2 availability recovered.

Mar 21, 2025 – 22:54 UTC The incident is considered resolved.

Analysis

R2’s architecture is primarily composed of three parts: R2 production gateway Worker (serves requests from S3 API, REST API, Workers API), metadata service, and storage infrastructure (stores encrypted object data).


The R2 Gateway Worker uses credentials (ID and key pair) to securely authenticate with our distributed storage infrastructure. We rotate these credentials regularly as a best practice security precaution.

Our key rotation process involves the following high-level steps:

  1. Create a new set of credentials (ID and key pair) for our storage infrastructure. At this point, the old credentials are maintained to avoid downtime during credential change over.

  2. Set the new credential secret for the R2 production gateway Worker using the wrangler secret put command.

  3. Set the new updated credential ID as an environment variable in the R2 production gateway Worker using the wrangler deploy command. At this point, new storage credentials start being used by the gateway Worker.

  4. Remove previous credentials from our storage infrastructure to complete the credential rotation process.

  5. Monitor operational dashboards and logs to validate change over.

The R2 engineering team uses Workers environments to separate production and development environments for the R2 Gateway Worker. Each environment defines a separate isolated Cloudflare Worker with separate environment variables and secrets. 

Critically, both wrangler secret put and wrangler deploy commands default to the default environment if the –env command line parameter is not included. In this case, due to human error, we inadvertently omitted the –env parameter and deployed the new storage credentials to the wrong Worker (default environment instead of production). To correctly deploy storage credentials to the production R2 Gateway Worker, we need to specify --env production.

The action we took on step 4 above to remove the old credentials from our storage infrastructure caused authentication errors, as the R2 Gateway production Worker still had the old credentials. This is ultimately what resulted in degraded availability.

The decline in R2 availability metrics was gradual and not immediately obvious because there was a delay in the propagation of the previous credential deletion to storage infrastructure. This accounted for a delay in our initial discovery of the problem. Instead of relying on availability metrics after updating the old set of credentials, we should have explicitly validated which token was being used by the R2 Gateway service to authenticate with R2’s storage infrastructure.

Overall, the impact on read availability was significantly mitigated by our intermediate cache that sits in front of storage and continued to serve requests.

Resolution

Once we identified the root cause, we were able to resolve the incident quickly by deploying the new credentials to the production R2 Gateway Worker. This resulted in an immediate recovery of R2 availability.

Next steps

This incident happened because of human error and lasted longer than it should have because we didn’t have proper visibility into which credentials were being used by the R2 Gateway Worker to authenticate with our storage infrastructure.

We have taken immediate steps to prevent this failure (and others like it) from happening again:

  • Added logging tags that include the suffix of the credential ID the R2 Gateway Worker uses to authenticate with our storage infrastructure. With this change, we can explicitly confirm which credential is being used.

  • Related to the above step, our internal processes now require explicit confirmation that the suffix of the new token ID matches logs from our storage infrastructure before deleting the previous token.

  • Require that key rotation takes place through our hotfix release tooling instead of relying on manual wrangler command entry which introduces human error. Our hotfix release deploy tooling explicitly enforces the environment configuration and contains other safety checks.

  • While it’s been an implicit standard that this process involves at least two humans to validate the changes ahead as we progress, we’ve updated our relevant SOPs (standard operating procedures) to include this explicitly.

  • In Progress: Extend our existing closed loop health check system that monitors our endpoints to test new keys, automate reporting of their status through our alerting platform, and ensure global propagation prior to releasing the gateway Worker.

  • In Progress: To expedite triage on any future issues with our distributed storage endpoints, we are updating our observability platform to include views of upstream success rates that bypass caching to give clearer indication of issues serving requests for any reason.

The list above is not exhaustive: as we work through the above items, we will likely uncover other improvements to our systems, controls, and processes that we’ll be applying to improve R2’s resiliency, on top of our business-as-usual efforts. We are confident that this set of changes will prevent this failure, and related credential rotation failure modes, from occurring again. Again, we sincerely apologize for this incident and deeply regret any disruption it has caused you or your users.

Cloudflare enables native monitoring and forensics with Log Explorer and custom dashboards

Post Syndicated from Jen Sells original https://blog.cloudflare.com/monitoring-and-forensics/

In 2024, we announced Log Explorer, giving customers the ability to store and query their HTTP and security event logs natively within the Cloudflare network. Today, we are excited to announce that Log Explorer now supports logs from our Zero Trust product suite. In addition, customers can create custom dashboards to monitor suspicious or unusual activity.

Every day, Cloudflare detects and protects customers against billions of threats, including DDoS attacks, bots, web application exploits, and more. SOC analysts, who are charged with keeping their companies safe from the growing spectre of Internet threats, may want to investigate these threats to gain additional insights on attacker behavior and protect against future attacks. Log Explorer, by collecting logs from various Cloudflare products, provides a single starting point for investigations. As a result, analysts can avoid forwarding logs to other tools, maximizing productivity and minimizing costs. Further, analysts can monitor signals specific to their organizations using custom dashboards.

Zero Trust dataset support in Log Explorer

Log Explorer stores your Cloudflare logs for a 30-day retention period so that you can analyze them natively and in a single interface, within the Cloudflare Dashboard. Cloudflare log data is diverse, reflecting the breadth of capabilities available.  For example, HTTP requests contain information about the client such as their IP address, request method, autonomous system (ASN), request paths, and TLS versions used. Additionally, Cloudflare’s Application Security WAF Detections enrich these HTTP request logs with additional context, such as the WAF attack score, to identify threats.

Today we are announcing that seven additional Cloudflare product datasets are now available in Log Explorer. These seven datasets are the logs generated from our Zero Trust product suite, and include logs from Access, Gateway DNS, Gateway HTTP, Gateway Network, CASB, Zero 

Trust Network Session, and Device Posture Results. Read on for examples of how to use these logs to identify common threats.

Investigating unauthorized access

By reviewing Access logs and HTTP request logs, we can reveal attempts to access resources or systems without proper permissions, including brute force password attacks, indicating potential security breaches or malicious activity.

Below, we filter Access Logs on the Allowed field, to see activity related to unauthorized access.


By then reviewing the HTTP logs for the requests identified in the previous query, we can assess if bot networks are the source of unauthorized activity.


With this information, you can craft targeted Custom Rules to block the offending traffic. 

Detecting malware

Cloudflare’s Web Gateway can track which websites users are accessing, allowing administrators to identify and block access to malicious or inappropriate sites. These logs can be used to detect if a user’s machine or account is compromised by malware attacks. When reviewing logs, this may become apparent when we look for records that show a rapid succession of attempts to browse known malicious sites, such as hostnames that have long strings of seemingly random characters that hide their true destination. In this example, we can query logs looking for requests to a spoofed YouTube URL.


Monitoring what matters using custom dashboards

Security monitoring is not one size fits all. For instance, companies in the retail or financial industries worry about fraud, while every company is concerned about data exfiltration, of information like trade secrets. And any form of personally identifiable information (PII) is a target for data breaches or ransomware attacks.

While log exploration helps you react to threats, our new custom dashboards allow you to define the specific metrics you need in order to monitor threats you are concerned about. 

Getting started is easy, with the ability to create a chart using natural language. A natural language interface is integrated into the chart create/edit experience, enabling you to describe in your own words the chart you want to create. Similar to the AI Assistant we announced during Security Week 2024, the prompt translates your language to the appropriate chart configuration, which can then be added to a new or existing custom dashboard.

  • Use a prompt: Enter a query like “Compare status code ranges over time”. The AI model decides the most appropriate visualization and constructs your chart configuration.

  • Customize your chart: Select the chart elements manually, including the chart type, title, dataset to query, metrics, and filters. This option gives you full control over your chart’s structure. 

Video shows entering a natural language description of desired metric “compare status code ranges over time”, preview chart shown is a time series grouped by error code ranges, selects “add chart” to save to dashboard.

For more help getting started, we have some pre-built templates that you can use for monitoring specific uses. Available templates currently include: 

  • Bot monitoring: Identify automated traffic accessing your website

  • API Security: Monitor the data transfer and exceptions of API endpoints within your application

  • API Performance: See timing data for API endpoints in your application, along with error rates

  • Account Takeover: View login attempts, usage of leaked credentials, and identify account takeover attacks

  • Performance Monitoring: Identify slow hosts and paths on your origin server, and view time to first byte (TTFB) metrics over time

Templates provide a good starting point, and once you create your dashboard, you can add or remove individual charts using the same natural language chart creator. 

Video shows editing chart from an existing dashboard and moving individual charts via drag and drop.

Example use cases

Custom dashboards can be used to monitor for suspicious activity, or to keep an eye on performance and errors for your domains. Let’s explore some examples of suspicious activity that we can monitor using custom dashboards.

Take, for example, our use case from above: investigating unauthorized access. With custom dashboards, you can create a dashboard using the Account takeover template to monitor for suspicious login activity related to your domain.


As another example, spikes in requests or errors are common indicators that something is wrong, and they can sometimes be signals of suspicious activity. With the Performance Monitoring template, you can view origin response time and time to first byte metrics as well as monitor for common errors. For example, in this chart, the spikes in 404 errors could be an indication of an unauthorized scan of your endpoints.


Seamlessly integrated into the Cloudflare platform

When using custom dashboards, if you observe a traffic pattern or spike in errors that you would like to further investigate, you can click the button to “View in Security Analytics” in order to drill down further into the data and craft custom WAF rules to mitigate the threat.  


These tools, seamlessly integrated into the Cloudflare platform, will enable users to discover, investigate, and mitigate threats all in one place, reducing time to resolution and overall cost of ownership by eliminating the need to forward logs to third party security analysis tools. And because it is a native part of Cloudflare, you can immediately use the data from your investigation to craft targeted rules that will block these threats. 

What’s next

Stay tuned as we continue to develop more capabilities in the areas of observability and forensics, with additional features including: 

  • Custom alerts: create alerts based on specific metrics or anomalies

  • Scheduled query detections: craft log queries and run them on a schedule to detect malicious activity

  • More integration: further streamlining the journey between detect, investigate, and mitigate across the full Cloudflare platform.

How to get it

Current Log Explorer beta users get immediate access to the new custom dashboards feature. Pricing will be made available to everyone during Q2 2025. Between now and then, these features continue to be available at no cost.

Let us know if you are interested in joining our Beta program by completing this form, and a member of our team will contact you.

Watch on Cloudflare TV

Cloudflare Incident on February 6, 2025

Post Syndicated from Matt Silverlock original https://blog.cloudflare.com/cloudflare-incident-on-february-6-2025/

Multiple Cloudflare services, including our R2 object storage, were unavailable for 59 minutes on Thursday, February 6th. This caused all operations against R2 to fail for the duration of the incident, and caused a number of other Cloudflare services that depend on R2 — including Stream, Images, Cache Reserve, Vectorize and Log Delivery — to suffer significant failures.

The incident occurred due to human error and insufficient validation safeguards during a routine abuse remediation for a report about a phishing site hosted on R2. The action taken on the complaint resulted in an advanced product disablement action on the site that led to disabling the production R2 Gateway service responsible for the R2 API.  

Critically, this incident did not result in the loss or corruption of any data stored on R2. 

We’re deeply sorry for this incident: this was a failure of a number of controls and we are prioritizing work to implement additional system-level controls related not only to our abuse processing systems, but so that we continue to reduce the blast radius of any system- or human- action that could result in disabling any production service at Cloudflare.

What was impacted?

All customers using Cloudflare R2 would have observed a 100% failure rate against their R2 buckets and objects during the primary incident window. Services that depend on R2 (detailed in the table below) observed heightened error rates and failure modes depending on their usage of R2.

The primary incident window occurred between 08:14 UTC to 09:13 UTC, when operations against R2 had a 100% error rate. Dependent services (detailed below) observed increased failure rates for operations that relied on R2.

From 09:13 UTC to 09:36 UTC, as R2 recovered and clients reconnected, the backlog and resulting spike in client operations caused load issues with R2’s metadata layer (built on Durable Objects). This impact was significantly more isolated: we observed a 0.09% increase in error rates in calls to Durable Objects running in North America during this window. 

The following table details the impacted services, including the user-facing impact, operation failures, and increases in error rates observed:

Product/Service

Impact

R2

100% of operations against R2 buckets and objects, including uploads, downloads, and associated metadata operations were impacted during the primary incident window. During the secondary incident window, we observed a <1% increase in errors as clients reconnected and increased pressure on R2’s metadata layer.

There was no data loss within the R2 storage subsystem: this incident impacted the HTTP frontend of R2. Separation of concerns and blast radius management meant that the underlying R2 infrastructure was unaffected by this.

Stream

100% of operations (upload & streaming delivery) against assets managed by Stream were impacted during the primary incident window.

Images

100% of operations (uploads & downloads) against assets managed by Images were impacted during the primary incident window.

Impact to Image Delivery was minor: success rate dropped to 97% as these assets are fetched from existing customer backends and do not rely on intermediate storage.

Cache Reserve

Cache Reserve customers observed an increase in requests to their origin during the incident window as 100% of operations failed. This resulted in an increase in requests to origins to fetch assets unavailable in Cache Reserve during this period. This impacted less than 0.049% of all cacheable requests served during the incident window.

User-facing requests for assets to sites with Cache Reserve did not observe failures as cache misses failed over to the origin.

Log Delivery

Log delivery was delayed during the primary incident window, resulting in significant delays (up to an hour) in log processing, as well as some dropped logs. 

Specifically:

Non-R2 delivery jobs would have experienced up to 4.5% data loss during the incident. This level of data loss could have been different between jobs depending on log volume and buffer capacity in a given location.

R2 delivery jobs would have experienced up to 13.6% data loss during the incident. 

R2 is a major destination for Cloudflare Logs. During the primary incident window, all available resources became saturated attempting to buffer and deliver data to R2. This prevented other jobs from acquiring resources to process their queues. Data loss (dropped logs) occurred when the job queues expired their data (to allow for new, incoming data). The system recovered when we enabled a kill switch to stop processing jobs sending data to R2.

Durable Objects

Durable Objects, and services that rely on it for coordination & storage, were impacted as the stampeding horde of clients re-connecting to R2 drove an increase in load.

We observed a 0.09% actual) increase in error rates in calls to Durable Objects running in North America, starting at 09:13 UTC and recovering by 09:36 UTC.

Cache Purge

Requests to the Cache Purge API saw a 1.8% error rate (HTTP 5xx) increase and a 10x increase in p90 latency for purge operations during the primary incident window. Error rates returned to normal immediately after this.

Vectorize

Queries and operations against Vectorize indexes were impacted during the primary incident window. 75% of queries to indexes failed (the remainder were served out of cache) and 100% of insert, upsert, and delete operations failed during the incident window as Vectorize depends on R2 for persistent storage. Once R2 recovered, Vectorize systems recovered in full.

We observed no continued impact during the secondary incident window, and we have not observed any index corruption as the Vectorize system has protections in place for this.

Key Transparency Auditor

100% of signature publish & read operations to the KT auditor service failed during the primary incident window. No third party reads occurred during this window and thus were not impacted by the incident.

Workers & Pages

A small volume (0.002%) of deployments to Workers and Pages projects failed during the primary incident window. These failures were limited to services with bindings to R2, as our control plane was unable to communicate with the R2 service during this period.

Incident timeline and impact

The incident timeline, including the initial impact, investigation, root cause, and remediation, are detailed below.

All timestamps referenced are in Coordinated Universal Time (UTC).

Time Event
2025-02-06 08:12 The R2 Gateway service is inadvertently disabled while responding to an abuse report.
2025-02-06 08:14 — IMPACT BEGINS —
2025-02-06 08:15 R2 service metrics begin to show signs of service degradation.
2025-02-06 08:17 Critical R2 alerts begin to fire due to our service no longer responding to our health checks.
2025-02-06 08:18 R2 on-call engaged and began looking at our operational dashboards and service logs to understand impact to availability.
2025-02-06 08:23 Sales engineering escalated to the R2 engineering team that customers are experiencing a rapid increase in HTTP 500’s from all R2 APIs.
2025-02-06 08:25 Internal incident declared.
2025-02-06 08:33 R2 on-call was unable to identify the root cause and escalated to the lead on-call for assistance.
2025-02-06 08:42 Root cause identified as R2 team reviews service deployment history and configuration, which surfaces the action and the validation gap that allowed this to impact a production service.
2025-02-06 08:46 On-call attempts to re-enable the R2 Gateway service using our internal admin tooling, however this tooling was unavailable because it relies on R2.
2025-02-06 08:49 On-call escalates to an operations team who has lower level system access and can re-enable the R2 Gateway service.
2025-02-06 08:57 The operations team engaged and began to re-enable the R2 Gateway service.
2025-02-06 09:09 R2 team triggers a redeployment of the R2 Gateway service.
2025-02-06 09:10 R2 began to recover as the forced re-deployment rolled out as clients were able to reconnect to R2.
2025-02-06 09:13 — IMPACT ENDS —
R2 availability recovers to within its service-level objective (SLO). Durable Objects begins to observe a slight increase in error rate (0.09%) for Durable Objects running in North America due to the spike in R2 clients reconnecting.
2025-02-06 09:36 The Durable Objects error rate recovers.
2025-02-06 10:29 The incident is closed after monitoring error rates.

At the R2 service level, our internal Prometheus metrics showed R2’s SLO near-immediately drop to 0% as R2’s Gateway service stopped serving all requests and terminated in-flight requests.

The slight delay in failure was due to the product disablement action taking 1-2 minutes to take effect as well as our configured metrics aggregation intervals:


For context, R2’s architecture separates the Gateway service, which is responsible for authenticating and serving requests to R2’s S3 & REST APIs and is the “front door” for R2 — its metadata store (built on Durable Objects), our intermediate caches, and the underlying, distributed storage subsystem responsible for durably storing objects. 


During the incident, all other components of R2 remained up: this is what allowed the service to recover so quickly once the R2 Gateway service was restored and re-deployed. The R2 Gateway acts as the coordinator for all work when operations are made against R2. During the request lifecycle, we validate authentication and authorization, write any new data to a new immutable key in our object store, then update our metadata layer to point to the new object. When the service was disabled, all running processes stopped.

While this means that all in-flight and subsequent requests fail, anything that had received a HTTP 200 response had already succeeded with no risk of reverting to a prior version when the service recovered. This is critical to R2’s consistency guarantees and mitigates the chance of a client receiving a successful API response without the underlying metadata and storage infrastructure having persisted the change.  

Deep dive 

Due to human error and insufficient validation safeguards in our admin tooling, the R2 Gateway service was taken down as part of a routine remediation for a phishing URL.

During a routine abuse remediation, action was taken on a complaint that inadvertently disabled the R2 Gateway service instead of the specific endpoint/bucket associated with the report. This was a failure of multiple system level controls (first and foremost) and operator training. 

A key system-level control that led to this incident was in how we identify (or “tag”) internal accounts used by our teams. Teams typically have multiple accounts (dev, staging, prod) to reduce the blast radius of any configuration changes or deployments, but our abuse processing systems were not explicitly configured to identify these accounts and block disablement actions against them. Instead of disabling the specific endpoint associated with the abuse report, the system allowed the operator to (incorrectly) disable the R2 Gateway service. 

Once we identified this as the cause of the outage, remediation and recovery was inhibited by the lack of direct controls to revert the product disablement action and the need to engage an operations team with lower level access than is routine. The R2 Gateway service then required a re-deployment in order to rebuild its routing pipeline across our edge network.

Once re-deployed, clients were able to re-connect to R2, and error rates for dependent services (including Stream, Images, Cache Reserve and Vectorize) returned to normal levels.

Remediation and follow-up steps

We have taken immediate steps to resolve the validation gaps in our tooling to prevent this specific failure from occurring in the future.

We are prioritizing several work-streams to implement stronger, system-wide controls (defense-in-depth) to prevent this, including how we provision internal accounts so that we are not relying on our teams to correctly and reliably tag accounts. A key theme to our remediation efforts here is around removing the need to rely on training or process, and instead ensuring that our systems have the right guardrails and controls built-in to prevent operator errors.

These work-streams include (but are not limited to) the following:

  • Actioned: deployed additional guardrails implemented in the Admin API to prevent product disablement of services running in internal accounts.

  • Actioned: Product disablement actions in the abuse review UI have been disabled while we add more robust safeguards. This will prevent us from inadvertently repeating similar high-risk manual actions.

  • In-flight: Changing how we create all internal accounts (staging, dev, production) to ensure that all accounts are correctly provisioned into the correct organization. This must include protections against creating standalone accounts to avoid re-occurrence of this incident (or similar) in the future.

  • In-flight: Further restricting access to product disablement actions beyond the remediations recommended by the system to a smaller group of senior operators.

  • In-flight: Two-party approval required for ad-hoc product disablement actions. Going forward, if an investigator requires additional remediations, they must be submitted to a manager or a person on our approved remediation acceptance list to approve their additional actions on an abuse report. 

  • In-flight: Expand existing abuse checks that prevent accidental blocking of internal hostnames to also prevent any product disablement action of products associated with an internal Cloudflare account.  

  • In-flight: Internal accounts are being moved to our new Organizations model ahead of public release of this feature. The R2 production account was a member of this organization but our abuse remediation engine did not have the necessary protections to prevent acting against accounts within this organization.

We’re continuing to discuss & review additional steps and effort that can continue to reduce the blast radius of any system- or human- action that could result in disabling any production service at Cloudflare.

Conclusion

We understand this was a serious incident and we are painfully aware of — and extremely sorry for — the impact it caused to customers and teams building and running their businesses on Cloudflare.

This is the first (and ideally, the last) incident of this kind and duration for R2, and we’re committed to improving controls across our systems and workflows to prevent this in the future.

Billions and billions (of logs): scaling AI Gateway with the Cloudflare Developer Platform

Post Syndicated from Catarina Pires Mota original https://blog.cloudflare.com/billions-and-billions-of-logs-scaling-ai-gateway-with-the-cloudflare

With the rapid advancements occurring in the AI space, developers face significant challenges in keeping up with the ever-changing landscape. New models and providers are continuously emerging, and understandably, developers want to experiment and test these options to find the best fit for their use cases. This creates the need for a streamlined approach to managing multiple models and providers, as well as a centralized platform to efficiently monitor usage, implement controls, and gather data for optimization.

AI Gateway is specifically designed to address these pain points. Since its launch in September 2023, AI Gateway has empowered developers and organizations by successfully proxying over 2 billion requests in just one year, as we highlighted during September’s Birthday Week. With AI Gateway, developers can easily store, analyze, and optimize their AI inference requests and responses in real time.

With our initial architecture, AI Gateway faced a significant challenge: the logs, those critical trails of data interactions between applications and AI models, could only be retained for 30 minutes. This limitation was not just a minor inconvenience; it posed a substantial barrier for developers and businesses needing to analyze long-term patterns, ensure compliance, or simply debug over more extended periods.

In this post, we’ll explore the technical challenges and strategic decisions behind extending our log storage capabilities from 30 minutes to being able to store billions of logs indefinitely. We’ll discuss the challenges of scale, the intricacies of data management, and how we’ve engineered a system that not only meets the demands of today, but is also scalable for the future of AI development.

Background

AI Gateway is built on Cloudflare Workers, a serverless platform that runs on the Cloudflare network, allowing developers to write small JavaScript functions that can execute at the point of need, near the user, on Cloudflare’s vast network of data centers, without worrying about platform scalability.


Our customers use multiple providers and models and are always looking to optimize the way they do inference. And, of course, in order to evaluate their prompts, performance, cost, and to troubleshoot what’s going on, AI Gateway’s customers need to store requests and responses. New requests show up within 15 seconds and customers can check a request’s cost, duration, number of tokens, and provide their feedback (thumbs up or down).


This scales in a way where an account can have multiple gateways and each gateway has its own settings. In our first implementation, a backend worker was responsible for storing Real Time Logs and other background tasks. However, in the rapidly evolving domain of artificial intelligence, where real-time data is as precious as the insights it provides, managing log data efficiently becomes paramount. We recognized that to truly empower our users, we needed to offer a solution where logs weren’t just transient records but could be stored permanently. Permanent log storage means developers can now track the performance, security, and operational insights of their AI applications over time, enabling not only immediate troubleshooting but also longitudinal studies of AI behavior, usage trends, and system health.


The diagram above describes our old architecture, which could only store 30 minutes of data.

Tracing the path of a request through the AI Gateway, as depicted in the sequence above:

  1. A developer sends a new inference request, which is first received by our Gateway Worker.

  2. The Gateway Worker then performs several checks: it looks for cached results, enforces rate limits, and verifies any other configurations set by the user for their gateway. Provided all conditions are met, it forwards the request to the selected inference provider (in this diagram, OpenAI).

  3. The inference provider processes the request and sends back the response.

  4. Simultaneously, as the response is relayed back to the developer, the request and response details are also dispatched to our Backend Worker. This worker’s role is to manage and store the log of this transaction.

The challenge: Store two billion logs

First step: real-time logs

Initially, the AI Gateway project stored both request metadata and the actual request bodies in a D1 database. This approach facilitated rapid development in the project’s infancy. However, as customer engagement grew, the D1 database began to fill at an accelerating rate, eventually retaining logs for only 30 minutes at a time.

To mitigate this, we first optimized the database schema, which extended the log retention to one hour. However, we soon encountered diminishing returns due to the sheer volume of byte data from the request bodies. Post-launch, it became clear that a more scalable solution was necessary. We decided to migrate the request bodies to R2 storage, significantly alleviating the data load on D1. This adjustment allowed us to incrementally extend log retention to 24 hours.

Consequently, D1 functioned primarily as a log index, enabling users to search and filter logs efficiently. When users needed to view details or download a log, these actions were seamlessly proxied through to R2.

This dual-system approach provided us with the breathing room to contemplate and develop more sophisticated storage solutions for the future.

Second step: persistent logs and Durable Object transactional storage

As our traffic surged, we encountered a growing number of requests from customers wanting to access and compare older logs.

Upon learning that the Durable Objects team was seeking beta testers for their new Durable Objects with SQLite, we eagerly signed up.

Originally, we considered Durable Objects as the ideal solution for expanding our log storage capacity, which required us to shard the logs by a unique string. Initially, this string was the account ID, but during a mid-development load test, we hit a cap at 10 million logs per Durable Object. This limitation meant that each account could only support up to this number of logs.

Given our commitment to the DO migration, we saw an opportunity rather than a constraint. To overcome the 10 million log limit per account, we refined our approach to shard by both account ID and gateway name. This adjustment effectively raised the storage ceiling from 10 million logs per account to 10 million per gateway. With the default setting allowing each account up to 10 gateways, the potential storage for each account skyrocketed to 100 million logs.

This strategic pivot not only enabled us to store a significantly larger number of logs. But also enhanced our flexibility in gateway management. Now, when a gateway is deleted, we can simply remove the corresponding Durable Object.

Additionally, this sharding method isolates high-volume request scenarios. If one customer’s heavy usage slows down log insertion, it only impacts their specific Durable Object, thereby preserving performance for other customers.


Taking a glance at the revised architecture diagram, we replaced the Backend Worker with our newly integrated Durable Object. The rest of the request flow remains unchanged, including the concurrent response to the user and the interaction with the Durable Object, which occurs in the fourth step.

Leveraging Cloudflare’s network, our Gateway Worker operates near the user’s location, which in turn positions the user’s Durable Object close by. This proximity significantly enhances the speed of log insertion and query operations.

Third step: managing thousands of Durable Objects

As the number of users and requests on AI Gateway grows, managing each unique Durable Object (DO) becomes increasingly complex. New customers join continuously, and we needed an efficient method to track each DO, ensure users stay within their 10 gateway limit, and manage the storage capacity for free users.

To address these challenges, we introduced another layer of control with a new Durable Object we’ve named the Account Manager. The primary function of the Account Manager is straightforward yet crucial: it keeps user activities in check.

Here’s how it works: before any Gateway commits a new log to permanent storage, it consults the Account Manager. This check determines whether the gateway is allowed to insert the log based on the user’s current usage and entitlements. The Account Manager uses its own SQLite database to verify the total number of rows a user has and their service level. If all checks pass, it signals the Gateway that the log can be inserted. It was paramount to guarantee that this entire validation process occurred in the background, ensuring that the user experience remains seamless and uninterrupted.

The Account Manager stays updated by periodically receiving data from each Gateway’s Durable Object. Specifically, after every 1000 inference requests, the Gateway sends an update on its total rows to the Account Manager, which then updates its local records. This system ensures that the Account Manager has the most current data when making its decisions.

Additionally, the Account Manager is responsible for monitoring customer entitlements. It tracks whether an account is on a free or paid plan, how many gateways a user is permitted to create, and the log storage capacity allocated to each gateway. 

Through these mechanisms, the Account Manager not only helps in maintaining system integrity but also ensures fair usage across all users of AI Gateway.

AI evaluations and Durable Objects sharding

As we continue to develop evaluations to fully automatic and, in the future, use Large Language Models (LLMs),  we are now taking the first step towards this goal and launching the open beta phase of comprehensive AI evaluations, centered on Human-in-the-Loop feedback.

This feature empowers users to create bespoke datasets from their application logs, thereby enabling them to score and evaluate the performance, speed, and cost-effectiveness of their models, with a primary focus on LLMs and automated scoring, analyzing the performance of LLMs, providing developers with objective, data-driven insights to refine their models.

To do this, developers require a reliable logging mechanism that persists logs from multiple gateways, storing up to 100 million logs in total (10 million logs per gateway, across 10 gateways). This represents a significant volume of data, as each request made through the AI Gateway generates a log entry, with some log entries potentially exceeding 50 MB in size.

This necessity leads us to work on the expansion of log storage capabilities. Since log storage is limited to 10 million logs per gateway, in future iterations, we aim to scale this capacity by implementing sharded Durable Objects (DO), allowing multiple Durable Objects per gateway to handle and store logs. This scaling strategy will enable us to store significantly larger volumes of logs, providing richer data for evaluations (using LLMs as a judge or from user input), all through AI Gateway.


Coming Soon

We are working on improving our existing Universal Endpoint, the next step on an enhanced solution that builds on existing fallback mechanisms to offer greater resilience, flexibility, and intelligence in request management.

Currently, when a provider encounters an error or is unavailable, our system falls back to an alternative provider to ensure continuity. The improved Universal Endpoint takes this a step further by introducing automatic retry capabilities, allowing failed requests to be reattempted before fallback is triggered. This significantly improves reliability by handling transient errors and increasing the likelihood of successful request fulfillment. It will look something like this:

curl --location 'https://aig.example.com/' \
--header 'CF-AIG-TOKEN: Bearer XXXX' \
--header 'Content-Type: application/json' \
--data-raw '[
    {
        "id": "0001",
        "provider": "openai",
        "endpoint": "chat/completions",
        "headers": {
            "Authorization": "Bearer XXXX",
            "Content-Type": "application/json"
        },
        "query": {
            "model": "gpt-3.5-turbo",
            "messages": [
                {
                    "role": "user",
                    "content": "generate a prompt to create cloudflare random images"
                }
            ]
        },
        "option": {
            "retry": 2,
            "delay": 200,
            "onComplete": {
                "provider": "workers-ai",
                "endpoint": "@cf/stabilityai/stable-diffusion-xl-base-1.0",
                "headers": {
                    "Authorization": "Bearer A5UFQkHewHF1-sA3hTVQFaPxRuu5wmS0eJcCS_MC",
                    "Content-Type": "application/json"
                },
                "query": {
                    "messages": [
                        {
                            "role": "user",
                            "content": "<prompt-response id='\''0001'\'' />"
                        }
                    ]
                }
            }
        }
    },
    {
        "provider": "workers-ai",
        "endpoint": "@cf/stabilityai/stable-diffusion-xl-base-1.0",
        "headers": {
            "Authorization": "Bearer XXXXXX",
            "Content-Type": "application/json"
        },
        "query": {
            "messages": [
                {
                    "role": "user",
                    "content": "create a image of a missing cat"
                }
            ]
        }
    }
]'

The request to the improved Universal Endpoint system demonstrates how it handles multiple providers with integrated retry mechanisms and fallback logic. In this example, the first request is sent to a provider like OpenAI, asking it to generate a text-to-image prompt. The “retry” option ensures that transient issues don’t result in immediate failure.

The system’s ability to seamlessly switch between providers while applying retry strategies ensures higher reliability and robustness in managing requests. By leveraging fallback logic, the Improved Universal Endpoint can dynamically adapt to provider failures, ensuring that tasks are completed successfully even in complex, multi-step workflows.

In addition to retry logic, we will have the ability to inspect requests and responses and make dynamic decisions based on the content of the result. This enables developers to create conditional workflows where the system can adapt its behavior depending on the nature of the response, creating a highly flexible and intelligent decision-making process.

If you haven’t yet used AI Gateway, check out our developer documentation on how to get started. If you have any questions, reach out on our Discord channel.

Builder Day 2024: 18 big updates to the Workers platform

Post Syndicated from Tanushree Sharma original https://blog.cloudflare.com/builder-day-2024-announcements

To celebrate Builder Day 2024, we’re shipping 18 updates inspired by direct feedback from developers building on Cloudflare. Choosing a platform isn’t just about current technologies and services — it’s about betting on a partner that will evolve with your needs as your project grows and the tech landscape shifts. We’re in it for the long haul with you.

Starting today, you can:

We’ve brought key features from Pages to Workers, allowing you to: 

Four things are going GA and are officially production-ready:

  • Gradual Deployments: Deploy changes to your Worker gradually, on a percentage basis of traffic

  • Cloudflare Queues: Now with much higher throughput and concurrency limits

  • R2 Event Notifications: Tightly integrated with Queues for event-driven applications

  • Vectorize: Globally distributed vector database, now faster, with larger indexes, and new pricing

The Workers platform is getting faster:

And we’re lowering the cost of building on Cloudflare:

Everything in this post is available for you to use today. Keep reading to learn more, and watch the Builder Day Live Stream for demos and more.

Persistent Logs for every Worker

Starting today in open beta, you can automatically retain logs from your Worker, with full search, query, and filtering capabilities available directly within the Cloudflare dashboard. All newly created Workers will have this setting automatically enabled. This marks the first step in the development of our observability platform, following Cloudflare’s acquisition of Baselime.

Getting started is easy – just add two lines to your Worker’s wrangler.toml and redeploy:

[observability]
enabled = true

Workers Logs allow you to view all logs emitted from your Worker. When enabled, each console.log message, error, and exception is published as a separate event. Every Worker invocation (i.e. requests, alarms, rpc, etc.) also publishes an enriched execution log that contains invocation metadata. You can view logs in the Logs tab of your Worker in the dashboard, where you can filter on any event field, such as time, error code, message, or your own custom field.


If you’ve ever had to piece together the puzzle of unusual metrics, such as a spike in errors or latency, you know how frustrating it is to connect metrics to traces and logs that often live in independent data silos. Workers Logs is the first piece of a new observability platform we are building that helps you easily correlate telemetry data, and surfaces insights to help you understand. We’ll structure your telemetry data so you have the full context to ask the right questions, and can quickly and easily analyze the behavior of your applications. This is just the beginning for observability tools for Workers. We are already working on automatically emitting distributed traces from Workers, with real time errors and wide, high dimensionality events coming soon as well. 


Starting November 1, 2024, Workers Logs will cost $0.60 per million log lines written after the included volume, as shown in the table below. Querying your logs is free. This makes it easy to estimate and forecast your costs — we think you shouldn’t have to calculate the number of ‘Gigabytes Ingested’ to understand what you’ll pay.

Workers Free Workers Paid
Included Volume 200,000 logs per day 20,000,000 logs per month
Additional Events N/A $0.60 per million logs
Retention 3 days 7 days

Try out Workers Logs today. You can learn more from our developer documentation, and give us feedback directly in the #workers-observability channel on Discord.

Connect to private databases from Workers

Starting today, you can now use Hyperdrive, Cloudflare Tunnels and Access together to securely connect to databases that are isolated in a private network. 

Hyperdrive enables you to build on Workers with your existing regional databases. It accelerates database queries using Cloudflare’s network, caching data close to end users and pooling connections close to the database. But there’s been a major blocker preventing you from building with Hyperdrive: network isolation.

The majority of databases today aren’t publicly accessible on the Internet. Data is highly sensitive and placing databases within private networks like a virtual private cloud (VPC) keeps data secure. But to date, that has also meant that your data is held captive within your cloud provider, preventing you from building on Workers. 

Today, we’re enabling Hyperdrive to securely connect to private databases using Cloudflare Tunnels and Cloudflare Access. With a Cloudflare Tunnel running in your private network, Hyperdrive can securely connect to your database and start speeding up your queries.


With this update, Hyperdrive makes it possible for you to build full-stack applications on Workers with your existing databases, network-isolated or not. Whether you’re using Amazon RDS, Amazon Aurora, Google Cloud SQL, Azure Database, or any other provider, Hyperdrive can connect to your databases and optimize your database connections to provide the fast performance you’ve come to expect with building on Workers.

Improved Node.js compatibility is now GA

Earlier this month, we overhauled our support for Node.js APIs in the Workers runtime. With twice as many Node APIs now supported on Workers, you can now use a wider set of NPM packages to build a broader range of applications. Today, we’re happy to announce that improved Node.js compatibility is GA.

To give it a try, enable the nodejs_compat compatibility flag, and set your compatibility date to on or after 2024-09-23:

compatibility_flags = ["nodejs_compat"]
compatibility_date = "2024-09-23"

Read the developer documentation to learn more about how to opt-in your Workers to try it today. If you encounter any bugs or want to report feedback, open an issue.

Build frontend applications on Workers with Static Asset Hosting

Starting today in open beta, you now can upload and serve HTML, CSS, and client-side JavaScript directly as part of your Worker. This means you can build dynamic, server-side rendered applications on Workers using popular frameworks such as Astro, Remix, Next.js and Svelte (full list here), with more coming soon.

You can now deploy applications to Workers that previously could only be deployed to Cloudflare Pages and use features that are not yet supported in Pages, including Logpush, Hyperdrive, Cron Triggers, Queue Consumers, and Gradual Deployments

To get started, create a new project with create-cloudflare. For example, to create a new Astro project:  

npm create cloudflare@latest -- my-astro-app --framework=astro --experimental

Visit our developer documentation to learn more about setting up a new front-end application on Workers and watch a quick demo to learn about how you can deploy an existing application to Workers. Static assets aren’t just for Workers written in JavaScript! You can serve static assets from Workers written in Python or even deploy a Leptos app using workers-rs.

If you’re wondering “What about Pages?” — rest assured, Pages will remain fully supported. We’ve heard from developers that as we’ve added new features to Workers and Pages, the choice of which product to use has become challenging. We’re closing this gap by bringing asset hosting, CI/CD and Preview URLs to Workers this Birthday Week.

To make the upfront choice Cloudflare Workers and Pages more transparent, we’ve created a compatibility matrix. Looking ahead, we plan to bridge the remaining gaps between Workers and Pages and provide ways to migrate your Pages projects to Workers.

Cloudflare joins OpenNext to deploy Next.js apps to Workers

Starting today, as an early developer preview, you can use OpenNext to deploy Next.js apps to Cloudflare Workers via @opennextjs/cloudflare, a new npm package that lets you use the Node.js “runtime” in Next.js on Workers.

This new adapter is powered by our new Node.js compatibility layer, newly introduced Static Assets for Workers, and Workers KV, which is now up to 3x faster. It unlocks support for Incremental Static Regeneration (ISR), custom error pages, and other Next.js features that our previous adapter, @cloudflare/next-on-pages, could not support, as it was only compatible with the Edge “runtime” in Next.js.

Cloud providers shouldn’t lock you in. Like cloud compute and storage, open source frameworks should be portable — you should be able to deploy them to different cloud providers. The goal of the OpenNext project is to make sure you can deploy Next.js apps to any cloud platform, originally to AWS, and now Cloudflare. We’re excited to contribute to the OpenNext community, and give developers the freedom to run on the cloud that fits their applications needs (and budget) best.

To get started by reading the OpenNext docs, which provide examples and a guide on how to add @opennextjs/cloudflare to your Next.js app.

We want your feedback! Report issues and contribute code at opennextjs/opennextjs-cloudflare on GitHub, and join the discussion on the OpenNext Discord.

npm create cloudflare@latest -- my-next-app --framework=next --experimental

We want your feedback! Report issues and contribute code at opennextjs/opennextjs-cloudflare on GitHub, and join the discussion on the OpenNext Discord.

Continuous Integration & Delivery (CI/CD) with Workers Builds

Now in open beta, you can connect a GitHub or GitLab repository to a Worker, and Cloudflare will automatically build and deploy your changes each time you push a commit. Workers Builds provides an integrated CI/CD workflow you can use to build and deploy everything from full-stack applications built with the most popular frameworks to simple static websites. Just add your build command and let Workers Builds take care of the rest. 


While in open beta, Workers Builds is free to use, with a limit of one concurrent build per account, and unlimited build minutes per month. Once Workers Builds is Generally Available in early 2025, you will be billed based on the number of build minutes you use each month, and have a higher number of concurrent builds.

Workers Free Workers Paid
Build minutes, open beta Unlimited Unlimited
Concurrent builds, open beta 1 1
Build minutes, general availability 3,000 minutes included per month 6,000 minutes included per month
+$0.005 per additional build minute
Concurrent builds, general availability 1 6

Read the docs to learn more about how to deploy your first project with Workers Builds.

Workers preview URLs

Each newly uploaded version of a Worker now automatically generates a preview URL. Preview URLs make it easier for you to collaborate with your team during development, and can be used to test and identify issues in a preview environment before they are deployed to production.

When you upload a version of your Worker via the Wrangler CLI, Wrangler will display the preview URL once your upload succeeds. You can also find preview URLs for each version of your Worker in the Cloudflare dashboard:


Preview URLs for Workers are similar to Pages preview deployments — they run on your Worker’s workers.dev subdomain and allow you to view changes applied on a new version of your application before the changes are deployed.

Learn more about preview URLs by visiting our developer documentation

Safely release to production with Gradual Deployments

At Developer Week, we launched Gradual Deployments for Workers and Durable Objects to make it safer and easier to deploy changes to your applications. Gradual Deployments is now GA — we have been using it ourselves at Cloudflare for mission-critical services built on Workers since early 2024.


Gradual deployments can help you stay on top of availability SLAs and minimize application downtime by surfacing issues early. Internally at Cloudflare, every single service built on Workers uses gradual deployments to roll out new changes. Each new version gets released in stages —– 0.05%, 0.5%, 3%, 10%, 25%, 50%, 75% and 100% with time to soak between each stage. Throughout the roll-out, we keep an eye on metrics (which are often instrumented with Workers Analytics Engine!) and we roll back if we encounter issues. 

Using gradual deployments is as simple as swapping out the wrangler commands, API endpoints, and/or using “Save version” in the code editor that is built into the Workers dashboard. Read the developer documentation to learn more and get started. 

Queues is GA, with higher throughput and concurrency limits

Cloudflare Queues is now generally available with higher limits. 

Queues let a developer decouple their Workers into event driven services. Producer Workers write events to a Queue, and consumer Workers are invoked to take actions on the events. For example, you can use a Queue to decouple an e-commerce website from a service which sends purchase confirmation emails to users.


Throughput and concurrency limits for Queues are now significantly higher, which means you can push more messages through a Queue, and consume them faster.

  • Throughput: Each queue can now process 5000 messages per second (previously 400 per second).

  • Concurrency: Each queue can now have up to 250 concurrent consumers (previously 20 concurrent consumers). 

Since we announced Queues in beta, we’ve added the following functionality:

Queues can be used by any developer on a Workers Paid plan. Head over to our getting started guide to start building with Queues.

Event notifications for R2 is now GA

We’re excited to announce that event notifications for R2 is now generally available. Whether it’s kicking off image processing after a user uploads a file or triggering a sync to an external data warehouse when new analytics data is generated, many applications need to be able to reliably respond when events happen. Event notifications for Cloudflare R2 give you the ability to build event-driven applications and workflows that react to changes in your data.


Here’s how it works: When data in your R2 bucket changes, event notifications are sent to your queue. You can consume these notifications with a consumer Worker or pull them over HTTP from outside of Cloudflare Workers.


Since we introduced event notifications in open beta earlier this year, we’ve made significant improvements based on your feedback:

  • We increased reliability of event notifications with throughput improvements from Queues. R2 event notifications can now scale to thousands of writes per second.

  • You can now configure event notifications directly from the Cloudflare dashboard (in addition to Wrangler).

  • There is now support for receiving notifications triggered by object lifecycle deletes.

  • You can now set up multiple notification rules for a single queue on a bucket.

Visit our documentation to learn about how to set up event notifications for your R2 buckets.

Removing the serverless microservices tax: No more request fees for Service Bindings and Tail Workers

Earlier this year, we quietly changed Workers pricing to lower your costs. As of July 2024, you are no longer charged for requests between Workers on your account made via Service Bindings, or for invocations of Tail Workers. For example, let’s say you have the following chain of Workers:


Each request from a client results in three Workers invocations. Previously, we charged you for each of these invocations, plus the CPU time for each of these Workers. With this change, we only charge you for the first request from the client, plus the CPU time used by each Worker.

This eliminates the additional cost of breaking a monolithic serverless app into microservices. In 2023, we introduced new pricing based on CPU time, rather than duration, so you don’t have to worry about being billed for time spent waiting on I/O. This includes I/O to other Workers. With this change, you’re only billed for the first request in the chain, eliminating the other additional cost of using multiple Workers.

When you build microservices on Workers, you face fewer trade offs than on other compute platforms. Service bindings have zero network overhead by default, a built-in JavaScript RPC system, and a security model with fewer footguns and simpler configuration. We’re excited to improve this further with this pricing change.

Image optimization is available to everyone for free — no subscription needed

Starting today, you can use Cloudflare Images for free to optimize your images with up to 5,000 transformations per month.

Large, oversized images can throttle your application speed and page load times. We built Cloudflare Images to let you dynamically optimize images in the correct dimensions and formats for each use case, all while storing only the original image.

In the spirit of Birthday Week, we’re making image optimization available to everyone with a Cloudflare account, no subscription needed. You’ll be able to use Images to transform images that are stored outside of Images, such as in R2.


Transformations are served from your zone through a specially formatted URL with parameters that specify how an image should be optimized. For example, the transformation URL below uses the format parameter to automatically serve the image in the most optimal format for the requesting browser:

https://example.com/cdn-cgi/image/format=auto/thumbnail.png

This means that the original PNG image may be served as AVIF to one user and WebP to another. Without a subscription, transforming images from remote sources is free up to 5,000 unique transformations per month. Once you exceed this limit, any already cached transformations will continue to be served, but you’ll need a paid Images plan to request new transformations or to purchase storage within Images.

To get started, navigate to Images in the dashboard to enable transformations on your zone.

Dive deep into more announcements from Builder Day

We shipped so much that we couldn’t possibly fit it all in one blog post. These posts dive into the technical details of what we’re announcing at Builder Day:

Build the next big thing on Cloudflare

Cloudflare is for builders, and everything we’re announcing at Builder Day, you can start building with right away. We’re now offering $250,000 in credits to use on our Developer Platform to qualified startups, so that you can get going even faster, and become the next company to reach hypergrowth scale with a small team, and not waste time provisioning infrastructure and doing undifferentiated heavy lifting. Focus on shipping, and we’ll take care of the rest.

Apply to the startup program here, or stop by and say hello in the Cloudflare Developers Discord.

Developer Week 2024 wrap-up

Post Syndicated from Phillip Jones original https://blog.cloudflare.com/developer-week-2024-wrap-up


Developer Week 2024 has officially come to a close. Each day last week, we shipped new products and functionality geared towards giving developers the components they need to build full-stack applications on Cloudflare.

Even though Developer Week is now over, we are continuing to innovate with the over two million developers who build on our platform. Building a platform is only as exciting as seeing what developers build on it. Before we dive into a recap of the announcements, to send off the week, we wanted to share how a couple of companies are using Cloudflare to power their applications:

We have been using Workers for image delivery using R2 and have been able to maintain stable operations for a year after implementation. The speed of deployment and the flexibility of detailed configurations have greatly reduced the time and effort required for traditional server management. In particular, we have seen a noticeable cost savings and are deeply appreciative of the support we have received from Cloudflare Workers.
FAN Communications

Milkshake helps creators, influencers, and business owners create engaging web pages directly from their phone, to simply and creatively promote their projects and passions. Cloudflare has helped us migrate data quickly and affordably with R2. We use Workers as a routing layer between our users’ websites and their images and assets, and to build a personalized analytics offering affordably. Cloudflare’s innovations have consistently allowed us to run infrastructure at a fraction of the cost of other developer platforms and we have been eagerly awaiting updates to D1 and Queues to sustainably scale Milkshake as the product continues to grow.
Milkshake

In case you missed anything, here’s a quick recap of the announcements and in-depth technical explorations that went out last week:

Summary of announcements

Monday

Announcement Summary
Making state easy with D1 GA, Hyperdrive, Queues and Workers Analytics Engine updates A core part of any full-stack application is storing and persisting data! We kicked off the week with announcements that help developers build stateful applications on top of Cloudflare, including making D1, Cloudflare’s SQL database and Hyperdrive, our database accelerating service, generally available.
Building D1: a Global Database D1, Cloudflare’s SQL database, is now generally available. With new support for 10GB databases, data export, and enhanced query debugging, we empower developers to build production-ready applications with D1 to meet all their relational SQL needs. To support Workers in global applications, we’re sharing a sneak peek of our design and API for D1 global read replication to demonstrate how developers scale their workloads with D1.
Why Workers environment variables contain live objects Bindings don’t just reduce boilerplate. They are a core design feature of the Workers platform which simultaneously improve developer experience and application security in several ways. Usually these two goals are in opposition to each other, but bindings elegantly solve for both at the same time.

Tuesday

Announcement Summary
Leveling up Workers AI: General Availability and more new capabilities We made a series of AI-related announcements, including Workers AI, Cloudflare’s inference platform becoming GA, support for fine-tuned models with LoRAs, one-click deploys from HuggingFace, Python support for Cloudflare Workers, and more.
Running fine-tuned models on Workers AI with LoRAs Workers AI now supports fine-tuned models using LoRAs. But what is a LoRA and how does it work? In this post, we dive into fine-tuning, LoRAs and even some math to share the details of how it all works under the hood.
Bringing Python to Workers using Pyodide and WebAssembly We introduced Python support for Cloudflare Workers, now in open beta. We’ve revamped our systems to support Python, from the Workers runtime itself to the way Workers are deployed to Cloudflare’s network. Learn about a Python Worker’s lifecycle, Pyodide, dynamic linking, and memory snapshots in this post.

Wednesday

Announcement Summary
R2 adds event notifications, support for migrations from Google Cloud Storage, and an infrequent access storage tier We announced three new features for Cloudflare R2: event notifications, support for migrations from Google Cloud Storage, and an infrequent access storage tier.
Data Anywhere with Pipelines, Event Notifications, and Workflows We’re making it easier to build scalable, reliable, data-driven applications on top of our global network, and so we announced a new Event Notifications framework; our take on durable execution, Workflows; and an upcoming streaming ingestion service, Pipelines.
Improving Cloudflare Workers and D1 developer experience with Prisma ORM Together, Cloudflare and Prisma make it easier than ever to deploy globally available apps with a focus on developer experience. To further that goal, Prisma ORM now natively supports Cloudflare Workers and D1 in Preview. With version 5.12.0 of Prisma ORM you can now interact with your data stored in D1 from your Cloudflare Workers with the convenience of the Prisma Client API. Learn more and try it out now.
How Picsart leverages Cloudflare’s Developer Platform to build globally performant services Picsart, one of the world’s largest digital creation platforms, encountered performance challenges in catering to its global audience. Adopting Cloudflare’s global-by-default Developer Platform emerged as the optimal solution, empowering Picsart to enhance performance and scalability substantially.

Thursday

Announcement Summary
Announcing Pages support for monorepos, wrangler.toml, database integrations and more! We launched four improvements to Pages that bring functionality previously restricted to Workers, with the goal of unifying the development experience between the two. Support for monorepos, wrangler.toml, new additions to Next.js support and database integrations!
New tools for production safety — Gradual Deployments, Stack Traces, Rate Limiting, and API SDKs Production readiness isn’t just about scale and reliability of the services you build with. We announced five updates that put more power in your hands – Gradual Deployments, Source mapped stack traces in Tail Workers, a new Rate Limiting API, brand-new API SDKs, and updates to Durable Objects – each built with mission-critical production services in mind.
What’s new with Cloudflare Media: updates for Calls, Stream, and Images With Cloudflare Calls in open beta, you can build real-time, serverless video and audio applications. Cloudflare Stream lets your viewers instantly clip from ongoing streams. Finally, Cloudflare Images now supports automatic face cropping and has an upload widget that lets you easily integrate into your application.
Cloudflare Calls: millions of cascading trees all the way down Cloudflare Calls is a serverless SFU and TURN service running at Cloudflare’s edge. It’s now in open beta and costs $0.05/ real-time GB. It’s 100% anycast WebRTC.

Friday

Announcement Summary
Browser Rendering API GA, rolling out Cloudflare Snippets, SWR, and bringing Workers for Platforms to all users Browser Rendering API is now available to all paid Workers customers with improved session management.
Cloudflare acquires Baselime to expand serverless application observability capabilities We announced that Cloudflare has acquired Baselime, a serverless observability company.
Cloudflare acquires PartyKit to allow developers to build real-time multi-user applications We announced that PartyKit, a trailblazer in enabling developers to craft ambitious real-time, collaborative, multiplayer applications, is now a part of Cloudflare. This acquisition marks a significant milestone in our journey to redefine the boundaries of serverless computing, making it more dynamic, interactive, and, importantly, stateful.
Blazing fast development with full-stack frameworks and Cloudflare Full-stack web development with Cloudflare is now faster and easier! You can now use your framework’s development server while accessing D1 databases, R2 object stores, AI models, and more. Iterate locally in milliseconds to build sophisticated web apps that run on Cloudflare. Let’s dev together!
We’ve added JavaScript-native RPC to Cloudflare Workers Cloudflare Workers now features a built-in RPC (Remote Procedure Call) system for use in Worker-to-Worker and Worker-to-Durable Object communication, with absolutely minimal boilerplate. We’ve designed an RPC system so expressive that calling a remote service can feel like using a library.
Community Update: empowering startups building on Cloudflare and creating an inclusive community We closed out Developer Week by sharing updates on our Workers Launchpad program, our latest Developer Challenge, and the work we’re doing to ensure our community spaces – like our Discord and Community forums – are safe and inclusive for all developers.

Continue the conversation

Thank you for being a part of Developer Week! Want to continue the conversation and share what you’re building? Join us on Discord. To get started building on Workers, check out our developer documentation.

Data Anywhere with Pipelines, Event Notifications, and Workflows

Post Syndicated from Matt Silverlock original https://blog.cloudflare.com/data-anywhere-events-pipelines-durable-execution-workflows


Data is fundamental to any real-world application: the database storing your user data and inventory, the analytics tracking sales events and/or error rates, the object storage with your web assets and/or the Parquet files driving your data science team, and the vector database enabling semantic search or AI-powered recommendations for your users.

When we first announced Workers back in 2017, and then Workers KV, Cloudflare R2, and D1, it was obvious that the next big challenge to solve for developers would be in making it easier to ingest, store, and query the data needed to build scalable, full-stack applications.

To that end, as part of our quest to make building stateful, distributed-by-default applications even easier, we’re launching our new Event Notifications service; a preview of our upcoming streaming ingestion product, Pipelines; and a sneak peek into our take on durable execution, Workflows.

Event-based architectures

When you’re writing data — whether that’s new data, changing existing data, or deleting old data — you often want to trigger other, asynchronous work to run in response. That could be processing user-driven uploads, updating search indexes as the underlying data changes, or removing associated rows in your SQL database when content is removed.

In order to make these event-driven workflows far easier to build across Cloudflare, we’re launching the first step towards a wider Event Notifications platform across Cloudflare, starting with notifications support in R2.

You can read more in the deep-dive on Event Notifications for R2, but in a nutshell: you can configure changes to content in any R2 bucket to write directly to a Queue, allowing you to reliably consume those events in a Worker or to pull from compute in a legacy cloud.

Event Notifications for R2 are just the beginning, though. There are many kinds of events you might want to trigger as a developer — these are just some of the event types we’re planning to support:

  • Changes (writes) to key-value pairs in your Workers KV namespaces.
  • Updates to your D1 databases, including changed rows or triggers.
  • Deployments to your Cloudflare Workers

Consuming event notifications from a single Worker is just one approach, though. As you start to consume events, you may want to trigger multi-step workflows that execute reliably, resume from errors or exceptions, and ensure that previous steps aren’t duplicated or repeated unnecessarily. An event notification framework turns out to be just the thing needed to drive a workflow engine that executes durably

Making it even easier to ingest data

When we launched Cloudflare R2, our object storage service, we knew that supporting the de facto-standard S3 API was critical in order to allow developers to bring the tooling and services they already had over to R2. But the S3 API is designed to be simple: at its core, it provides APIs for upload, download, multipart and metadata operations, and many tools don’t support the S3 API.

What if you want to batch clickstream data from your web services so that it’s efficient (and cost-effective) to query by your analytics team? Or partition data by customer ID, merchant ID, or locale within a structured data format like JSON?

Well, we want to help solve this problem too, and so we’re announcing Pipelines, an upcoming streaming ingestion service designed to ingest data at scale, aggregate it, and write it directly to R2, without you having to manage infrastructure, partitions, runners, or worry about durability.

With Pipelines, creating a globally scalable ingestion endpoint that can ingest tens-of-thousands of events per second doesn’t require any code:

$ wrangler pipelines create clickstream-ingest-prod --batch-size="1MB" --batch-timeout-secs=120 --batch-on-json-key=".merchantId" --destination-bucket="prod-cs-data"

✅ Successfully created new pipeline "clickstream-ingest-prod"
📥 Created endpoints:
➡ HTTPS: https://d458dbe698b8eef41837f941d73bc5b3.pipelines.cloudflarestorage.com/clickstream-ingest-prod
➡ WebSocket: wss://d458dbe698b8eef41837f941d73bc5b3.pipelines.cloudflarestorage.com:8443/clickstream-ingest-prod
➡ Kafka: d458dbe698b8eef41837f941d73bc5b3.pipelines.cloudflarestorage.com:9092 (topic: clickstream-ingest-prod)

As you can see here, we’re already thinking about how to make Pipelines protocol-agnostic: write from a HTTP client, stream events over a WebSocket, and/or redirect your existing Kafka producer (and stop having to manage and scale Kafka) directly to Pipelines.

But that’s just the beginning of our vision here. Scalable ingestion and simple batching is one thing, but what about if you have more complex needs? Well, we have a massively scalable compute platform (Cloudflare Workers) that can help address this too.

The code below is just an initial exploration for how we’re thinking about an API for running transforms over streaming data. If you’re aware of projects like Apache Beam or Flink, this programming model might even look familiar:

export default {    
   // Pipeline handler is invoked when batch criteria are met
   async pipeline(stream: StreamPipeline, env: Env, ctx: ExecutionContext): Promise<StreamingPipeline> {
      // ...
      return stream
         // Type: transform(label: string, transformFunc: TransformFunction): Promise<StreamPipeline>
         // Each transform has a label that is used in metrics to provide
    // per-transform observability and debugging
         .transform("human readable label", (events: Array<StreamEvent>) => {
            return events.map((e) => ...)
         })
         .transform("another transform", (events: Array<StreamEvent>) => {
            return events.map((e) => ...)
         })
         .writeToR2({
            format: "json",
            bucket: "MY_BUCKET_NAME",
            prefix: somePrefix,
            batchSize: "10MB"
         })
   }
}

Specifically:

  • The Worker describes a pipeline of transformations (mapping, reducing, filtering) that operates over each subset of events (records)
  • You can call out to other services — including D1 or KV — in order to synchronously or asynchronously hydrate data or lookup values during your stream processing
  • We take care of scaling horizontally based on records-per-second and/or any concurrency settings you configure based on processing latency requirements.

We’ll be bringing Pipelines into open beta later in 2024, and it will initially launch with support for HTTP ingestion and R2 as a destination (sink), but we’re already thinking bigger.

We’ll be sharing more as Pipelines gets closer to release. In the meantime, you can register your interest and share your use-case, and we’ll reach out when Pipelines reaches open beta.

Durable Execution

If the term “Durable Execution” is new to you, don’t worry: the term comes from the desire to run applications that can resume execution from where they left off, even if the underlying host or compute fails (where the “durable” part comes from).

As we’ve continued to build out our data and AI platforms, we’ve been acutely aware that developers need ways to create reliable, repeatable workflows that operate over that data, turn unstructured data into structured data, trigger on fresh data (or periodically), and automatically retry, restart, and export metrics for each step along the way. The industry calls this Durable Execution: we’re just calling it Workflows.

What makes Workflows different from other takes on Durable Execution is that we provide the underlying compute as part of the platform. You don’t have to bring-your-own compute, or worry about scaling it or provisioning it in the right locations. Workflows runs on top of Cloudflare Workers – you write the workflow, and we take care of the rest.

Here’s an early example of writing a Workflow that generates text embeddings using Workers AI and stores them (ready to query) in Vectorize as new content is written to (or updated within) R2.

  • Each Workflow run is triggered by an Event Notification consumed from a Queue, but could also be triggered by a HTTP request, another Worker, or even scheduled on a timer.
  • Individual steps within the Workflow allow us to define individually retriable units of work: in this case, we’re reading the new objects from R2, creating text embeddings using Workers AI, and then inserting.
  • State is durably persisted between steps: each step can emit state, and Workflows will automatically persist that so that any underlying failures, uncaught exceptions or network retries can resume execution from the last successful step.
  • Every call to step() automatically emits metrics associated with the unique Workflow run, making it easier to debug within each step and/or break down your application into its smallest units of execution, without having to worry about observability.

Step-by-step, it looks like this:

Transforming this series of steps into real code, here’s what this would look like with Workflows:

import { Ai } from "@cloudflare/ai";
import { Workflow } from "cloudflare:workers";

export interface Env {
  R2: R2Bucket;
  AI: any;
  VECTOR_INDEX: VectorizeIndex;
}

export default class extends Workflow {
  async run(event: Event) {
    const ai = new Ai(this.env.AI);

    // List of keys to fetch from our incoming event notification
    const keysToFetch = event.messages.map((val) => {
      return val.object.key;
    });

    // The return value of each step is stored (the "durable" part
    // of "durable execution")
    // This ensures that state can be persisted between steps, reducing
    // the need to recompute results ($$, time) should subsequent
    // steps fail.
    const inputs = await this.ctx.run(
      // Each step has a user-defined label
      // Metrics are emitted as each step runs (to success or failure)
// with this label attached and available within per-Workflow
// analytics in near-real-time.
"read objects from R2", async () => {
      const objects = [];

      for (const key of keysToFetch) {
        const object = await this.env.R2.get(key);
        objects.push(await object.text());
      }

      return objects;
    });


    // Persist the output of this step.
    const embeddings = await this.ctx.run(
      "generate embeddings",
      async () => {
        const { data } = await ai.run("@cf/baai/bge-small-en-v1.5", {
          text: inputs,
        });

        if (data.length) {
          return data;
        } else {
          // Uncaught exceptions trigger an automatic retry of the step
          // Retries and timeouts have sane defaults and can be overridden
    // per step
          throw new Error("Failed to generate embeddings");
        }
      },
      {
        retries: {
          limit: 5,
          delayMs: 1000,
          backoff: "exponential",
        },
      }
    );

    await this.ctx.run("insert vectors", async () => {
      const vectors = [];

      keysToFetch.forEach((key, index) => {
        vectors.push({
          id: crypto.randomUUID(),
          // Our embeddings from the previous step
          values: embeddings[index].values, 
          // The path to each R2 object to map back to during
 	    // vector search
          metadata: { r2Path: key },
        });
      });

      return this.env.VECTOR_INDEX.upsert();
    });
  }
}

This is just one example of what a Workflow can do. The ability to durably execute an application, modeled as a series of steps, applies to a wide number of domains. You can apply this model of execution to a number of use-cases, including:

  • Deploying software: each step can define a build step and subsequent health check, gating further progress until your deployment meets your criteria for “healthy”.
  • Post-processing user data: triggering a workflow based on user uploads (e.g. to Cloudflare R2) that then subsequently parses that data asynchronously, redacts PII or sensitive data, writes the sanitized output, and triggers a notification via email, webhook, or mobile push.
  • Payment and batch workflows: aggregating raw customer usage data on a periodic schedule by querying your data warehouse (or Workers Analytics Engine), triggering usage or spend alerts, and/or generating PDF invoices.

Each of these use cases model tasks that you want to run to completion, minimize redundant retries by persisting intermediate state, and (importantly) easily observe success and failure.

We’ll be sharing more about Workflows during the second quarter of 2024 as we work towards an open (public!) beta. This includes how we’re thinking about idempotency and interactions with our storage, per-instance observability and metrics, local development, and templates to bootstrap common workflows.

Putting it together

We’ve often thought of Cloudflare’s own network as one massively scalable parallel data processing cluster: data centers in 310+ cities, with the ability to run compute close to users and/or close to data, keep it within the bounds of regulatory or compliance requirements, and most importantly, use our massive scale to enable our customers to scale as well.

Recapping, a fully-fledged data platform needs to enable three things:

  1. Ingesting data: getting data into the platform (in the right format, from the right sources)
  2. Storing data: securely, reliably, and durably.
  3. Querying data: understanding and extracting insights from the data, and/or transforming it for use by other tools.

When we launched R2 we tackled the second part, but knew that we’d need to follow up with the first and third parts in order to make it easier for developers to get data in and make use of it.

If we look at how we can build a system that helps us solve each of these three parts together with Pipelines, Event Notifications, R2, and Workflows, we end up with an architecture that resembles this:

Specifically, we have Pipelines (1) scaling out to ingest data, batch it, filter it, and then durably store it in R2 (2) in a format that’s ready and optimized for querying. Workflows, ClickHouse, Databricks, or the query engine of your choice can then query (3) that data as soon as it’s ready — with “ready” being automatically triggered by an Event Notification as soon as the data is ingested and written to R2.

There’s no need to poll, no need to batch after the fact, no need to have your query engine slow down on data that wasn’t pre-aggregated or filtered, and no need to manage and scale infrastructure in order to keep up with load or data jurisdiction requirements. Create a Pipeline, write your data directly to R2, and query directly from it.

If you’re also looking at this and wondering about the costs of moving this data around, then we’re holding to one important principle: zero egress fees across all of our data products. Just as we set the stage for this with our R2 object storage, we intend to apply this to every data product we’re building, Pipelines included.

Start Building

We’ve shared a lot of what we’re building so that developers have an opportunity to provide feedback (including via our Developer Discord), share use-cases, and think about how to build their next application on Cloudflare.

R2 adds event notifications, support for migrations from Google Cloud Storage, and an infrequent access storage tier

Post Syndicated from Matt DeBoard original https://blog.cloudflare.com/r2-events-gcs-migration-infrequent-access


We’re excited to announce three new features for Cloudflare R2, our zero egress fee object storage platform:

Event Notifications Open Beta

The lifecycle of data often doesn’t stop immediately after upload to an R2 bucket – event data may need to be transformed and loaded into a data warehouse, media files may need to go through a post-processing step, etc. We’re releasing event notifications for R2 in open beta to enable building applications and workflows driven by your changing data.

Event notifications work by sending messages to your queue each time there is a change to your data. These messages are then received by a consumer Worker where you can then define any subsequent action that needs to be taken.

To get started enabling event notifications on your R2 bucket, you can run the following Wrangler command (replacing bucket_name and queue_name with your bucket and queue names respectively):

wrangler r2 bucket notification create <bucket_name> --event-type object-create --queue <queue_name>

For more information on how to set up event notifications on your R2 buckets today and limitations during beta, please refer to the documentation.

Super Slurper for Google Cloud Storage

Super Slurper can now migrate data from Google Cloud Storage (GCS) to Cloudflare R2. We released Super Slurper last year with the goal of making one-time comprehensive data migrations fast, reliable, and easy: there’s no need to spin up migration VMs and implement complicated retry logic. Since then, thousands of developers have used Super Slurper to migrate petabytes of data from AWS S3 to R2. Now Google Cloud Storage customers can migrate data to Cloudflare R2 to benefit from Cloudflare’s zero egress fees, whether you are permanently moving data to another provider or not.

To get started migrating data from GCS:

  1. From the Cloudflare dashboard, select R2 > Data Migration.
  2. Select Migrate files.
  3. Select Google Cloud Storage for the source bucket provider.
  4. Enter your bucket name and associated credentials and select Next.
  5. Enter your R2 bucket name and associated credentials and select Next.
  6. After you finish reviewing the details of your migration, select Migrate files.

You can view the status of your migration job at any time on the dashboard. For more information on how to use Super Slurper, please refer to the documentation here.

Infrequent Access Private Beta

We’re excited to introduce the private beta of our new Infrequent Access storage class. For use cases that involve data that isn’t frequently accessed (long tail user-generated content, logs, etc), Infrequent Access gives you the ability to pay less for storage while maintaining performance and durability.

Here’s an example of how you can upload an object to your R2 bucket with the new Infrequent Access storage class using Workers:

# wrangler.toml
[[r2_buckets]]
binding = 'MY_BUCKET'
bucket_name = '<YOUR_BUCKET_NAME>'

# index.ts
export default {
   async fetch(request: Request, env: Env): Promise<Response> {
      if (request.method === "PUT") {
         await env.MY_BUCKET.put("myobject", request.body, storageClass: "InfrequentAccess");
         return new Response("Put object successfully!");
      }
      return new Response("Not a PUT!");
   }
}

In addition to uploading objects directly to Infrequent Access, you can define an object lifecycle policy to move data to Infrequent Access after a period of time goes by and you no longer need to access your data as often. In the future, we plan to automatically optimize storage classes for data so you can avoid manually creating rules and better adapt to changing data access patterns.

For data stored in the Infrequent Access storage class, the pricing components will be similar to what you’re used to with R2: storage, Class A operations (writes, lists), Class B operations (reads), and data retrieval (processing). Data retrieval is charged per GB when data in the Infrequent Access storage class is retrieved and is what allows us to provide storage at a lower price. It reflects the additional computational resources required to fetch data from underlying storage optimized for less frequent access. And when the time comes, and you do need to use your data, there are still no egress fees.

Component Price
Storage $0.01 / GB-month
Class A Operations $9.00 / million requests
Class B Operations $0.90 / million requests
Data Retrieval (Processing) $0.01 / GB
Egress (or Data Transfer) $0 – No Charge

Are you interested in participating in the private beta for Infrequent Access?

Join the private beta waitlist to get access.

Have any feedback?

We would love to hear from you! To share your feedback about R2 and our data migration services, please join the Cloudflare Developer Discord. If you’re interested in learning more about R2, get started by visiting R2’s developer documentation or see how much you could save with our pricing calculator.

Log Explorer: monitor security events without third-party storage

Post Syndicated from Jen Sells original https://blog.cloudflare.com/log-explorer


Today, we are excited to announce beta availability of Log Explorer, which allows you to investigate your HTTP and Security Event logs directly from the Cloudflare Dashboard. Log Explorer is an extension of Security Analytics, giving you the ability to review related raw logs. You can analyze, investigate, and monitor for security attacks natively within the Cloudflare Dashboard, reducing time to resolution and overall cost of ownership by eliminating the need to forward logs to third party security analysis tools.

Background

Security Analytics enables you to analyze all of your HTTP traffic in one place, giving you the security lens you need to identify and act upon what matters most: potentially malicious traffic that has not been mitigated. Security Analytics includes built-in views such as top statistics and in-context quick filters on an intuitive page layout that enables rapid exploration and validation.

In order to power our rich analytics dashboards with fast query performance, we implemented data sampling using Adaptive Bit Rate (ABR) analytics. This is a great fit for providing high level aggregate views of the data. However, we received feedback from many Security Analytics power users that sometimes they need access to a more granular view of the data — they need logs.

Logs provide critical visibility into the operations of today’s computer systems. Engineers and SOC analysts rely on logs every day to troubleshoot issues, identify and investigate security incidents, and tune the performance, reliability, and security of their applications and infrastructure. Traditional metrics or monitoring solutions provide aggregated or statistical data that can be used to identify trends. Metrics are wonderful at identifying THAT an issue happened, but lack the detailed events to help engineers uncover WHY it happened. Engineers and SOC Analysts rely on raw log data to answer questions such as:

  • What is causing this increase in 403 errors?
  • What data was accessed by this IP address?
  • What was the user experience of this particular user’s session?

Traditionally, these engineers and analysts would stand up a collection of various monitoring tools in order to capture logs and get this visibility. With more organizations using multiple clouds, or a hybrid environment with both cloud and on-premise tools and architecture, it is crucial to have a unified platform to regain visibility into this increasingly complex environment.  As more and more companies are moving towards a cloud native architecture, we see Cloudflare’s connectivity cloud as an integral part of their performance and security strategy.

Log Explorer provides a lower cost option for storing and exploring log data within Cloudflare. Until today, we have offered the ability to export logs to expensive third party tools, and now with Log Explorer, you can quickly and easily explore your log data without leaving the Cloudflare Dashboard.

Log Explorer Features

Whether you’re a SOC Engineer investigating potential incidents, or a Compliance Officer with specific log retention requirements, Log Explorer has you covered. It stores your Cloudflare logs for an uncapped and customizable period of time, making them accessible natively within the Cloudflare Dashboard. The supported features include:

  • Searching through your HTTP Request or Security Event logs
  • Filtering based on any field and a number of standard operators
  • Switching between basic filter mode or SQL query interface
  • Selecting fields to display
  • Viewing log events in tabular format
  • Finding the HTTP request records associated with a Ray ID

Narrow in on unmitigated traffic

As a SOC analyst, your job is to monitor and respond to threats and incidents within your organization’s network. Using Security Analytics, and now with Log Explorer, you can identify anomalies and conduct a forensic investigation all in one place.

Let’s walk through an example to see this in action:

On the Security Analytics dashboard, you can see in the Insights panel that there is some traffic that has been tagged as a likely attack, but not mitigated.

Clicking the filter button narrows in on these requests for further investigation.

In the sampled logs view, you can see that most of these requests are coming from a common client IP address.

You can also see that Cloudflare has flagged all of these requests as bot traffic. With this information, you can craft a WAF rule to either block all traffic from this IP address, or block all traffic with a bot score lower than 10.

Let’s say that the Compliance Team would like to gather documentation on the scope and impact of this attack. We can dig further into the logs during this time period to see everything that this attacker attempted to access.

First, we can use Log Explorer to query HTTP requests from the suspect IP address during the time range of the spike seen in Security Analytics.

We can also review whether the attacker was able to exfiltrate data by adding the OriginResponseBytes field and updating the query to show requests with OriginResponseBytes > 0. The results show that no data was exfiltrated.

Find and investigate false positives

With access to the full logs via Log Explorer, you can now perform a search to find specific requests.

A 403 error occurs when a user’s request to a particular site is blocked. Cloudflare’s security products use things like IP reputation and WAF attack scores based on ML technologies in order to assess whether a given HTTP request is malicious. This is extremely effective, but sometimes requests are mistakenly flagged as malicious and blocked.

In these situations, we can now use Log Explorer to identify these requests and why they were blocked, and then adjust the relevant WAF rules accordingly.

Or, if you are interested in tracking down a specific request by Ray ID, an identifier given to every request that goes through Cloudflare, you can do that via Log Explorer with one query.

Note that the LIMIT clause is included in the query by default, but has no impact on RayID queries as RayID is unique and only one record would be returned when using the RayID filter field.

How we built Log Explorer

With Log Explorer, we have built a long-term, append-only log storage platform on top of Cloudflare R2. Log Explorer leverages the Delta Lake protocol, an open-source storage framework for building highly performant, ACID-compliant databases atop a cloud object store. In other words, Log Explorer combines a large and cost-effective storage system – Cloudflare R2 – with the benefits of strong consistency and high performance. Additionally, Log Explorer gives you a SQL interface to your Cloudflare logs.

Each Log Explorer dataset is stored on a per-customer level, just like Cloudflare D1, so that your data isn’t placed with that of other customers. In the future, this single-tenant storage model will give you the flexibility to create your own retention policies and decide in which regions you want to store your data.

Under the hood, the datasets for each customer are stored as Delta tables in R2 buckets. A Delta table is a storage format that organizes Apache Parquet objects into directories using Hive’s partitioning naming convention. Crucially, Delta tables pair these storage objects with an append-only, checkpointed transaction log. This design allows Log Explorer to support multiple writers with optimistic concurrency.

Many of the products Cloudflare builds are a direct result of the challenges our own team is looking to address. Log Explorer is a perfect example of this culture of dogfooding. Optimistic concurrent writes require atomic updates in the underlying object store, and as a result of our needs, R2 added a PutIfAbsent operation with strong consistency. Thanks, R2! The atomic operation sets Log Explorer apart from Delta Lake solutions based on Amazon Web Services’ S3, which incur the operational burden of using an external store for synchronizing writes.

Log Explorer is written in the Rust programming language using open-source libraries, such as delta-rs, a native Rust implementation of the Delta Lake protocol, and Apache Arrow DataFusion, a very fast, extensible query engine. At Cloudflare, Rust has emerged as a popular choice for new product development due to its safety and performance benefits.

What’s next

We know that application security logs are only part of the puzzle in understanding what’s going on in your environment. Stay tuned for future developments including tighter, more seamless integration between Analytics and Log Explorer, the addition of more datasets including Zero Trust logs, the ability to define custom retention periods, and integrated custom alerting.

Please use the feedback link to let us know how Log Explorer is working for you and what else would help make your job easier.

How to get it

We’d love to hear from you! Let us know if you are interested in joining our Beta program by completing this form and a member of our team will contact you.

Pricing will be finalized prior to a General Availability (GA) launch.

Tune in for more news, announcements and thought-provoking discussions! Don’t miss the full Security Week hub page.