Passionate sports viewers expect to easily discover and access sports events and their favorite teams, leagues, and players. Providing a robust and intuitive search experience is crucial for the success of Prime Video Sports. With a vast, rapidly growing catalog of live and on-demand sports offerings, a well-designed search architecture allows Prime Video Sports to cater to this engaged audience, streamlining navigation and reducing friction in the user experience. The Prime Video search experience is one of the most clicked on elements in the global navigation bar. Search enables highly relevant recommendations and drives increased viewership and engagement. By prioritizing a seamless search experience that caters to the needs of sports fans, Prime Video has enhanced the overall customer experience, fostering trust and loyalty that contributes to the platform’s long-term growth and success. In this post, we will walk you through how Prime Video used Amazon OpenSearch Service and its AI and machine learning (AI/ML) capabilities to build a more intuitive and enhanced sports search experience.
Challenges
The Prime Video search experience was originally designed to help customers discover trending movies and TV shows that carry durable stats including ratings, viewership, and so on. As Prime Video began to acquire sports rights, they needed to rethink the approach, which was focused primarily on TV shows and movies, to understand the customers’ intent and surface the right content. The approach for TV shows and movies didn’t work as well for live sports because of the more temporal and seasonal nature of sports content making every title a cold start. For example, a search for “soccer live” surfaced documentaries such as “This is football: Season 1” and “Ronaldo VS Messi – Face Off!” rather than live soccer matches. While those entertainment options are perfectly fine on their own, they didn’t fulfill the customers’ goal of finding and watching live or upcoming games for their favorite sports. This disconnect between search queries and relevant results created challenges for customers trying to access the sports content they wanted. By surfacing these relevant sports events in search results, Prime Video enhanced the customer experience, helping customers discover the full breadth of sports coverage available on Prime Video and finding their favorite sports events. To address these issues and better serve the needs of sports fans, in 2024, Prime Video enhanced its sports-specific search capabilities, incorporating deeper sports understanding and using state-of-the-art search techniques, creating an improved and intelligent search system.
Solution overview
In 2024, Prime Video Sports Search delivered the first version of an enhanced sports search functionality powering the experience through a two layer solution comprised of coarse retrieval using semantic search and binary search relevance classification. Semantic search is a technique of searching for information that goes beyond just matching keywords. It matches queries to data (sports events in this case) based on vector embeddings, which capture the meaning of words, phrases, and sentences. The vectors can have n dimensions; when mapped into an n-dimensional space, data that is close in semantic meaning (not a direct text match) will be close to each other in the space, as shown in the following diagram of a two-dimensional vector space of sports matches (in yellow) and search queries (in green).
The foundation of using vector search for sports is the creation of vector embeddings for each sport event present in the Prime Video Sports Catalog. As event data is ingested, textual information including title, sports, team names, leagues, and other event details are used to generate a unique vector representation for each sports event. This allows the system to capture the semantic meaning and relationships between different events—including abbreviations, nicknames, and so on—that are often used by customers to search. When a customer searches for something related to sports, their query is also converted into a vector. The system then performs a K-nearest neighbor (KNN) search, comparing the customer’s query vector to the vectors of all sports events in the catalog. The events with vectors that are closest to the query vector are identified as the most relevant matches, even if the searched words were not directly indexed. For example, Thursday Night Football events might be indexed without the abbreviation tnf, however these games will be returned by semantic search if a customer searches using “tnf” as their search query.
The following figure shows a high level indexing and query flow for a KNN vector search.
Finding the nearest vectors isn’t enough—the system also runs each of these potentially relevant events through a custom binary relevance classification machine learning (ML) model, trained in-house. This allows the system to filter out any events that might be only tangentially related to the original search, leaving behind a refined list of the most pertinent and relevant results for the customer.
Finally, these highly relevant events are ranked and surfaced to the customer with factors like the event’s current live status and upcoming schedule playing a key role in determining the optimal order to display the results. This combined use of vector semantic search and relevance classification enables Prime Video to provide customers with a sports search experience that accurately surfaces the content they’re looking for, significantly enhancing their ability to discover and access the live, upcoming, and recently ended games that they’re most interested in.
Procedure
The vector semantic search implementation we developed consists of two main components: a KNN search index and an endpoint to invoke the text embedding model. To host these components, we used AWS services—the custom text embedding model was deployed on Amazon SageMaker, while the KNN index was created using OpenSearch Service, and hosted on a managed cluster consisting of more than 50 data nodes.
Both of these components are designed to handle real-time customer traffic at a scale of thousands of requests per second. We simplified our system’s application layer by using ready-to-use solutions available in AWS. The Amazon OpenSearch Ingestion pipeline enabled a seamless, code-free integration, allowing us to write sports data from an Amazon DynamoDB table directly into the OpenSearch Service index, eliminating the need for traditional extract, transform, and load (ETL) processes. Furthermore, we used the Neural Search feature of OpenSearch Service instead of directly integrating our application layer with SageMaker for text-to-vector conversion. This approach enables internal text-to-vector transformation, facilitating vector search during both ingestion and search phases. The Neural Search plugin of OpenSearch Service directly communicates with a text embedding model deployed on SageMaker as a real-time inference endpoint using ML connectors.
This architecture—illustrated in the following figure—enabled us to build a scalable and efficient vector search solution, taking advantage of the strengths of various AWS services to simplify the implementation and improve performance.
OpenSearch Ingestion : No-ETL data transfer from DynamoDB to an OpenSearch Service index
Before indexing the sports data in OpenSearch Service, the data is first stored in a DynamoDB table. This layer of storage allows us to maintain a database of all sports events and their metadata required to enable search. This layer acts as a source of truth for sports data that isn’t impacted by the evolution of customer use cases and their respective implementation.
To seamlessly transfer this data from DynamoDB to the OpenSearch Service index, we used an OpenSearch Ingestion pipeline. This allowed us to set up real-time data transfer with a zero ETL integration, abstracting away the data indexing from the application layer. The OpenSearch Ingestion pipeline configuration enables us to specify a schema mapping between the DynamoDB table and the expected document schema in OpenSearch Service. This configuration also allows us to perform data formatting operations on specific fields and configure a dead-letter queue (DLQ) if needed. The steps to setup an OpenSearch Ingestion pipeline can be found in this blog post.
Embedding model setup on SageMaker
At the core of our vector search implementation is the text-embedding model, which plays a crucial role in capturing the semantic meaning of sports-related data. The Sports Search Science team developed this text-embedding model and deployed it on SageMaker as a real-time inference endpoint using AWS Cloud Development Kit (AWS CDK).
The process of creating the SageMaker endpoint requires two key artifacts:
With these two components in place, we used the AWS CDK to programmatically provision the SageMaker endpoint, ensuring a seamless and consistent deployment of the text-embedding model. By using the capabilities of AWS services, such as SageMaker, Amazon ECR, and Amazon S3, we were able to build a scalable and efficient text-embedding model infrastructure to power the vector search solution.
ML connectors
To facilitate access to machine learning models hosted on platforms, such as SageMaker or Amazon Bedrock, OpenSearch Service provides ML connectors. These connectors enable direct integration between OpenSearch Service and external machine learning models.
In our case, the ML connector allows OpenSearch Service to directly invoke the SageMaker endpoint where our custom text-embedding model is deployed. This built-in integration between OpenSearch Service and the SageMaker hosted model simplifies the overall architecture and eliminates the need for the application layer to manage the communication between these two components.
By using the ML connectors provided by the OpenSearch Service ML plugin, we were able to seamlessly integrate our text-embedding model—which is hosted on SageMaker—into the OpenSearch-powered vector search solution. This integration streamlines the data ingestion and querying pipeline making the implementation simpler and more intuitive.
Neural search
To simplify the application layer of our vector search solution, we used the Neural Search capabilities provided by OpenSearch Service. This feature allows us to send only the text data to the index, without the need to explicitly manage the vector embedding generation and indexing. Using neural search helped simplify the application layer of the system by abstracting the generations and management of vectors required to perform a KNN search. During ingestion, neural search transforms document text into vector embeddings and indexes both the text and its vector embeddings in a vector index. When you use a neural query during search, neural search converts the query text into vector embeddings, uses vector search to compare the query and sports event embeddings, and returns the closest results. This abstracts away the need to integrate with SageMaker in the application layer to generate vector embeddings during ingestion and search.
The process of setting up a neural search index with a SageMaker-hosted inference endpoint involves the following detailed steps:
Create a neural ingest pipeline: An ingest pipeline is a sequence of processors that are applied to documents as they’re ingested into an index. To enable neural search, you can define the text_embedding processor in the pipeline. This processor converts the text in a document field to vector embeddings, and the field_map configuration determines the input and output fields for this process.
Create the neural search index: To use the text embedding processor defined in the ingest pipeline, you can create a KNN index and specify the pipeline created in the previous step as the default pipeline.
Run a neural query: To verify your neural search setup, run a neural query by providing a search text and evaluate the results.
By following these steps, you can set up a neural search index in OpenSearch Service and run a neural query. The neural query can perform KNN vector search internally, while only requiring the input of text data during both indexing and querying. This simplifies the application layer and uses the built-in vector embedding generation and indexing capabilities provided by the OpenSearch Service Neural Search feature.
Outcomes
The initial launch of this architecture for sports search had a measurably positive impact on customer experience. We observed a statistically significant increase in search-attributed conversions including streams, purchases, subscriptions, and so on. Offline analysis of the results delivered to customers indicated an improvement in the precision of search results and a reduction in the irrelevance rate of the content shown.
Additionally, we saw that customers engaged with the search feature more frequently, as it was now surfacing results that much more closely aligned with what they were looking for. This increased engagement led to greater discovery of relevant titles on the Prime Video service, including titles that had received little engagement prior to the changes.
Overall, the data clearly demonstrated that by tailoring the specific needs of sports fans into the search experience, we significantly improved their ability to find and access desired content. By developing a smarter search system that better understands sports intent, we have driven more meaningful customer activity and increased conversions directly from search interactions.
Conclusion
By using the innovative AI/ML capabilities of Amazon OpenSearch Service, Prime Video was able to create a cutting-edge search experience that effectively addressed the unique challenges presented by highly dynamic, high-volume sports content. In addition, by overcoming the hurdles that come with such large scale, Prime Video Sports Search was able to contribute valuable improvements and enhancements back to the OpenSearch open source community. These contributions help to pave the way for other developers to more readily use the advanced AI/ML features that OpenSearch Service offers.
This collaboration between Prime Video Sports Search and OpenSearch Service has resulted in a best-in-class search capability that can seamlessly accommodate the unique requirements of live sports content. It’s a partnership that has allowed the products to grow and innovate in tandem, to the benefit of customers seeking exceptional search and discovery experiences.
If you want to build a search experience that understands user intent beyond keyword matching, try the semantic search algorithm with OpenSearch Service and its AI/ML capabilities. If you have any questions, leave a comment below.
About the authors
Radhika Chandak is a Software Development Engineer at Amazon Prime Video, where she has been working for the past 3 years. Her focus is on creating high-velocity customer experiences, with a particular emphasis on building state-of-the-art search experiences for sports content. Radhika is passionate about developing solutions that solve customer problems and delight users. Her expertise lies in crafting innovative approaches to enhance the Prime Video Sports platform, ensuring seamless and engaging experiences for sports enthusiasts.
Anna Chalupowicz is a Software Development Manager at Amazon Prime Video Sports, with 6 years of diverse experience within Amazon. For the last 3.5 years, Anna has been working in Prime Video Sports, where she focuses on developing high-scale solutions and architectural approaches that directly benefit customers. With a passion for collaborative learning and knowledge sharing, Anna finds joy in tackling complex technical challenges and using data-driven insights to enhance the customer experience.
Yaliang Wu is a Software Engineering Manager at AWS, focusing on OpenSearch projects, machine learning, and generative AI applications.
The Paris 2024 Summer Olympics wrapped up on August 11, 2024, with the Olympic flag being lowered in the Stade de France after 16 days of competitions. With 329 events across 32 sports, over 10,000 athletes from 204 nations participated in the pursuit of medals and glory, creating some viral online moments along the way. In this post, we turn our attention to the closing ceremony, the impact of various Olympic moments on Internet traffic, and the cyber attacks faced by sponsors. We also examine email trends related to the Olympics, including mentions of Simone Biles, Snoop Dogg, and Imane Khelif.
Cloudflare has a global presence with data centers in over 330 cities, supporting millions of customers with different tools and products, which provides a global view of what’s happening on the Internet. This is helpful for improving security, privacy, efficiency, and speed, but also for observing Internet disruptions and traffic trends.
In our previous blog post about the opening ceremony and the early days of the event, we showed how France was impacted by the Olympics, with clear drops in traffic during the main events. The opening ceremony caused the most significant drop—traffic decreased by as much as 20% compared to the previous week. Other countries were also less online during that time, spending more time on broadcast TV.
Closing ceremony impact in France
The moment that the Golden Voyager (a golden dancing character) descended from the sky during the closing ceremony. Captured in a photo taken by Cloudflare CEO Matthew Prince, who was in attendance.
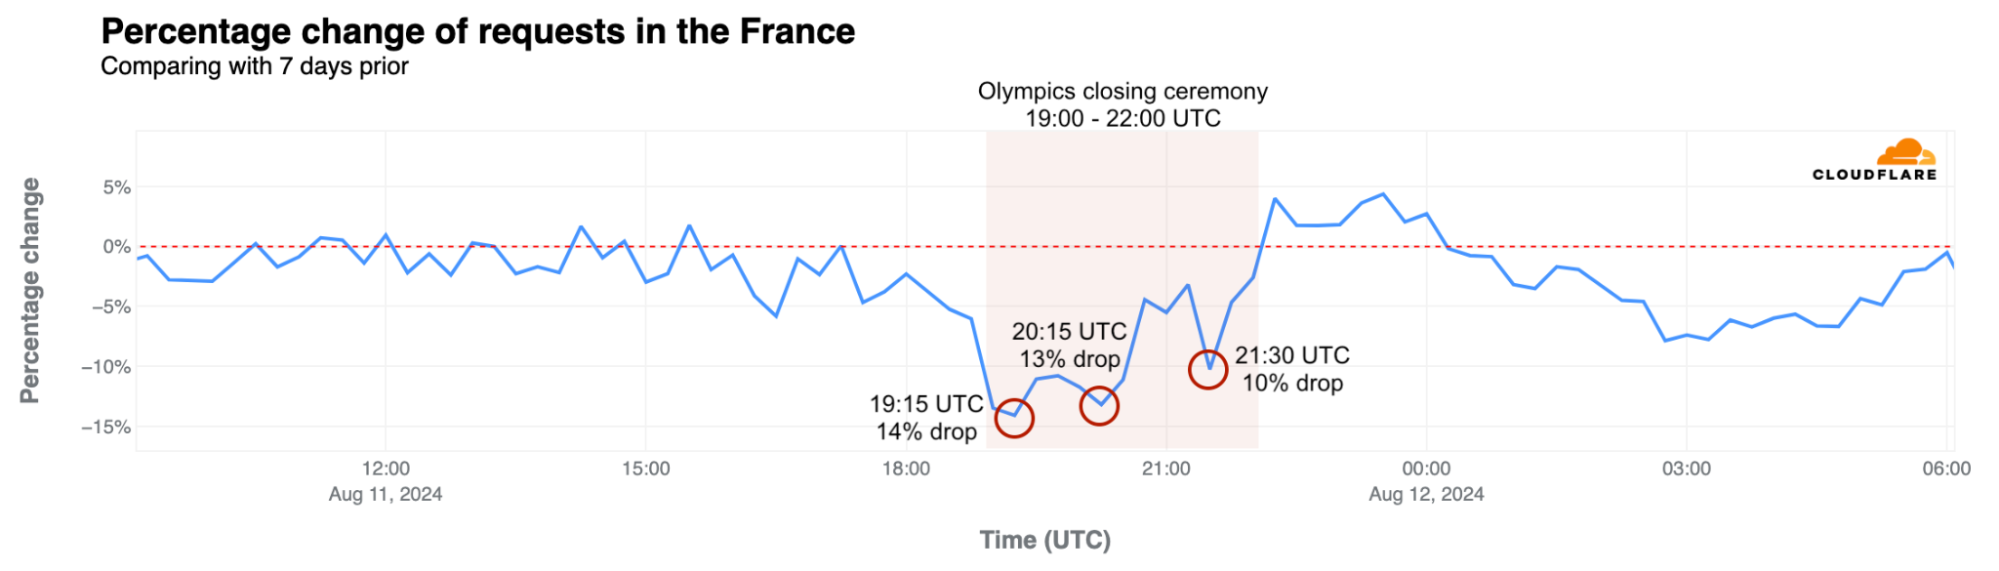
More than two weeks after the Summer Olympics began, the 3-hour closing ceremony on August 11, 2024, had a similar impact as the opening ceremony did on Internet traffic in France, although less pronounced. Internet traffic dropped by as much as 14% compared to the previous week at the start of the ceremony, around 19:15 UTC. Here is a breakdown of the top three traffic drops compared to the previous week during the ceremony, detailing the events occurring at those times. Our data provides insights with 15-minute granularity.
Moments of the closing ceremony by traffic drop in France
Time of drop (UTC)
Drop %
Events at the time
#1
~19:15
-14%
Léon Marchand, France’s swimming star, carried a lantern from the Cauldron at the Jardins des Tuileries to the Stade de France. Flags of all National Olympic Committees entered the stadium, followed by the athletes.
#2
~20:15
-13%
A Golden Voyager, inspired by French history, descended from the sky, followed by Nike, the Goddess of Victory. In the stands, LED bracelets—similar to those used at Taylor Swift concerts—created images of athletes, doves of peace, and the Olympic Rings.
#3
~21:30
-10%
Californian artist H.E.R. performed the U.S. national anthem and introduced Tom Cruise, who performed Mission Impossible stunts to transport the Olympic flag from Paris to Los Angeles.
During the closing ceremony, from 19:00 to 22:00 UTC, traffic in France was significantly lower than the previous week, down between 3% – 14%. The decreases were less pronounced during the middle and end of the event. Internet requests increased during band performances and the official closing speeches. Traffic also rose during Yseult’s finale, singing a rendition of Frank Sinatra’s “My Way,” contrasting with the significant drop during Celine Dion’s performance at the end of the opening ceremony.
In exploring traffic trends for other countries, we found that the closing ceremony didn’t have as clear an impact as the opening event did.
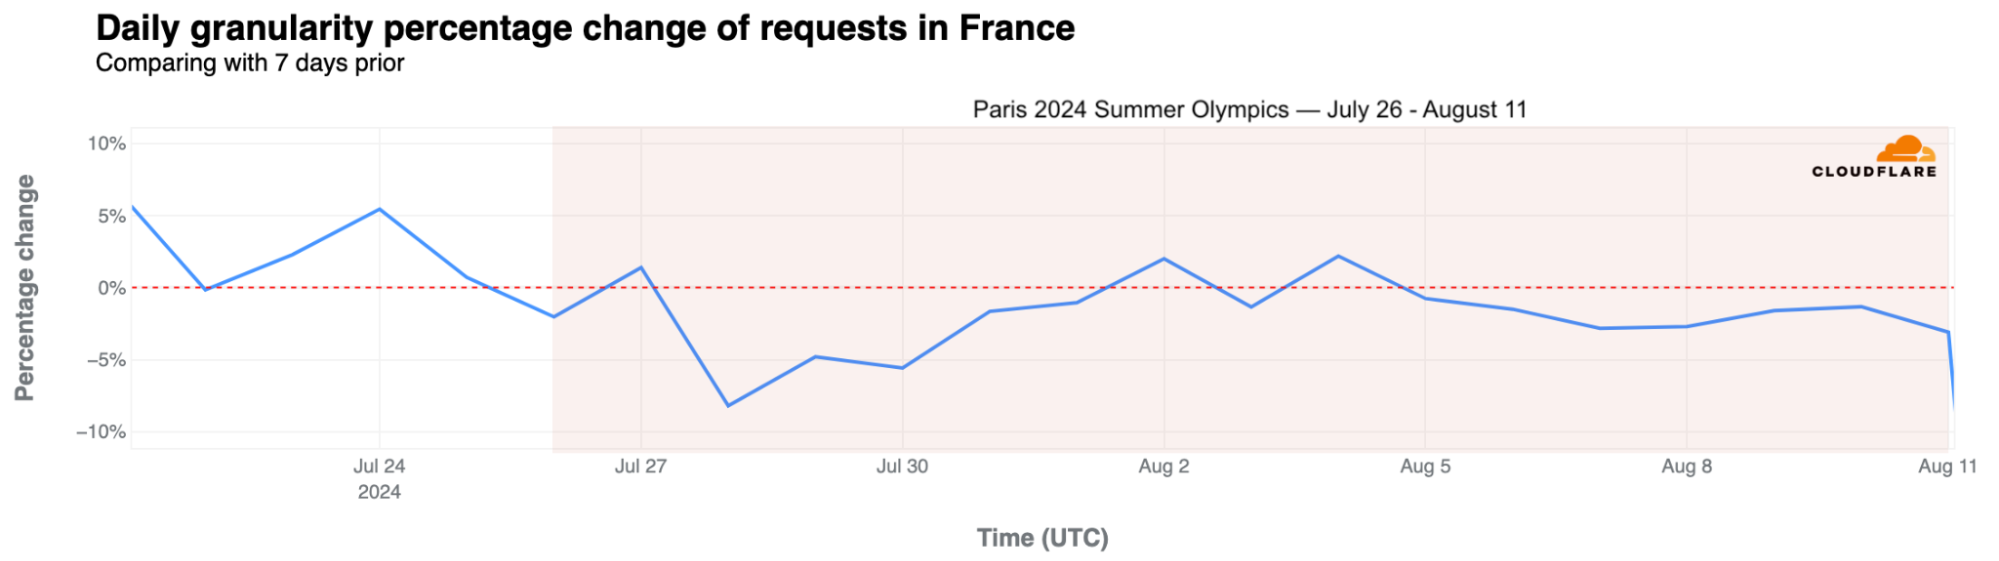
Taking a broader look at traffic in France during the entire Olympic period, daily traffic dropped by as much as 8% on July 28 but remained fairly stable afterward, with a 3% drop on August 8.
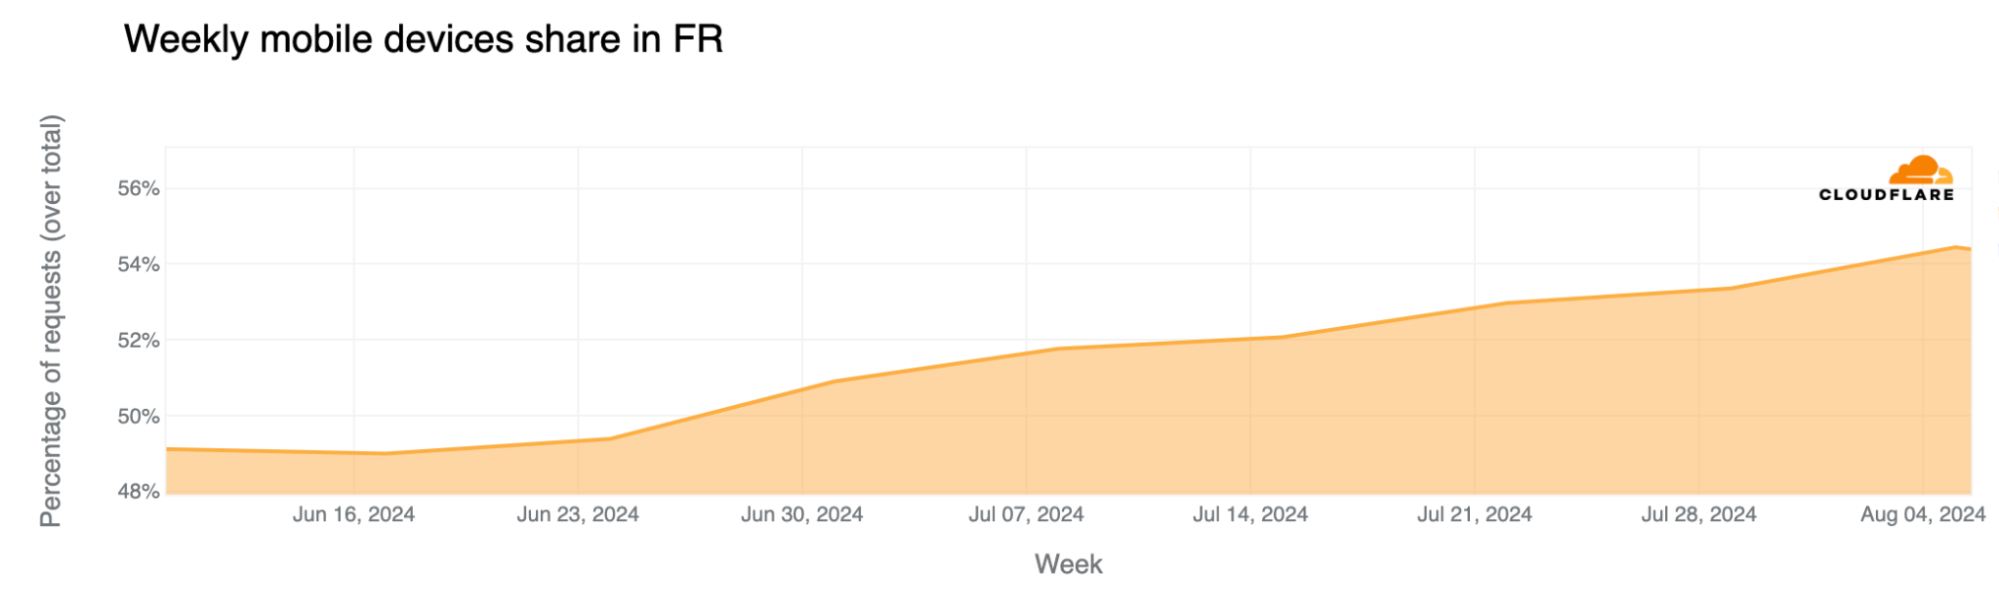
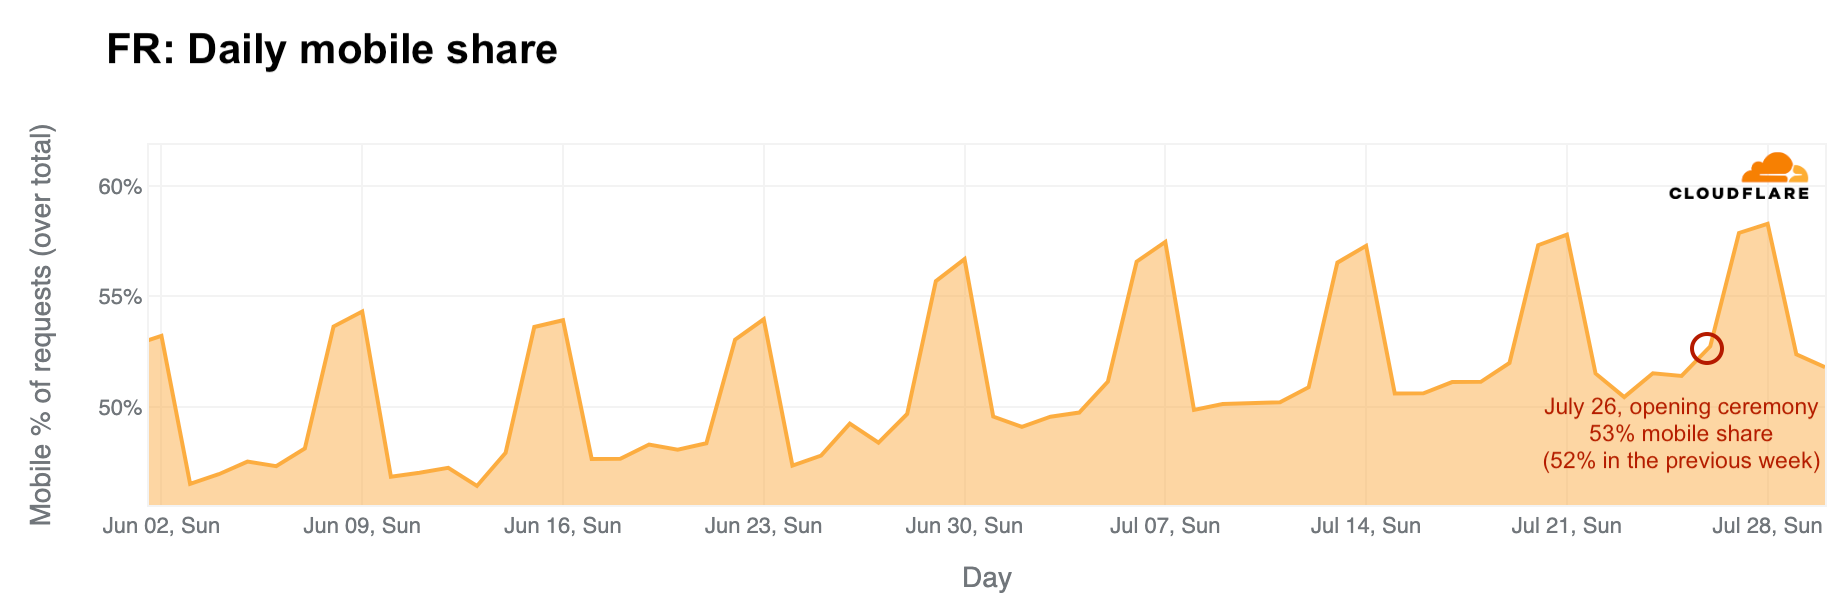
Mobile device use rose in France
Mobile device traffic share continued to grow during the event, with more people using mobile devices to access the Internet. This trend of more mobile use in France aligns not only with more tourists and visitors in the country during the Olympics – visitors more typically use mobile devices to access the Internet – but also with French people taking vacations and working less during this time. Weekly mobile device traffic share in France in mid-June was 49%, and since the Olympics started, it has increased to between 53% and 54%.
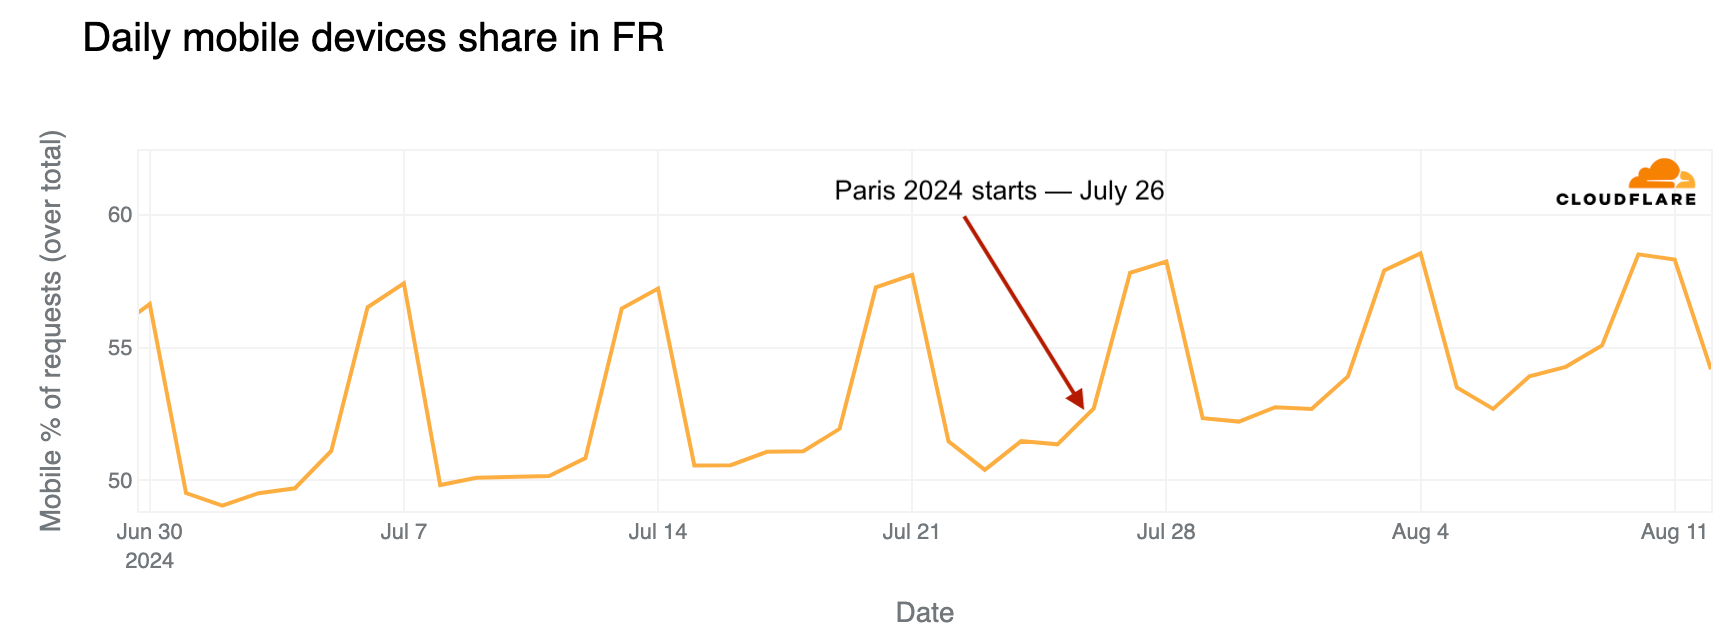
In France, mobile device use is higher on weekends. However, looking at daily trends, mobile traffic share on weekdays was clearly higher after July 26, when the Olympics began.
Parisians left, Olympic tourists arrived
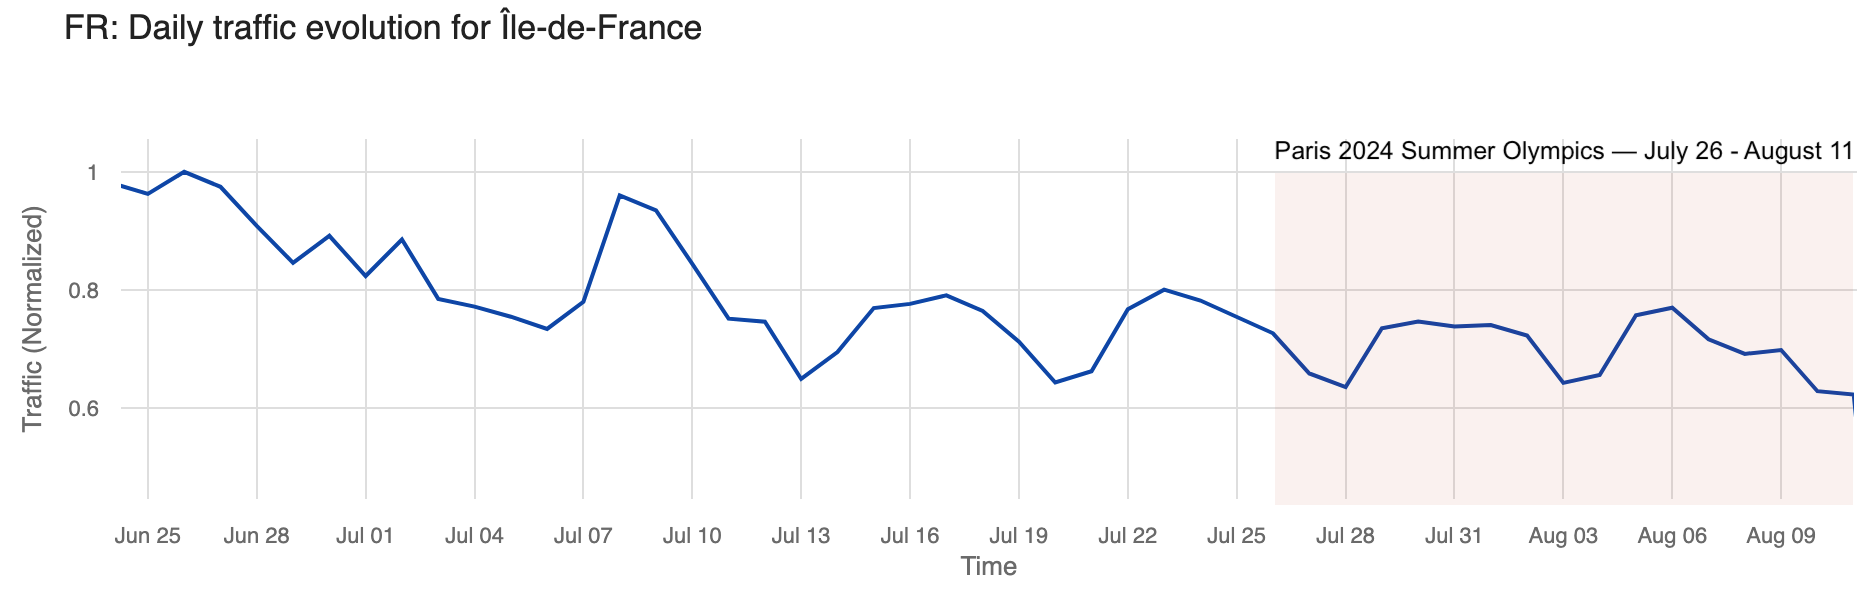
We’ve seen before that Parisians appeared to left town (and the region) just before the Olympics. In the Paris region of Île-de-France, with the Olympics, traffic during the first week of the event dropped as much as 6% on July 30, compared to the previous week. Traffic picked up a bit on the second weekend of the Olympics but dropped even more during the second and final week.
The chart below illustrates daily traffic to the Île-de-France region, with a noticeable decline visible during the weekend before the Olympics that was more pronounced during the event.
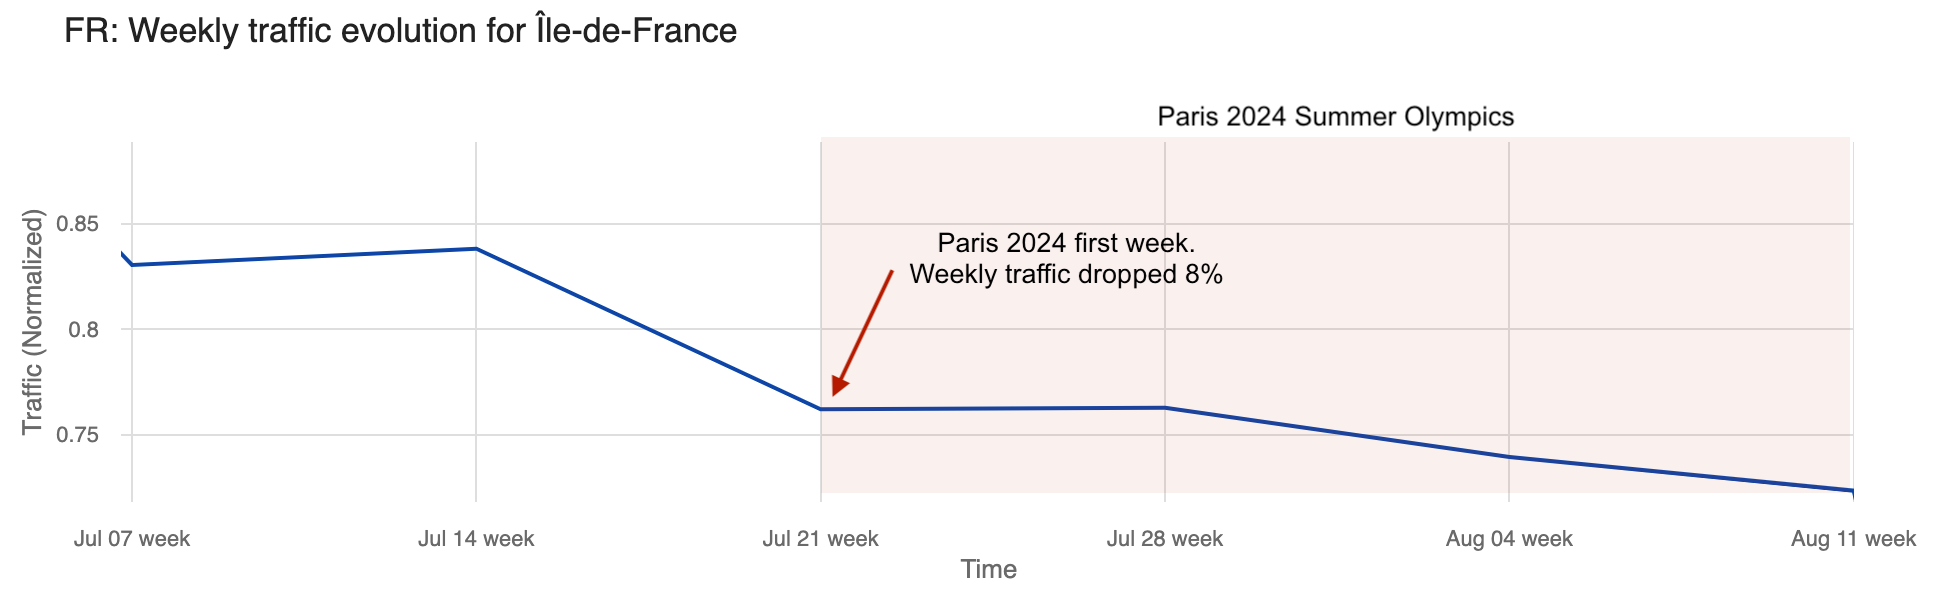
Weekly traffic dropped 8% the week the Olympics started and remained stable the following week. Even so, by August 4, the last week of the Olympics, traffic was 23% lower in the Île-de-France region than in the week of June 30, when it was at its highest in recent weeks.
Significant moments: from Simone Biles to breakdancing debut
Below, we highlight specific Olympic events affecting Internet traffic that we were able to observe in our data from different locations (ordered by the numbers of medals in the event), starting from the first full competition day on Saturday, July 27, 2024.
Host nation France was clearly the one with more significant impacts to Internet traffic during relevant moments of the Olympics.
United States: The artistic gymnastics competition featuring four-time Olympic gold medalist Simone Biles had a greater impact on U.S. Internet traffic than the opening ceremony. On July 26-28, traffic dipped most significantly during Biles’ events. On the 28th, at 10:00 UTC, during her beam routine, traffic was already 4% lower than the previous week. It dropped by 6% at 10:45 UTC during her floor and vault routines.
On July 29, at 19:30 UTC, traffic dropped 4% during the swimming event where Ryan Murphy won the bronze medal in the men’s 100 m backstroke final.
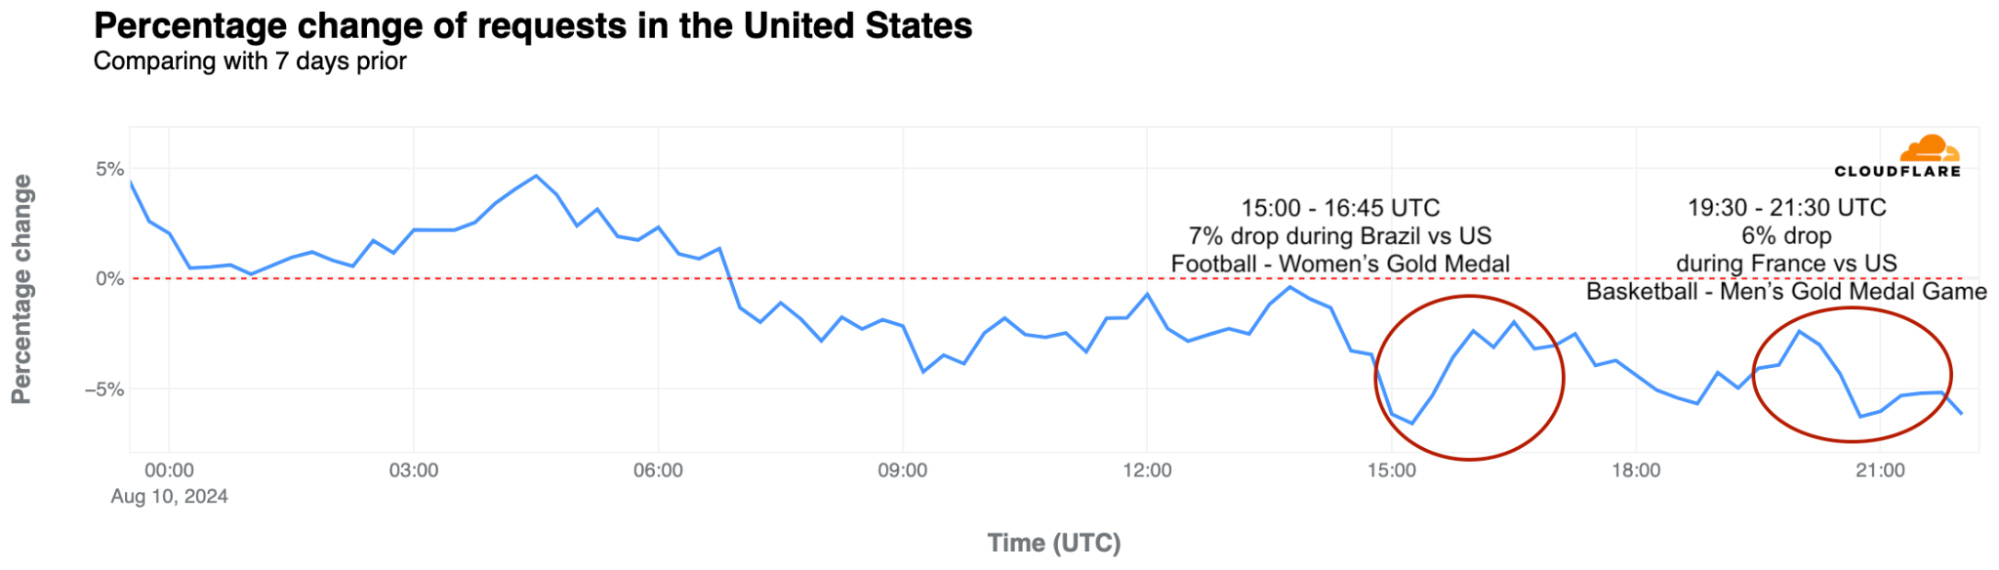
Another notable drop occurred on August 10, with a 7% decrease around 15:00 UTC during the women’s football gold medal match between Brazil and the USA. Later that day, during the men’s basketball gold medal game between France and the USA, traffic dropped by as much as 6%.
Great Britain: The first weekend of the Olympics saw clear drops in traffic, with a 10% decrease compared to the previous week around 15:00 UTC on July 28, 2024. British athletes participated in several events during those busy days. Traffic the following weekend was slightly higher than in the first Olympic weekend but dropped again on the final day, August 11.
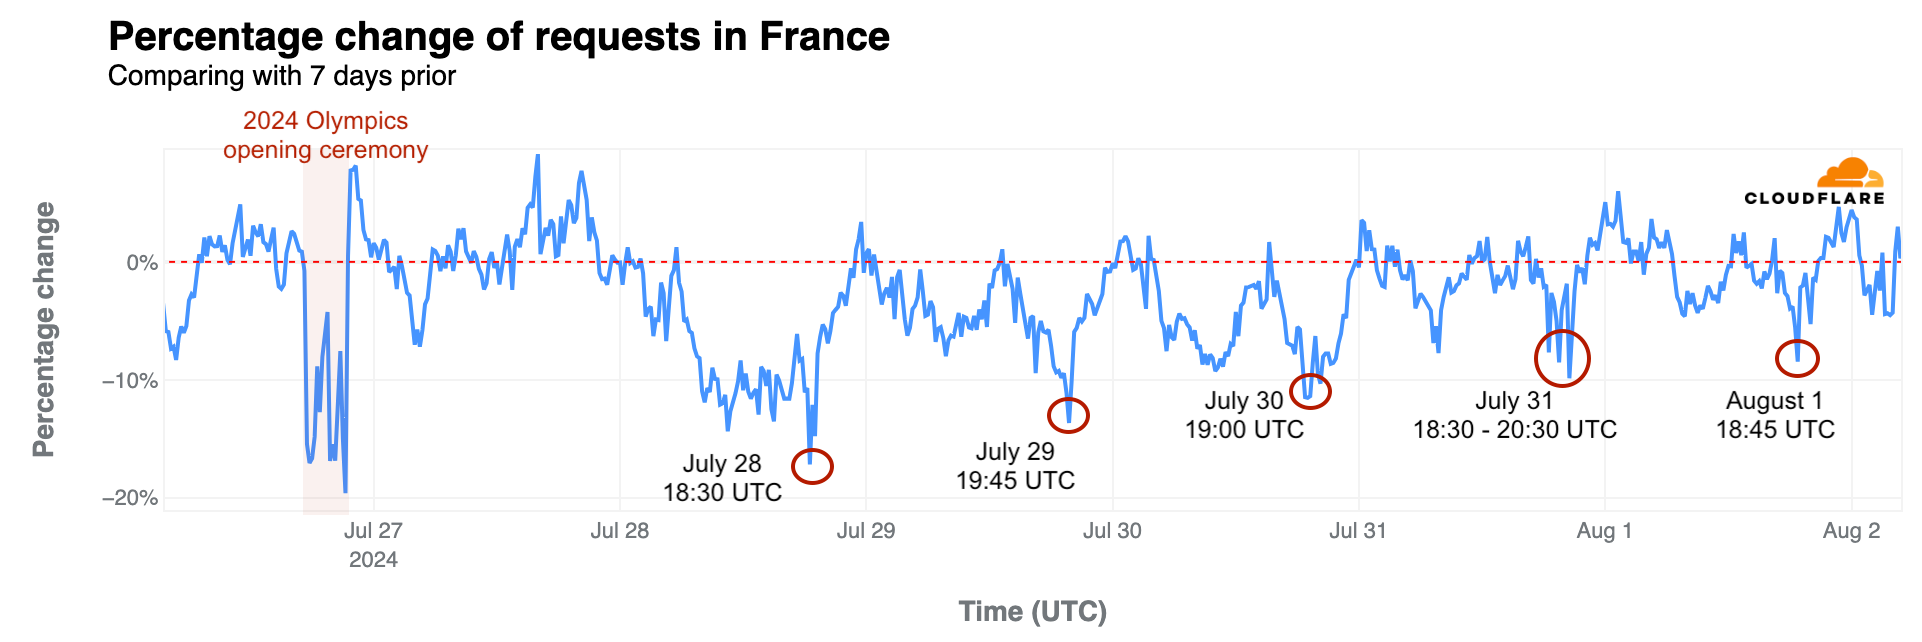
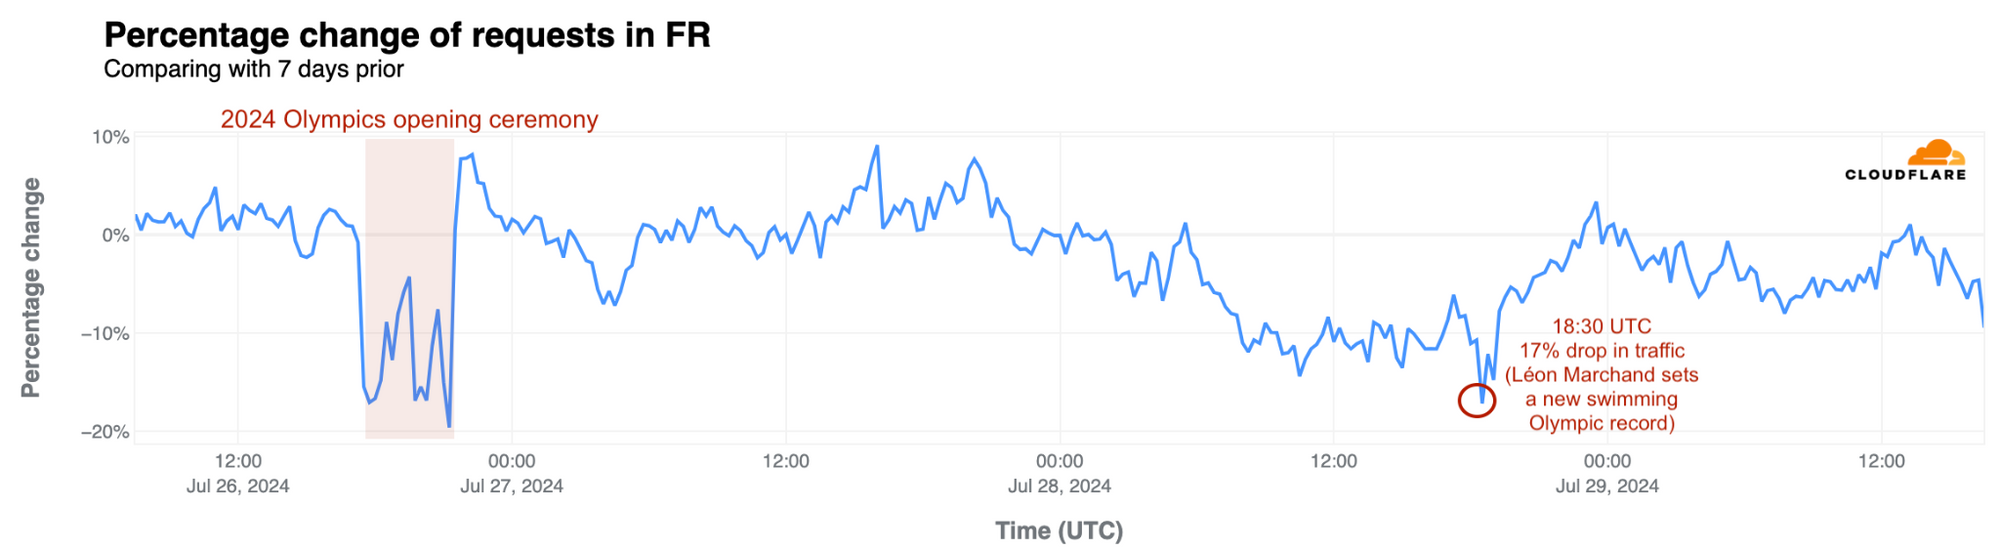
France: As previously noted, French swimmer Léon Marchand’s gold medal and Olympic record in the men’s 400-meter individual medley on July 28 had the most significant impact on French traffic during the Olympics, aside from the 20% drop seen during the opening ceremony. Traffic fell by 17% at 18:30 UTC during his event—the same level of drop seen during the closing ceremony. Similar impacts occurred during other swimming events:
July 29, 19:45 UTC, 14% drop during the Women’s 100 m Backstroke Semifinals featuring Yohann Ndoye-Brouard.
July 30, 19:00 UTC, 12% drop during the Men’s 200 m Butterfly Semifinals with Léon Marchand.
July 31, 18:30-20:30 UTC, 7% to 10% drop during the Men’s 200 m Butterfly final with Léon Marchand.
August 1, 18:45 UTC, 8% drop during swimming semifinals and finals.
Other notable drops include breakdancing:
August 9, 14:30 UTC, 10% drop during the Breaking dance debut with France’s participation.
August 10, 18:45-21:00 UTC, 7% drop during the Breaking B-Boys gold medal battle and the men’s basketball gold medal game, France vs USA.
August 11, 07:00 UTC, 8% drop during the women’s marathon.
Australia: During Mollie O’Callaghan’s victory in the women’s 200 m freestyle on July 29, at around 20:00 UTC, Australian traffic was 5% lower than the previous week, a larger drop than during the opening ceremony, which saw a 2% decrease.
On August 1, at around 18:45 UTC, traffic was 10% lower than the previous week during swimming events that led to Australia’s gold in the women’s 4x200m freestyle relay. And on August 11, at around 07:00 UTC, traffic dropped 7% compared to the previous week during the women’s marathon with Australian participants.
Japan: One of the most significant drops in traffic in Japan during the Olympics occurred on August 6, around the time Fumita Kenichiro from Japan won gold in the men’s Greco-Roman wrestling 60 kg final, followed by artistic swimming and the women’s table tennis competition, with traffic dropping 12% at 18:15 UTC.
On August 10, for several hours after 17:30 UTC, traffic in Japan was also lower than usual, with a drop of as much as 14%. This coincided with Japan’s gold medal win in the women’s javelin throw and the men’s breaking quarterfinals and semifinals.
Italy: During the event that gave Italy its first ever gold medal in artistic gymnastics, won by Alice D’Amato in the women’s balance beam event, traffic dropped 5% at around 10:45 UTC.
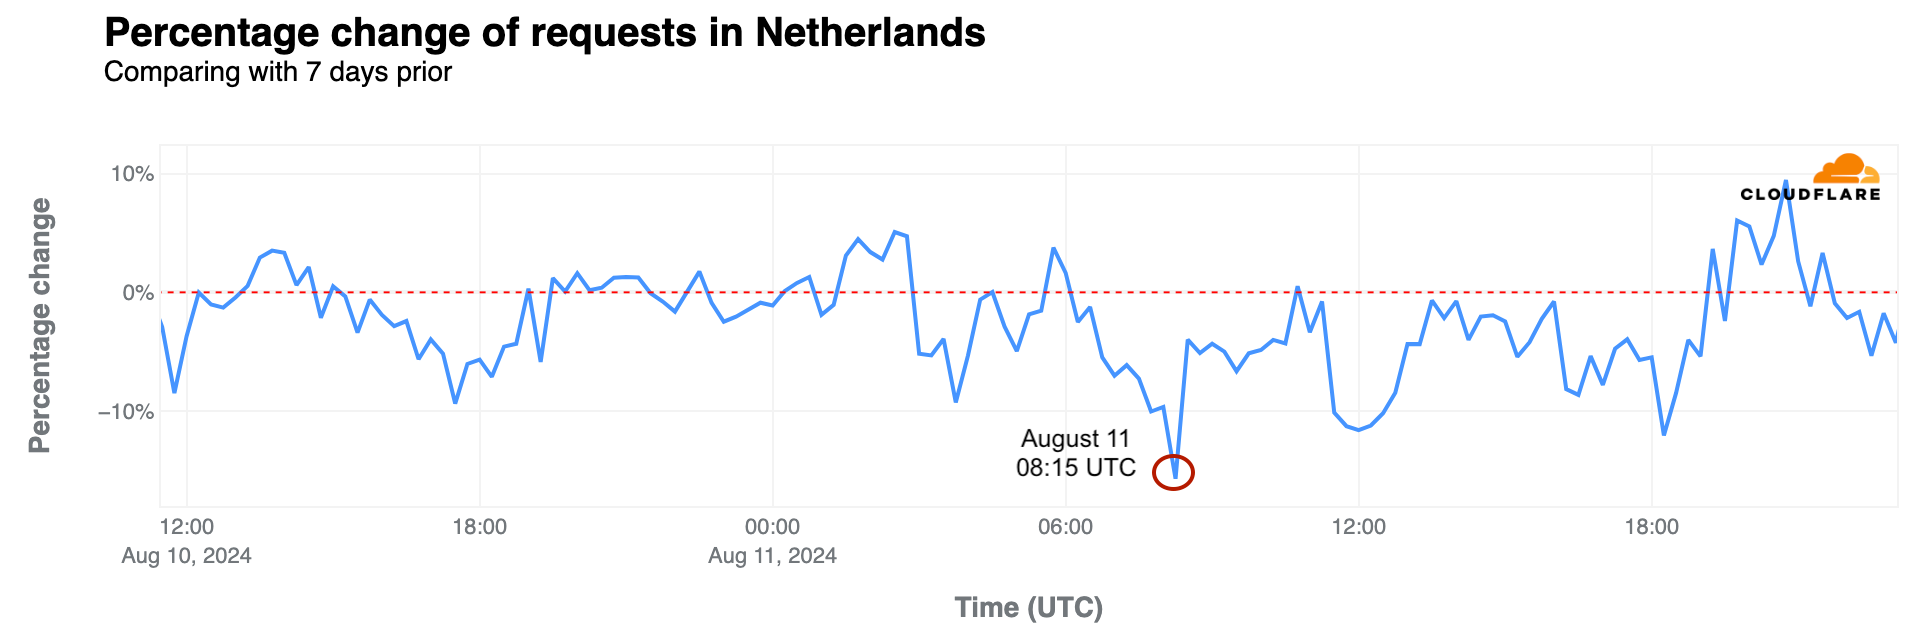
Netherlands: On the morning of July 28, the second full day of the Olympics, traffic in the Netherlands dropped by as much as 20% compared to the previous week, with Dutch athletes participating in several competitions.
On August 11, traffic dropped between 06:30 and 09:30 UTC, and by as much as 16% at 08:15 UTC, when Dutch runner Sifan Hassan won the gold medal in the women’s marathon.
South Korea: The Korean women’s archery team’s gold medal win on July 28 at 15:30 UTC led to an 8% drop in traffic, the most significant decrease noted in the country between July 26 and July 29.
On August 7, at 19:45 UTC, traffic was 9% lower during the Taekwondo gold medal event for Park Taejoon in the men’s -58 kg (under 58 kg) competition.
Brazil: Traffic in Brazil was 15% lower than the previous week on July 27 at around 19:30 UTC, surpassing the impact of the opening ceremony. This occurred as Brazilian swimmers Guilherme Costa and Maria Fernanda Costa competed in the men’s and women’s 400 m freestyle events.
On August 2, traffic in Brazil was 5% lower at around 00:30 UTC during the men’s surfing quarterfinals with Gabriel Medina and was 8% lower at around 01:00 UTC during the women’s surfing quarterfinals with Tatiana Weston-Webb.
Cape Verde: David Pina won the first Olympic medal in boxing for this archipelago nation off the western coast of Africa. On August 4, the amateur boxer took the bronze medal, with traffic dropping 12% in the country at around 15:00 UTC during the match.
DNS trends for official Olympic websites by country
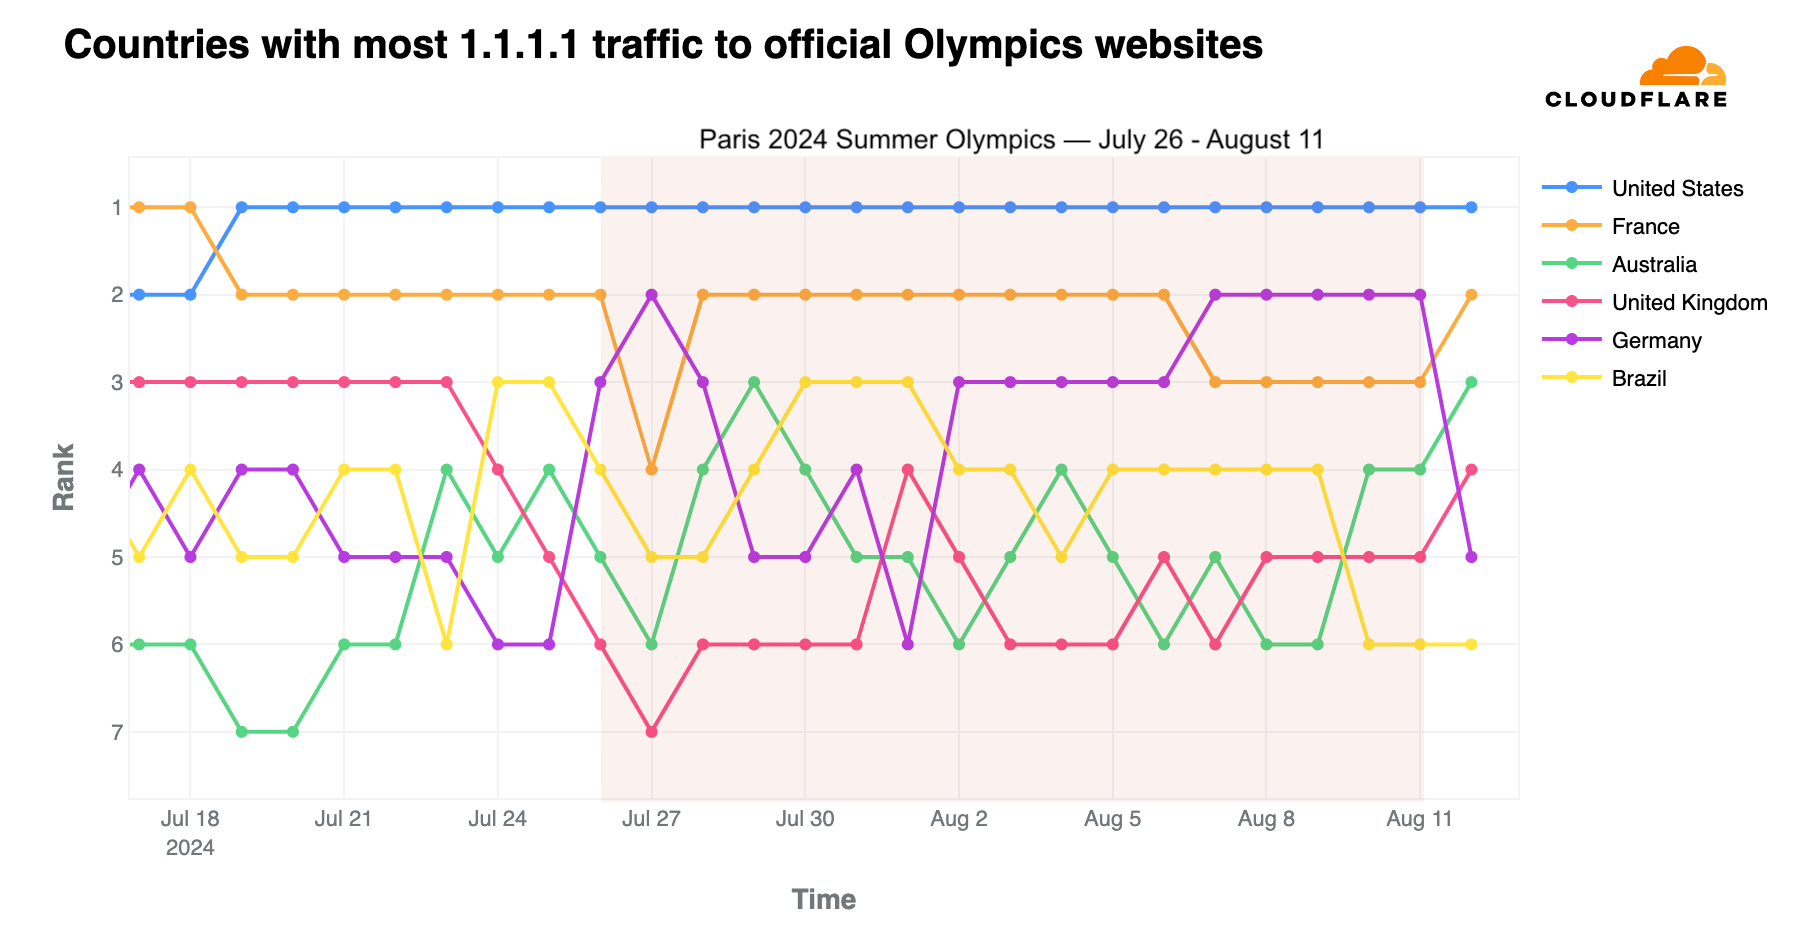
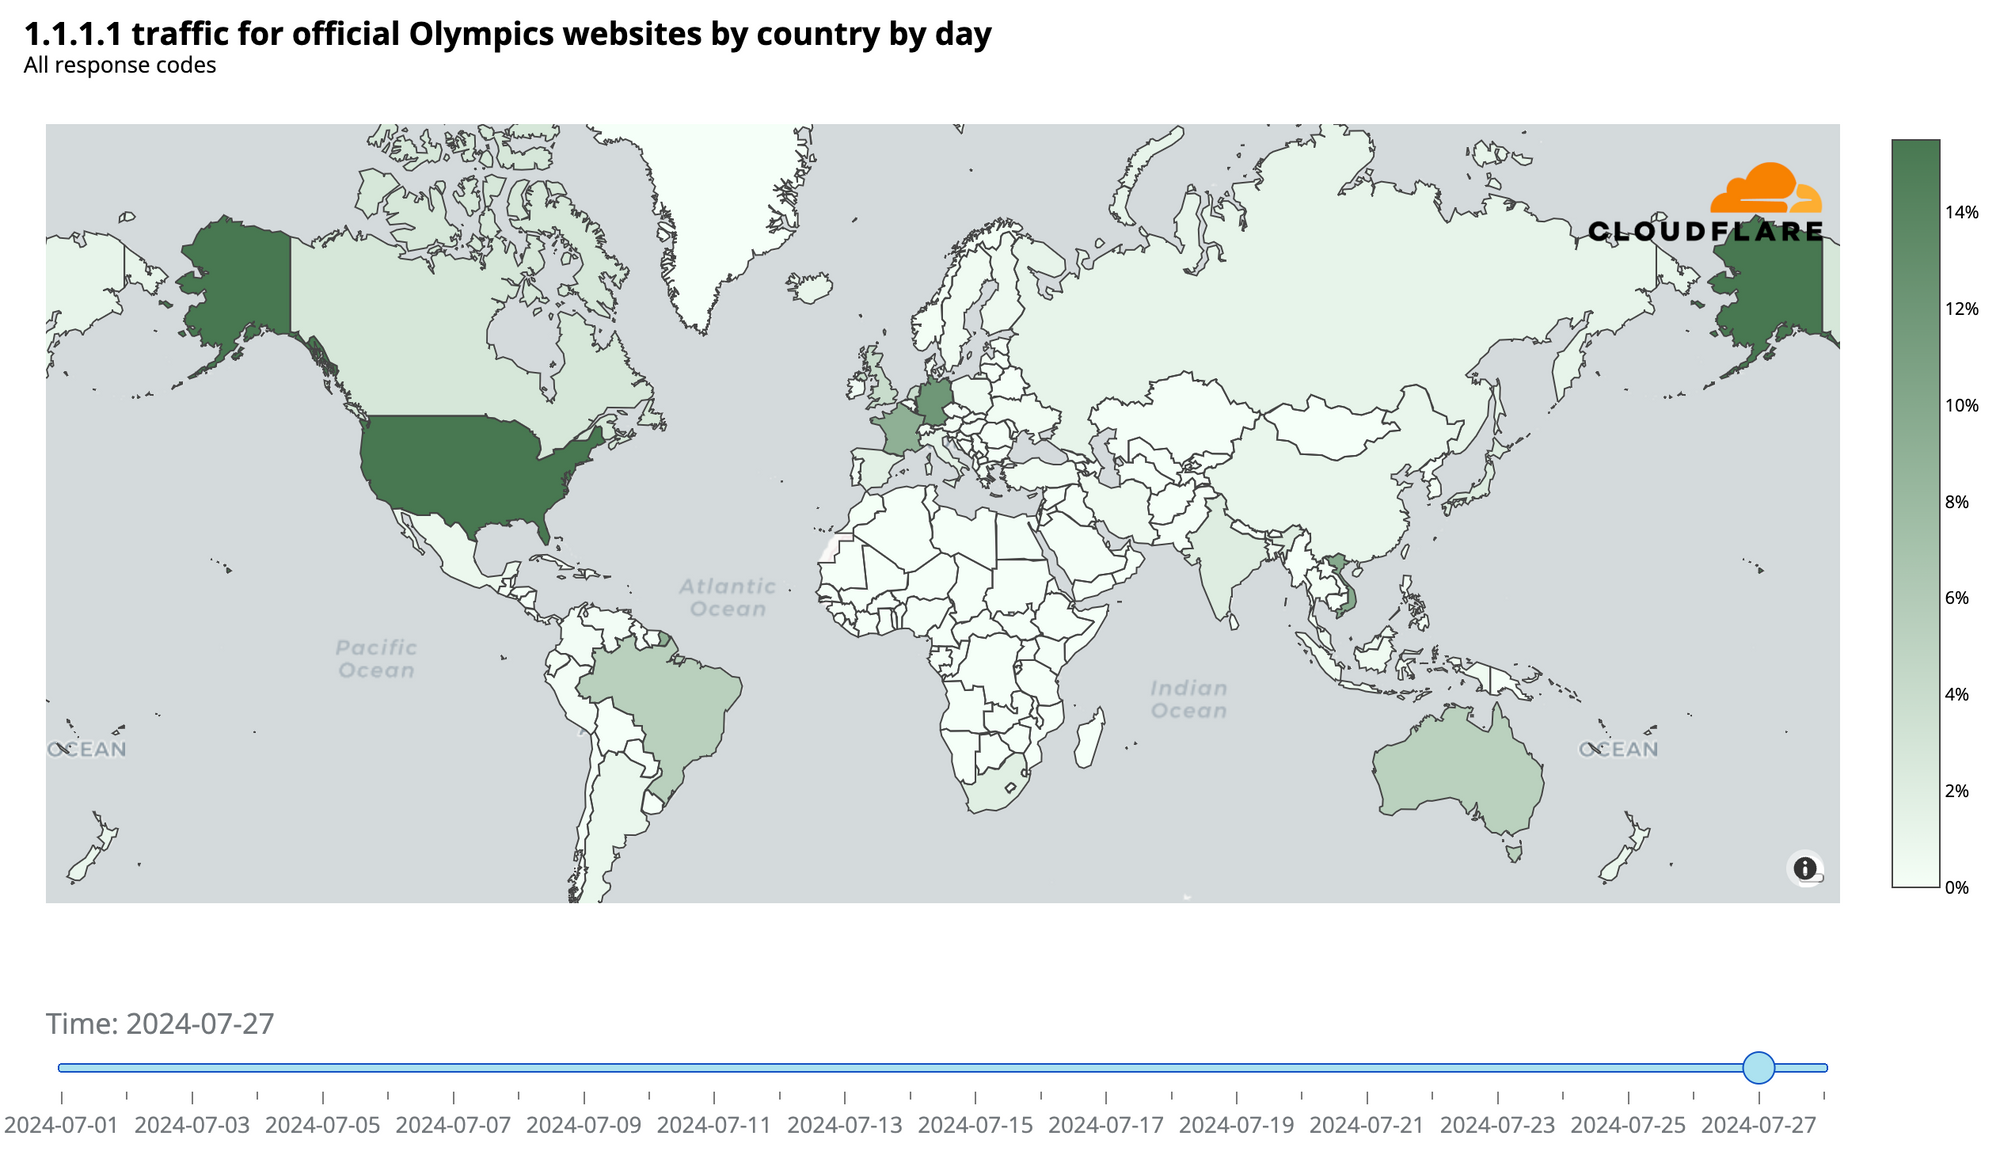
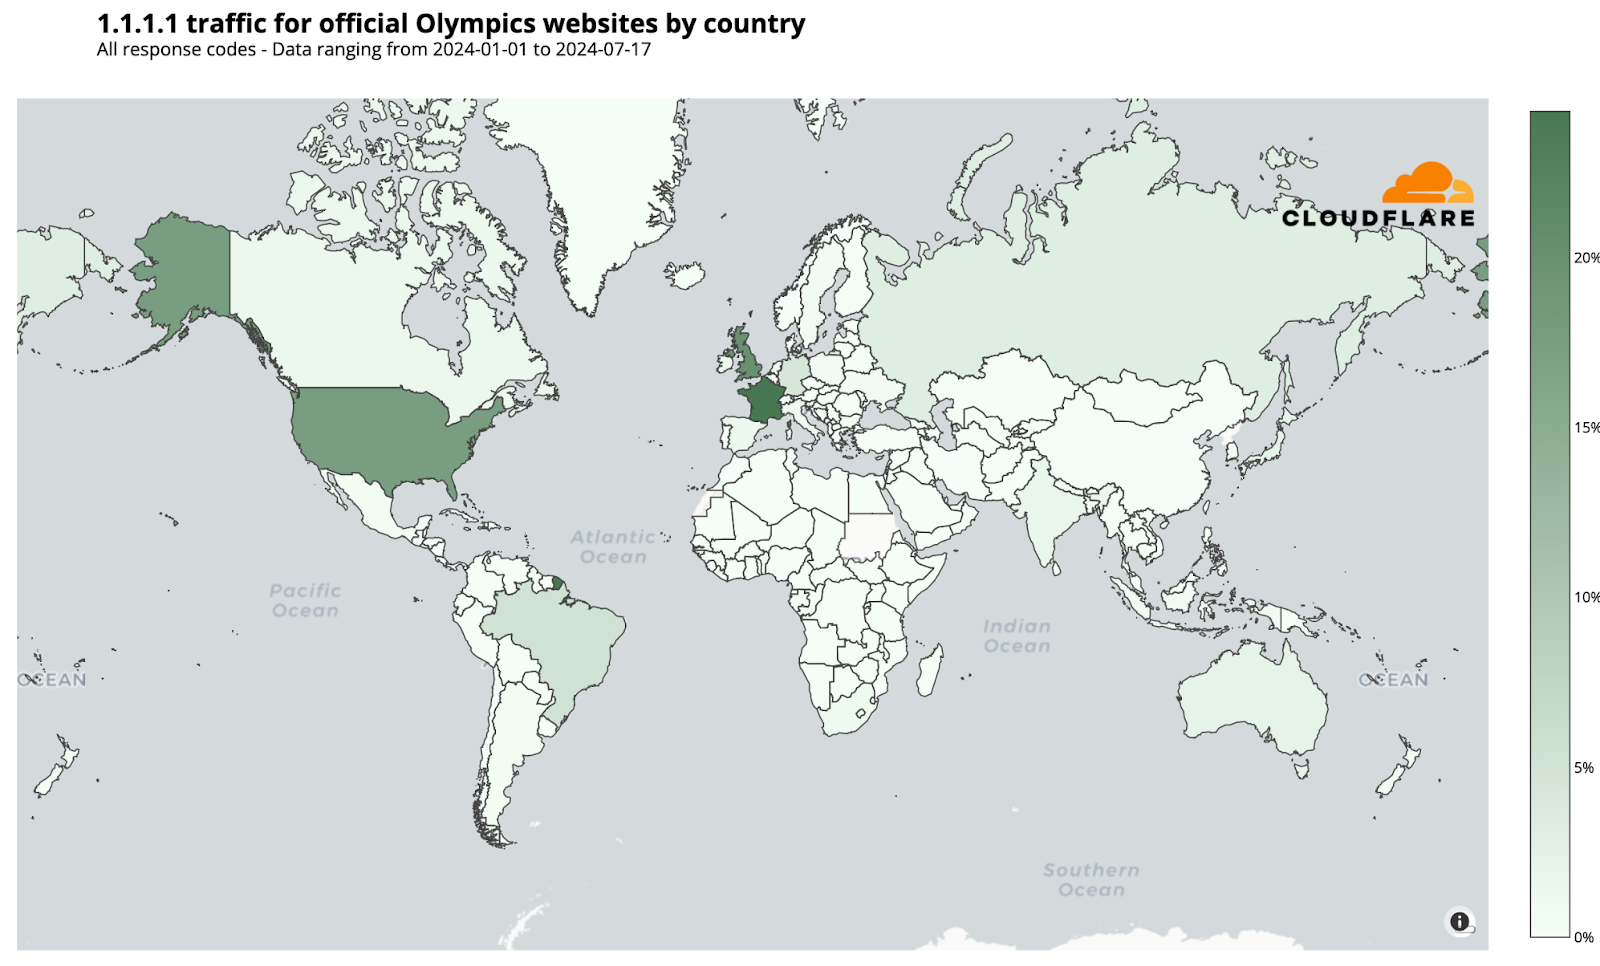
On July 22, before the Olympics began, we reported on the heightened interest in official Olympic websites based on request data from our 1.1.1.1 DNS resolver. France initially dominated with 24% of DNS traffic, followed by the UK (20%) and the US (17%). However, when the Olympics started, the US took the lead, maintaining it throughout the event.
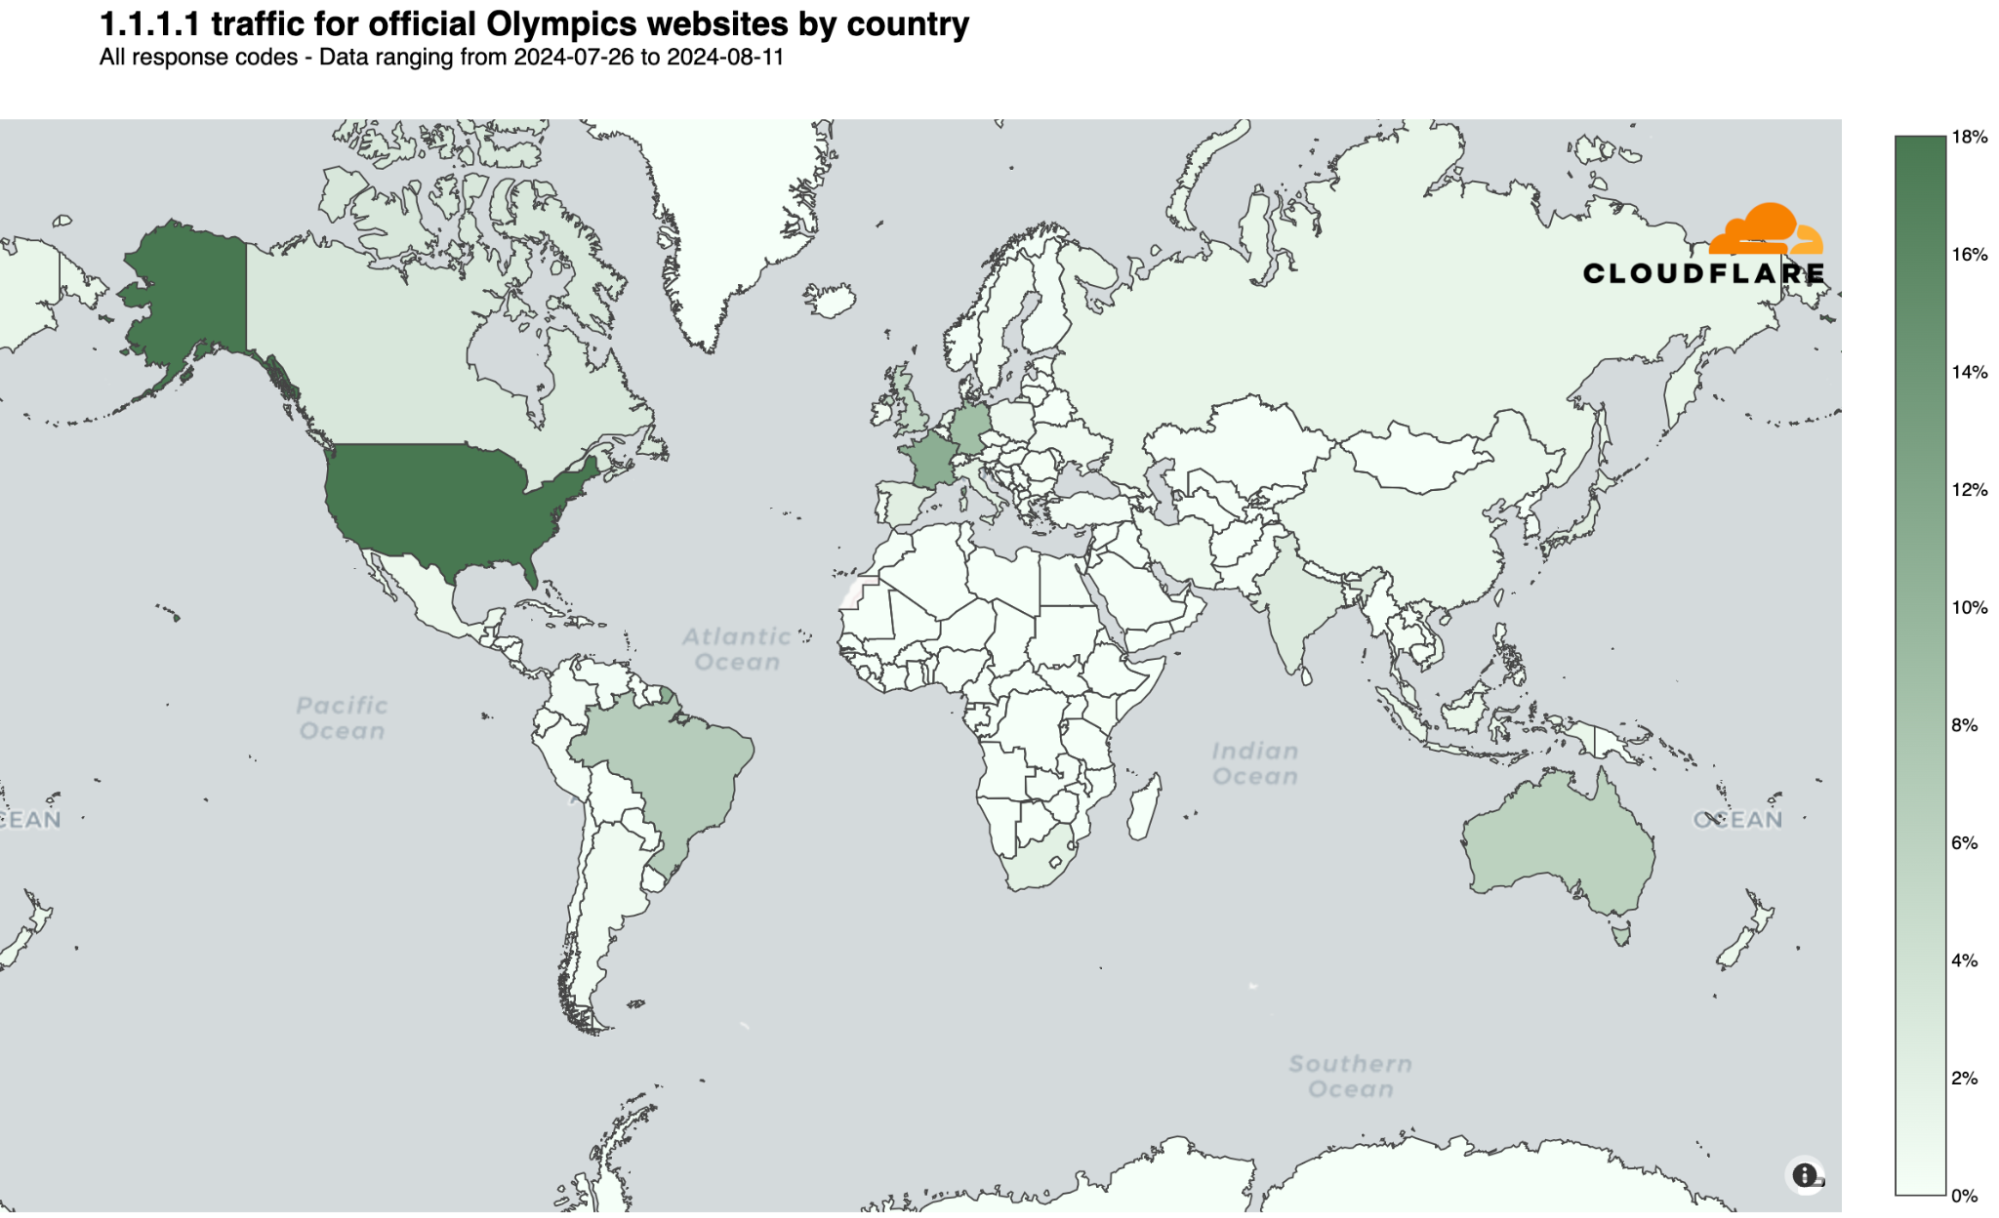
The following chart summarizes the highest shares of DNS request traffic by country during the Paris 2024 Summer Olympics. There was a shift in percentages that indicates a broader spread of interest across countries as the Olympics progressed, visible in the dynamic version of the map by day of the event that is available in our Paris 2024 Olympics report.
Here are the top 10 countries that during the event had more DNS traffic for Olympics official websites. The US took the “gold,” France the “silver,” and the UK the “bronze”:
United States: 18%
France: 16%
United Kingdom: 10%
Germany: 7%
Brazil: 6%
Australia: 5%
Canada: 2%
Japan: 2%
India: 2%
Russian Federation: 2%
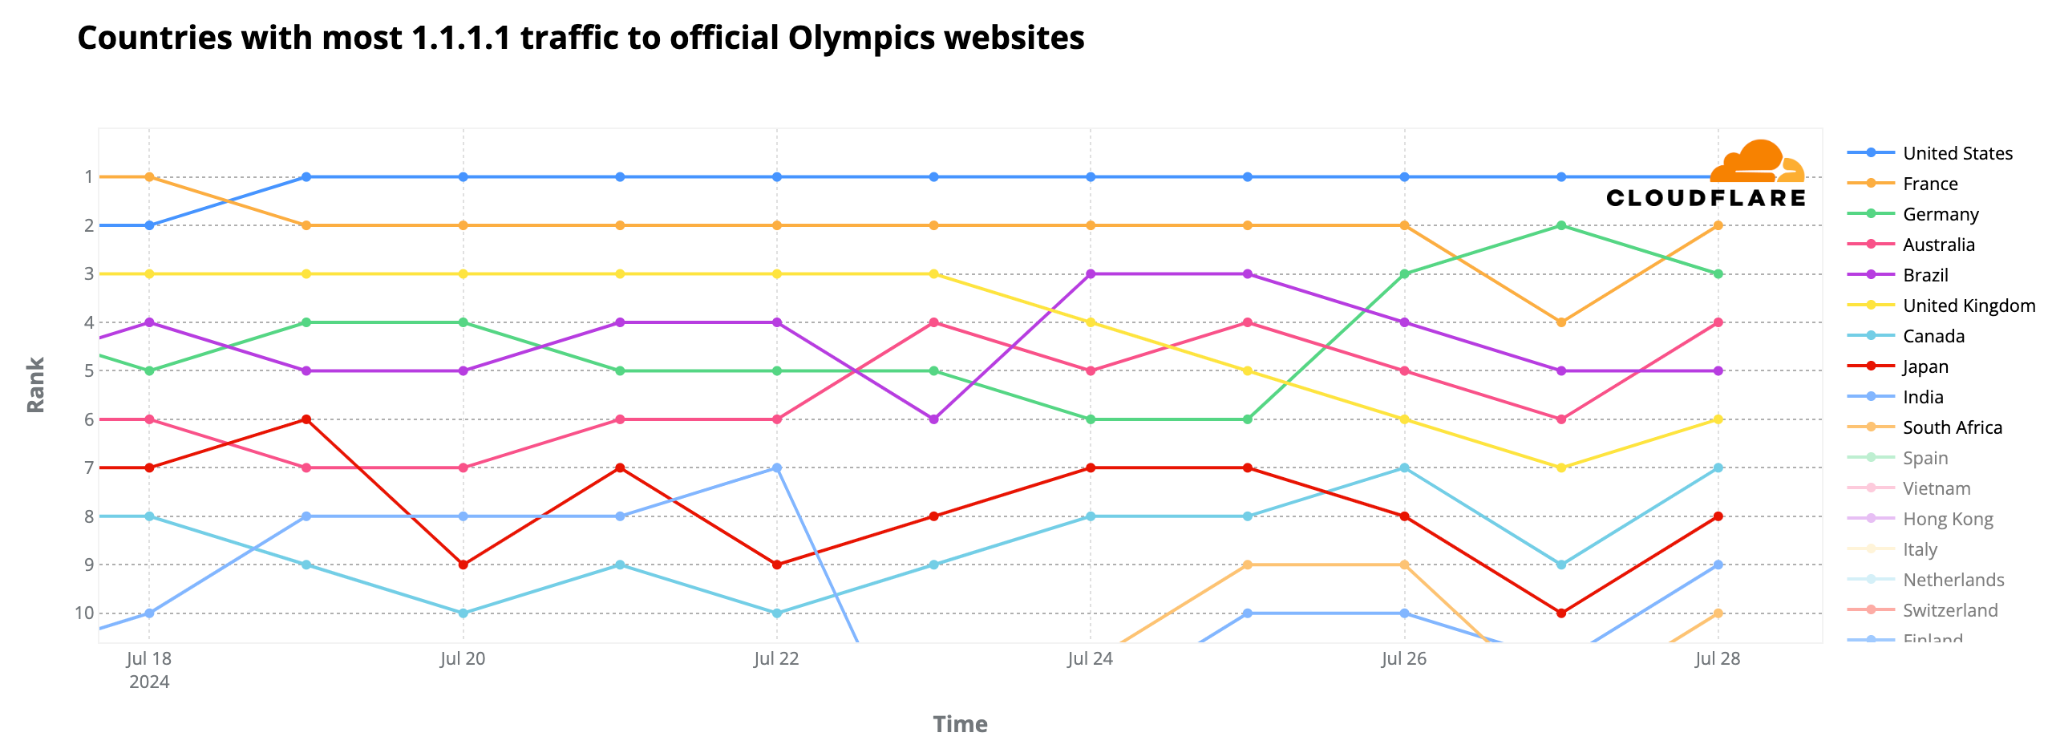
We observed that the US overtook France for the #1 spot a few days before the event began. France also dropped to third place behind Germany on July 27, the first full day of competitions, and again after August 2, though interestingly, it returned to #2 the day after the Olympics ended.
As shown in the following daily ranking chart, the UK was #3 before the event began but dropped to #4 on August 1. Australia’s highest ranking was #3 on July 29, and #4 on August 10 and 11. Brazil’s best days, ranking #3, were on July 24-25, and on July 30, 31, and August 1.
In terms of volume of DNS traffic to our 1.1.1.1 resolver, the first full week of Olympic events saw the highest volume of requests related to official Olympic websites, with a 637% increase compared to the week before the Olympics began. This trend of peak traffic during the first week was consistent across most countries, except for Germany, Spain, India, Italy, and Russia, where the final week generated more DNS resolver traffic.
On a daily basis, worldwide DNS traffic to official Olympics domains peaked on August 2, followed by August 4 and August 5, marking the start of the second and final week of the event. Below are the top 3 days with the highest DNS traffic to official Olympic websites in the top 3 countries by traffic volume:
United States: July 30 (when the US women’s team won gold in artistic gymnastics and several medals were won in swimming), July 29, and August 5.
France: July 31 (when swimmer Léon Marchand won gold in the men’s 200 m butterfly final), July 29, and August 1.
Germany: July 27 (when swimmer Lukas Maertens won gold in the men’s 400 m freestyle final), August 8, and August 7.
Sports news sites
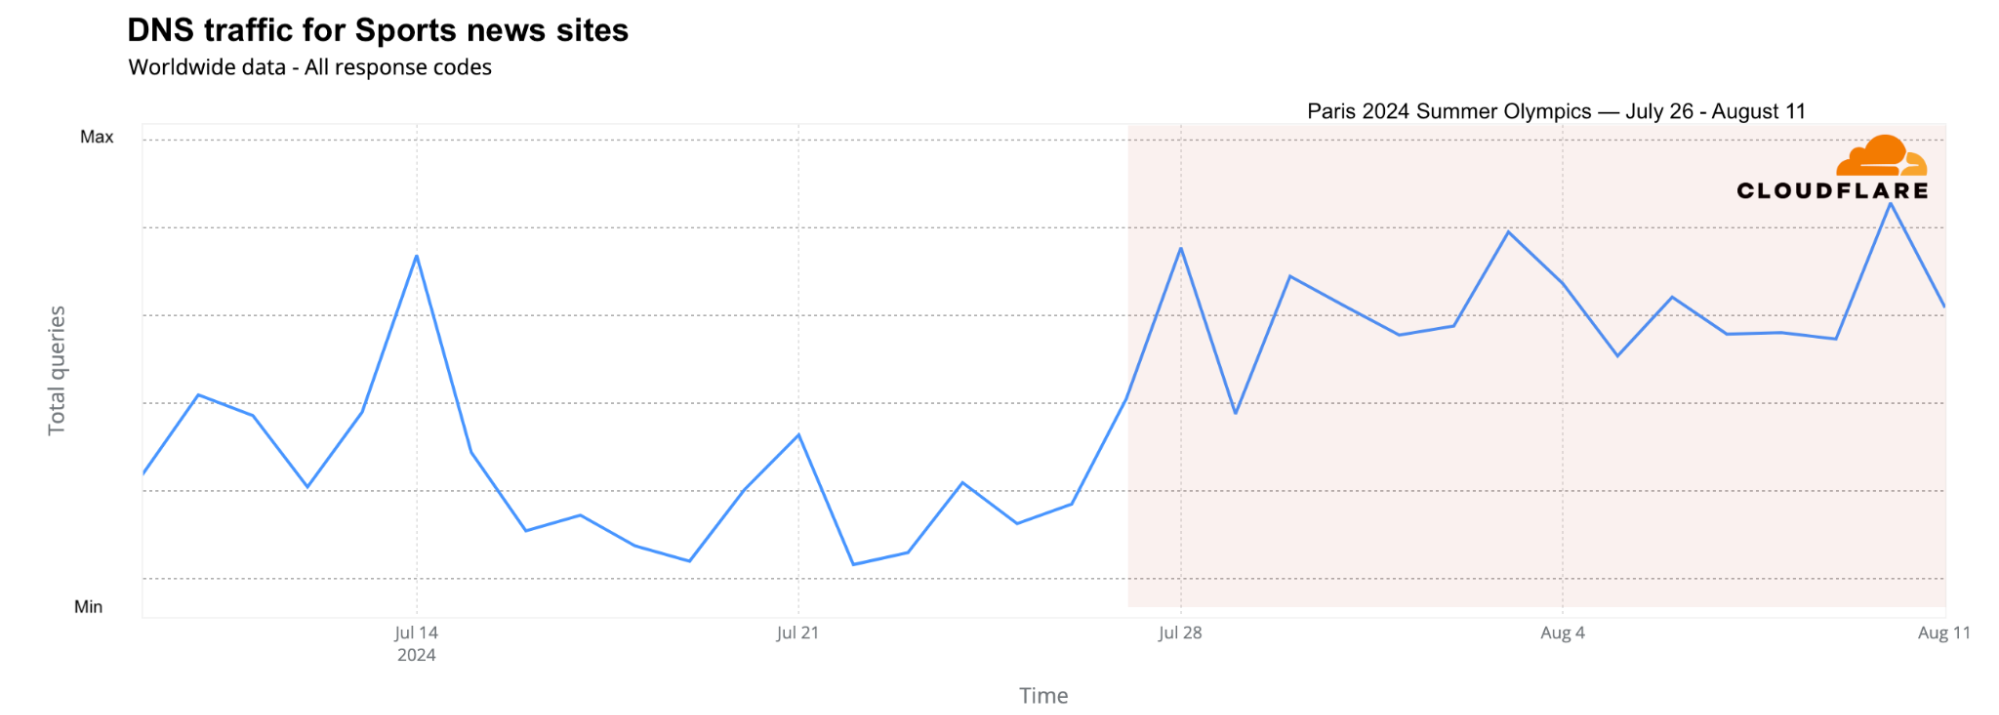
Looking at DNS traffic for sports news sites across different countries, the two weeks of the Olympics brought more traffic than any other week since June, including during the major football event, UEFA Euro 2024, held between June 14 and July 14. The Olympic weeks saw 17% more traffic than the week before the Olympics and 4% more DNS traffic than the best week of Euro 2024 (June 22-29).
From a daily perspective, the days with the highest traffic to sports news sites were August 10, August 3, July 28, and July 14 (related to the Euro 2024 final).
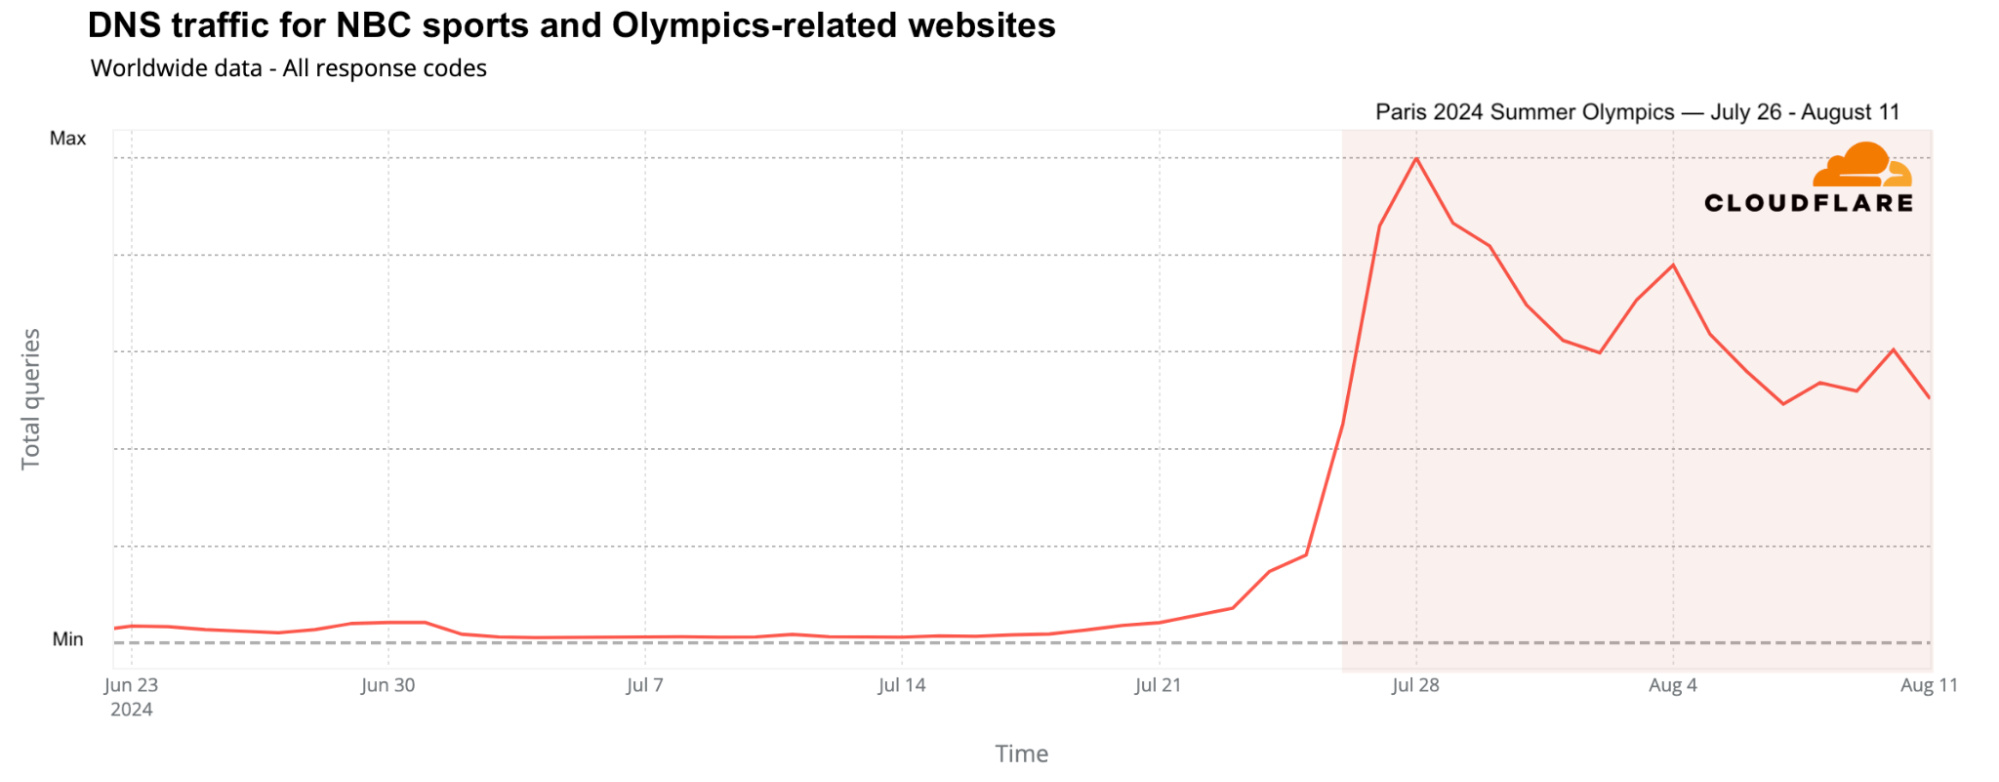
In the United States, NBC was not only the official broadcaster of the Olympics, but also created a dedicated website. NBC’s sports and NBC Olympics websites saw a significant rise in global DNS traffic, increasing up to 1,640% on July 28 compared to the previous week.
From official streaming services to Olympic sponsors
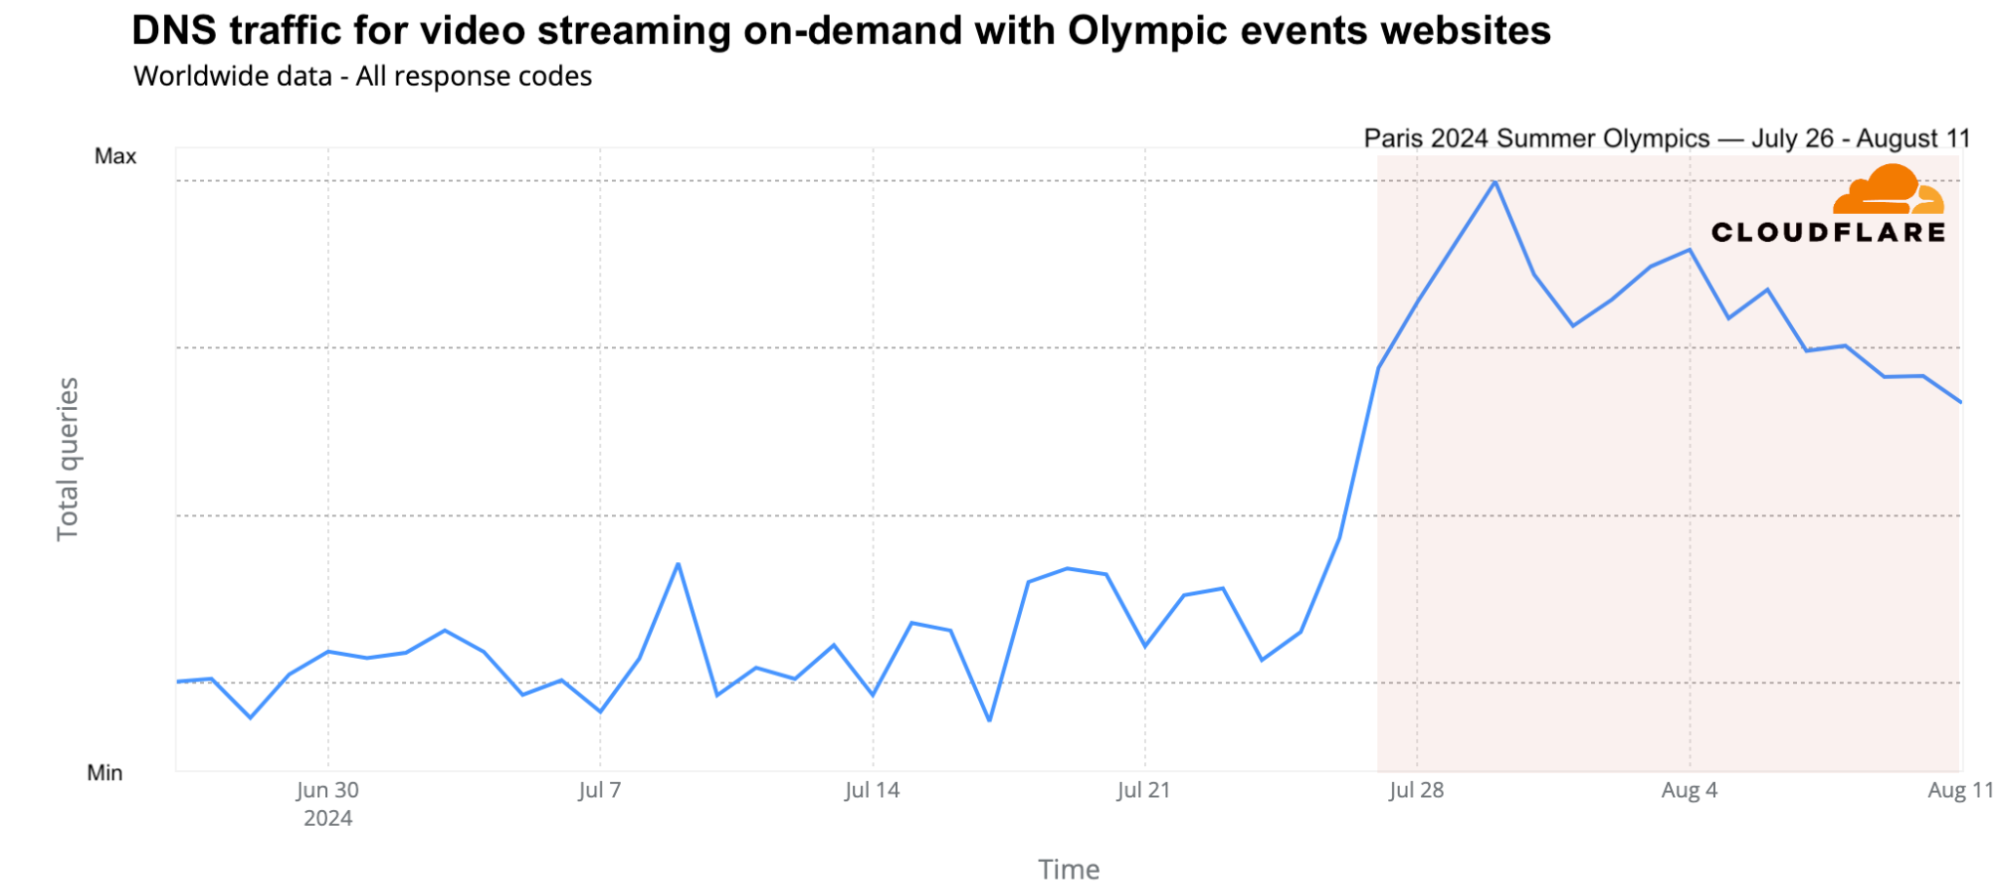
While the Olympics were still broadcast on several traditional national TV networks, streaming also played a key role, with Peacock TV (in the US and Canada) and Max (from Warner Bros. Discovery) in Europe offering several hours of Olympic content daily. The global traffic growth to these platforms was evident. On a weekly basis, DNS request traffic for streaming platforms featuring Olympic events grew by as much as 65%. Daily traffic peaked on July 30 (68% higher than the previous week), followed by July 29 and August 4. Peacock TV led over Max in terms of traffic.
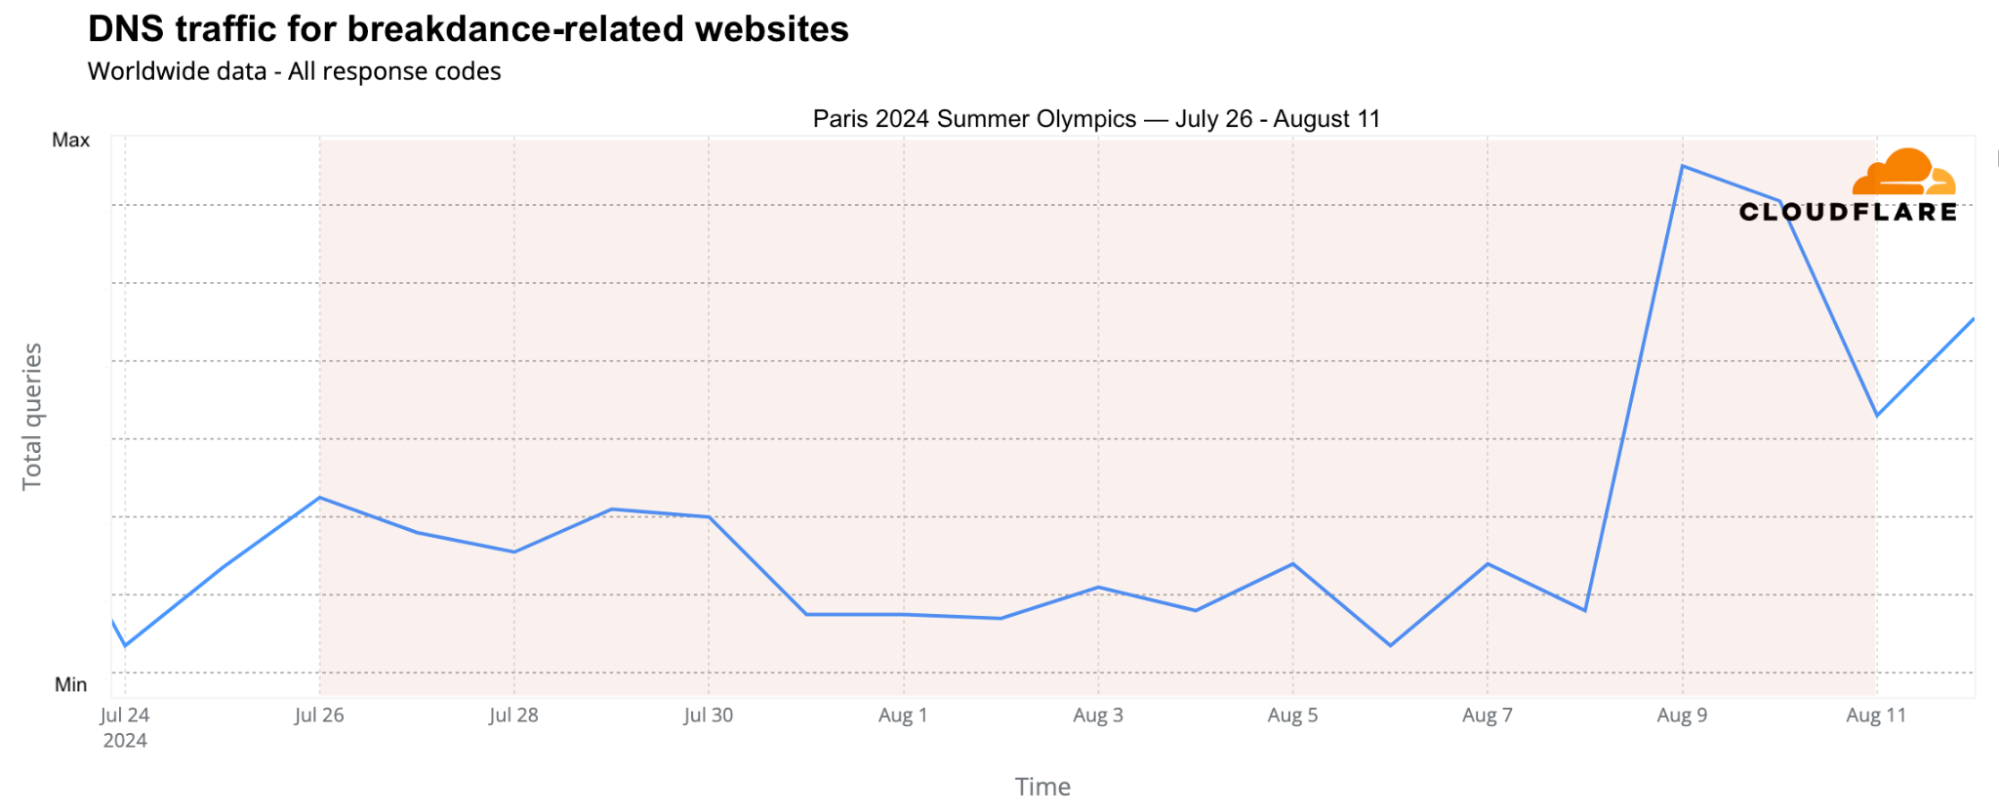
Breakdancing, or “breaking,” made its first appearance in the 2024 Summer Olympics, leading to a surge in DNS traffic to breaking-related websites, particularly on August 9 and 10. Traffic peaked on August 9, with a 215% increase compared to the previous week, driven by viral moments like Australian Rachael Gunn’s performance.
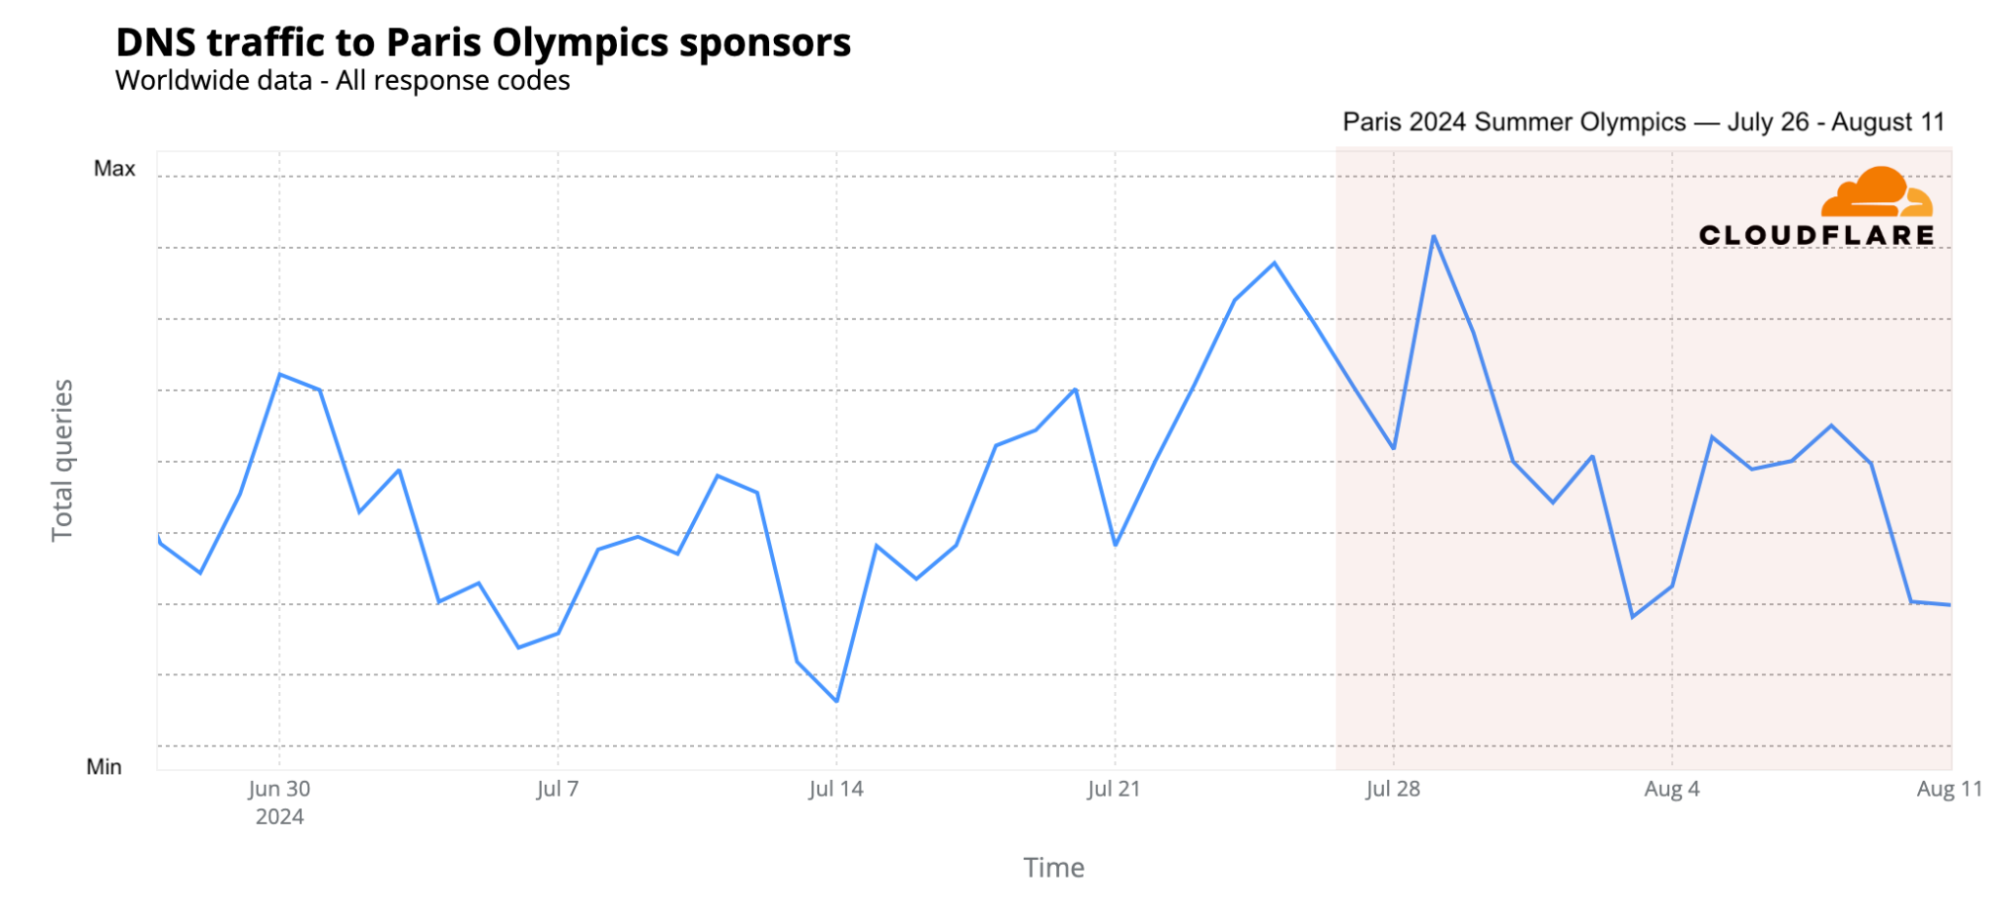
How about the Paris Olympics sponsors? DNS traffic also increased, particularly in the early days of the event and the days leading up to it, with peak traffic on July 29 (15% higher than the previous week), followed by July 25 and 24 (the two days before the opening ceremony). Samsung saw the most significant impact during the early days of the Olympics, while Airbnb experienced a surge in traffic just before the opening ceremony (July 25).
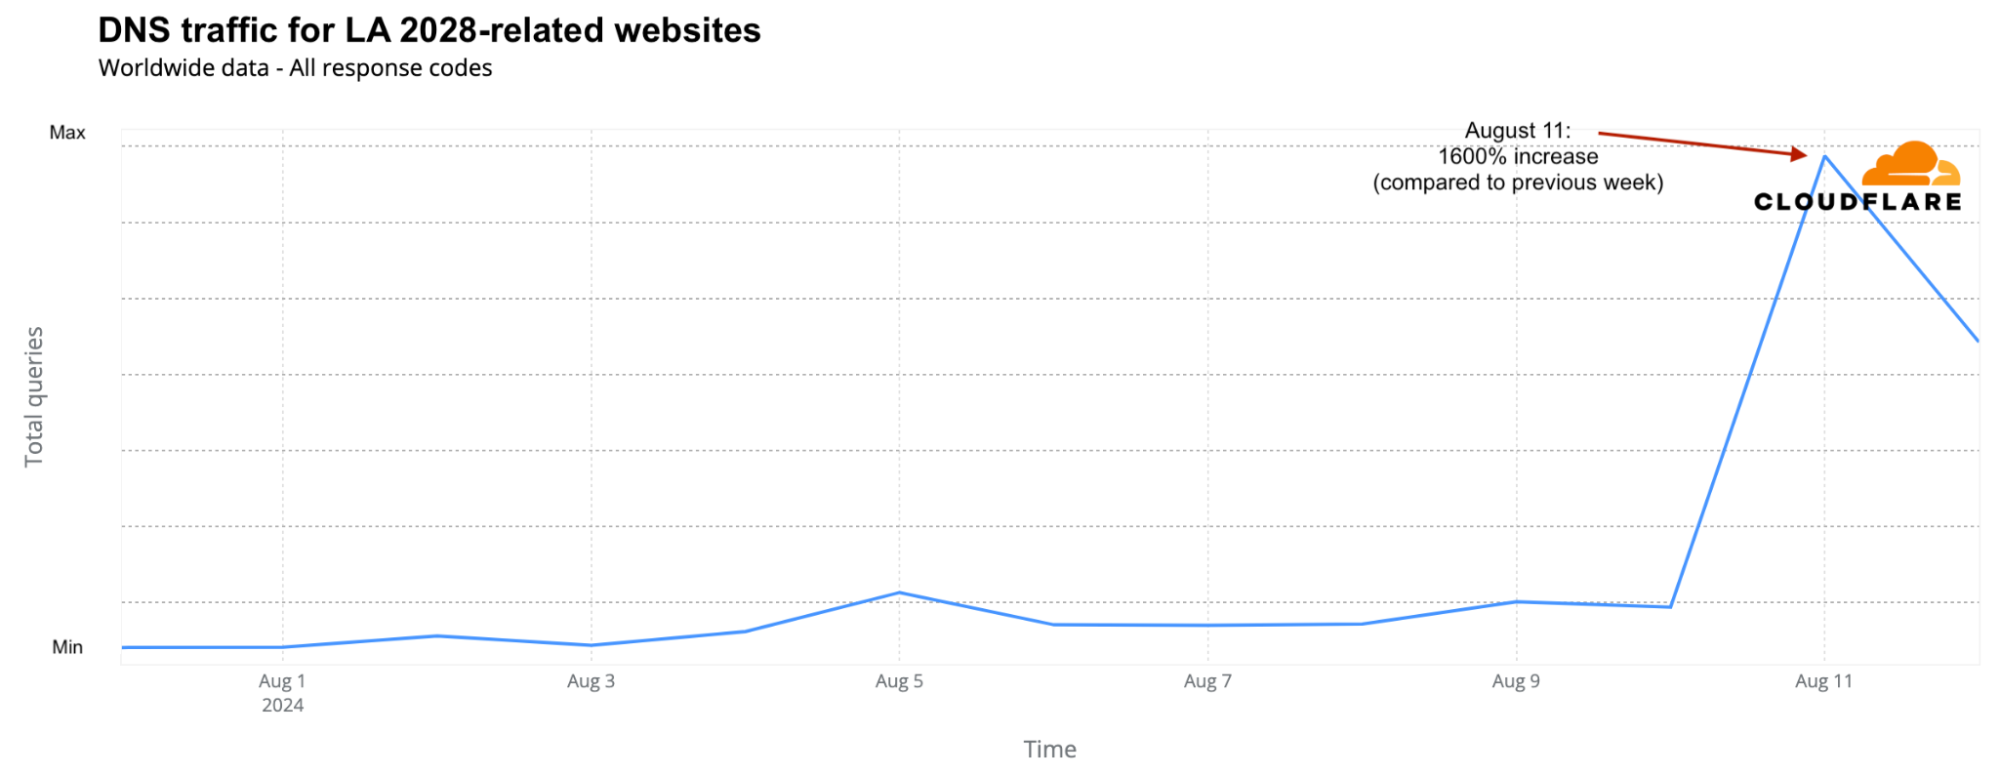
Next stop: LA 2028
The closing ceremony concluded with a symbolic passing of the torch from Paris 2024 to Los Angeles 2028. Simone Biles handed the Olympic flag to Tom Cruise, who transported it Mission Impossible-style from Paris to a Venice Beach concert in LA featuring acts including the Red Hot Chili Peppers and Billie Eilish. Unsurprisingly, the official LA 2028 Olympics website saw a 1600% surge in DNS traffic on August 11 compared to the previous week.
DDoS attacks targeting Olympic-related and sponsor websites
As we observed during the 2024 elections, including the French elections, political parties are not the only targets of DDoS (Distributed Denial of Service) attacks during significant events. Attackers are aware of large global events. In a previous related blog post, we discussed attacks targeting French transportation and government websites. Below, let’s focus on Olympic-related and sponsor organizations.
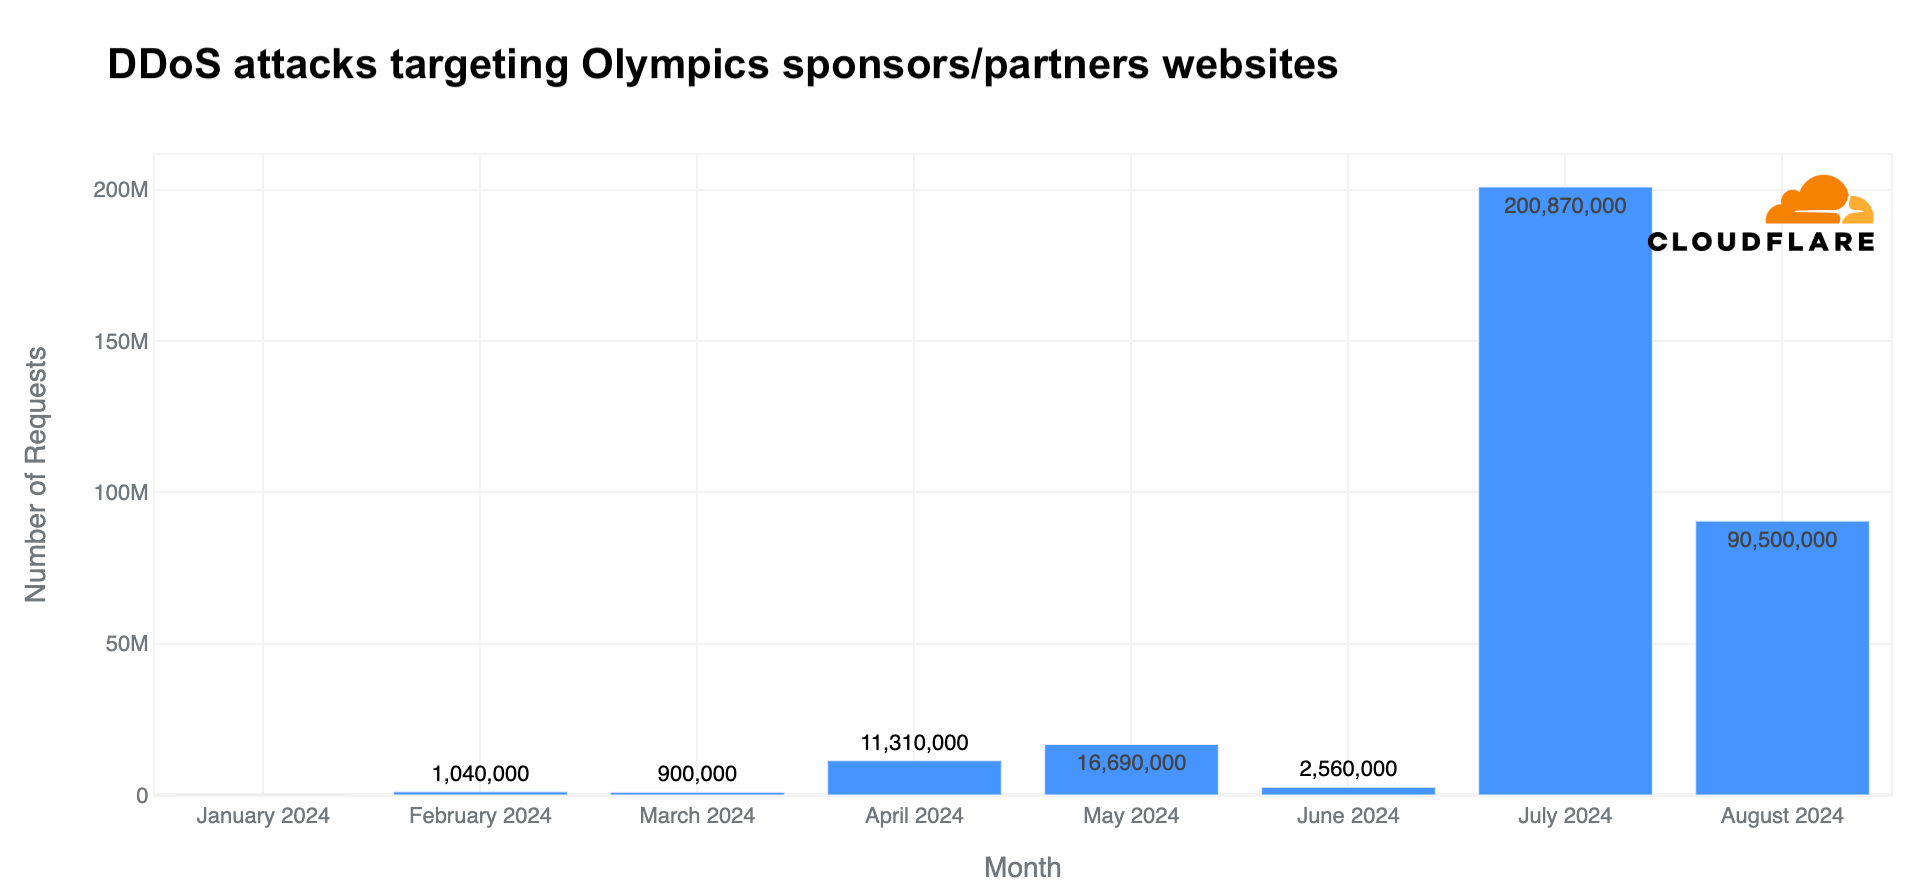
In July, Cloudflare blocked a surge in DDoS attacks on Olympic partner websites – higher than in any other month of 2024. Daily DDoS attack requests jumped to 200 million, and in just 11 days of August, more DDoS requests (90 million) were blocked than in any full month in 2024 before the Olympics.
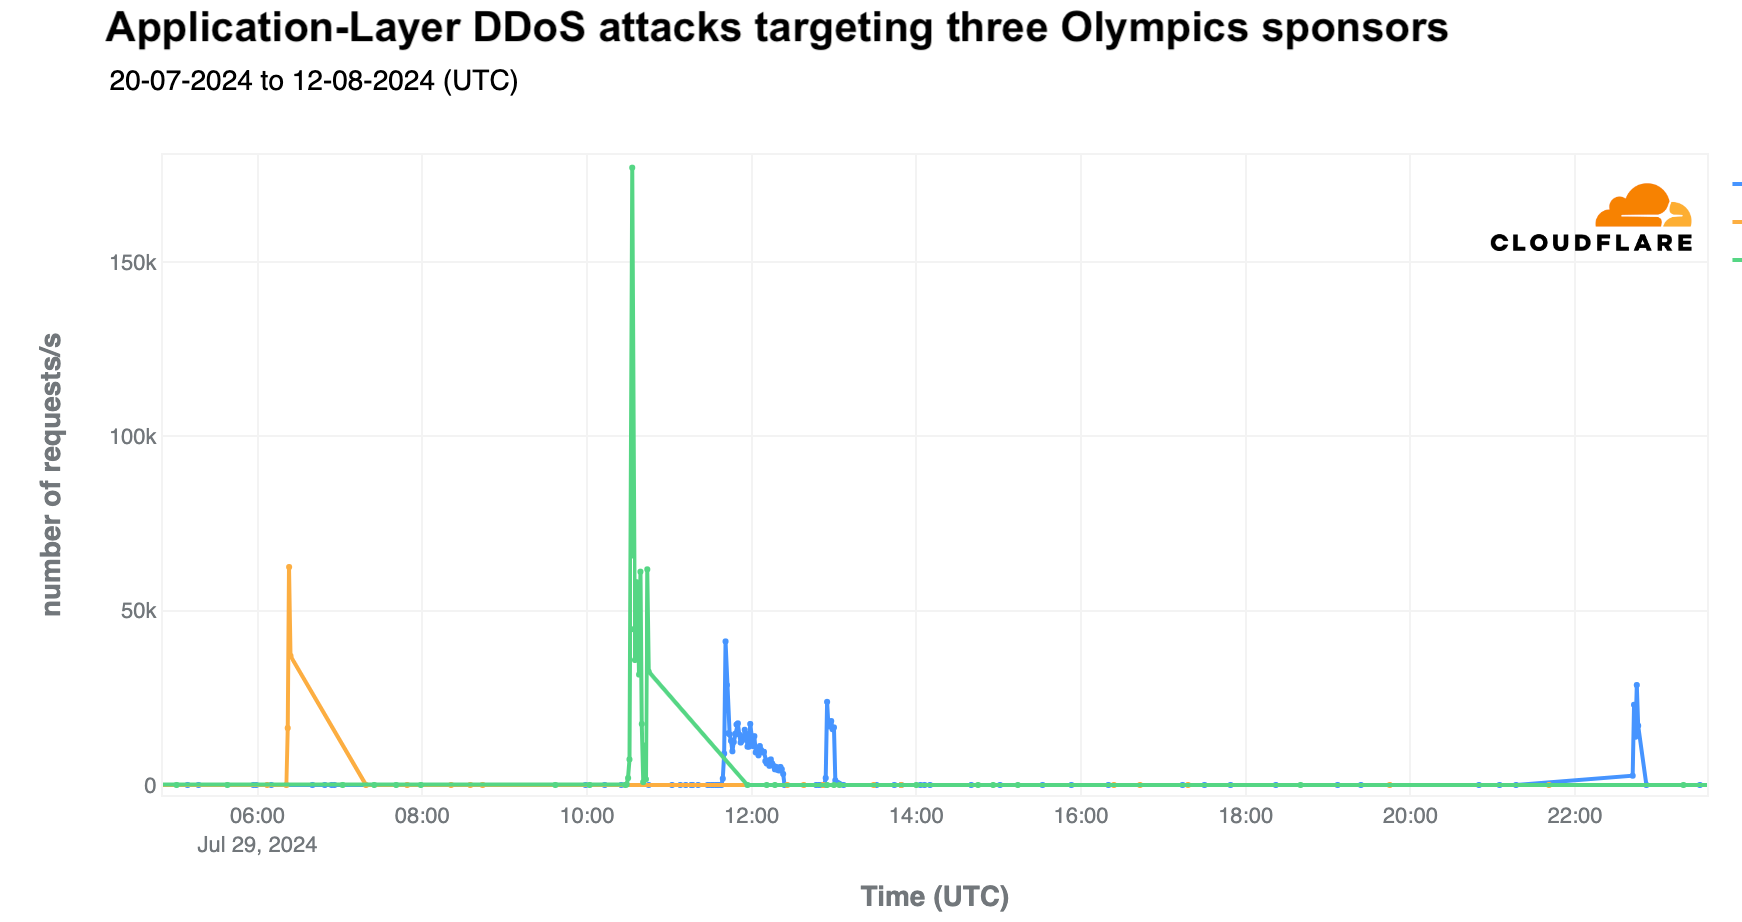
The largest spike in attacks occurred on July 29, targeting three sponsor websites simultaneously, with 84 million DDoS-related requests in a single day. The most intense DDoS attack peaked at 190,000 requests per second at 10:20 UTC.
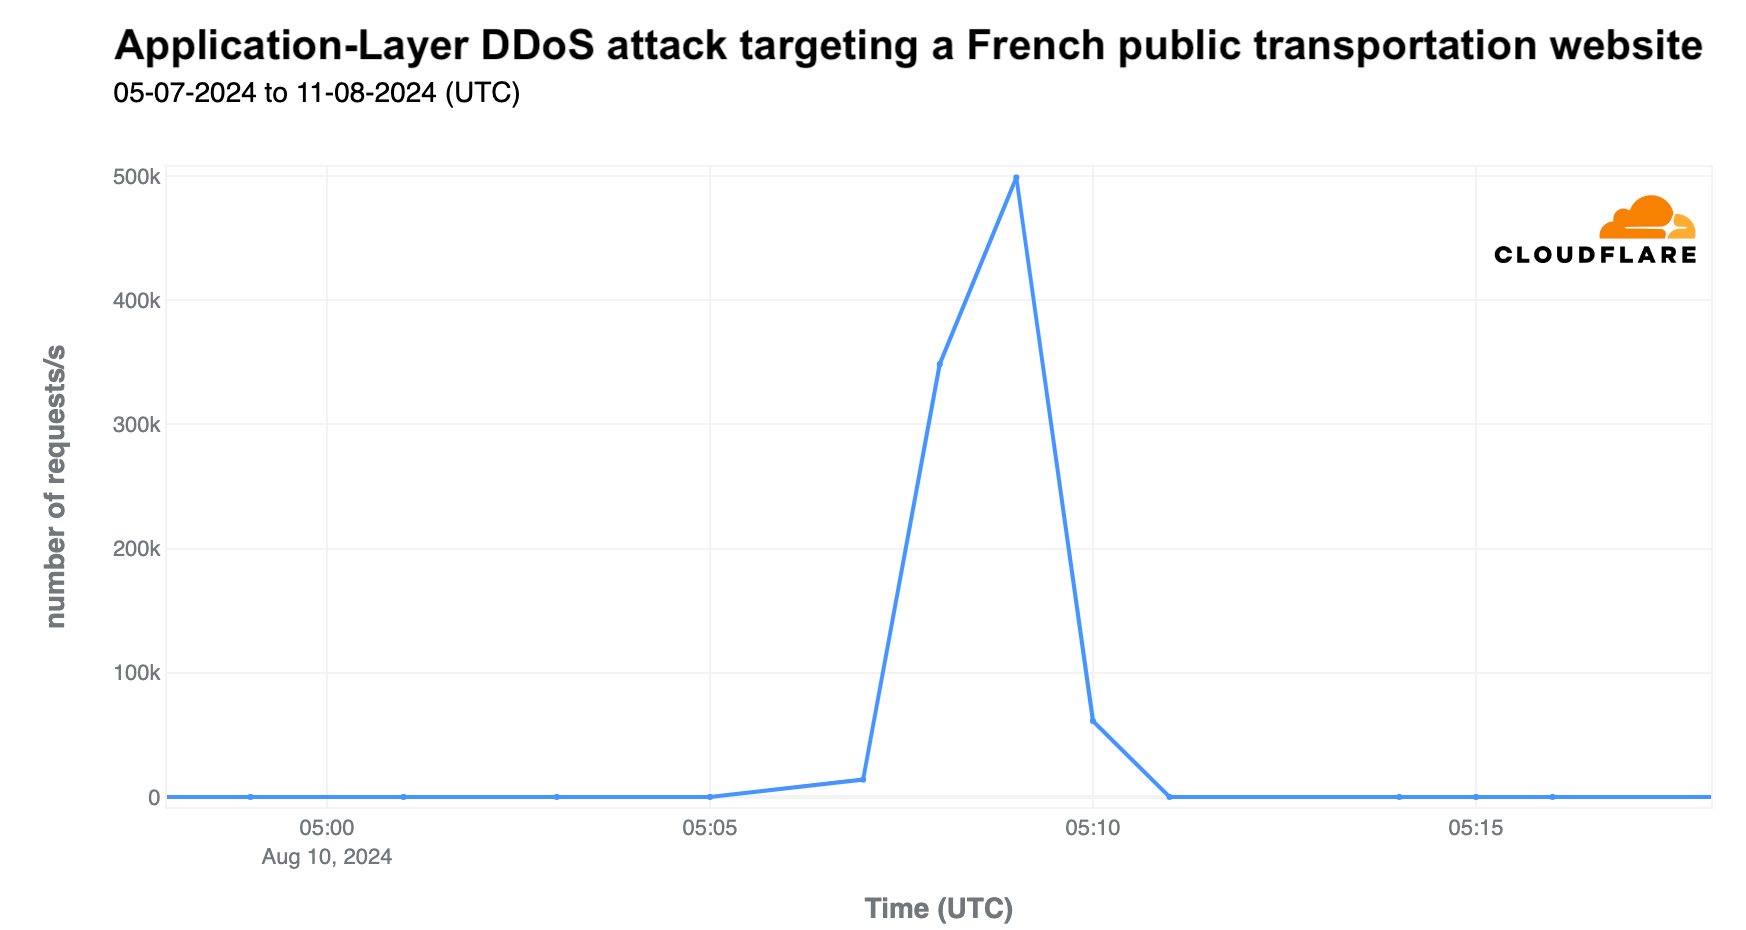
The most significant specific attack was on the last day of the event, August 11, targeting a French transportation site. It lasted four minutes and peaked at over 500,000 requests per second at 05:09 UTC.
As highlighted in our Q2 DDoS report, most DDoS attacks are short-lived, as seen in the two mentioned attacks. While a 500,000 request per second (rps) attack is not large for Cloudflare, it can be devastating for websites not equipped to handle such traffic levels.
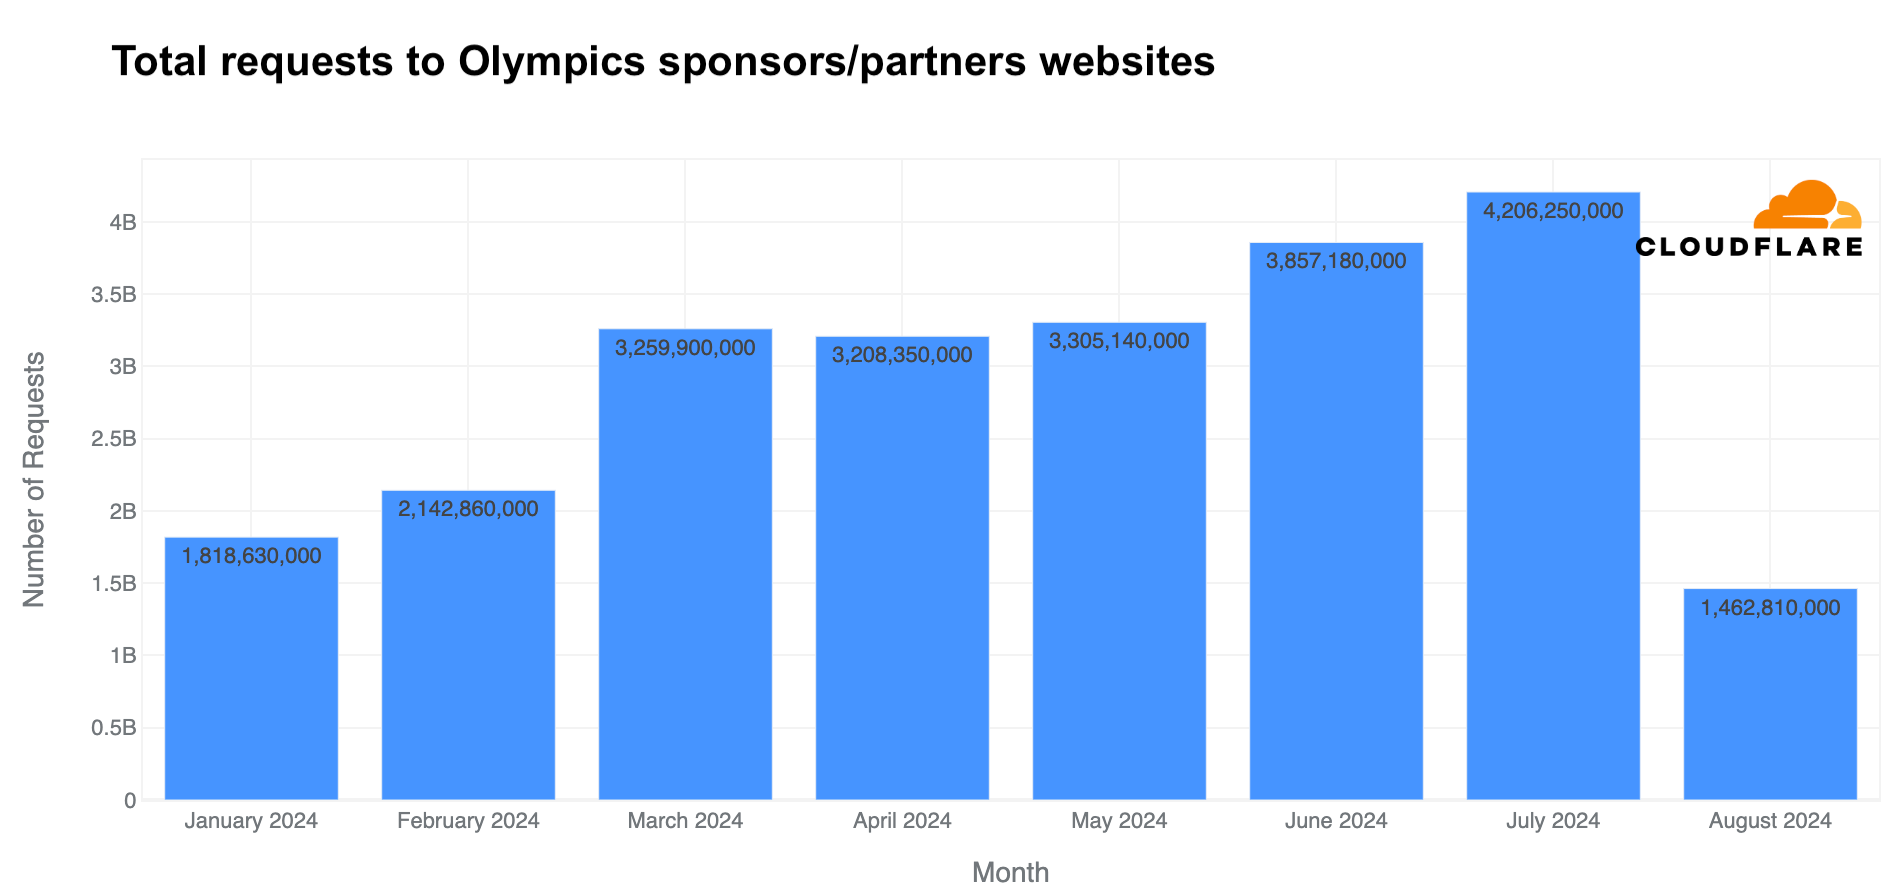
Analyzing the same pool of Olympic partner websites that use Cloudflare, total requests (including legitimate traffic and attacks) rose in July, reaching 4.2 billion—27% more than in May and 11% more than in June.
Rise in “Olympics” and “Paris 2024” emails
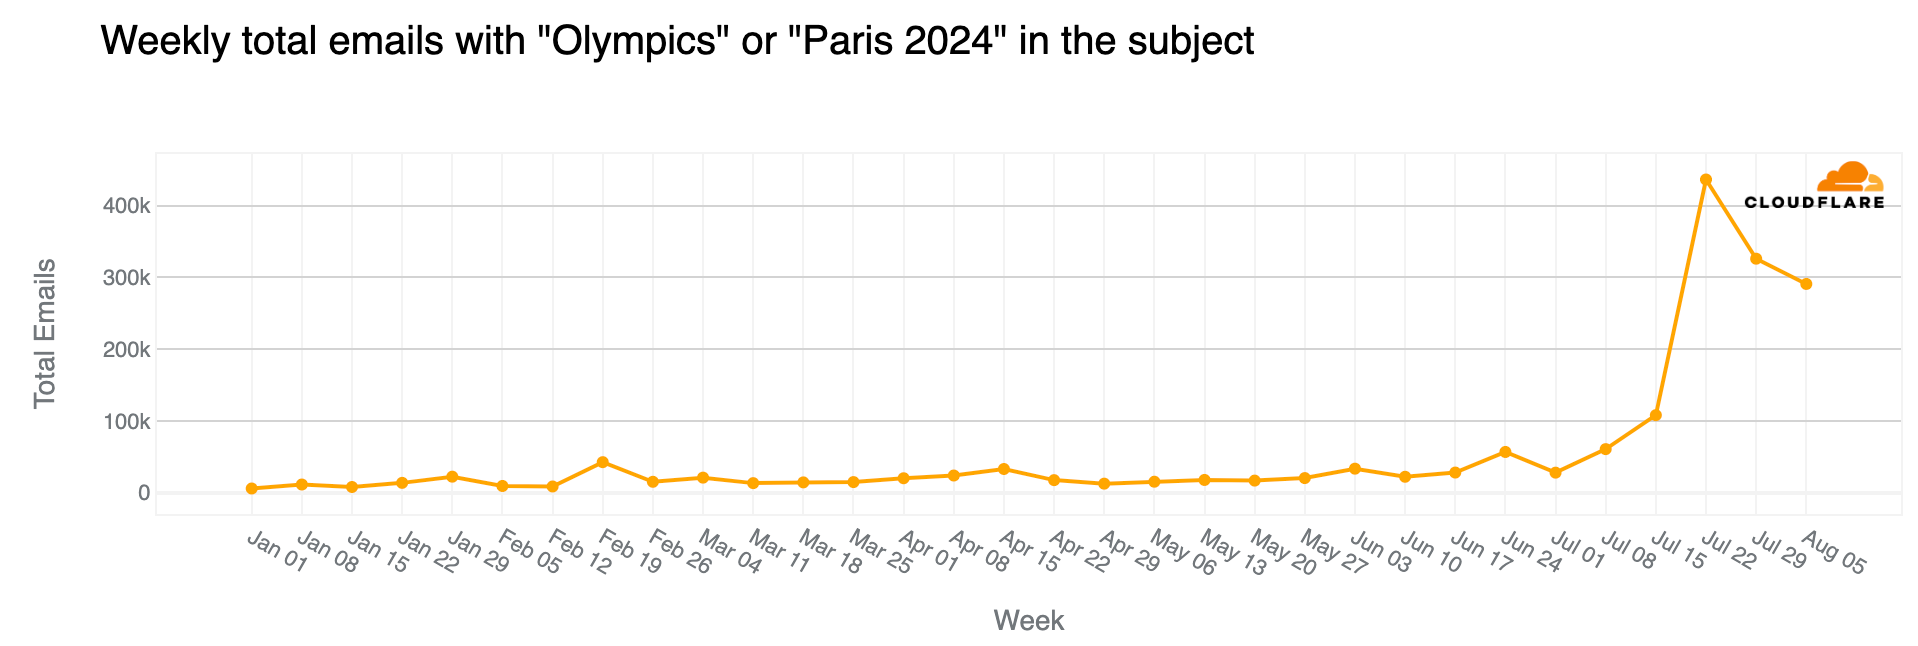
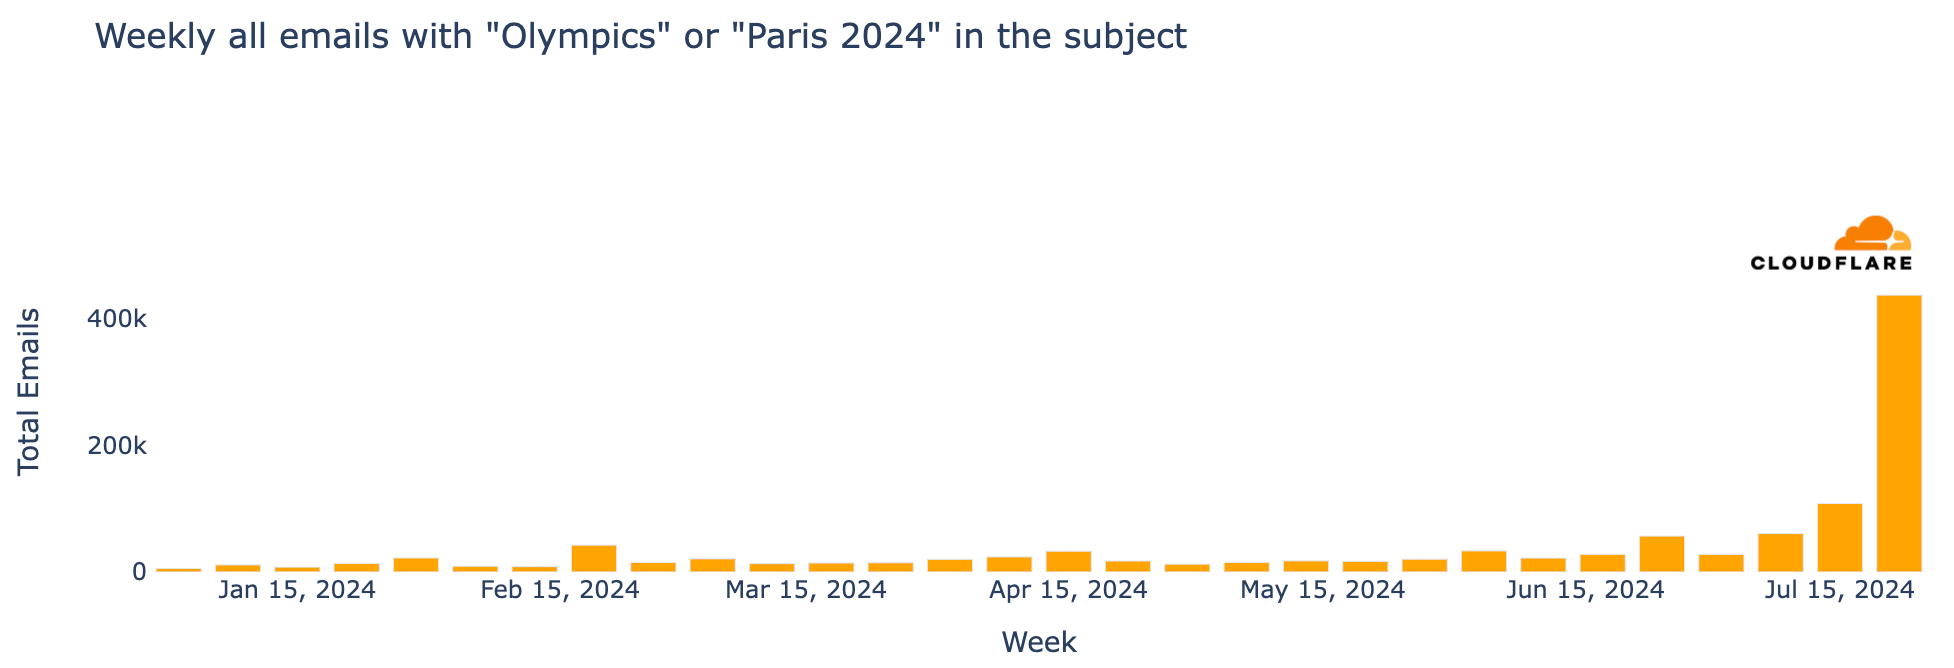
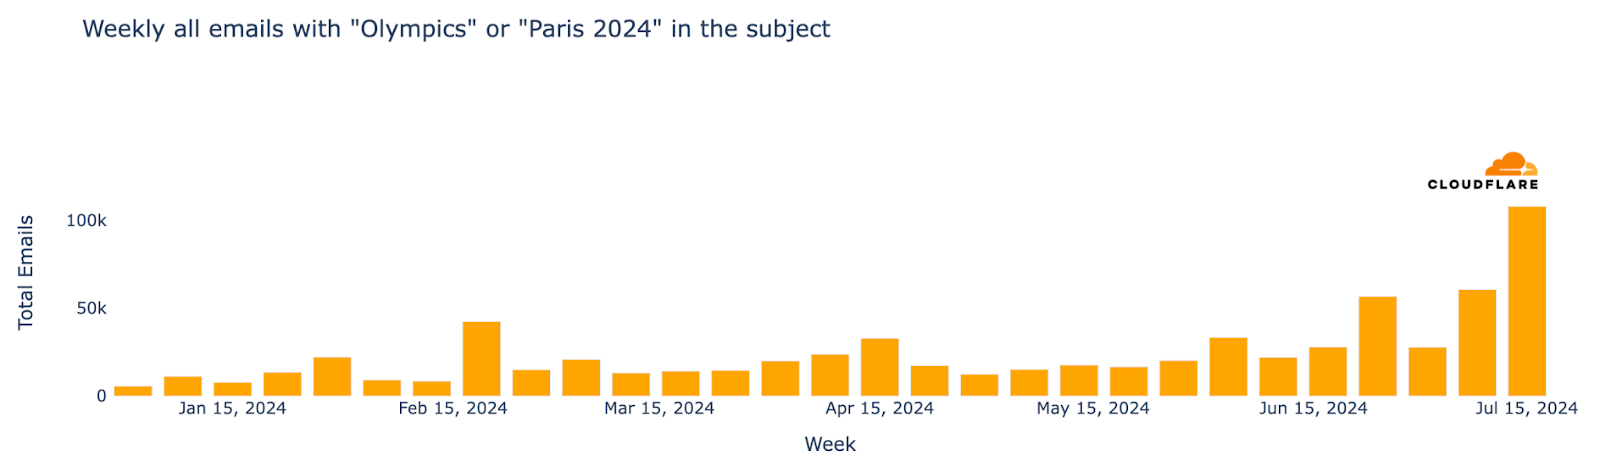
Major events often attract attention in the email realm, including spam and malicious emails, and the Olympics were no exception. From January 2024 through August 11, Cloudflare’s Cloud Email Security service processed over 1.7 million emails containing “Olympics” or “Paris 2024” in the subject. More than half of these emails (890,000) were sent during the Olympics (July 26 to August 11), with the highest volume (150,000 messages) on July 26, the day of the opening ceremony.
The week of July 22-28, coinciding with the first few days of the Olympics, saw a 304% increase in such emails compared to the previous week, and an astonishing 3111% increase compared to the busiest week in January.
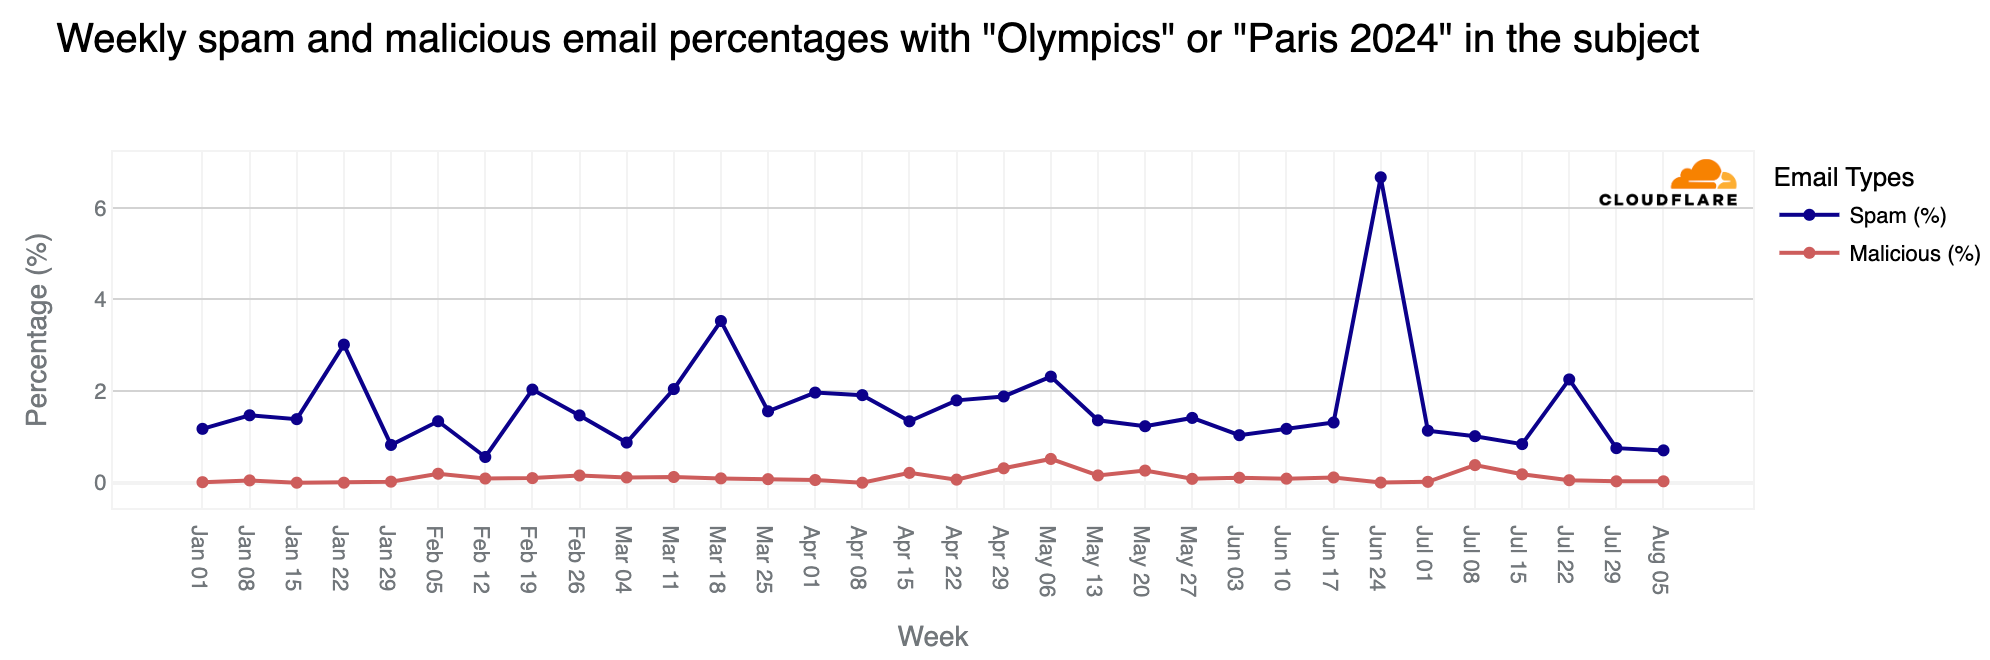
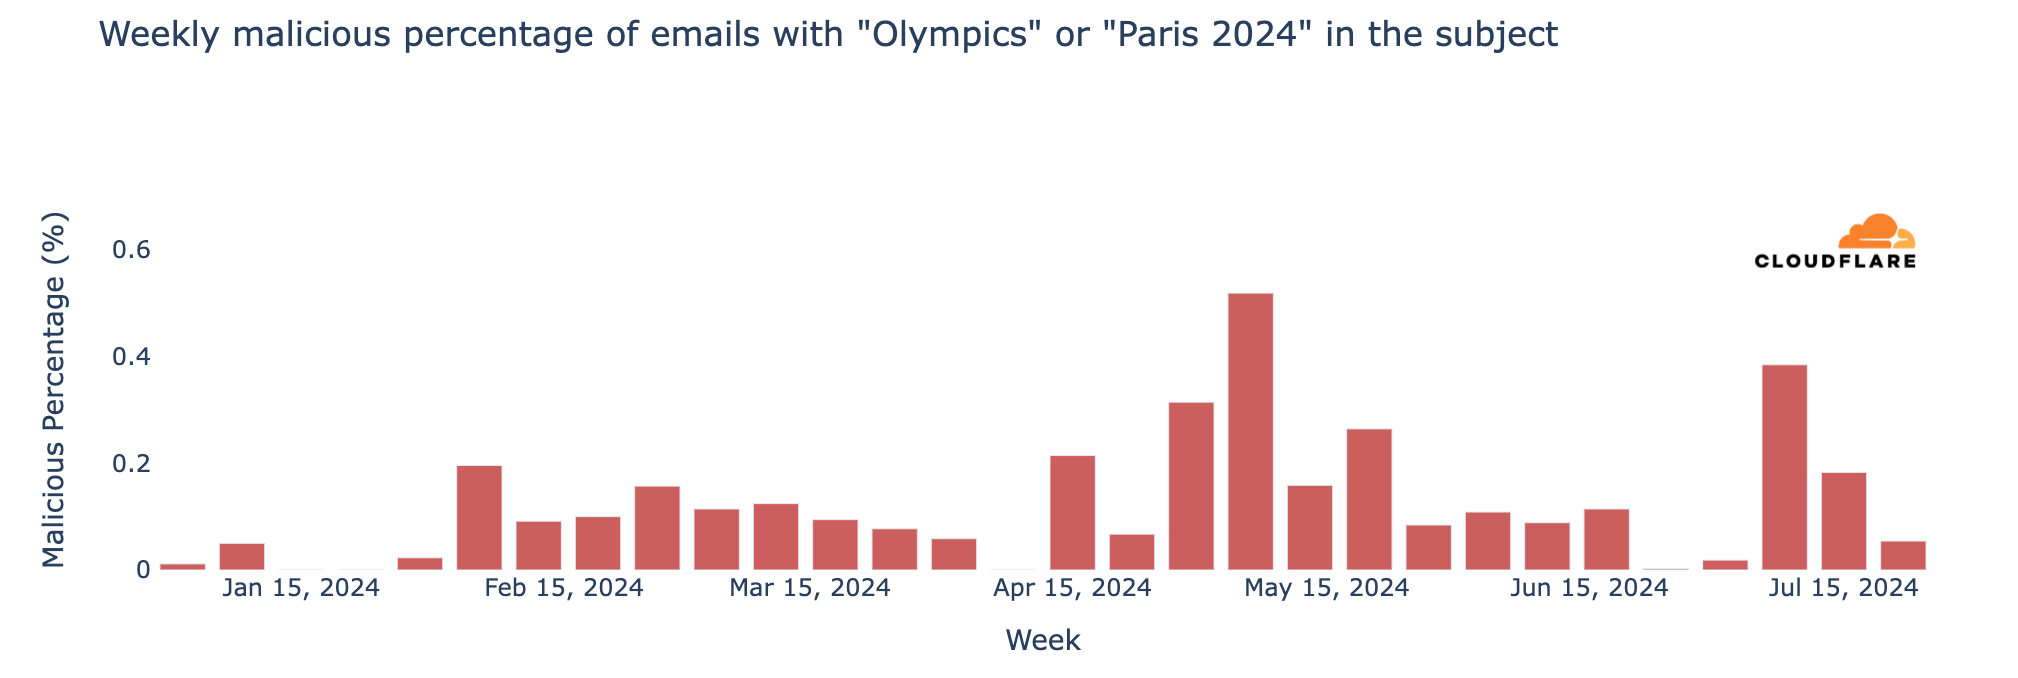
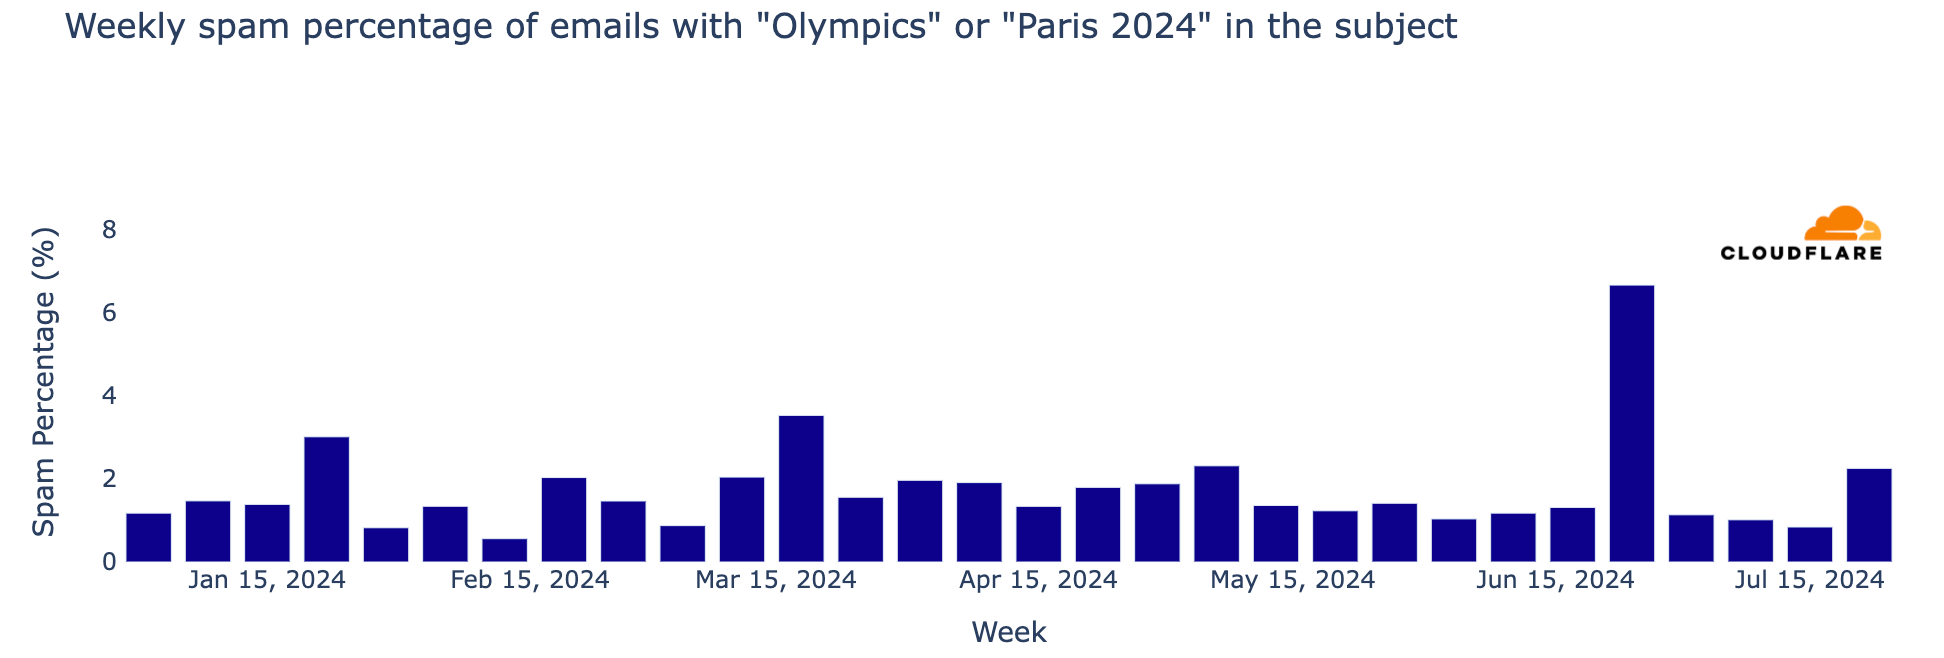
Although the Olympics period (July 26 – August 11) was busy in terms of related emails, the percentages of spam and malicious messages were lower than before. However, over 6,200 emails were classified as spam (0.7%), and just 248 were identified as malicious or phishing (0.07%).
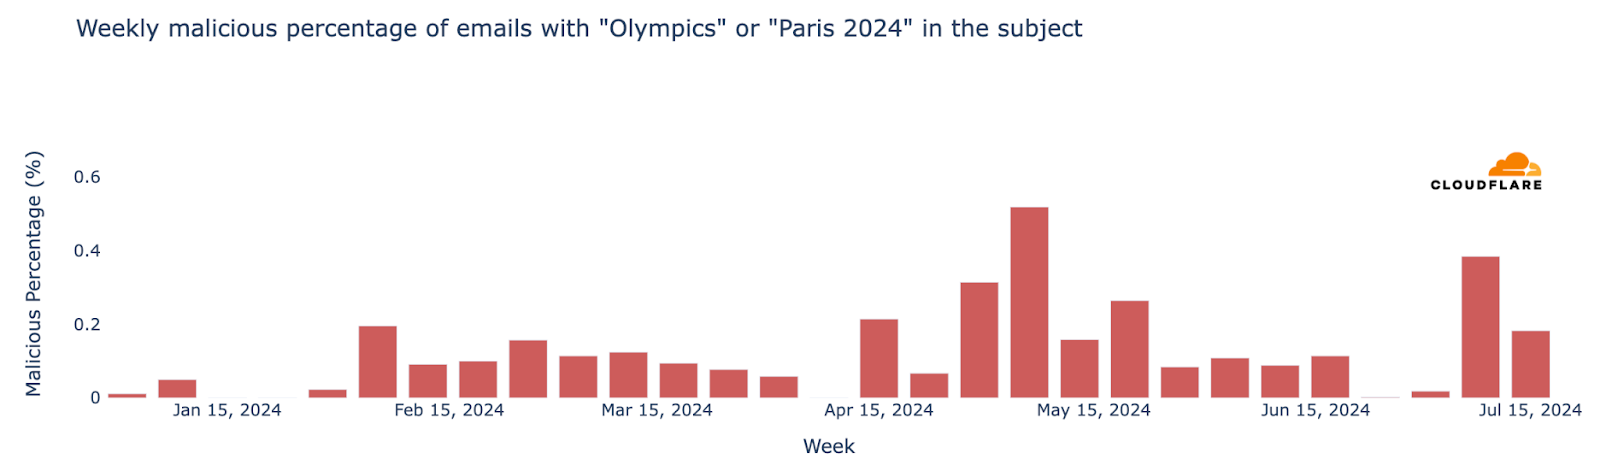
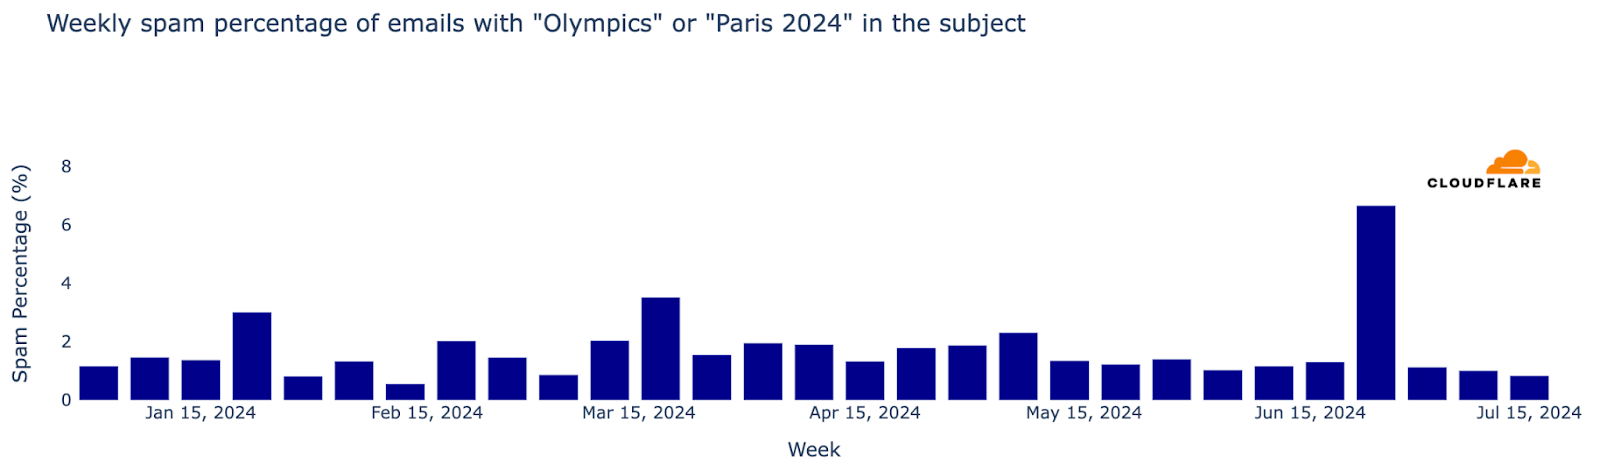
As noted in a previous blog post, since January 1, 2024, spam accounted for 1.3% of all emails with “Olympics” or “Paris 2024” in the subject, while malicious emails made up 0.1%. In a sample of 1,000 emails, roughly 13 would be spam and 1 would be malicious. The peak for malicious Olympic-related emails occurred during the week of May 6, with 0.6% classified as malicious. Although there was a decline after this peak, rates increased slightly in July, reaching 0.4% on July 8. Despite the surge in volume during the week of July 22, only 0.05% of emails were malicious.
Simone Biles and Snoop Dogg popular via email
Famous individuals are often used by attackers for email phishing. Among the athletes shining at the event, Simone Biles generated the most emails, but very few of them were spam or malicious. Biles led other popular names during the event, including those named below, ordered by number of email messages: Katie Ledecky (US), Imane Khelif (Algeria), Novak Djokovic (Serbia), Steph Curry (US), and Léon Marchand (France).
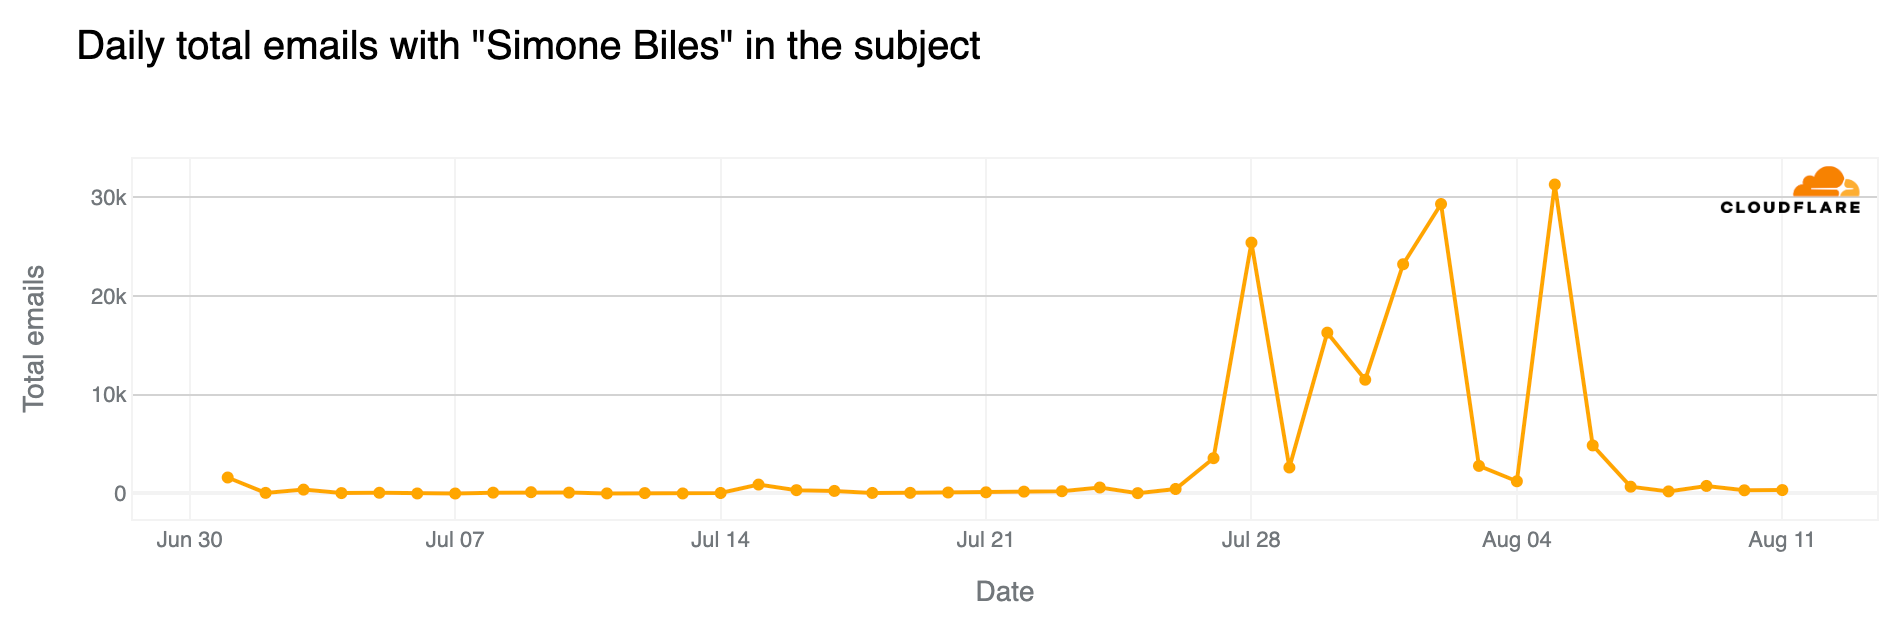
Since July 1, over 160,000 emails processed by Cloudflare’s Cloud Email Security service have included “Simone Biles” or “Biles” in the subject, with only 0.5% considered spam and 0.01% classified as malicious. (And 97% of those 160,000 emails were sent since the Olympics started on July 26.) The most emails were sent on August 5, followed by August 2 and July 28. Spam percentage peaked on July 24, with 5% of all emails considered spam.
Among famous attendees, Snoop Dogg topped the list ahead of other US team supporters like Martha Stewart, Flava Flav, and Jason Kelce. Since July, there have been over 6,600 emails with “Snoop Dogg” in the subject, with 40 classified as spam (0.6%) and 4 as malicious (0.06%).
Conclusion: from Paris to Los Angeles
The Paris 2024 Summer Olympics not only captivated millions worldwide with thrilling sports competitions, but also had a significant impact on global Internet traffic. Our data shows noticeable drops in Internet activity during key Olympic events, particularly in France, as viewers shifted from online activities to watching the games live. This trend underscores the enduring power of broadcast media during major global events, even in an increasingly digital age.
Additionally, the increase in DNS traffic for official Olympic websites and the surge in DNS traffic for streaming platforms covering the event indicates strong interest in online coverage, especially among certain audiences, complementing traditional TV viewership broadcast by national networks worldwide.
Finally, the heightened cybersecurity threats, including DDoS attacks on sponsor sites and the rise in Olympic-related emails (including spam and malicious ones), emphasize both the marketing impact of this global event and its vulnerabilities.
And after the Paris 2024 Summer Olympics, the 2024 Summer Paralympics are just around the corner (August 28-September 8), and in four years, it will be time for LA 2028.
As we’ve observed throughout the Paris 2024 Olympics, the Olympic spirit continues to capture interest and remains relevant across different media. This spirit, present for 2,800 years since Ancient Greece (dating back to 776 BC), still attracts and inspires humanity.
(Jorge Pacheco from the Cloudflare Radar team contributed to this blog post)
The Paris 2024 Summer Olympics, themed “Games Wide Open” (“Ouvrons grand les Jeux”), kicked off on Friday, July 26, 2024, and will run until August 11. A total of 10,714 athletes from 204 nations, including individual and refugee teams, will compete in 329 events across 32 sports. This blog post focuses on the opening ceremony and the initial days of the event, examining associated impact on Internet traffic, especially in France, the popularity of Olympic websites by country, and the rise in Olympics-related spam and malicious emails.
Cloudflare has a global presence with data centers in over 320 cities, supporting millions of customers, which provides a global view of what’s happening on the Internet. This is helpful for improving security, privacy, efficiency, and speed, but also for observing Internet disruptions and traffic trends.
We are closely monitoring the event through our 2024 Olympics report on Cloudflare Radar and will provide updates on significant Internet trends as they develop.
An opening ceremony to remember
For the first time in modern Olympic history, the opening ceremony was held outside a stadium, lasting nearly four hours and clearly impacting Internet traffic in France. The nation’s engagement was evident during the TV broadcast, leading to noticeable traffic drops similar to those observed during Euro 2024 – we’ve seen that national TV broadcast events usually come with drops in Internet traffic.
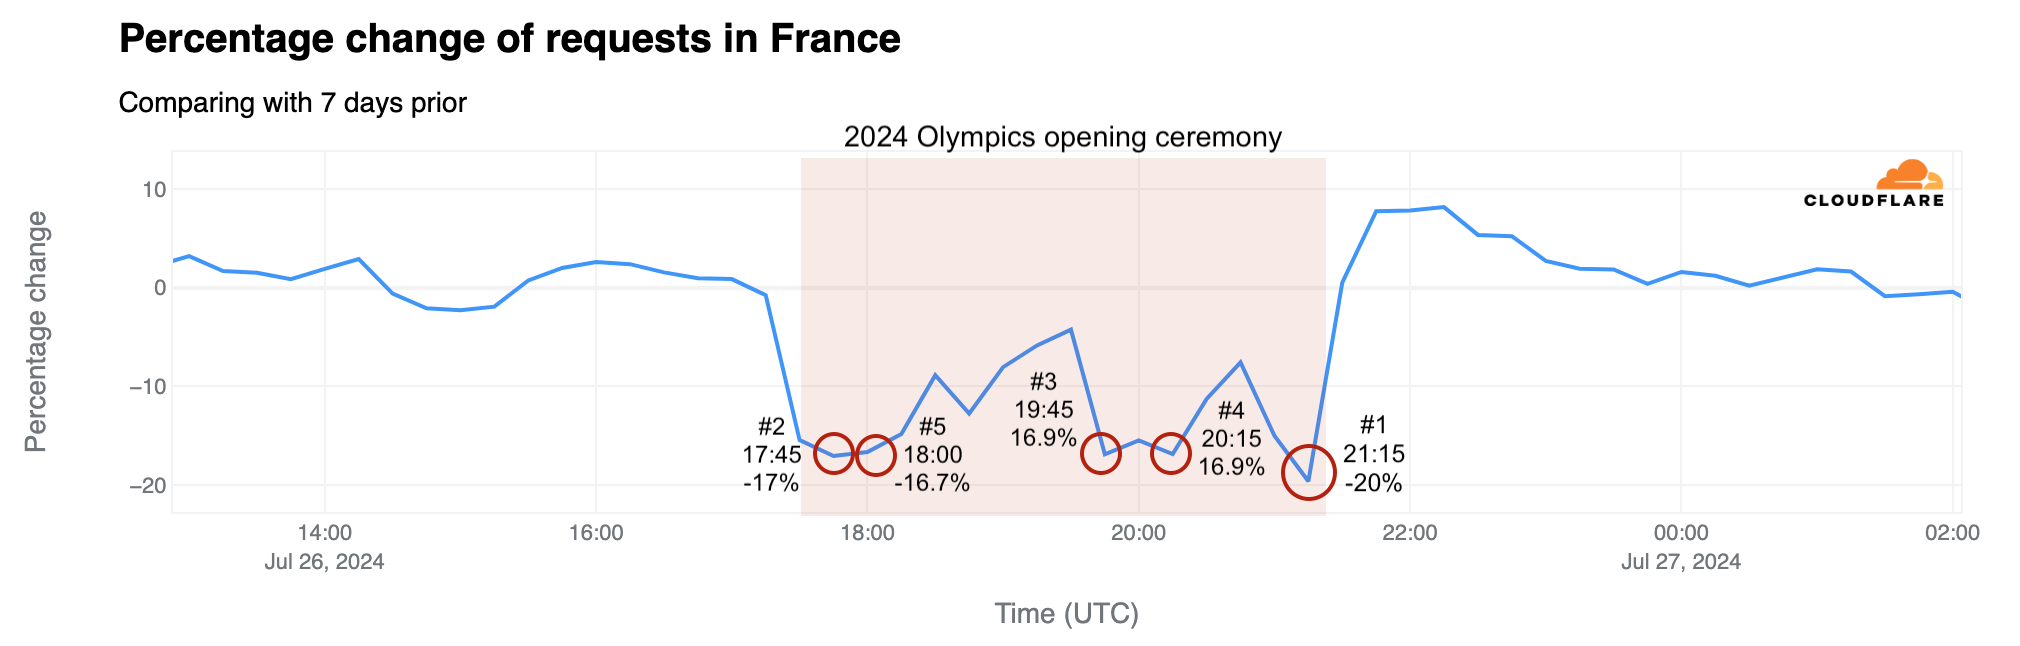
The Olympics are more than just sporting events – they are filled with inspiring moments and stories that capture global attention in real time, and create stories that live on. Significant traffic dips during the ceremony coincided with performances by Celine Dion and Lady Gaga, the lighting of the Olympic cauldron, and John Lennon’s “Imagine” performed by Juliette Armanet. Here is a breakdown of the top five traffic drops compared to the previous week that occurred during the ceremony, detailing the events occurring at those times. Our data provides insights with 15-minute granularity.
Moments of the ceremony by traffic drop
Time of drop (UTC)
Drop %
Events at the time
#1
~21:15
-20%
The Olympic cauldron is lit and floats into the Paris sky via air balloon; Celine Dion serenades Paris from the Eiffel Tower.
#2
~17:45
-17%
Lady Gaga sings the French classic “Mon truc en plumes” by Zizi Jeanmaire.
#3
~19:45
-16.9%
Team USA boat takes to the river, followed by Team France – the last boat en route to the Eiffel Tower.
#4
~20:15
-16.9%
Dionysus performs the song “Naked” (Philippe Katerine); John Lennon’s “Imagine” is sung from the middle of the Seine by Juliette Armanet; a metal horse rides down the river.
#5
~18:00
-16.7%
As the boats continue along the Seine, around 80 artists from the Moulin Rouge perform the famous French cabaret dance, the can-can.
During the opening ceremony on July 26, between 17:30 to 21:20 UTC, traffic in France was noticeably lower than the previous week, with losses between 15% and 20%. However, there were moments with smaller drops. For example, at 19:30 UTC, traffic only fell by 4% during the middle of the boat parade of athletes on the Seine River. Right after the event, at 21:45 UTC, traffic increased by as much as 8% compared to the previous week.
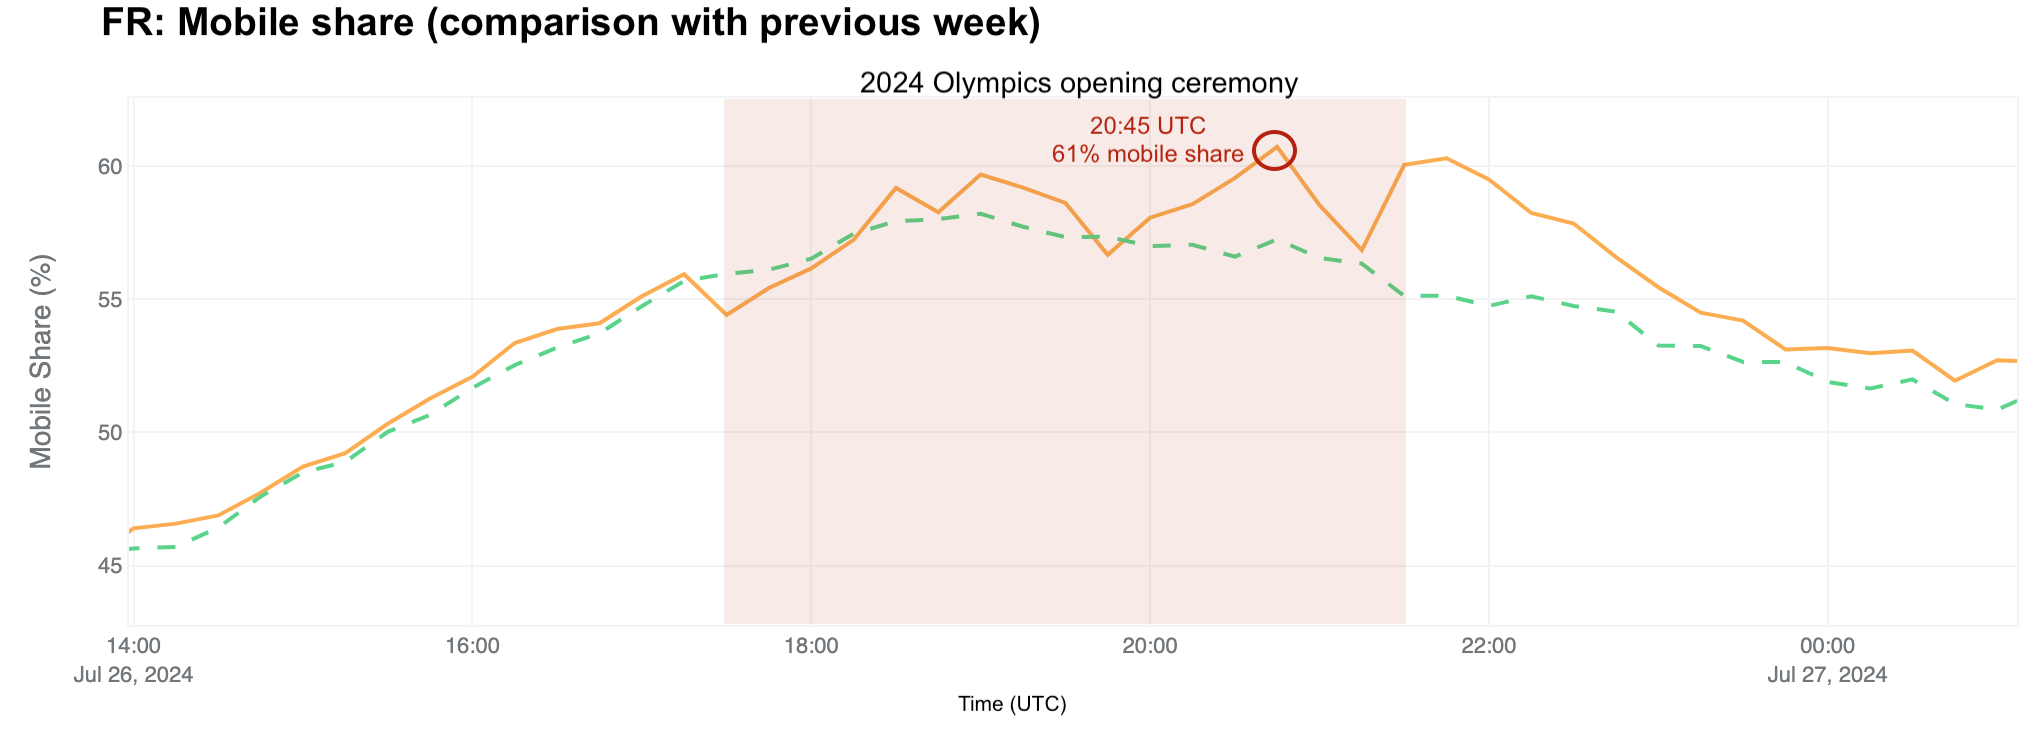
The opening ceremony also resulted in a higher mobile share of traffic than usual in France. At 20:45 UTC, close to the end of the ceremony, the mobile share of Internet traffic was 61%, up from 57% the previous week.
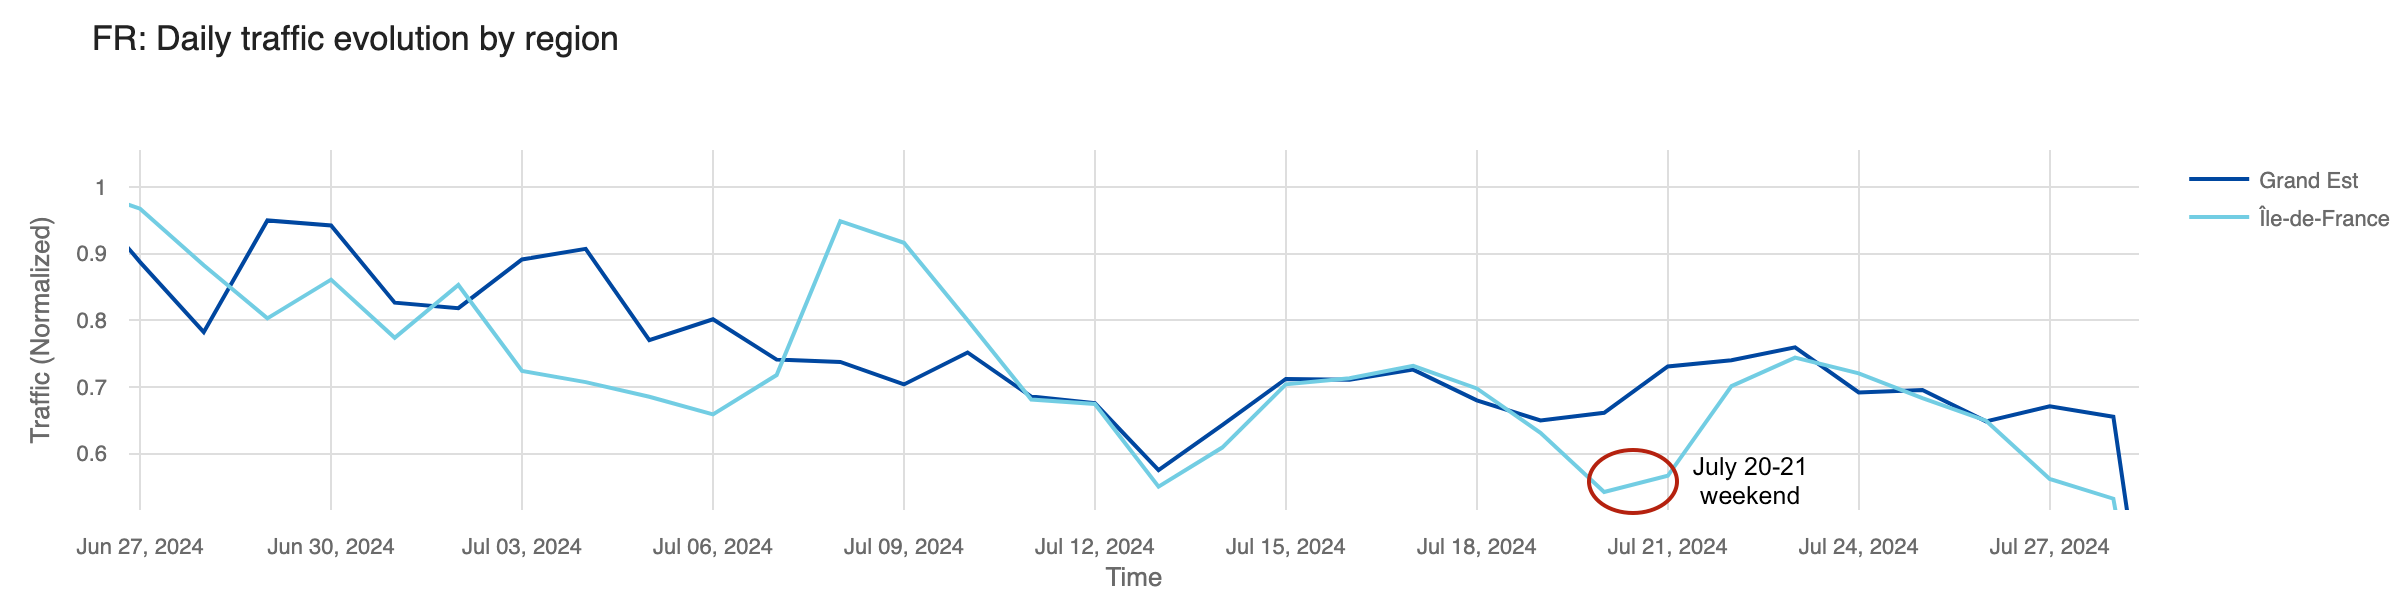
Parisians leaving town before the Olympics
With the Olympics in Paris, many locals left the city, either for vacations or quieter places, while tourists arrived for the games. Our data shows that two French regions, Île-de-France, where Paris is located, and Grand Est, east of Paris, experienced the most significant traffic drops. The chart below illustrates daily traffic to these regions, with a noticeable decline visible during the weekend before the Olympics in Île-de-France.
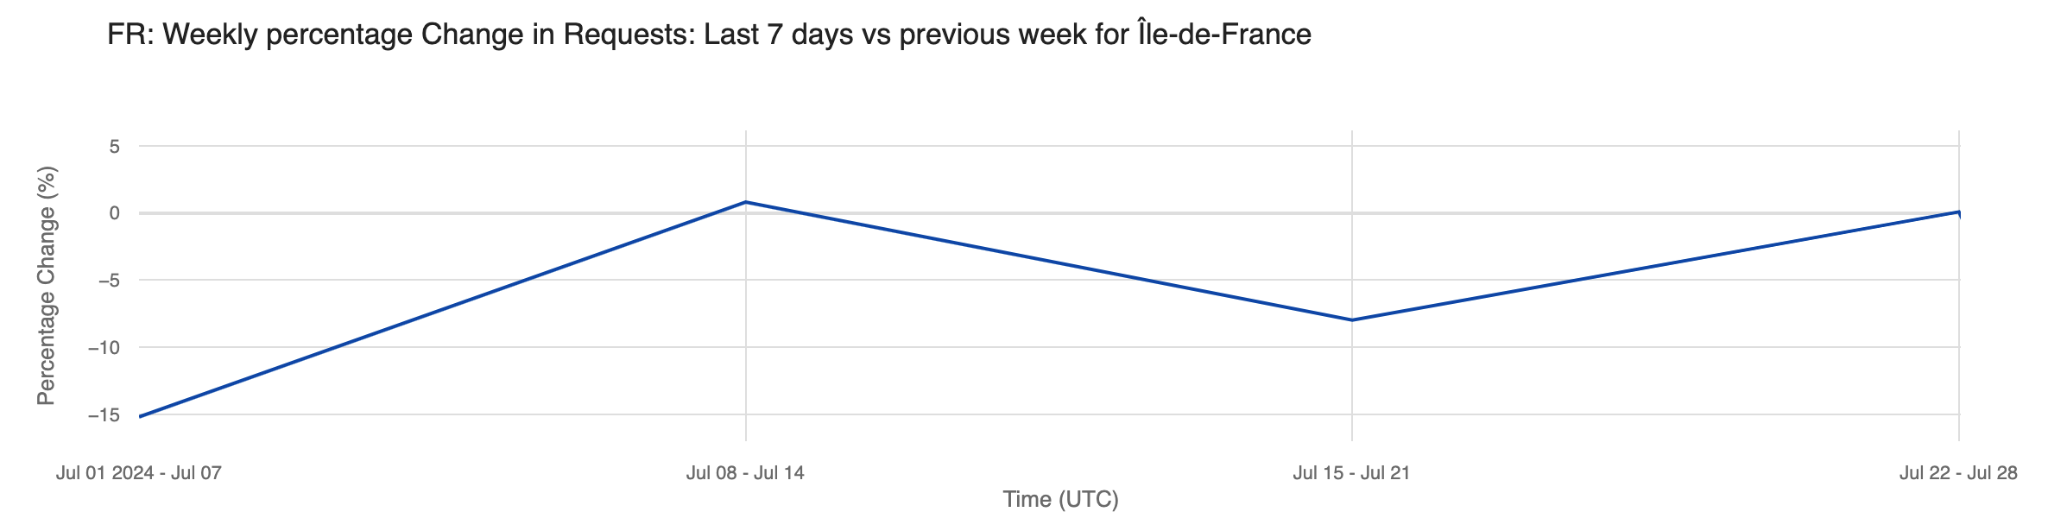
Analyzing the percentage change in request traffic from the previous week, Île-de-France saw its largest drops in the first week of July (July 1-7), with a 15% decrease, and the week before the Olympics started, with an 8% decrease. Interestingly, there was no percentage change in traffic during the week of the Olympics (July 22-28) – that was also the week when most visitors for the Olympics started to arrive.
The daily share of mobile device traffic from France also reveals shifts in typical patterns, with increases noted especially after the June 30 weekend, indicative of vacation periods and leisure Internet use. Mobile device traffic peaked during the first Olympic weekend, reaching 53% on July 26, the day of the opening ceremony – higher than any previous Friday since June. On Sunday, July 28, mobile device traffic peaked at 58%, the highest since June.
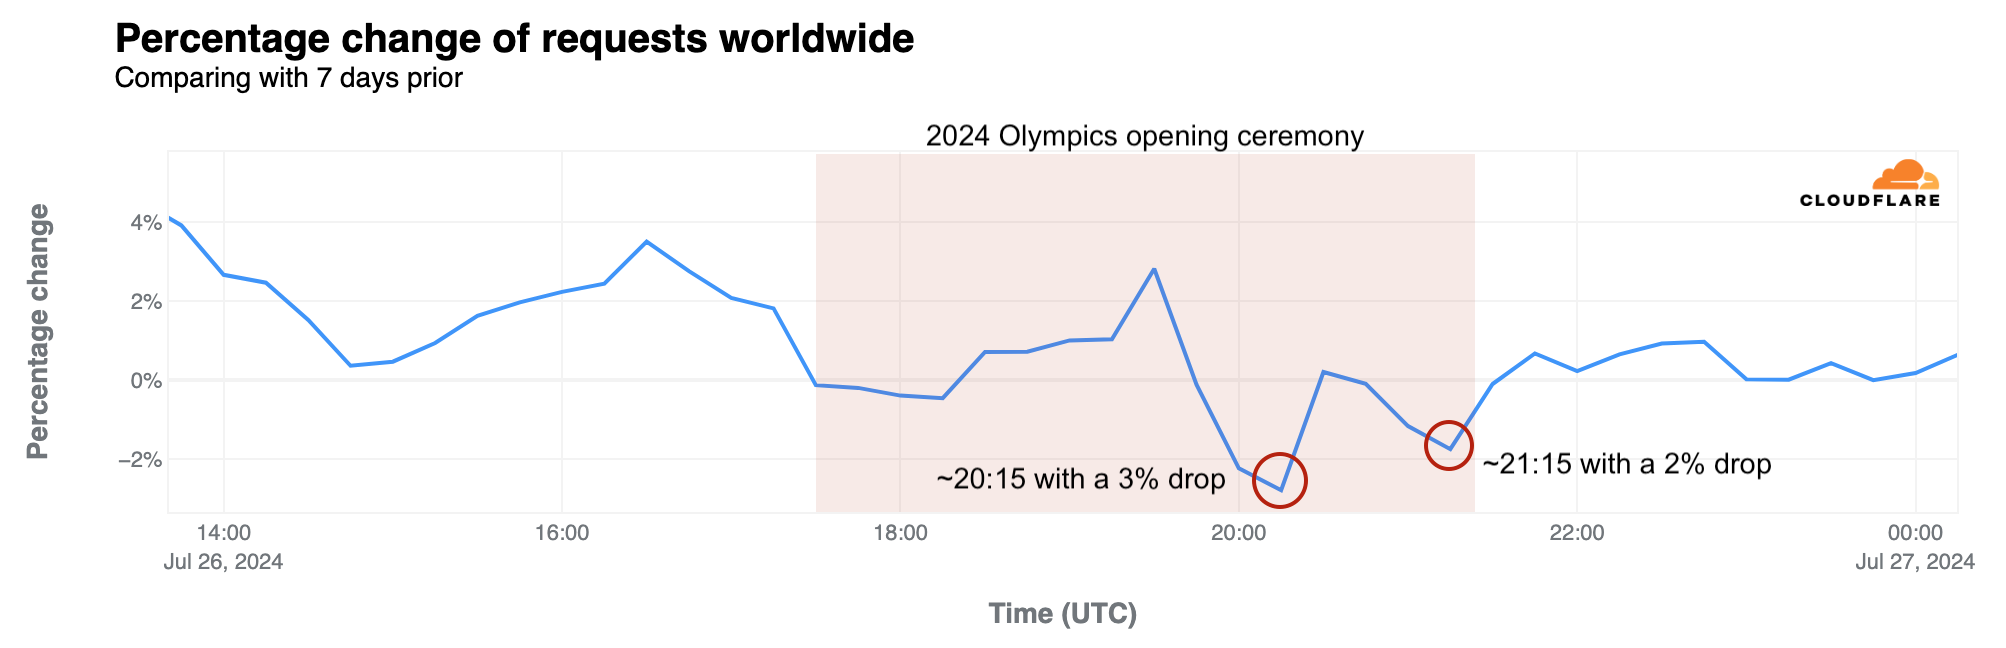
Impact to Internet traffic outside of France
Globally, Internet traffic variations were less pronounced than in France. However, on July 26, the day of the opening ceremony, a noticeable global drop occurred during the event. This was particularly evident during two key moments previously highlighted: during song performances at 20:15 UTC, traffic dropped 3% compared to the previous week, and around the end of the ceremony, at 21:15 UTC, it dropped 2%.
Expanding our view to other countries, moments of significant drops in traffic during the opening ceremony were clearly visible. Below is a summary list of 30 countries selected based on their tally of Summer Olympic medals.
Country
Drop in traffic (%)
Time of drop (UTC)
United States
-4%
20:15
Great Britain
-8%
20:15
France
-20%
21:15
Germany
-4%
20:15
China
-4%
21:00
Italy
-11%
18:15
Australia
-2%
20:00
Hungary
-5%
21:15
Sweden
-4%
21:15
Japan
-12%
21:15
Russia
-7%
19:45
Canada
-3%
20:15
Netherlands
-6%
21:15
Romania
-12%
20:00
Finland
-12%
17:30
Poland
-5%
21:15
South Korea
-4%
20:15
Cuba
-3%
19:00
Bulgaria
-6%
21:15
Switzerland
-10%
18:15
Denmark
-2%
21:15
Spain
-8%
18:15
Norway
-2%
21:15
Belgium
-5%
21:15
Brazil
-3%
18:15
Czech Republic
-10%
18:00
Slovakia
-11%
20:15
Ukraine
-2%
20:45
New Zealand
-9%
21:15
Greece
-11%
18:00
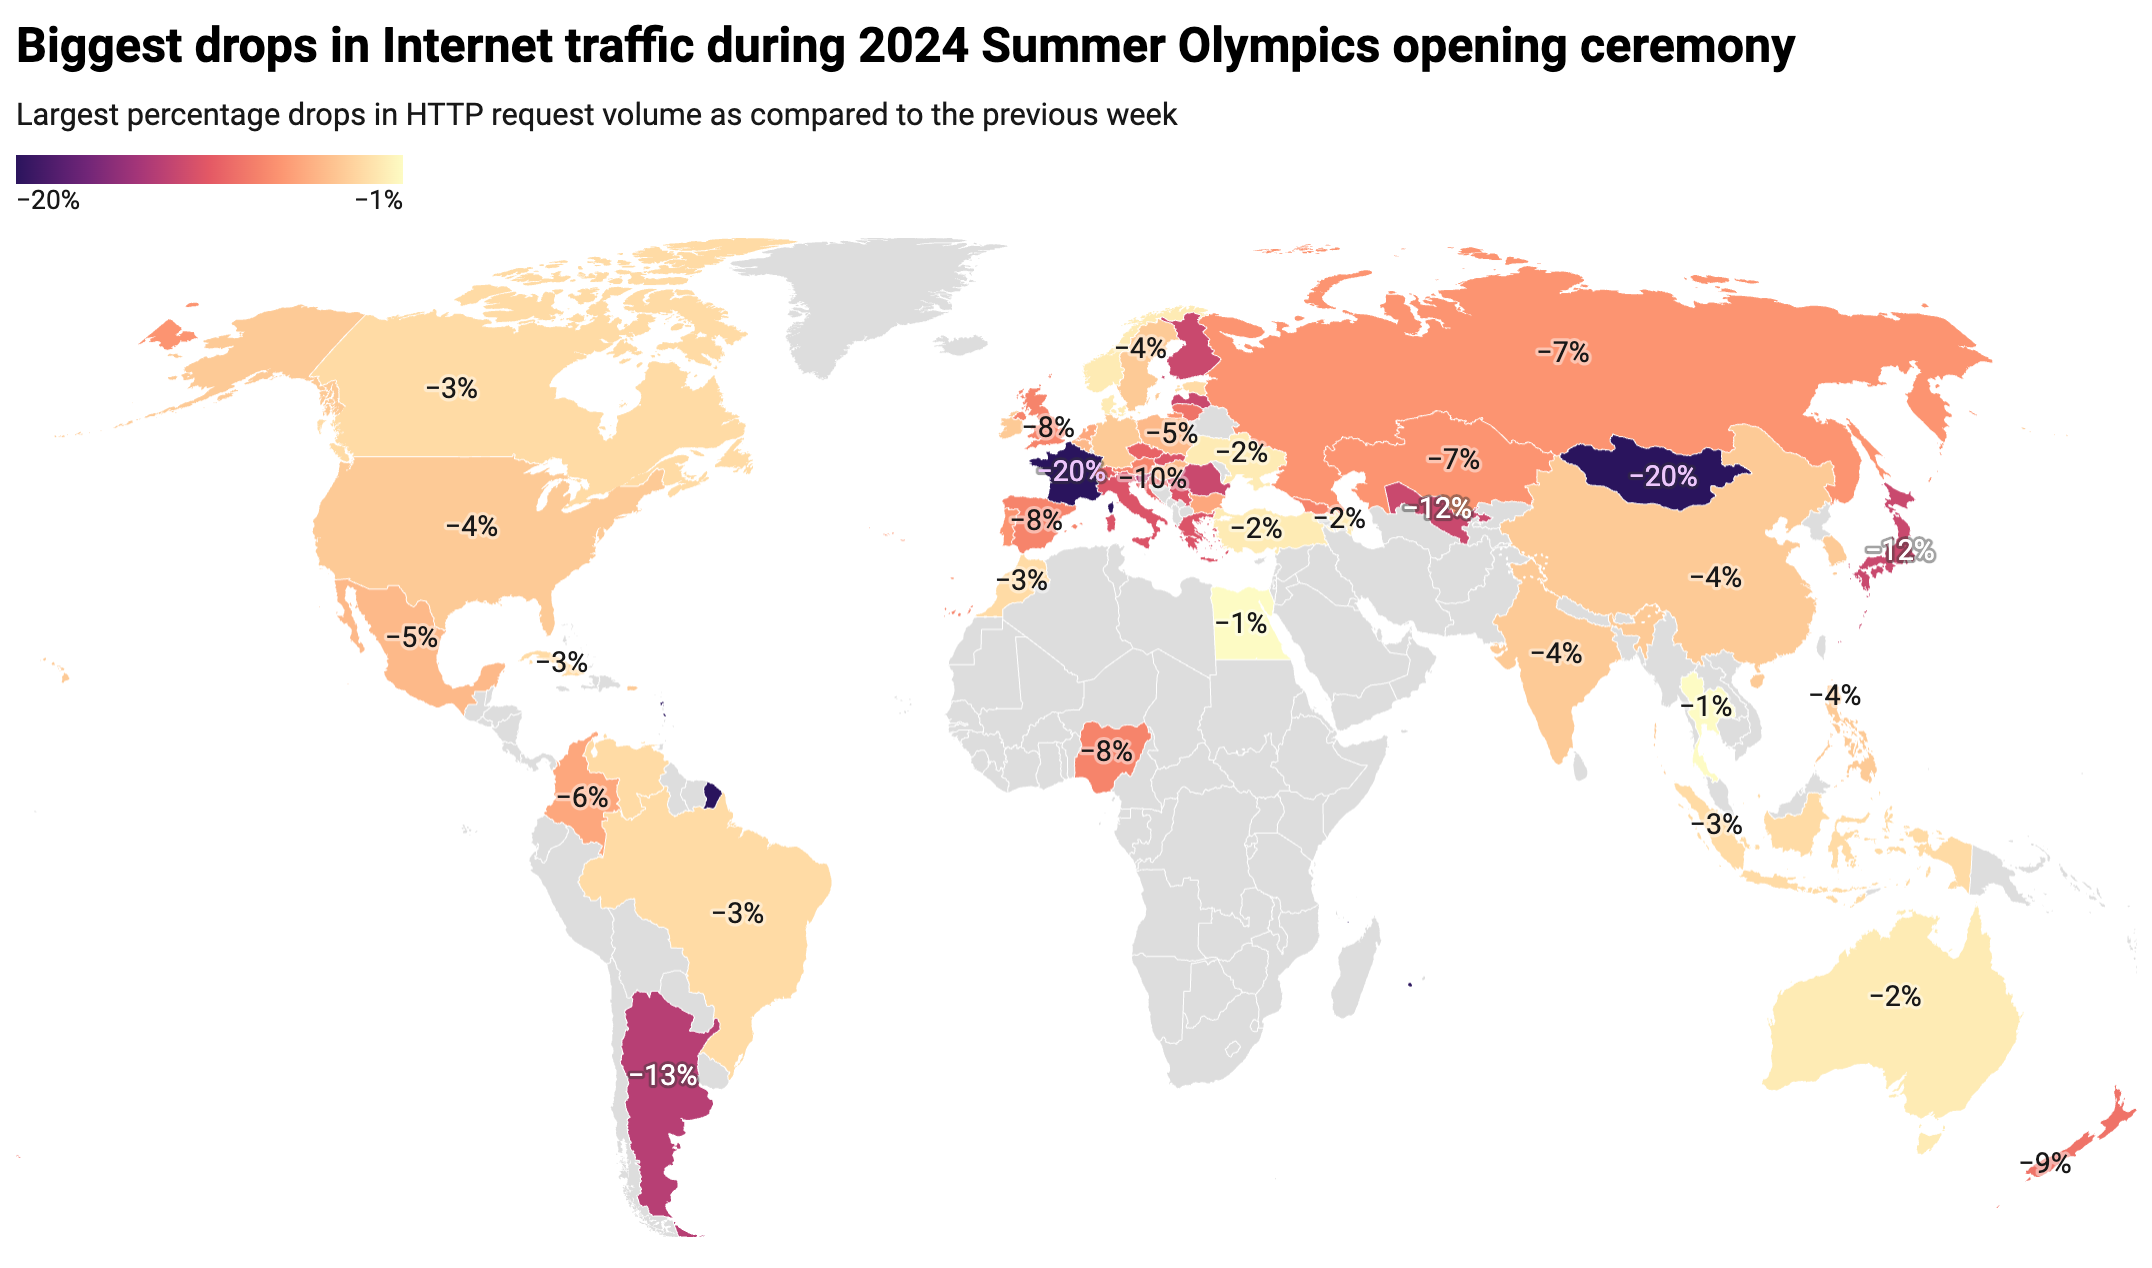
Additionally, the world map below highlights the countries that experienced notable Internet traffic impacts during the opening ceremony.
(Source: Cloudflare; created with Datawrapper)
Outside Europe, the countries with the most substantial drops were New Zealand (-9%), Uzbekistan (-12%), Argentina (-13%), and Mongolia -(20%), all experiencing greater declines than those in Europe.
Significant moments at the games: from Simone Biles to Olympic records
Below, we highlight specific Olympic events affecting Internet traffic, starting from the first full competition day on Saturday, July 27, 2024.
United States: The artistic gymnastics competition featuring four-time Olympic gold medalist Simone Biles notably impacted US Internet traffic more than the opening ceremony. On July 26-28, traffic dipped most significantly during Biles’ events. At 10:00 UTC, concurrent with her beam routine, traffic was already 4% lower than the previous week. It dropped by 6% at 10:45 UTC during her floor and vault routines.
France: French swimmer Léon Marchand’s gold medal and Olympic record-setting performance in the men’s 400-meter individual medley on July 28 had the most significant impact in the host nation. Traffic fell by 17% at 18:30 UTC during his event. However, as we noted above, the opening ceremony drove a bigger drop in traffic.
Australia: During Mollie O’Callaghan’s victory in the women’s 200m freestyle on July 29, at around 20:00 UTC, Australian traffic was 5% lower than the previous week This was larger than during the opening ceremony, which saw a 2% drop.
South Korea: The Korean women’s archery team’s gold medal win on July 28 at 15:30 UTC led to an 8% drop in traffic, the most significant decrease noted in the country from July 26 to July 29.
Brazil: Traffic in Brazil was15% lower than the previous week on July 27 at around 19:30 UTC, surpassing the opening ceremony’s impact. This occurred as Brazilian swimmers Guilherme Costa and Maria Fernanda Costa competed in the men’s and women’s 400 m freestyle events.
DNS trends to official Olympic websites by country
On July 22, before the Olympics started, we reported on the heightened interest in official Olympic websites based on request data from our 1.1.1.1 DNS resolver. We noted France’s dominance with 24% of DNS traffic to official Olympic websites, followed by the UK (20%) and the US (17%). However, the start of the Olympics marked a shift, with the US taking the lead.
On the first full day of competitions, July 27, the US led with 16% of all DNS request traffic to official Olympic sites. This change indicates a broader spread of interest across countries during the Olympics. A dynamic version of the map below is available in our Paris 2024 Olympics report.
Here are the top 10 countries with the highest shares of DNS request traffic for the first full day of competitions, July 27, to Olympic sites (percentages rounded):
United States: 16%
Germany: 12%
France: 9%
Vietnam: 9%
Brazil: 5%
Australia: 5%
United Kingdom: 4%
Netherlands: 4%
Canada: 3%
South Africa: 2%
Growth in interest as the Olympics drew closer
Global daily DNS request traffic to official Olympic websites began climbing to the highest levels seen year to date starting on July 23, showing a steady increase. It peaked on July 28, the second full day of events, with a fivefold (509%) increase from the previous week. On the opening ceremony day, traffic was already 110% higher than the previous week.
Country-specific peaks included the US, where traffic to Olympic sites surged 719% on July 28, coinciding with Simone Biles’ first competition day. In France, traffic peaked on the same day with a 391% increase, and in Germany, it skyrocketed by 2300% on July 27.
The evolving DNS ranking of Olympic site traffic by country reveals that from July 19, the US overtook France. Also, Germany ascended to the #2 spot on July 27, the first full day of competitions, while Australia climbed to #4 on July 28, and Canada’s peak day was also July 28.
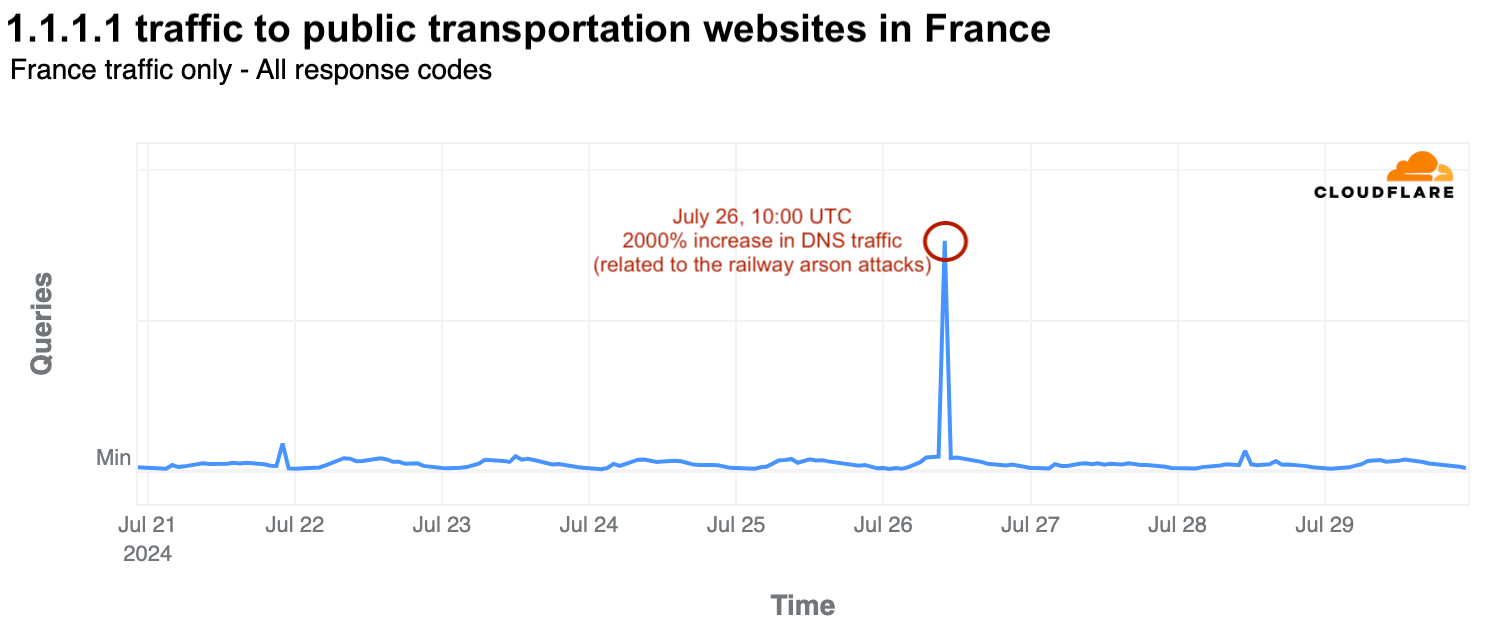
Railway attacks on opening ceremony day cause surge in traffic
The opening ceremony day, July 26, was also disrupted by railway arson attacks in France, affecting the 800,000 passengers on the high-speed railway system. At 10:00 UTC, there was a significant surge in DNS traffic to public transportation websites, including high-speed railway services. Traffic spiked by 2000% compared to the previous week as users accessed websites to check updates.
DDoS attacks: always around
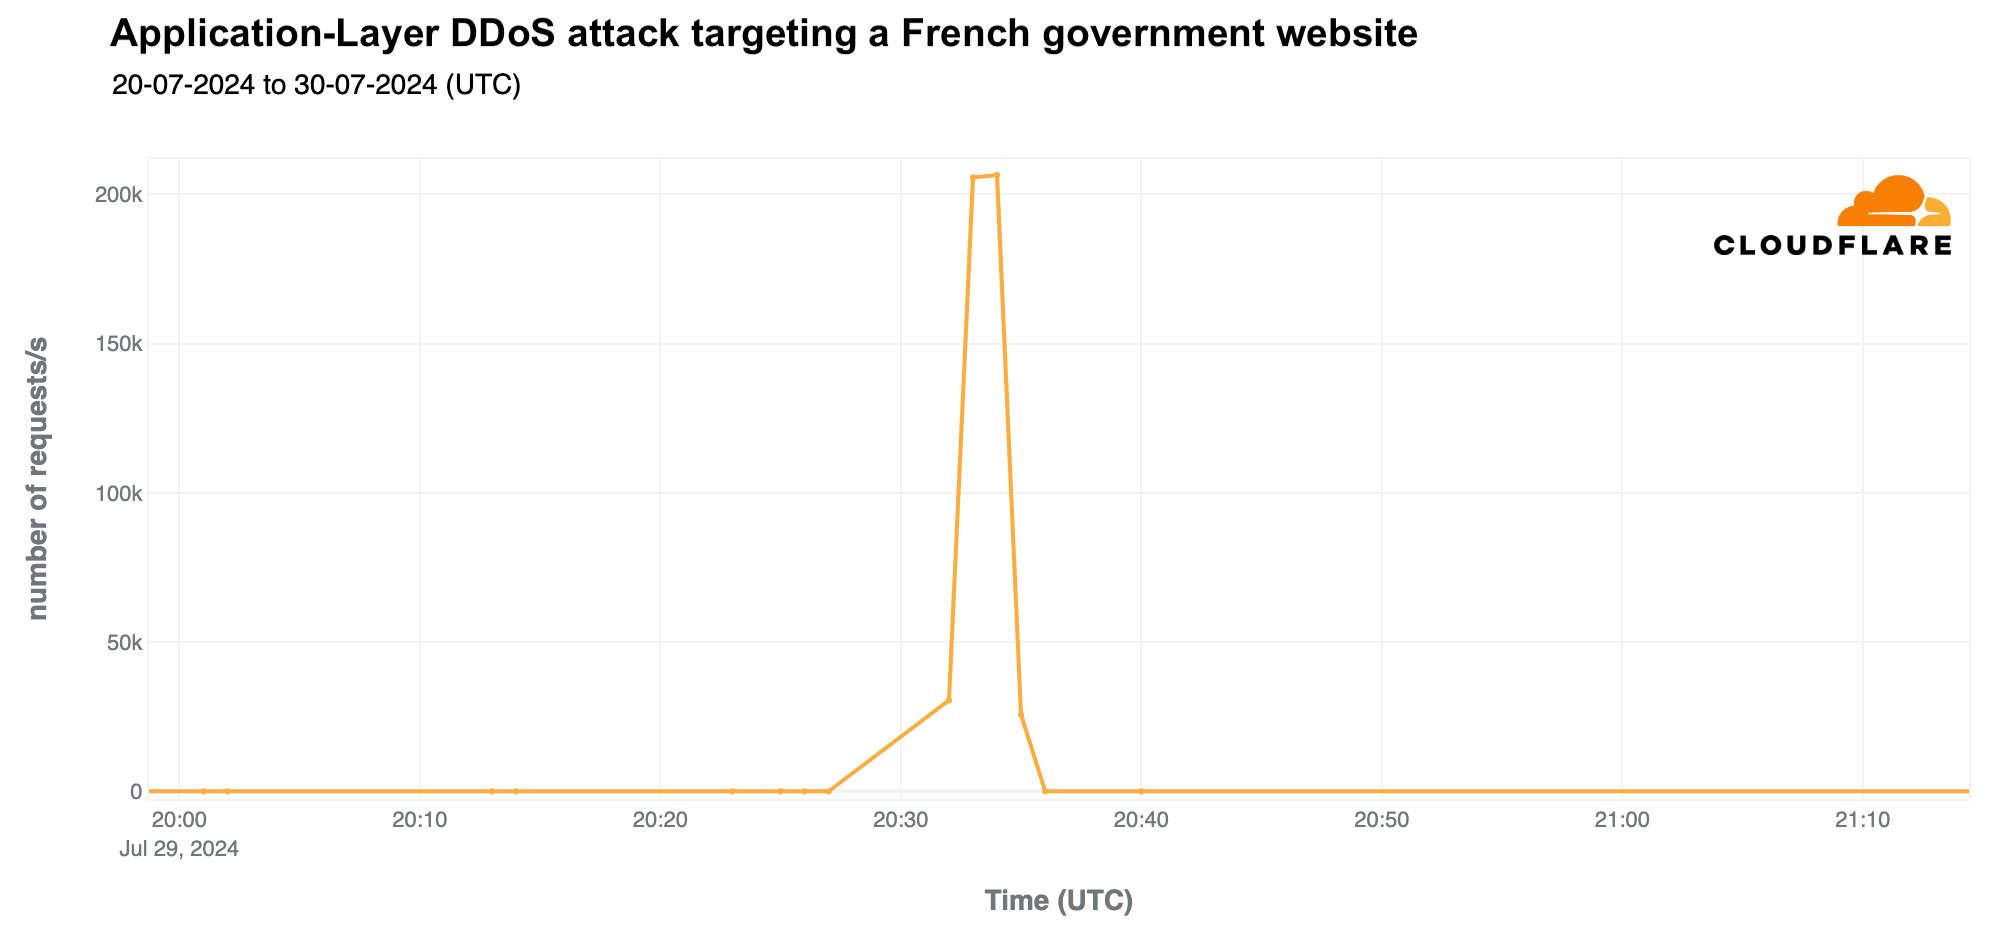
As we’ve observed with elections in 2024, including the French elections, political parties are not the only targets of DDoS (Distributed Denial of Service) attacks during significant events. While we haven’t seen any coordinated flow of major DDoS attacks targeting services potentially used during the Olympics in France, we have observed a few incidents.
A generally used French government website was targeted by a DDoS attack on July 29, 2024, lasting nine minutes and peaked at 207,000 requests per second at 20:34 UTC.
Before the Olympics began, a national transportation website was also targeted by a smaller DDoS attack, lasting only a couple of minutes and peaking at 10,000 requests per second on July 21 at 10:20 UTC.
As highlighted in our Q2 DDoS report, most DDoS attacks are short-lived, as exemplified by the two mentioned attacks. Also, 81% of HTTP DDoS attacks peak at under 50,000 requests per second (rps), and only 7% reach between 100,000 and 250,000 rps. While a 10,000 rps attack might seem minor to Cloudflare, it can be devastating for websites not equipped to handle such high levels of traffic.
“Olympics” and “Paris 2024” emails on the rise
From another cybersecurity perspective, major events often attract phishing and spam, and the Olympics are no exception. From January 2024 through late July, Cloudflare’s Cloud Email Security service processed over a million emails containing “Olympics” or “Paris 2024” in the subject. During the week of July 22-28, coinciding with the first few days of the Olympics, there was a 304% increase in such emails compared to the previous week and a staggering 3111% increase compared to the busiest week in January.
Regarding unwanted messages, spam accounted for 1.5% of all emails with “Olympics” or “Paris 2024” in the subject, while malicious emails made up 0.1% since January 2024. This means that in a sample of 1000 emails, roughly 15 would be spam and 1 would be malicious. The peak for malicious Olympic-related emails occurred the week of May 6, with 0.6% classified as malicious. Although there was a decline after this peak, rates increased slightly in July, reaching 0.4% on July 8. Despite the surge in volume during the week of July 22, only 0.05% of emails were malicious.
That same week, when the Olympics started, also saw an increase in spam emails to over 2%, the highest since the 7% peak the week of June 24.
Conclusion
The Paris 2024 Olympics started on July 26, with a clear impact on Internet traffic in different countries, most notably in France, the host nation. The significant traffic drops during key moments of the opening ceremony, and the reactive spikes following major events highlight the ever-present interplay between physical events and the way humans interact with the online world. Not many events take the focus away from the Internet, and in this case, into TV broadcast.
We’ve also observed how the interest in official Olympic websites surged, with clear increases in DNS traffic after the event started, in different countries, with the US ultimately taking the gold.
Regarding the July 29, 2024 sabotage of French fiber optic cables, we did not observe any notable disruptions of Internet traffic in France or its cities during the day.
As the games continue, we will maintain a Paris 2024 Olympics report on Cloudflare Radar, updating it as significant Internet trends related to the event emerge.
The 2024 Summer Olympics, or Paris 2024, is set from July 26 to August 11 in France. The opening ceremony, scheduled for Friday, July 26 at 17:30, will take place for the first time not in a stadium but in the open space of the Jardins du Trocadéro by the Seine River in Paris. We’ll monitor relevant Internet insights throughout the event, but here we analyze some pre-event trends, from the popularity of Olympic websites by country to the increase in Olympics-related spam and malicious emails.
This year’s Olympics will host 329 events across 32 sports, featuring the debut of breakdancing as an Olympic event and the return of skateboarding, sport climbing, and surfing from 2020. Similar to our 2024 elections coverage, we will maintain a Paris 2024 Olympics report on Cloudflare Radar, updating it as significant Internet trends related to the event emerge.
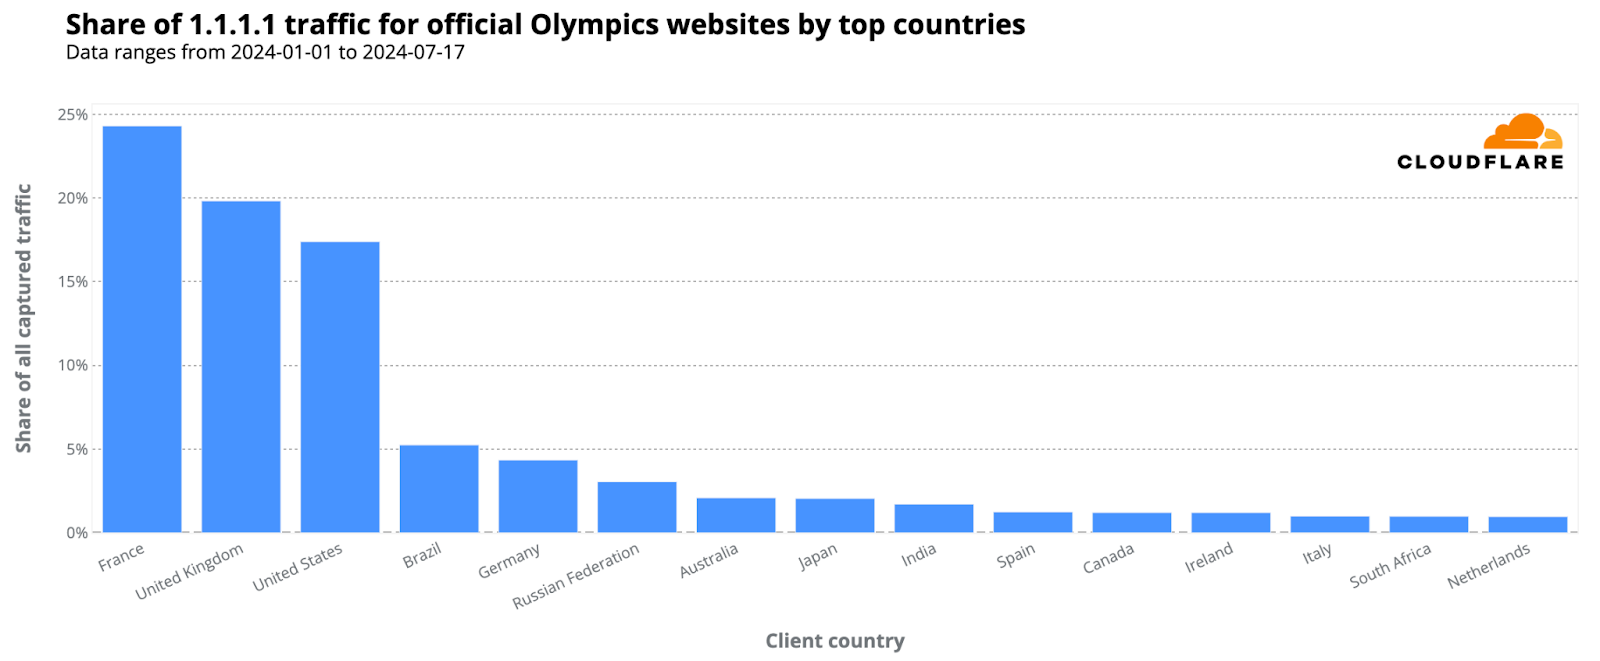
From our 1.1.1.1 resolver, DNS trends show heightened interest in the Olympics, especially from France. 24% of DNS requests for official Olympic-related websites came from the host country, followed by the United Kingdom and the United States, with 20% and 17% respectively.
Here’s the breakdown of countries responsible for at least 1% of 1.1.1.1. traffic for Olympic sites (percentages rounded):
France: 24%
United Kingdom: 20%
United States: 17%
Brazil: 5%
Germany: 4%
Russia: 3%
Australia: 2%
Japan: 2%
India: 2%
Spain: 1%
Ireland: 1%
Canada: 1%
South Africa: 1%
Netherlands: 1%
Italy: 1%
Days with the highest “Olympic” spikes
Analyzing the evolution of DNS traffic to official Olympic websites since January 2024, we’ve noted multiple spikes associated with specific Olympic events or ticket sales. The following ranking offers a global perspective via our 1.1.1.1 resolver, illustrating that as the event draws near and Paris readies itself, more recent dates are emerging prominently in the data.
Top 5 days with higher DNS traffic to Olympic official sites in 2024:
January 31: Eve of the 2024 Winter Youth Olympics closing ceremony in Gangwon, South Korea.
April 17: Over 250,000 new tickets for Olympic Games Paris 2024 went on sale – one of the last opportunities to get tickets to the main events.
January 19: Opening ceremony of the 2024 Winter Youth Olympics (South Korea).
June 26: One month before the opening ceremony; the Paris 2024 Main Operations Center starts full games operation; in Paris, areas like the Champ-de-Mars became full occupied by the Olympics; in the US, tickets for NBC’s Opening Ceremony coverage for the Paris 2024 in IMAX theaters went on sale.
July 1: Preparations in Paris with street and bridges closures and road signs added indicating fast track routes for Olympic related vehicles.
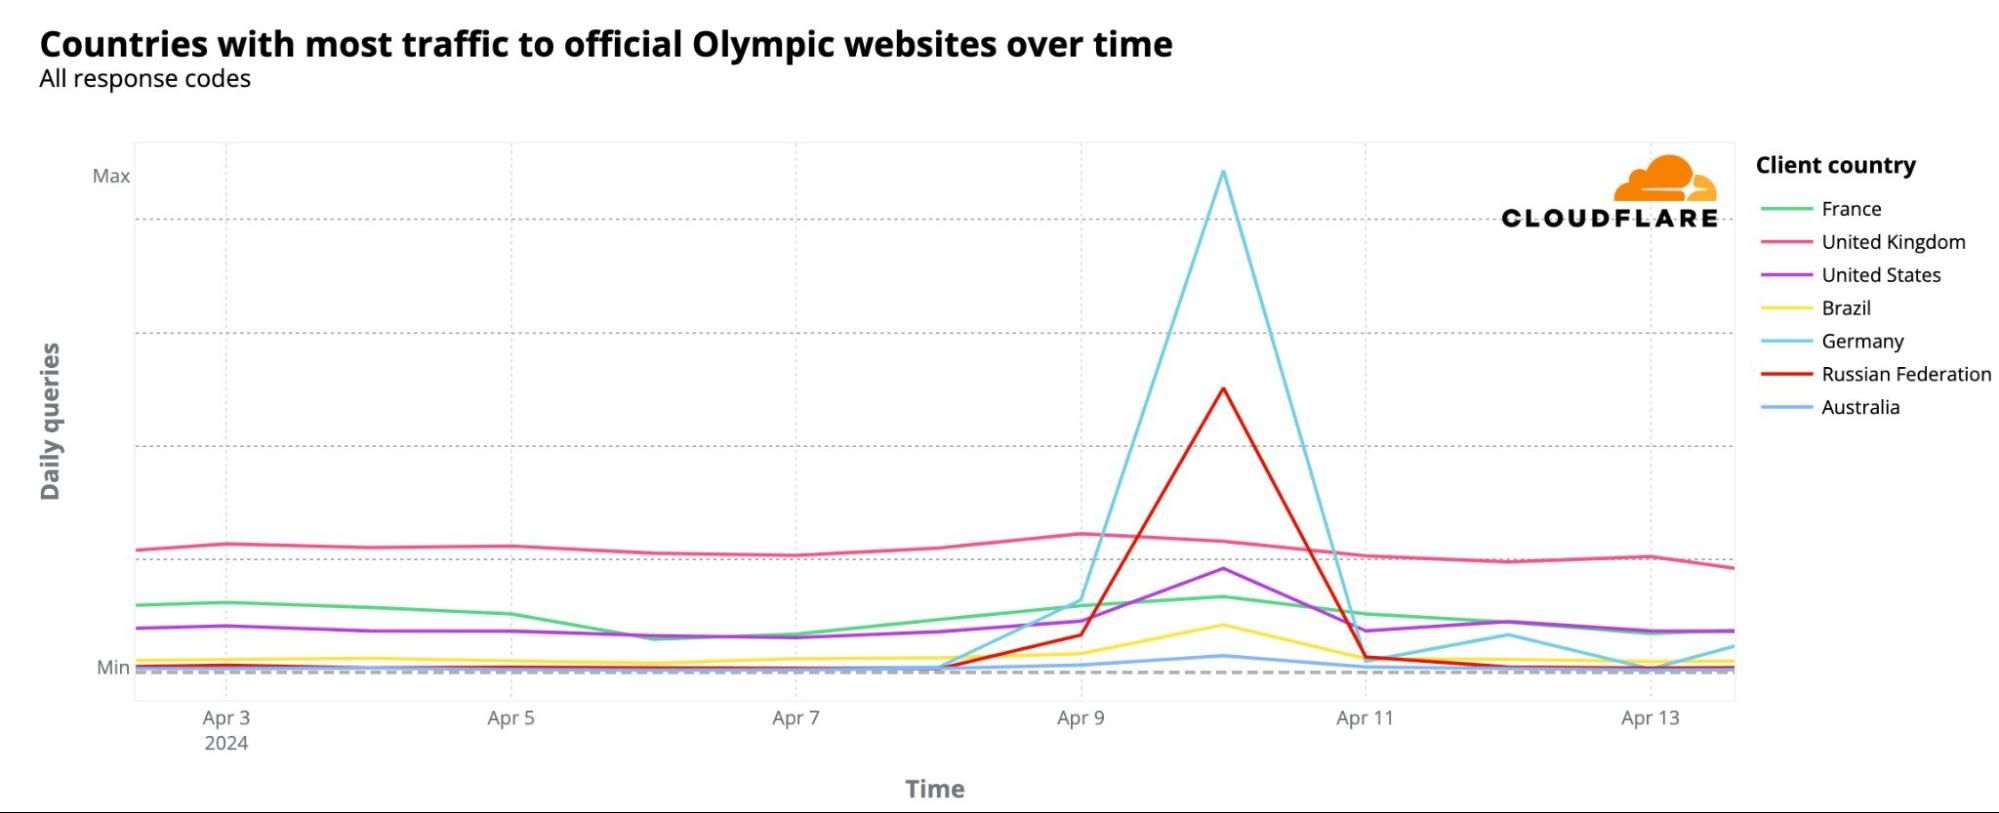
April 10 spikes in Germany, Russia and the US
On April 10, 2024, DNS traffic spikes were observed not just in France but also notably in Germany, Russia, and the US, among others. Despite France leading in overall DNS traffic to Olympic sites since January, as seen on the world map above, this particular day saw the largest spikes originating from other countries. These spikes were most prominent from Germany, Russia, the US, the UK, France, Brazil, and Australia, in that order.
What caused these spikes? Several press conferences related to the Olympics took place that day. One major announcement, covered globally, declared that for the first time, the Olympics would offer prize money, with track and field gold medalists receiving $50,000. The following chart illustrates the spike in DNS traffic in these countries on that day.
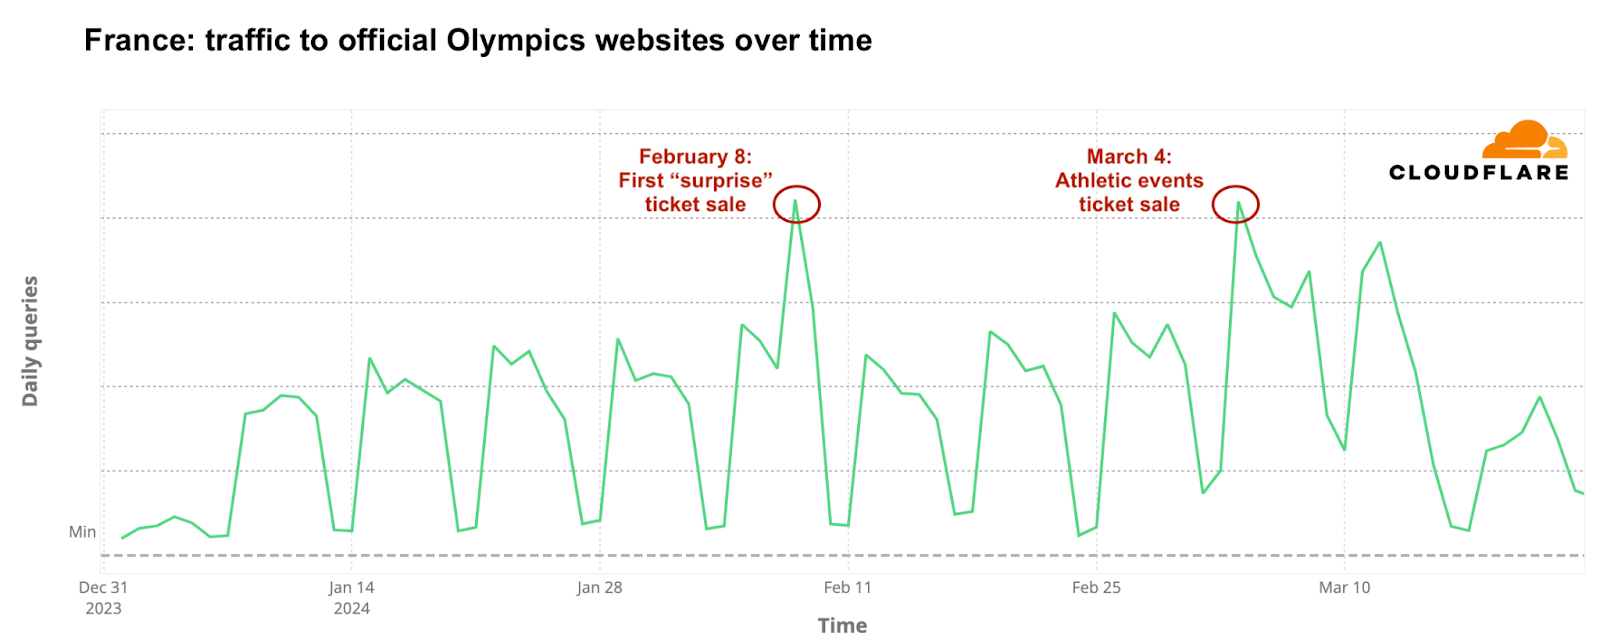
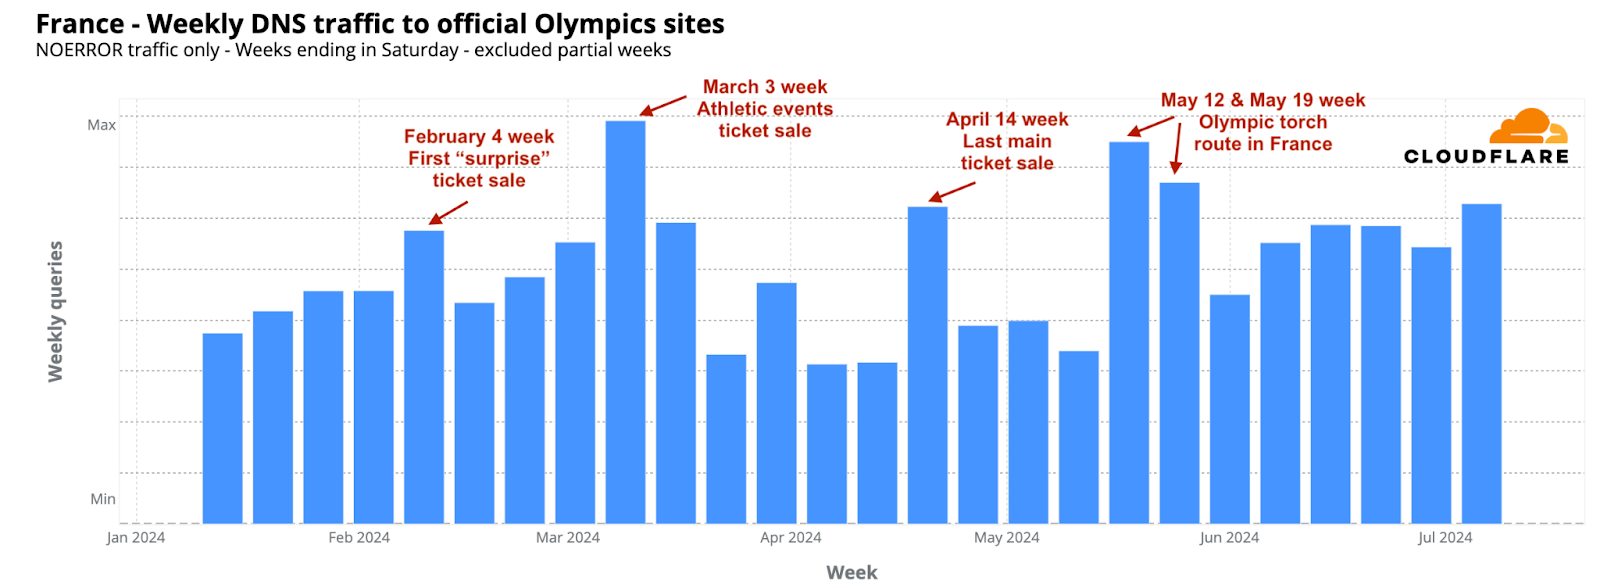
France’s trends: interest in tickets comes first
In France, the host nation, ticket sale days significantly influenced DNS traffic to official Olympic websites. The most obvious spike occurred on February 8, 2024, marking the start of the first phase of ticket sales for 2024, called the “Paris 2024 official ticketing website surprise releases.” On that day, daily DNS traffic was double that of the previous week. A significant surge was also observed at 10:00 local time, coinciding with the ticket release, which saw an hourly DNS traffic increase of 398% compared to the previous week.
The week of March 3, 2024, saw the highest DNS traffic to Olympic-related sites in France so far. The most significant increase occurred on March 4, the day the “Athletics Special” ticket sales began for events at the Stade de France, which also coincided with the unveiling of the Olympic poster. On this day, daily DNS traffic rose by 45% compared to the previous week. Other notable periods included the weeks of May 12 and May 19, when the Olympic torch arrived in France and started its journey through various cities. April 14 also marked a critical day, offering one of the last chances to purchase 250,000 tickets for major events.
“Olympics” and “Paris 2024” emails on the rise
From a cybersecurity perspective, as major events often attract phishing and spam, we’ve analyzed email trends related to the Olympics—recently we did the same for the Biden vs Trump US presidential debate. From January 2024 up to late-July, Cloudflare’s Cloud Email Security service processed well over half a million emails containing “Olympics” or “Paris 2024” in the subject. The week of July 15 saw the highest number of such emails, marking a 694% increase compared to the busiest week in January.
Regarding unwanted messages, spam accounted for 1.5% of all emails with “Olympics” or “Paris 2024” in the subject, while malicious emails made up 0.2%. This means that in a sample of 1000 emails, roughly 15 would be spam and about 2 would be malicious. The week with the highest percentage of malicious Olympic-related emails was May 6, with 0.6% classified as malicious. Declining after that peak, it ticked back up in July, to 0.4% on July 8.
Furthermore, the week of June 24 witnessed the highest proportion of spam emails for the year so far, at 7% of all emails.
As the Olympics opening ceremony approaches, we expect the volume of related emails, and the proportion of malicious and spam emails, to increase. We’ll provide an update of the first days of the Olympics next week.
Conclusion: “Citius, Altius, Fortius” *
As the world turns its eyes to Paris for the 2024 Summer Olympics, our latest analysis provides a snapshot of the enthusiasm surrounding the games, with France, the host nation, clearly leading in terms of DNS traffic to official Olympic websites, followed by the UK, the US, and Australia.
With the games about to start, the best is yet to come, with the Olympics bringing over three hundred events in 32 sports to people all around the world.
* “Citius, Altius, Fortius”—Latin for “Faster, Higher, Stronger.” This motto was proposed by Pierre de Coubertin, a French historian and the “father” of the modern Olympic Games, upon the creation of the International Olympic Committee in 1894.
My latest book, A Hacker’s Mind, has a lot of sports stories. Sports are filled with hacks, as players look for every possible advantage that doesn’t explicitly break the rules. Here’s an example from pickleball, which nicely explains the dilemma between hacking as a subversion and hacking as innovation:
Some might consider these actions cheating, while the acting player would argue that there was no rule that said the action couldn’t be performed. So, how do we address these situations, and close those loopholes? We make new rules that specifically address the loophole action. And the rules book gets longer, and the cycle continues with new loopholes identified, and new rules to prohibit that particular action in the future.
Alternatively, sometimes an action taken as a result of an identified loophole which is not deemed as harmful to the integrity of the game or sportsmanship, becomes part of the game. Ernie Perry found a loophole, and his shot, appropriately named the “Ernie shot,” became part of the game. He realized that by jumping completely over the corner of the NVZ, without breaking any of the NVZ rules, he could volley the ball, making contact closer to the net, usually surprising the opponent, and often winning the rally with an un-returnable shot. He found a loophole, and in this case, it became a very popular and exciting shot to execute and to watch!
I don’t understand pickleball at all, so that explanation doesn’t make a lot of sense to me. (I watched a video explaining the shot; that helped somewhat.) But it looks like an excellent example.
The blog post also links to a 2010 paper that I wish I’d known about when I was writing my book: “Loophole ethics in sports,” by Øyvind Kvalnes and Liv Birgitte Hemmestad:
Abstract: Ethical challenges in sports occur when the practitioners are caught between the will to win and the overall task of staying within the realm of acceptable values and virtues. One way to prepare for these challenges is to formulate comprehensive and specific rules of acceptable conduct. In this paper we will draw attention to one serious problem with such a rule-based approach. It may inadvertently encourage what we will call loophole ethics, an attitude where every action that is not explicitly defined as wrong, will be seen as a viable option. Detailed codes of conduct leave little room for personal judgement, and instead promote a loophole mentality. We argue that loophole ethics can be avoided by operating with only a limited set of general principles, thus leaving more space for personal judgement and wisdom.
Everyone visiting Qatar for the World Cup needs to install spyware on their phone.
Everyone travelling to Qatar during the football World Cup will be asked to download two apps called Ehteraz and Hayya.
Briefly, Ehteraz is an covid-19 tracking app, while Hayya is an official World Cup app used to keep track of match tickets and to access the free Metro in Qatar.
In particular, the covid-19 app Ehteraz asks for access to several rights on your mobile., like access to read, delete or change all content on the phone, as well as access to connect to WiFi and Bluetooth, override other apps and prevent the phone from switching off to sleep mode.
The Ehteraz app, which everyone over 18 coming to Qatar must download, also gets a number of other accesses such as an overview of your exact location, the ability to make direct calls via your phone and the ability to disable your screen lock.
The Hayya app does not ask for as much, but also has a number of critical aspects. Among other things, the app asks for access to share your personal information with almost no restrictions. In addition, the Hayya app provides access to determine the phone’s exact location, prevent the device from going into sleep mode, and view the phone’s network connections.
Despite what the article says, I don’t know how mandatory this actually is. I know people who visited Saudi Arabia when that country had a similarly sketchy app requirement. Some of them just didn’t bother downloading the apps, and were never asked about it at the border.
This is a fascinating glimpse of the future of automatic cheating detection in sports:
Maybe you heard about the truly insane false-start controversy in track and field? Devon Allen—a wide receiver for the Philadelphia Eagles—was disqualified from the 110-meter hurdles at the World Athletics Championships a few weeks ago for a false start.
Here’s the problem: You can’t see the false start. Nobody can see the false start. By sight, Allen most definitely does not leave before the gun.
But here’s the thing: World Athletics has determined that it is not possible for someone to push off the block within a tenth of a second of the gun without false starting. They have science that shows it is beyond human capabilities to react that fast. Of course there are those (I’m among them) who would tell you that’s nonsense, that’s pseudoscience, there’s no way that they can limit human capabilities like that. There is science that shows it is humanly impossible to hit a fastball. There was once science that showed human beings could not run a four-minute mile.
Besides, do you know what Devon Allen’s reaction time was? It was 0.99 seconds. One thousandth of a second too fast, according to World Athletics’ science. They’re THAT sure that .01 seconds—and EXACTLY .01 seconds—is the limit of human possibilities that they will disqualify an athlete who has trained his whole life for this moment because he reacted one thousandth of a second faster than they think possible?
We in the computer world are used to this sort of thing. “The computer is always right,” even when it’s obviously wrong. But now computers are leaving the world of keyboards and screens, and this sort of thing will become more pervasive. In sports, computer systems are used to detect when a ball is out of bounds in tennis and other games and when a pitch is a strike in baseball. I’m sure there’s more—are computers detecting first downs in football?—but I’m not enough of a sports person to know them.
China is mandating that athletes download and use a health and travel app when they attend the Winter Olympics next month. Citizen Lab examined the app and found it riddled with security holes.
Key Findings:
MY2022, an app mandated for use by all attendees of the 2022 Olympic Games in Beijing, has a simple but devastating flaw where encryption protecting users’ voice audio and file transfers can be trivially sidestepped. Health customs forms which transmit passport details, demographic information, and medical and travel history are also vulnerable. Server responses can also be spoofed, allowing an attacker to display fake instructions to users.
MY2022 is fairly straightforward about the types of data it collects from users in its public-facing documents. However, as the app collects a range of highly sensitive medical information, it is unclear with whom or which organization(s) it shares this information.
MY2022 includes features that allow users to report “politically sensitive” content. The app also includes a censorship keyword list, which, while presently inactive, targets a variety of political topics including domestic issues such as Xinjiang and Tibet as well as references to Chinese government agencies.
While the vendor did not respond to our security disclosure, we find that the app’s security deficits may not only violate Google’s Unwanted Software Policy and Apple’s App Store guidelines but also China’s own laws and national standards pertaining to privacy protection, providing potential avenues for future redress.
It’s not clear whether the security flaws were intentional or not, but the report speculated that proper encryption might interfere with some of China’s ubiquitous online surveillance tools, especially systems that allow local authorities to snoop on phones using public wireless networks or internet cafes. Still, the researchers added that the flaws were probably unintentional, because the government will already be receiving data from the app, so there wouldn’t be a need to intercept the data as it was being transferred.
[…]
The app also included a list of 2,422 political keywords, described within the code as “illegalwords.txt,” that worked as a keyword censorship list, according to Citizen Lab. The researchers said the list appeared to be a latent function that the app’s chat and file transfer function was not actively using.
The US government has already advised athletes to leave their personal phones and laptops home and bring burners.
In an evolving world that is increasingly connected, data-centric, and fast-paced, the sports industry is no exception. Amazon Web Services (AWS) has been helping customers in the sports industry gain real-time insights through analytics. You can re-invent and reimagine the fan experience by tracking sports actions and activities. In this blog post, we will highlight common architectural and design patterns for building a data pipeline to track sporting events in real time.
The sports industry is largely comprised of two subsegments: participatory and spectator sports. Participatory sports, for example fitness, golf, boating, and skiing, comprise the largest share of the market. Spectator sports, such as teams/clubs/leagues, individual sports, and racing, are expected to be the fastest growing segment. Sports teams/leagues/clubs comprise the largest share of the Spectator sports segment, and is growing most rapidly.
IoT data pipeline architecture overview
Let’s discuss the infrastructure in three parts:
Infrastructure at the arena itself
Processing data using AWS services
Leveraging this analysis using a graphics overlay (this can be especially useful for broadcasters, OTT channels, and arena users)
Data-gathering devices
Radio-frequency identification (RFID) chips or IoT devices can be worn by players or embedded in the playing equipment. These devices emit 20–50 messages per second. These messages are collected and output using JSON. This information may include player coordinate positions, player speed, statistics, health information, or more. To process the game, leagues, coaches, or broadcasters can analyze this data using analytics tools and/or machine learning.
Figure 1. Data pipeline architecture using AWS Services
Processing data, feature engineering, and model training at AWS
Use serverless services from AWS when possible in order to keep your solution scalable and cost-efficient. This also helps with operational overhead for teams. You can use the Kinesis family of services for stream ingestion and processing. The streaming data from hundreds to thousands of IoT sources (from equipment and clothing) can be fed to Amazon Kinesis Data Streams (KDS). KDS and Amazon Kinesis Data Firehose provide a buffering mechanism for streaming data before it lands on Amazon Simple Storage Service (S3). With Amazon Kinesis Data Analytics, you can process and analyze Kinesis stream data using powerful SQL, Apache Flink, or Beam. Kinesis Data Analytics also supports building applications in SQL, Java, Scala, and Python. With this service, you can quickly author and run powerful SQL code against Amazon Kinesis Streams as your source. This way you can perform time series analytics, feed real-time dashboards, and create real-time metrics. Read more about Amazon Kinesis Data Analytics for SQL Applications.
You might want to transform or enhance the streaming data before it is delivered to Amazon S3. Amazon Kinesis Data Firehose can be used with an AWS Lambda function to do the transformation. Let’s say you have a player prediction timestamp that you want to represent in a different time format to different ML algorithms. Lambda can process and transform this data. Kinesis Data Firehose will deliver the transformed and raw data to the destination (Amazon S3). This can occur after the specific buffering size or when the buffering interval is reached, whichever happens first.
For more complex transformations, AWS Glue can be used. For example, once the data lands in Amazon S3, you can start preparing and aggregating the training dataset using Amazon SageMaker Data Wrangler. As part of the feature engineering process, you can do the following:
Transform the data
Delete unneeded columns
Impute missing values
Perform label encoding
Use the quick model option to get a sense of which features are adding predictive power as you progress with your data preparation
All the data preparation and feature engineering tasks can be performed from Data Wrangler’s single visual interface.
Once data is prepared in Amazon S3, Amazon SageMaker can be used for model training. In soccer, you can predict a goal percentage based on the player’s position, acceleration, and past performance history. SageMaker provides several built-in algorithms that can be trained. For real-time predictions, Amazon API Gateway provides an API layer to clients like an OTT, broadcasting service, or a web browser. API Gateway can invoke a Lambda function, with logic to call a SageMaker endpoint and persist the output to the database. This data can be used later on for further analysis or to fine-tune your models.
Figure 2. Deliver real-time prediction using Amazon SageMaker
Computer vision-based object detection techniques can be very useful in Sports. These techniques use deep learning algorithms to predict the pass probability, game player face-off, or win prediction. For the sports industry, object detection technology like these are crucial. They obviate the need for sensors. Real-time object identification can be used to:
Generate new advanced analytics regarding player and team performance
Aid game officials in making correct calls
Provide fans an improved and more data-rich viewing experience
Read Football tracking in the NFL with Amazon SageMaker for more information on how to track using broadcast video data. Using SageMaker, you can train object detection models that analyze thousands of images. You can then locate and classify the football itself, and distinguish it from background objects.
Creating a graphics overlay
When you have the ML inference data and video ingestion ready, you may want to represent this data on your broadcasted video. The graphic overlay feature lets you insert an image (a BMP, PNG, or TGA file) at a specified time. It is displayed as a static overlay on the underlying video for a specified duration. The motion graphic overlay feature lets you insert an animation (a MOV or SWF file, or a series of PNG files) on the underlying video. This can be displayed at a specified time for a specified duration.
For example, a player’s motion prediction can be inserted on video during a game, through a RESTful API call of ML inferences. You can use AWS Elemental Live to achieve this. Read about AWS Elemental Live Graphic Overlay at AWS documentation.
In this blog, we’ve highlighted how customers in the sports industry are using AWS to increase the quality of the game, and enhance the sports fan’s experience. The following benefits can be achieved by building a data pipeline for tracking sporting events using AWS services:
Amazon Kinesis collects, processes, and analyzes in-game streaming data in real time. This way both teams and fans get timely insights and can react quickly to new information.
The serverless nature of this architecture enables a cost-effective, scalable, and operationally efficient environment for customers.
Amazon Machine Learning services like Amazon SageMaker can be used to enrich the fan viewing experience. It presents in-game predictions such as who will score next, or which team will win the game.
To provide the best experiences, we use technologies like cookies to store and/or access device information. Consenting to these technologies will allow us to process data such as browsing behavior or unique IDs on this site. Not consenting or withdrawing consent, may adversely affect certain features and functions.
Functional
Always active
The technical storage or access is strictly necessary for the legitimate purpose of enabling the use of a specific service explicitly requested by the subscriber or user, or for the sole purpose of carrying out the transmission of a communication over an electronic communications network.
Preferences
The technical storage or access is necessary for the legitimate purpose of storing preferences that are not requested by the subscriber or user.
Statistics
The technical storage or access that is used exclusively for statistical purposes.The technical storage or access that is used exclusively for anonymous statistical purposes. Without a subpoena, voluntary compliance on the part of your Internet Service Provider, or additional records from a third party, information stored or retrieved for this purpose alone cannot usually be used to identify you.
Marketing
The technical storage or access is required to create user profiles to send advertising, or to track the user on a website or across several websites for similar marketing purposes.


 Radhika Chandak is a Software Development Engineer at Amazon Prime Video, where she has been working for the past 3 years. Her focus is on creating high-velocity customer experiences, with a particular emphasis on building state-of-the-art search experiences for sports content. Radhika is passionate about developing solutions that solve customer problems and delight users. Her expertise lies in crafting innovative approaches to enhance the Prime Video Sports platform, ensuring seamless and engaging experiences for sports enthusiasts.
 Anna Chalupowicz is a Software Development Manager at Amazon Prime Video Sports, with 6 years of diverse experience within Amazon. For the last 3.5 years, Anna has been working in Prime Video Sports, where she focuses on developing high-scale solutions and architectural approaches that directly benefit customers. With a passion for collaborative learning and knowledge sharing, Anna finds joy in tackling complex technical challenges and using data-driven insights to enhance the customer experience.
 Yaliang Wu is a Software Engineering Manager at AWS, focusing on OpenSearch projects, machine learning, and generative AI applications.