Tag Archives: Application Integration

Accelerate workflow development with enhanced local testing in AWS Step Functions

Post Syndicated from Donnie Prakoso original https://aws.amazon.com/blogs/aws/accelerate-workflow-development-with-enhanced-local-testing-in-aws-step-functions/

Today, I’m excited to announce enhanced local testing capabilities for AWS Step Functions through the TestState API, our testing API.

These enhancements are available through the API, so you can build automated test suites that validate your workflow definitions locally on your development machines, test error handling patterns, data transformations, and mock service integrations using your preferred testing frameworks. This launch introduces an API-based approach for local unit testing, providing programmatic access to comprehensive testing capabilities without deploying to Amazon Web Services (AWS).

There are three key capabilities introduced in this enhanced TestState API:

  • Mocking support – Mock state outputs and errors without invoking downstream services, enabling true unit testing of state machine logic. TestState validates mocked responses against AWS API models with three validation modes: STRICT (this is the default and validates all required fields), PRESENT (validates field types and names), and NONE (no validation), providing high-fidelity testing.

  • Support for all state types – All state types, including advanced states such as Map states (inline and distributed), Parallel states, activity-based Task states, .sync service integration patterns, and .waitForTaskToken service integration patterns, can now be tested. This means you can use TestState API across your entire workflow definition and write unit tests to verify control flow logic, including state transitions, error handling, and data transformations.

  • Testing individual states – Test specific states within a full state machine definition using the new stateName parameter. You can provide the complete state machine definition one time and test each state individually by name. You can control execution context to test specific retry attempts, Map iteration positions, and error scenarios.

Getting started with enhanced TestState
Let me walk you through these new capabilities in enhanced TestState.

Scenario 1: Mock successful results

The first capability is mocking support, which you can use to test your workflow logic without invoking actual AWS services or even external HTTP requests. You can either mock service responses for fast unit testing or test with actual AWS services for integration testing. When using mocked responses, you don’t need AWS Identity and Access Management (IAM) permissions.

Here’s how to mock a successful AWS Lambda function response:

aws stepfunctions test-state --region us-east-1 \
--definition '{
  "Type": "Task",
  "Resource": "arn:aws:states:::lambda:invoke",
  "Parameters": {"FunctionName": "process-order"},
  "End": true
}' \
--mock '{"result":"{\"orderId\":\"12345\",\"status\":\"processed\"}"}' \
--inspection-level DEBUG

This command tests a Lambda invocation state without actually calling the function. TestState validates your mock response against the Lambda service API model so your test data matches what the real service would return.

The response shows the successful execution with detailed inspection data (when using DEBUG inspection level):

{
    "output": "{\"orderId\":\"12345\",\"status\":\"processed\"}",
    "inspectionData": {
        "input": "{}",
        "afterInputPath": "{}",
        "afterParameters": "{\"FunctionName\":\"process-order\"}",
        "result": "{\"orderId\":\"12345\",\"status\":\"processed\"}",
        "afterResultSelector": "{\"orderId\":\"12345\",\"status\":\"processed\"}",
        "afterResultPath": "{\"orderId\":\"12345\",\"status\":\"processed\"}"
    },
    "status": "SUCCEEDED"
}

When you specify a mock response, TestState validates it against the AWS service’s API model so your mocked data conforms to the expected schema, maintaining high-fidelity testing without requiring actual AWS service calls.

Scenario 2: Mock error conditions
You can also mock error conditions to test your error handling logic:

aws stepfunctions test-state --region us-east-1 \
--definition '{
  "Type": "Task",
  "Resource": "arn:aws:states:::lambda:invoke",
  "Parameters": {"FunctionName": "process-order"},
  "End": true
}' \
--mock '{"errorOutput":{"error":"Lambda.ServiceException","cause":"Function failed"}}' \
--inspection-level DEBUG

This simulates a Lambda service exception so you can verify how your state machine handles failures without triggering actual errors in your AWS environment.

The response shows the failed execution with error details:

{
    "error": "Lambda.ServiceException",
    "cause": "Function failed",
    "inspectionData": {
        "input": "{}",
        "afterInputPath": "{}",
        "afterParameters": "{\"FunctionName\":\"process-order\"}"
    },
    "status": "FAILED"
}

Scenario 3: Test Map states
The second capability adds support for previously unsupported state types. Here’s how to test a Distributed Map state:

aws stepfunctions test-state --region us-east-1 \
--definition '{
  "Type": "Map",
  "ItemProcessor": {
    "ProcessorConfig": {"Mode": "DISTRIBUTED", "ExecutionType": "STANDARD"},
    "StartAt": "ProcessItem",
    "States": {
      "ProcessItem": {
        "Type": "Task", 
        "Resource": "arn:aws:states:::lambda:invoke",
        "Parameters": {"FunctionName": "process-item"},
        "End": true
      }
    }
  },
  "End": true
}' \
--input '[{"itemId":1},{"itemId":2}]' \
--mock '{"result":"[{\"itemId\":1,\"status\":\"processed\"},{\"itemId\":2,\"status\":\"processed\"}]"}' \
--inspection-level DEBUG

The mock result represents the complete output from processing multiple items. In this case, the mocked array must match the expected Map state output format.

The response shows successful processing of the array input:

{
    "output": "[{\"itemId\":1,\"status\":\"processed\"},{\"itemId\":2,\"status\":\"processed\"}]",
    "inspectionData": {
        "input": "[{\"itemId\":1},{\"itemId\":2}]",
        "afterInputPath": "[{\"itemId\":1},{\"itemId\":2}]",
        "afterResultSelector": "[{\"itemId\":1,\"status\":\"processed\"},{\"itemId\":2,\"status\":\"processed\"}]",
        "afterResultPath": "[{\"itemId\":1,\"status\":\"processed\"},{\"itemId\":2,\"status\":\"processed\"}]"
    },
    "status": "SUCCEEDED"
}

Scenario 4: Test Parallel states
Similarly, you can test Parallel states that execute multiple branches concurrently:

aws stepfunctions test-state --region us-east-1 \
--definition '{
  "Type": "Parallel",
  "Branches": [
    {"StartAt": "Branch1", "States": {"Branch1": {"Type": "Pass", "End": true}}},
    {"StartAt": "Branch2", "States": {"Branch2": {"Type": "Pass", "End": true}}}
  ],
  "End": true
}' \
--mock '{"result":"[{\"branch1\":\"data1\"},{\"branch2\":\"data2\"}]"}' \
--inspection-level DEBUG

The mock result must be an array with one element per branch. By using TestState, your mock data structure matches what a real Parallel state execution would produce.

The response shows the parallel execution results:

{
    "output": "[{\"branch1\":\"data1\"},{\"branch2\":\"data2\"}]",
    "inspectionData": {
        "input": "{}",
        "afterResultSelector": "[{\"branch1\":\"data1\"},{\"branch2\":\"data2\"}]",
        "afterResultPath": "[{\"branch1\":\"data1\"},{\"branch2\":\"data2\"}]"
    },
    "status": "SUCCEEDED"
}

Scenario 5: Test individual states within complete workflows
You can test specific states within a full state machine definition using the stateName parameter. Here’s an example testing a single state, though you would typically provide your complete workflow definition and specify which state to test:

aws stepfunctions test-state --region us-east-1 \
--definition '{
  "Type": "Task",
  "Resource": "arn:aws:states:::lambda:invoke",
  "Parameters": {"FunctionName": "validate-order"},
  "End": true
}' \
--input '{"orderId":"12345","amount":99.99}' \
--mock '{"result":"{\"orderId\":\"12345\",\"validated\":true}"}' \
--inspection-level DEBUG

This tests a Lambda invocation state with specific input data, showing how TestState processes the input and transforms it through the state execution.

The response shows detailed input processing and validation:

{
    "output": "{\"orderId\":\"12345\",\"validated\":true}",
    "inspectionData": {
        "input": "{\"orderId\":\"12345\",\"amount\":99.99}",
        "afterInputPath": "{\"orderId\":\"12345\",\"amount\":99.99}",
        "afterParameters": "{\"FunctionName\":\"validate-order\"}",
        "result": "{\"orderId\":\"12345\",\"validated\":true}",
        "afterResultSelector": "{\"orderId\":\"12345\",\"validated\":true}",
        "afterResultPath": "{\"orderId\":\"12345\",\"validated\":true}"
    },
    "status": "SUCCEEDED"
}

These enhancements bring the familiar local development experience to Step Functions workflows, helping me to get instant feedback on changes before deploying to my AWS account. I can write automated test suites to validate all Step Functions features with the same reliability as cloud execution, providing confidence that my workflows will work as expected when deployed.

Things to know
Here are key points to note:

  • Availability – Enhanced TestState capabilities are available in all AWS Regions where Step Functions is supported.
  • Pricing – TestState API calls are included with AWS Step Functions at no additional charge.
  • Framework compatibility – TestState works with any testing framework that can make HTTP requests, including Jest, pytest, JUnit, and others. You can write test suites that validate your workflows automatically in your continuous integration and continuous delivery (CI/CD) pipeline before deployment.
  • Feature support – Enhanced TestState supports all Step Functions features including Distributed Map, Parallel states, error handling, and JSONata expressions.
  • Documentation – For detailed options for different configurations, refer to the TestState documentation and API reference for the updated request and response model.

Get started today with enhanced local testing by integrating TestState into your development workflow.

Happy building!
Donnie

Multi Agent Collaboration with Strands

Post Syndicated from Aaron Sempf original https://aws.amazon.com/blogs/devops/multi-agent-collaboration-with-strands/

In the evolving landscape of autonomous systems, multi-agent collaboration is becoming not only feasible but necessary. As agents gain more capabilities, like advanced reasoning, adaptation, and tool use, the challenge shifts from individual performance to effective coordination. The question is no longer “can an agent solve a task?” but “how do we organize execution across many intelligent agents?”

A foundational step toward answering this came with the Supervisor pattern, introduced in our article on creating asynchronous AI agents with Amazon Bedrock. The Supervisor addresses the first generation of coordination challenges by acting as a centralized orchestrator, monitoring and delegating tasks across agents in a structured, serverless workflow. It provides asynchronous orchestration, fallback handling, and state tracking across loosely coupled agents, giving organizations a reliable way to move from single-agent prototypes to multi-agent systems.

Yet as agentic systems scale and become more dynamic, the limitations of static supervision become clear. The Supervisor model assumes a relatively stable set of agents and predictable workflows; but modern systems face constantly shifting tasks, emergent capabilities, and the need for adaptive coordination. This is where the Arbiter pattern emerges as the natural evolution: a next-generation supervisory model that extends the Supervisor with dynamic agent generation, semantic task routing, and blackboard-model-based coordination. By addressing the unpredictability and fluidity of large, evolving agent ecosystems, the Arbiter pattern enables systems not only to manage complexity but to thrive in it.

The Arbiter pattern builds directly on this by adding three key capabilities:

  1. Semantic Capability Matching: Instead of only assigning known tasks to known agents, the Arbiter reasons about what kind of agent should exist for a task—even if that agent doesn’t exist yet.
  2. Delegated Agent Creation: If no suitable agent is found, the Arbiter escalates the request to a Fabricator agent that dynamically generates a task-specific agent on demand. This moves beyond delegation to true adaptive generation.
  3. Task Planning + Contextual Memory: Building on the Supervisors task coordination capability, Arbiter decomposes complex inputs into structured task plans, and uses contextual memory to track execution, retry logic, and agent performance.

In short, the Arbiter transforms static orchestration into adaptive coordination.

The Blackboard Model Revisited

To enable loose, extensible collaboration across agents, the Arbiter Pattern incorporates principles from the blackboard model – a classic architecture from distributed AI. In this model, agents contribute opportunistically to a shared data space (the “blackboard”), reacting to changes and collectively solving problems.

Reference: See “The Blackboard Model of Control” (Hayes-Roth et al.), and early applications like Hearsay-II for foundational research.

In our extended Arbiter Pattern, the blackboard becomes a semantic event substrate. Agents, including the Arbiter, publish and consume task-relevant state, enabling loosely coupled, event-driven collaboration.

How It Works

When an event enters the system, the Arbiter takes on the supervisory role but extends it with greater dynamism and adaptability. Like the Supervisor pattern, it begins by interpreting the event and identifying the required objectives and sub-tasks. It then performs a capability assessment, using a local index or peer-published manifests, much like the Supervisor querying an Agents config table.

  1. Interpretation: The Arbiter uses LLM-based reasoning to extract task objectives and sub-tasks.
  2. Capability Assessment: It evaluates which agents can handle each sub-task using a local index or peer capability manifests.
  3. Delegation or Generation:
    • If a suitable agent exists, the task is routed accordingly.
    • If not, the Arbiter sends a generation request to the fabricator agent.
  4. Blackboard Coordination: All agents involved read/write to a shared semantic blackboard, contributing as needed based on observed task state.
  5. Reflection and Adaptation: Performance data is logged and used to inform future agent creation, adaptation, or deprecation.

Arbiter Pattern Architecture

Unlike the Supervisor, which maintains orchestration through a static config list, the Arbiter introduces a shared semantic blackboard that allows all participating agents to read, write, and coordinate based on evolving task state. This blackboard serves as a dynamic collaboration space, enabling mid-task adaptation and richer multi-agent coordination.

The following Diagram 1: Agentic AI Arbiter pattern implemented as a code example can be downloaded here

Architecture diagram of the Arbiter Pattern for Agentic AI. The diagram illustrates the components and flow of the pattern, showing how multiple AI agents interact with an arbiter to coordinate tasks and decision-making in a structured system

Diagram 1: Agentic AI Arbiter pattern

The following sequence describes the Arbiter pattern, according to the numbered steps in the diagram 1: Agentic AI Arbiter pattern

  1. Events entering the system trigger the Supervisor function
  2. Supervisor queries Agents Config table for agent capabilities
  3. Supervisor uses Agents config list as context to plan orchestration of tasks

Option: New Agent:

If no capable agent is found, the Arbiter goes further than the basic supervisor pattern: it issues a generation request to a fabricator agent, which synthesizes new worker code, stores it for runtime access, and updates the capability registry so the agentic system can immediately benefit from the new skill.

  1. Task cannot be completed, request create new capability
  2. Request to fabricate triggers Fabrication agent instance
  3. Fabrication agent queries resources register for available tools (capabilities)
  4. Fabricator generates worker agent code
  5. Worker agent code stored in bucket for runtime access
  6. New worker added to Agents config list with agent capabilities description
  7. Result of fabrication posted to message bus

Repeat steps 1, 2 & 3

Option: Orchestrate workflow:

If a suitable agent exists, the Arbiter orchestrates the workflow by invoking the appropriate worker agents, tracking progress and state as in the Supervisor model.

  1. Orchestration of tasks is stored for tracking end-to-end process
  2. Request to invoke worker agent, by name/id. Add workflow state for agent invocation.
  3. Request to invoke worker agent triggers worker agent wrapper instance
  4. Worker agent wrapper loads agent code
  5. Worker agent reasons and takes action
  6. Worker agent sends response to message bus
  7. Supervisor agent updates workflow state and tracks against orchestration

The Arbiter incorporates a reflection and adaptation loop: performance data from task execution is logged, analyzed, and fed back into the fabricator and coordination logic. This ensures that not only are tasks completed in the moment, but the system continuously adapts, retires underperforming agents, and evolves toward greater efficiency.

The Arbiter Agent: Event Orchestration Engine

The Supervisor Agent (Arbiter Agent) serves as the central coordinator component, managing complex event-driven workflows through intelligent task delegation.

Event Processing Workflow:

The Arbiter pattern follows a structured approach to handle incoming events

  1. Configuration Loading: Loads available agent configurations from Amazon DynamoDB via load_config_from_dynamodb()
  2. LLM Invocation: Invokes Amazon Bedrock LLM with event context and available tool specifications
  3. Decision Analysis: LLM analyzes the event and returns tool invocation decisions with parameters
  4. Task Dispatch: For each specified tool call:
    • Extracts tool name, input parameters, and tool use ID
    • Dispatches message to corresponding Amazon Simple Queue Service (SQS) queue via process_tool_call()
    • Maintains tool invocation list for workflow tracking

Workflow State Management:

The system maintains comprehensive state tracking throughout execution

  • Creates workflow tracking record in DynamoDB with create_workflow_tracking_record()
  • Initializes all invoked agents as incomplete
  • Associates unique request ID with orchestration instance
  • Persists orchestration state including conversation history and request mapping

Completion Coordination:

The Arbiter coordinates task completion through a systematic process

  1. Event Reception: Receives agent completion events via Amazon EventBridge
  2. Status Updates: Updates workflow tracking with update_workflow_tracking()
  3. Completion Check: Performs completion check across all tracked agents
  4. Result Aggregation: When all agents complete:
    • Aggregates results from DynamoDB data field
    • Appends tool results to conversation as user messages
    • Re-invokes orchestration with updated context
  5. Continuation: Continues until LLM provides final response without tool calls

The Fabricator Agent: Dynamic Capability Generation

The Fabricator Agent implements just-in-time agent development using the Strands agents framework, creating new capabilities when required functionality doesn’t exist in the system.

Agent Development Architecture:

The Fabricator operates as a specialized Strands Agent with specific characteristics

  • Implemented as a Strands Agent with specialized system prompt for code generation
  • Triggered by “New worker agent” events from the Arbiter
  • Receives capability requirements through prompt augmentation with agent directive
  • System prompt includes:
    • Strands Agent implementation examples
    • Complete catalog of available Strands Tools
    • Code generation patterns and conventions
    • Standardized handler() function requirements

Code Generation Process:

The agent follows a structured development workflow

  1. Requirement Analysis: LLM analyzes capability requirements and generates Python implementation
  2. Tool Selection: Prioritizes use of existing Strands Tools over custom @tool implementations
  3. Code Structure: Creates agents following standardized patterns:
    • Bedrock model initialization with models.BedrockModel()
    • Agent instantiation with appropriate tool selection
    • Standardized handler() function interface
    • Event-driven completion signaling
  4. File Creation: Writes generated code to /tmp/ directory for immediate availability

Capability Registration Pipeline:

New capabilities are registered through a multi-step process

  1. File Storage: File upload to Amazon Simple Storage Service (S3) via upload_file_to_s3() tool
  2. Metadata Registration: Registration in DynamoDB via store_agent_config_dynamo():
    • toolId: Unique capability identifier
    • filename: S3 object reference
    • schema: OpenAPI specification for LLM tool calling
    • description: Human-readable capability documentation
    • action: SQS queue routing configuration for Generic Wrapper
  3. Completion Notification: Completion event publication to Arbiter via complete_task() tool

Testing Considerations:

The original implementation revealed important insights about testing approaches

  • Previous Approach: Agent testing within the Fabricator resulted in:
    • Unstructured testing leading to false negatives
    • Overzealous optimization of generated agents
  • Recommendation: Separate testing agent with standardized harness for validation feedback

The Generic Wrapper: Dynamic Execution Runtime

The Generic Wrapper implements a hot-loading pattern that enables unlimited agent creation without infrastructure scaling, providing a universal execution environment for Fabricator-generated agents.

This hot-loading approach is critical because it decouples capability growth from infrastructure scaling. Instead of provisioning and maintaining new infrastructure components for every new agent, which could be dozens or even hundreds of agents, the system reuses a single execution wrapper that can dynamically load and execute arbitrary agent code.

This not only makes agent creation effectively limitless but also ensures infrastructure efficiency, cost optimization, and simplified operations, allowing the Arbiter and Fabricator to evolve system capabilities without operational bottlenecks.

In the AWS Samples code, found here, the Hot-loading handler is implemented as am AWS Lambda function, represented in the following code snippet:

def process_event(event, context):
    orchestration_id = event["orchestration_id"]
    tool_use_id = event["tool_use_id"]
    request = event["tool_input"]
    tool_name = event['node']

    # Based on the tool from the event, load the details from DDB
    tool = load_config_from_dynamodb(tool_name)
    config = tool['config']

    if isinstance(config, str):
        config = json.loads(config)

    file_name = config['filename']

    load_file_from_s3_into_tmp(os.environ["AGENT_BUCKET_NAME"], file_name)

    # Hot load the module from the tmp directory
    spec = importlib.util.spec_from_file_location("module.name", "/tmp/loaded_module.py")
    loaded_module = importlib.util.module_from_spec(spec)
    sys.modules["module.name"] = loaded_module
    spec.loader.exec_module(loaded_module)

    # Invoke the generic handler with whatever args were passed in by the Arbiter
    try:
        print("attempting to use module")
        response = loaded_module.handler(**request)
        print(f"response: {response}")
    except Exception as e:
        print(f"error running module: {e}")
        response = "The task could not be completed, this agent has issues, please ignore for now."

    # Finally. report back to the Arbiter. Handled by the wrapper. To avoid the Frabricator from attempting to code this part itself
    post_task_complete(response, tool_use_id, tool_name, orchestration_id)

Although this example is demonstrated through a lambda function, the Hot-Loading code can be executed in Amazon Bedrock AgentCore Runtime, or AWS native container services, such as Amazon Elastic Container Service (ECS) or Amazon Elastic Kubernetes Service (EKS)

Hot-Loading Architecture:

The wrapper implements several key architectural principles

  • Single infrastructure component handles execution of all dynamically created agents
  • Eliminates need for separate infrastructure provisioning per agent
  • Implements runtime code loading from S3 storage
  • Accepts latency trade-off for infrastructure efficiency in non-ultra-low-latency environment

Dynamic Loading Process:

The system follows a precise loading sequence

  1. Message Processing: Extracts agent identifier from incoming SQS message
  2. Configuration Retrieval: Queries DynamoDB for agent configuration via load_config_from_dynamodb()
  3. Code Download: Downloads agent implementation from S3 to /tmp/ directory
  4. Runtime Loading: Module loading using importlib.util:
    • spec_from_file_location() creates module specification
    • module_from_spec() instantiates module object
    • exec_module() performs actual code loading and execution

Execution Management:

The wrapper provides comprehensive execution oversight

  • Invokes standardized handler() function with provided parameters
  • Captures execution results and handles error conditions gracefully
  • Maintains execution isolation between different agent invocations
  • Implements resource cleanup after agent execution completion

Standardized Communication Protocol:

Communication follows strict standardization to ensure system reliability, which is critical in multi-agent environments where dozens or even hundreds of dynamically generated agents may interact. Without consistent message formats, routing rules, and completion signals, orchestration would become brittle, errors would propagate unpredictably, and debugging would be nearly impossible. Standardization guarantees that every agent, no matter when it was created, can interoperate seamlessly, enabling the Arbiter to maintain end-to-end visibility, traceability, and fault-tolerance across the entire system.

Event Handling Principles:

  • Event posting handled exclusively by Generic Wrapper, not individual agents
  • Ensures consistent event-driven communication patterns across all agents

Completion Event Structure:

  • orchestration_id: Workflow context linkage
  • tool_use_id: LLM tool invocation mapping
  • node: Agent identifier for tracking
  • data: Execution results or error information

Reliability Measures:

  • Publishes completion events to EventBridge for Arbiter processing
  • Guarantees workflow tracking receives completion signals regardless of execution outcome

Scalability Characteristics:

The hot-loading approach provides significant scalability benefits

  • Enables agent scaling creation without minimal infrastructure impact
  • S3 download latency acceptable within overall system performance profile
  • Single wrapper instance can execute multiple agent types
  • Memory and resource management handled at container level

Conclusion

The Arbiter Pattern represents a significant evolution beyond the Supervisor architecture, delivering the flexibility required for truly autonomous agentic systems. By introducing semantically rich, context-aware orchestration, it enables dynamic scalability, where agent capabilities grow in step with task demands. The architecture is resilient, redistributing or regenerating tasks when agents fail, and it achieves loose coupling by having agents interact through semantically meaningful events rather than rigid APIs. Most importantly, it embeds continuous adaptation through Arbiter-guided feedback loops, allowing systems to learn and evolve over time. This marks a shift from pre-programmed logic to generative, blackboard-model-based coordination, paving the way for decentralized, intelligent systems that can learn, adapt, and collaborate effectively at scale.

The system delivers several critical capabilities

  • Asynchronous Processing: SQS-based message passing for scalable execution
  • Persistent State Management (Short-term memory): DynamoDB-based workflow tracking
  • Scalability: Hot-loading architecture for unlimited agent creation
  • Intelligent Orchestration: LLM-driven task decomposition and sequencing
  • Self-Expanding Capabilities: Strands-based agent creation on demand
  • Standardized Communication: Reliable event-driven protocols

This architecture enables processing of arbitrary event types by dynamically creating necessary processing capabilities and coordinating their execution through LLM-driven workflow orchestration, while maintaining infrastructure efficiency through hot-loading patterns.


About the Authors

aaron sempfAaron Sempf is Next Gen Tech Lead for the AWS Partner Organization in Asia-Pacific and Japan. With over 20 years in distributed system engineering design and development, he focuses on solving for large scale complex integration and event driven systems. In his spare time, he can be found coding prototypes for autonomous robots, IoT devices, distributed solutions, and designing agentic architecture patterns for generative AI assisted business automation.

josh tothJoshua Toth is a Senior Prototyping Engineer with over a decade of experience in software engineering and distributed systems. He specializes in solving complex business challenges through technical prototypes, demonstrating the art of the possible. With deep expertise in proof of concept development, he focuses on bridging the gap between emerging technologies and practical business applications. In his spare time, he can be found developing next-generation interactive demonstrations and exploring cutting-edge technological innovations.

Use Apache Airflow workflows to orchestrate data processing on Amazon SageMaker Unified Studio

Post Syndicated from Vinod Jayendra original https://aws.amazon.com/blogs/big-data/use-apache-airflow-workflows-to-orchestrate-data-processing-on-amazon-sagemaker-unified-studio/

Orchestrating machine learning pipelines is complex, especially when data processing, training, and deployment span multiple services and tools. In this post, we walk through a hands-on, end-to-end example of developing, testing, and running a machine learning (ML) pipeline using workflow capabilities in Amazon SageMaker, accessed through the Amazon SageMaker Unified Studio experience. These workflows are powered by Amazon Managed Workflows for Apache Airflow (Amazon MWAA).

While SageMaker Unified Studio includes a visual builder for low-code workflow creation, this guide focuses on the code-first experience: authoring and managing workflows as Python-based Apache Airflow DAGs (Directed Acyclic Graphs). A DAG is a set of tasks with defined dependencies, where each task runs only after its upstream dependencies are complete, promoting correct execution order and making your ML pipeline more reproducible and resilient.We’ll walk through an example pipeline that ingests weather and taxi data, transforms and joins datasets, and uses ML to predict taxi fares—all orchestrated using SageMaker Unified Studio workflows.

If you prefer a simpler, low-code experience, see Orchestrate data processing jobs, querybooks, and notebooks using visual workflow experience in Amazon SageMaker.

Solution overview

This solution demonstrates how SageMaker Unified Studio workflows can be used to orchestrate a complete data-to-ML pipeline in a centralized environment. The pipeline runs through the following sequential tasks, as shown in the preceding diagram.

  • Task 1: Ingest and transform weather data: This task uses a Jupyter notebook in SageMaker Unified Studio to ingest and preprocess synthetic weather data. The synthetic weather dataset includes hourly observations with attributes such as time, temperature, precipitation, and cloud cover. For this task, the focus is on time, temperature, rain, precipitation, and wind speed.
  • Task 2: Ingest, transform and join taxi data: A second Jupyter notebook in SageMaker Unified Studio ingests the raw New York City taxi ride dataset. This dataset includes attributes such as pickup time, drop-off time, trip distance, passenger count, and fare amount. The relevant fields for this task include pickup and drop-off time, trip distance, number of passengers, and total fare amount. The notebook transforms the taxi dataset in preparation for joining it with the weather data. After transformation, the taxi and weather datasets are joined to create a unified dataset, which is then written to Amazon S3 for downstream use.
  • Task 3: Train and predict using ML: A third Jupyter notebook in SageMaker Unified Studio applies regression techniques to the joined dataset to create a model to determine how attributes of the weather and taxi data such as rain and trip distance impact taxi fares and create a fare prediction model. The trained model is then used to generate fare predictions for new trip data.

This unified approach enables orchestration of extract, transform, and load (ETL) and ML steps with full visibility into the data lifecycle and reproducibility through governed workflows in SageMaker Unified Studio.

Prerequisites

Before you begin, complete the following steps:

  1. Create a SageMaker Unified Studio domain: Follow the instructions in Create an Amazon SageMaker Unified Studio domain – quick setup
  2. Sign in to your SageMaker Unified Studio domain: Use the domain you created in Step 1 sign in. For more information, see Access Amazon SageMaker Unified Studio.
  3. Create a SageMaker Unified Studio project: Create a new project in your domain by following the project creation guide. For Project profile, select All capabilities.

Set up workflows

You can use workflows in SageMaker Unified Studio to set up and run a series of tasks using Apache Airflow to design data processing procedures and orchestrate your querybooks, notebooks, and jobs. You can create workflows in Python code, test and share them with your team, and access the Airflow UI directly from SageMaker Unified Studio. It provides features to view workflow details, including run results, task completions, and parameters. You can run workflows with default or custom parameters and monitor their progress. Now that you have your SageMaker Unified Studio project set up, you can build your workflows.

  1. In your SageMaker Unified Studio project, navigate to the Compute section and select Workflow environment.
  2. Choose Create environment to set up a new workflow environment.
  3. Review the options and choose Create environment. By default, SageMaker Unified Studio creates an mw1.micro class environment, which is suitable for testing and small-scale workflows. To update the environment class before project creation, navigate to Domain and select Project Profiles and then All Capabilities and go to OnDemand Workflows blueprint deployment settings. By using these settings, you can override default parameters and tailor the environment to your specific project requirements.

Develop workflows

You can use workflows to orchestrate notebooks, querybooks, and more in your project repositories. With workflows, you can define a collection of tasks organized as a DAG that can run on a user-defined schedule.To get started:

  1. Download Weather Data Ingestion, Taxi Ingest and Join to Weather, and Prediction notebooks to your local environment.
  2. Go to Build and select JupyterLab; choose Upload files and import the three notebooks you downloaded in the previous step.

  1. Configure your SageMaker Unified Studio space: Spaces are used to manage the storage and resource needs of the relevant application. For this demo, configure the space with an ml.m5.8xlarge instance
    1. Choose Configure Space in the right-hand corner and stop the space.
    2. Update instance type to ml.m5.8xlarge and start the space. Any active processes will be paused during the restart, and any unsaved changes will be lost. Updating the workspace might take a take few minutes.
  2. Go to Build and select Orchestration and then Workflows.
  3. Select the down arrow (▼) next to Create new workflow. From the dropdown menu that appears, select Create in code editor.
  4. In the editor, create a new Python file named multinotebook_dag.py under src/workflows/dags. Copy the following DAG code, which implements a sequential ML pipeline that orchestrates multiple notebooks in SageMaker Unified Studio. Replace <REPLACE-OWNER> with your username. Update NOTEBOOK_PATHS to match your actual notebook locations.
from airflow.decorators import dag
from airflow.utils.dates import days_ago
from workflows.airflow.providers.amazon.aws.operators.sagemaker_workflows import NotebookOperator

WORKFLOW_SCHEDULE = '@daily'

NOTEBOOK_PATHS = [
'<REPLACE FULL PATH FOR Weather_Data_Ingestion.ipynb>',
'<REPLACE FULL PATH FOR Taxi_Weather_Data_Collection.ipynb>',
'<REPLACE FULL PATH FOR Prediction.ipynb>'
]

default_args = {
    'owner': '<REPLACE-OWNER>',
}

@dag(
    dag_id='workflow-multinotebooks',
    default_args=default_args,
    schedule_interval=WORKFLOW_SCHEDULE,
    start_date=days_ago(2),
    is_paused_upon_creation=False,
    tags=['MLPipeline'],
    catchup=False
)
def multi_notebook():
    previous_task = None

    for idx, notebook_path in enumerate(NOTEBOOK_PATHS, 1):
        current_task = NotebookOperator(
            task_id=f"Notebook{idx}task",
            input_config={'input_path': notebook_path, 'input_params': {}},
            output_config={'output_formats': ['NOTEBOOK']},
            wait_for_completion=True,
            poll_interval=5
        )

        # Ensure tasks run sequentially
        if previous_task:
            previous_task >> current_task

        previous_task = current_task  # Update previous task

multi_notebook()

The code uses the NotebookOperator to execute three notebooks in order: data ingestion for weather data, data ingestion for taxi data, and the trained model created by combining the weather and taxi data. Each notebook runs as a separate task, with dependencies to help ensure that they execute in sequence. You can customize with your own notebooks. You can modify the NOTEBOOK_PATHS list to orchestrate any number of notebooks in their workflow while maintaining sequential execution order.

The workflow schedule can be customized by updating WORKFLOW_SCHEDULE (for example: '@hourly', '@weekly', or cron expressions like ‘13 2 1 * *’) to match your specific business needs.

  1. After a workflow environment has been created by a project owner, and once you’ve saved your workflows DAG files in JupyterLab, they are automatically synced to the project. After the files are synced, all project members can view the workflows you have added in the workflow environment. See Share a code workflow with other project members in an Amazon SageMaker Unified Studio workflow environment.

Test and monitor workflow execution

  1. To validate your DAG, Go to Build > Orchestration > Workflows. You should now see the workflow running in Local Space based on the Schedule.

  1. Once the execution completes, workflow would change to success start as shown below.

  1. For each execution, you can zoom in to get a detailed workflow run details and task logs

  1. Access the airflow UI from actions for more information on the dag and execution.

Results

The model’s output is written to the Amazon Simple Storage Service (Amazon S3) output folder as shown the following figure. These results should be evaluated for correctness of fit, prediction accuracy, and the consistency of relationships between variables. If any results appear unexpected or unclear, it is important to review the data, engineering steps, and model assumptions to verify that they align with the intended use case.

Clean up

To avoid incurring additional charges associated with resources created as part of this post, make sure you delete the items created in the AWS account for this post.

  1. The SageMaker domain
  2. The S3 bucket associated with the SageMaker domain

Conclusion

In this post, we demonstrated how you can use Amazon SageMaker to build powerful, integrated ML workflows that span the full data and AI/ML lifecycle. You learned how to create an Amazon SageMaker Unified Studio project, use a multi-compute notebook to process data, and use the built-in SQL editor to explore and visualize results. Finally, we showed you how to orchestrate the entire workflow within the SageMaker Unified Studio interface.

SageMaker offers a comprehensive set of capabilities for data practitioners to perform end-to-end tasks, including data preparation, model training, and generative AI application development. When accessed through SageMaker Unified Studio, these capabilities come together in a single, centralized workspace that helps eliminate the friction of siloed tools, services, and artifacts.

As organizations build increasingly complex, data-driven applications, teams can use SageMaker, together with SageMaker Unified Studio, to collaborate more effectively and operationalize their AI/ML assets with confidence. You can discover your data, build models, and orchestrate workflows in a single, governed environment.

To learn more, visit the Amazon SageMaker Unified Studio page.


About the authors

Suba Palanisamy

Suba Palanisamy

Suba is a Enterprise Support Lead, helping customers achieve operational excellence on AWS. Suba is passionate about all things data and analytics. She enjoys traveling with her family and playing board games.

Sean Bjurstrom

Sean Bjurstrom

Sean is a Enterprise Support Lead in ISV accounts at Amazon Web Services, where he specializes in Analytics technologies and draws on his background in consulting to support customers on their analytics and cloud journeys. Sean is passionate about helping businesses harness the power of data to drive innovation and growth. Outside of work, he enjoys running and has participated in several marathons.

Vinod Jayendra

Vinod Jayendra

Vinod is a Enterprise Support Lead in ISV accounts at Amazon Web Services, where he helps customers in solving their architectural, operational, and cost optimization challenges. With a particular focus on Serverless & Analytics technologies, he draws from his extensive background in application development to deliver top-tier solutions. Beyond work, he finds joy in quality family time, embarking on biking adventures, and coaching youth sports team.

Kamen Sharlandjiev

Kamen Sharlandjiev

Kamen is a Senior Worldwide Specialist SA, Big Data expert. He’s on a mission to make life easier for customers who are facing complex data integration and orchestration challenges. His secret weapon? Fully managed AWS services that can get the job done with minimal effort. Follow Kamen on LinkedIn to keep up to date with the latest MWAA and AWS Glue features and news!

AWS Weekly Roundup: Kiro, AWS Lambda remote debugging, Amazon ECS blue/green deployments, Amazon Bedrock AgentCore, and more (July 21, 2025)

Post Syndicated from Donnie Prakoso original https://aws.amazon.com/blogs/aws/aws-weekly-roundup-kiro-aws-lambda-remote-debugging-amazon-ecs-blue-green-deployments-amazon-bedrock-agentcore-and-more-july-21-2025/

I’m writing this as I depart from Ho Chi Minh City back to Singapore. Just realized what a week it’s been, so let me rewind a bit. This week, I tried my first Corne keyboard, wrapped up rehearsals for AWS Summit Jakarta with speakers who are absolutely raising the bar, and visited Vietnam to participate as a technical keynote speaker in AWS Community Day Vietnam, an energetic gathering of hundreds of cloud practitioners and AWS enthusiasts who shared knowledge through multiple technical tracks and networking sessions.

What I presented was a keynote titled “Reinvent perspective as modern developers”, featuring serverless, containers, and how we can cut the learning curves and be more productive with Amazon Q Developer and Kiro. I got a chance to discuss with a couple of AWS Community Builders and community developers, who shared how Amazon Q Developer actually addressed their challenges on building applications, with several highlighting significant productivity improvements and smoother learning curves in their cloud development journeys.

As I head back to Singapore, I’m carrying with me not just memories of delicious cà phê sữa đá (iced milk coffee), but also fresh perspectives and inspirations from this vibrant community of cloud innovators.

Introducing Kiro
One of the highlights from last week was definitely Kiro, an AI IDE that helps you deliver from concept to production through a simplified developer experience for working with AI agents. Kiro goes beyond “vibe coding” with features like specs and hooks that help get prototypes into production systems with proper planning and clarity.

Join the waitlist to get notified when it becomes available.

Last week’s AWS Launches
In other news, last week we had AWS Summit in New York, where we released several services. Here are some launches that caught my attention:

Console to IDE Integration

ECS Blue-Green Deployments

AWS Free Tier Enhanced Benefits

  • Monitor and debug event-driven applications with new Amazon EventBridge logging — Amazon EventBridge now provides enhanced logging capabilities that offer comprehensive event lifecycle tracking with detailed information about successes, failures, and status codes. This new observability feature addresses microservices and event-driven architecture monitoring challenges by providing visibility into the complete event journey.

EventBridge Enhanced Logging

S3 Vectors Overview

  • Amazon EKS enables ultra-scale AI/ML workloads with support for 100k nodes per cluster — Amazon EKS now supports up to 100,000 worker nodes in a single cluster, enabling customers to scale up to 1.6 million AWS Trainium accelerators or 800K NVIDIA GPUs. This industry-leading scale empowers customers to train trillion-parameter models and advance AGI development while maintaining Kubernetes conformance and familiar developer experience.

EKS Ultra-Scale Performance Improvements

From AWS Builder Center
In case you missed it, we just launched AWS Builder Center and integrated community.aws. Here are my top picks from the posts:

Upcoming AWS events
Check your calendars and sign up for upcoming AWS and AWS Community events:

  • AWS re:Invent – Register now to get a head start on choosing your best learning path, booking travel and accommodations, and bringing your team to learn, connect, and have fun. If you’re an early-career professional, you can apply to the All Builders Welcome Grant program, which is designed to remove financial barriers and create diverse pathways into cloud technology.
  • AWS Builders Online Series – If you’re based in one of the Asia Pacific time zones, join and learn fundamental AWS concepts, architectural best practices, and hands-on demonstrations to help you build, migrate, and deploy your workloads on AWS.
  • AWS Summits — Join free online and in-person events that bring the cloud computing community together to connect, collaborate, and learn about AWS. Register in your nearest city: Taipei (July 29), Mexico City (August 6), and Jakarta (June 26–27).
  • AWS Community Days — Join community-led conferences that feature technical discussions, workshops, and hands-on labs led by expert AWS users and industry leaders from around the world: Singapore (August 2), Australia (August 15), Adria (September 5), Baltic (September 10), and Aotearoa (September 18).

You can browse all upcoming AWS led in-person and virtual developer-focused events.

That’s all for this week. Check back next Monday for another Weekly Roundup!

Donnie

This post is part of our Weekly Roundup series. Check back each week for a quick roundup of interesting news and announcements from AWS!


Join Builder ID: Get started with your AWS Builder journey at builder.aws.com

Monitor and debug event-driven applications with new Amazon EventBridge logging

Post Syndicated from Donnie Prakoso original https://aws.amazon.com/blogs/aws/monitor-and-debug-event-driven-applications-with-new-amazon-eventbridge-logging/

Starting today, you can use enhanced logging capability in Amazon EventBridge to monitor and debug your event-driven applications with comprehensive logs. These new enhancements help improve how you monitor and troubleshoot event flows.

Here’s how you can find this new capability on the Amazon EventBridge console:

The new observability capabilities address microservices and event-driven architecture monitoring challenges by providing comprehensive event lifecycle tracking. EventBridge now generates detailed log entries every time a matched event against rules is published, delivered to subscribers, or encounters failures and retries.

You gain visibility into the complete event journey with detailed information about successes, failures, and status codes that make identifying and diagnosing issues straightforward. What used to take hours of trial-and-error debugging now takes minutes with detailed event lifecycle tracking and built-in query tools.

Using Amazon EventBridge enhanced observability
Let me walk you through a demonstration that showcases the logging capability in Amazon EventBridge.

I can enable logging for an existing event bus or when creating a new custom event bus. First, I navigate to the EventBridge console and choose Event buses in the left navigation pane. In Custom event bus, I choose Create event bus.

I can see this new capability in the Logs section. I have three options to configure the Log destination: Amazon CloudWatch Logs, Amazon Data Firehose Stream, and Amazon Simple Storage Service (Amazon S3). If I want to stream my logs into a data lake, I can select Amazon Kinesis Data Firehose Stream. Logs are encrypted in transit with TLS and at rest if a customer-managed key (CMK) is provided for the event bus. CloudWatch Logs supports customer-managed keys, and Data Firehose offers server-side encryption for downstream destinations.

For this demo, I select CloudWatch logs and S3 logs.

I can also choose Log level, from Error, Info, or Trace. I choose Trace and select Include execution data because I need to review the payloads. You need to be mindful as logging payload data may contain sensitive information, and this setting applies to all log destinations you select. Then, I configure two destinations, one each for CloudWatch log group and S3 logs. Then I choose Create.

After logging is enabled, I can start publishing test events to observe the logging behavior.

For the first scenario, I’ve built an AWS Lambda function and configured this Lambda function as a target.

I navigate to my event bus to send a sample event by choosing Send events.

Here’s the payload that I use:

{
  "Source": "ecommerce.orders",
  "DetailType": "Order Placed",
  "Detail": {
    "orderId": "12345",
    "customerId": "cust-789",
    "amount": 99.99,
    "items": [
      {
        "productId": "prod-456",
        "quantity": 2,
        "price": 49.99
      }
    ]
  }
}

After I sent the sample event, I can see the logs are available in my S3 bucket.

I can also see the log entries appearing in the Amazon CloudWatch logs. The logs show the event lifecycle, from EVENT_RECEIPT to SUCCESS. Learn more about the complete event lifecycle on TBD:DOC_PAGE.

Now, let’s evaluate these logs. For brevity, I only include a few logs and have redacted them for readability. Here’s the log from when I triggered the event:

{
    "resource_arn": "arn:aws:events:us-east-1:123:event-bus/demo-logging",
    "message_timestamp_ms": 1751608776896,
    "event_bus_name": "demo-logging",
// REDACTED FOR BREVITY //
    "message_type": "EVENT_RECEIPT",
    "log_level": "TRACE",
    "details": {
        "caller_account_id": "123",
        "source_time_ms": 1751608775000,
        "source": "ecommerce.orders",
        "detail_type": "Order Placed",
        "resources": [],
        "event_detail": "REDACTED FOR BREVITY"
    }
}

Here’s the log when the event was successfully invoked:

{
    "resource_arn": "arn:aws:events:us-east-1:123:event-bus/demo-logging",
    "message_timestamp_ms": 1751608777091,
    "event_bus_name": "demo-logging",
// REDACTED FOR BREVITY //
    "message_type": "INVOCATION_SUCCESS",
    "log_level": "INFO",
    "details": {
// REDACTED FOR BREVITY //
        "total_attempts": 1,
        "final_invocation_status": "SUCCESS",
        "ingestion_to_start_latency_ms": 105,
        "ingestion_to_complete_latency_ms": 183,
        "ingestion_to_success_latency_ms": 183,
        "target_duration_ms": 53,
        "target_response_body": "<REDACTED FOR BREVITY>",
        "http_status_code": 202
    }
}

The additional log entries include rich metadata that makes troubleshooting straightforward. For example, on a successful event, I can see the latency timing from starting to completing the event, duration for the target to finish processing, and HTTP status code.

Debugging failures with complete event lifecycle tracking
The benefit of EventBridge logging becomes apparent when things go wrong. To test failure scenarios, I intentionally misconfigure a Lambda function’s permissions and change the rule to point to a different Lambda function without proper permissions.

The attempt failed with a permanent failure due to missing permissions. The log shows it’s a FIRST attempt that resulted in NO_PERMISSIONS status.

{
    "message_type": "INVOCATION_ATTEMPT_PERMANENT_FAILURE",
    "log_level": "ERROR",
    "details": {
        "rule_arn": "arn:aws:events:us-east-1:123:rule/demo-logging/demo-order-placed",
        "role_arn": "arn:aws:iam::123:role/service-role/Amazon_EventBridge_Invoke_Lambda_123",
        "target_arn": "arn:aws:lambda:us-east-1:123:function:demo-evb-fail",
        "attempt_type": "FIRST",
        "attempt_count": 1,
        "invocation_status": "NO_PERMISSIONS",
        "target_duration_ms": 25,
        "target_response_body": "{\"requestId\":\"a4bdfdc9-4806-4f3e-9961-31559cb2db62\",\"errorCode\":\"AccessDeniedException\",\"errorType\":\"Client\",\"errorMessage\":\"User: arn:aws:sts::123:assumed-role/Amazon_EventBridge_Invoke_Lambda_123/db4bff0a7e8539c4b12579ae111a3b0b is not authorized to perform: lambda:InvokeFunction on resource: arn:aws:lambda:us-east-1:123:function:demo-evb-fail because no identity-based policy allows the lambda:InvokeFunction action\",\"statusCode\":403}",
        "http_status_code": 403
    }
}

The final log entry summarizes the complete failure with timing metrics and the exact error message.

{
    "message_type": "INVOCATION_FAILURE",
    "log_level": "ERROR",
    "details": {
        "rule_arn": "arn:aws:events:us-east-1:123:rule/demo-logging/demo-order-placed",
        "role_arn": "arn:aws:iam::123:role/service-role/Amazon_EventBridge_Invoke_Lambda_123",
        "target_arn": "arn:aws:lambda:us-east-1:123:function:demo-evb-fail",
        "total_attempts": 1,
        "final_invocation_status": "NO_PERMISSIONS",
        "ingestion_to_start_latency_ms": 62,
        "ingestion_to_complete_latency_ms": 114,
        "target_duration_ms": 25,
        "http_status_code": 403
    },
    "error": {
        "http_status_code": 403,
        "error_message": "User: arn:aws:sts::123:assumed-role/Amazon_EventBridge_Invoke_Lambda_123/db4bff0a7e8539c4b12579ae111a3b0b is not authorized to perform: lambda:InvokeFunction on resource: arn:aws:lambda:us-east-1:123:function:demo-evb-fail because no identity-based policy allows the lambda:InvokeFunction action",
        "aws_service": "AWSLambda",
        "request_id": "a4bdfdc9-4806-4f3e-9961-31559cb2db62"
    }
}

The logs provide detailed performance metrics that help identify bottlenecks. The ingestion_to_start_latency_ms: 62 shows the time from event ingestion to starting invocation, while ingestion_to_complete_latency_ms: 114 represents the total time from ingestion to completion. Additionally, target_duration_ms: 25 indicates how long the target service took to respond, helping distinguish between EventBridge processing time and target service performance.

The error message clearly states what failed, lambda:InvokeFunction action, why it failed, (no identity-based policy allows the action), which role was involved (Amazon_EventBridge_Invoke_Lambda_1428392416), and which specific resource was affected, which was indicated by the Lambda function Amazon Resource Name (ARN).

Debugging API Destinations with EventBridge Logging
One particular use case that I think EventBridge logging capability will be helpful is to debug issues with API destinations. EventBridge API destinations are HTTPS endpoints that you can invoke as the target of an event bus rule or pipe. HTTPS endpoints help you to route events from your event bus to external systems, software-as-a-service (SaaS) applications, or third-party APIs using HTTPS calls. They use connections to handle authentication and credentials, making it easy to integrate your event-driven architecture with any HTTPS-based service. 

API destinations are commonly used to send events to external HTTPS endpoints and debugging failures from the external endpoint can be a challenge. These problems typically stem from changes to the endpoint authentication requirements or modified credentials.

To demonstrate this debugging capability, I intentionally configured an API destination with incorrect credentials in the connection resource.

When I send an event to this misconfigured endpoint, the enhanced logging shows the root cause of this failure.

{
    "resource_arn": "arn:aws:events:us-east-1:123:event-bus/demo-logging",
    "message_timestamp_ms": 1750344097251,
    "event_bus_name": "demo-logging",
    //REDACTED FOR BREVITY//,
    "message_type": "INVOCATION_FAILURE",
    "log_level": "ERROR",
    "details": {
        //REDACTED FOR BREVITY//,
        "total_attempts": 1,
        "final_invocation_status": "SDK_CLIENT_ERROR",
        "ingestion_to_start_latency_ms": 135,
        "ingestion_to_complete_latency_ms": 549,
        "target_duration_ms": 327,
        "target_response_body": "",
        "http_status_code": 400
    },
    "error": {
        "http_status_code": 400,
        "error_message": "Unable to invoke ApiDestination endpoint: The request failed because the credentials included for the connection are not authorized for the API destination."
    }
}

The log provides immediate clarity about the failure. The target_arn shows this involves an API destination, the final_invocation_status indicates SDK_CLIENT_ERROR, and the http_status_code of 400 , which points to a client-side issue. Most importantly, the error_message explicitly states that: Unable to invoke ApiDestination endpoint: The request failed because the credentials included for the connection are not authorized for the API destination.

This complete log sequence provides useful debugging insights because I can see exactly how the event moved through EventBridge — from event receipt, to ingestion, to rule matching, to invocation attempts. This level of detail eliminates guesswork and points directly to the root cause of the issue.

Additional things to know
Here are a couple of things to note:

  • Architecture support – Logging works with all EventBridge features including custom event buses, partner event sources, and API destinations for HTTPS endpoints.
  • Performance impact – Logging operates asynchronously with no measurable impact on event processing latency or throughput.
  • Pricing – You pay standard Amazon S3, Amazon CloudWatch Logs or Amazon Data Firehose pricing for log storage and delivery. EventBridge logging itself incurs no additional charges. For details, visit the Amazon EventBridge pricing page .
  • Availability – Amazon EventBridge logging capability is available in all AWS Regions where EventBridge is supported.
  • Documentation — For more details, refer to the Amazon EventBridge monitoring and debugging Documentation.

Get started with Amazon EventBridge logging capability by visiting the EventBridge console and enabling logging on your event buses.

Happy building!
— Donnie 

AWS Weekly roundup: EventBridge, SNS FIFO, Amazon Corretto, Amazon Connect, Amazon Bedrock, and more

Post Syndicated from Sébastien Stormacq original https://aws.amazon.com/blogs/aws/aws-weekly-roundup-eventbridge-sns-fifo-amazon-corretto-amazon-connect-amazon-bedrock-and-more/

I counted about 40 new launches from AWS since last week – back to our normal rhythm of releases. Services teams are listening to your feedback and developing little (or big) changes that makes your life easier when working with our services. The ability to support multiple sessions in the AWS Console is my favorite one so far in 2025.

But our teams didn’t stop there, let’s look at the last week’s new announcements.

Last week’s launches

Beside the usual Regional expansion (new capabilities that are now available in a new Region), here are the launches that got my attention.

Amazon EventBridge announces direct delivery to cross-account targetsAmazon EventBridge is now able to deliver events to targets in another AWS account directly without having to send them to the default bus in the target account first. This will simplify so many architectures out there! It supports any target that supports resource-based policies, including AWS Lambda, Amazon Simple Queue Service (Amazon SQS), Amazon Simple Notification Service (Amazon SNS), Amazon Kinesis, and Amazon API Gateway.

Amazon Corretto quaterly update – We announced quarterly security and critical updates for Amazon Corretto Long-Term Supported (LTS) and Feature Release (FR) versions of OpenJDK. Corretto 23.0.2, 21.0.6, 17.0.14, 11.0.26, 8u442 are now available for download. Amazon Corretto is a no-cost, multi-platform, production-ready distribution of OpenJDK. You can download the updates from the Corretto home page or just type apt-get or yum update.

High-throughput mode for Amazon SNS FIFO Topics – Amazon SNS now supports high-throughput mode for SNS FIFO topics, with default throughput matching SNS standard topics across all Regions. When you enable high-throughput mode, SNS FIFO topics will maintain order within message group, while reducing the deduplication scope to the message-group level. With this change, you can leverage up to 30K messages per second (MPS) per account by default in US East (N. Virginia) Region, and 9K MPS per account in US West (Oregon) and Europe (Ireland) Regions, and request quota increases for additional throughput in any Region.

Amazon Connect agent workspace now supports audio optimization for Citrix and Amazon WorkSpaces virtual desktopsAmazon Connect agent workspace now supports the ability to redirect audio from Citrix and Amazon WorkSpaces Virtual Desktop Infrastructure (VDI) environments to a customer service agent’s local device. Audio redirection improves voice quality and reduces latency for voice calls handled on virtual desktops, providing a better experience for both end customers and agents.

Amazon Redshift announces support for History Mode for zero-ETL integrationsThis new capability enables you to build Type 2 Slowly Changing Dimension (SCD 2) tables on your historical data from databases, out-of-the-box in Amazon Redshift, without writing any code. History mode simplifies the process of tracking and analyzing historical data changes, allowing you to gain valuable insights from your data’s evolution over time.

Finally, Amazon Bedrock has its own set of announcements. First, for anyone investing in retrieval-augmented generation, Bedrock now support multimodal content with Cohere Embed 3 Multilingual and Embed 3 English models. This enables you to create embeddings to not only index text, but also images.

Second, read Luma AI’s Ray2 visual AI model now available in Amazon Bedrock. Luma Ray2 is a large-scale video-generation model capable of creating realistic visuals with fluid, natural movement. With Luma Ray2 in Amazon Bedrock, you can generate production-ready video clips with seamless animations, ultrarealistic details, and logical event sequences with natural language prompts, removing the need for technical prompt engineering. Ray2 currently supports 5- and 9-second video generations with 540p and 720p resolution.

And finally, Amazon Bedrock Flows announces preview of multi-turn conversation support. Amazon Bedrock Flows enables you to link foundation models (FMs), Amazon Bedrock Prompts, Amazon Bedrock Agents, Amazon Bedrock Knowledge Bases, Amazon Bedrock Guardrails and other AWS services together to build and scale pre-defined generative AI workflows. This week, the team announced preview of multi-turn conversation support for agent nodes in Flows. This capability enables dynamic, back-and-forth conversations between users and flows, similar to a natural dialogue.

For a full list of AWS announcements, be sure to keep an eye on the What’s New at AWS page.

Other AWS events
Check your calendar and sign up for upcoming AWS events.

AWS Summits season is starting! I’m already working with the local team to prepare content for the Summits in Paris and London. Summits are free online and in-person events that bring the cloud computing community together to connect, collaborate, and learn about AWS. Stay updated by visiting the official AWS Summit website and sign up for notifications to learn when registration opens for events in your area.

AWS GenAI Lofts are collaborative spaces and immersive experiences that showcase AWS expertise in cloud computing and AI. They provide startups and developers with hands-on access to AI products and services, exclusive sessions with industry leaders, and valuable networking opportunities with investors and peers. Find a GenAI Loft location near you, and don’t forget to register.

Browse all upcoming AWS led in-person and virtual events here.

That’s all for this week. Check back next Monday for another Weekly Roundup!

— seb

This post is part of our Weekly Roundup series. Check back each week for a quick roundup of interesting news and announcements from AWS!

Introducing simplified interaction with the Airflow REST API in Amazon MWAA

Post Syndicated from Chandan Rupakheti original https://aws.amazon.com/blogs/big-data/introducing-simplified-interaction-with-the-airflow-rest-api-in-amazon-mwaa/

Amazon Managed Workflows for Apache Airflow (Amazon MWAA) is a fully managed service that builds upon Apache Airflow, offering its benefits while eliminating the need for you to set up, operate, and maintain the underlying infrastructure, reducing operational overhead while increasing security and resilience.

Today, we are excited to announce an enhancement to the Amazon MWAA integration with the Airflow REST API. This improvement streamlines the ability to access and manage your Airflow environments and their integration with external systems, and allows you to interact with your workflows programmatically. The Airflow REST API facilitates a wide range of use cases, from centralizing and automating administrative tasks to building event-driven, data-aware data pipelines.

In this post, we discuss the enhancement and present several use cases that the enhancement unlocks for your Amazon MWAA environment.

Airflow REST API

The Airflow REST API is a programmatic interface that allows you to interact with Airflow’s core functionalities. It’s a set of HTTP endpoints to perform operations such as invoking Directed Acyclic Graphs (DAGs), checking task statuses, retrieving metadata about workflows, managing connections and variables, and even initiating dataset-related events, without directly accessing the Airflow web interface or command line tools.

Before today, Amazon MWAA provided the foundation for interacting with the Airflow REST API. Though functional, the process of obtaining and managing access tokens and session cookies added complexity to the workflow. Amazon MWAA now supports a simplified mechanism for interacting with the Airflow REST API using AWS credentials, significantly reducing complexity and improving overall usability.

Enhancement overview

The new InvokeRestApi capability allows you to run Airflow REST API requests with a valid SigV4 signature using your existing AWS credentials. This feature is now available to all Amazon MWAA environments (2.4.3+) in supported Amazon MWAA AWS Regions. By acting as an intermediary, this REST API processes requests on behalf of users, requiring only the environment name and API request payload as inputs.

Integrating with the Airflow REST API through the enhanced Amazon MWAA API provides several key benefits:

  • Simplified integration – The new InvokeRestApi capability in Amazon MWAA removes the complexity of managing access tokens and session cookies, making it straightforward to interact with the Airflow REST API.
  • Improved usability – By acting as an intermediary, the enhanced API delivers Airflow REST API execution results directly to the client, reducing complexity and improving overall usability.
  • Automated administration – The simplified REST API access enables automating various administrative and management tasks, such as managing Airflow variables, connections, slot pools, and more.
  • Event-driven architectures – The enhanced API facilitates seamless integration with external events, enabling the triggering of Airflow DAGs based on these events. This supports the growing emphasis on event-driven data pipelines.
  • Data-aware scheduling – Using the dataset-based scheduling feature in Airflow, the enhanced API enables the Amazon MWAA environment to manage the incoming workload and scale resources accordingly, improving the overall reliability and efficiency of event-driven pipelines.

In the following sections, we demonstrate how to use the enhanced API in various use cases.

How to use the enhanced Amazon MWAA API

The following code snippet shows the general request format for the enhanced REST API:

POST /restapi/Name HTTP/1.1
Content-type: application/json

{
    Name: String,
    Method: String,
    Path: String,
    QueryParameters: Json,
    Body: Json
}

The Name of the Amazon MWAA environment, the Path of the Airflow REST API endpoint to be called, and the HTTP Method to use are the required parameters, whereas QueryParameters and Body are optional and can be used as needed in the API calls.

The following code snippet shows the general response format:

{
    RestApiStatusCode: Number,
    RestApiResponse: Json
}

The RestApiStatusCode represents the HTTP status code returned by the Airflow REST API call, and the RestApiResponse contains the response payload from the Airflow REST API.

The following sample code snippet showcases how to update the description field of an Airflow variable using the enhanced integration. The call uses the AWS Python SDK to invoke the Airflow REST API for the task.

import boto3

# Create a boto3 client
mwaa_client = boto3.client("mwaa")

# Call the enhanced REST API using boto3 client
# Using QueryParameters, you can selectively specify the field to be updated
# Without QueryParameters, all fields will be updated
response = mwaa_client.invoke_rest_api(
    Name="<your-environment-name>",
    Method="PATCH",
    Path=f"/variables/<your-variable-key>",
    Body={
        "key": "<key>",
        "value": "<value>",
        "description": "<description>"
    },
    QueryParameters={
        "update_mask": ["description"]
    }
)

# Access the outputs of the REST call
status_code = response["RestApiStatusCode"]
result = response['RestApiResponse']

To make the invoke_rest_api SDK call, the calling client should have an AWS Identity and Access Management (IAM) principal of airflow:InvokeRestAPI attached to call the requisite environment. The permission can be scoped to specific Airflow roles (Admin, Op, User, Viewer, or Public) to control access levels.

This simple yet powerful REST API supports various use cases for your Amazon MWAA environments. Let’s review some important ones in the subsequent sections.

Automate administration and management tasks

Prior to this launch, to automate configurations and setup of resources such as variables, connections, slot pools, and more, you had to develop a lengthy boilerplate code to make API requests to the Amazon MWAA web servers. You had to handle the cookie and session management in the process. You can simplify this automation with the new enhanced REST API support.

For this example, let’s assume you want to automate maintaining your Amazon MWAA environment variables. You need to perform API operations such as create, read, update, and delete on Airflow variables to achieve this task. The following is a simple Python client to do so (mwaa_variables_client.py):

import boto3

# Client for managing MWAA environment variables
class MWAAVariablesClient:
    # Initialize the client with environment name and optional MWAA boto3 client
    def __init__(self, env_name, mwaa_client=None):
        self.env_name = env_name
        self.client = mwaa_client or boto3.client("mwaa")

    # List all variables in the MWAA environment
    def list(self):
        response = self.client.invoke_rest_api(
            Name=self.env_name,
            Method="GET",
            Path="/variables"
        )

        output = response['RestApiResponse']['variables']
        return output

    # Get a specific variable by key
    def get(self, key):
        response = self.client.invoke_rest_api(
            Name=self.env_name,
            Method="GET",
            Path=f"/variables/{key}"
        )

        return response['RestApiResponse']

    # Create a new variable with key, value, and optional description
    def create(self, key, value, description=None):
        response = self.client.invoke_rest_api(
            Name=self.env_name,
            Method="POST",
            Path="/variables",
            Body={
                "key": key,
                "value": value,
                "description": description
            }
        )

        return response['RestApiResponse']
    
    # Update an existing variable's value and description
    def update(self, key, value, description, query_parameters=None):
        response = self.client.invoke_rest_api(
            Name=self.env_name,
            Method="PATCH",
            Path=f"/variables/{key}",
            Body={
                "key": key,
                "value": value,
                "description": description
            },
            QueryParameters=query_parameters
        )

        return response['RestApiResponse']

    # Delete a variable by key
    def delete(self, key):
        response = self.client.invoke_rest_api(
            Name=self.env_name,
            Method="DELETE",
            Path=f"/variables/{key}"
        )
        return response['RestApiStatusCode']

if __name__ == "__main__":
    client = MWAAVariablesClient("<your-mwaa-environment-name>")

    print("\nCreating a test variable ...")
    response = client.create(
        key="test",
        value="Test value",
        description="Test description"
    )
    print(response)

    print("\nListing all variables ...")
    variables = client.list()
    print(variables)

    print("\nGetting the test variable ...")
    response = client.get("test")
    print(response)

    print("\nUpdating the value and description of test variable ...")
    response = client.update(
        key="test",
        value="Updated Value",
        description="Updated description"
    )
    print(response)

    print("\nUpdating only description of test variable ...")
    response = client.update(
        key="test", 
        value="Updated Value", 
        description="Yet another updated description", 
        query_parameters={ "update_mask": ["description"] }
    )
    print(response)

    print("\nDeleting the test variable ...")
    response_code = client.delete("test")
    print(f"Response code: {response_code}")

    print("\nFinally, getting the deleted test variable ...")
    try:
        response = client.get("test")
        print(response)
    except Exception as e:
        print(e.response["RestApiResponse"])

Assuming that you have configured your terminal with appropriate AWS credentials, you can run the preceding Python script to achieve the following results:

$python mwaa_variables_client.py 

Creating a test variable ...
{'description': 'Test description', 'key': 'test', 'value': 'Test value'}

Listing all variables ...
[{'key': 'test', 'value': 'Test value'}]

Getting the test variable ...
{'key': 'test', 'value': 'Test value'}

Updating the value and description of test variable ...
{'description': 'Updated description', 'key': 'test', 'value': 'Updated Value'}

Updating only description of test variable ...
{'description': 'Yet another updated description', 'key': 'test', 'value': 'Updated Value'}

Deleting the test variable ...
Response code: 204

Finally, getting the deleted test variable ...
{'detail': 'Variable does not exist', 'status': 404, 'title': 'Variable not found', 'type': 'https://airflow.apache.org/docs/apache-airflow/2.8.1/stable-rest-api-ref.html#section/Errors/NotFound'}

Let’s further explore other useful use cases.

Build event-driven data pipelines

The Airflow community has been actively innovating to enhance the platform’s data awareness, enabling you to build more dynamic and responsive workflows. When we announced support for version 2.9.2 in Amazon MWAA, we introduced capabilities that allow pipelines to react to changes in datasets, both within Airflow environments and in external systems. The new simplified integration with the Airflow REST API makes the implementation of data-driven pipelines more straightforward.

Consider a use case where you need to run a pipeline that uses input from an external event. The following sample DAG runs a bash command supplied as a parameter (any_bash_command.py):

"""
This DAG allows you to execute a bash command supplied as a parameter to the DAG.
The command is passed as a parameter called `command` in the DAG configuration.
"""

from airflow import DAG
from airflow.operators.bash_operator import BashOperator
from airflow.models.param import Param

from datetime import datetime

with DAG(
    dag_id="any_bash_command", 
    schedule=None, 
    start_date=datetime(2022, 1, 1), 
    catchup=False,
    params={
        "command": Param("env", type="string")
    },
) as dag:
    cli_command = BashOperator(
        task_id="triggered_bash_command",
        bash_command="{{ dag_run.conf['command'] }}"
    )

With the help of the enhanced REST API, you can create a client that can invoke this DAG, supplying the bash command of your choice as follows (mwaa_dag_run_client.py):

import boto3

# Client for triggering DAG runs in Amazon MWAA
class MWAADagRunClient:
    # Initialize the client with MWAA environment name and optional MWAA boto3 client
    def __init__(self, env_name, mwaa_client=None):
        self.env_name = env_name
        self.client = mwaa_client or boto3.client("mwaa")

    # Trigger a DAG run with specified parameters
    def trigger_run(self, 
            dag_id, 
            dag_run_id=None,
            logical_date=None,
            data_interval_start=None,
            data_interval_end=None,
            note=None,
            conf=None,
    ):
        body = {}
        if dag_run_id:
            body["dag_run_id"] = dag_run_id
        if logical_date:
            body["logical_date"] = logical_date
        if data_interval_start:
            body["data_interval_start"] = data_interval_start
        if data_interval_end:
            body["data_interval_end"] = data_interval_end
        if note:
            body["note"] = note
        body["conf"] = conf or {}            

        response = self.client.invoke_rest_api(
            Name=self.env_name,
            Method="POST",
            Path=f"/dags/{dag_id}/dagRuns",
            Body=body
        )
        return response['RestApiResponse']

if __name__ == "__main__":
    client = MWAADagRunClient("<your-mwaa-environment-name>")
	
    print("\nTriggering a dag run ...")
    result = client.trigger_run(
        dag_id="any_bash_command", 
        conf={
            "command": "echo 'Hello from external trigger!'"
        }
    )
    print(result)

The following snippet shows a sample run of the script:

$python mwaa_dag_run_client.py
Triggering a dag run ...
{'conf': {'command': "echo 'Hello from external trigger!'"}, 'dag_id': 'any_bash_command', 'dag_run_id': 'manual__2024-10-21T16:56:09.852908+00:00', 'data_interval_end': '2024-10-21T16:56:09.852908+00:00', 'data_interval_start': '2024-10-21T16:56:09.852908+00:00', 'execution_date': '2024-10-21T16:56:09.852908+00:00', 'external_trigger': True, 'logical_date': '2024-10-21T16:56:09.852908+00:00', 'run_type': 'manual', 'state': 'queued'}

On the Airflow UI, the trigger_bash_command task shows the following execution log:

[2024-10-21, 16:56:12 UTC] {local_task_job_runner.py:123} ▶ Pre task execution logs
[2024-10-21, 16:56:12 UTC] {subprocess.py:63} INFO - Tmp dir root location: /tmp
[2024-10-21, 16:56:12 UTC] {subprocess.py:75} INFO - Running command: ['/usr/bin/bash', '-c', "echo 'Hello from external trigger!'"]
[2024-10-21, 16:56:12 UTC] {subprocess.py:86} INFO - Output:
[2024-10-21, 16:56:12 UTC] {subprocess.py:93} INFO - Hello from external trigger!
[2024-10-21, 16:56:12 UTC] {subprocess.py:97} INFO - Command exited with return code 0
[2024-10-21, 16:56:12 UTC] {taskinstance.py:340} ▶ Post task execution logs

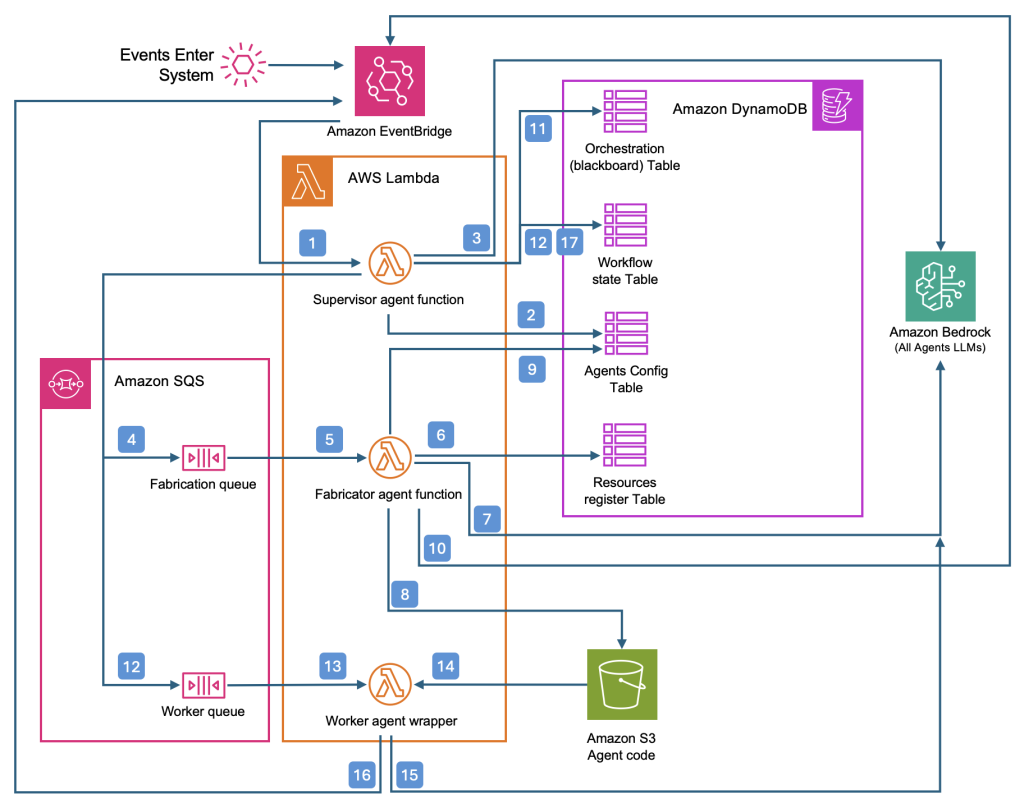
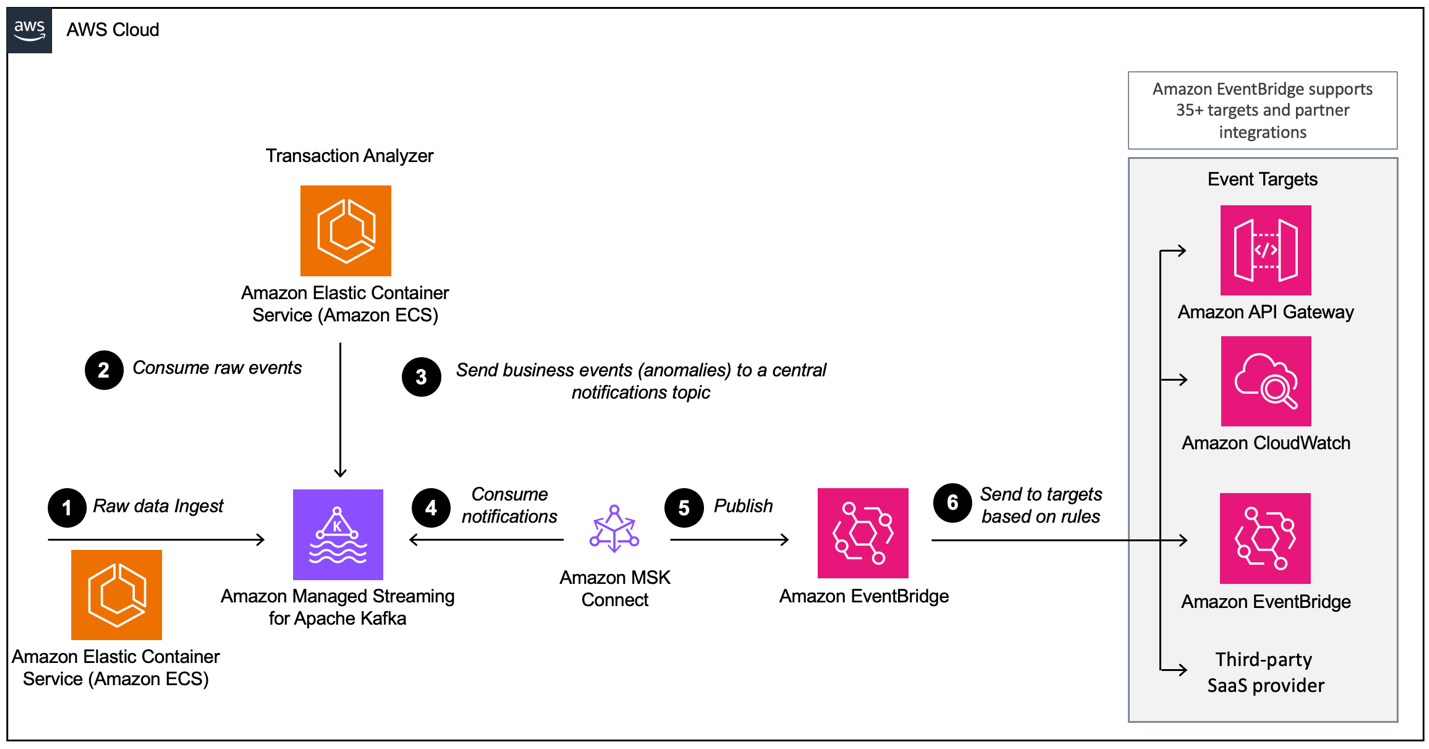
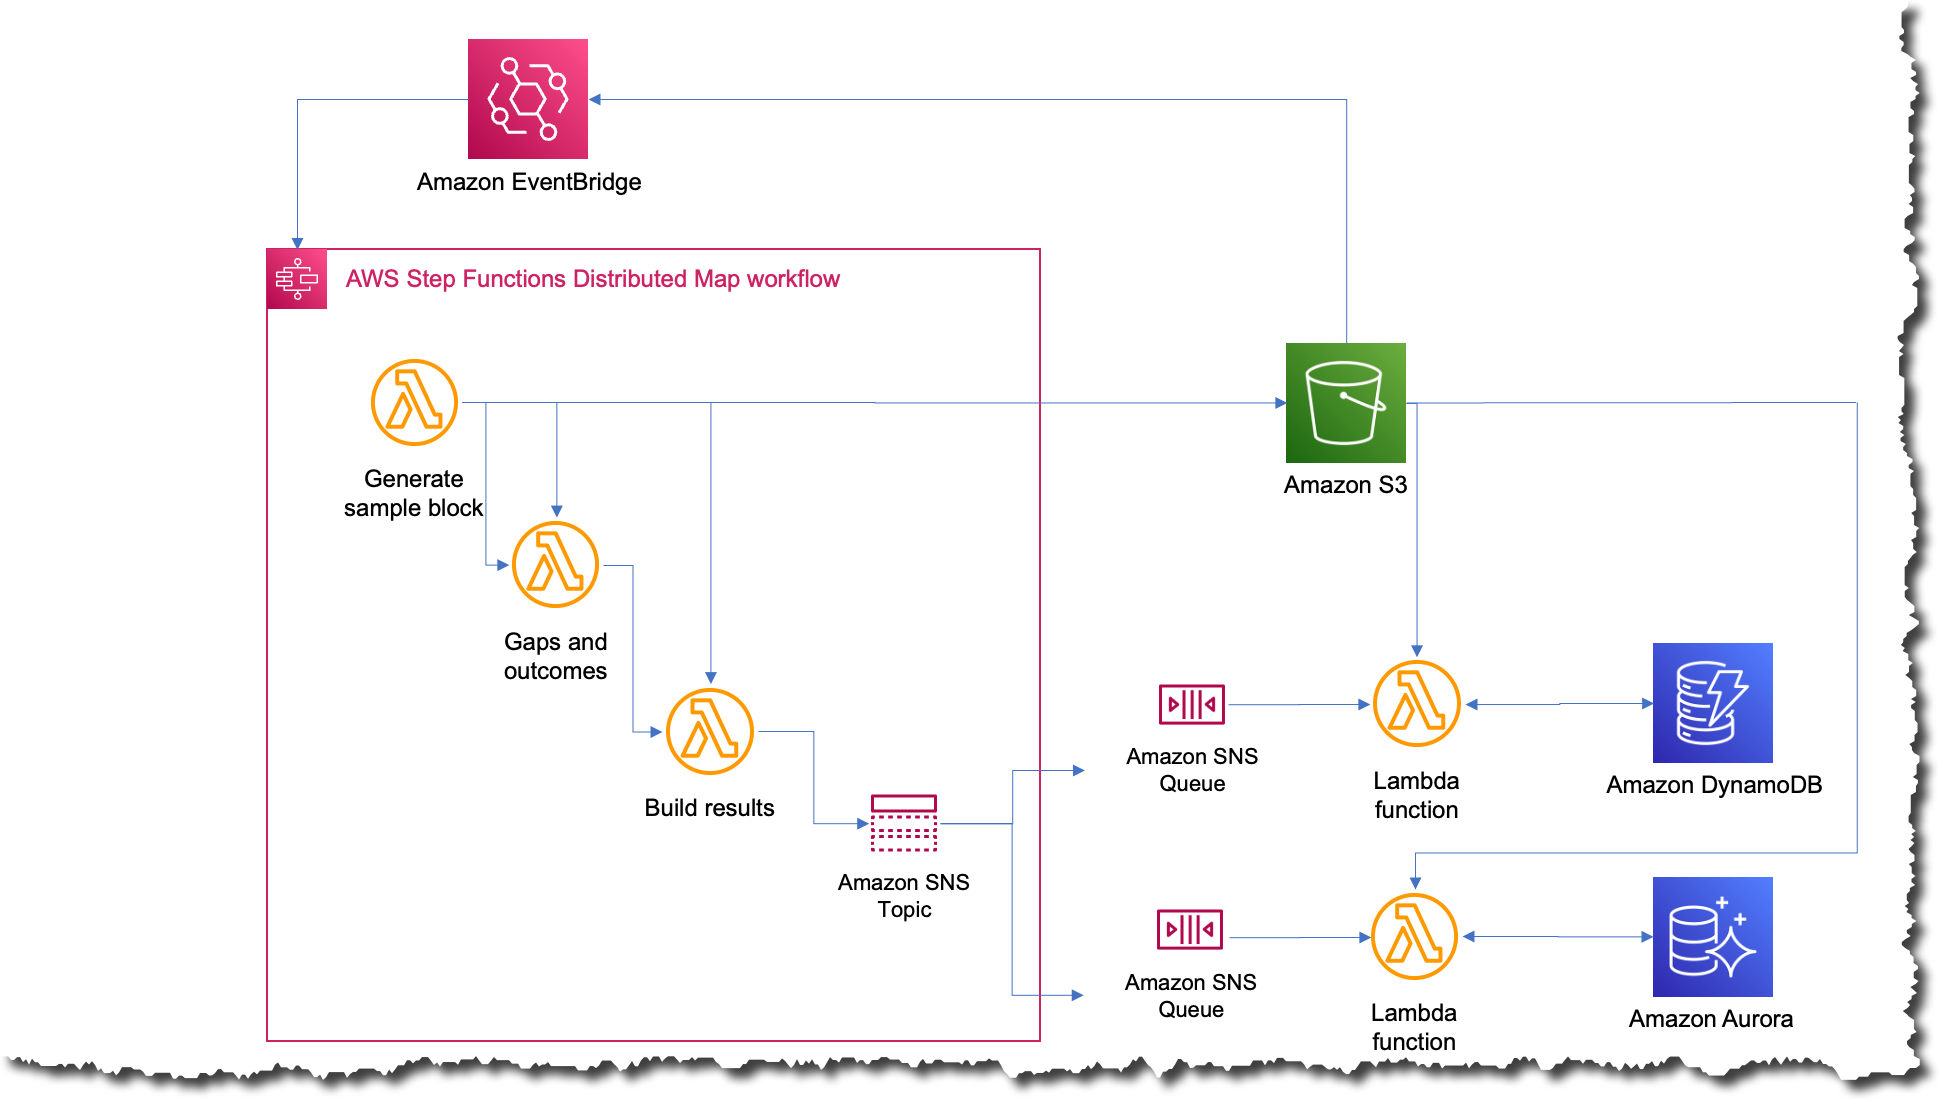
You can further expand this example to more useful event-driven architectures. Let’s expand the use case to run your data pipeline and perform extract, transform, and load (ETL) jobs when a new file lands in an Amazon Simple Storage Service (Amazon S3) bucket in your data lake. The following diagram illustrates one architectural approach.

In the context of invoking a DAG through an external input, the AWS Lambda function would have no knowledge of how busy the Amazon MWAA web server is, potentially leading to the function overwhelming the Amazon MWAA web server by processing a large number of files in a short timeframe.

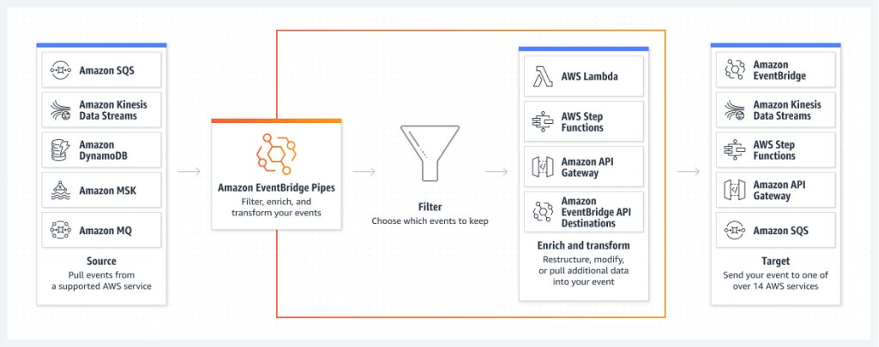
One way to regulate the file processing throughput would be to introduce an Amazon Simple Queue Service (Amazon SQS) queue between the S3 bucket and the Lambda function, which can help with rate limiting the API requests to the web server. You can achieve this by configuring maximum concurrency for Lambda for the SQS event source. However, the Lambda function would still be unaware of the processing capacity available in the Amazon MWAA environment to run the DAGs.

In addition to the SQS queue, to help afford the Amazon MWAA environment manage the load natively, you can use the Airflow’s data-aware scheduling feature using datasets. This approach involves using the enhanced Amazon MWAA REST API to create dataset events, which are then used by the Airflow scheduler to schedule the DAG natively. This way, the Amazon MWAA environment can effectively batch the dataset events and scale resources based on the load. Let’s explore this approach in more detail.

Configure data-aware scheduling

Consider the following DAG that showcases a framework for an ETL pipeline (data_aware_pipeline.py). It uses a dataset for scheduling.

"""
DAG to run the given ETL pipeline based on the datalake dataset event.
"""
from airflow import DAG, Dataset
from airflow.decorators import task

from datetime import datetime

# Create a dataset
datalake = Dataset("datalake")

# Return a list of S3 file URIs from the supplied dataset events 
def get_resources(dataset_uri, triggering_dataset_events=None):
    events = triggering_dataset_events[dataset_uri] if triggering_dataset_events else []
    s3_uris = list(map(lambda e: e.extra["uri"], events))
    return s3_uris

with DAG(
    dag_id="data_aware_pipeline",
    schedule=[datalake],
    start_date=datetime(2022, 1, 1), 
    catchup=False
):
    @task
    def extract(triggering_dataset_events=None):
        resources = get_resources("datalake", triggering_dataset_events)
        for resource in resources:
            print(f"Running data extraction for {resource} ...")

    @task
    def transform(triggering_dataset_events=None):
        resources = get_resources("datalake", triggering_dataset_events)
        for resource in resources:
            print(f"Running data transformation for {resource} ...")

    @task()
    def load(triggering_dataset_events=None):
        resources = get_resources("datalake", triggering_dataset_events)
        for resource in resources:
            print(f"Loading finalized data for {resource} ...")
    
    extract() >> transform() >> load()

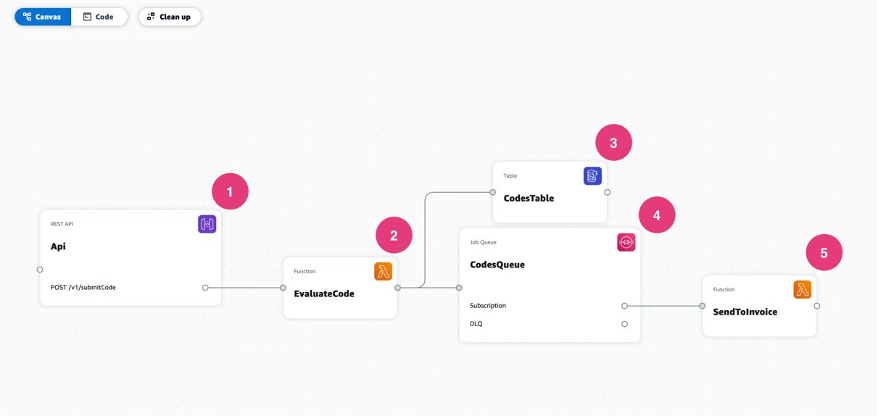
In the preceding code snippet, a Dataset object called datalake is used to schedule the DAG. The get_resources function extracts the extra information that contains the locations of the newly added files in the S3 data lake. Upon receiving dataset events, the Amazon MWAA environment batches the dataset events based on the load and schedules the DAG to handle them appropriately. The modified architecture to support the data-aware scheduling is presented below.

The following is a simplified client that can create a dataset event through the enhanced REST API (mwaa_dataset_client.py):

import boto3

# Client for interacting with MWAA datasets
class MWAADatasetClient:
    # Initialize the client with environment name and optional MWAA boto3 client
    def __init__(self, env_name, mwaa_client=None):
        self.env_name = env_name
        self.client = mwaa_client or boto3.client("mwaa")

    # Create a dataset event in the MWAA environment
    def create_event(self, dataset_uri, extra=None):
        body = {
            "dataset_uri": dataset_uri
        }
        if extra:
            body["extra"] = extra

        response = self.client.invoke_rest_api(
            Name=self.env_name,
            Method="POST",
            Path="/datasets/events",
            Body=body
        )
        return response['RestApiResponse']

The following is a code snippet for the Lambda function in the preceding architecture to generate the dataset event, assuming the function is configured to handle one S3 PUT event at a time (dataset_event_lambda.py):

import os
import json

from mwaa_dataset_client import MWAADatasetClient

environment = os.environ["MWAA_ENV_NAME"]
client = MWAADatasetClient(environment)

def handler(event, context):
    # Extract S3 file URI from SQS record
    record = event["Records"][0]
    bucket = record["s3"]["bucket"]["name"]
    key = record["s3"]["object"]["key"]
    s3_file_uri = f"s3://{bucket}/{key}"

    # Create a dataset event
    result = client.create_event(
        dataset_uri="datalake",
        extra={"uri": s3_file_uri}
    )

    return {
        "statusCode": 200,
        "body": json.dumps(result)
    }

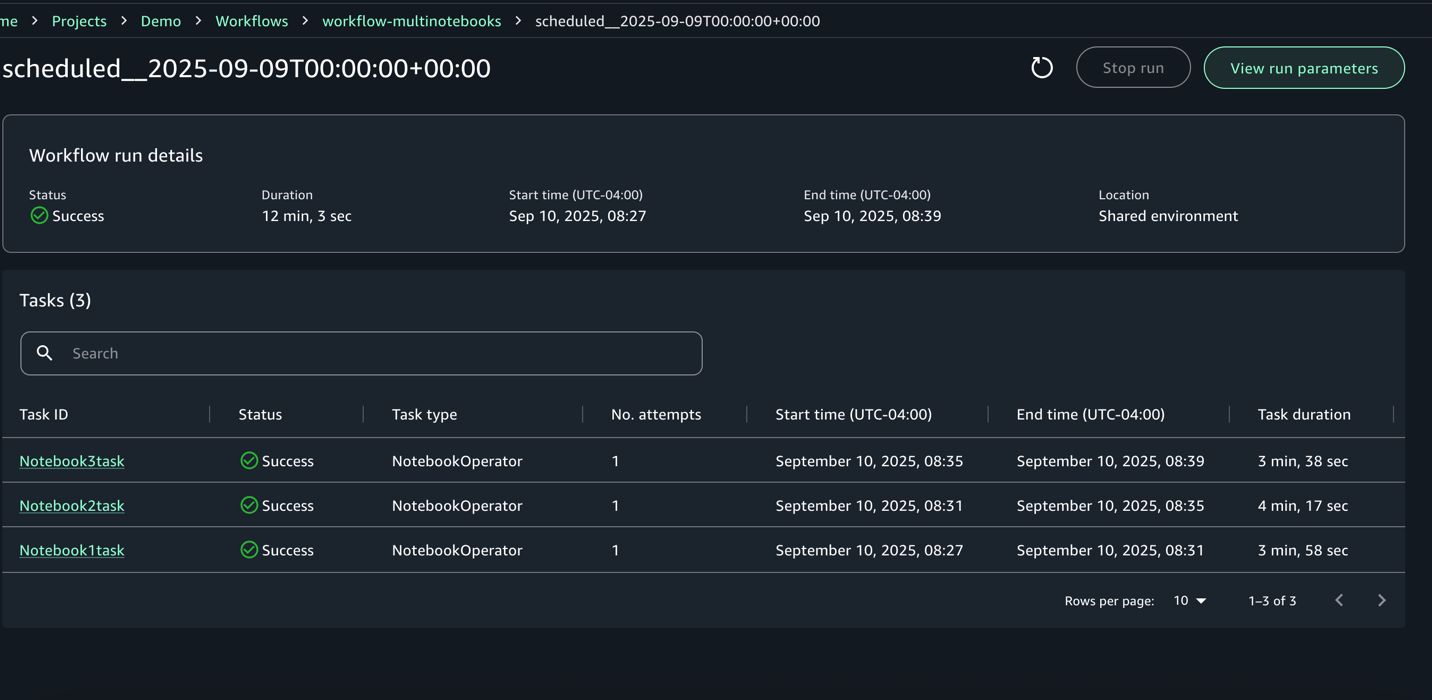
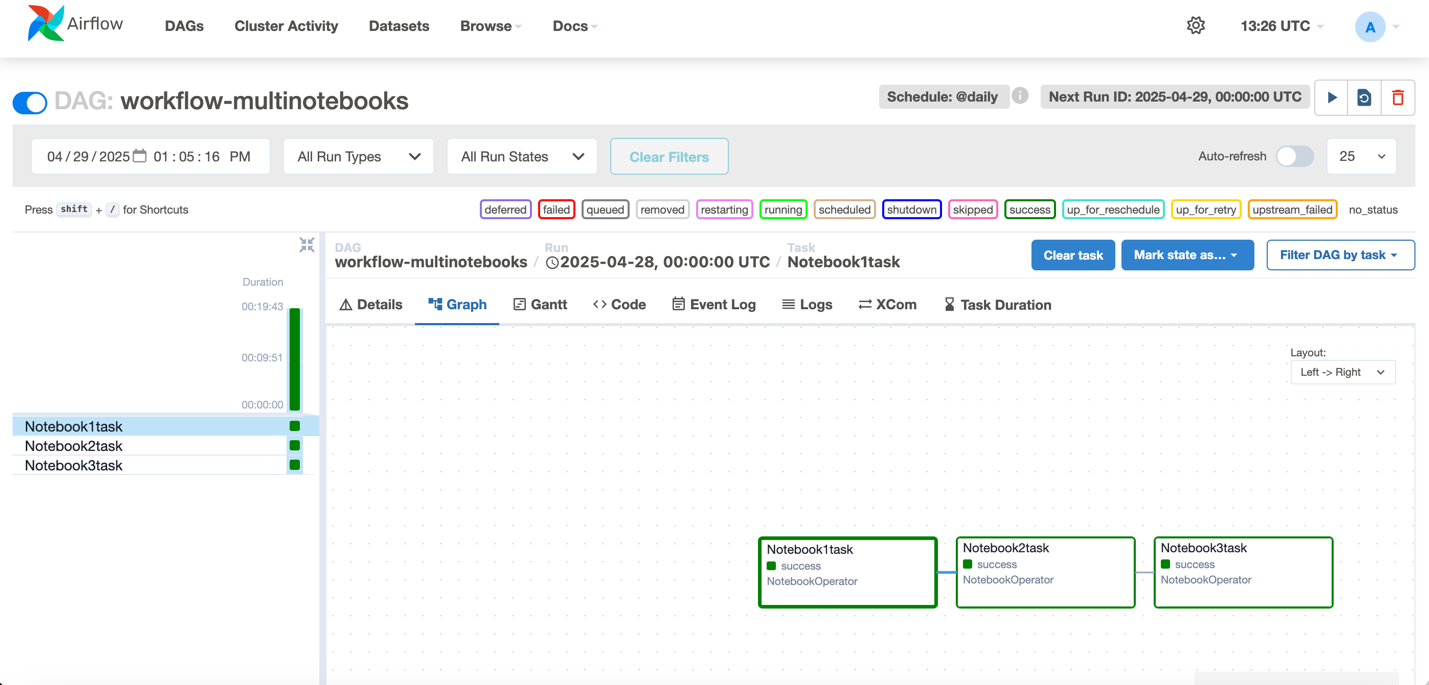
As new files get dropped into the S3 bucket, the Lambda function will generate a dataset event per file, passing in the Amazon S3 location of the newly added files. The Amazon MWAA environment will schedule the ETL pipeline upon receiving the dataset events. The following diagram illustrates a sample run of the ETL pipeline on the Airflow UI.

The following snippet shows the execution log of the extract task from the pipeline. The log shows how the Airflow scheduler batched three dataset events together to handle the load.

[2024-10-21, 16:47:15 UTC] {local_task_job_runner.py:123} ▶ Pre task execution logs
[2024-10-21, 16:47:15 UTC] {logging_mixin.py:190} INFO - Running data extraction for s3://example-bucket/path/to/file1.csv ...
[2024-10-21, 16:47:15 UTC] {logging_mixin.py:190} INFO - Running data extraction for s3://example-bucket/path/to/file2.csv ...
[2024-10-21, 16:47:15 UTC] {logging_mixin.py:190} INFO - Running data extraction for s3://example-bucket/path/to/file3.csv ...
[2024-10-21, 16:47:15 UTC] {python.py:240} INFO - Done. Returned value was: None
[2024-10-21, 16:47:16 UTC] {taskinstance.py:340} ▶ Post task execution logs

In this way, you can use the enhanced REST API to create data-aware, event-driven pipelines.

Considerations

When implementing solutions using the enhanced Amazon MWAA REST API, it’s important to consider the following:

  • IAM permissions – Make sure the IAM principal making the invoke_rest_api SDK call has the airflow:InvokeRestAPI permission on the Amazon MWAA resource. To control access levels, the permission can be scoped to specific Airflow roles (Admin, Op, User, Viewer, or Public).
  • Error handling – Implement robust error handling mechanisms to handle various HTTP status codes and error responses from the Airflow REST API.
  • Monitoring and logging – Set up appropriate monitoring and logging to track the performance and reliability of your API-based integrations and data pipelines.
  • Versioning and compatibility – Monitor the versioning of the Airflow REST API and the Amazon MWAA service to make sure your integrations remain compatible with any future changes.
  • Security and compliance – Adhere to your organization’s security and compliance requirements when integrating external systems with Amazon MWAA and handling sensitive data.

You can start using the simplified integration with the Airflow REST API in your Amazon MWAA environments with Airflow version 2.4.3 or greater, in all currently supported Regions.

Conclusion

The enhanced integration between Amazon MWAA and the Airflow REST API represents a significant improvement in the ease of interacting with Airflow’s core functionalities. This new capability opens up a wide range of use cases, from centralizing and automating administrative tasks, improving overall usability, to building event-driven, data-aware data pipelines.

As you explore this new feature, consider the various use cases and best practices outlined in this post. By using the new InvokeRestApi, you can streamline your data management processes, enhance operational efficiency, and drive greater value from your data-driven systems.


About the Authors

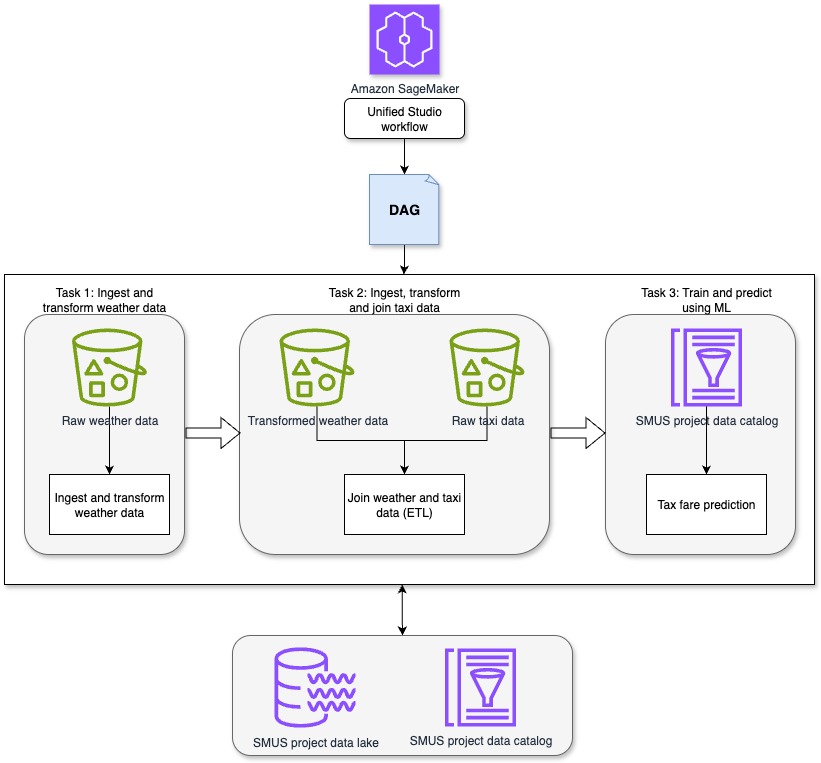
Chandan Rupakheti is a Senior Solutions Architect at AWS. His main focus at AWS lies in the intersection of analytics, serverless, and AdTech services. He is a passionate technical leader, researcher, and mentor with a knack for building innovative solutions in the cloud. Outside of his professional life, he loves spending time with his family and friends, and listening to and playing music.

Hernan Garcia is a Senior Solutions Architect at AWS based out of Amsterdam. He has worked in the financial services industry since 2018, specializing in application modernization and supporting customers in their adoption of the cloud with a focus on serverless technologies.

Enrich your serverless data lake with Amazon Bedrock

Post Syndicated from Dave Horne original https://aws.amazon.com/blogs/big-data/enrich-your-serverless-data-lake-with-amazon-bedrock/

Organizations are collecting and storing vast amounts of structured and unstructured data like reports, whitepapers, and research documents. By consolidating this information, analysts can discover and integrate data from across the organization, creating valuable data products based on a unified dataset. For many organizations, this centralized data store follows a data lake architecture.  Although data lakes provide a centralized repository, making sense of this data and extracting valuable insights can be challenging. End-users often struggle to find relevant information buried within extensive documents housed in data lakes, leading to inefficiencies and missed opportunities.

Surfacing relevant information to end-users in a concise and digestible format is crucial for maximizing the value of data assets. Automatic document summarization, natural language processing (NLP), and data analytics powered by generative AI present innovative solutions to this challenge. By generating concise summaries of large documents, performing sentiment analysis, and identifying patterns and trends, end-users can quickly grasp the essence of the information without the need to sift through vast amounts of raw data, streamlining information consumption and enabling more informed decision-making.

This is where Amazon Bedrock comes into play. Amazon Bedrock is a fully managed service that offers a choice of high-performing foundation models (FMs) from leading AI companies like AI21 Labs, Anthropic, Cohere, Meta, Mistral AI, Stability AI, and Amazon through a single API, along with a broad set of capabilities to build generative AI applications with security, privacy, and responsible AI. This post shows how to integrate Amazon Bedrock with the AWS Serverless Data Analytics Pipeline architecture using Amazon EventBridge, AWS Step Functions, and AWS Lambda to automate a wide range of data enrichment tasks in a cost-effective and scalable manner.

Solution overview

The AWS Serverless Data Analytics Pipeline reference architecture provides a comprehensive, serverless solution for ingesting, processing, and analyzing data. At its core, this architecture features a centralized data lake hosted on Amazon Simple Storage Service (Amazon S3), organized into raw, cleaned, and curated zones. The raw zone stores unmodified data from various ingestion sources, the cleaned zone stores validated and normalized data, and the curated zone contains the final, enriched data products.

Building upon this reference architecture, this solution demonstrates how enterprises can use Amazon Bedrock to enhance their data assets through automated data enrichment. Specifically, it showcases the integration of the powerful FMs available in Amazon Bedrock for generating concise summaries of unstructured documents, enabling end-users to quickly grasp the essence of information without sifting through extensive content.

The enrichment process begins when a document is ingested into the raw zone, invoking an Amazon S3 event that initiates a Step Functions workflow. This serverless workflow orchestrates Lambda functions to extract text from the document based on its file type (text, PDF, Word). A Lambda function then constructs a payload with the document’s content and invokes the Amazon Bedrock Runtime service, using state-of-the-art FMs to generate concise summaries. These summaries, encapsulating key insights, are stored alongside the original content in the curated zone, enriching the organization’s data assets for further analysis, visualization, and informed decision-making. Through this seamless integration of serverless AWS services, enterprises can automate data enrichment, unlocking new possibilities for knowledge extraction from their valuable unstructured data.

The serverless nature of this architecture provides inherent benefits, including automatic scaling, seamless updates and patching, comprehensive monitoring capabilities, and robust security measures, enabling organizations to focus on innovation rather than infrastructure management.

The following diagram illustrates the solution architecture.

Let’s walk through the architecture chronologically for a closer look at each step.

Initiation

The process is initiated when an object is written to the raw zone. In this example, the raw zone is a prefix, but it could also be a bucket. Amazon S3 emits an object created event and matches an EventBridge rule. The event invokes a Step Functions state machine. The state machine runs for each object in parallel, so the architecture scales horizontally.

Workflow

The Step Functions state machine provides a workflow to handle different file types for text summarization.  Files are first preprocessed based on the file extension and corresponding Lambda function.  Next, the files are processed by another Lambda function that summarizes the preprocessed content. If the file type is not supported, the workflow fails with an error. The workflow consists of the following states:

  • CheckFileType – The workflow starts with a Choice state that checks the file extension of the uploaded object. Based on the file extension, it routes the workflow to different paths:
    • If the file extension is .txt, it goes to the IngestTextFile state.
    • If the file extension is .pdf, it goes to the IngestPDFFile state.
    • If the file extension is .docx, it goes to the IngestDocFile state.
    • If the file extension doesn’t match any of these options, it goes to the UnsupportedFileType state and fails with an error.
  • IngestTextFile, IngestPDFFile, and IngestDocFile – These are Task states that invoke their respective Lambda functions to ingest (or process) the file based on its type. After ingesting the file, the job moves to the SummarizeTextFile state.
  • SummarizeTextFile – This is another Task state that invokes a Lambda function to summarize the ingested text file. The function takes the source key (object key) and bucket name as input parameters. This is the final state of the workflow.

You can extend this code sample to account for different types of files, including audio, pictures, and video files, by using services like Amazon Transcribe or Amazon Rekognition.

Preprocessing

Lambda enables you to run code without provisioning or managing servers. This solution contains a Lambda function for each file type. These three functions are part of a larger workflow that processes different types of files (Word documents, PDFs, and text files) uploaded to an S3 bucket. The functions are designed to extract text content from these files, handle any encoding issues, and store the extracted text as new text files in the same S3 bucket with a different prefix. The functions are as follows:

  • Word document processing function:
    • Downloads a Word document (.docx) file from the S3 bucket
    • Uses the python-docx library to extract text content from the Word document by iterating over its paragraphs
    • Stores the extracted text as a new text file (.txt) in the same S3 bucket with a cleaned prefix
  • PDF processing function:
    • Downloads a PDF file from the S3 bucket
    • Uses the PyPDF2 library to extract text content from the PDF by iterating over its pages
    • Stores the extracted text as a new text file (.txt) in the same S3 bucket with a cleaned prefix
  • Text file processing function:
    • Downloads a text file from the S3 bucket
    • Uses the chardet library to detect the encoding of the text file
    • Decodes the text content using the detected encoding (or UTF-8 if encoding can’t be detected)
    • Encodes the decoded text content as UTF-8
    • Stores the UTF-8 encoded text as a new text file (.txt) in the same S3 bucket with a cleaned prefix

All three functions follow a similar pattern:

  1. Download the source file from the S3 bucket.
  2. Process the file to extract or convert the text content.
  3. Store the extracted and converted text as a new text file in the same S3 bucket with a different prefix.
  4. Return a response indicating the success of the operation and the location of the output text file.

Processing

After the content has been extracted to the cleaned prefix, the Step Functions state machine initiates the Summarize_text Lambda function. This function acts as an orchestrator in a workflow designed to generate summaries for text files stored in an S3 bucket. When it’s invoked by a Step Functions event, the function retrieves the source file’s path and bucket location, reads the text content using the Boto3 library, and generates a concise summary using Anthropic Claude 3 on Amazon Bedrock. After obtaining the summary, the function encapsulates the original text, generated summary, model details, and a timestamp into a JSON file, which is uploaded back to the same S3 bucket with a specified prefix, providing organized storage and accessibility for further processing or analysis.

Summarization

Amazon Bedrock provides a straightforward way to build and scale generative AI applications with FMs. The Lambda function sends the content to Amazon Bedrock with directions to summarize it. The Amazon Bedrock Runtime service plays a crucial role in this use case by enabling the Lambda function to integrate with the Anthropic Claude 3 model seamlessly. The function constructs a JSON payload containing the prompt, which includes a predefined prompt stored in an environment variable and the input text content, along with parameters like maximum tokens to sample, temperature, and top-p. This payload is sent to the Amazon Bedrock Runtime service, which invokes the Anthropic Claude 3 model and generates a concise summary of the input text. The generated summary is then received by the Lambda function and incorporated into the final JSON file.

If you use this solution for your own use case, you can customize the following parameters:

  • modelId – The model you want Amazon Bedrock to run. We recommend testing your use case and data with different models. Amazon Bedrock has a lot of models to offer, each with their own strengths. Models also vary by context window, which is how much data you can send with a single prompt.
  • prompt – The prompt that you want Anthropic Claude 3 to complete. Customize the prompt for your use case. You can set the prompt in the initial deployment steps as described in the following section.
  • max_tokens_to_sample – The maximum number of tokens to generate before stopping. This sample is currently set at 300 to manage cost, but you will likely want to increase it.
  • Temperature – The amount of randomness injected into the response.
  • top_p – In nucleus sampling, Anthropic’s Claude 3 computes the cumulative distribution over all the options for each subsequent token in decreasing probability order and cuts it off when it reaches a particular probability specified by top_p.

The best way to determine the best parameters for a specific use case is to prototype and test. Fortunately, this can be a quick process by using the following code example or the Amazon Bedrock console. For more details about models and parameters available, refer to Anthropic Claude Text Completions API.

AWS SAM template

This sample is built and deployed with AWS Serverless Application Model (AWS SAM) to streamline development and deployment. AWS SAM is an open source framework for building serverless applications. It provides shorthand syntax to express functions, APIs, databases, and event source mappings. You define the application you want with just a few lines per resource and model it using YAML. In the following sections, we guide you through the process of a sample deployment using AWS SAM that exemplifies the reference architecture.

Prerequisites

For this walkthrough, you should have the following prerequisites:

Set up the environment

This walkthrough uses AWS CloudShell to deploy the solution. CloudShell is a browser-based shell environment provided by AWS that allows you to interact with and manage your AWS resources directly from the AWS Management Console. It offers a pre-authenticated command line interface with popular tools and utilities pre-installed, such as the AWS Command Line Interface (AWS CLI), Python, Node.js, and git. CloudShell eliminates the need to set up and configure your local development environments or manage SSH keys, because it provides secure access to AWS services and resources through a web browser. You can run scripts, run AWS CLI commands, and manage your cloud infrastructure without leaving the AWS console. CloudShell is free to use and comes with 1 GB of persistent storage for each AWS Region, allowing you to store your scripts and configuration files. This tool is particularly useful for quick administrative tasks, troubleshooting, and exploring AWS services without the need for additional setup or local resources.

Complete the following steps to set up the CloudShell environment:

  1. Open the CloudShell console.

If this is your first time using CloudShell, you may see a “Welcome to AWS CloudShell” page.

  1. Choose the option to open an environment in your Region (the Region listed may vary based on your account’s primary Region).

It may take several minutes for the environment to fully initialize if this is your first time using CloudShell.

The display resembles a CLI suitable for deploying AWS SAM sample code.

Download and deploy the solution

This code sample is available on Serverless Land and GitHub. Deploy it according to the directions in the GitHub README on the CloudShell console:

git clone https://github.com/aws-samples/step-functions-workflows-collection

cd step-functions-workflows-collection/s3-sfn-lambda-bedrock

sam build

sam deploy –-guided

For the guided deployment process, use the default values. Also, enter a stack name. AWS SAM will deploy the sample code.

Run the following code to set up the required prefix structure:

bucket=$(aws s3 ls | grep sam-app | cut -f 3 -d ' ') && for each in raw cleaned curated; do aws s3api put-object --bucket $bucket --key $each/; done

The sample application has now been deployed and you’re ready to begin testing.

Test the solution

In this demo, we can initiate the workflow by uploading documents to the raw prefix. In our example, we use PDF files from the AWS Prescriptive Guidance portal. Download the article Prompt engineering best practices to avoid prompt injection attacks on modern LLMs and upload it to the raw prefix.

EventBridge will monitor for new file additions to the raw S3 bucket, invoking the Step Functions workflow.

You can navigate to the Step Functions console and view the state machine. You can observe the status of the job and when it’s complete.

The Step Functions workflow verifies the file type, subsequently invoking the appropriate Lambda function for processing or raising an error if the file type is unsupported. Upon successful content extraction, a second Lambda function is invoked to summarize the content using Amazon Bedrock.

The workflow employs two distinct functions: the first function extracts content from various file types, and the second function processes the extracted information with the assistance of Amazon Bedrock, receiving data from the initial Lambda function.

Upon completion, the processed data is stored back in the curated S3 bucket in JSON format.

The process creates a JSON file with the original_content and summary fields.  The following screenshot shows an example of the process using the Containers On AWS whitepaper.  Results can vary depending on the large language model (LLM) and prompt strategies selected.

Clean up

To avoid incurring future charges, delete the resources you created. Run sam delete from CloudShell.

Solution benefits

Integrating Amazon Bedrock into the AWS Serverless Data Analytics Pipeline for data enrichment offers numerous benefits that can drive significant value for organizations across various industries:

  • Scalability – This serverless approach inherently scales resources up or down as data volumes and processing requirements fluctuate, providing optimal performance and cost-efficiency. Organizations can handle spikes in demand seamlessly without manual capacity planning or infrastructure provisioning.
  • Cost-effectiveness – With the pay-per-use pricing model of AWS serverless services, organizations only pay for the resources consumed during data enrichment. This avoids upfront costs and ongoing maintenance expenses of traditional deployments, resulting in substantial cost savings.
  • Ease of maintenance – AWS handles the provisioning, scaling, and maintenance of serverless services, reducing operational overhead. Organizations can focus on developing and enhancing data enrichment workflows rather than managing infrastructure.
  • Across industries, this solution unlocks numerous use cases:
  • Research and academia – Summarizing research papers, journals, and publications to accelerate literature reviews and knowledge discovery
  • Legal and compliance – Extracting key information from legal documents, contracts, and regulations to support compliance efforts and risk management
    • Healthcare – Summarizing medical records, studies, and patient reports for better patient care and informed decision-making by healthcare professionals
    • Enterprise knowledge management – Enriching internal documents and repositories with summaries, topic modeling, and sentiment analysis to facilitate information sharing and collaboration
  • Customer experience management – Analyzing customer feedback, reviews, and social media data to identify sentiment, issues, and trends for proactive customer service
  • Marketing and sales – Summarizing customer data, sales reports, and market analysis to uncover insights, trends, and opportunities for optimized campaigns and strategies

With Amazon Bedrock and the AWS Serverless Data Analytics Pipeline, organizations can unlock their data assets’ potential, driving innovation, enhancing decision-making, and delivering exceptional user experiences across industries.

The serverless nature of the solution provides scalability, cost-effectiveness, and reduced operational overhead, empowering organizations to focus on data-driven innovation and value creation.

Conclusion

Organizations are inundated with vast information buried within documents, reports, and complex datasets. Unlocking the value of these assets requires innovative solutions that transform raw data into actionable insights.

This post demonstrated how to use Amazon Bedrock, a service providing access to state-of-the-art LLMs, within the AWS Serverless Data Analytics Pipeline. By integrating Amazon Bedrock, organizations can automate data enrichment tasks like document summarization, named entity recognition, sentiment analysis, and topic modeling. Because the solution utilizes a serverless approach, it handles fluctuating data volumes without manual capacity planning, paying only for resources consumed during enrichment and avoiding upfront infrastructure costs.

This solution empowers organizations to unlock their data assets’ potential across industries like research, legal, healthcare, enterprise knowledge management, customer experience, and marketing. By providing summaries, extracting insights, and enriching with metadata, you efficiency add innovative features that provide differentiated user experiences.

Explore the AWS Serverless Data Analytics Pipeline reference architecture and take advantage of the power of Amazon Bedrock. By embracing serverless computing and advanced NLP, organizations can transform data lakes into valuable sources of actionable insights.


About the Authors

Dave Horne is a Sr. Solutions Architect supporting Federal System Integrators at AWS. He is based in Washington, DC, and has 15 years of experience building, modernizing, and integrating systems for public sector customers. Outside of work, Dave enjoys playing with his kids, hiking, and watching Penn State football!

Robert Kessler is a Solutions Architect at AWS supporting Federal Partners, with a recent focus on generative AI technologies. Previously, he worked in the satellite communications segment supporting operational infrastructure globally. Robert is an enthusiast of boats and sailing (despite not owning a vessel), and enjoys tackling house projects, playing with his kids, and spending time in the great outdoors.

Sending and receiving CloudEvents with Amazon EventBridge

Post Syndicated from David Boyne original https://aws.amazon.com/blogs/compute/sending-and-receiving-cloudevents-with-amazon-eventbridge/

Amazon EventBridge helps developers build event-driven architectures (EDA) by connecting loosely coupled publishers and consumers using event routing, filtering, and transformation. CloudEvents is an open-source specification for describing event data in a common way. Developers can publish CloudEvents directly to EventBridge, filter and route them, and use input transformers and API Destinations to send CloudEvents to downstream AWS services and third-party APIs.

Overview

Event design is an important aspect in any event-driven architecture. Developers building event-driven architectures often overlook the event design process when building their architectures. This leads to unwanted side effects like exposing implementation details, lack of standards, and version incompatibility.

Without event standards, it can be difficult to integrate events or streams of messages between systems, brokers, and organizations. Each system has to understand the event structure or rely on custom-built solutions for versioning or validation.

CloudEvents is a specification for describing event data in common formats to provide interoperability between services, platforms, and systems using Cloud Native Computing Foundation (CNCF) projects. As CloudEvents is a CNCF graduated project, many third-party brokers and systems adopt this specification.

Using CloudEvents as a standard format to describe events makes integration easier and you can use open-source tooling to help build event-driven architectures and future proof any integrations. EventBridge can route and filter CloudEvents based on common metadata, without needing to understand the business logic within the event itself.

CloudEvents support two implementation modes, structured mode and binary mode, and a range of protocols including HTTP, MQTT, AMQP, and Kafka. When publishing events to an EventBridge bus, you can structure events as CloudEvents and route them to downstream consumers. You can use input transformers to transform any event into the CloudEvents specification. Events can also be forwarded to public APIs, using EventBridge API destinations, which supports both structured and binary mode encodings, enhancing interoperability with external systems.

Standardizing events using Amazon EventBridge

When publishing events to an EventBridge bus, EventBridge uses its own event envelope and represents events as JSON objects. EventBridge requires that you define top-level fields, such as detail-type and source. You can use any event/payload in the detail field.

This example event shows an OrderPlaced event from the orders-service that is unstructured without any event standards. The data within the event contains the order_id, customer_id and order_total.

{
  "version": "0",
  "id": "dbc1c73a-c51d-0c0e-ca61-ab9278974c57",
  "account": "1234567890",
  "time": "2023-05-23T11:38:46Z",
  "region": "us-east-1",
  "detail-type": "OrderPlaced",
  "source": "myapp.orders-service",
  "resources": [],
  "detail": {
    "data": {
      "order_id": "c172a984-3ae5-43dc-8c3f-be080141845a",
      "customer_id": "dda98122-b511-4aaf-9465-77ca4a115ee6",
      "order_total": "120.00"
    }
  }
}

Publishers may also choose to add an additional metadata field along with the data field within the detail field to help define a set of standards for their events.

{
  "version": "0",
  "id": "dbc1c73a-c51d-0c0e-ca61-ab9278974c58",
  "account": "1234567890",
  "time": "2023-05-23T12:38:46Z",
  "region": "us-east-1",
  "detail-type": "OrderPlaced",
  "source": "myapp.orders-service",
  "resources": [],
  "detail": {
    "metadata": {
      "idempotency_key": "29d2b068-f9c7-42a0-91e3-5ba515de5dbe",
      "correlation_id": "dddd9340-135a-c8c6-95c2-41fb8f492222",
      "domain": "ORDERS",
      "time": "1707908605"
    },
    "data": {
      "order_id": "c172a984-3ae5-43dc-8c3f-be080141845a",
      "customer_id": "dda98122-b511-4aaf-9465-77ca4a115ee6",
      "order_total": "120.00"
    }
  }
}

This additional event information helps downstream consumers, improves debugging, and can manage idempotency. While this approach offers practical benefits, it duplicates solutions that are already solved with the CloudEvents specification.

Publishing CloudEvents using Amazon EventBridge

When publishing events to EventBridge, you can use CloudEvents structured mode. A structured-mode message is where the entire event (attributes and data) is encoded in the message body, according to a specific event format. A binary-mode message is where the event data is stored in the message body, and event attributes are stored as part of the message metadata.

CloudEvents has a list of required fields but also offers flexibility with optional attributes and extensions. CloudEvents also offers a solution to implement idempotency, requiring that the combination of id and source must uniquely identify an event, which can be used as the idempotency key in downstream implementations.

{
  "version": "0",
  "id": "dbc1c73a-c51d-0c0e-ca61-ab9278974c58",
  "account": "1234567890",
  "time": "2023-05-23T12:38:46Z",
  "region": "us-east-1",
  "detail-type": "OrderPlaced",
  "source": "myapp.orders-service",
  "resources": [],
  "detail": {
    "specversion": "1.0",
    "id": "bba4379f-b764-4d90-9fb2-9f572b2b0b61",
    "source": "myapp.orders-service",
    "type": "OrderPlaced",
    "data": {
      "order_id": "c172a984-3ae5-43dc-8c3f-be080141845a",
      "customer_id": "dda98122-b511-4aaf-9465-77ca4a115ee6",
      "order_total": "120.00"
    },
    "time": "2024-01-01T17:31:00Z",
    "dataschema": "https://us-west-2.console.aws.amazon.com/events/home?region=us-west-2#/registries/discovered-schemas/schemas/myapp.orders-service%40OrderPlaced",
    "correlationid": "dddd9340-135a-c8c6-95c2-41fb8f492222",
    "domain": "ORDERS"
  }
}

By incorporating the required fields, the OrderPlaced event is now CloudEvents compliant. The event also contains optional and extension fields for additional information. Optional fields such as dataschema can be useful for brokers and consumers to retrieve a URI path to the published event schema. This example event references the schema in the EventBridge schema registry, so downstream consumers can fetch the schema to validate the payload.

Mapping existing events into CloudEvents using input transformers

When you define a target in EventBridge, input transformations allow you to modify the event before it reaches its destination. Input transformers are configured per target, allowing you to convert events when your downstream consumer requires the CloudEvents format and you want to avoid duplicating information.

Input transformers allow you to map EventBridge fields, such as id, region, detail-type, and source, into corresponding CloudEvents attributes.

This example shows how to transform any EventBridge event into CloudEvents format using input transformers, so the target receives the required structure.

{
  "version": "0",
  "id": "dbc1c73a-c51d-0c0e-ca61-ab9278974c58",
  "account": "1234567890",
  "time": "2024-01-23T12:38:46Z",
  "region": "us-east-1",
  "detail-type": "OrderPlaced",
  "source": "myapp.orders-service",
  "resources": [],
  "detail": {
    "order_id": "c172a984-3ae5-43dc-8c3f-be080141845a",
    "customer_id": "dda98122-b511-4aaf-9465-77ca4a115ee6",
    "order_total": "120.00"
  }
}

Using this input transformer and input template EventBridge transforms the event schema into the CloudEvents specification for downstream consumers.

Input transformer for CloudEvents:

{
  "id": "$.id",
  "source": "$.source",
  "type": "$.detail-type",
  "time": "$.time",
  "data": "$.detail"
}

Input template for CloudEvents:

{
  "specversion": "1.0",
  "id": "<id>",
  "source": "<source>",
  "type": "<type>",
  "time": "<time>",
  "data": <data>
}

This example shows the event payload that is received by downstream targets, which is mapped to the CloudEvents specification.

{
  "specversion": "1.0",
  "id": "dbc1c73a-c51d-0c0e-ca61-ab9278974c58",
  "source": "myapp.orders-service",
  "type": "OrderPlaced",
  "time": "2024-01-23T12:38:46Z",
  "data": {
      "order_id": "c172a984-3ae5-43dc-8c3f-be080141845a",
      "customer_id": "dda98122-b511-4aaf-9465-77ca4a115ee6",
      "order_total": "120.00"
    }
}

For more information on using input transformers with CloudEvents, see this pattern on Serverless Land.

Transforming events into CloudEvents using API destinations

EventBridge API destinations allows you to trigger HTTP endpoints based on matched rules to integrate with third-party systems using public APIs. You can route events to APIs that support the CloudEvents format by using input transformations and custom HTTP headers to convert EventBridge events to CloudEvents. API destinations now supports custom content-type headers. This allows you to send structured or binary CloudEvents to downstream consumers.

Sending binary CloudEvents using API destinations

When sending binary CloudEvents over HTTP, you must use the HTTP binding specification and set the necessary CloudEvents headers. These headers tell the downstream consumer that the incoming payload uses the CloudEvents format. The body of the request is the event itself.

CloudEvents headers are prefixed with ce-. You can find the list of headers in the HTTP protocol binding documentation.

This example shows the Headers for a binary event:

POST /order HTTP/1.1 
Host: webhook.example.com
ce-specversion: 1.0
ce-type: OrderPlaced
ce-source: myapp.orders-service
ce-id: bba4379f-b764-4d90-9fb2-9f572b2b0b61
ce-time: 2024-01-01T17:31:00Z
ce-dataschema: https://us-west-2.console.aws.amazon.com/events/home?region=us-west-2#/registries/discovered-schemas/schemas/myapp.orders-service%40OrderPlaced
correlationid: dddd9340-135a-c8c6-95c2-41fb8f492222
domain: ORDERS
Content-Type: application/json; charset=utf-8

This example shows the body for a binary event:

{
  "order_id": "c172a984-3ae5-43dc-8c3f-be080141845a",
  "customer_id": "dda98122-b511-4aaf-9465-77ca4a115ee6",
  "order_total": "120.00"
}

For more information when using binary CloudEvents with API destinations, explore this pattern available on Serverless Land.

Sending structured CloudEvents using API destinations

To support structured mode with CloudEvents, you must specify the content-type as application/cloudevents+json; charset=UTF-8, which tells the API consumer that the payload of the event is adhering to the CloudEvents specification.

POST /order HTTP/1.1
Host: webhook.example.com
 
Content-Type: application/cloudevents+json; charset=utf-8
{
    "specversion": "1.0",
    "id": "bba4379f-b764-4d90-9fb2-9f572b2b0b61",
    "source": "myapp.orders-service",
    "type": "OrderPlaced",      
    "data": {
      "order_id": "c172a984-3ae5-43dc-8c3f-be080141845a",
      "customer_id": "dda98122-b511-4aaf-9465-77ca4a115ee6",
      "order_total": "120.00"
    },
    "time": "2024-01-01T17:31:00Z",
    "dataschema": "https://us-west-2.console.aws.amazon.com/events/home?region=us-west-2#/registries/discovered-schemas/schemas/myapp.orders-service%40OrderPlaced",
    "correlationid": "dddd9340-135a-c8c6-95c2-41fb8f492222",
    "domain":"ORDERS"
}

Conclusion

Carefully designing events plays an important role when building event-driven architectures to integrate producers and consumers effectively. The open-source CloudEvents specification helps developers to standardize integration processes, simplifying interactions between internal systems and external partners.

EventBridge allows you to use a flexible payload structure within an event’s detail property to standardize events. You can publish structured CloudEvents directly onto an event bus in the detail field and use payload transformations to allow downstream consumers to receive events in the CloudEvents format.

EventBridge simplifies integration with third-party systems using API destinations. Using the new custom content-type headers with input transformers to modify the event structure, you can send structured or binary CloudEvents to integrate with public APIs.

For more serverless learning resources, visit Serverless Land.

Manage EDI at scale with new AWS B2B Data Interchange

Post Syndicated from Sébastien Stormacq original https://aws.amazon.com/blogs/aws/introducing-aws-b2b-data-interchange-simplified-connections-with-your-trading-partners/

Today we’re launching AWS B2B Data Interchange, a fully managed service allowing organizations to automate and monitor the transformation of EDI-based business-critical transactions at cloud scale. With this launch, AWS brings automation, monitoring, elasticity, and pay-as-you-go pricing to the world of B2B document exchange.

Electronic data interchange (EDI) is the electronic exchange of business documents in a standard electronic format between business partners. While email is also an electronic approach, the documents exchanged via email must still be handled by people rather than computer systems. Having people involved slows down the processing of the documents and also introduces errors. Instead, EDI documents can flow straight through to the appropriate application on the receiver’s system, and processing can begin immediately. Electronic documents exchanged between computer systems help businesses reduce cost, accelerate transactional workflows, reduce errors, and improve relationships with business partners.

Work on EDI started in the 1970s. I remember reading a thesis about EDIFACT, a set of standards defining the structure of business documents, back in 1994. But despite being a more than 50-year-old technology, traditional self-managed EDI solutions deployed to parse, validate, map, and translate data from business applications to EDI data formats are difficult to scale as the volume of business changes. They typically do not provide much operational visibility into communication and content errors. These challenges often oblige businesses to fall back to error-prone email document exchanges, leading to high manual work, increased difficulty controlling compliance, and ultimately constraining growth and agility.

AWS B2B Data Interchange is a fully managed, easy-to-use, and cost-effective service for accelerating your data transformations and integrations. It eliminates the heavy lifting of establishing connections with your business partners and mapping the documents to your system’s data-formats and gives visibility on documents that can’t be processed.

It provides a low-code interface for business partner onboarding and EDI data transformation to easily import the processed data to your business applications and analytics solutions. B2B Data Interchange gives you easy access to monitoring data, allowing you to build dashboards to monitor the volume of documents exchanged and the status of each document transformation. For example, it is easy to create alarms when incorrectly formatted documents can’t be transformed or imported into your business applications.

It is common for large enterprises to have thousands of business partners and hundreds of types of documents exchanged with each partner, leading to millions of combinations to manage. AWS B2B Data Interchange is not only available through the AWS Management Console, it is also accessible with the AWS Command Line Interface (AWS CLI) and AWS SDKs. This allows you to write applications or scripts to onboard new business partners and their specific data transformations and to programmatically add alarms and monitoring logic to new or existing dashboards.

B2B Data Interchange supports the X12 EDI data format. It makes it easier to validate and transform EDI documents to the formats expected by your business applications, such as JSON or XML. The raw documents and the transformed JSON or XML files are stored on Amazon Simple Storage Service (Amazon S3). This allows you to build event-driven applications for real-time business data processing or to integrate business documents with your existing analytics or AI/ML solutions.

For example, when you receive a new EDI business document, you can trigger additional routing, processing, and transformation logic using AWS Step Functions or Amazon EventBridge. When an error is detected in an incoming document, you can configure the sending of alarm messages by email or SMS or trigger an API call or additional processing logic using AWS Lambda.

Let’s see how it works
As usual on this blog, let me show you how it works. Let’s imagine I am in charge of the supply chain for a large retail company, and I have hundreds of business partners to exchange documents such as bills of lading, customs documents, advanced shipment notices, invoices, or receiving advice certificates.

In this demo, I use the AWS Management Console to onboard a new business partner. By onboarding, I mean defining the contact details of the business partner, the type of documents I will exchange with them, the technical data transformation to the JSON formats expected by my existing business apps, and where to receive the documents.

With this launch, the configuration of the transport mechanism for the EDI document is managed outside B2B Data Interchange. Typically, you will configure a transfer gateway and propose that your business partner transfer the document using SFTP or AS2.

There are no servers to manage or application packages to install and configure. I can get started in just four steps.

First, I create a profile for my business partner.

B2B Data Interchange - Create profile

Second, I create a transformer. A transformer defines the source document format and the mapping to my existing business application data format: JSON or XML. I can use the graphical editor to validate a sample document and see the result of the transformation directly from the console. We use the standard JSONATA query and transformation language to define the transformation logic to JSON documents and standard XSLT when transforming to XML documents.

B2B Data Interchange - Create transformer - input

B2B Data Interchange - Create transformer - transformation

I activate the transformer once created.

B2B Data Interchange - Create transformer - activate

Third, I create a trading capability. This defines which Amazon Simple Storage Service (Amazon S3) buckets will receive the documents from a specific business partner and where the transformed data will be stored.

There is a one-time additional configuration to make sure proper permissions are defined on the S3 bucket policy. I select Copy policy and navigate to the Amazon S3 page of the console to apply the policies to the S3 bucket. One policy allows B2B Data Interchange to read from the incoming bucket, and one policy allows it to write to your outgoing bucket.

B2B Data Interchange - Create capability

B2B Data Interchange - Create capability - configure directory

While I am configuring the S3 bucket, it is also important to turn on Amazon EventBridge on the S3 bucket. This is the mechanism we use to trigger the data transformation upon the arrival of a new business document.

B2B Data Interchange - Enbale EventBridge on S3 bucket

Finally, back at the B2B Data Interchange configuration, I create a partnership. Partnerships are dedicated resources that establish a relationship between you and your individual trading partners. Partnerships contain details about a specific trading partner, the types of EDI documents you receive from them, and how those documents should be transformed into custom JSON or XML formats. A partnership links the business profile I created in the first step with one or multiple document types and transformations I defined in step two.

B2B Data Interchange - Create partnership

This is also where I can monitor the status of the last set of documents I received and the status of their transformation. For more historical data, you can navigate to Amazon CloudWatch using the links provided in the console.

B2B Data Interchange - Log group

To test my setup, I upload an EDI 214 document to the incoming bucket and a few seconds later, I can see the transformed JSON document appearing in the destination bucket.

B2B Data Interchange - Transformed document on the bucket

I can observe the status of document processing and transformation using Invocations and TriggeredRules CloudWatch metrics from EventBridge. From there, together with the CloudWatch Logs, I can build dashboards and configure alarms as usual. I can also configure additional enrichment, routing, and processing of the incoming or transformed business documents by writing an AWS Lambda function or a workflow using AWS Step Functions.

Pricing and availability
AWS B2B Data Interchange is available today in three of the AWS Regions: US East (Ohio, N. Virginia) and US West (Oregon).

There is no one-time setup fee or recurring monthly subscription. AWS charges you on demand based on your real usage. There is a price per partnership per month and a price per document transformed. The B2B Data Interchange pricing page has the details.

AWS B2B Data Interchange makes it easy to manage your trading partner relationships so you can automatically exchange, transform, and monitor EDI workflows at cloud scale. It doesn’t require you to install or manage any infrastructure and makes it easy for you to integrate with your existing business applications and systems. You can use the AWS B2B Data Interchange API or the AWS SDK to automate the onboarding of your partners. Combined with a fully managed and scalable infrastructure, AWS B2B Data Interchange helps your business to be more agile and scale your operations.

Learn more:

Go build!

— seb

New – AWS Audit Manager now supports first third-party GRC integration

Post Syndicated from Veliswa Boya original https://aws.amazon.com/blogs/aws/new-aws-audit-manager-now-supports-first-third-party-grc-integration/

Auditing is a continuous and ongoing process, and every audit includes the collection of evidence. The evidence gathered helps confirm the state of resources and it’s used to demonstrate that the customer’s policies, procedures, and activities (controls), are in place, and that the control has been operational for a specified period of time. AWS Audit Manager already automates this evidence collection for AWS usage. However, large enterprise organizations who deploy their workloads across a range of locations such as cloud, on-premises, or a combination of both, manage this evidence data using a combination of third-party or homegrown tools, spreadsheets, and emails.

Today we’re excited to announce the integration of AWS Audit Manager with third party Governance, Risk, and Compliance (GRC) provider, MetricStream CyberGRC, an AWS Partner with GRC capabilities. This integration allows enterprises to manage compliance across AWS, on-premises, and other cloud environments in a centralized GRC environment.

Before this announcement, Audit Manager operated only in the AWS context, allowing customers to collect compliance evidence for resources in AWS. They would then relay that information to their GRC systems external to AWS for additional aggregation and analysis. This process left customers without an automated way to monitor and evaluate all compliance data in one centralized location, resulting in delays to compliance outcomes.

The GRC integration with Audit Manager allows you to use audit evidence collected by Audit Manager directly in MetricStream CyberGRC. Audit Manager now receives the controls in scope from MetricStream CyberGRC, collects evidence around these controls, and exports the data related to the audit into MetricStream CyberGRC for aggregation and analysis. You will now have aggregated compliance, real-time monitoring and centralized reporting. This will reduce compliance fatigue and improve stakeholder collaboration.

How It Works
Using Amazon Cognito User Pools, you’ll be onboarded into the multi-tenant instance of MetricStream CyberGRC.

Amazon Cognito User Pools diagram

Amazon Cognito User Pools

Once onboarded, you’ll be able to view AWS assets and frameworks inside MetricStream CyberGRC. You can then begin by choosing the suitable Audit Manager framework to define the relationships between your existing enterprise controls and AWS controls. After creating this one-time control mapping, you can define the accounts in scope to create an assessment that MetricStream CyberGRC will manage in AWS Audit Manager on your behalf. This assessment triggers AWS Audit Manager to collect evidence in context of the mapped controls. As a result, you get a unified view of compliance evidence inside your GRC application. Any standard controls that you have in Audit Manager will be provided to MetricStream CyberGRC by using the GetControl API to facilitate manual mapping process wherever automated mapping fails or does not suffice. The EvidenceFinder API will send bulk evidence from Audit Manager to MetricStream CyberGRC.

Available Now
This feature is available today where Audit Manager (AWS Regions) and MetricStream CyberGRC are both available. There are no additional AWS Audit Manager charges for using this integration. To use this integration, please reach out to MetricStream for information about access and purchase of MetricStream CyberGRC software.

As part of the AWS Free Tier, AWS Audit Manager offers a free tier for first-time customers. The free tier will expire in two calendar months after the first subscription. For more information, see AWS Audit Manager pricing. To learn more about AWS Audit Manager integration with MetricStream CyberGRC, see Audit Manager documentation.

Veliswa

Build event-driven architectures with Amazon MSK and Amazon EventBridge

Post Syndicated from Florian Mair original https://aws.amazon.com/blogs/big-data/build-event-driven-architectures-with-amazon-msk-and-amazon-eventbridge/

Based on immutable facts (events), event-driven architectures (EDAs) allow businesses to gain deeper insights into their customers’ behavior, unlocking more accurate and faster decision-making processes that lead to better customer experiences. In EDAs, modern event brokers, such as Amazon EventBridge and Apache Kafka, play a key role to publish and subscribe to events. EventBridge is a serverless event bus that ingests data from your own apps, software as a service (SaaS) apps, and AWS services and routes that data to targets. Although there is overlap in their role as the backbone in EDAs, both solutions emerged from different problem statements and provide unique features to solve specific use cases. With a solid understanding of both technologies and their primary use cases, developers can create easy-to-use, maintainable, and evolvable EDAs.

If the use case is well defined and directly maps to one event bus, such as event streaming and analytics with streaming events (Kafka) or application integration with simplified and consistent event filtering, transformation, and routing on discrete events (EventBridge), the decision for a particular broker technology is straightforward. However, organizations and business requirements are often more complex and beyond the capabilities of one broker technology. In almost any case, choosing an event broker should not be a binary decision. Combining complementary broker technologies and embracing their unique strengths is a solid approach to build easy-to-use, maintainable, and evolvable EDAs. To make the integration between Kafka and EventBridge even smoother, AWS open-sourced the EventBridge Connector based on Apache Kafka. This allows you to consume from on-premises Kafka deployments and avoid point-to-point communication, while using the existing knowledge and toolset of Kafka Connect.

Streaming applications enable stateful computations over unbound datasets. This allows real-time use cases such as anomaly detection, event-time computations, and much more. These applications can be built using frameworks such as Apache Flink, Apache Spark, or Kafka Streams. Although some of those frameworks support sending events to downstream systems other than Apache Kafka, there is no standardized way of doing so across frameworks. It would require each application owner to build their own logic to send events downstream. In an EDA, the preferred way to handle such a scenario is to publish events to an event bus and then send them downstream.

There are two ways to send events from Apache Kafka to EventBridge: the preferred method using Amazon EventBridge Pipes or the EventBridge sink connector for Kafka Connect. In this post, we explore when to use which option and how to build an EDA using the EventBridge sink connector and Amazon Managed Streaming for Apache Kafka (Amazon MSK).

EventBridge sink connector vs. EventBridge Pipes

EventBridge Pipes connects sources to targets with a point-to-point integration, supporting event filtering, transformations, enrichment, and event delivery to over 14 AWS services and external HTTPS-based targets using API Destinations. This is the preferred and most easy method to send events from Kafka to EventBridge as it simplifies the setup and operations with a delightful developer experience.

Alternatively, under the following circumstances you might want to choose the EventBridge sink connector to send events from Kafka directly to EventBridge Event Buses:

  • You are have already invested in processes and tooling around the Kafka Connect framework as the platform of your choice to integrate with other systems and services
  • You need to integrate with a Kafka-compatible schema registry e.g., the AWS Glue Schema Registry, supporting Avro and Protobuf data formats for event serialization and deserialization
  • You want to send events from on-premises Kafka environments directly to EventBridge Event Buses

Overview of solution

In this post, we show you how to use Kafka Connect and the EventBridge sink connector to send Avro-serialized events from Amazon Managed Streaming for Apache Kafka (Amazon MSK) to EventBridge. This enables a seamless and consistent data flow from Apache Kafka to dozens of supported EventBridge AWS and partner targets, such as Amazon CloudWatch, Amazon SQS, AWS Lambda, and HTTPS targets like Salesforce, Datadog, and Snowflake using EventBridge API destinations. The following diagram illustrates the event-driven architecture used in this blog post based on Amazon MSK and EventBridge.

Architecture Diagram

The workflow consists of the following steps:

  1. The demo application generates credit card transactions, which are sent to Amazon MSK using the Avro format.
  2. An analytics application running on Amazon Elastic Container Service (Amazon ECS) consumes the transactions and analyzes them if there is an anomaly.
  3. If an anomaly is detected, the application emits a fraud detection event back to the MSK notification topic.
  4. The EventBridge connector consumes the fraud detection events from Amazon MSK in Avro format.
  5. The connector converts the events to JSON and sends them to EventBridge.
  6. In EventBridge, we use JSON filtering rules to filter our events and send them to other services or another Event Bus. In this example, fraud detection events are sent to Amazon CloudWatch Logs for auditing and introspection, and to a third-party SaaS provider to showcase how easy it is to integrate with third-party APIs, such as Salesforce.

Prerequisites

For this walkthrough, you should have the following prerequisites:

Deploy the AWS CDK stack

This walkthrough requires you to deploy an AWS CDK stack to your account. You can deploy the full stack end to end or just the required resources to follow along with this post.

  1. In your terminal, run the following command:
    git clone https://github.com/awslabs/eventbridge-kafka-connector/

  2. Navigate to the cdk directory:
    cd eventbridge-kafka-connector/cdk

  3. Deploy the AWS CDK stack based on your preferences:
  4. If you want to see the complete setup explained in this post, run the following command:
    cdk deploy —context deployment=FULL

  5. If you want to deploy the connector on your own but have the required resources already, including the MSK cluster, AWS Identity and Access Management (IAM) roles, security groups, data generator, and so on, run the following command:
    cdk deploy —context deployment=PREREQ

Deploy the EventBridge sink connector on Amazon MSK Connect

If you deployed the CDK stack in FULL mode, you can skip this section and move on to Create EventBridge rules.

The connector needs an IAM role that allows reading the data from the MSK cluster and sending records downstream to EventBridge.

Upload connector code to Amazon S3

Complete the following steps to upload the connector code to Amazon Simple Storage Service (Amazon S3):

  1. Navigate to the GitHub repo.
  2. Download the release 1.0.0 with the AWS Glue Schema Registry dependencies included.
  3. On the Amazon S3 console, choose Buckets in the navigation pane.
  4. Choose Create bucket.
  5. For Bucket name, enter eventbridgeconnector-bucket-${AWS_ACCOUNT_ID}.

As Because S3 buckets must be globally unique, replace ${AWS_ACCOUNT_ID} with your actual AWS account ID. For example, eventbridgeconnector-bucket-123456789012.

  1. Open the bucket and choose Upload.
  2. Select the .jar file that you downloaded from the GitHub repository and choose Upload.

S3 File Upload Console

Create a custom plugin

We now have our application code in Amazon S3. As a next step, we create a custom plugin in Amazon MSK Connect. Complete the following steps:

  1. On the Amazon MSK console, choose Custom plugins in the navigation pane under MSK Connect.
  2. Choose Create custom plugin.
  3. For S3 URI – Custom plugin object, browse to the file named kafka-eventbridge-sink-with-gsr-dependencies.jar in the S3 bucket eventbridgeconnector-bucket-${AWS_ACCOUNT_ID} for the EventBridge connector.
  4. For Custom plugin name, enter msk-eventBridge-sink-plugin-v1.
  5. Enter an optional description.
  6. Choose Create custom plugin.

MSK Connect Plugin Screen

  1. Wait for plugin to transition to the status Active.

Create a connector

Complete the following steps to create a connector in MSK Connect:

  1. On the Amazon MSK console, choose Connectors in the navigation pane under MSK Connect.
  2. Choose Create connector.
  3. Select Use existing custom plugin and under Custom plugins, select the plugin msk-eventBridge-sink-plugin-v1 that you created earlier.
  4. Choose Next.
  5. For Connector name, enter msk-eventBridge-sink-connector.
  6. Enter an optional description.
  7. For Cluster type, select MSK cluster.
  8. For MSK clusters, select the cluster you created earlier.
  9. For Authentication, choose IAM.
  10. Under Connector configurations, enter the following settings (for more details on the configuration, see the GitHub repository):
    auto.offset.reset=earliest
    connector.class=software.amazon.event.kafkaconnector.EventBridgeSinkConnector
    topics=notifications
    aws.eventbridge.connector.id=avro-test-connector
    aws.eventbridge.eventbus.arn=arn:aws:events:us-east-1:123456789012:event-bus/eventbridge-sink-eventbus
    aws.eventbridge.region=us-east-1
    tasks.max=1
    key.converter=org.apache.kafka.connect.storage.StringConverter
    value.converter=com.amazonaws.services.schemaregistry.kafkaconnect.AWSKafkaAvroConverter
    value.converter.region=us-east-1
    value.converter.registry.name=default-registry
    value.converter.avroRecordType=GENERIC_RECORD

  11. Make sure to replace aws.eventbridge.eventbus.arn, aws.eventbridge.region, and value.converter.region with the values from the prerequisite stack.
  12. In the Connector capacity section, select Autoscaled for Capacity type.
  13. Leave the default value of 1 for MCU count per worker.
  14. Keep all default values for Connector capacity.
  15. For Worker configuration, select Use the MSK default configuration.
  16. Under Access permissions, choose the custom IAM role KafkaEventBridgeSinkStack-connectorRole, which you created during the AWS CDK stack deployment.
  17. Choose Next.
  18. Choose Next again.
  19. For Log delivery, select Deliver to Amazon CloudWatch Logs.
  20. For Log group, choose /aws/mskconnect/eventBridgeSinkConnector.
  21. Choose Next.
  22. Under Review and Create, validate all the settings and choose Create connector.

The connector will be now in the state Creating. It can take up to several minutes for the connector to transition into the status Running.

Create EventBridge rules

Now that the connector is forwarding events to EventBridge, we can use EventBridge rules to filter and send events to other targets. Complete the following steps to create a rule:

  1. On the EventBridge console, choose Rules in the navigation pane.
  2. Choose Create rule.
  3. Enter eb-to-cloudwatch-logs-and-webhook for Name.
  4. Select eventbridge-sink-eventbus for Event bus.
  5. Choose Next.
  6. Select Custom pattern (JSON editor), choose Insert, and replace the event pattern with the following code:
    {
      "detail": {
        "value": {
          "eventType": ["suspiciousActivity"],
          "source": ["transactionAnalyzer"]
        }
      },
      "detail-type": [{
        "prefix": "kafka-connect-notification"
      }]
    }
    

  7. Choose Next.
  8. For Target 1, select CloudWatch log group and enter kafka-events for Log Group.
  9. Choose Add another target.
  10. (Optional: Create an API destination) For Target 2, select EventBridge API destination for Target types.
  11. Select Create a new API destination.
  12. Enter a descriptive name for Name.
  13. Add the URL and enter it as API destination endpoint. (This can be the URL of your Datadog, Salesforce, etc. endpoint)
  14. Select POST for HTTP method.
  15. Select Create a new connection for Connection.
  16. For Connection Name, enter a name.
  17. Select Other as Destination type and select API Key as Authorization Type.
  18. For API key name and Value, enter your keys.
  19. Choose Next.
  20. Validate your inputs and choose Create rule.

EventBridge Rule

The following screenshot of the CloudWatch Logs console shows several events from EventBridge.

CloudWatch Logs

Run the connector in production

In this section, we dive deeper into the operational aspects of the connector. Specifically, we discuss how the connector scales and how to monitor it using CloudWatch.

Scale the connector

Kafka connectors scale through the number of tasks. The code design of the EventBridge sink connector doesn’t limit the number of tasks that it can run. MSK Connect provides the compute capacity to run the tasks, which can be from Provisioned or Autoscaled type. During the deployment of the connector, we choose the capacity type Autoscaled and 1 MCU per worker (which represents 1vCPU and 4GiB of memory). This means MSK Connect will scale the infrastructure to run tasks but not the number of tasks. The number of tasks is defined by the connector. By default, the connector will start with the number of tasks defined in tasks.max in the connector configuration. If this value is higher than the partition count of the processed topic, the number of tasks will be set to the number of partitions during the Kafka Connect rebalance.

Monitor the connector

MSK Connect emits metrics to CloudWatch for monitoring by default. Besides MSK Connect metrics, the offset of the connector should also be monitored in production. Monitoring the offset gives insights if the connector can keep up with the data produced in the Kafka cluster.

Clean up

To clean up your resources and avoid ongoing charges, complete the following the steps:

  1. On the Amazon MSK console, choose Connectors in the navigation pane under MSK Connect.
  2. Select the connectors you created and choose Delete.
  3. Choose Clusters in the navigation pane.
  4. Select the cluster you created and choose Delete on the Actions menu.
  5. On the EventBridge console, choose Rules in the navigation pane.
  6. Choose the event bus eventbridge-sink-eventbus.
  7. Select all the rules you created and choose Delete.
  8. Confirm the removal by entering delete, then choose Delete.

If you deployed the AWS CDK stack with the context PREREQ, delete the .jar file for the connector.

  1. On the Amazon S3 console, choose Buckets in the navigation pane.
  2. Navigate to the bucket where you uploaded your connector and delete the kafka-eventbridge-sink-with-gsr-dependencies.jar file.

Independent from the chosen deployment mode, all other AWS resources can be deleted by using AWS CDK or AWS CloudFormation. Run cdk destroy from the repository directory to delete the CloudFormation stack.

Alternatively, on the AWS CloudFormation console, select the stack KafkaEventBridgeSinkStack and choose Delete.

Conclusion

In this post, we showed how you can use MSK Connect to run the AWS open-sourced Kafka connector for EventBridge, how to configure the connector to forward a Kafka topic to EventBridge, and how to use EventBridge rules to filter and forward events to CloudWatch Logs and a webhook.

To learn more about the Kafka connector for EventBridge, refer to Amazon EventBridge announces open-source connector for Kafka Connect, as well as the MSK Connect Developer Guide and the code for the connector on the GitHub repo.


About the Authors

Florian Mair is a Senior Solutions Architect and data streaming expert at AWS. He is a technologist that helps customers in Germany succeed and innovate by solving business challenges using AWS Cloud services. Besides working as a Solutions Architect, Florian is a passionate mountaineer, and has climbed some of the highest mountains across Europe.

Benjamin Meyer is a Senior Solutions Architect at AWS, focused on Games businesses in Germany to solve business challenges by using AWS Cloud services. Benjamin has been an avid technologist for 7 years, and when he’s not helping customers, he can be found developing mobile apps, building electronics, or tending to his cacti.

How Vercel Shipped Cron Jobs in 2 Months Using Amazon EventBridge Scheduler

Post Syndicated from Marcia Villalba original https://aws.amazon.com/blogs/aws/how-vercel-shipped-cron-jobs-in-2-months-using-amazon-eventbridge-scheduler/

Vercel implemented Cron Jobs using Amazon EventBridge Scheduler, enabling their customers to create, manage, and run scheduled tasks at scale. The adoption of this feature was rapid, reaching over 7 million weekly cron invocations within a few months of release. This article shows how they did it and how they handle the massive scale they’re experiencing.

Vercel builds a front-end cloud that makes it easier for engineers to deploy and run their front-end applications. With more than 100 million deployments in Vercel in the last two years, Vercel helps users take advantage of best-in-class AWS infrastructure with zero configuration by relying heavily on serverless technology. Vercel provides a lot of features that help developers host their front-end applications. However, until the beginning of this year, they hadn’t built Cron Jobs yet.

A cron job is a scheduled task that automates running specific commands or scripts at predetermined intervals or fixed times. It enables users to set up regular, repetitive actions, such as backups, sending notification emails to customers, or processing payments when a subscription needs to be renewed. Cron jobs are widely used in computing environments to improve efficiency and automate routine operations, and they were a commonly requested feature from Vercel’s customers.

In December 2022, Vercel hosted an internal hackathon to foster innovation. That’s where Vincent Voyer and Andreas Schneider joined forces to build a prototype cron job feature for the Vercel platform. They formed a team of five people and worked on the feature for a week. The team worked on different tasks, from building a user interface to display the cron jobs to creating the backend implementation of the feature.

Amazon EventBridge Scheduler
When the hackathon team started thinking about solving the cron job problem, their first idea was to use Amazon EventBridge rules that run on a schedule. However, they realized quickly that this feature has a limit of 300 rules per account per AWS Region, which wasn’t enough for their intended use. Luckily, one of the team members had read the announcement of Amazon EventBridge Scheduler in the AWS Compute blog and they thought this would be a perfect tool for their problem.

By using EventBridge Scheduler, they could schedule one-time or recurrently millions of tasks across over 270 AWS services without provisioning or managing the underlying infrastructure.

How cron jobs work

For creating a new cron job in Vercel, a customer needs to define the frequency in which this task will run and the API they want to invoke. Vercel, in the backend, uses EventBridge Scheduler and creates a new schedule when a new cron job is created.

To call the endpoint, the team used an AWS Lambda function that receives the path that needs to be invoked as input parameters.

How cron jobs works

When the time comes for the cron job to run, EventBridge Scheduler invokes the function, which then calls the customer website endpoint that was configured.

By the end of the week, Vincent and his team had a working prototype version of the cron jobs feature, and they won a prize at the hackathon.

Building Vercel Cron Jobs
After working for one week on this prototype in December, the hackathon ended, and Vincent and his team returned to their regular jobs. In early January 2023, Vicent and the Vercel team decided to take the project and turn it into a real product.

During the hackathon, the team built the fundamental parts of the feature, but there were some details that they needed to polish to make it production ready. Vincent and Andreas worked on the feature, and in less than two months, on February 22, 2023, they announced Vercel Cron Jobs to the public. The announcement tweet got over 400 thousand views, and the community loved the launch.

Tweet from Vercel announcing cron jobs

The adoption of this feature was very rapid. Within a few months of launching Cron Jobs, Vercel reached over 7 million cron invocations per week, and they expect the adoption to continue growing.

Cron jobs adoption

How Vercel Cron Jobs Handles Scale
With this pace of adoption, scaling this feature is crucial for Vercel. In order to scale the amount of cron invocations at this pace, they had to make some business and architectural decisions.

From the business perspective, they defined limits for their free-tier customers. Free-tier customers can create a maximum of two cron jobs in their account, and they can only have hourly schedules. This means that free customers cannot run a cron job every 30 minutes; instead, they can do it at most every hour. Only customers on Vercel paid tiers can take advantage of EventBridge Scheduler minute granularity for scheduling tasks.

Also, for free customers, minute precision isn’t guaranteed. To achieve this, Vincent took advantage of the time window configuration from EventBridge Scheduler. The flexible time window configuration allows you to start a schedule within a window of time. This means that the scheduled tasks are dispersed across the time window to reduce the impact of multiple requests on downstream services. This is very useful if, for example, many customers want to run their jobs at midnight. By using the flexible time window, the load can spread across a set window of time.

From the architectural perspective, Vercel took advantage of hosting the APIs and owning the functions that the cron jobs invoke.

Validating the calls

This means that when the Lambda function is started by EventBridge Scheduler, the function ends its run without waiting for a response from the API. Then Vercel validates if the cron job ran by checking if the API and Vercel function ran correctly from its observability mechanisms. In this way, the function duration is very short, less than 400 milliseconds. This allows Vercel to run a lot of functions per second without affecting their concurrency limits.

Lambda invocations and duration dashboard

What Was The Impact?
Vercel’s implementation of Cron Jobs is an excellent example of what serverless technologies enable. In two months, with two people working full time, they were able to launch a feature that their community needed and enthusiastically adopted. This feature shows the completeness of Vercel’s platform and is an important feature to convince their customers to move to a paid account.

If you want to get started with EventBridge Scheduler, see Serverless Land patterns for EventBridge Scheduler, where you’ll find a broad range of examples to help you.

Marcia

Automatically delete schedules upon completion with Amazon EventBridge Scheduler

Post Syndicated from Marcia Villalba original https://aws.amazon.com/blogs/compute/automatically-delete-schedules-upon-completion-with-amazon-eventbridge-scheduler/

Amazon EventBridge Scheduler now supports configuring automatic deletion of schedules after completion. Now you can configure one-time and recurring schedules with an end date to be automatically deleted upon completion to avoid managing individual schedules.

Amazon EventBridge Scheduler allows you to create, run, and manage schedules on scale. Using EventBridge Scheduler, you can schedule millions of tasks to invoke over 270 AWS services and over 6,000 API operations, such as AWS Lambda, AWS Step Functions, and Amazon SNS.

By default, EventBridge Scheduler allows customers to have 1 million schedules per account, which can be increased as needed. However, completed schedules are counted towards the account quota limits. In addition, completed schedules are visible when listing schedules, and require customers to remove them. Some customers have created their own patterns to automatically remove completed schedules and since the EventBridge Scheduler announcement last November, this was one of the most requested features by customers.

Deleting after completion

When you configure automatic deletion for a schedule, EventBridge Scheduler deletes the schedule shortly after its last target invocation. You can set up automatic deletion when you create the schedule, or you can update the schedule settings at any point before its last invocation.

You can configure this setting in one-time and recurring schedules.

  • One-time schedules: your schedule is deleted after the schedule has invoked its target once.
  • Recurring schedules: set with rate or cron expressions, your schedule is deleted after the last invocation.

If all retries are exhausted because of failure for a schedule configured with automatic deletion, the schedule is deleted shortly after the last unsuccessful attempt.

Console action after schedule completition

With this new capability, you can save time, resources, and operational costs when managing your schedules.

Setting up schedules to delete after completion

You can create schedules that are automatically deleted after completion from the AWS Management Console, AWS SDK, or AWS CLI in all AWS Regions where EventBridge Scheduler is available.

For example, imagine that you are a developer on a platform that allows end users to receive notifications when a task is due. You are already using EventBridge Scheduler to implement this feature. For every task that your users create in your application, your code creates a new schedule in EventBridge Scheduler. You can now configure all these schedules to be deleted automatically after completion. And shortly after the schedules run, they are removed from your EventBridge Scheduler, allowing you to scale your system and keep on creating schedules, making it easier to manage your active schedules and quota limits.

Let see how you can implement this example with the new capability of EventBridge Scheduler. When a user creates a new task with a reminder, a function is triggered from your application. That function creates a one-time schedule in EventBridge Scheduler.

Create a schedule diagram

This example shows how you can create a new one-time schedule that is automatically deleted after completion using the AWS CLI and has SNS as a target. Make sure that you update the AWS CLI to the latest version. Then you can create a new schedule with the parameter action-after-completion ‘DELETE’.

$ aws scheduler create-schedule --name SendEmailOnce \
--schedule-expression ”at(2023-08-02T17:35:00)",\
--schedule-expression-timezone "Europe/Helsinki" \
--flexible-time-window "{\"Mode\": \"OFF\"}" \
--target "{\"Arn\": \"arn:aws:sns:us-east-1:xxx:test-send-email\", \"RoleArn\": \" arn:aws:iam::xxxx:role/sam_scheduler_role\" }" \
--action-after-completion 'DELETE'

This command creates a one-time schedule with the name SendEmailOnce, that runs at a specific date, defined in the schedule-expression, and in a specific time zone, defined in the schedule-expression-timezone. This schedule is not using the flexible time window feature. Next, you must define the target for this schedule. This one sends a message to an SNS topic.

You can validate that your schedule is created correctly from the AWS CLI with the get-schedule command.

$ aws scheduler get-schedule --name SendEmailOnce
{
    "ActionAfterCompletion": "DELETE",
    "Arn": "arn:aws:scheduler:us-east-1:905614108351:schedule/default/SendEmailOnce",
    "CreationDate": 1690874334.83,
    "FlexibleTimeWindow": {
        "Mode": "OFF"
    },
    "GroupName": "default",
    "LastModificationDate": 1690874334.83,
    "Name": "SendEmailOnce3",
    "ScheduleExpression": "at(2023-08-02T17:35:00)",
    "ScheduleExpressionTimezone": "Europe/Helsinki",
    "State": "ENABLED",
    "Target": {
        "Arn": "arn:aws:sns:us-east-1:xxxx:test-send-email",
        "RetryPolicy": {
            "MaximumEventAgeInSeconds": 86400,
            "MaximumRetryAttempts": 185
        },
        "RoleArn": "arn:aws:iam::XXXX:role/scheduler_role"
    }
}

In addition, you can see the details of the schedule from the AWS Management Console.

Schedule details

Now when the date of the notification arrives, EventBridge Scheduler invokes the target configured in the schedule, in this case SNS, and emails a notification to the customer.

Schedule starts

Shortly after this schedule is completed, if you list the schedules, you see that the schedule was deleted and it is no longer listed.

$ aws scheduler list-schedules
{
"Schedules": [
]
}

Benefits of automation

Traditionally, many problems that EventBridge Scheduler solves were addressed using batch processes and pull-based models.

Some organizations are using EventBridge Scheduler to replace their pull-based models for a more dynamic push-based model. Before implementing Scheduler, they were relying on the customer to ask for the data when they need it. Now, with EventBridge Scheduler, they are creating schedules to report back to their customers at critical times of their journey.

For example, an airline can use EventBridge Scheduler to create one-time schedules 24 hours, 4 hours, and 2 hours before the flight, to keep their passengers up to date with the flight status. Customers receive a notification with the link for the online check-in, the check-in counter number, baggage pick up information, and any flight changes that occur. In this way, passengers are always up to date on their flight status and they can take immediate action. This dynamic model not only helps to improve the customer experience but also improves the operational efficiency for the airline.

Other organizations use EventBridge Scheduler to replace batch operations, as you can configure a schedule that starts a batch process at the time of the day you need. Also, you can take advantage of EventBridge Scheduler time zones and run the processes at the time that make sense for your end customer.

For example, consider an international financial institution that must send customers a statement of their account at the end of the day. You can use EventBridge Scheduler to set up a recurrent schedule for each of your customers that sends a report at the end of the day of your customers’ time zone. In this way, you can improve the customer experience as now the system is personalized for their settings, and also reduce operational overhead, as the processing operations are distributed throughout the day.

In addition, EventBridge Scheduler solves many new use cases for customers. For example, if you are a financial institution that handles payments, you can create a one-time schedule for every large transaction that needs a confirmation. If the transaction is not confirmed when the schedule runs, you can cancel the transaction. This decreases the risk of handling transactions, improves the customer experience, and also improves the automation of your processes by making them real time.

Another use case is to handle credit card expiration dates. You can create a one-time schedule that emails the customer to update their credit card information one month before the expiration date. This solution removes operational overhead compared to the traditional implementation of using servers and batch processes.

Conclusion

In the preceding use cases listed, automation and task scheduling improve the end user experience, remove undifferentiated heavy lifting, and benefit from using the new capability of removing schedules after their completion.

This blog post introduces the new capability from Amazon EventBridge Scheduler that automatically deletes the completed schedules. This feature simplifies the use of EventBridge Scheduler, reduces the operational overhead of managing schedules at scale, and allows you to scale even further.

To get started with EventBridge Scheduler, visit Serverless Land patterns where you can find over 20 patterns using this service.

Learn how to streamline and secure your SaaS applications at AWS Applications Innovation Day

Post Syndicated from Phil Goldstein original https://aws.amazon.com/blogs/aws/learn-how-to-streamline-and-secure-your-saas-applications-at-aws-applications-innovation-day/

Companies continue to adopt software as a service (SaaS) applications at a rapid clip, with recent research showing that the average SaaS portfolio now has at least 200 applications. While organizations purchase these purpose-built tools to make their employees more productive, they now must contend with growing security complexities, context switching, and data silos.

If your company faces these issues, or you want to avoid them in the future, join us on Tuesday, June 27, for a free-to-attend online event AWS Applications Innovation Day. AWS will stream the event simultaneously across multiple platforms, including LinkedIn Live, Twitter, YouTube, and Twitch. You can also join us in person in Seattle to hear from Dilip Kumar, Vice President of AWS Applications and an executive panel with AWS Partners Splunk, Asana, and Okta.

Join us for Applications Innovation Day June 27, 2023.

Applications Innovation Day is designed to give you the tools you need to improve how your organization uses and secures SaaS applications. Sessions throughout the day will show you how you can secure data while providing your employees with the best tools for the job. You’ll also learn how to support the right mix of applications to improve workforce collaboration, and how to use generative artificial intelligence securely and effectively to improve insights and enhance employee productivity.

We’ll start the virtual broadcast with a keynote from Dilip Kumar, Vice President of AWS Applications, who will discuss the way we use and govern SaaS applications at AWS. He’ll also discuss how we’ll make it easier to deploy purpose-built SaaS applications like Asana, Okta, Splunk, Zoom, and others across your business, including the announcement of some exciting new innovations from AWS.

AWS product leaders will present technical breakout sessions during the day on the productivity and security aspects of managing a SaaS application tech stack. Sessions will cover a wide range of topics, including how the nature of productivity at work is changing, how AI is transforming SaaS applications and collaboration, how you can improve your security observability across your applications, and how you can create custom analytics on SaaS application activity.

Overall, the event is a great opportunity for security leaders, IT administrators and operations leaders, and anyone leading digital workplace and transformation initiatives to learn how to better leverage and govern SaaS applications.

To register for AWS Applications Innovation Day, simply go to the event page.

How CyberCRX cut ML processing time from 8 days to 56 minutes with AWS Step Functions Distributed Map

Post Syndicated from Marcia Villalba original https://aws.amazon.com/blogs/aws/how-cybercrx-cut-ml-processing-time-from-8-days-to-56-minutes-with-aws-step-functions-distributed-map/

Last December, Sébastien Stormacq wrote about the availability of a distributed map state for AWS Step Functions, a new feature that allows you to orchestrate large-scale parallel workloads in the cloud. That’s when Charles Burton, a data systems engineer for a company called CyberGRX, found out about it and refactored his workflow, reducing the processing time for his machine learning (ML) processing job from 8 days to 56 minutes. Before, running the job required an engineer to constantly monitor it; now, it runs in less than an hour with no support needed. In addition, the new implementation with AWS Step Functions Distributed Map costs less than what it did originally.

What CyberGRX achieved with this solution is a perfect example of what serverless technologies embrace: letting the cloud do as much of the undifferentiated heavy lifting as possible so the engineers and data scientists have more time to focus on what’s important for the business. In this case, that means continuing to improve the model and the processes for one of the key offerings from CyberGRX, a cyber risk assessment of third parties using ML insights from its large and growing database.

What’s the business challenge?
CyberGRX shares third-party cyber risk (TPCRM) data with their customers. They predict, with high confidence, how a third-party company will respond to a risk assessment questionnaire. To do this, they have to run their predictive model on every company in their platform; they currently have predictive data on more than 225,000 companies. Whenever there’s a new company or the data changes for a company, they regenerate their predictive model by processing their entire dataset. Over time, CyberGRX data scientists improve the model or add new features to it, which also requires the model to be regenerated.

The challenge is running this job for 225,000 companies in a timely manner, with as few hands-on resources as possible. The job runs a set of operations for each company, and every company calculation is independent of other companies. This means that in the ideal case, every company can be processed at the same time. However, implementing such a massive parallelization is a challenging problem to solve.

First iteration
With that in mind, the company built their first iteration of the pipeline using Kubernetes and Argo Workflows, an open-source container-native workflow engine for orchestrating parallel jobs on Kubernetes. These were tools they were familiar with, as they were already using them in their infrastructure.

But as soon as they tried to run the job for all the companies on the platform, they ran up against the limits of what their system could handle efficiently. Because the solution depended on a centralized controller, Argo Workflows, it was not robust, and the controller was scaled to its maximum capacity during this time. At that time, they only had 150,000 companies. And running the job with all of the companies took around 8 days, during which the system would crash and need to be restarted. It was very labor intensive, and it always required an engineer on call to monitor and troubleshoot the job.

The tipping point came when Charles joined the Analytics team at the beginning of 2022. One of his first tasks was to do a full model run on approximately 170,000 companies at that time. The model run lasted the whole week and ended at 2:00 AM on a Sunday. That’s when he decided their system needed to evolve.

Second iteration
With the pain of the last time he ran the model fresh in his mind, Charles thought through how he could rewrite the workflow. His first thought was to use AWS Lambda and SQS, but he realized that he needed an orchestrator in that solution. That’s why he chose Step Functions, a serverless service that helps you automate processes, orchestrate microservices, and create data and ML pipelines; plus, it scales as needed.

Charles got the new version of the workflow with Step Functions working in about 2 weeks. The first step he took was adapting his existing Docker image to run in Lambda using Lambda’s container image packaging format. Because the container already worked for his data processing tasks, this update was simple. He scheduled Lambda provisioned concurrency to make sure that all functions he needed were ready when he started the job. He also configured reserved concurrency to make sure that Lambda would be able to handle this maximum number of concurrent executions at a time. In order to support so many functions executing at the same time, he raised the concurrent execution quota for Lambda per account.

And to make sure that the steps were run in parallel, he used Step Functions and the map state. The map state allowed Charles to run a set of workflow steps for each item in a dataset. The iterations run in parallel. Because Step Functions map state offers 40 concurrent executions and CyberGRX needed more parallelization, they created a solution that launched multiple state machines in parallel; in this way, they were able to iterate fast across all the companies. Creating this complex solution, required a preprocessor that handled the heuristics of the concurrency of the system and split the input data across multiple state machines.

This second iteration was already better than the first one, as now it was able to finish the execution with no problems, and it could iterate over 200,000 companies in 90 minutes. However, the preprocessor was a very complex part of the system, and it was hitting the limits of the Lambda and Step Functions APIs due to the amount of parallelization.

Second iteration with AWS Step Functions

Third and final iteration
Then, during AWS re:Invent 2022, AWS announced a distributed map for Step Functions, a new type of map state that allows you to write Step Functions to coordinate large-scale parallel workloads. Using this new feature, you can easily iterate over millions of objects stored in Amazon Simple Storage Service (Amazon S3), and then the distributed map can launch up to 10,000 parallel sub-workflows to process the data.

When Charles read in the News Blog article about the 10,000 parallel workflow executions, he immediately thought about trying this new state. In a couple of weeks, Charles built the new iteration of the workflow.

Because the distributed map state split the input into different processors and handled the concurrency of the different executions, Charles was able to drop the complex preprocessor code.

The new process was the simplest that it’s ever been; now whenever they want to run the job, they just upload a file to Amazon S3 with the input data. This action triggers an Amazon EventBridge rule that targets the state machine with the distributed map. The state machine then executes with that file as an input and publishes the results to an Amazon Simple Notification Service (Amazon SNS) topic.

Final iteration with AWS Step Functions

What was the impact?
A few weeks after completing the third iteration, they had to run the job on all 227,000 companies in their platform. When the job finished, Charles’ team was blown away; the whole process took only 56 minutes to complete. They estimated that during those 56 minutes, the job ran more than 57 billion calculations.

Processing of the Distributed Map State

The following image shows an Amazon CloudWatch graph of the concurrent executions for one Lambda function during the time that the workflow was running. There are almost 10,000 functions running in parallel during this time.

Lambda concurrency CloudWatch graph

Simplifying and shortening the time to run the job opens a lot of possibilities for CyberGRX and the data science team. The benefits started right away the moment one of the data scientists wanted to run the job to test some improvements they had made for the model. They were able to run it independently without requiring an engineer to help them.

And, because the predictive model itself is one of the key offerings from CyberGRX, the company now has a more competitive product since the predictive analysis can be refined on a daily basis.

Learn more about using AWS Step Functions:

You can also check the Serverless Workflows Collection that we have available in Serverless Land for you to test and learn more about this new capability.

Marcia

Serverless ICYMI Q4 2022

Post Syndicated from Marcia Villalba original https://aws.amazon.com/blogs/compute/serverless-icymi-q4-2022/

Welcome to the 20th edition of the AWS Serverless ICYMI (in case you missed it) quarterly recap. Every quarter, we share all the most recent product launches, feature enhancements, blog posts, webinars, Twitch live streams, and other interesting things that you might have missed!In case you missed our last ICYMI, check out what happened last quarter here.

AWS Lambda

For developers using Java, AWS Lambda has introduced Lambda SnapStart. SnapStart is a new capability that can improve the start-up performance of functions using Corretto (java11) runtime by up to 10 times, at no extra cost.

To use this capability, you must enable it in your function and then publish a new version. This triggers the optimization process. This process initializes the function, takes an immutable, encrypted snapshot of the memory and disk state, and caches it for reuse. When the function is invoked, the state is retrieved from the cache in chunks, on an as-needed basis, and it is used to populate the execution environment.

The ICYMI: Serverless pre:Invent 2022 post shares some of the launches for Lambda before November 21, like the support of Lambda functions using Node.js 18 as a runtime, the Lambda Telemetry API, and new .NET tooling to support .NET 7 applications.

Also, now Amazon Inspector supports Lambda functions. You can enable Amazon Inspector to scan your functions continually for known vulnerabilities. The log4j vulnerability shows how important it is to scan your code for vulnerabilities continuously, not only after deployment. Vulnerabilities can be discovered at any time, and with Amazon Inspector, your functions and layers are rescanned whenever a new vulnerability is published.

AWS Step Functions

There were many new launches for AWS Step Functions, like intrinsic functions, cross-account access capabilities, and the new executions experience for Express Workflows covered in the pre:Invent post.

During AWS re:Invent this year, we announced Step Functions Distributed Map. If you need to process many files, or items inside CSV or JSON files, this new flow can help you. The new distributed map flow orchestrates large-scale parallel workloads.

This feature is optimized for files stored in Amazon S3. You can either process in parallel multiple files stored in a bucket, or process one large JSON or CSV file, in which each line contains an independent item. For example, you can convert a video file into multiple .gif animations using a distributed map, or process over 37 GB of aggregated weather data to find the highest temperature of the day. 

Amazon EventBridge

Amazon EventBridge launched two major features: Scheduler and Pipes. Amazon EventBridge Scheduler allows you to create, run, and manage scheduled tasks at scale. You can schedule one-time or recurring tasks across 270 services and over 6.000 APIs.

Amazon EventBridge Pipes allows you to create point-to-point integrations between event producers and consumers. With Pipes you can now connect different sources, like Amazon Kinesis Data Streams, Amazon DynamoDB Streams, Amazon SQS, Amazon Managed Streaming for Apache Kafka, and Amazon MQ to over 14 targets, such as Step Functions, Kinesis Data Streams, Lambda, and others. It not only allows you to connect these different event producers to consumers, but also provides filtering and enriching capabilities for events.

EventBridge now supports enhanced filtering capabilities including:

  • Matching against characters at the end of a value (suffix filtering)
  • Ignoring case sensitivity (equals-ignore-case)
  • OR matching: A single rule can match if any conditions across multiple separate fields are true.

It’s now also simpler to build rules, and you can generate AWS CloudFormation from the console pages and generate event patterns from a schema.

AWS Serverless Application Model (AWS SAM)

There were many announcements for AWS SAM during this quarter summarized in the ICMYI: Serverless pre:Invent 2022 post, like AWS SAM ConnectorsSAM CLI Pipelines now support OpenID Connect Protocol, and AWS SAM CLI Terraform support.

AWS Application Composer

AWS Application Composer is a new visual designer that you can use to build serverless applications using multiple AWS services. This is ideal if you want to build a prototype, review with others architectures, generate diagrams for your projects, or onboard new team members to a project.

Within a simple user interface, you can drag and drop the different AWS resources and configure them visually. You can use AWS Application Composer together with AWS SAM Accelerate to build and test your applications in the AWS Cloud.

AWS Serverless digital learning badges

The new AWS Serverless digital learning badges let you show your AWS Serverless knowledge and skills. This is a verifiable digital badge that is aligned with the AWS Serverless Learning Plan.

This badge proves your knowledge and skills for Lambda, Amazon API Gateway, and designing serverless applications. To earn this badge, you must score at least 80 percent on the assessment associated with the Learning Plan. Visit this link if you are ready to get started learning or just jump directly to the assessment. 

News from other services:

Amazon SNS

Amazon SQS

AWS AppSync and AWS Amplify

Observability

AWS re:Invent 2022

AWS re:Invent was held in Las Vegas from November 28 to December 2, 2022. Werner Vogels, Amazon’s CTO, highlighted event-driven applications during his keynote. He stated that the world is asynchronous and showed how strange a synchronous world would be. During the keynote, he showcased Serverlesspresso as an example of an event-driven application. The Serverless DA team presented many breakouts, workshops, and chalk talks. Rewatch all our breakout content:

In addition, we brought Serverlesspresso back to Vegas. Serverlesspresso is a contactless, serverless order management system for a physical coffee bar. The architecture comprises several serverless apps that support an ordering process from a customer’s smartphone to a real espresso bar. The customer can check the virtual line, place an order, and receive a notification when their drink is ready for pickup.

Serverless blog posts

October

November

December

Videos

Serverless Office Hours – Tuesday 10 AM PT

Weekly live virtual office hours: In each session, we talk about a specific topic or technology related to serverless and open it up to helping with your real serverless challenges and issues. Ask us anything about serverless technologies and applications.

YouTube: youtube.com/serverlessland

Twitch: twitch.tv/aws

October

November

December

FooBar Serverless YouTube Channel

Marcia Villalba frequently publishes new videos on her popular FooBar Serverless YouTube channel.

October

November

December

Still looking for more?

The Serverless landing page has more information. The Lambda resources page contains case studies, webinars, whitepapers, customer stories, reference architectures, and even more Getting Started tutorials. If you want to learn more about event-driven architectures, read our new guide that will help you get started.

You can also follow the Serverless Developer Advocacy team on Twitter and LinkedIn to see the latest news, follow conversations, and interact with the team.

For more serverless learning resources, visit Serverless Land.

New — Create Point-to-Point Integrations Between Event Producers and Consumers with Amazon EventBridge Pipes

Post Syndicated from Donnie Prakoso original https://aws.amazon.com/blogs/aws/new-create-point-to-point-integrations-between-event-producers-and-consumers-with-amazon-eventbridge-pipes/

It is increasingly common to use multiple cloud services as building blocks to assemble a modern event-driven application. Using purpose-built services to accomplish a particular task ensures developers get the best capabilities for their use case. However, communication between services can be difficult if they use different technologies to communicate, meaning that you need to learn the nuances of each service and how to integrate them with each other. We usually need to create integration code (or “glue” code) to connect and bridge communication between services. Writing glue code slows our velocity, increases the risk of bugs, and means we spend our time writing undifferentiated code rather than building better experiences for our customers.

Introducing Amazon EventBridge Pipes
Today, I’m excited to announce Amazon EventBridge Pipes, a new feature of Amazon EventBridge that makes it easier for you to build event-driven applications by providing a simple, consistent, and cost-effective way to create point-to-point integrations between event producers and consumers, removing the need to write undifferentiated glue code.

The simplest pipe consists of a source and a target. An optional filtering step allows only specific source events to flow into the Pipe and an optional enrichment step using AWS Lambda, AWS Step Functions, Amazon EventBridge API Destinations, or Amazon API Gateway enriches or transforms events before they reach the target. With Amazon EventBridge Pipes, you can integrate supported AWS and self-managed services as event producers and event consumers into your application in a simple, reliable, consistent and cost-effective way.

Amazon EventBridge Pipes bring the most popular features of Amazon EventBridge Event Bus, such as event filtering, integration with more than 14 AWS services, and automatic delivery retries.

How Amazon EventBridge Pipes Works
Amazon EventBridge Pipes provides you a seamless means of integrating supported AWS and self-managed services, favouring configuration over code. To start integrating services with EventBridge Pipes, you need to take the following steps:

  1. Choose a source that is producing your events. Supported sources include: Amazon DynamoDB, Amazon Kinesis Data Streams, Amazon SQS, Amazon Managed Streaming for Apache Kafka, and Amazon MQ (both ActiveMQ and RabbitMQ).
  2. (Optional) Specify an event filter to only process events that match your filter (you’re not charged for events that are filtered out).
  3. (Optional) Transform and enrich your events using built-in free transformations, or AWS Lambda, AWS Step Functions, Amazon API Gateway, or EventBridge API Destinations to perform more advanced transformations and enrichments.
  4. Choose a target destination from more than 14 AWS services, including Amazon Step Functions, Kinesis Data Streams, AWS Lambda, and third-party APIs using EventBridge API destinations.

Amazon EventBridge Pipes provides simplicity to accelerate development velocity by reducing the time needed to learn the services and write integration code, to get reliable and consistent integration.

EventBridge Pipes also comes with additional features that can help in building event-driven applications. For example, with event filtering, Pipes helps event-driven applications become more cost-effective by only processing the events of interest.

Get Started with Amazon EventBridge Pipes
Let’s see how to get started with Amazon EventBridge Pipes. In this post, I will show how to integrate an Amazon SQS queue with AWS Step Functions using Amazon EventBridge Pipes.

The following screenshot is my existing Amazon SQS queue and AWS Step Functions state machine. In my case, I need to run the state machine for every event in the queue. To do so, I need to connect my SQS queue and Step Functions state machine with EventBridge Pipes.

Existing Amazon SQS queue and AWS Step Functions state machine

First, I open the Amazon EventBridge console. In the navigation section, I select Pipes. Then I select Create pipe.

On this page, I can start configuring a pipe and set the AWS Identity and Access Management (IAM) permission, and I can navigate to the Pipe settings tab.

Navigate to Pipe Settings

In the Permissions section, I can define a new IAM role for this pipe or use an existing role. To improve developer experience, the EventBridge Pipes console will figure out the IAM role for me, so I don’t need to manually configure required permissions and let EventBridge Pipes configures least-privilege permissions for IAM role. Since this is my first time creating a pipe, I select Create a new role for this specific resource.

Setting IAM Permission for pipe

Then, I go back to the Build pipe section. On this page, I can see the available event sources supported by EventBridge Pipes.

List of available services as the event source

I select SQS and select my existing SQS queue. If I need to do batch processing, I can select Additional settings to start defining Batch size and Batch window. Then, I select Next.

Select SQS Queue as event source

On the next page, things get even more interesting because I can define Event filtering from the event source that I just selected. This step is optional, but the event filtering feature makes it easy for me to process events that only need to be processed by my event-driven application. In addition, this event filtering feature also helps me to be more cost-effective, as this pipe won’t process unnecessary events. For example, if I use Step Functions as the target, the event filtering will only execute events that match the filter.

Event filtering in Amazon EventBridge Pipes

I can use sample events from AWS events or define custom events. For example, I want to process events for returned purchased items with a value of 100 or more. The following is the sample event in JSON format:

{
   "event-type":"RETURN_PURCHASE",
   "value":100
}

Then, in the event pattern section, I can define the pattern by referring to the Content filtering in Amazon EventBridge event patterns documentation. I define the event pattern as follows:

{
   "event-type": ["RETURN_PURCHASE"],
   "value": [{
      "numeric": [">=", 100]
   }]
}

I can also test by selecting test pattern to make sure this event pattern will match the custom event I’m going to use. Once I’m confident that this is the event pattern that I want, I select Next.

Defining and testing an event pattern for filtering

In the next optional step, I can use an Enrichment that will augment, transform, or expand the event before sending the event to the target destination. This enrichment is useful when I need to enrich the event using an existing AWS Lambda function, or external SaaS API using the Destination API. Additionally, I can shape the event using the Enrichment Input Transformer.

The final step is to define a target for processing the events delivered by this pipe.

Defining target destination service

Here, I can select various AWS services supported by EventBridge Pipes.

I select my existing AWS Step Functions state machine, named pipes-statemachine.

In addition, I can also use Target Input Transformer by referring to the Transforming Amazon EventBridge target input documentation. For my case, I need to define a high priority for events going into this target. To do that, I define a sample custom event in Sample events/Event Payload and add the priority: HIGH in the Transformer section. Then in the Output section, I can see the final event to be passed to the target destination service. Then, I select Create pipe.

In less than a minute, my pipe was successfully created.

Pipe successfully created

To test this pipe, I need to put an event into the Amaon SQS queue.

Sending a message into Amazon SQS Queue

To check if my event is successfully processed by Step Functions, I can look into my state machine in Step Functions. On this page, I see my event is successfully processed.

I can also go to Amazon CloudWatch Logs to get more detailed logs.

Things to Know
Event Sources
– At launch, Amazon EventBridge Pipes supports the following services as event sources: Amazon DynamoDB, Amazon Kinesis, Amazon Managed Streaming for Apache Kafka (Amazon MSK) alongside self-managed Apache Kafka, Amazon SQS (standard and FIFO), and Amazon MQ (both for ActiveMQ and RabbitMQ).

Event Targets – Amazon EventBridge Pipes supports 15 Amazon EventBridge targets, including AWS Lambda, Amazon API Gateway, Amazon SNS, Amazon SQS, and AWS Step Functions. To deliver events to any HTTPS endpoint, developers can use API destinations as the target.

Event Ordering – EventBridge Pipes maintains the ordering of events received from an event sources that support ordering when sending those events to a destination service.

Programmatic Access – You can also interact with Amazon EventBridge Pipes and create a pipe using AWS Command Line Interface (CLI), AWS CloudFormation, and AWS Cloud Development Kit (AWS CDK).

Independent Usage – EventBridge Pipes can be used separately from Amazon EventBridge bus and Amazon EventBridge Scheduler. This flexibility helps developers to define source events from supported AWS and self-managed services as event sources without Amazon EventBridge Event Bus.

Availability – Amazon EventBridge Pipes is now generally available in all AWS commercial Regions, with the exception of Asia Pacific (Hyderabad) and Europe (Zurich).

Visit the Amazon EventBridge Pipes page to learn more about this feature and understand the pricing. You can also visit the documentation page to learn more about how to get started.

Happy building!

— Donnie

New — Amazon SageMaker Data Wrangler Supports SaaS Applications as Data Sources

Post Syndicated from Donnie Prakoso original https://aws.amazon.com/blogs/aws/new-amazon-sagemaker-data-wrangler-supports-saas-applications-as-data-sources/

Data fuels machine learning. In machine learning, data preparation is the process of transforming raw data into a format that is suitable for further processing and analysis. The common process for data preparation starts with collecting data, then cleaning it, labeling it, and finally validating and visualizing it. Getting the data right with high quality can often be a complex and time-consuming process.

This is why customers who build machine learning (ML) workloads on AWS appreciate the ability of Amazon SageMaker Data Wrangler. With SageMaker Data Wrangler, customers can simplify the process of data preparation and complete the required processes of the data preparation workflow on a single visual interface. Amazon SageMaker Data Wrangler helps to reduce the time it takes to aggregate and prepare data for ML.

However, due to the proliferation of data, customers generally have data spread out into multiple systems, including external software-as-a-service (SaaS) applications like SAP OData for manufacturing data, Salesforce for customer pipeline, and Google Analytics for web application data. To solve business problems using ML, customers have to bring all of these data sources together. They currently have to build their own solution or use third-party solutions to ingest data into Amazon S3 or Amazon Redshift. These solutions can be complex to set up and not cost-effective.

Introducing Amazon SageMaker Data Wrangler Supports SaaS Applications as Data Sources
I’m happy to share that starting today, you can aggregate external SaaS application data for ML in Amazon SageMaker Data Wrangler to prepare data for ML. With this feature, you can use more than 40 SaaS applications as data sources via Amazon AppFlow and have these data available on Amazon SageMaker Data Wrangler. Once the data sources are registered in AWS Glue Data Catalog by AppFlow, you can browse tables and schemas from these data sources using Data Wrangler SQL explorer. This feature provides seamless data integration between SaaS applications and SageMaker Data Wrangler using Amazon AppFlow.

Here is a quick preview of this new feature:

This new feature of Amazon SageMaker Data Wrangler works by using integration with Amazon AppFlow, a fully managed integration service that enables you to securely exchange data between SaaS applications and AWS services. With Amazon AppFlow, you can establish bidirectional data integration between SaaS applications, such as Salesforce, SAP, and Amplitude and all supported services, into your Amazon S3 or Amazon Redshift.

Then, with Amazon AppFlow, you can catalog the data in AWS Glue Data Catalog. This is a new feature where with Amazon AppFlow, you can create an integration with AWS Glue Data Catalog for Amazon S3 destination connector. With this new integration, customers can catalog SaaS data applications into AWS Glue Data Catalog with a few clicks, directly from the Amazon AppFlow Flow configuration, without the need to run any crawlers.

Once you’ve established a flow and inserted it into the AWS Glue Data Catalog, you can use this data inside the Amazon SageMaker Data Wrangler. Then, you can do the data preparation as you usually do. You can write Amazon Athena queries to preview data, join data from multiple sources, or import data to prepare for ML model training.

With this feature, you need to do a few simple steps to perform seamless data integration between SaaS applications into Amazon SageMaker Data Wrangler via Amazon AppFlow. This integration supports more than 40 SaaS applications, and for a complete list of supported applications, please check the Supported source and destination applications documentation.

Get Started with Amazon SageMaker Data Wrangler Support for Amazon AppFlow
Let’s see how this feature works in detail. In my scenario, I need to get data from Salesforce, and do the data preparation using Amazon SageMaker Data Wrangler.

To start using this feature, the first thing I need to do is to create a flow in Amazon AppFlow that registers the data source into the AWS Glue Data Catalog. I already have an existing connection with my Salesforce account, and all I need now is to create a flow.

One important thing to note is that to make SaaS application data available in Amazon SageMaker Data Wrangler, I need to create a flow with Amazon S3 as the destination. Then, I need to enable Create a Data Catalog table in the AWS Glue Data Catalog settings. This option will automatically catalog my Salesforce data into AWS Glue Data Catalog.

On this page, I need to select a user role with the required AWS Glue Data Catalog permissions and define the database name and the table name prefix. In addition, in this section, I can define the data format preference, be it in JSON, CSV, or Apache Parquet formats, and filename preference if I want to add a timestamp into the file name section.

To learn more about how to register SaaS data in Amazon AppFlow and AWS Glue Data Catalog, you can read Cataloging the data output from an Amazon AppFlow flow documentation page.

Once I’ve finished registering SaaS data, I need to make sure the IAM role can view the data sources in Data Wrangler from AppFlow. Here is an example of a policy in the IAM role:

{
    "Version": "2012-10-17",
    "Statement": [
        {
            "Effect": "Allow",
            "Action": "glue:SearchTables",
            "Resource": [
                "arn:aws:glue:*:*:table/*/*",
                "arn:aws:glue:*:*:database/*",
                "arn:aws:glue:*:*:catalog"
            ]
        }
    ]
} 

By enabling data cataloging with AWS Glue Data Catalog, from this point on, Amazon SageMaker Data Wrangler will be able to automatically discover this new data source and I can browse tables and schema using the Data Wrangler SQL Explorer.

Now it’s time to switch to the Amazon SageMaker Data Wrangler dashboard then select Connect to data sources.

On the following page, I need to Create connection and select the data source I want to import. In this section, I can see all the available connections for me to use. Here I see the Salesforce connection is already available for me to use.

If I would like to add additional data sources, I can see a list of external SaaS applications that I can integrate into the Set up new data sources section. To learn how to recognize external SaaS applications as data sources, I can learn more with the select How to enable access.

Now I will import datasets and select the Salesforce connection.

On the next page, I can define connection settings and import data from Salesforce. When I’m done with this configuration, I select Connect.

On the following page, I see my Salesforce data that I already configured with Amazon AppFlow and AWS Glue Data Catalog called appflowdatasourcedb. I can also see a table preview and schema for me to review if this is the data I need.

Then, I start building my dataset using this data by performing SQL queries inside the SageMaker Data Wrangler SQL Explorer. Then, I select Import query.

Then, I define a name for my dataset.

At this point, I can start doing the data preparation process. I can navigate to the Analysis tab to run the data insight report. The analysis will provide me with a report on the data quality issues and what transform I need to use next to fix the issues based on the ML problem I want to predict. To learn more about how to use the data analysis feature, see Accelerate data preparation with data quality and insights in the Amazon SageMaker Data Wrangler blog post.

In my case, there are several columns I don’t need, and I need to drop these columns. I select Add step.

One feature I like is that Amazon SageMaker Data Wrangler provides numerous ML data transforms. It helps me to streamline the process of cleaning, transforming and feature engineering my data in one dashboard. For more about what SageMaker Data Wrangler provides for transformation data, please read this Transform Data documentation page.

In this list, I select Manage columns.

Then, in the Transform section, I select the Drop column option. Then, I select a few columns that I don’t need.

Once I’m done, the columns I don’t need are removed and the Drop column data preparation step I just created is listed in the Add step section.

I can also see the visual of my data flow inside the Amazon SageMaker Data Wrangler. In this example, my data flow is quite basic. But when my data preparation process becomes complex, this visual view makes it easy for me to see all the data preparation steps.

From this point on, I can do what I require with my Salesforce data. For example, I can export data directly to Amazon S3 by selecting Export to and choosing Amazon S3 from the Add destination menu. In my case, I specify Data Wrangler to store the data in Amazon S3 after it has processed it by selecting Add destination and then Amazon S3.

Amazon SageMaker Data Wrangler provides me flexibility to automate the same data preparation flow using scheduled jobs. I can also automate feature engineering with SageMaker Pipelines (via Jupyter Notebook) and SageMaker Feature Store (via Jupyter Notebook), and deploy to Inference end point with SageMaker Inference Pipeline (via Jupyter Notebook).

Things to Know
Related news – This feature will make it easy for you to do data aggregation and preparation with Amazon SageMaker Data Wrangler. As this feature is an integration with Amazon AppFlow and also AWS Glue Data Catalog, you might want to learn more on Amazon AppFlow now supports AWS Glue Data Catalog integration and provides enhanced data preparation page.

Availability – Amazon SageMaker Data Wrangler supports SaaS applications as data sources available in all the Regions currently supported by Amazon AppFlow.

Pricing – There is no additional cost to use SaaS applications supports in Amazon SageMaker Data Wrangler, but there is a cost to running Amazon AppFlow to get the data in Amazon SageMaker Data Wrangler.

Visit Import Data From Software as a Service (SaaS) Platforms documentation page to learn more about this feature, and follow the getting started guide to start data aggregating and preparing SaaS applications data with Amazon SageMaker Data Wrangler.

Happy building!
Donnie

Introducing Amazon EventBridge Scheduler

Post Syndicated from Marcia Villalba original https://aws.amazon.com/blogs/compute/introducing-amazon-eventbridge-scheduler/

Today, we are announcing Amazon EventBridge Scheduler. This is a new capability from Amazon EventBridge that allows you to create, run, and manage scheduled tasks at scale. With EventBridge Scheduler, you can schedule one-time or recurrently tens of millions of tasks across many AWS services without provisioning or managing underlying infrastructure.

Previously, many customers used commercial off-the-shelf tools or built their own scheduling capabilities. This can increase application complexity, slow application development, and increase costs, which are magnified at scale. Most of these solutions are limited in what services they can trigger and create complexity in managing concurrency limitations of invoked targets that can affect application performance.

When to use EventBridge Scheduler?

For example, consider a company that develops a task management system. One feature that the application provides is that users can add a reminder for a task and be reminded by email one week before, two days before, or on the day of the task due date. You can automate the creation of all the schedules with EventBridge Scheduler, create the task for each of the reminders, and send it to Amazon SNS to send the notifications.

Or consider a large organization, like a supermarket, with thousands of AWS accounts and tens of thousands of Amazon EC2 instances. These instances are used in different parts of the world during business hours. You want to make sure that all the instances are started before the stores open and terminated after the business hours to reduce costs as much as possible. You can use EventBridge Scheduler to start and stop all the thousands of instances and also respect time zones.

SaaS providers can also benefit from EventBridge Scheduler, as now they can more easily manage all the different scheduled tasks that their customers have. For example, consider a SaaS provider with a subscription model for your customers paying a monthly or annual fee. You want to ensure that their license key is valid until the end of their current billing period. With Scheduler, you can create a schedule that removes the access to the service when the billing period is over, or when the user cancels their subscription. Also, you can create a series of emails that let your customer knows that their license is expiring so they can purchase a renewal. Example using scheduler

Use cases for EventBridge Scheduler are diverse, from simplifying new feature development to improving your infrastructure operations.

How does EventBridge Scheduler work?

With EventBridge Scheduler, you can now create single or recurrent schedules that trigger over 200 services with more than 6,000 APIs. EventBridge Scheduler allows you to configure schedules with a minimum granularity of one minute.

EventBridge Scheduler provides at-least-once event delivery to targets, and you can create schedules that adjust to different delivery patterns by setting the window of delivery, the number of retries, the time for the event to be retained, and the dead letter queue (DLQ). You can learn more about each configuration from the Scheduler User Guide.

  • Time window allows you to start a schedule within a window of time. This means that the scheduled tasks are dispersed across the time window to reduce the impact of multiple requests on downstream services.
  • Maximum retention time of the event is the maximum time to keep an unprocessed event in the scheduler. If the target is not responding during this time, the event is dropped or sent to a DLQ.
  • Retries with exponential backoff help to retry a failed task with delayed attempts. This improves the success of the task when the target is available.
  • A dead letter queue is an Amazon SQS queue where events that failed to get delivered to the target are routed.

By default, EventBridge Scheduler tries to send the event for 24 hours and a maximum of 185 times. You can configure these values. If that fails, the message is dropped, since by default there is not a DLQ configured.

In addition, by default, all events in Scheduler are encrypted with a key that AWS owns and manages. You can also use your own AWS KMS encryption keys.

You can also schedule tasks using Amazon EventBridge rules. But to schedule tasks at scale, EventBridge Scheduler is better suited for this task. The following table shows the main differences between EventBridge Scheduler and EventBridge rules:


Amazon EventBridge Scheduler Amazon EventBridge rules
Quota on schedules 1 million per account 300 rule limit per account per Region
Event invocation throughput Able to support throughput in 1,000s of TPS Because of the schedule limit, you can only have 300 1-minute schedules for max throughput of 5 TPS
Targets Over 270 services and over 6,000 API Actions with AWS SDK targets 20+ targets supported by EventBridge
Time expression and time-zones

at(), cron(), rate()

All time-zones and DST

cron(), rate(), UTC

No support for DST

One-time schedules Yes No
Time window schedules Yes No
Event bus support No event bus is needed Default bus only
Rule quota consumption No. 1 million schedules soft limit Yes, consumes from 2,000 rules per bus

Getting started with EventBridge Scheduler

This walkthrough builds a series of schedules to get started with EventBridge Scheduler. For that, you use the AWS Command Line (AWS CLI) to configure the schedules that send notifications using Amazon SNS.

Prerequisites

Update your AWS CLI to the latest version (v1.27.7).

As a prerequisite, you must create an SNS topic with an email subscription and an AWS IAM role that EventBridge Scheduler can assume to publish messages on your behalf. You can deploy these AWS resources using AWS SAM. Follow the instructions in the README file.

Scheduling a one-time schedule

Once configured, create your first schedule. This is a one-time schedule that publishes an event for the SNS topic you created.

For creating the schedule, run this command in your terminal and replace the schedule expression and time zone with values for your task:

$ aws scheduler create-schedule --name SendEmailOnce \ 
--schedule-expression "at(2022-11-01T11:00:00)" \ 
--schedule-expression-timezone "Europe/Helsinki" \
--flexible-time-window "{\"Mode\": \"OFF\"}" \
--target "{\"Arn\": \"arn:aws:sns:us-east-1:xxx:test-chronos-send-email\", \"RoleArn\": \" arn:aws:iam::xxxx:role/sam_scheduler_role\" }"

Let’s analyze the different parts of this command. The first parameter is the name of the schedule.

In the schedule expression attribute, you can define if the event is a one-time schedule or a recurrent schedule. Because this is a one-time schedule, it uses the at() expression with the date and time you want this schedule to run. Also, you must configure the schedule expression time zone in which this schedule run:

--schedule-expression "at(2022-11-01T11:00:00)" --schedule-expression-timezone "Europe/Helsinki"

Another setting that you can configure is the flexible time window. It’s not used for this example, but if you choose a time window, EventBridge Scheduler invokes the task within that timeframe. This setting helps to distribute the invocations across time and manage the downstream service limits.

--flexible-time-window "{\"Mode\": \"OFF\"}"

Finally, pass the IAM role ARN. This is the role previously created with the AWS SAM template. This role is the one that EventBridge Scheduler assumes when publishing events to SNS and it has permissions to publish messages on that topic.

Finally, you must configure the target. Scheduler comes with predefined targets with simpler APIs, that include actions like putting events for Amazon EventBridge, invoke a Lambda function, send a message to an Amazon SQS queue. For this example, use the universal target, which allows you to invoke almost any AWS services. Learn more about the targets from the User Guide.

--target "{\"Arn\": \"arn:aws:sns:us-east-1:xxx:test-chronos-send-email\", \"RoleArn\": \" arn:aws:iam::xxxx:role/sam_scheduler_role\" }"

Scheduling groups

Scheduling groups help you organize your schedules. Scheduling groups support tags that you can use for cost allocation, access control, and resource organization. When creating a new schedule, you can add it to a scheduling group.

To create a new scheduling group, run:

$ aws scheduler create-schedule-group --name ScheduleGroupTest

Scheduling a recurrent schedule

Now let’s create a recurrent schedule for that scheduling group. This schedule runs every five minutes and publishes a message to the SNS topic you created during the prerequisites.

$ aws scheduler create-schedule --name SendEmailTest \
--group-name ScheduleGroupTest \
--schedule-expression "rate(5minutes)" \
--flexible-time-window "{\"Mode\": \"OFF\"}" \
--target "{\"Arn\": \"arn:aws:sns:us-east-1:xxxx:test-chronos-send-email\", \"RoleArn\": \" arn:aws:iam::xxxx:role/sam_scheduler_role \" }"

Recurrent schedules can be configured with a cron expression or rate expression, to define the frequency that this schedule should be triggered. For scheduling this to run every five minutes, you can use an expression like this one:

--schedule-expression "rate(5minutes)"

Because you have selected the recurring schedule, you can define the timeframe in which this schedule runs. You can optionally choose a start and end date and time for your schedule. If you don’t do it, the schedule starts as soon as you create the task. These times are formatted in the same way as other AWS CLI timestamps.

--start-date "2022-11-01T18:48:00Z" --end-date "2022-11-01T19:00:00Z"

If you run the previous recurrent schedule for some time, and then check Amazon CloudWatch metrics, you find a metric called InvocationAttemptCount, for the schedule invocations that happened within the scheduling group you just created.

You can graph that metric in a dashboard and see how many times this schedule run. Also, you can create alarms to get notified if the number of invocations exceeds a threshold. For example, you can set this threshold to be close to the limits of your downstream service, to prevent reaching those limits.

Graphed metric in dashboard

Cleaning up

Make sure that you delete all the recurrent schedules that you created without an end time.

To check all the schedules that you have configured:

$ aws scheduler list-schedules

To delete a schedule using the AWS CLI:

$ aws scheduler delete-schedule --name <name-of-schedule> --group <name-of-group>

Also delete the CloudFormation stack with the prerequisite infrastructure when you complete this demo, as is defined in the README file of that project.

Conclusion

This blog post introduces the new Amazon EventBridge Scheduler, its use cases and its differences with existing scheduling options. It shows you how to create a new schedule using Amazon EventBridge Scheduler to simplify the creation, execution, and managing of scheduled tasks at scale.

You can get started today with EventBridge Scheduler from the AWS Management Console, AWS CLI, AWS CloudFormation, AWS SDK, and AWS SAM.

For more serverless learning resources, visit Serverless Land.