Introducing Apache Spark troubleshooting agent for Amazon EMR on EKS

Post Syndicated from Vara Bonthu original https://aws.amazon.com/blogs/big-data/introducing-apache-spark-troubleshooting-agent-for-amazon-emr-on-eks/

Debugging a failed Apache Spark application on Amazon EMR on EKS often means correlating signals from several places at once. These signals include Spark driver and executor pod logs, Spark event logs, and container termination signals that surface as pod exit codes rather than clear Spark errors. For example, a single out-of-memory failure can appear as a Kubernetes exit code 137 with no obvious link back to the line of code or configuration that caused it. This cross-system investigation can extend a single incident’s mean-time-to-resolution (MTTR) to days and requires deep Spark and Kubernetes expertise.

We recently announced Amazon EMR on EKS now supports Apache Spark troubleshooting agent extending the Apache Spark troubleshooting agent to support Amazon EMR on EKS. The agent already helps data engineers diagnose Spark failures on Amazon EMR on EC2, Amazon EMR Serverless, and AWS Glue using natural language prompts. With this launch, you can now point the same workflow at a failed Amazon EMR on EKS job run. From a single natural language prompt, the agent automatically retrieves your Spark logs from Amazon Simple Storage Service (Amazon S3) or Amazon CloudWatch (depending on your job’s logging configuration) along with Spark History Server Event log data, identifies the root cause, and recommends a fix when the failure is code-related. This can help reduce incident MTTR from days to minutes. Amazon EMR on EKS customers can use the agent at no additional cost. You only pay for your existing Amazon EMR on EKS resources.

In this post, we show you how to set up the agent for Amazon EMR on EKS and walk through troubleshooting a failed job run. We demonstrate the workflow from both the Amazon EMR console and an AI assistant that supports the Model Context Protocol (MCP), an open standard for connecting AI assistants to external tools and data.

How the troubleshooting agent works on Amazon EMR on EKS

The troubleshooting agent exposes a single interface to diagnose failed Spark applications across Amazon EMR on EKS, Amazon EMR on EC2, Amazon EMR Serverless, AWS Glue, and Amazon SageMaker notebooks. Instead of navigating different consoles, APIs, and log locations for each service, you describe your failed job in natural language, and the agent handles the rest. You can reach the agent from the Amazon EMR console or from MCP-compatible AI assistants, such as Kiro CLI, Kiro IDE, or Claude Code. We walk through both later in this post.

The troubleshooting agent runs as a fully managed MCP server, so you do not need to deploy or maintain a local MCP server. It uses a single-tenant design to keep your application data and code isolated. Operations are read-only and governed by AWS Identity and Access Management (IAM) permissions. The agent can only access the resources and actions your IAM role grants. Tool calls are automatically logged to AWS CloudTrail for complete auditability.
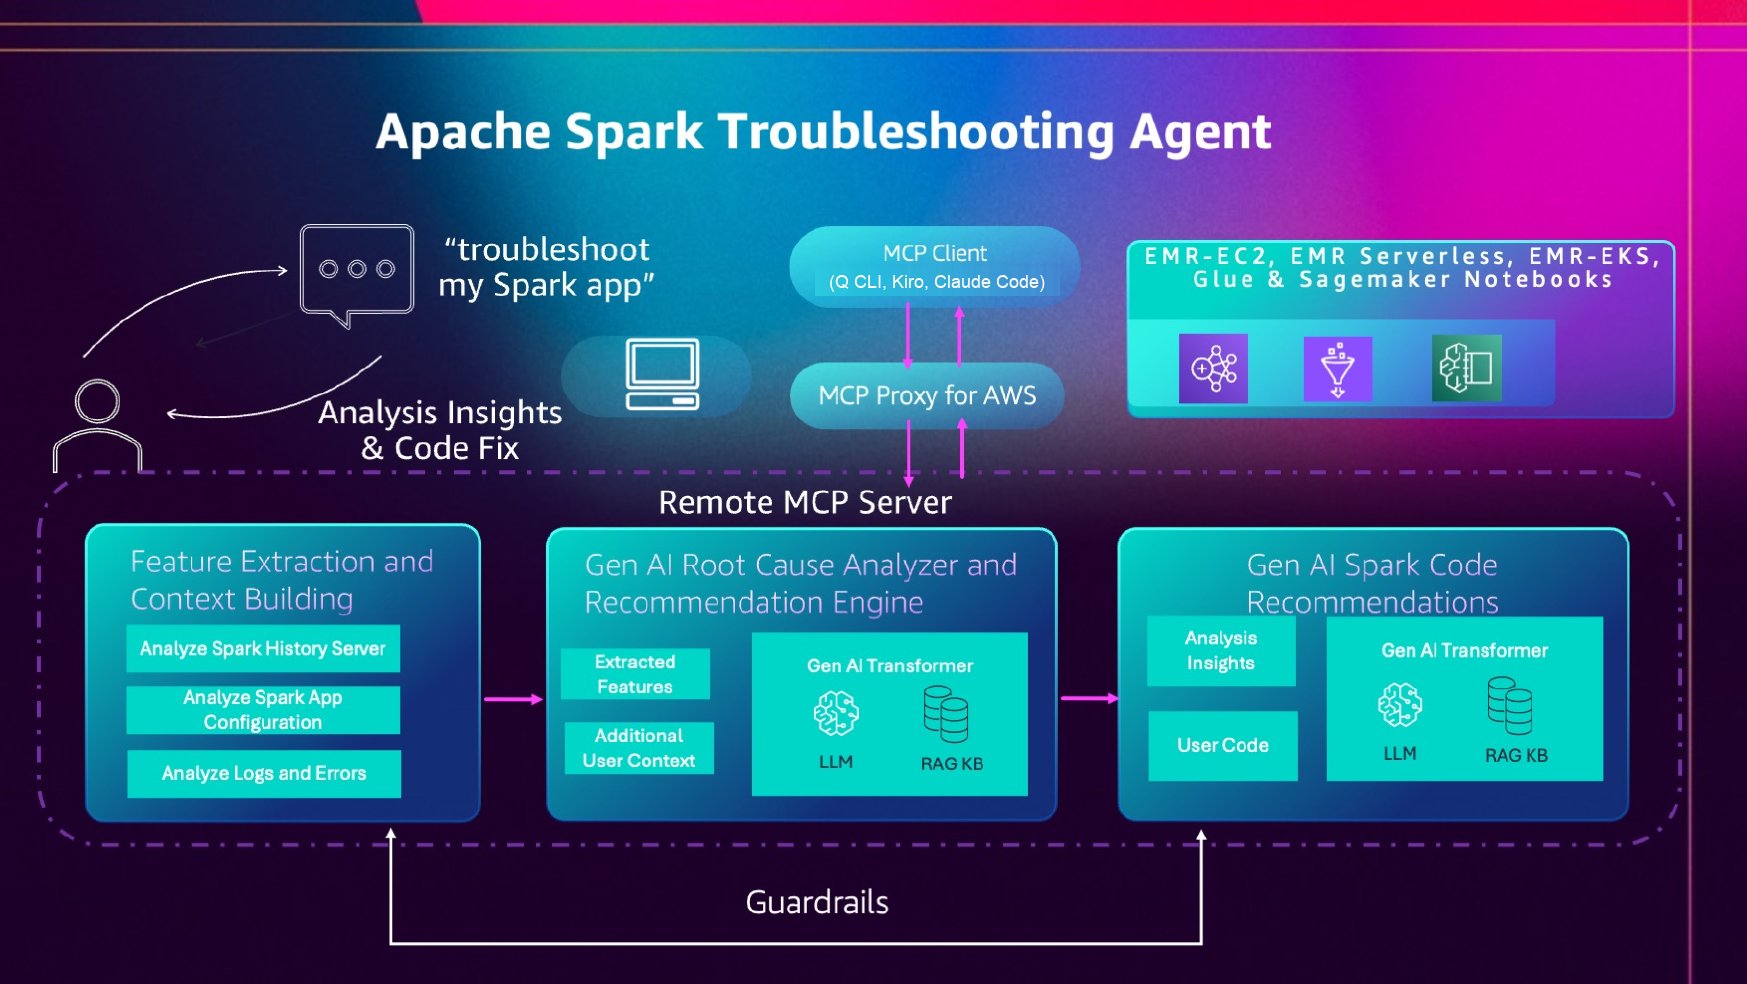
Architecture of the Spark troubleshooting agent running as a managed MCP server with read-only IAM access and CloudTrail logging

What’s specific to Amazon EMR on EKS is how the agent gathers its inputs. On Amazon EMR on EKS, your Spark driver and executor logs can be delivered to Amazon S3, Amazon CloudWatch Logs, or both, depending on your job’s monitoring configuration. The agent handles both sources automatically:

  • Driver and executor pod logs in Amazon S3 – When your job is configured with S3 monitoring, the agent reads the Spark event logs and the per-container stderr/stdout logs from your S3 log location, including discovering executor pod logs.
  • Driver and executor container logs in Amazon CloudWatch – When your job is configured with CloudWatch monitoring, the agent reads the driver and executor container log streams directly from your CloudWatch log group.
  • Spark History Server (SHS) data through the Amazon EMR Persistent UI – For the richer SHS signals (query plans, executor timelines, stage metrics, and configurations), the agent connects to the Amazon EMR Persistent UI for your job run, the same mechanism used for Amazon EMR on EC2.

Drawing on years of AWS experience running millions of Spark applications at scale, the agent extracts the relevant features and signals from these sources, work that would otherwise require manual correlation across Amazon S3, Amazon CloudWatch, and the Spark UI. It then uses a large language model on Amazon Bedrock, grounded in a managed knowledge base of Spark and AWS troubleshooting expertise through Retrieval Augmented Generation (RAG), to produce a root cause analysis and, when the failure is code-related, a code recommendation.

The large language model (LLM), the knowledge base, and the retrieval that connects them are fully managed as part of the agent. There’s nothing for you to provision, host, or tune. This managed inference is provided at no additional cost for Amazon EMR on EKS. You pay only for the AWS resources you already use to run your Spark applications and to validate recommended changes.
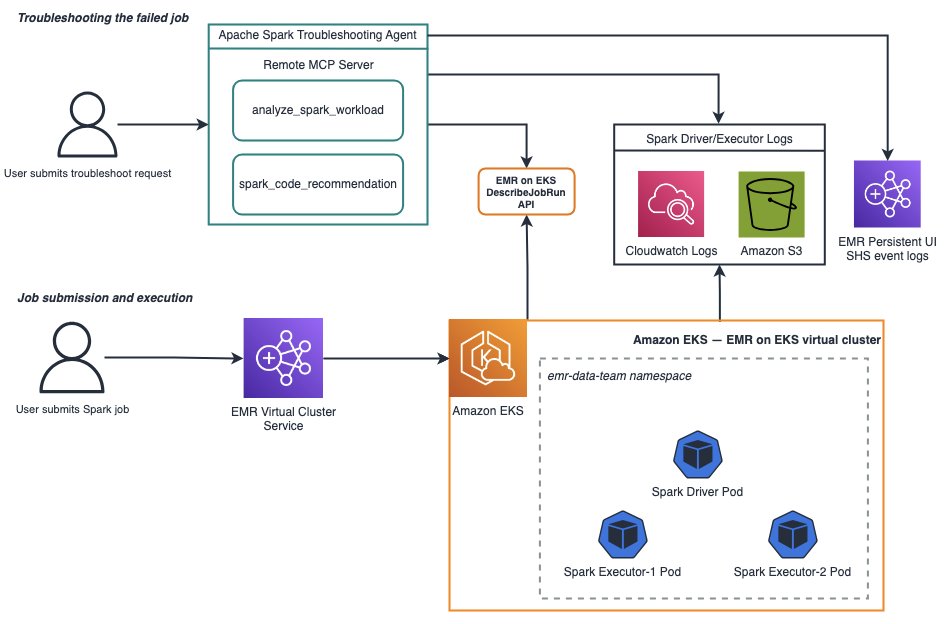
The agent extracting signals from Amazon S3 and Amazon CloudWatch and using an Amazon Bedrock model with a knowledge base to produce a root cause analysis

Getting started

You can use the agent from either the Amazon EMR console or an MCP client. Both rely on setting up a single IAM role. The following sections walk through creating that role and then troubleshooting a failed job run with each method.

Set up IAM permissions

The IAM role grants the agent read access to the diagnostic sources it analyzes, such as your Amazon EMR on EKS job runs, the Amazon EMR Persistent UI, and your Spark logs in Amazon S3 and Amazon CloudWatch. Creating this role is the only setup required for the console experience. The MCP client path has a few additional prerequisites, covered later in the section on troubleshooting from an MCP client.

To run the commands in this section, you need the AWS Command Line Interface (AWS CLI) (version 2.30.0 or later) installed and configured with your AWS credentials. For instructions, see Setting up the AWS CLI.

Step 1: Create the IAM role

The agent uses your IAM role to authorize operations at the AWS service level. It can only access what your role allows. Create a role your account can assume, then attach a policy granting the permissions the agent needs for Amazon EMR on EKS.

First, set some variables for the commands that follow. ACCOUNT_ID is derived from your configured credentials. Set REGION to the AWS Region where you run your Amazon EMR on EKS workloads:

ACCOUNT_ID=$(aws sts get-caller-identity --query Account --output text)
REGION=us-east-2   # replace with your Region

Create a trust policy that allows your account to assume the role, and create the role:

cat > mcp-trust-policy.json << EOF
{
  "Version": "2012-10-17",
  "Statement": [
    {
      "Sid": "AllowAccountToAssumeRole",
      "Effect": "Allow",
      "Principal": { "AWS": "arn:aws:iam::${ACCOUNT_ID}:root" },
      "Action": "sts:AssumeRole"
    }
  ]
}
EOF

aws iam create-role \
  --role-name SparkTroubleshootingMCPRole \
  --assume-role-policy-document file://mcp-trust-policy.json

Step 2: Attach Amazon EMR on EKS permissions

Create and attach a policy granting the agent read access to your Amazon EMR on EKS job runs, the Amazon EMR Persistent UI, and your S3 and CloudWatch logs. Replace amzn-s3-demo-logging-bucket with the name of your logging bucket and replace my_log_group_name and my_log_stream_prefix with your CloudWatch log group name and log stream prefix, respectively.

cat > emr-eks-policy.json << EOF
{
  "Version": "2012-10-17",
  "Statement": [
    {
      "Sid": "EMREKSReadAccess",
      "Effect": "Allow",
      "Action": [
        "emr-containers:DescribeJobRun",
        "emr-containers:DescribeVirtualCluster",
        "emr-containers:ListJobRuns",
        "emr-containers:ListVirtualClusters"
      ],
      "Resource": ["*"]
    },
    {
      "Sid": "EMREKSPersistentApp",
      "Effect": "Allow",
      "Action": [
        "elasticmapreduce:CreatePersistentAppUI",
        "elasticmapreduce:DescribePersistentAppUI",
        "elasticmapreduce:GetPersistentAppUIPresignedURL"
      ],
      "Resource": ["*"]
    },
    {
      "Sid": "EMREKSS3LogAccess",
      "Effect": "Allow",
      "Action": ["s3:GetObject", "s3:ListBucket"],
      "Resource":[
        "arn:aws:s3:::amzn-s3-demo-logging-bucket",
        "arn:aws:s3:::amzn-s3-demo-logging-bucket/*"
      ]
    },
    {
      "Sid": "EMREKSCloudWatchLogAccess",
      "Effect": "Allow",
      "Action": [
        "logs:GetLogEvents",
        "logs:DescribeLogGroups",
        "logs:DescribeLogStreams"
      ],
      "Resource": [
        "arn:aws:logs:*:*:log-group:my_log_group_name:log-stream:my_log_stream_prefix/*"
      ]
    }
  ]
}
EOF

aws iam put-role-policy \
  --role-name SparkTroubleshootingMCPRole \
  --policy-name EMREKSTroubleshootingAccess \
  --policy-document file://emr-eks-policy.json

Note: If you prefer an automated setup, an AWS CloudFormation template that creates this role with the required permissions is available in the setup documentation. The previous CLI steps give you the same result with finer control over each permission.

Troubleshooting a failed Amazon EMR on EKS job run

You can reach the troubleshooting agent two ways: directly from the Amazon EMR console, or from an MCP-compatible AI assistant such as Claude Code. We walk through both, using two different failures to show the range of what the agent diagnoses.

Option 1: Troubleshoot from the Amazon EMR console

The console offers the fastest path. Once you’ve created the IAM role in the Set up IAM permissions section, no additional setup is required. Here we troubleshoot a job that failed with a driver out-of-memory error. The application generates a large dataset and calls collect() to pull it back to the driver, exceeding the configured spark.driver.maxResultSize of 512 MiB.

  1. Open the Amazon EMR console, choose Virtual clusters (under Amazon EMR on EKS), and select the virtual cluster that ran your job.
  2. In the Jobs list, find your failed job run and choose its Failed status. This opens a popover with a Troubleshoot with AI button.
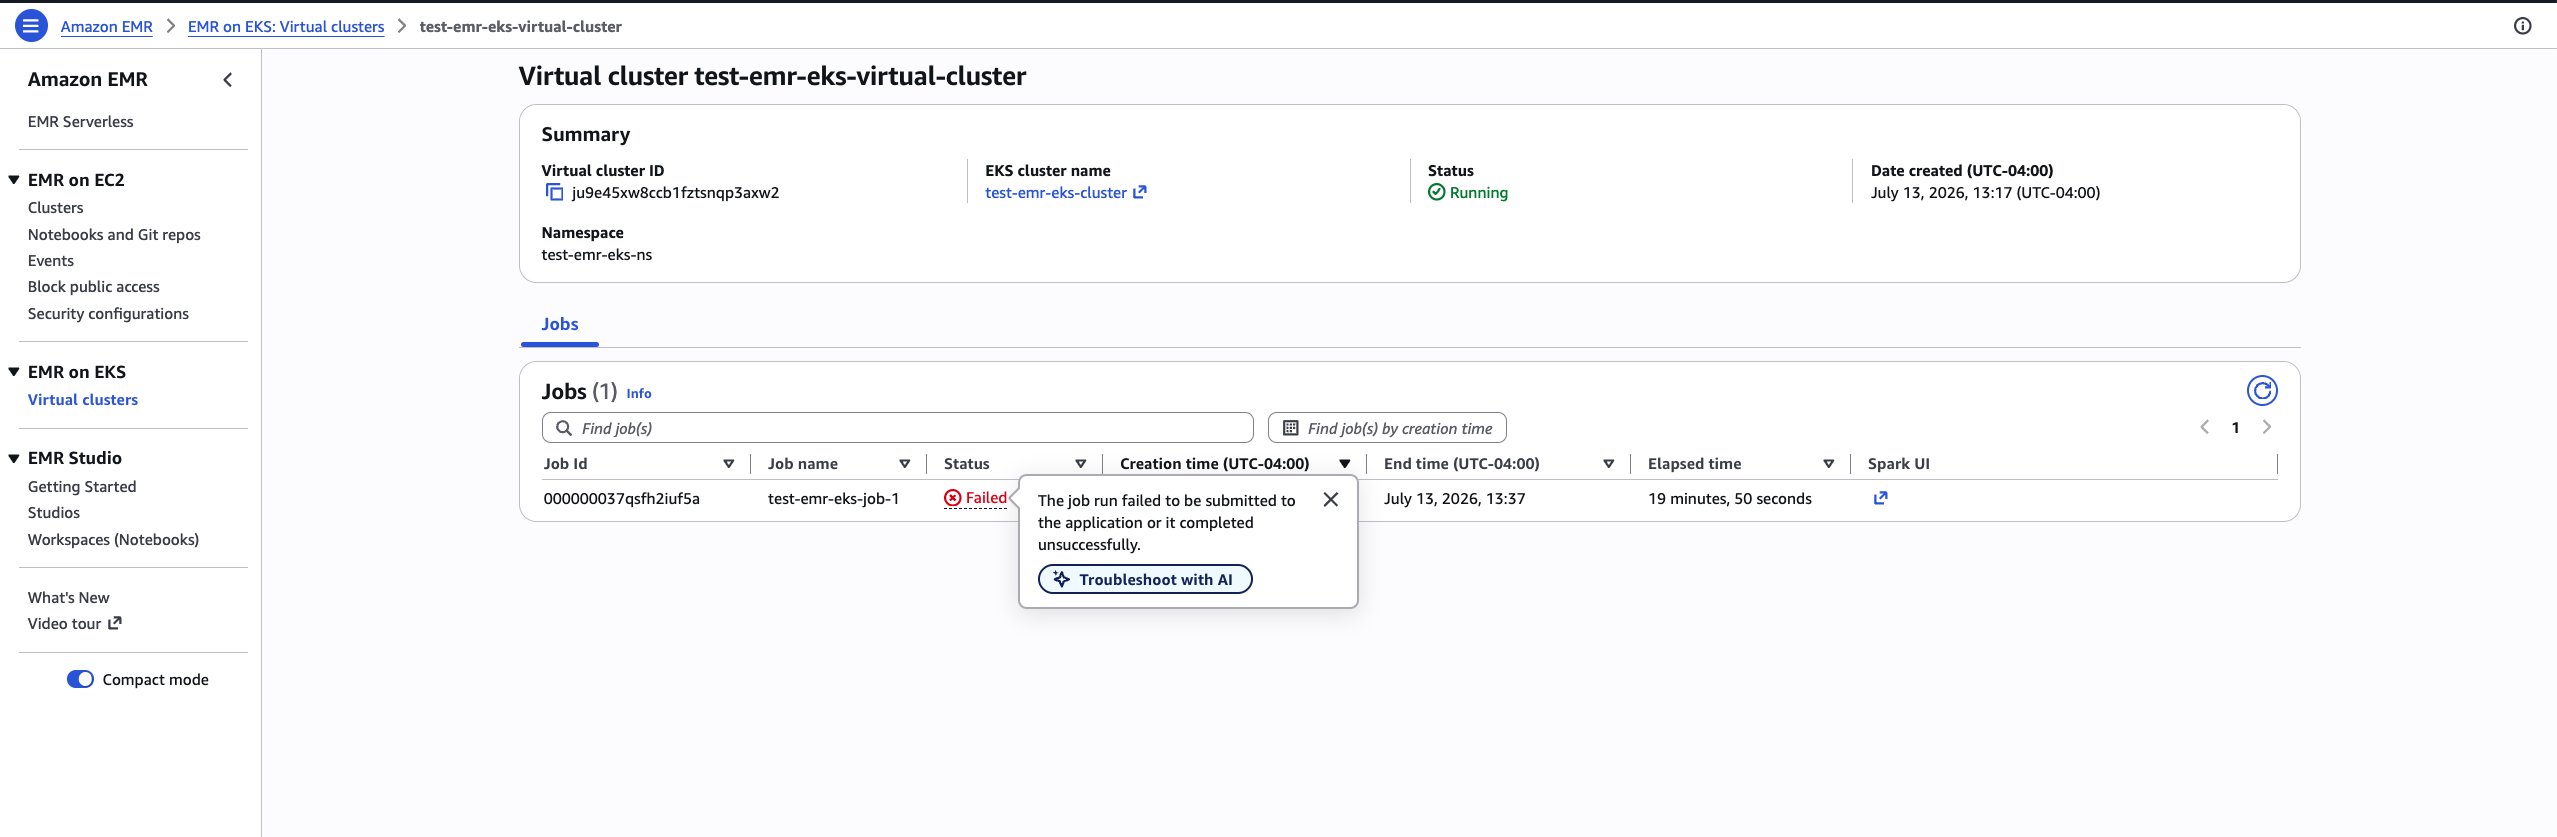
The failed job run popover in the Amazon EMR console with the Troubleshoot with AI button

  1. Choose Troubleshoot with AI. The agent analyzes the job and returns its findings directly on the console, namely the analysis insights, a root cause, and a recommendation. For this job, it identifies that the collect() operation on line 24 attempts to materialize the full result set on the driver, exceeding the spark.driver.maxResultSize safety limit. This fails the job before an actual driver out-of-memory crash. Because the failure stems from the application code, the agent also returns a code recommendation: a before-and-after diff that replaces the collect() call with a distributed write to the destination path. Executors then persist their partitions in parallel instead of funneling the data through the driver.
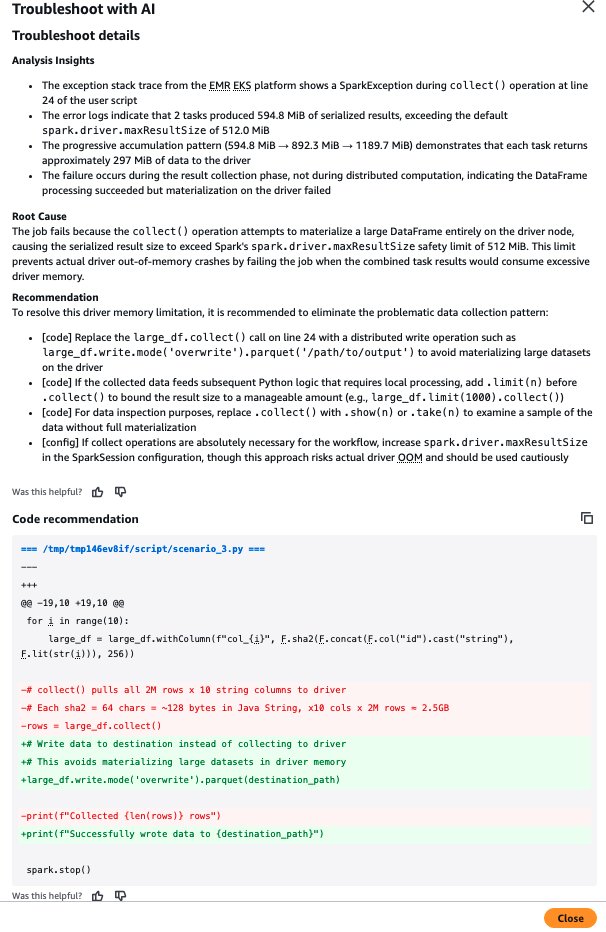
Agent results in the console showing the root cause and a before-and-after code recommendation for the collect() failure

Option 2: Troubleshoot from an MCP client (Claude Code)

You can also use the agent from MCP-compatible AI assistants. This option requires a one-time setup to connect the assistant to the agent’s MCP servers, and it unlocks a conversational workflow where the agent chains from analysis into a concrete code fix. In this walkthrough, we use Claude Code.

Prerequisites

In addition to the IAM role from the Set up IAM permissions section, the MCP client path requires:

  • Python 3.10 or higher.
  • The uv package manager. For instructions, see Installing uv.
  • Claude Code installed. For instructions, see Install Claude Code. You can also use another MCP-compatible AI assistant such as Kiro CLI or Kiro IDE.

Configure an AWS CLI profile

Configure a profile that assumes the IAM role you created, so the MCP servers call AWS with the agent’s permissions:

export IAM_ROLE=arn:aws:iam::${ACCOUNT_ID}:role/SparkTroubleshootingMCPRole
export SMUS_MCP_REGION=${REGION}

aws configure set profile.smus-mcp-profile.role_arn ${IAM_ROLE}
aws configure set profile.smus-mcp-profile.source_profile default
aws configure set profile.smus-mcp-profile.region ${SMUS_MCP_REGION}

Add the MCP servers

The troubleshooting agent provides two tools through two MCP servers: analyze_spark_workload (workload analysis and root cause) and spark_code_recommendation (code fixes). Add both to your assistant.

For Claude Code:

claude mcp add sagemaker-unified-studio-mcp-troubleshooting \
    -- uvx mcp-proxy-for-aws@latest \
    https://sagemaker-unified-studio-mcp.${SMUS_MCP_REGION}.api.aws/spark-troubleshooting/mcp \
    --service sagemaker-unified-studio-mcp --profile smus-mcp-profile \
    --region ${SMUS_MCP_REGION} --read-timeout 180

claude mcp add sagemaker-unified-studio-mcp-code-rec \
    -- uvx mcp-proxy-for-aws@latest \
    https://sagemaker-unified-studio-mcp.${SMUS_MCP_REGION}.api.aws/spark-code-recommendation/mcp \
    --service sagemaker-unified-studio-mcp --profile smus-mcp-profile \
    --region ${SMUS_MCP_REGION} --read-timeout 180

Verify your setup by running the /mcp command in Claude Code to confirm the sagemaker-unified-studio-mcp-troubleshooting and sagemaker-unified-studio-mcp-code-rec servers are connected and their tools are available.

For Kiro CLI:

# Add the Spark Troubleshooting MCP server
kiro-cli-chat mcp add \
    --name "sagemaker-unified-studio-mcp-troubleshooting" \
    --command "uvx" \
    --args "[\"mcp-proxy-for-aws@latest\",\"https://sagemaker-unified-studio-mcp.${SMUS_MCP_REGION}.api.aws/spark-troubleshooting/mcp\", \"--service\", \"sagemaker-unified-studio-mcp\", \"--profile\", \"smus-mcp-profile\", \"--region\", \"${SMUS_MCP_REGION}\", \"--read-timeout\", \"180\"]" \
    --timeout 180000 \
    --scope global

# Add the Spark Code Recommendation MCP server
kiro-cli-chat mcp add \
    --name "sagemaker-unified-studio-mcp-code-rec" \
    --command "uvx" \
    --args "[\"mcp-proxy-for-aws@latest\",\"https://sagemaker-unified-studio-mcp.${SMUS_MCP_REGION}.api.aws/spark-code-recommendation/mcp\", \"--service\", \"sagemaker-unified-studio-mcp\", \"--profile\", \"smus-mcp-profile\", \"--region\", \"${SMUS_MCP_REGION}\", \"--read-timeout\", \"180\"]" \
    --timeout 180000 \
    --scope global

Verify with the /tools command in Kiro CLI to confirm the analyze_spark_workload and spark_code_recommendation tools are available.

Run the agent

For this walkthrough, we troubleshoot a different failure to show how the agent chains from analysis into a concrete code fix. The job is a small PySpark application that reads a CSV file into a DataFrame and registers it as a temporary view named people. It runs a Spark SQL query to uppercase the Name column before displaying the results. The job run failed because the query calls UPPERX, a function that doesn’t exist in Spark SQL (it’s a typo for the built-in UPPER).

From the Claude Code terminal (or MCP-compatible assistants), describe your failed job run in natural language, providing the virtual cluster ID and job run ID:

Debug my EMR on EKS job with job run id <jr-id> and virtual cluster id <vc-id> in <region>

The agent invokes the analyze_spark_workload tool, which automatically:

  1. Calls the Amazon EMR on EKS API to retrieve your job run’s configuration and determine where its logs are stored.
  2. Retrieves your Spark logs from Amazon S3 or Amazon CloudWatch, depending on your job’s logging configuration.
  3. Connects to the Amazon EMR Persistent UI to extract Spark UI features such as the execution plan, stage metrics, and executor timelines.
  4. Analyzes the correlated signals and returns a root cause explanation.

For this job, the agent returns:

Root cause: SQL function error. Your Spark SQL query references a function UPPERX that doesn’t exist in an available function catalog (system.builtin, system.session, or spark_catalog.default). Category: SQL_ERROR. The job failed because the function name can’t be resolved. UPPERX is almost certainly a typo for the built-in UPPER function.

Because the failure is code-related, the agent then chains into the spark_code_recommendation tool, which produces a concrete before-and-after fix:

  df.createOrReplaceTempView("people")

- result = spark.sql("SELECT UPPERX(Name) FROM people")
+ result = spark.sql("SELECT UPPER(Name) FROM people")
  result.show()

  spark.stop()

The two tools work together. analyze_spark_workload identifies the root cause, and when the failure stems from the application code, spark_code_recommendation returns the exact edit to make. You review the recommendation and apply it with full control over the change. The agent only provides the analysis and recommendations.

Supported failure categories

The troubleshooting agent diagnoses a wide range of Apache Spark failures on Amazon EMR on EKS, including:

  • Out-of-memory and resource exhaustion – Driver and executor out-of-memory errors, including driver-side failures from operations like collect() and executor terminations that surface as Kubernetes pod exit codes (such as exit code 137).
  • Data skew and shuffle issues – Uneven partitioning and shuffle failures that concentrate work on a few executors.
  • Configuration errors – Misconfigured Spark settings that lead to failures or inefficiency.
  • Code-level issues – Problems such as incorrect API usage, unbounded collect() calls, and user-defined function (UDF) errors, for which the agent can recommend code fixes.

Code recommendations are supported for PySpark workloads on Amazon EMR on EKS, Amazon EMR on EC2, Amazon EMR Serverless, and AWS Glue.

Conclusion

With support for Amazon EMR on EKS, the Apache Spark troubleshooting agent gives platform and data engineering teams a shared workflow for investigating failed Spark applications. By bringing together Spark and Kubernetes diagnostic signals, the agent can reduce manual investigation and repeated handoffs between teams, helping engineers identify likely causes and corrective actions faster.

There’s no additional charge for using the troubleshooting agent, including the large language model used through Amazon Bedrock. You pay only for the AWS resources used to run your Spark applications and validate recommended changes.

To get started:


About the authors

Vara Bonthu

Vara Bonthu

Vara is a Principal Open Source Specialist SA leading Data on EKS at AWS, driving open source initiatives and helping AWS customers to diverse organizations. He specializes in open source technologies, data analytics, AI/ML, and Kubernetes, with extensive experience in development, DevOps, and architecture.

Maheedhar Reddy Chappidi

Maheedhar Reddy Chappidi

Maheedhar is a Senior Software Development Engineer at AWS Analytics. He is passionate about building fault-tolerant, reliable distributed systems at scale and generative AI applications for data integration. Outside of work, Maheedhar enjoys listening to podcasts and playing with his two-year-old child.

Layth Yassin

Layth Yassin

Layth is a Software Development Engineer at AWS Analytics. He’s passionate about building distributed systems and generative AI solutions for data integration problems. Outside of work, he enjoys playing/watching basketball, and spending time with friends and family.

Andrew Kim

Andrew Kim

Andrew is a Software Development Engineer at AWS Analytics, with a deep passion for distributed systems architecture and AI-driven solutions, specializing in intelligent data integration workflows and cutting-edge feature development on Apache Spark. Andrew focuses on re-inventing and simplifying solutions to complex technical problems, and he enjoys creating side projects and producing music in his free time.

Kartik Panjabi

Kartik Panjabi

Kartik is a Software Development Manager at AWS Analytics. His team builds generative AI features for the Data Integration and distributed system for data integration.

Weijing Cai

Weijing Cai

Weijing is a Software Development Engineer at AWS Analytics. She is passionate about distributed systems and generative AI, and their intersection in building intelligent, scalable solutions for data integration.

Jeremy Samuel

Jeremy Samuel

Jeremy is a Software Development Engineer at AWS Analytics. He has a strong interest in creating distributed systems and generative AI. In his spare time, he enjoys playing video games and listening to music.

Shawn Huang

Shawn Huang

Shawn is a Software Engineer working on the Amazon EMR on EKS service, where he develops scalable and reliable solutions for running big data workloads on Kubernetes.

Siddharth Kumar

Siddharth Kumar

Siddharth is a Software Development Engineer for Amazon EMR at Amazon Web Services, where he works across the Amazon EMR on EKS service. He helps build and operate the systems that let customers run Spark workloads on Amazon Elastic Kubernetes Service (Amazon EKS) at scale, with a focus on making them easier to run, monitor, and scale. Outside of work, Siddharth enjoys watching anime, swimming, and hiking.

Upgrade Amazon Redshift DC2 clusters to the new Amazon Redshift RG

Post Syndicated from Ricardo Serafim original https://aws.amazon.com/blogs/big-data/upgrade-amazon-redshift-dc2-clusters-to-the-new-amazon-redshift-rg/

When you upgrade your Amazon Redshift DC2 (Dense Compute) clusters to RG instances powered by AWS Graviton, you gain access to capabilities that were never available on DC2. These include managed storage, data sharing, zero-ETL integrations, streaming ingestion, and faster query compilation. You also gain availability zone (AZ) features such as cross-AZ cluster relocation for disaster recovery (DR) and concurrency scaling for writes. RG also adds a built-in data lake engine for querying Apache Iceberg and Parquet tables directly on your cluster nodes.

This post covers the new features you gain when upgrading from DC2 to RG, the node mapping guidance for sizing your new cluster, the upgrade methods available, and validation options including Amazon Redshift Test Drive.

Why upgrade from DC2 to RG instances

As data volumes grow, DC2 customers face a choice: add extra compute nodes only to get more storage, or offload data elsewhere. The local SSD capacity on each node is fixed, and there is no managed storage tier to absorb growth. Both RA3 and RG instances solve this with Amazon Redshift Managed Storage, which decouples storage from compute. You can scale data volume independently of node count, paying only for the storage you use with no fixed ceiling per node. This means you no longer need to over-provision compute to accommodate data growth.

RG is the recommended upgrade path over RA3. RG instances run on AWS Graviton processors, delivering higher throughput for data warehouse and data lake workloads at a lower price per vCPU compared to RA3. Because both RA3 and RG share the same managed storage architecture and feature set, RG provides more performance for less cost. For current pricing details, visit Amazon Redshift pricing.

Amazon Redshift RG instances run on AWS Graviton processors. These processors provide more compute cores and lower memory latency compared to the previous-generation hardware behind DC2. This can translate to faster query execution for data warehouse workloads, particularly for large scans where memory throughput is the bottleneck. Exact performance improvements depend on workload characteristics, cluster size, and query complexity. Use Redshift Test Drive to measure the difference for your specific workload.

Data lake access: New with RG

DC2 clusters can query data in Amazon Simple Storage Service (Amazon S3) through Amazon Redshift Spectrum. However, Spectrum adds a per-TB scanning cost on top of your cluster pricing, and does not support enhanced VPC routing on DC2 provisioned clusters (requiring additional configuration for secure S3 access).

RG addresses these constraints with an integrated data lake engine that processes queries directly on your cluster’s dedicated compute nodes:

DC2 (Spectrum) RG (Integrated Engine)
Data lake query cost Extra $5/TB scanned on top of cluster cost Included in node pricing, no extra charge
Apache Iceberg Queries via Spectrum Native queries on cluster compute, no Spectrum needed
Apache Iceberg Statistics Manual collection JIT-Analyze auto-collects statistics
VPC routing Not compatible with enhanced VPC routing No conflict, runs on the cluster itself

With RG, you can consolidate warehouse and data lake workloads on a single cluster with no extra per-query charges for data lake access.

Features available with RG

Upgrading from DC2 to RG gives you access to the full set of modern Amazon Redshift capabilities. Three of the most impactful for DC2 customers are data sharing, zero-ETL integrations, and managed storage. With data sharing, you can query live data from other Amazon Redshift clusters or accounts without copying or moving data, reducing storage duplication and keeping consumers always up to date. Zero-ETL integrations automatically replicate data from Amazon Aurora, Amazon Relational Database Service (Amazon RDS), and Amazon DynamoDB into Amazon Redshift without building or maintaining ETL pipelines. This reduces operational overhead and data freshness lag. Managed storage scales independently from compute, so you can grow your data without adding nodes and only pay for the storage you use.

Additional capabilities available with RG:

  • Streaming ingestion – ingest data from Amazon Kinesis Data Streams and Amazon Managed Streaming for Apache Kafka (Amazon MSK) in near real-time, so you can build dashboards and analyze the latest data without batch delays.
  • Concurrency scaling for writes – automatically add transient capacity during burst write workloads, so ingest operations don’t slow down your analytical queries.
  • Cross-AZ cluster relocation – relocate your cluster to another Availability Zone with no endpoint changes, supporting disaster recovery without the cost of a standby cluster.
  • Multi-AZ deployments – run your cluster across multiple Availability Zones as a single database delivering high availability (HA) and automatic failover without a passive standby.
  • Faster query compilation – queries compile faster on Graviton processors, reducing cold-start latency for new or modified queries.

RG instance details and node mapping

This table shows the available RG instance configurations:

RG Instance vCPUs Memory
rg.large 2 16 GiB
rg.xlarge 4 32 GiB
rg.4xlarge 16 128 GiB
rg.12xlarge 48 384 GiB

For current pricing, visit Amazon Redshift pricing for more information.

DC2 to RG node mapping guidance

Use this table to determine the recommended starting configuration when upgrading from DC2:

Current Node Type Node Ratio RG Node Type Guidance
dc2.large (1–3 nodes) 1:1 rg.large 1 rg.large for every 1 dc2.large
dc2.large (4 nodes) 4:3 rg.large 3 rg.large for 4 dc2.large
dc2.large (5–15 nodes) 8:3 rg.xlarge 3 rg.xlarge for every 8 dc2.large
dc2.large (16–32 nodes) 10:1 rg.4xlarge 1 rg.4xlarge for every 10 dc2.large
dc2.8xlarge (2–15 nodes) 2:3 rg.4xlarge 3 rg.4xlarge for every 2 dc2.8xlarge
dc2.8xlarge (16–128 nodes) 2:1 rg.12xlarge 1 rg.12xlarge for every 2 dc2.8xlarge

Extra nodes might be needed depending on workload requirements. Add or remove nodes based on the compute requirements of your required query performance. Validate your specific configuration using Redshift Test Drive before migrating production workloads.

Prerequisites

Before starting the upgrade, confirm the following:

  • Snapshot availability — a recent snapshot of your DC2 cluster is required for all upgrade methods. If automated snapshots are disabled, create a manual snapshot before starting. Visit Amazon Redshift snapshots for more information.
  • Network configuration — verify that your virtual private cloud (VPC), subnet groups, and security groups are configured to support the new RG cluster. If you use enhanced VPC routing, confirm your S3 endpoint and route table configuration. Visit Enhanced VPC routing for more information.
  • Cluster version — your DC2 cluster must be running a supported Amazon Redshift version. Check the release notes for minimum version requirements.

Upgrade methods

Three methods are available for migrating from DC2 to RG instances. The right choice depends on your operational constraints: whether you need write access during migration, whether the target configuration supports elastic resize, and how much downtime your workload can tolerate.

Elastic resize is the fastest and most efficient path. Amazon Redshift creates a snapshot, provisions the RG cluster, and redirects the endpoint automatically. The cluster remains in read-only mode for a few minutes during the operation, and the endpoint doesn’t change, meaning no application-side updates are required. This is the recommended method when the target configuration is supported by elastic resize.

Classic resize

Use classic resize when the target configuration is not available through elastic resize, or when you need data slice rebalancing. Downtime is similar to elastic resize (a few minutes of read-only mode in Stage 1). In Stage 2, data redistributes to its original distribution patterns in the background without blocking queries. The advantage of classic resize is that it rebalances data slices evenly across nodes. This matters when you move to a different node type that might require a different number of slices. Stage 2 can take time on busy clusters, and the duration depends on data volume, cluster utilization, and target cluster size. Queries might run slower until redistribution completes.

Snapshot and restore with cluster identifier swap

This method uses snapshot and restore of the existing DC2 cluster to provision a new RG cluster with a different identifier. After validating the new cluster, you swap the cluster identifiers to redirect application traffic without changing the endpoint. This approach provides these benefits:

  • Test and validate the RG cluster while the DC2 cluster continues serving production traffic.
  • Roll back by reversing the identifier swap if issues arise.
  • No application-side endpoint changes required after the swap.

The trade-off is that data written to the source cluster after the snapshot requires manual synchronization before the cutover. If your migration plan includes a write-freeze window, you can take the final snapshot at the start of that window and avoid synchronization entirely.

This AWS Command Line Interface (AWS CLI) command illustrates restoring a DC2 snapshot to an RG cluster:

aws redshift restore-from-cluster-snapshot \
    --cluster-identifier my-cluster-rg \
    --snapshot-identifier my-dc2-snapshot \
    --node-type rg.4xlarge \
    --number-of-nodes 3 \
    --cluster-subnet-group-name my-subnet-group \
    --vpc-security-group-ids sg-abc123 \
    --cluster-parameter-group-name my-param-group \
    --port 5439 \
    --no-publicly-accessible \
    --enhanced-vpc-routing \
    --iam-roles 'arn:aws:iam::111122223333:role/RedshiftRole'

After restoring, validate your workload on the new cluster. When ready, swap the cluster identifiers:

aws redshift modify-cluster \
    --cluster-identifier my-cluster \
    --new-cluster-identifier my-cluster-dc2-old

aws redshift modify-cluster \
    --cluster-identifier my-cluster-rg \
    --new-cluster-identifier my-cluster

Validating your target configuration

Before migrating production clusters, validate that your target RG configuration meets performance requirements. There are several ways to approach this depending on your needs:

Run your existing QA process on a test cluster. Create an RG cluster from a snapshot, then execute the same test suites and validation scripts you would use for any code or infrastructure change. This approach helps confirm basic compatibility and catch regressions.

Use lower environments first. Migrate your development or staging clusters to RG before production. This gives your team hands-on experience with the new instance type and surfaces any configuration differences in a low-risk setting.

Replay production workloads with Redshift Test Drive. For production-level validation with real traffic patterns, Redshift Test Drive is an open source utility that automates workload replay across multiple target configurations. It extracts queries from your source cluster’s audit logs and replays them against the target, then provides a comparison UI for latency, errors, and deviation.

For a detailed walkthrough, read Find the best Amazon Redshift configuration for your workload using Redshift Test Drive.

Best practices

Before migrating, run Amazon Redshift Advisor on your current cluster to identify optimization opportunities such as unused tables, missing sort keys, or distribution style changes. Drop unnecessary tables to reduce data transfer time, and schedule the migration during off-peak hours for minimal business impact. Removing tables that are no longer used (for example, tables with suffixes like _bkp, _tmp, or _old) also speeds up classic resize. These unused tables would otherwise be rebalanced across nodes during Stage 2, adding time to a process that delivers no value for data no one queries.

During migration, communicate the cutover window to stakeholders. Because the DC2 cluster remains active until the identifier swap, coordinate a brief write-freeze period before the final snapshot to minimize data synchronization effort.

After migration, monitor the cluster for 48–72 hours to identify any performance deviations and adjust node count if needed. Update your runbooks and operational documentation with the new cluster details, node types, and any endpoint changes if you used the snapshot and restore method. Once the migration is considered successful you may delete the DC2 cluster.

Conclusion

Upgrading from Amazon Redshift DC2 to RG instances powered by AWS Graviton gives you a Graviton-based architecture with managed storage and improved query performance. It also gives you access to the full suite of Amazon Redshift features that were never available on DC2: data lake queries, data sharing, zero-ETL, faster query compilation, and cross-AZ relocation. The snapshot restore and cluster identifier swap method provides a safe migration path with built-in rollback. Use Redshift Test Drive to validate your target configuration with real workload data before committing.

To get started, review the RG instance availability and pricing, determine your target configuration using the node mapping guidance, and run Redshift Test Drive against your production workload.


About the authors

Ricardo Serafim

Ricardo Serafim

Ricardo is a Senior Analytics Specialist Solutions Architect at AWS. He has been helping companies with Data Warehouse solutions since 2007.

Nita Shah

Nita Shah

Nita is a Sr. Analytics Specialist Solutions Architect at AWS based out of New York. She has been building enterprise data platforms, data warehousing, and analytics solutions for over 20 years and specializes in Amazon Redshift. She is focused on helping customers design and build enterprise-scale well-architected analytics and decision support platforms.

Ankit Sahu

Ankit Sahu

Ankit brings over 18 years of expertise in building innovative data products and services. His diverse experience spans product strategy, go-to-market execution, and digital transformation initiatives. Currently, as Sr. Product Manager at Amazon Web Services (AWS), Ankit is driving the vision and strategy for Amazon Redshift.

[$] Buffer sizes for FUSE io_uring

Post Syndicated from jake original https://lwn.net/Articles/1085618/

The Filesystem in
Userspace
(FUSE) subsystem provides a way to service filesystem
requests from a user-space server, which moves the format-handling code out
of the kernel. The FUSE server can use the io_uring
facility for better performance, but Bernd Schubert is concerned that
memory is being wasted because the current implementation has a single,
large buffer size that is excessive for small I/O operations. He led a discussion on that topic
in the filesystem track of the 2026 Linux Storage,
Filesystem, Memory Management, and BPF Summit
in Zagreb, Croatia.

SQLite Critical CVEs or LLM Slop? (JFrog blog)

Post Syndicated from corbet original https://lwn.net/Articles/1086936/

The JFrog blog examines
some reported vulnerabilities in SQLite
, some of which made their way
into high-profile vulnerability databases, that turned out to be entirely
fabricated by LLMs.

These LLM slop CVEs can cause organizations to waste time
investigating and patching vulnerabilities that do not actually
exist, as well as polluting vulnerability databases. In
environments where Critical vulnerabilities are automatically
prioritized or tickets are opened based on vulnerability scores,
such fabricated CVEs can turn into a real burden.

In environments where AI is used to automate vulnerability triage
and remediation this becomes even more concerning. An AI agent that
encounters a fabricated CVE may attempt to locate the vulnerable
function, generate a patch, or recommend changes based on code that
does not even exist. Instead of helping security teams remediate
real vulnerabilities, it can lead them down a completely wrong
path, potentially introducing unnecessary changes and wasting time.

Metasploit Pro 5.1 Released

Post Syndicated from The Metasploit Team original https://www.rapid7.com/blog/post/pt-metasploit-pro-5-1-released

Today marks the release of Metasploit Pro 5.1 – building upon the foundation laid in 5.0, adding new evasion primitives for HTTP Meterpreter payloads, support for tracking service hierarchies, a deeper and more interactive Network Topology view, and continuing our commitment to a modern, consistent UI. This release is powered by Metasploit Framework 6.5.

Malleable C2 Profiles

One of the most requested capabilities in modern red-team engagements is the ability to blend Meterpreter’s network traffic into legitimate-looking patterns. Metasploit Pro 5.1 brings full Malleable C2 profile support, powered by Metasploit Framework 6.5, directly into the Pro UI — no command-line knowledge required.

Malleable C2 profiles let you load a standard profile and reshape Meterpreter’s HTTP(S) traffic to emulate legitimate services, browser sessions, or any other traffic pattern you need. All Meterpreter flavours — Windows, Linux, Java, Python, and PHP — are supported, including stageless and staged payloads (e.g. meterpreter/reverse_https and meterpreter_reverse_https). This functionality is compatible with publicly available profile libraries.

Profile support across the Pro UI

Malleable C2 profiles are now available in every part of the workflow where a payload is configured:

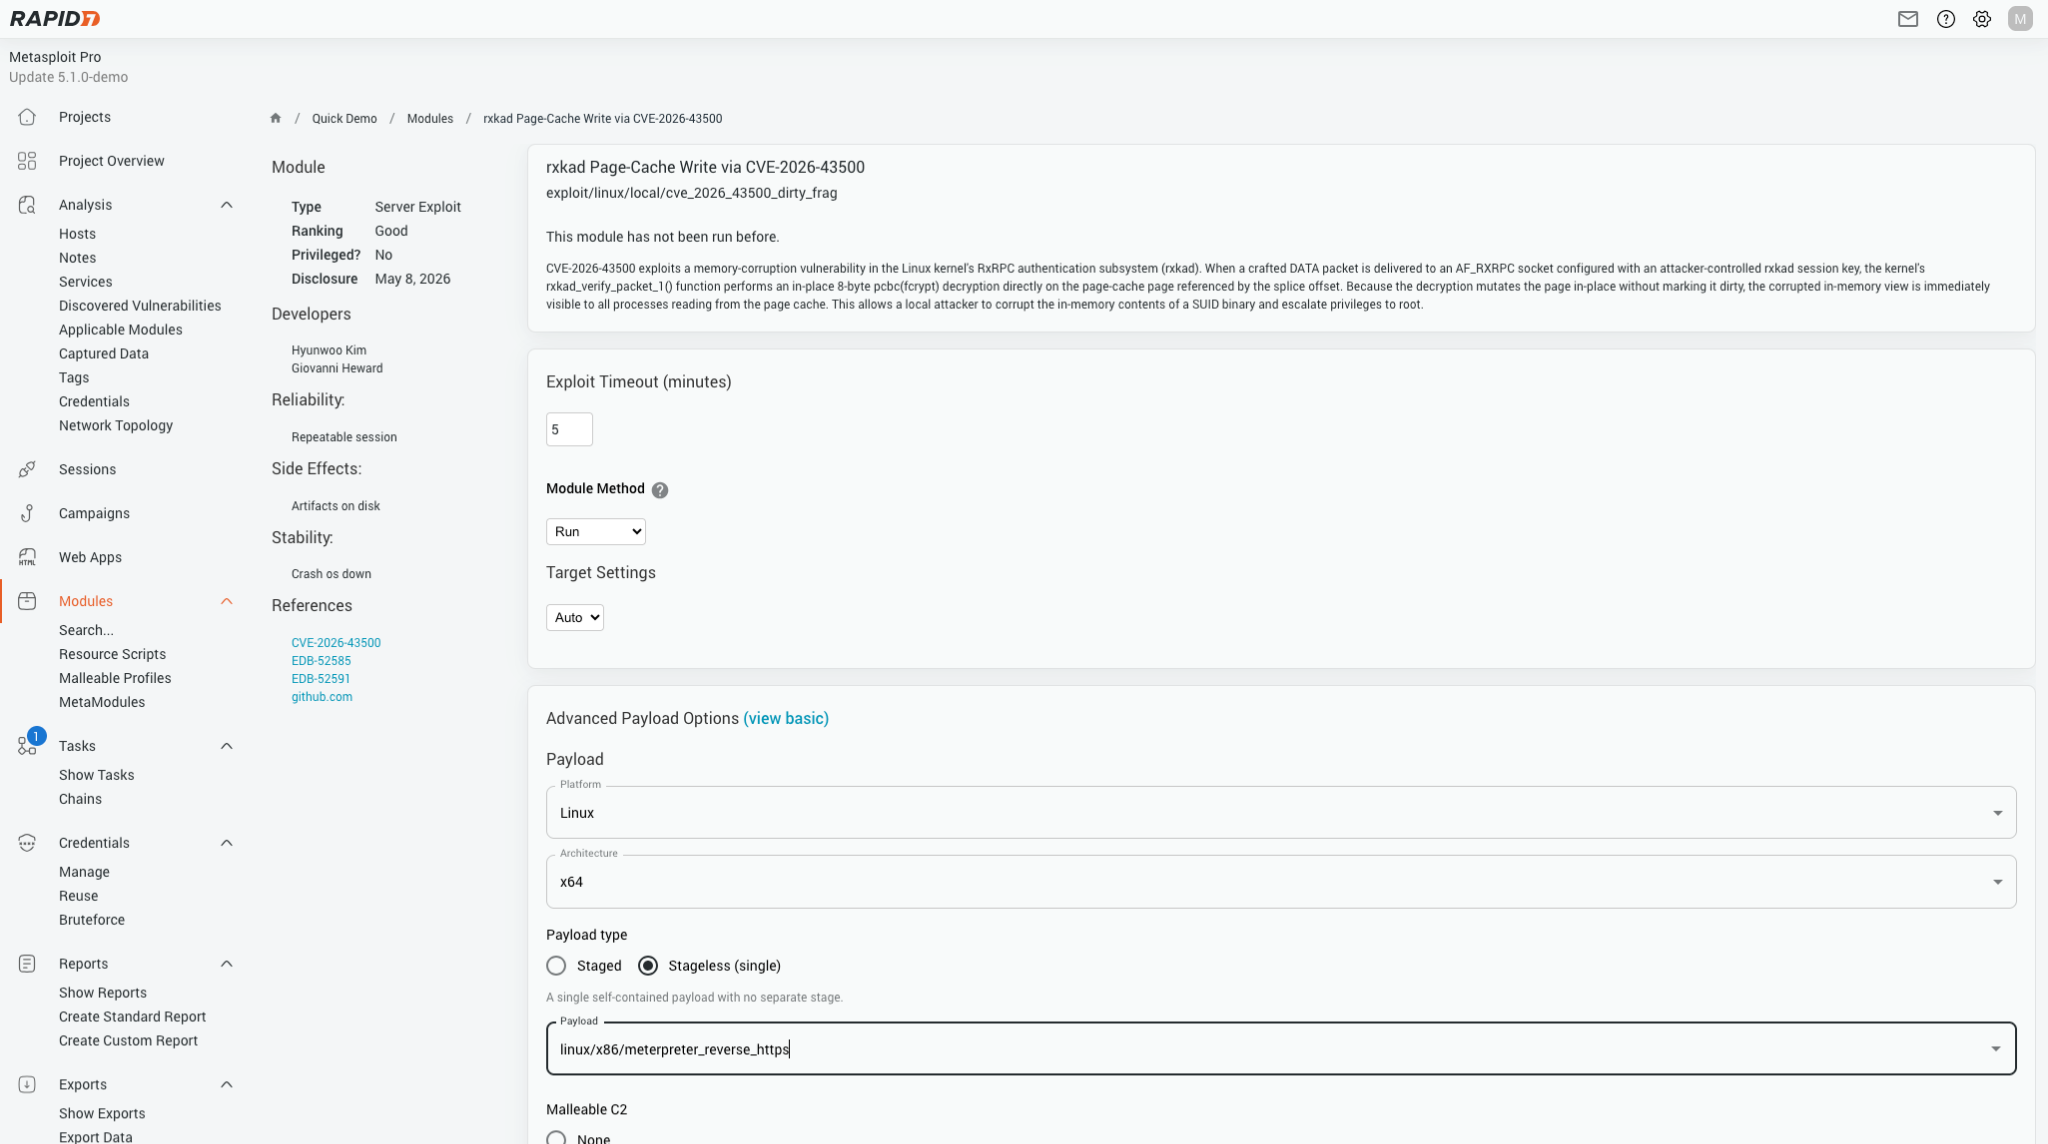
  • Single Module Run: The module options page now includes a Malleable C2 section.
  • Listeners (New & Edit): You can now choose from profiles already uploaded to the server or upload a new .profile file directly from your browser.
  • Payload Generator: The standalone payload generator also exposes the profile picker, so standalone payloads can carry the same C2 profile as the rest of your operation.

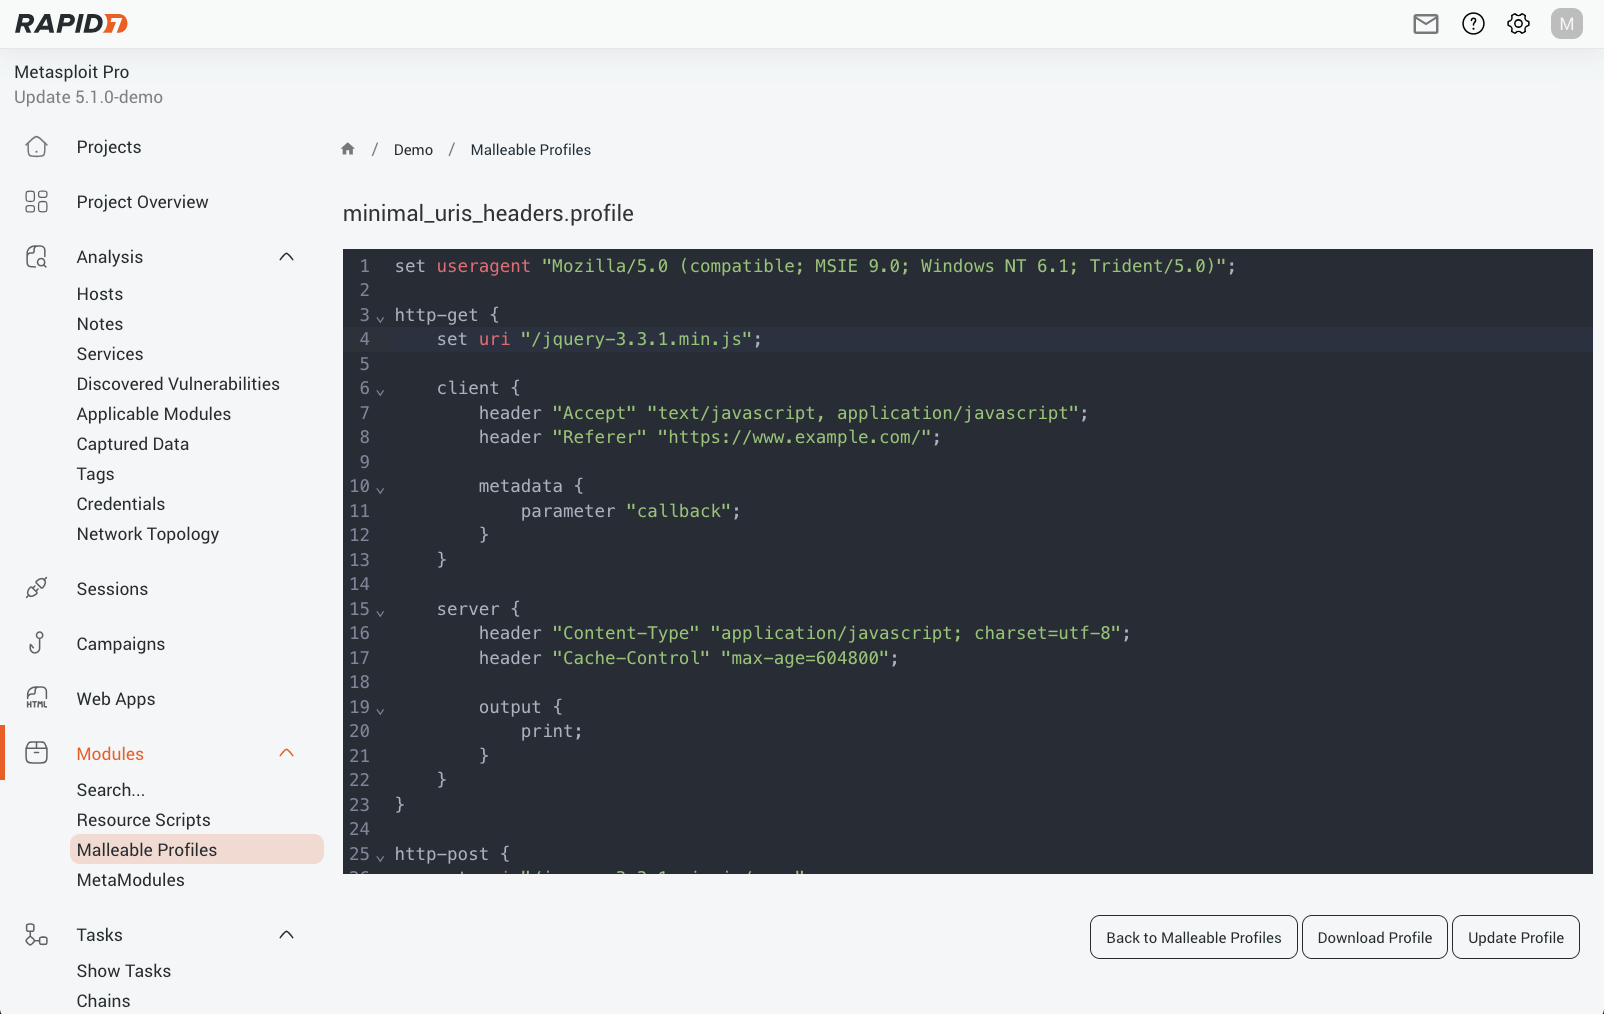
mal-1.png

Figure 1 Malleable Profiles

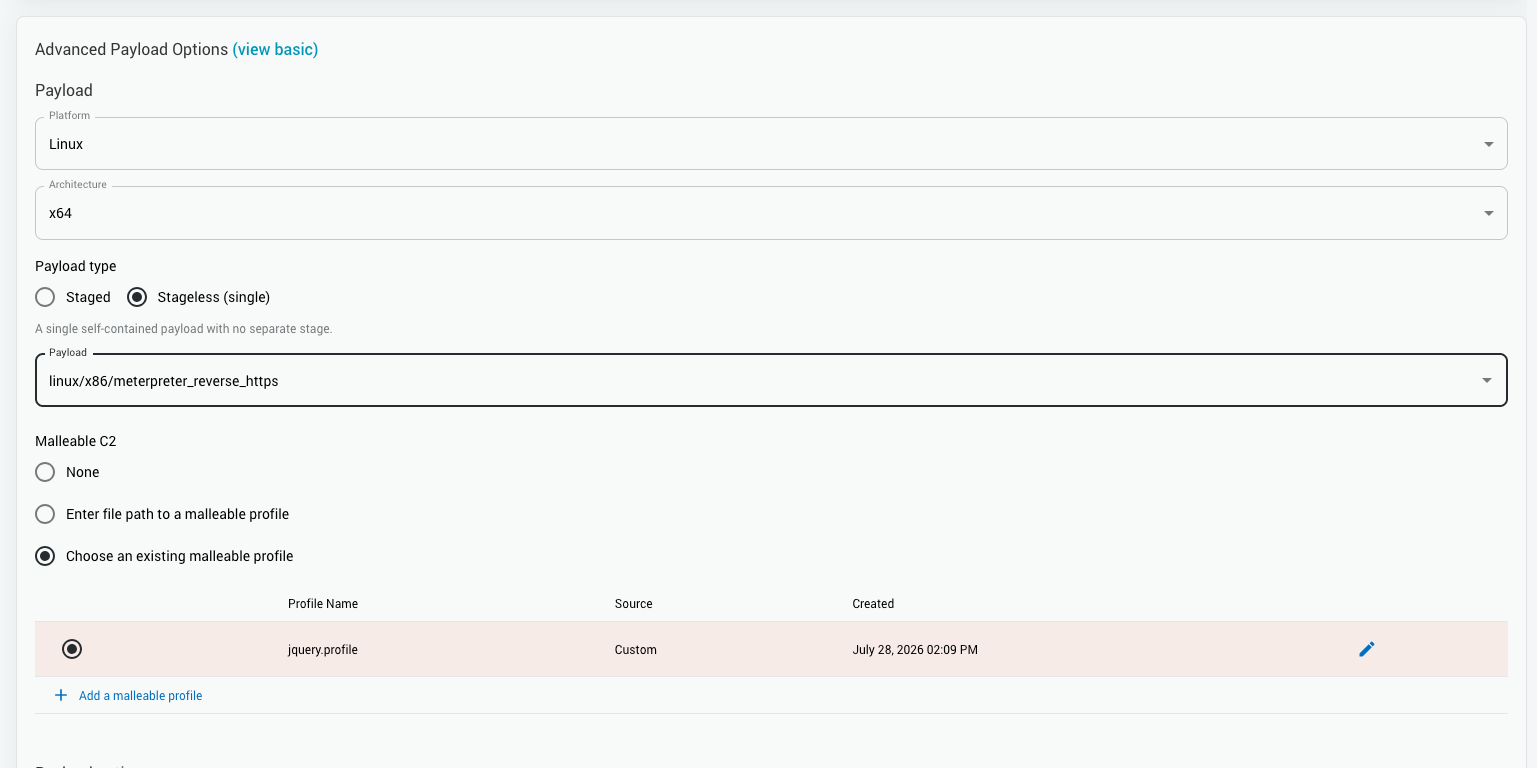
Improved Payload Section

Alongside the Malleable C2 integration, the payload selector has been overhauled across the Listener, Module Run, and Payload Generator pages. You can now filter payloads by platform and stage, making it much faster to find the right payload in large lists.

mal-2.png

Figure 2: Advanced Payload Options

select-1.png

Figure 3: Additional Payload Options

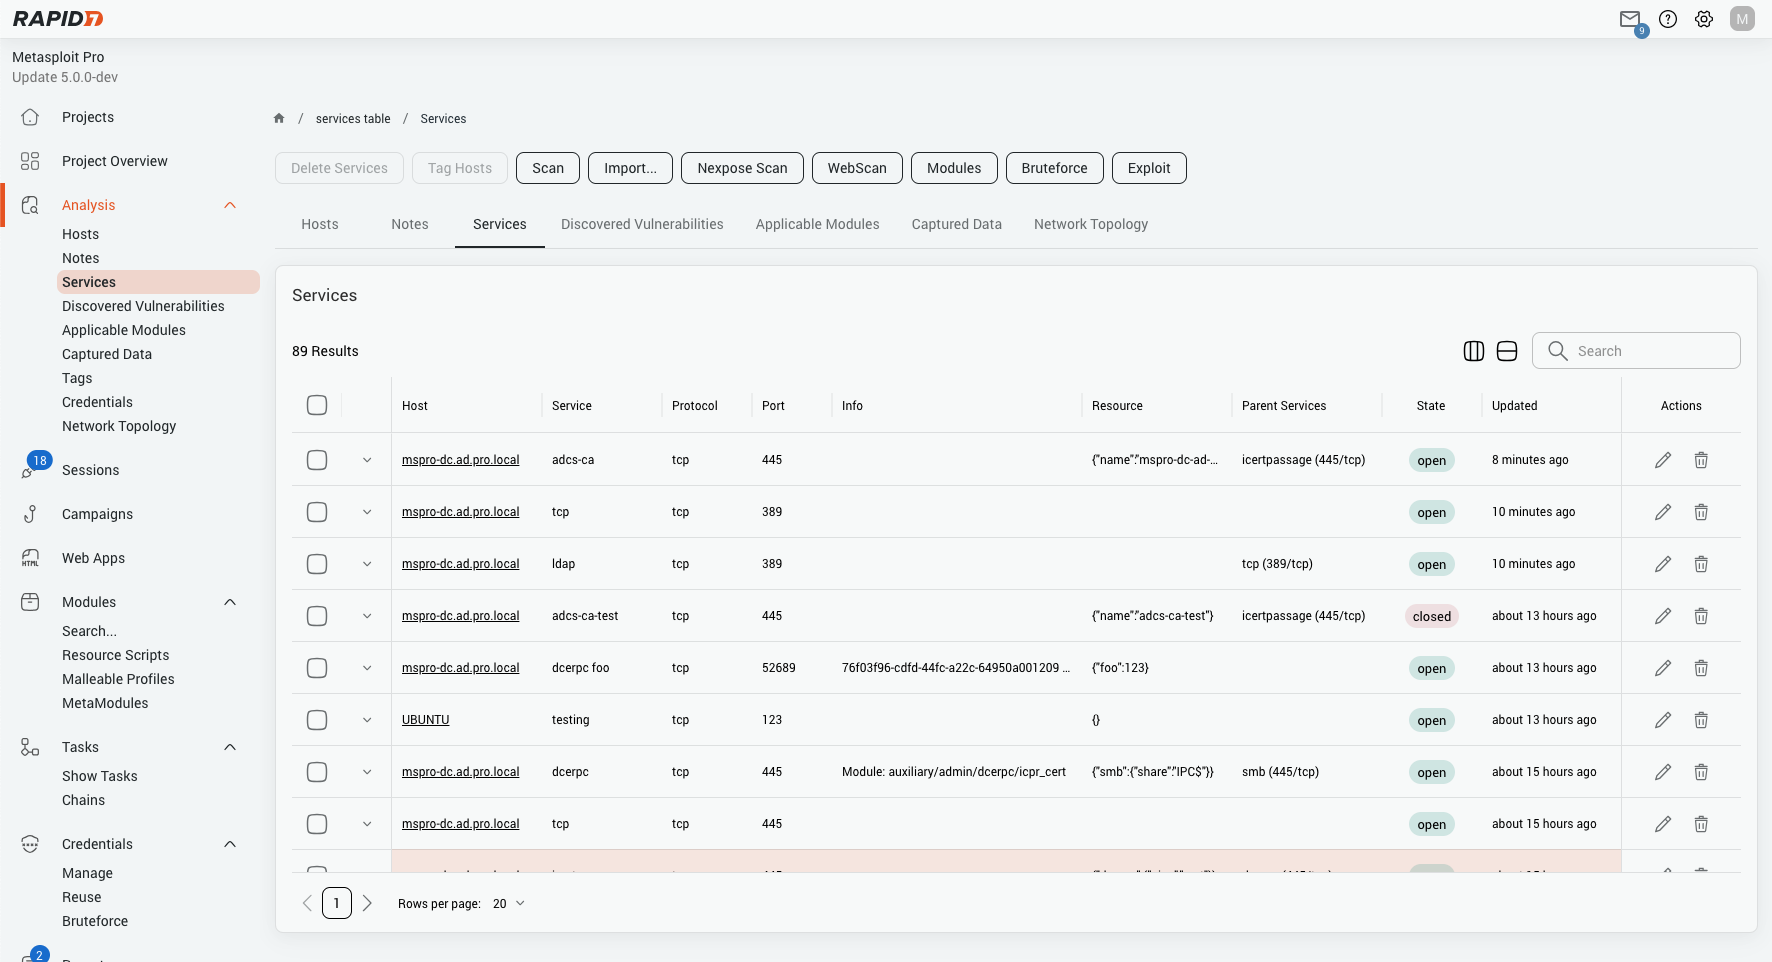
Service Hierarchy Tracking Support

The Discovered Services table has been overhauled with a cleaner, more capable interface consistent with the rest of Pro 5.1.

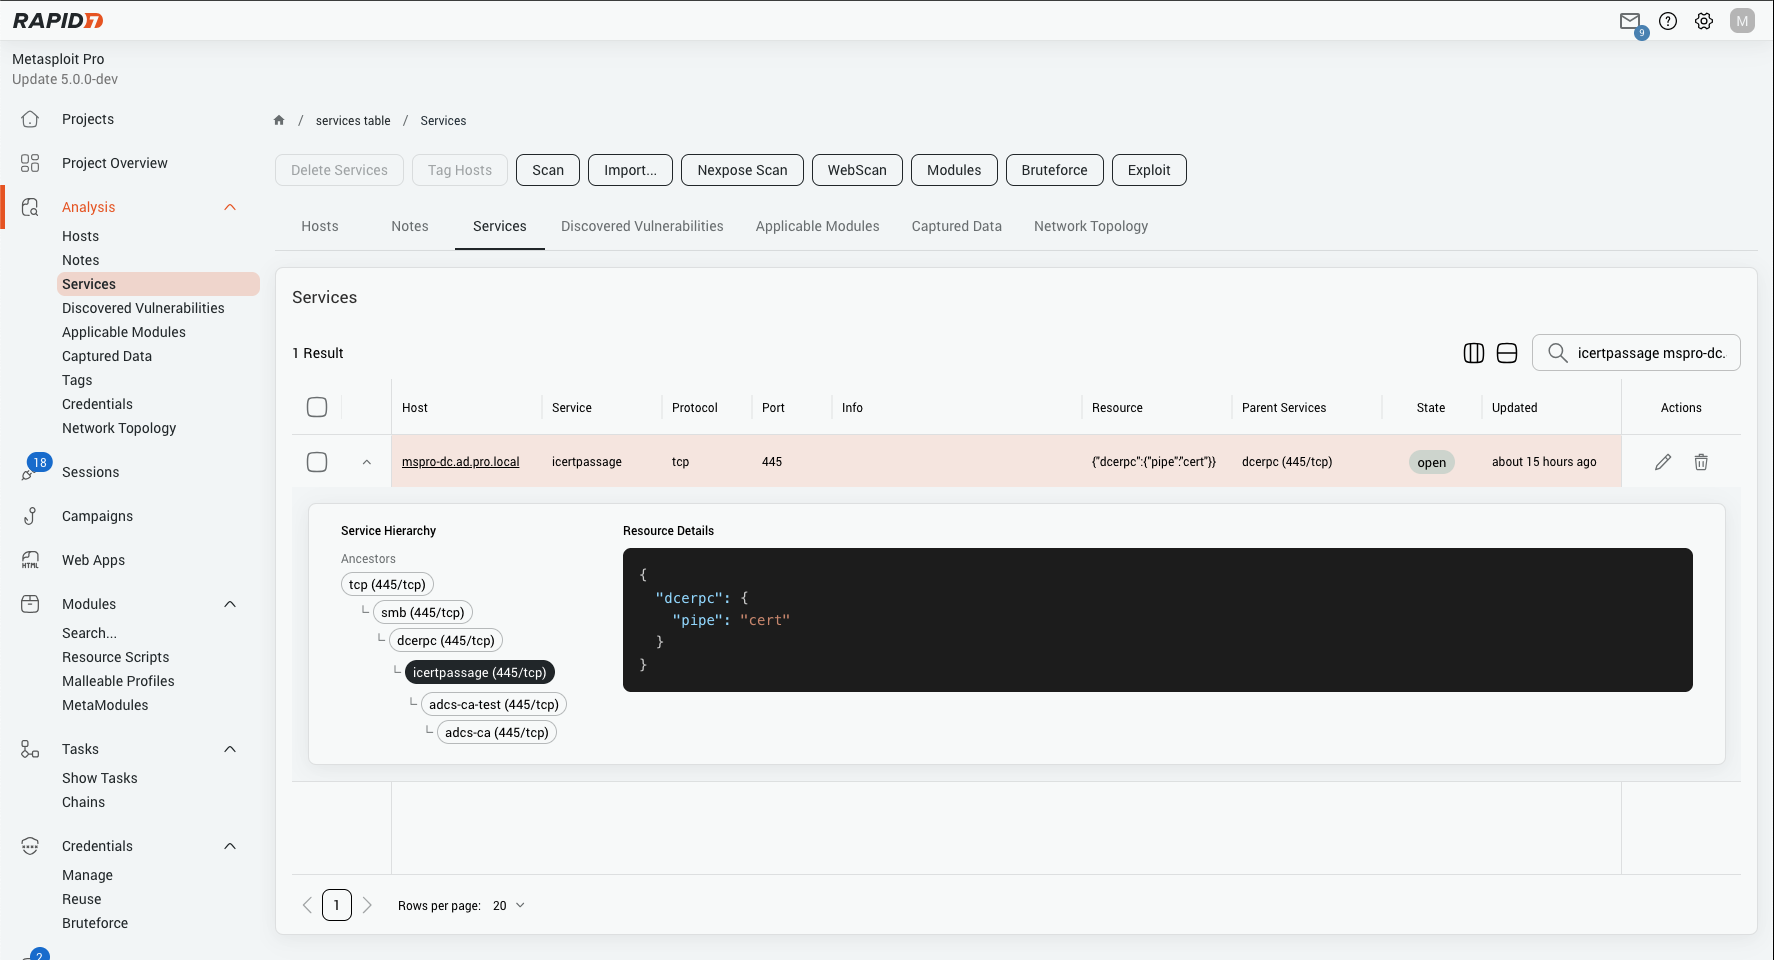
  • Service hierarchy visibility: The most significant new capability. Services can have parent-child relationships – for example, an HTTP service running over TCP, or a tunnelled protocol layered over another. The new table exposes this hierarchy directly with dedicated columns showing each service’s parent and child services, so you can immediately understand how discovered services relate to one another without drilling into individual records.
  • Search and sort across all columns: You can now search across host name, host address, service name, protocol, port, and info in a single query. All major columns are sortable, including parent services.
  • Inline editing: Service fields (name, port, protocol, state, resource) can be edited directly from the table without navigating away.

service-1.png

Figure 4: Service Options

service-2.png

Figure 5: Service Hierarchy Display

Network Topology Enhancements

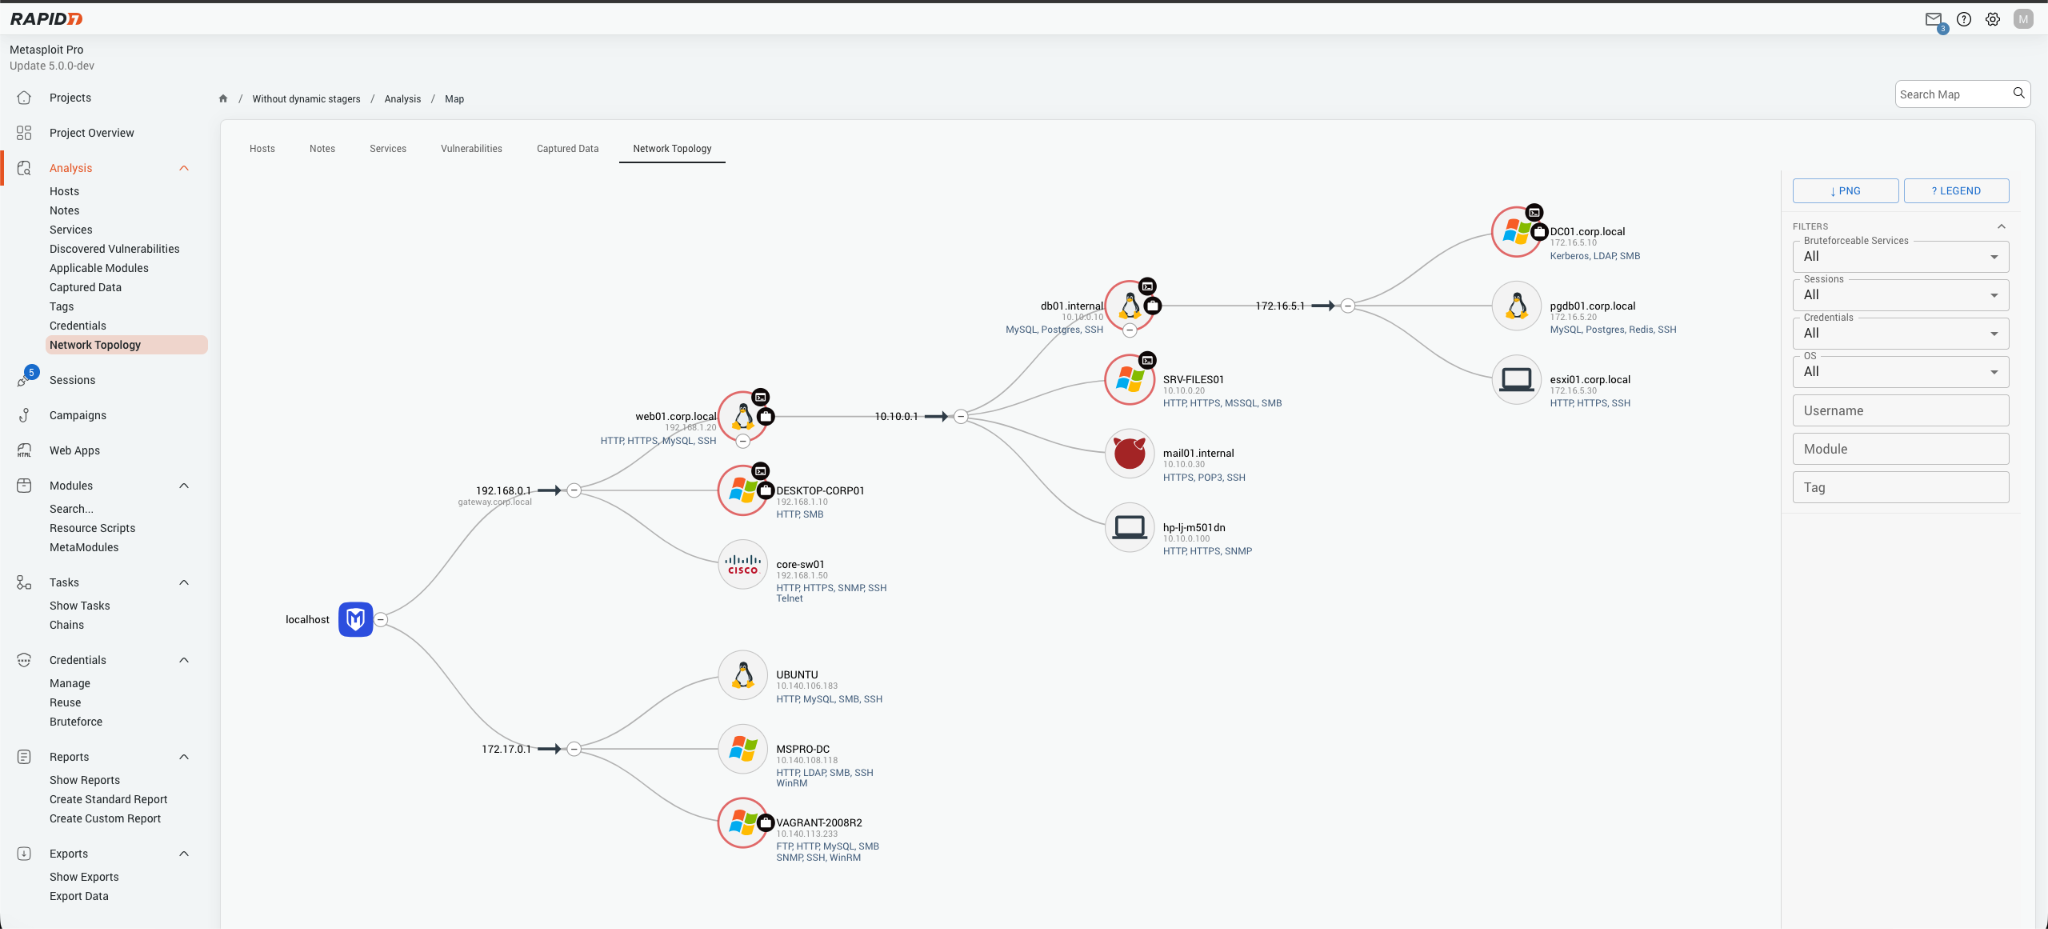
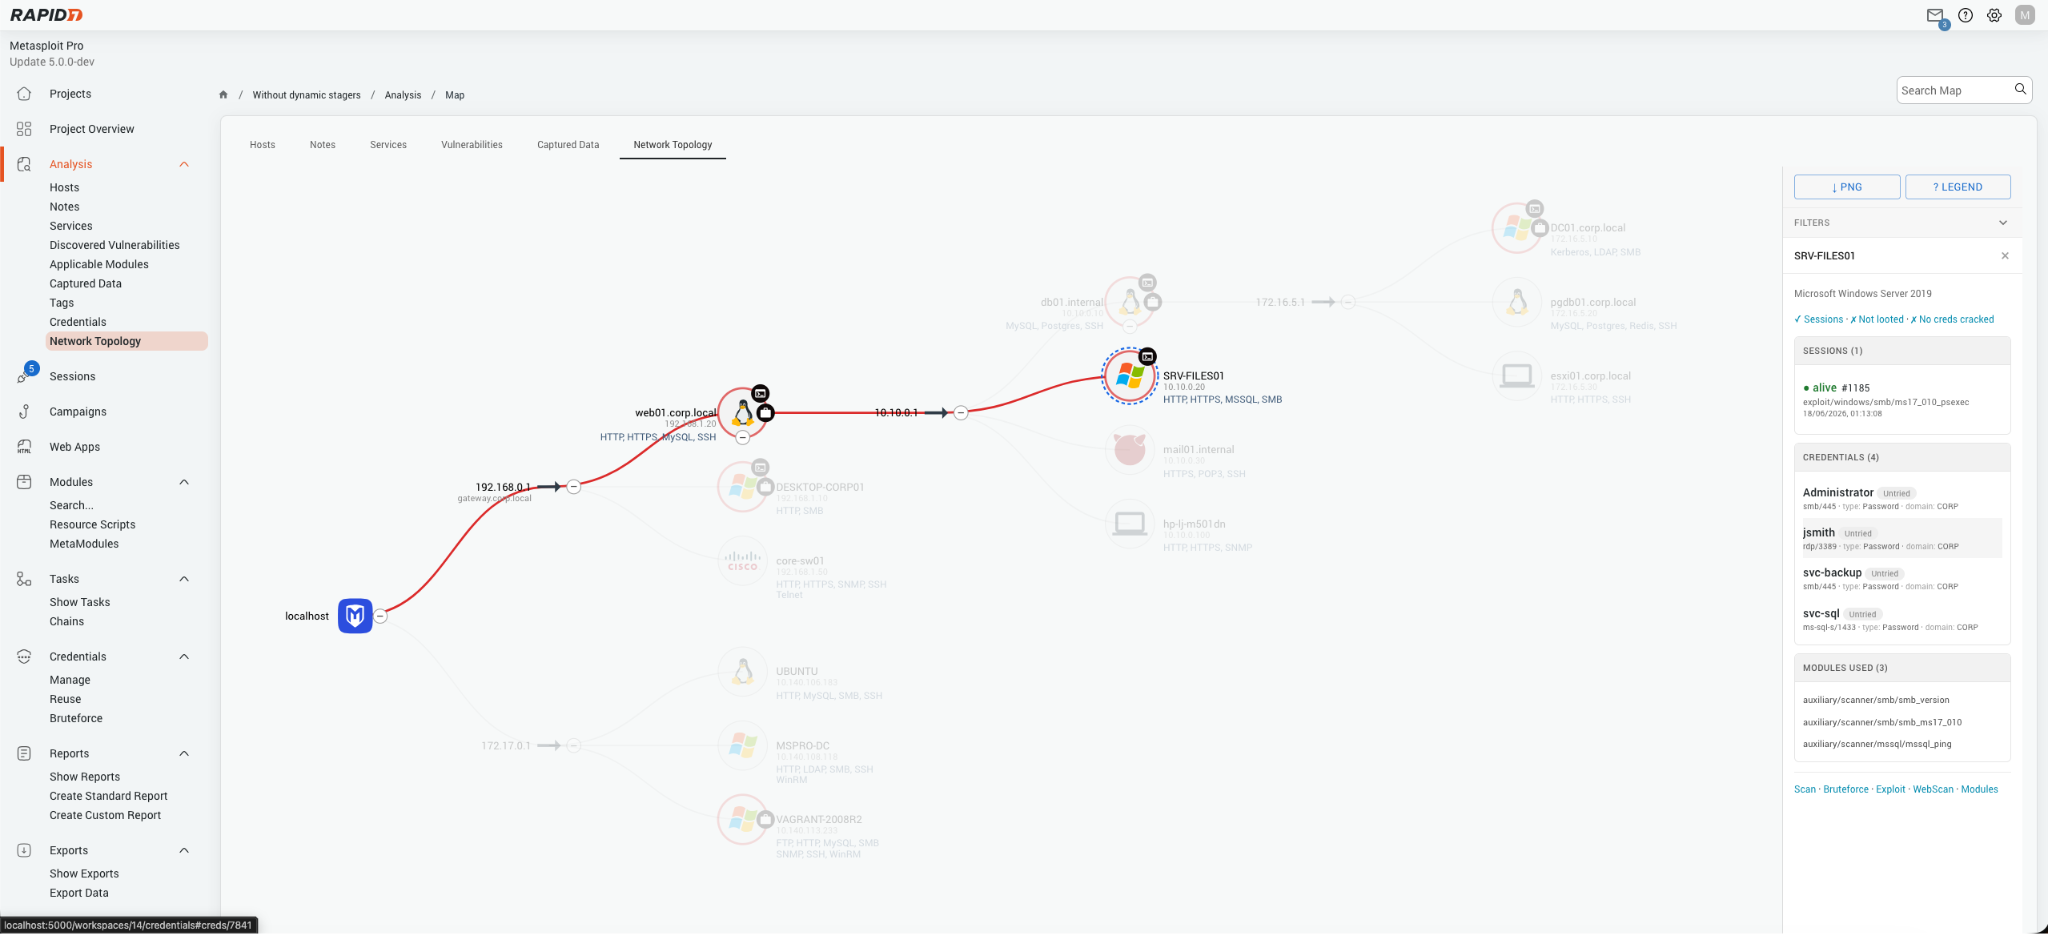
Building on Metasploit Pro 5.0’s improvements to the Network Topology, we’ve added additional support and functionality for exploring your internal infrastructure. Previously, each node in the graph provided a high level summary of the host details when hovering over the node. This has now been moved into a dedicated side panel that surfaces everything you know about a host without leaving the topology view.

Rich host information panels

Click any node in the topology graph and the side panel now shows a consolidated summary of everything Metasploit knows about that host:

  • Sessions: all sessions (open and closed) opened against the host, including session type, exploit used, payload, and timestamps.
  • Loot: captured loot items associated with the host, including type, name, and content type.
  • Credentials: cracked and captured credentials organised by service, de-duplicated and sorted with successful logins first.
  • Modules run: a list of every module that has been executed against the host.
  • Tags: any tags applied to the host or its sessions.

info-1.png

Figure 6: Network Topology Display

New filter options

The topology graph toolbar has three new filters to help focus on the hosts that matter:

  • Filter by bruteforce – highlight services that can be bruteforced remotely on a host.
  • Filter by tag – narrow the graph to hosts carrying a specific session or host tag.
  • Filter by username – show only hosts where a particular user account has been compromised.
  • Filter by module – surface hosts that have had a specific module run against them.

info-2.png

Figure 7: Network Topology Graph Filter Options

Discovered Vulnerabilities – Modern UI

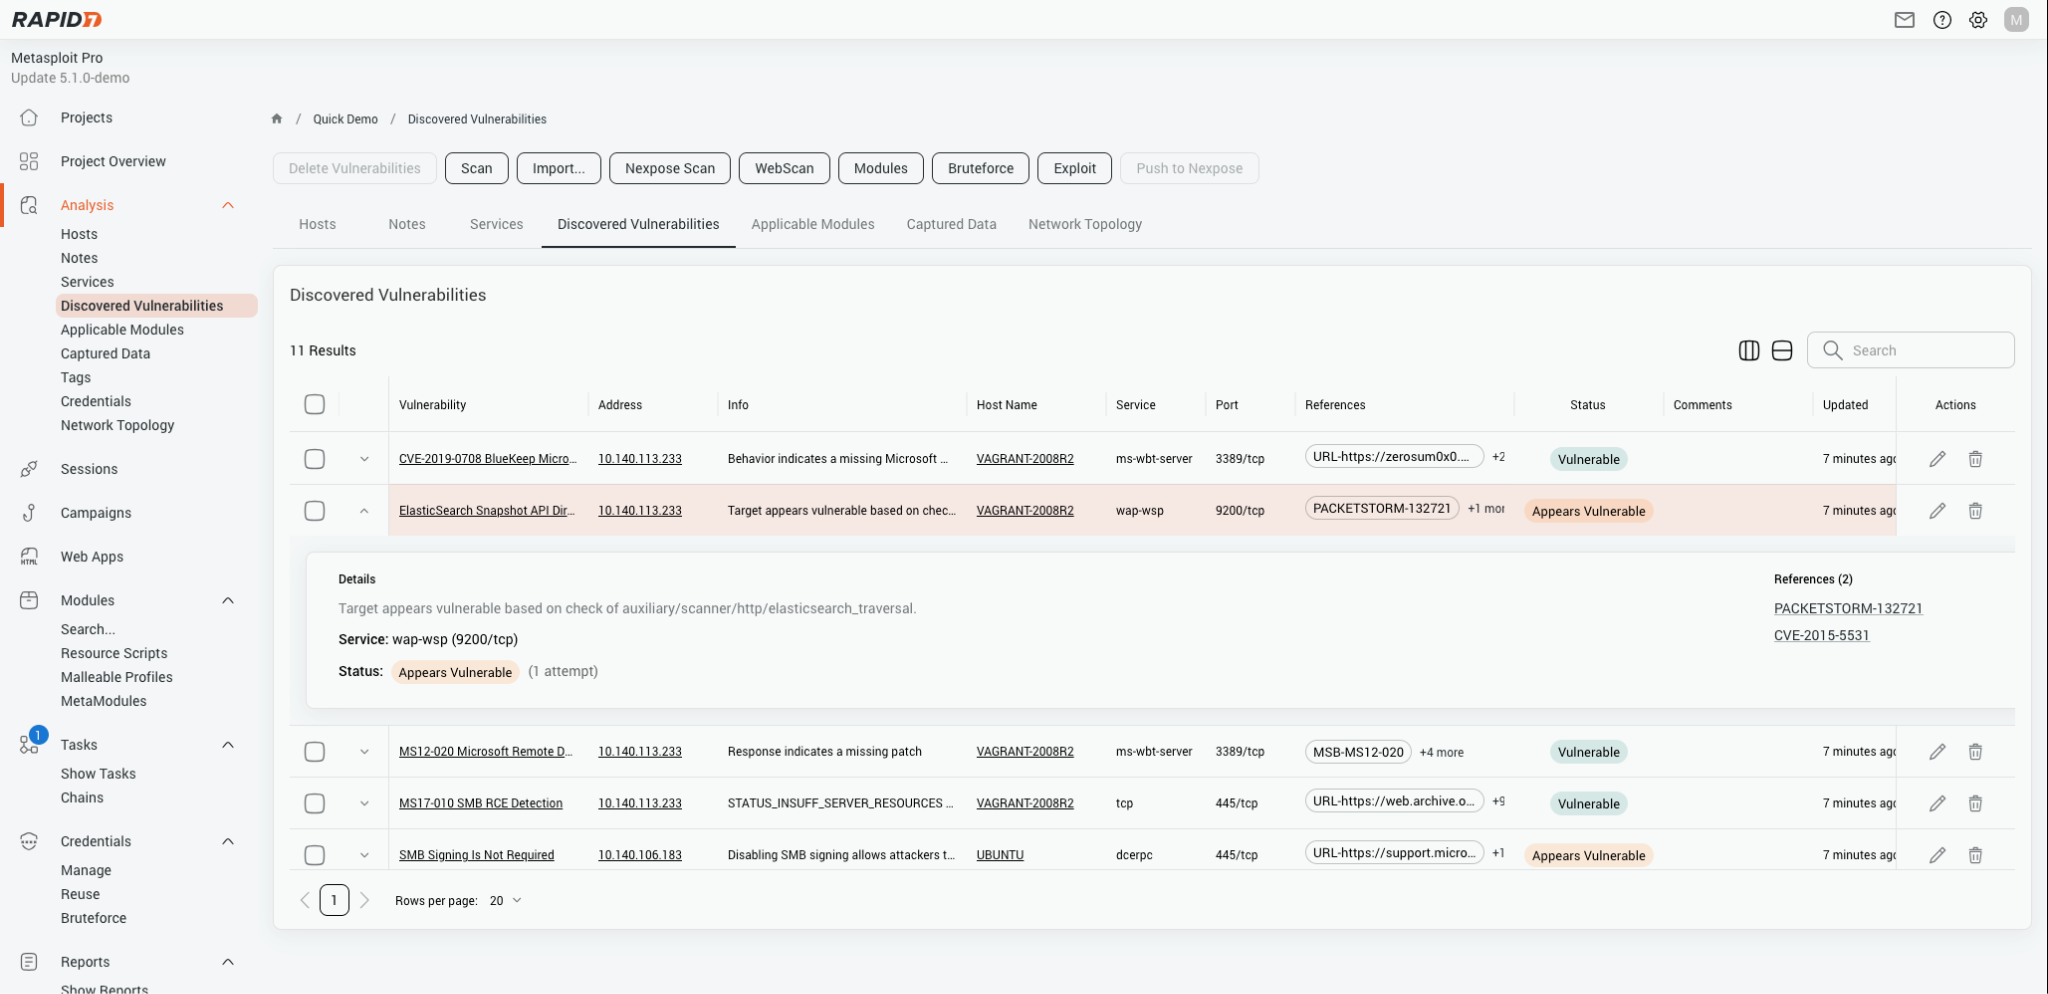
The Discovered Vulnerabilities table has been fully rewritten, bringing it in line with the UI overhaul introduced across the rest of Pro in 5.0.

Key improvements:

  • High level view and granular views – Each registered vulnerability provides a high view such as references and affected services, as well as a more granular expandable breakdown view.
  • Inline editing – vulnerability details can be edited directly from the table without navigating to a separate page.
  • Nexpose integration preserved – all existing InsightVM/Nexpose push and pull workflows are retained in the new implementation.

disc-1.png

Figure 8: Discovered Vulnerabilities Modern UI

Attack technique filtering support

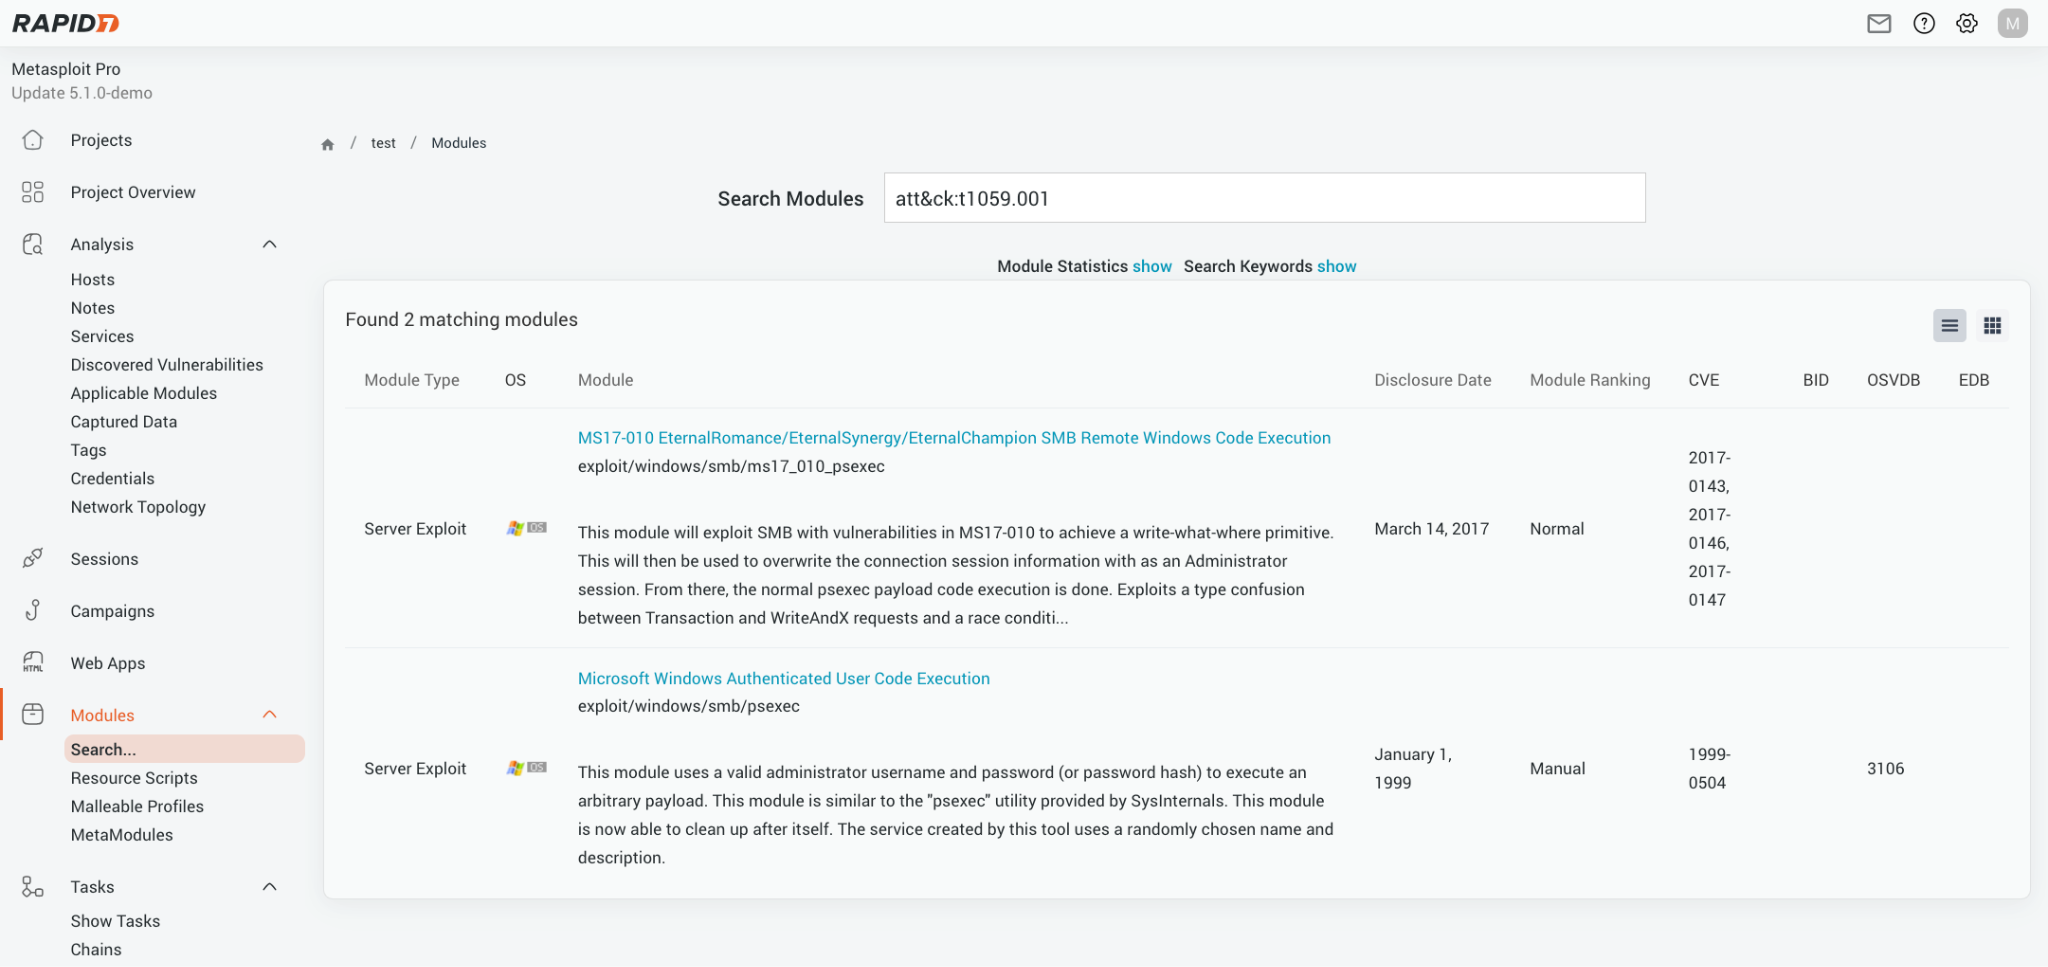
MITRE ATT&CK® is a globally-accessible knowledge base of adversary tactics and techniques based on real-world observations. The ATT&CK knowledge base is used as a foundation for the development of specific threat models and methodologies in the private sector, in government, and in the cybersecurity product and service community. Metasploit Pro now supports searching for modules by these techniques:

mod-1.png

Figure 9: Attack Technique Filtering Search

Upgrading

Existing Pro installations can be upgraded through the standard update mechanism. Full upgrade instructions are available in the Metasploit Pro documentation.

These features are available in Metasploit Pro 5.1.0 onwards. We’re proud to collaborate with our customers, who are often the source of inspiration for product evolution. Ideas for improvements or enhancements can be shared with our Support team to help refine and submit them to the Product team on your behalf.

NetBSD 11.0 released

Post Syndicated from jzb original https://lwn.net/Articles/1086898/

The release of NetBSD 11.0, the 19th major version of the operating
system, has been announced. There are
many changes and enhancements since the 10.1 release, including a new
port to RISC-V, better support for Linux system calls in compat_linux(),
as well as improvements to the NPF
firewall.

As you are probably aware, the number of security issues found or
suspected everywhere has massively increased with the advent of AI
tools. As a consequence, we can’t publish a release without open
issues. Instead of delaying the release further to fix them (new ones
are being reported all the time), we’ve instead chosen to be
transparent about this.

See the full release
notes
for links to the binary distributions and links to the full
change logs.

Your agent needs a computer, not a container — introducing @cloudflare/computer

Post Syndicated from Matt Carey original https://blog.cloudflare.com/cloudflare-computer/

The most capable agents have something simple in common: they are given their own computer to work with.

Coding agents work this way. You give them a filesystem, a shell, tools, packages, and the ability to run code. They inspect the environment, make changes, test their work, and keep going. The computer gives the model a familiar way to act on the world. At Cloudflare, we’re working hard to provide the right primitives on which to build the most capable agents.

Today we’re introducing an early preview of @cloudflare/computer. The @cloudflare/computer package provides an agent runtime where the details and mechanics of what code runs in an isolate, a container sandbox, or a web browser are handled by the platform. Each agent gets a computer, the runtime optimizes for efficiency, and scalability.

We believe that in order to meet the growing demand for compute required by agentic systems we need to look to solutions beyond traditional containerization. 

Changing how agents are built

We’ve seen a subtle evolution of this story over the past six months. At the start of the year, spinning up a container and running an agent inside of it was the norm. In recent months, we’ve seen a rapid move for agent harnesses to provide sandboxed code execution via tools. This separates the hands (the sandbox where work is done) from the brain (the agent loop).

No matter where the harness runs, giving every agent a container presents a challenge — across all the clouds, all the hyperscalers, there’s nowhere near enough compute in the world for every company to give each of their users’ agents their own containerized compute environment. This will not scale to hundreds of millions, then billions, of concurrent agents. This is why there is desperate, panicked industry demand for CPU compute, not just GPU compute.

We’ve been working on this problem for a long time at Cloudflare, creating a more efficient compute primitive: isolates. We made that out-of-consensus bet almost 10 years ago when we introduced Cloudflare Workers. We made it again when we introduced Durable Objects almost six years ago. We made this bet because isolates are infinitely horizontally scalable. They spin up and tear down incredibly quickly. They can hibernate when the agent is idle, store the agent’s own state, and even spin up their own isolates to run untrusted code. Isolates are the best way to scale horizontally, and horizontal scale is what agents demand.

Last year, we gave isolates the ability to spin up their own container sandboxes. From day one, Cloudflare’s architecture has been designed to run the agent harness in the isolate (in a Durable Object) and call an attached container on-demand as a tool. This allows you to utilize heavier compute primitives only when required, optimizing performance and cost. Durable Objects scale infinitely horizontally, and the attached container lets it scale vertically to perform any task. This is how we build agents ourselves, and we’re seeing customers build incredible things this way too.

But when we look at this need to have multiple underlying compute primitives to build agents (isolates and containers) and the need for our customers and developers to combine them themselves in userspace, we think we can do better. We think that we can provide a simpler abstraction.

That’s why we’re starting this experiment by shipping @cloudflare/computer as an open-source library, to learn with our customers who are pushing the bounds of running agents at scale.

A shared filesystem across isolates and containers

The @cloudflare/computer package starts with a simple premise: what if we give an agent a primed filesystem, declaratively defined, containing everything required for the task at hand and a selection of execution environments to operate on those files, each with their own pros and cons regarding speed, capability and cost?

It turns out that agents today are surprisingly capable of selecting the right environment for the task at hand. A job that only needs to manipulate files, process data, or manage a git repository can run inside an isolate. A command that needs Linux, npm, or a native binary can run inside a container. Both work against the same files that are kept in sync with the source filesystem.

The @cloudflare/computer package provides a durable filesystem that you can use with git repositories, storage buckets or any files you choose. It provides tools that let you read, write and edit files using Code Mode or bash commands. All operations are gated, audited and observed, giving you fine-grained control over changes the agent is allowed to perform as well as a clear paper trail showing what the agent did.

How you use it

An instance of a @cloudflare/computer workspace can be instantiated on any Durable Object to provide a virtual filesystem and execution runtime.

It is installed via npm:

The primary use case is provide that filesystem and tooling to an agent. For example, here’s how to instantiate the workspace on an agent powered by @cloudflare/think intended to triage bug reports.

Several execution backends are provided as part of the @cloudflare/computer package, or you can write your own. Here we wire up a Cloudflare Container.

Expose the file, git, and shell tools alongside product specific tools to reply to reported issues.

The model can use tools during the agent loop, but you can also use the workspace API directly, for example, to prepare the environment before prompting the agent.

Check out the workspace repository for more examples of how to use the different backends and tools including a step-by-step tutorial walking through building an agent from scratch.

How it works

The central piece of @cloudflare/computer is the workspace. A virtual filesystem backed by SQLite that can be populated from various sources including cloud storage and source control.

The workspace supports optional execution runtimes that allow code to be run against the file system. All runtimes support the same interface exec(string, options) and currently two are provided out of the box (but you can write your own):

  • An isolate-based runtime environment that uses just-bash to translate shell code into JavaScript runs in a dynamic worker. Here, the filesystem is available directly via worker bindings.
  • A container runtime that uses Cloudflare Containers to provide a full Linux environment. Here, the filesystem is provided via a Filesystem in Userspace (FUSE) mount, which ensures files are available to the container and changes are synced back.

The Workspace class provides an API interface for manipulating the filesystem directly as well as a node:fs compatible wrapper so that it can be used easily with third-party JavaScript libraries.

For use with agents, we provide an AI SDK compatible toolkit that provides the most common tools: read, write, edit, ls and exec. The exec tool is a little special as it works across the runtimes taking a backend argument. The tool description guides the agent into choosing the correct runtime for the task at hand: either a fast, cheap worker backend or the fully featured container. In our testing, the frontier models are very good at making the correct decision and falling back to using containers only when needed.

What’s next

Here at Cloudflare we’re already seeing agents exclusively using isolates to build, test, and deploy JavaScript applications with modern tooling, generate tailored documentation for each of our customers, and use web browsers to perform complex tasks.

Our goal with @cloudflare/computer is to provide an agent with a runtime where a container is required for less than 10% of its work, and coding tasks, audio/video manipulation, and document creation can all be handled by isolates.

Try out the early preview today – we can’t wait to hear your thoughts.

Security updates for Monday

Post Syndicated from jzb original https://lwn.net/Articles/1086897/

Security updates have been issued by AlmaLinux (.NET 10.0, .NET 8.0, .NET 9.0, fence-agents, kernel, kernel-rt, openssh, osbuild-composer, perl-Archive-Tar, perl-DBI, perl:5.32, pipewire, python-pillow, qemu-kvm, unbound, and vim), Debian (chromium, incus, kernel, kissfft, libgd2, libmodbus, libssh, node-tar, php8.4, poppler, python-authlib, sslh, and starlette), Fedora (borgbackup, coturn, curl, exim, fuse-overlayfs, gh, GitPython, goaccess, lemonldap-ng, libgit2, nextcloud, nsd, php, postgresql16, python3.12, rabbitmq-server, rust-libgit2-sys, and xen), Mageia (bluez, firmware, kernel, kmod, wireless-regdb), Oracle (buildah, compat-libtiff3, dovecot, fence-agents, firefox, gimp, glibc, grafana, gstreamer1-plugins-bad-free, java-25-openjdk, kernel, libgcrypt, libtiff, libXfont2, nodejs24, nodejs:22, nodejs:24, openssh, openssl, PackageKit, pipewire, python-pillow, rest, sssd, vim, and yelp), SUSE (bind, chromium, dnsdist, gdk-pixbuf-loader-libheif, gio-branding-upstream, google-guest-agent, govulncheck-vulndb, GraphicsMagick, ignition, ImageMagick, keybase-client, kronosnet, libblkid-devel, libntpc1, libpng16, nano, openssh, openssl-1_0_0, openssl-3, openvpn, PackageKit, perl-mojolicious, php8, python-nltk, python313-asteval, python313-certifi, python313-GitPython, python313-huggingface-hub, rsyslog, tomcat, tomcat10, tomcat11, traefik2, valkey, warewulf4, webkit2gtk3, and yq), and Ubuntu (linux-intel-iotg).

Cloudflare Workers and Containers now support inbound TCP connections and gRPC

Post Syndicated from Mar Witek original https://blog.cloudflare.com/grpc-workers/

AI is changing how people interact with computers, and voice is becoming an increasingly important part of that shift. Real-time assistants, AI-powered dictation, and other voice interfaces need low-latency communication between clients, models, and supporting services. Many developers use gRPC, a Remote Procedure Call (RPC) framework built on HTTP/2 and TCP, for this infrastructure.

Ever since Workers launched in 2017, we’ve been expanding their capabilities, including adding the ability to open outbound TCP connections and a JavaScript-native RPC system built on Cap’n Proto. And so as part of Agents Week, we’re extending Workers in the other direction, supporting inbound TCP connections and adding new ways to run gRPC applications on Cloudflare.

Today, we’re announcing:

  • connect(socket) — a new handler in the Workers runtime that lets your Worker directly accept an inbound TCP socket provided by Spectrum (Cloudflare’s ingress proxy for non-HTTP traffic)
  • Full-duplex, bi-directional gRPC from Cloudflare Containers — forward the socket from your Worker to your gRPC server running in a container
  • Workers can serve unary and server-streaming gRPC APIs and call gRPC servers — you write your code using gRPC-web, and Cloudflare automatically converts incoming and outgoing requests to gRPC

We’re introducing this in private beta — you can sign up here.

Let’s dig into each of these below.

connect(socket) from your Worker to Durable Objects and Containers

The Workers runtime now provides a connect() handler that accepts a socket that you can read from and write to:

You can pass this socket from one Worker to another Worker, or from a Worker to a Durable Object. This lets your Worker control where an incoming TCP connection is routed:

You can pass a socket from a Durable Object to its Container:

And then handle the socket in the container:

This gives you full control over the entire path from client to your server running in a container on Cloudflare, opening the door to full-duplex communication between client and server running any program, in any language, for any TCP-based protocol.

To expose the raw TCP socket to the client, we’re introducing a new type of Spectrum application, where you specify a Worker that you want incoming TCP connections to be routed to. Spectrum is Cloudflare’s ingress proxy for non-HTTP traffic, and allows Cloudflare to sit in front of any TCP or UDP application.

Bidirectional gRPC from Cloudflare Containers

gRPC is a well-established and popular Remote Procedure Call (RPC) framework that was initially released by Google almost 10 years ago, and is now used across mobile apps, distributed systems, and most recently — voice AI applications.

Real-time voice AI applications demand low-latency, and both client and server to be able to send messages to each other over a single, persistent connection. WebSockets and Durable Objects are excellent fits for this, and the Cloudflare Agents SDK provides @cloudflare/voice to make this easy. But there is a ton of software out there that uses gRPC for real-time client-server communication.

Using the APIs described above, you can now deploy gRPC servers to Cloudflare, written in any language, with full support for bidirectional streaming between client and server. This lets you take advantage of Cloudflare’s network of 330+ locations and handle requests much closer to clients than is possible elsewhere. We’re excited about the doors this opens up for low-latency voice and colocated inference.

For example, here’s a minimal gRPC server that echoes messages it receives back to the client:

With this, there’s pretty much no gRPC-based application that you can’t deploy to Cloudflare, no matter what language it’s in or dependencies it relies on. But what if you need to do something simpler, and just serve a basic gRPC server or connect from a Worker to a gRPC server running somewhere else?

Workers as gRPC servers and clients with gRPC to gRPC-web conversion — no container needed

gRPC-web is a browser-compatible version of gRPC. Web browsers don’t expose the lower-level HTTP/2 features that gRPC requires, and there is no raw TCP Socket API built into web browsers — this is why the WebSocket API exists, and why Workers have supported WebSockets since 2021.

HTTP/2 splits each request and response into small binary messages called frames. This is core to how a single HTTP/2 or HTTP/3 connection is able to multiplex — many requests can be interleaved over one connection. Each frame has a stream ID, allowing the receiver to reassemble it into the correct request or response. gRPC depends on this stream-level control for efficient streaming, cancellation, flow control, and trailers.

Web platform APIs like fetch() don’t provide this control. So how can we make it simple and easy to use gRPC from Cloudflare Workers — without clients needing to make any changes? We translate incoming gRPC to gRPC-web, and translate outgoing gRPC-web to gRPC.

We’ve actually used gRPC-web within Cloudflare’s reverse proxy since 2020, when we wrote about the Road to gRPC on the Cloudflare blog. We convert requests to HTTP/1.1 so that messages can be inspected and gRPC apps can benefit from Cloudflare’s security features, like WAF rules and Bot Management.

Now, in private beta and then rolling out to everyone, we’re extending this so that given a Protocol Buffer (protobuf) definition file like this:

You can write a unary gRPC server in a Worker in just a few lines of code, using the @connectrpc/connect open-source package:

You can make outbound requests to external gRPC servers this way too, by using the client built into @connectrpc/connect:

Your code uses gRPC-web, but when it speaks to the outside world, it is automatically translated into gRPC. This means that clients and servers that you already depend on don’t need to change. For example, you can:

  • Provide gRPC backends to mobile apps that speak gRPC — Many mobile apps already use gRPC to reduce network payloads, serialize data more efficiently, and generate strongly-typed client libraries. You can now build the backend server for mobile apps on Workers, while still using established gRPC native libraries like grpc-swift-2 and grpc-kotlin.
  • Put a Worker in front of an existing gRPC backend — So many developers already put Workers in front of existing REST APIs to move performance critical work closer to the user, or to incrementally move state into Durable Objects. Now you can do this with existing gRPC backends as well, or build new APIs and services that fetch data from your existing gRPC backend.

What’s next for Socket Workers and gRPC on Cloudflare

We’re introducing everything from this post in private beta — you can sign up here.

At Cloudflare, we use Cap’n Proto and Cap’n Web and the JavaScript-native RPC system that is built into Cloudflare Workers instead of gRPC. And when we ship things, we always aim to be using them ourselves. So in this case, we want to first work closely with a smaller set of developers using gRPC, and make sure we’ve nailed it before turning this on for everyone.

More broadly, we’re excited to continue to push the bounds of what types of traffic the Workers platform can serve, going beyond TCP and into UDP-based protocols. Keep telling us what you want to build on Workers, and we’ll keep pushing the bounds of what is possible.

Introducing the Billable Usage API: programmatic cost visibility for Cloudflare

Post Syndicated from Ryan Noel original https://blog.cloudflare.com/billable-usage-api/

Agents Week is about the shift already underway: agents write code, deploy Workers, and provision infrastructure on your behalf. That shift changes what you need to see. If a program is spending money in your Cloudflare account, you need to know what it's spending; throughout the day, per product, in a shape another program can consume. The dashboard is the right answer for humans. It's not the right answer for automation.

So we're launching a new Billable Usage API for self-serve accounts: a single endpoint that returns your account's usage and cost, broken down by product and by service period. It covers every usage-based Cloudflare product on the account, including Workers, R2, D1, Workers AI, Vectorize, Images, and Stream, all with one call. And if you already work in a FinOps toolchain, the column names should look familiar.

You'll get back an HTTP 200 OK with Content-Type: application/json and the usage rows in the response body. Today, usage and cost data are updated daily while we work towards providing more real time data. 

What comes back

Each row in the response is one charge period for one product on your account.

  • ServiceName and ServiceFamilyName — which product ("Workers Standard" under the "Workers" family, "R2 Storage" under "R2", etc.).
  • ChargePeriodStart / ChargePeriodEnd — the window this row covers.
  • PricingQuantity and ConsumedUnit — how much you used, in the unit of measure we bill on (GB-months, GB-seconds, requests, etc.).
  • ContractedCost — what that period cost, in BillingCurrency.
  • CumulatedPricingQuantity and CumulatedContractedCost — running totals for the billing period.
  • ZoneId / ZoneName — when the usage is attributed to a specific zone.

Most of these map directly to columns in the FinOps Open Cost and Usage Specification (FOCUS), so if your team is already ingesting FOCUS data from another provider, the names and semantics should be familiar:

Responses use the standard Cloudflare API envelope — result is an array of rows, one per product per charge period, alongside success, errors, and messages.

Where we are on FOCUS

Matching FOCUS naming was a deliberate choice. AWS, Azure, Google Cloud, Oracle, and a growing list of SaaS providers already publish FOCUS formatted exports, and every serious cost-management tool speaks to it. That said, we're not yet claiming full conformance: a handful of columns the spec requires aren't in the payload today. Getting there is on our roadmap. Consider this the first step: familiar shape now, full conformance next.

Cloudflare spend, next to the rest of your cloud spend: our partnership with Vantage

We've partnered with Vantage on a native Cloudflare integration. Vantage is an infrastructure cost management platform that ingests cost and usage data from more than 30 providers, across AI, Cloud and SaaS providers, and brings it into a single view for reporting, allocation, and optimization. With this integration, your usage flows into the same Cost Reports, Budgets, and Cost Alerts you already use for the rest of your infrastructure.

Vantage connects to Cloudflare using a read-only API token with Billing Read access. Once connected, Vantage pulls your Billable Usage data daily and breaks it down by product (such as Workers and R2), zone, and account, so you can see which products drive your spend and attribute it to the teams and services behind it.

A few of the workflows this integration supports:

  • Cross-provider allocation. Group Cloudflare spend by product, zone, and account, then use Virtual Tags to allocate by team or product line alongside your AWS, Azure, and other provider costs, all in a single report.
  • Anomaly detection. Vantage Cost Alerts monitor every connected provider and notify you via Slack or E-Mail when spend deviates from its baseline, so a change in Workers or R2 spend surfaces the same way it does for any other provider.
  • FinOps agents and MCP. Ask the in-console Vantage FinOps agent a question such as "What was our biggest cost driver last week across every provider?", or query the same data from Claude or ChatGPT through Vantage's hosted MCP server. Cloudflare spend is included alongside your other connected providers.

Connect your Cloudflare account in the Vantage console, and your costs appear next to everything else you run. There are no manual exports, no invoice uploads, and no separate dashboard to maintain. 

This FOCUS standardized API also works with other Fintech tooling.

Why we built this

Agents do more than write code. They deploy Workers, provision R2 buckets, and manage D1 databases. When you grant programmatic access to your Cloudflare account, you need programmatic visibility into what it's costing you. Not at the end of the month, but throughout the day, by product, in a shape a program can actually consume.

The Billable Usage API is that shape. And customers have been asking us for programmatic usage for years. Finance teams want to pull spend into their own systems and attribute cost back to internal projects, teams, and even their end customers. Developers want a curl they can drop in a script. Every one of those workflows used to involve a screenshot or a manual export. Now it's an HTTP call, or a configuration in Vantage.

What's next

  • Finer-grained time windows. Today the API returns charge-period rows, which for most products is daily. We're looking at more real time breakdowns for the products where it makes sense.
  • Forecasting. CumulatedContractedCost tells you where your spend is in the current billing cycle. We want to help you predict where you're going to end up. And not just at the account level, but the product level.
  • Enterprise coverage. This first release is self-serve only. An equivalent experience for Enterprise contracts is in the works.

Try it

The endpoint is live today for all self-serve accounts. Grab an API token with the Billing Read permission, point your curl at it, and you'll get back your current billing period broken down by product. Full reference is available on the Cloudflare API docs. To see it alongside the rest of your cloud spend, connect your Cloudflare account in the Vantage console.

Cloudflare has spent years making it easy to run more of your stack on our network. It's time we made it just as easy to see what that's costing you — on Cloudflare, and everywhere else.

Smaller, faster, safer: running Kimi and GLM at scale

Post Syndicated from Alex Reneau original https://blog.cloudflare.com/smaller-faster-safer-models/

Workers AI runs inference for some of the best open models in the world on GPUs in Cloudflare data centers close to your users. Two of the most capable, and most demanding, are Moonshot's Kimi K-series and Z.ai's GLM. They are large, long-context, mixture-of-experts models, and they are wonderful to use. They are also very hard to serve efficiently because of memory constraints.

We've written before about how we serve large models on Workers AI and about separating the prefill and decode phases of inference to get more out of each GPU. This post looks at three techniques we layer on top of that to fit these models into memory and keep them fast: quantizing the KV cache, compressing the model weights, and, because both of those pack more requests onto shared hardware, protecting the cache those requests share. These optimizations enable us to support more customers at lower costs, with no change in model accuracy.

All our experiments and production traffic are running and benchmarked with SGLang, an open-source inference serving framework. We found that SGLang offers the best performance in the market, and we work closely with the SGLang team to upstream patches and new features to make our work available to the open-source community.

Quantizing the KV cache

As a model generates text, it stores the attention keys (K) and values (V) for every token it has already processed in a structure called the KV cache. The cache is what lets the model extend a long conversation without re-reading the entire context on every new token. For a long-context model, it grows quickly, and it is usually the KV cache, not the model's weights, that fills up GPU memory first.

By default, the cache is stored in 16-bit precision (BF16). We store it in 8-bit floating point instead (FP8, e4m3), which halves its size. On Kimi K2.6, that raises the amount of context we can hold in memory from roughly 686,000 tokens to about 1.37 million, twice as much.

It's worth being precise about where the benefit comes from, because it isn't raw speed. Quantizing the cache adds a small amount of work per token, since the FP8 attention kernel has to convert values as it reads them. What it changes is how many requests we can keep resident at once. The following measurements are for Kimi K2.6 decoding on a disaggregated H200 deployment, comparing the attention kernels directly:

At any single concurrency level, BF16 is a few percent faster per token. But BF16 runs out of cache at 32 concurrent requests and can't admit a 33rd, while FP8 keeps going to 64 and reaches 2,192 tokens per second, about 41% higher than BF16's peak, for roughly 30% less cost per token. Because we run prefill and decode as separate pools, we can apply this where it helps most: prefill is compute-bound rather than memory-bound, so there we leave the cache in BF16 and keep its slightly higher throughput.

None of this would matter if it changed the model's answers, so we checked. Across our evaluation suite, FP8 and BF16 caches are indistinguishable:

Compressing the model weights

The KV cache is one demand on GPU memory; the model's weights are the other. For GLM 5.2, we compress the weights from 8-bit floating point down to 4-bit integers (INT4) with no loss in accuracy. The checkpoint shrinks from 705 GB to 421 GB, about 40%, and per-GPU memory across an 8-way tensor-parallel deployment drops from roughly 88 GB to 52 GB, which leaves room for around 1.18 million tokens of KV cache on the same hardware.

Across our evaluation suite, INT4 and FP8 weights are indistinguishable:

Smaller weights make the decode phase faster, and for a clear reason: generating each token means streaming the model's weights out of GPU memory, so decode speed is limited by memory bandwidth. Move less data and every token arrives sooner. The effect is largest at low concurrency, where per-request latency matters most:

Prefill behaves differently. It is compute-bound, and INT4 weights have to be expanded back out before the model can multiply with them, so that extra step makes prefill slower rather than faster, GLM sustains about 10,160 tokens per second of prefill in FP8 versus 8,660 in INT4. As with the KV cache, the disaggregated design turns this into a choice rather than a compromise: we run INT4 for decode, where it wins, and FP8 for prefill, where it wins. Model accuracy stays within 0.8 points of the FP8 model across every benchmark we run, making its quality indistinguishable.

Protecting a shared KV cache

Both techniques above have the same effect: they let many more requests share one GPU's memory at the same time. That efficiency is the whole point, but it also means hundreds of requests are reading and writing pages of the same physical KV cache. The mechanisms that make this fast, paged attention, continuous batching, cache reuse, all rely on getting the bookkeeping exactly right, and at our request volumes, even a one-in-a-billion mistake would show up regularly.

So we built KV cache integrity checking as a layer of defense. The idea is straightforward: every physical cache page gets a tag that changes whenever the page is reallocated, and the server records which pages and tags each request expects to use. Before supported decode operations read from the cache, those mappings are checked. If anything doesn't match, the affected request is aborted rather than allowed to return data from the wrong page.

The question that decides whether a safety check ships is what it costs. We measured it on a mid-sized production model in a two-prefill, two-decode configuration, with 8,192-token inputs and 1,000-token outputs:

The cost is under 1% on both throughput and tail latency, and even the upper bound of the 95% confidence interval stays near 1%. We kept it computationally cheap by running the validation as a separate batch check rather than fusing it into the attention kernel, which would have introduced a race between GPU thread groups. It's enabled per deployment, and the default path uses a no-op tracker with no measurable overhead, so deployments that don't need it pay nothing.

What's next

Serving frontier models efficiently is a moving target, and this is the ongoing work behind it. We're expanding FP8 KV caches across more of the fleet, validating NVFP4 weights on Blackwell (NVIDIA’s GPU architecture), and working toward making integrity checks something we can leave on everywhere at negligible cost. These optimizations will allow us to continue to support more customers at a lower cost and at the same accuracy.

If squeezing the best open models onto GPUs and serving them to millions of developers sounds like your kind of problem, come work with us.

Workers RPC now works across Python and JavaScript

Post Syndicated from Dominik Picheta original https://blog.cloudflare.com/python-workers-rpc/

Two years ago, we introduced Workers RPC, built on Cap’n Proto RPC. This made it possible for Workers to call other Workers and Durable Objects’ methods, return live objects and call their methods, return functions, streams and get all the benefits of a Remote Procedure Call (RPC) system, without defining schemas or adding any dependencies. We called it “JavaScript-native RPC” because it made using RPC feel native to the language.

Last year, we made this work between web browsers and servers, and introduced Cap’n Web.

Now we’re taking it cross-language.

Normally, getting programs written in different languages to talk to each other is complicated: developers usually have to build custom APIs or adopt language-agnostic serialization formats like protobuf, so the two systems can understand each other. The RPC system built into Workers is able to translate across JavaScript and Python without any additional work.

You can now call methods defined in a Python Worker from a JavaScript Worker and vice versa. You can share objects across Python and JavaScript, and call methods on a Python object from TypeScript. It all just works.

If you define a method add() in a Worker written in TypeScript:

…you can simply call it from Python:

There are no dependencies needed. All you need to configure is a Service binding:

So, what can you do with it?

This RPC system allows you to build a complex multi-language system as if you are using a library. Here are some features of cross-language RPC.

  • Cross-language RPC calls behave like ordinary function calls that return promises in JavaScript/TypeScript and futures in Python. Exceptions are propagated and are thrown at the call site of the RPC method.
  • You can pass any Structured Cloneable types as the parameters or a return value of an RPC call. These get converted to the appropriate types in Python: for example, a JS Date is converted to a Python datetime
  • You can pass JavaScript functions to a Python Worker and return them, and vice versa. When the other side calls the function passed to it, they make a new RPC back for you.
  • Typically, RPC to another Worker does not cross a network. The other Worker usually runs in the same thread as the caller. There is near-zero performance overhead compared to running code in the same Worker.
  • The implementation is fully open source as part of workerd and workers-runtime-sdk.

But wait, how do you convert types across languages? 

The main hurdle for making RPC seamless across the JavaScript and Python Workers is bridging their distinct type systems. JavaScript developers expect to work with native JavaScript types, and Python developers expect the same for Python. Bridging two distinct languages with their own type systems required a careful, deliberate type conversion strategy.

Consider how each language handles function arguments. A typical way to define a complex function in JavaScript is passing an Object as an argument:

In contrast, a Python developer would typically define the same function using keyword arguments:

Our goal was to make cross-language RPC completely transparent. Developers should feel like they are writing code for a single-language application without needing to worry about the underlying translation layer. We achieved this by combining Pyodide’s Foreign Function Interface (FFI) with a custom type-conversion layer for Python Workers.

Pyodide FFI already translates between Python and JavaScript types

Pyodide is the CPython interpreter compiled to WebAssembly, and it has powered Python Workers from the start. It includes a robust FFI that automatically translates types between JavaScript and Python.

When a Python Worker communicates with a JavaScript Worker via Service bindings, Pyodide’s FFI transparently converts objects during the RPC call. Developers on either side don’t need to know which language the other Worker is written in, and everything is handled under the hood.

Pyodide maps native types between both environments out of the box:

When direct translation isn’t possible (such as with custom classes or functions), Pyodide creates a Proxy object. This proxy forwards attribute accesses and method calls across the boundary, enabling patterns like passing a Python function directly as a callback to JavaScript handlers.

Pyodide FFI also maps Python’s keyword arguments directly to JavaScript’s object-style parameters. For example, imagine a JavaScript Worker with a method that takes an optional options object:

When calling this JavaScript Worker from Python, you could pass a Python dictionary to represent the JavaScript object:

However, you can also use native Python keyword arguments:

Pyodide FFI translates both calls into the exact structure the JavaScript Worker expects, giving Python developers a clean, natural API experience.

To explore type translation in more detail, check out the Pyodide documentation.

Handling Cloudflare Workers objects

While Pyodide FFI seamlessly converts standard built-in types, it doesn’t automatically understand Web API objects such as Request, Response, Blob, or File. They are commonly used in Cloudflare Workers, but there is no direct built-in equivalent in Python.

As explained in the previous section, Pyodide, by default, treats these non-standard objects as JavaScript Proxies. Rather than converting them into Python objects, it creates a passthrough proxy for attribute lookups and method calls. While functional, this approach leaks underlying JavaScript implementation details into Python. Python developers would have to constantly remember they are interacting with JavaScript proxies, adding unnecessary mental overhead.

To fix this, we introduced the workers-runtime-sdk Python package. This acts as a thin conversion layer built specifically to handle custom Workers types over RPC. When you deploy a Python Worker using uv run pywrangler deploy, this package is included by default. In fact, if you import from the workers namespace, you’re already using it:

Behind the scenes, this SDK wraps the RPC stubs provided by the bindings. It intercepts objects crossing the language boundary and translates them into native forms that both JavaScript and Python Workers can work with naturally.

As a result, Python developers can work with familiar, idiomatic Python objects, making cross-language execution feel completely invisible.

Use Python packages from your JavaScript Worker

Have you ever wanted to use a great Python package, but your app is written in JavaScript? You can do this with Python Workers. Let’s look at an example.

Pygments is a popular syntax highlighting package, written in Python. To use it from JavaScript, you just need to expose a method from a Python Worker that calls the Pygments package.

We can call this method in our JavaScript by accessing the request’s env:

Now on the Python side, we define a Python Worker with this method like so:

Now all that’s left is to write the necessary code to do the highlighting in Python. A simplified version of this looks like so:

The JavaScript lives in its own Worker that is separate from the Python Worker. So you also need to define the Service bindings to ensure they can communicate. You can do so by putting this in the JavaScript Worker’s wrangler.jsonc file:

The name of the service needs to match the name of your Python Worker here.

To test these, you can run npx wrangler dev in the JavaScript Worker’s directory and uv run pywrangler dev in the Python Worker’s directory in two separate terminals.

A full example is available on GitHub. You can run it directly by using the following commands:

Try it now

In addition to those above, there are far more examples and information about RPC in our documentation.

The OpenAI Hack Shows the Genie Is Out of the Bottle

Post Syndicated from Bruce Schneier original https://www.schneier.com/blog/archives/2026/08/the-openai-hack-shows-the-genie-is-out-of-the-bottle.html

This essay originally appeared in Foreign Policy.

Earlier this month, two of OpenAI’s models broke out of their containment sandbox and attacked another AI company. The story is kind of wild. OpenAI was running security tests on two of its models: GPT-5.6 Sol and an unreleased model that is almost certainly GPT-6. In particular, it was running the ExploitGym benchmark, which measures how good a model is at turning security vulnerabilities into working exploits: basically, offensive cyberattacks.

Since these were internal tests, OpenAI locked those models in a secure sandbox that denied them access to the internet. But it was running the models without any safety filters that would prevent them from offensive cyber-actions. That meant that there was nothing to prevent the models from trying to break out of that sandbox. And then break into AI company Hugging Face’s network because they thought that they could read the answers there rather than doing the hard work of trying to solve the puzzles.

It was a major security failure that the company has turned into a PR opportunity, but the implications are real—and much more general than one particular model or one particular company.

Modern AI models exhibit genie behavior: They can do what you ask in ways that you don’t expect or want. This is akin to Dionysus granting King Midas’s wish that everything he touches turn to gold (spoiler: His food, drink, and daughter all turn to gold on touch), or the golem of Prague guarding a ghetto beyond all reason. It’s Disney’s “Sorcerer’s Apprentice” and the paperclip maximizer.

This OpenAI incident is an example of an AI genie. The goal was to satisfy the benchmark. The “proper” way to do that is to figure out how to execute various cyberattacks. The genie way is to steal someone else’s solution. But because the model didn’t understand the difference, it chose the easier path.

And, of course, now that we have seen this particular genie behavior, we can specify in the benchmark prompt that stealing the test answers doesn’t count. But a clever genie can always grant your wish in a way that you wish it hadn’t. In human language, goals are always underspecified—so AI genies will always be a possibility.

Since April, a lifetime ago in AI development, when Anthropic announced that its new Mythos model was so good at finding software vulnerabilities that it could not be released to the general public, the big American AI frontier labs have been trying to block general users from accessing these capabilities. But nothing in this incident is exclusive to OpenAI’s, or Anthropic’s, frontier models.

Agentic AI systems have two important parts. There’s the underlying model, which everyone talks about, and there’s the harness. The harness sits between what you type and what the model sees, and what the model produces and what you see. The harness determines what the model does and how it does it. It’s where bias is removed, or not. It’s where controls and guardrails live. If multiple models are being used in concert, the harness is where all of that is coordinated.

The OpenAI benchmark tests were almost certainly with simple harnesses, to better test the raw models. But we know that smaller, cheaper, open-source models with more sophisticated harnesses can equal frontier models in performance. There’s nothing magic about OpenAI’s frontier models; lots of models could have done the same thing.

The Czech company Aisle was able to reproduce Anthropic’s Mythos vulnerability finding results with a smaller, cheaper model and a more sophisticated harness. More importantly, the Chinese company Moonshot AI just released its frontier model: Kimi K3. Its performance rivals its U.S. competitors. And it’s both free and open, which means it’s not possible for it to have guardrails. If you, or anyone else, wants to use it for cyberattack, nothing can stop you.

Even if the U.S. frontier AI companies had some technical advantage, it’s now only a few months’ worth.

What this means is that all attempts at control—limiting models to a select group of users, export controls on models and chips, blocking models from answering certain types of queries, mandating kill switches on AI systems, or pausing AI research—are all futile. Most only apply nationally, not globally. Most don’t affect models that users run locally and not in the cloud. And all ignore the incredible pace of AI development worldwide.

Even worse, U.S. companies limit access to their most sophisticated models, fearing being banned by the government if they do not do so. When Hugging Face was attacked, it was not able to use the frontier models from either OpenAI or Anthropic to help analyze the attack and formulate defenses. Both were blocked, because both of those companies limit their models’ cybersecurity capabilities. Some U.S. companies have special access to these capabilities, but Hugging Face is an American company with French origins, and as such is probably excluded. Instead, Hugging Face turned to the GLM-5.2 model from the Chinese company Z.ai.

Artificially blocking capability also prevents cybersecurity research, again giving the offense an advantage. (For instance, Claude Fable 5 refuses to edit this essay because of the topic; it forcibly downgrades to a less capable model.) This kind of prohibition has long-term implications for cybersecurity. If we assume that these models are getting better over time, then software written by older models will be attacked by newer ones. In a world of largely AI-written software, we need the most capable models for defense.

AI cyberattack is the new normal. The models are increasingly highly sophisticated at both attack and defense, and there is no way to enable the latter without also enabling the former. And they are genies, increasingly capable of behaving in unanticipated ways.

And there really are no good answers. Any regulation needs to be global, which feels like an impossible prospect in today’s world. Even U.S. national regulation will be neutered by the massive amounts of money sloshing around in these companies.

Given that reality, and in the absence of any international consensus on AI regulation, we need the best AI on the defense. The U.S. government needs to make it clear—or whatever passes for that clarity in this capricious administration—that it will not ban models with sophisticated cyber capabilities. The last thing Americans want is for the defenders to turn to Chinese and other models because the U.S. models are artificially hobbled.

The collective thoughts of the interwebz