Post Syndicated from Tejal Patel original https://aws.amazon.com/blogs/big-data/implement-fine-grained-access-control-for-iceberg-tables-using-amazon-emr-on-eks-integrated-with-aws-lake-formation/
The rise of distributed data processing frameworks such as Apache Spark has revolutionized the way organizations manage and analyze large-scale data. However, as the volume and complexity of data continue to grow, the need for fine-grained access control (FGAC) has become increasingly important. This is particularly true in scenarios where sensitive or proprietary data must be shared across multiple teams or organizations, such as in the case of open data initiatives. Implementing robust access control mechanisms is crucial to maintain secure and controlled access to data stored in Open Table Format (OTF) within a modern data lake.
One approach to addressing this challenge is by using Amazon EMR on Amazon Elastic Kubernetes Service (Amazon EKS) and incorporating FGAC mechanisms. With Amazon EMR on EKS, you can run open source big data frameworks such as Spark on Amazon EKS. This integration provides the scalability and flexibility of Kubernetes, while also using the data processing capabilities of Amazon EMR.
On February 6th 2025, AWS introduced fine-grained access control based on AWS Lake Formation for EMR on EKS from Amazon EMR 7.7 and higher version. You can now significantly enhance your data governance and security frameworks using this feature.
In this post, we demonstrate how to implement FGAC on Apache Iceberg tables using EMR on EKS with Lake Formation.
Data mesh use case
With FGAC in a data mesh architecture, domain owners can manage access to their data products at a granular level. This decentralized approach allows for greater agility and control, making sure data is accessible only to authorized users and services within or across domains. Policies can be tailored to specific data products, considering factors like data sensitivity, user roles, and intended use. This localized control enhances security and compliance while supporting the self-service nature of the data mesh.
FGAC is especially useful in business domains that deal with sensitive data, such as healthcare, finance, legal, human resources, and others. In this post, we focus on examples from the healthcare domain, showcasing how we can achieve the following:
- Share patient data securely – Data mesh enables different departments within a hospital to manage their own patient data as independent domains. FGAC makes sure only authorized personnel can access specific patient records or data elements based on their roles and need-to-know basis.
- Facilitate research and collaboration – Researchers can access de-identified patient data from various hospital domains through the data mesh architecture, enabling collaboration between multidisciplinary teams across different healthcare institutions, fostering knowledge sharing, and accelerating research and discovery. FGAC supports compliance with privacy regulations (such as HIPAA) by restricting access to sensitive data elements or allowing access only to aggregated, anonymized datasets.
- Improve operational efficiency – Data mesh can streamline data sharing between hospitals and insurance companies, simplifying billing and claims processing. FGAC makes sure only authorized personnel within each organization can access the necessary data, protecting sensitive financial information.
Solution overview
In this post, we explore how to implement FGAC on Iceberg tables within an EMR on EKS application, using the capabilities of Lake Formation. For details on how to implement FGAC on Amazon EMR on EC2, refer to Fine-grained access control in Amazon EMR Serverless with AWS Lake Formation.
The following components play critical roles in this solution design:
- Apache Iceberg OTF:
- High-performance table format for large-scale analytics
- Supports schema evolution, ACID transactions, and time travel
- Compatible with Spark, Trino, Presto, and Flink
- Amazon S3 Tables fully managed Iceberg tables for analytics workload
- AWS Lake Formation:
- FGAC for data lakes
- Column-, row-, and cell-level security controls
- Data mesh producers and consumers:
- Producers: Create and serve domain-specific data products
- Consumers: Access and integrate data products
- Enables self-service data consumption
To demonstrate how you can use Lake Formation to implement cross-account FGAC within an EMR on EKS environment, we create tables in the AWS Glue Data Catalog in a central AWS account acting as producer and provision different user personas to reflect various roles and access levels in a separate AWS account acting as multiple consumers. Consumers can be spread across multiple accounts in real-world scenarios.
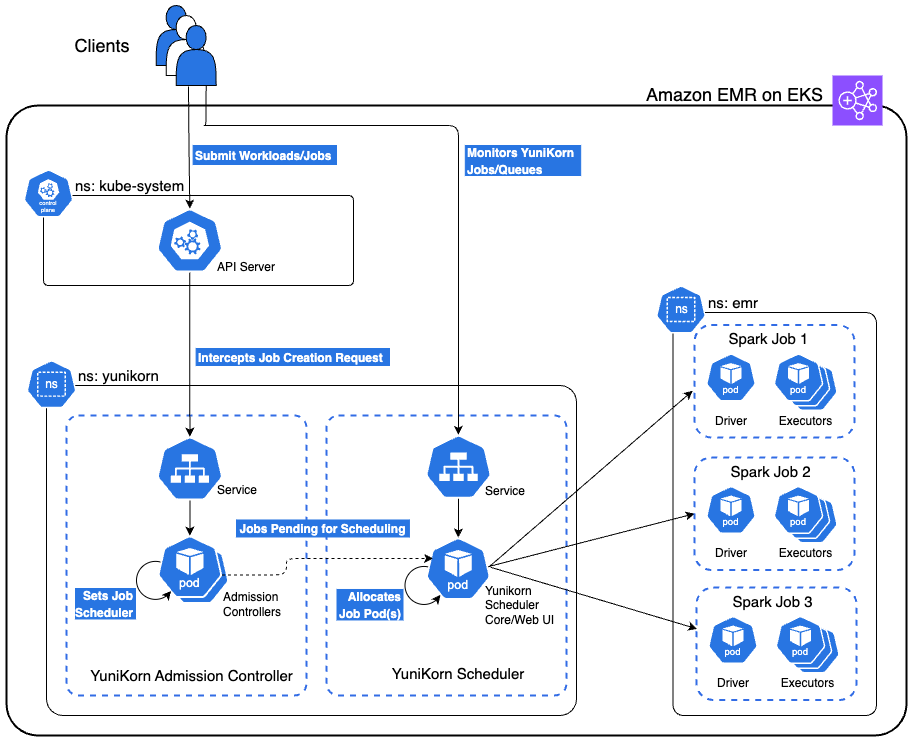
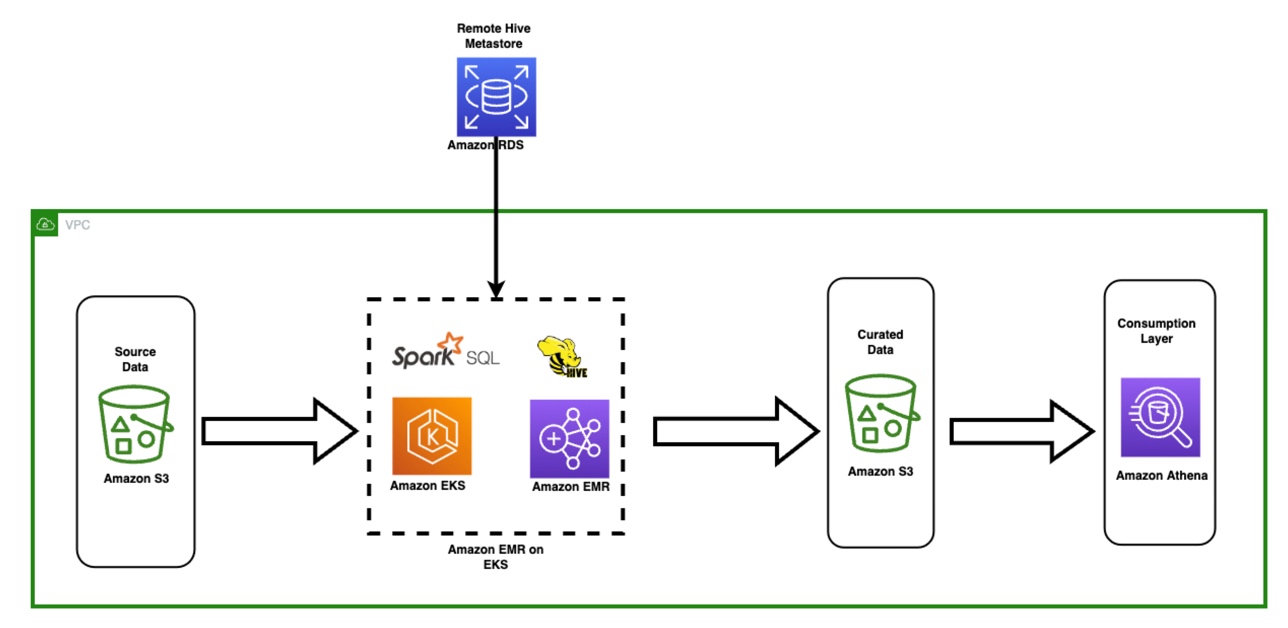
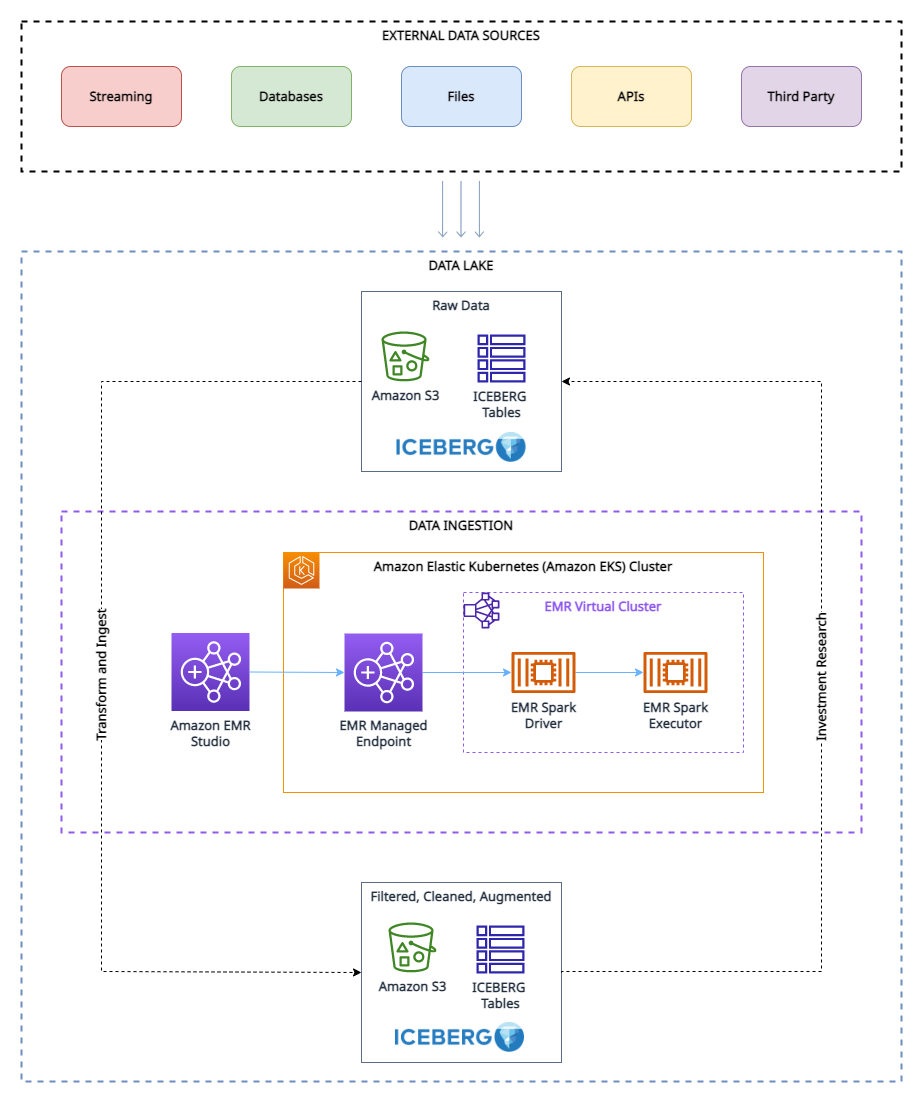
The following diagram illustrates the high-level solution architecture.
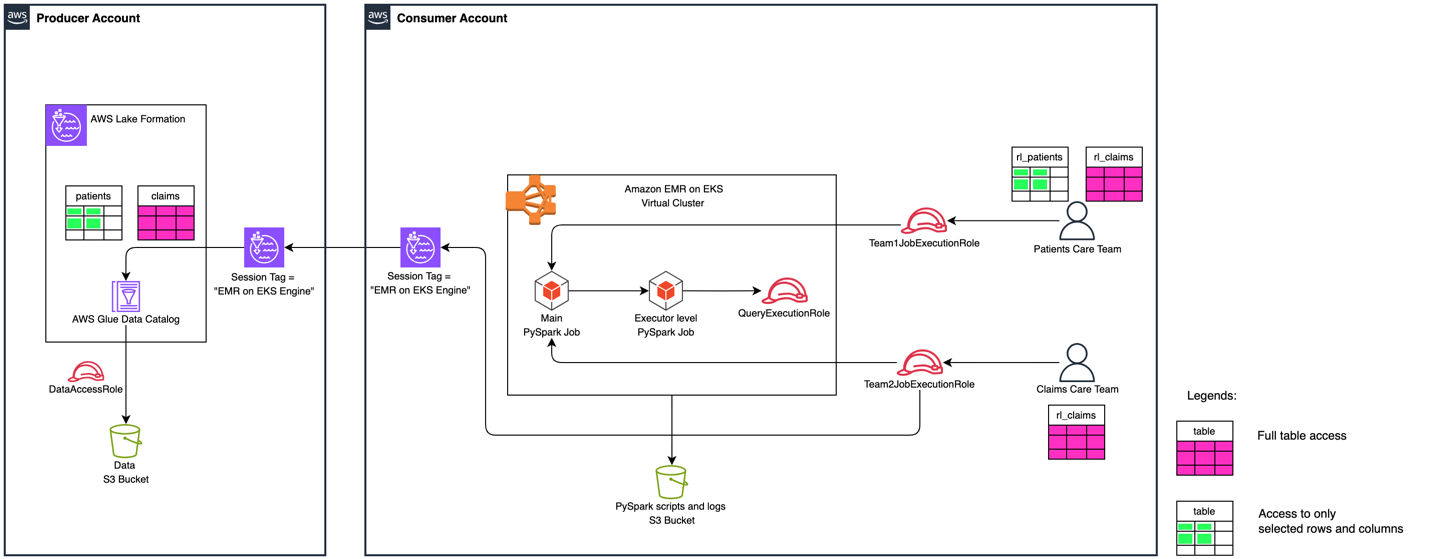
Figure 1: High Level Solution Architecture
To demonstrate the cross-account data sharing and data filtering with Lake Formation FGAC, the solution deploys two different Iceberg tables with varied access for different consumers. The permission mapping for consumers are with cross-account table shares and data cell filters.
It has two different teams with different levels of Lake Formation permissions to access Patients and Claims Iceberg tables. The following table summarizes the solution’s user personas.
| Persona/Table Name | Patients | Claims |
|
Patients Care Team ( |
|
Full table access |
|
Claims Care Team ( |
No access | Full table access |
Prerequisites
This solution requires an AWS account with an AWS Identity and Access Management (IAM) power user role that can create and interact with AWS services, including Amazon EMR, Amazon EKS, AWS Glue, Lake Formation, and Amazon Simple Storage Service (Amazon S3). Additional specific requirements for each account are detailed in the relevant sections.
Clone the project
To get started, download the project either to your computer or the AWS CloudShell console:
Set up infrastructure in producer account
To set up the infrastructure in the producer account, you must have the following additional resources:
- The latest release version of the AWS Command Line Interface (AWS CLI)
- The latest release version of the Amazon EKS CLI (eksctl)
- An IAM role that’s a Lake Formation administrator to run the
producer_iceberg_datalake_setup.shscript - An S3 bucket to store Amazon Athena query results
- A resource policy in the Data Catalog settings to allow cross-account permission grants
The setup script deploys the following infrastructure:
- An S3 bucket to store sample data in Iceberg table format, registered as a data location in Lake Formation
- An AWS Glue database named
healthcare_db - Two AWS Glue tables:
PatientsandClaimsIceberg tables - A Lake Formation data access IAM role
- Cross-account permissions enabled for the consumer account:
- Allow the consumer to describe the database
healthcare_dbin the producer account - Allow to access the
Patientstable using a data cell filter, based on row-level selectedstate, and exclude columnssn - Allow full table access to the
Claimstable
- Allow the consumer to describe the database
Run the following producer_iceberg_datalake_setup.sh script to create a development environment in the producer account. Update its parameters according to your requirements:
Enable cross-account Lake Formation access in producer account
A consumer account ID and an EMR on EKS Engine session tag must set in the producer’s environment. It allows the consumer to access the producer’s AWS Glue tables governed by Lake Formation. Complete the following steps to enable cross-account access:
- Open the Lake Formation console in the producer account.
- Choose Application integration settings under Administration in the navigation pane.
- Select Allow external engines to filter data in Amazon S3 locations registered with Lake Formation.
- For Session tag values, enter EMR on EKS Engine.
- For AWS account IDs, enter your consumer account ID.
- Choose Save.

Figure 2: Producer Account – Lake Formation third-party engine configuration screen with session tags, account IDs, and data access permissions.
Validate FGAC setup in producer environment
To validate the FGAC setup in the producer account, check the Iceberg tables, data filter, and FGAC permission settings.
Iceberg tables
Two AWS Glue tables in Iceberg format were created by producer_iceberg_datalake_setup.sh. On the Lake Formation console, choose Tables under Data Catalog in the navigation pane to see the tables listed.
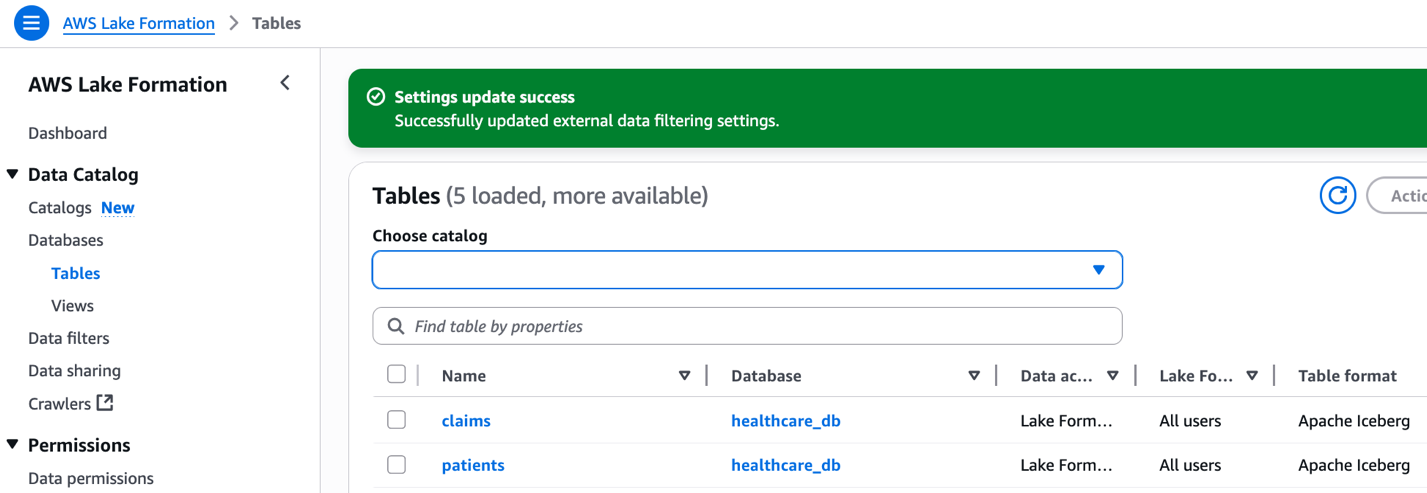
Figure 3: Lake Formation interface displaying claims and patients tables from healthcare_db with Apache Iceberg format.
The following screenshot shows an example of the patients table data.
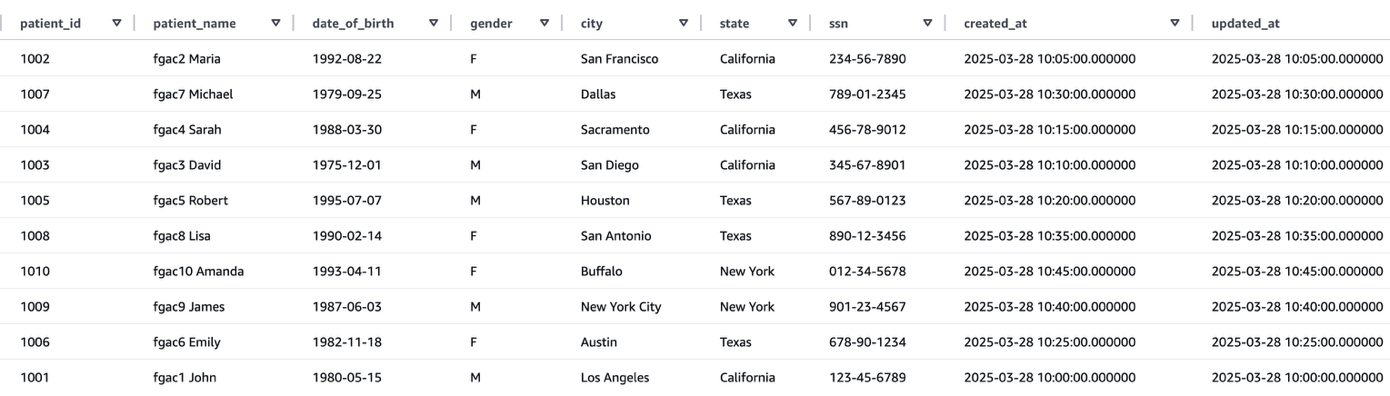
Figure 4: Patients table data
The following screenshot shows an example of the claims table data.
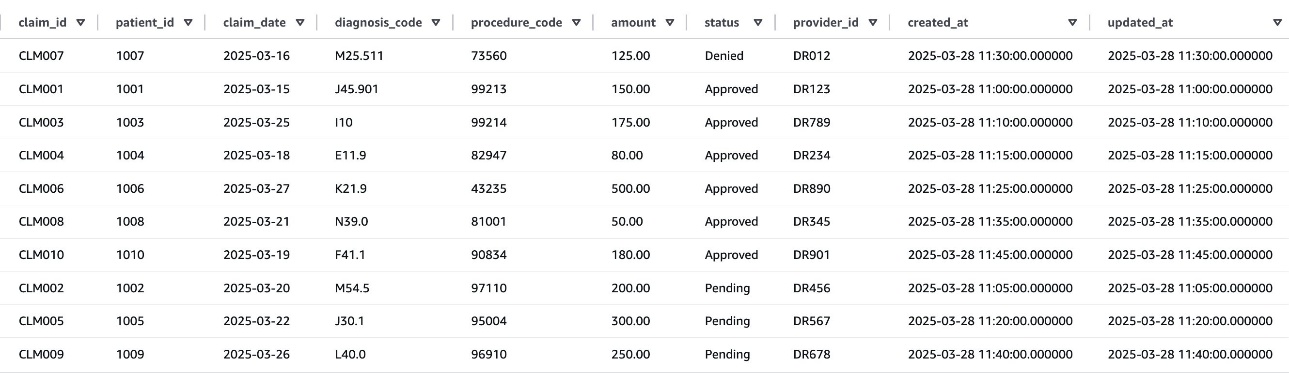
Figure 5: Claims table data
Data cell filter against patients table
After successfully running the producer_iceberg_datalake_setup.sh script, a new data cell filter named patients_column_row_filter was created in Lake Formation. This filter performs two functions:
- Exclude the
ssncolumn from thepatientstable data - Include rows where the state is Texas or New York
To view the data cell filter, choose Data filters under Data Catalog in the navigation pane of the Lake Formation console, and open the filter. Choose View permission to view the permission details.
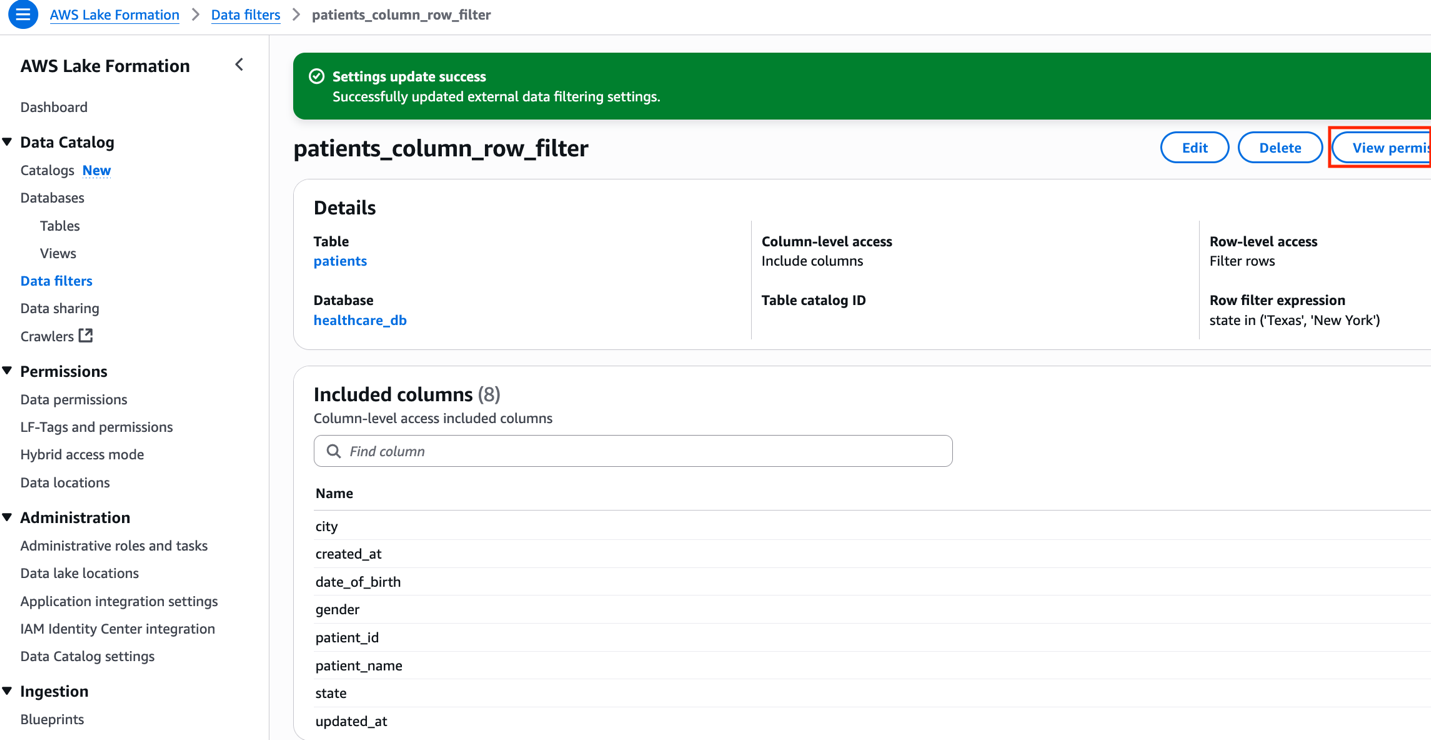
Figure 6: Column and Row level filter configuration for patients table
FGAC permissions allowing cross-account access
To view all the FGAC permissions, choose Data permissions under Permissions in the navigation pane of the Lake Formation console, and filter by the database name healthcare_db.
Make sure to revoke data permissions with the IAMAllowedPrincipals principal associated to the healthcare_db tables, because it will cause cross-account data sharing to fail, particularly with AWS Resource Access Manager (AWS RAM).
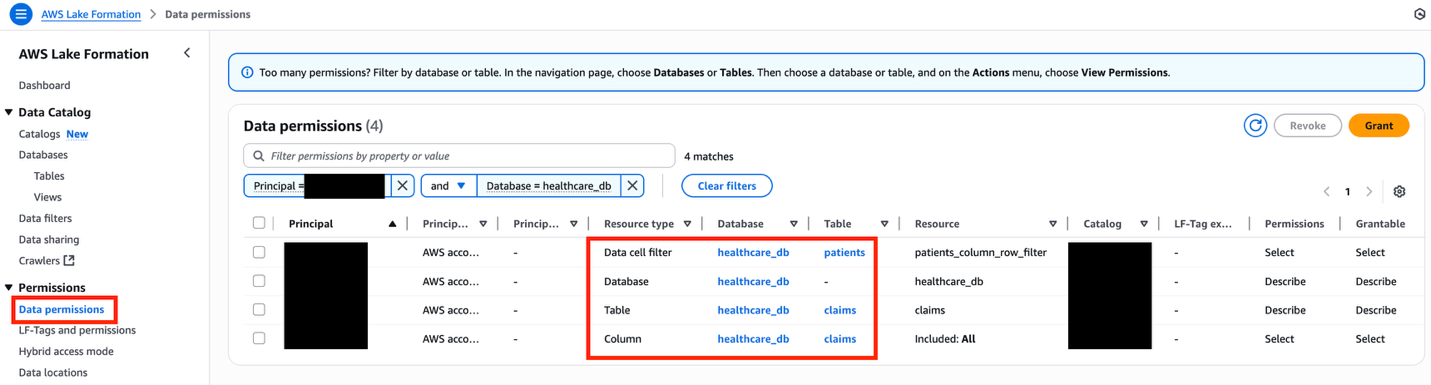
Figure 7: Lake Formation data permissions interface displaying filtered healthcare database resources with granular access controls
The following table summarizes the overall FGAC setup.
| Resource Type | Resource | Permissions | Grant Permissions |
| Database | Describe | Describe | |
| Data Cell Filter | Select | Select | |
| Table | Select, Describe | Select, Describe |
Set up infrastructure in consumer account
To set up the infrastructure in the consumer account, you must have the following additional resources:
- eksctl and kubectl packages must be installed
- An IAM role in the consumer account must be a Lake Formation administrator to run
consumer_emr_on_eks_setup.shscript - The Lake Formation admin must accept the AWS RAM resource share invites using the AWS RAM console, if the consumer account is outside of the producer’s organizational unit
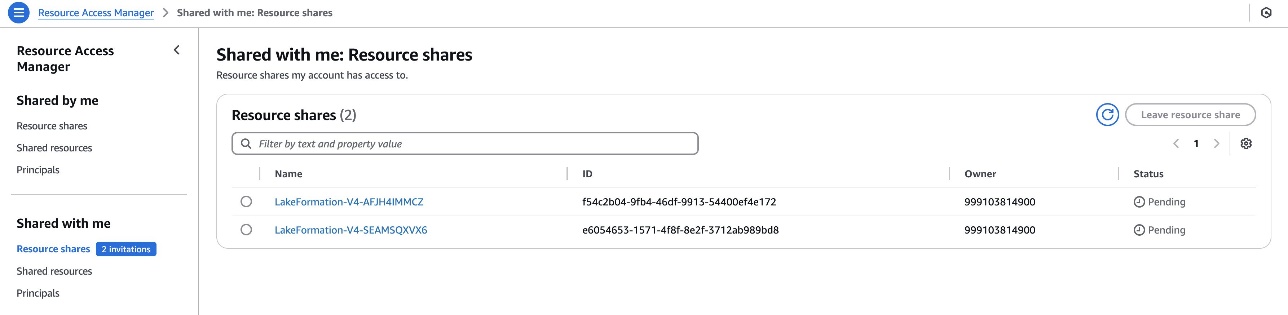
Figure 8: Consumer account – Cross-account RAM share for Lake Formation resource
The setup script deploys the following infrastructure:
- An EKS cluster called
fgac-blogwith two namespaces:- User namespace:
lf-fgac-user - System namespace:
lf-fgac-secure
- User namespace:
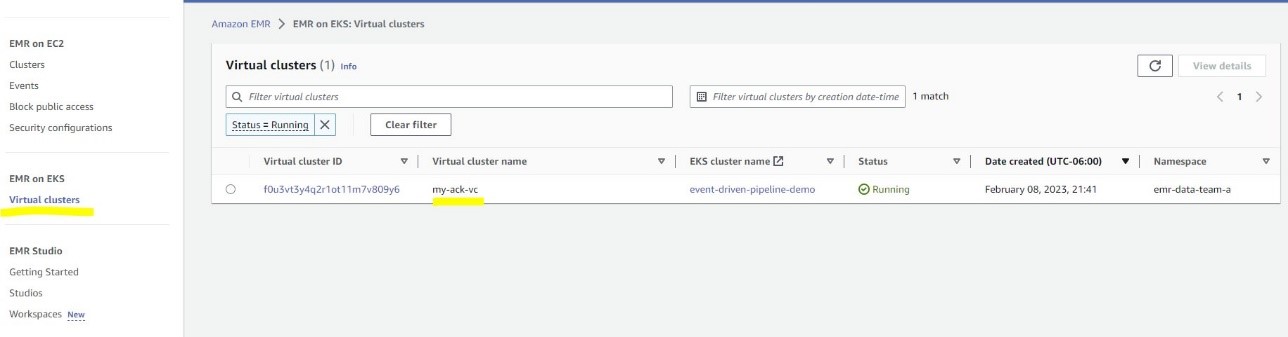
- An EMR on EKS virtual cluster
emr-on-eks-fgac-blog:- Set up with a security configuration
emr-on-eks-fgac-sec-conifg - Two EMR on EKS job execution IAM roles:
- Role for the Patients Care Team (
team1):emr_on_eks_fgac_job_team1_execution_role - Role for Claims Care Team (
team2):emr_on_eks_fgac_job_team2_execution_role
- Role for the Patients Care Team (
- A query engine IAM role used by FGAC secure space:
emr_on_eks_fgac_query_execution_role
- Set up with a security configuration
- An S3 bucket to store PySpark job scripts and logs
- An AWS Glue local database named
consumer_healthcare_db - Two resource links to cross-account shared AWS Glue tables:
rl_patientsandrl_claims - Lake Formation permission on Amazon EMR IAM roles
Run the following consumer_emr_on_eks_setup.sh script to set up a development environment in the consumer account. Update the parameters according to your use case:
Enable cross-account Lake Formation access in consumer account
The consumer account must add the consumer account ID with an EMR on EKS Engine session tag in Lake Formation. This session tag will be used by EMR on EKS job execution IAM roles to access Lake Formation tables. Complete the following steps:
- Open the Lake Formation console in the consumer account.
- Choose Application integration settings under Administration in the navigation pane.
- Select Allow external engines to filter data in Amazon S3 locations registered with Lake Formation.
- For Session tag values, enter EMR on EKS Engine.
- For AWS account IDs, enter your consumer account ID.
- Choose Save.
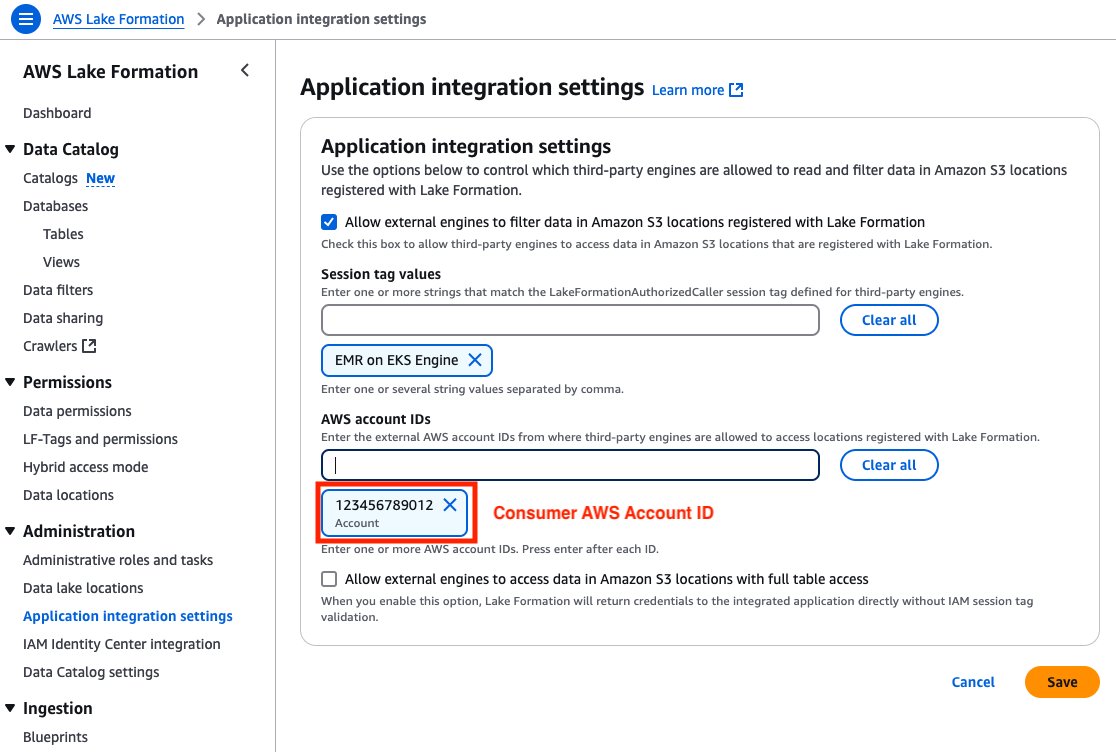
Figure 9: Consumer Account – Lake Formation third-party engine configuration screen with session tags, account IDs, and data access permissions
Validate FGAC setup in consumer environment
To validate the FGAC setup in the producer account, check the EKS cluster, namespaces, and Spark job scripts to test data permissions.
EKS cluster
On the Amazon EKS console, choose Clusters in the navigation pane and confirm the EKS cluster fgac-blog is listed.
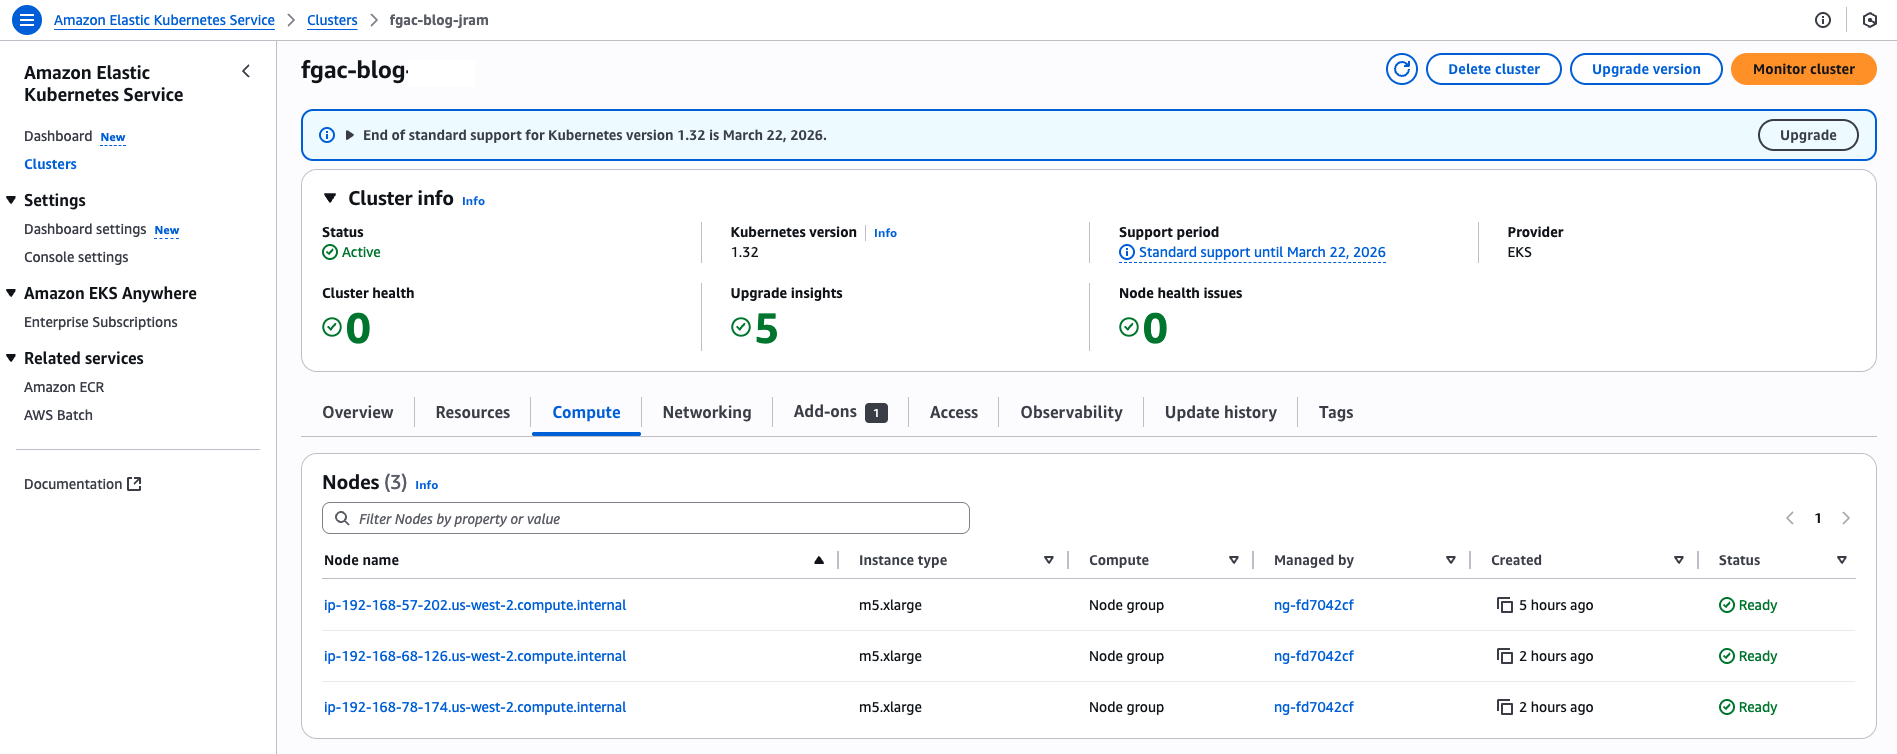
Figure 10: Consumer Account – EKS Cluster console page
Namespaces in Amazon EKS
Kubernetes uses namespaces as logical partitioning system for organizing objects such as Pods and Deployments. Namespaces also operate as a privilege boundary in the Kubernetes role-based access control (RBAC) system. Multi-tenant workloads in Amazon EKS can be secured using namespaces.
This solution creates two namespaces:
lf-fgac-userlf-fgac-secure
The StartJobRun API uses the backend workflows to submit a Spark job’s UserComponents (JobRunner, Driver, Executors) in the user namespace, and the corresponding system components in the system namespace to accomplish the desired FGAC behaviors.
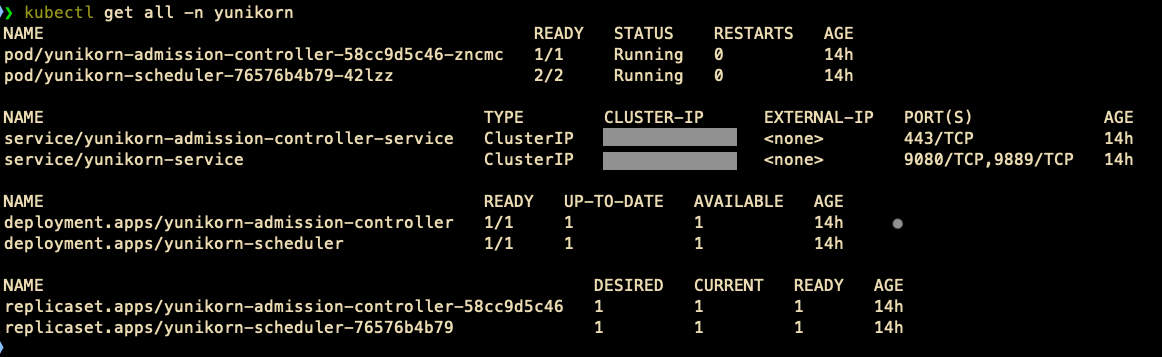
You can verify the namespaces with the following command:kubectl get namespaceThe following screenshot shows an example of the expected output.
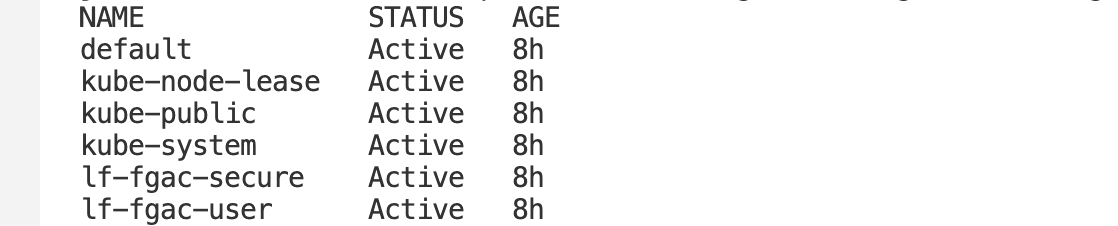
Figure 11: EKS Cluster namespaces
Spark job script to test Patients Care Team’s data permissions
Starting with Amazon EMR version 6.6.0, you can use Spark on EMR on EKS with the Iceberg table format. For more information on how Iceberg works in an immutable data lake, see Build a high-performance, ACID compliant, evolving data lake using Apache Iceberg on Amazon EMR.
The following script is a snippet of the PySpark job that retrieves filtered data for the Claims and Patient tables:
Spark job script to test Claims Care Team’s data permissions
The following script is a snippet of the PySpark job that retrieves data from the Claims table:
Validate job execution roles for EMR on EKS
The Patients Care Team uses the emr_on_eks_fgac_job_team1_execution_role IAM role to execute a PySpark job on EMR on EKS. The job execution role has permission to query both the Patients and Claims tables.
The Claims Care Team uses the emr_on_eks_fgac_job_team2_execution_role IAM role to execute jobs on EMR on EKS. The job execution role only has permission to access Claims data.
Both IAM job execution roles have the following permissions:
The following code is the job execution IAM role trust policy:
The following code is the query engine IAM role policy (emr_on_eks_fgac_query_execution_role-policy):
The following code is the query engine IAM role trust policy:
Run PySpark jobs on EMR on EKS with FGAC
For more details about how to work with Iceberg tables in EMR on EKS jobs, refer to Using Apache Iceberg with Amazon EMR on EKS. Complete the following steps to run the PySpark jobs on EMR on EKS with FGAC:
- Run the following commands to run the patients and claims jobs:
- Watch the application logs from the Spark driver pod:
kubectl logs drive-pod-name -c spark-kubernetes-driver -n lf-fgac-user -f
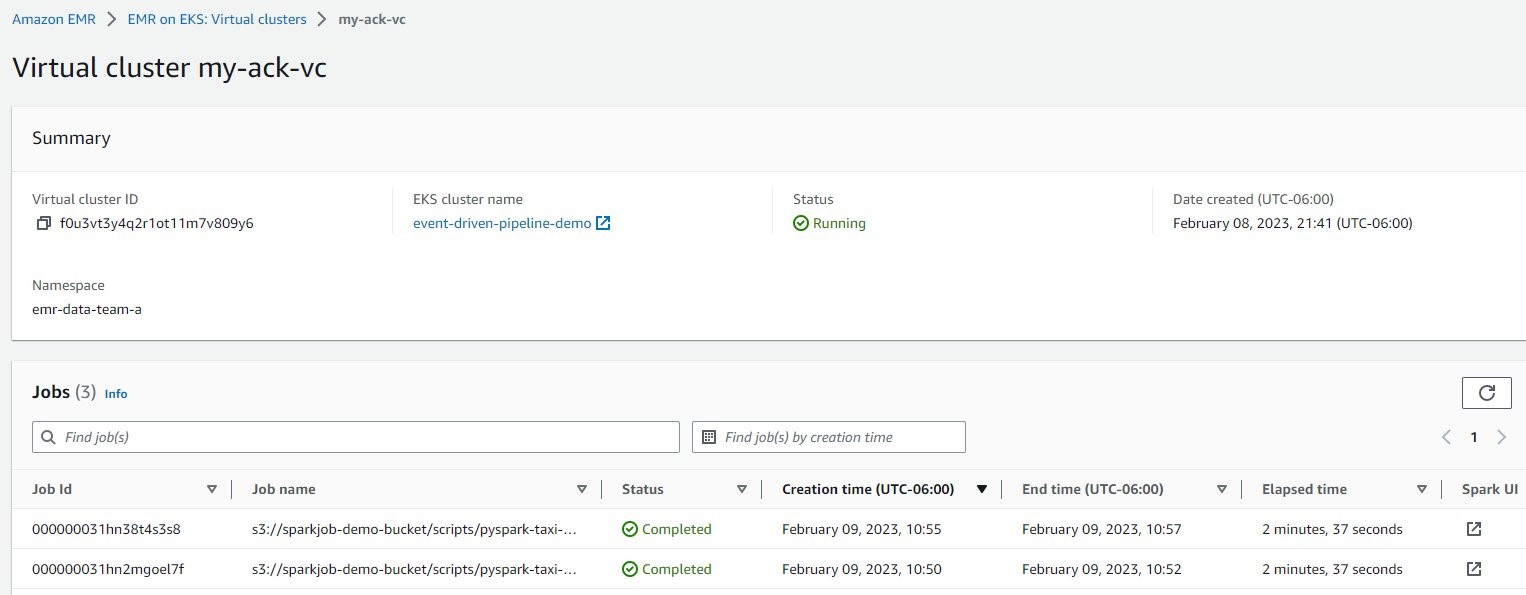
Alternatively, you can navigate to the Amazon EMR console, open your virtual cluster, and choose the open icon next to the job to open the Spark UI and monitor the job progress.
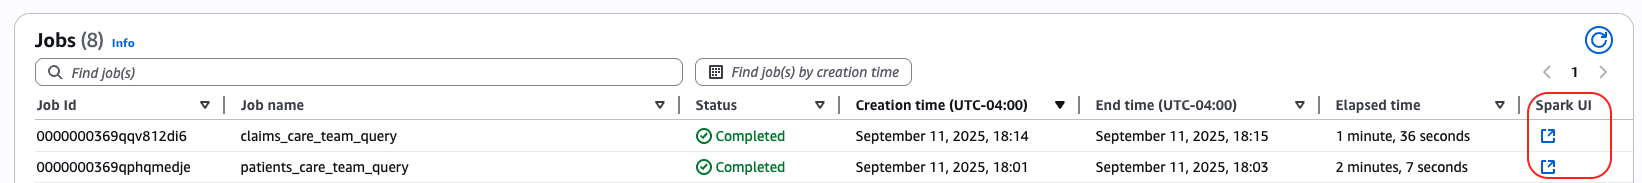
Figure 12: EMR on EKS job runs
View PySpark jobs output on EMR on EKS with FGAC
In Amazon S3, navigate to the Spark output logs folder:
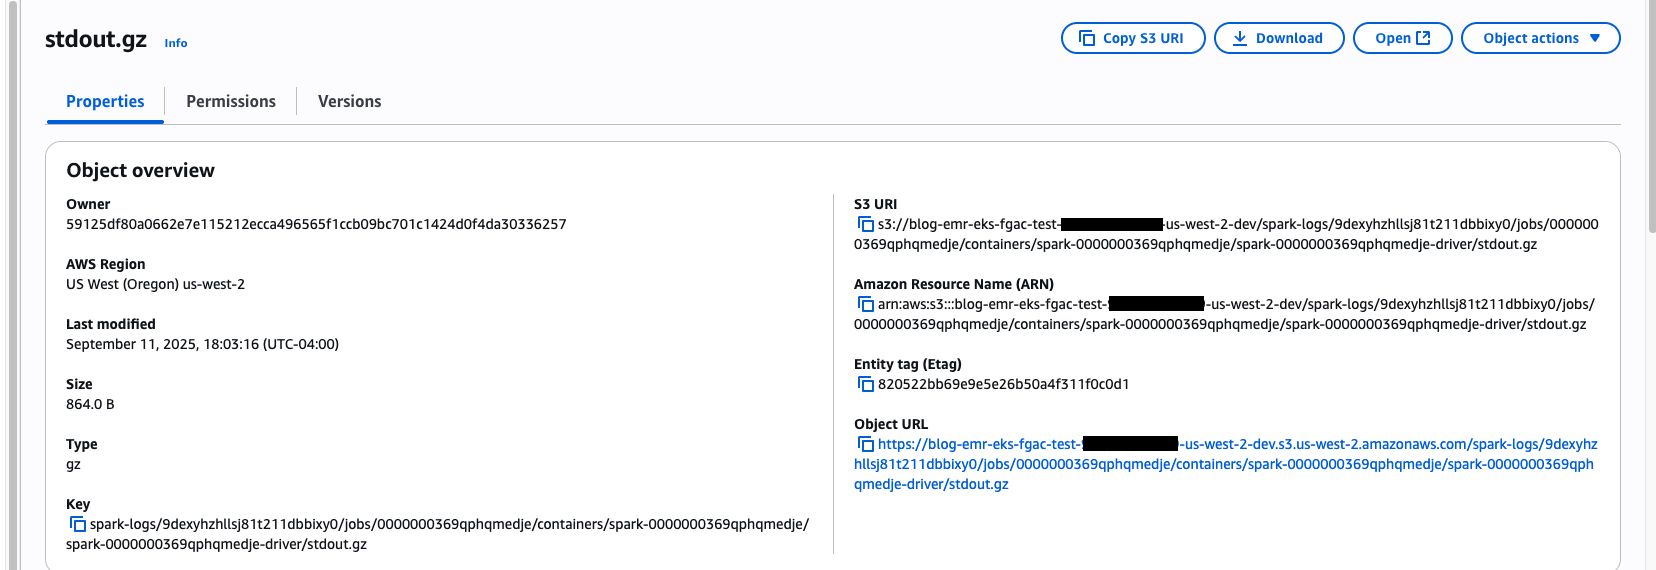
Figure 13: EMR on EKS job’s stdout.gz location on S3 Bucket
The Patients Care Team PySpark job has query access to the Patients and Claims tables. The Patients table has filtered out the SSN column and only shows records for Texas and New York claim records, as specified in our FGAC setup.
The following screenshot shows the Claims table for only Texas and New York.
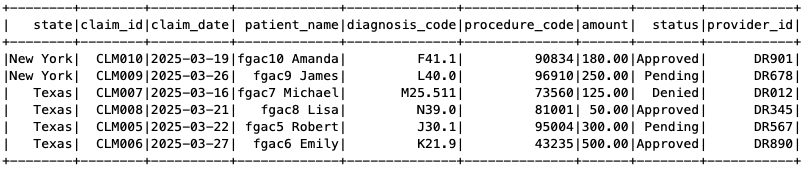
Figure 14: EMR on EKS Spark job output
The following screenshot shows the Patients table without the SSN column.
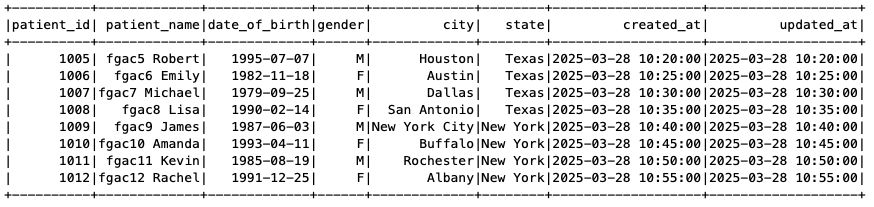
Figure 15: EMR on EKS Spark job output
Similarly, navigate to the Spark output log folder for the Claims Care Team job:
As shown in the following screenshot, the Claims Care Team only has access to the Claims table, so when the job tried to access the Patients table, it received an access denied error.
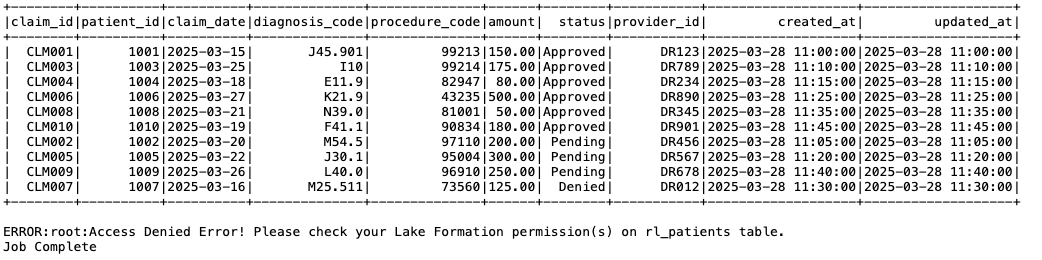
Figure 16: EMR on EKS Spark job output
Considerations and limitations
Although the approach discussed in this post provides valuable insights and practical implementation strategies, it’s important to recognize the key considerations and limitations before you start using this feature. To learn more about using EMR on EKS with Lake Formation, refer to How Amazon EMR on EKS works with AWS Lake Formation.
Clean up
To avoid incurring future charges, delete the resources generated if you don’t need the solution anymore. Run the following cleanup scripts (change the AWS Region if necessary).Run the following script in the consumer account:
Run the following script in the producer account:
Conclusion
In this post, we demonstrated how to integrate Lake Formation with EMR on EKS to implement fine-grained access control on Iceberg tables. This integration offers organizations a modern approach to enforcing detailed data permissions within a multi-account open data lake environment. By centralizing data management in a primary account and carefully regulating user access in secondary accounts, this strategy can simplify governance and enhance security.
For more information about Amazon EMR 7.7 in reference to EMR on EKS, see Amazon EMR on EKS 7.7.0 releases. To learn more about using Lake Formation with EMR on EKS, see Enable Lake Formation with Amazon EMR on EKS.
We encourage you to explore this solution for your specific use cases and share your feedback and questions in the comments section.
 Suvojit Dasgupta is a Principal Data Architect at Amazon Web Services. He leads a team of skilled engineers in designing and building scalable data solutions for diverse customers. He specializes in developing and implementing innovative data architectures to address complex business challenges.
 Peter Manastyrny is a Senior Product Manager at AWS Analytics. He leads Amazon EMR on EKS, a product that makes it straightforward and efficient to run open-source data analytics frameworks such as Spark on Amazon EKS.
 Matt Poland is a Senior Cloud Infrastructure Architect at Amazon Web Services. He is passionate about solving complex problems and delivering well-structured solutions for diverse customers. His expertise spans across a range of cloud technologies, providing scalable and reliable infrastructure tailored to each project’s unique challenges.
 Gregory Fina is a Principal Startup Solutions Architect for Generative AI at Amazon Web Services, where he empowers startups to accelerate innovation through cloud adoption. He specializes in application modernization, with a strong focus on serverless architectures, containers, and scalable data storage solutions. He is passionate about using generative AI tools to orchestrate and optimize large-scale Kubernetes deployments, as well as advancing GitOps and DevOps practices for high-velocity teams. Outside of his customer-facing role, Greg actively contributes to open source projects, especially those related to Backstage.


 Sri Potluri is a Cloud Infrastructure Architect at AWS. He is passionate about solving complex problems and delivering well-structured solutions for diverse customers. His expertise spans across a range of cloud technologies, providing scalable and reliable infrastructures tailored to each project’s unique challenges.
 Suvojit Dasgupta is a Principal Data Architect at AWS. He leads a team of skilled engineers in designing and building scalable data solutions for AWS customers. He specializes in developing and implementing innovative data architectures to address complex business challenges.


 Avinash Desireddy is a Cloud Infrastructure Architect at AWS, passionate about building secure applications and data platforms. He has extensive experience in Kubernetes, DevOps, and enterprise architecture, helping customers containerize applications, streamline deployments, and optimize cloud-native environments.
 Suvojit Dasgupta is a Principal Data Architect at AWS. He leads a team of skilled engineers in designing and building scalable data solutions for AWS customers. He specializes in developing and implementing innovative data architectures to address complex business challenges.


 Guy Bachar is a Senior Solutions Architect at AWS based in New York. He specializes in assisting capital markets customers with their cloud transformation journeys. His expertise encompasses identity management, security, and unified communication.
 Sercan Karaoglu is Senior Solutions Architect, specialized in capital markets. He is a former data engineer and passionate about quantitative investment research.
 Boris Litvin is a Principal Solutions Architect at AWS. His job is in financial services industry innovation. Boris joined AWS from the industry, most recently Goldman Sachs, where he held a variety of quantitative roles across equity, FX, and interest rates, and was CEO and Founder of a quantitative trading FinTech startup.
 Salim Tutuncu is a Senior Partner Solutions Architect Specialist on Data & AI, based in Dubai with a focus on the EMEA. With a background in the technology sector that spans roles as a data engineer, data scientist, and machine learning engineer, Salim has built a formidable expertise in navigating the complex landscape of data and artificial intelligence. His current role involves working closely with partners to develop long-term, profitable businesses using the AWS platform, particularly in data and AI use cases.
 Alex Tarasov is a Senior Solutions Architect working with Fintech startup customers, helping them to design and run their data workloads on AWS. He is a former data engineer and is passionate about all things data and machine learning.
 Jiwan Panjiker is a Solutions Architect at Amazon Web Services, based in the Greater New York City area. He works with AWS enterprise customers, helping them in their cloud journey to solve complex business problems by making effective use of AWS services. Outside of work, he likes spending time with his friends and family, going for long drives, and exploring local cuisine.


 Umair Nawaz is a Senior DevOps Architect at Amazon Web Services. He works on building secure architectures and advises enterprises on agile software delivery. He is motivated to solve problems strategically by utilizing modern technologies.
 Ravikiran Rao is a Data Architect at Amazon Web Services and is passionate about solving complex data challenges for various customers. Outside of work, he is a theater enthusiast and amateur tennis player.
 Sri Potluri is a Cloud Infrastructure Architect at Amazon Web Services. He is passionate about solving complex problems and delivering well-structured solutions for diverse customers. His expertise spans across a range of cloud technologies, ensuring scalable and reliable infrastructure tailored to each project’s unique challenges.
 Suvojit Dasgupta is a Principal Data Architect at Amazon Web Services. He leads a team of skilled engineers in designing and building scalable data solutions for AWS customers. He specializes in developing and implementing innovative data architectures to address complex business challenges.
 Kinnar Kumar Sen is a Sr. Solutions Architect at Amazon Web Services (AWS) focusing on Flexible Compute. As a part of the EC2 Flexible Compute team, he works with customers to guide them to the most elastic and efficient compute options that are suitable for their workload running on AWS. Kinnar has more than 15 years of industry experience working in research, consultancy, engineering, and architecture.
 Alex Lines is a Principal Containers Specialist at AWS helping customers modernize their Data and ML applications on Amazon EKS.
 Mengfei Wang is a Software Development Engineer specializing in building large-scale, robust software infrastructure to support big data demands on containers and Kubernetes within the EMR on EKS team. Beyond work, Mengfei is an enthusiastic snowboarder and a passionate home cook.
 Jerry Zhang is a Software Development Manager in AWS EMR on EKS. His team focuses on helping AWS customers to solve their business problems using cutting-edge data analytics technology on AWS infrastructure.


 Amit Maindola is a Senior Data Architect focused on big data and analytics at Amazon Web Services. He helps customers in their digital transformation journey and enables them to build highly scalable, robust, and secure cloud-based analytical solutions on AWS to gain timely insights and make critical business decisions.


 Boris Litvin is Principal Solution Architect, responsible for financial services industry innovation. He is a former Quant and FinTech founder, and is passionate about systematic investing.
 Noam Ouaknine is a Technical Account Manager at AWS, and is based in Florida. He helps enterprise customers develop and achieve their long-term strategy through technical guidance and proactive planning.
 Sercan Karaoglu is Senior Solutions Architect, specialized in capital markets. He is a former data engineer and passionate about quantitative investment research.
 Jack Ye is a software engineer in the Athena Data Lake and Storage team. He is an Apache Iceberg Committer and PMC member.
 Amogh Jahagirdar is a Software Engineer in the Athena Data Lake team. He is an Apache Iceberg Committer.
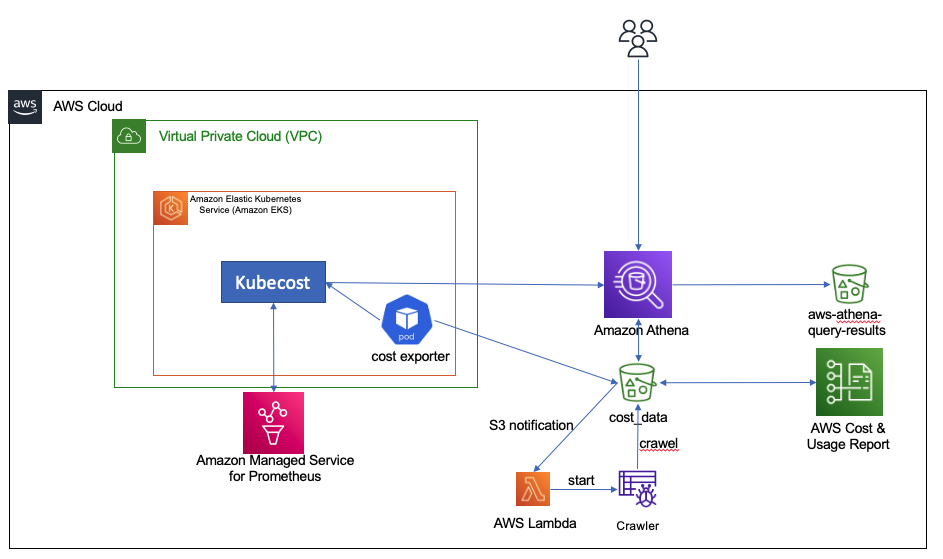


 Lotfi Mouhib is a Senior Solutions Architect working for the Public Sector team with Amazon Web Services. He helps public sector customers across EMEA realize their ideas, build new services, and innovate for citizens. In his spare time, Lotfi enjoys cycling and running.
 Hamza Mimi Principal Solutions Architect in the French Public sector team at Amazon Web Services (AWS). With a long experience in the telecommunications industry. He is currently working as a customer advisor on topics ranging from digital transformation to architectural guidance.
 Vara Bonthu is a dedicated technology professional and Worldwide Tech Leader for Data on EKS, specializing in assisting AWS customers ranging from strategic accounts to diverse organizations. He is passionate about open-source technologies, data analytics, AI/ML, and Kubernetes, and boasts an extensive background in development, DevOps, and architecture. Vara’s primary focus is on building highly scalable data and AI/ML solutions on Kubernetes platforms, helping customers harness the full potential of cutting-edge technology for their data-driven pursuits.


 Ashok Chintalapati is a software development engineer for Amazon EMR at Amazon Web Services.


 Victor Gu is a Containers and Serverless Architect at AWS. He works with AWS customers to design microservices and cloud native solutions using Amazon EKS/ECS and AWS serverless services. His specialties are Kubernetes, Spark on Kubernetes, MLOps and DevOps.
 Michael Gasch is a Senior Product Manager for AWS EventBridge, driving innovations in event-driven architectures. Prior to AWS, Michael was a Staff Engineer at the VMware Office of the CTO, working on open-source projects, such as Kubernetes and Knative, and related distributed systems research.
 Peter Dalbhanjan is a Solutions Architect for AWS based in Herndon, VA. Peter has a keen interest in evangelizing AWS solutions and has written multiple blog posts that focus on simplifying complex use cases. At AWS, Peter helps with designing and architecting variety of customer workloads.


 Nan Zhu is the engineering lead of the platform team in SafeGraph. He leads the team to build a broad range of infrastructure and internal toolings to improve the reliability, efficiency and productivity of the SafeGraph engineering process, e.g. internal Spark ecosystem, metrics store and CI/CD for large mono repos, etc. He is also involved in multiple open source projects like Apache Spark, Apache Iceberg, Gluten, etc.
 Dave Thibault is a Sr. Solutions Architect serving AWS’s independent software vendor (ISV) customers. He’s passionate about building with serverless technologies, machine learning, and accelerating his AWS customers’ business success. Prior to joining AWS, Dave spent 17 years in life sciences companies doing IT and informatics for research, development, and clinical manufacturing groups. He also enjoys snowboarding, plein air oil painting, and spending time with his family.