Post Syndicated from Mark Paulsen original https://github.blog/2023-02-24-3-ways-to-meet-compliance-needs-without-slowing-down-agility/
In the previous blog, Setting the foundations for compliance, we set the groundwork for developer-enabled compliance that will keep your teams happy, in the flow, secure, compliant, and auditable.
Today, we’ll walk through three practical ways that you can start meeting your compliance requirements without having to revolutionize or transform the culture in your company—all while enabling your developers to be more productive and happy.
1. Do the basics well and often
The first way to start meeting your compliance requirements is often overlooked because it’s so simple. No matter what industry you are in, whether it’s finance, automotive, government, or tech, there are some basic quick compliance wins that may be part of your existing developer workflows and culture.
Code review
A key part of writing clean code is code review. But having a repeatable and traceable code review process is also a foundational component of your compliance program. This ensures risks within software delivery are found and mitigated early—and are also auditable for future reviews.
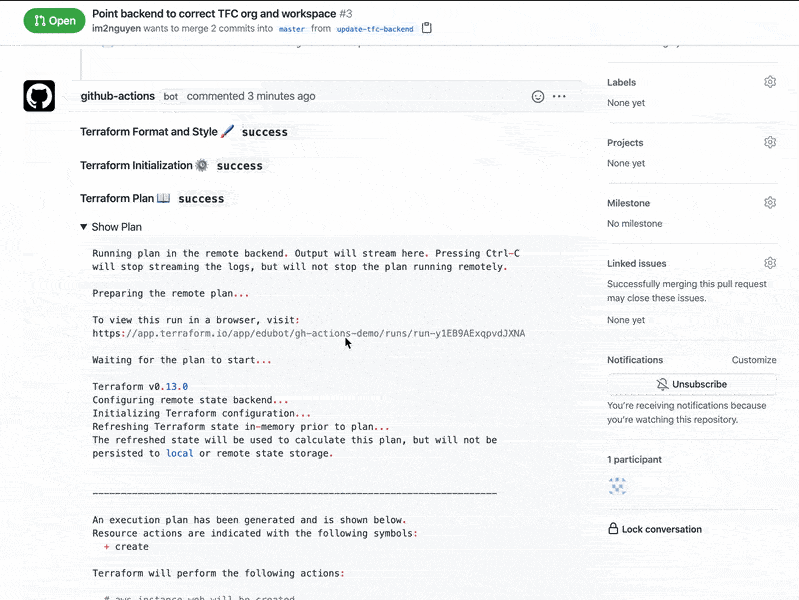
GitHub makes code review easy, since pull requests are part of the existing workflow that millions of developers use every day. GitHub also makes it easy for compliance testers and auditors to review pull requests with access to immutable audit logs in a central location.
Separation of duties
In some enterprises, separation of duties has been defined as a person having too much manual control over transactions or processes. This can lead to apprehension when modern cloud native practices are introduced.
Thankfully, there is guidance from the Industry that supports a more modern approach to separation of duties. The PCI-DSS requirements guide avoids the term person and provides a more cloud native friendly approach by focusing on functions and accounts:
“The purpose of this requirement is to separate the development and test functions from the production functions. For example, a developer can use an administrator-level account with elevated privileges in the development environment and have a separate account with user-level access to the production environment.”
This approach aligns well with the 12 factor application methodology for cloud native. The Build, release, run factor explanation states, “Each release must enforce a strict separation across the build, release, and run stages. Each should be tagged with a unique ID and support the ability to roll back.” Teams can fully automate their delivery to production, without having to worry about a person manually exceeding too much control, as long as there is separation of functions and traceability back to unique IDs. With the added assurance that they are aligned to industry best practices and requirements, such as PCI-DSS.
To enable separation of duties, you have to have a clear identity and access management strategy. Thankfully, we don’t have to reinvent the wheel. GitHub Enterprise has several options to help you manage access to your overall development environment:
- You can configure SAML single sign-on for your enterprise. This is an additional check, allowing you to confirm the authenticity of your users against your own identity provider (while still using your own GitHub account).
- You can then synchronize team memberships with groups in your identity provider. As a result, group membership changes in your identity provider update the team membership (and therefore associated access) in GitHub.
- Alternatively, you could adopt GitHub Enterprise Managed Users (EMUs). This is a flavor of GitHub Enterprise where you can only log in with an account that is centrally managed through your identity provider. The user does not have to log in to GitHub with a personal account and use single sign on to access company resources. (For more information on this, check out this blog post on exploring EMUs and the benefits they can bring.)
AI-powered compliance
In our last blog we briefly covered AI-enabled compliance and some of the existing opportunities for security, manufacturing, and banks. There are also several other opportunities on the horizon that could further optimize the basics of compliance.
It is entirely possible that a generative AI tool could soon be leveraged to help ensure that separation of duties is enforced in a declarative DevOps workflow by creating unit tests on its own. Because of the non-deterministic nature of generative AI, each time it runs it may have a different result and the unit tests may include risk scenarios that nobody has thought of yet. This can add an amazing level of true risk-based compliance.
One of the major benefits of addressing compliance often in your delivery is an increased level of trust. But quantifying trust can be extremely difficult—especially within a regulated industry that wants to leverage deep learning solutions. There is work being driven by AI results to help provide trust quantification for these types of solutions, which will not only enable continuous compliance but will also help enterprises implement new technologies that can increase business value.
Dependency management
Companies are increasing their reliance on open source software in their supply chain. As a result, optimized, repeatable, and audible controls for dependency management are becoming a cornerstone of compliance programs across industries.
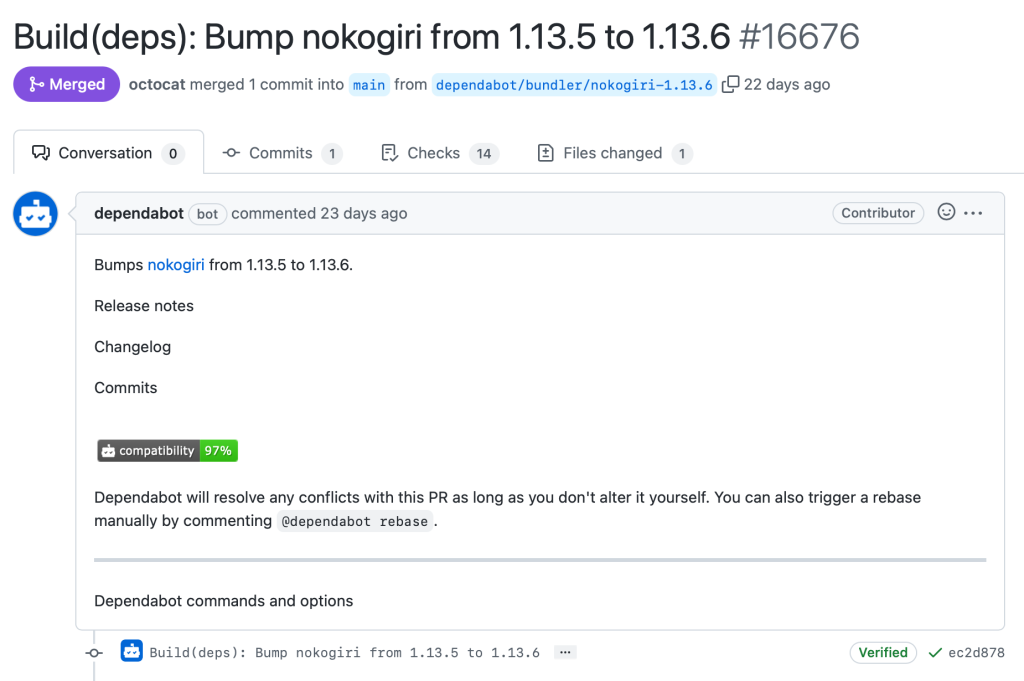
From a GitHub perspective, Dependabot can provide confidence that your supply chain is secure. When Dependabot is configured, developers are alerted as soon as a security threat is found and gives them the ability to take action in their normal workflows.
By leveraging Dependabot, you will receive an immutable and auditable alert when a repository uses a software dependency with a known vulnerability. Pull requests can be triggered by either your developers or security teams, which give you another set of auditable artifacts for future review.
Approvals
While most organizations have approval processes, they can be slow and occur too late in the process. Google explains that peer reviews can help to streamline the change approval process, based on results from the DORA 2019 state of DevOps report.
There could be many control points in your delivery pipeline that may require approval, such as sign-off of requirements, testing results, security reviews, or production operational readiness confirmations before a release.
Depending on your internal structure and alignment, you may require teams to provide sign-off at different stages throughout the process. In your build and test stage, you can use manual approvals in a pull request to gather the needed reviews.
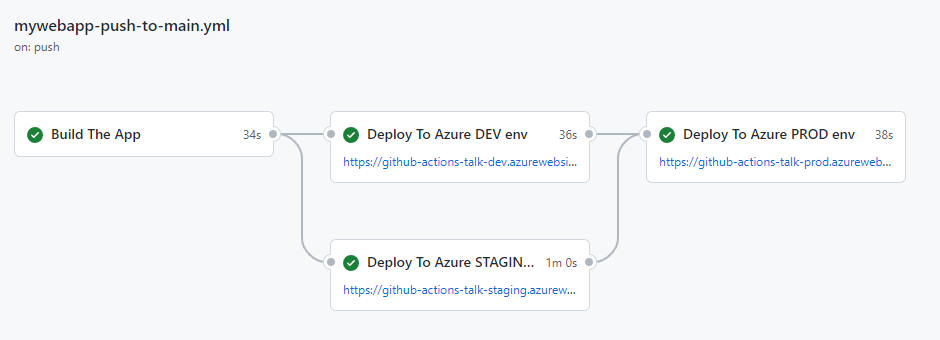
Once your builds and tests are complete, it’s time to release your code into your infrastructure. Talking about deployment patterns and strategies is beyond the scope of this post. However, you may require approvals as part of the deployment process.
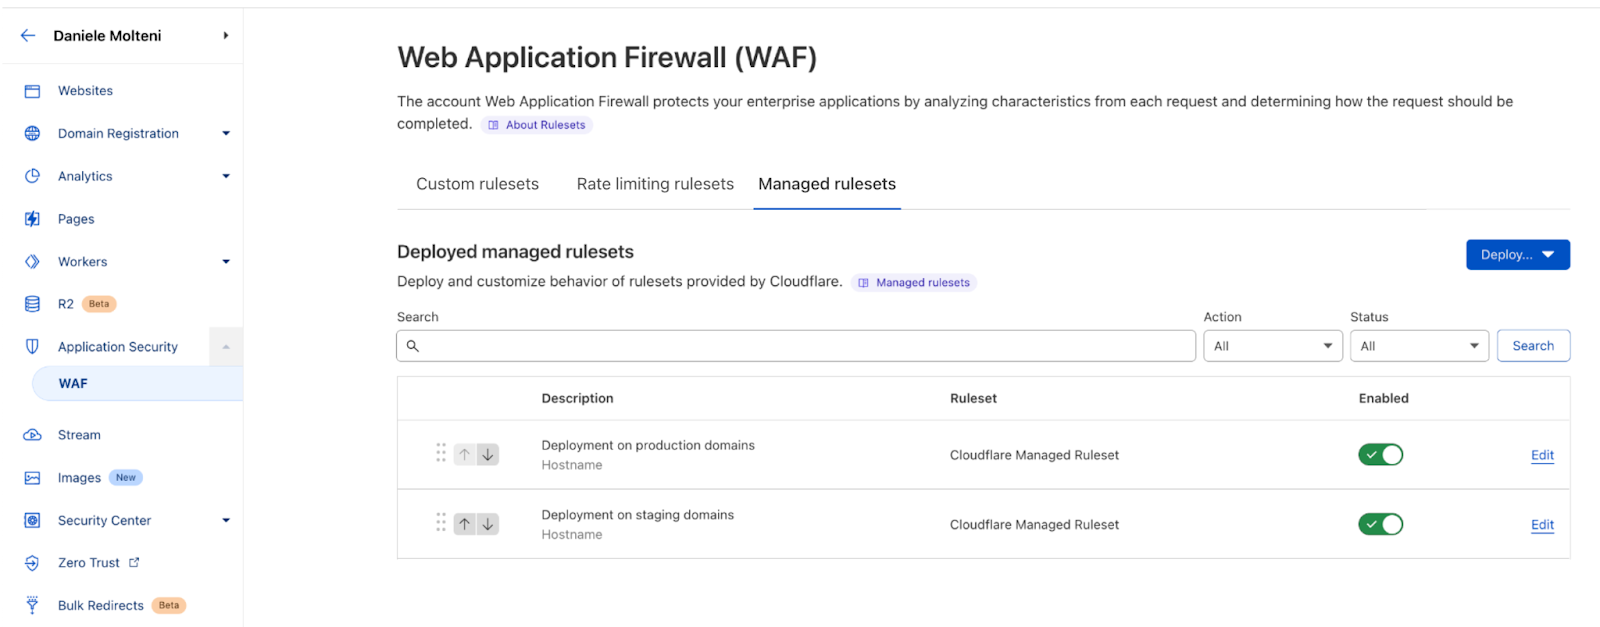
To obtain these approvals, you should use environments for your deployments. Environments are used to describe a deployment target (such as staging, testing, and production). By using environments, you can require a manual approval to take place before GitHub Actions begins the deployment job.
In both instances, remember that there is a tradeoff when deciding the number of approvals required. Setting the number of required reviews too high means that you may impact your pace of delivery, as manual intervention is required. Where possible, consider automating checks to reduce the manual overhead, thereby optimizing your overall agility.
2. Have a common understanding of concepts and terms
Again, this may be overlooked since it sounds so obvious. But there are probably many concepts and terms that developers, DevOps and cloud native practitioners use on a daily basis that may be totally incomprehensible to compliance testers and auditors.
Back in 2015, the author of The Phoenix Project, Gene Kim, and several other authors, created the DevOps Audit Defense Toolkit. As we mentioned in our first blog, the goal of this document was to “educate IT management and practitioners on the audit process so they can demonstrate to auditors they understand the business risks and are properly mitigating those risks.” But where do you start?
Below is a basic cheat-sheet of terms for GitHub related control objectives and a mapping to the world of compliance, regulations, risk, and audit. This could be a good place to start building a common understanding between developers and your compliance and audit friends.
| Objective | Control | Financial Reporting | Industry Frameworks |
| The Code Review Control ensures that security requirements have been addressed and that the code is understandable, maintainable, and properly formatted. | Pull requests let you tell others about changes you’ve pushed to a branch in a repository on GitHub.Once a pull request is opened, you can discuss and review the potential changes with collaborators and add follow-up commits before your changes are merged into the base branch. | SOX: Change Management
COSO: Control Activities—Conduct application change management. |
NIST Cyber: DE.CM-4 —Malicious code is detected.
PCI-DSS: 6.3.2: Review all custom code for vulnerabilities, manually or via automation. SLSA: Two-person review is an industry best practice for catching mistakes and deterring bad behavior. |
| Controls and processes should be in place to scan code repositories for passwords and security tokens. Prevention measures should be enforced to ensure secrets do not reach production. | Secret scanning will scan your entire Git history on all branches present in your GitHub repository for secrets. GitHub push protection will check for high-confidence secrets as developers push code and block the push if a secret is identified. | SOX: IT Security
COSO: Control Activities—Improve security |
NIST Cyber: PR.DS-5: Protections against data leaks are implemented.
PCI-DSS: 6.5.3: Protect against all insufficiently secure cryptographic key storage. |
To help bring this together, there is a great example of the benefits of a common understanding between developers and compliance testers and auditors in the latest Forrester report on the economic impact of GitHub Enterprise Cloud and Advanced Security. The report highlights one of the benefits of an automated documentation process that both helps developers and auditors:
“These new, standardized documentation structures made it easier for auditors to find and compile the documentation necessary to be compliant. This helped the interviewees’ organizations save time preparing for industry compliance and security audits.”
3. Helping developers understand where they fit into the three lines of defense
The three lines of defense is a model used for risk management and governance. It helps clarify the roles and responsibilities of teams involved in addressing risk.
Think of the engineering team and engineering leads as the first line of defense, as they continue shipping software to their end-users. Making sure this team has the appropriate level of skills to identify risk within their solution is crucial.
The second line of defense is typically achieved at scale through frameworks, policies, and tools at an organizational level. This acts as oversight for the first line of defense on how well they are implementing risk mitigation techniques and consistently measuring and defining risk across the organization.
Internal audit is the third line of defense. Just like a red team and blue team compliment each other, you can think of internal audit as the final puzzle piece in the three lines of defense. They evaluate the effectiveness of risk management and governance, working with senior management and external regulators to raise awareness of the controls being executed.
Let’s use an analogy. A hockey team is not just structured to score goals but also prevent goals being scored against them.
- Forwards: they are there to score and assist on goals. But they can be called on to work with the other positions in defense. Think of them as the first line of defense. Their job is to create solutions which provide business value, but are also secure.
- Defenders: their main role is clearly preventing goals. But they partner with the forwards on the current priority (offense or defense). They are like the second line of defense, providing risk oversight and collaborating with the engineering teams.
- Goaltender: the last line of defense. They can be thought of as the equivalent of an internal audit. They are independent of the forwards and defenders with different responsibilities, tools, and perspective.
Hockey teams that have very strong forwards but weak defenders and goalkeepers are rarely successful. Teams with a strong defense but weak offense are rarely successful, either. It takes all three aspects working in harmony to be successful.
This applies in business, too. If your solutions meet your customers’ requirements but are insecure, your business will fail. If your solutions are secure but aren’t user friendly or providing value, it will result in failure. Success is achieved by finding the right balance of value and risk management.
Developers can see that they are there to score goals for their team; creating the software that runs our world. But they need to support the defensive capabilities of the team, ensuring their software is secure. Their success is dependent on the success of the wider team, without having to take on additional responsibilities.
Next steps
We’ve taken a whistle-stop tour on how you can bring compliance into your development flow. From branch protection rules and pull requests to CODEOWNERS and environment approvals, there are several GitHub capabilities that can help you naturally focus on compliance.
This is only one step in solving the problem. A common language between compliance and DevOps practitioners is crucial in demonstrating the implemented measures. With that common language, it is clear that everyone must think about compliance; engineering teams are a part of the three lines of defense.
Next up in the series, we’ll be talking about how to ensure compliance in developer workflows.
Ready to increase developer velocity and collaboration while remaining secure and compliant? See how GitHub Enterprise can help.

 Dependencies