Welcome to the 23rd edition of Cloudflare’s Quarterly DDoS Threat Report. This report offers a comprehensive analysis of the evolving threat landscape of Distributed Denial of Service (DDoS) attacks based on data from the Cloudflare network. In this edition, we focus on the third quarter of 2025.
The third quarter of 2025 was overshadowed by the Aisuru botnet with a massive army of an estimated 1–4 million infected hosts globally. Aisuru unleashed hyper-volumetric DDoS attacks routinely exceeding 1 terabit per second (Tbps) and 1 billion packets per second (Bpps). The number of these attacks surged 54% quarter-over-quarter (QoQ), averaging 14 hyper-volumetric attacks daily. The scale was unprecedented, with attacks peaking at 29.7 Tbps and 14.1 Bpps.
Key insights
Other than Aisuru, additional key insights in this report include:
DDoS attack traffic against AI companies surged by as much as 347% MoM in September 2025, as public concern and regulatory review of AI increases.
Escalating EU-China trade tensions over rare earth minerals and EV tariffs coincide with a significant increase in DDoS attacks against the Mining, Minerals & Metals industry as well as the Automotive industry in 2025 Q3.
Overall, in the third quarter of 2025, Cloudflare’s autonomous defenses blocked a total of 8.3 million DDoS attacks. That’s an average of almost 3,780 DDoS attacks per hour. The number of DDoS attacks grew by 15% QoQ and 40% YoY.
DDoS attacks in numbers
So far in 2025, and with an entire quarter to go until the end of the year, Cloudflare has already mitigated 36.2 million DDoS attacks. That corresponds to 170% of the DDoS attacks Cloudflare mitigated throughout 2024.
In the third quarter of 2025, Cloudflare automatically detected and mitigated 8.3 million DDoS attacks, representing a 15% increase QoQ and 40% increase YoY.
Network-layer DDoS attacks, accounting for 71% of the DDoS attacks in 2025 Q3, or 5.9 million DDoS attacks, increased by 87% QoQ and 95% YoY. However, HTTP DDoS attacks, accounting only for 29% of the DDoS attacks in 2025 Q3, or 2.4 million DDoS attacks, decreased by 41% QoQ and 17% YoY.
In the third quarter of 2025, Cloudflare mitigated an average of 3,780 DDoS attacks every hour.
Aisuru breaking records with ultrasophisticated, hyper-volumetric DDoS attacks
Disruptive force
Aisuru targeted telecommunication providers, gaming companies, hosting providers, and financial services, to name a few. It has also caused “widespread collateral Internet disruption [in the US]”, as reported by Krebs on Security, simply due to the amount of botnet traffic routing through the Internet Service Providers (ISPs).
Let that sink in. If Aisuru’s attack traffic can disrupt parts of the U.S. Internet infrastructure when said ISPs were not even the target of the attack, imagine what it can do when it’s directly aimed at unprotected or insufficiently protected ISPs, critical infrastructure, healthcare services, emergency services, and military systems.
Botnet-for-hire and DDoS stats
“Chunks” of Aisuru are offered by distributors as botnets-for-hire, so anyone can potentially inflict chaos on entire nations by crippling backbone networks and saturating Internet links, disrupting millions of users and impairing access to essential services — all at a cost of a few hundred to a few thousand U.S. dollars.
Since the start of 2025, Cloudflare has already mitigated 2,867 Aisuru attacks. In the third quarter alone, Cloudflare mitigated 1,304 hyper-volumetric attacks launched by Aisuru. That represents an increase of 54% QoQ. These include the world record-breaking 29.7 Tbps DDoS attack and the 14.1 Bpps DDoS attack.
The 29.7 Tbps was a UDP carpet-bombing attack bombarding an average of 15K destination ports per second. The distributed attack randomized various packet attributes in an attempt to evade defenses, but Cloudflare’s mitigation systems detected and mitigated all the attacks, including this one, fully autonomously. Read more on How Cloudflare mitigates hyper-volumetric DDoS attacks.
Attack characteristics
While the majority of DDoS attacks are relatively small, in Q3, the amount of DDoS attacks that exceeded 100 million packets per second (Mpps) increased by 189% QoQ. Similarly, attacks exceeding 1 Tbps increased by 227% QoQ. On the HTTP layer, 4 out of every 100 attacks exceeded 1 million requests per second.
Furthermore, most attacks, 71% of HTTP DDoS and 89% of network-layer, end in under 10 minutes. That’s too fast for any human or on-demand service to react. A short attack may only last a few seconds, but the disruption it causes can be severe, and recovery takes far longer. Engineering and operational teams are then stuck with a complex, multi-step process to get critical systems back online, check data for consistency across distributed systems, and restore secure, reliable service to customers.
The impact of short-lived DDoS attacks, whether hyper-volumetric or not, can extend well beyond the duration of the attack.
Top attack sources
Seven out of the ten top sources are locations within Asia, with Indonesia in the lead. Indonesia is the largest source of DDoS attacks, and it has been ranked number one in the world for an entire year (since 2024 Q3). Even prior to this, Indonesia has always been placed in the top lists of attack sources. In 2024 Q2, Indonesia was the second-largest source, after climbing up from lower ranks in previous quarters and years.
To illustrate the rise of Indonesia as a DDoS hub, in just five years (since 2021 Q3), the percentage of HTTP DDoS attack requests originating from Indonesia has increased by a staggering 31,900%.
Top attacked industries
DDoS attackers go after rare Earth minerals
DDoS attacks against the Mining, Minerals & Metals industry significantly increased in the third quarter of 2025 as the 25th European Union–China trade summit saw rising tensions over Electric Vehicle (EV) tariffs, rare-earth exports, and cybersecurity issues, according to multiple news outlets. The BBC reported that “China also raised export controls on rare earths and critical minerals.” Overall, the Mining, Minerals & Metals industry surged 24 spots on the global ranking, making it the 49th most attacked industry in the world.
The Automotive industry saw the largest surge in DDoS attacks, leaping the industry by 62 spots in just one quarter, placing it as the sixth most attacked industry in the world. Cybersecurity companies also saw a significant increase in DDoS attacks. The Cybersecurity industry hopped by 17 spots, making it the 13th most attacked industry in the world.
DDoS attacks against AI surge by 347%
In September 2025, aTony Blair Institute poll showed Britons view AI more as an economic risk than an opportunity, sparking major headlines about automation and trust. TheUK Law Commission launched a review into AI use in government, making it a headline month for AI ethics, regulation, and generative-AI adoption. In September 2025, Cloudflare also saw MoM spikes as high as 347% in HTTP DDoS attack traffic against generative AI companies (based on a sample of leading generative AI services).
The top 10
In the third quarter of 2025, Information Technology & Services topped the list as the most attacked industry, followed by Telecommunications, and Gambling & Casinos. Notably, Automotive surged dramatically by 62 spots QoQ. Media, Production & Publishing also saw a sharp rise, preceded by the Banking & Financial Services industry, the Retail industry, and the Consumer Electronics industry.
Top attacked locations
There is a direct correlation between geopolitical events and DDoS attack activity.
Stop the Loot!
“Lootuvaifi” (Stop the Loot!) in Maldivian, became the rallying chant in the 2025 Maldivian protests as protesters took to the streets objecting the “perceived government corruption and democratic backsliding,” peaking with the “end of free speech” media bill, which the UN Human Rights Chief said will “seriously undermine media freedom and the right to freedom of expression for the people of the Maldives if not withdrawn.” The 2025 Maldivian protests were accompanied by a barrage of DDoS attacks. Correspondingly, the Maldives was the country that saw the highest increase in DDoS attacks. In the third quarter of 2025, the Maldives leaped by 125 spots, making it the 38th most attacked country in the world.
‘Block Everything’
The nationwide protest movement, “Block Everything,”or “Bloquons Tout” in French, was launched by French trade unions in September 2025 to oppose President Macron’s government over new austerity measures, pension system changes, and rising living costs. While trade unions called for coordinated strikes and transport blockades to paralyze the country, cyber threat actors targeted French websites and Internet services with waves of DDoS attacks. France jumped 65 spots QoQ, making it the 18th most attacked country in the world.
‘Drawing the red line for Gaza in Brussels’
Increases in DDoS attacks were observed alongside protests in more countries. For example, Belgium jumped 63 places making it the 74th most attacked country in the world, as “tens of thousands of protesters drew the Red Line for Gaza in Brussels.”
The top 10
In the third quarter of 2025, China remained the most attacked, followed by Turkey in second, and Germany in third place. The most notable changes within this quarter was an increase in DDoS attacks against the United States, which leaped by 11 spots as the fifth most attacked country. The Philippines saw the largest increase within the top 10 – it jumped by 20 spots.
Attack vectors
Network-layer DDoS attacks
The amount of UDP DDoS attacks, partially fueled by Aisuru attacks, increased by 231% QoQ making it the top attack vector at the network-layer. DNS floods came in second place, SYN floods in third, and ICMP floods in fourth — accounting for just over half of all network-layer DDoS attacks.
Although almost 10 years have passed since its first major debut, Mirai DDoS attacks are still quite common. Almost 2 out of every 100 network-layer DDoS attacks are launched by permutations of the Mirai botnet.
HTTP DDoS attacks
Nearly 70% of HTTP DDoS attacks originated from botnets already known to Cloudflare. This reflects one of the benefits that our customers gain from using Cloudflare. Once a botnet attacks one out of the millions of Cloudflare customers, everyone is automatically protected from that botnet.
Another ~20% of HTTP DDoS attacks originated from fake or headless browsers, or included suspicious HTTP attributes. The remaining ~10% were a combination of generic floods, unusual requests, cache busting attacks, and attacks that targeted login endpoints.
Why legacy DDoS solutions no longer suffice
We’ve entered an era where DDoS attacks have rapidly grown in sophistication and size — beyond anything we could’ve imagined a few years ago. Many organizations have faced challenges in keeping pace with this evolving threat landscape.
Organizations relying on on-premise mitigation appliances or on-demand scrubbing center solutions may benefit from reviewing their defense strategy given the current threat landscape.
Welcome to the 22nd edition of the Cloudflare DDoS Threat Report. Published quarterly, this report offers a comprehensive analysis of the evolving threat landscape of Distributed Denial of Service (DDoS) attacks based on data from the Cloudflare network. In this edition, we focus on the second quarter of 2025. To view previous reports, visit www.ddosreport.com.
June was the busiest month for DDoS attacks in 2025 Q2, accounting for nearly 38% of all observed activity. One notable target was an independent Eastern European news outlet protected by Cloudflare, which reported being attacked following its coverage of a local Pride parade during LGBTQ Pride Month.
Key DDoS insights
DDoS attacks continue to break records. During 2025 Q2, Cloudflare automatically blocked the largest ever reported DDoS attacks, peaking at 7.3 terabits per second (Tbps) and 4.8 billion packets per second (Bpps).
Overall, in 2025 Q2, hyper-volumetric DDoS attacks skyrocketed. Cloudflare blocked over 6,500 hyper-volumetric DDoS attacks, an average of 71 per day.
Although the overall number of DDoS attacks dropped compared to the previous quarter — which saw an unprecedented surge driven by a large-scale campaign targeting Cloudflare’s network and critical Internet infrastructure protected by Cloudflare — the number of attacks in 2025 Q2 were still 44% higher than in 2024 Q2. Critical infrastructure continues to face sustained pressure, with the Telecommunications, Service Providers, and Carriers sector jumping again to the top as the most targeted industry.
All the attacks in this report were automatically detected and blocked by our autonomous defenses.
To learn more about DDoS attacks and other types of cyber threats, refer to our Learning Center. Visit Cloudflare Radar to view an interactive version of this report where you can drill down further. Radar also offers a free API for those interested in investigating Internet trends. You can also learn more about the methodologies used in preparing these reports.
DDoS attacks in numbers
In 2025 Q2, Cloudflare mitigated 7.3 million DDoS attacks — down sharply from 20.5 million in Q1, when an 18-day campaign against Cloudflare’s own and other critical infrastructure protected by Cloudflare, drove 13.5 million of those attacks.
DDoS attacks by quarter
We’ve just crossed halfway through 2025, and so far Cloudflare has already blocked 27.8 million DDoS attacks, equivalent to 130% of all the DDoS attacks we blocked in the full calendar year 2024.
DDoS attacks by year
Breaking it down further, Layer 3/Layer 4 (L3/4) DDoS attacks plunged 81% quarter-over-quarter to 3.2 million, while HTTP DDoS attacks rose 9% to 4.1 million. Year-over-year changes remain elevated. Overall attacks were 44% higher than 2024 Q2, with HTTP DDoS attacks seeing the largest increase of 129% YoY.
DDoS attacks by month
Hyper-volumetric DDoS attacks
In 2025 Q2, Cloudflare blocked over 6,500 hyper-volumetric DDoS attacks, averaging 71 hyper-volumetric attacks per day. Hyper-volumetric attacks include L3/4 DDoS attacks exceeding 1 Bpps or 1 Tbps, and HTTP DDoS attacks exceeding 1 million requests per second (Mrps).
The number of hyper-volumetric DDoS attacks exceeding 100 million packets per second (pps) surged by 592% compared to the previous quarter, and the number exceeding 1 billion pps and 1 terabits per second (Tbps) doubled compared to the previous quarter. The number of HTTP DDoS attacks exceeding 1 million rps (rps) remained the same at around 20 million in total, an average of almost 220,000 attacks every day.
Hyper-volumetric DDoS attacks in 2025 Q2
Threat actors
When asked who was behind the DDoS attacks they experienced in 2025 Q2, the majority (71%) of respondents said they didn’t know who attacked them. Of the remaining 29% of respondents that claimed to have identified the threat actor, 63% pointed to competitors, a pattern especially common in the Gaming, Gambling and Crypto industries. Another 21% attributed the attack to state-level or state-sponsored actors, while 5% each said they’d inadvertently attacked themselves (self-DDoS), were targeted by extortionists, or suffered an assault from disgruntled customers/users.
Top threat actors reported in 2025 Q2
Ransom DDoS attacks
The percentage of attacked Cloudflare customers that reported being targeted by a Ransom DDoS attack or that were threatened increased by 68% compared to the previous quarter, and by 6% compared to the same quarter in 2024.
Ransom DDoS attacks by quarter 2025 Q2
Diving deeper, Ransom DDoS attacks soared in June 2025. Around a third of respondents reported being threatened or subjected to Ransom DDoS attacks.
Ransom DDoS attacks by month 2025 Q2
Top attacked locations
The ranking of the top 10 most attacked locations in 2025 Q2 shifted significantly. China climbed two spots to reclaim first place, Brazil jumped four spots to second place, Germany slipped two spaces to third place, India edged up one to fourth, and South Korea rose four to fifth. Turkey fell four places to sixth, Hong Kong dropped three to seventh, and Vietnam vaulted an astonishing fifteen spots into eighth. Meanwhile, Russia rocketed forty places to ninth, and Azerbaijan surged thirty-one to round out the top ten.
The locations most targeted by DDoS attacks for 2025 Q2
It’s important to note that these attacked locations are determined by the billing country of the Cloudflare customer whose services were targeted — not that those nations themselves are under attack. In other words, a high rank simply means more of our registered customers in that billing jurisdiction were targeted by DDoS traffic, rather than implying direct geopolitical targeting.
Top attacked industries
The ranking of the top 10 most attacked industries in 2025 Q2 also saw notable movement. Telecommunications, Service Providers and Carriers climbed one spot to claim first place, while the Internet sector jumped two spots to second place. Information Technology & Services held its placement as third most attacked, and Gaming rose one spot to fourth place. Gambling & Casinos slipped four spots to fifth place, and the Banking & Financial Services industry remained in sixth place. Retail inched up one spot to seventh place, and Agriculture made a dramatic 38-place leap into eighth. Computer Software climbed two spots to ninth place, and Government hopped two places to round out the top ten most attacked industries.
The top attacked industries of DDoS attacks for 2025 Q2
Top sources of DDoS attacks
The ranking of the top 10 largest sources of DDoS attacks in 2025 Q2 also saw several shifts compared to the previous quarter. Indonesia climbed one spot to claim the first place, Singapore jumped two places to second place, Hong Kong dropped two places to third, Argentina slipped one space as fourth and Ukraine held on as the fifth-largest source of DDoS attacks. Russia surged six spots as the sixth-largest source, followed by Ecuador who jumped seven places. Vietnam inched up one place as the eighth-largest source. The Netherlands moved up four places as the ninth-largest source, and Thailand fell three places as the tenth-largest source of DDoS attacks.
The top sources of DDoS attacks for 2025 Q2
It’s important to note that these “source” rankings reflect where botnet nodes, proxy or VPN endpoints reside — not the actual location of threat actors. For L3/4 DDoS attacks, where IP spoofing is rampant, we geolocate each packet to the Cloudflare data center that first ingested and blocked it, drawing on our presence in over 330 cities for truly granular accuracy.
Top source networks of DDoS attacks
An ASN (Autonomous System Number) is a unique identifier assigned to a network or group of IP networks that operate under a single routing policy on the Internet. It’s used to exchange routing information between systems using protocols like BGP (Border Gateway Protocol).
For the first time in about a year, the German-based Hetzner (AS24940) network dropped from the first place as the largest source of HTTP DDoS attack to the third place. In its place, Austrian-based Drei (AS200373) jumped 6 places as the number one largest source of HTTP DDoS attacks. The US-based DigitalOcean (AS14061) hopped one spot to the second place.
The top 10 ASN sources of HTTP DDoS attacks
As can be seen in the chart above, 8 out of 10 ASNs listed offer virtual machines (VMs), hosting, or cloud services which indicate the common use of VM-based botnets. These botnets are estimated to be 5,000x stronger than IoT-based botnets. Only Drei (AS200373) and ChinaNet Backbone (AS4134) are primarily ISPs or telecom carriers without significant public VM/cloud offerings.
IoT-based botnets versus VM-based botnets
To help hosting providers, cloud computing providers and any Internet service providers identify and take down the abusive accounts that launch these attacks, we leverage Cloudflare’s unique vantage point to provide a free DDoS Botnet Threat Feed for Service Providers. Over 600 organizations worldwide have already signed up for this feed, and we’ve already seen great collaboration across the community to take down botnet nodes. This is possible thanks to the threat feed which provides these service providers a list of offending IP addresses from within their ASN that we see launching HTTP DDoS attacks. It’s completely free and all it takes is opening a free Cloudflare account, authenticating the ASN via PeeringDB, and then fetching the threat intelligence via API.
With a simple API call, service providers can get a list of offending IPs from within their network. An example response is provided below.
Example response from the free ISP DDoS Botnet Threat Feed API
Attack vectors
Defending against DDoS Botnets
In Q2 2025, the majority (71%) of HTTP DDoS attacks were launched by known botnets. Rapid detection and blocking of these attacks was possible as a result of operating a massive network and seeing many different types of attacks and botnets. By leveraging real-time threat intelligence, our systems are able to incriminate DDoS botnets very fast, contributing to a more effective mitigation. Even if a DDoS botnet has been incriminated while targeting only one website or IP address, our entire network and customer base is immediately protected against it. This real-time threat intelligence system adapts with botnets as they morph and change nodes.
The top HTTP DDoS attack vectors for 2025 Q2
L3/4 attack vectors
In Q2 2025, DNS flood attacks were the top L3/4 attack vector accounting for almost a third of all L3/4 DDoS attacks. SYN floods was the second most common attack vector, dipping from 31% in Q1 to 27% in Q2.
In third place, UDP floods also grew meaningfully, rising from 9% in Q1 to 13% in Q2. RST floods, another form of TCP-based DDoS attacks, accounting for 5% of all L3/4 attacks, was the fourth most common vector. Rounding out the top five, SSDP floods edged into fifth place at 3% despite a decline from 4.3% last quarter, but enough to push the previously prevalent Mirai attacks (which fell from 18% in Q1 to just 2% in Q2) out of the top five altogether.
The top L3/4 DDoS attack vectors for 2025 Q2
Breakdown of the top 3 L3/4 DDoS attack vectors
Below are details about the top 3 most common L3/4 DDoS attacks. We provide recommendations on how organizations can avoid becoming a reflection and amplification element, and also recommendations on how to defend against these attacks whilst avoiding impact to legitimate traffic. Cloudflare’s customers are protected against these attacks.
DNS Flood Attack
Type: Flood
How it works: A DNS flood aims to overwhelm a DNS server with a high volume of DNS queries—either valid, random, or malformed—to exhaust CPU, memory, or bandwidth. Unlike amplification attacks, this is a direct flood aimed at degrading performance or causing outages, often over UDP port 53, but sometimes over TCP as well (especially for DNS-over-TCP or DNSSEC-enabled zones).
How to defend against the attack: Use Cloudflare DNS as primary or secondary, Cloudflare DNS Firewall and/or Cloudflare Magic Transit to absorb and mitigate query floods before they reach your origin. Cloudflare’s global network handles tens of millions of DNS queries per second with built-in DDoS filtering and query caching, blocking malformed or excessive traffic while answering legitimate requests.
How to avoid unintended impact: Avoid blocking all DNS traffic or disabling UDP port 53, which would break normal resolution. Rely on Cloudflare’s DNS-specific protection such as the Advanced DNS Protection system, and deploy DNSSEC-aware protection to handle TCP-based query floods safely.
SYN Flood Attack
Type: Flood
How it works: In a SYN flood, threat actors send a large volume of TCP SYN packets—often with spoofed IP addresses—to initiate connections that are never completed. This leaves the target system with half-open connections, consuming memory and connection tracking resources, potentially exhausting server limits and preventing real clients from connecting.
How to defend against the attack: Use Cloudflare Magic Transit to intercept and mitigate TCP SYN floods at the edge. Cloudflare leverages SYN cookies, connection tracking, and behavioral analysis to distinguish real clients from spoofed or malicious sources, ensuring legitimate TCP connections are completed successfully. Using Cloudflare’s CDN/WAF services or Cloudflare Spectrum which are both reverse-proxy services for HTTP or TCP, respectively. Using a reverse-proxy basically eliminates the possible impact of TCP-based DDoS attacks.
How to avoid unintended impact: Blocking all SYN traffic or applying aggressive timeouts can block real users. Instead, rely on Cloudflare’s Advanced TCP protection system, which uses SYN rate shaping, anomaly detection, and spoofed-packet filtering to mitigate attacks without affecting genuine client connections.
UDP DDoS attack
Type: Flood
How it works: A high volume of UDP packets is sent to random or specific ports on the target IP address(es). It may attempt to saturate the Internet link or overwhelm its in-line appliances with more packets than it can handle in order to create disruption or an outage.
How to defend against the attack: Deploy cloud-based volumetric DDoS protection that can fingerprint attack traffic in real-time such as Cloudflare Magic Transit or Cloudflare Spectrum, apply smart rate-limiting on UDP traffic, and drop unwanted UDP traffic altogether with the Magic Firewall.
How to avoid unintended impact: Aggressive filtering may disrupt legitimate UDP services such as VoIP, video conferencing, or online games. Apply thresholds carefully.
Emerging threats
Among emerging L3/4 DDoS threats in 2025 Q2, Teeworlds flood saw the biggest spike. These attacks jumped 385% QoQ, followed by the RIPv1 flood, which surged 296%. RDP floods climbed by 173%, and Demon Bot floods increased by 149%. Even the venerable VxWorks flood made a comeback, rising 71% quarter-over-quarter. These dramatic upticks highlight threat actors’ ongoing experimentation with lesser-known and legacy protocols to evade standard defenses.
The top emerging threats for 2025 Q2
Breakdown of the top emerging threats
Below are details about the emerging threats for 2025 Q2, mostly recycling of very old attack vectors. We provide recommendations on how organizations can avoid becoming a reflection and amplification element, and also recommendations on how to defend against these attacks whilst avoiding impact to legitimate traffic. Cloudflare’s customers are protected against these attacks.
Teeworlds DDoS Attack
Type: Flood
How it works:Teeworlds is a fast-paced, open-source 2D multiplayer shooter game that uses a custom UDP-based protocol for real-time gameplay. Threat actors flood the target’s game server with spoofed or excessive UDP packets that mimic in-game actions or connection attempts. This can overwhelm server resources and cause lag or outages.
How to defend against the attack: Use Cloudflare Spectrum or Cloudflare Magic Transit to protect the servers. Cloudflare automatically detects and mitigates these types of attacks using real-time fingerprinting, blocking attack traffic while allowing real players through. Magic Transit also provides a packet-level firewall capability, the Magic Firewall which can be used to craft custom protection.
How to avoid unintended impact: When crafting custom rules, avoid blocking or aggressively rate-limiting UDP port 8303 directly as it can disrupt overall gameplay. Instead, rely on intelligent detection and mitigation services to avoid affecting legitimate users.
How it works: Exploits the Routing Information protocol version 1 (RIPv1), an old unauthenticated distance-vector routing protocol that uses UDP/520. Threat actors send spoofed routing updates to flood or confuse networks.
How to prevent becoming a reflection / amplification element: Disable RIPv1 on routers. Use RIPv2 with authentication where routing is needed.
How to defend against the attack: Block inbound UDP/520 from untrusted networks. Monitor for unexpected routing updates.
How to avoid unintended impact: RIPv1 is mostly obsolete; disabling it is generally safe. If legacy systems rely on it, validate routing behavior before changes.
RDP DDoS Attack
Type: Reflection + Amplification
How it works: The Remote Desktop Protocol (RDP) is used for remote access to Windows systems and typically runs over TCP port 3389. In some misconfigured or legacy setups, RDP can respond to unauthenticated connection attempts, making it possible to abuse for reflection or amplification. Threat actors send spoofed RDP initiation packets to exposed servers, causing them to reply to a victim, generating high volumes of unwanted traffic.
How to defend against the attack: Use Cloudflare Magic Transit to protect your network infrastructure. Magic Transit provides L3/L4 DDoS protection, filtering out spoofed or malformed RDP traffic before it reaches your origin. For targeted application-layer abuse, Cloudflare Gateway or Zero Trust Network Access (ZTNA) can help secure remote desktop access behind authenticated tunnels.
How to avoid unintended impact: Do not block TCP/3389 globally if RDP is actively used. Instead, restrict RDP access to known IPs or internal networks, or use Cloudflare Tunnel with Zero Trust Network Access (ZTNA) to remove public exposure altogether while maintaining secure access for legitimate users.
DemonBot DDoS Attack
Type: Botnet-based Flood
How it works: DemonBot is a malware strain that infects Linux-based systems—particularly unsecured IoT devices—via open ports or weak credentials. Once infected, devices become part of a botnet that can launch high-volume UDP, TCP, and application-layer floods. Attacks are typically command-and-control (C2) driven and can generate significant volumetric traffic, often targeting gaming, hosting, or enterprise services. To avoid infection, leverage antivirus software and domain filtering.
How to defend against the attack: Use Cloudflare Magic Transit to absorb and filter large-scale network-layer floods before they reach your infrastructure. Cloudflare’s real-time traffic analysis and signature-based detection neutralize traffic originating from DemonBot-infected devices. For application-layer services, Cloudflare DDoS protection and WAF can mitigate targeted HTTP floods and connection abuse.
How to avoid unintended impact: Instead of broadly blocking traffic types or ports, rely on Cloudflare’s adaptive mitigation to distinguish between legitimate users and botnet traffic. Combine with IP reputation filtering, geo-blocking, and rate limiting to reduce false positives and maintain service availability.
VxWorks Flood DDoS Attack
Type: Flood (IoT-based)
How it works:VxWorks is a real-time operating system (RTOS) used in millions of embedded and IoT devices (e.g., routers, industrial controllers). Devices running outdated or misconfigured versions of VxWorks can be compromised and used to launch DDoS attacks. Once infected—often via public exploits or weak credentials—they send high volumes of UDP, TCP, or ICMP traffic to overwhelm targets, similar to traditional IoT botnets.
How to defend against the attack: Deploy Cloudflare Magic Transit to block volumetric traffic at the network edge. Cloudflare uses real-time fingerprinting and proprietary heuristics to identify traffic from compromised VxWorks devices and mitigate it in real-time. For application services, Cloudflare’s DDoS mitigationandGateway services provide additional protection against protocol-level abuse.
How to avoid unintended impact: Avoid over-blocking UDP or ICMP traffic, as it may disrupt legitimate diagnostics or real-time services. Instead, use Cloudflare’s intelligent filtering, rate limiting, and geo/IP reputation tools to safely mitigate attacks while avoiding impact to legitimate traffic.
Most DDoS attacks are small and short. In 2025 Q2, 94% of L3/4 DDoS attacks didn’t exceed 500 Mbps. Similarly, around 85% of L3/4 DDoS attacks didn’t exceed 50,000 pps. The majority of HTTP DDoS attacks are also small, 65% stay below 50K rps. “Small”, though, is a relative term.
An average modern server typically refers to a general-purpose physical or virtual machine with around 4–8 CPU cores (e.g. Intel Xeon Silver), 16–64 GB RAM, and a 1 Gbps NIC, running a Linux OS like Ubuntu or CentOS with NGINX or similar software. This setup can handle ~100,000–500,000 pps, up to ~940 Mbps throughput, and around 10,000–100,000 rps for static content or 500–1,000 rps for database-backed dynamic applications, depending on tuning and workload.
Assuming the server is unprotected by a cloud DDoS protection service, if it’s targeted by “small” DDoS attacks during peak time traffic rates, it is very likely that the server won’t be able to handle it. Even “small” DDoS attacks can cause significant impact to unprotected servers.
DDoS attacks size and duration in 2025 Q2
While the majority of DDoS attacks are small, hyper-volumetric DDoS attacks are increasing in size and frequency. 6 out of every 100 HTTP DDoS attacks exceed 1M rps, and 5 out of every 10,000 L3/4 DDoS attacks exceed 1 Tbps — a 1,150% QoQ increase.
The largest attack in the world: 7.3 Tbps
Most DDoS attacks are short in duration, even the largest and most intense ones. Threat actors often rely on brief bursts of concentrated traffic—sometimes lasting as little as 45 seconds as seen with the monumental 7.3 Tbps DDoS attack — in an attempt to avoid detection, overwhelm targets and cause maximum disruption before defenses can fully activate. This tactic of short, high-intensity bursts makes detection and mitigation more challenging and underscores the need for always-on, real-time protection. Thankfully, Cloudflare’s autonomous DDoS defenses kick in immediately.
Helping build a better Internet
At Cloudflare, we’re committed to helping build a better Internet. A part of that mission is offering free, unmetered DDoS protection regardless of size, duration and quantity. We don’t just defend against DDoS attacks. The best defense is a good offense, and using our free ISP Botnet Threat Feed, we contribute to botnet takedowns.
While many still adopt protection reactively or rely on outdated solutions, our data shows proactive, always-on security is far more effective. Powered by a global network with 388 Tbps capacity across 330+ cities, we provide automated, in-line, battle-proven defense against all types of DDoS attacks.
In mid-May 2025, Cloudflare blocked the largest DDoS attack ever recorded: a staggering 7.3 terabits per second (Tbps). This comes shortly after the publication of our DDoS threat report for 2025 Q1 on April 27, 2025, where we highlighted attacks reaching 6.5 Tbps and 4.8 billion packets per second (pps). The 7.3 Tbps attack is 12% larger than our previous record and 1 Tbps greater than a recent attack reported by cyber security reporter Brian Krebs at KrebsOnSecurity.
New world record: 7.3 Tbps DDoS attack autonomously blocked by Cloudflare
The attack targeted a Cloudflare customer, a hosting provider, that uses Magic Transit to defend their IP network. Hosting providers and critical Internet infrastructure have increasingly become targets of DDoS attacks, as we reported in our latest DDoS threat report. Pictured below is an attack campaign from January and February 2025 that blasted over 13.5 million DDoS attacks against Cloudflare’s infrastructure and hosting providers protected by Cloudflare.
DDoS attack campaign target Cloudflare infrastructure and hosting providers protected by Cloudflare
Let’s start with some stats, and then we’ll dive into how our systems detected and mitigated this attack.
The 7.3 Tbps attack delivered 37.4 terabytes in 45 seconds
37.4 terabytes is not a staggering figure in today’s scales, but blasting 37.4 terabytes in just 45 seconds is. It’s the equivalent to flooding your network with over 9,350 full-length HD movies, or streaming 7,480 hours of high-definition video nonstop (that’s nearly a year of back-to-back binge-watching) in just 45 seconds. If it were music, you’d be downloading about 9.35 million songs in under a minute, enough to keep a listener busy for 57 years straight. Think of snapping 12.5 million high-resolution photos on your smartphone and never running out of storage—even if you took one shot every day, you’d be clicking away for 4,000 years — but in 45 seconds.
The record-breaking 7.3 Tbps DDoS attack delivered 37.4 TB in 45 seconds
The attack details
The attack carpet-bombed an average of 21,925 destination ports of a single IP address owned and used by our customer, with a peak of 34,517 destination ports per second. The attack also originated from a similar distribution of source ports.
Distribution of destination ports
Attack vectors
The 7.3 Tbps attack was a multivector DDoS attack. Around 99.996% of the attack traffic was categorized as UDP floods. However, the remaining 0.004%, which accounted for 1.3 GB of the attack traffic, were identified as QOTD reflection attacks, Echo reflection attack, NTP reflection attack, Mirai UDP flood attack, Portmap flood, and RIPv1 amplification attacks.
The attack vectors other than UDP floods
Breakdown of the attack vectors
Below are details about the various attack vectors seen in this attack, how organizations can avoid becoming a reflection and amplification participant, and recommendations on how to defend against these attacks whilst avoiding impact to legitimate traffic. Cloudflare’s customers are protected against these attacks.
UDP DDoS attack
Type: Flood
How it works: A high volume of UDP packets is sent to random or specific ports on the target IP address(es). It may attempt to saturate the Internet link or overwhelm its in-line appliances with more packets than it can handle.
How to defend against the attack: Deploy cloud-based volumetric DDoS protection, apply smart rate-limiting on UDP traffic, and drop unwanted UDP traffic altogether.
How to avoid unintended impact: Aggressive filtering may disrupt legitimate UDP services such as VoIP, video conferencing, or online games. Apply thresholds carefully.
QOTD DDoS attack
Type: Reflection + Amplification
How it works: Abuses the Quote of the Day (QOTD) Protocol, which listens on UDP port 17 and responds with a short quote or message. Attackers send QOTD requests to exposed servers from a spoofed IP address, causing amplified responses to flood the victim.
How to prevent becoming a reflection / amplification element: Disable the QOTD service and block UDP/17 on all servers and firewalls.
How to defend against the attack: Block inbound UDP/17. Drop abnormal small-packet UDP request spikes.
How to avoid unintended impact: QOTD is an obsolete diagnostic/debugging protocol and is not used by modern applications. Disabling it should not have any negative effect on legitimate services.
Echo DDoS attack
Type: Reflection + Amplification
How it works: Exploits the Echo protocol (UDP/TCP port 7), which replies with the same data it receives. Attackers spoof the victim’s IP address, causing devices to reflect the data back, amplifying the attack.
How to prevent becoming a reflection / amplification element: Disable the Echo service on all devices. Block UDP/TCP port 7 at the edge.
How to defend against the attack: Disable the Echo service and block TCP/UDP port 7 at the network perimeter.
How to avoid unintended impact: Echo is an obsolete diagnostic tool; disabling or blocking it has no negative effect on modern systems.
NTP DDoS attack
Type: Reflection + Amplification
How it works: Abuses the Network Time Protocol (NTP), used to sync clocks over the Internet. Attackers exploit the monlist command on old NTP servers (UDP/123) which returns a large list of recent connections. Spoofed requests cause amplified reflections.
How to prevent becoming a reflection / amplification element: Upgrade or configure NTP servers to disable monlist. Restrict NTP queries to trusted IP addresses only.
How to defend against the attack: Disable the monlist command, update NTP software, and filter or rate-limit UDP/123 traffic.
How to avoid unintended impact: Disabling monlist has no effect on time synchronization. However, filtering or blocking UDP/123 could affect time syncing if done too broadly — ensure only untrusted or external sources are blocked.
Mirai UDP attack
Type: Flood
How it works: The Mirai botnet, made up of compromised IoT devices, floods victims using random or service-specific UDP packets (e.g., DNS, game services).
How to prevent becoming part of the botnet: Secure your IoT devices, change default passwords, upgrade to the latest firmware versions, and follow IoT security best practices to avoid becoming part of the botnet. When possible, monitor outbound traffic to detect irregularities.
How to defend against the attack: Deploy cloud-based volumetric DDoS protection and rate-limiting for UDP traffic.
How to avoid unintended impact: First, understand your network and the type of traffic that you receive, specifically the protocols, their sources and their destinations. Identify services that run over UDP that you want to avoid impacting. Once you have identified those, you can apply rate-limiting in a way that excludes those end points, or takes into account your regular traffic levels. Otherwise, aggressively rate-limiting UDP traffic can impact your legitimate traffic and impact services that run over UDP such as VoIP calls and VPN traffic.
Portmap DDoS attack
Type: Reflection + Amplification
How it works: Targets the Portmapper service (UDP/111) used by Remote Procedure Call (RPC)-based applications to identify available services. Spoofed requests result in reflected responses.
How to prevent becoming a reflection / amplification element: Disable the Portmapper service if not required. If needed internally, restrict it to trusted IP addresses only.
How to defend against the attack: Disable the Portmapper service if not needed, block inbound UDP/111 traffic. Use Access Control Lists (ACLs) or firewalls to restrict access to known RPC services.
How to avoid unintended impact: Disabling Portmapper may disrupt applications relying on RPC (e.g., Network File System protocol). Validate service dependencies before removal.
RIPv1 DDoS attack
Type: Reflection + (Low) Amplification
How it works: Exploits the Routing Information protocol version 1 (RIPv1), an old unauthenticated distance-vector routing protocol that uses UDP/520. Attackers send spoofed routing updates to flood or confuse networks.
How to prevent becoming a reflection / amplification element: Disable RIPv1 on routers. Use RIPv2 with authentication where routing is needed.
How to defend against the attack: Block inbound UDP/520 from untrusted networks. Monitor for unexpected routing updates.
How to avoid unintended impact: RIPv1 is mostly obsolete; disabling it is generally safe. If legacy systems rely on it, validate routing behavior before changes.
All recommendations here should be taken into consideration with the context and behavior of each unique network or application to avoid any unintended impact to legitimate traffic.
Attack origins
The attack originated from over 122,145 source IP addresses spanning 5,433 Autonomous Systems (AS) across 161 countries.
Almost half of the attack traffic originated from Brazil and Vietnam, with approximately a quarter each. Another third, in aggregate, originated from Taiwan, China, Indonesia, Ukraine, Ecuador, Thailand, the United States, and Saudi Arabia.
Top 10 source countries of the attack traffic
The average number of unique source IP addresses per second was 26,855 with a peak of 45,097.
Distribution of unique source IP addresses
The attack originated from 5,433 different networks (ASes). Telefonica Brazil (AS27699) accounted for the largest portion of the DDoS attack traffic, responsible for 10.5% of the total. Viettel Group (AS7552) follows closely with 9.8%, while China Unicom (AS4837) and Chunghwa Telecom (AS3462) contributed 3.9% and 2.9% respectively. China Telecom (AS4134) accounted for 2.8% of the traffic. The remaining ASNs in the top 10, including Claro NXT (AS28573), VNPT Corp (AS45899), UFINET Panama (AS52468), STC (AS25019), and FPT Telecom Company (AS18403), each contributed between 1.3% and 1.8% of the total DDoS attack traffic.
Top 10 source autonomous systems
Free botnet threat feed
To help hosting providers, cloud computing providers, and any Internet service providers identify and take down the abusive accounts that launch these attacks, we leverage Cloudflare’s unique vantage point to provide a free DDoS Botnet Threat Feed for Service Providers. Over 600 organizations worldwide have already signed up for this feed. It gives service providers a list of offending IP addresses from within their ASN that we see launching HTTP DDoS attacks. It’s completely free and all it takes is opening a free Cloudflare account, authenticating the ASN via PeeringDB, and then fetching the feed via API.
How the attack was detected and mitigated
Using the distributed nature of DDoS attacks against it
The attacked IP address was advertised from Cloudflare’s network using global anycast. This means that the attack packets that targeted the IP were routed to the closest Cloudflare data center. Using global anycast allows us to spread the attack traffic and use its distributed nature against it, enabling us to mitigate close to the botnet nodes and continue serving users from the data centers closest to them. In the case of this attack, it was detected and mitigated in 477 data centers across 293 locations around the world. In high-traffic locations, we have presence in multiple data centers.
Autonomous DDoS detection and mitigation
The Cloudflare global network runs every service in every data center. This includes our DDoS detection and mitigation systems. This means that attacks can be detected and mitigated fully autonomously, regardless of where they originate from.
Our system analyzes the packet samples to identify suspicious patterns based on our unique heuristic engine named dosd (denial of service daemon). Dosd looks for patterns in the packet samples, such as finding commonality in the packet header fields and looking for packet anomalies, as well as applying other proprietary techniques.
Flow diagram of the real-time fingerprint generation
To our customers, this complex fingerprinting system is encapsulated as a user-friendly group of managed rules, the DDoS Protection Managed Rulesets.
When patterns are detected by dosd, it generates multiple permutations of those fingerprints in order to find the most accurate fingerprint that will have the highest mitigation efficacy and accuracy, i.e. to try and surgically match against attack traffic without impacting legitimate traffic.
Diagram of Cloudflare’s DDoS Protection systems
Mitigation
We count the various packet samples that match each fingerprint permutation, and using a data streaming algorithm, we bubble up the fingerprint with the most hits. When activation thresholds are exceeded, to avoid false positives, a mitigation rule using the fingerprint syntax is compiled as an eBPF program to drop packets that match the attack pattern. Once the attack ends, the rule times out and is automatically removed.
Gossiping about attacks
As we mentioned, each server detects and mitigates attacks fully autonomously — making our network highly efficient, resilient, and fast at blocking attacks. In addition, each server gossips (multicasts) the top fingerprint permutations within a data center, and globally. This sharing of real-time threat intelligence helps improve the mitigation efficacy within a data center and globally.
Protecting the Internet
Our systems successfully blocked this record-breaking 7.3 Tbps DDoS attack fully autonomously without requiring any human intervention, without triggering any alerts, and without causing any incidents. This demonstrates the effectiveness of our world-leading DDoS protection systems. We built this system as part of our mission to help build a better Internet committed to provide free unmetered DDoS protection.
Welcome to the 21st edition of the Cloudflare DDoS Threat Report. Published quarterly, this report offers a comprehensive analysis of the evolving threat landscape of Distributed Denial of Service (DDoS) attacks based on data from the Cloudflare network. In this edition, we focus on the first quarter of 2025. To view previous reports, visit www.ddosreport.com.
While this report primarily focuses on 2025 Q1, it also includes late-breaking data from a hyper-volumetric DDoS campaign observed in April 2025, featuring some of the largest attacks ever publicly disclosed. In a historic surge of activity, we blocked the most intense packet rate attack on record, peaking at 4.8 billion packets per second (Bpps), 52% higher than the previous benchmark, and separately defended against a massive 6.5 terabits-per-second (Tbps) flood, matching the highest bandwidth attacks ever reported.
Key DDoS insights
In the first quarter of 2025, Cloudflare blocked 20.5 million DDoS attacks. That represents a 358% year-over-year (YoY) increase and a 198% quarter-over-quarter (QoQ) increase.
Around one third of those, 6.6 million, targeted the Cloudflare network infrastructure directly, as part of an 18-day multi-vector attack campaign.
Furthermore, in the first quarter of 2025, Cloudflare blocked approximately 700 hyper-volumetric DDoS attacks that exceeded 1 Tbps or 1 Bpps — an average of around 8 attacks per day.
To learn more about DDoS attacks and other types of cyber threats, refer to our Learning Center. Visit Cloudflare Radar to view this report in its interactive version where you can drill down further. There’s a free API for those interested in investigating Internet trends. You can also learn more about the methodologies used in preparing these reports.
DDoS attacks in numbers
In the first quarter of 2025, we blocked 20.5 million DDoS attacks. For comparison, during the calendar year 2024, we blocked 21.3 million DDoS attacks. In just this past quarter, we blocked 96% of what we blocked in 2024.
The most significant increase was in network-layer DDoS attacks. In 2025 Q1, we blocked 16.8M network-layer DDoS attacks. That’s a 397% QoQ increase and a 509% YoY increase. HTTP DDoS attacks also increased — a 7% QoQ increase and a 118% YoY increase.
We count DDoS attacks based on unique real-time fingerprints generated by our systems. In some instances, a single attack or campaign may generate multiple fingerprints, particularly when different mitigation strategies are applied. While this can occasionally lead to higher counts, the metric offers a strong overall indicator of attack activity during a given period.
Attacks target the Cloudflare network and Internet infrastructure
Of the 20.5 million DDoS attacks blocked in Q1, 16.8 million were network-layer DDoS attacks, and of those, 6.6M targeted Cloudflare’s network infrastructure directly. Another 6.9 million targeted hosting providers and service providers protected by Cloudflare.
In the graph below, daily aggregates of attacks against Cloudflare are represented by the blue line, and the other colors represent the various hosting providers and Internet service providers using Cloudflare’s Magic Transit service that were attacked simultaneously.
Hyper-volumetric DDoS attacks
Hyper-volumetric DDoS attacks are attacks that exceed 1-2 Tbps or 1 Bpps. In 2025 Q1, we blocked over 700 of these attacks. Approximately 4 out of every 100,000 network-layer DDoS attacks were hyper-volumetric. Hyper-volumetric DDoS attacks tend to take place over UDP.
Hyper-volumetric attacks continue spill into Q2
While this report primarily focuses on 2025 Q1, we believe it is important to also highlight the significant hyper-volumetric record-breaking DDoS attacks that continued into Q2. As such, we have included initial insights from that campaign.
In the second half of April 2025, Cloudflare’s systems automatically detected and blocked dozens of hyper-volumetric DDoS attacks as part of an intense campaign. The largest attacks peaked at 4.8 Bpps and 6.5 Tbps, with these massive surges typically lasting between 35 and 45 seconds. At 6.5 Tbps, this attack matches the largest publicly disclosed DDoS attack to date. The 4.8 Bpps attack is the largest ever to be disclosed from the packet intensity perspective, approximately 52% larger than the previous 3.15 Bpps record.
The attacks originated from 147 countries and targeted multiple IP addresses and ports of a hosting provider that is protected by Cloudflare Magic Transit. All the attacks were successfully blocked by Cloudflare’s network.
Threat actors
When surveying Cloudflare customers that were targeted by DDoS attacks, the majority said they didn’t know who attacked them. The ones that did know reported their competitors as the number one threat actor behind the attacks (39%), which is similar to last quarter. This is quite common in the gaming and gambling industry.
Another 17% reported that a state-level or state-sponsored threat actor was behind the attack, and a similar percentage reported that a disgruntled user or customer was behind the attack.
Another 11% reported that they mistakenly inflicted the DDoS attack on themselves (self-DDoS) and a similar percentage said an extortionist was behind the attacks. 6% reported that the attacks were launched by disgruntled or former employees.
Anatomy of a DDoS attack
On the network-layer, SYN flood remains the most common Layer 3/4 DDoS attack vector, followed by DNS flood attacks. Mirai-launched DDoS attacks take the third place, replacing UDP flood attacks.
In the HTTP realm, over 60% of the attacks were identified and blocked as known botnets, 21% were attacks with suspicious HTTP attributes, another 10% were launched by botnets impersonating browsers, and the remaining 8% were generic floods, attacks of unusual request patterns, and cache busting attacks.
Emerging threats
In 2025 Q1, we saw a 3,488% QoQ increase in CLDAP reflection/amplification attacks. CLDAP (Connectionless Lightweight Directory Access Protocol) is a variant of LDAP (Lightweight Directory Access Protocol), used for querying and modifying directory services running over IP networks. CLDAP is connectionless, using UDP instead of TCP, making it faster but less reliable. Because it uses UDP, there’s no handshake requirement, which allows attackers to spoof the source IP address, thus allowing attackers to exploit it as a reflection vector. In these attacks, small queries are sent with a spoofed source IP address (the victim’s IP), causing servers to send large responses to the victim, overwhelming it. Mitigation involves filtering and monitoring unusual CLDAP traffic.
We also saw a 2,301% QoQ increase in ESP reflection/amplification attacks. The ESP (Encapsulating Security Payload) protocol is part of IPsec and provides confidentiality, authentication, and integrity to network communications. However, it can be abused in DDoS attacks if malicious actors exploit misconfigured or vulnerable systems to reflect or amplify traffic towards a target, leading to service disruption. Like with other protocols, securing and properly configuring the systems using ESP is crucial to block the risks of DDoS attacks.
Attack size & duration
Despite the increase in hyper-volumetric attacks, most DDoS attacks are small. In 2025 Q1, 99% of Layer 3/4 DDoS attacks were under 1 Gbps and 1 Mpps. Similarly, 94% of HTTP DDoS attacks were 1 million requests per second (rps). However, ‘small’ is a relative term and most Internet properties wouldn’t be able to withstand even those small attacks. They can easily saturate unprotected Internet links and crash unprotected servers.
Furthermore, most attacks are very short-lived. 89% of Layer 3/4 DDoS attacks and 75% of HTTP DDoS attacks end within 10 minutes. Even the largest, record-breaking, hyper-volumetric DDoS attacks can be very short, such as the 35-second attack seen in the examples above. 35 seconds, or even 10 minutes, is not a sufficient time for manual mitigation or activating an on-demand solution: by the time a security analyst receives the alert, and analyzes the attack, it’s already over. And while the attacks may be very short, the trickle effect of attack leads to network and applications failures that can take days to recover from — all whilst services are down or degraded. The current threat landscape leaves no time for human intervention. Detection and mitigation should be always-on, in-line and automated — with sufficient capacity and global coverage to handle the attack traffic along with legitimate peak time traffic.
On the other hand, hyper-volumetric HTTP DDoS attacks that exceed 1 Mrps doubled their share. In 2025 Q1, 6 out of every 100 HTTP DDoS attacks exceeded 1 Mrps. On the network-layer, 1 out of every 100,000 attacks exceeded 1 Tbps or 1 Bpps.
Attack example
One example of such an attack targeted a Cloudflare Magic Transit customer. The customer itself is a US-based hosting provider that offers web servers, Voice over IP (VoIP) servers, and game servers amongst its solutions. This specific attack targeted port 27015. This port is most commonly associated with multiplayer gaming servers, especially Valve’s Source engine games, such as Counter-Strike: Global Offensive (CS:GO), Team Fortress 2, Garry’s Mod, Left 4 Dead, and Half-Life 2: Deathmatch.
It’s used for the game server connection, letting clients connect to the server to play online. In many cases, this port is open for both UDP and TCP, depending on the game and what kind of communication it’s doing. This customer was targeted with multiple hyper-volumetric attacks that were autonomously blocked by Cloudflare.
Top attacked locations
The first quarter of 2025 saw a significant shift in the top 10 most attacked locations globally. Germany made a notable jump, climbing four spots — making it the most attacked country. In second place, Turkey also experienced a surge of 11 spots. In third, China, on the other hand, slipped two spots compared to the previous quarter, while Hong Kong remained unchanged. India rose four spots, and Brazil stayed the same. Taiwan dropped four positions. The Philippines experienced the largest decline, falling 6 spots. South Korea and Indonesia, however, both jumped up by two spots each.
Top attacked industries
The top 10 most attacked industries in 2025 Q1 saw some notable changes. The Gambling & Casinos industry jumped up four spots as the most attacked industry, while the Telecommunications, Service Providers and Carriers industry slid down one spot. The Information Technology & Services and Internet industries both saw minor fluctuations, moving up one and down two spots, respectively. The Gaming and Banking & Financial Services industries both saw a one-spot increase, while the Cyber Security industry made a massive leap of 37 spots compared to the previous quarter. Retail saw a slight decline of one spot, while the Manufacturing, Machinery, Technology & Engineering industry surged 28 spots. The Airlines, Aviation & Aerospace industry had the biggest jump of all, moving up 40 spots making it the tenth most attacked industry.
Top attack sources
The ranking of the top 10 largest sources of DDoS attacks in 2025 Q1 also shifted notably. Hong Kong soared to the number one position, climbing three spots from the previous quarter. Indonesia edged down to second place, while Argentina rose two spots to third. Singapore slipped two spots to fourth, and Ukraine dropped one to fifth. Brazil made a striking leap, climbing seven places to land in sixth place, closely followed by Thailand, which also rose seven spots to seventh. Germany also increased, moving up two positions to eighth. Vietnam made the most dramatic climb, jumping 15 spots to claim ninth place, while Bulgaria rounded out the list, dipping two spots to tenth.
Top source ASNs
An ASN (Autonomous System Number) is a unique identifier assigned to a network or group of IP networks that operate under a single routing policy on the Internet. It’s used to exchange routing information between systems using protocols like BGP (Border Gateway Protocol).
When looking at where the DDoS attacks originate from, specifically HTTP DDoS attacks, there are a few autonomous systems that stand out. In 2025 Q1, the German-based Hetzner (AS24940) retained its position as the largest source of HTTP DDoS attacks. It was followed by the French-based OVH (AS16276) in second, the US-based DigitalOcean (AS14061) in third, and another German-based provider, Contabo (AS51167), in fourth.
To help hosting providers, cloud computing providers and any Internet service providers identify and take down the abusive accounts that launch these attacks, we leverage Cloudflare’s unique vantage point to provide a free DDoS Botnet Threat Feed for Service Providers. Over 600 organizations worldwide have already signed up for this feed. It gives service providers a list of offending IP addresses from within their ASN that we see launching HTTP DDoS attacks. It’s completely free and all it takes is opening a free Cloudflare account, authenticating the ASN via PeeringDB, and then fetching the threat intelligence via API.
Helping build a better Internet
At Cloudflare, our mission is to help build a better Internet. A key part of that commitment is offering free protection against DDoS attacks, as well as supporting the broader Internet community by providing free tools to help other networks detect and dismantle botnets operating within their infrastructure.
As the threat landscape continues to evolve, we see that many organizations still adopt DDoS protection only after experiencing an attack or rely on outdated, on-demand solutions. In contrast, our data shows that those with proactive security strategies are far more resilient. That’s why we focus on automation and a comprehensive, always-on, in-line security approach to stay ahead of both existing and emerging threats.
Backed by our global network with 348 Tbps of capacity spanning 335 cities, we remain dedicated to delivering unmetered, unlimited DDoS protection, regardless of the size, duration, or frequency of attacks.
January 27 marks the International Holocaust Remembrance Day — a solemn occasion to honor the memory of the six million Jews who perished in the Holocaust, along with countless others who fell victim to the Nazi regime’s campaign of hatred and intolerance. This tragic chapter in human history serves as a stark reminder of the catastrophic consequences of prejudice and extremism.
The United Nations General Assembly designated January 27 — the anniversary of the liberation of Auschwitz-Birkenau — as International Holocaust Remembrance Day. This year, we commemorate the 80th anniversary of the liberation of this infamous extermination camp.
As the world reflects on this dark period, a troubling resurgence of antisemitism underscores the importance of vigilance. This growing hatred has spilled into the digital realm, with cyberattacks increasingly targeting Jewish and Holocaust remembrance and educational websites — spaces dedicated to preserving historical truth and fostering awareness.
For this reason, here at Cloudflare, we began to publish annual reports covering cyberattacks that target these organizations. These cyberattacks include DDoS attacks as well as bot and application attacks. The insights and trends are based on websites protected by Cloudflare. This is our fourth report, and you can view our previous Holocaust Remembrance Day blogs here.
Project Galileo
At Cloudflare, we are proud to support these vital organizations through Project Galileo, an initiative providing free security protections to vulnerable groups worldwide. If you or your organization could benefit from this program, consider applying today to help protect these essential platforms and the invaluable work they do.
One of the organizations that we protect through Project Galileo is Muzeon, a museum dedicated to preserving Jewish history in Cluj-Napoca, Romania. Muzeon faced significant cyberattacks that impacted their website’s performance and hindered operations before using Cloudflare.
As part of Project Galileo, Muzeon implemented Cloudflare’s DDoS mitigation, Web Application Firewall (WAF), Managed DNS, and other services. These measures drastically reduced the attacks and allowed Muzeon to focus on its important mission of storytelling and preserving cultural heritage.
Cloudflare’s solutions not only protected their digital infrastructure but also freed up time for Muzeon to expand its interactive exhibits, ensuring they could continue sharing their essential work globally. You can read more about this case study here.
Significant rise in antisemitism around the world
Following the October 7, 2023, Hamas-led attack on Israel, there has been a surge in global antisemitic incidents. In the U.S. alone there have been more than 10,000 antisemitic incidents from October 7, 2023 to September 24, 2024, representing an over 200-percent increase compared to the incidents reported during the same period a year before. As we’ve seen, the digital world is often a mirror to the real world. As a result, it is not surprising that websites dedicated to sharing information about the Holocaust, as well as Jewish memorial and education platforms, are now increasingly being targeted online.
Cyberattacks against Jewish and Holocaust educational websites
For the years 2020, 2021, and 2022, the number of cyberthreats targeting Holocaust and Jewish educational and memorial websites protected by Cloudflare was, on average, 736,339 malicious HTTP requests annually.
After the October 7 Hamas-led attack, cyberattacks skyrocketed. In 2023, the amount of blocked HTTP requests surged by 872% to 35.7 million compared to 2022. Most of these cyberattacks occurred after October 7, 2023.
In 2024, the number of blocked HTTP requests exceeded 47 million — representing a 30% increase compared to 2023. Over 3 out of every 100 HTTP requests towards Holocaust and Jewish memorial and education websites protected by Cloudflare were malicious and blocked.
Cyber threats against Holocaust and Jewish memorial and educational websites by year
Cyberattacks by quarter
In the fourth quarter of 2023, the volume of malicious requests exceeded 27 million. Throughout the first three quarters of 2024, we saw a gradual decrease in the quantity of malicious requests. But in the fourth quarter of 2024, cyberattacks spiked by 33%, to 36 million requests, following the one-year anniversary of the October 7 assault.
Cyber threats against Holocaust and Jewish memorial and educational websites by quarter
Cyberattacks by month
Breaking down the quarters into months, we can see an initial peak in October 2023 after the October 7 Hamas-led attack. The volume of cyberattacks remained elevated during November and December 2023.
Afterward, as we entered 2024, the quantity and percentage of cyberattacks against these websites significantly decreased. In November, over a third (34%) of all requests towards these websites were blocked, with over 36 million requests blocked that month alone.
Cyber threats against Holocaust and Jewish memorial and educational websites by month
Helping build a safer Internet and a better world
On the International Holocaust Remembrance Day, we reflect on the importance of standing against both antisemitism and cyber threats — issues that have escalated since the October 7, 2023, Hamas-led attack.
At Cloudflare, we are unwavering in our commitment to create a safer, more inclusive Internet. The rise in antisemitism has made it even more critical to protect educational websites and communities from harmful cyber attacks. We invite everyone to join us in this fight. Even with our free plan, we offer strong security and performance, ensuring that vital resources and websites remain safe and accessible. By working together, we can protect the lessons of history and foster a more secure digital world for all.
Welcome to the 20th edition of the Cloudflare DDoS Threat Report, marking five years since our first report in 2020.
Published quarterly, this report offers a comprehensive analysis of the evolving threat landscape of Distributed Denial of Service (DDoS) attacks based on data from the Cloudflare network. In this edition, we focus on the fourth quarter of 2024 and look back at the year as a whole.
Cloudflare’s unique vantage point
When we published our first report, Cloudflare’s global network capacity was 35 Terabits per second (Tbps). Since then, our network’s capacity has grown by 817% to 321 Tbps. We also significantly expanded our global presence by 65% from 200 cities in the beginning of 2020 to 330 cities by the end of 2024.
Using this massive network, we now serve and protect nearly 20% of all websites and close to 18,000 unique Cloudflare customer IP networks. This extensive infrastructure and customer base uniquely positions us to provide key insights and trends that benefit the wider Internet community.
Key DDoS insights
In 2024, Cloudflare’s autonomous DDoS defense systems blocked around 21.3 million DDoS attacks, representing a 53% increase compared to 2023. On average, in 2024, Cloudflare blocked 4,870 DDoS attacks every hour.
In the fourth quarter, over 420 of those attacks were hyper-volumetric, exceeding rates of 1 billion packets per second (pps) and 1 Tbps. Moreover, the amount of attacks exceeding 1 Tbps grew by a staggering 1,885% quarter-over-quarter.
During the week of Halloween 2024, Cloudflare’s DDoS defense systems successfully and autonomously detected and blocked a 5.6 Terabit per second (Tbps) DDoS attack — the largest attack ever reported.
To learn more about DDoS attacks and other types of cyber threats, visit our Learning Center, access previous DDoS threat reports on the Cloudflare blog, or visit our interactive hub, Cloudflare Radar. There’s also a free API for those interested in investigating these and other Internet trends. You can also learn more about the methodologies used in preparing these reports.
Anatomy of a DDoS attack
In 2024 Q4 alone, Cloudflare mitigated 6.9 million DDoS attacks. This represents a 16% increase quarter-over-quarter (QoQ) and 83% year-over-year (YoY).
Of the 2024 Q4 DDoS attacks, 49% (3.4 million) were Layer 3/Layer 4 DDoS attacks and 51% (3.5 million) were HTTP DDoS attacks.
Distribution of 6.9 million DDoS attacks: 2024 Q4
HTTP DDoS attacks
The majority of the HTTP DDoS attacks (73%) were launched by known botnets. Rapid detection and blocking of these attacks were made possible as a result of operating a massive network and seeing many types of attacks and botnets. In turn, this allows our security engineers and researchers to craft heuristics to increase mitigation efficacy against these attacks.
An additional 11% were HTTP DDoS attacks that were caught pretending to be a legitimate browser. Another 10% were attacks which contained suspicious or unusual HTTP attributes. The remaining 8% “Other” were generic HTTP floods, volumetric cache busting attacks, and volumetric attacks targeting login endpoints.
Top HTTP DDoS attack vectors: 2024 Q4
These attack vectors, or attack groups, are not necessarily exclusive. For example, known botnets also impersonate browsers and have suspicious HTTP attributes, but this breakdown is our attempt to categorize the HTTP DDoS attacks in a meaningful way.
Top user agents
As of this report’s publication, the current stable version of Chrome for Windows, Mac, iOS, and Android is 132, according to Google’s release notes. However, it seems that threat actors are still behind, as thirteen of the top user agents that appeared most frequently in DDoS attacks were Chrome versions ranging from 118 to 129.
The HITV_ST_PLATFORM user agent had the highest share of DDoS requests out of total requests (99.9%), making it the user agent that’s used almost exclusively in DDoS attacks. In other words, if you see traffic coming from the HITV_ST_PLATFORM user agent, there is a 0.1% chance that it is legitimate traffic.
Threat actors often avoid using uncommon user agents, favoring more common ones like Chrome to blend in with regular traffic. The presence of the HITV_ST_PLATFORM user agent, which is associated with smart TVs and set-top boxes, suggests that the devices involved in certain cyberattacks are compromised smart TVs or set-top boxes. This observation highlights the importance of securing all Internet-connected devices, including smart TVs and set-top boxes, to prevent them from being exploited in cyberattacks.
Top user agents abused in DDoS attacks: 2024 Q4
The user agent hackney came in second place, with 93% of requests containing this user agent being part of a DDoS attack. If you encounter traffic coming from the hackney user agent, there is a 7% chance that it is legitimate traffic. Hackney is an HTTP client library for Erlang, used for making HTTP requests and is popular in Erlang/Elixir ecosystems.
Additional user agents that were used in DDoS attacks are uTorrent, which is associated with a popular BitTorrent client for downloading files. Go-http-client and fasthttp were also commonly used in DDoS attacks. The former is the default HTTP client in Go’s standard library and the latter is a high-performance alternative. fasthttp is used to build fast web applications, but is often exploited for DDoS attacks and web scraping too.
HTTP attributes commonly used in DDoS attacks
HTTP methods
HTTP methods (also called HTTP verbs) define the action to be performed on a resource on a server. They are part of the HTTP protocol and allow communication between clients (such as browsers) and servers.
The GET method is most commonly used. Almost 70% of legitimate HTTP requests made use of the GET method. In second place is the POST method with a share of 27%.
With DDoS attacks, we see a different picture. Almost 14% of HTTP requests using the HEAD method were part of a DDoS attack, despite it hardly being present in legitimate HTTP requests (0.75% of all requests). The DELETE method came in second place, with around 7% of its usage being for DDoS purposes.
The disproportion between methods commonly seen in DDoS attacks versus their presence in legitimate traffic definitely stands out. Security administrators can use this information to optimize their security posture based on these headers.
Distribution of HTTP methods in DDoS attacks and legitimate traffic: 2024 Q4
HTTP paths
An HTTP path describes a specific server resource. Along with the HTTP method, the server will perform the action on the resource.
DDoS attacks often target the root of the website (“/”), but in other cases, they can target specific paths. In 2024 Q4, 98% of HTTP requests towards the /wp-admin/ path were part of DDoS attacks. The /wp-admin/ path is the default administrator dashboard for WordPress websites.
Obviously, many paths are unique to the specific website, but in the graph below, we’ve provided the top generic paths that were attacked the most. Security administrators can use this data to strengthen their protection on these endpoints, as applicable.
Top HTTP paths targeted by HTTP DDoS attacks: 2024 Q4
HTTP vs. HTTPS
In Q4, almost 94% of legitimate traffic was HTTPS. Only 6% was plaintext HTTP (not encrypted). Looking at DDoS attack traffic, around 92% of HTTP DDoS attack requests were over HTTPS and almost 8% were over plaintext HTTP.
HTTP vs. HTTPS in legitimate traffic and DDoS attacks: 2024 Q4
An additional common attack vector, or rather, botnet type, is Mirai. Mirai attacks accounted for 6% of all network layer DDoS attacks — a 131% increase QoQ. In 2024 Q4, a Mirai-variant botnet was responsible for the largest DDoS attack on record, but we’ll discuss that further in the next section.
Emerging attack vectors
Before moving on to the next section, it’s worthwhile to discuss the growth in additional attack vectors that were observed this quarter.
Top emerging threats: 2024 Q4
Memcached DDoS attacks saw the largest growth, with a 314% QoQ increase. Memcached is a database caching system for speeding up websites and networks. Memcached servers that support UDP can be abused to launch amplification or reflection DDoS attacks. In this case, the attacker would request content from the caching system and spoof the victim’s IP address as the source IP in the UDP packets. The victim will be flooded with the Memcache responses, which can be up to 51,200x larger than the initial request.
BitTorrent DDoS attacks also surged this quarter by 304%. The BitTorrent protocol is a communication protocol used for peer-to-peer file sharing. To help the BitTorrent clients find and download the files efficiently, BitTorrent clients may utilize BitTorrent Trackers or Distributed Hash Tables (DHT) to identify the peers that are seeding the desired file. This concept can be abused to launch DDoS attacks. A malicious actor can spoof the victim’s IP address as a seeder IP address within Trackers and DHT systems. Then clients would request the files from those IP addresses. Given a sufficient number of clients requesting the file, it can flood the victim with more traffic than it can handle.
The largest DDoS attack on record
On October 29, a 5.6 Tbps UDP DDoS attack launched by a Mirai-variant botnet targeted a Cloudflare Magic Transit customer, an Internet service provider (ISP) from Eastern Asia. The attack lasted only 80 seconds and originated from over 13,000 IoT devices. Detection and mitigation were fully autonomous by Cloudflare’s distributed defense systems. It required no human intervention, didn’t trigger any alerts, and didn’t cause any performance degradation. The systems worked as intended.
Cloudflare’s autonomous DDoS defenses mitigate a 5.6 Tbps Mirai DDoS attack without human intervention
While the total number of unique source IP addresses was around 13,000, the average unique source IP addresses per second was 5,500. We also saw a similar number of unique source ports per second. In the graph below, each line represents one of the 13,000 different source IP addresses, and as portrayed, each contributed less than 8 Gbps per second. The average contribution of each IP address per second was around 1 Gbps (~0.012% of 5.6 Tbps).
The 13,000 source IP addresses that launched the 5.6 Tbps DDoS attack
Hyper-volumetric DDoS attacks
In 2024 Q3, we started seeing a rise in hyper-volumetric network layer DDoS attacks. In 2024 Q4, the amount of attacks exceeding 1 Tbps increased by 1,885% QoQ and attacks exceeding 100 Million pps (packets per second) increased by 175% QoQ. 16% of the attacks that exceeded 100 Million pps also exceeded 1 Billion pps.
Distribution of hyper-volumetric L3/4 DDoS attacks: 2024 Q4
Attack size
The majority of HTTP DDoS attacks (63%) did not exceed 50,000 requests per second. On the other side of the spectrum, 3% of HTTP DDoS attacks exceeded 100 million requests per second.
Similarly, the majority of network layer DDoS attacks are also small. 93% did not exceed 500 Mbps and 87% did not exceed 50,000 packets per second.
QoQ change in attack size by packet rate: 2024 Q4
QoQ change in attack size by bit rate: 2024 Q4
Attack duration
The majority of HTTP DDoS attacks (72%) end in under ten minutes. Approximately 22% of HTTP DDoS attacks last over one hour, and 11% last over 24 hours.
Similarly, 91% of network layer DDoS attacks also end within ten minutes. Only 2% last over an hour.
Overall, there was a significant QoQ decrease in the duration of DDoS attacks. Because the duration of most attacks is so short, it is not feasible, in most cases, for a human to respond to an alert, analyze the traffic, and apply mitigation. The short duration of attacks emphasizes the need for an in-line, always-on, automated DDoS protection service.
QoQ change in attack duration: 2024 Q4
Attack sources
In the last quarter of 2024, Indonesia remained the largest source of DDoS attacks worldwide for the second consecutive quarter. To understand where attacks are coming from, we map the source IP addresses launching HTTP DDoS attacks because they cannot be spoofed, and for Layer 3/Layer 4 DDoS attacks, we use the location of our data centers where the DDoS packets were ingested. This lets us overcome the spoofability that is possible in Layer 3/Layer 4. We’re able to achieve geographical accuracy due to our extensive network spanning over 330 cities around the world.
Hong Kong came in second, having moved up five spots from the previous quarter. Singapore advanced three spots, coming in third place.
Top 10 largest sources of DDoS attacks: 2024 Q4
Top source networks
An autonomous system (AS) is a large network or group of networks that has a unified routing policy. Every computer or device that connects to the Internet is connected to an AS. To find out what your AS is, visit https://radar.cloudflare.com/ip.
When looking at where the DDoS attacks originate from, specifically HTTP DDoS attacks, there are a few autonomous systems that stand out.
The AS that we saw the most HTTP DDoS attack traffic from in 2024 Q4 was German-based Hetzner (AS24940). Almost 5% of all HTTP DDoS requests originated from Hetzer’s network, or in other words, 5 out of every 100 HTTP DDoS requests that Cloudflare blocked originated from Hetzner.
Top 10 largest source networks of DDoS attacks: 2024 Q4
For many network operators such as the ones listed above, it can be hard to identify the malicious actors that abuse their infrastructure for launching attacks. To help network operators and service providers crack down on the abuse, we provide a freeDDoS Botnet threat intelligence feed that provides ASN owners a list of their IP addresses that we’ve seen participating in DDoS attacks.
Top threat actors
When surveying Cloudflare customers that were targeted by DDoS attacks, the majority said they didn’t know who attacked them. The ones that did know reported their competitors as the number one threat actor behind the attacks (40%). Another 17% reported that a state-level or state-sponsored threat actor was behind the attack, and a similar percentage reported that a disgruntled user or customer was behind the attack.
Another 14% reported that an extortionist was behind the attacks. 7% claimed it was a self-inflicted DDoS, 2% reported hacktivism as the cause of the attack, and another 2% reported that the attacks were launched by former employees.
Top threat actors: 2024 Q4
Ransom DDoS attacks
In the final quarter of 2024, as anticipated, we observed a surge in Ransom DDoS attacks. This spike was predictable, given that Q4 is a prime time for cybercriminals, with increased online shopping, travel arrangements, and holiday activities. Disrupting these services during peak times can significantly impact organizations’ revenues and cause real-world disruptions, such as flight delays and cancellations.
In Q4, 12% of Cloudflare customers that were targeted by DDoS attacks reported being threatened or extorted for a ransom payment. This represents a 78% QoQ increase and 25% YoY growth compared to 2023 Q4.
Reported Ransom DDoS attacks by quarter: 2024
Looking back at the entire year of 2024, Cloudflare received the most reports of Ransom DDoS attacks in May. In Q4, we can see the gradual increase starting from October (10%), November (13%), and December (14%) — a seven-month-high.
Reported Ransom DDoS attacks by month: 2024
Target of attacks
In 2024 Q4, China maintained its position as the most attacked country. To understand which countries are subject to more attacks, we group DDoS attacks by our customers’ billing country.
Philippines makes its first appearance as the second most attacked country in the top 10. Taiwan jumped to third place, up seven spots compared to last quarter.
In the map below, you can see the top 10 most attacked locations and their ranking change compared to the previous quarter.
Top 10 most attacked locations by DDoS attacks: 2024 Q4
Most attacked industries
In the fourth quarter of 2024, the Telecommunications, Service Providers and Carriers industry jumped from the third place (last quarter) to the first place as the most attacked industry. To understand which industries are subject to more attacks, we group DDoS attacks by our customers’ industry. The Internet industry came in second, followed by Marketing and Advertising in third.
The Banking & Financial Services industry dropped seven places from number one in 2024 Q3 to number eight in Q4.
Top 10 most attacked industries by DDoS attacks: 2024 Q4
Our commitment to unmetered DDoS protection
The fourth quarter of 2024 saw a surge in hyper-volumetric Layer 3/Layer 4 DDoS attacks, with the largest one breaking our previous record, peaking at 5.6 Tbps. This rise in attack size renders capacity-limited cloud DDoS protection services or on-premise DDoS appliances obsolete.
The growing use of powerful botnets, driven by geopolitical factors, has broadened the range of vulnerable targets. A rise in Ransom DDoS attacks is also a growing concern.
Too many organizations only implement DDoS protection after suffering an attack. Our observations show that organizations with proactive security strategies are more resilient. At Cloudflare, we invest in automated defenses and a comprehensive security portfolio to provide proactive protection against both current and emerging threats.
With our 321 Tbps network spanning 330 cities globally, we remain committed to providing unmetered and unlimited DDoS protection no matter the size, duration and quantity of the attacks.
Welcome to the 19th edition of the Cloudflare DDoS Threat Report. Released quarterly, these reports provide an in-depth analysis of the DDoS threat landscape as observed across the Cloudflare network. This edition focuses on the third quarter of 2024.
With a 296 Terabit per second (Tbps) network located in over 330 cities worldwide, Cloudflare is used as a reverse proxy by nearly 20% of all websites. Cloudflare holds a unique vantage point to provide valuable insights and trends to the broader Internet community.
Key insights
The number of DDoS attacks spiked in the third quarter of 2024. Cloudflare mitigated nearly 6 million DDoS attacks, representing a 49% increase QoQ and 55% increase YoY.
Out of those 6 million, Cloudflare’s autonomous DDoS defense systems detected and mitigated over 200 hyper-volumetric DDoS attacks exceeding rates of 3 terabits per second (Tbps) and 2 billion packets per second (Bpps). The largest attack peaked at 4.2 Tbps and lasted just a minute.
The Banking & Financial Services industry was subjected to the most DDoS attacks. China was the country most targeted by DDoS attacks, and Indonesia was the largest source of DDoS attacks.
To learn more about DDoS attacks and other types of cyber threats, visit our Learning Center, access previous DDoS threat reports on the Cloudflare blog, or visit our interactive hub, Cloudflare Radar. There’s also a free API for those interested in investigating these and other Internet trends. You can also learn more about the methodologies used in preparing these reports.
Hyper-volumetric campaign
In the first half of 2024, Cloudflare’s autonomous DDoS defense systems automatically detected and mitigated 8.5 million DDoS attacks: 4.5 million in Q1 and 4 million in Q2. In Q3, our systems mitigated nearly 6 million DDoS attacks bringing it to a total of 14.5 million DDoS attacks year-to-date. That’s an average of around 2,200 DDoS attacks every hour.
Of those attacks, Cloudflare mitigated over 200 hyper-volumetric network-layer DDoS attacks that exceeded 1 Tbps or 1 Bpps. The largest attacks peaked at 3.8 Tbps and 2.2 Bpps. Read more about these attacks and how our DDoS defense systems mitigated them autonomously.
Distribution of hyper-volumetric DDoS attacks over time
As we were writing this blog post, our systems continued to detect and mitigate these massive attacks and a new record has just been broken again, only three weeks after our last disclosure. On October 21, 2024, Cloudflare’s systems autonomously detected and mitigated a 4.2 Tbps DDoS attack that lasted around a minute.
4.2 Tbps DDoS attack mitigated autonomously by Cloudflare
DDoS attack types and characteristics
Of the 6 million DDoS attacks, half were HTTP (application layer) DDoS attacks and half were network layer DDoS attacks. Network layer DDoS attacks increased by 51% QoQ and 45% YoY, and HTTP DDoS attacks increased by 61% QoQ and 68% YoY.
Attack duration
90% of DDoS attacks, including the largest of attacks, were very short-lived. We did see, however, a slight increase (7%) in attacks lasting more than an hour. These longer attacks accounted for 3% of all attacks.
On the application layer, 72% of HTTP DDoS attacks were launched by known botnets and automatically mitigated by our proprietary heuristics. The fact that 72% of DDoS attacks were mitigated by our home-grown heuristics showcases the advantages of operating a large network. The volume of traffic and attacks that we see let us craft, test, and deploy robust defenses against botnets.
Another 13% of HTTP DDoS attacks were mitigated due to their suspicious or unusual HTTP attributes, and another 9% were HTTP DDoS attacks launched by fake browsers or browser impersonators. The remaining 6% of “Other” includes attacks that targeted login endpoints and cache busting attacks.
One thing to note is that these attack vectors, or attack groups, are not necessarily exclusive. For example, known botnets also impersonate browsers and have suspicious HTTP attributes, but this breakdown is our attempt to categorize the HTTP DDoS attacks in a meaningful way.
Distribution of DDoS attacks in 2024 Q3
In Q3, we observed a 4,000% increase in SSDP amplification attacks compared to the previous quarter. An SSDP (Simple Service Discovery Protocol) attack is a type of reflection and amplification DDoS attack that exploits the UPnP (Universal Plug and Play) protocol. Attackers send SSDP requests to vulnerable UPnP-enabled devices such as routers, printers, and IP-enabled cameras, and spoof the source IP address to be the victim’s IP address. These devices respond to the victim’s IP address with large amounts of traffic, overwhelming the victim’s infrastructure. The amplification effect allows attackers to generate massive traffic from small requests, causing the victim’s service to go offline. Disabling UPnP on unnecessary devices and using DDoS mitigation strategies can help defend against this attack.
Illustration of an SSDP amplification attack
User agents used in HTTP DDoS attacks
When launching HTTP DDoS attacks, threat actors want to blend in to avoid detection. One tactic to achieve this is to spoof the user agent. This lets them appear as a legitimate browser or client if done successfully.
In Q3, 80% of HTTP DDoS attack traffic impersonated the Google Chrome browser, which was the most common user agent observed in attacks. More specifically, Chrome 118, 119, 120, and 121 were the most common versions.
In second place, no user agent was seen for 9% of HTTP DDoS attack traffic.
In third and fourth place, we observed attacks using the Go-http-client and fasthttp user agents. The former is the default HTTP client in Go’s standard library and the latter is a high-performance alternative. fasthttp is used to build fast web applications, but is often used for DDoS attacks and web scraping too.
Top user agents used in DDoS attacks
The user agent hackney came in fifth place. It’s an HTTP client library for Erlang. It’s used for making HTTP requests and is popular in Erlang/Elixir ecosystems.
An interesting user agent shows up in the sixth place: HITV_ST_PLATFORM. This user agent appears to be associated with smart TVs or set-top boxes. Threat actors typically avoid using uncommon user agents, as evidenced by the frequent use of Chrome user agents in cyberattacks. Therefore, the presence of HITV_ST_PLATFORM likely suggests that the devices in question are indeed compromised smart TVs or set-top boxes.
In seventh place, we saw the uTorrent user agent being used in attacks. This user agent is associated with a popular BitTorrent client that’s used for downloading files.
Lastly, okhttp was the least common user agent in DDoS attacks despite its popularity as an HTTP client for Java and Android applications.
HTTP attack attributes
While 89% of HTTP DDoS attack traffic used the GET method, it is also the most commonly used HTTP method. So when we normalize the attack traffic by dividing the number of attack requests by total request per HTTP method, we get a different picture.
Almost 12% of all requests that used the DELETE method were part of an HTTP DDoS attack. After DELETE, we see that HEAD, PATCH and GET are the methods most commonly used in DDoS attack requests.
While 80% of DDoS attack requests were over HTTP/2 and 19% were over HTTP/1.1, they represented a much smaller portion when normalized by the total traffic by version. When we normalize the attack requests by all requests by version, we see a different picture. Over half of traffic to the non-standard or mislabeled “HTTP/1.2” version was malicious and part of DDoS attacks. It’s important to note that “HTTP/1.2” is not an official version of the protocol.
The vast majority of HTTP DDoS attacks are actually encrypted — almost 94% — using HTTPS.
Targets of DDoS attacks
Top attacked locations
China was the most attacked location in the third quarter of 2024. The United Arab Emirates was ranked second, with Hong Kong in third place, followed closely by Singapore, Germany, and Brazil.
Canada was ranked seventh, followed by South Korea, the United States, and Taiwan as number ten.
Top attacked industries
In the third quarter of 2024, Banking & Financial Services was the most targeted by DDoS attacks. Information Technology & Services was ranked in second place, followed by the Telecommunications, Service Providers, and Carriers sector.
Cryptocurrency, Internet, Gambling & Casinos, and Gaming followed closely behind as the next most targeted industries. Consumer Electronics, Construction & Civil Engineering, and the Retail industries rounded out the top ten most attacked industries.
Sources of DDoS attacks
Threat actors
For a few years now, we’ve been surveying our customers that have been subjected to DDoS attacks. The survey covers various factors, such as the nature of the attack and the threat actors. In the case of threat actors, while 80% of survey respondents said that they don’t know who attacked them, 20% said they did. Of those, 32% said that the threat actors were extortionists. Another 25% said a competitor attacked them, and another 21% said that a disgruntled customer or user was behind the attack. 14% of respondents said that the attacks were carried out by a state or a state-sponsored group. Lastly, 7% said that they mistakenly attacked themselves. One example of when a self-DDoS attack occurs is a post-firmware update for IoT devices that causes all devices to phone home at the same time, resulting in a flood of traffic.
Distribution of the top threat actors
While extortionists were the most common threat actor, overall, reports of Ransom DDoS attacks decreased by 42% QoQ, but increased 17% YoY. A total of 7% of respondents reported being subjected to a Ransom DDoS attack or threatened by the attacker. In August, however, that figure increased to 10% — that’s one out of ten.
Reports of Ransom DDoS attacks by quarter
Top source locations of DDoS attacks
Indonesia was the largest source of DDoS attacks in the third quarter of 2024. The Netherlands was the second-largest source, followed by Germany, Argentina, and Colombia.
The next five largest sources included Singapore, Hong Kong, Russia, Finland, and Ukraine.
Top source networks of DDoS attacks
For service providers that operate their own networks and infrastructure, it can be difficult to identify who is using their infrastructure for malicious intent, such as generating DDoS attacks. For this reason, we provide a free threat intelligence feed to network operators. This feed provides service providers information on IP addresses from within their networks that we’ve seen participate in subsequent DDoS attacks.
On that note, Hetzner (AS24940), a German-based IT provider, was the largest source of HTTP DDoS attacks in the third quarter of 2024. Linode (AS63949), a cloud computing platform acquired by Akamai in 2022, was the second-largest source of HTTP DDoS attacks. Vultr (AS64515), a Florida-based service provider, came in third place.
Networks that were that largest sources of HTTP DDoS attacks in 2024 Q3
Key takeaways
This quarter, we observed an unprecedented surge in hyper-volumetric DDoS attacks, with peaks reaching 3.8 Tbps and 2.2 Bpps. This mirrors a similar trend from the same period last year, when application layer attacks in the HTTP/2 Rapid Reset campaign exceeded 200 million requests per second (Mrps). These massive attacks are capable of overwhelming Internet properties, particularly those relying on capacity-limited cloud services or on-premise solutions.
The increasing use of powerful botnets, fueled by geopolitical tensions and global events, is expanding the range of organizations at risk — many of which were not traditionally considered prime targets for DDoS attacks. Unfortunately, too many organizations reactively deploy DDoS protections after an attack has already caused significant damage.
Our observations confirm that businesses with well-prepared, comprehensive security strategies are far more resilient against these cyberthreats. At Cloudflare, we’re committed to safeguarding your Internet presence. Through significant investment in our automated defenses and a robust portfolio of security products, we ensure proactive protection against both current and emerging threats — so you don’t have to.
Welcome to the 18th edition of the Cloudflare DDoS Threat Report. Released quarterly, these reports provide an in-depth analysis of the DDoS threat landscape as observed across the Cloudflare network. This edition focuses on the second quarter of 2024.
With a 280 terabit per second network located across over 230 cities worldwide, serving 19% of all websites, Cloudflare holds a unique vantage point that enables us to provide valuable insights and trends to the broader Internet community.
Key insights for 2024 Q2
Cloudflare recorded a 20% year-over-year increase in DDoS attacks.
1 out of every 25 survey respondents said that DDoS attacks against them were carried out by state-level or state-sponsored threat actors.
Threat actor capabilities reached an all-time high as our automated defenses generated 10 times more fingerprints to counter and mitigate the ultrasophisticated DDoS attacks.
Quick recap – what is a DDoS attack?
Before diving in deeper, let’s recap what a DDoS attack is. Short for Distributed Denial of Service, a DDoS attack is a type of cyber attack designed to take down or disrupt Internet services, such as websites or mobile apps, making them unavailable to users. This is typically achieved by overwhelming the victim’s server with more traffic than it can handle — usually from multiple sources across the Internet, rendering it unable to handle legitimate user traffic.
Diagram of a DDoS attack
To learn more about DDoS attacks and other types of cyber threats, visit our Learning Center, access previous DDoS threat reports on the Cloudflare blog or visit our interactive hub, Cloudflare Radar. There’s also a free API for those interested in investigating these and other Internet trends.
To learn about our report preparation, refer to our Methodologies.
Threat actor sophistication fuels the continued increase in DDoS attacks
In the first half of 2024, we mitigated 8.5 million DDoS attacks: 4.5 million in Q1 and 4 million in Q2. Overall, the number of DDoS attacks in Q2 decreased by 11% quarter-over-quarter, but increased 20% year-over-year.
Distribution of DDoS attacks by types and vectors
For context, in the entire year of 2023, we mitigated 14 million DDoS attacks, and halfway through 2024, we have already mitigated 60% of last year’s figure.
Cloudflare successfully mitigated 10.2 trillion HTTP DDoS requests and 57 petabytes of network-layer DDoS attack traffic, preventing it from reaching our customers’ origin servers.
DDoS attacks stats for 2024 Q2
When we break it down further, those 4 million DDoS attacks were composed of 2.2 million network-layer DDoS attacks and 1.8 million HTTP DDoS attacks. This number of 1.8 million HTTP DDoS attacks has been normalized to compensate for the explosion in sophisticated and randomized HTTP DDoS attacks. Our automated mitigation systems generate real-time fingerprints for DDoS attacks, and due to the randomized nature of these sophisticated attacks, we observed many fingerprints being generated for single attacks. The actual number of fingerprints that was generated was closer to 19 million – over ten times larger than the normalized figure of 1.8 million. The millions of fingerprints that were generated to deal with the randomization stemmed from a few single rules. These rules did their job to stop attacks, but they inflated the numbers, so we excluded them from the calculation.
HTTP DDoS attacks by quarter, with the excluded fingerprints
This ten-fold difference underscores the dramatic change in the threat landscape. The tools and capabilities that allowed threat actors to carry out such randomized and sophisticated attacks were previously associated with capabilities reserved for state-level actors or state-sponsored actors. But, coinciding with the rise of generative AI and autopilot systems that can help actors write better code faster, these capabilities have made their way to the common cyber criminal.
Ransom DDoS attacks
In May 2024, the percentage of attacked Cloudflare customers that reported being threatened by a DDoS attack threat actor, or subjected to a Ransom DDoS attack reached 16% – the highest it’s been in the past 12 months. The quarter started relatively low, at 7% of customers reporting a threat or a ransom attack. That quickly jumped to 16% in May and slightly dipped in June to 14%.
Percentage of customers reporting DDoS threats or ransom extortion (by month)
Overall, ransom DDoS attacks have been increasing quarter over quarter throughout the past year. In Q2 2024, the percentage of customers that reported being threatened or extorted was 12.3%, slightly higher than the previous quarter (10.2%) but similar to the percentage of the year before (also 12.0%).
Percentage of customers reporting DDoS threats or ransom extortion (by quarter)
Threat actors
75% of respondents reported that they did not know who attacked them or why. These respondents are Cloudflare customers that were targeted by HTTP DDoS attacks.
Of the respondents that claim they did know, 59% said it was a competitor who attacked them. Another 21% said the DDoS attack was carried out by a disgruntled customer or user, and another 17% said that the attacks were carried out by state-level or state-sponsored threat actors. The remaining 3% reported it being a self-inflicted DDoS attack.
Percentage of threat actor type reported by Cloudflare customers, excluding unknown attackers and outliers
Top attacked countries and regions
In the second quarter of 2024, China was ranked the most attacked country in the world. This ranking takes into consideration HTTP DDoS attacks, network-layer DDoS attacks, the total volume and the percentage of DDoS attack traffic out of the total traffic, and the graphs show this overall DDoS attack activity per country or region. A longer bar in the chart means more attack activity.
After China, Turkey came in second place, followed by Singapore, Hong Kong, Russia, Brazil, and Thailand. The remaining countries and regions comprising the top 15 most attacked countries are provided in the chart below.
15 most attacked countries and regions in 2024 Q2
Most attacked industries
The Information Technology & Services was ranked as the most targeted industry in the second quarter of 2024. The ranking methodologies that we’ve used here follow the same principles as previously described to distill the total volume and relative attack traffic for both HTTP and network-layer DDoS attacks into one single DDoS attack activity ranking.
The Telecommunications, Services Providers and Carrier sector came in second. Consumer Goods came in third place.
15 most attacked industries in 2024 Q2
When analyzing only the HTTP DDoS attacks, we see a different picture. Gaming and Gambling saw the most attacks in terms of HTTP DDoS attack request volume. The per-region breakdown is provided below.
Top attacked industries by region (HTTP DDoS attacks)
Largest sources of DDoS attacks
Libya was ranked as the largest source of DDoS attacks in the second quarter of 2024. The ranking methodologies that we’ve used here follow the same principles as previously described to distill the total volume and relative attack traffic for both HTTP and network-layer DDoS attacks into one single DDoS attack activity ranking.
Indonesia followed closely in second place, followed by the Netherlands in third.
15 largest sources of DDoS attacks in 2024 Q2
DDoS attack characteristics
Network-layer DDoS attack vectors
Despite a 49% decrease quarter-over-quarter, DNS-based DDoS attacks remain the most common attack vector, with a combined share of 37% for DNS floods and DNS amplification attacks. SYN floods came in second place with a share of 23%, followed by RST floods accounting for a little over 10%. SYN floods and RST floods are both types of TCP-based DDoS attacks. Collectively, all types of TCP-based DDoS attacks accounted for 38% of all network-layer DDoS attacks.
Top attack vectors (network-layer)
HTTP DDoS attack vectors
One of the advantages of operating a large network is that we see a lot of traffic and attacks. This helps us improve our detection and mitigation systems to protect our customers. In the last quarter, half of all HTTP DDoS attacks were mitigated using proprietary heuristics that targeted botnets known to Cloudflare. These heuristics guide our systems on how to generate a real-time fingerprint to match against the attacks.
Another 29% were HTTP DDoS attacks that used fake user agents, impersonated browsers, or were from headless browsers. An additional 13% had suspicious HTTP attributes which triggered our automated system, and 7% were marked as generic floods. One thing to note is that these attack vectors, or attack groups, are not necessarily exclusive. For example, known botnets also impersonate browsers and have suspicious HTTP attributes, but this breakdown is our initial attempt to categorize the HTTP DDoS attacks.
Top attack vectors (HTTP)
HTTP versions used in DDoS attacks
In Q2, around half of all web traffic used HTTP/2, 29% used HTTP/1.1, an additional fifth used HTTP/3, nearly 0.62% used HTTP/1.0, and 0.01% for HTTP/1.2.
Distribution of web traffic by HTTP version
HTTP DDoS attacks follow a similar pattern in terms of version adoption, albeit a larger bias towards HTTP/2. 76% of HTTP DDoS attack traffic was over the HTTP/2 version and nearly 22% over HTTP/1.1. HTTP/3, on the other hand, saw a much smaller usage. Only 0.86% of HTTP DDoS attack traffic were over HTTP/3 — as opposed to its much broader adoption of 20% by all web traffic.
Distribution of HTTP DDoS attack traffic by HTTP version
DDoS attack duration
The vast majority of DDoS attacks are short. Over 57% of HTTP DDoS attacks and 88% of network-layer DDoS attacks end within 10 minutes or less. This emphasizes the need for automated, in-line detection and mitigation systems. Ten minutes are hardly enough time for a human to respond to an alert, analyze the traffic, and apply manual mitigations.
On the other side of the graphs, we can see that approximately a quarter of HTTP DDoS attacks last over an hour, and almost a fifth last more than a day. On the network layer, longer attacks are significantly less common. Only 1% of network-layer DDoS attacks last more than 3 hours.
HTTP DDoS attacks: distribution by durationNetwork-layer DDoS attacks: distribution by duration
DDoS attack size
Most DDoS attacks are relatively small. Over 95% of network-layer DDoS attacks stay below 500 megabits per second, and 86% stay below 50,000 packets per second.
Distribution of network-layer DDoS attacks by bit rateDistribution of network-layer DDoS attacks by packet rate
Similarly, 81% of HTTP DDoS attacks stay below 50,000 requests per second. Although these rates are small on Cloudflare’s scale, they can still be devastating for unprotected websites unaccustomed to such traffic levels.
Distribution of HTTP DDoS attacks by request rate
Despite the majority of attacks being small, the number of larger volumetric attacks has increased. One out of every 100 network-layer DDoS attacks exceed 1 million packets per second (pps), and two out of every 100 exceed 500 gigabits per second. On layer 7, four out of every 1,000 HTTP DDoS attacks exceed 1 million requests per second.
Key takeaways
The majority of DDoS attacks are small and quick. However, even these attacks can disrupt online services that do not follow best practices for DDoS defense.
Furthermore, threat actor sophistication is increasing, perhaps due to the availability of Generative AI and developer copilot tools, resulting in attack code that delivers DDoS attacks that are harder to defend against. Even prior to the rise in attack sophistication, many organizations struggled to defend against these threats on their own. But they don’t need to. Cloudflare is here to help. We invest significant resources – so you don’t have to – to ensure our automated defenses, along with the entire portfolio of Cloudflare security products, to protect against existing and emerging threats.
Welcome to the 17th edition of Cloudflare’s DDoS threat report. This edition covers the DDoS threat landscape along with key findings as observed from the Cloudflare network during the first quarter of 2024.
What is a DDoS attack?
But first, a quick recap. A DDoS attack, short for Distributed Denial of Service attack, is a type of cyber attack that aims to take down or disrupt Internet services such as websites or mobile apps and make them unavailable for users. DDoS attacks are usually done by flooding the victim’s server with more traffic than it can handle.
To learn more about DDoS attacks and other types of attacks, visit our Learning Center.
Accessing previous reports
Quick reminder that you can access previous editions of DDoS threat reports on the Cloudflare blog. They are also available on our interactive hub, Cloudflare Radar. On Radar, you can find global Internet traffic, attacks, and technology trends and insights, with drill-down and filtering capabilities, so you can zoom in on specific countries, industries, and networks. There’s also a free API allowing academics, data sleuths, and other web enthusiasts to investigate Internet trends across the globe.
To learn how we prepare this report, refer to our Methodologies.
2024 Q1 key insights
Key insights from the first quarter of 2024 include:
2024 started with a bang. Cloudflare’s defense systems automatically mitigated 4.5 million DDoS attacks during the first quarter — representing a 50% year-over-year (YoY) increase.
DNS-based DDoS attacks increased by 80% YoY and remain the most prominent attack vector.
DDoS attacks on Sweden surged by 466% after its acceptance to the NATO alliance, mirroring the pattern observed during Finland’s NATO accession in 2023.
Starting 2024 with a bang
We’ve just wrapped up the first quarter of 2024, and, already, our automated defenses have mitigated 4.5 million DDoS attacks — an amount equivalent to 32% of all the DDoS attacks we mitigated in 2023.
Breaking it down to attack types, HTTP DDoS attacks increased by 93% YoY and 51% quarter-over-quarter (QoQ). Network-layer DDoS attacks, also known as L3/4 DDoS attacks, increased by 28% YoY and 5% QoQ.
2024 Q1: Cloudflare mitigated 4.5 million DDoS attacks
When comparing the combined number of HTTP DDoS attacks and L3/4 DDoS attacks, we can see that, overall, in the first quarter of 2024, the count increased by 50% YoY and 18% QoQ.
DDoS attacks by year and quarter
In total, our systems mitigated 10.5 trillion HTTP DDoS attack requests in Q1. Our systems also mitigated over 59 petabytes of DDoS attack traffic — just on the network-layer.
Among those network-layer DDoS attacks, many of them exceeded the 1 terabit per second rate — almost on a weekly basis. The largest attack that we have mitigated so far in 2024 was launched by a Mirai-variant botnet. This attack reached 2 Tbps and was aimed at an Asian hosting provider protected by Cloudflare Magic Transit. Cloudflare’s systems automatically detected and mitigated the attack.
The Mirai botnet, infamous for its massive DDoS attacks, was primarily composed of infected IoT devices. It notably disrupted Internet access across the US in 2016 by targeting DNS service providers. Almost eight years later, Mirai attacks are still very common. Four out of every 100 HTTP DDoS attacks, and two out of every 100 L3/4 DDoS attacks are launched by a Mirai-variant botnet. The reason we say “variant” is that the Mirai source code was made public, and over the years there have been many permutations of the original.
Mirai botnet targets Asian hosting provider with 2 Tbps DDoS attack
DNS attacks surge by 80%
In March 2024, we introduced one of our latest DDoS defense systems, the Advanced DNS Protection system. This system complements our existing systems, and is designed to protect against the most sophisticated DNS-based DDoS attacks.
It is not out of the blue that we decided to invest in this new system. DNS-based DDoS attacks have become the most prominent attack vector and its share among all network-layer attacks continues to grow. In the first quarter of 2024, the share of DNS-based DDoS attacks increased by 80% YoY, growing to approximately 54%.
DNS-based DDoS attacks by year and quarter
Despite the surge in DNS attacks and due to the overall increase in all types of DDoS attacks, the share of each attack type, remarkably, remains the same as seen in our previous report for the final quarter of 2023. HTTP DDoS attacks remain at 37% of all DDoS attacks, DNS DDoS attacks at 33%, and the remaining 30% is left for all other types of L3/4 attacks, such as SYN Flood and UDP Floods.
Attack type distribution
And in fact, SYN Floods were the second most common L3/4 attack. The third was RST Floods, another type of TCP-based DDoS attack. UDP Floods came in fourth with a 6% share.
Top attack vectors
When analyzing the most common attack vectors, we also check for the attack vectors that experienced the largest growth but didn’t necessarily make it into the top ten list. Among the top growing attack vectors (emerging threats), Jenkins Flood experienced the largest growth of over 826% QoQ.
Jenkins Flood is a DDoS attack that exploits vulnerabilities in the Jenkins automation server, specifically through UDP multicast/broadcast and DNS multicast services. Attackers can send small, specially crafted requests to a publicly facing UDP port on Jenkins servers, causing them to respond with disproportionately large amounts of data. This can amplify the traffic volume significantly, overwhelming the target’s network and leading to service disruption. Jenkins addressed this vulnerability (CVE-2020-2100) in 2020 by disabling these services by default in later versions. However, as we can see, even 4 years later, this vulnerability is still being abused in the wild to launch DDoS attacks.
Attack vectors that experienced the largest growth QoQ
The HTTP/2 Continuation Flood vulnerability targets HTTP/2 protocol implementations that improperly handle HEADERS and multiple CONTINUATION frames. The threat actor sends a sequence of CONTINUATION frames without the END_HEADERS flag, leading to potential server issues such as out-of-memory crashes or CPU exhaustion. HTTP/2 Continuation Flood allows even a single machine to disrupt websites and APIs using HTTP/2, with the added challenge of difficult detection due to no visible requests in HTTP access logs.
This vulnerability poses a potentially severe threat more damaging than the previously known
HTTP/2 Rapid Reset, which resulted in some of the largest HTTP/2 DDoS attack campaigns in recorded history. During that campaign, thousands of hyper-volumetric DDoS attacks targeted Cloudflare. The attacks were multi-million requests per second strong. The average attack rate in that campaign, recorded by Cloudflare, was 30M rps. Approximately 89 of the attacks peaked above 100M rps and the largest one we saw hit 201M rps. Additional coverage was published in our 2023 Q3 DDoS threat report.
HTTP/2 Rapid Reset campaign of hyper-volumetric DDoS attacks in 2023 Q3
Cloudflare’s network, its HTTP/2 implementation, and customers using our WAF/CDN services are not affected by this vulnerability. Furthermore, we are not currently aware of any threat actors exploiting this vulnerability in the wild.
Multiple CVEs have been assigned to the various implementations of HTTP/2 that are impacted by this vulnerability. A CERT alert published by Christopher Cullen at Carnegie Mellon University, which was covered by Bleeping Computer, lists the various CVEs:
Affected service
CVE
Details
Node.js HTTP/2 server
CVE-2024-27983
Sending a few HTTP/2 frames can cause a race condition and memory leak, leading to a potential denial of service event.
Envoy’s oghttp codec
CVE-2024-27919
Not resetting a request when header map limits are exceeded can cause unlimited memory consumption which can potentially lead to a denial of service event.
Tempesta FW
CVE-2024-2758
Its rate limits are not entirely effective against empty CONTINUATION frames flood, potentially leading to a denial of service event.
amphp/http
CVE-2024-2653
It collects CONTINUATION frames in an unbounded buffer, risking an out of memory (OOM) crash if the header size limit is exceeded, potentially resulting in a denial of service event.
Go’s net/http and net/http2 packages
CVE-2023-45288
Allows an attacker to send an arbitrarily large set of headers, causing excessive CPU consumption, potentially leading to a denial of service event.
nghttp2 library
CVE-2024-28182
Involves an implementation using nghttp2 library, which continues to receive CONTINUATION frames, potentially leading to a denial of service event without proper stream reset callback.
Apache Httpd
CVE-2024-27316
A flood of CONTINUATION frames without the END_HEADERS flag set can be sent, resulting in the improper termination of requests, potentially leading to a denial of service event.
Apache Traffic Server
CVE-2024-31309
HTTP/2 CONTINUATION floods can cause excessive resource consumption on the server, potentially leading to a denial of service event.
Envoy versions 1.29.2 or earlier
CVE-2024-30255
Consumption of significant server resources can lead to CPU exhaustion during a flood of CONTINUATION frames, which can potentially lead to a denial of service event.
Top attacked industries
When analyzing attack statistics, we use our customer’s industry as it is recorded in our systems to determine the most attacked industries. In the first quarter of 2024, the top attacked industry by HTTP DDoS attacks in North America was Marketing and Advertising. In Africa and Europe, the Information Technology and Internet industry was the most attacked. In the Middle East, the most attacked industry was Computer Software. In Asia, the most attacked industry was Gaming and Gambling. In South America, it was the Banking, Financial Services and Insurance (BFSI) industry. Last but not least, in Oceania, was the Telecommunications industry.
Top attacked industries by HTTP DDoS attacks, by region
Globally, the Gaming and Gambling industry was the number one most targeted by HTTP DDoS attacks. Just over seven of every 100 DDoS requests that Cloudflare mitigated were aimed at the Gaming and Gambling industry. In second place, the Information Technology and Internet industry, and in third, Marketing and Advertising.
Top attacked industries by HTTP DDoS attacks
With a share of 75% of all network-layer DDoS attack bytes, the Information Technology and Internet industry was the most targeted by network-layer DDoS attacks. One possible explanation for this large share is that Information Technology and Internet companies may be “super aggregators” of attacks and receive DDoS attacks that are actually targeting their end customers. The Telecommunications industry, the Banking, Financial Services and Insurance (BFSI) industry, the Gaming and Gambling industry and the Computer Software industry accounted for the next three percent.
Top attacked industries by L3/4 DDoS attacks
When normalizing the data by dividing the attack traffic by the total traffic to a given industry, we get a completely different picture. On the HTTP front, Law Firms and Legal Services was the most attacked industry, as over 40% of their traffic was HTTP DDoS attack traffic. The Biotechnology industry came in second with a 20% share of HTTP DDoS attack traffic. In third place, Nonprofits had an HTTP DDoS attack share of 13%. In fourth, Aviation and Aerospace, followed by Transportation, Wholesale, Government Relations, Motion Pictures and Film, Public Policy, and Adult Entertainment to complete the top ten.
Top attacked industries by HTTP DDoS attacks (normalized)
Back to the network layer, when normalized, Information Technology and Internet remained the number one most targeted industry by L3/4 DDoS attacks, as almost a third of their traffic were attacks. In second, Textiles had a 4% attack share. In third, Civil Engineering, followed by Banking Financial Services and Insurance (BFSI), Military, Construction, Medical Devices, Defense and Space, Gaming and Gambling, and lastly Retail to complete the top ten.
Top attacked industries by L3/4 DDoS attacks (normalized)
Largest sources of DDoS attacks
When analyzing the sources of HTTP DDoS attacks, we look at the source IP address to determine the origination location of those attacks. A country/region that’s a large source of attacks indicates that there is most likely a large presence of botnet nodes behind Virtual Private Network (VPN) or proxy endpoints that attackers may use to obfuscate their origin.
In the first quarter of 2024, the United States was the largest source of HTTP DDoS attack traffic, as a fifth of all DDoS attack requests originated from US IP addresses. China came in second, followed by Germany, Indonesia, Brazil, Russia, Iran, Singapore, India, and Argentina.
The top sources of HTTP DDoS attacks
At the network layer, source IP addresses can be spoofed. So, instead of relying on IP addresses to understand the source, we use the location of our data centers where the attack traffic was ingested. We can gain geographical accuracy due to Cloudflare’s large global coverage in over 310 cities around the world.
Using the location of our data centers, we can see that in the first quarter of 2024, over 40% L3/4 DDoS attack traffic was ingested in our US data centers, making the US the largest source of L3/4 attacks. Far behind, in second, Germany at 6%, followed by Brazil, Singapore, Russia, South Korea, Hong Kong, United Kingdom, Netherlands, and Japan.
The top sources of L3/4 DDoS attacks
When normalizing the data by dividing the attack traffic by the total traffic to a given country or region, we get a totally different lineup. Almost a third of the HTTP traffic originating from Gibraltar was DDoS attack traffic, making it the largest source. In second place, Saint Helena, followed by the British Virgin Islands, Libya, Paraguay, Mayotte, Equatorial Guinea, Argentina, and Angola.
The top sources of HTTP DDoS attacks (normalized)
Back to the network layer, normalized, things look rather different as well. Almost 89% of the traffic we ingested in our Zimbabwe-based data centers were L3/4 DDoS attacks. In Paraguay, it was over 56%, followed by Mongolia reaching nearly a 35% attack share. Additional top locations included Moldova, Democratic Republic of the Congo, Ecuador, Djibouti, Azerbaijan, Haiti, and Dominican Republic.
The top sources of L3/4 DDoS attacks (normalized)
Most attacked locations
When analyzing DDoS attacks against our customers, we use their billing country to determine the “attacked country (or region)”. In the first quarter of 2024, the US was the most attacked by HTTP DDoS attacks. Approximately one out of every 10 DDoS requests that Cloudflare mitigated targeted the US. In second, China, followed by Canada, Vietnam, Indonesia, Singapore, Hong Kong, Taiwan, Cyprus, and Germany.
Top attacked countries and regions by HTTP DDoS attacks
When normalizing the data by dividing the attack traffic by the total traffic to a given country or region, the list changes drastically. Over 63% of HTTP traffic to Nicaragua was DDoS attack traffic, making it the most attacked location. In second, Albania, followed by Jordan, Guinea, San Marino, Georgia, Indonesia, Cambodia, Bangladesh, and Afghanistan.
Top attacked countries and regions by HTTP DDoS attacks (normalized)
On the network layer, China was the number one most attacked location, as 39% of all DDoS bytes that Cloudflare mitigated during the first quarter of 2024 were aimed at Cloudflare’s Chinese customers. Hong Kong came in second place, followed by Taiwan, the United States, and Brazil.
Top attacked countries and regions by L3/4 DDoS attacks
Back to the network layer, when normalized, Hong Kong takes the lead as the most targeted location. L3/4 DDoS attack traffic accounted for over 78% of all Hong Kong-bound traffic. In second place, China with a DDoS share of 75%, followed by Kazakhstan, Thailand, Saint Vincent and the Grenadines, Norway, Taiwan, Turkey, Singapore, and Brazil.
Top attacked countries and regions by L3/4 DDoS attacks (normalized)
Cloudflare is here to help – no matter the attack type, size, or duration
Cloudflare’s mission is to help build a better Internet, a vision where it remains secure, performant, and accessible to everyone. With four out of every 10 HTTP DDoS attacks lasting over 10 minutes and approximately three out of 10 extending beyond an hour, the challenge is substantial. Yet, whether an attack involves over 100,000 requests per second, as is the case in one out of every 10 attacks, or even exceeds a million requests per second — a rarity seen in only four out of every 1,000 attacks — Cloudflare’s defenses remain impenetrable.
Since pioneering unmetered DDoS Protection in 2017, Cloudflare has steadfastly honored its promise to provide enterprise-grade DDoS protection at no cost to all organizations, ensuring that our advanced technology and robust network architecture do not just fend off attacks but also preserve performance without compromise.
Welcome to the sixteenth edition of Cloudflare’s DDoS Threat Report. This edition covers DDoS trends and key findings for the fourth and final quarter of the year 2023, complete with a review of major trends throughout the year.
What are DDoS attacks?
DDoS attacks, or distributed denial-of-service attacks, are a type of cyber attack that aims to disrupt websites and online services for users, making them unavailable by overwhelming them with more traffic than they can handle. They are similar to car gridlocks that jam roads, preventing drivers from getting to their destination.
There are three main types of DDoS attacks that we will cover in this report. The first is an HTTP request intensive DDoS attack that aims to overwhelm HTTP servers with more requests than they can handle to cause a denial of service event. The second is an IP packet intensive DDoS attack that aims to overwhelm in-line appliances such as routers, firewalls, and servers with more packets than they can handle. The third is a bit-intensive attack that aims to saturate and clog the Internet link causing that ‘gridlock’ that we discussed. In this report, we will highlight various techniques and insights on all three types of attacks.
Previous editions of the report can be found here, and are also available on our interactive hub, Cloudflare Radar. Cloudflare Radar showcases global Internet traffic, attacks, and technology trends and insights, with drill-down and filtering capabilities for zooming in on insights of specific countries, industries, and service providers. Cloudflare Radar also offers a free API allowing academics, data sleuths, and other web enthusiasts to investigate Internet usage across the globe.
To learn how we prepare this report, refer to our Methodologies.
Key findings
In Q4, we observed a 117% year-over-year increase in network-layer DDoS attacks, and overall increased DDoS activity targeting retail, shipment and public relations websites during and around Black Friday and the holiday season.
In Q4, DDoS attack traffic targeting Taiwan registered a 3,370% growth, compared to the previous year, amidst the upcoming general election and reported tensions with China. The percentage of DDoS attack traffic targeting Israeli websites grew by 27% quarter-over-quarter, and the percentage of DDoS attack traffic targeting Palestinian websites grew by 1,126% quarter-over-quarter — as the military conflict between Israel and Hamas continues.
In Q4, there was a staggering 61,839% surge in DDoS attack traffic targeting Environmental Services websites compared to the previous year, coinciding with the 28th United Nations Climate Change Conference (COP 28).
For an in-depth analysis of these key findings and additional insights that could redefine your understanding of current cybersecurity challenges, read on!
Illustration of a DDoS attack
Hyper-volumetric HTTP DDoS attacks
2023 was the year of uncharted territories. DDoS attacks reached new heights — in size and sophistication. The wider Internet community, including Cloudflare, faced a persistent and deliberately engineered campaign of thousands of hyper-volumetric DDoS attacks at never before seen rates.
These attacks were highly complex and exploited an HTTP/2 vulnerability. Cloudflare developed purpose-built technology to mitigate the vulnerability’s effect and worked with others in the industry to responsibly disclose it.
As part of this DDoS campaign, in Q3 our systems mitigated the largest attack we’ve ever seen — 201 million requests per second (rps). That’s almost 8 times larger than our previous 2022 record of 26 million rps.
Largest HTTP DDoS attacks as seen by Cloudflare, by year
Growth in network-layer DDoS attacks
After the hyper-volumetric campaign subsided, we saw an unexpected drop in HTTP DDoS attacks. Overall in 2023, our automated defenses mitigated over 5.2 million HTTP DDoS attacks consisting of over 26 trillion requests. That averages at 594 HTTP DDoS attacks and 3 billion mitigated requests every hour.
Despite these astronomical figures, the amount of HTTP DDoS attack requests actually declined by 20% compared to 2022. This decline was not just annual but was also observed in 2023 Q4 where the number of HTTP DDoS attack requests decreased by 7% YoY and 18% QoQ.
On the network-layer, we saw a completely different trend. Our automated defenses mitigated 8.7 million network-layer DDoS attacks in 2023. This represents an 85% increase compared to 2022.
In 2023 Q4, Cloudflare’s automated defenses mitigated over 80 petabytes of network-layer attacks. On average, our systems auto-mitigated 996 network-layer DDoS attacks and 27 terabytes every hour. The number of network-layer DDoS attacks in 2023 Q4 increased by 175% YoY and 25% QoQ.
HTTP and Network-layer DDoS attacks by quarter
DDoS attacks increase during and around COP 28
In the final quarter of 2023, the landscape of cyber threats witnessed a significant shift. While the Cryptocurrency sector was initially leading in terms of the volume of HTTP DDoS attack requests, a new target emerged as a primary victim. The Environmental Services industry experienced an unprecedented surge in HTTP DDoS attacks, with these attacks constituting half of all its HTTP traffic. This marked a staggering 618-fold increase compared to the previous year, highlighting a disturbing trend in the cyber threat landscape.
This surge in cyber attacks coincided with COP 28, which ran from November 30th to December 12th, 2023. The conference was a pivotal event, signaling what many considered the ‘beginning of the end’ for the fossil fuel era. It was observed that in the period leading up to COP 28, there was a noticeable spike in HTTP attacks targeting Environmental Services websites. This pattern wasn’t isolated to this event alone.
Looking back at historical data, particularly during COP 26 and COP 27, as well as other UN environment-related resolutions or announcements, a similar pattern emerges. Each of these events was accompanied by a corresponding increase in cyber attacks aimed at Environmental Services websites.
In February and March 2023, significant environmental events like the UN’s resolution on climate justice and the launch of United Nations Environment Programme’s Freshwater Challenge potentially heightened the profile of environmental websites, possibly correlating with an increase in attacks on these sites.
This recurring pattern underscores the growing intersection between environmental issues and cyber security, a nexus that is increasingly becoming a focal point for attackers in the digital age.
DDoS attacks and Iron Swords
It’s not just UN resolutions that trigger DDoS attacks. Cyber attacks, and particularly DDoS attacks, have long been a tool of war and disruption. We witnessed an increase in DDoS attack activity in the Ukraine-Russia war, and now we’re also witnessing it in the Israel-Hamas war. We first reported the cyber activity in our report Cyber attacks in the Israel-Hamas war, and we continued to monitor the activity throughout Q4.
DDoS attacks targeting Israeli and Palestinian websites, by industry
Relative to each region’s traffic, the Palestinian territories was the second most attacked region by HTTP DDoS attacks in Q4. Over 10% of all HTTP requests towards Palestinian websites were DDoS attacks, a total of 1.3 billion DDoS requests — representing a 1,126% increase in QoQ. 90% of these DDoS attacks targeted Palestinian Banking websites. Another 8% targeted Information Technology and Internet platforms.
Top attacked Palestinian industries
Similarly, our systems automatically mitigated over 2.2 billion HTTP DDoS requests targeting Israeli websites. While 2.2 billion represents a decrease compared to the previous quarter and year, it did amount to a larger percentage out of the total Israel-bound traffic. This normalized figure represents a 27% increase QoQ but a 92% decrease YoY. Notwithstanding the larger amount of attack traffic, Israel was the 77th most attacked region relative to its own traffic. It was also the 33rd most attacked by total volume of attacks, whereas the Palestinian territories was 42nd.
Of those Israeli websites attacked, Newspaper & Media were the main target — receiving almost 40% of all Israel-bound HTTP DDoS attacks. The second most attacked industry was the Computer Software industry. The Banking, Financial Institutions, and Insurance (BFSI) industry came in third.
Top attacked Israeli industries
On the network layer, we see the same trend. Palestinian networks were targeted by 470 terabytes of attack traffic — accounting for over 68% of all traffic towards Palestinian networks. Surpassed only by China, this figure placed the Palestinian territories as the second most attacked region in the world, by network-layer DDoS attack, relative to all Palestinian territories-bound traffic. By absolute volume of traffic, it came in third. Those 470 terabytes accounted for approximately 1% of all DDoS traffic that Cloudflare mitigated.
Israeli networks, though, were targeted by only 2.4 terabytes of attack traffic, placing it as the 8th most attacked country by network-layer DDoS attacks (normalized). Those 2.4 terabytes accounted for almost 10% of all traffic towards Israeli networks.
Top attacked countries
When we turned the picture around, we saw that 3% of all bytes that were ingested in our Israeli-based data centers were network-layer DDoS attacks. In our Palestinian-based data centers, that figure was significantly higher — approximately 17% of all bytes.
On the application layer, we saw that 4% of HTTP requests originating from Palestinian IP addresses were DDoS attacks, and almost 2% of HTTP requests originating from Israeli IP addresses were DDoS attacks as well.
Main sources of DDoS attacks
In the third quarter of 2022, China was the largest source of HTTP DDoS attack traffic. However, since the fourth quarter of 2022, the US took the first place as the largest source of HTTP DDoS attacks and has maintained that undesirable position for five consecutive quarters. Similarly, our data centers in the US are the ones ingesting the most network-layer DDoS attack traffic — over 38% of all attack bytes.
HTTP DDoS attacks originating from China and the US by quarter
Together, China and the US account for a little over a quarter of all HTTP DDoS attack traffic in the world. Brazil, Germany, Indonesia, and Argentina account for the next twenty-five percent.
Top source of HTTP DDoS attacks
These large figures usually correspond to large markets. For this reason, we also normalize the attack traffic originating from each country by comparing their outbound traffic. When we do this, we often get small island nations or smaller market countries that a disproportionate amount of attack traffic originates from. In Q4, 40% of Saint Helena’s outbound traffic were HTTP DDoS attacks — placing it at the top. Following the ‘remote volcanic tropical island’, Libya came in second, Swaziland (also known as Eswatini) in third. Argentina and Egypt follow in fourth and fifth place.
Top source of HTTP DDoS attacks with respect to each country’s traffic
On the network layer, Zimbabwe came in first place. Almost 80% of all traffic we ingested in our Zimbabwe-based data center was malicious. In second place, Paraguay, and Madagascar in third.
Top source of Network-layer DDoS attacks with respect to each country’s traffic
Most attacked industries
By volume of attack traffic, Cryptocurrency was the most attacked industry in Q4. Over 330 billion HTTP requests targeted it. This figure accounts for over 4% of all HTTP DDoS traffic for the quarter. The second most attacked industry was Gaming & Gambling. These industries are known for being coveted targets and attract a lot of traffic and attacks.
Top industries targeted by HTTP DDoS attacks
On the network layer, the Information Technology and Internet industry was the most attacked — over 45% of all network-layer DDoS attack traffic was aimed at it. Following far behind were the Banking, Financial Services and Insurance (BFSI), Gaming & Gambling, and Telecommunications industries.
Top industries targeted by Network-layer DDoS attacks
To change perspectives, here too, we normalized the attack traffic by the total traffic for a specific industry. When we do that, we get a different picture.
Top attacked industries by HTTP DDoS attacks, by region
We already mentioned in the beginning of this report that the Environmental Services industry was the most attacked relative to its own traffic. In second place was the Packaging and Freight Delivery industry, which is interesting because of its timely correlation with online shopping during Black Friday and the winter holiday season. Purchased gifts and goods need to get to their destination somehow, and it seems as though attackers tried to interfere with that. On a similar note, DDoS attacks on retail companies increased by 23% compared to the previous year.
Top industries targeted by HTTP DDoS attacks with respect to each industry’s traffic
On the network layer, Public Relations and Communications was the most targeted industry — 36% of its traffic was malicious. This too is very interesting given its timing. Public Relations and Communications companies are usually linked to managing public perception and communication. Disrupting their operations can have immediate and widespread reputational impacts which becomes even more critical during the Q4 holiday season. This quarter often sees increased PR and communication activities due to holidays, end-of-year summaries, and preparation for the new year, making it a critical operational period — one that some may want to disrupt.
Top industries targeted by Network-layer DDoS attacks with respect to each industry’s traffic
Most attacked countries and regions
Singapore was the main target of HTTP DDoS attacks in Q4. Over 317 billion HTTP requests, 4% of all global DDoS traffic, were aimed at Singaporean websites. The US followed closely in second and Canada in third. Taiwan came in as the fourth most attacked region — amidst the upcoming general elections and the tensions with China. Taiwan-bound attacks in Q4 traffic increased by 847% compared to the previous year, and 2,858% compared to the previous quarter. This increase is not limited to the absolute values. When normalized, the percentage of HTTP DDoS attack traffic targeting Taiwan relative to all Taiwan-bound traffic also significantly increased. It increased by 624% quarter-over-quarter and 3,370% year-over-year.
Top targeted countries by HTTP DDoS attacks
While China came in as the ninth most attacked country by HTTP DDoS attacks, it’s the number one most attacked country by network-layer attacks. 45% of all network-layer DDoS traffic that Cloudflare mitigated globally was China-bound. The rest of the countries were so far behind that it is almost negligible.
Top targeted countries by Network-layer DDoS attacks
When normalizing the data, Iraq, Palestinian territories, and Morocco take the lead as the most attacked regions with respect to their total inbound traffic. What’s interesting is that Singapore comes up as fourth. So not only did Singapore face the largest amount of HTTP DDoS attack traffic, but that traffic also made up a significant amount of the total Singapore-bound traffic. By contrast, the US was second most attacked by volume (per the application-layer graph above), but came in the fiftieth place with respect to the total US-bound traffic.
Top targeted countries by HTTP DDoS attacks with respect to each country’s traffic
Similar to Singapore, but arguably more dramatic, China is both the number one most attacked country by network-layer DDoS attack traffic, and also with respect to all China-bound traffic. Almost 86% of all China-bound traffic was mitigated by Cloudflare as network-layer DDoS attacks. The Palestinian territories, Brazil, Norway, and again Singapore followed with large percentages of attack traffic.
Top targeted countries by Network-layer DDoS attacks with respect to each country’s traffic
Attack vectors and attributes
The majority of DDoS attacks are short and small relative to Cloudflare’s scale. However, unprotected websites and networks can still suffer disruption from short and small attacks without proper inline automated protection — underscoring the need for organizations to be proactive in adopting a robust security posture.
In 2023 Q4, 91% of attacks ended within 10 minutes, 97% peaked below 500 megabits per second (mbps), and 88% never exceeded 50 thousand packets per second (pps).
Two out of every 100 network-layer DDoS attacks lasted more than an hour, and exceeded 1 gigabit per second (gbps). One out of every 100 attacks exceeded 1 million packets per second. Furthermore, the amount of network-layer DDoS attacks exceeding 100 million packets per second increased by 15% quarter-over-quarter.
DDoS attack stats you should know
One of those large attacks was a Mirai-botnet attack that peaked at 160 million packets per second. The packet per second rate was not the largest we’ve ever seen. The largest we’ve ever seen was 754 million packets per second. That attack occurred in 2020, and we have yet to see anything larger.
This more recent attack, though, was unique in its bits per second rate. This was the largest network-layer DDoS attack we’ve seen in Q4. It peaked at 1.9 terabits per second and originated from a Mirai botnet. It was a multi-vector attack, meaning it combined multiple attack methods. Some of those methods included UDP fragments flood, UDP/Echo flood, SYN Flood, ACK Flood, and TCP malformed flags.
This attack targeted a known European Cloud Provider and originated from over 18 thousand unique IP addresses that are assumed to be spoofed. It was automatically detected and mitigated by Cloudflare’s defenses.
This goes to show that even the largest attacks end very quickly. Previous large attacks we’ve seen ended within seconds — underlining the need for an in-line automated defense system. Though still rare, attacks in the terabit range are becoming more and more prominent.
1.9 Terabit per second Mirai DDoS attacks
The use of Mirai-variant botnets is still very common. In Q4, almost 3% of all attacks originate from Mirai. Though, of all attack methods, DNS-based attacks remain the attackers’ favorite. Together, DNS Floods and DNS Amplification attacks account for almost 53% of all attacks in Q4. SYN Flood follows in second and UDP floods in third. We’ll cover the two DNS attack types here, and you can visit the hyperlinks to learn more about UDP and SYN floods in our Learning Center.
DNS floods and amplification attacks
DNS floods and DNS amplification attacks both exploit the Domain Name System (DNS), but they operate differently. DNS is like a phone book for the Internet, translating human-friendly domain names like “www.cloudfare.com” into numerical IP addresses that computers use to identify each other on the network.
Simply put, DNS-based DDoS attacks comprise the method computers and servers used to identify one another to cause an outage or disruption, without actually ‘taking down’ a server. For example, a server may be up and running, but the DNS server is down. So clients won’t be able to connect to it and will experience it as an outage.
A DNS flood attack bombards a DNS server with an overwhelming number of DNS queries. This is usually done using a DDoS botnet. The sheer volume of queries can overwhelm the DNS server, making it difficult or impossible for it to respond to legitimate queries. This can result in the aforementioned service disruptions, delays or even an outage for those trying to access the websites or services that rely on the targeted DNS server.
On the other hand, a DNS amplification attack involves sending a small query with a spoofed IP address (the address of the victim) to a DNS server. The trick here is that the DNS response is significantly larger than the request. The server then sends this large response to the victim’s IP address. By exploiting open DNS resolvers, the attacker can amplify the volume of traffic sent to the victim, leading to a much more significant impact. This type of attack not only disrupts the victim but also can congest entire networks.
In both cases, the attacks exploit the critical role of DNS in network operations. Mitigation strategies typically include securing DNS servers against misuse, implementing rate limiting to manage traffic, and filtering DNS traffic to identify and block malicious requests.
Top attack vectors
Amongst the emerging threats we track, we recorded a 1,161% increase in ACK-RST Floods as well as a 515% increase in CLDAP floods, and a 243% increase in SPSS floods, in each case as compared to last quarter. Let’s walk through some of these attacks and how they’re meant to cause disruption.
Top emerging attack vectors
ACK-RST floods
An ACK-RST Flood exploits the Transmission Control Protocol (TCP) by sending numerous ACK and RST packets to the victim. This overwhelms the victim’s ability to process and respond to these packets, leading to service disruption. The attack is effective because each ACK or RST packet prompts a response from the victim’s system, consuming its resources. ACK-RST Floods are often difficult to filter since they mimic legitimate traffic, making detection and mitigation challenging.
CLDAP floods
CLDAP (Connectionless Lightweight Directory Access Protocol) is a variant of LDAP (Lightweight Directory Access Protocol). It’s used for querying and modifying directory services running over IP networks. CLDAP is connectionless, using UDP instead of TCP, making it faster but less reliable. Because it uses UDP, there’s no handshake requirement which allows attackers to spoof the IP address thus allowing attackers to exploit it as a reflection vector. In these attacks, small queries are sent with a spoofed source IP address (the victim’s IP), causing servers to send large responses to the victim, overwhelming it. Mitigation involves filtering and monitoring unusual CLDAP traffic.
SPSS floods
Floods abusing the SPSS (Source Port Service Sweep) protocol is a network attack method that involves sending packets from numerous random or spoofed source ports to various destination ports on a targeted system or network. The aim of this attack is two-fold: first, to overwhelm the victim’s processing capabilities, causing service disruptions or network outages, and second, it can be used to scan for open ports and identify vulnerable services. The flood is achieved by sending a large volume of packets, which can saturate the victim’s network resources and exhaust the capacities of its firewalls and intrusion detection systems. To mitigate such attacks, it’s essential to leverage in-line automated detection capabilities.
Cloudflare is here to help – no matter the attack type, size, or duration
Cloudflare’s mission is to help build a better Internet, and we believe that a better Internet is one that is secure, performant, and available to all. No matter the attack type, the attack size, the attack duration or the motivation behind the attack, Cloudflare’s defenses stand strong. Since we pioneered unmetered DDoS Protection in 2017, we’ve made and kept our commitment to make enterprise-grade DDoS protection free for all organizations alike — and of course, without compromising performance. This is made possible by our unique technology and robust network architecture.
It’s important to remember that security is a process, not a single product or flip of a switch. Atop of our automated DDoS protection systems, we offer comprehensive bundled features such as firewall, bot detection, API protection, and caching to bolster your defenses. Our multi-layered approach optimizes your security posture and minimizes potential impact. We’ve also put together a list of recommendations to help you optimize your defenses against DDoS attacks, and you can follow our step-by-step wizards to secure your applications and prevent DDoS attacks. And, if you’d like to benefit from our easy to use, best-in-class protection against DDoS and other attacks on the Internet, you can sign up — for free! — at cloudflare.com. If you’re under attack, register or call the cyber emergency hotline number shown here for a rapid response.
Welcome to the second DDoS threat report of 2023. DDoS attacks, or distributed denial-of-service attacks, are a type of cyber attack that aims to disrupt websites (and other types of Internet properties) to make them unavailable for legitimate users by overwhelming them with more traffic than they can handle — similar to a driver stuck in a traffic jam on the way to the grocery store.
We see a lot of DDoS attacks of all types and sizes and our network is one of the largest in the world spanning more than 300 cities in over 100 countries. Through this network we serve over 63 million HTTP requests per second at peak and over 2 billion DNS queries every day. This colossal amount of data gives us a unique vantage point to provide the community access to insightful DDoS trends.
For our regular readers, you might notice a change in the layout of this report. We used to follow a set pattern to share our insights and trends about DDoS attacks. But with the landscape of DDoS threats changing as DDoS attacks have become more powerful and sophisticated, we felt it's time for a change in how we present our findings. So, we'll kick things off with a quick global overview, and then dig into the major shifts we're seeing in the world of DDoS attacks.
Reminder: an interactive version of this report is also available on Cloudflare Radar. Furthermore, we’ve also added a new interactive component that will allow you to dive deeper into attack activity in each country or region.
New interactive Radar graph to shed light on local DDoS activity
The DDoS landscape: a look at global patterns
The second quarter of 2023 was characterized by thought-out, tailored and persistent waves of DDoS attack campaigns on various fronts, including:
Multiple DDoS offensives orchestrated by pro-Russian hacktivist groups REvil, Killnet and Anonymous Sudan against Western interest websites.
An increase in deliberately engineered and targeted DNS attacks alongside a 532% surge in DDoS attacks exploiting the Mitel vulnerability (CVE-2022-26143). Cloudflare contributed to disclosing this zero-day vulnerability last year.
Attacks targeting Cryptocurrency companies increased by 600%, as a broader 15% increase in HTTP DDoS attacks was observed. Of these, we’ve noticed an alarming escalation in attack sophistication which we will cover more in depth.
Additionally, one of the largest attacks we’ve seen this quarter was an ACK flood DDoS attack which originated from a Mirai-variant botnet comprising approximately 11K IP addresses. The attack targeted an American Internet Service Provider. It peaked at 1.4 terabit per seconds (Tbps) and was automatically detected and mitigated by Cloudflare’s systems.
Despite general figures indicating an increase in overall attack durations, most of the attacks are short-lived and so was this one. This attack lasted only two minutes. However, more broadly, we’ve seen that attacks exceeding 3 hours have increased by 103% QoQ.
Now having set the stage, let’s dive deeper into these shifts we’re seeing in the DDoS landscape.
Mirai botnet attacks an American Service Provider, peaks at 1.4 Tbps
Hacktivist alliance dubbed “Darknet Parliament” aims at Western banks and SWIFT network
On June 14, Pro-Russian hacktivist groups Killnet, a resurgence of REvil and Anonymous Sudan announced that they have joined forces to execute “massive” cyber attacks on the Western financial system including European and US banks, and the US Federal Reserve System. The collective, dubbed “Darknet Parliament”, declared its first objective was to paralyze SWIFT (Society for Worldwide Interbank Financial Telecommunication). A successful DDoS attack on SWIFT could have dire consequences because it's the main service used by financial institutions to conduct global financial transactions.
Beyond a handful of publicized events such as the Microsoft outage which was reported by the media, we haven’t observed any novel DDoS attacks or disruptions targeting our customers. Our systems have been automatically detecting and mitigating attacks associated with this campaign. Over the past weeks, as many as 10,000 of these DDoS attacks were launched by the Darknet Parliament against Cloudflare-protected websites (see graph below).
REvil, Killnet and Anonymous Sudan attacks
Despite the hacktivists’ statements, Banking and Financial Services websites were only the ninth most attacked industry — based on attacks we’ve seen against our customers as part of this campaign.
Top industries attacked by the REvil, Killnet and Anonymous Sudan attack campaign
The most attacked industries were Computer Software, Gambling & Casinos and Gaming. Telecommunications and Media outlets came in fourth and fifth, respectively. Overall, the largest attack we witnessed in this campaign peaked at 1.7 million requests per second (rps) and the average was 65,000 rps.
For perspective, earlier this year we mitigated the largest attack in recorded history peaking at 71 million rps. So these attacks were very small compared to Cloudflare scale, but not necessarily for an average website. Therefore, we shouldn’t underestimate the damage potential on unprotected or suboptimally configured websites.
Sophisticated HTTP DDoS attacks
An HTTP DDoS attack is a DDoS attack over the Hypertext Transfer Protocol (HTTP). It targets HTTP Internet properties such as websites and API gateways. Over the past quarter, HTTP DDoS attacks increased by 15% quarter-over-quarter (QoQ) despite a 35% decrease year-over-year (YoY).
Illustration of an HTTP DDoS attack
Additionally, we've observed an alarming uptick in highly-randomized and sophisticated HTTP DDoS attacks over the past few months. It appears as though the threat actors behind these attacks have deliberately engineered the attacks to try and overcome mitigation systems by adeptly imitating browser behavior very accurately, in some cases, by introducing a high degree of randomization on various properties such as user agents and JA3 fingerprints to name a few. An example of such an attack is provided below. Each different color represents a different randomization feature.
Example of a highly randomized HTTP DDoS attack
Furthermore, in many of these attacks, it seems that the threat actors try to keep their attack rates-per-second relatively low to try and avoid detection and hide amongst the legitimate traffic.
This level of sophistication has previously been associated with state-level and state-sponsored threat actors, and it seems these capabilities are now at the disposal of cyber criminals. Their operations have already targeted prominent businesses such as a large VoIP provider, a leading semiconductor company, and a major payment & credit card provider to name a few.
Protecting websites against sophisticated HTTP DDoS attacks requires intelligent protection that is automated and fast, that leverages threat intelligence, traffic profiling and Machine Learning/statistical analysis to differentiate between attack traffic and user traffic. Moreover, even increasing caching where applicable can help reduce the risk of attack traffic impacting your origin. Read more about DDoS protection best practices here.
DNS Laundering DDoS attacks
The Domain Name System, or DNS, serves as the phone book of the Internet. DNS helps translate the human-friendly website address (e.g. www.cloudflare.com) to a machine-friendly IP address (e.g. 104.16.124.96). By disrupting DNS servers, attackers impact the machines’ ability to connect to a website, and by doing so making websites unavailable to users.
Over the past quarter, the most common attack vector was DNS-based DDoS attacks — 32% of all DDoS attacks were over the DNS protocol. Amongst these, one of the more concerning attack types we’ve seen increasing is the DNS Laundering attack which can pose severe challenges to organizations that operate their own authoritative DNS servers.
Top DDoS attack vectors in 2023 Q2
The term “Laundering” in the DNS Laundering attack name refers to the analogy of money laundering, the devious process of making illegally-gained proceeds, often referred to as "dirty money," appear legal. Similarly, in the DDoS world, a DNS Laundering attack is the process of making bad, malicious traffic appear as good, legitimate traffic by laundering it via reputable recursive DNS resolvers.
In a DNS Laundering attack, the threat actor will query subdomains of a domain that is managed by the victim’s DNS server. The prefix that defines the subdomain is randomized and is never used more than once or twice in such an attack. Due to the randomization element, recursive DNS servers will never have a cached response and will need to forward the query to the victim’s authoritative DNS server. The authoritative DNS server is then bombarded by so many queries until it cannot serve legitimate queries or even crashes all together.
Illustration of a DNS Laundering DDoS attack
From the protection point of view, the DNS administrators can’t block the attack source because the source includes reputable recursive DNS servers like Google’s 8.8.8.8 and Cloudflare’s 1.1.1.1. The administrators also cannot block all queries to the attacked domain because it is a valid domain that they want to preserve access to legitimate queries.
The above factors make it very challenging to distinguish legitimate queries from malicious ones. A large Asian financial institution and a North American DNS provider are amongst recent victims of such attacks. An example of such an attack is provided below.
Example of a DNS Laundering DDoS attack
Similar to the protection strategies outlined for HTTP applications, protecting DNS servers also requires a precise, fast, and automated approach. Leveraging a managed DNS service or a DNS reverse proxy such as Cloudflare’s can help absorb and mitigate the attack traffic. For those more sophisticated DNS attacks, a more intelligent solution is required that leverages statistical analysis of historical data to be able to differentiate between legitimate queries and attack queries.
The rise of the Virtual Machine Botnets
As we’ve previously disclosed, we are witnessing an evolution in botnet DNA. The era of VM-based DDoS botnets has arrived and with it hyper-volumetric DDoS attacks. These botnets are comprised of Virtual Machines (VMs, or Virtual Private Servers, VPS) rather than Internet of Things (IoT) devices which makes them so much more powerful, up to 5,000 times stronger.
Illustration of an IoT botnet compared with a VM Botnet
Because of the computational and bandwidth resources that are at the disposal of these VM-based botnets, they’re able to generate hyper-volumetric attacks with a much smaller fleet size compared to IoT-based botnets.
These botnets have executed one largest recorded DDoS attacks including the 71 million request per second DDoS attack. Multiple organizations including an industry-leading gaming platform provider have already been targeted by this new generation of botnets.
Cloudflare has proactively collaborated with prominent cloud computing providers to combat these new botnets. Through the quick and dedicated actions of these providers, significant components of these botnets have been neutralized. Since this intervention, we have not observed any further hyper-volumetric attacks yet, a testament to the efficacy of our collaboration.
While we already enjoy a fruitful alliance with the cybersecurity community in countering botnets when we identify large-scale attacks, our goal is to streamline and automate this process further. We extend an invitation to cloud computing providers, hosting providers, and other general service providers to join Cloudflare’s free Botnet Threat Feed. This would provide visibility into attacks originating within their networks, contributing to our collective efforts to dismantle botnets.
“Startblast”: Exploiting Mitel vulnerabilities for DDoS attacks
This exploit operates by reflecting traffic off vulnerable servers, amplifying it in the process, with a factor as high as 220 billion percent. The vulnerability stems from an unauthenticated UDP port exposed to the public Internet, which could allow malicious actors to issue a 'startblast' debugging command, simulating a flurry of calls to test the system.
As a result, for each test call, two UDP packets are sent to the issuer, enabling an attacker to direct this traffic to any IP and port number to amplify a DDoS attack. Despite the vulnerability, only a few thousand of these devices are exposed, limiting the potential scale of attack, and attacks must run serially, meaning each device can only launch one attack at a time.
Top industries targeted by Startblast DDoS attacks
Overall, in the past quarter, we’ve seen additional emerging threats such as DDoS attacks abusing the TeamSpeak3 protocol. This attack vector increased by a staggering 403% this quarter.
TeamSpeak, a proprietary voice-over-Internet Protocol (VoIP) that runs over UDP to help gamers talk with other gamers in real time. Talking instead of just chatting can significantly improve a gaming team’s efficiency and help them win. DDoS attacks that target TeamSpeak servers may be launched by rival groups in an attempt to disrupt their communication path during real-time multiplayer games and thus impact their team’s performance.
DDoS hotspots: The origins of attacks
Overall, HTTP DDoS attacks increased by 15% QoQ despite a 35% decrease YoY. Additionally, network-layer DDoS attacks decreased this quarter by approximately 14%.
HTTP DDoS attack requests by quarter
In terms of total volume of attack traffic, the US was the largest source of HTTP DDoS attacks. Three out of every thousand requests we saw were part of HTTP DDoS attacks originating from the US. China came in second place and Germany in third place.
Top source countries of HTTP DDoS attacks (percentage of attack traffic out of the total traffic worldwide)
Some countries naturally receive more traffic due to various factors such as market size, and therefore more attacks. So while it’s interesting to understand the total amount of attack traffic originating from a given country, it is also helpful to remove that bias by normalizing the attack traffic by all traffic to a given country.
When doing so, we see a different pattern. The US doesn’t even make it into the top ten. Instead, Mozambique, Egypt and Finland take the lead as the source countries of the most HTTP DDoS attack traffic relative to all of their traffic. Almost a fifth of all HTTP traffic originating from Mozambique IP addresses were part of DDoS attacks.
Top source countries of HTTP DDoS attacks (percentage of attack traffic out of the total traffic per country)
Using the same calculation methodology but for bytes, Vietnam remains the largest source of network-layer DDoS attacks (aka L3/4 DDoS attacks) for the second consecutive quarter — and the amount even increased by 58% QoQ. Over 41% of all bytes that were ingested in Cloudflare’s Vietnam data centers were part of L3/4 DDoS attacks.
Top source countries of L3/4 DDoS attacks (percentage of attack traffic out of the total traffic per country)
Industries under attack: examining DDoS attack targets
When examining HTTP DDoS attack activity in Q2, Cryptocurrency websites were targeted with the largest amount of HTTP DDoS attack traffic. Six out of every ten thousand HTTP requests towards Cryptocurrency websites behind Cloudflare were part of these attacks. This represents a 600% increase compared to the previous quarter.
After Crypto, Gaming and Gambling websites came in second place as their attack share increased by 19% QoQ. Marketing and Advertising websites not far behind in third place with little change in their share of attacks.
Top industries targeted by HTTP DDoS attacks (percentage of attack traffic out of the total traffic for all industries)
However, when we look at the amount of attack traffic relative to all traffic for any given industry, the numbers paint a different picture. Last quarter, Non-profit organizations were attacked the most — 12% of traffic to Non-profits were HTTP DDoS attacks. Cloudflare protects more than 2,271 Non-profit organizations in 111 countries as part of Project Galileo which celebrated its ninth anniversary this year. Over the past months, an average of 67.7 million cyber attacks targeted Non-profits on a daily basis.
Overall, the amount of DDoS attacks on Non-profits increased by 46% bringing the percentage of attack traffic to 17.6%. However, despite this growth, the Management Consulting industry jumped to the first place with 18.4% of its traffic being DDoS attacks.
Top industries targeted by HTTP DDoS attacks (percentage of attack traffic out of the total traffic per industry)
When descending the layers of the OSI model, the Internet networks that were most targeted belonged to the Information Technology and Services industry. Almost every third byte routed to them were part of L3/4 DDoS attacks.
Surprisingly enough, companies operating in the Music industry were the second most targeted industry, followed by Broadcast Media and Aviation & Aerospace.
Top industries targeted by L3/4 DDoS attacks (percentage of attack traffic out of the total traffic per industry)
Top attacked industries: a regional perspective
Cryptocurrency websites experienced the highest number of attacks worldwide, while Management Consulting and Non-profit sectors were the most targeted considering their total traffic. However, when we look at individual regions, the situation is a bit different.
Top industries targeted by HTTP DDoS attacks by region
Africa
The Telecommunications industry remains the most attacked industry in Africa for the second consecutive quarter. The Banking, Financial Services and Insurance (BFSI) industry follows as the second most attacked. The majority of the attack traffic originated from Asia (35%) and Europe (25%).
Asia
For the past two quarters, the Gaming and Gambling industry was the most targeted industry in Asia. In Q2, however, the Gaming and Gambling industry dropped to second place and Cryptocurrency took the lead as the most attacked industry (~50%). Substantial portions of the attack traffic originated from Asia itself (30%) and North America (30%).
Europe
For the third consecutive quarter, the Gaming & Gambling industry remains the most attacked industry in Europe. The Hospitality and Broadcast Media industries follow not too far behind as the second and third most attacked. Most of the attack traffic came from within Europe itself (40%) and from Asia (20%).
Latin America
Surprisingly, half of all attack traffic targeting Latin America was aimed at the Sporting Goods industry. In the previous quarter, the BFSI was the most attacked industry. Approximately 35% of the attack traffic originated from Asia, and another 25% originated from Europe.
Middle East
The Media & Newspaper industries were the most attacked in the Middle East. The vast majority of attack traffic originated from Europe (74%).
North America
For the second consecutive quarter, Marketing & Advertising companies were the most attacked in North America (approximately 35%). Manufacturing and Computer Software companies came in second and third places, respectively. The main sources of the attack traffic were Europe (42%) and the US itself (35%).
Oceania
This quarter, the Biotechnology industry was the most attacked. Previously, it was the Health & Wellness industry. Most of the attack traffic originated from Asia (38%) and Europe (25%).
Countries and regions under attack: examining DDoS attack targets
When examining the total volume of attack traffic, last quarter, Israel leaped to the front as the most attacked country. This quarter, attacks targeting Israeli websites decreased by 33% bringing it to the fourth place. The US takes the lead again as the most attacked country, followed by Canada and Singapore.
Top countries and regions targeted by HTTP DDoS attacks (percentage of attack traffic out of the total traffic for all countries and regions)
If we normalize the data per country and region and divide the attack traffic by the total traffic, we get a different picture. Palestine jumps to the first place as the most attacked country. Almost 12% of all traffic to Palestinian websites were HTTP DDoS attacks.
Top countries and regions targeted by HTTP DDoS attacks (percentage of attack traffic out of the total traffic per country and region)
Last quarter, we observed a striking deviation at the network layer, with Finnish networks under Cloudflare's shield emerging as the primary target. This surge was likely correlated with the diplomatic talks that precipitated Finland's formal integration into NATO. Roughly 83% of all incoming traffic to Finland comprised cyberattacks, with China a close second at 68% attack traffic.
This quarter, however, paints a very different picture. Finland has receded from the top ten, and Chinese Internet networks behind Cloudflare have ascended to the first place. Almost two-thirds of the byte streams towards Chinese networks protected by Cloudflare were malicious. Following China, Switzerland saw half of its inbound traffic constituting attacks, and Turkey came third, with a quarter of its incoming traffic identified as hostile.
Top countries and regions targeted by L3/4 DDoS attacks (percentage of attack traffic out of the total traffic per country and region)
Ransom DDoS attacks
Occasionally, DDoS attacks are carried out to extort ransom payments. We’ve been surveying Cloudflare customers over three years now, and have been tracking the occurrence of Ransom DDoS attack events.
High level comparison of Ransomware and Ransom DDoS attacks
Unlike Ransomware attacks, where victims typically fall prey to downloading a malicious file or clicking on a compromised email link which locks, deletes or leaks their files until a ransom is paid, Ransom DDoS attacks can be much simpler for threat actors to execute. Ransom DDoS attacks bypass the need for deceptive tactics such as luring victims into opening dubious emails or clicking on fraudulent links, and they don't necessitate a breach into the network or access to corporate resources.
Over the past quarter, reports of Ransom DDoS attacks decreased. One out of ten respondents reported being threatened or subject to Ransom DDoS attacks.
Wrapping up: the ever-evolving DDoS threat landscape
In recent months, there's been an alarming escalation in the sophistication of DDoS attacks. And even the largest and most sophisticated attacks that we’ve seen may only last a few minutes or even seconds — which doesn’t give a human sufficient time to respond. Before the PagerDuty alert is even sent, the attack may be over and the damage is done. Recovering from a DDoS attack can last much longer than the attack itself — just as a boxer might need a while to recover from a punch to the face that only lasts a fraction of a second.
Security is not one single product or a click of a button, but rather a process involving multiple layers of defense to reduce the risk of impact. Cloudflare's automated DDoS defense systems consistently safeguard our clients from DDoS attacks, freeing them up to focus on their core business operations. These systems are complemented by the vast breadth of Cloudflare capabilities such as firewall, bot detection, API protection and even caching which can all contribute to reducing the risk of impact.
The DDoS threat landscape is evolving and increasingly complex, demanding more than just quick fixes. Thankfully, with Cloudflare's multi-layered defenses and automatic DDoS protections, our clients are equipped to navigate these challenges confidently. Our mission is to help build a better Internet, and so we continue to stand guard, ensuring a safer and more reliable digital realm for all.
Methodologies
How we calculate Ransom DDoS attack insights
Cloudflare’s systems constantly analyze traffic and automatically apply mitigation when DDoS attacks are detected. Each attacked customer is prompted with an automated survey to help us better understand the nature of the attack and the success of the mitigation. For over two years, Cloudflare has been surveying attacked customers. One of the questions in the survey asks the respondents if they received a threat or a ransom note. Over the past two years, on average, we collected 164 responses per quarter. The responses of this survey are used to calculate the percentage of Ransom DDoS attacks.
How we calculate geographical and industry insights
Source country At the application-layer, we use the attacking IP addresses to understand the origin country of the attacks. That is because at that layer, IP addresses cannot be spoofed (i.e., altered). However, at the network layer, source IP addresses can be spoofed. So, instead of relying on IP addresses to understand the source, we instead use the location of our data centers where the attack packets were ingested. We’re able to get geographical accuracy due to our large global coverage in over 285 locations around the world.
Target country For both application-layer and network-layer DDoS attacks, we group attacks and traffic by our customers’ billing country. This lets us understand which countries are subject to more attacks.
Target industry For both application-layer and network-layer DDoS attacks, we group attacks and traffic by our customers’ industry according to our customer relations management system. This lets us understand which industries are subject to more attacks.
Total volume vs. percentage For both source and target insights, we look at the total volume of attack traffic compared to all traffic as one data point. Additionally, we also look at the percentage of attack traffic towards or from a specific country, to a specific country or to a specific industry. This gives us an “attack activity rate” for a given country/industry which is normalized by their total traffic levels. This helps us remove biases of a country or industry that normally receives a lot of traffic and therefore a lot of attack traffic as well.
How we calculate attack characteristics To calculate the attack size, duration, attack vectors and emerging threats, we bucket attacks and then provide the share of each bucket out of the total amount for each dimension. On the new Radar component, these trends are calculated by number of bytes instead. Since attacks may vary greatly in number of bytes from one another, this could lead to trends differing between the reports and the Radar component.
General disclaimer and clarification
When we describe ‘top countries’ as the source or target of attacks, it does not necessarily mean that that country was attacked as a country, but rather that organizations that use that country as their billing country were targeted by attacks. Similarly, attacks originating from a country does not mean that that country launched the attacks, but rather that the attack was launched from IP addresses that have been mapped to that country. Threat actors operate global botnets with nodes all over the world, and in many cases also use Virtual Private Networks and proxies to obfuscate their true location. So if anything, the source country could indicate the presence of exit nodes or botnet nodes within that country.
Welcome to the first DDoS threat report of 2023. DDoS attacks, or distributed denial-of-service attacks, are a type of cyber attack that aim to overwhelm Internet services such as websites with more traffic than they can handle, in order to disrupt them and make them unavailable to legitimate users. In this report, we cover the latest insights and trends about the DDoS attack landscape as we observed across our global network.
Kicking off 2023 with a bang
Threat actors kicked off 2023 with a bang. The start of the year was characterized by a series of hacktivist campaigns against Western targets including banking, airports, healthcare and universities — mainly by the pro-Russian Telegram-organized groups Killnet and more recently by AnonymousSudan.
While Killnet-led and AnonymousSudan-led cyberattacks stole the spotlight, we haven’t witnessed any novel or exceedingly large attacks by them.
Hyper-volumetric attacks
We did see, however, an increase of hyper-volumetric DDoS attacks launched by other threat actors — with the largest one peaking above 71 million requests per second (rps) — exceeding Google’s previous world record of 46M rps by 55%.
Back to Killnet and AnonymousSudan, while no noteworthy attacks were reported, we shouldn’t underestimate the potential risks. Unprotected Internet properties can still be, and have been, taken down by Killnet-led or AnonymousSudan-led cyber campaigns. Organizations should take proactive defensive measures to reduce the risks.
Business as usual for South American Telco targeted by terabit-strong attacks thanks to Cloudflare
Another large attack we saw in Q1 was a 1.3 Tbps (terabits per second) DDoS attack that targeted a South American Telecommunications provider. The attack lasted only a minute. It was a multi-vector attack involving DNS and UDP attack traffic. The attack was part of a broader campaign which included multiple Terbit-strong attacks originating from a 20,000-strong Mirai-variant botnet. Most of the attack traffic originated from the US, Brazil, Japan, Hong Kong, and India. Cloudflare systems automatically detected and mitigated it without any impact to the customer’s networks.
Cloudflare auto-mitigates a 1.3 Tbps Mirai DDoS attack
High-performance botnets
Hyper-volumetric attacks leverage a new generation of botnets that are comprised of Virtual Private Servers (VPS) instead of Internet of Things (IoT) devices.
Historically, large botnets relied on exploitable IoT devices such as smart security cameras to orchestrate their attacks. Despite the limited throughput of each IoT device, together — usually numbering in the hundreds of thousands or millions — they generated enough traffic to disrupt their targets.
The new generation of botnets uses a fraction of the amount of devices, but each device is substantially stronger. Cloud computing providers offer virtual private servers to allow start ups and businesses to create performant applications. The downside is that it also allows attackers to create high-performance botnets that can be as much as 5,000x stronger. Attackers gain access to virtual private servers by compromising unpatched servers and hacking into management consoles using leaked API credentials.
Cloudflare has been working with key cloud computing providers to crack down on these VPS-based botnets. Substantial portions of such botnets have been disabled thanks to the cloud computing providers’ rapid response and diligence. Since then, we have yet to see additional hyper-volumetric attacks — a testament to the fruitful collaboration.
We have excellent collaboration with the cyber-security community to take down botnets once we detect such large-scale attacks, but we want to make this process even simpler and more automated.
We invite Cloud computing providers, hosting providers and general service providers to sign up for Cloudflare’s free Botnet Threat Feed to gain visibility on attacks launching from within their networks — and help us dismantle botnets.
Key highlights from this quarter
In Q1, 16% of surveyed customers reported a Ransom DDoS attack — remains steady compared to the previous quarter but represents a 60% increase YoY.
Non-profit organizations and Broadcast Media were two of the most targeted industries. Finland was the largest source of HTTP DDoS attacks in terms of percentage of attack traffic, and the main target of network-layer DDoS attacks. Israel was the top most attacked country worldwide by HTTP DDoS attacks.
Large scale volumetric DDoS attacks — attacks above 100 Gbps — increased by 6% QoQ. DNS-based attacks became the most popular vector. Similarly, we observed surges in SPSS-bas in ed DDoS attacks, DNS amplification attacks, and GRE-based DDoS attacks.
Ransom DDoS attacks
Often, DDoS attacks are carried out to extort ransom payments. We continue to survey Cloudflare customers and track the ratio of DDoS events where the target received a ransom note. This number has been steadily rising through 2022 and currently stands at 16% – the same as in Q4 2022.
Percent of users reporting a Ransom DDoS attack or threat, per quarter
As opposed to Ransomware attacks, where usually the victim is tricked into downloading a file or clicking on an email link that encrypts and locks their computer files until they pay a ransom fee, Ransom DDoS attacks can be much easier for attackers to execute. Ransom DDoS attacks don’t require tricking the victim into opening an email or clicking a link, nor do they require a network intrusion or a foothold into the corporate assets.
In a Ransom DDoS attack, the attacker doesn’t need access to the victim’s computer but rather just needs to bombard them with a sufficiently large amount of traffic to take down their websites, DNS servers, and any other type of Internet-connected property to make it unavailable or with poor performance to users. The attacker will demand a ransom payment, usually in the form of Bitcoin, to stop and/or avoid further attacks.
The months of January 2023 and March 2023 were the second highest in terms of Ransom DDoS activity as reported by our users. The highest month thus far remains November 2022 — the month of Black Friday, Thanksgiving, and Singles Day in China — a lucrative month for threat actors.
Percent of users reporting a Ransom DDoS attack or threat, per month
Who and what are being attacked?
Top targeted countries
Perhaps related to the judicial reform and opposing protests, in Q1, Israel jumps to the first place as the country targeted by the most HTTP DDoS attack traffic — even above the United States of America. This is an astonishing figure. Just short of a single percent of all HTTP traffic that Cloudflare processed in the first quarter of the year, was part of HTTP DDoS attacks that targeted Israeli websites. Following closely behind Israel are the US, Canada, and Turkey.
Top countries targeted by HTTP DDoS attacks (percentage of attack traffic out of the total traffic worldwide)
In terms of the percentage of attack traffic compared to all traffic to a given country, Slovenia and Georgia came at the top. Approximately 20% of all traffic to Slovenian and Georgian websites were HTTP DDoS attacks. Next in line were the small Caribbean dual-island nation, Saint Kitts and Nevis, and Turkey. While Israel was the top in the previous graph, here it has found its placement as the ninth most attacked country — above Russia. Still high compared to previous quarters.
Top countries targeted by HTTP DDoS attacks (percentage of attack traffic out of the total traffic per country)
Looking at the total amount of network-layer DDoS attack traffic, China came in first place. Almost 18% of all network-layer DDoS attack traffic came from China. Closely in second, Singapore came in second place with a 17% share. The US came in third, followed by Finland.
Top countries targeted by network-layer DDoS attacks (percentage of attack traffic out of the all DDoS traffic worldwide)
When we normalize attacks to a country by all traffic to that country, Finland jumps to the first place, perhaps due to its newly approved NATO membership. Nearly 83% of all traffic to Finland was network-layer attack traffic. China followed closely with 68% and Singapore again with 49%.
Top countries targeted by network-layer DDoS attacks (percentage of attack traffic out of the all traffic per country)
Top targeted industries
In terms of overall bandwidth, globally, Internet companies saw the largest amount of HTTP DDoS attack traffic. Afterwards, it was the Marketing and Advertising industry, Computer Software industry, Gaming / Gambling and Telecommunications.
Top industries targeted by HTTP DDoS attacks (percentage of attack traffic out of the total traffic for all industries)
By percentage of attack traffic out of total traffic to an industry, Non-profits were the most targeted in the first quarter of the year, followed by Accounting firms. Despite the uptick of attacks on healthcare, it didn’t make it into the top ten. Also up there in the top were Chemicals, Government, and Energy Utilities & Waste industries. Looking at the US, almost 2% of all traffic to US Federal websites were part of DDoS attacks.
Top industries targeted by HTTP DDoS attacks (percentage of attack traffic out of the total traffic per industry)
On a regional scale, the Gaming & Gambling industry was the most targeted in Asia, Europe, and the Middle East. In South and Central America, the Banking, Financial Services and Insurance (BFSI) industry was the most targeted. In North America it was the Marketing & Advertising industry followed by Telecommunications — which was also the most attacked industry in Africa. Last by not least, in Oceania, the Health, Wellness and Fitness industry was the most targeted by HTTP DDoS attacks.
Diving lower in the OSI stack, based on the total volume of L3/4 attack traffic, the most targeted industries were Information Technology and Services, Gaming / Gambling, and Telecommunications.
Top industries targeted by L3/4 DDoS attacks (percentage of attack traffic out of the total DDoS traffic for all industries)
When comparing the attack traffic to the total traffic per industry, we see a different picture. Almost every second byte transmitted to Broadcast Media companies was L3/4 DDoS attack traffic.
Top industries targeted by L3/4 DDoS attacks (percentage of attack traffic out of the total traffic per industry)
Where attacks are coming from
Top source countries
In the first quarter of 2023, Finland was the largest source of HTTP DDoS attacks in terms of the percentage of attack traffic out of all traffic per country. Closely after Finland, the British Virgin Islands came in second place, followed by Libya and Barbados.
Top source countries of HTTP DDoS attacks (percentage of attack traffic out of the total traffic per country)
In terms of absolute volumes, the most HTTP DDoS attack traffic came from US IP addresses. China came in second, followed by Germany, Indonesia, Brazil, and Finland.
Top source countries of HTTP DDoS attacks (percentage of attack traffic out of the total traffic worldwide)
On the L3/4 side of things, Vietnam was the largest source of L3/4 DDoS attack traffic. Almost a third of all L3/4 traffic we ingested in our Vietnam data centers was attack traffic. Following Vietnam were Paraguay, Moldova, and Jamaica.
Top source countries of L3/4 DDoS attacks (percentage of attack traffic out of the total traffic per country)
What attack types and sizes we see
Attack size and duration
When looking at the types of attacks that are launched against our customers and our own network and applications, we can see that the majority of attacks are short and small; 86% of network-layer DDoS attacks end within 10 minutes, and 91% of attacks never exceed 500 Mbps.
Network-layer DDoS attacks by duration
Only one out of every fifty attacks ever exceeds 10 Gbps, and only one out of every thousand attacks exceeds 100 Gbps.
Network-layer DDoS attacks by bitrate
Having said that, larger attacks are slowly increasing in quantity and frequency. Last quarter, attacks exceeding 100 Gbps saw a 67% increase QoQ in their quantity. This quarter, the growth has slowed down a bit to 6%, but it’s still growing. In fact, there was an increase in all volumetric attacks excluding the ‘small’ bucket where the majority fall into — as visualized in the graph below. The largest growth was in the 10-100 Gbps range; an 89% increase QoQ.
Network-layer DDoS attacks by size: quarter-over-quarter change
Attack vectors
This quarter we saw a tectonic shift. With a 22% share, SYN floods scooched to the second place, making DNS-based DDoS attacks the most popular attack vector (30%). Almost a third of all L3/4 DDoS attacks were DNS-based; either DNS floods or DNS amplification/reflection attacks. Not far behind, UDP-based attacks came in third with a 21% share.
Top DDoS attack vectors
Emerging threats
Every quarter we see the reemergence of old and sometimes even ancient attack vectors. What this tells us is that even decade-old vulnerabilities are still being exploited to launch attacks. Threat actors are recycling and reusing old methods — perhaps hoping that organizations have dropped those protections against older methods.
In the first quarter of 2023, there was a massive surge in SPSS-based DDoS attacks, DNS amplification attacks and GRE-based DDoS attacks.
Top DDoS emerging threats
SPSS-based DDoS attacks increased by 1,565% QoQ
The Statistical Product and Service Solutions (SPSS) is an IBM-developed software suite for use cases such as data management, business intelligence, and criminal investigation. The Sentinel RMS License Manager server is used to manage licensing for software products such as the IBM SPSS system. Back in 2021, two vulnerabilities (CVE-2021-22713 and CVE-2021-38153) were identified in the Sentinel RMS License Manager server which can be used to launch reflection DDoS attacks. Attackers can send large amounts of specially crafted license requests to the server, causing it to generate a response that is much larger than the original request. This response is sent back to the victim’s IP address, effectively amplifying the size of the attack and overwhelming the victim’s network with traffic. This type of attack is known as a reflection DDoS attack, and it can cause significant disruption to the availability of software products that rely on the Sentinel RMS License Manager, such as IBM SPSS Statistics. Applying the available patches to the license manager is essential to prevent these vulnerabilities from being exploited and to protect against reflection DDoS attacks.
DNS amplification DDoS attacks increased by 958% QoQ
DNS amplification attacks are a type of DDoS attack that involves exploiting vulnerabilities in the Domain Name System (DNS) infrastructure to generate large amounts of traffic directed at a victim’s network. Attackers send DNS requests to open DNS resolvers that have been misconfigured to allow recursive queries from any source, and use these requests to generate responses that are much larger than the original query. The attackers then spoof the victim’s IP address, causing the large responses to be directed at the victim’s network, overwhelming it with traffic and causing a denial of service. The challenge of mitigating DNS amplification attacks is that the attack traffic can be difficult to distinguish from legitimate traffic, making it difficult to block at the network level. To mitigate DNS amplification attacks, organizations can take steps such as properly configuring DNS resolvers, implementing rate-limiting techniques, and using traffic filtering tools to block traffic from known attack sources.
GRE-based DDoS attacks increased by 835% QoQ
GRE-based DDoS attacks involve using the Generic Routing Encapsulation (GRE) protocol to flood a victim’s network with large amounts of traffic. Attackers create multiple GRE tunnels between compromised hosts to send traffic to the victim’s network. These attacks are difficult to detect and filter, as the traffic appears as legitimate traffic on the victim’s network. Attackers can also use source IP address spoofing to make it appear that the traffic is coming from legitimate sources, making it difficult to block at the network level. GRE-based DDoS attacks pose several risks to targeted organizations, including downtime, disruption of business operations, and potential data theft or network infiltration. Mitigating these attacks requires the use of advanced traffic filtering tools that can detect and block attack traffic based on its characteristics, as well as techniques such as rate limiting and source IP address filtering to block traffic from known attack sources.
The DDoS threat landscape
In recent months, there has been an increase in longer and larger DDoS attacks across various industries, with volumetric attacks being particularly prominent. Non-profit and Broadcast Media companies were some of the top targeted industries. DNS DDoS attacks also became increasingly prevalent.
As DDoS attacks are typically carried out by bots, automated detection and mitigation are crucial for effective defense. Cloudflare’s automated systems provide constant protection against DDoS attacks for our customers, allowing them to focus on other aspects of their business. We believe that DDoS protection should be easily accessible to organizations of all sizes, and have been offering free and unlimited protection since 2017.
At Cloudflare, our mission is to help build a better Internet — one that is more secure and faster Internet for all.
We invite you to join our DDoS Trends Webinar to learn more about emerging threats and effective defense strategies.
A note about methodologies
How we calculate Ransom DDoS attack insights Cloudflare’s systems constantly analyze traffic and automatically apply mitigation when DDoS attacks are detected. Each attacked customer is prompted with an automated survey to help us better understand the nature of the attack and the success of the mitigation. For over two years, Cloudflare has been surveying attacked customers. One of the questions in the survey asks the respondents if they received a threat or a ransom note. Over the past two years, on average, we collected 164 responses per quarter. The responses of this survey are used to calculate the percentage of Ransom DDoS attacks.
How we calculate geographical and industry insights Source country At the application-layer, we use the attacking IP addresses to understand the origin country of the attacks. That is because at that layer, IP addresses cannot be spoofed (i.e., altered). However, at the network layer, source IP addresses can be spoofed. So, instead of relying on IP addresses to understand the source, we instead use the location of our data centers where the attack packets were ingested. We’re able to get geographical accuracy due to our large global coverage in over 285 locations around the world.
Target country For both application-layer and network-layer DDoS attacks, we group attacks and traffic by our customers’ billing country. This lets us understand which countries are subject to more attacks.
Target industry For both application-layer and network-layer DDoS attacks, we group attacks and traffic by our customers’ industry according to our customer relations management system. This lets us understand which industries are subject to more attacks.
Total volume vs. percentage For both source and target insights, we look at the total volume of attack traffic compared to all traffic as one data point. Additionally, we also look at the percentage of attack traffic towards or from a specific country, to a specific country or to a specific industry. This gives us an “attack activity rate” for a given country/industry which is normalized by their total traffic levels. This helps us remove biases of a country or industry that normally receives a lot of traffic and therefore a lot of attack traffic as well.
How we calculate attack characteristics To calculate the attack size, duration, attack vectors and emerging threats, we bucket attacks and then provide the share of each bucket out of the total amount for each dimension.
General disclaimer and clarification When we describe ‘top countries’ as the source or target of attacks, it does not necessarily mean that that country was attacked as a country, but rather that organizations that use that country as their billing country were targeted by attacks. Similarly, attacks originating from a country does not mean that that country launched the attacks, but rather that the attack was launched from IP addresses that have been mapped to that country. Threat actors operate global botnets with nodes all over the world, and in many cases also use Virtual Private Networks and proxies to obfuscate their true location. So if anything, the source country could indicate the presence of exit nodes or botnet nodes within that country.
Welcome to our DDoS Threat Report for the fourth and final quarter of 2022. This report includes insights and trends about the DDoS threat landscape – as observed across Cloudflare’s global network.
In the last quarter of the year, as billions around the world celebrated holidays and events such as Thanksgiving, Christmas, Hanukkah, Black Friday, Singles’ Day, and New Year, DDoS attacks persisted and even increased in size, frequency, and sophistication whilst attempting to disrupt our way of life.
Cloudflare’s automated DDoS defenses stood firm and mitigated millions of attacks in the last quarter alone. We’ve taken all of those attacks, aggregated, analyzed, and prepared the bottom lines to help you better understand the threat landscape.
Global DDoS insights
In the last quarter of the year, despite a year-long decline, the amount of HTTP DDoS attack traffic still increased by 79% YoY. While most of these attacks were small, Cloudflare constantly saw terabit-strong attacks, DDoS attacks in the hundreds of millions of packets per second, and HTTP DDoS attacks peaking in the tens of millions of requests per second launched by sophisticated botnets.
Volumetric attacks surged; the number of attacks exceeding rates of 100 gigabits per second (Gbps) grew by 67% quarter-over-quarter (QoQ), and the number of attacks lasting more than three hours increased by 87% QoQ.
Ransom DDoS attacks steadily increased this year. In Q4, over 16% of respondents reported receiving a threat or ransom demand as part of the DDoS attack that targeted their Internet properties.
Industries most targeted by DDoS attacks
HTTP DDoS attacks constituted 35% of all traffic to Aviation and Aerospace Internet properties.
Similarly, over a third of all traffic to the Gaming/Gambling and Finance industries was network-layer DDoS attack traffic.
A whopping 92% of traffic to Education Management companies was part of network-layer DDoS attacks. Likewise, 73% of traffic to the Information Technology and Services and the Public Relations & Communications industries were also network-layer DDoS attacks.
Source and targets of DDoS attacks
In Q4, 93% of network-layer traffic to Chinese Internet properties behind Cloudflare were part of network-layer DDoS attacks. Similarly, over 86% of traffic to Cloudflare customers in Lithuania and 80% of traffic to Cloudflare customers in Finland was attack traffic.
On the application-layer, over 42% of all traffic to Georgian Internet properties behind Cloudflare was part of HTTP DDoS attacks, followed by Belize with 28%, and San Marino in third place with just below 20%. Almost 20% of all traffic from Libya that Cloudflare saw was application-layer DDoS attack traffic.
Over 52% of all traffic recorded in Cloudflare’s data centers in Botswana was network-layer DDoS attack traffic. Similarly, in Cloudflare’s data centers in Azerbaijan, Paraguay, and Palestine, network-layer DDoS attack traffic constituted approximately 40% of all traffic.
Quick note: this quarter, we’ve made a change to our algorithms to improve the accuracy of our data which means that some of these data points are incomparable to previous quarters. Read more about these changes in the next section Changes to the report methodologies.
Sign up to the DDoS Trends Webinar to learn more about the emerging threats and how to defend against them.
Changes to the report methodologies
Since our first report in 2020, we’ve always used percentages to represent attack traffic, i.e., the percentage of attack traffic out of all traffic including legitimate/user traffic. We did this to normalize the data, avoid data biases, and be more flexible when it comes to incorporating new mitigation system data into the report.
In this report, we’ve introduced changes to the methods used to calculate some of those percentages when we bucket attacks by certain dimensions such as target country, source country, or target industry. In the application-layer sections, we previously divided the amount of attack HTTP/S requests to a given dimension by all the HTTP/S requests to all dimensions. In the network-layer section, specifically in Target industries and Target countries, we used to divide the amount of attack IP packets to a given dimension by the total attack packets to all dimensions.
From this report onwards, we now divide the attack requests (or packets) to a given dimension only by the total requests (or packets) to that given dimension. We made these changes in order to align our calculation methods throughout the report and improve the data accuracy so it better represents the attack landscape.
For example, the top industry attacked by application-layer DDoS attacks using the previous method was the Gaming and Gambling industry. The attack requests towards that industry accounted for 0.084% of all traffic (attack and non-attack) to all industries. Using that same old method, the Aviation and Aerospace industry came in 12th place. Attack traffic towards the Aviation and Aerospace industry accounted for 0.0065% of all traffic (attack and non-attack) to all industries. However, using the new method, the Aviation and Aerospace industry came in as the number one most attacked industry — attack traffic formed 35% of all traffic (attack and non-attack) towards that industry alone. Again using the new method, the Gaming and Gambling industry came in 14th place — 2.4% of its traffic was attack traffic.
The old calculation method used in previous reports to calculate the percentage of attack traffic for each dimension was the following:
The new calculation method used from this report onwards is the following:
The changes apply to the following metrics:
Target industries of application-layer DDoS attacks
Target countries of application-layer DDoS attacks
Source of application-layer DDoS attacks
Target industries of network-layer DDoS attacks
Target countries of network-layer DDoS attacks
No other changes were made in the report. The Source of network-layer DDoS attacks metrics already use this method since the first report. Also, no changes were made to the Ransom DDoS attacks, DDoS attack rate, DDoS attack duration, DDoS attack vectors, and Top emerging threats sections. These metrics do not take legitimate traffic into consideration and no methodology alignment was needed.
With that in mind, let’s dive in deeper and explore these insights and trends. You can also view an interactive version of this report on Cloudflare Radar.
Ransom DDoS attacks
As opposed to Ransomware attacks, where the victim is tricked into downloading a file or clicking on an email link that encrypts and locks their computer files until they pay a ransom fee, Ransom DDoS attacks can be much easier for attackers to launch. Ransom DDoS attacks don’t require tricking the victim into opening an email or clicking a link, nor do they require a network intrusion or a foothold to be carried out.
In a Ransom DDoS attack, the attacker doesn’t need access to the victim’s computer but rather just floods them with enough traffic to negatively impact their Internet services. The attacker will demand a ransom payment, usually in the form of Bitcoin, to stop and/or avoid further attacks.
In the last quarter of 2022, 16% of Cloudflare customers that responded to our survey reported being targeted by HTTP DDoS attacks accompanied by a threat or a ransom note. This represents a 14% increase QoQ but a 16% decrease YoY in reported Ransom DDoS attacks.
Distribution of Ransom DDoS attacks over 2021 and 2022 by quarter (each column represents the percentage of users reporting a ransom attack)
How we calculate Ransom DDoS attack trends Cloudflare’s systems constantly analyze traffic and automatically apply mitigation when DDoS attacks are detected. Each DDoS’d customer is prompted with an automated survey to help us better understand the nature of the attack and the success of the mitigation. For over two years, Cloudflare has been surveying attacked customers. One of the questions in the survey asks the respondents if they received a threat or a ransom note. Over the past two years, on average, we collected 187 responses per quarter. The responses of this survey are used to calculate the percentage of Ransom DDoS attacks.
Application-layer DDoS attack landscape
Application-layer DDoS attacks, specifically HTTP/S DDoS attacks, are cyber attacks that usually aim to disrupt web servers by making them unable to process legitimate user requests. If a server is bombarded with more requests than it can process, the server will drop legitimate requests and – in some cases – crash, resulting in degraded performance or an outage for legitimate users.
Application-layer DDoS attack trends
When we look at the graph below, we can see a clear downward trend in attacks each quarter this year. However, despite the downward trend, HTTP DDoS attacks still increased by 79% when compared to the same quarter of previous year.
Distribution of HTTP DDoS attacks over the last year by quarter
Target industries of application-layer DDoS attacks
In the quarter where many people travel for the holidays, the Aviation and Aerospace was the most attacked industry. Approximately 35% of traffic to the industry was part of HTTP DDoS attacks. In second place, the Events Services industry saw over 16% of its traffic as HTTP DDoS attacks.
In the following places were the Media and Publishing, Wireless, Government Relations, and Non-profit industries. To learn more about how Cloudflare protects non-profit and human rights organizations, read our recent Impact Report.
Top industries targeted by HTTP DDoS attacks in 2022 Q4
When we break it down regionally, and after excluding generic industry buckets like Internet and Software, we can see that in North America and Oceania the Telecommunications industry was the most targeted. In South America and Africa, the Hospitality industry was the most targeted. In Europe and Asia, Gaming & Gambling industries were the most targeted. And in the Middle East, the Education industry saw the most attacks.
Top industries targeted by HTTP DDoS attacks in 2022 Q4, by region
Target countries of application-layer DDoS attacks
Bucketing attacks by our customers’ billing address helps us understand which countries are more frequently attacked. In Q4, over 42% of all traffic to Georgian HTTP applications behind Cloudflare was DDoS attack traffic.
In second place, Belize-based companies saw almost a third of their traffic as DDoS attacks, followed by San Marino in third with just below 20% of its traffic being DDoS attack traffic.
Top countries targeted by HTTP DDoS attacks in 2022 Q4
Source of application-layer DDoS attacks
Quick note before we dive in. If a country is found to be a major source of DDoS attacks, it doesn’t necessarily mean that it is that country that launches the attacks. Most often with DDoS attacks, attackers are launching attacks remotely in an attempt to hide their true location. Top source countries are more often indicators that there are botnet nodes operating from within that country, perhaps hijacked servers or IoT devices.
In Q4, almost 20% of all HTTP traffic originating from Libya was part of HTTP DDoS attacks. Similarly, 18% of traffic originating from Timor-Leste, an island country in Southeast Asia just north of Australia, was attack traffic. DDoS attack traffic also accounted for 17% of all traffic originating from the British Virgin Islands and 14% of all traffic originating from Afghanistan.
Top source countries of HTTP DDoS attacks in 2022 Q4
Network-layer DDoS attacks
While application-layer attacks target the application (Layer 7 of the OSI model) running the service that end users are trying to access (HTTP/S in our case), network-layer DDoS attacks aim to overwhelm network infrastructure, such as in-line routers and servers, and the Internet link itself.
Network-layer DDoS attack trends
After a year of steady increases in network-layer DDoS attacks, in the fourth and final quarter of the year, the amount of attacks actually decreased by 14% QoQ and 13% YoY.
Distribution of Network-layer DDoS attacks over the last year by quarter
Now let’s dive a little deeper to understand the various attack properties such as the attack volumetric rates, durations, attack vectors, and emerging threats.
DDoS attack rate While the vast majority of attacks are relatively short and small, we did see a spike in longer and larger attacks this quarter. The amount of volumetric network-layer DDoS attacks with a rate exceeding 100 Gbps increased by 67% QoQ. Similarly, attacks in the range of 1-100 Gbps increased by ~20% QoQ, and attacks in the range of 500 Mbps to 1 Gbps increased by 108% QoQ.
QoQ change in DDoS attack rates in 2022 Q4
Below is an example of one of those attacks exceeding 100 Gbps that took place the week after Thanksgiving. This was a 1 Tbps DDoS attack targeted at a Korean-based hosting provider. This particular attack was an ACK flood, and it lasted roughly one minute. Since the hosting provider was using Magic Transit, Cloudflare’s L3 DDoS protection service, the attack was automatically detected and mitigated.
Graph of a 1 Tbps DDoS attack
While bit-intensive attacks usually aim to clog up the Internet connection to cause a denial of service event, packet-intensive attacks attempt to crash in-line devices. If an attack sends more packets than you can handle, the servers and other in-line appliances might not be able to process legitimate user traffic, or even crash altogether.
DDoS attack duration In Q4, the amount of shorter attacks lasting less than 10 minutes decreased by 76% QoQ, and the amount of longer attacks increased. Most notably, attacks lasting 1-3 hours increased by 349% QoQ and the amount of attacks lasting more than three hours increased by 87% QoQ. Most of the attacks, over 67% of them, lasted 10-20 minutes.
QoQ change in the duration of DDoS attacks in 2022 Q4
DDoS attack vectors The attack vector is a term used to describe the attack method. In Q4, SYN floods remained the attacker’s method of choice — in fact, almost half of all network-layer DDoS attacks were SYN floods.
As a recap, SYN floods are a flood of SYN packets (TCP packets with the Synchronize flag turned on, i.e., the bit set to 1). SYN floods take advantage of the statefulness of the Three-way TCP handshake — which is the way to establish a connection between a server and a client.
The Three-way TCP Handshake
The client starts off by sending a SYN packet, the server responds with a Synchronize-acknowledgement (SYN/ACK) packet and waits for the client’s Acknowledgement (ACK) packet. For every connection, a certain amount of memory is allocated. In the SYN flood, the source IP addresses may be spoofed (altered) by the attacker, causing the server to respond with the SYN/ACK packets to the spoofed IP addresses — which most likely ignore the packet. The server then naively waits for the never arriving ACK packets to complete the handshake. After a while, the server times out and releases those resources. However, given a sufficient amount of SYN packets in a short amount of time, they may be enough to drain the server’s resources and render it unable to handle legitimate user connections or even crash altogether.
After SYN floods, with a massive drop in share, DNS floods and amplification attacks came in second place, accounting for ~15% of all network-layer DDoS attacks. And in third UDP-based DDoS attacks and floods with a 9% share.
Top attack vectors in 2022 Q4
Emerging DDoS threats In Q4, Memcached-based DDoS attacks saw the highest growth — a 1,338% increase QoQ. Memcached is a database caching system for speeding up websites and networks. Memcached servers that support UDP can be abused to launch amplification/reflection DDoS attacks. In this case, the attacker would request content from the caching system and spoof the victim’s IP address as the source IP in the UDP packets. The victim will be flooded with the Memcache responses which can be amplified by a factor of up to 51,200x.
In second place, SNMP-based DDoS attacks increased by 709% QoQ. Simple Network Management Protocol (SNMP) is a UDP-based protocol that is often used to discover and manage network devices such as printers, switches, routers, and firewalls of a home or enterprise network on UDP well-known port 161. In an SNMP reflection attack, the attacker sends out numerous SNMP queries while spoofing the source IP address in the packet as the targets to devices on the network that, in turn, reply to that target’s address. Numerous responses from the devices on the network results in the target network being DDoSed.
In third place, VxWorks-based DDoS attacks increased by 566% QoQ. VxWorks is a real-time operating system (RTOS) often used in embedded systems such as Internet of Things (IoT) devices. It also is used in networking and security devices, such as switches, routers, and firewalls. By default, it has a debug service enabled which not only allows anyone to do pretty much anything to those systems, but it can also be used for DDoS amplification attacks. This exploit (CVE-2010-2965) was exposed as early as 2010 and as we can see it is still being used in the wild to generate DDoS attacks.
Top emerging threats in 2022 Q4
Target industries of network-layer DDoS attacks
In Q4, the Education Management industry saw the highest percentage of network-layer DDoS attack traffic — 92% of all traffic routed to the industry was network-layer DDoS attack traffic.
Not too far behind, in the second and third places, the Information Technology and Services alongside the Public Relations and Communications industries also saw a significant amount of network-layer DDoS attack traffic (~73%). With a high margin, the Finance, Gaming / Gambling, and Medical Practice industries came in next with approximately a third of their traffic flagged as attack traffic.
Top industries targeted by network-layer DDoS attacks in 2022 Q4
Target countries of network-layer DDoS attacks
Grouping attacks by our customers’ billing country lets us understand which countries are subject to more attacks. In Q4, a staggering 93% of traffic to Chinese Internet properties behind Cloudflare was network-layer DDoS attack traffic.
In second place, Lithuanian Internet properties behind Cloudflare saw 87% of their traffic belonging to network-layer DDoS attack traffic. Following were Finland, Singapore, and Taiwan with the highest percentage of attack traffic.
Top countries targeted by network-layer DDoS attacks in 2022 Q4
Source of network-layer DDoS attacks
In the application-layer, we used the attacking IP addresses to understand the origin country of the attacks. That is because at that layer, IP addresses cannot be spoofed (i.e., altered). However, in the network layer, source IP addresses can be spoofed. So, instead of relying on IP addresses to understand the source, we instead use the location of our data centers where the attack packets were ingested. We’re able to get geographical accuracy due to our large global coverage in over 275+ locations around the world.
In Q4, over 52% of the traffic we ingested in our Botswana-based data center was attack traffic. Not too far behind, over 43% of traffic in Azerbaijan was attack traffic, followed by Paraguay, Palestine, Laos, and Nepal.
Top Cloudflare data center locations with the highest percentage of DDoS attack traffic in 2022 Q4
Please note: Internet Service Providers may sometimes route traffic differently which may skew results. For example, traffic from China may be hauled through California due to various operational considerations.
Understanding the DDoS threat landscape
This quarter, longer and larger attacks became more frequent. Attack durations increased across the board, volumetric attacks surged, and Ransom DDoS attacks continued to rise. During the 2022 holiday season, the top targeted industries for DDoS attacks at the application-layer were Aviation/Aerospace and Events Services. Network-layer DDoS attacks targeted Gaming/Gambling, Finance, and Education Management companies. We also saw a shift in the top emerging threats, with Memcashed-based DDoS attacks continuing to increase in prevalence.
Defending against DDoS attacks is critical for organizations of all sizes. While attacks may be initiated by humans, they are executed by bots — and to play to win, you must fight bots with bots. Detection and mitigation must be automated as much as possible, because relying solely on humans puts defenders at a disadvantage. Cloudflare’s automated systems constantly detect and mitigate DDoS attacks for our customers, so they don’t have to.
Over the years, it has become easier, cheaper, and more accessible for attackers and attackers-for-hire to launch DDoS attacks. But as easy as it has become for the attackers, we want to make sure that it is even easier – and free – for defenders of organizations of all sizes to protect themselves against DDoS attacks of all types. We’ve been providing unmetered and unlimited DDoS protection for free to all of our customers since 2017 — when we pioneered the concept. Cloudflare’s mission is to help build a better Internet. A better Internet is one that is more secure, faster, and reliable for everyone – even in the face of DDoS attacks.
Sign up to the DDoS Trends Webinar to learn more about the emerging threats and how to defend against them.
Welcome to our DDoS Threat Report for the third quarter of 2022. This report includes insights and trends about the DDoS threat landscape – as observed across Cloudflare’s global network.
Multi-terabit strong DDoS attacks have become increasingly frequent. In Q3, Cloudflare automatically detected and mitigated multiple attacks that exceeded 1 Tbps. The largest attack was a 2.5 Tbps DDoS attack launched by a Mirai botnet variant, aimed at the Minecraft server, Wynncraft. This is the largest attack we’ve ever seen from the bitrate perspective.
It was a multi-vector attack consisting of UDP and TCP floods. However, Wynncraft, a massively multiplayer online role-playing game Minecraft server where hundreds and thousands of users can play on the same server, didn’t even notice the attack, since Cloudflare filtered it out for them.
The 2.5 Tbps DDoS attack that targeted Wynncraft — launched by Mirai
General DDoS attack trends
Overall this quarter, we’ve seen:
An increase in DDoS attacks compared to last year.
Longer-lasting volumetric attacks, a spike in attacks generated by the Mirai botnet and its variants.
Surges in attacks targeting Taiwan and Japan.
Application-layer DDoS attacks
HTTP DDoS attacks increased by 111% YoY, but decreased by 10% QoQ.
HTTP DDoS attacks targeting Taiwan increased by 200% QoQ; attacks targeting Japan increased by 105% QoQ.
Reports of Ransom DDoS attacks increased by 67% YoY and 15% QoQ.
Network-layer DDoS attacks
L3/4 DDoS attacks increased by 97% YoY and 24% QoQ.
L3/4 DDoS attacks by Mirai botnets increased by 405% QoQ.
The Gaming / Gambling industry was the most targeted by L3/4 DDoS attacks including a massive 2.5 Tbps DDoS attack.
This report is based on DDoS attacks that were automatically detected and mitigated by Cloudflare’s DDoS Protection systems. To learn more about how it works, check out this deep-dive blog post.
Ransom attacks
Ransom DDoS attacks are attacks where the attacker demands a ransom payment, usually in the form of Bitcoin, to stop/avoid the attack. In Q3, 15% of Cloudflare customers that responded to our survey reported being targeted by HTTP DDoS attacks accompanied by a threat or a ransom note. This represents a 15% increase QoQ and 67% increase YoY of reported ransom DDoS attacks.
Distribution of Ransom DDoS attacks by quarter
Diving into Q3, we can see that since June 2022, there was a steady decline in reports of ransom attacks. However, in September, the reports of ransom attacks spiked again. In the month of September, almost one out of every four respondents reported receiving a ransom DDoS attack or threat — the highest month in 2022 so far.
Distribution of Ransom DDoS attacks by month
How we calculate Ransom DDoS attack trends Our systems constantly analyze traffic and automatically apply mitigation when DDoS attacks are detected. Each DDoS’d customer is prompted with an automated survey to help us better understand the nature of the attack and the success of the mitigation. For over two years, Cloudflare has been surveying attacked customers. One of the questions in the survey asks the respondents if they received a threat or a ransom note demanding payment in exchange to stop the DDoS attack. Over the past year, on average, we collected 174 responses per quarter. The responses of this survey are used to calculate the percentage of Ransom DDoS attacks.
Application-layer DDoS attacks
Application-layer DDoS attacks, specifically HTTP DDoS attacks, are attacks that usually aim to disrupt a web server by making it unable to process legitimate user requests. If a server is bombarded with more requests than it can process, the server will drop legitimate requests and – in some cases – crash, resulting in degraded performance or an outage for legitimate users.
Application-layer DDoS attack trends
When we look at the graph below, we can see a clear trend of approximately 10% decrease in attacks each quarter since 2022 Q1. However, despite the downward trend, when comparing Q3 of 2022 to Q3 of 2021, we can see that HTTP DDoS attacks still increased by 111% YoY.
Distribution of HTTP DDoS attacks by quarter
When we dive into the months of the quarter, attacks in September and August were fairly evenly distributed; 36% and 35% respectively. In July, the amount of attacks was the lowest for the quarter (29%).
Distribution of HTTP DDoS attacks by month in 2022 Q3
Application-layer DDoS attacks by industry
By bucketing the attacks by our customers’ industry of operation, we can see that HTTP applications operated by Internet companies were the most targeted in Q3. Attacks on the Internet industry increased by 131% QoQ and 300% YoY.
The second most attacked industry was the Telecommunications industry with an increase of 93% QoQ and 2,317% (!) YoY. In third place was the Gaming / Gambling industry with a more conservative increase of 17% QoQ and 36% YoY.
Top industries targeted by HTTP DDoS attacks in 2022 Q3
Application-layer DDoS attacks by target country
Bucketing attacks by our customers’ billing address gives us an understanding of which countries are more attacked. HTTP applications operated by US companies were the most targeted in Q3. US-based websites saw an increase of 60% QoQ and 105% YoY in attacks targeting them. After the US, was China with a 332% increase QoQ and an 800% increase YoY.
Looking at Ukraine, we can see that attacks targeting Ukrainian websites increased by 67% QoQ but decreased by 50% YoY. Furthermore, attacks targeting Russian websites increased by 31% QoQ and 2,400% (!) YoY.
In East Asia, we can see that attacks targeting Taiwanese companies increased by 200% QoQ and 60% YoY, and attacks targeting Japanese companies increased by 105% QoQ.
Top countries targeted by HTTP DDoS attacks in 2022 Q3
When we zoom in on specific countries, we can identify the below trends that may reveal interesting insights regarding the war in Ukraine and geopolitical events in East Asia:
In Ukraine, we see a surprising change in the attacked industries. Over the past two quarters, Broadcasting, Online Media and Publishing companies were targeted the most in what appeared to be an attempt to silence information and make it unavailable to civilians. However, this quarter, those industries dropped out of the top 10 list. Instead, the Marketing & Advertising industry took the lead (40%), followed by Education companies (20%), and Government Administration (8%).
In Russia, attacks on the Banking, Financial Services and Insurance (BFSI) industry continue to persist (25%). Be that as it may, attacks on the BFSI sector still decreased by 44% QoQ. In second place is the Events Services industry (20%), followed by Cryptocurrency (16%), Broadcast Media (13%), and Retail (11%). A significant portion of the attack traffic came from Germany-based IP addresses, and the rest were globally distributed.
In Taiwan, the two most attacked industries were Online Media (50%) and Internet (23%). Attacks to those industries were globally distributed indicating the usage of botnets.
In Japan, the most attacked industry was Internet/Media & Internet (52%), Business Services (12%), and Government – National (11%).
Application-layer DDoS attack traffic by source country
Before digging into specific source country metrics, it is important to note that while country of origin is interesting, it is not necessarily indicative of where the attacker is located. Oftentimes with DDoS attacks, they are launched remotely, and attackers will go to great lengths to hide their actual location in an attempt to avoid being caught. If anything, it is indicative of where botnet nodes are located. With that being said, by mapping the attacking IP address to their location, we can understand where attack traffic is coming from.
After two consecutive quarters, China replaced the US as the main source of HTTP DDoS attack traffic. In Q3, China was the largest source of HTTP DDoS attack traffic. Attack traffic from China-registered IP addresses increased by 29% YoY and 19% QoQ. Following China was India as the second-largest source of HTTP DDoS attack traffic — an increase of 61% YoY. After India, the main sources were the US and Brazil.
Looking at Ukraine, we can see that this quarter there was a drop in attack traffic originating from Ukrainian and Russian IP addresses — a decrease of 29% and 11% QoQ, respectively. However, YoY, attack traffic from within those countries still increased by 47% and 18%, respectively.
Another interesting data point is that attack traffic originating from Japanese IP addresses increased by 130% YoY.
Top source countries of HTTP DDoS attacks in 2022 Q3
Network-layer DDoS attacks
While application-layer attacks target the application (Layer 7 of the OSI model) running the service that end users are trying to access (HTTP/S in our case), network-layer attacks aim to overwhelm network infrastructure (such as in-line routers and servers) and the Internet link itself.
Network-layer DDoS attack trends
In Q3, we saw a large surge in L3/4 DDoS attacks — an increase of 97% YoY and a 24% QoQ. Furthermore, when we look at the graph we can see a clear trend, over the past three quarters, of an increase in attacks.
Distribution of L3/4 DDoS attacks by quarter
Drilling down into the quarter, it’s apparent that the attacks were, for the most part, evenly distributed throughout the quarter — with a slightly larger share for July.
Distribution of L3/4 DDoS attacks by month in 2022 Q3
Network-layer DDoS attacks by Industry
The Gaming / Gambling industry was hit by the most L3/4 DDoS attacks in Q3. Almost one out of every five bytes Cloudflare ingested towards Gaming / Gambling networks was part of a DDoS attack. This represents a whopping 381% increase QoQ.
The second most targeted industry was Telecommunications — almost 6% of bytes towards Telecommunications networks were part of DDoS attacks. This represents a 58% drop from the previous quarter where Telecommunications was the top most attacked industry by L3/4 DDoS attacks.
Following were the Information Technology and Services industry along with the Software industry. Both saw significant growth in attacks — 89% and 150% QoQ, respectively.
Top industries targeted by L3/4 DDoS attacks in 2022 Q3
Network-layer DDoS attacks by target country
In Q3, Singapore-based companies saw the most L3/4 DDoS attacks — over 15% of all bytes to their networks were associated with a DDoS attack. This represents a dramatic 1,175% increase QoQ.
The US comes in second after a 45% decrease QoQ in attack traffic targeting US networks. In third, China, with a 62% QoQ increase. Attacks on Taiwan companies also increased by 200% QoQ.
Top countries targeted by L3/4 DDoS attacks in 2022 Q3
Network-layer DDoS attacks by ingress country
In Q3, Cloudflare’s data centers in Azerbaijan saw the largest percentage of attack traffic. More than a third of all packets ingested there were part of a L3/4 DDoS attack. This represents a 44% increase QoQ and a huge 59-fold increase YoY.
Similarly, our data centers in Tunisia saw a dramatic increase in attack packets – 173x the amount in the previous year. Zimbabwe and Germany also saw significant increases in attacks.
Zooming into East Asia, we can see that our data centers in Taiwan saw an increase of attacks — 207% QoQ and 1,989% YoY. We saw similar numbers in Japan where attacks increased by 278% QoQ and 1,921% YoY.
Looking at Ukraine, we actually see a dip in the amount of attack packets we observed in our Ukraine-based and Russia-based data centers — 49% and 16% QoQ, respectively.
Top Cloudflare data center locations with the highest percentage of DDoS attack traffic in 2022 Q3
Attack vectors & Emerging threats
An attack vector is the method used to launch the attack or the method of attempting to achieve denial-of-service. With a combined share of 71%, SYN floods and DNS attacks remain the most popular DDoS attack vectors in Q3.
Top attack vectors in 2022 Q3
Last quarter, we saw a resurgence of attacks abusing the CHARGEN protocol, the Ubiquity Discovery Protocol, and Memcached reflection attacks. While the growth in Memcached DDoS attacks also slightly grew (48%), this quarter, there was a more dramatic increase in attacks abusing the BitTorrent protocol (1,221%), as well as attacks launched by the Mirai botnet and its variants.
BitTorrent DDoS attacks increased by 1,221% QoQ The BitTorrent protocol is a communication protocol that’s used for peer to peer file sharing. To help the BitTorrent clients find and download the files efficiently, BitTorrent clients may use BitTorrent Trackers or Distributed Hash Tables (DHT) to identify the peers that are seeding the desired file. This concept can be abused to launch DDoS attacks. A malicious actor can spoof the victim’s IP address as a seeder IP address within Trackers and DHT systems. Then clients would request the files from those IPs. Given a sufficient number of clients requesting the file, it can flood the victim with more traffic than it can handle.
Mirai DDoS attacks increased by 405% QoQ Mirai is malware that infects smart devices that run on ARC processors, turning them into a network of bots that can be used to launch DDoS attacks. This processor runs a stripped-down version of the Linux operating system. If the default username-and-password combo is not changed, Mirai is able to log in to the device, infect it, and take over. The botnet operator can instruct the botnet to launch a flood of UDP packets at the victim’s IP address to bombard them.
Top emerging threats in 2022 Q3
Network-layer DDoS attacks by Attack Rates & Duration
While Terabit-strong attacks are becoming more frequent, they are still the outliers. The majority of attacks are tiny (in terms of Cloudflare scale). Over 95% of attacks peaked below 50,000 packets per second (pps) and over 97% below 500 Megabits per second (Mbps). We call this “cyber vandalism”.
What is cyber vandalism? As opposed to “classic” vandalism where the purpose is to cause deliberate destruction of or damage to public or private physical property — such as graffiti on the side of a building — in the cyberworld, cyber vandalism is the act of causing deliberate damage to Internet properties. Today the source codes for various botnets are available online and there are a number of free tools that can be used to launch a flood of packets. By directing those tools to Internet properties, any script-kid can use those tools to launch attacks against their school during exam season or any other website they desire to take down or disrupt. This is as opposed to organized crime, Advanced Persistent Threat actors, and state-level actors that can launch much larger and sophisticated attacks.
Distribution of DDoS attacks by bitrate in 2022 Q3
Similarly, most of the attacks are very short and end within 20 minutes (94%). This quarter we did see an increase of 9% in attacks of 1-3 hours, and a 3% increase in attacks over 3 hours — but those are still the outliers.
QoQ change in the duration of DDoS attacks in 2022 Q3
Even with the largest attacks, such as the 2.5 Tbps attack we mitigated earlier this quarter, and the 26M request per second attack we mitigated back in the summer, the peak of the attacks were short-lived. The entire 2.5 Tbps attack lasted about 2 minutes, and the peak of the 26M rps attack only 15 seconds. This emphasizes the need for automated, always-on solutions. Security teams can’t respond quick enough. By the time the security engineer looks at the PagerDuty notification on their phone, the attack has subsided.
Summary
Attacks may be initiated by humans, but they are executed by bots — and to play to win, you must fight bots with bots. Detection and mitigation must be automated as much as possible, because relying solely on humans puts defenders at a disadvantage. Cloudflare’s automated systems constantly detect and mitigate DDoS attacks for our customers, so they don’t have to.
Over the years, it has become easier, cheaper, and more accessible for attackers and attackers-for-hire to launch DDoS attacks. But as easy as it has become for the attackers, we want to make sure that it is even easier – and free – for defenders of organizations of all sizes to protect themselves against DDoS attacks of all types. We’ve been providing unmetered and unlimited DDoS protection for free to all of our customers since 2017 — when we pioneered the concept.
Cloudflare’s mission is to help build a better Internet. A better Internet is one that is more secure, faster, and reliable for everyone – even in the face of DDoS attacks.
Welcome to our 2022 Q2 DDoS report. This report includes insights and trends about the DDoS threat landscape — as observed across the global Cloudflare network. An interactive version of this report is also available on Radar.
In Q2, we’ve seen some of the largest attacks the world has ever seen including a 26 million request per second HTTPS DDoS attacks that Cloudflare automatically detected and mitigated. Furthermore, attacks against Ukraine and Russia continue, whilst a new Ransom DDoS attack campaign emerged.
The Highlights
Ukrainian and Russian Internet
The war on the ground is accompanied by attacks targeting the spread of information.
Broadcast Media companies in the Ukraine were the most targeted in Q2 by DDoS attacks. In fact, all the top five most attacked industries are all in online/Internet media, publishing, and broadcasting.
In Russia on the other hand, Online Media drops as the most attacked industry to the third place. Making their way to the top, Banking, Financial Services and Insurance (BFSI) companies in Russia were the most targeted in Q2; almost 45% of all application-layer DDoS attacks targeted the BFSI sector. Cryptocurrency companies in Russia were the second most attacked.
We’ve seen a new wave of Ransom DDoS attacks by entities claiming to be the Fancy Lazarus.
In June 2022, ransom attacks peaked to the highest of the year so far: one out of every five survey respondents who experienced a DDoS attack reported being subject to a Ransom DDoS attack or other threats.
Overall in Q2, the percent of Ransom DDoS attacks increased by 11% QoQ.
Application-layer DDoS attacks
In 2022 Q2, application-layer DDoS attacks increased by 72% YoY.
Organizations in the US were the most targeted, followed by Cyprus, Hong Kong, and China. Attacks on organizations in Cyprus increased by 166% QoQ.
The Aviation & Aerospace industry was the most targeted in Q2, followed by the Internet industry, Banking, Financial Services and Insurance, and Gaming / Gambling in fourth place.
Network-layer DDoS attacks
In 2022 Q2, network-layer DDoS attacks increased by 109% YoY. Attacks of 100 Gbps and larger increased by 8% QoQ, and attacks lasting more than 3 hours increased by 12% QoQ.
The top attacked industries were Telecommunications, Gaming / Gambling and the Information Technology and Services industry.
Organizations in the US were the most targeted, followed by China, Singapore, and Germany.
This report is based on DDoS attacks that were automatically detected and mitigated by Cloudflare’s DDoS Protection systems. To learn more about how it works, check out this deep-dive blog post.
A note on how we measure DDoS attacks observed over our network
To analyze attack trends, we calculate the “DDoS activity” rate, which is either the percentage of attack traffic out of the total traffic (attack + clean) observed over our global network, or in a specific location, or in a specific category (e.g., industry or billing country). Measuring the percentages allows us to normalize data points and avoid biases reflected in absolute numbers towards, for example, a Cloudflare data center that receives more total traffic and likely, also more attacks.
Ransom Attacks
Our systems constantly analyze traffic and automatically apply mitigation when DDoS attacks are detected. Each DDoS’d customer is prompted with an automated survey to help us better understand the nature of the attack and the success of the mitigation.
For over two years now, Cloudflare has been surveying attacked customers — one question on the survey being if they received a threat or a ransom note demanding payment in exchange to stop the DDoS attack.
The number of respondents reporting threats or ransom notes in Q2 increased by 11% QoQ and YoY. During this quarter, we’ve been mitigating Ransom DDoS attacks that have been launched by entities claiming to be the Advanced Persistent Threat (APT) group “Fancy Lazarus”. The campaign has been focusing on financial institutions and cryptocurrency companies.
The percentage of respondents reported being targeted by a ransom DDoS attack or that have received threats in advance of the attack.
Drilling down into Q2, we can see that in June one out of every five respondents reported receiving a ransom DDoS attack or threat — the highest month in 2022, and the highest since December 2021.
Application-layer DDoS attacks
Application-layer DDoS attacks, specifically HTTP DDoS attacks, are attacks that usually aim to disrupt a web server by making it unable to process legitimate user requests. If a server is bombarded with more requests than it can process, the server will drop legitimate requests and — in some cases — crash, resulting in degraded performance or an outage for legitimate users.
Application-layer DDoS attacks by month
In Q2, application-layer DDoS attacks increased by 72% YoY.
Overall, in Q2, the volume of application-layer DDoS attacks increased by 72% YoY, but decreased 5% QoQ. May was the busiest month in the quarter. Almost 41% of all application-layer DDoS attacks took place in May, whereas the least number of attacks took place in June (28%).
Application-layer DDoS attacks by industry
Attacks on the Aviation and Aerospace industry increased by 493% QoQ.
In Q2, Aviation and Aerospace was the most targeted industry by application-layer DDoS attacks. After it, was the Internet industry, Banking, Financial Institutions and Insurance (BFSI) industry, and in fourth place the Gaming / Gambling industry.
Ukraine and Russia cyberspace
Media and publishing companies are the most targeted in Ukraine.
As the war in Ukraine continues on the ground, in the air and on the water, so does it continue in cyberspace. Entities targeting Ukrainian companies appear to be trying to silence information. The top five most attacked industries in the Ukraine are all in broadcasting, Internet, online media, and publishing — that’s almost 80% of all DDoS Attacks targeting Ukraine.
On the other side of the war, the Russian Banks, Financial Institutions and Insurance (BFSI) companies came under the most attacks. Almost 45% of all DDoS attacks targeted the BFSI sector. The second most targeted was the Cryptocurrency industry, followed by Online media.
In both sides of the war, we can see that the attacks are highly distributed, indicating the use of globally distributed botnets.
Application-layer DDoS attacks by source country
In Q2, attacks from China shrank by 78%, and attacks from the US shrank by 43%.
To understand the origin of the HTTP attacks, we look at the geolocation of the source IP address belonging to the client that generated the attack HTTP requests. Unlike network-layer attacks, source IP addresses cannot be spoofed in HTTP attacks. A high percentage of DDoS activity in a given country doesn’t mean that that specific country is launching the attacks but rather indicates the presence of botnets operating from within the country’s borders.
For the second quarter in a row, the United States tops the charts as the main source of HTTP DDoS attacks. Following the US is China in second place, and India and Germany in the third and fourth. Even though the US remained in the first place, attacks originating from the US shrank by 48% QoQ while attacks from other regions grew; attacks from India grew by 87%, from Germany by 33%, and attacks from Brazil grew by 67%.
Application-layer DDoS attacks by target country
In order to identify which countries are targeted by the most HTTP DDoS attacks, we bucket the DDoS attacks by our customers’ billing countries and represent it as a percentage out of all DDoS attacks.
HTTP DDoS attacks on US-based countries increased by 67% QoQ pushing the US back to the first place as the main target of application-layer DDoS attacks. Attacks on Chinese companies plunged by 80% QoQ dropping it from the first place to the fourth. Attacks on Cyprus increase by 167% making it the second most attacked country in Q2. Following Cyprus is Hong Kong, China, and the Netherlands.
Network-layer DDoS attacks
While application-layer attacks target the application (Layer 7 of the OSI model) running the service that end users are trying to access (HTTP/S in our case), network-layer attacks aim to overwhelm network infrastructure (such as in-line routers and servers) and the Internet link itself.
Network-layer DDoS attacks by month
In Q2, network-layer DDoS attacks increased by 109% YoY, and volumetric attacks of 100 Gbps and larger increased by 8% QoQ.
In Q2, the total amount of network-layer DDoS attacks increased by 109% YoY and 15% QoQ. June was the busiest month of the quarter with almost 36% of the attacks occurring in June.
Network-layer DDoS attacks by industry
In Q2, attacks on Telecommunication companies grew by 66% QoQ.
For the second consecutive quarter, the Telecommunications industry was the most targeted by network-layer DDoS attacks. Even more so, attacks on Telecommunication companies grew by 66% QoQ. The Gaming industry came in second place, followed by Information Technology and Services companies.
Network-layer DDoS attacks by target country
Attacks on US networks grew by 95% QoQ.
In Q2, the US remains the most attacked country. After the US came China, Singapore and Germany.
Network-layer DDoS attacks by ingress country
In Q2, almost a third of the traffic Cloudflare observed in Palestine and a fourth in Azerbaijan was part of a network-layer DDoS attack.
When trying to understand where network-layer DDoS attacks originate, we cannot use the same method as we use for the application-layer attack analysis. To launch an application-layer DDoS attack, successful handshakes must occur between the client and the server in order to establish an HTTP/S connection. For a successful handshake to occur, the attacks cannot spoof their source IP address. While the attacker may use botnets, proxies, and other methods to obfuscate their identity, the attacking client’s source IP location does sufficiently represent the attack source of application-layer DDoS attacks.
On the other hand, to launch network-layer DDoS attacks, in most cases, no handshake is needed. Attackers can spoof the source IP address in order to obfuscate the attack source and introduce randomness into the attack properties, which can make it harder for simple DDoS protection systems to block the attack. So if we were to derive the source country based on a spoofed source IP, we would get a ‘spoofed country’.
For this reason, when analyzing network-layer DDoS attack sources, we bucket the traffic by the Cloudflare data center locations where the traffic was ingested, and not by the (potentially) spoofed source IP to get an understanding of where the attacks originate from. We are able to achieve geographical accuracy in our report because we have data centers in over 270 cities around the world. However, even this method is not 100% accurate, as traffic may be back hauled and routed via various Internet Service Providers and countries for reasons that vary from cost reduction to congestion and failure management.
Palestine jumps from the second to the first place as the Cloudflare location with the highest percentage of network-layer DDoS attacks. Following Palestine is Azerbaijan, South Korea, and Angola.
To view all regions and countries, check out the interactive map.
Attack vectors
In Q2, DNS attacks increased making it the second most frequent attack vector.
An attack vector is a term used to describe the method that the attacker uses to launch their DDoS attack, i.e., the IP protocol, packet attributes such as TCP flags, flooding method, and other criteria.
In Q2, 53% of all network-layer attacks were SYN floods. SYN floods remain the most popular attack vector. They abuse the initial connection request of the stateful TCP handshake. During this initial connection request, servers don’t have any context about the TCP connection as it is new and without the proper protection may find it hard to mitigate a flood of initial connection requests. This makes it easier for the attacker to consume an unprotected server’s resources.
After the SYN floods are attacks targeting DNS infrastructure, RST floods again abusing TCP connection flow, and generic attacks over UDP.
Emerging threats
In Q2, the top emerging threats included attacks over CHARGEN, Ubiquiti and Memcached.
Identifying the top attack vectors helps organizations understand the threat landscape. In turn, this may help them improve their security posture to protect against those threats. Similarly, learning about new emerging threats that may not yet account for a significant portion of attacks, can help mitigate them before they become a significant force.
In Q2, the top emerging threats were amplification attacks abusing the Character Generator Protocol (CHARGEN), amplification attacks reflecting traffic off of exposed Ubiquiti devices, and the notorious Memcached attack.
Abusing the CHARGEN protocol to launch amplification attacks
In Q2, attacks abusing the CHARGEN protocol increased by 378% QoQ.
Initially defined in RFC 864 (1983), the Character Generator (CHARGEN) protocol is a service of the Internet Protocol Suite that does exactly what it says it does – it generates characters arbitrarily, and it doesn’t stop sending them to the client until the client closes the connection. Its original intent was for testing and debugging. However, it’s rarely used because it can so easily be abused to generate amplification/reflection attacks.
An attacker can spoof the source IP of their victim and fool supporting servers around the world to direct a stream of arbitrary characters “back” to the victim’s servers. This type of attack is amplification/reflection. Given enough simultaneous CHARGEN streams, the victim’s servers, if unprotected, would be flooded and unable to cope with legitimate traffic — resulting in a denial of service event.
Amplification attacks exploiting the Ubiquiti Discovery Protocol
In Q2, attacks over Ubiquity increased by 327% QoQ.
Ubiquiti is a US-based company that provides networking and Internet of Things (IoT) devices for consumers and businesses. Ubiquiti devices can be discovered on a network using the Ubiquiti Discovery protocol over UDP/TCP port 10001.
Similarly to the CHARGEN attack vector, here too, attackers can spoof the source IP to be the victim’s IP address and spray IP addresses that have port 10001 open. Those would then respond to the victim and essentially flood it if the volume is sufficient.
Memcached DDoS attacks
In Q2, Memcached DDoS attacks increased by 287% QoQ.
Memcached is a database caching system for speeding up websites and networks. Similarly to CHARGEN and Ubiquiti, Memcached servers that support UDP can be abused to launch amplification/reflection DDoS attacks. In this case, the attacker would request content from the caching system and spoof the victim’s IP address as the source IP in the UDP packets. The victim will be flooded with the Memcache responses which can be amplified by a factor of up to 51,200x.
Network-layer DDoS attacks by attack rate
Volumetric attacks of over 100 Gbps increase by 8% QoQ.
There are different ways of measuring the size of an L3/4 DDoS attack. One is the volume of traffic it delivers, measured as the bit rate (specifically, terabits per second or gigabits per second). Another is the number of packets it delivers, measured as the packet rate (specifically, millions of packets per second).
Attacks with high bit rates attempt to cause a denial-of-service event by clogging the Internet link, while attacks with high packet rates attempt to overwhelm the servers, routers, or other in-line hardware appliances. These devices dedicate a certain amount of memory and computation power to process each packet. Therefore, by bombarding it with many packets, the appliance can be left with no further processing resources. In such a case, packets are “dropped,” i.e., the appliance is unable to process them. For users, this results in service disruptions and denial of service.
Distribution by packet rate
The majority of network-layer DDoS attacks remain below 50,000 packets per second. While 50 kpps is on the lower side of the spectrum at Cloudflare scale, it can still easily take down unprotected Internet properties and congest even a standard Gigabit Ethernet connection.
When we look at the changes in the attack sizes, we can see that packet-intensive attacks above 50 kpps decreased in Q2, resulting in an increase of 4% in small attacks.
Distribution by bitrate
In Q2, most of the network-layer DDoS attacks remain below 500 Mbps. This too is a tiny drop in the water at Cloudflare scale, but can very quickly shut down unprotected Internet properties with less capacity or at the very least cause congestion for even a standard Gigabit Ethernet connection.
Interestingly enough, large attacks between 500 Mbps and 100 Gbps decreased by 20-40% QoQ, but volumetric attacks above 100 Gbps increased by 8%.
Network-layer DDoS attacks by duration
In Q2, attacks lasting over three hours increased by 9%.
We measure the duration of an attack by recording the difference between when it is first detected by our systems as an attack and the last packet we see with that attack signature towards that specific target.
In Q2, 52% of network-layer DDoS attacks lasted less than 10 minutes. Another 40% lasted 10-20 minutes. The remaining 8% include attacks ranging from 20 minutes to over three hours.
One important thing to keep in mind is that even if an attack lasts only a few minutes, if it is successful, the repercussions could last well beyond the initial attack duration. IT personnel responding to a successful attack may spend hours and even days restoring their services.
While most of the attacks are indeed short, we can see an increase of over 15% in attacks ranging between 20-60 minutes, and a 12% increase of attacks lasting more than three hours.
Short attacks can easily go undetected, especially burst attacks that, within seconds, bombard a target with a significant number of packets, bytes, or requests. In this case, DDoS protection services that rely on manual mitigation by security analysis have no chance in mitigating the attack in time. They can only learn from it in their post-attack analysis, then deploy a new rule that filters the attack fingerprint and hope to catch it next time. Similarly, using an “on-demand” service, where the security team will redirect traffic to a DDoS provider during the attack, is also inefficient because the attack will already be over before the traffic routes to the on-demand DDoS provider.
It’s recommended that companies use automated, always-on DDoS protection services that analyze traffic and apply real-time fingerprinting fast enough to block short-lived attacks.
Summary
Cloudflare’s mission is to help build a better Internet. A better Internet is one that is more secure, faster, and reliable for everyone — even in the face of DDoS attacks. As part of our mission, since 2017, we’ve been providing unmetered and unlimited DDoS protection for free to all of our customers. Over the years, it has become increasingly easier for attackers to launch DDoS attacks. But as easy as it has become, we want to make sure that it is even easier — and free — for organizations of all sizes to protect themselves against DDoS attacks of all types.
Not using Cloudflare yet? Start now with our Free and Pro plans to protect your websites, or contact us for comprehensive DDoS protection for your entire network using Magic Transit.
Welcome to our first DDoS report of 2022, and the ninth in total so far. This report includes new data points and insights both in the application-layer and network-layer sections — as observed across the global Cloudflare network between January and March 2022.
The first quarter of 2022 saw a massive spike in application-layer DDoS attacks, but a decrease in the total number of network-layer DDoS attacks. Despite the decrease, we’ve seen volumetric DDoS attacks surge by up to 645% QoQ, and we mitigated a new zero-day reflection attack with an amplification factor of 220 billion percent.
In the Russian and Ukrainian cyberspace, the most targeted industries were Online Media and Broadcast Media. In our Azerbaijan and Palestinian Cloudflare data centers, we’ve seen enormous spikes in DDoS activity — indicating the presence of botnets operating from within.
The Highlights
The Russian and Ukrainian cyberspace
Russian Online Media companies were the most targeted industries within Russia in Q1. The next most targeted was the Internet industry, then Cryptocurrency, and then Retail. While many attacks that targeted Russian Cryptocurrency companies originated in Ukraine or the US, another major source of attacks was from within Russia itself.
The majority of HTTP DDoS attacks that targeted Russian companies originated from Germany, the US, Singapore, Finland, India, the Netherlands, and Ukraine. It’s important to note that being able to identify where cyber attack traffic originates is not the same as being able to attribute where the attacker is located.
Attacks on Ukraine targeted Broadcast Media and Publishing websites and seem to have been more distributed, originating from more countries — which may indicate the use of global botnets. Still, most of the attack traffic originated from the US, Russia, Germany, China, the UK, and Thailand.
In January 2022, over 17% of under-attack respondents reported being targeted by ransom DDoS attacks or receiving a threat in advance.
That figure drastically dropped to 6% in February, and then to 3% in March.
When compared to previous quarters, we can see that in total, in Q1, only 10% of respondents reported a ransom DDoS attack; a 28% decrease YoY and 52% decrease QoQ.
Application-layer DDoS attacks
2022 Q1 was the busiest quarter in the past 12 months for application-layer attacks. HTTP-layer DDoS attacks increased by 164% YoY and 135% QoQ.
Diving deeper into the quarter, in March 2022 there were more HTTP DDoS attacks than in all of Q4 combined (and Q3, and Q1).
After four consecutive quarters in a row with China as the top source of HTTP DDoS attacks, the US stepped into the lead this quarter. HTTP DDoS attacks originating from the US increased by a staggering 6,777% QoQ and 2,225% YoY.
Network-layer DDoS attacks
Network-layer attacks in Q1 increased by 71% YoY but decreased 58% QoQ.
The Telecommunications industry was the most targeted by network-layer DDoS attacks, followed by Gaming and Gambling companies, and the Information Technology and Services industry.
Volumetric attacks increased in Q1. Attacks above 10 Mpps (million packets per second) grew by over 300% QoQ, and attacks over 100 Gbps grew by 645% QoQ.
This report is based on DDoS attacks that were automatically detected and mitigated by Cloudflare’s DDoS Protection systems. To learn more about how it works, check out this deep-dive blog post.
A note on how we measure DDoS attacks observed over our network To analyze attack trends, we calculate the “DDoS activity” rate, which is either the percentage of attack traffic out of the total traffic (attack + clean) observed over our global network, or in a specific location, or in a specific category (e.g., industry or billing country). Measuring the percentages allows us to normalize data points and avoid biases reflected in absolute numbers towards, for example, a Cloudflare data center that receives more total traffic and likely, also more attacks.
To view an interactive version of this report view it on Cloudflare Radar.
Ransom Attacks
Our systems constantly analyze traffic and automatically apply mitigation when DDoS attacks are detected. Each DDoS’d customer is prompted with an automated survey to help us better understand the nature of the attack and the success of the mitigation.
For over two years now, Cloudflare has been surveying attacked customers — one question on the survey being if they received a threat or a ransom note demanding payment in exchange to stop the DDoS attack. In the last quarter, 2021 Q4, we observed a record-breaking level of reported ransom DDoS attacks (one out of every five customers). This quarter, we’ve witnessed a drop in ransom DDoS attacks with only one out of 10 respondents reporting a ransom DDoS attack; a 28% decrease YoY and 52% decrease QoQ.
When we break it down by month, we can see that January 2022 saw the largest number of respondents reporting receiving a ransom letter in Q1. Almost one out of every five customers (17%).
Application-layer DDoS attacks
Application-layer DDoS attacks, specifically HTTP DDoS attacks, are attacks that usually aim to disrupt a web server by making it unable to process legitimate user requests. If a server is bombarded with more requests than it can process, the server will drop legitimate requests and — in some cases — crash, resulting in degraded performance or an outage for legitimate users.
Application-layer DDoS attacks by month
In Q1, application-layer DDoS attacks soared by 164% YoY and 135% QoQ – the busiest quarter within the past year.
Application-layer DDoS attacks increased to new heights in the first quarter of 2022. In March alone, there were more HTTP DDoS attacks than in all of 2021 Q4 combined (and Q3, and Q1).
Application-layer DDoS attacks by industry
Consumer Electronics was the most targeted industry in Q1.
Globally, the Consumer Electronics industry was the most attacked with an increase of 5,086% QoQ. Second was the Online Media industry with a 2,131% increase in attacks QoQ. Third were Computer Software companies, with an increase of 76% QoQ and 1,472 YoY.
To understand the origin of the HTTP attacks, we look at the geolocation of the source IP address belonging to the client that generated the attack HTTP requests. Unlike network-layer attacks, source IP addresses cannot be spoofed in HTTP attacks. A high percentage of DDoS activity in a given country usually indicates the presence of botnets operating from within the country’s borders.
After four consecutive quarters in a row with China as the top source of HTTP DDoS attacks, the US stepped into the lead this quarter. HTTP DDoS attacks originating from the US increased by a staggering 6,777% QoQ and 2,225% YoY. Following China in second place are India, Germany, Brazil, and Ukraine.
Application-layer DDoS attacks by target country
In order to identify which countries are targeted by the most HTTP DDoS attacks, we bucket the DDoS attacks by our customers’ billing countries and represent it as a percentage out of all DDoS attacks.
The US drops to second place, after being first for three consecutive quarters. Organizations in China were targeted the most by HTTP DDoS attacks, followed by the US, Russia, and Cyprus.
Network-layer DDoS attacks
While application-layer attacks target the application (Layer 7 of the OSI model) running the service that end users are trying to access (HTTP/S in our case), network-layer attacks aim to overwhelm network infrastructure (such as in-line routers and servers) and the Internet link itself.
Network-layer DDoS attacks by month
While HTTP DDoS attacks soared in Q1, network-layer DDoS attacks actually decreased by 58% QoQ, but still increased by 71% YoY.
Diving deeper into Q1, we can see that the amount of network-layer DDoS attacks remained mostly consistent throughout the quarter with about a third of attacks occurring every month.
Amongst these network-layer DDoS attacks are also zero-day DDoS attacks that Cloudflare automatically detected and mitigated.
In the beginning of March, Cloudflare researchers helped investigate and expose a zero-day vulnerability in Mitel business phone systems that amongst other possible exploitations, also enables attackers to launch an amplification DDoS attack. This type of attack reflects traffic off vulnerable Mitel servers to victims, amplifying the amount of traffic sent in the process by an amplification factor of 220 billion percent in this specific case. You can read more about it in our recent blog post.
We observed several of these attacks across our network. One of them targeted a North American cloud provider using the Cloudflare Magic Transit service. The attack originated from 100 source IPs mainly from the US, UK, Canada, Netherlands, Australia, and approximately 20 other countries. It peaked above 50 Mpps (~22 Gbps) and was automatically detected and mitigated by Cloudflare systems.
In this report, for the first time, we’ve begun classifying network-layer DDoS attacks according to the industries of our customers using the Spectrum and Magic products. This classification allows us to understand which industries are targeted the most by network-layer DDoS attacks.
When we look at Q1 statistics, we can see that in terms of attack packets and attack bytes launched towards Cloudflare customers, the Telecommunications industry was targeted the most. More than 8% of all attack bytes and 10% of all attack packets that Cloudflare mitigated targeted Telecommunications companies.
Following not too far behind, in second and third place were the Gaming / Gambling and Information Technology and Services industries.
Network-layer DDoS attacks by target country
Similarly to the classification by our customers’ industry, we can also bucket attacks by our customers’ billing country as we do for application-layer DDoS attacks, to identify the top attacked countries.
Looking at Q1 numbers, we can see that the US was targeted by the highest percentage of DDoS attacks traffic — over 10% of all attack packets and almost 8% of all attack bytes. Following the US is China, Canada, and Singapore.
Network-layer DDoS attacks by ingress country
When trying to understand where network-layer DDoS attacks originate, we cannot use the same method as we use for the application-layer attack analysis. To launch an application-layer DDoS attack, successful handshakes must occur between the client and the server in order to establish an HTTP/S connection. For a successful handshake to occur, the attacker cannot spoof their source IP address. While the attacker may use botnets, proxies, and other methods to obfuscate their identity, the attacking client’s source IP location does sufficiently represent the attack source of application-layer DDoS attacks.
On the other hand, to launch network-layer DDoS attacks, in most cases, no handshake is needed. Attackers can spoof the source IP address in order to obfuscate the attack source and introduce randomness into the attack properties, which can make it harder for simple DDoS protection systems to block the attack. So if we were to derive the source country based on a spoofed source IP, we would get a ‘spoofed country’.
For this reason, when analyzing network-layer DDoS attack sources, we bucket the traffic by the Cloudflare edge data center locations where the traffic was ingested, and not by the (potentially) spoofed source IP to get an understanding of where the attacks originate from. We are able to achieve geographical accuracy in our report because we have data centers in over 270 cities around the world. However, even this method is not 100% accurate, as traffic may be back hauled and routed via various Internet Service Providers and countries for reasons that vary from cost reduction to congestion and failure management.
In Q1, the percentage of attacks detected in Cloudflare’s data centers in Azerbaijan increased by 16,624% QoQ and 96,900% YoY, making it the country with the highest percentage of network-layer DDoS activity (48.5%).
Following our Azerbaijanian data center is our Palestinian data center where a staggering 41.9% of all traffic was DDoS traffic. This represents a 10,120% increase QoQ and 46,456% YoY.
To view all regions and countries, check out the interactive map.
Attack vectors
SYN Floods remain the most popular DDoS attack vector, while use of generic UDP floods drops significantly in Q1.
An attack vector is a term used to describe the method that the attacker uses to launch their DDoS attack, i.e., the IP protocol, packet attributes such as TCP flags, flooding method, and other criteria.
In Q1, SYN floods accounted for 57% of all network-layer DDoS attacks, representing a 69% increase QoQ and a 13% increase YoY. In second place, attacks over SSDP surged by over 1,100% QoQ. Following were RST floods and attacks over UDP. Last quarter, generic UDP floods took the second place, but this time, generic UDP DDoS attacks plummeted by 87% QoQ from 32% to a mere 3.9%.
Emerging threats
Identifying the top attack vectors helps organizations understand the threat landscape. In turn, this may help them improve their security posture to protect against those threats. Similarly, learning about new emerging threats that may not yet account for a significant portion of attacks, can help mitigate them before they become a significant force.
When we look at new emerging attack vectors in Q1, we can see increases in DDoS attacks reflecting off of Lantronix services (+971% QoQ) and SSDP reflection attacks (+724% QoQ). Additionally, SYN-ACK attacks increased by 437% and attacks by Mirai botnets by 321% QoQ.
Attacker reflecting traffic off of Lantronix Discovery Service
Lantronix is a US-based software and hardware company that provides solutions for Internet of Things (IoT) management amongst their vast offering. One of the tools that they provide to manage their IoT components is the Lantronix Discovery Protocol. It is a command-line tool that helps to search and find Lantronix devices. The discovery tool is UDP-based, meaning that no handshake is required. The source IP can be spoofed. So an attacker can use the tool to search for publicly exposed Lantronix devices using a 4 byte request, which will then in turn respond with a 30 byte response from port 30718. By spoofing the source IP of the victim, all Lantronix devices will target their responses to the victim — resulting in a reflection/amplification attack.
Simple Service Discovery Protocol used for reflection DDoS attacks
The Simple Service Discovery Protocol (SSDP) protocol works similarly to the Lantronix Discovery protocol, but for Universal Plug and Play (UPnP) devices such as network-connected printers. By abusing the SSDP protocol, attackers can generate a reflection-based DDoS attack overwhelming the target’s infrastructure and taking their Internet properties offline. You can read more about SSDP-based DDoS attacks here.
Network-layer DDoS attacks by attack rate
In Q1, we observed a massive uptick in volumetric DDoS attacks — both from the packet rate and bitrate perspective. Attacks over 10 Mpps grew by over 300% QoQ, and attacks over 100 Gbps grew by 645% QoQ.
There are different ways of measuring the size of an L3/4 DDoS attack. One is the volume of traffic it delivers, measured as the bit rate (specifically, terabits per second or gigabits per second). Another is the number of packets it delivers, measured as the packet rate (specifically, millions of packets per second).
Attacks with high bit rates attempt to cause a denial-of-service event by clogging the Internet link, while attacks with high packet rates attempt to overwhelm the servers, routers, or other in-line hardware appliances. These devices dedicate a certain amount of memory and computation power to process each packet. Therefore, by bombarding it with many packets, the appliance can be left with no further processing resources. In such a case, packets are “dropped,” i.e., the appliance is unable to process them. For users, this results in service disruptions and denial of service.
Distribution by packet rate
The majority of network-layer DDoS attacks remain below 50,000 packets per second. While 50 kpps is on the lower side of the spectrum at Cloudflare scale, it can still easily take down unprotected Internet properties and congest even a standard Gigabit Ethernet connection.
When we look at the changes in the attack sizes, we can see that attacks of over 10 Mpps grew by over 300% QoQ. Similarly, attacks of 1-10 Mpps grew by almost 40% QoQ.
Distribution by bitrate
In Q1, most of the network-layer DDoS attacks remain below 500 Mbps. This too is a tiny drop in the water at Cloudflare scale, but can very quickly shut down unprotected Internet properties with less capacity or at the very least congest, even a standard Gigabit Ethernet connection.
Graph of the distribution of network-layer DDoS attacks by bit rate in 2022 Q1
Similarly to the trends observed in the packet-per-second realm, here we can also see large increases. The amount of DDoS attacks that peaked over 100 Gbps increased by 645% QoQ; attacks peaking between 10 Gbps to 100 Gbps increased by 407%; attacks peaking between 1 Gbps to 10 Gbps increased by 88%; and even attacks peaking between 500 Mbps to 1 Gbps increased by almost 20% QoQ.
Network-layer DDoS attacks by duration
Most attacks remain under one hour in duration, reiterating the need for automated always-on DDoS mitigation solutions.
We measure the duration of an attack by recording the difference between when it is first detected by our systems as an attack and the last packet we see with that attack signature towards that specific target.
In previous reports, we provided a breakdown of ‘attacks under an hour’, and larger time ranges. However, in most cases over 90 percent of attacks last less than an hour. So starting from this report, we broke down the short attacks and grouped them by shorter time ranges to provide better granularity.
One important thing to keep in mind is that even if an attack lasts only a few minutes, if it is successful, the repercussions could last well beyond the initial attack duration. IT personnel responding to a successful attack may spend hours and even days restoring their services.
In the first quarter of 2022, more than half of the attacks lasted 10-20 minutes, approximately 40% ended within 10 minutes, another ~5% lasted 20-40 minutes, and the remaining lasted longer than 40 minutes.
Short attacks can easily go undetected, especially burst attacks that, within seconds, bombard a target with a significant number of packets, bytes, or requests. In this case, DDoS protection services that rely on manual mitigation by security analysis have no chance in mitigating the attack in time. They can only learn from it in their post-attack analysis, then deploy a new rule that filters the attack fingerprint and hope to catch it next time. Similarly, using an “on-demand” service, where the security team will redirect traffic to a DDoS provider during the attack, is also inefficient because the attack will already be over before the traffic routes to the on-demand DDoS provider.
It’s recommended that companies use automated, always-on DDoS protection services that analyze traffic and apply real-time fingerprinting fast enough to block short-lived attacks.
Summary
Cloudflare’s mission is to help build a better Internet. A better Internet is one that is more secure, faster, and reliable for everyone — even in the face of DDoS attacks. As part of our mission, since 2017, we’ve been providing unmetered and unlimited DDoS protection for free to all of our customers. Over the years, it has become increasingly easier for attackers to launch DDoS attacks. But as easy as it has become, we want to make sure that it is even easier — and free — for organizations of all sizes to protect themselves against DDoS attacks of all types.
Not using Cloudflare yet? Start now with our Free and Pro plans to protect your websites, or contact us for comprehensive DDoS protection for your entire network using Magic Transit.
The collective thoughts of the interwebz
Manage Consent
To provide the best experiences, we use technologies like cookies to store and/or access device information. Consenting to these technologies will allow us to process data such as browsing behavior or unique IDs on this site. Not consenting or withdrawing consent, may adversely affect certain features and functions.
Functional
Always active
The technical storage or access is strictly necessary for the legitimate purpose of enabling the use of a specific service explicitly requested by the subscriber or user, or for the sole purpose of carrying out the transmission of a communication over an electronic communications network.
Preferences
The technical storage or access is necessary for the legitimate purpose of storing preferences that are not requested by the subscriber or user.
Statistics
The technical storage or access that is used exclusively for statistical purposes.The technical storage or access that is used exclusively for anonymous statistical purposes. Without a subpoena, voluntary compliance on the part of your Internet Service Provider, or additional records from a third party, information stored or retrieved for this purpose alone cannot usually be used to identify you.
Marketing
The technical storage or access is required to create user profiles to send advertising, or to track the user on a website or across several websites for similar marketing purposes.


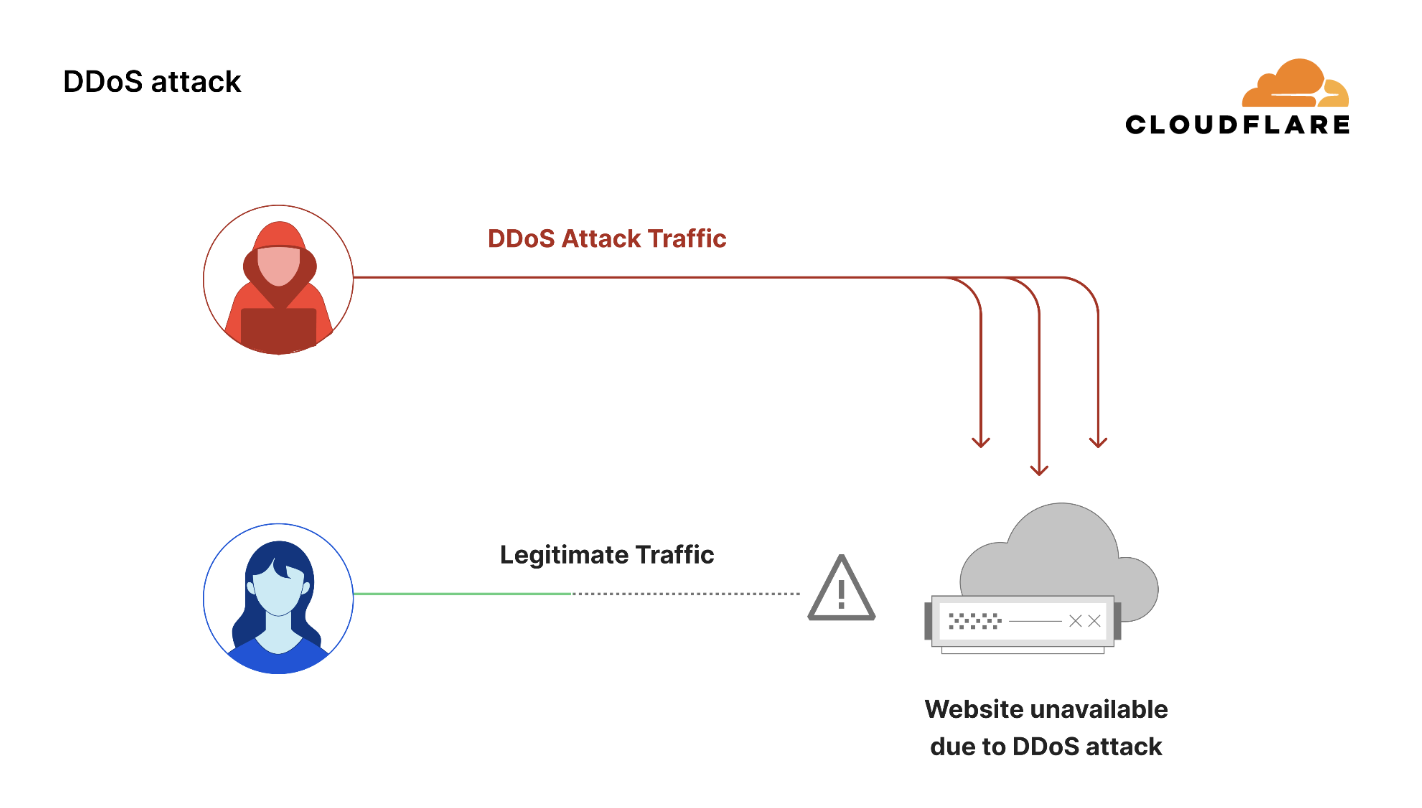
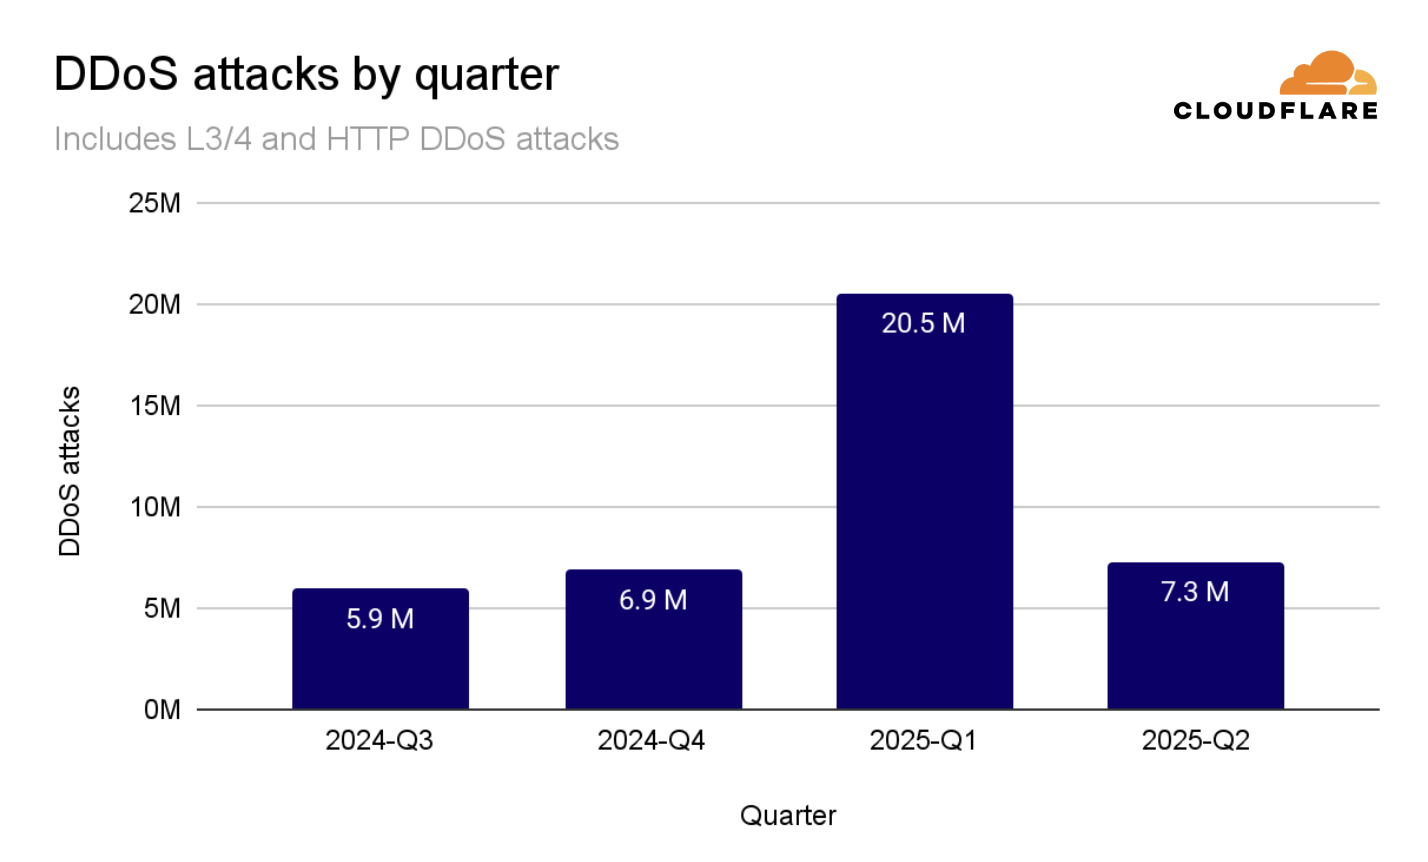
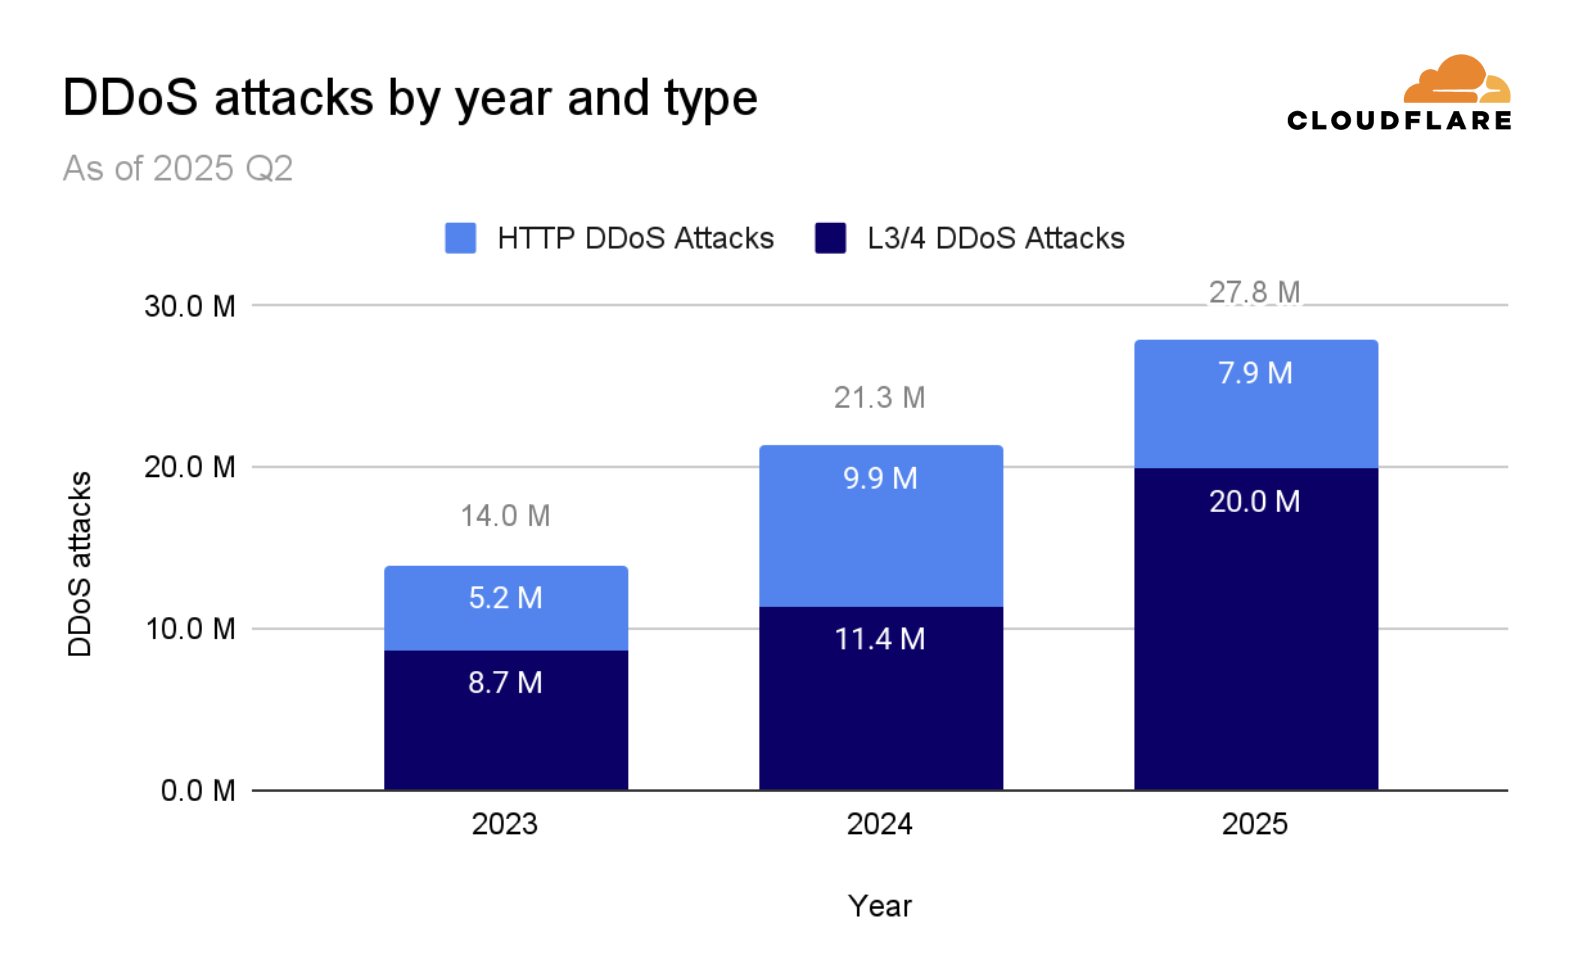
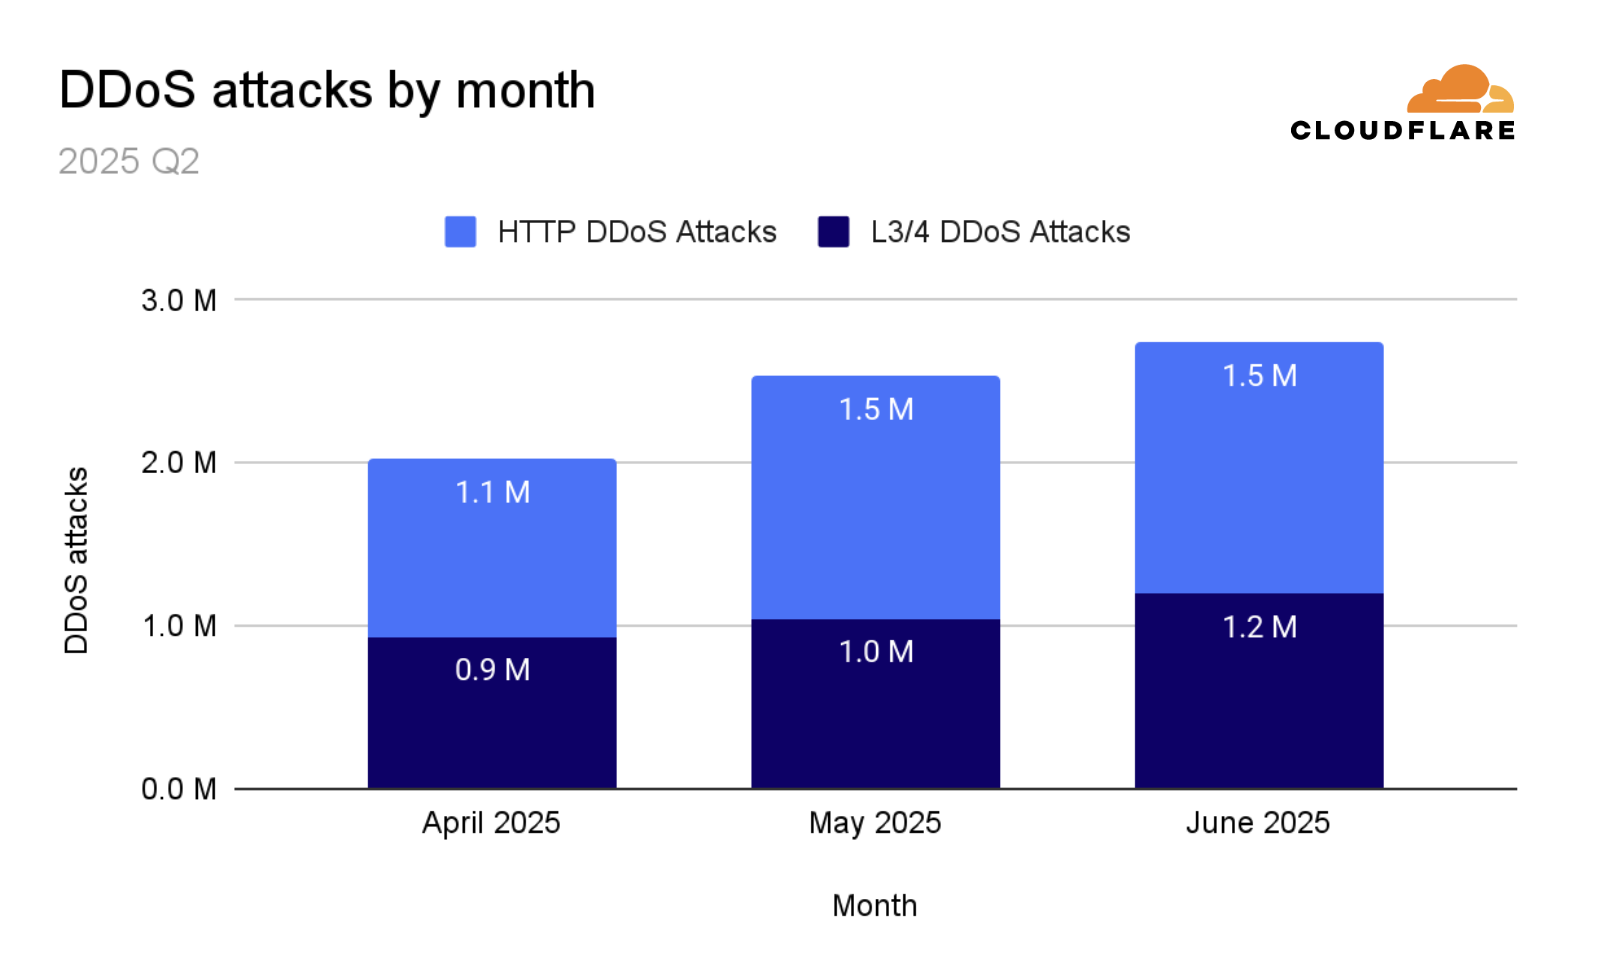
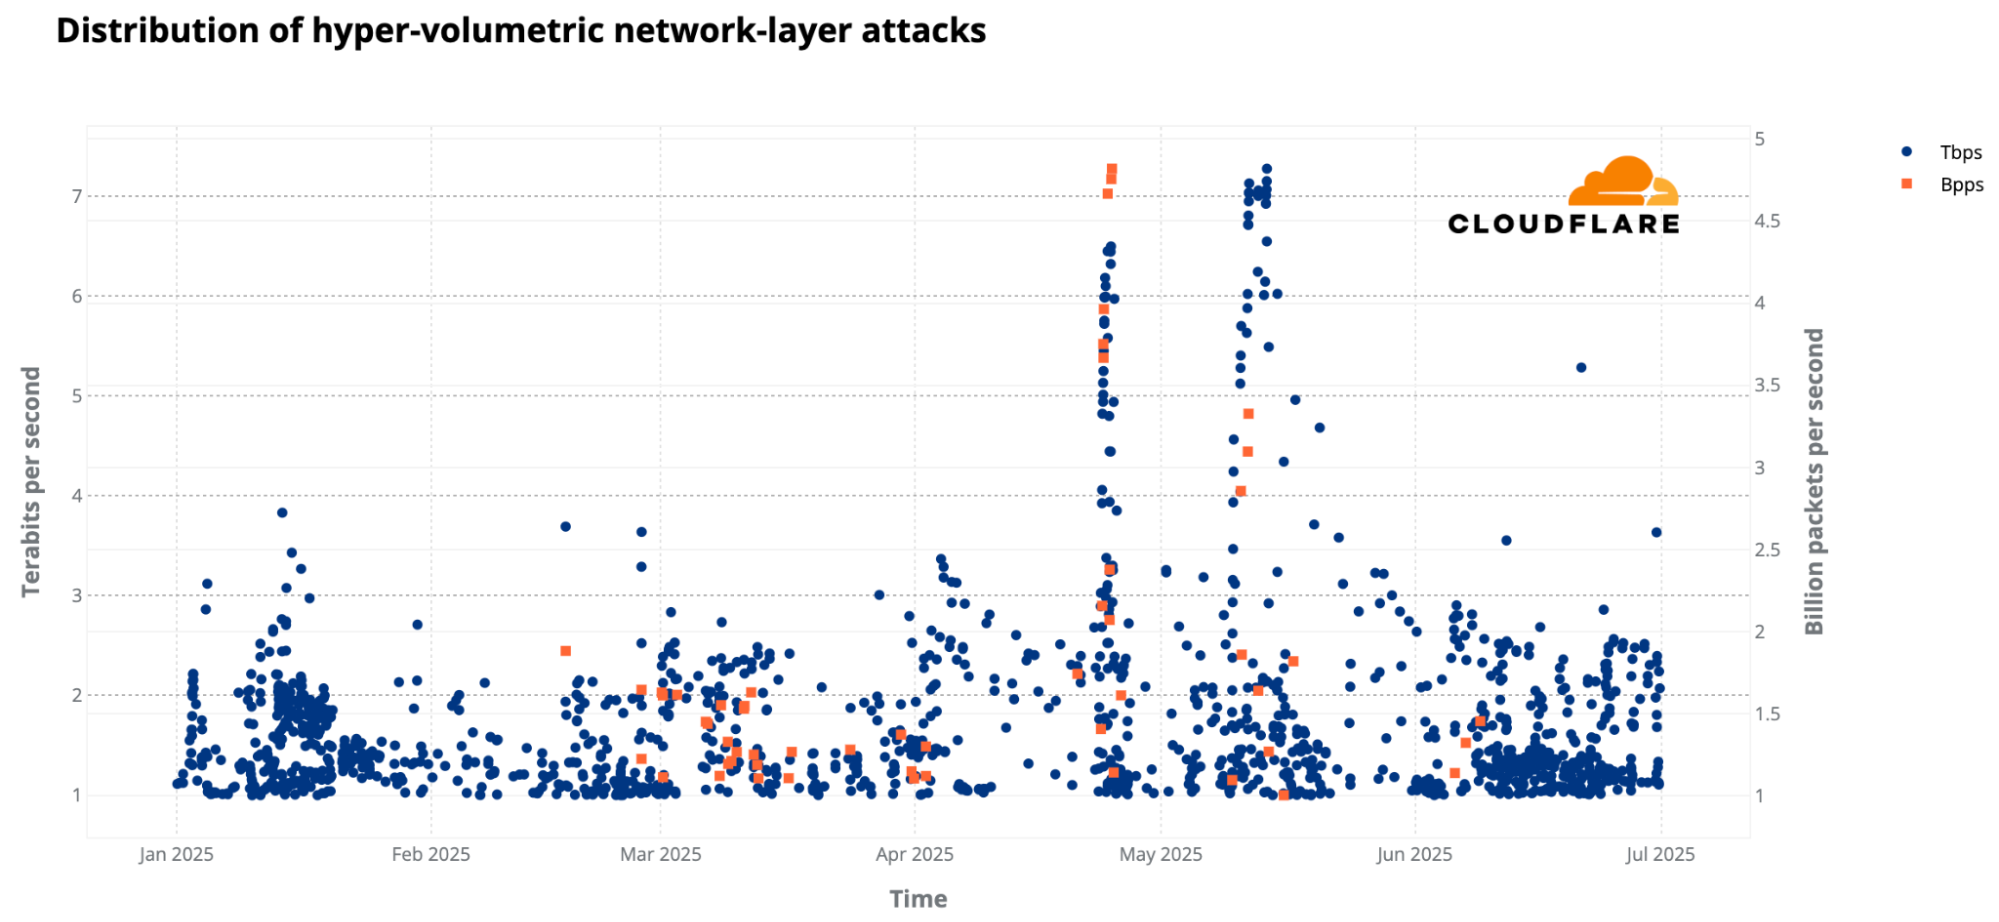
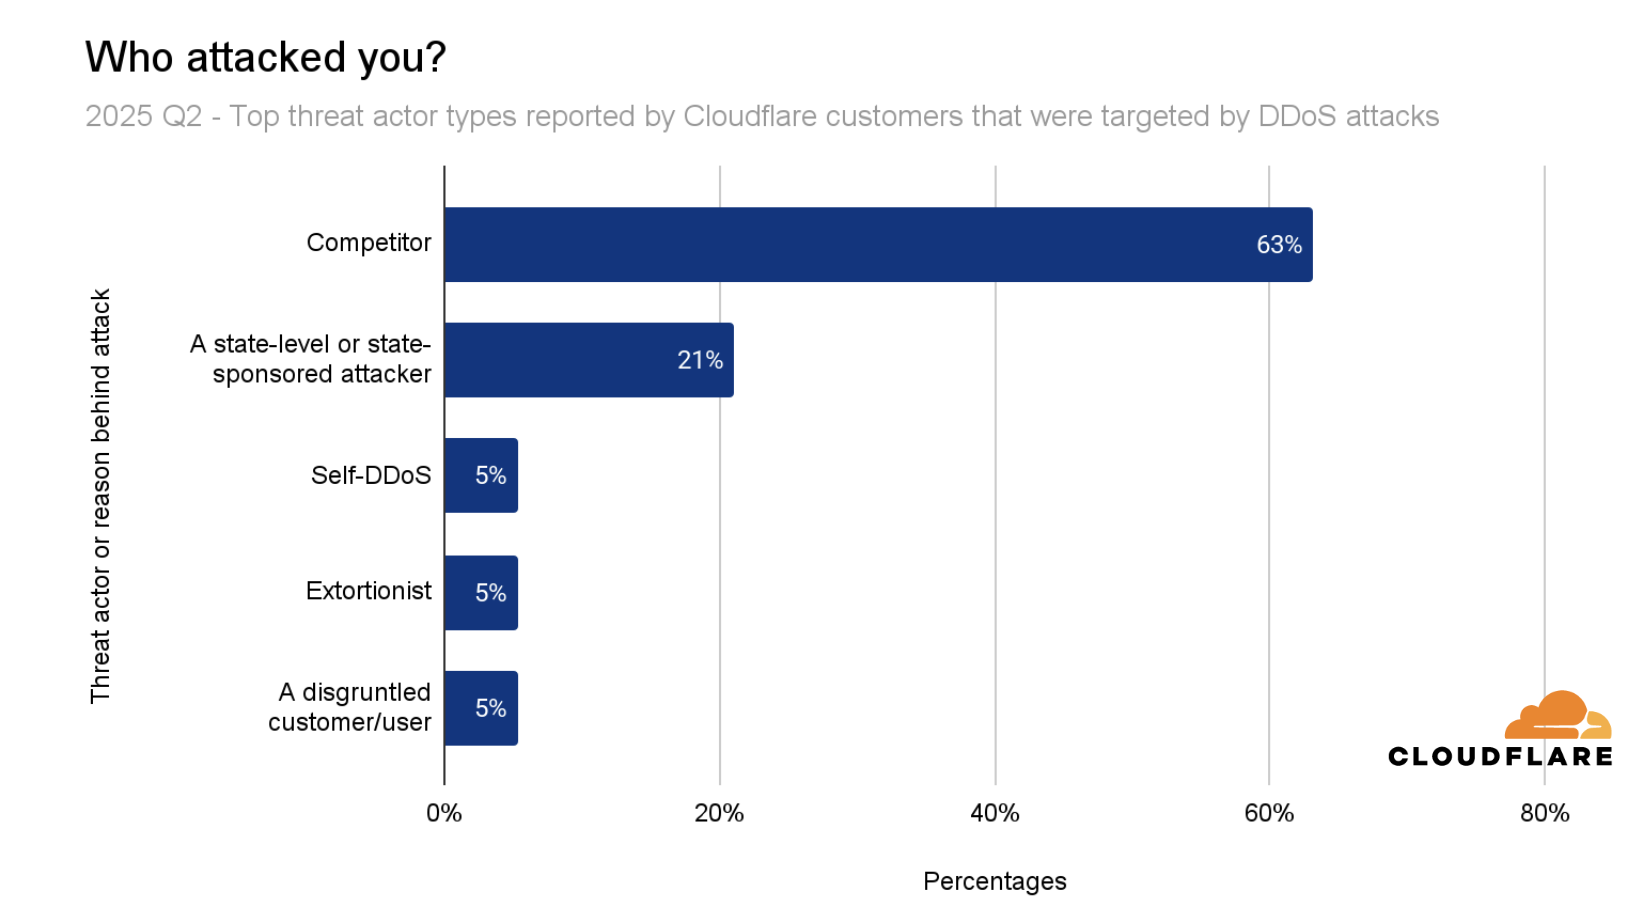
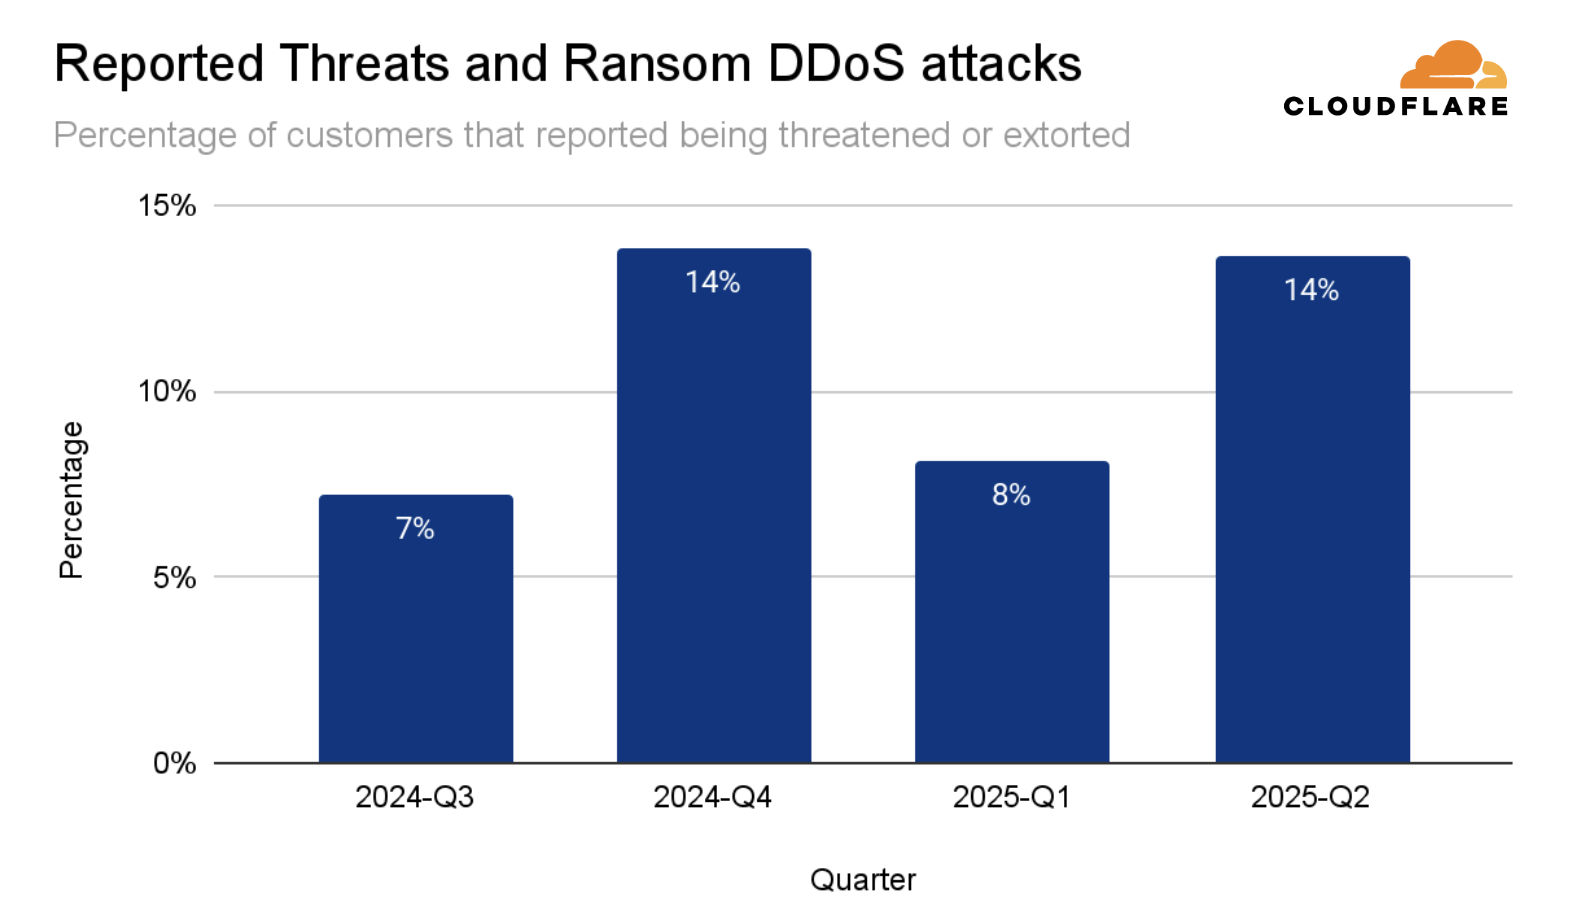
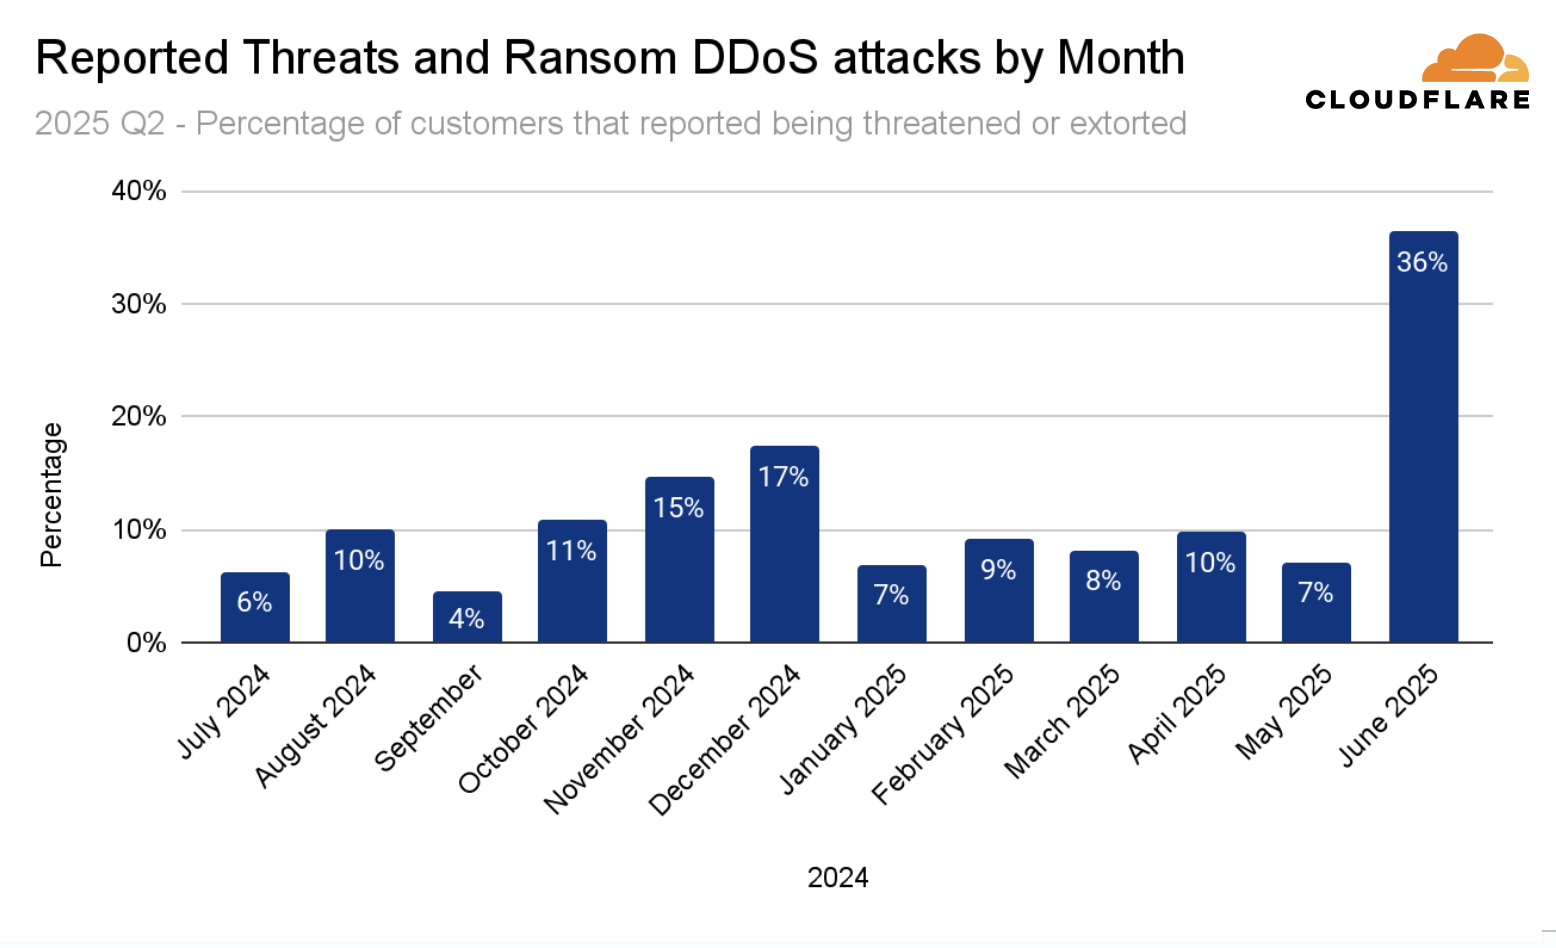
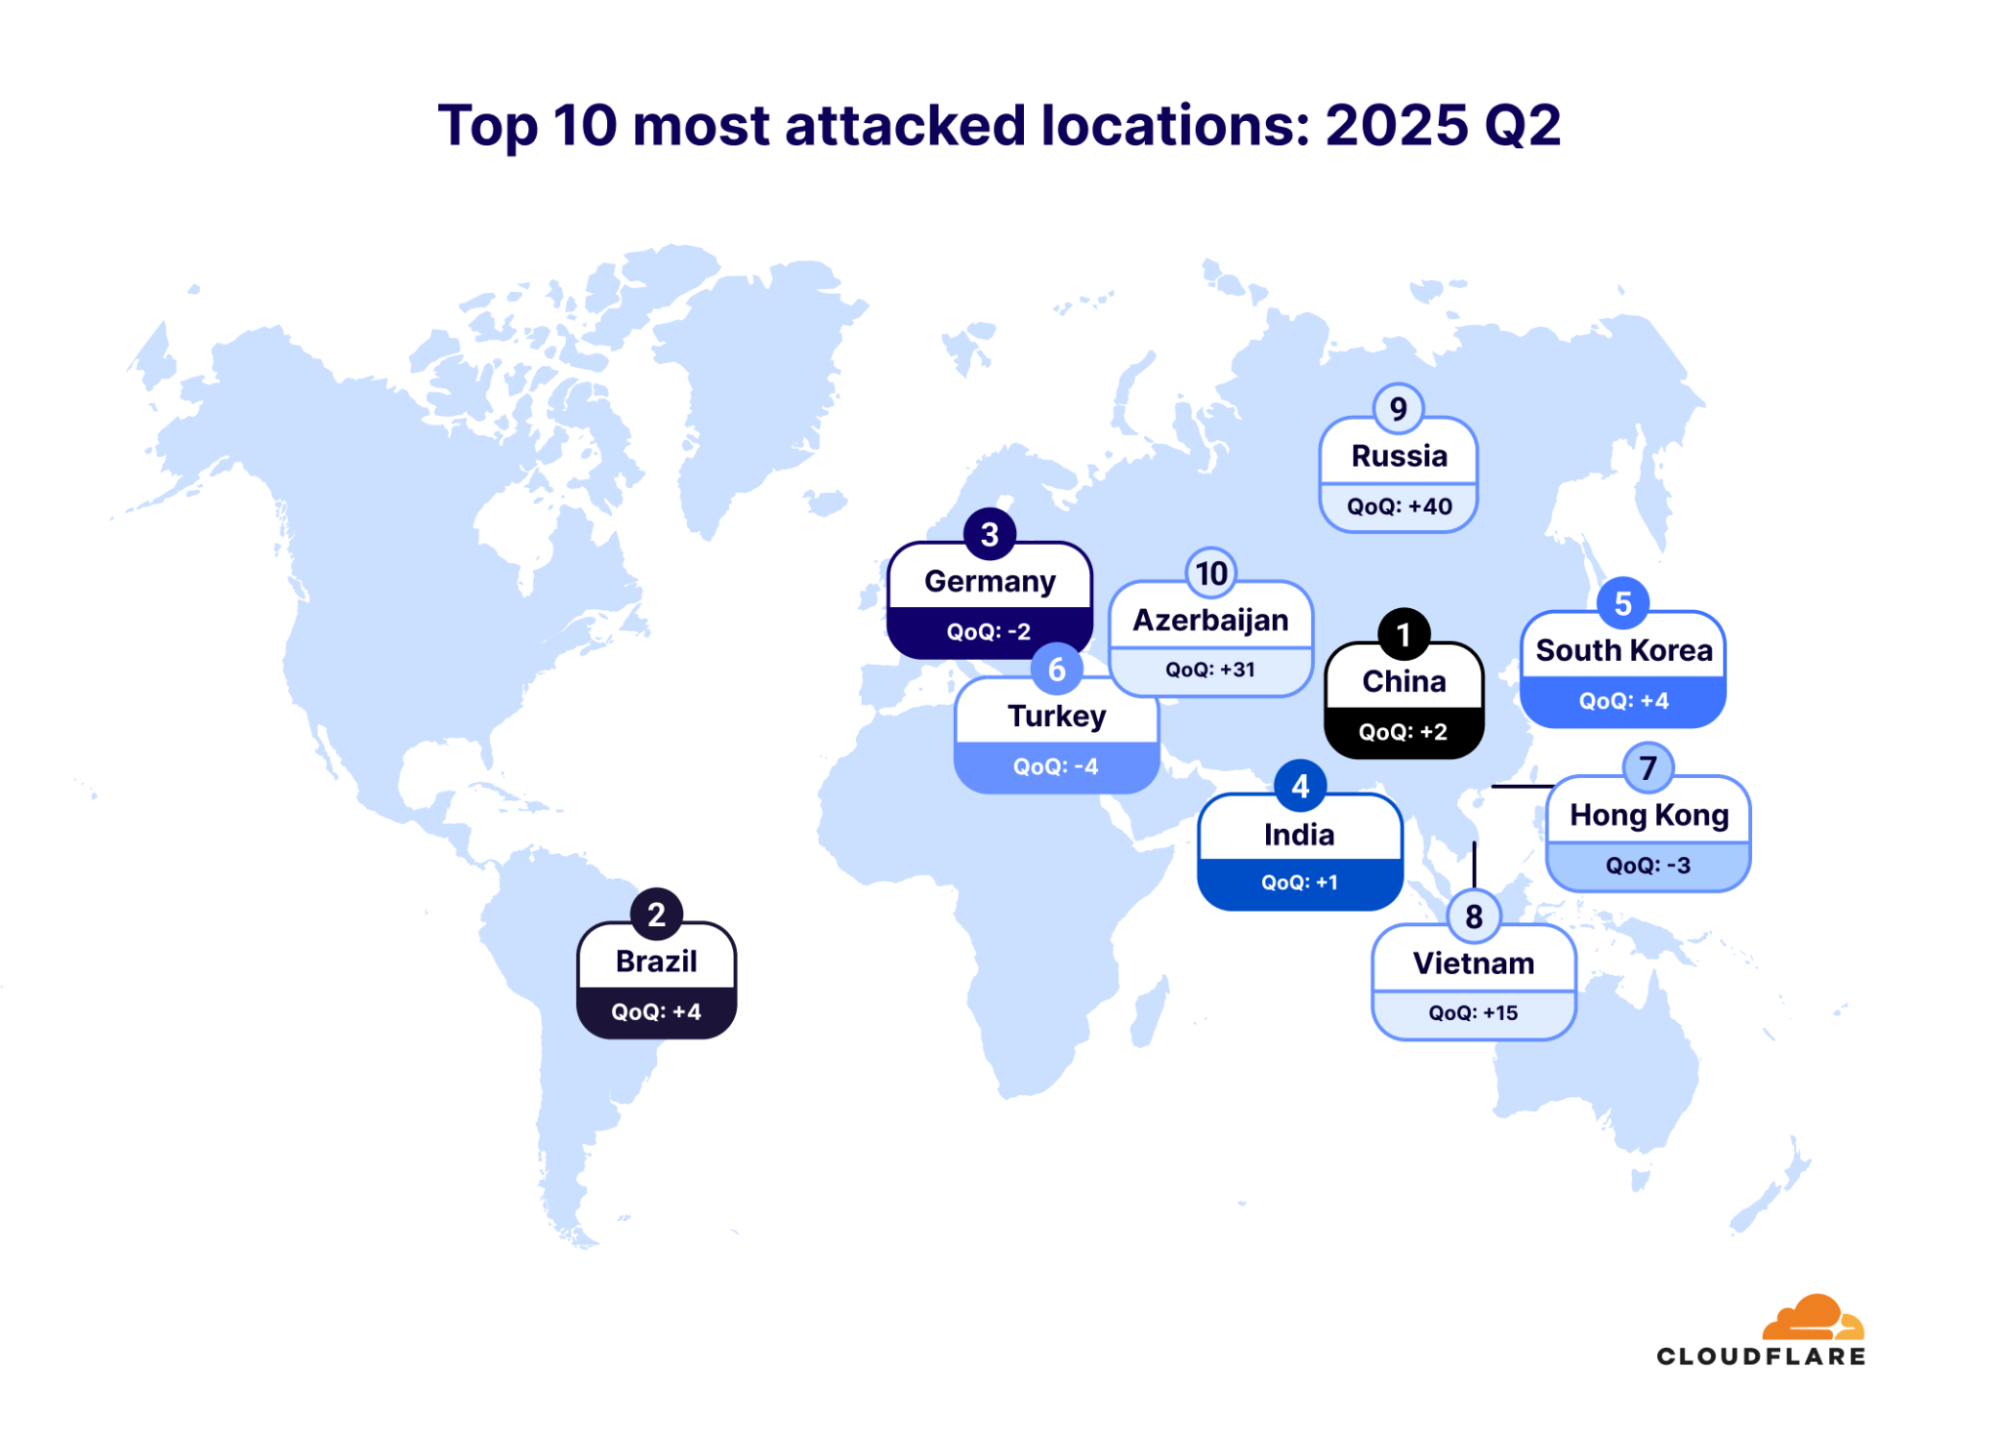
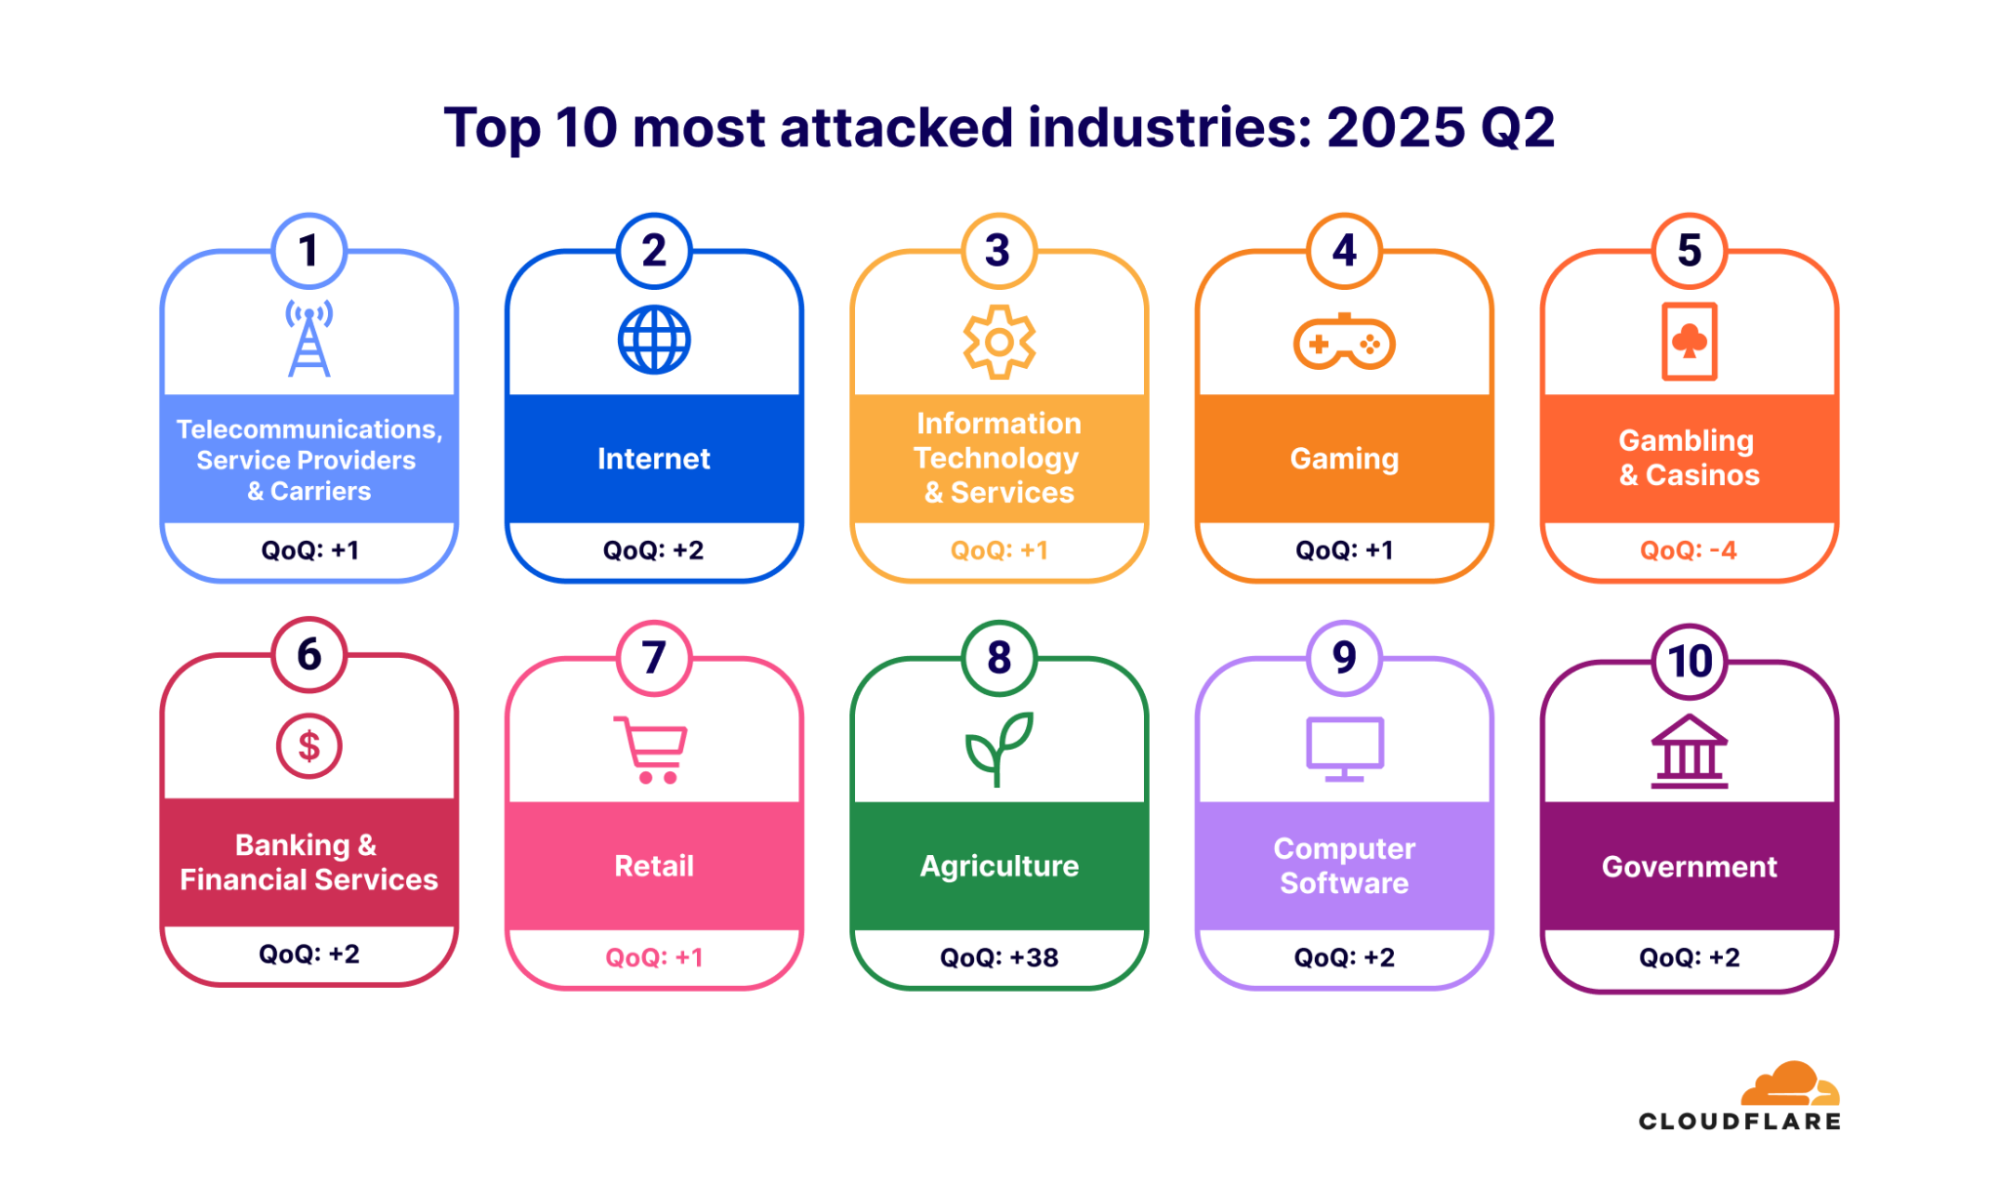
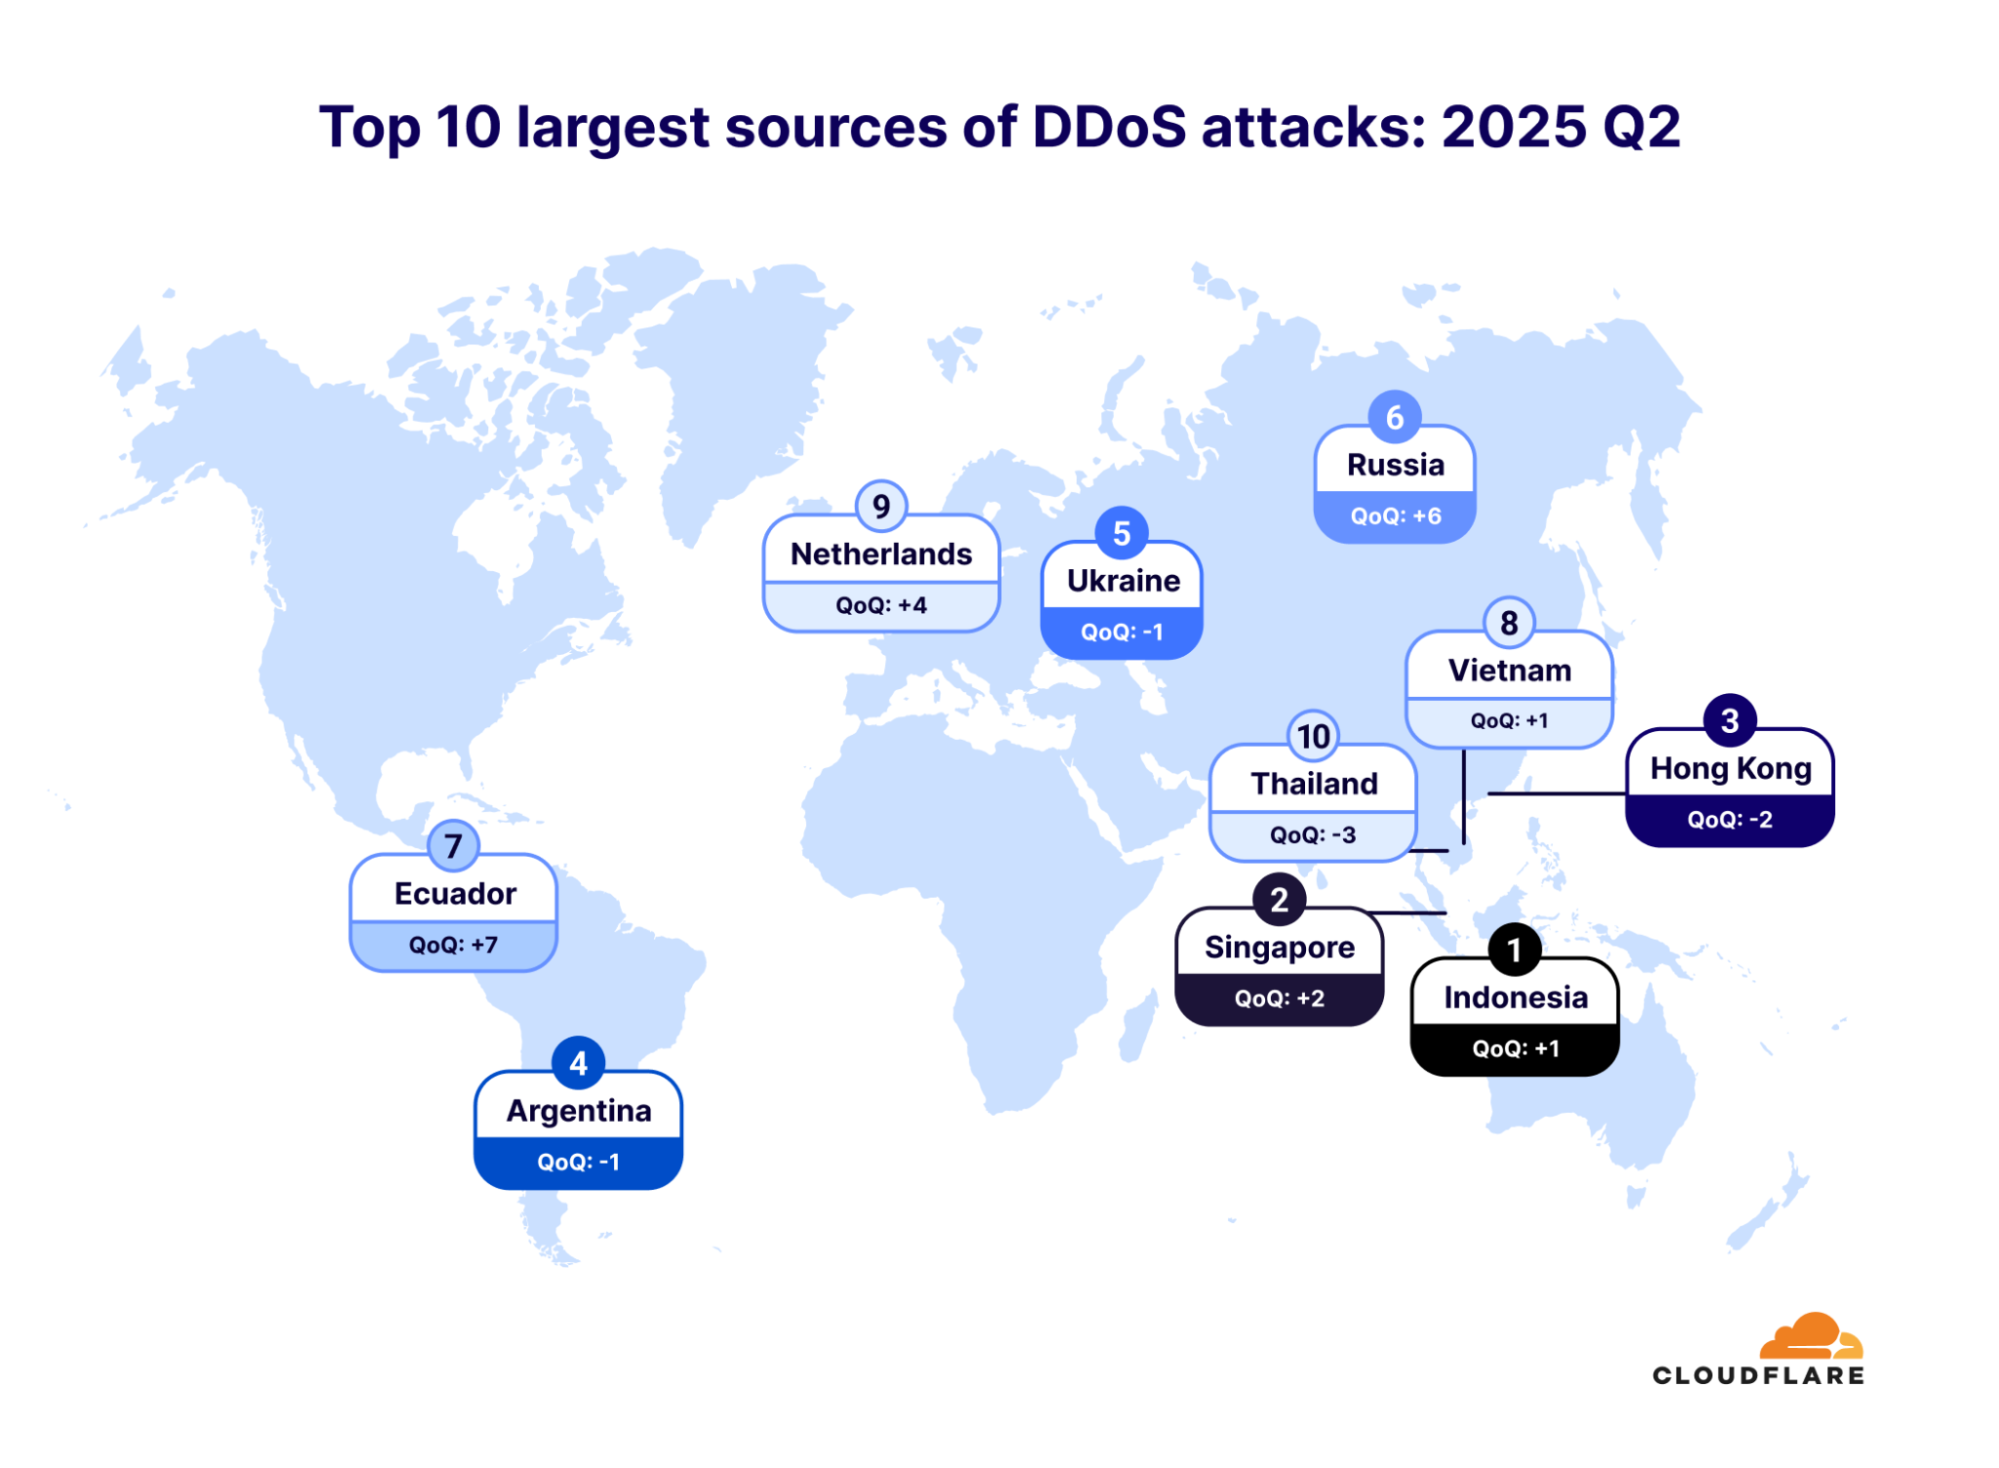
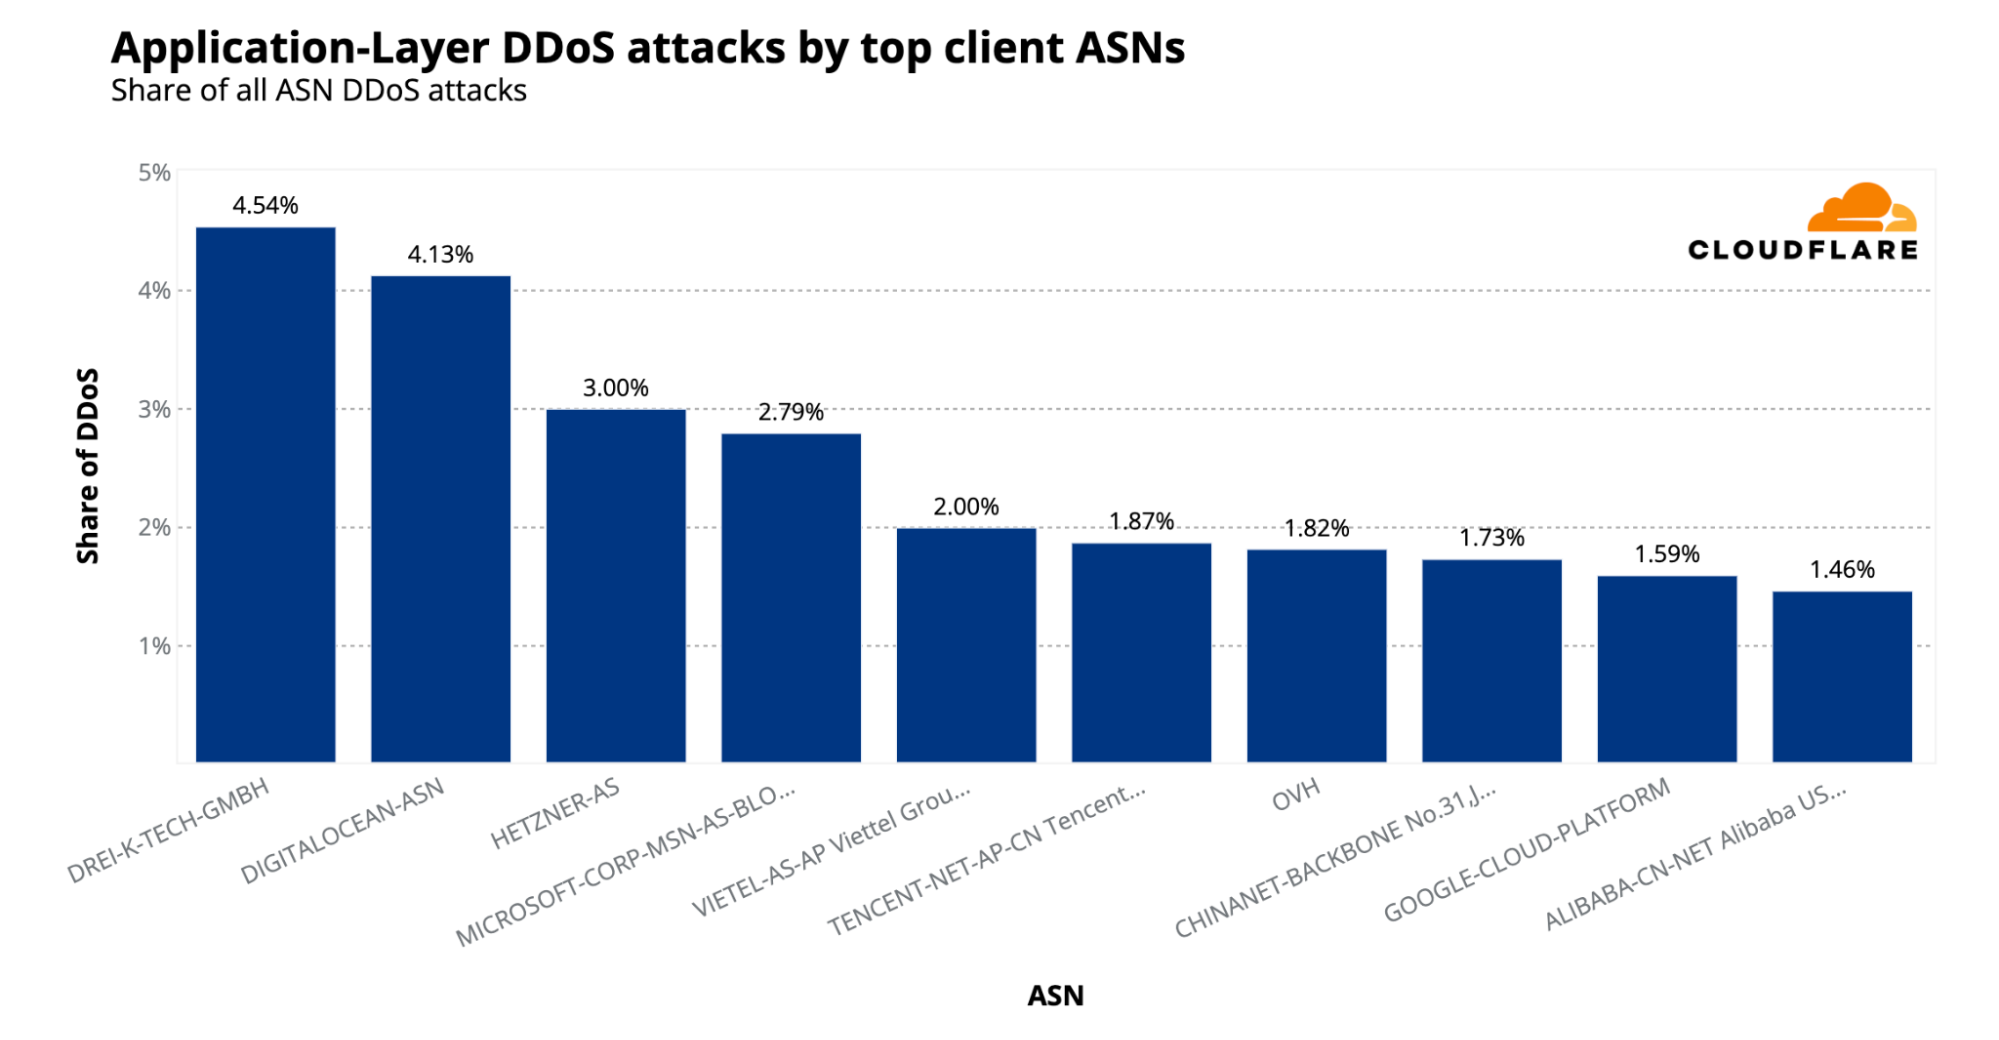
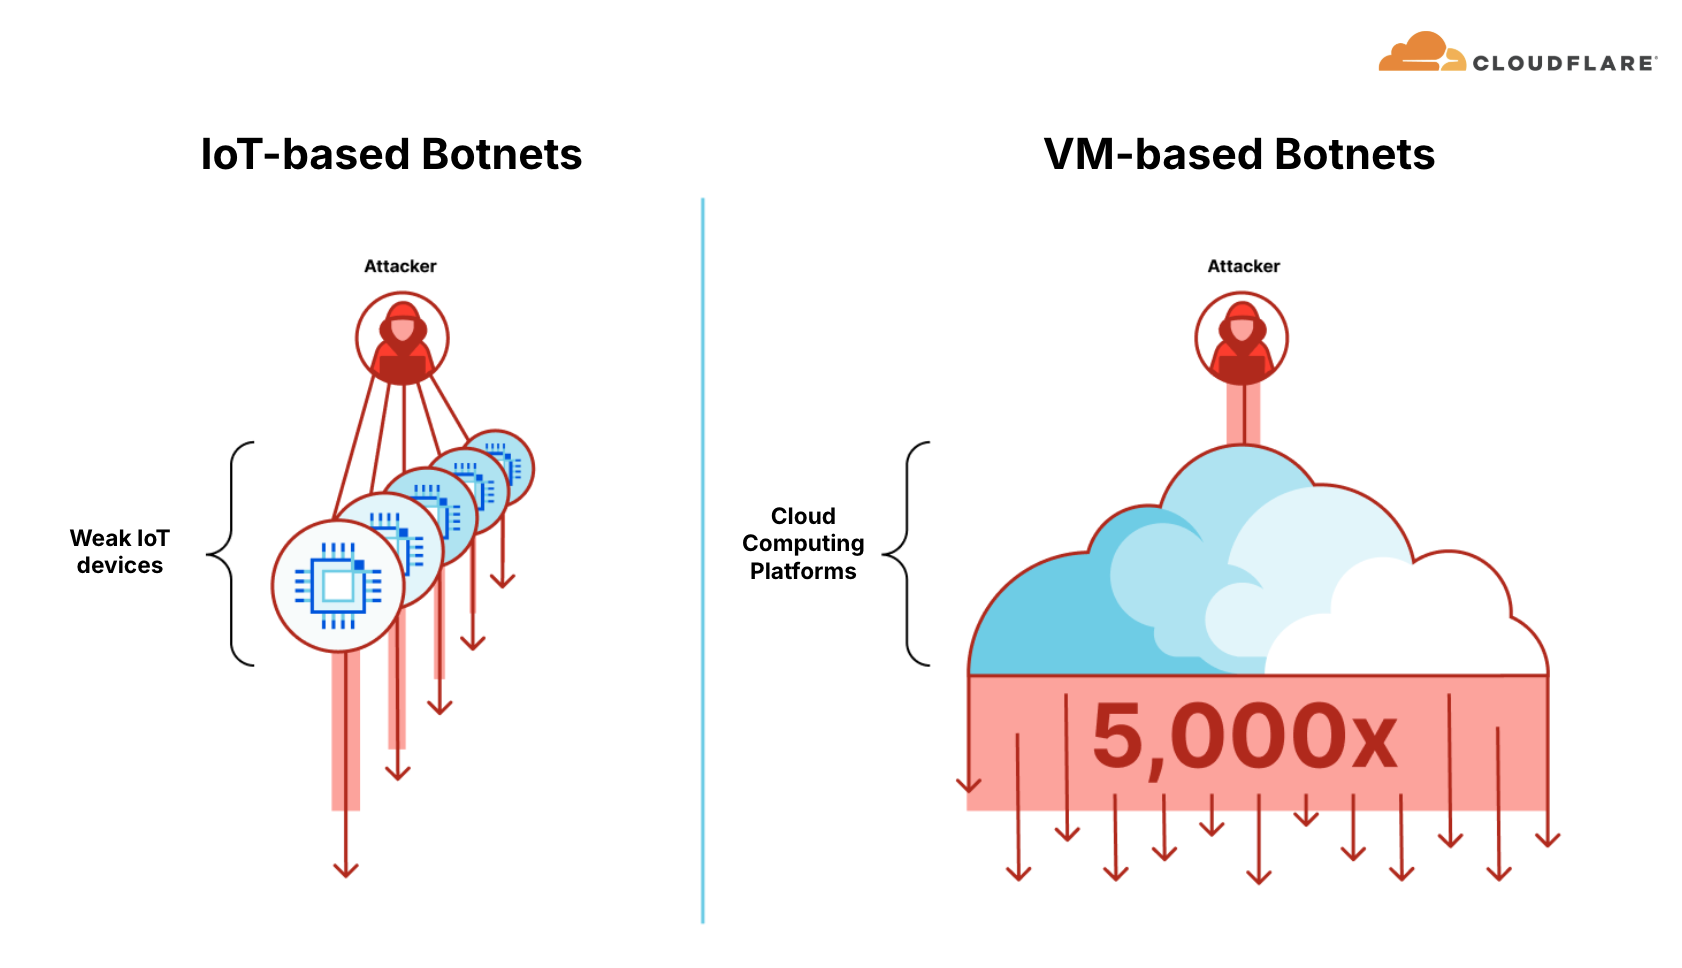
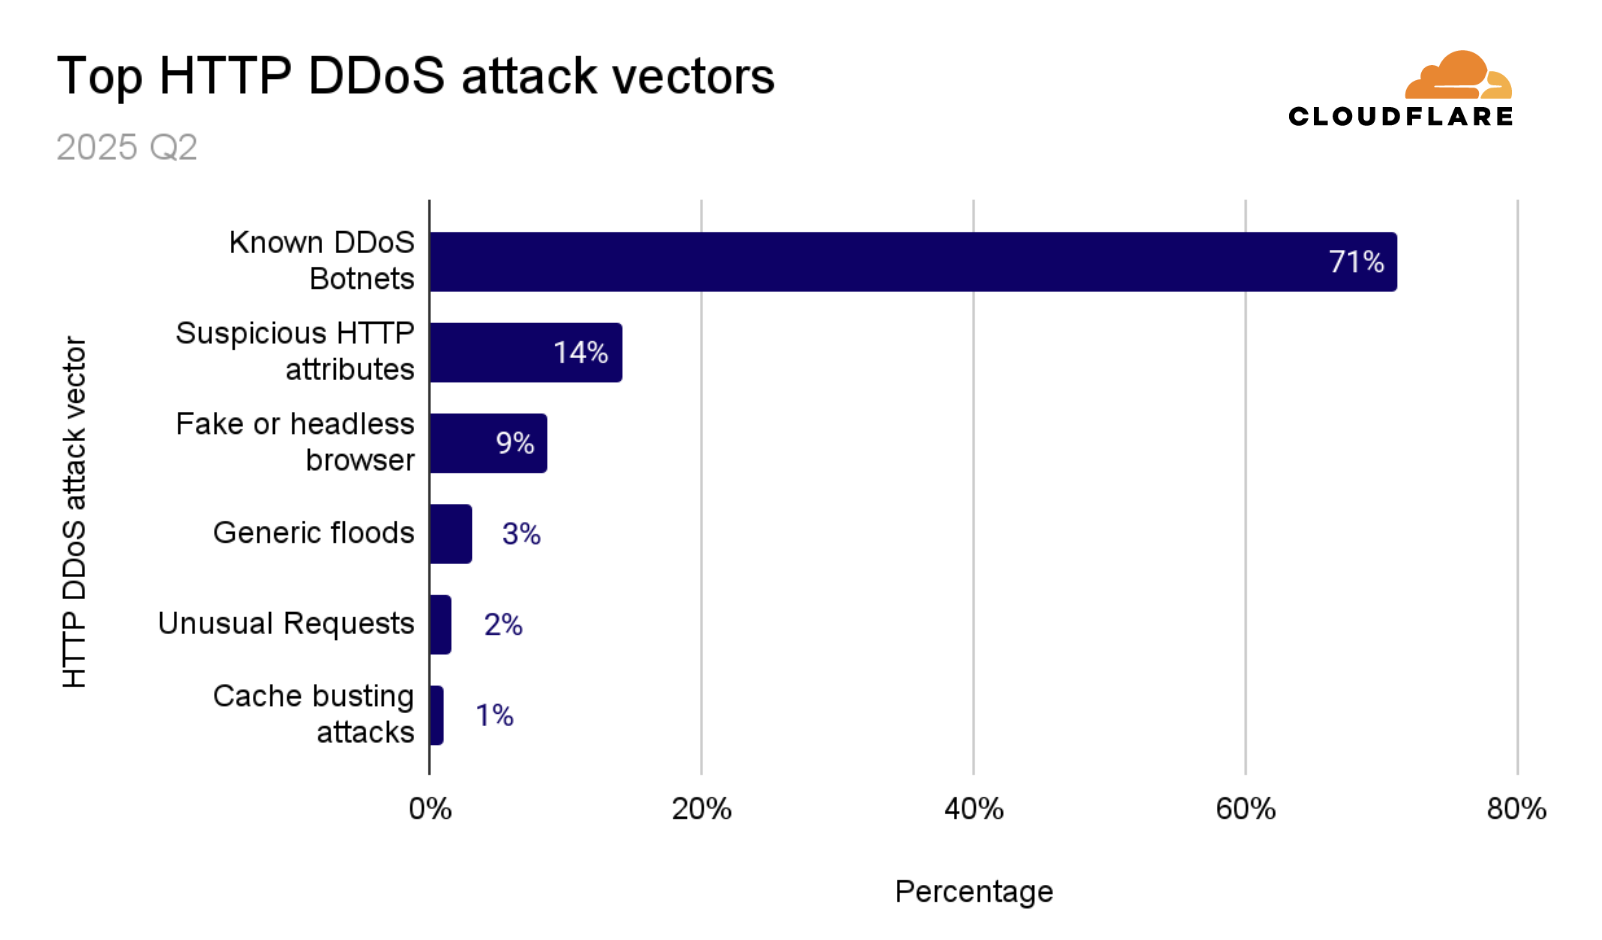
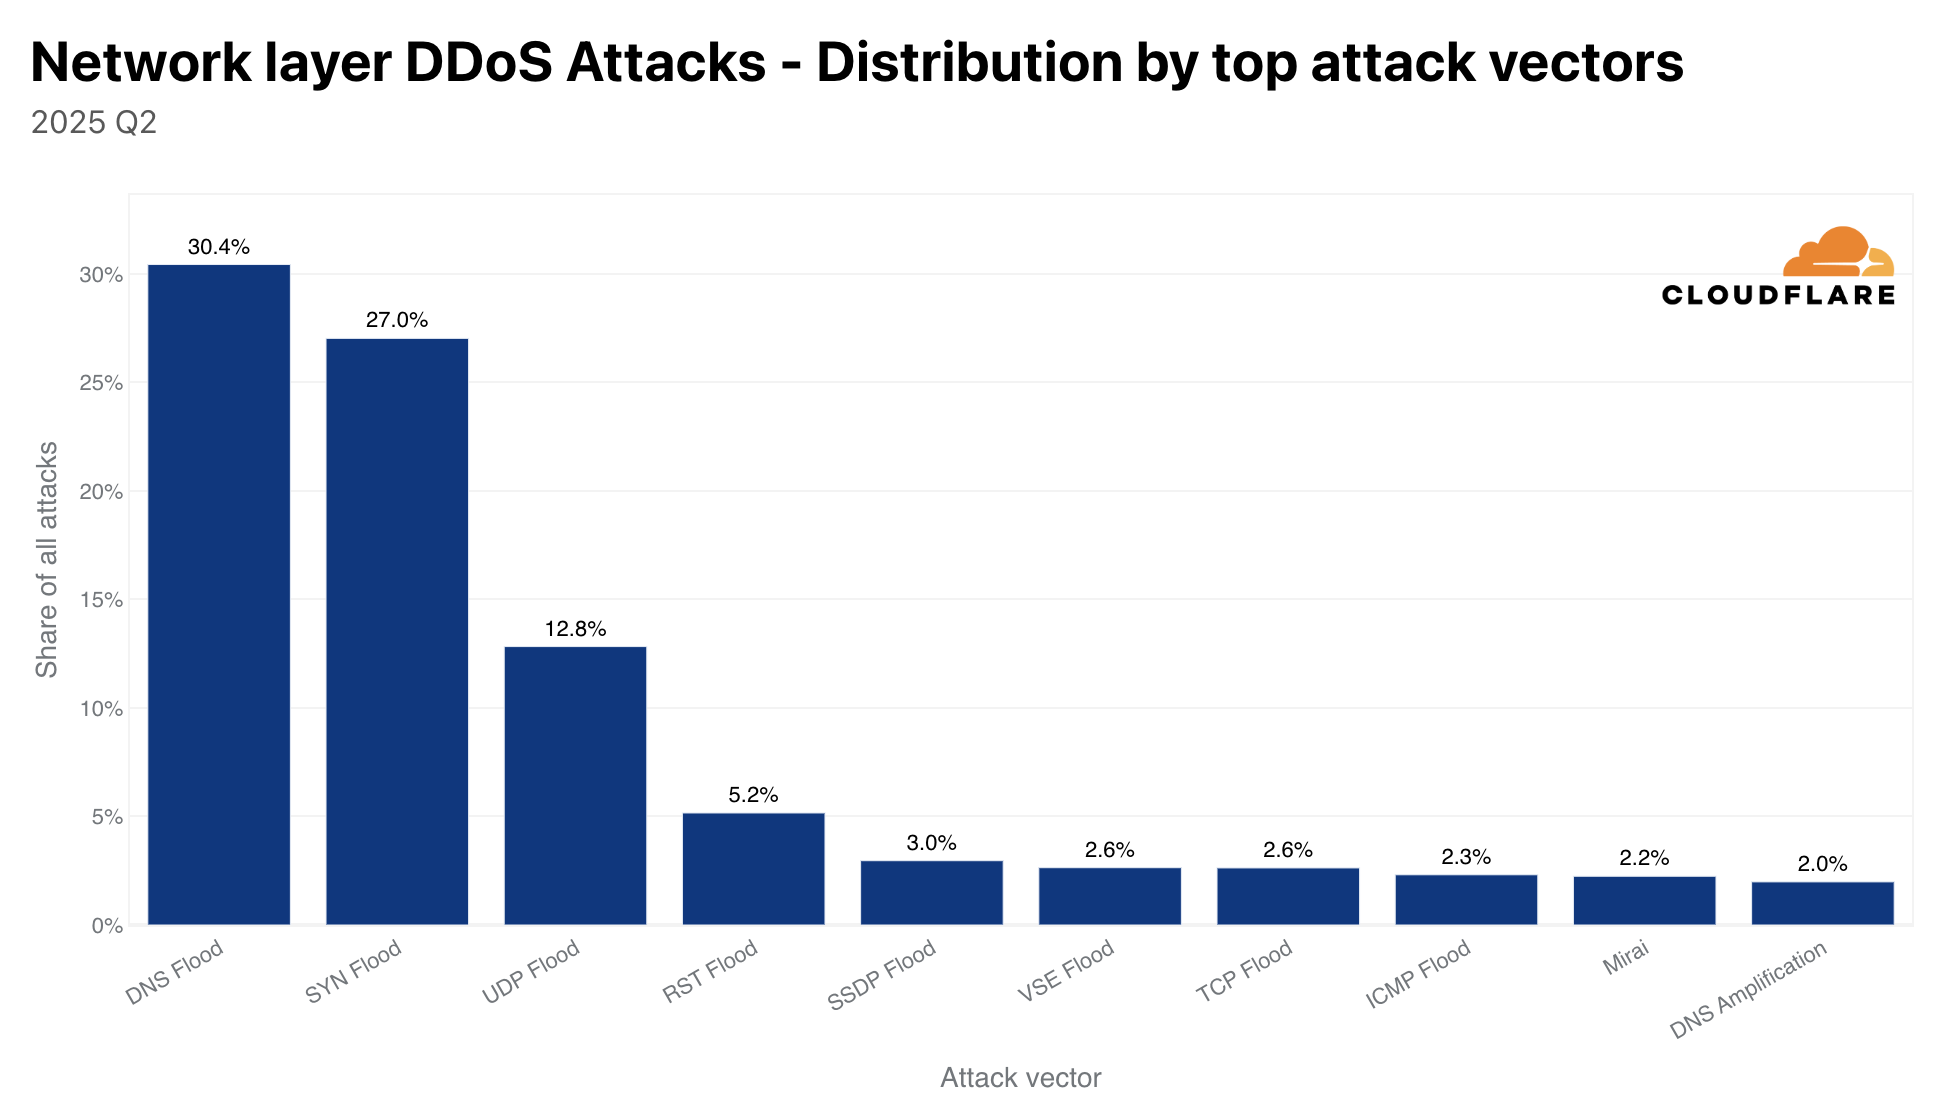
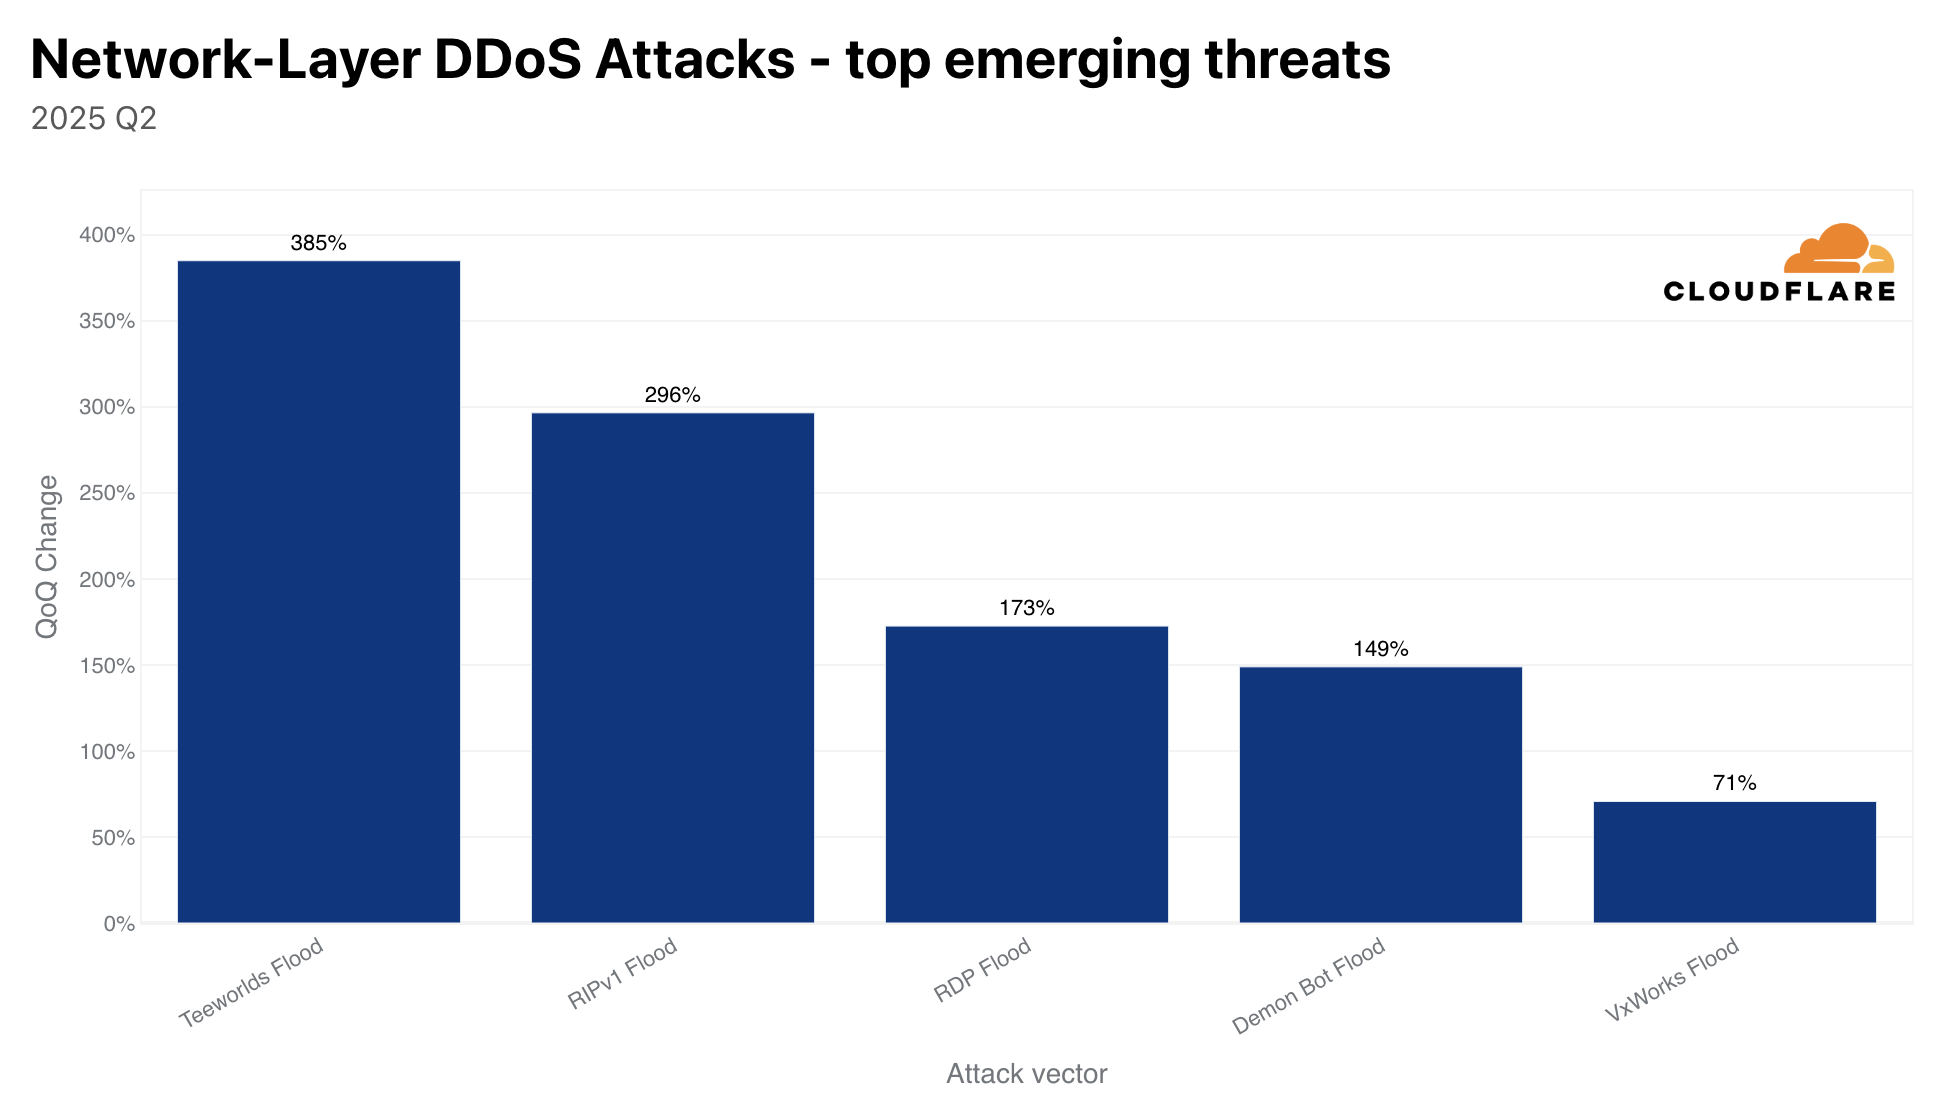

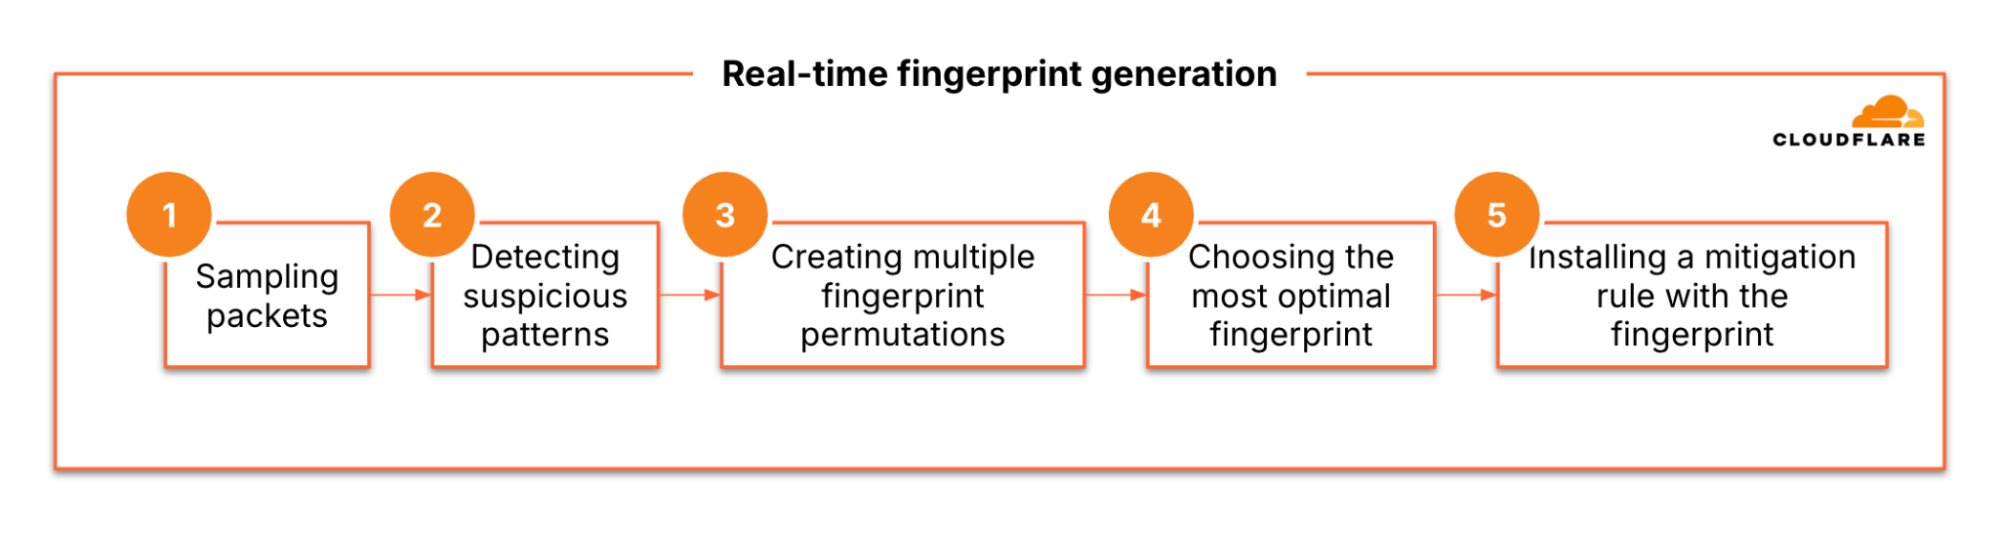
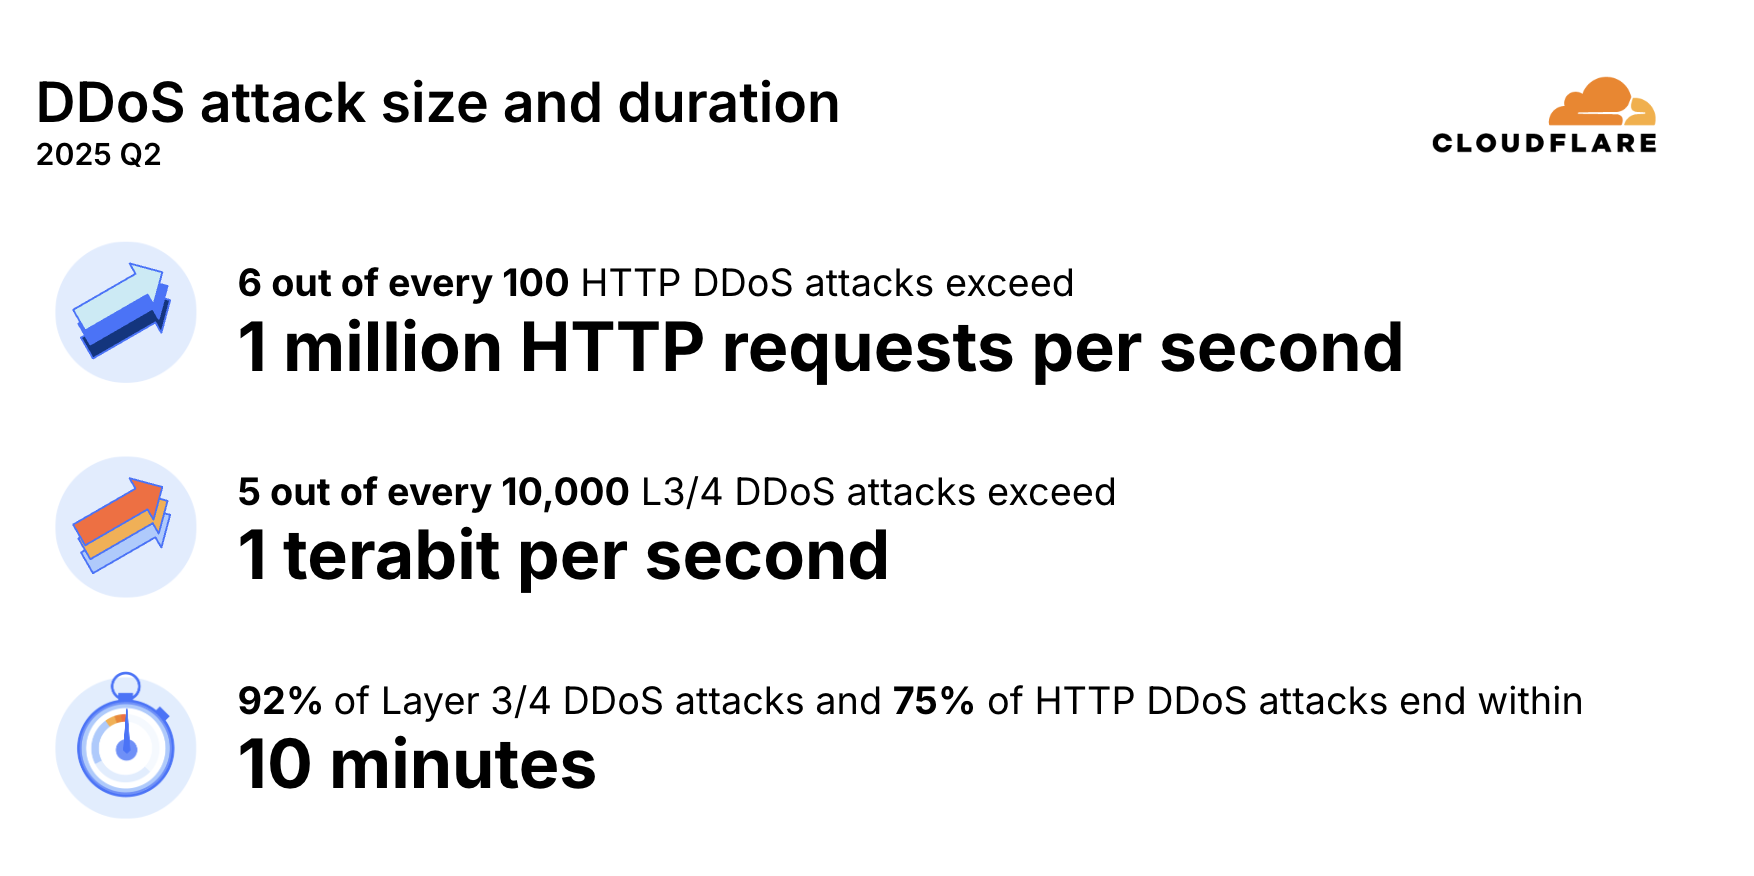
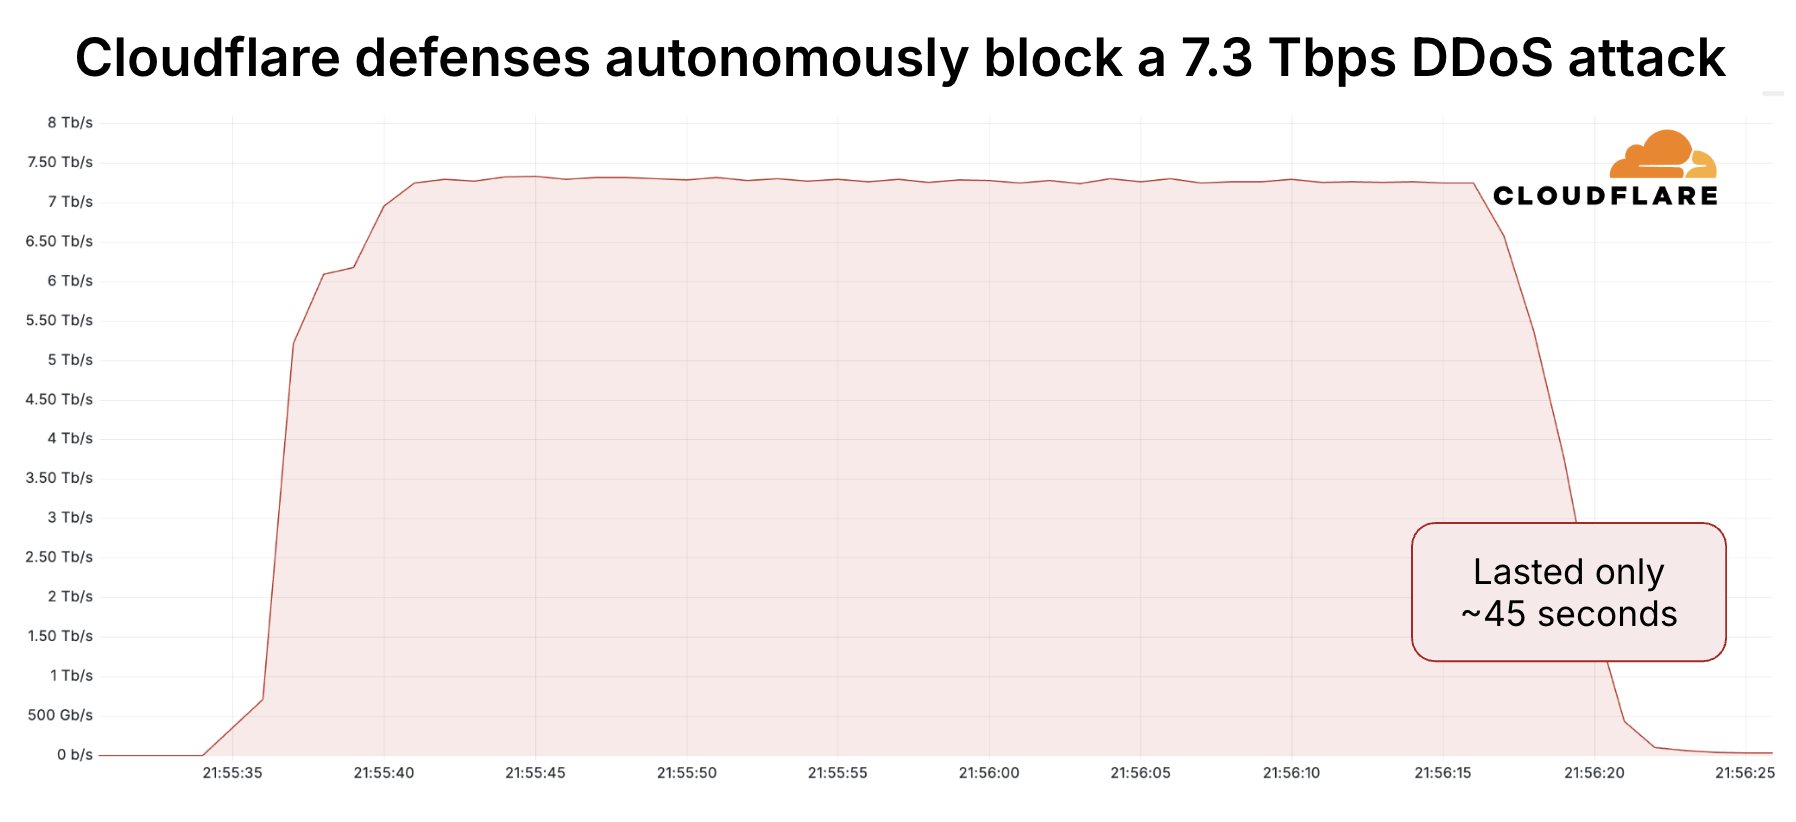
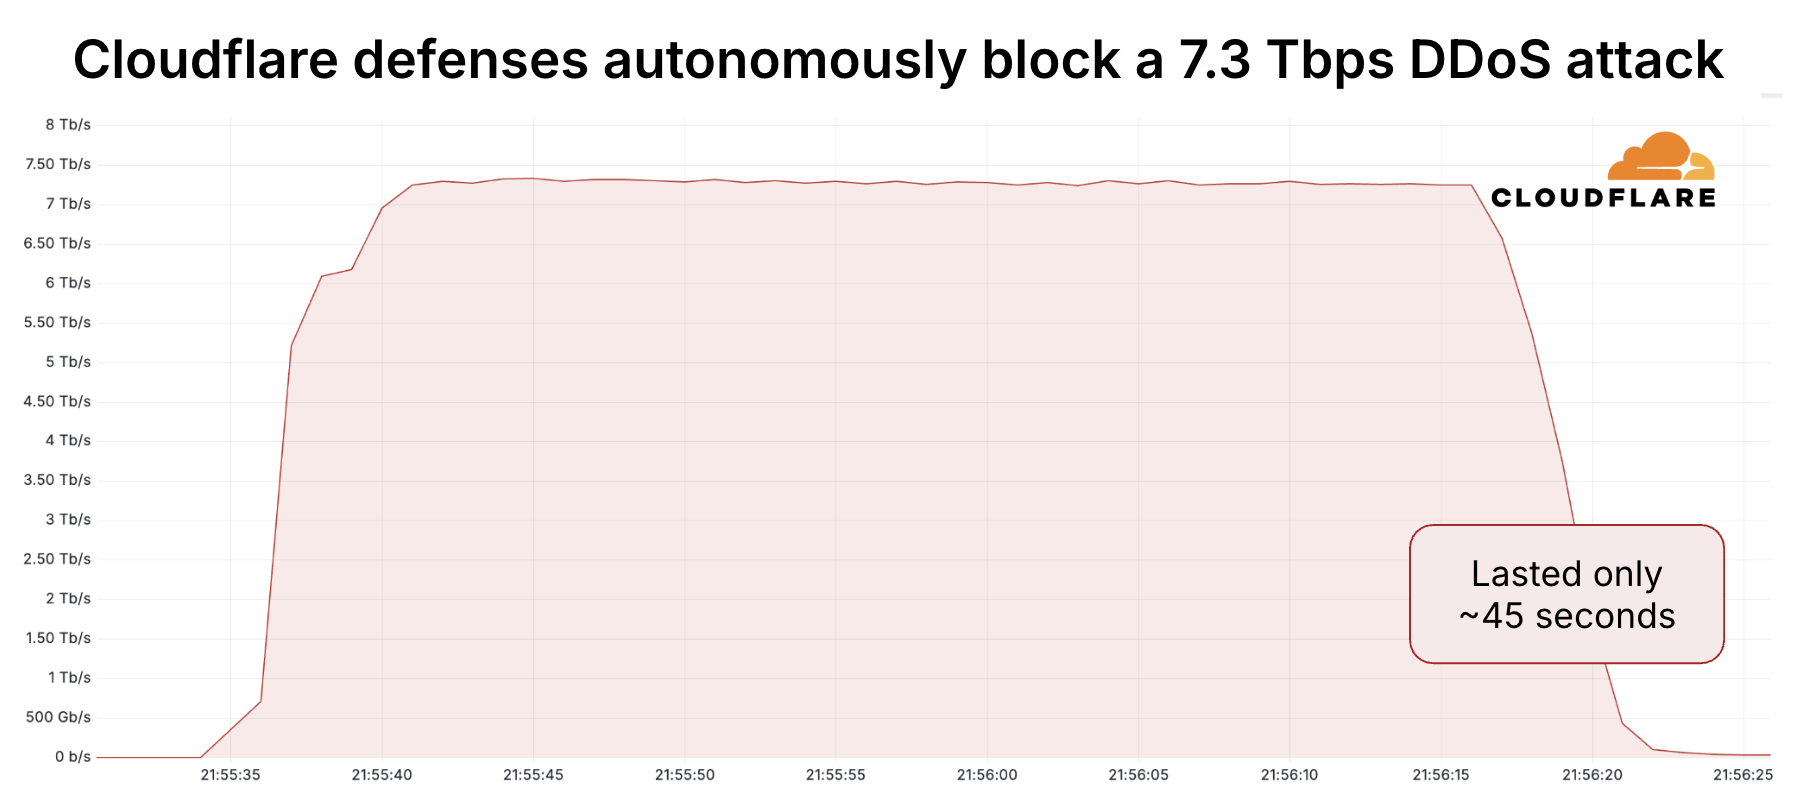
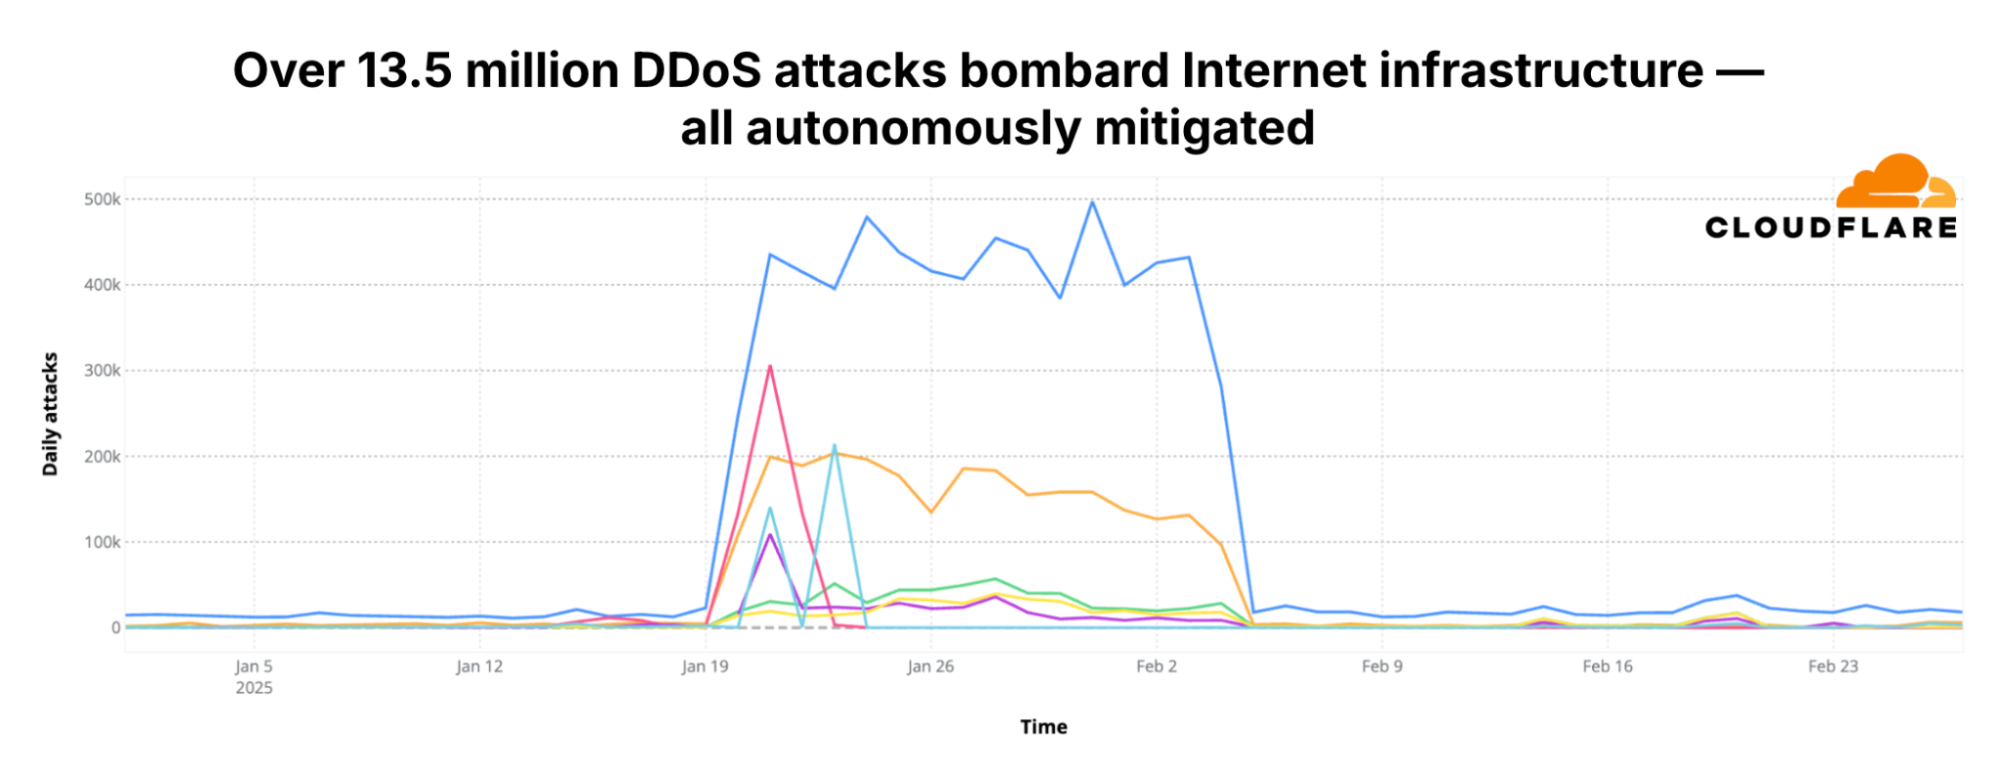
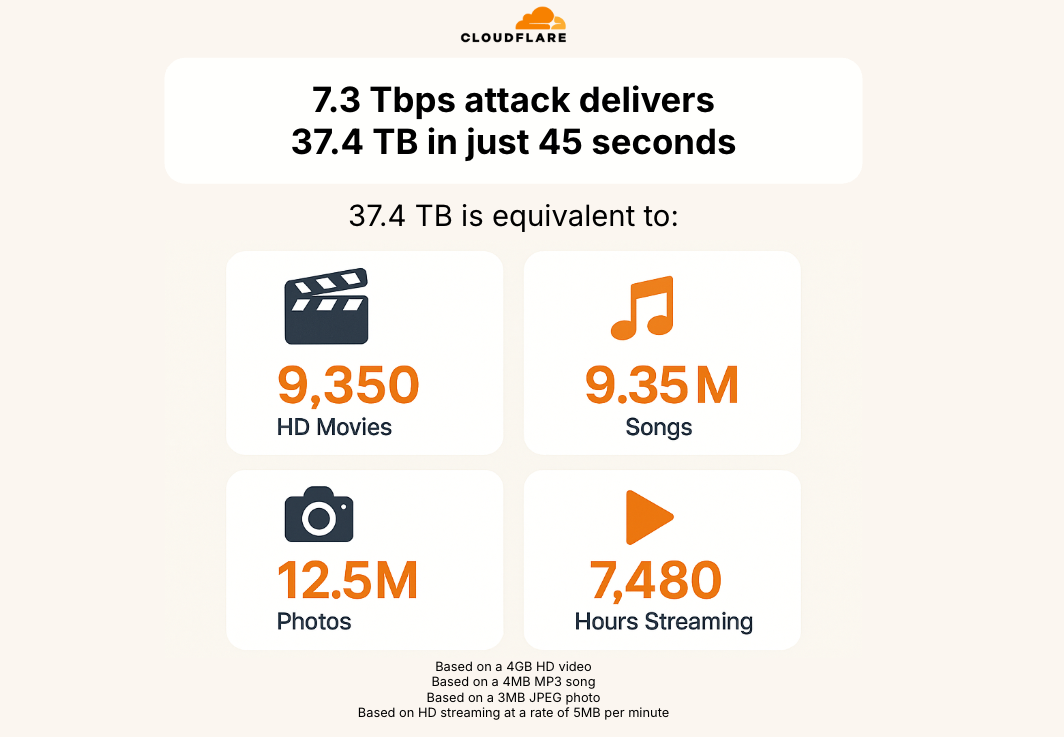
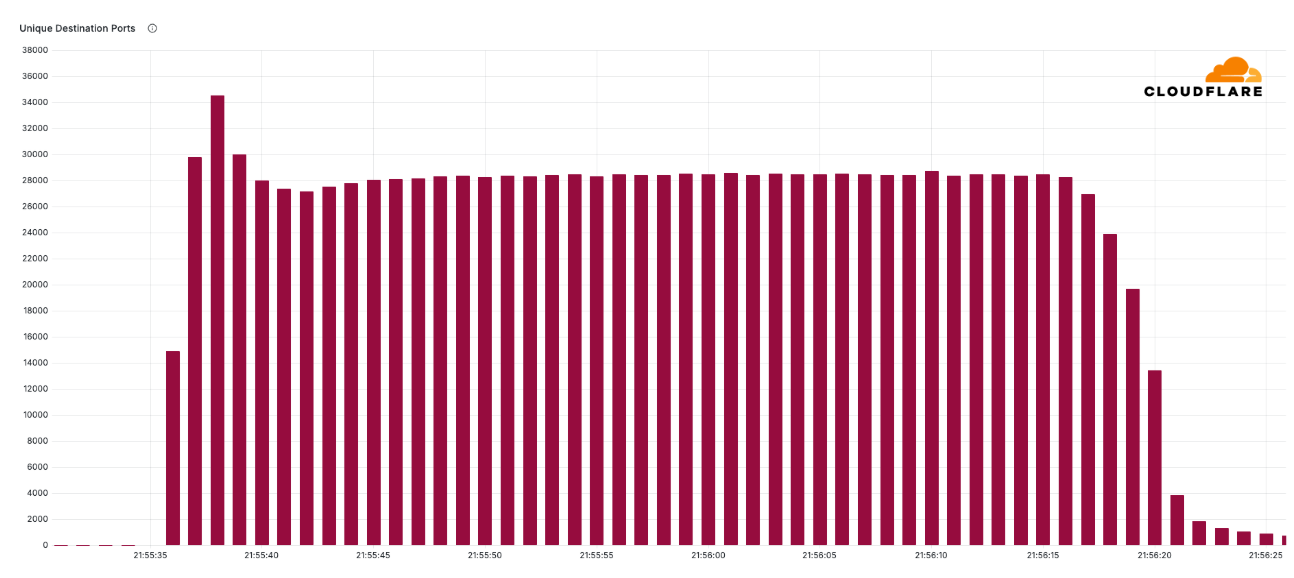
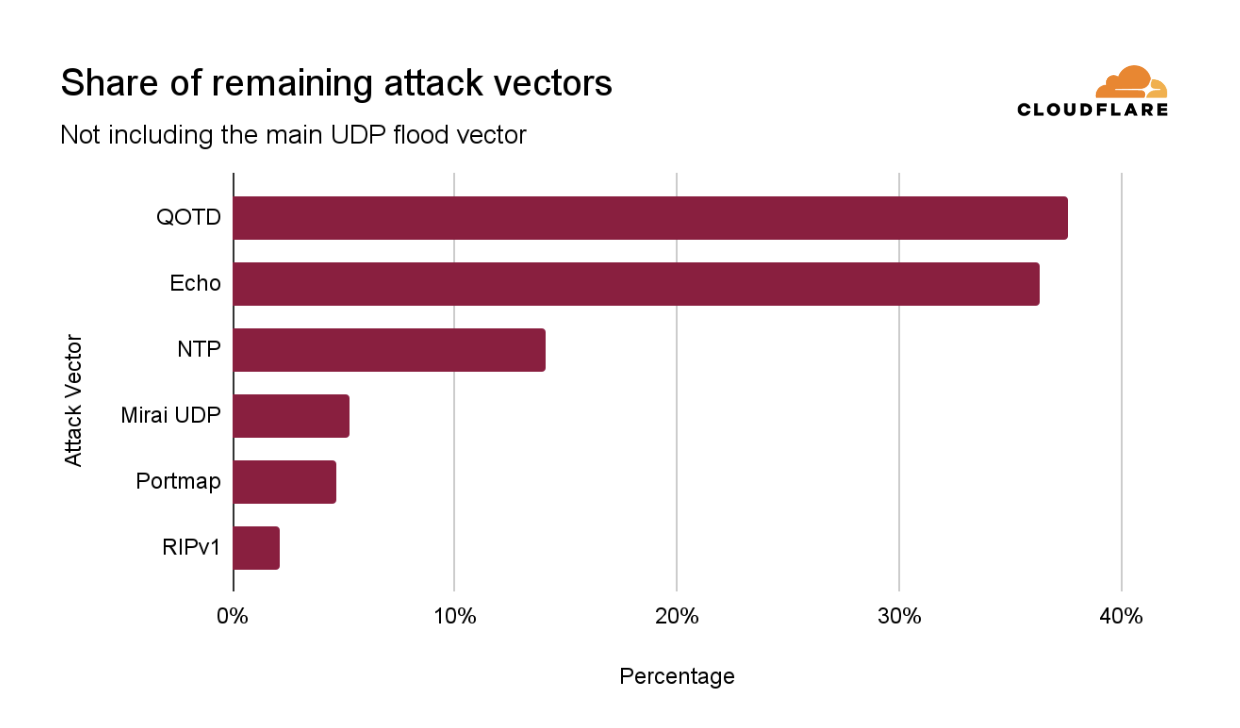
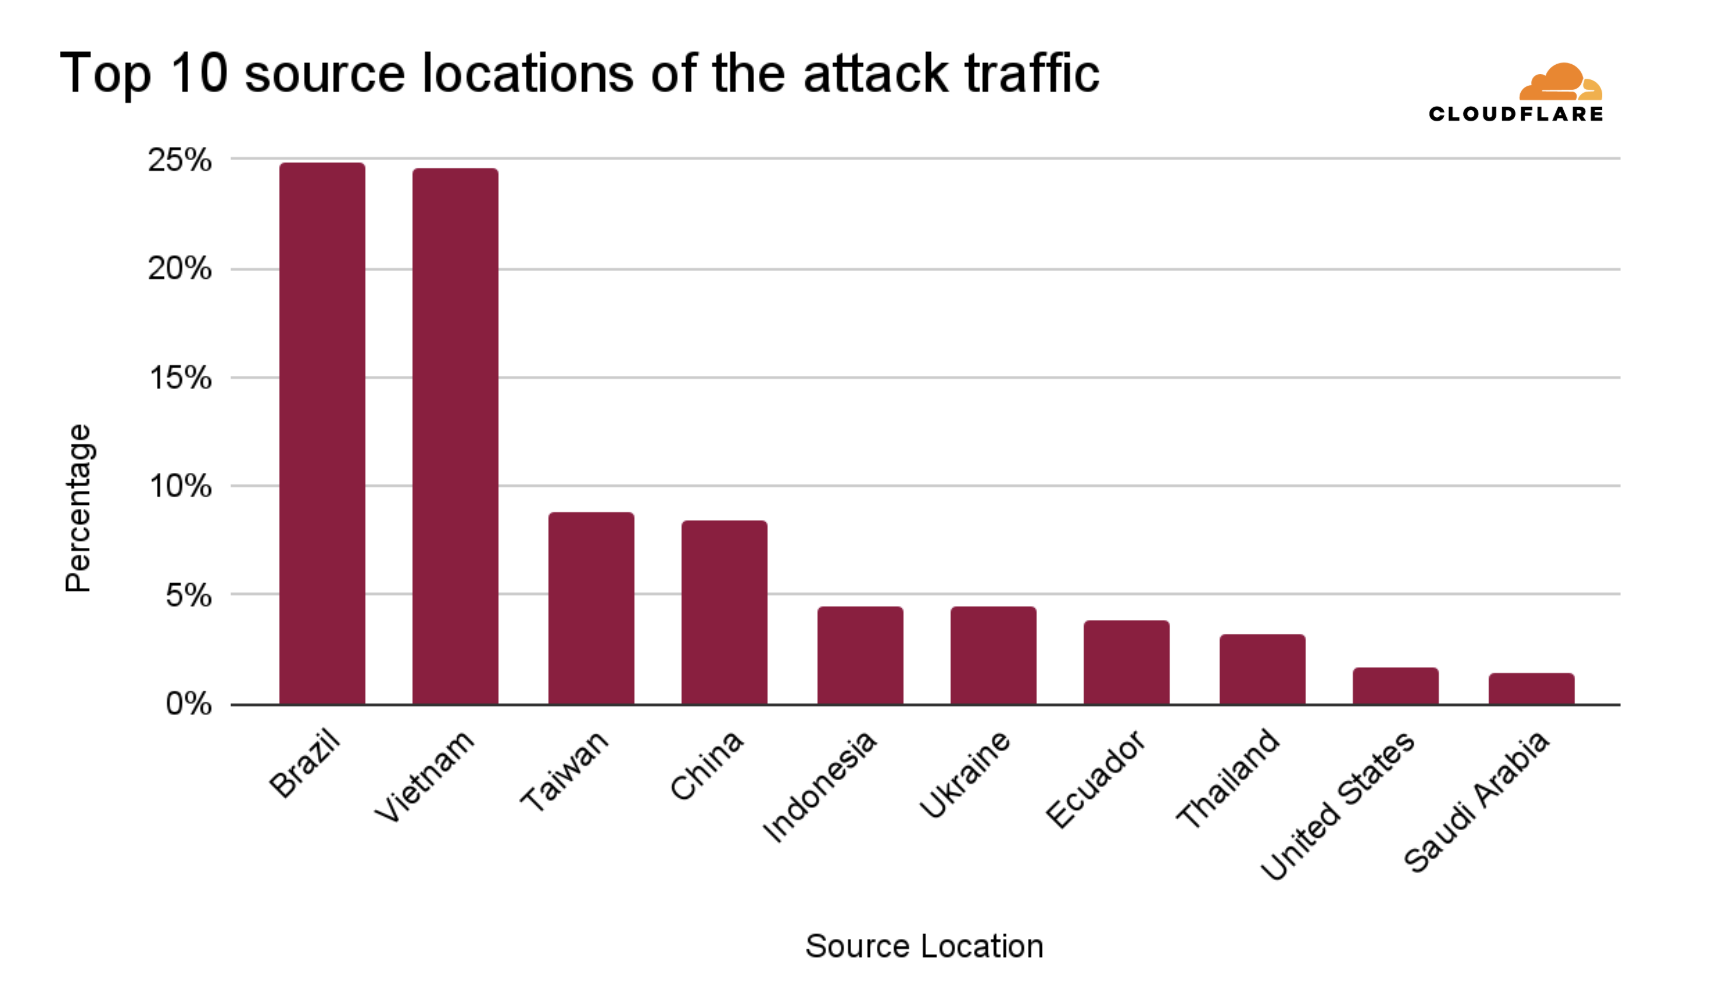
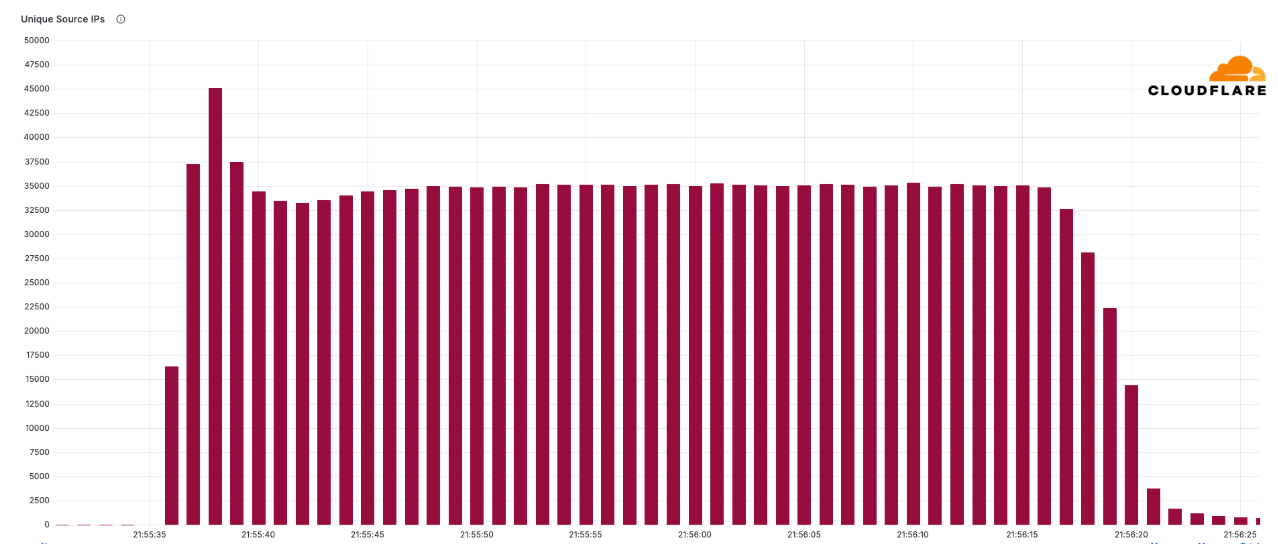
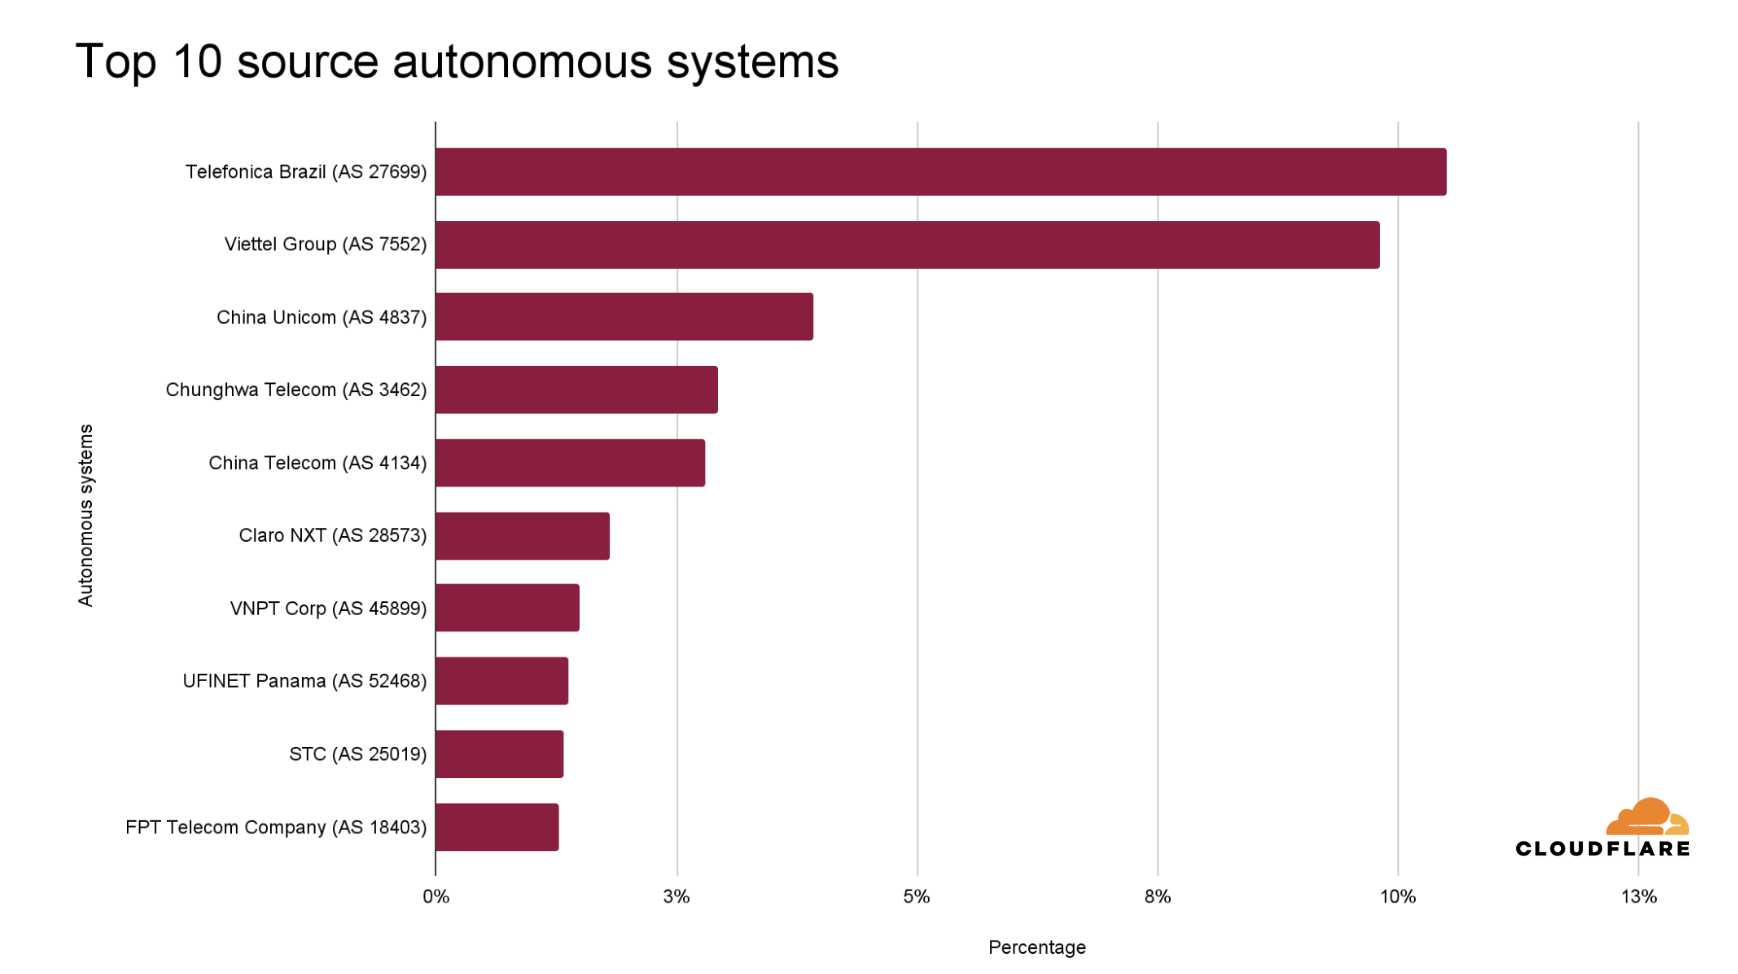
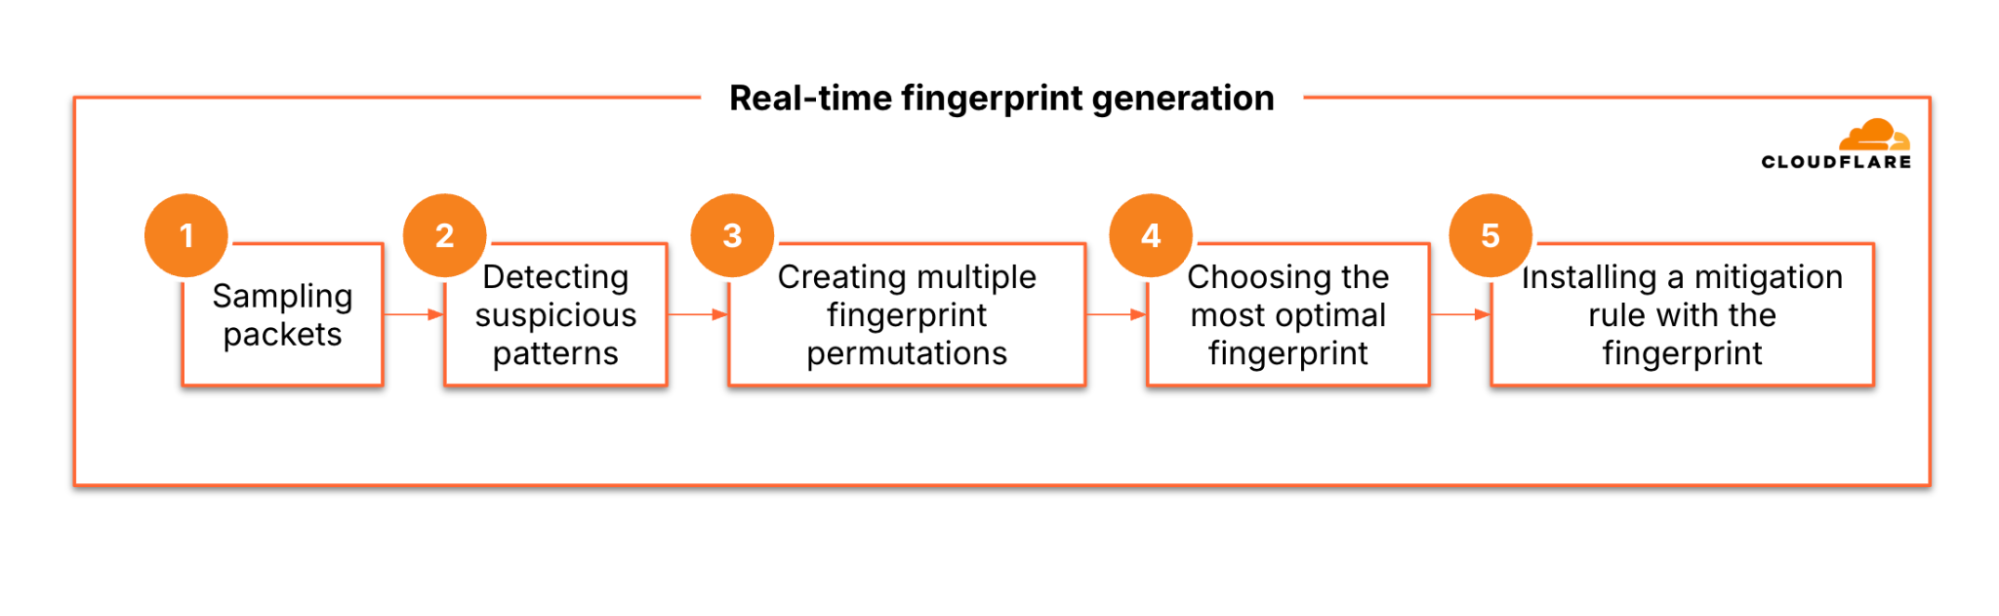
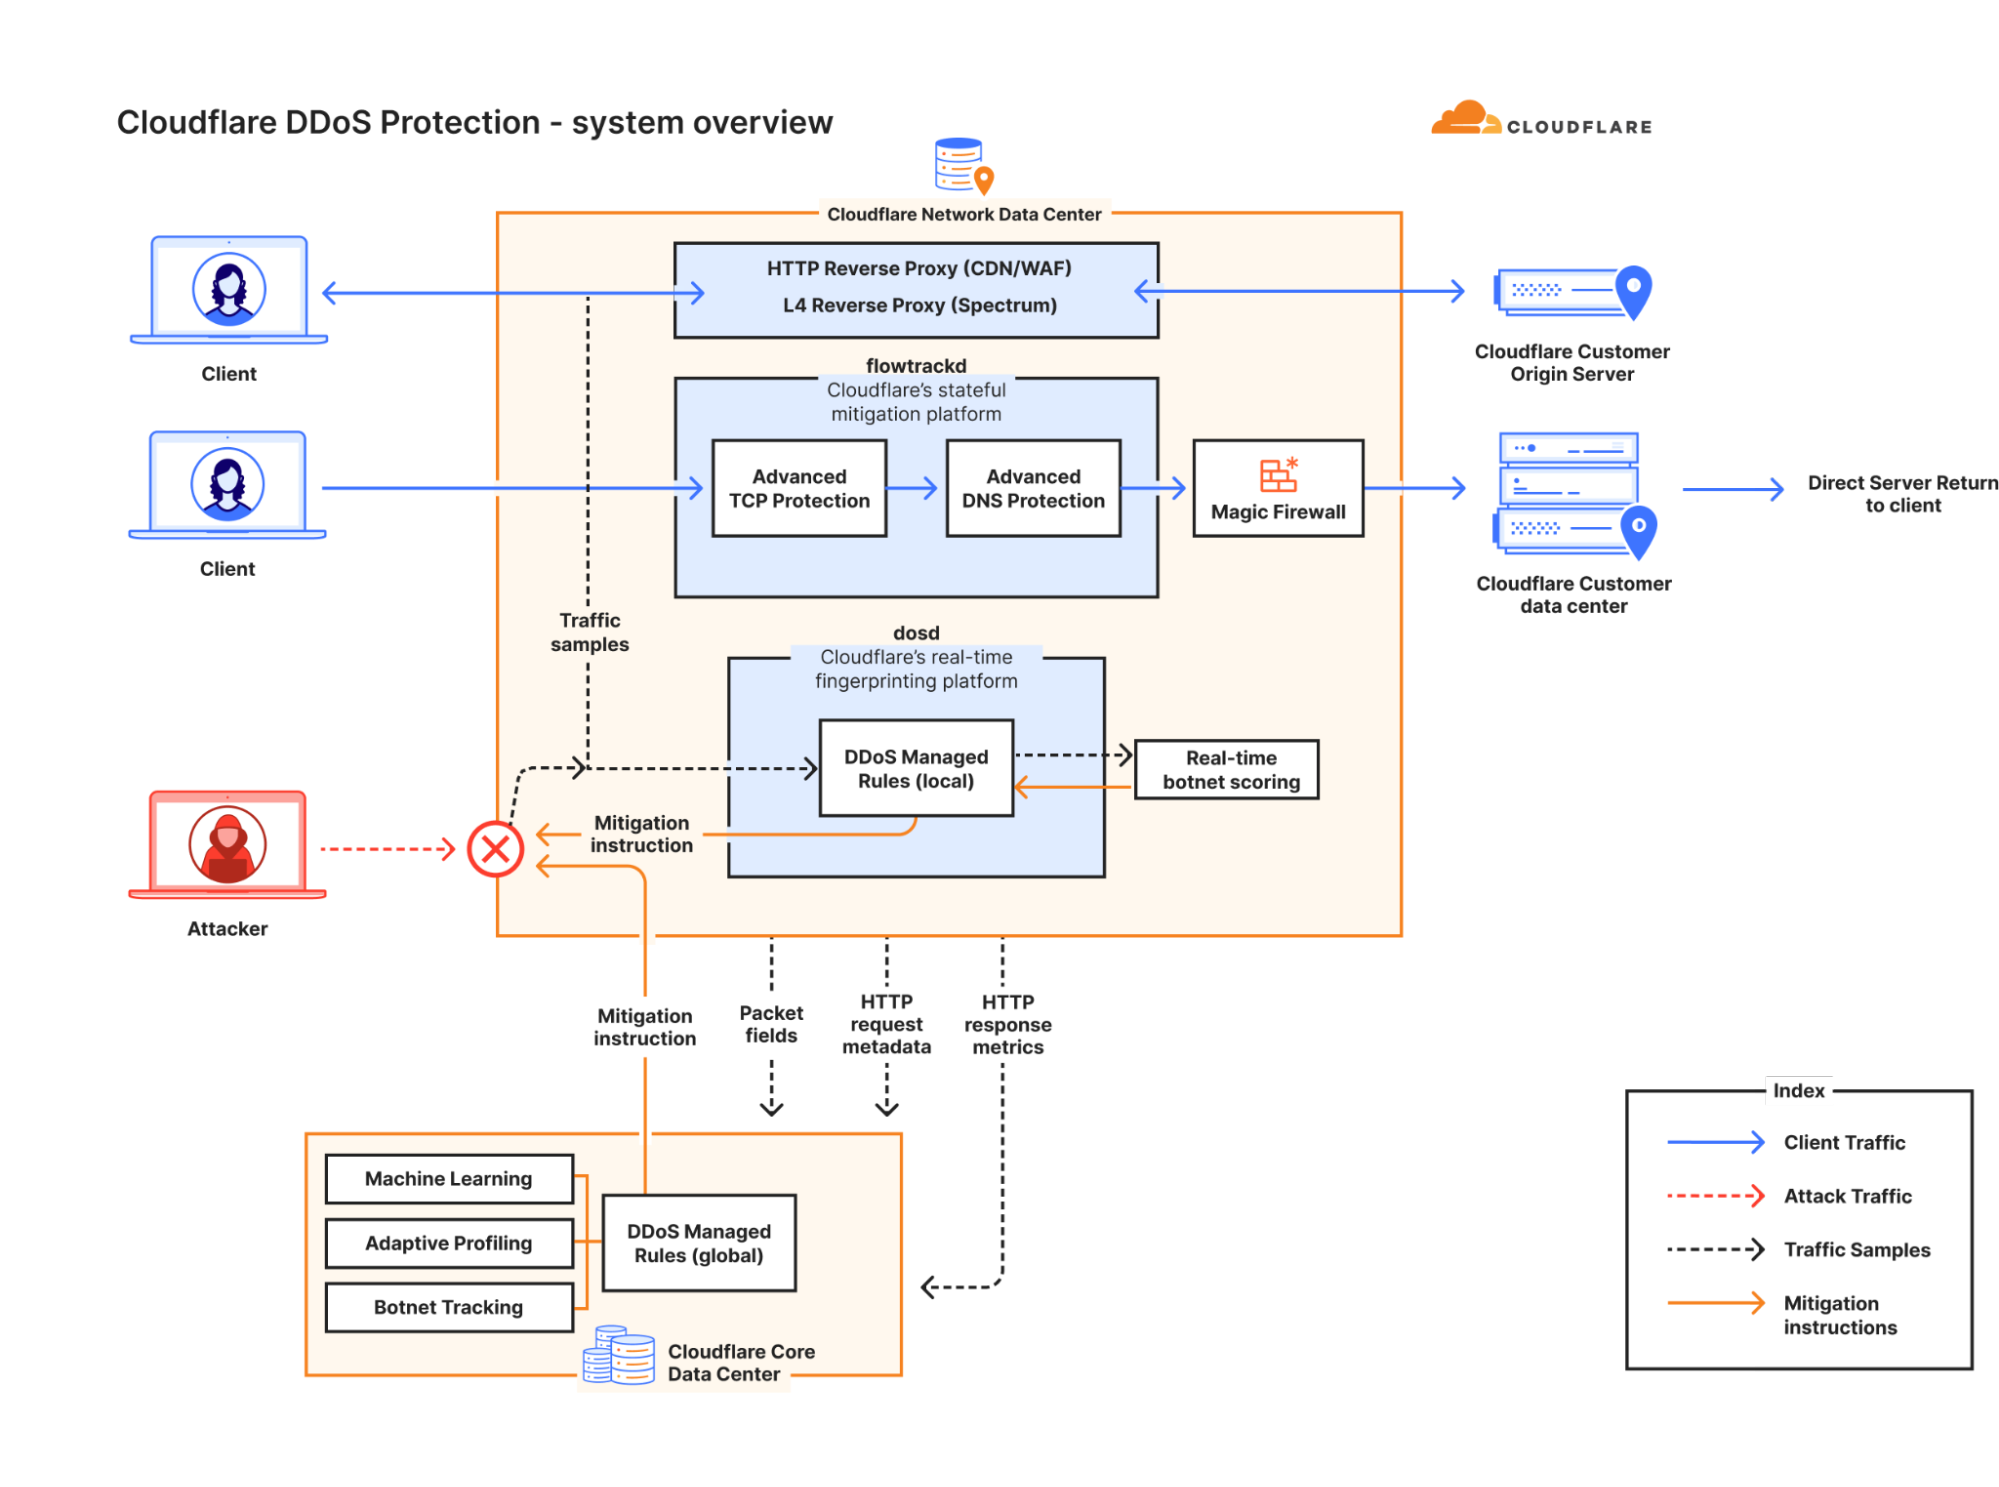


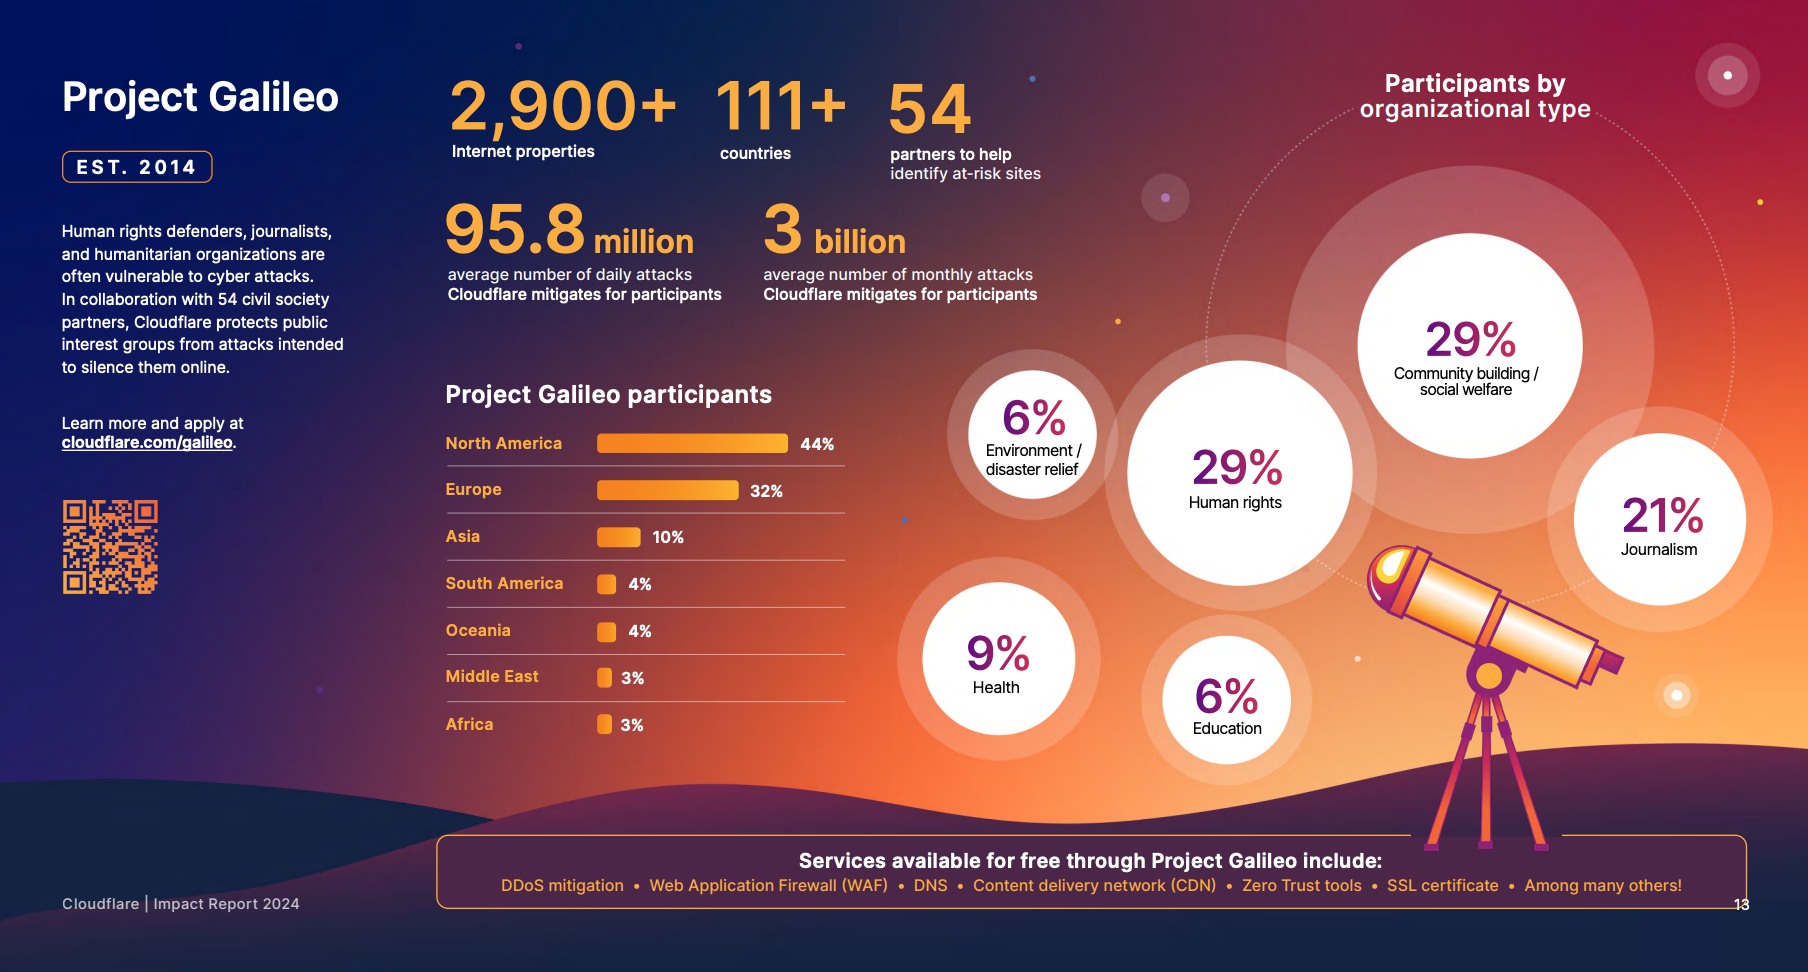
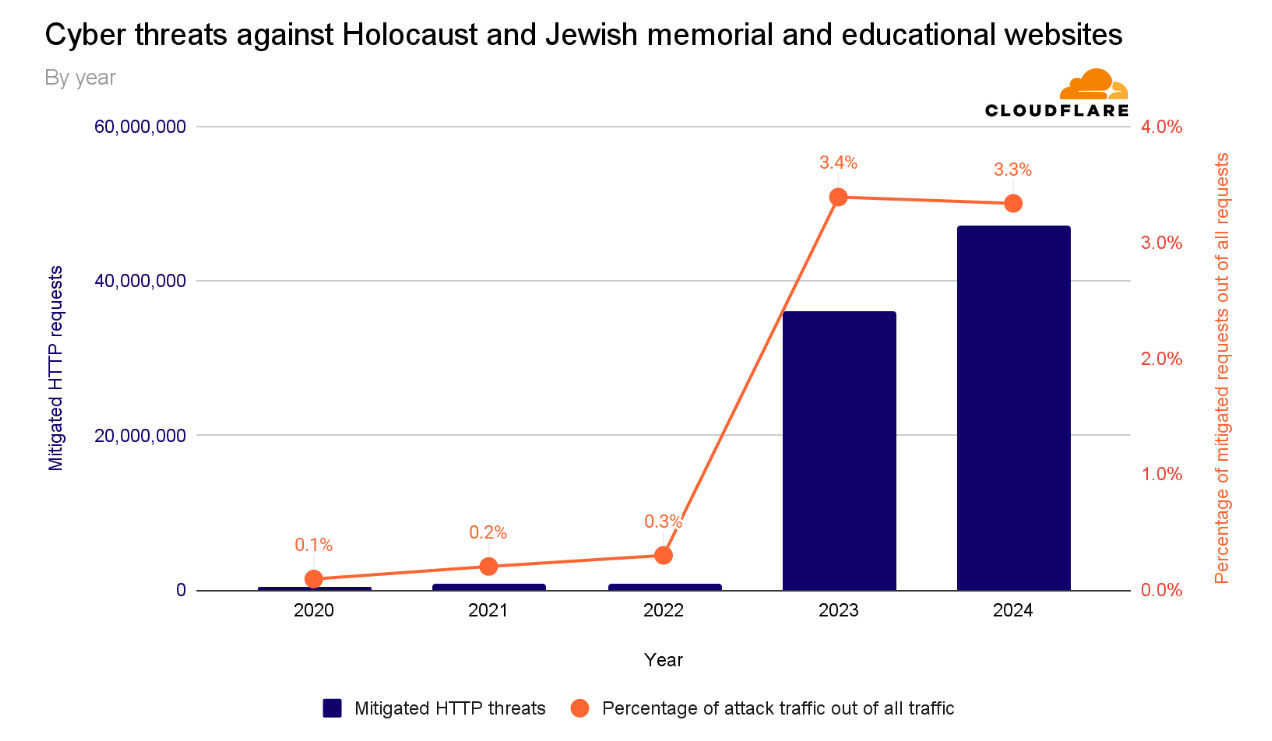
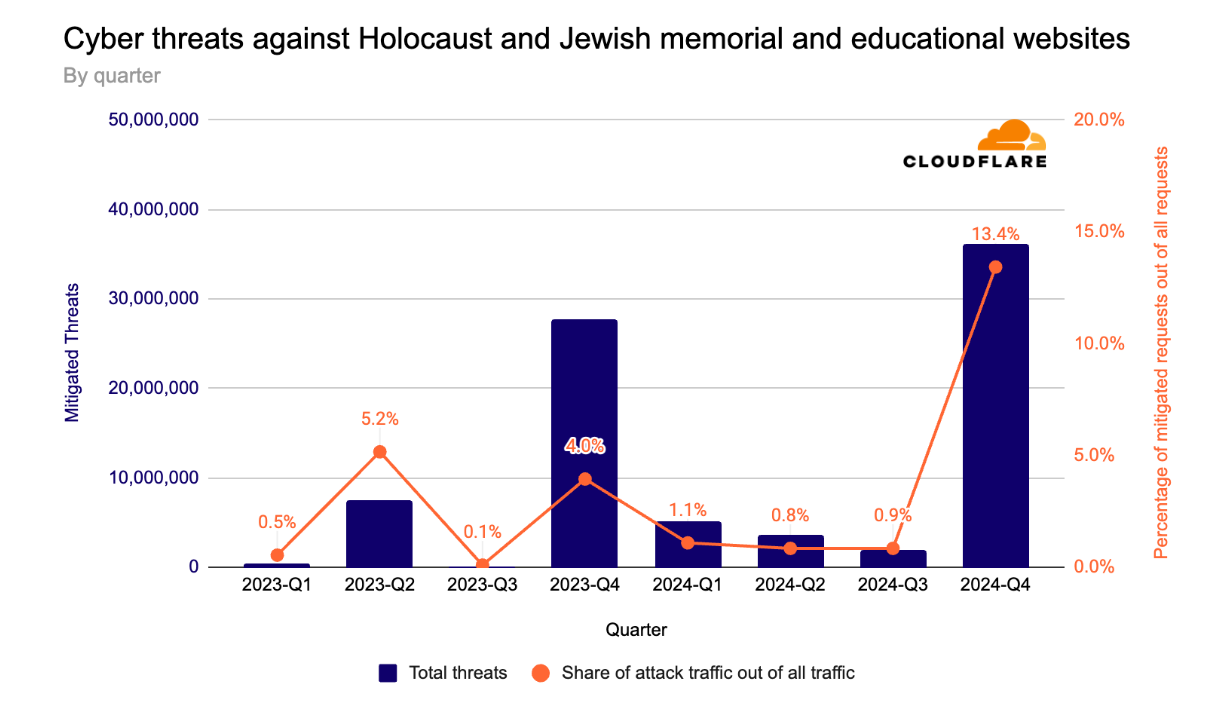
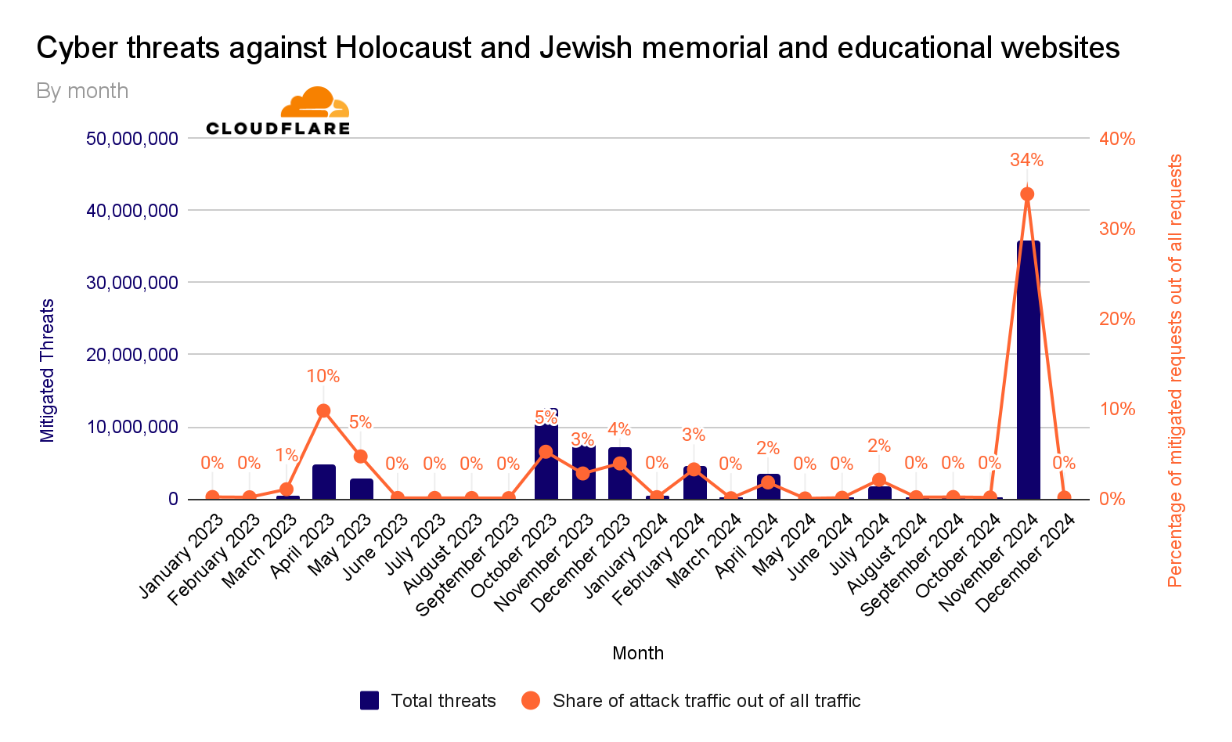

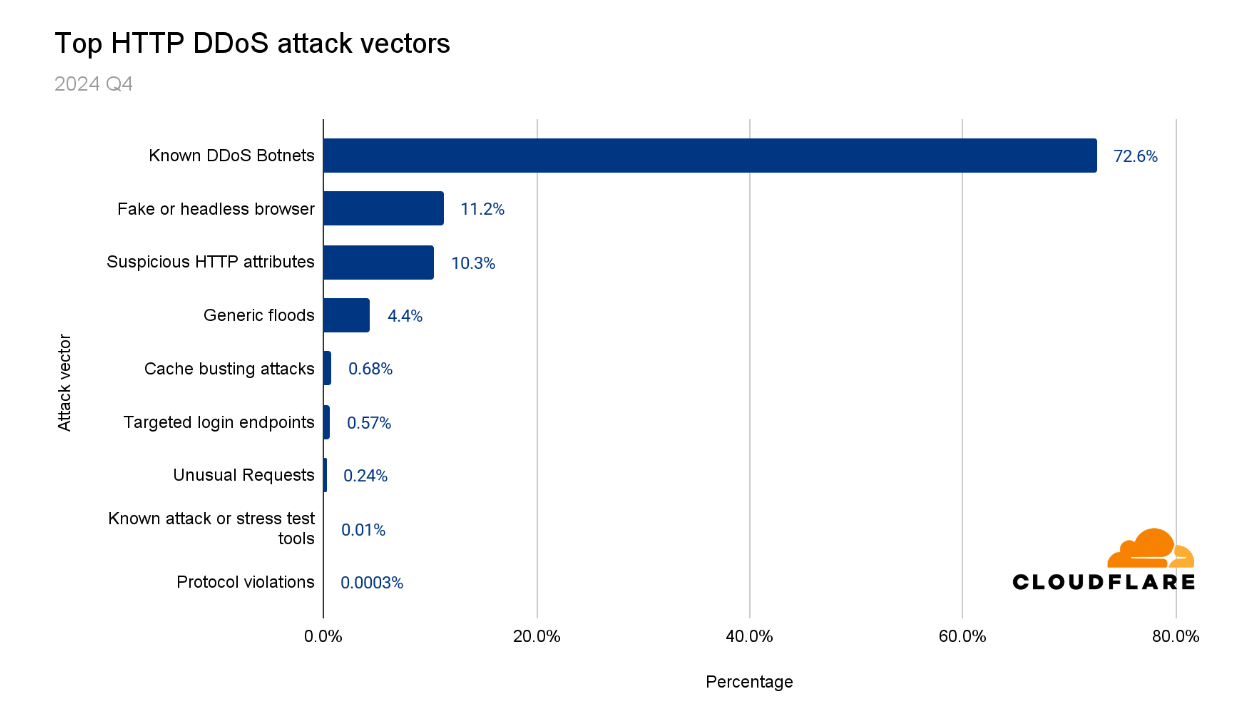
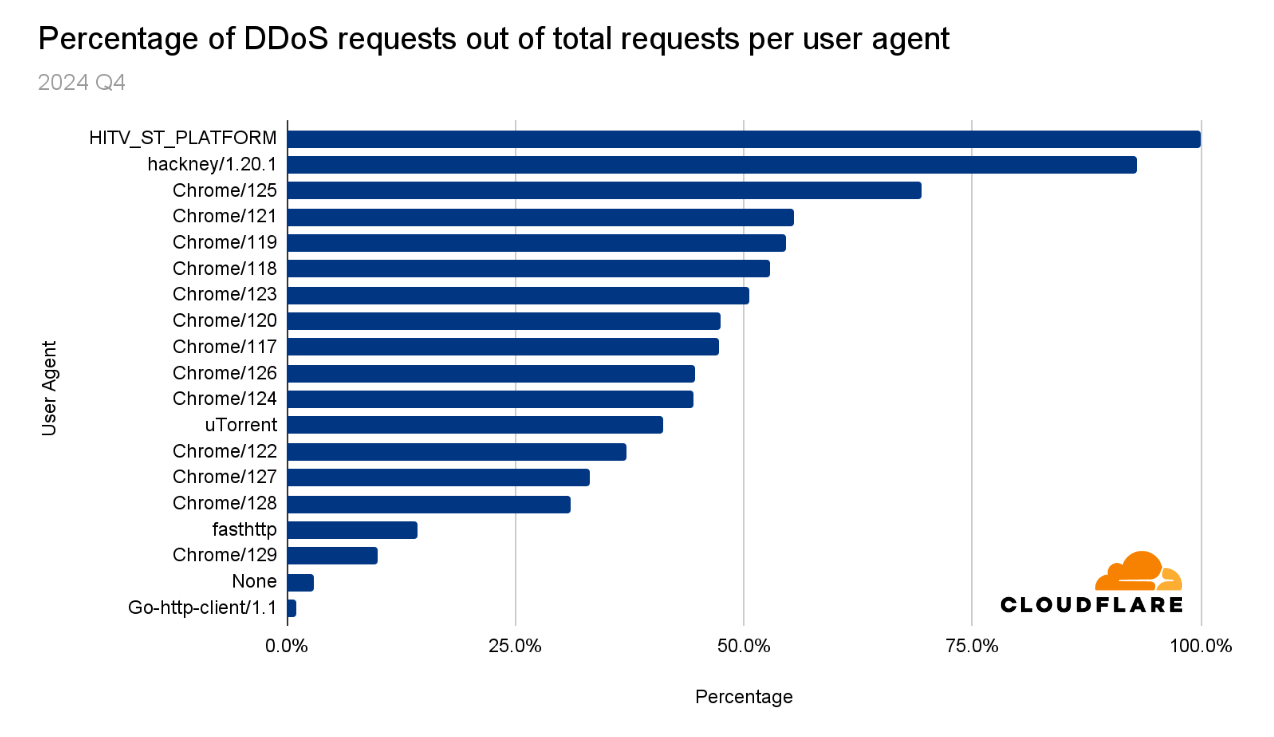
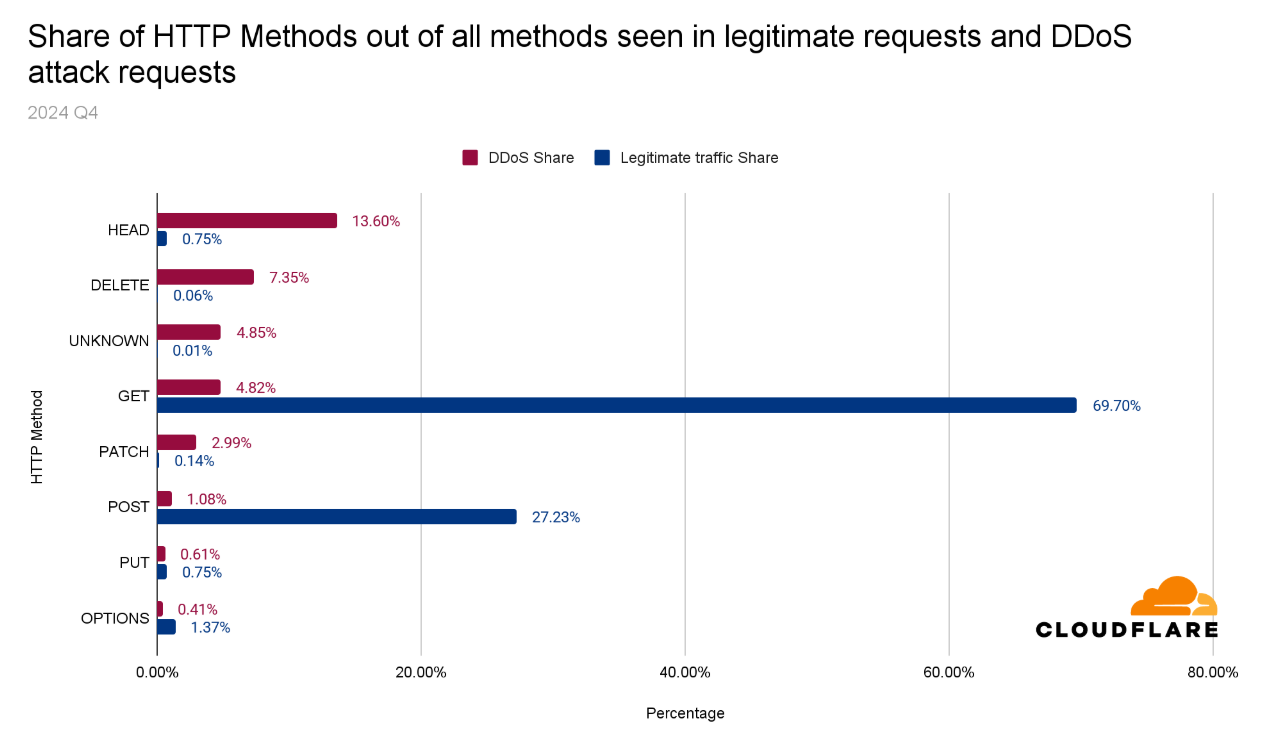
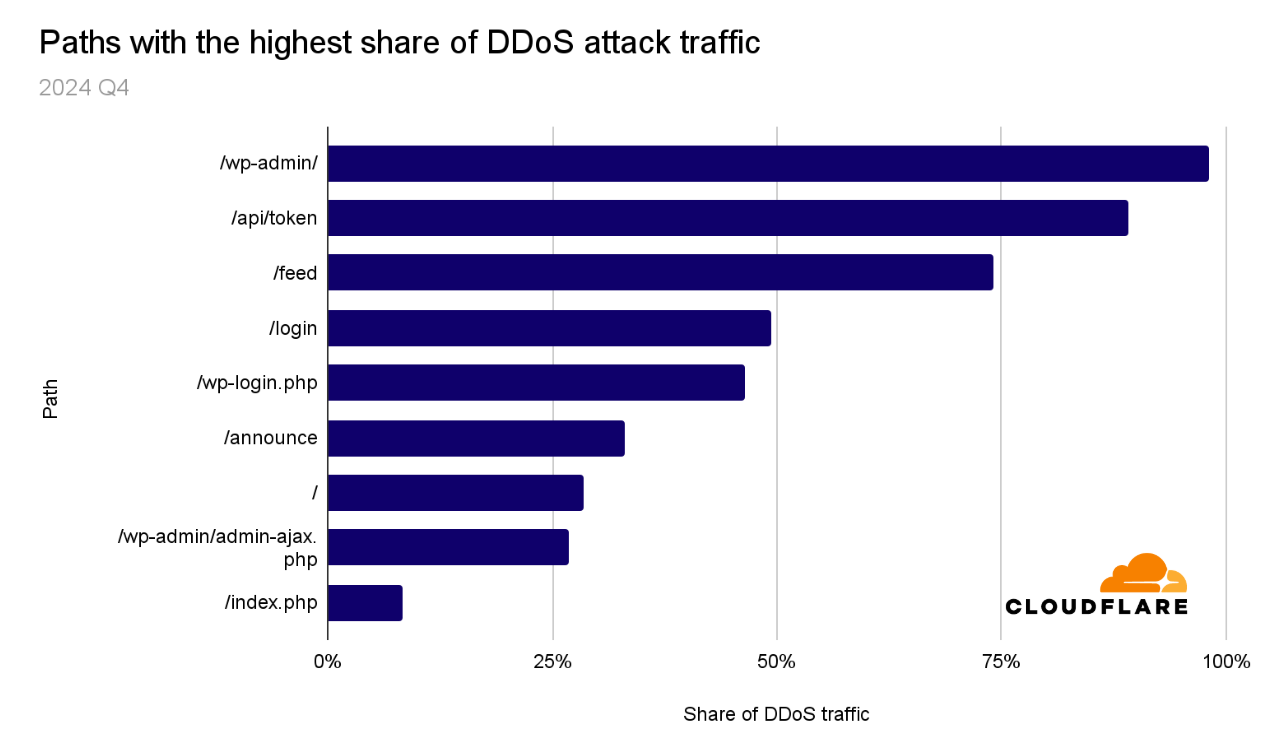
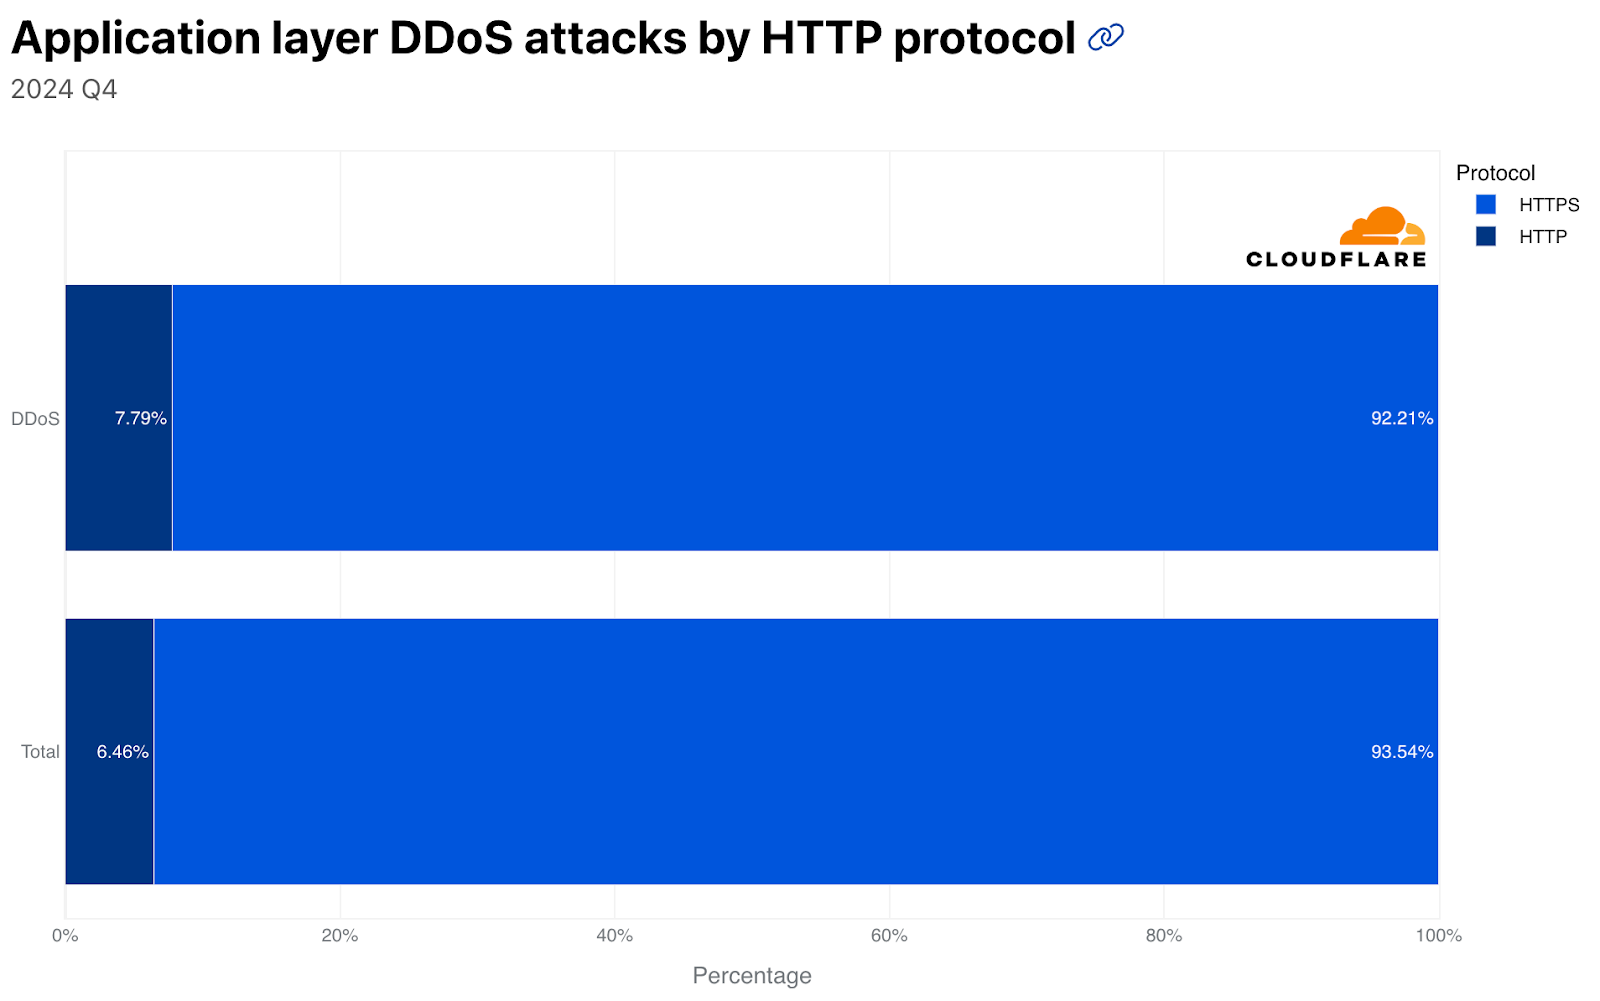
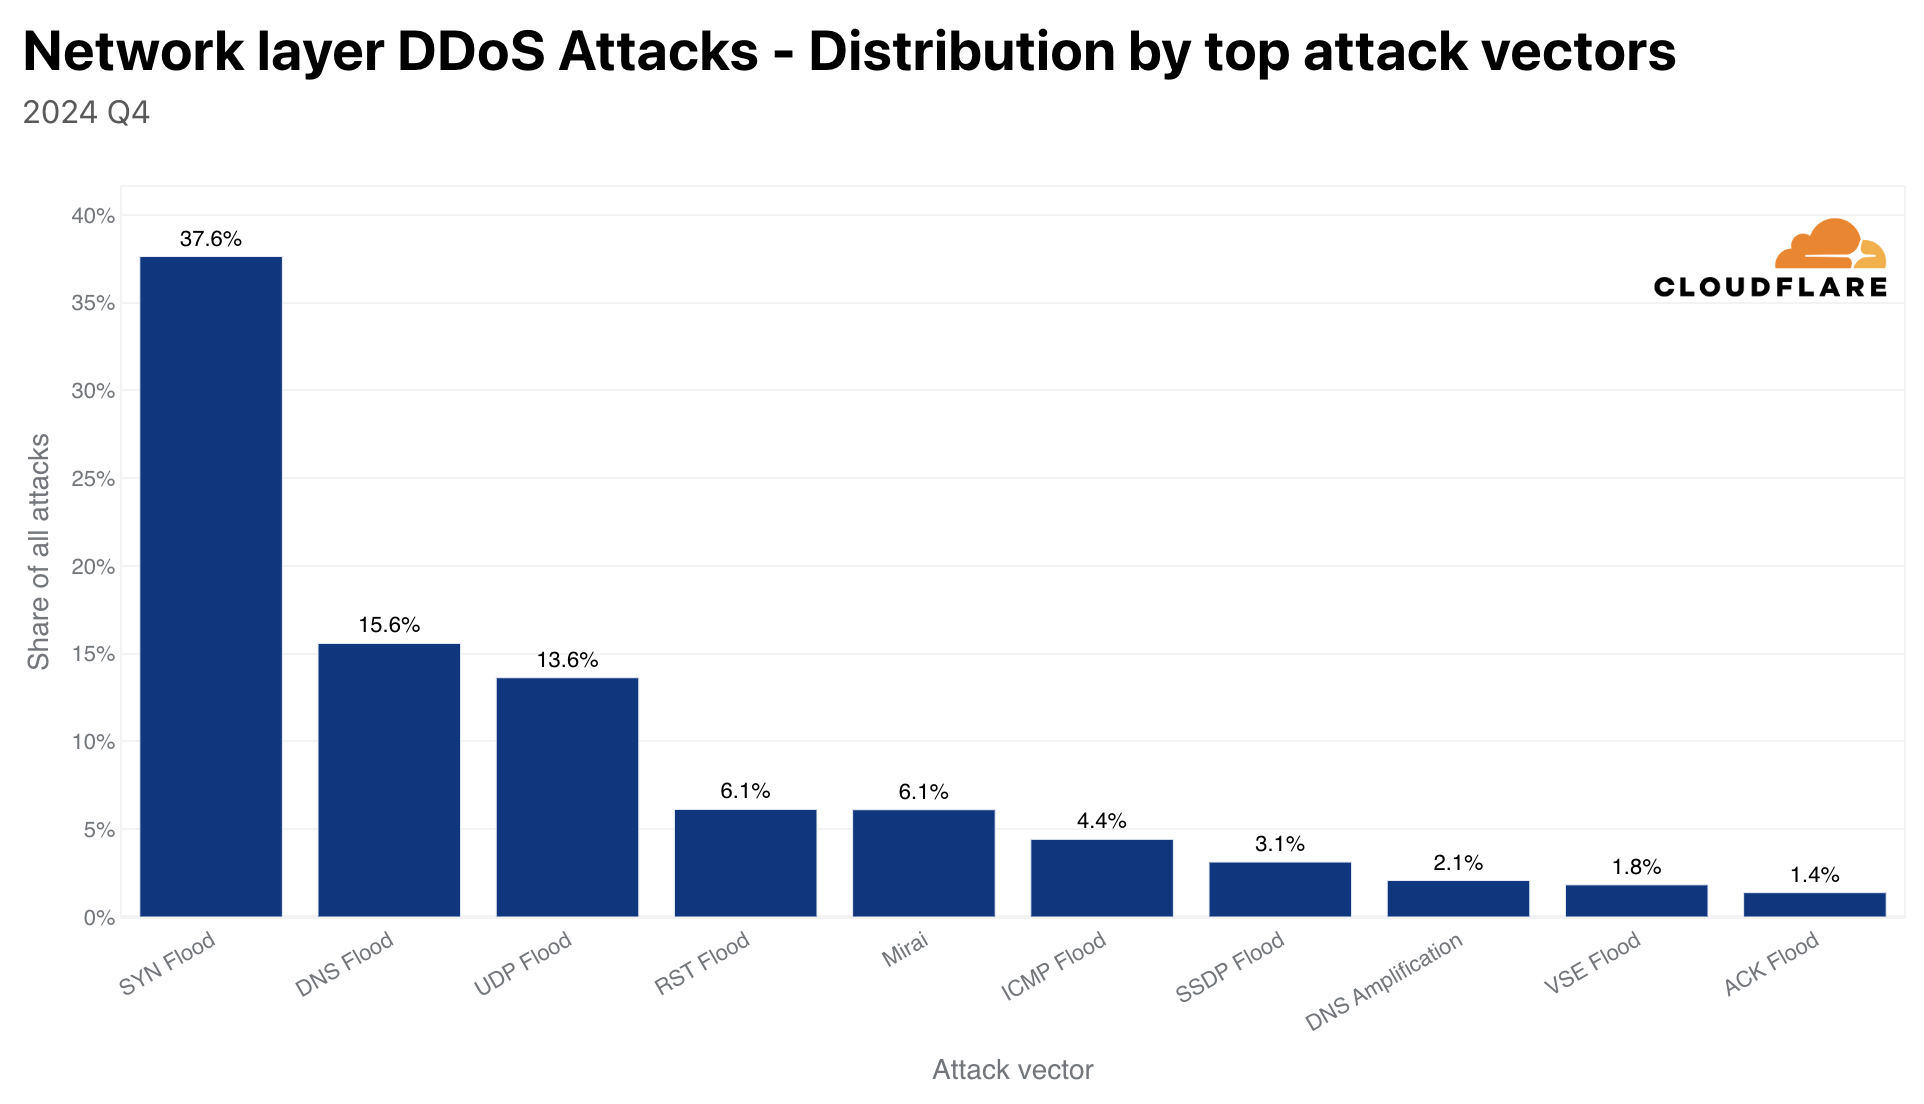
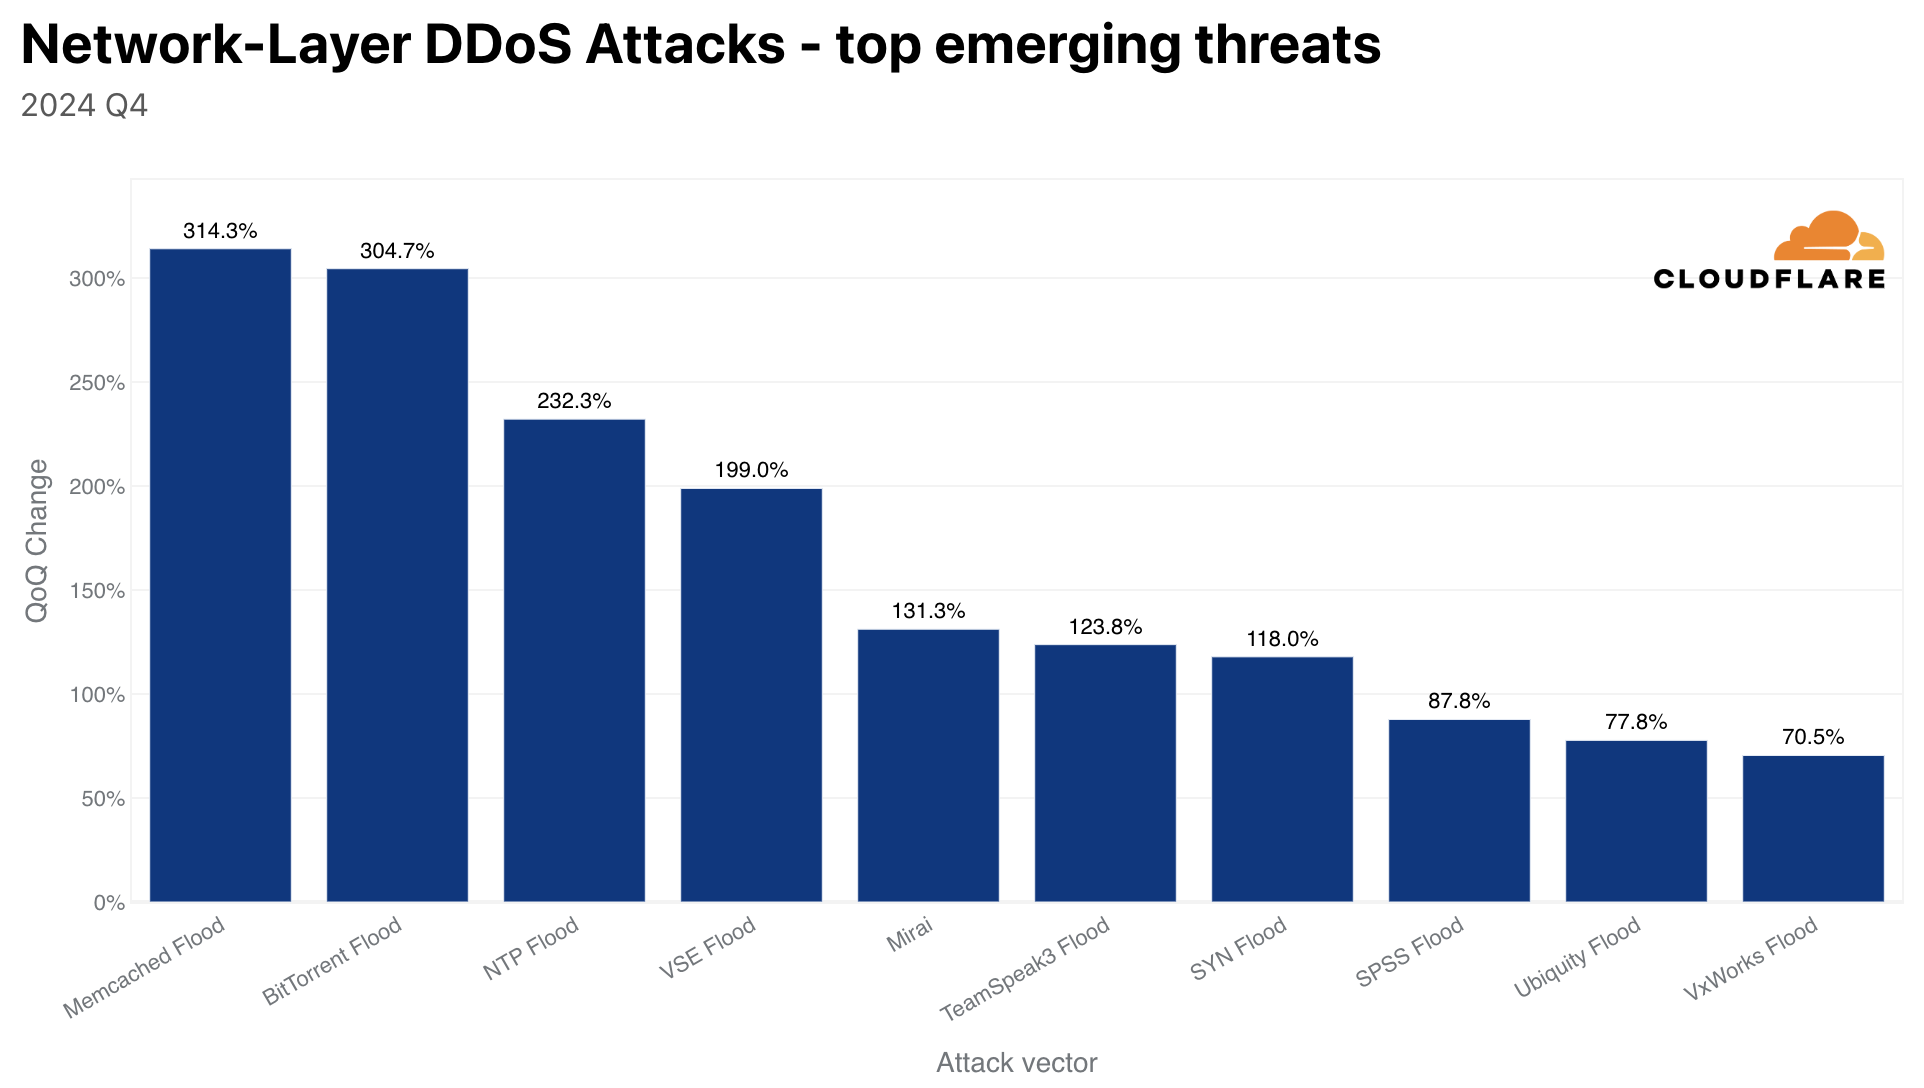
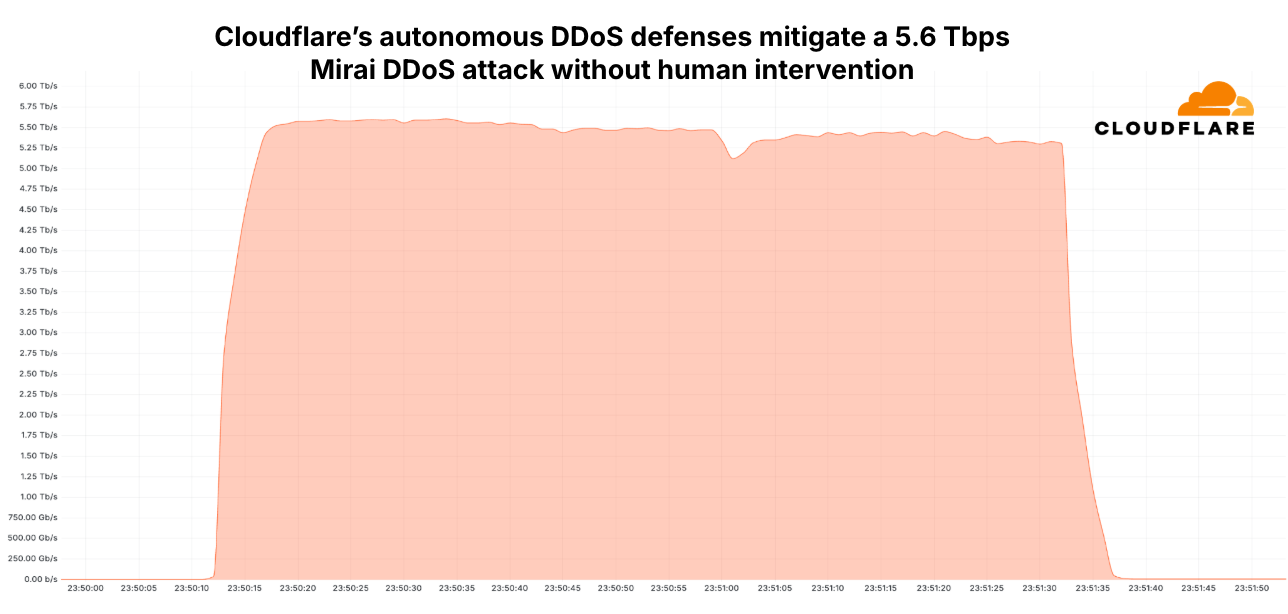
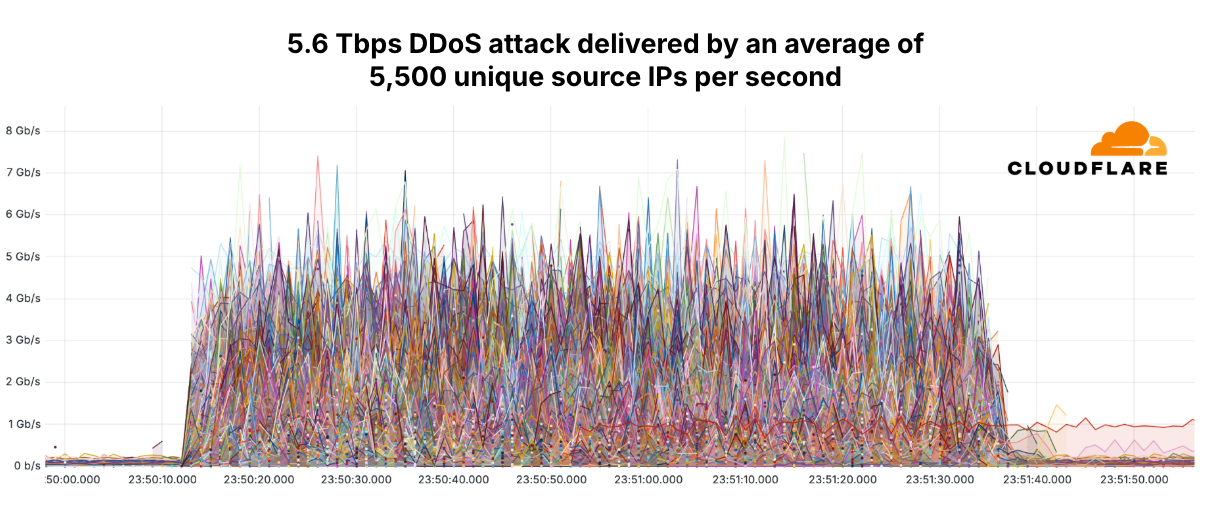
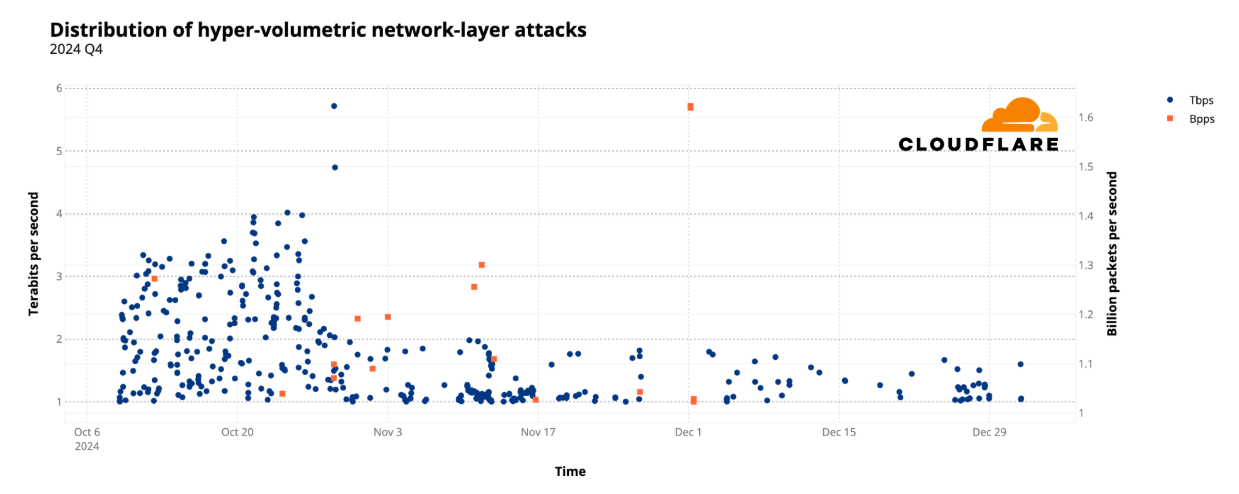

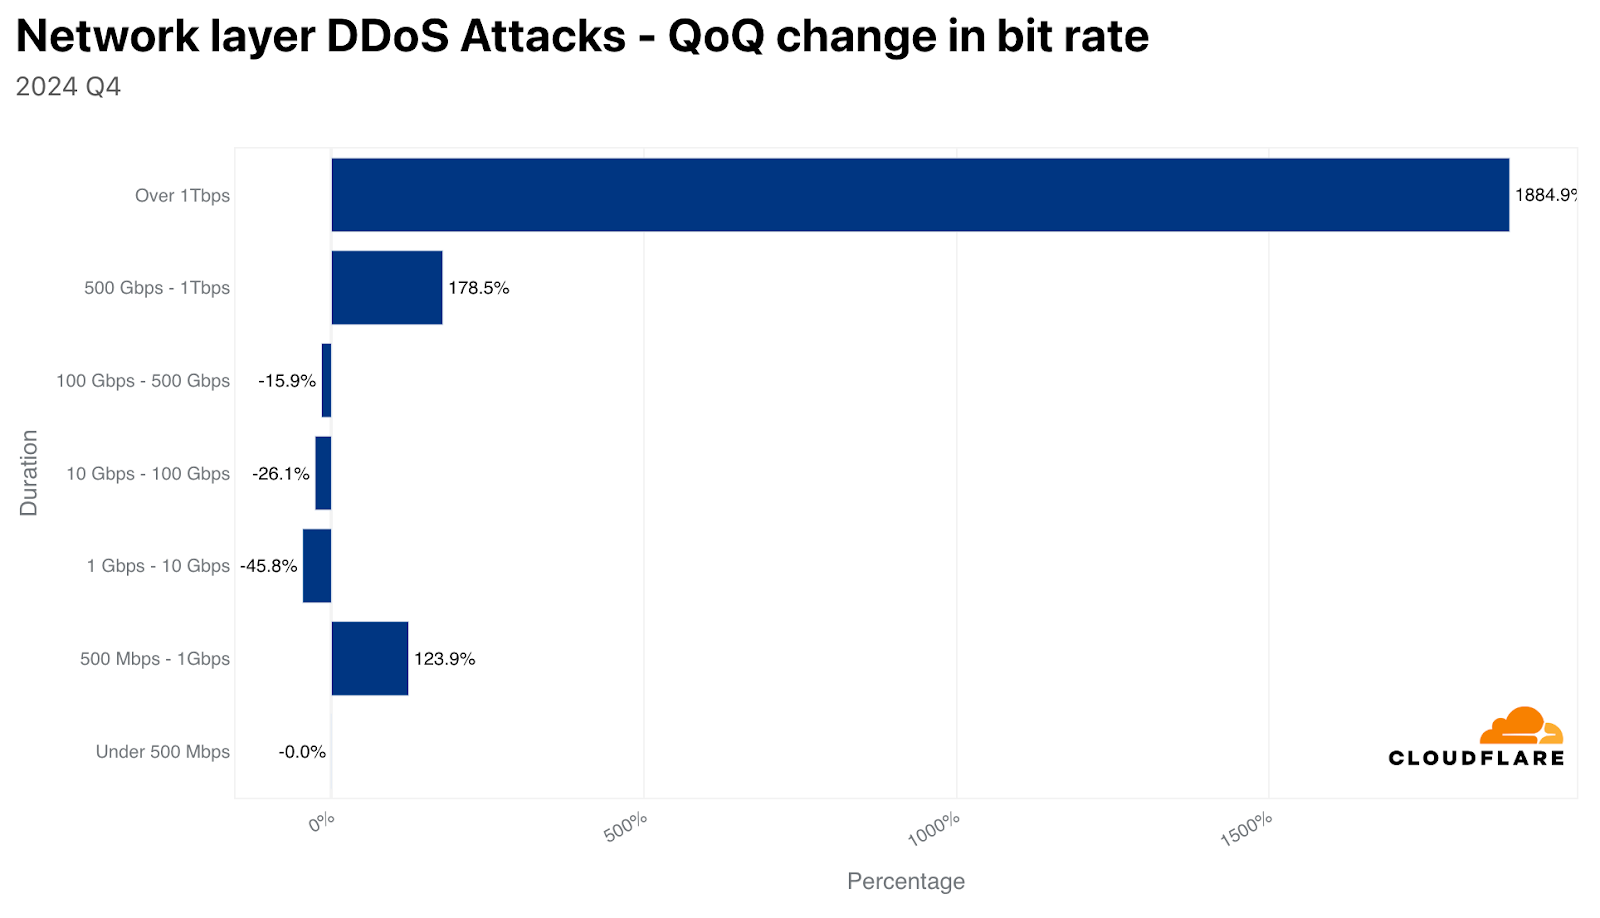
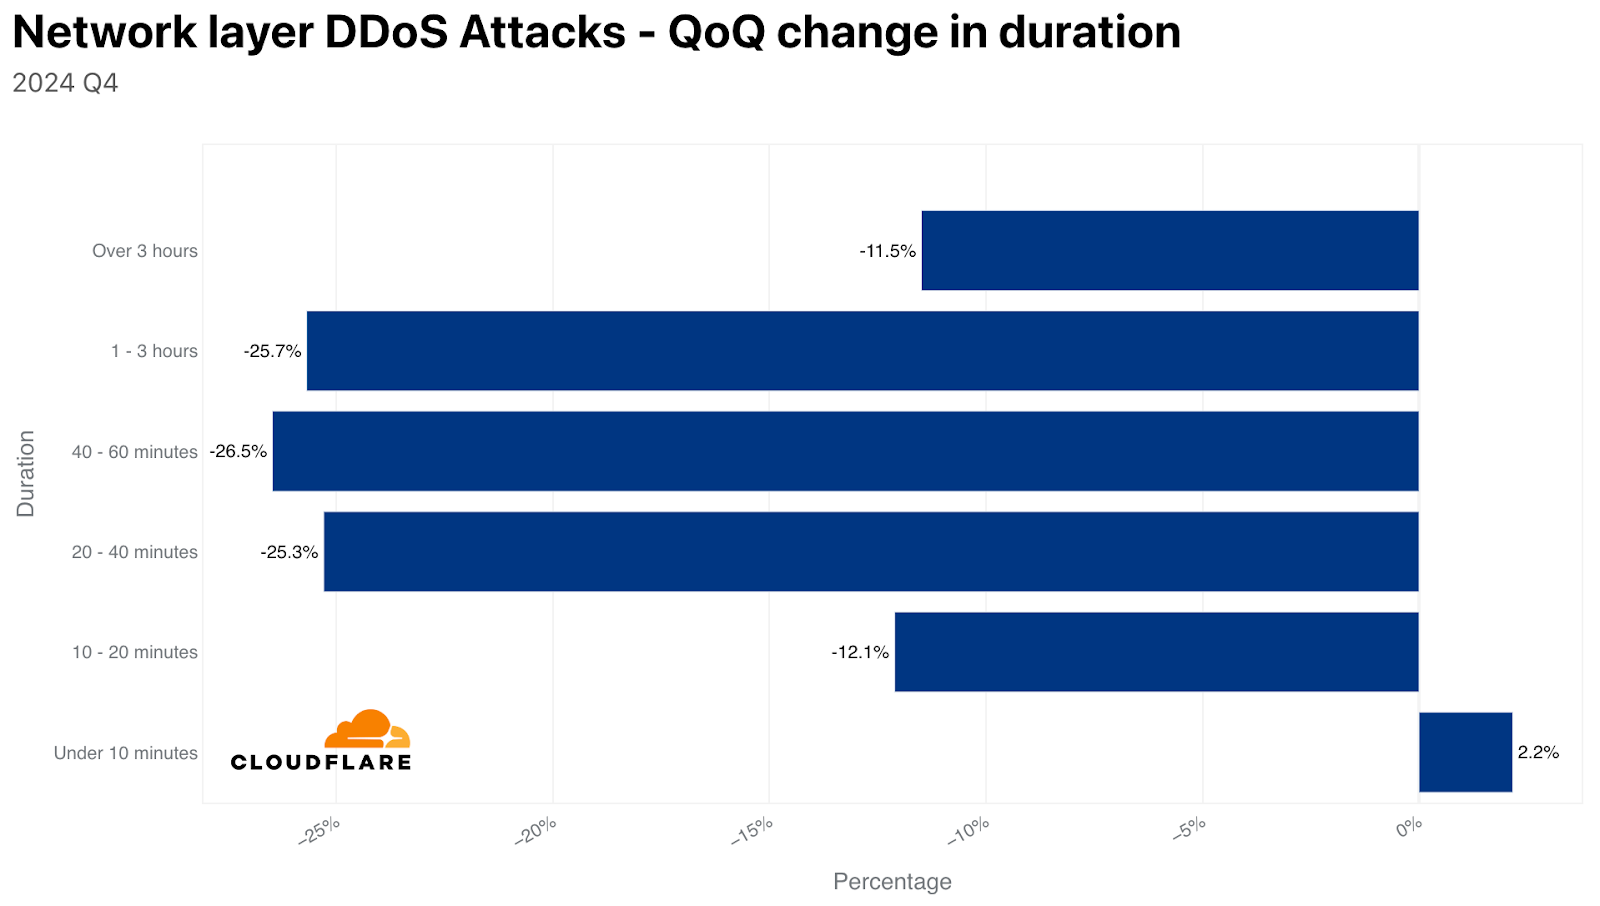
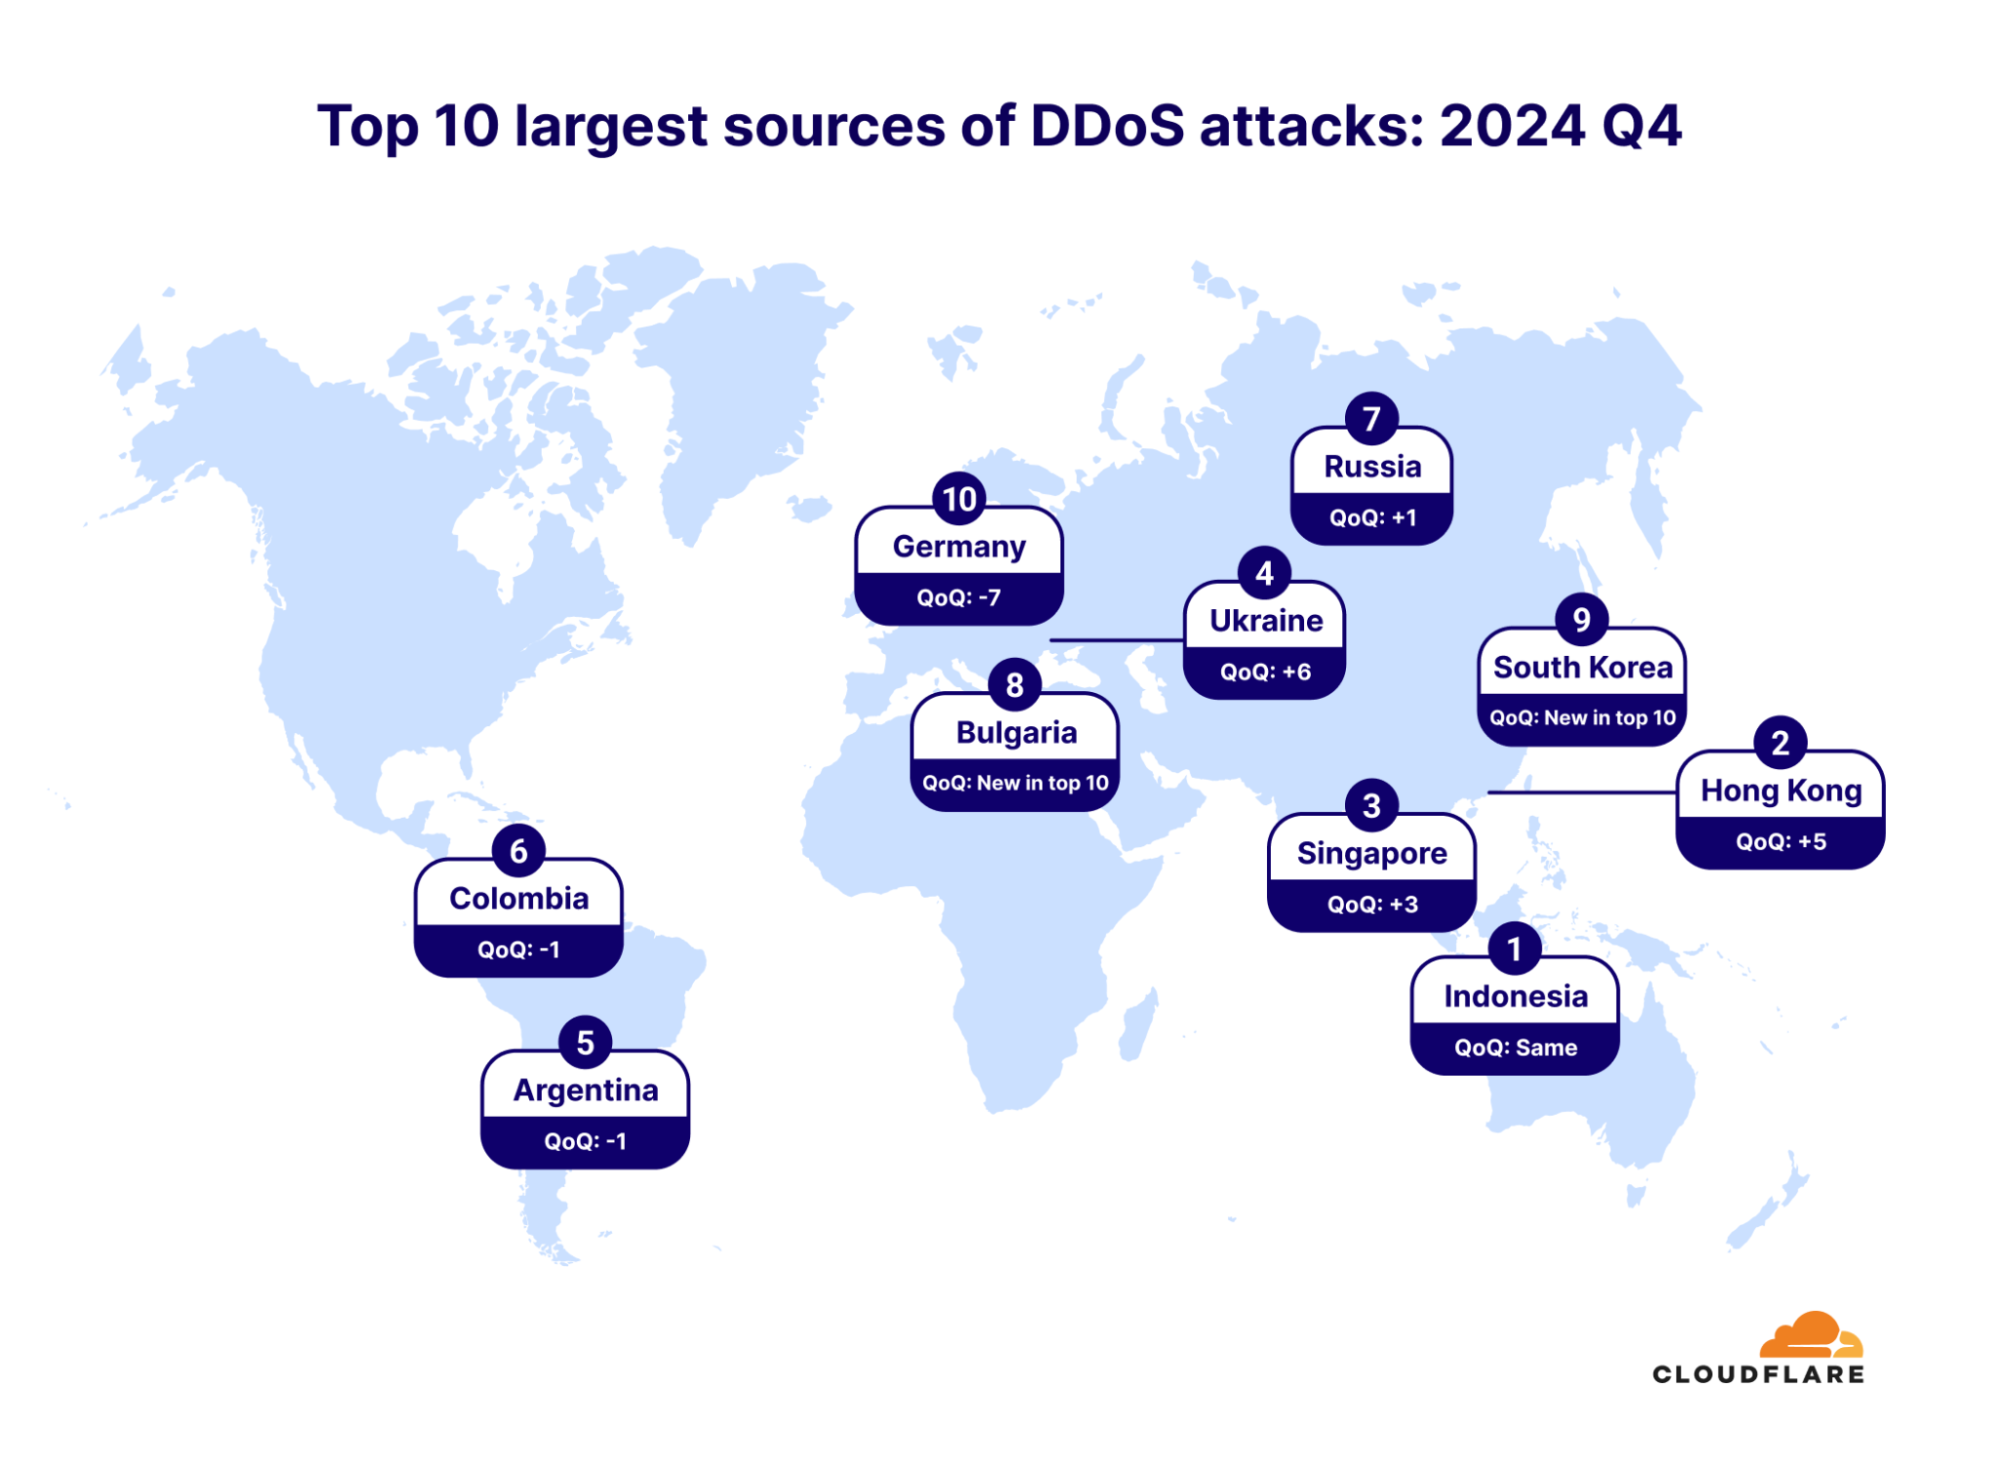
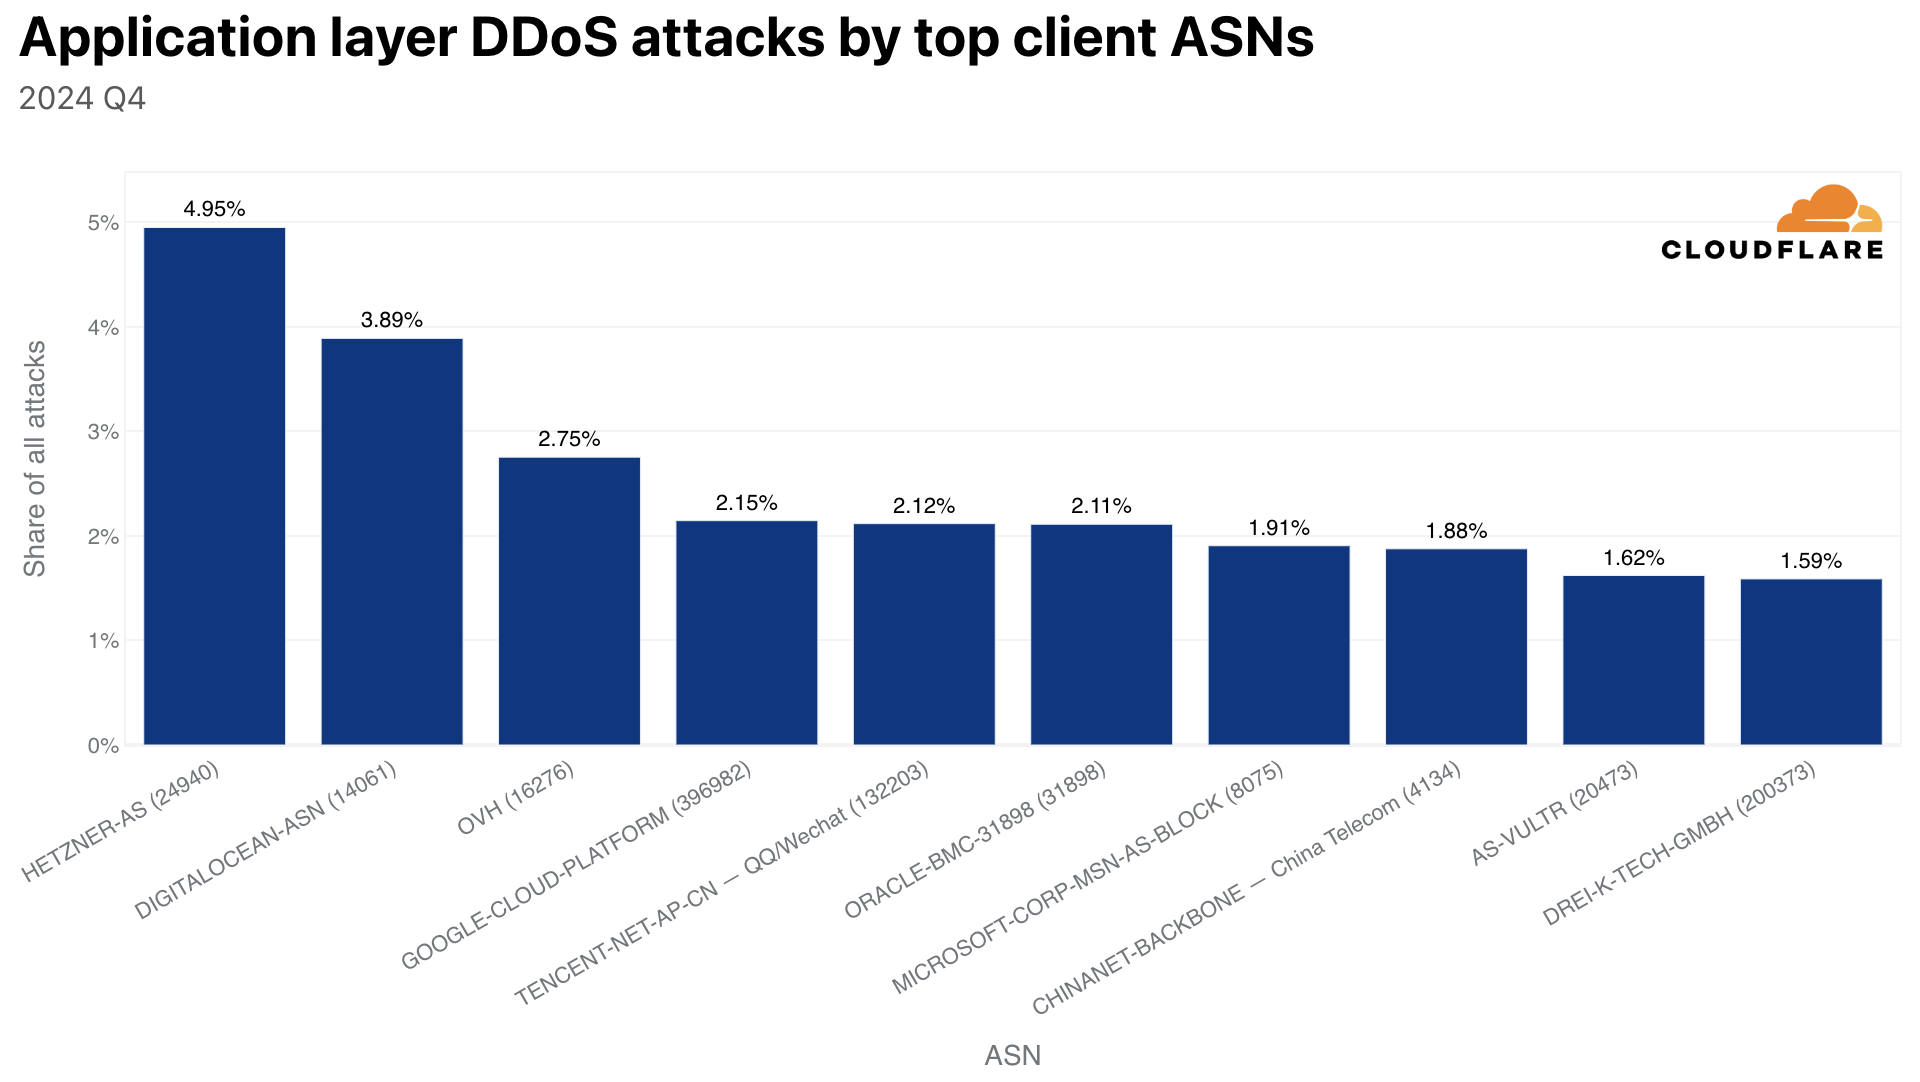

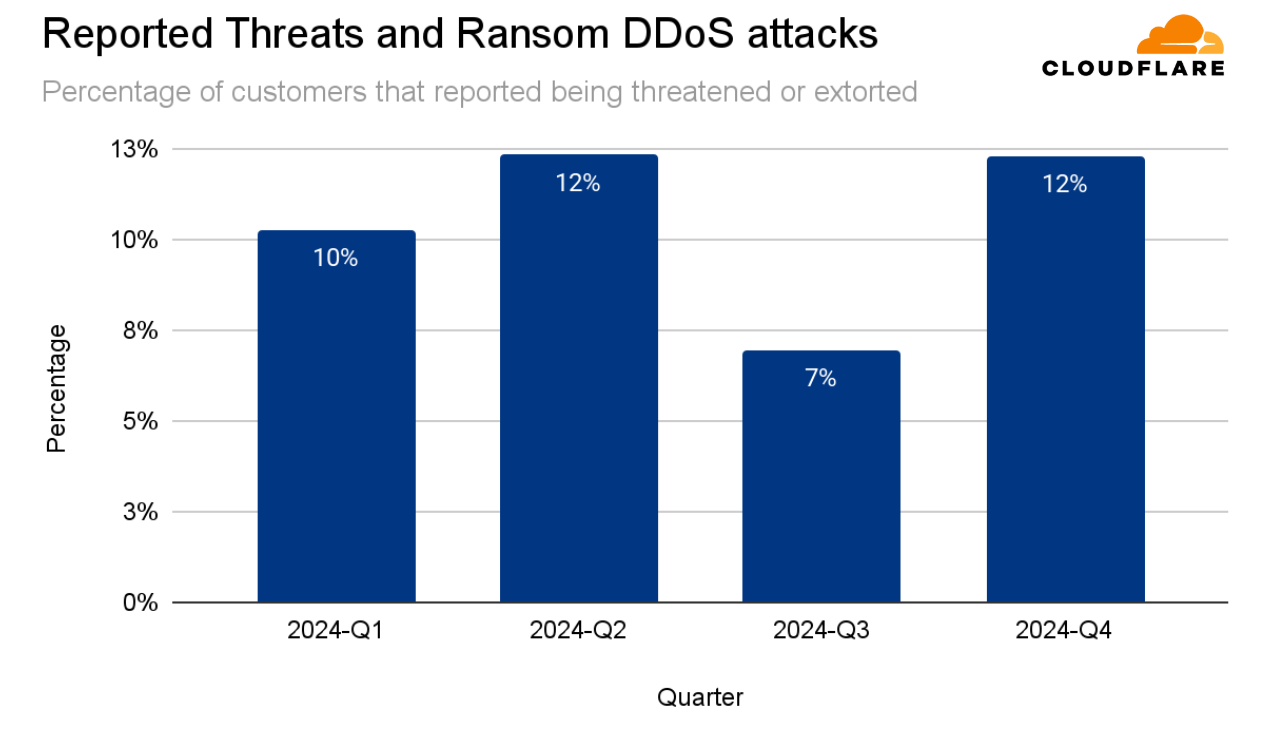
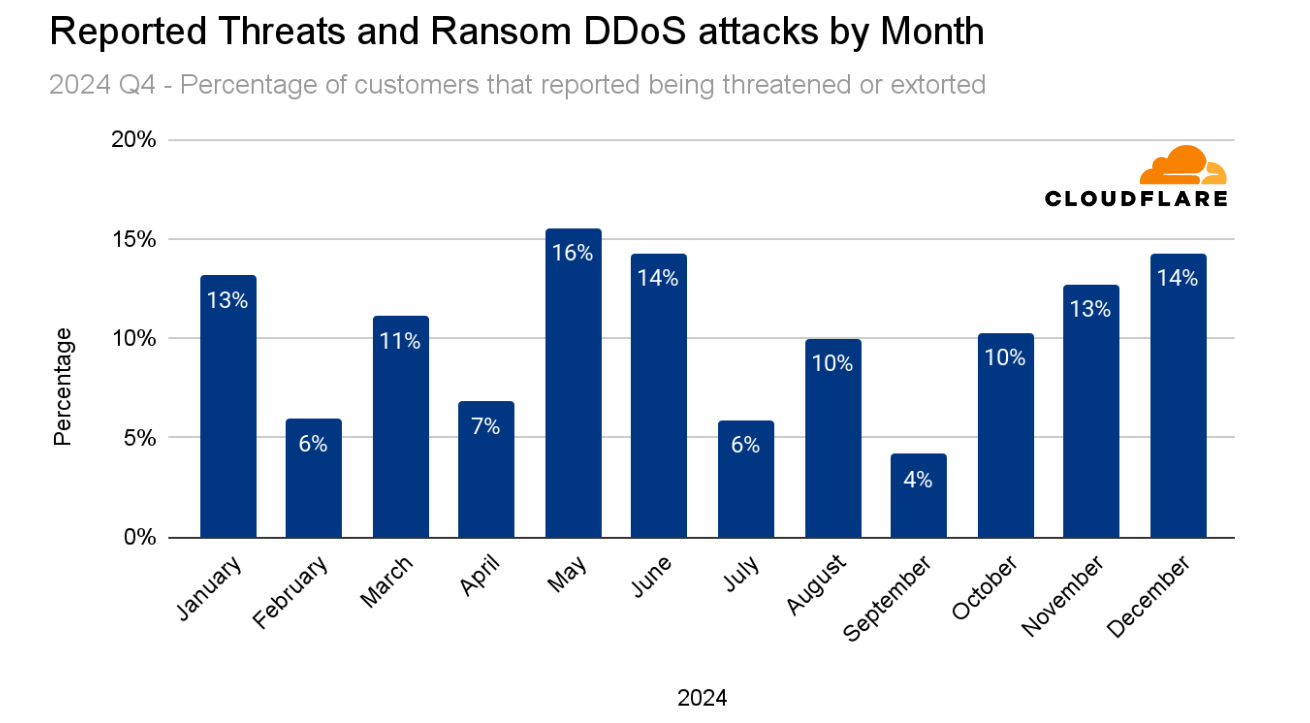
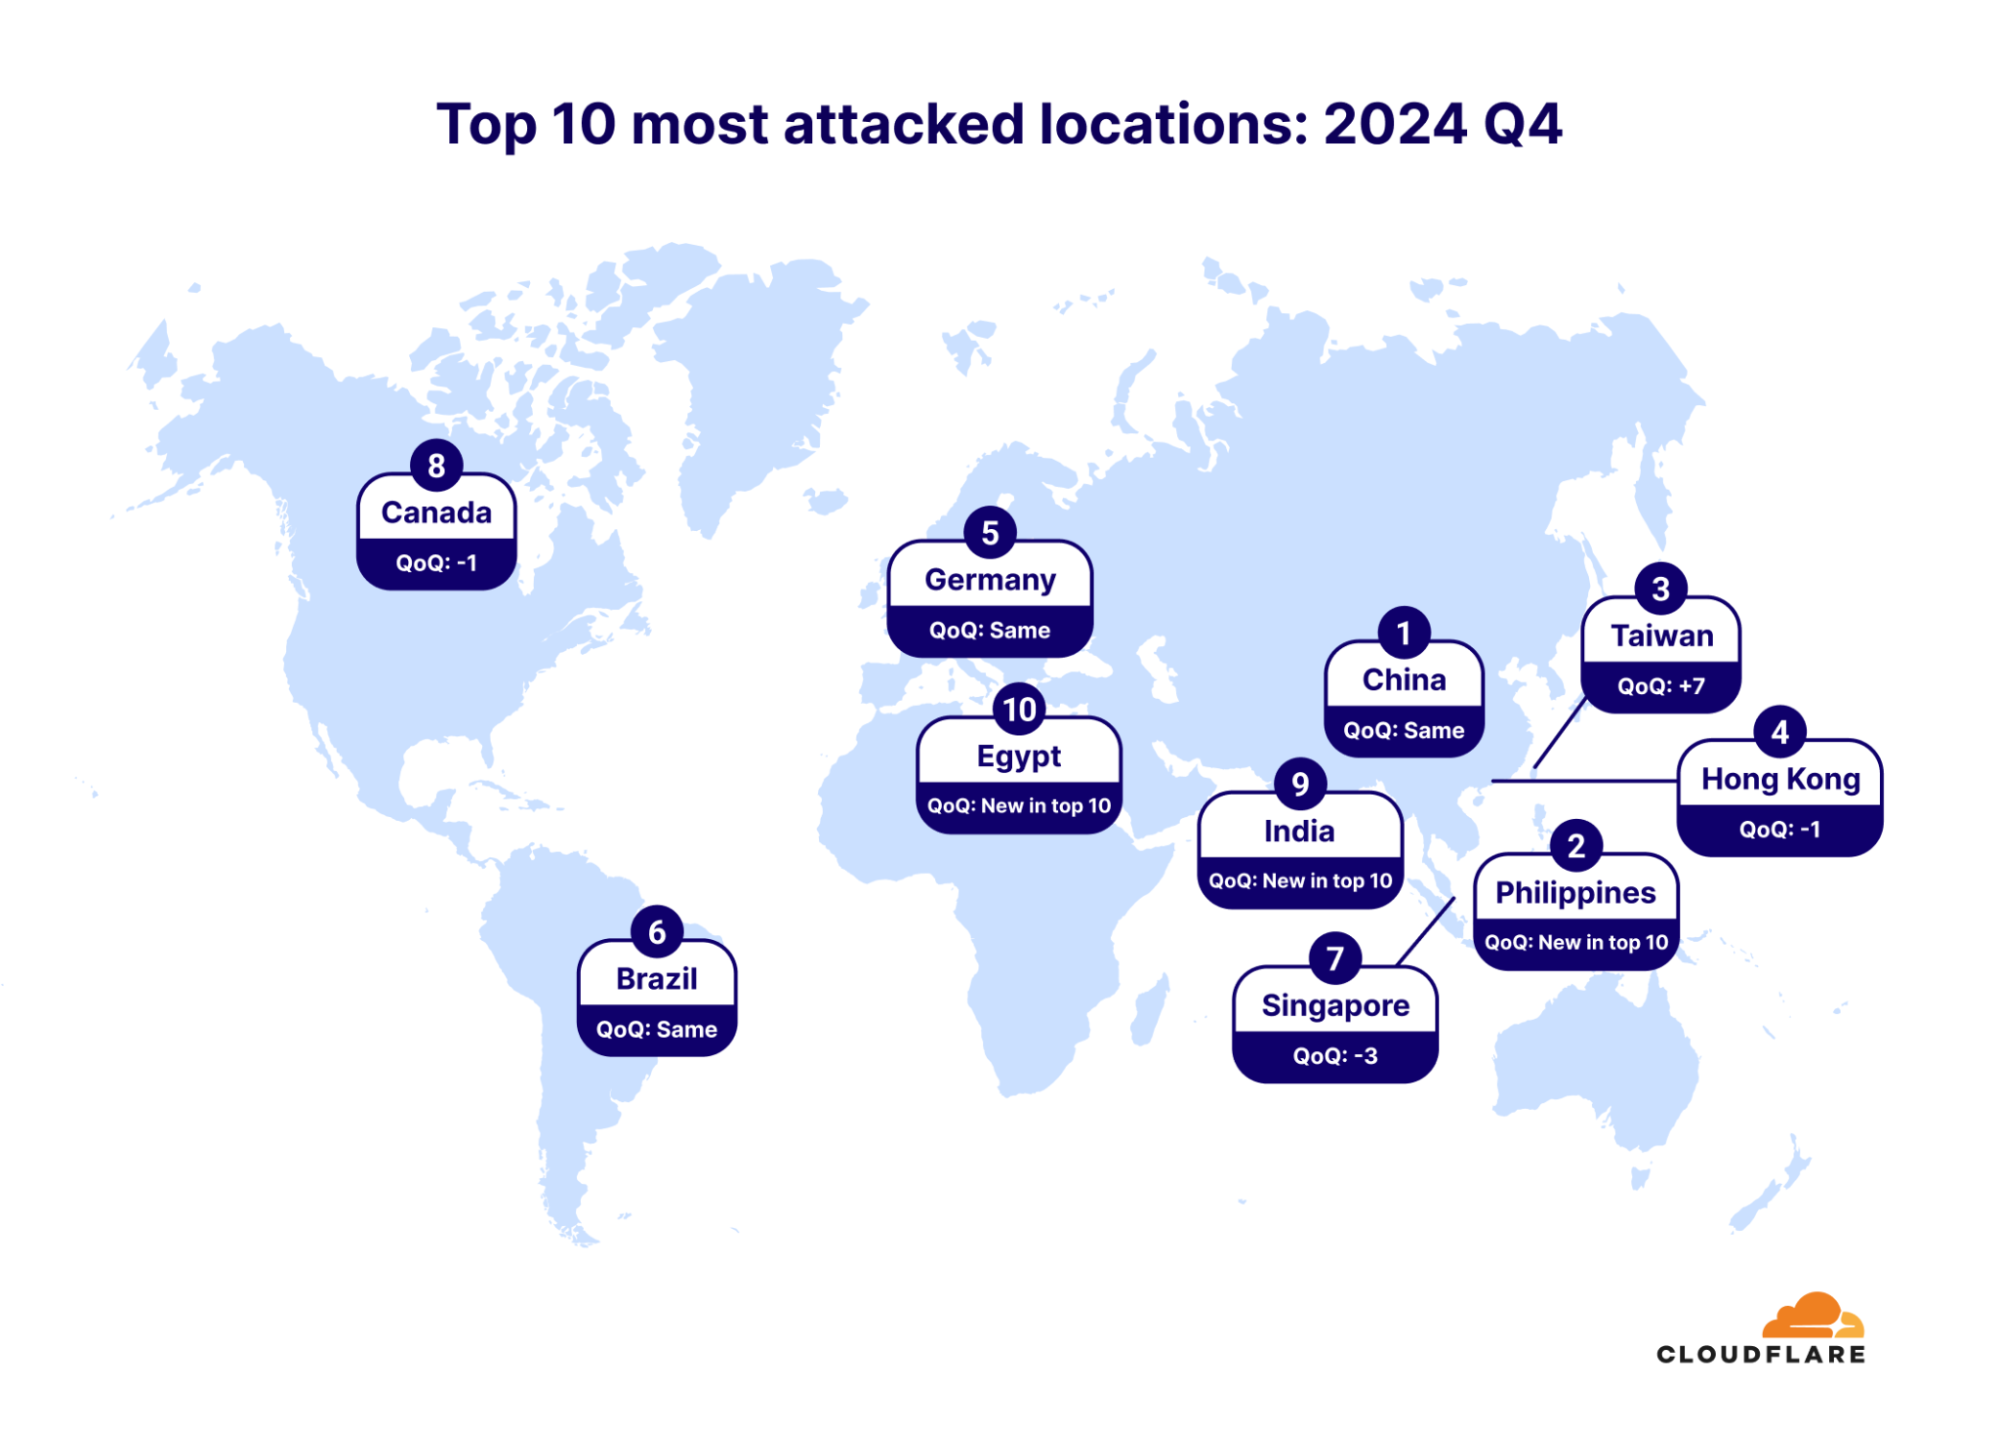
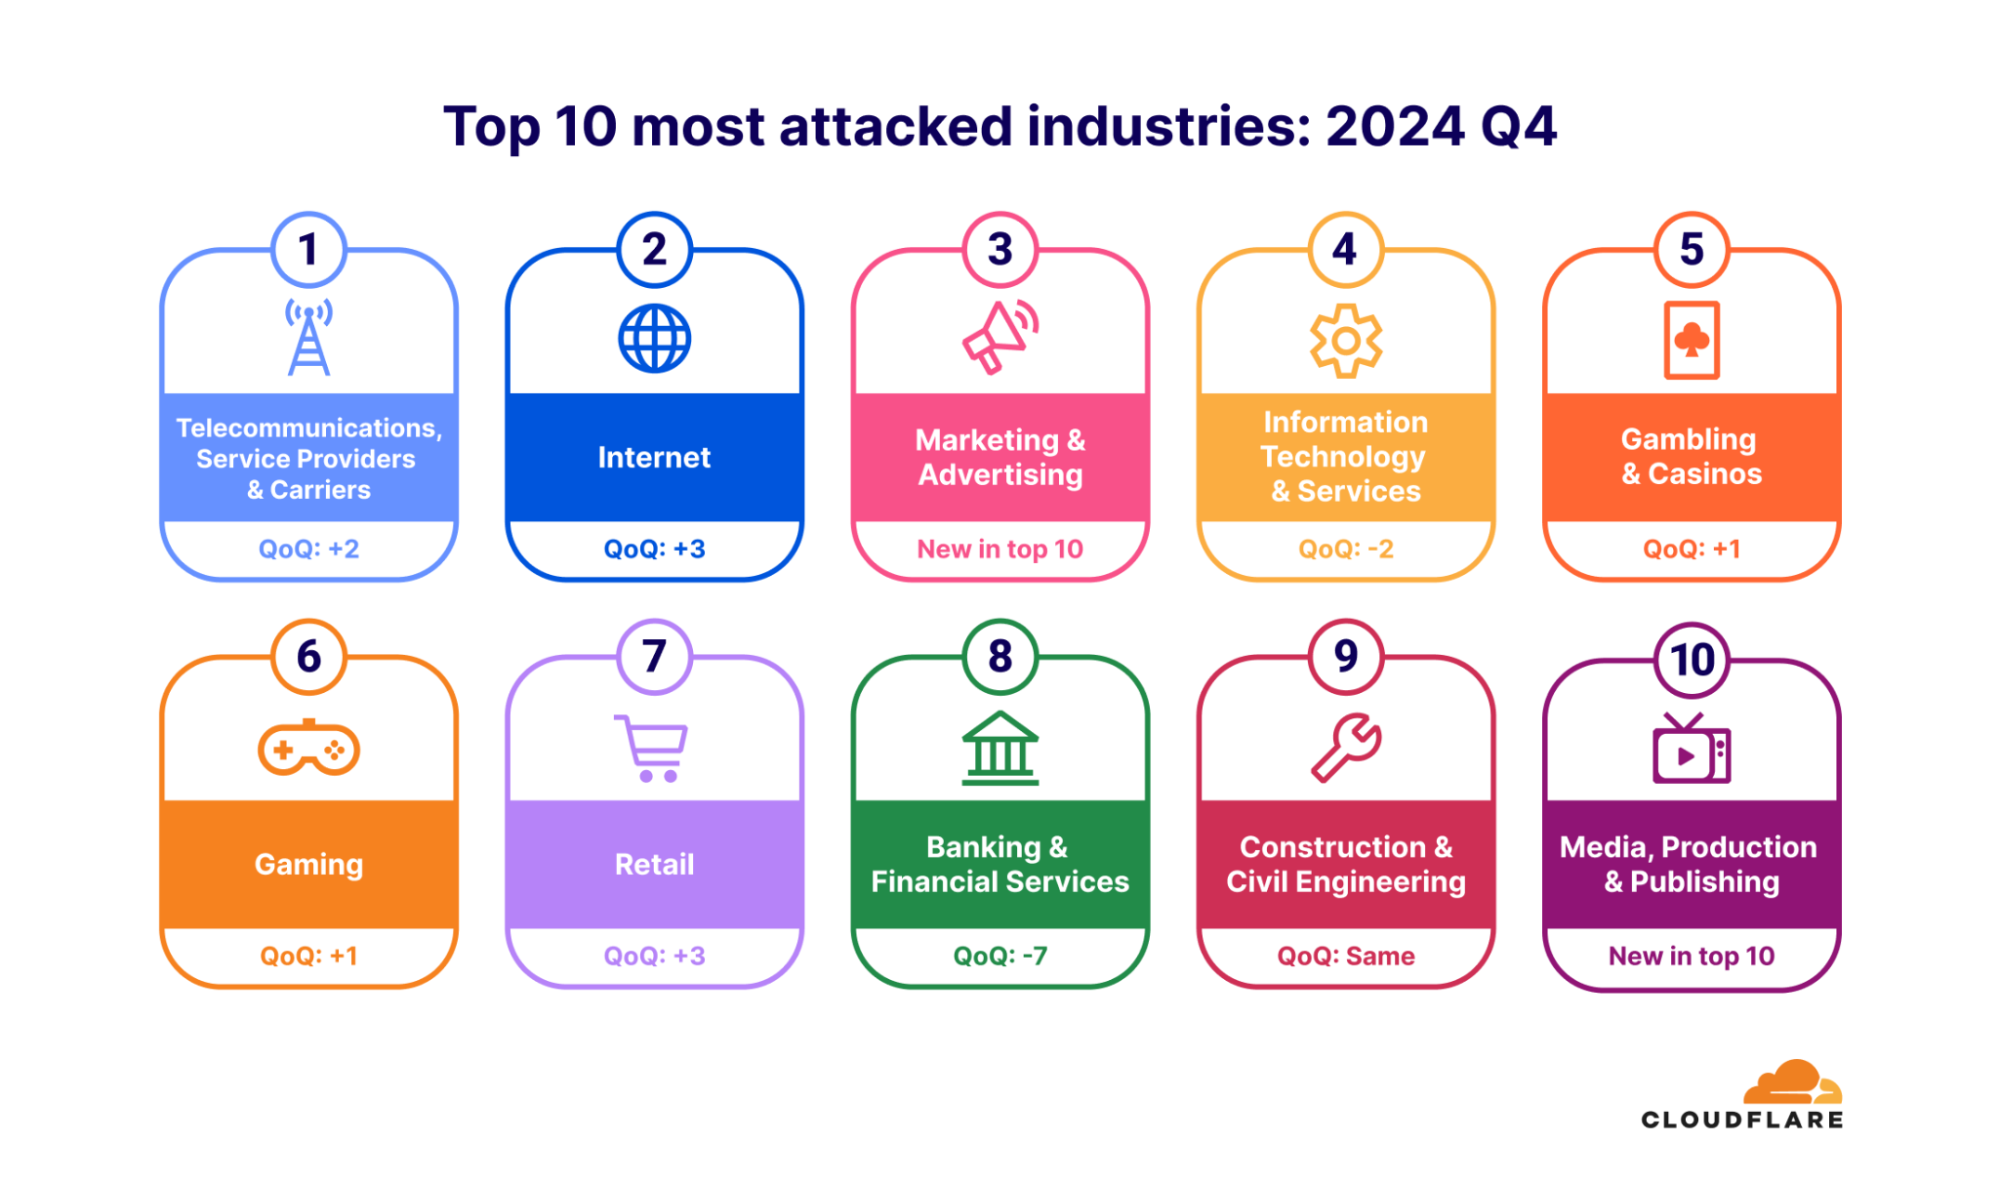


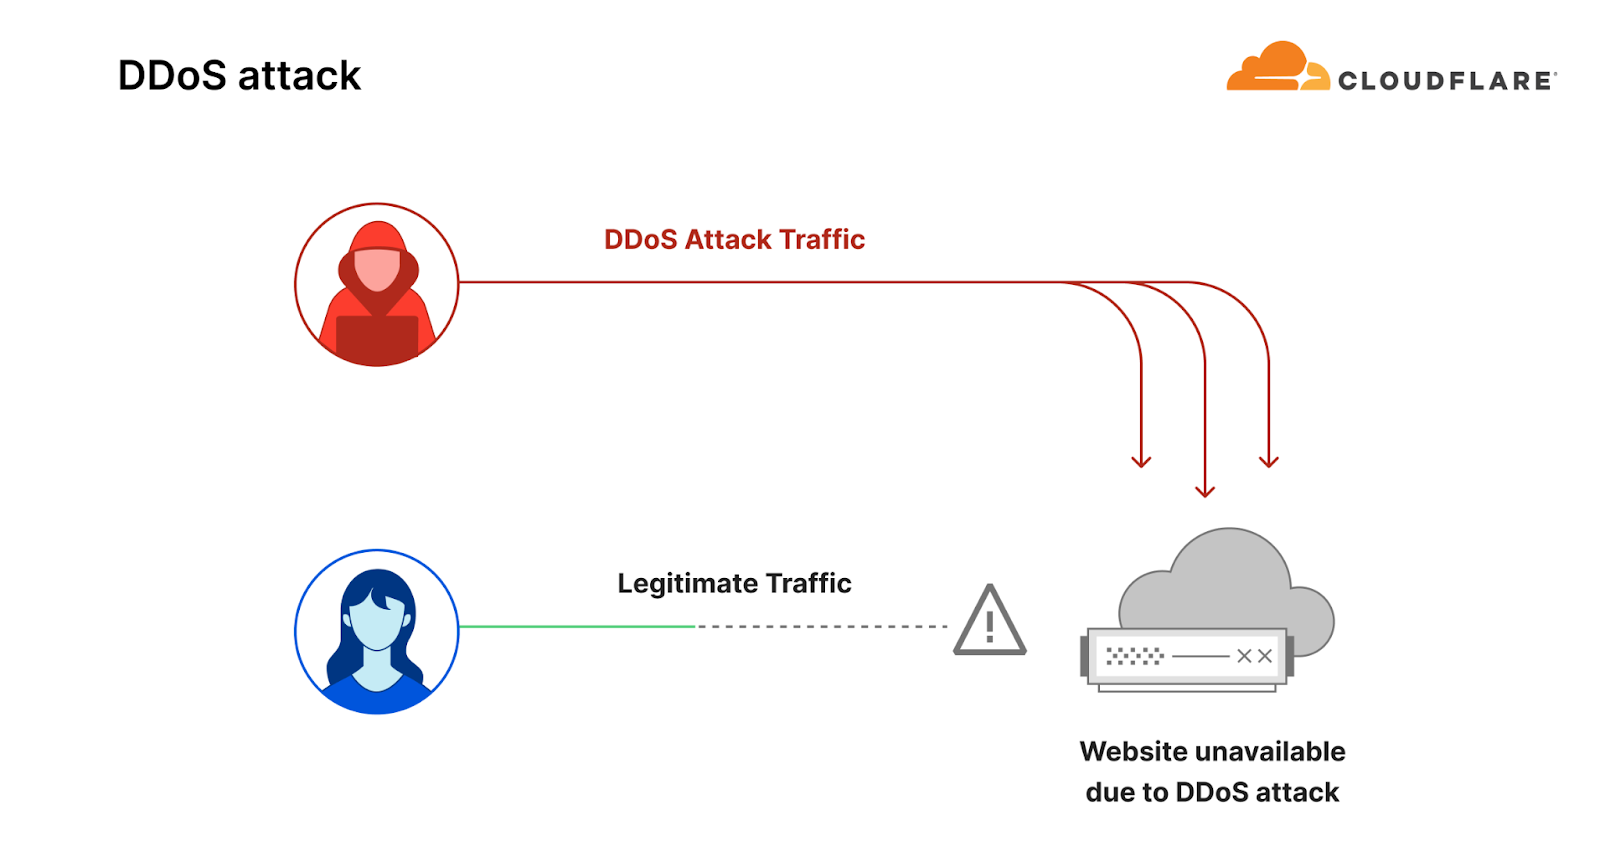
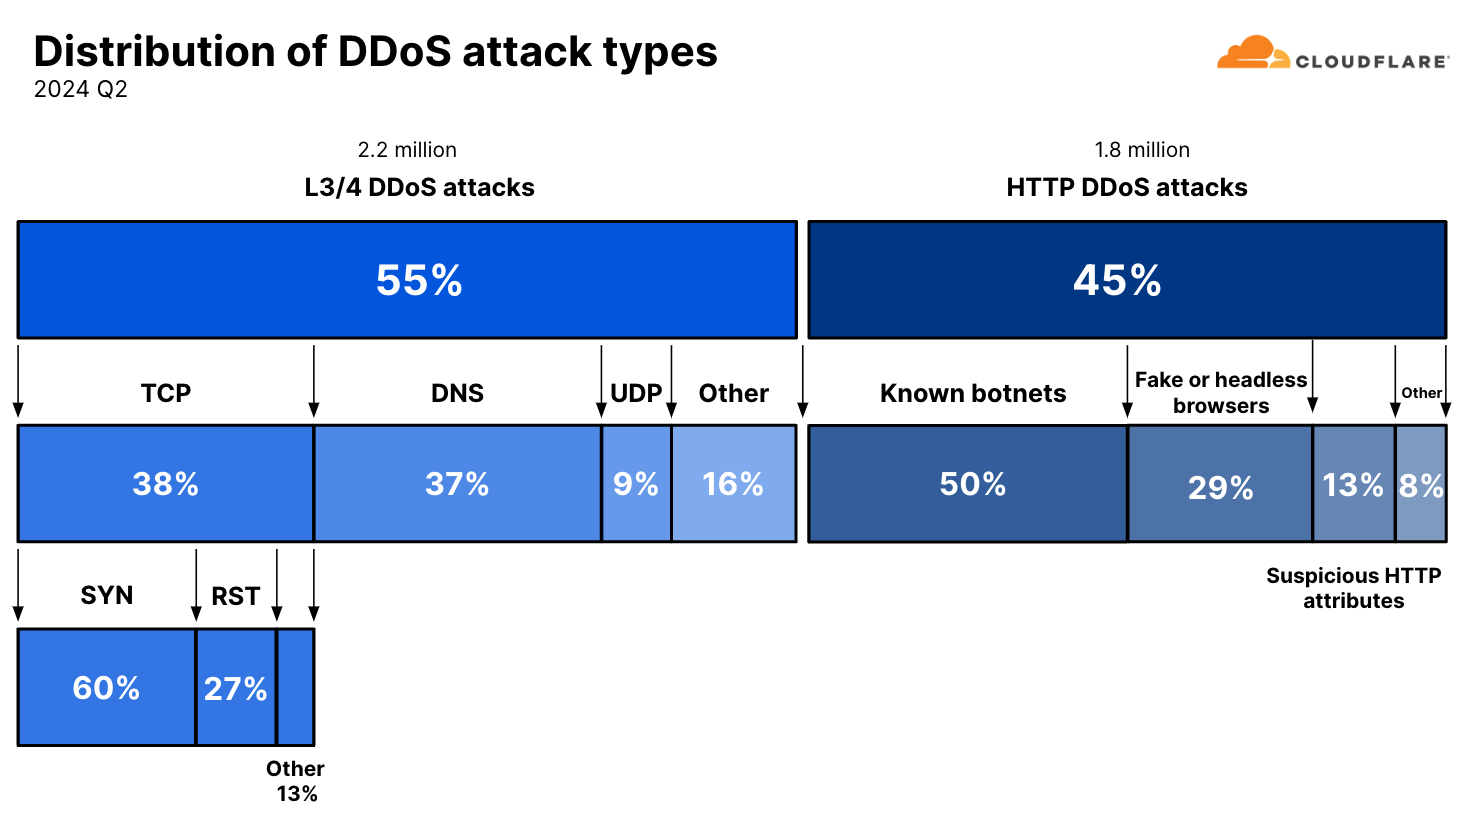
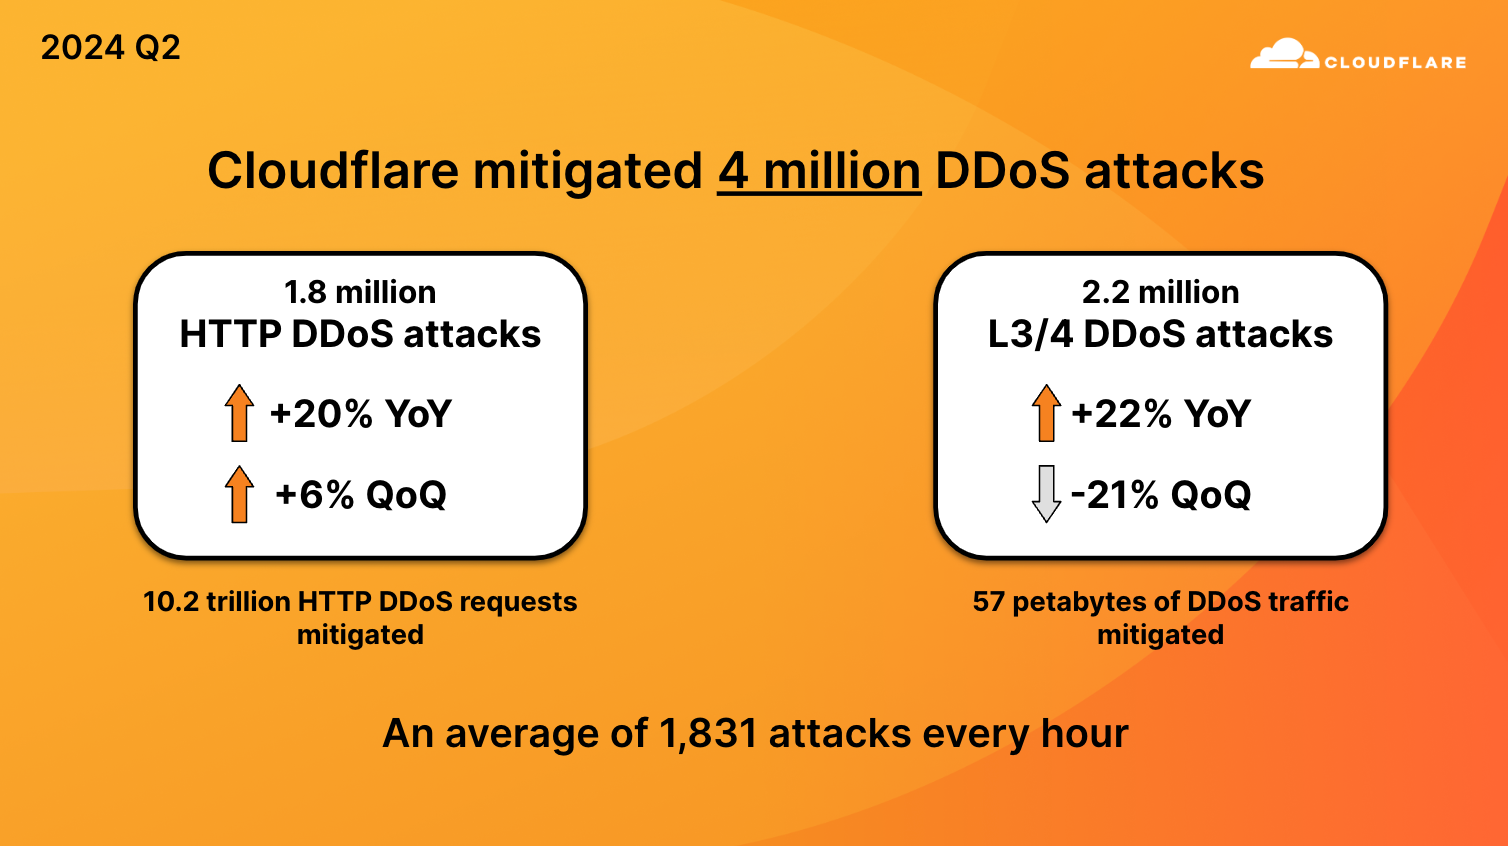
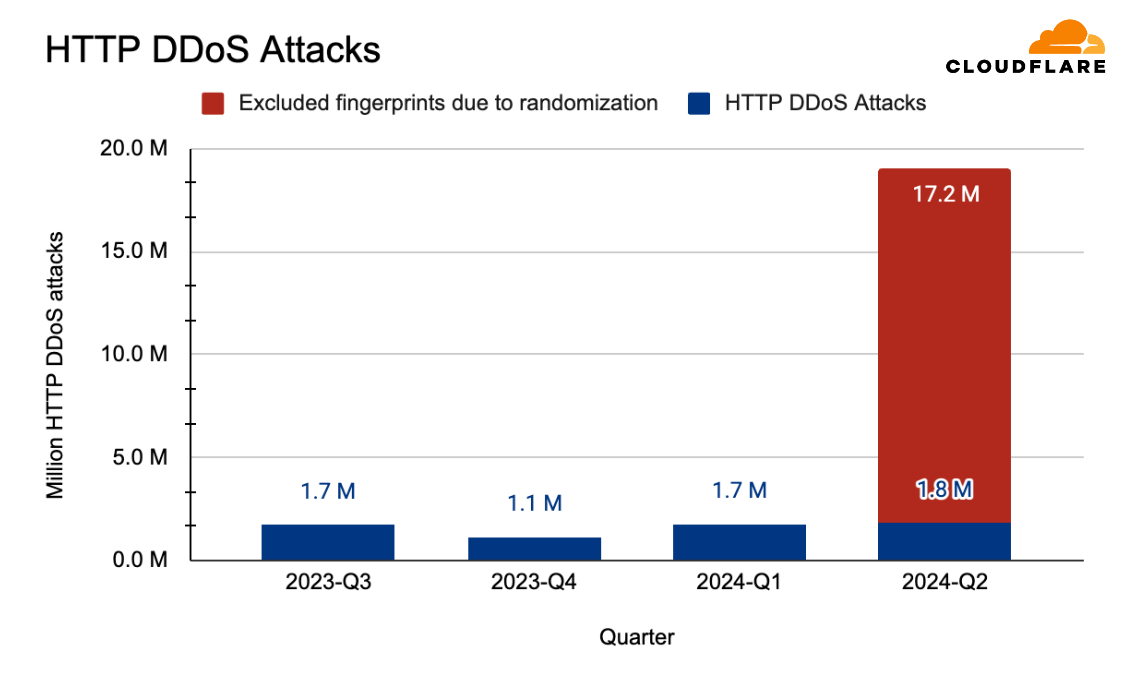
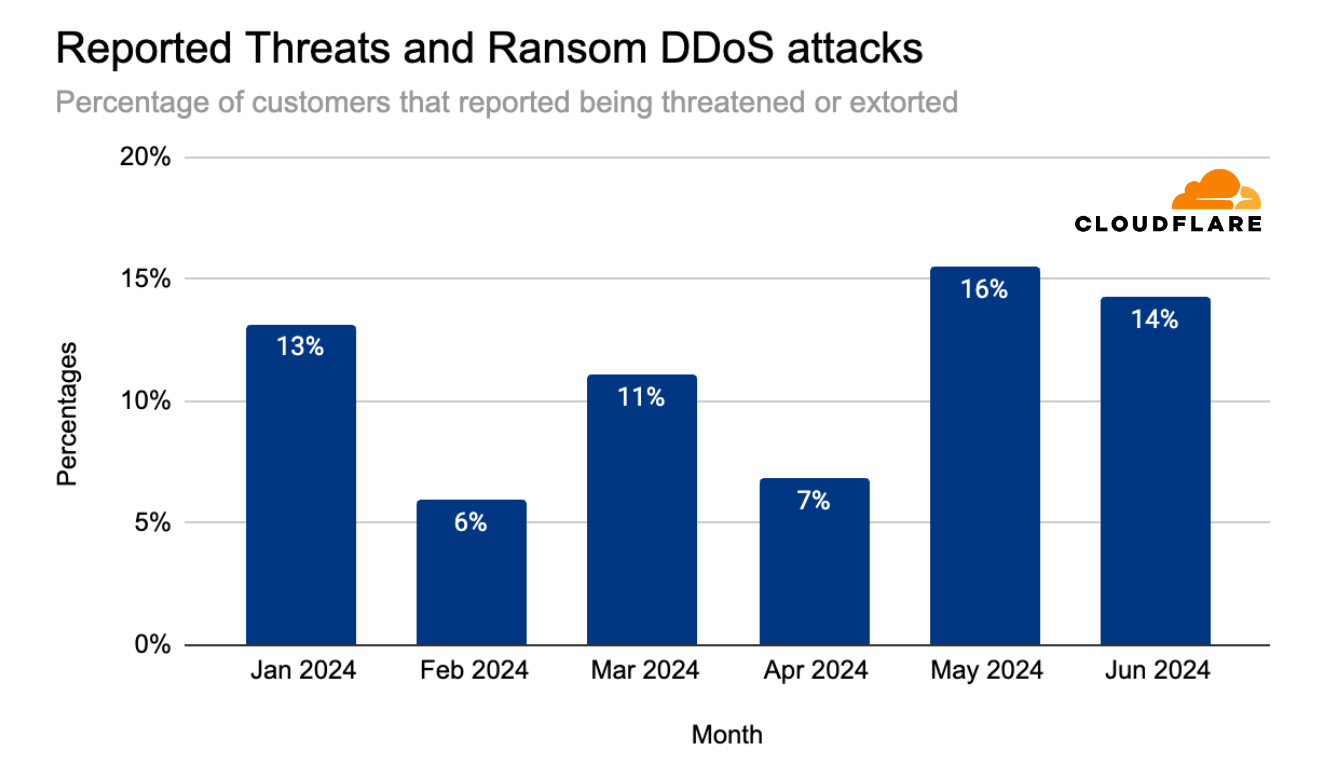
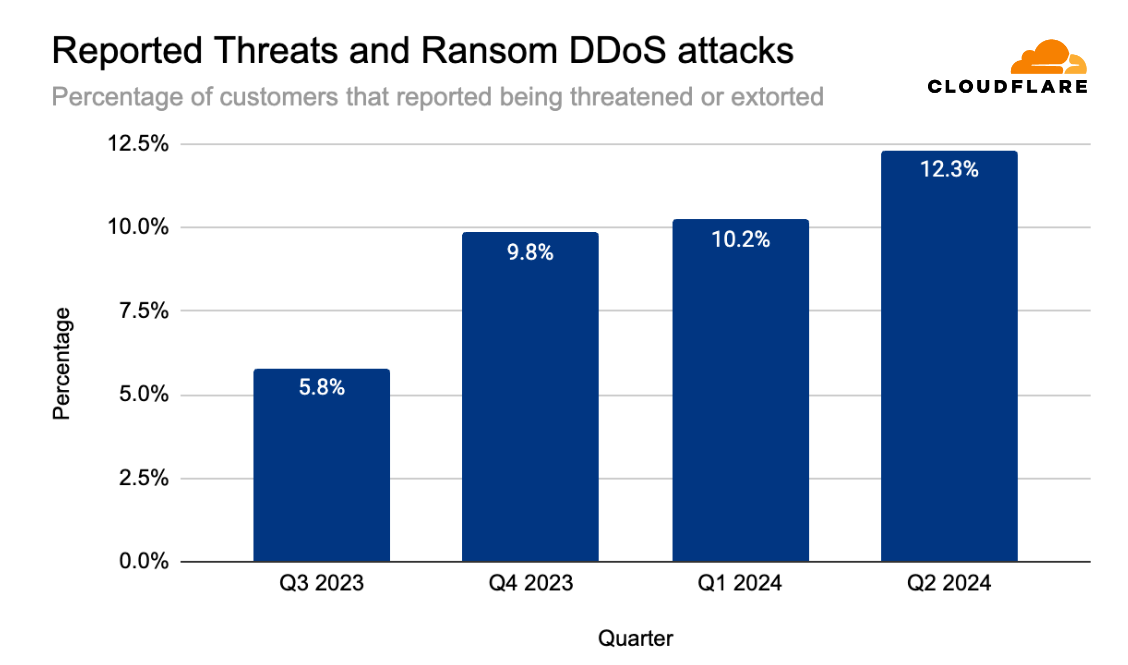
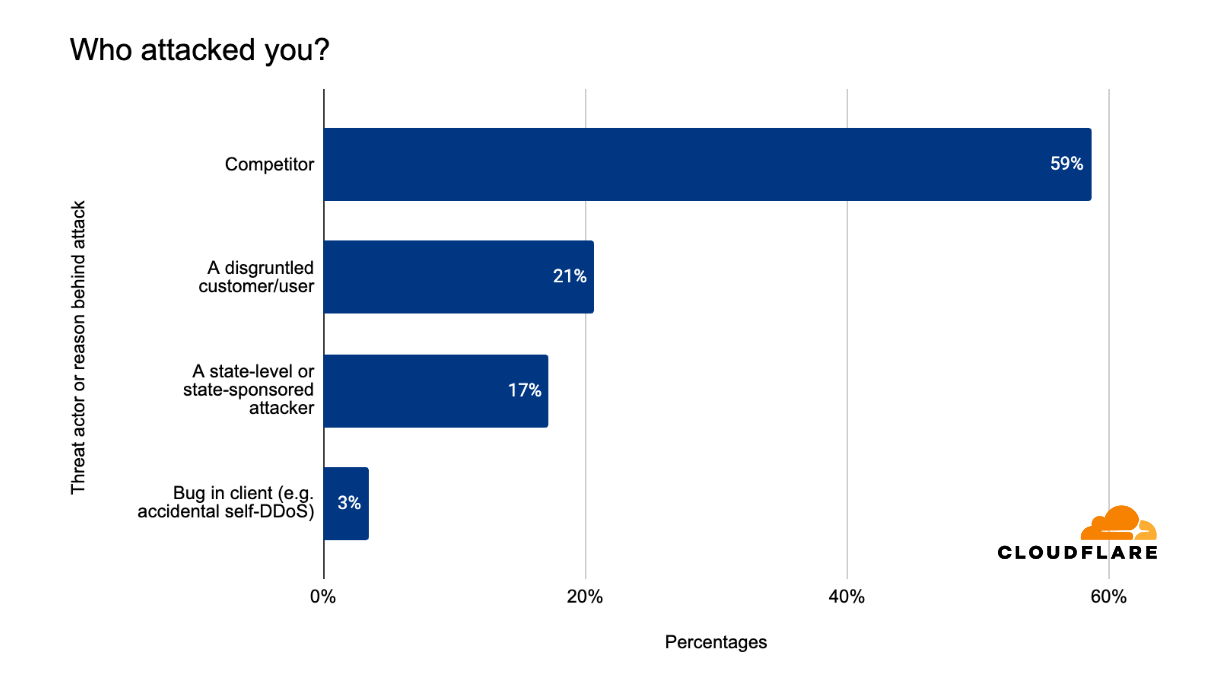
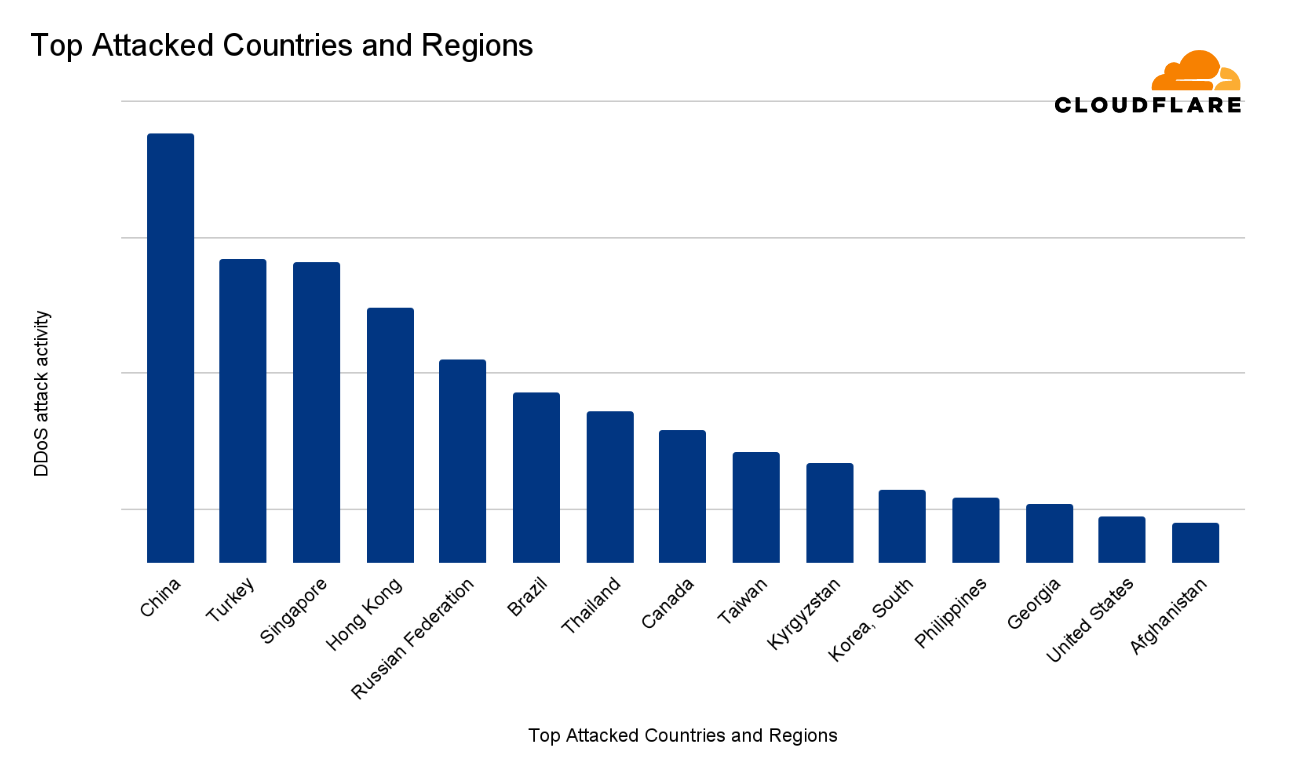
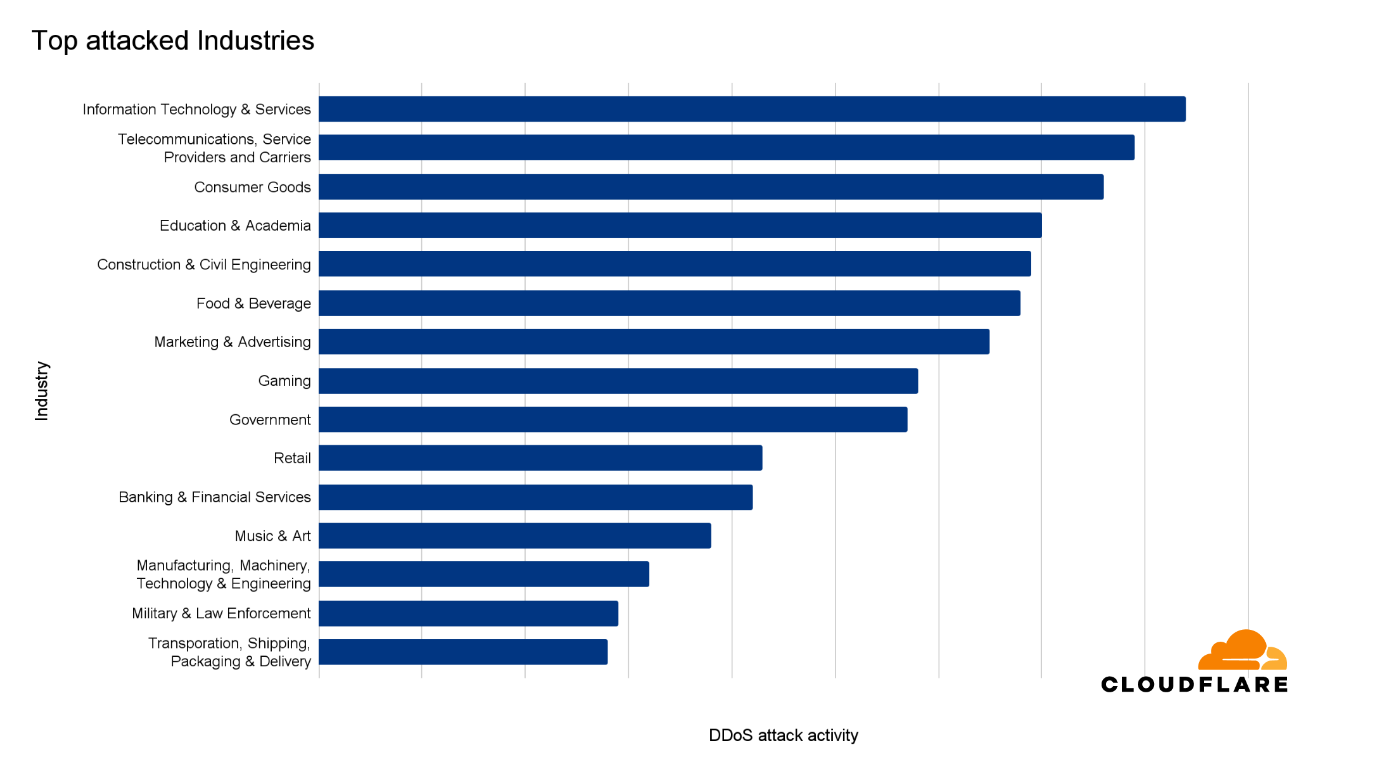
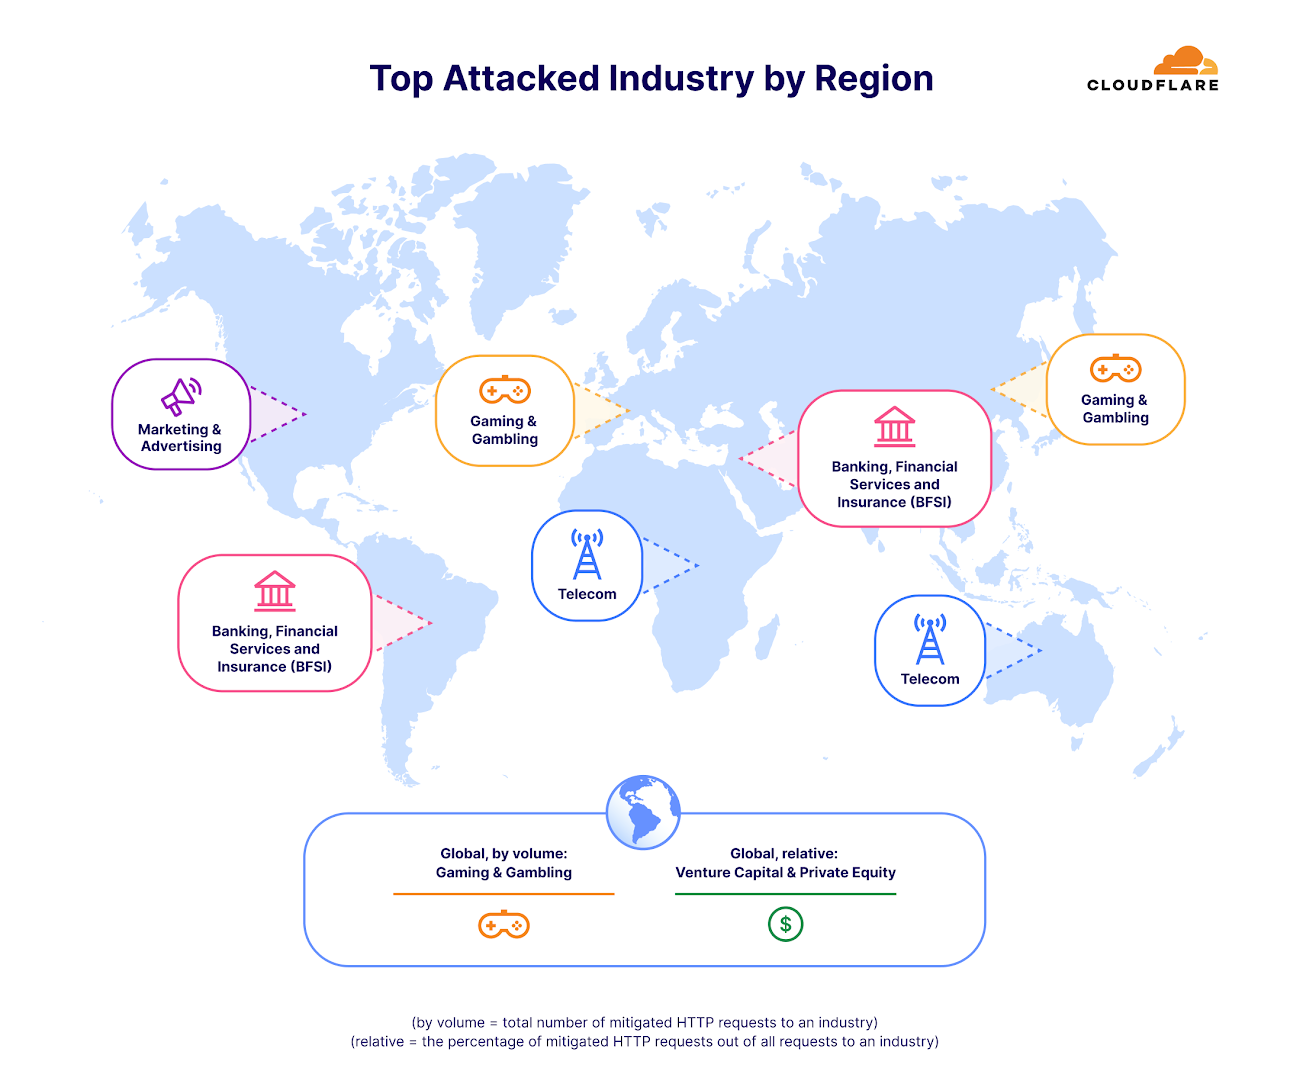
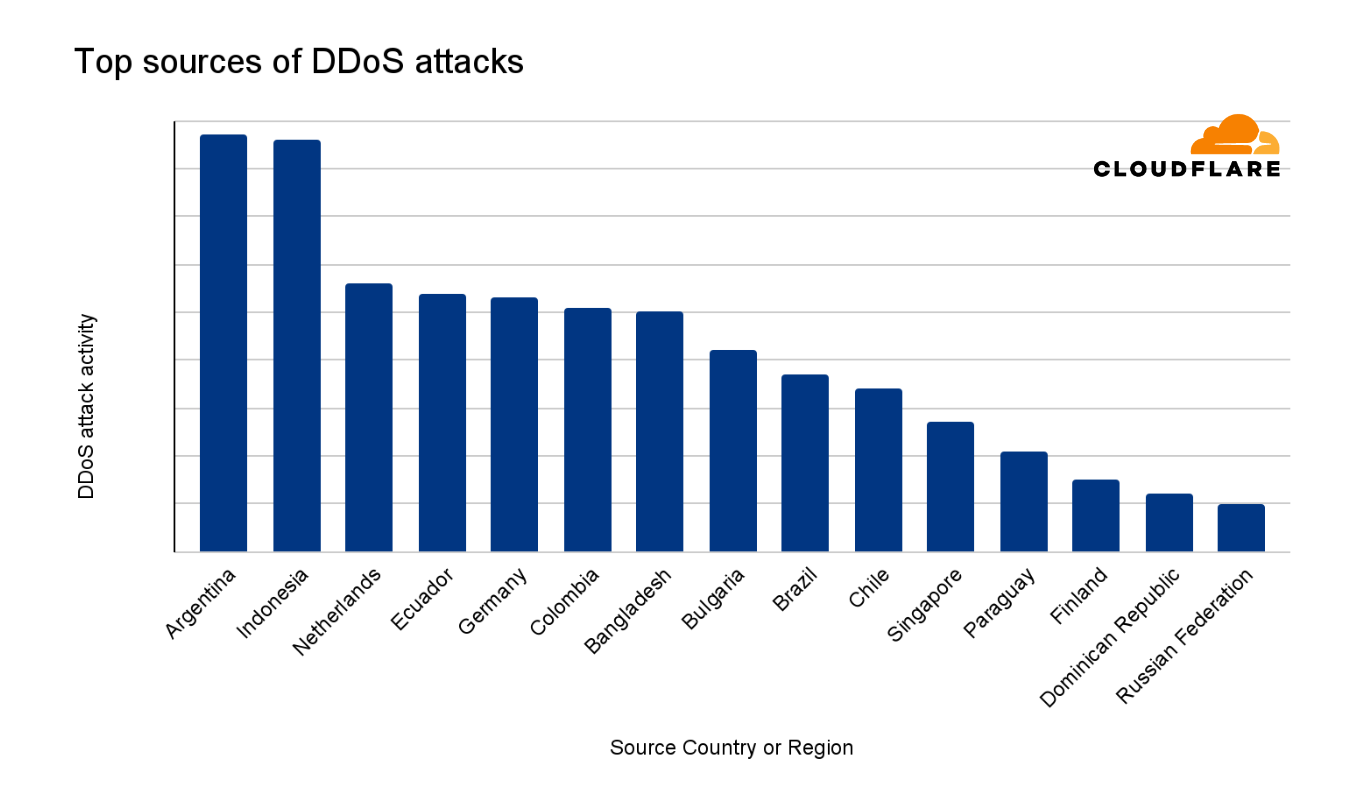
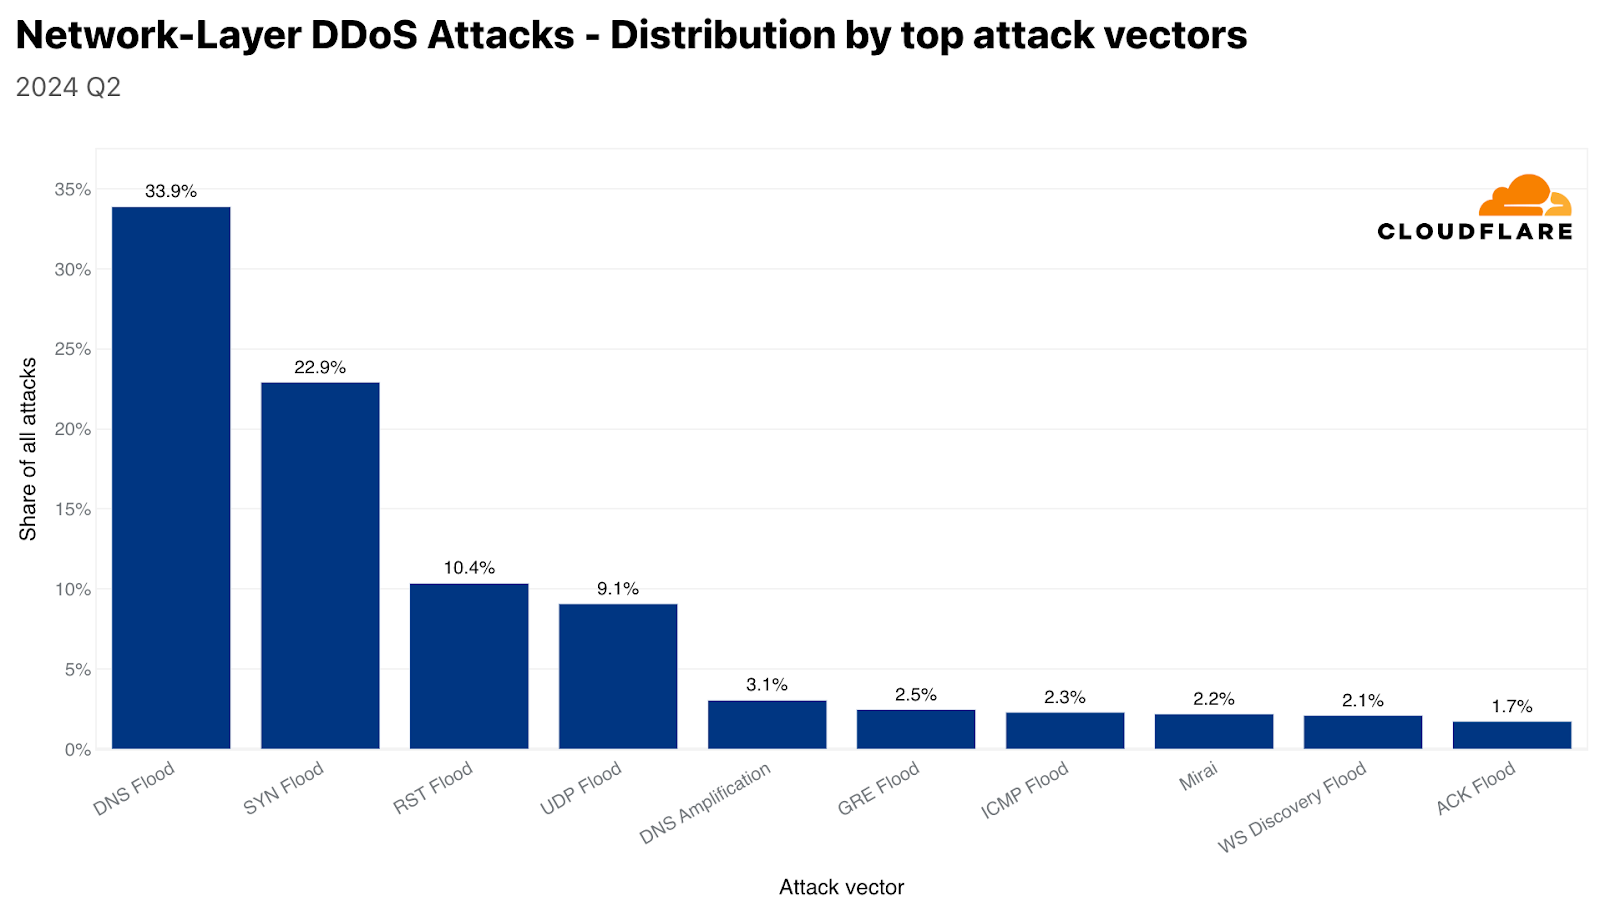
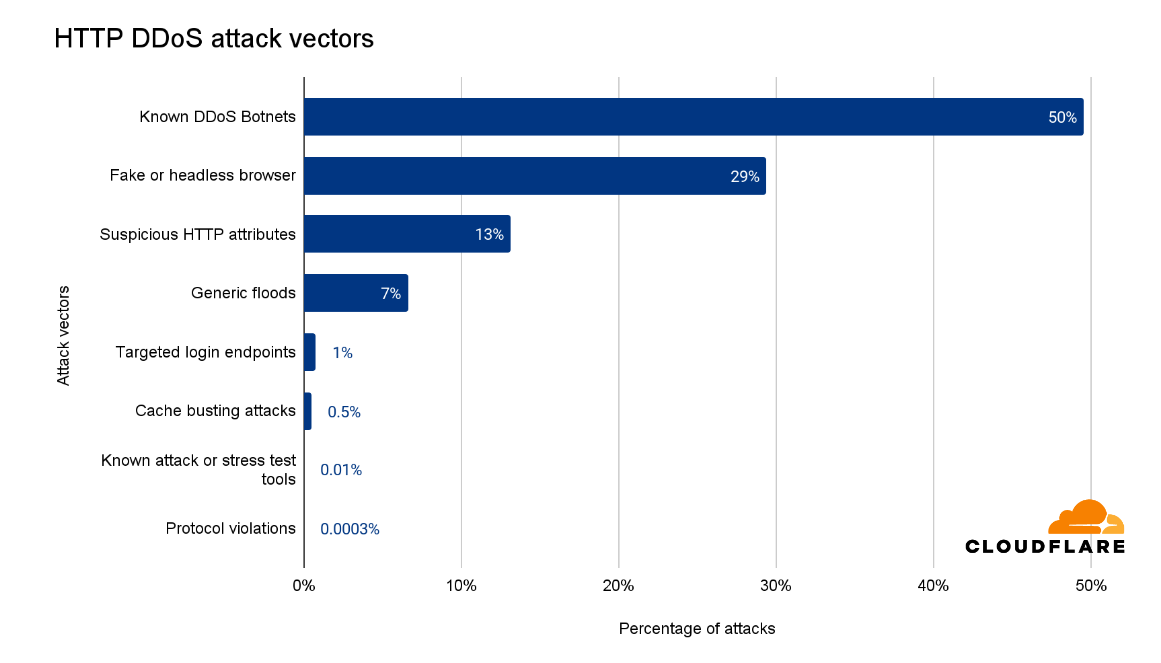
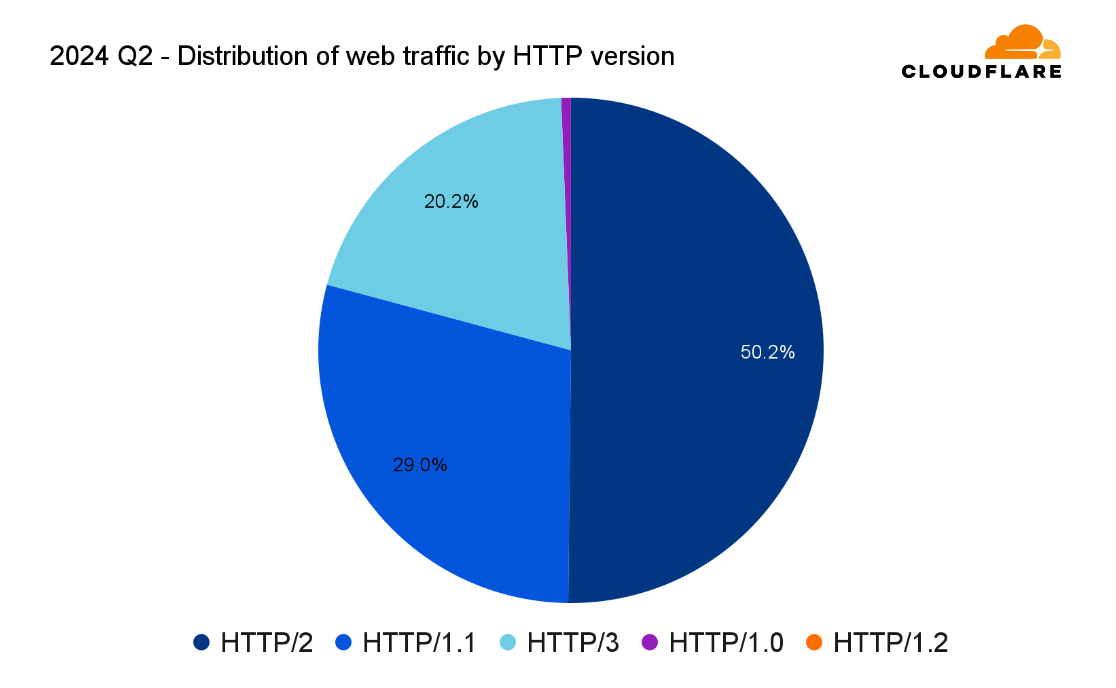
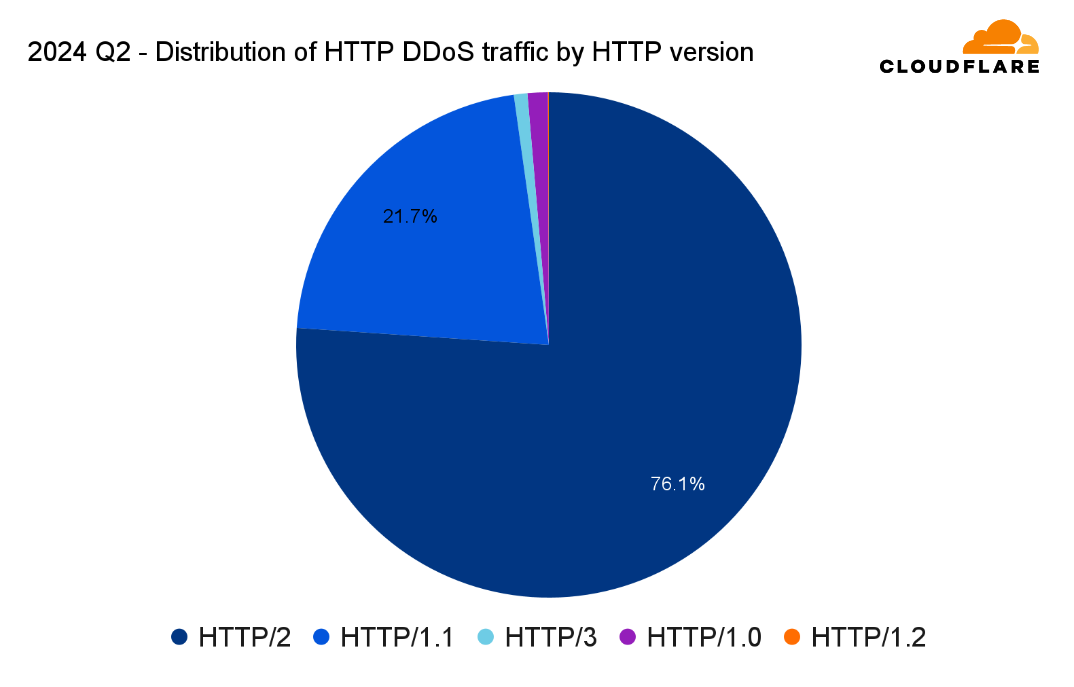
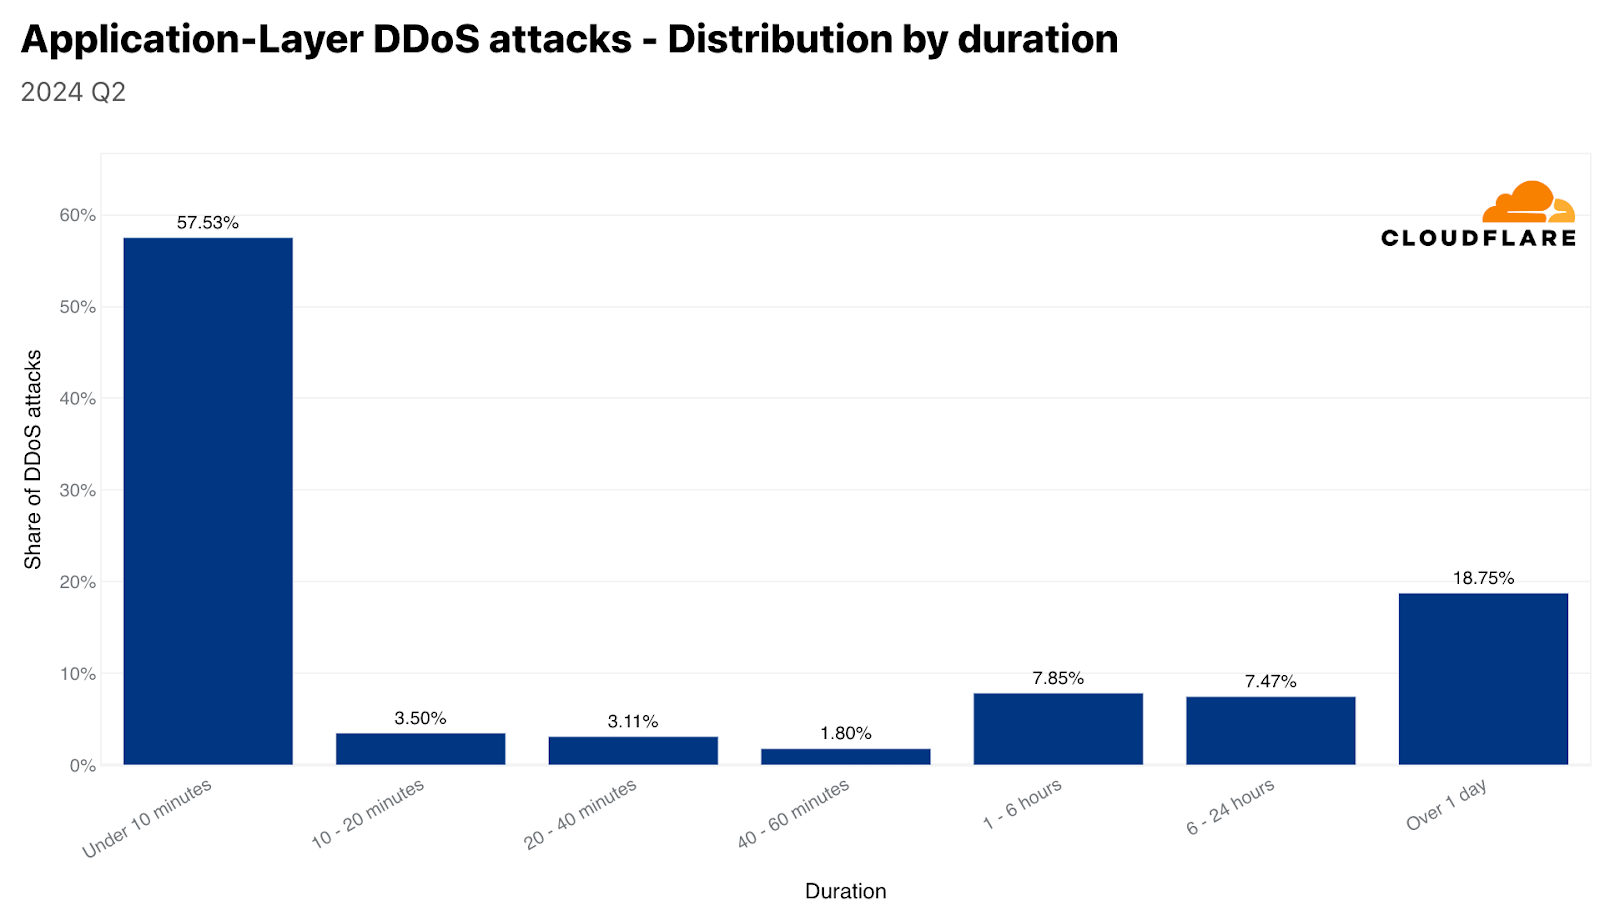
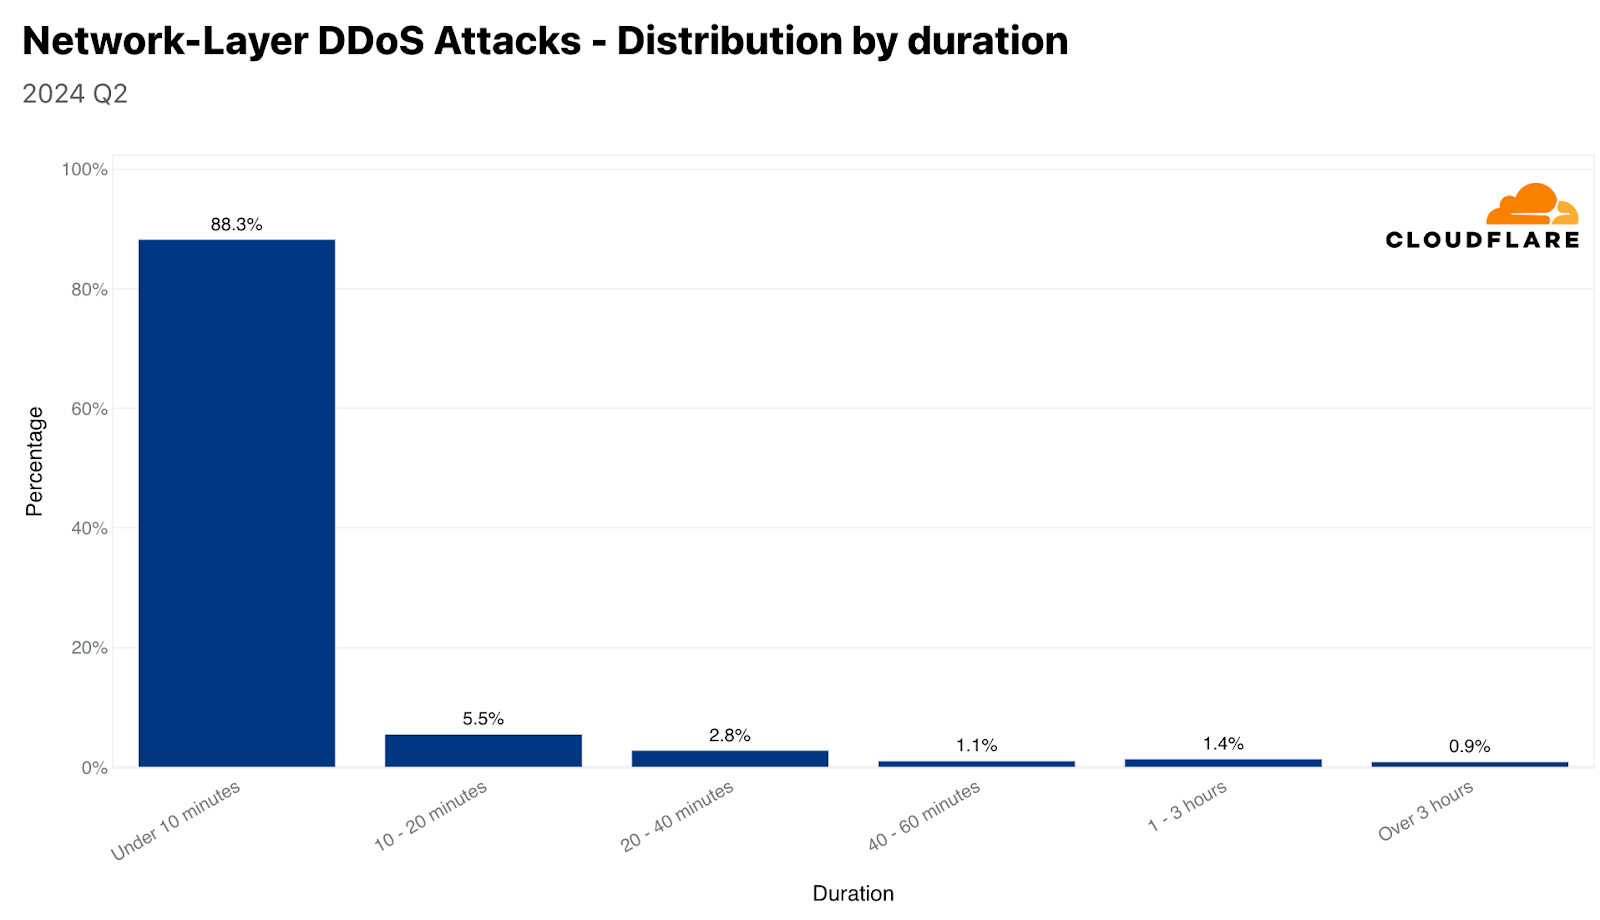
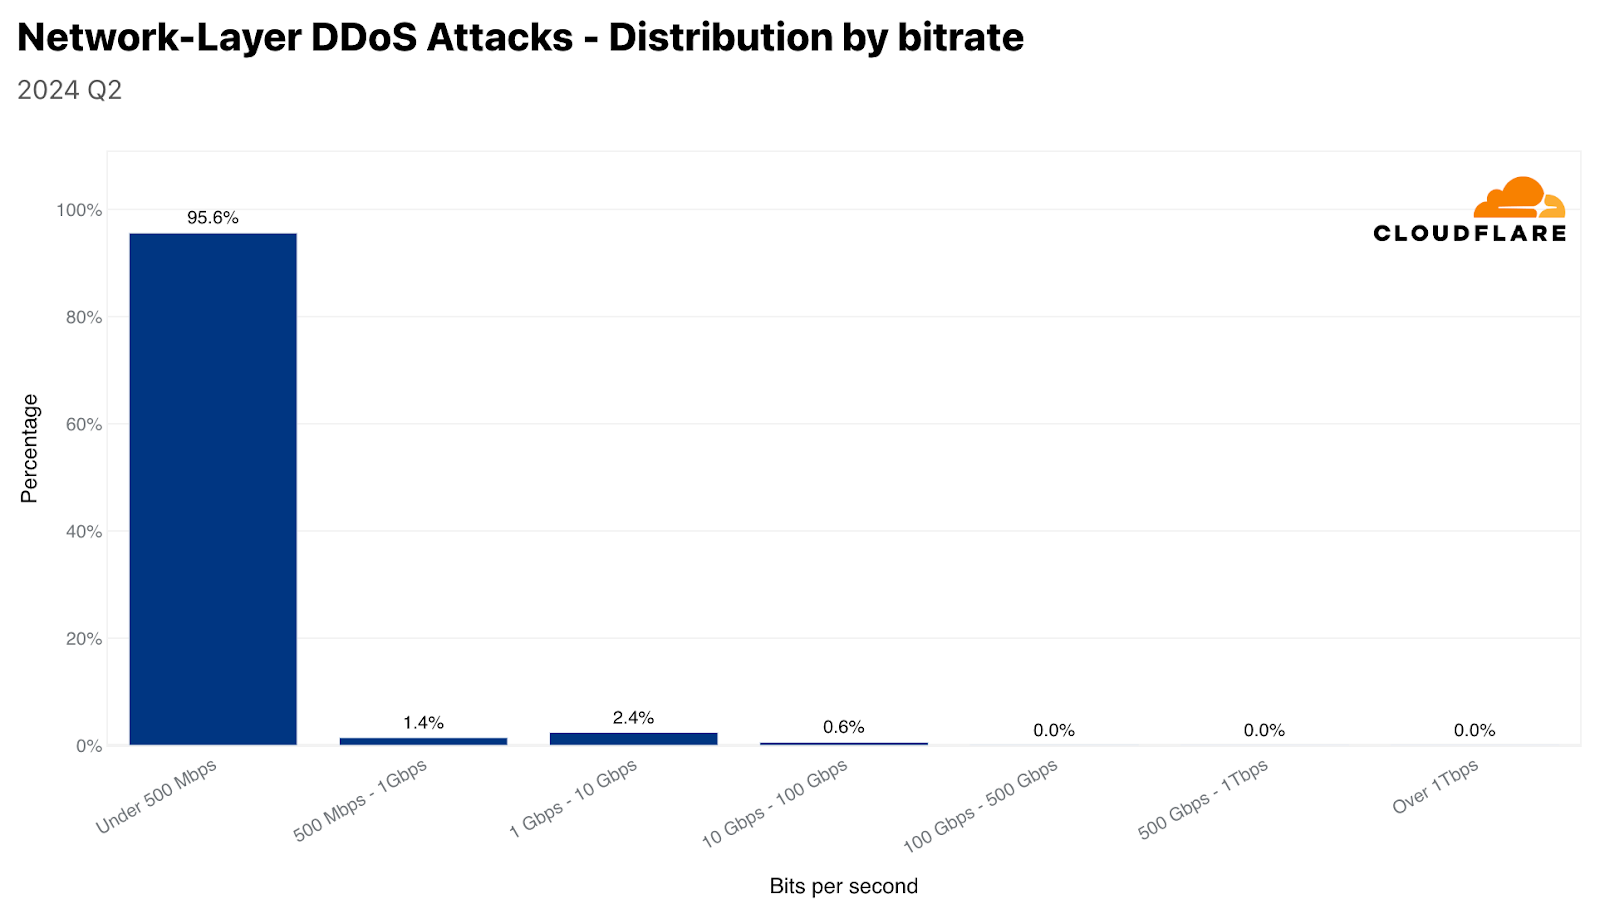
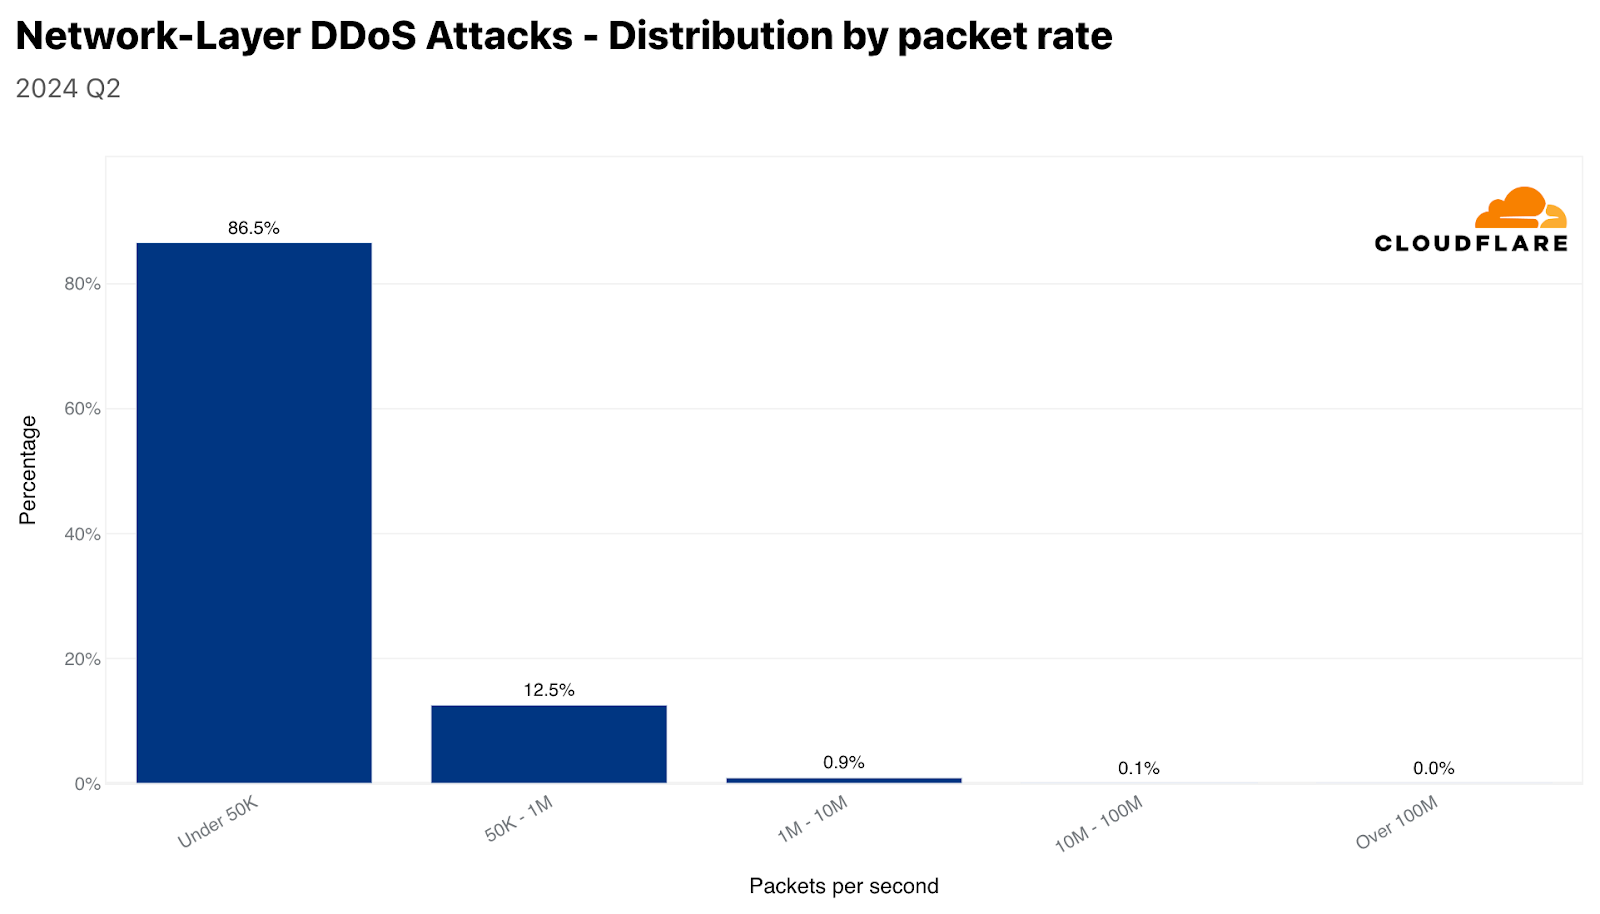
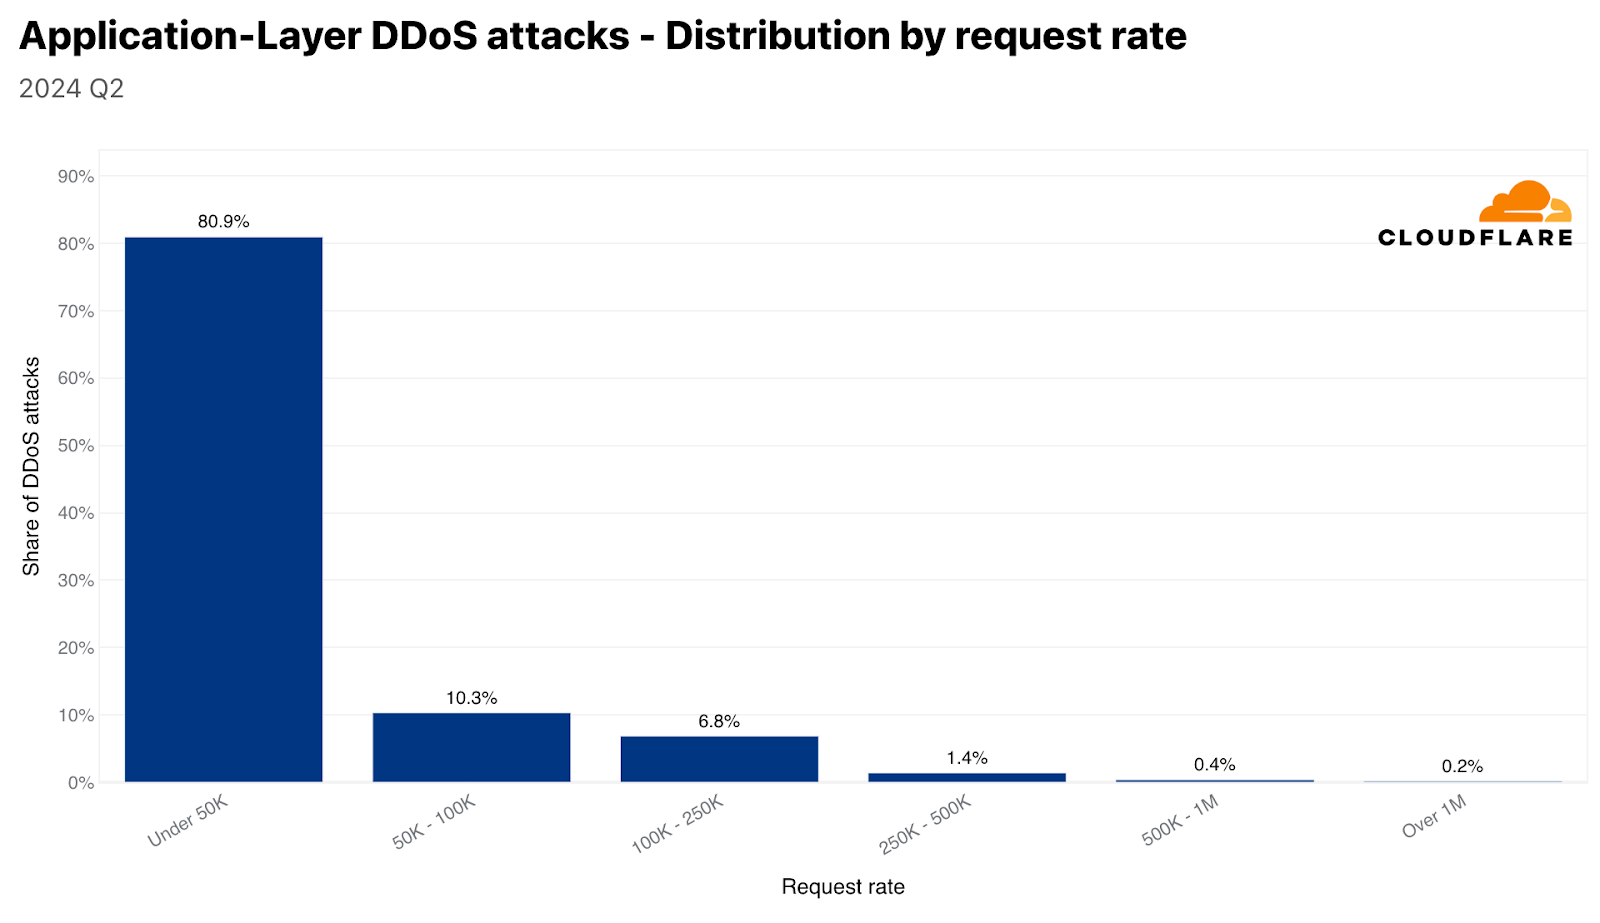

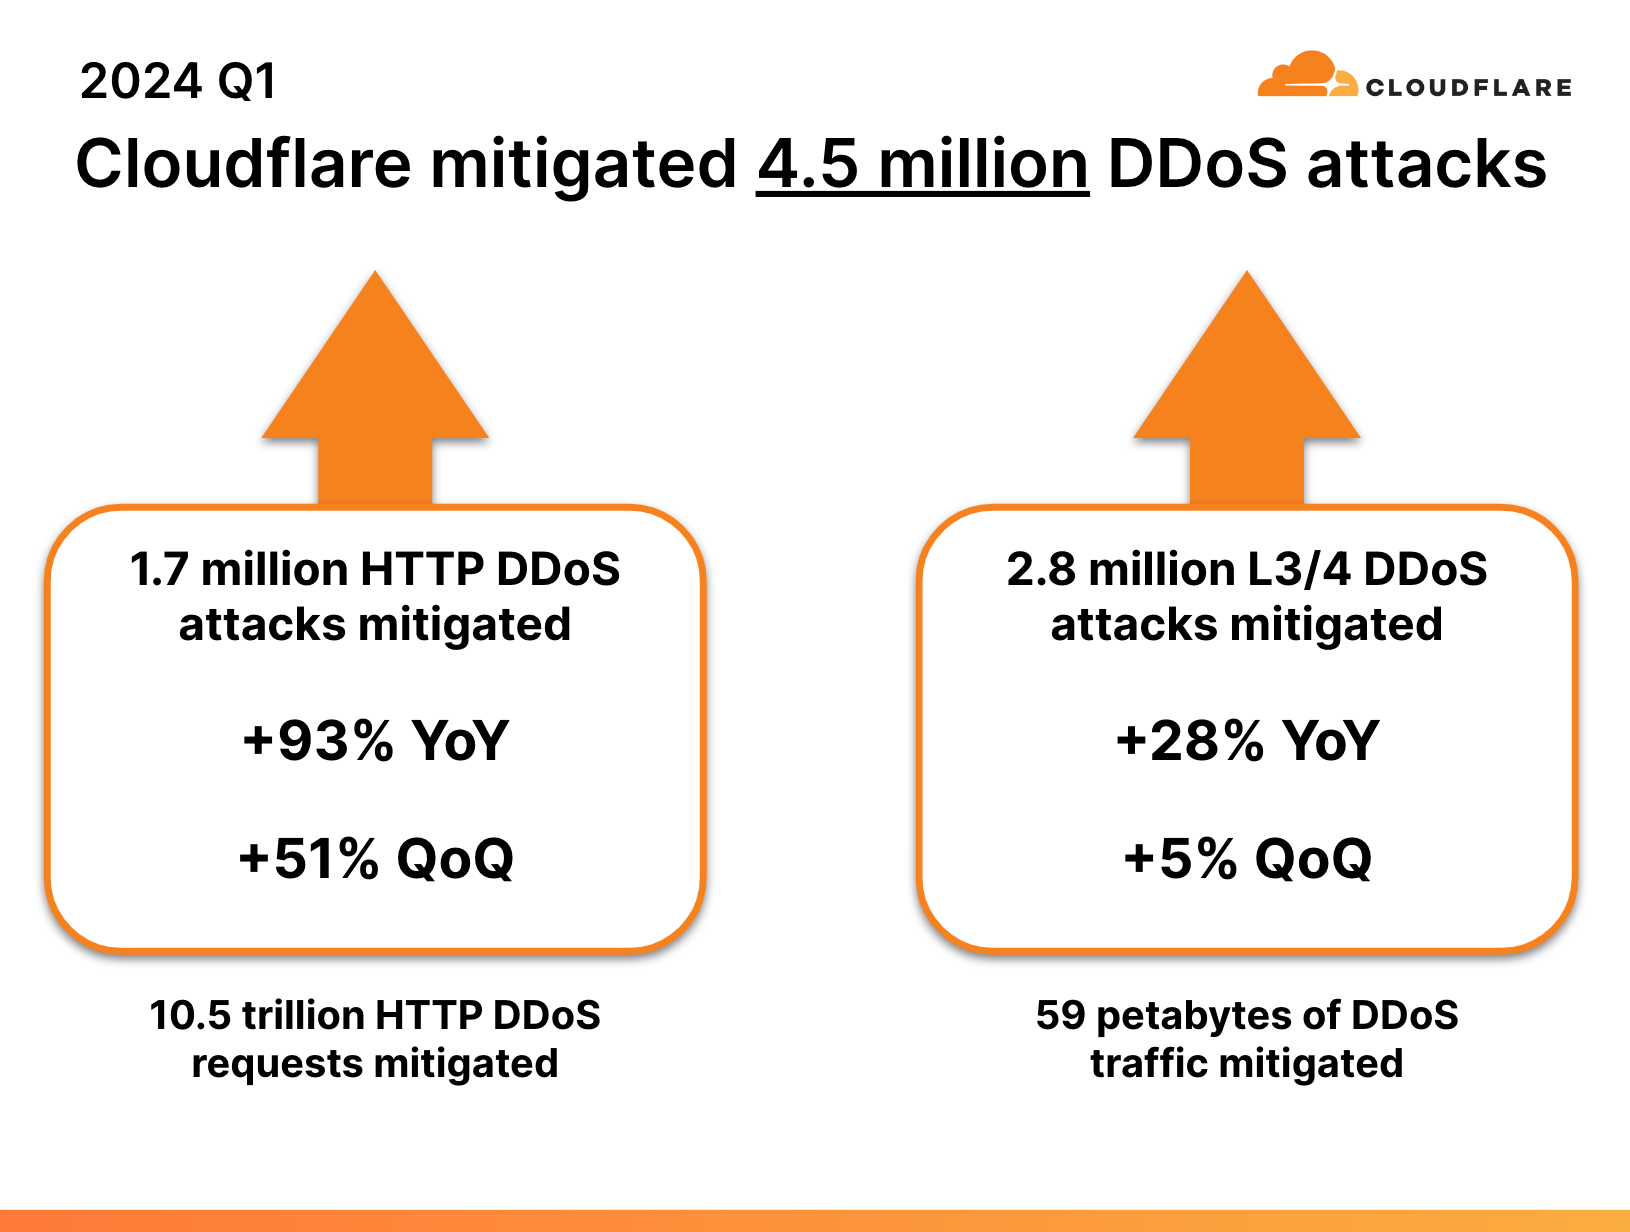
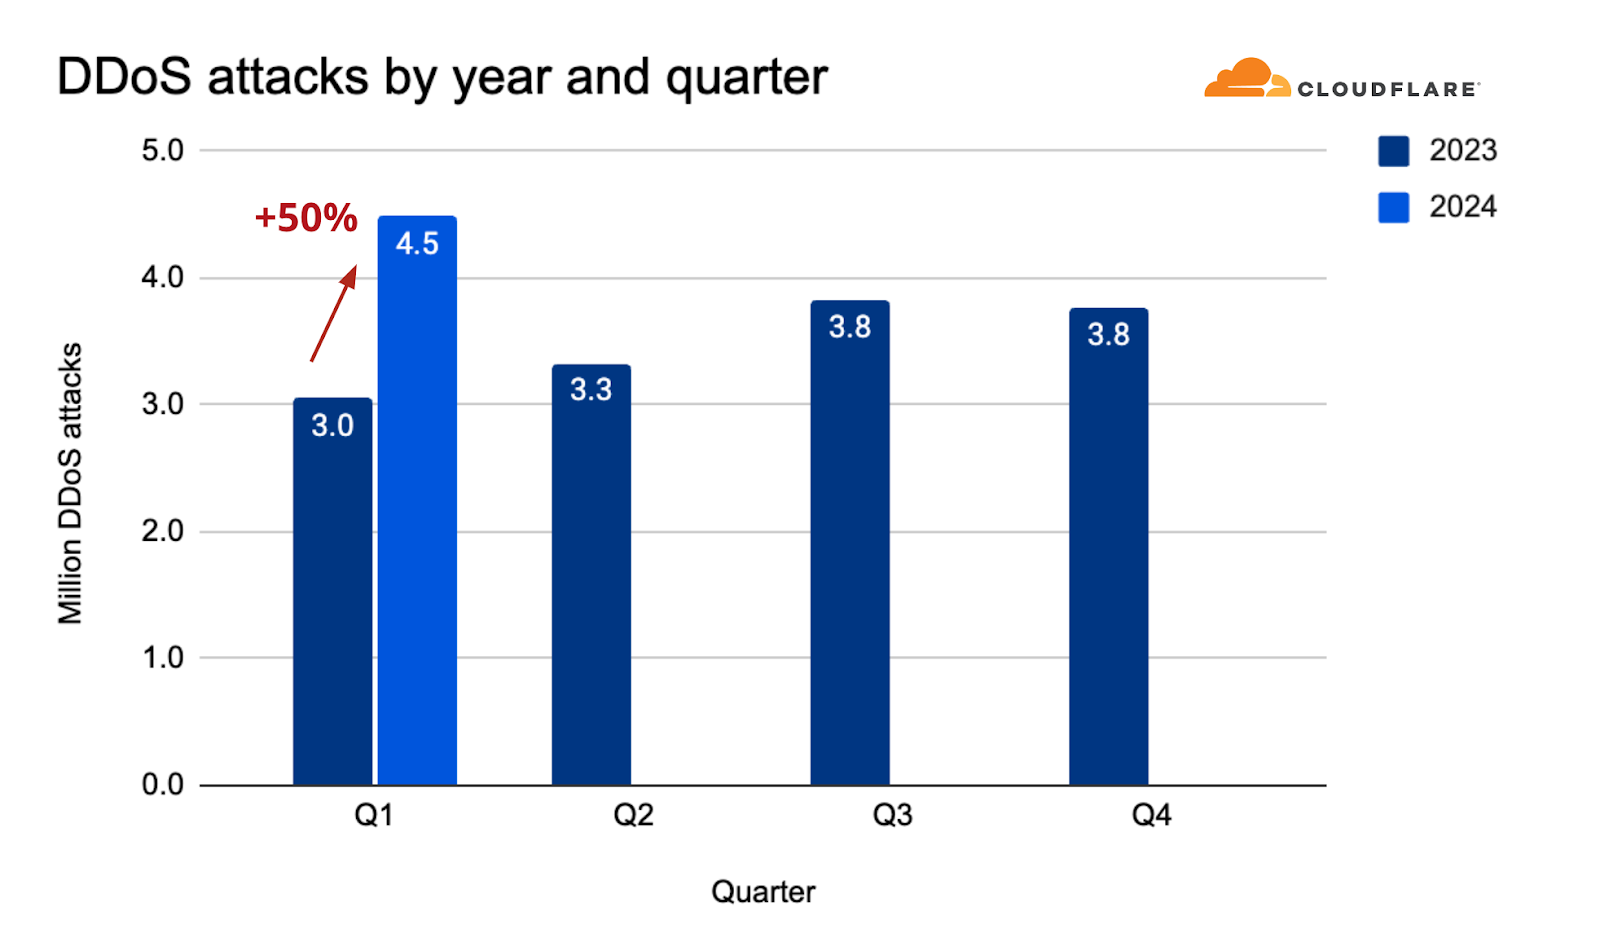
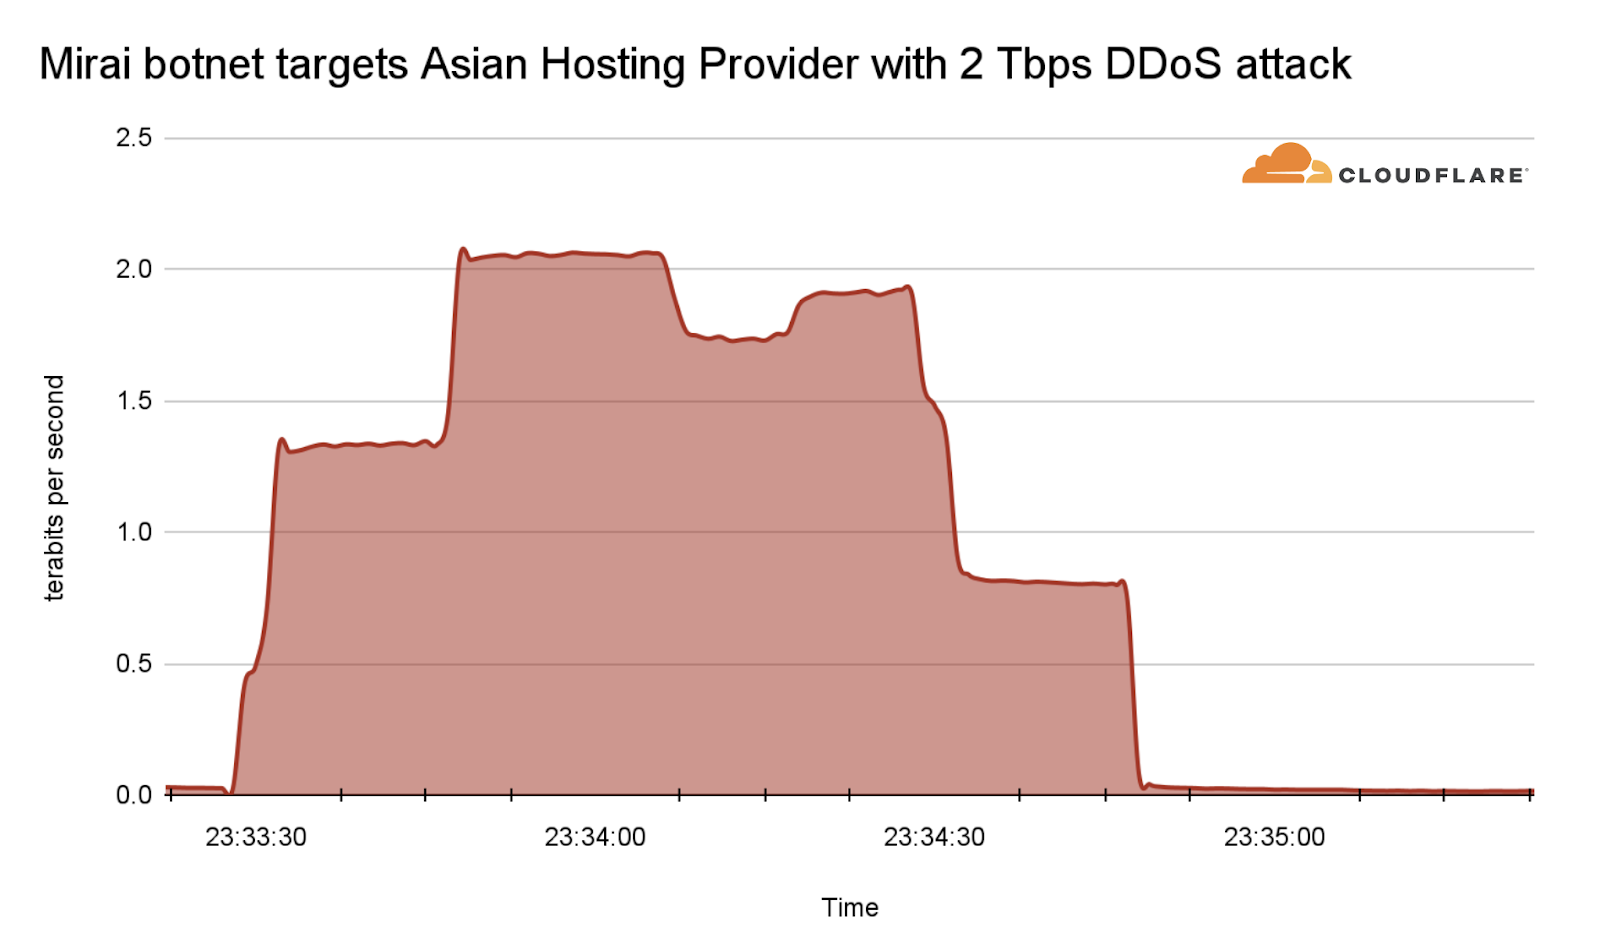
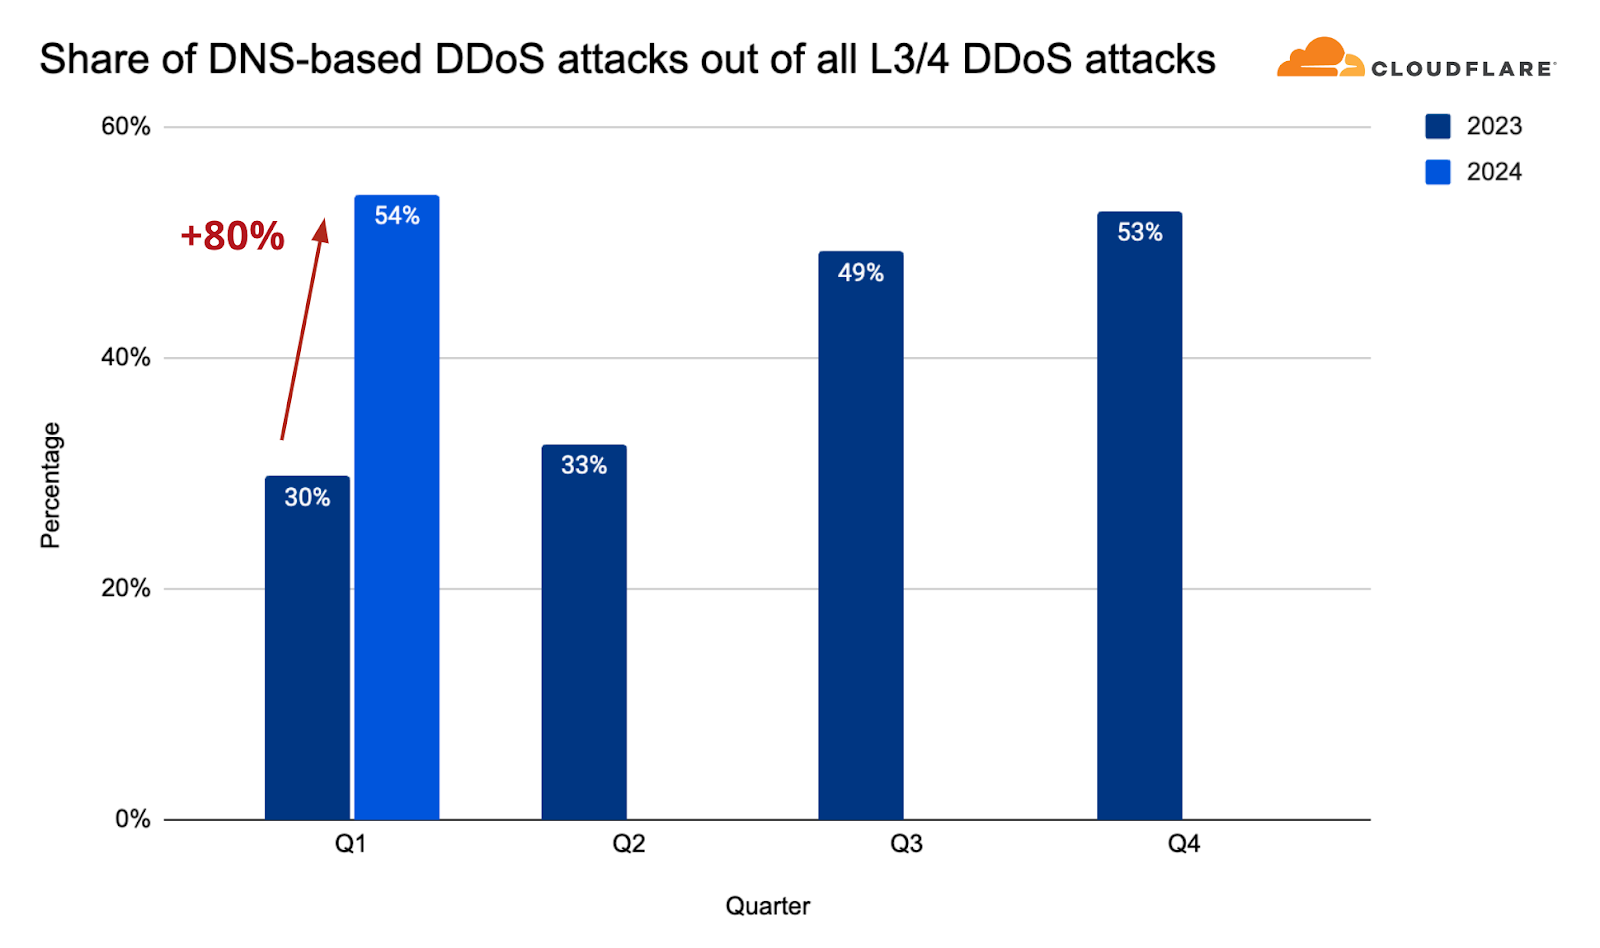
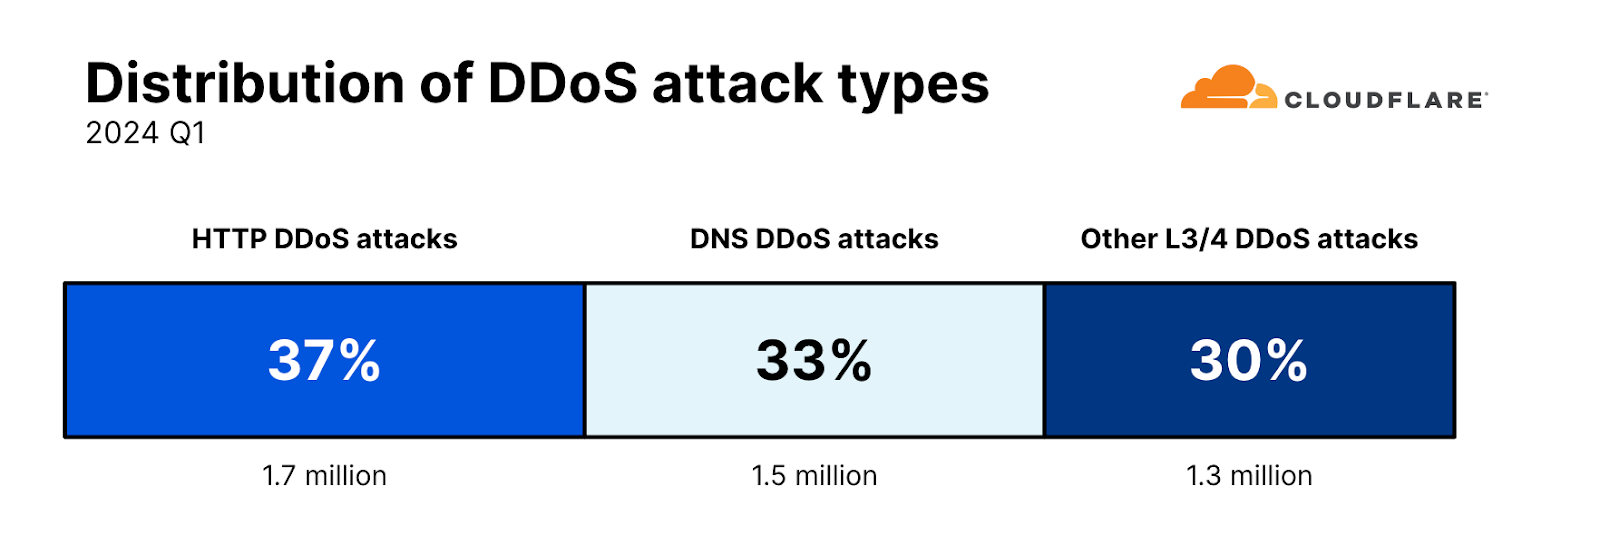
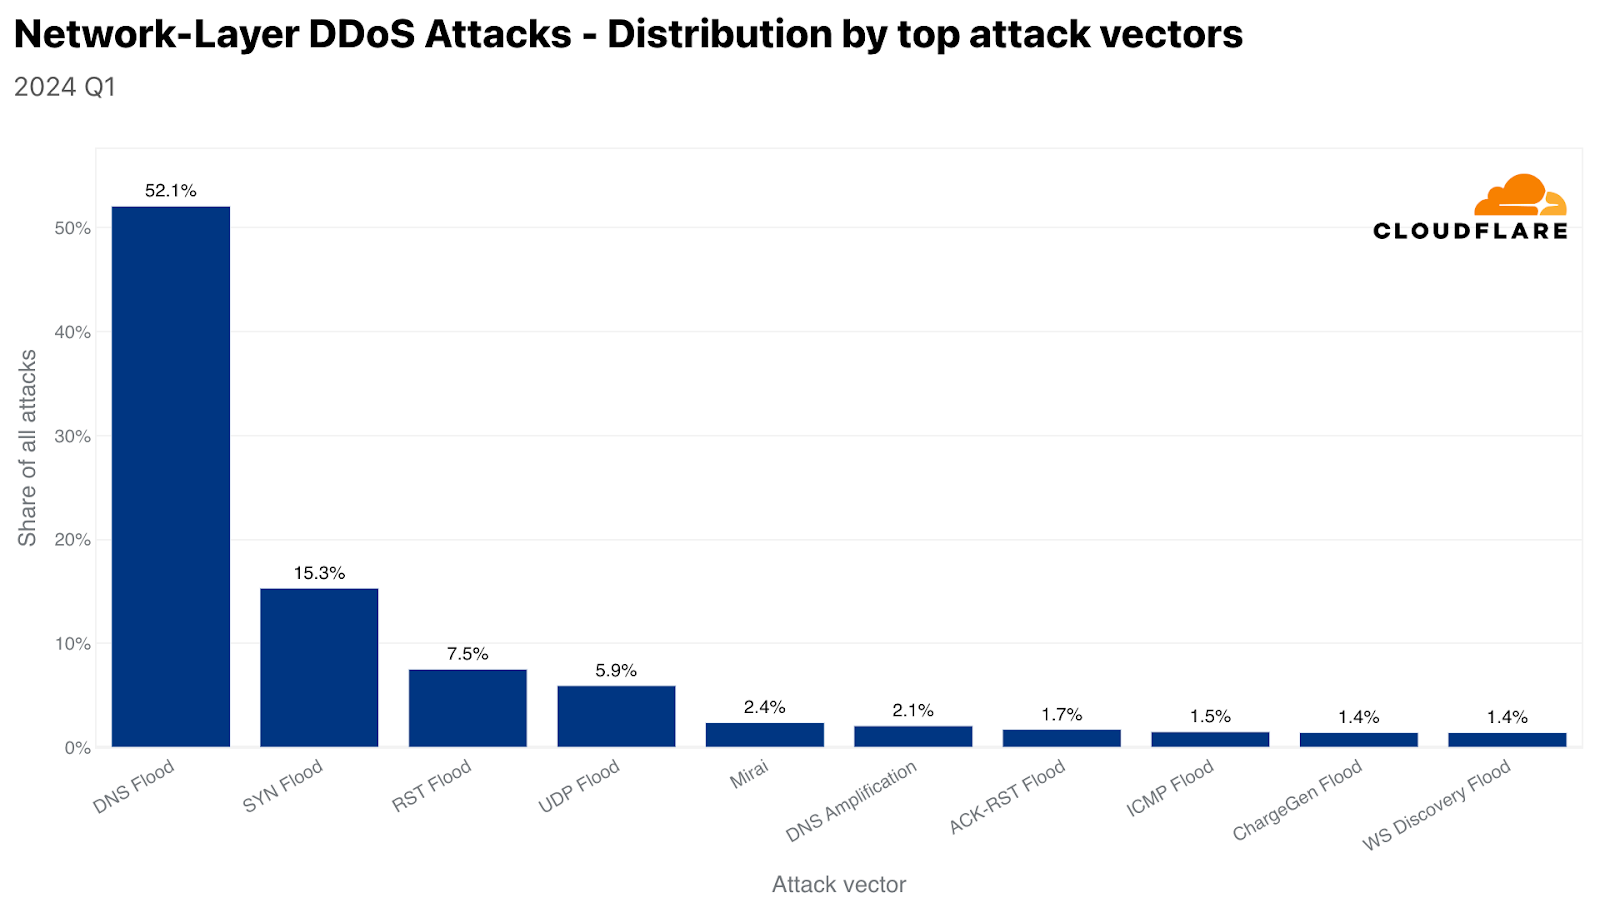
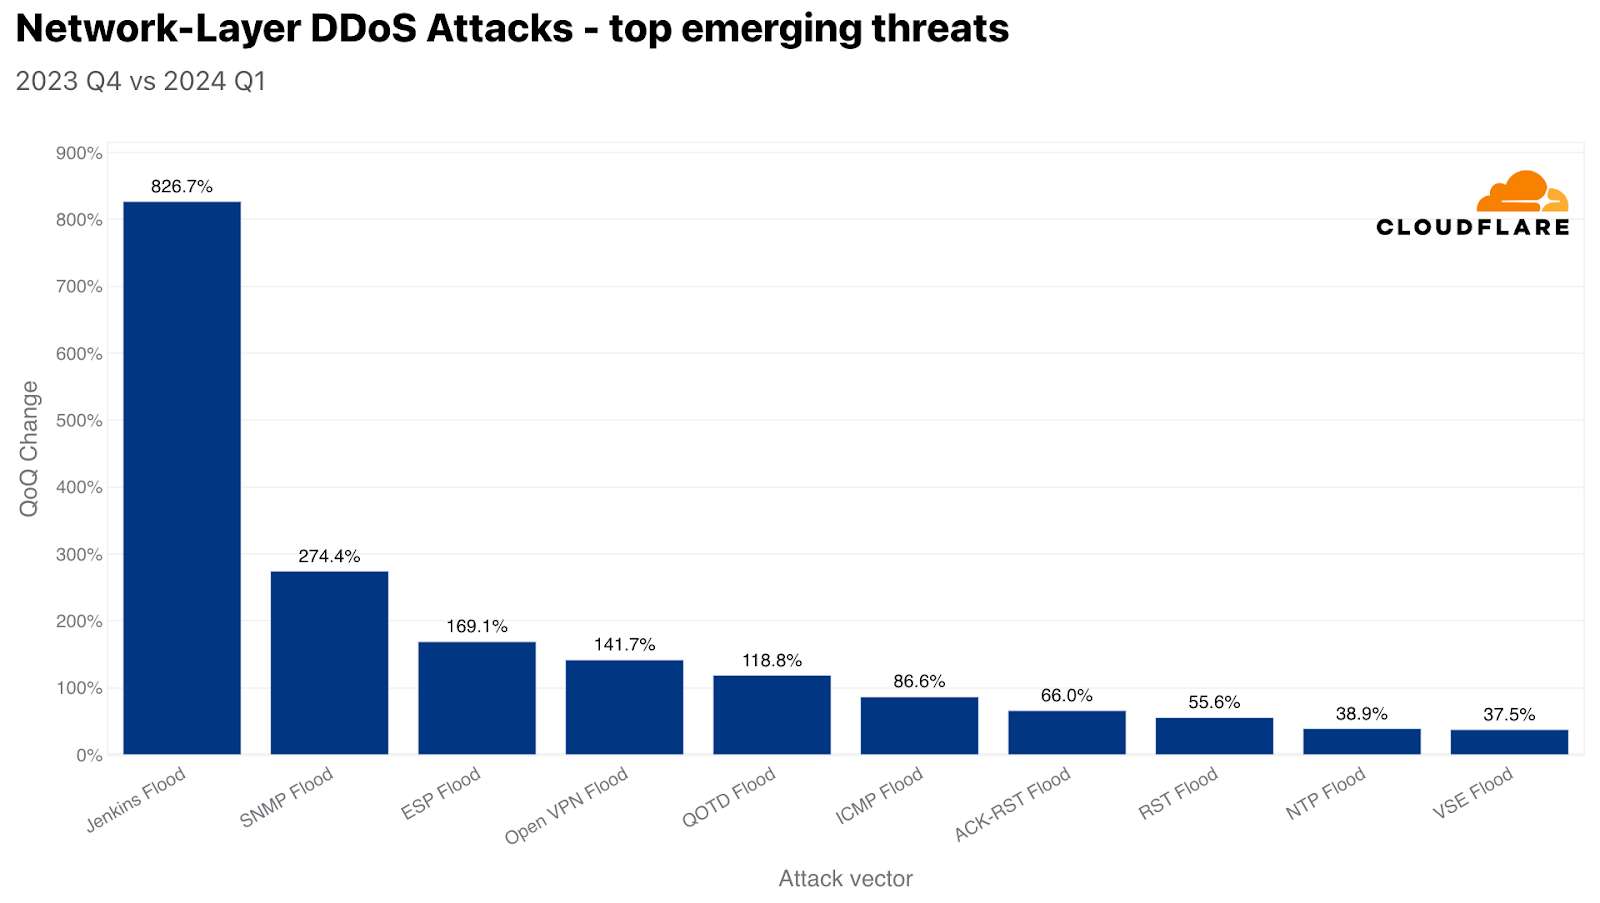
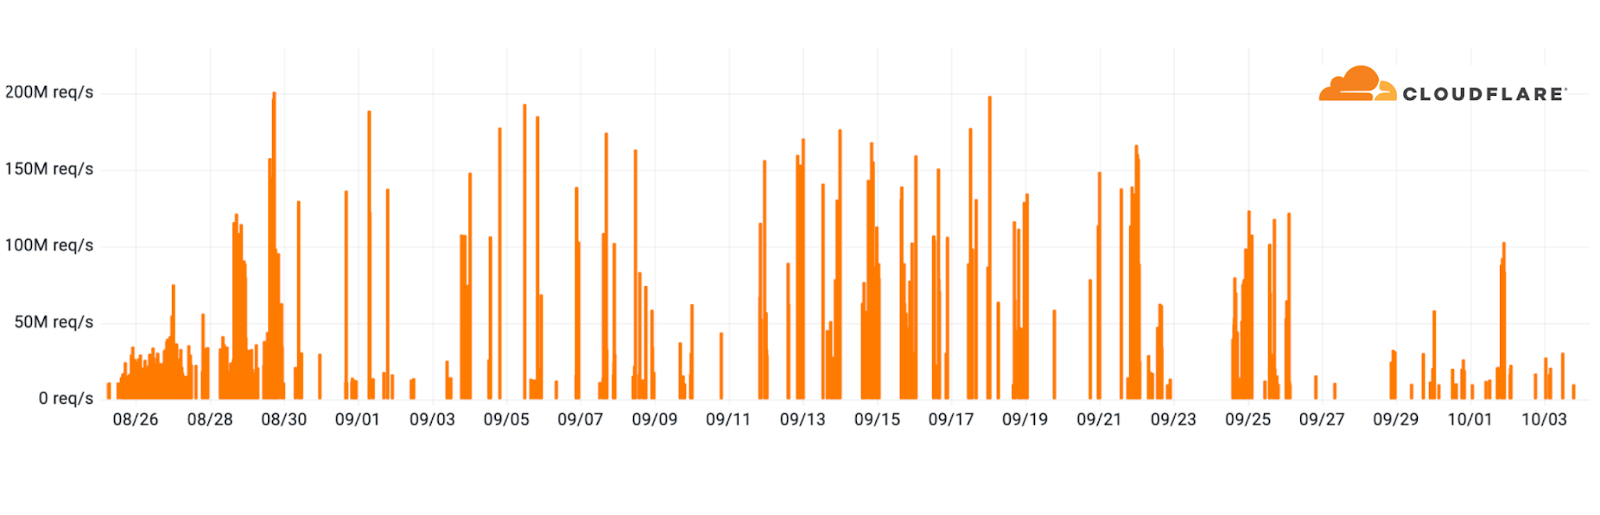
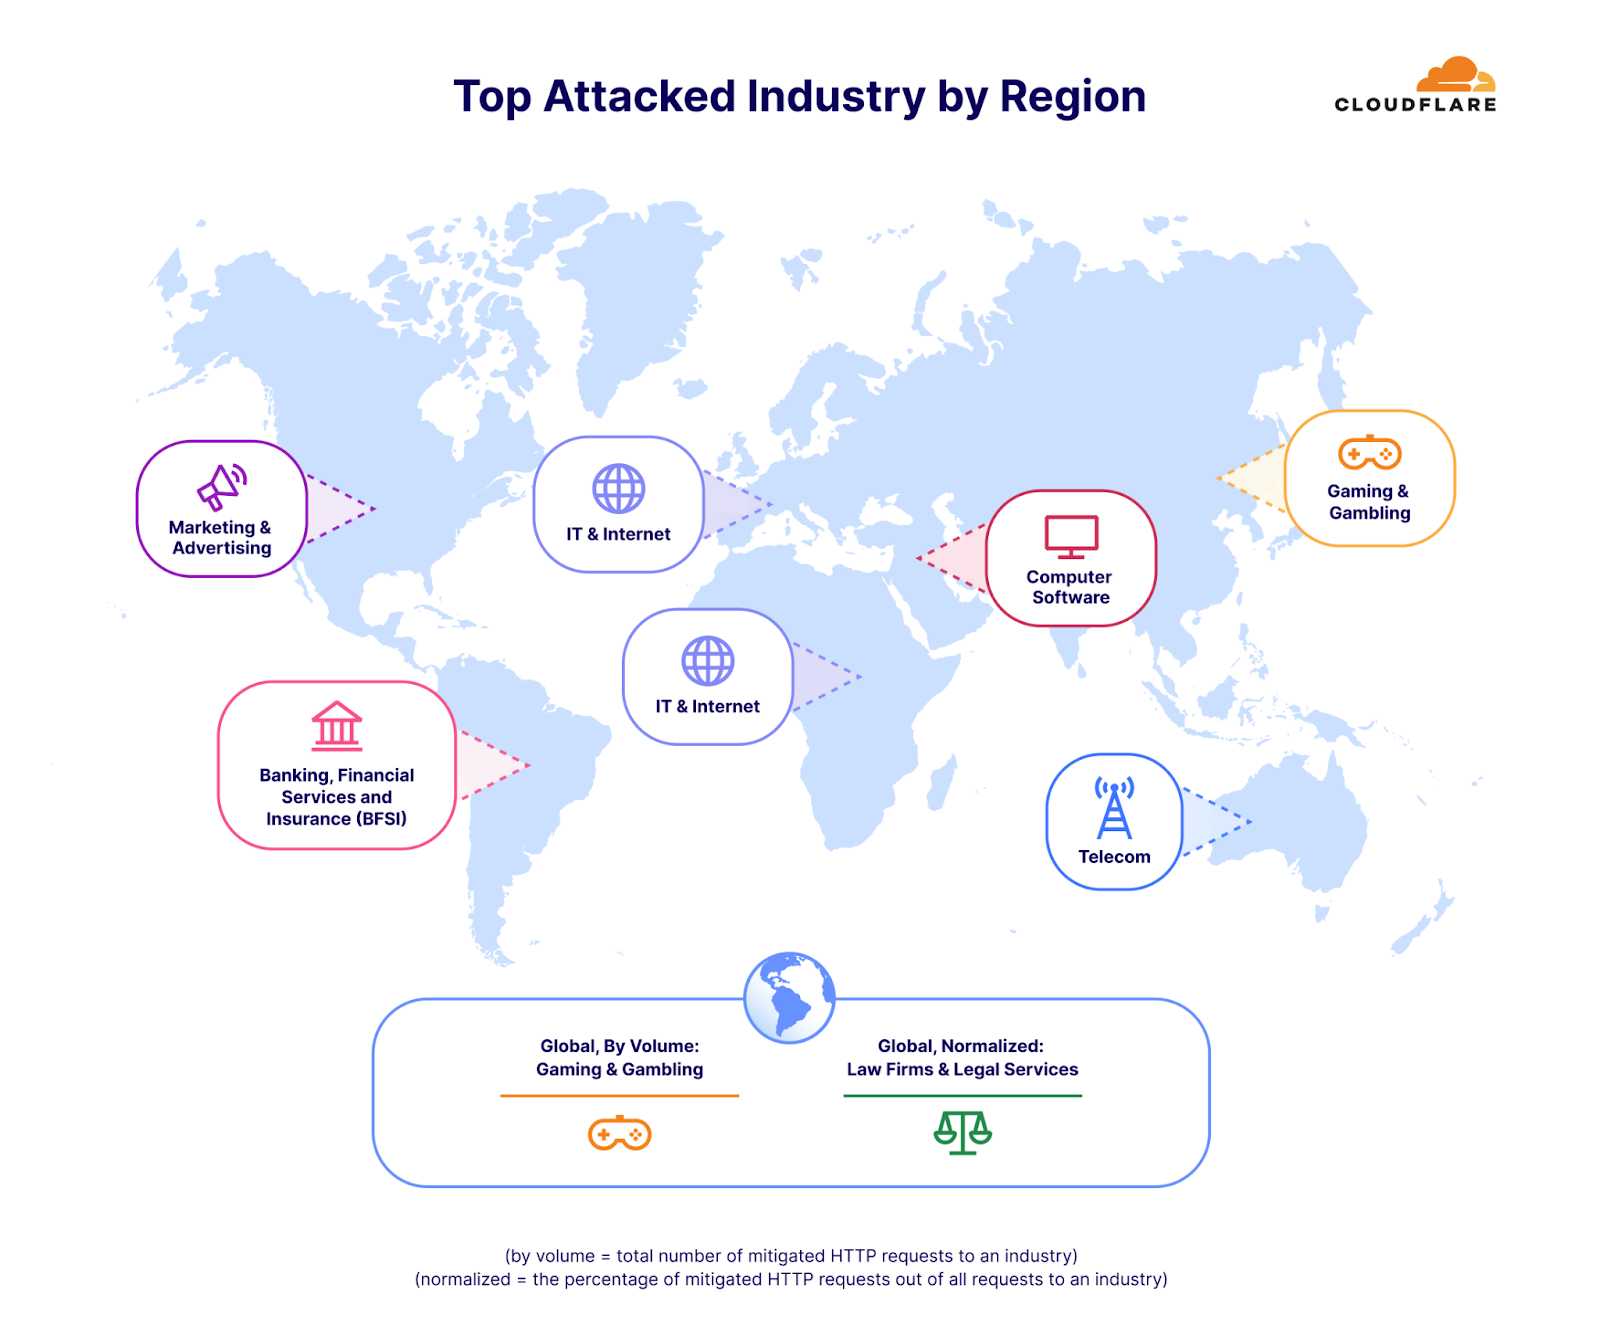
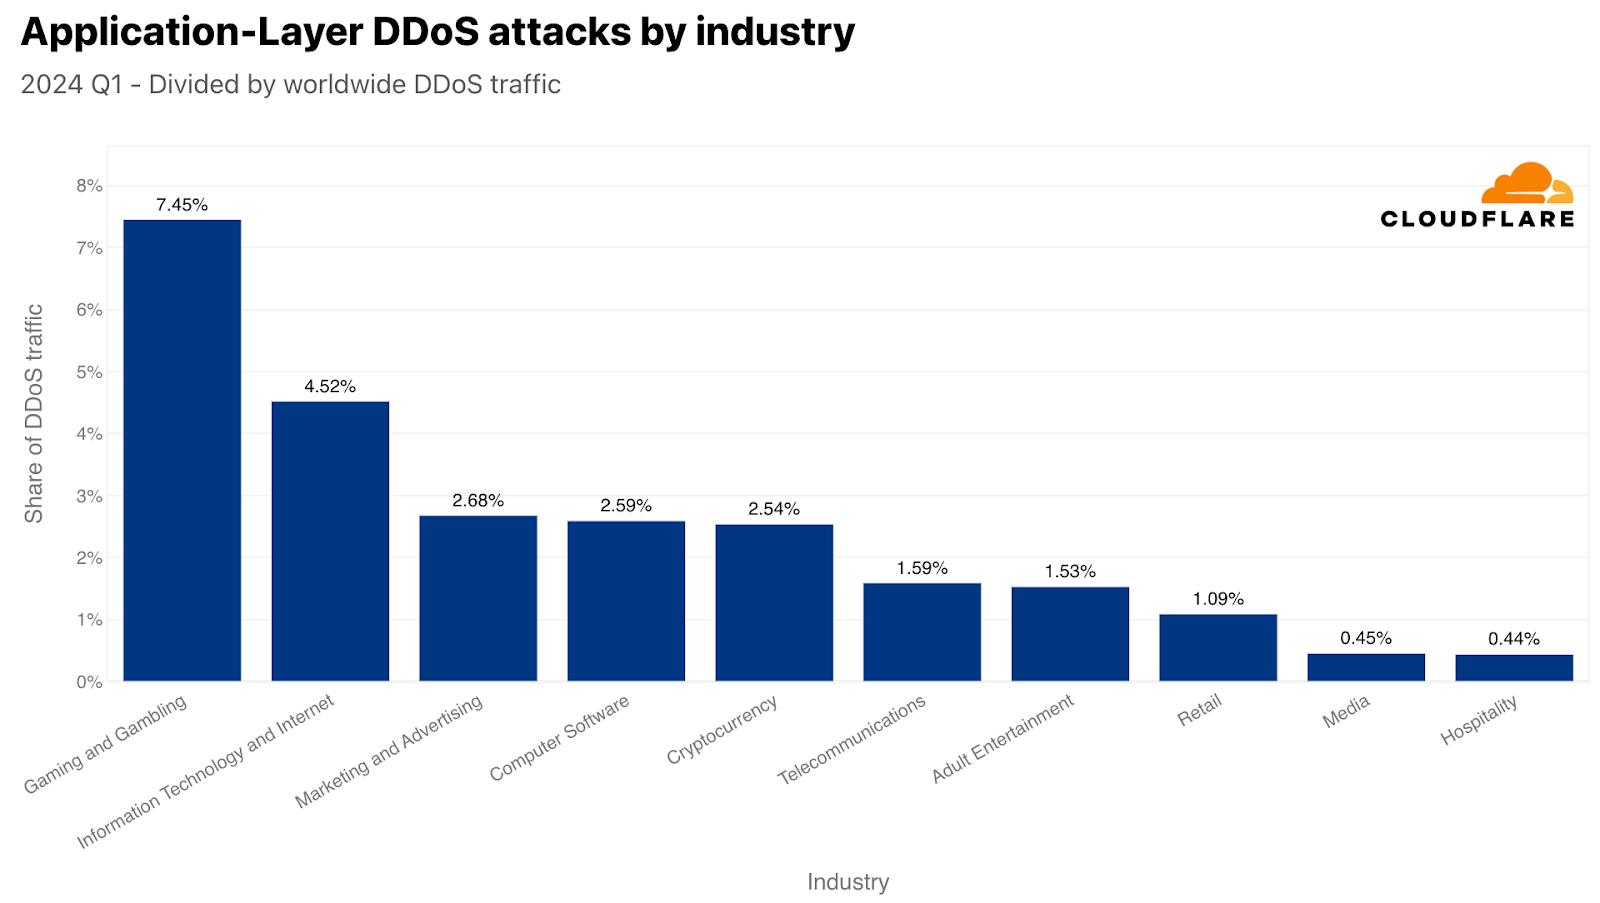
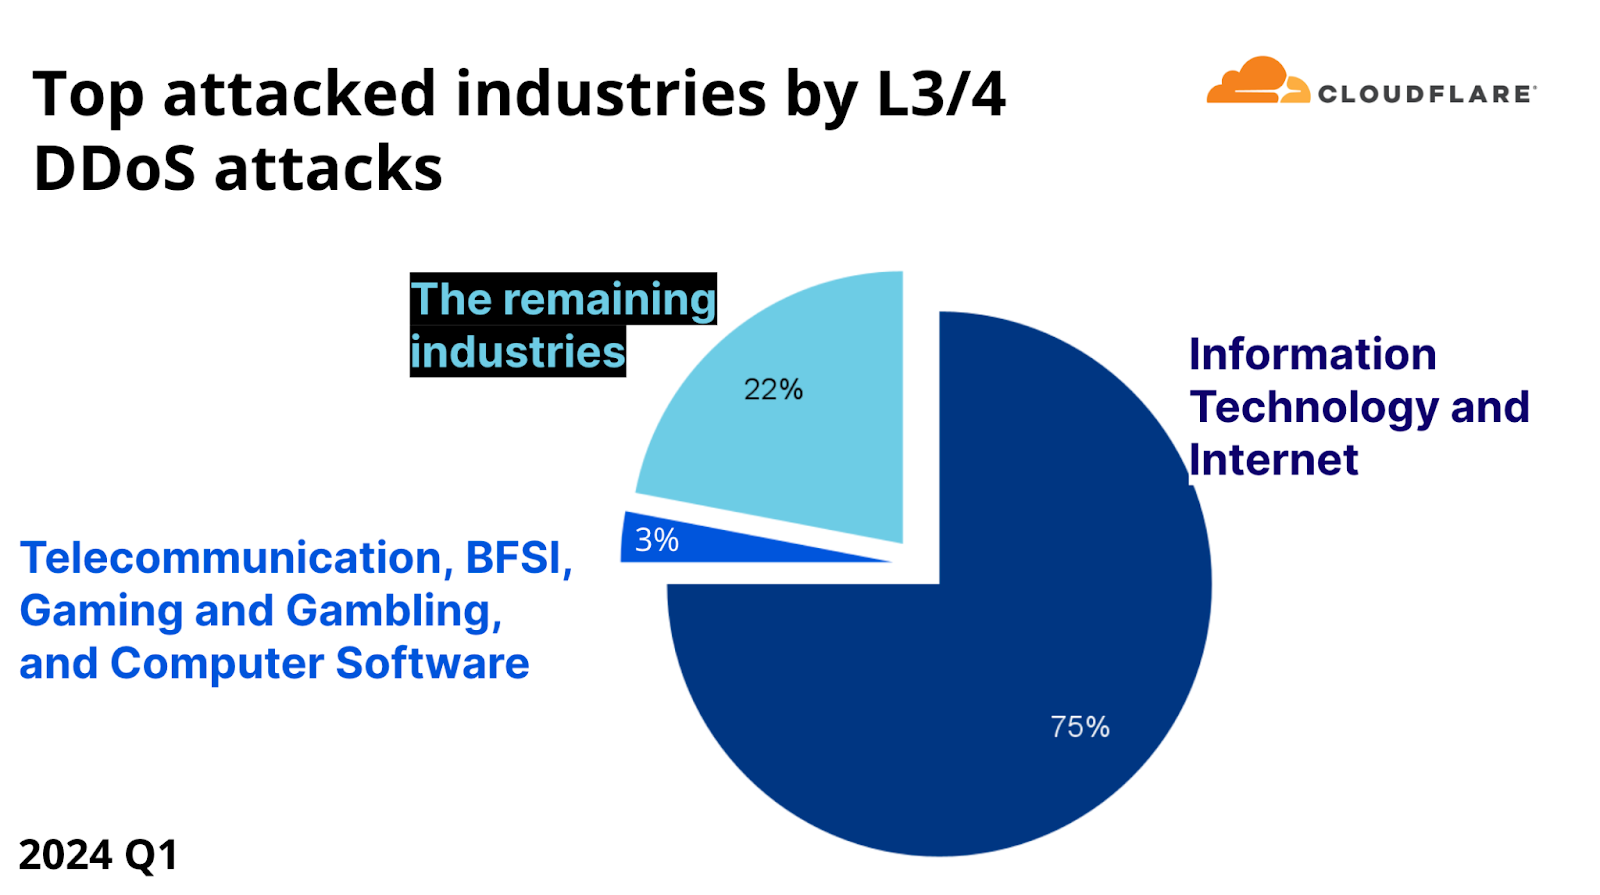
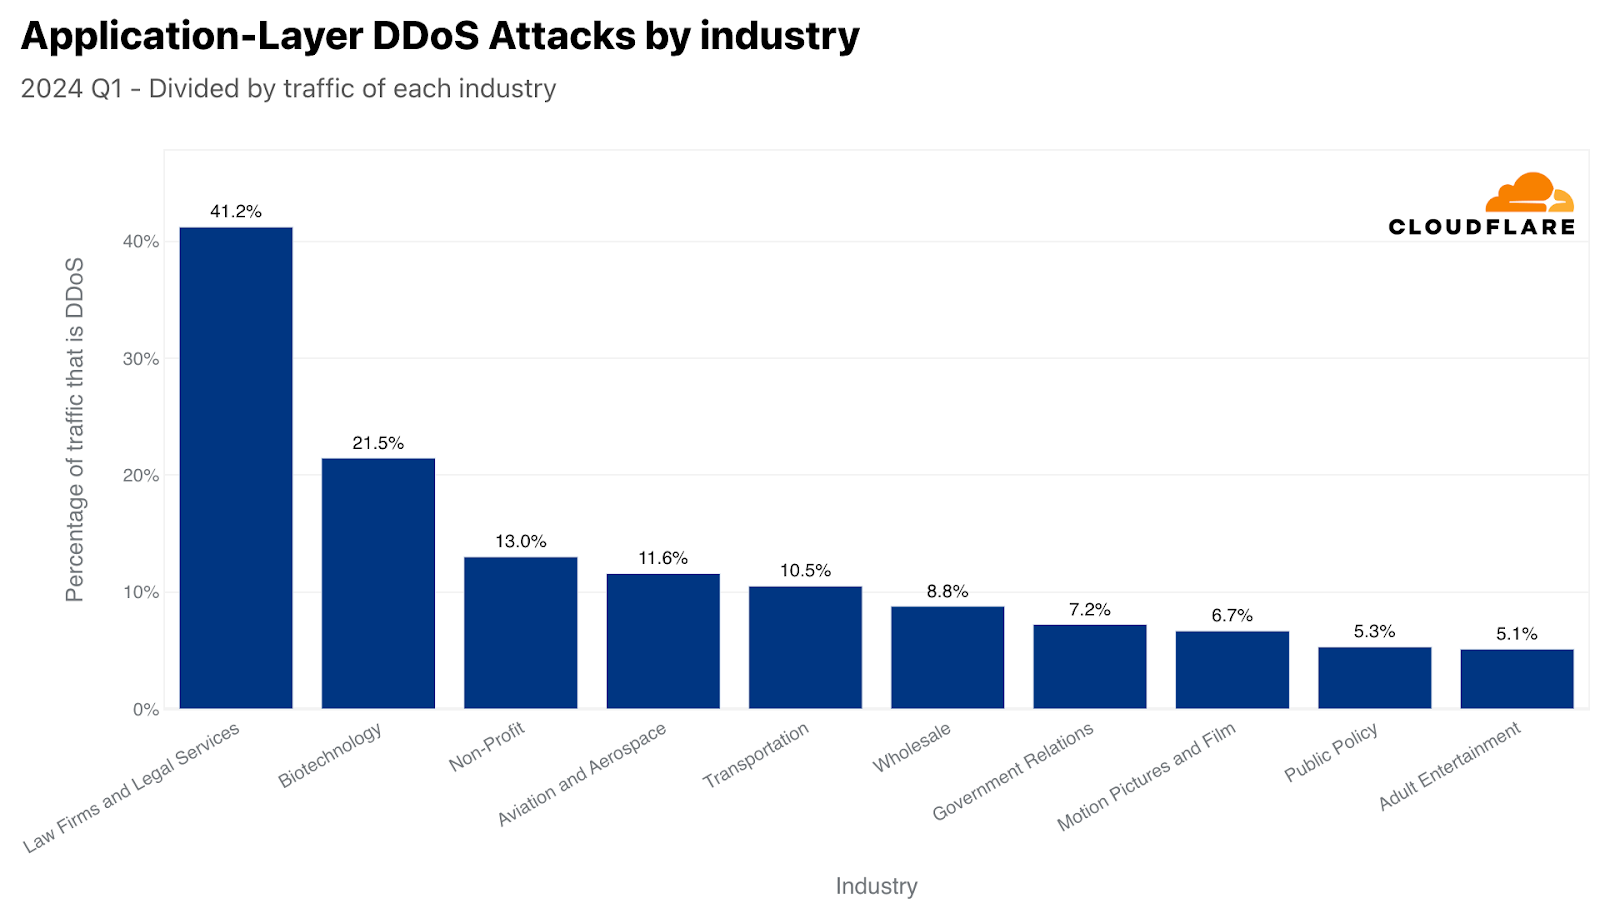
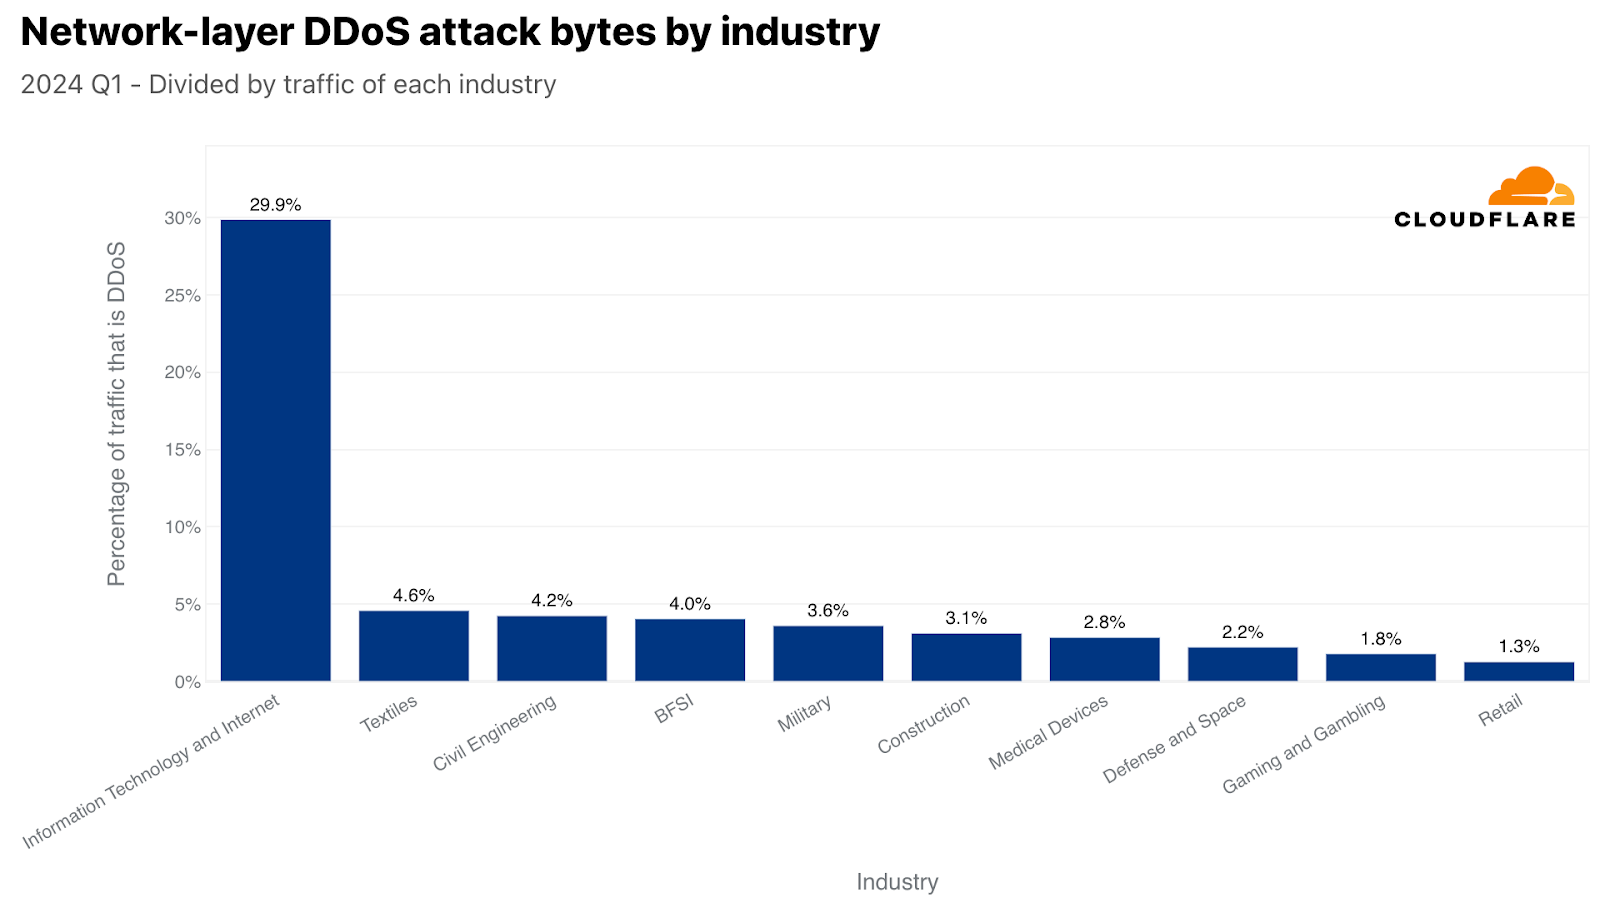
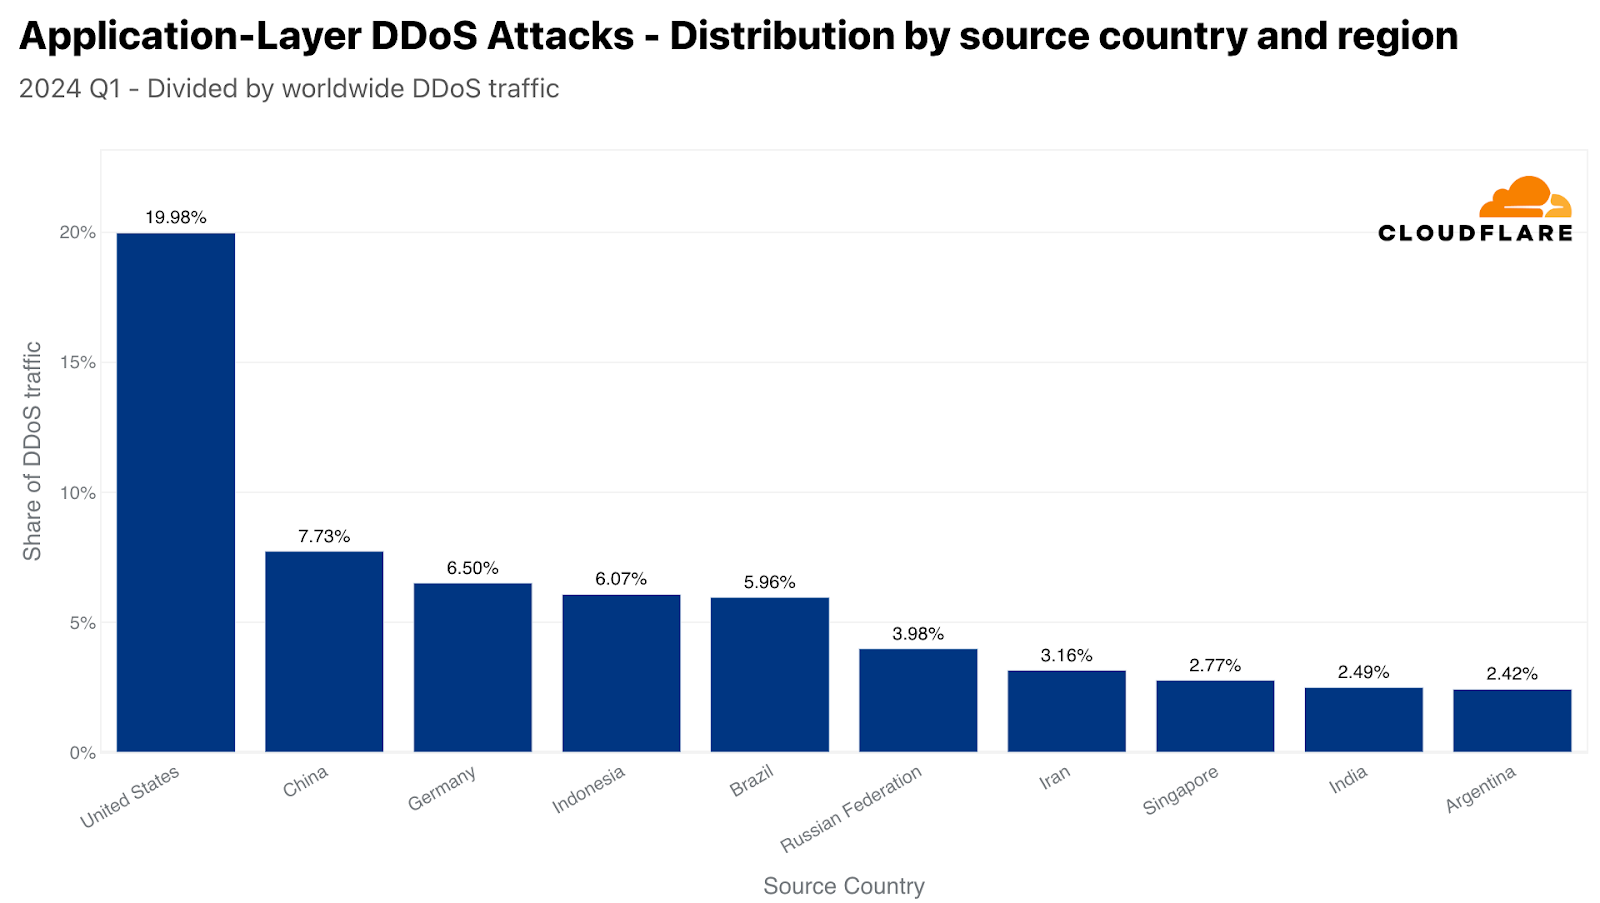
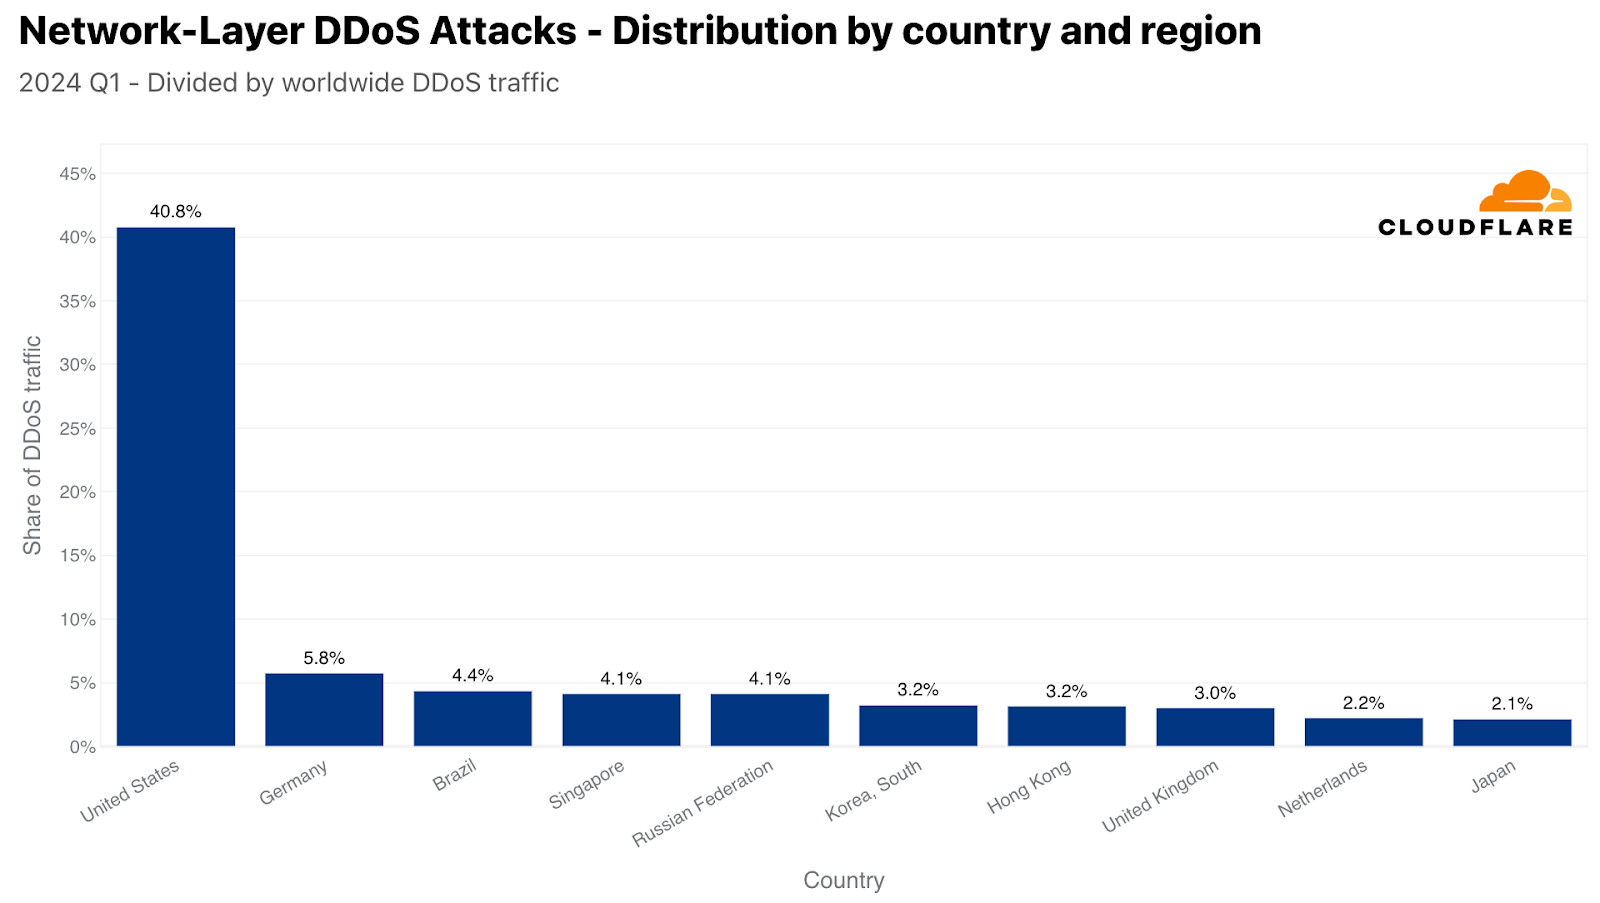
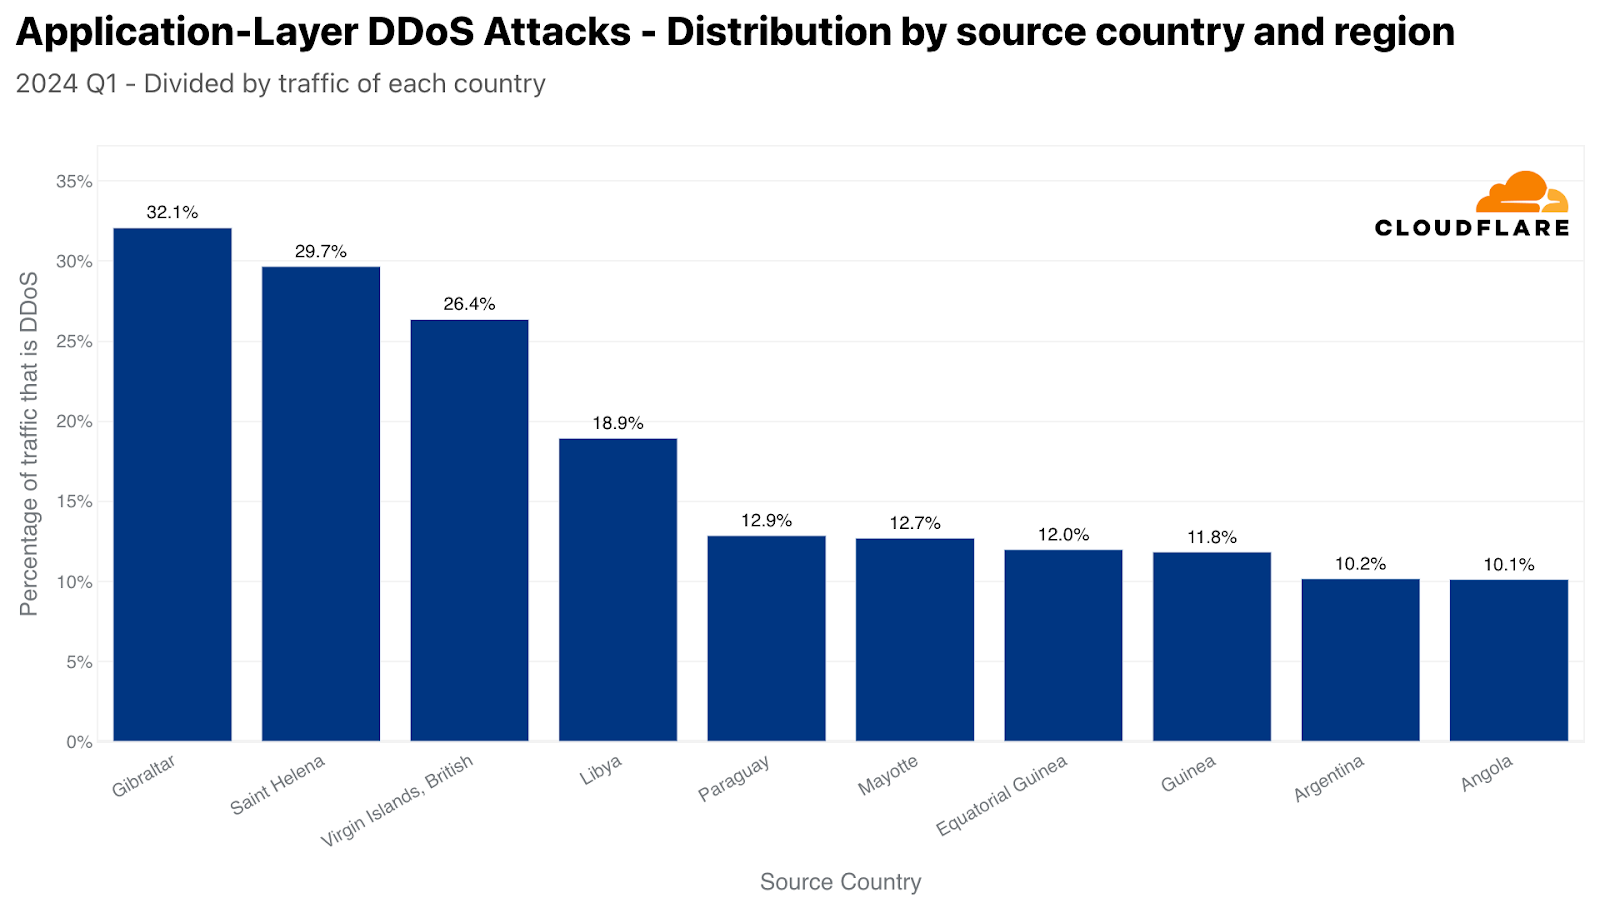
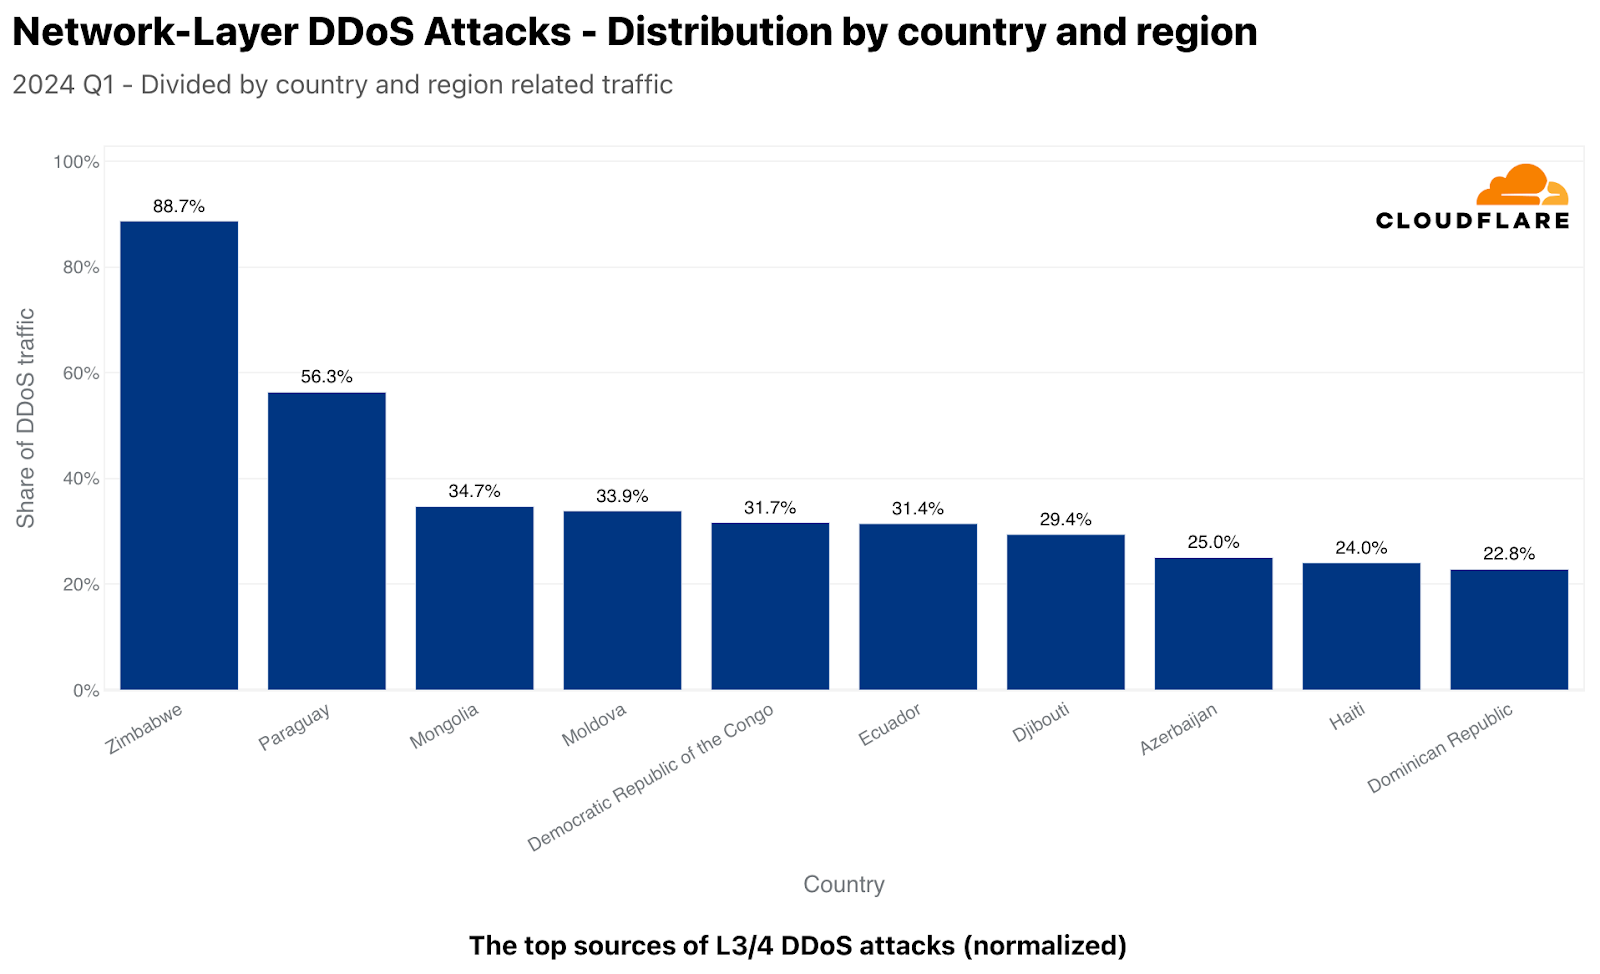
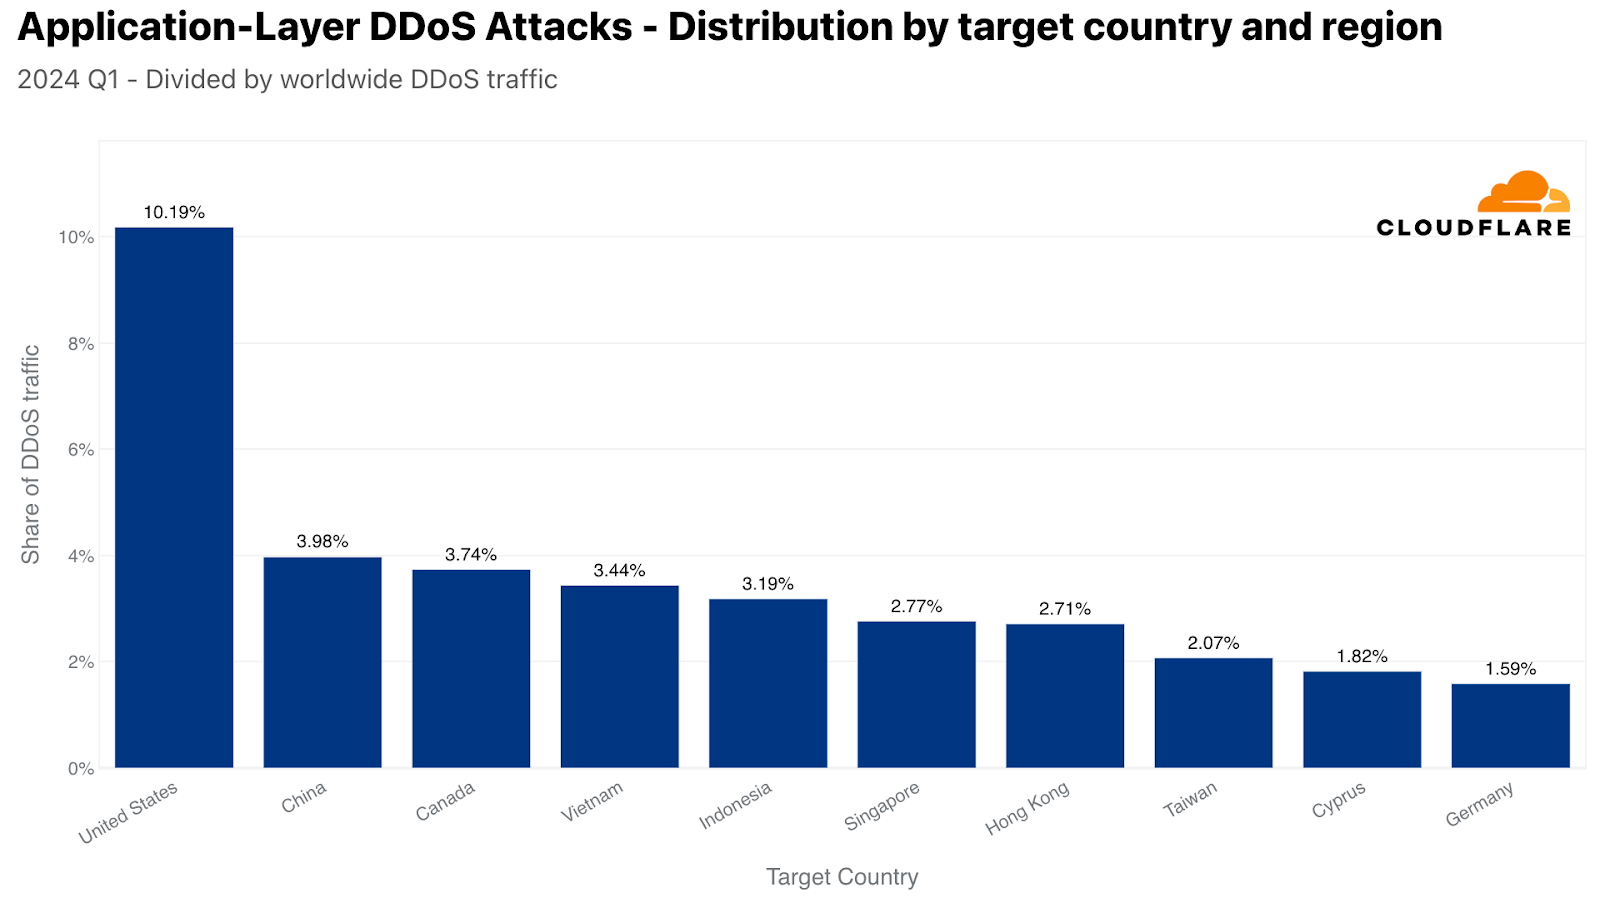
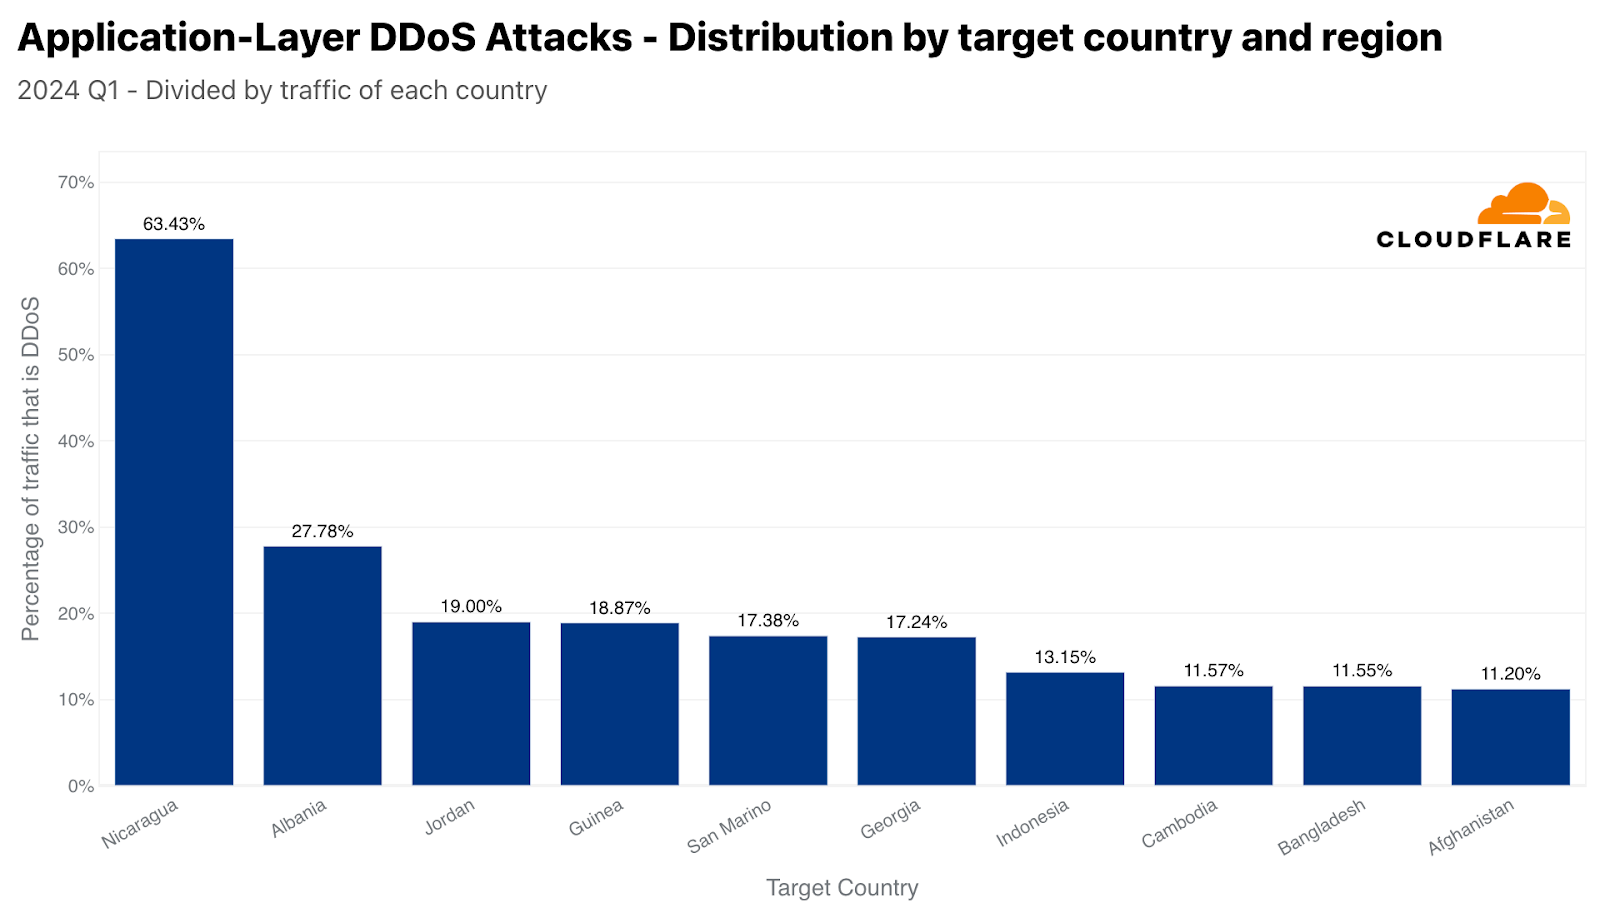
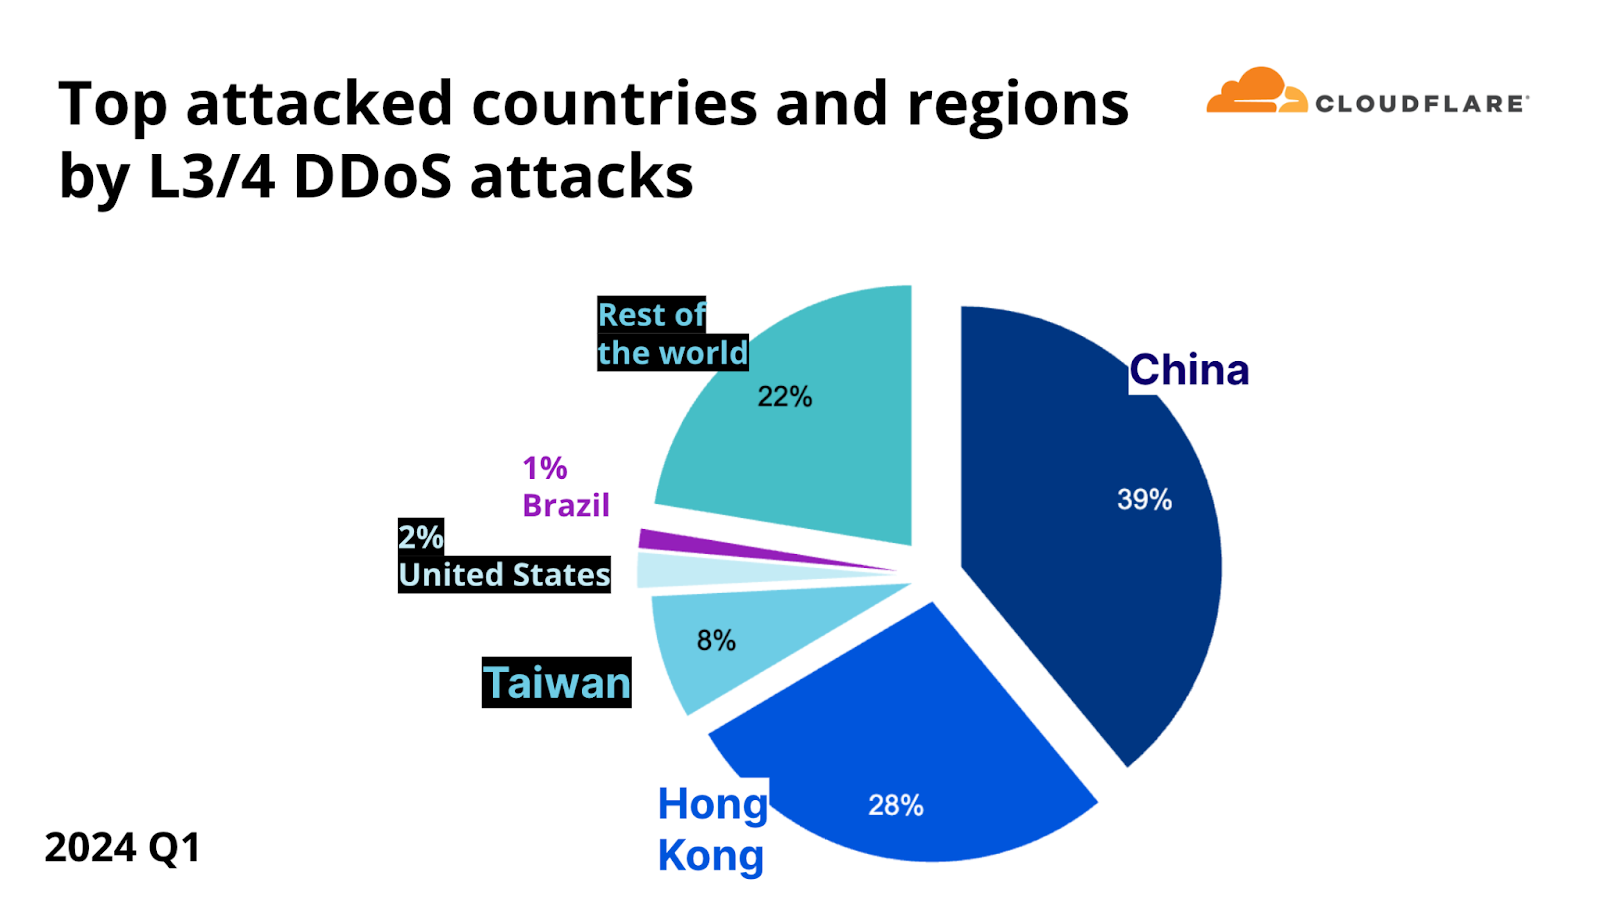
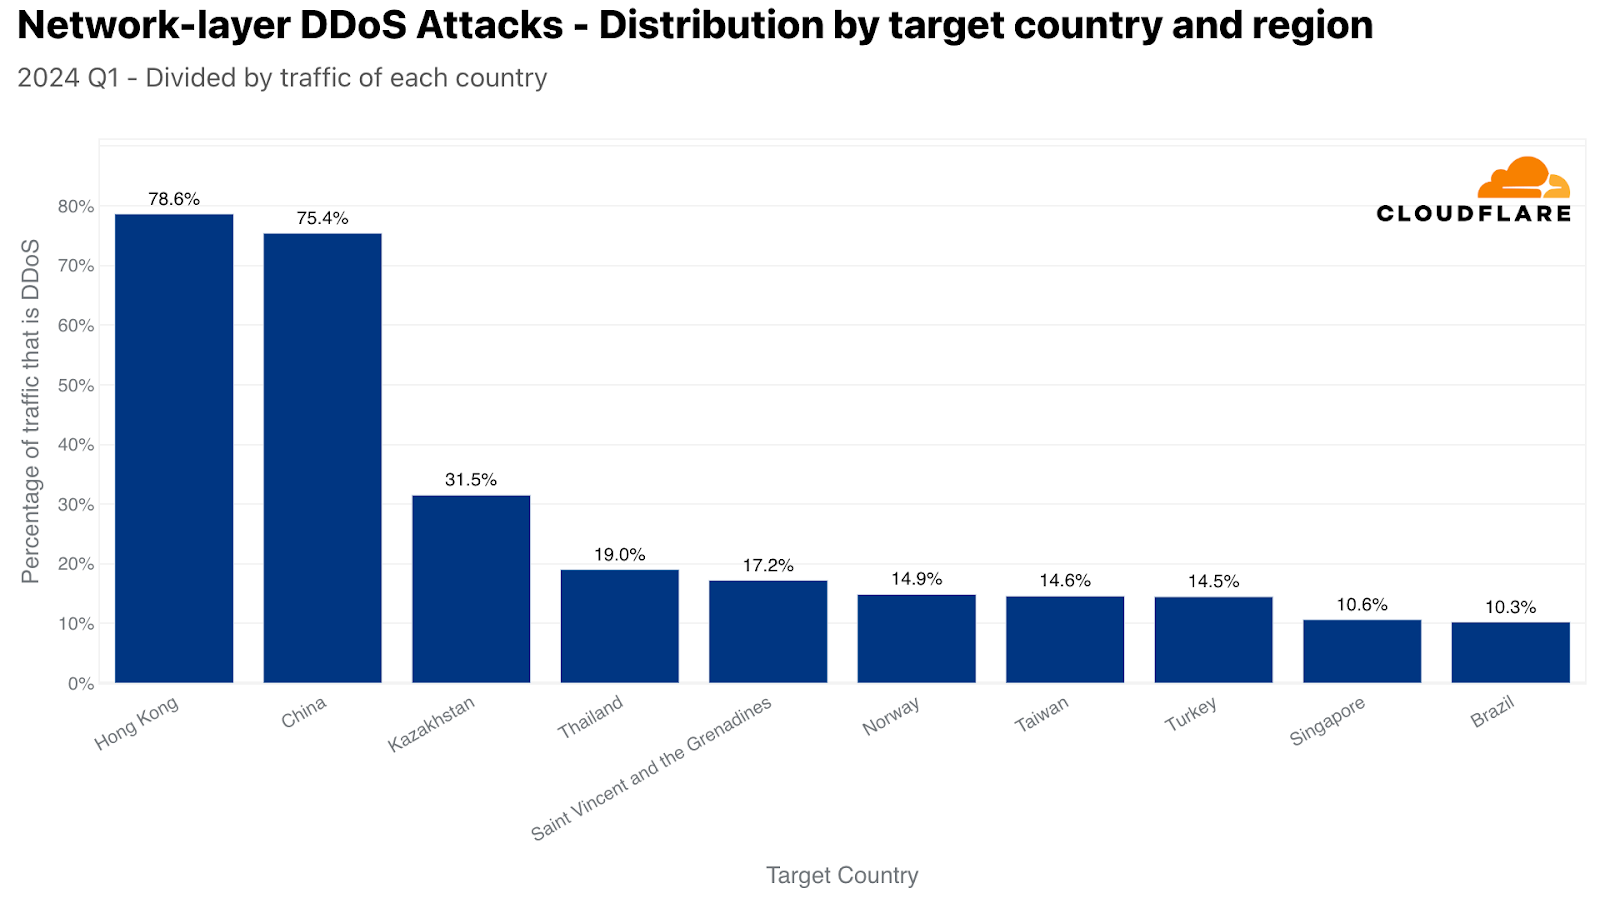
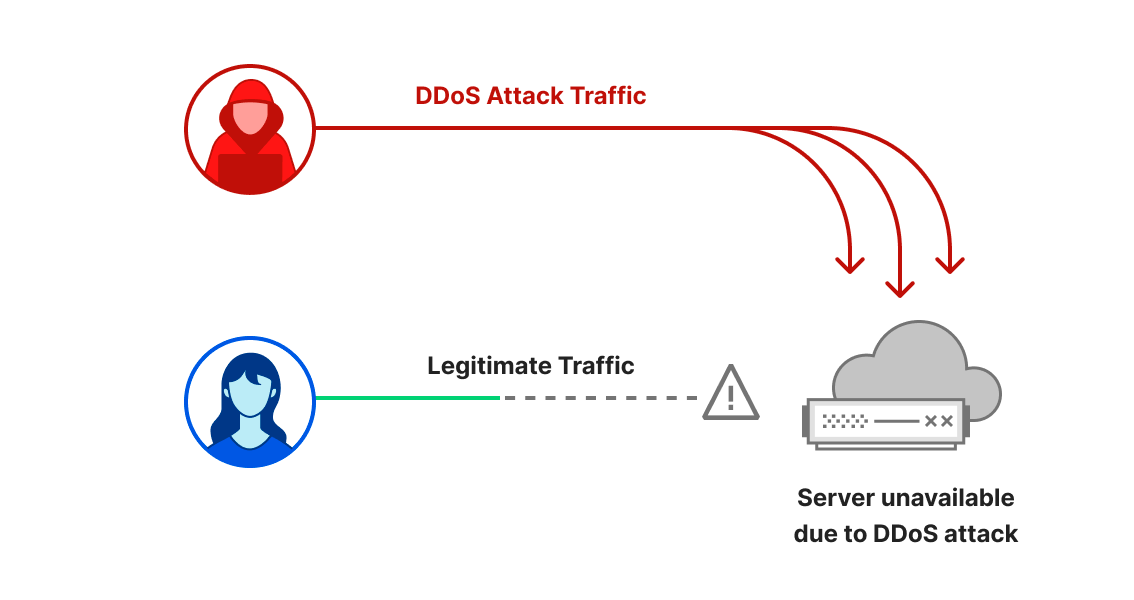
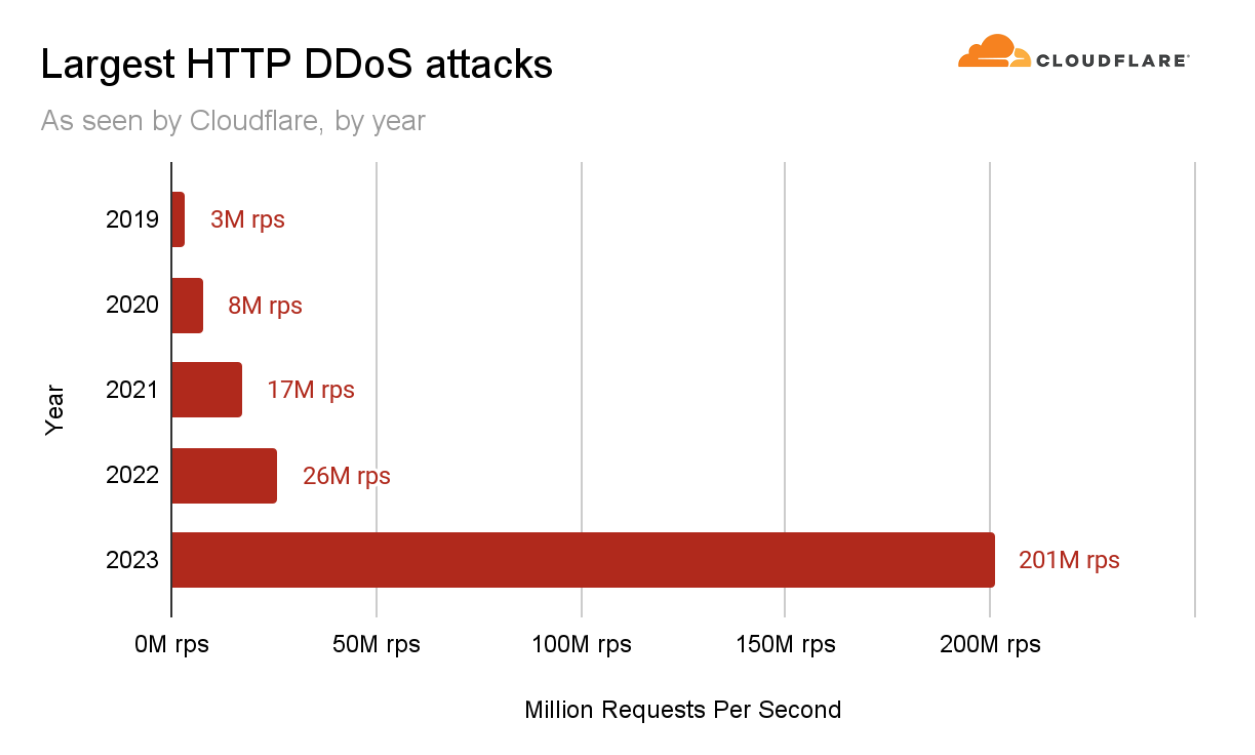
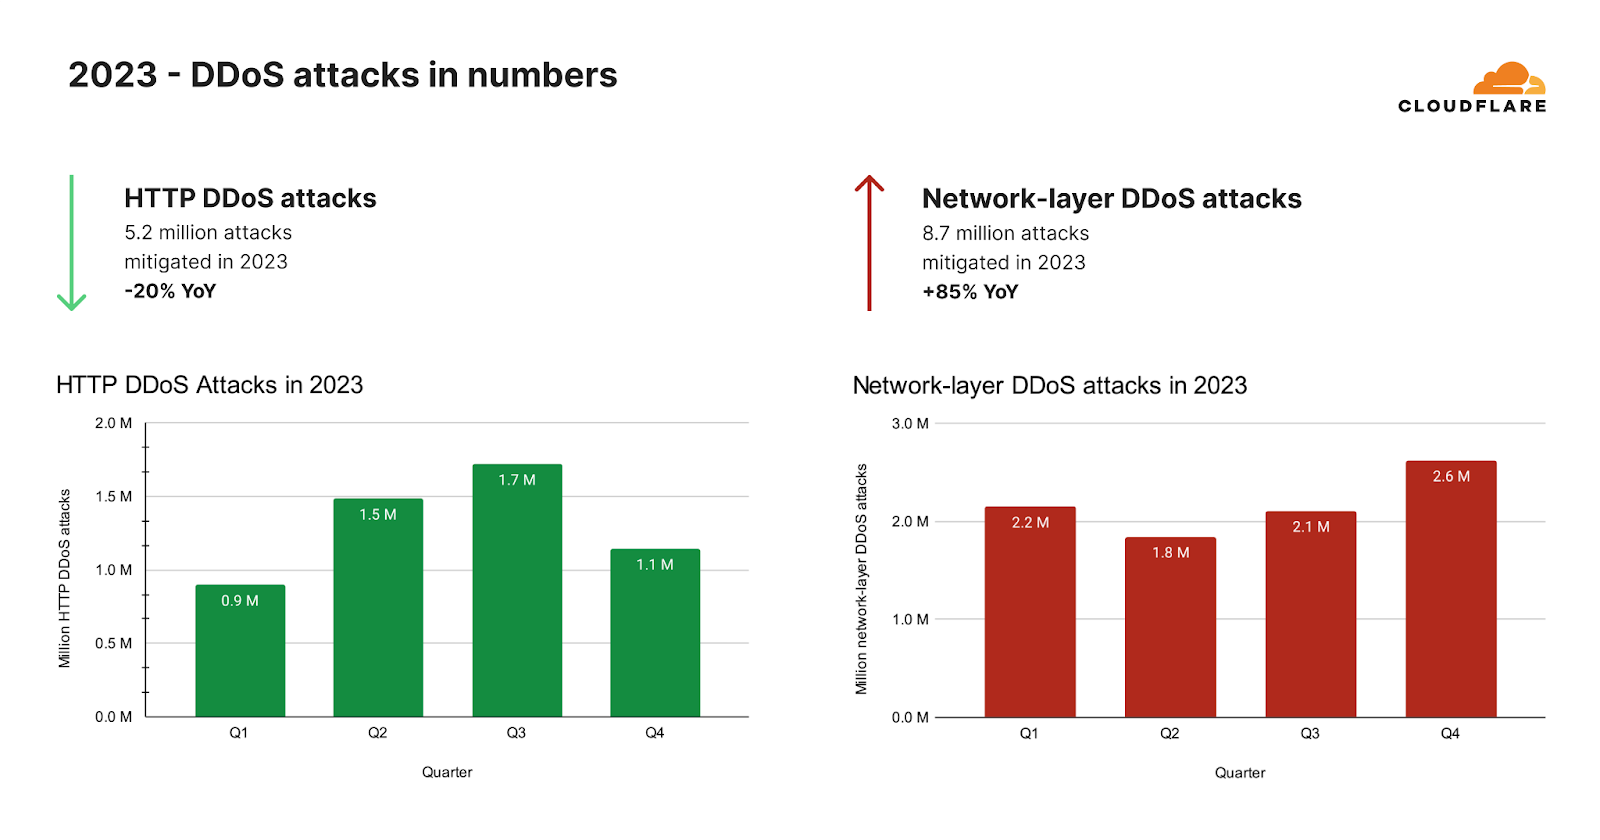
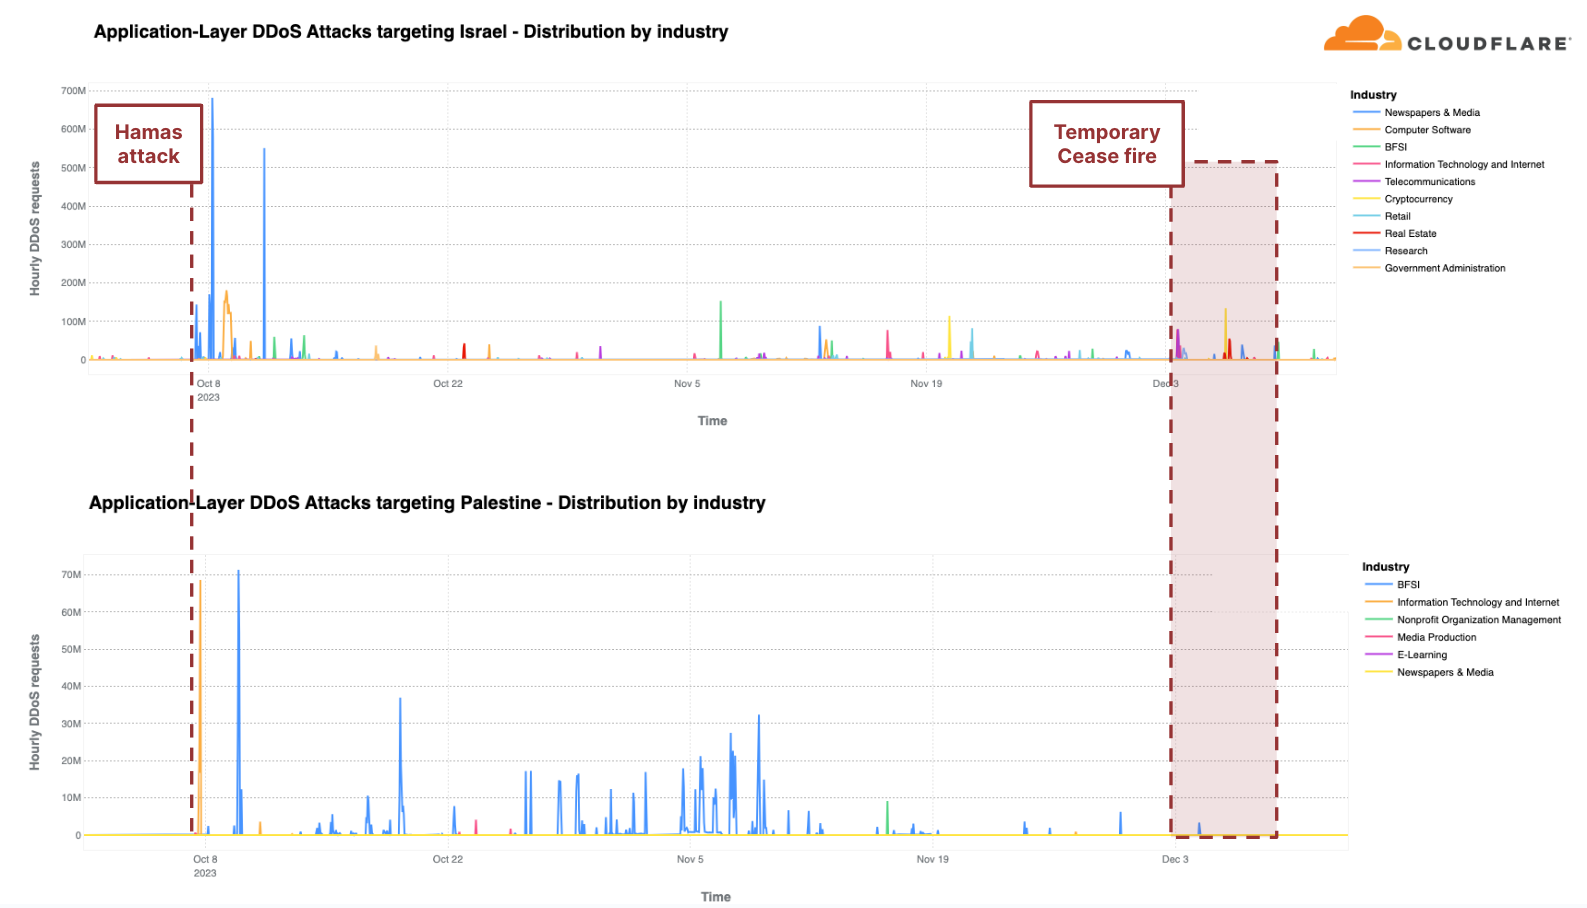
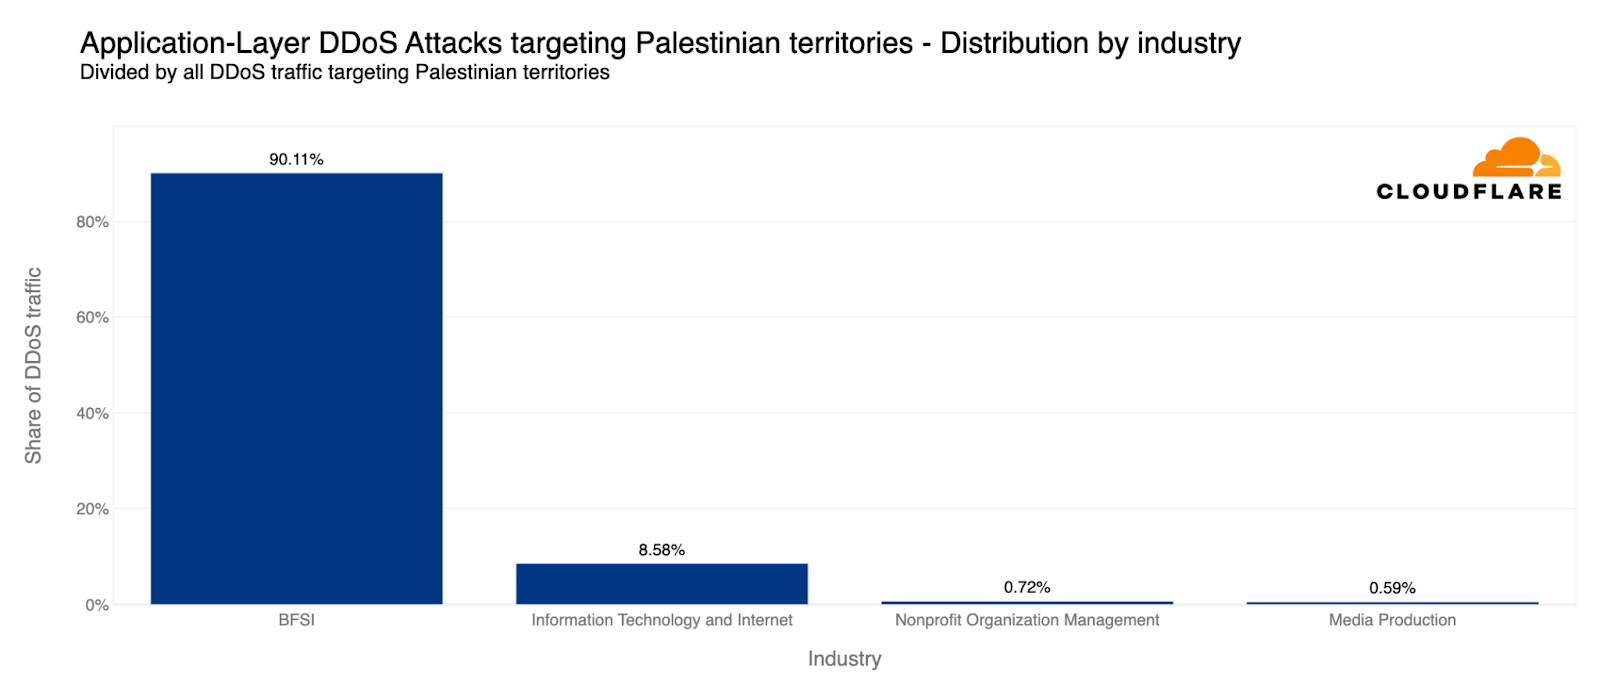
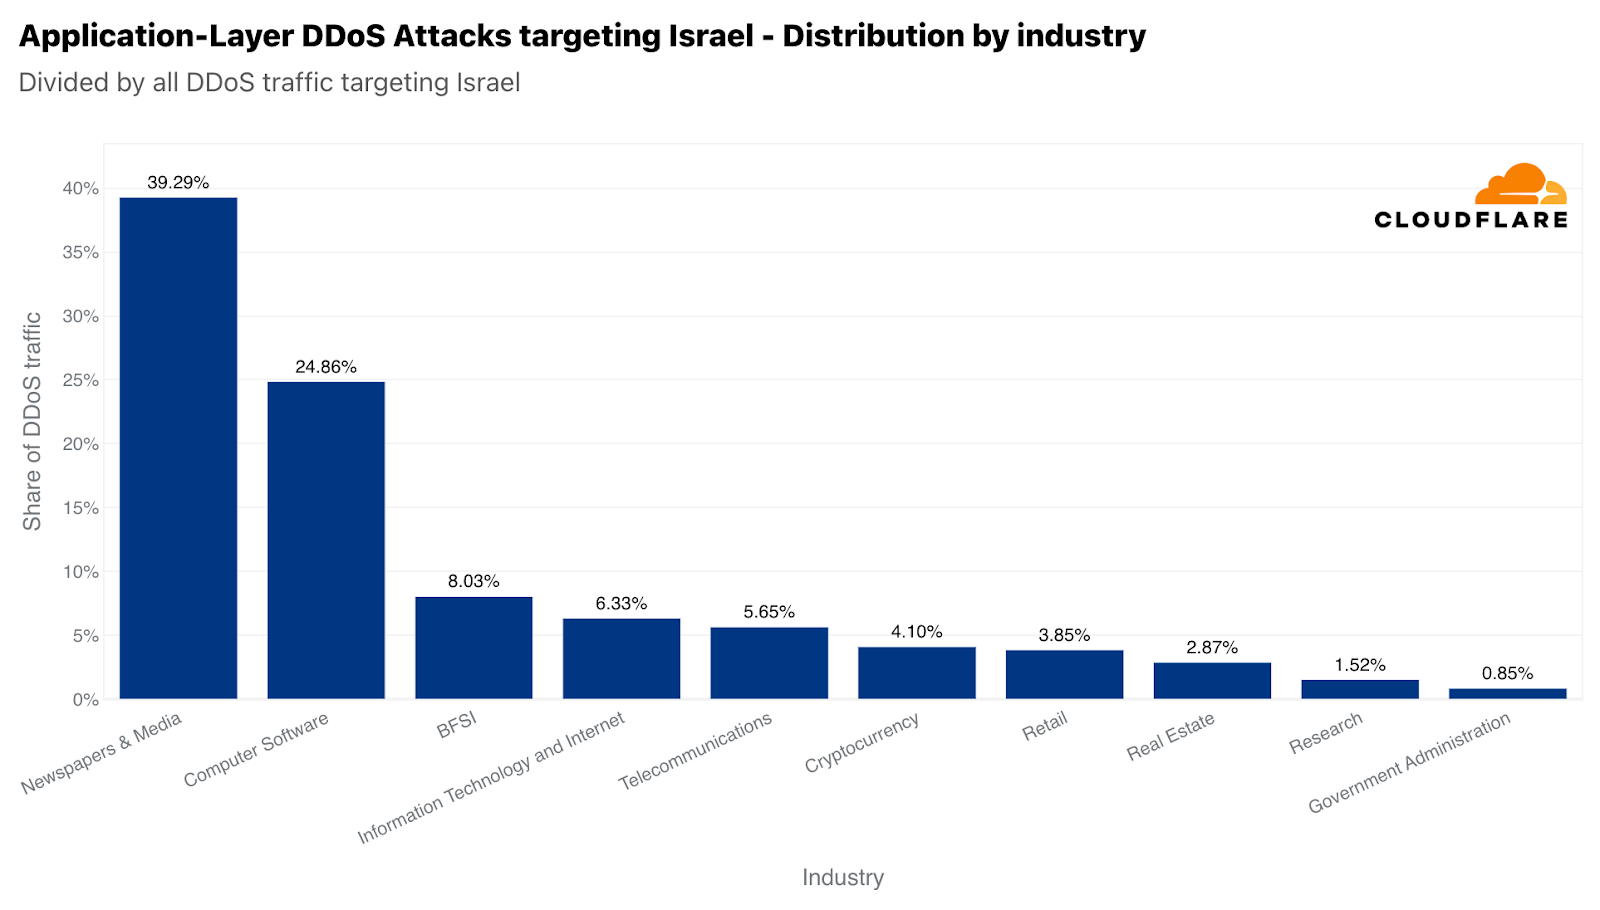
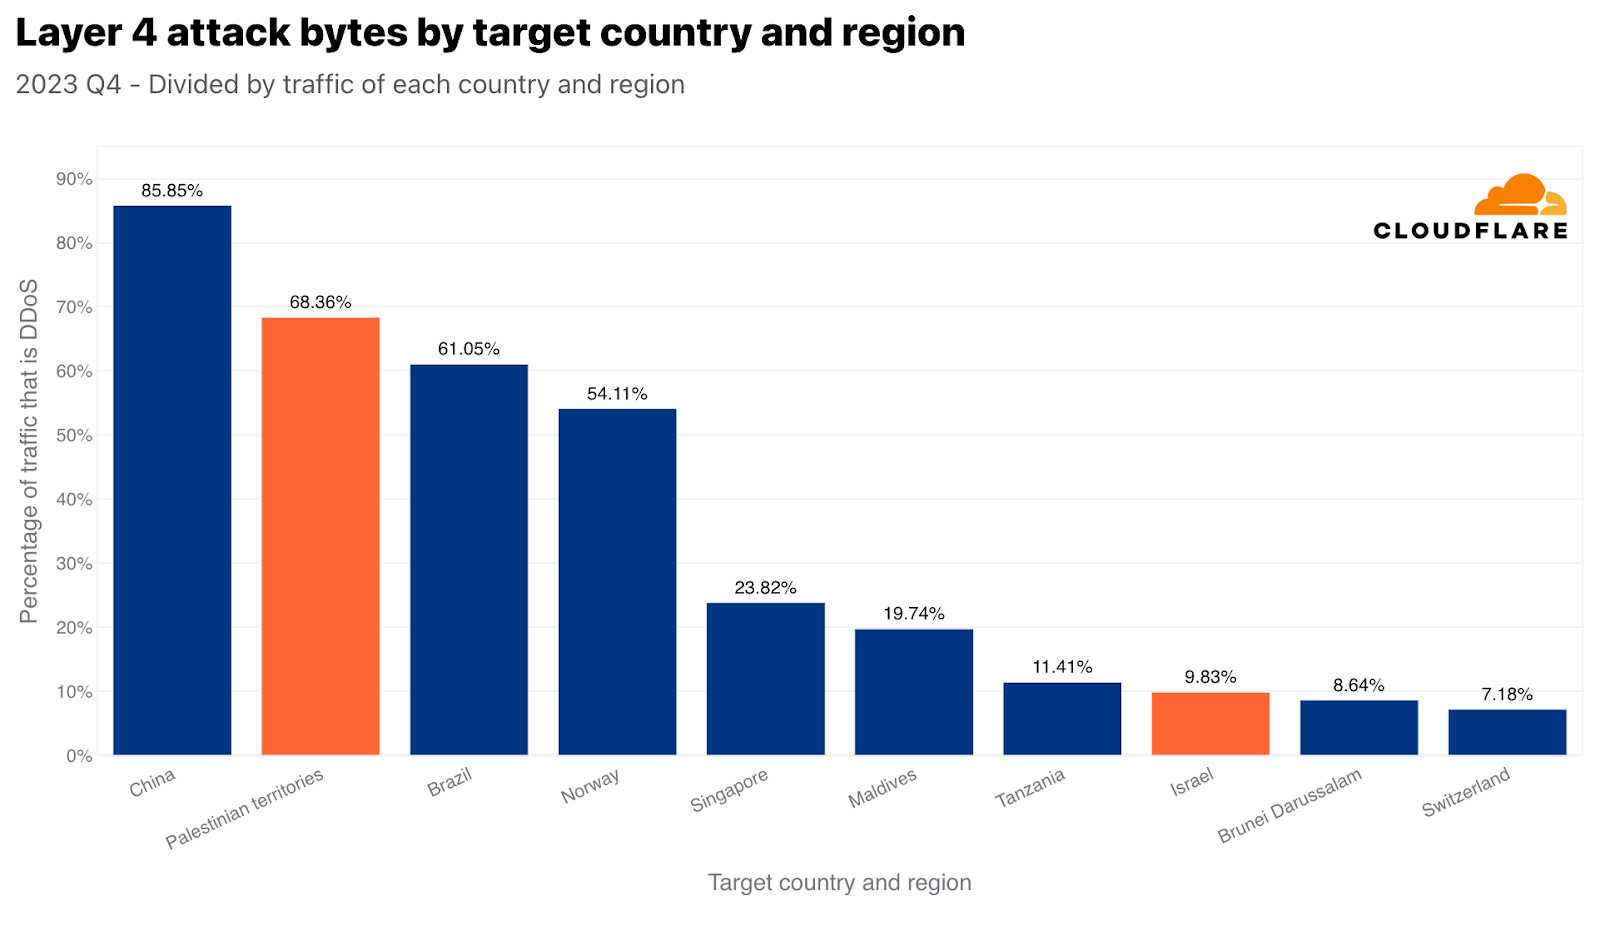
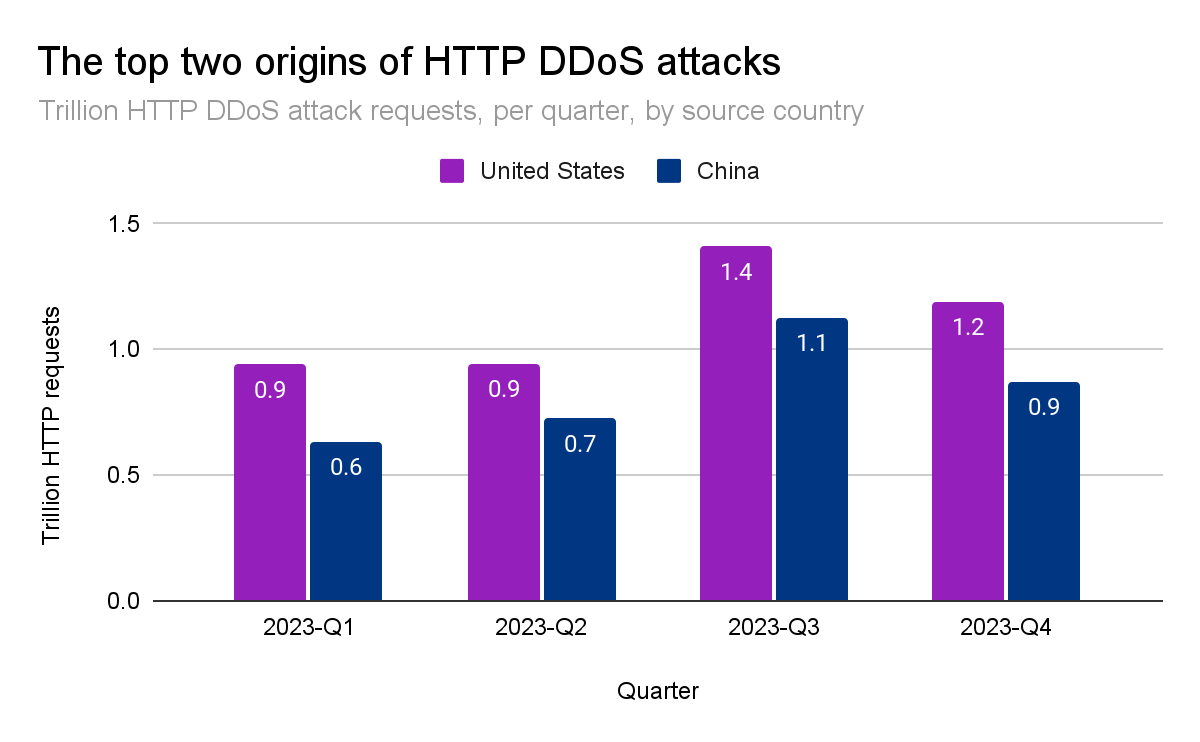
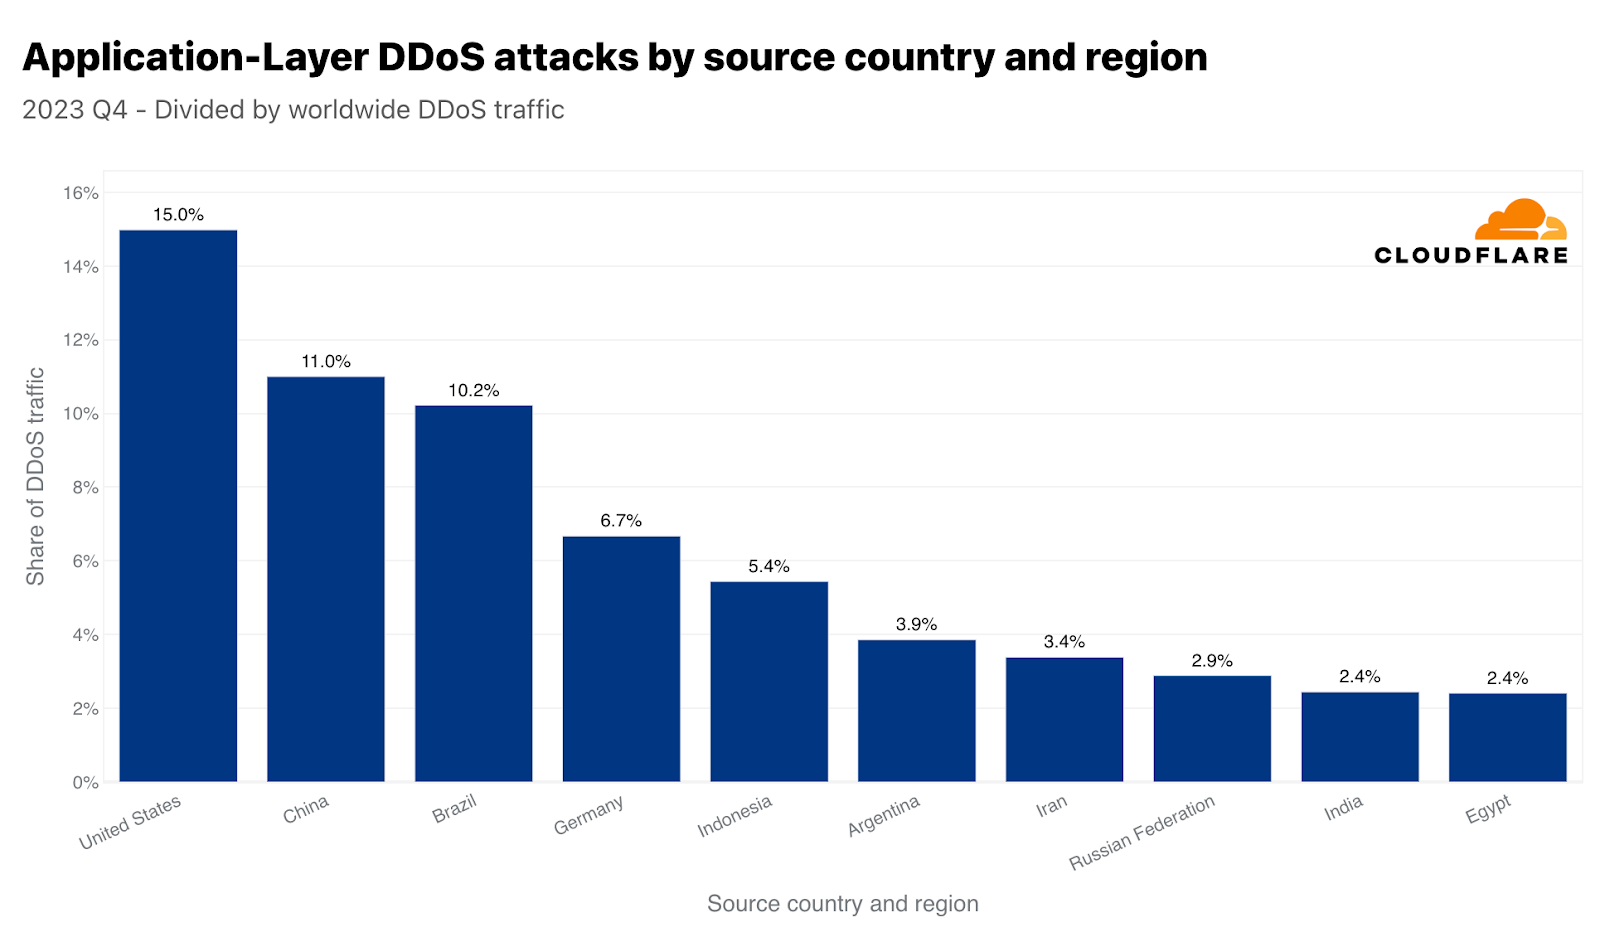
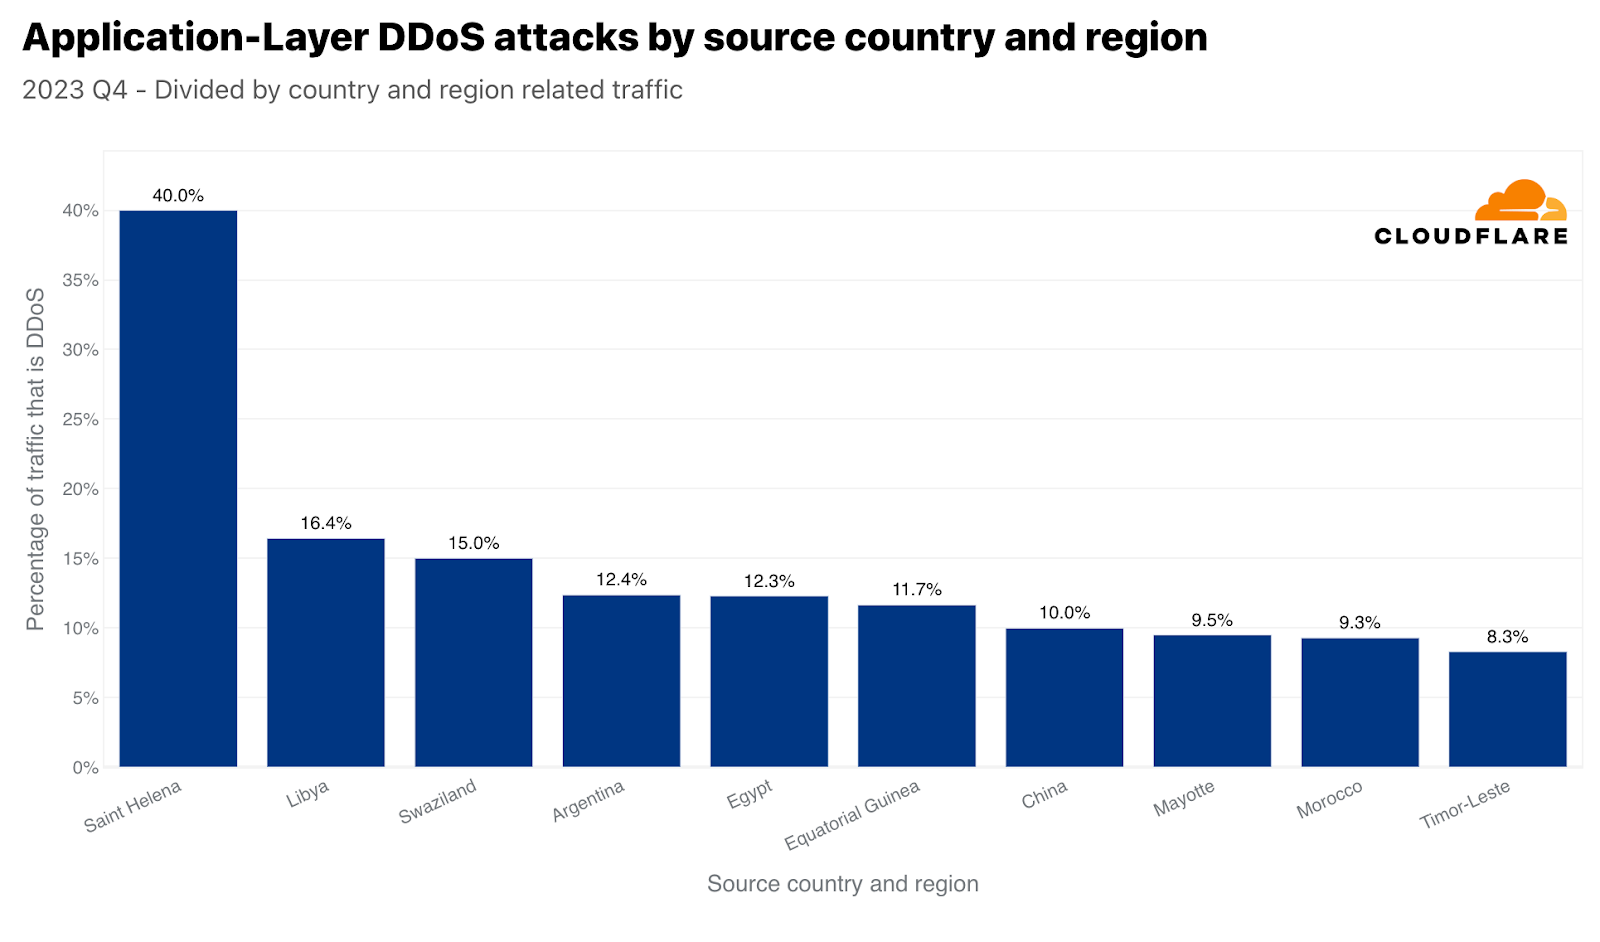
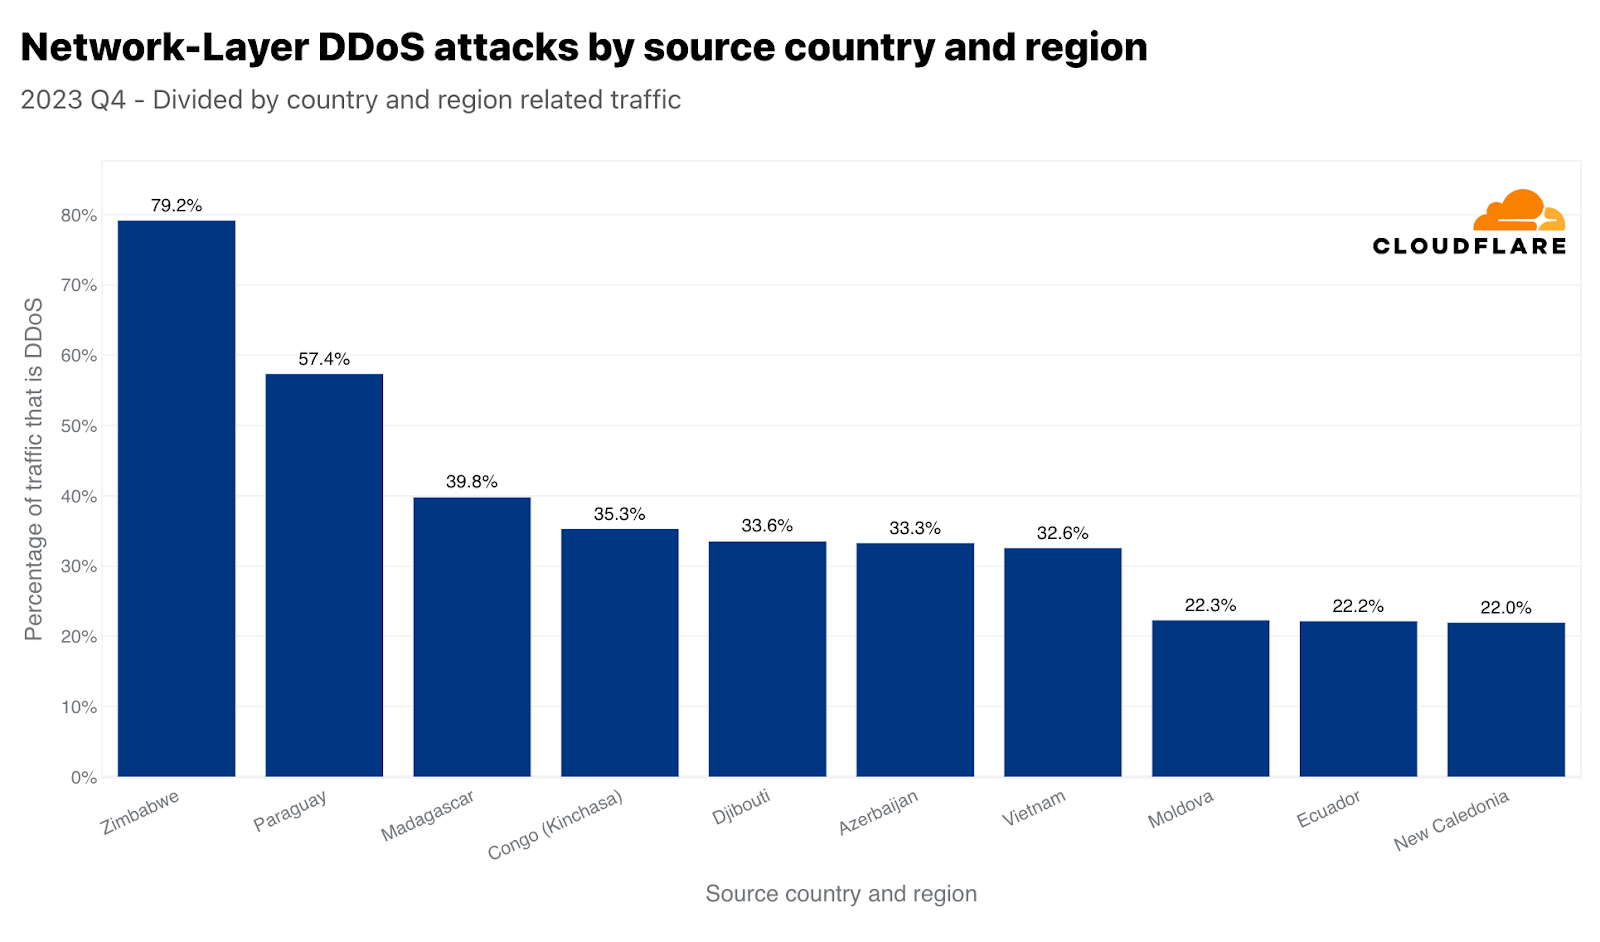
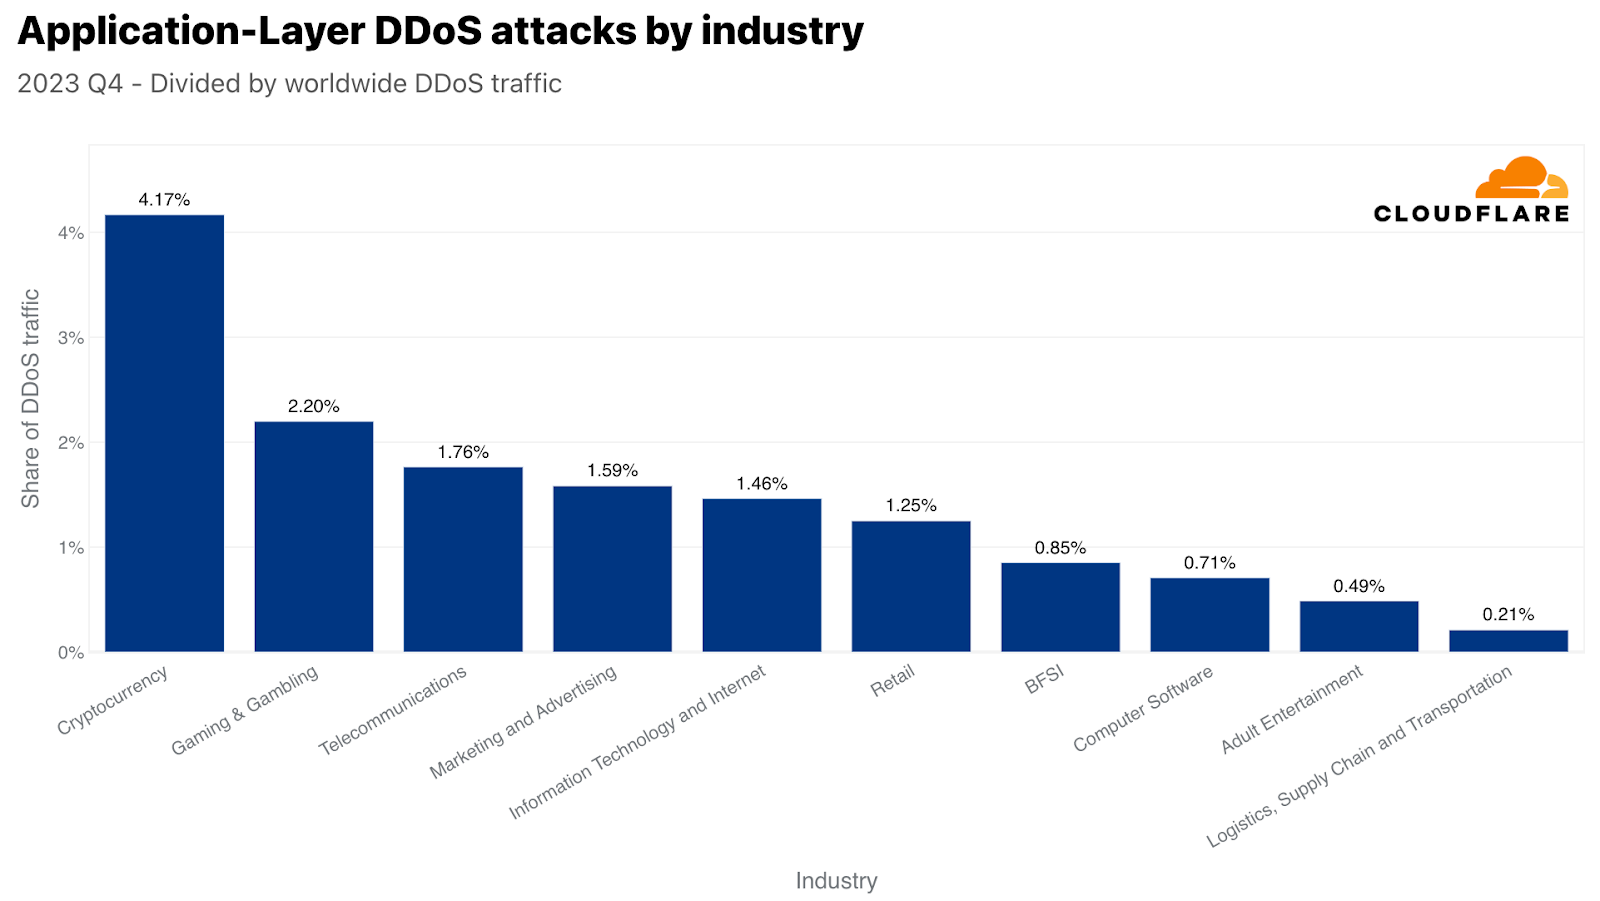
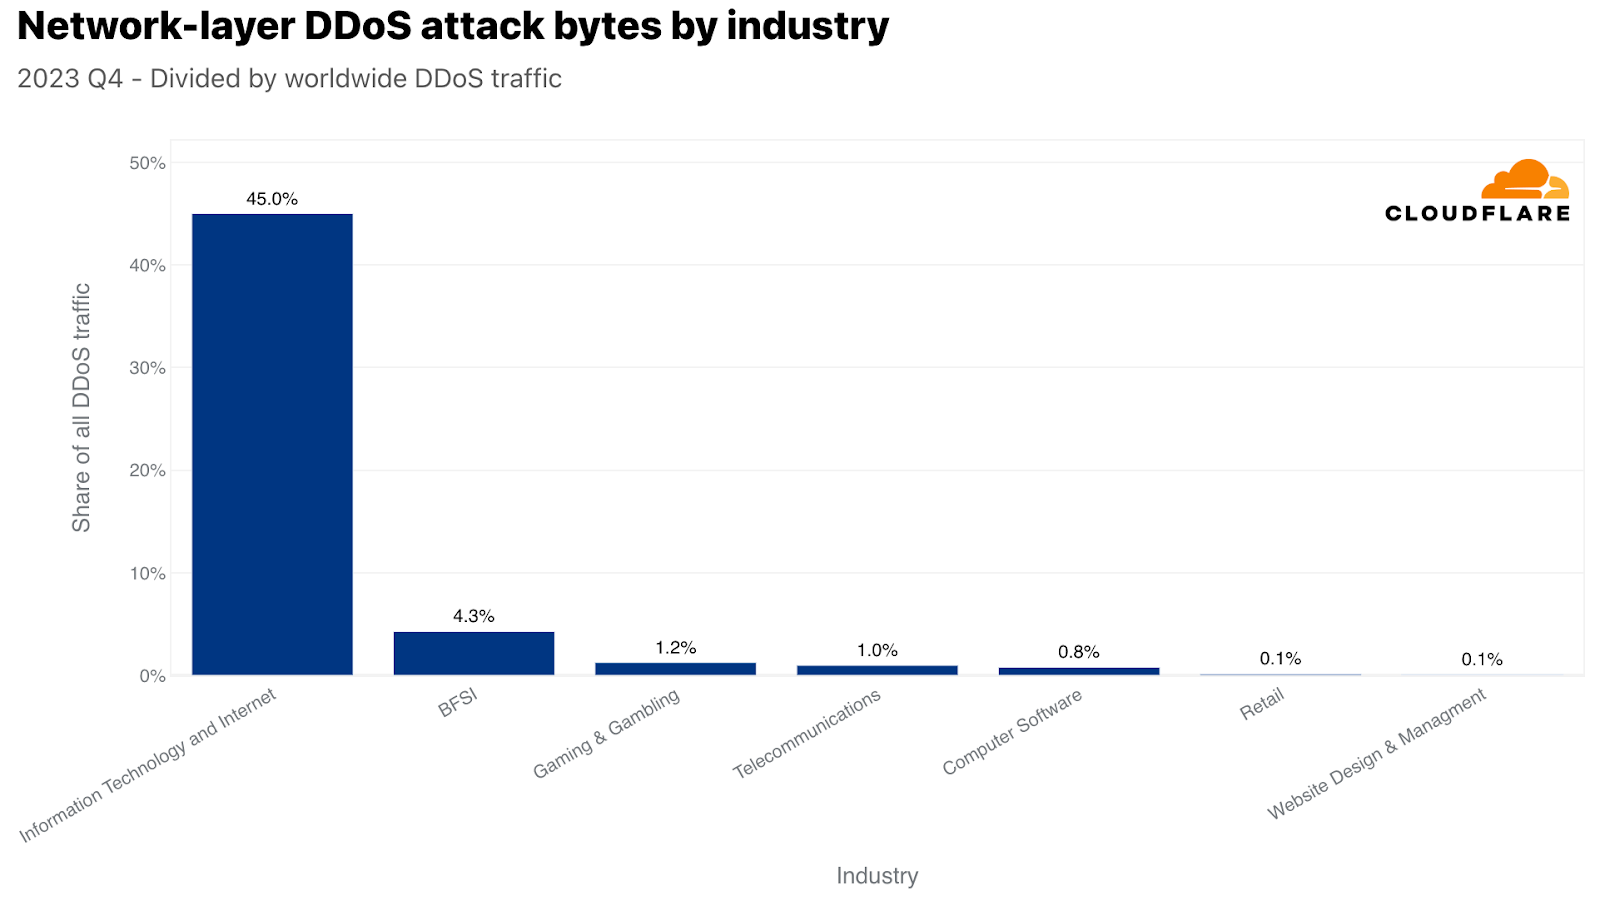
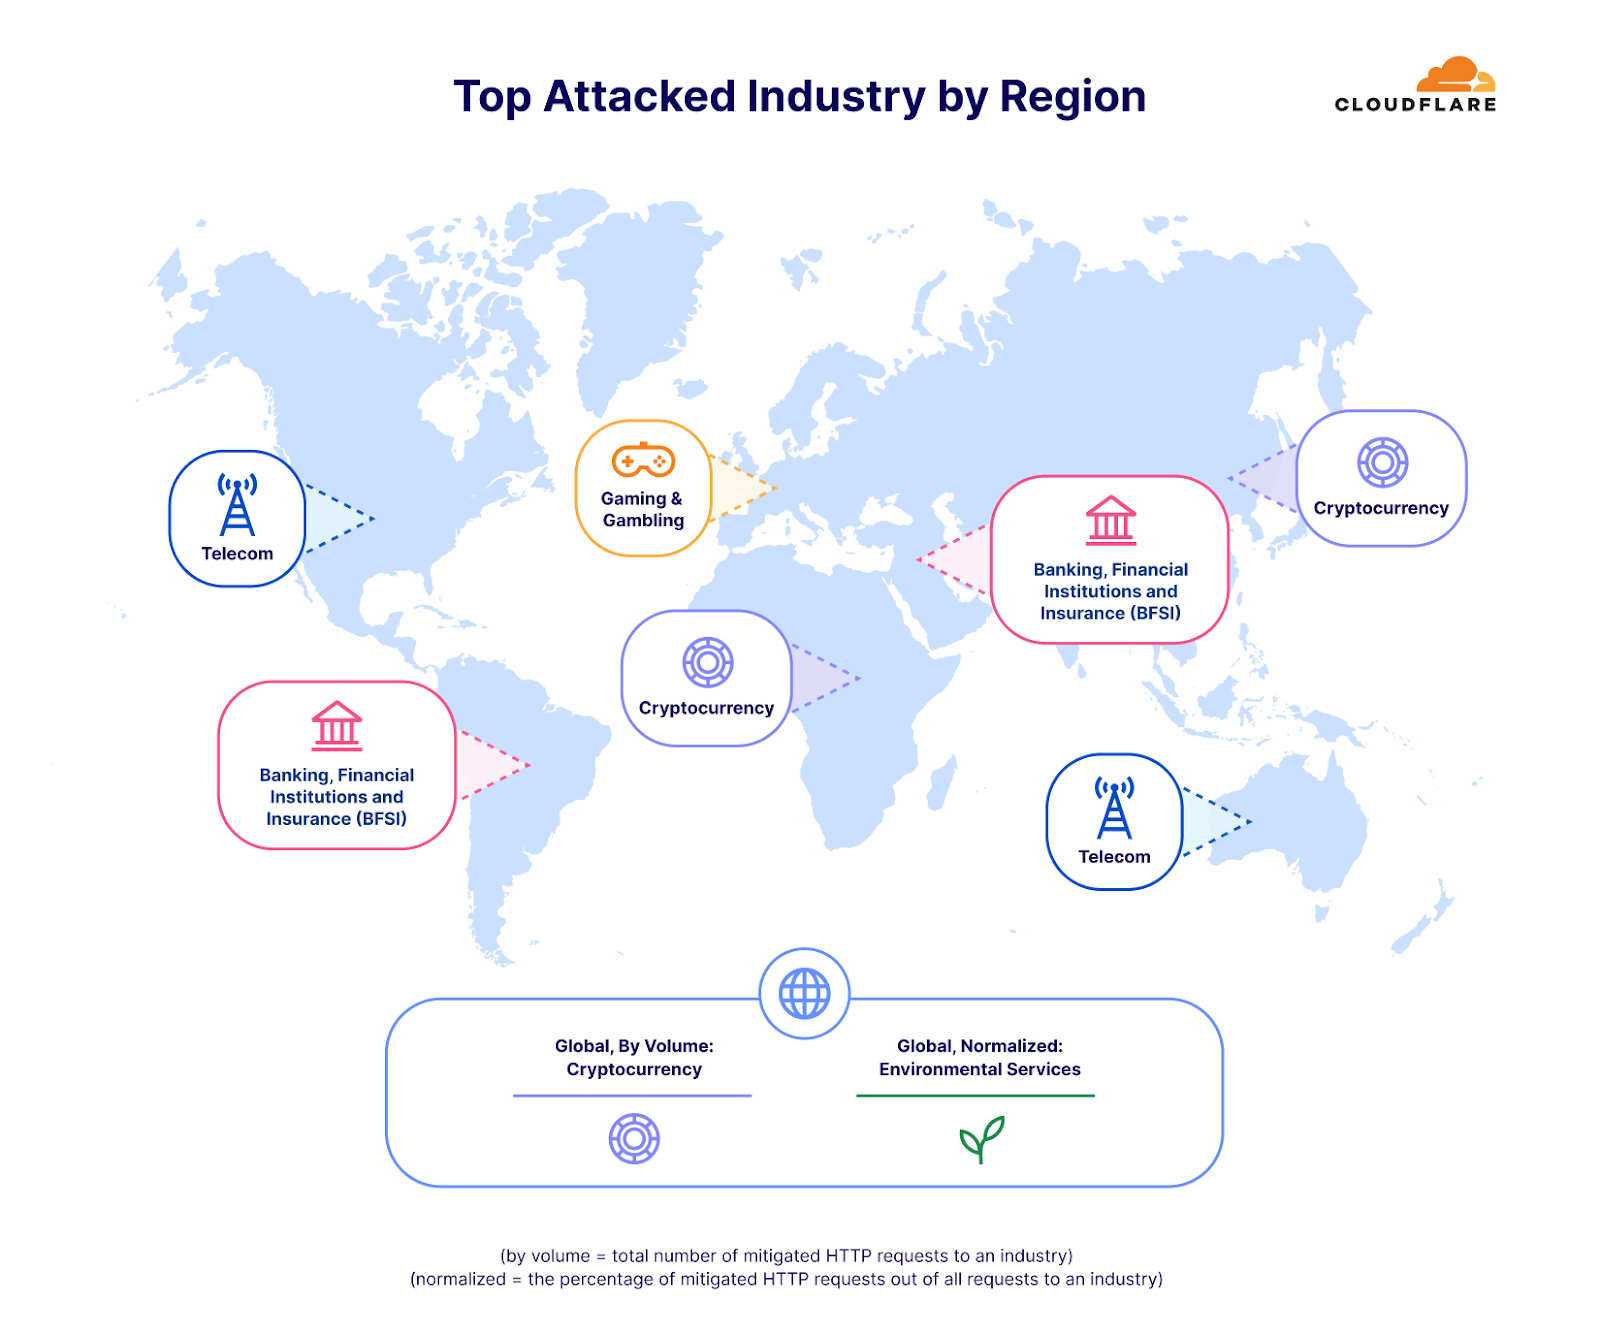
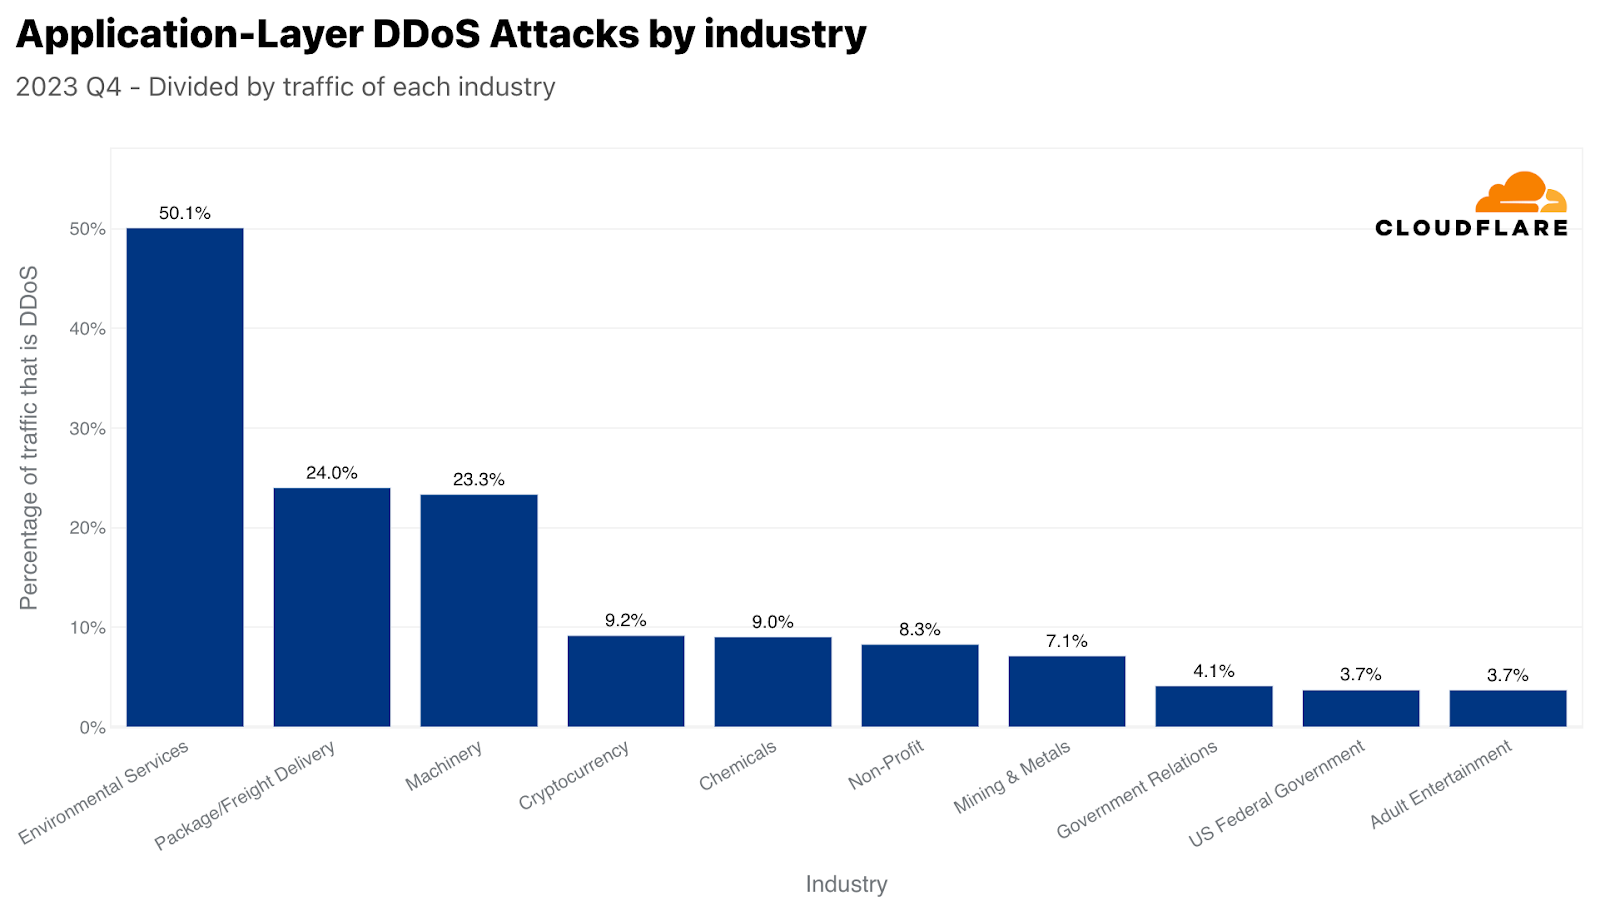
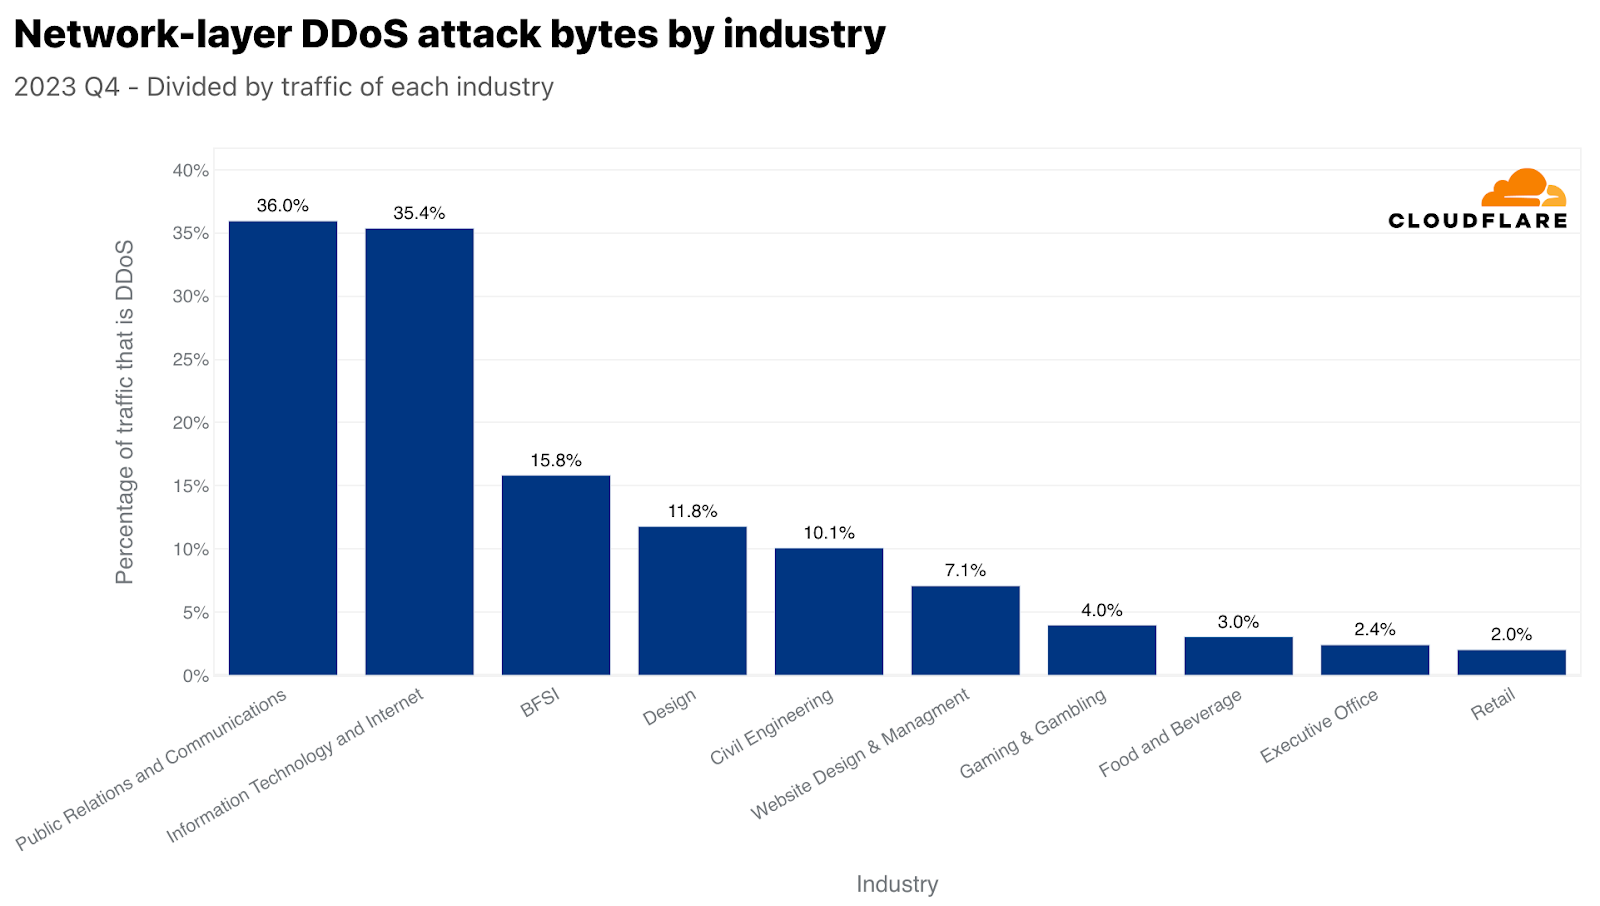
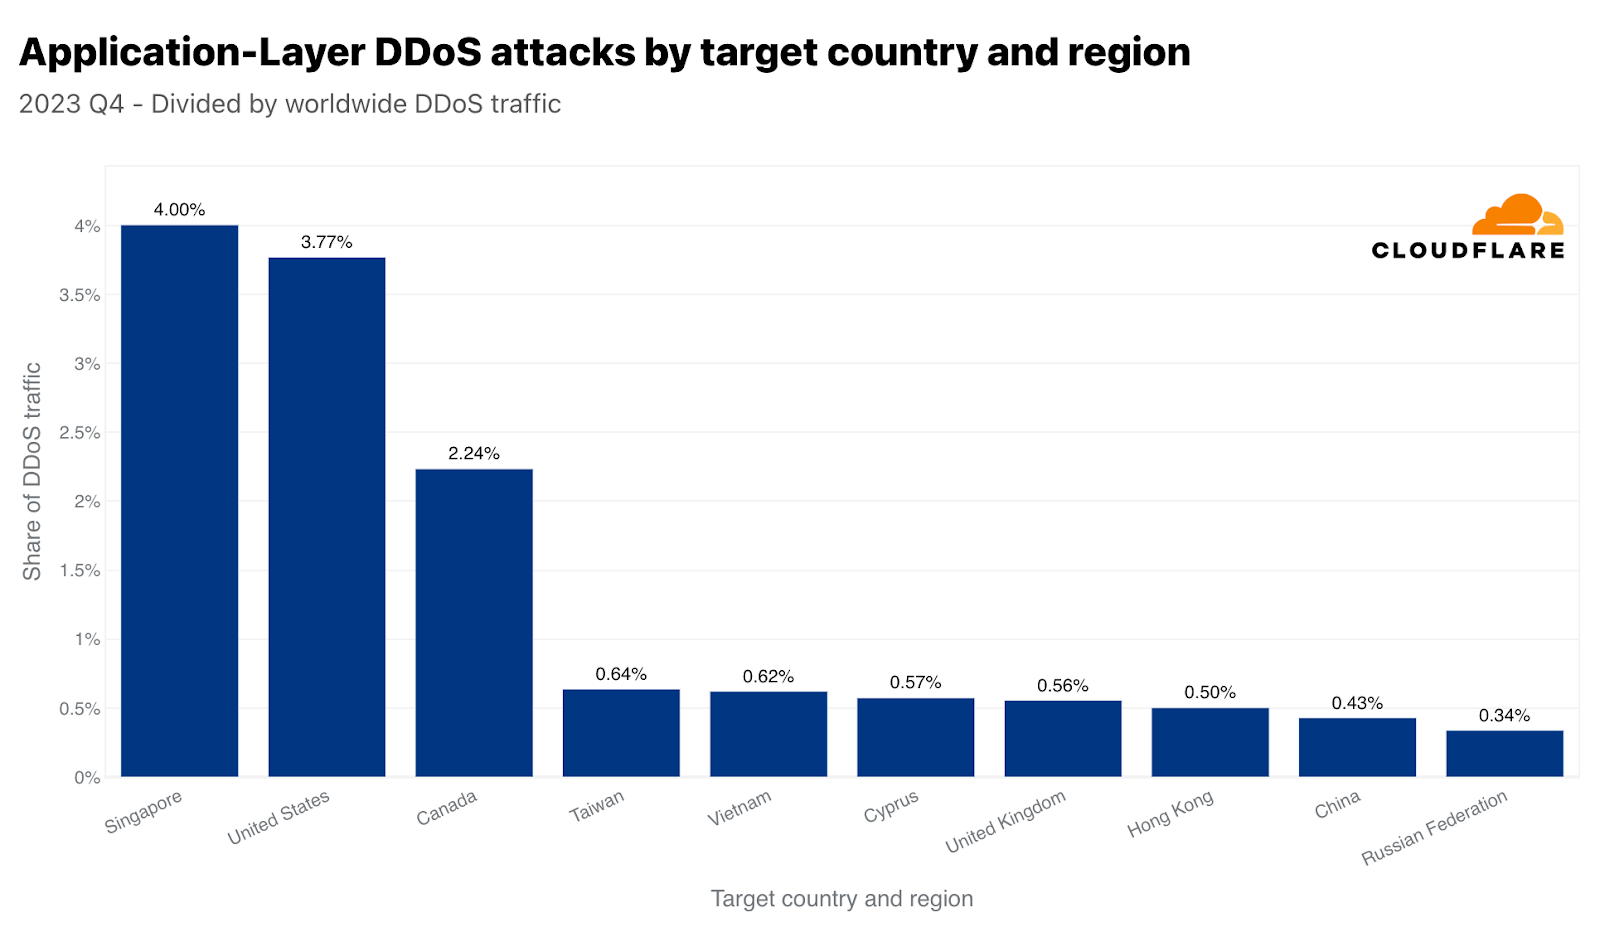
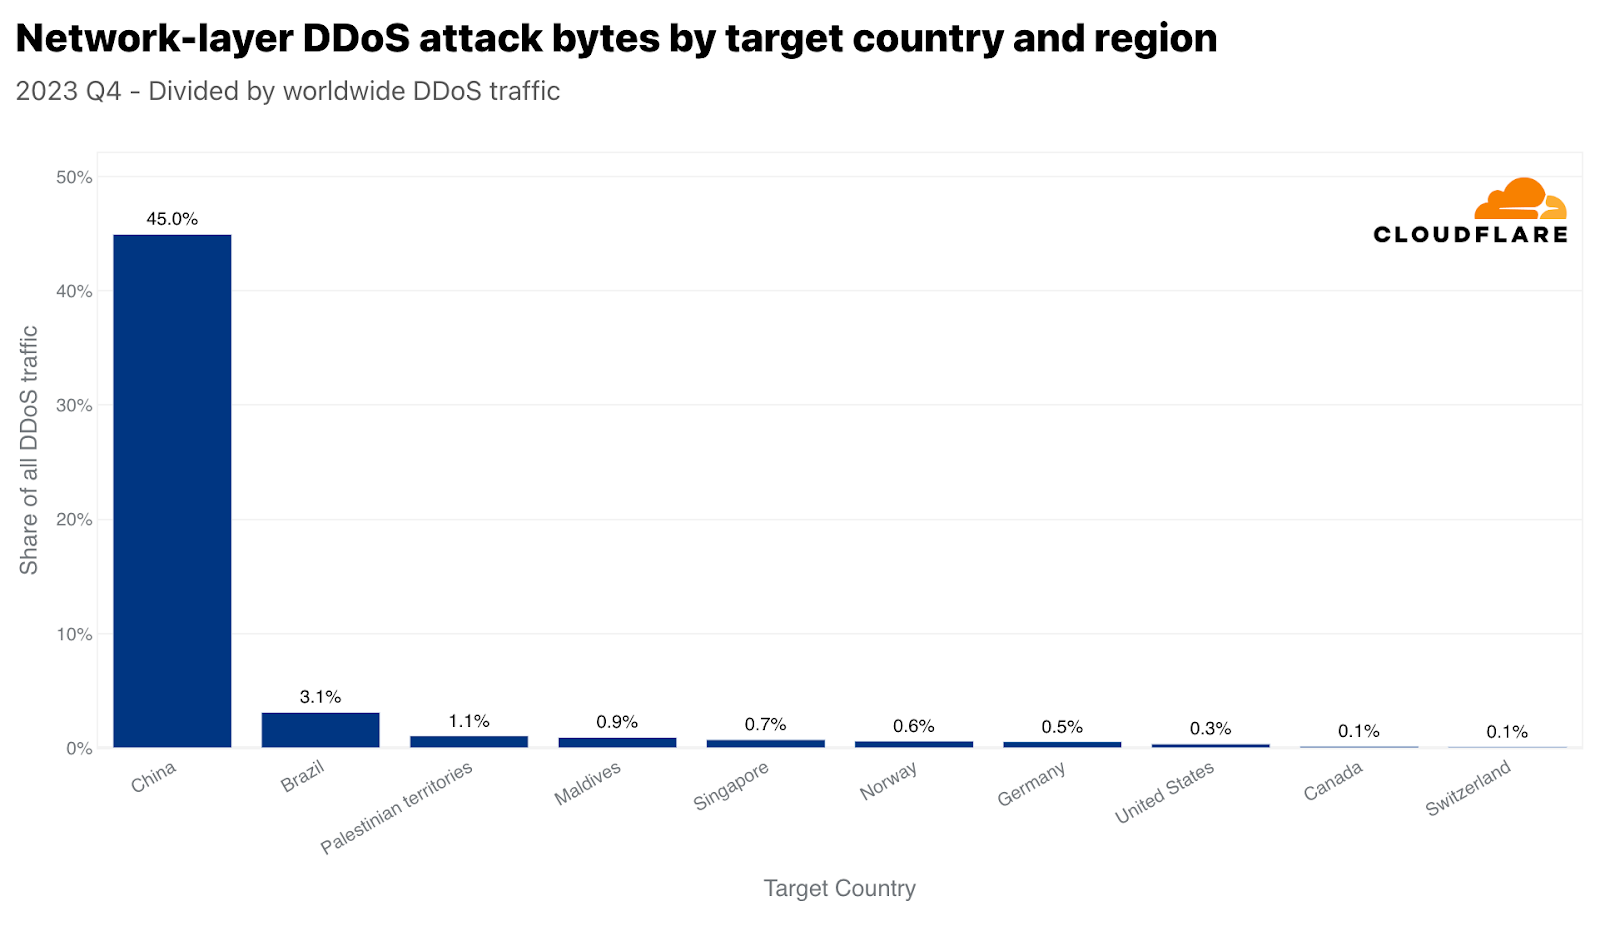
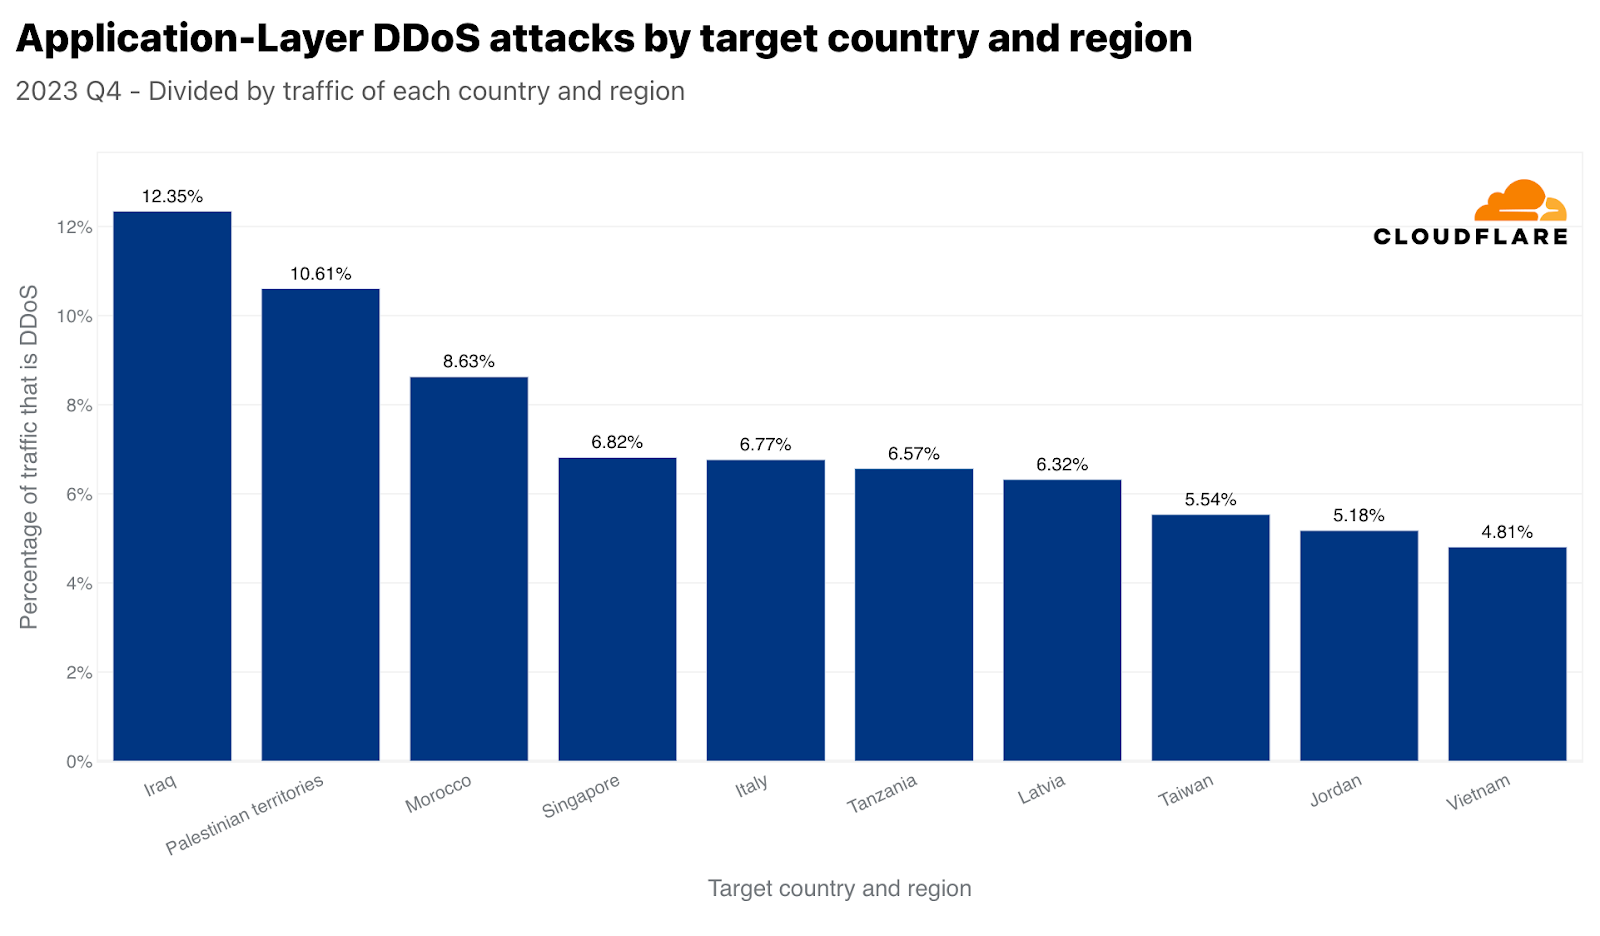
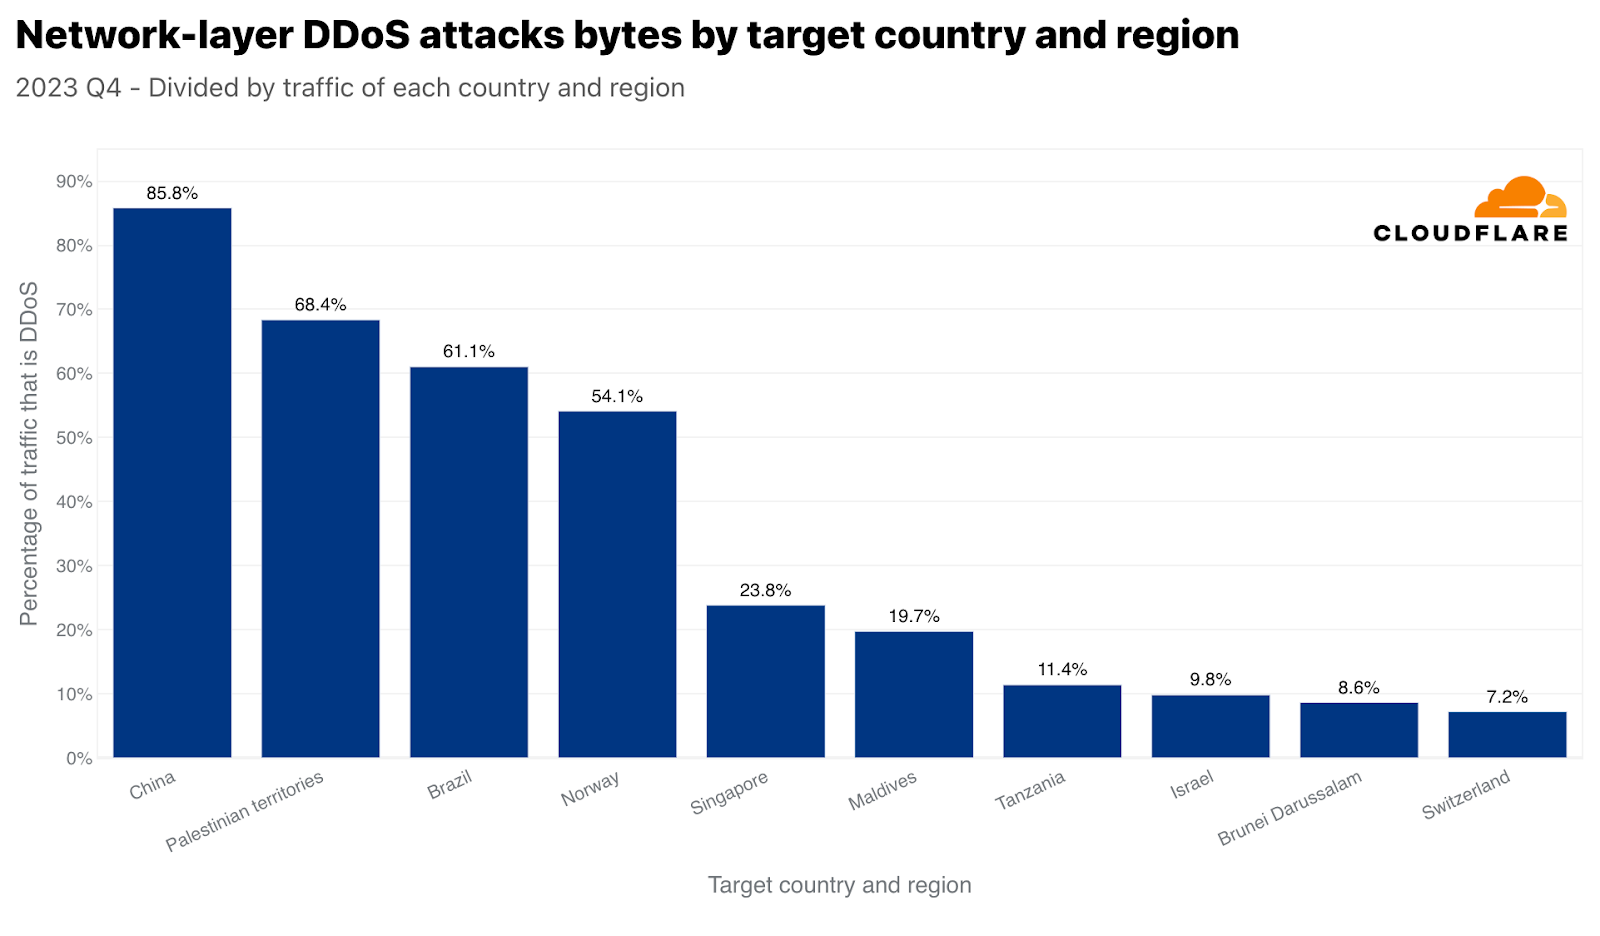
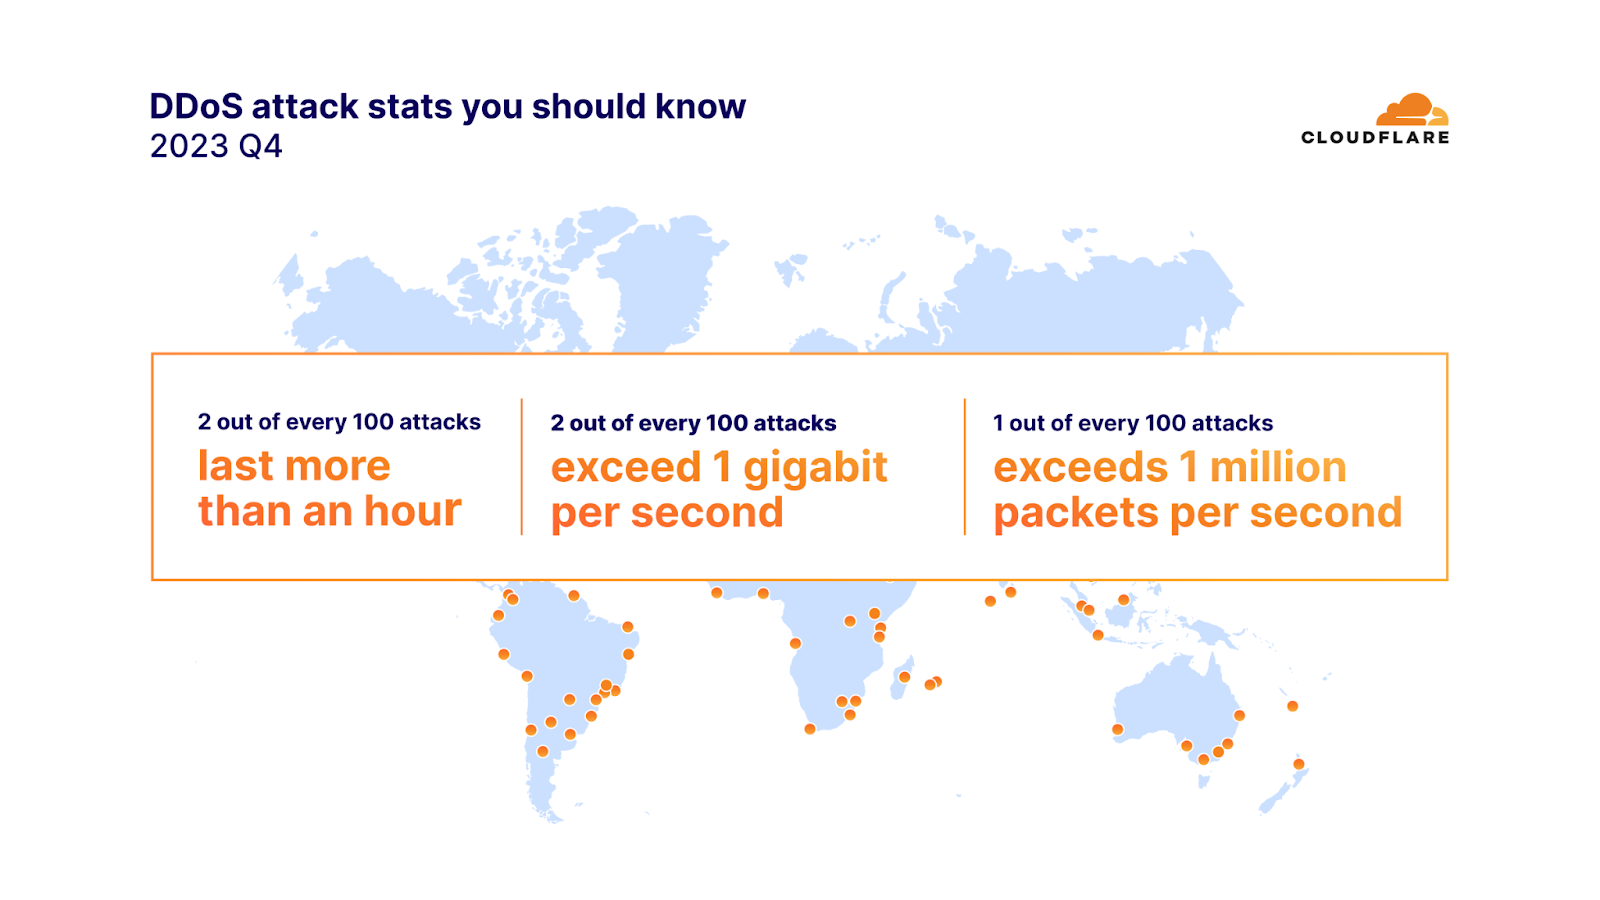
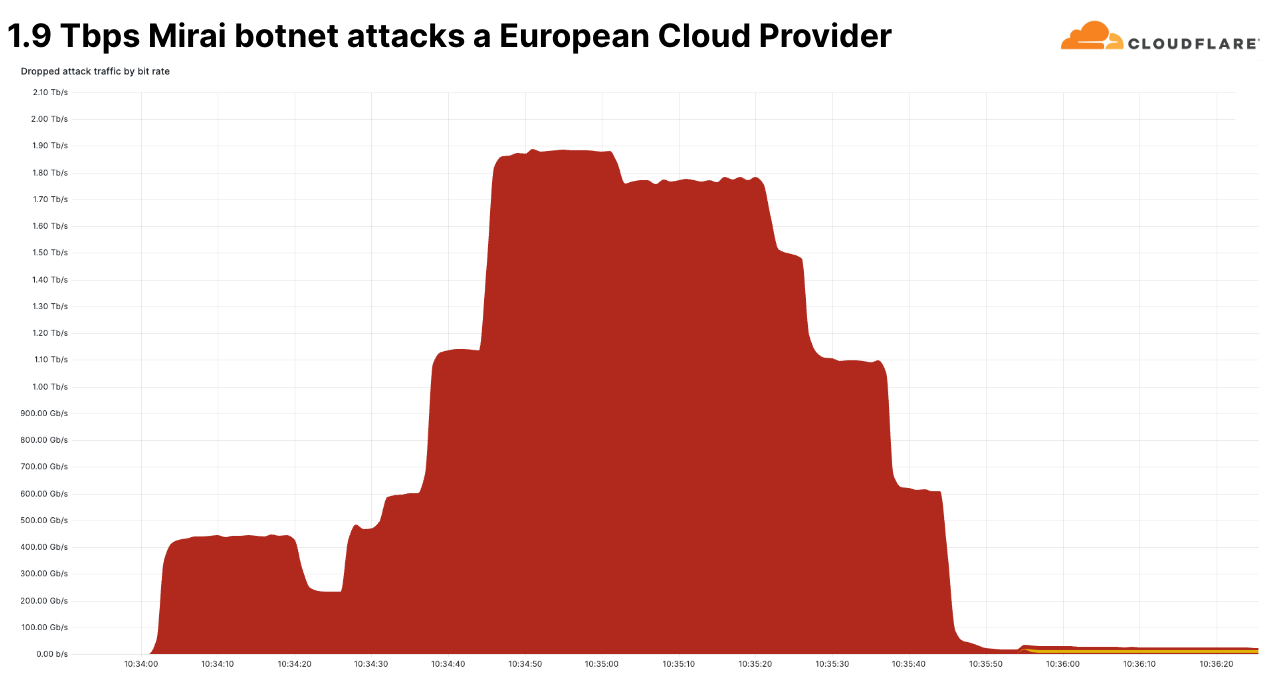
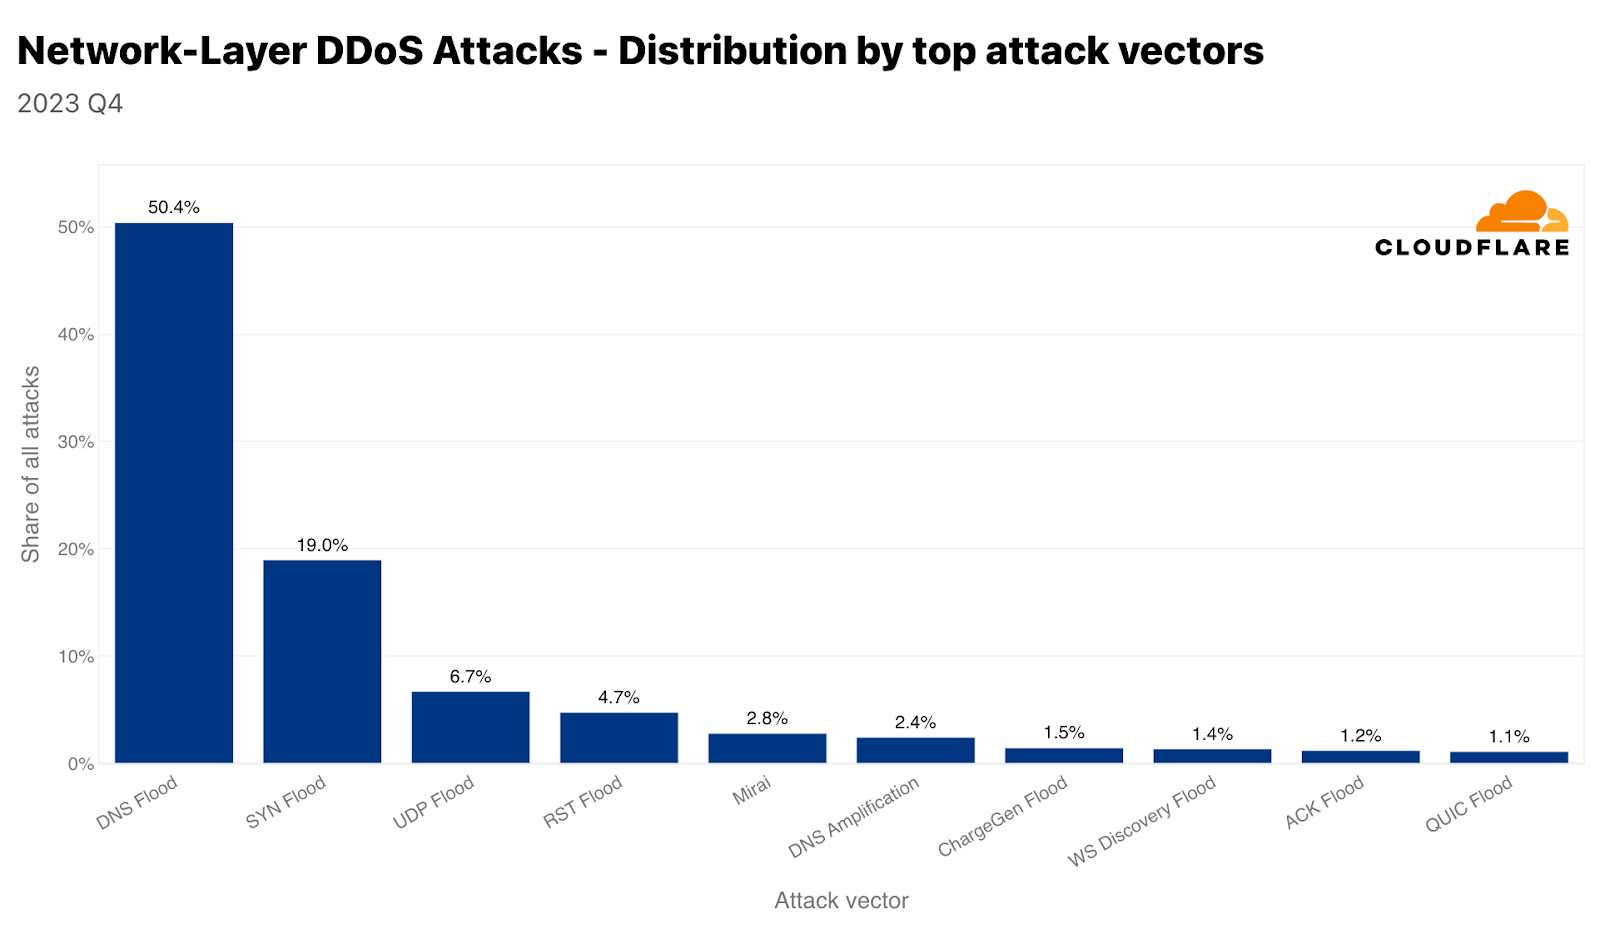
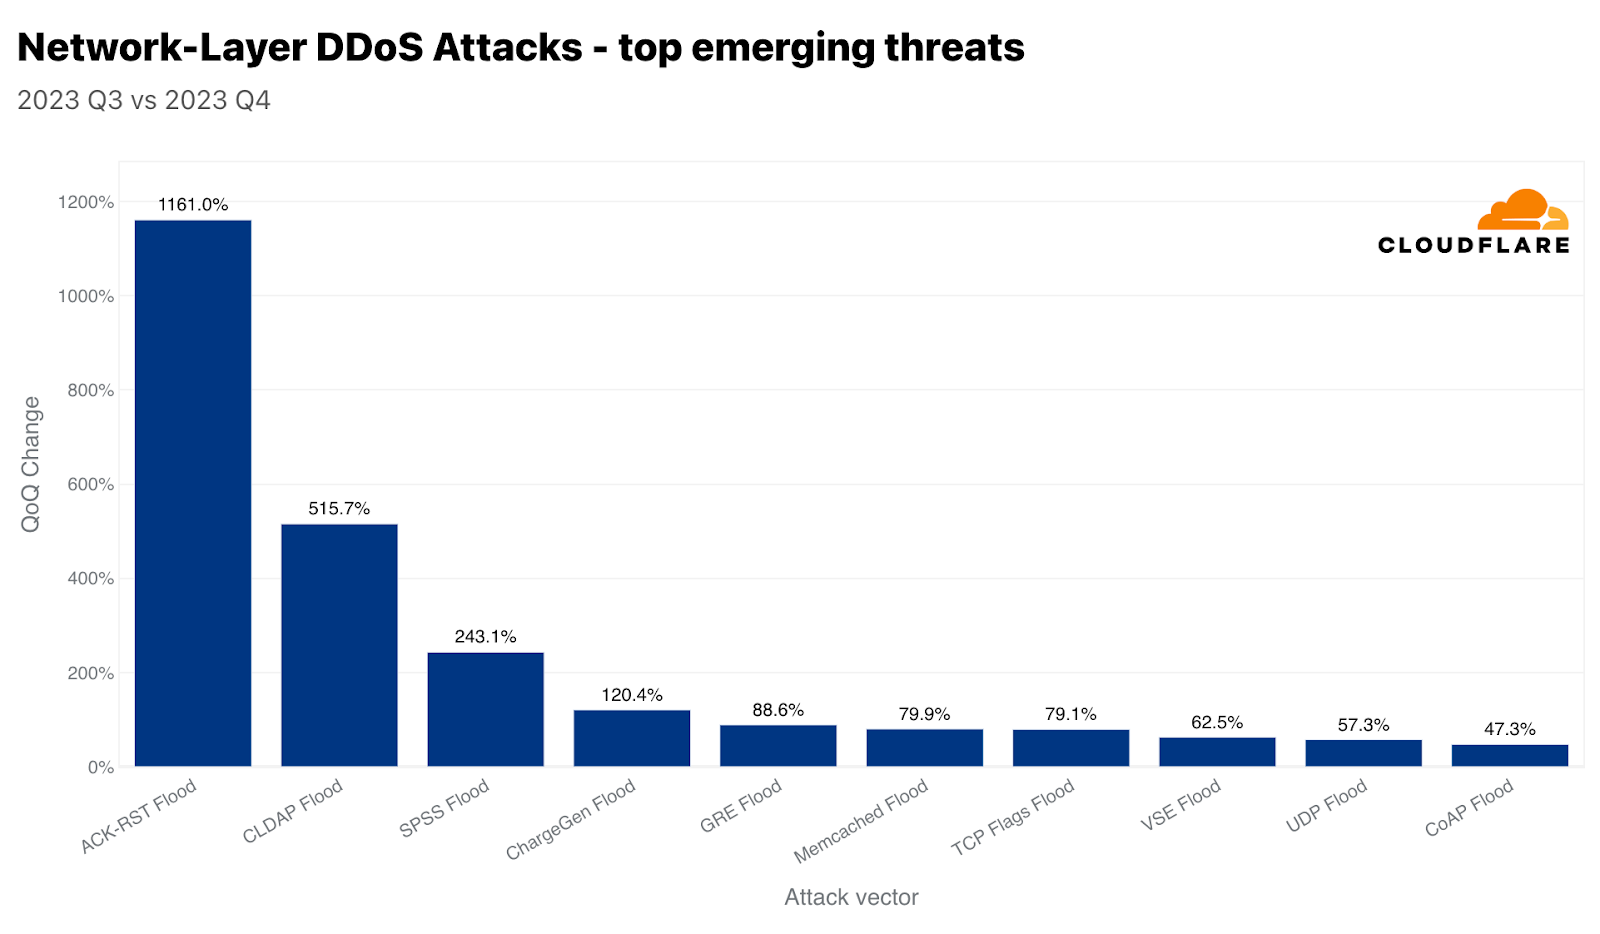


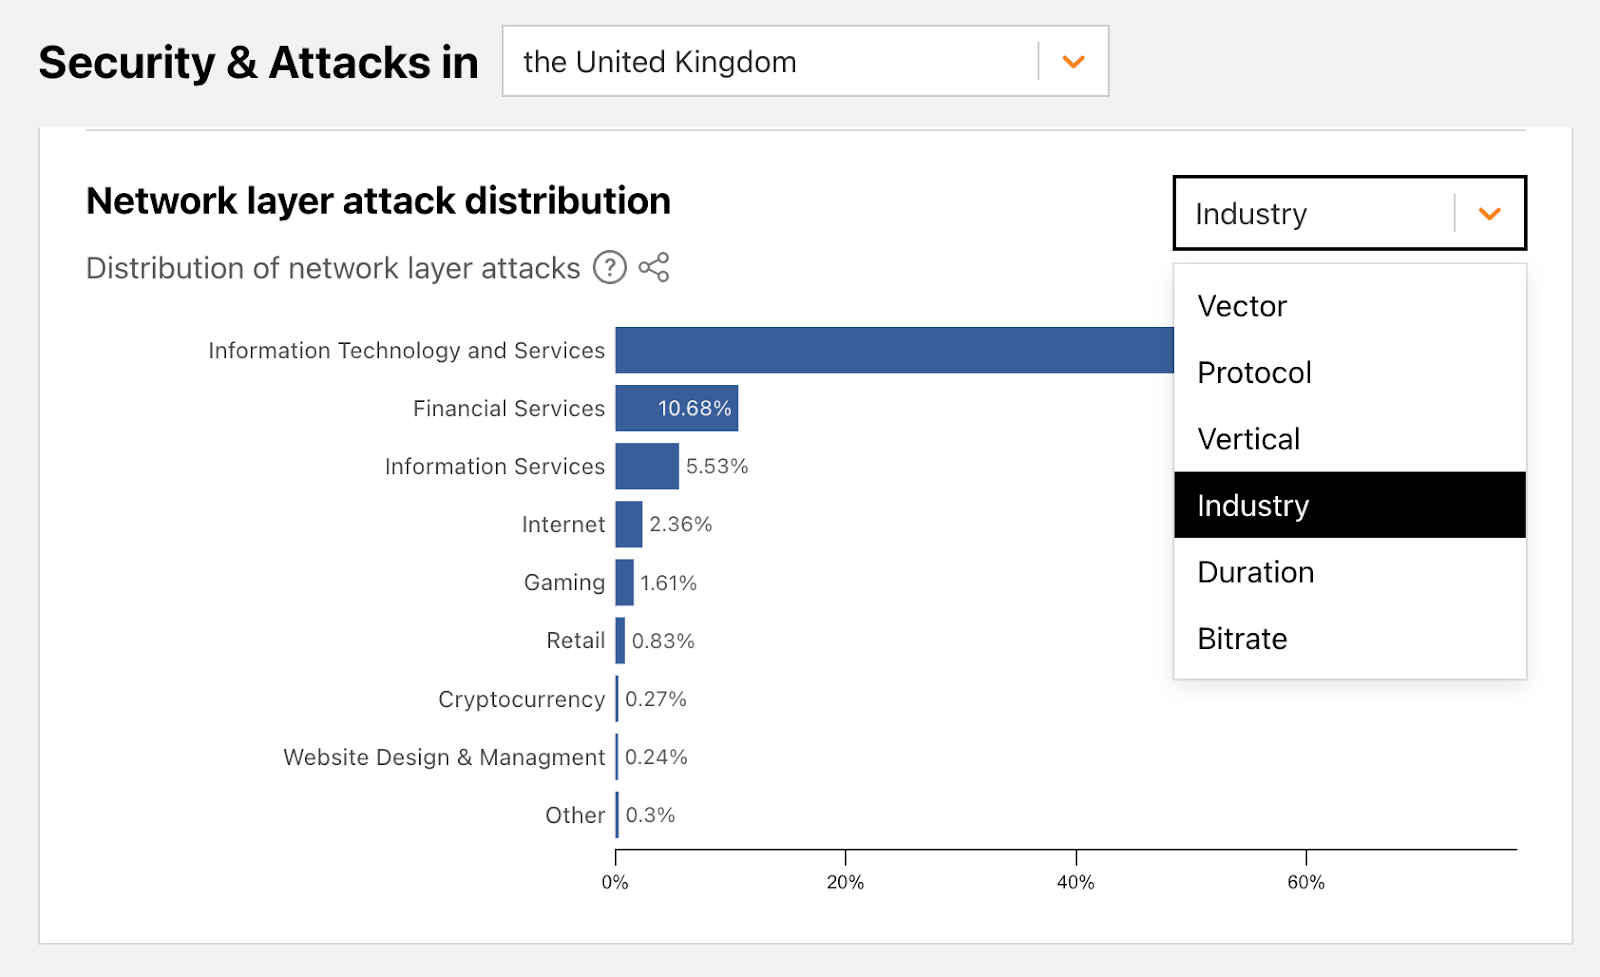
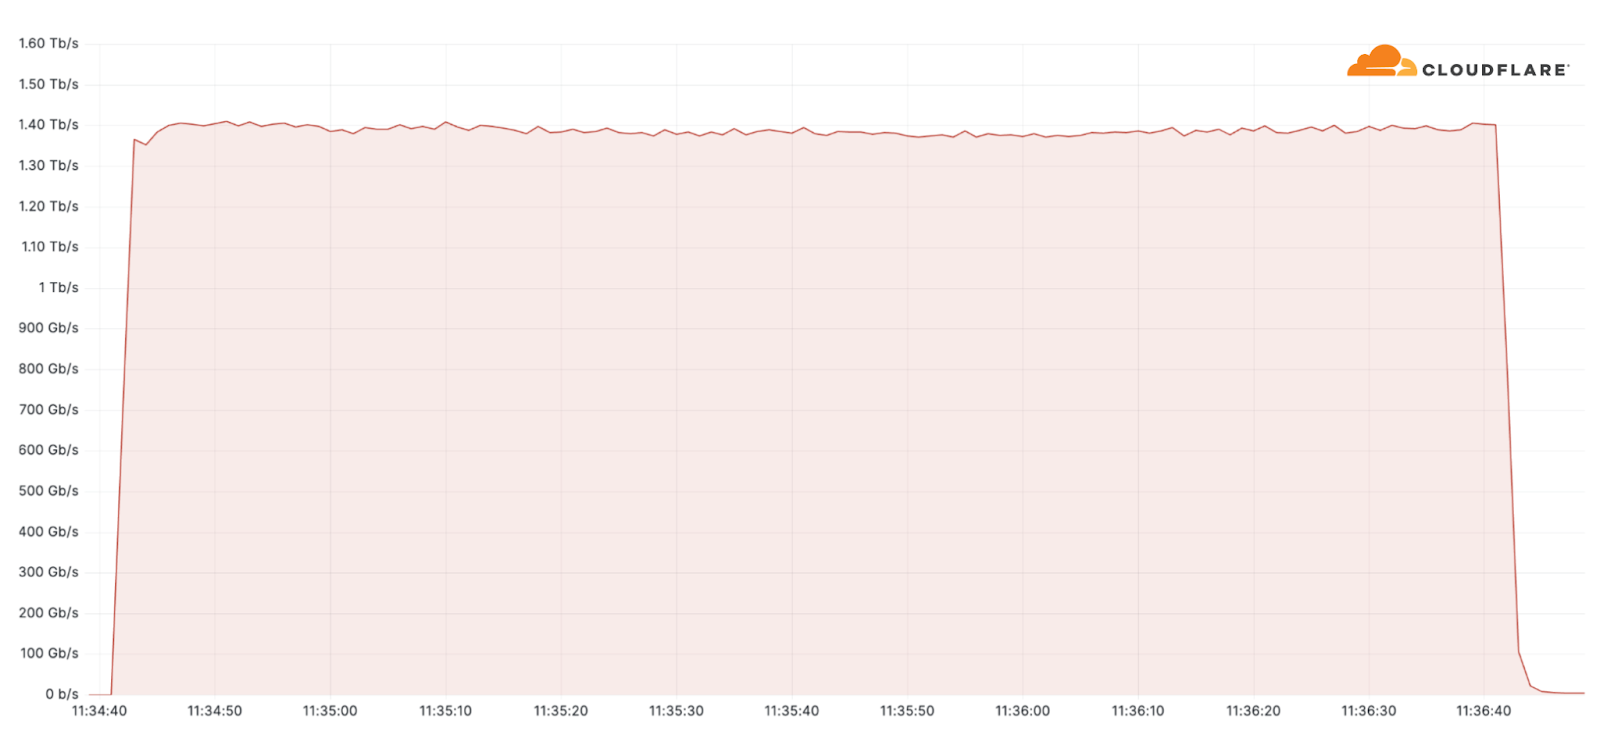
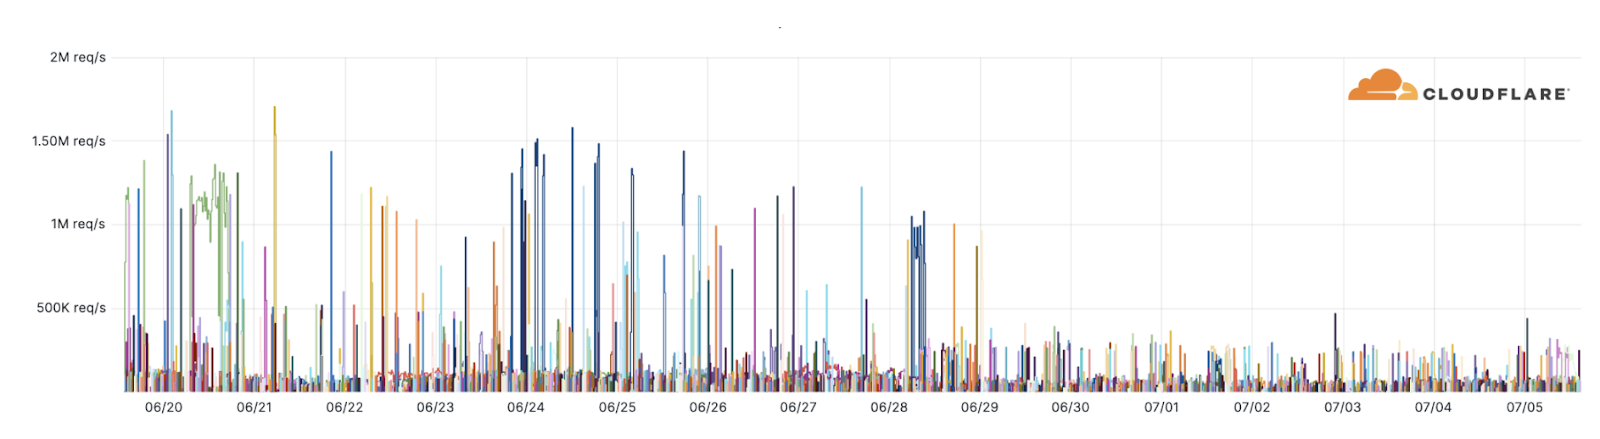
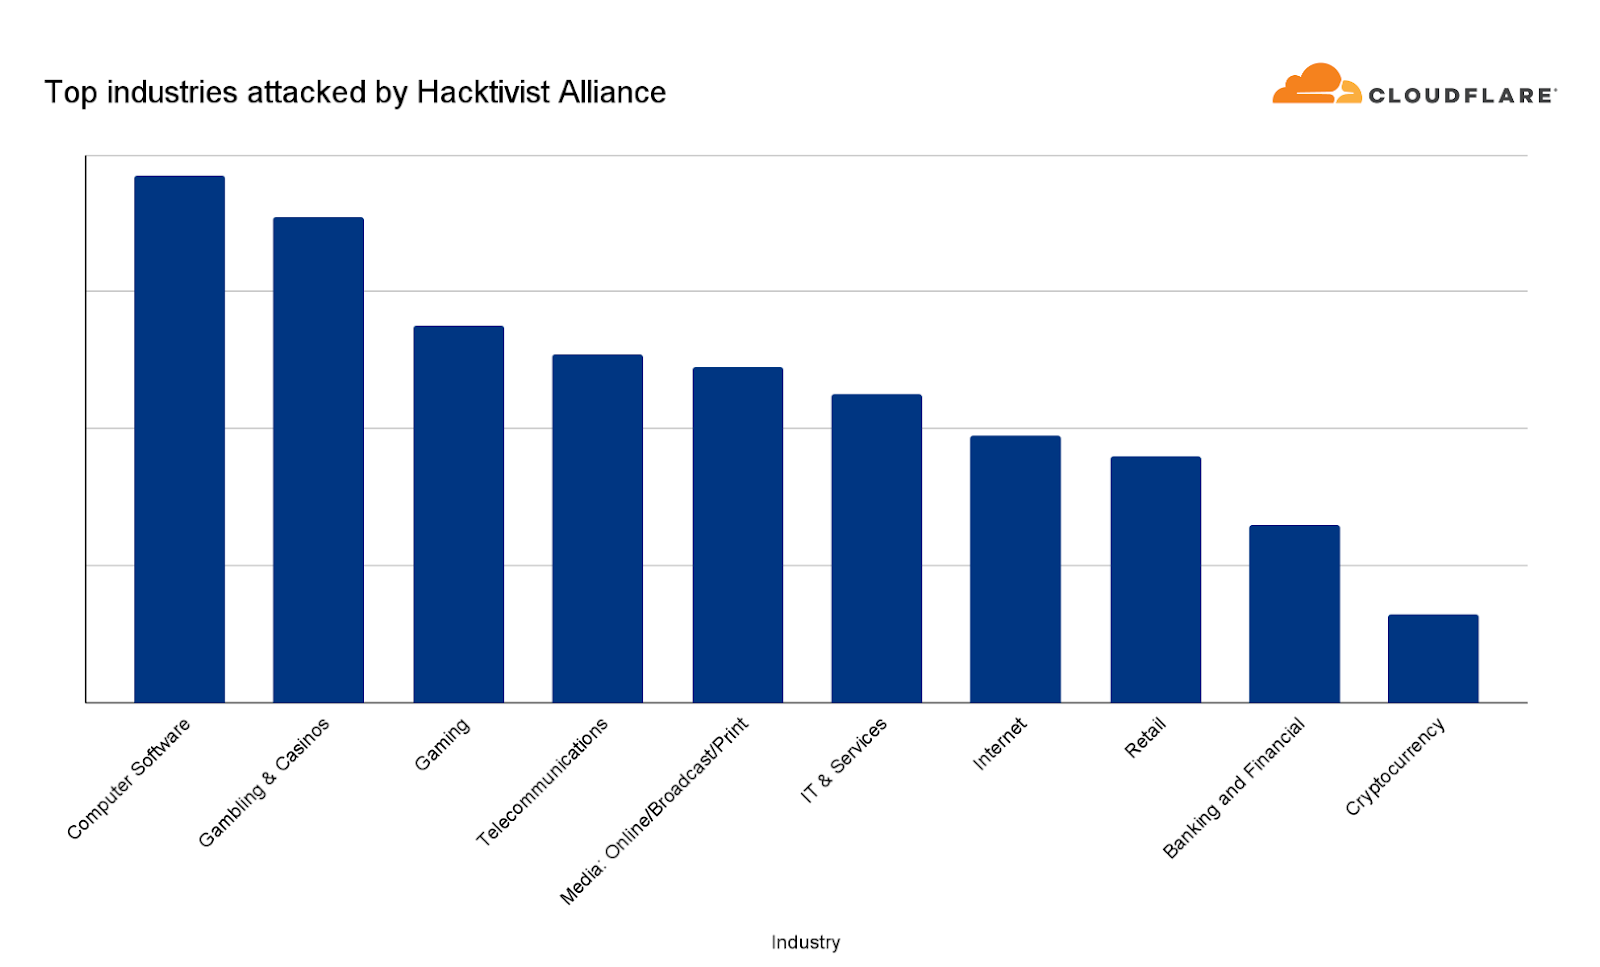

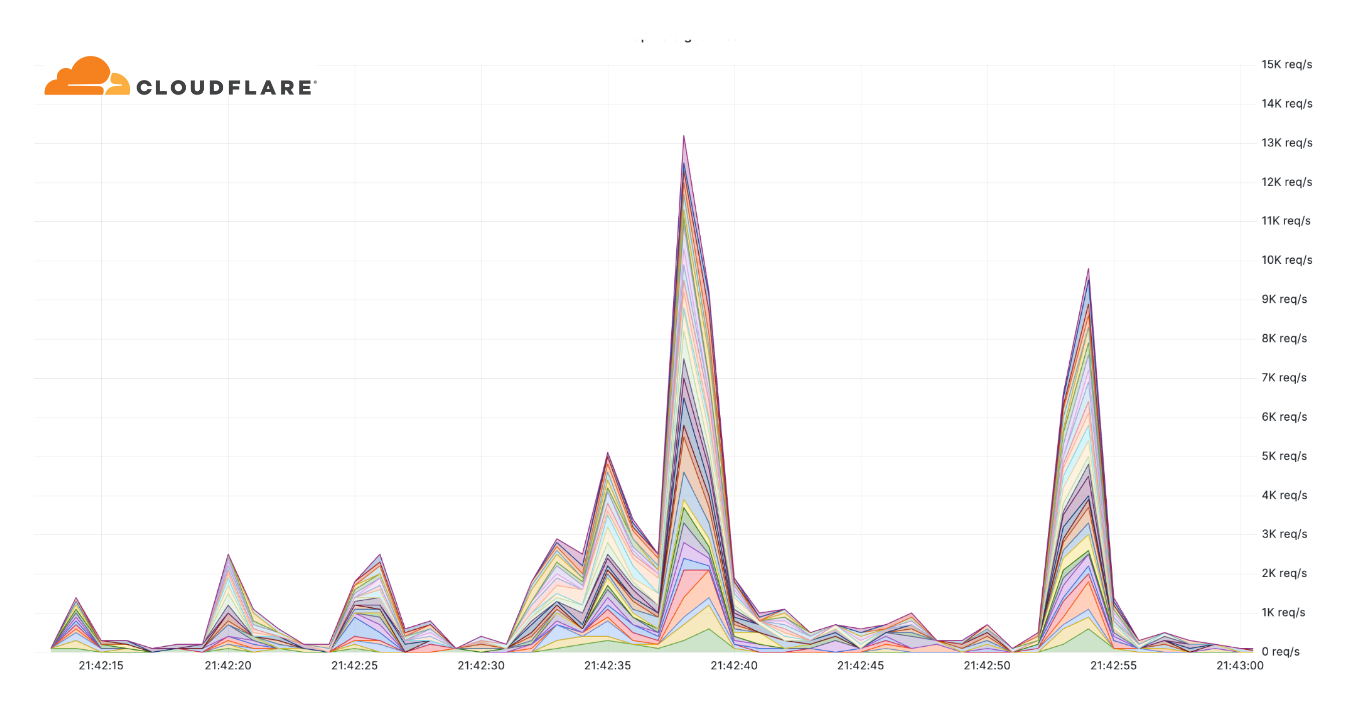
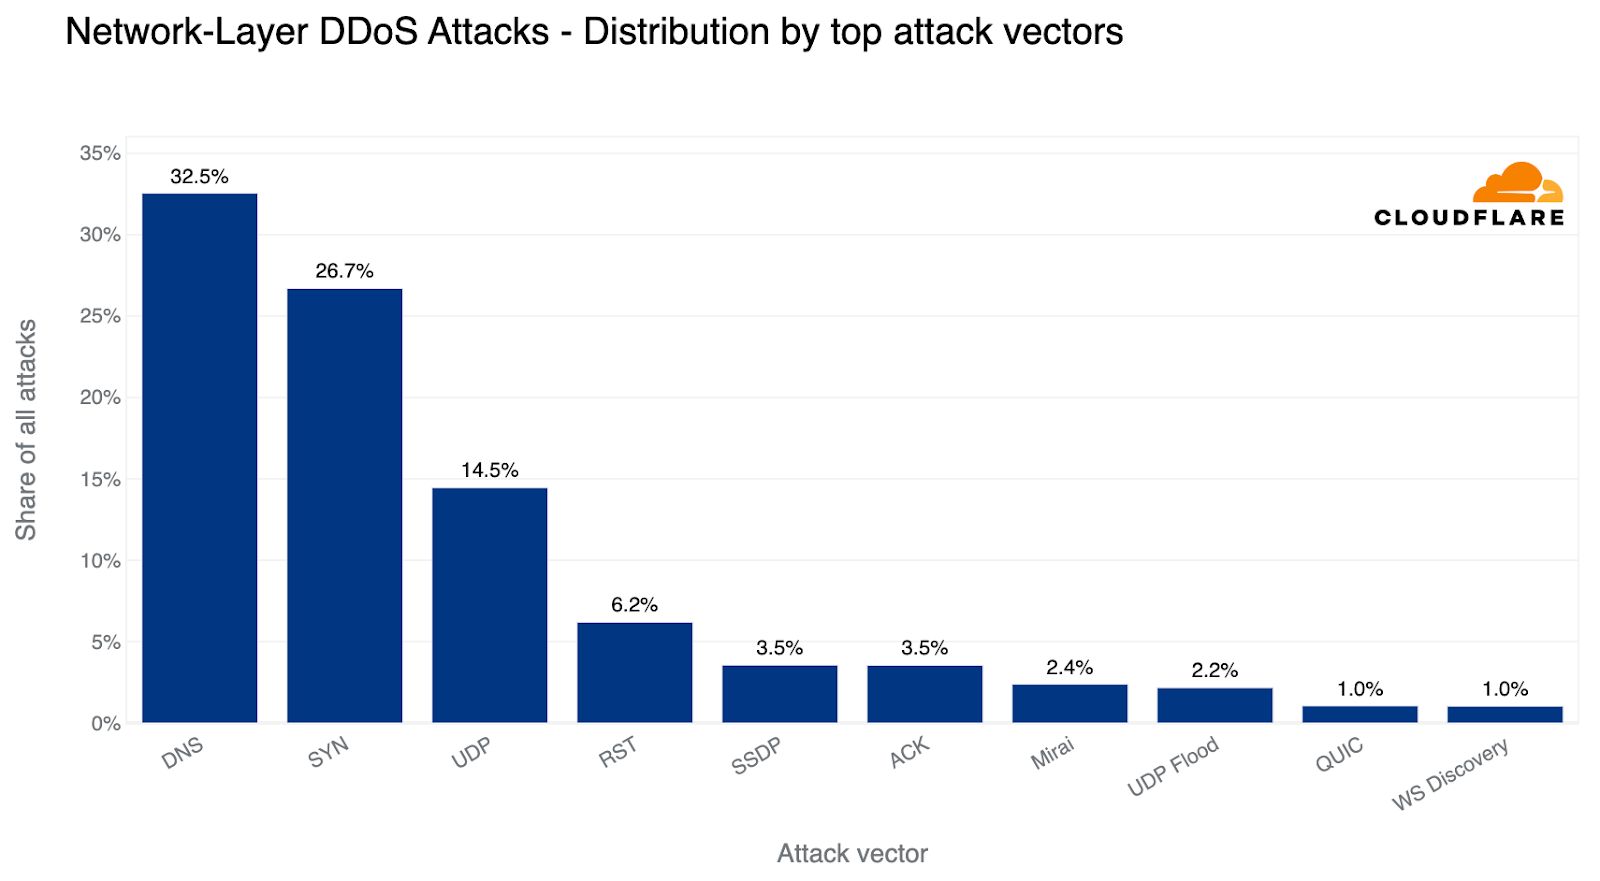
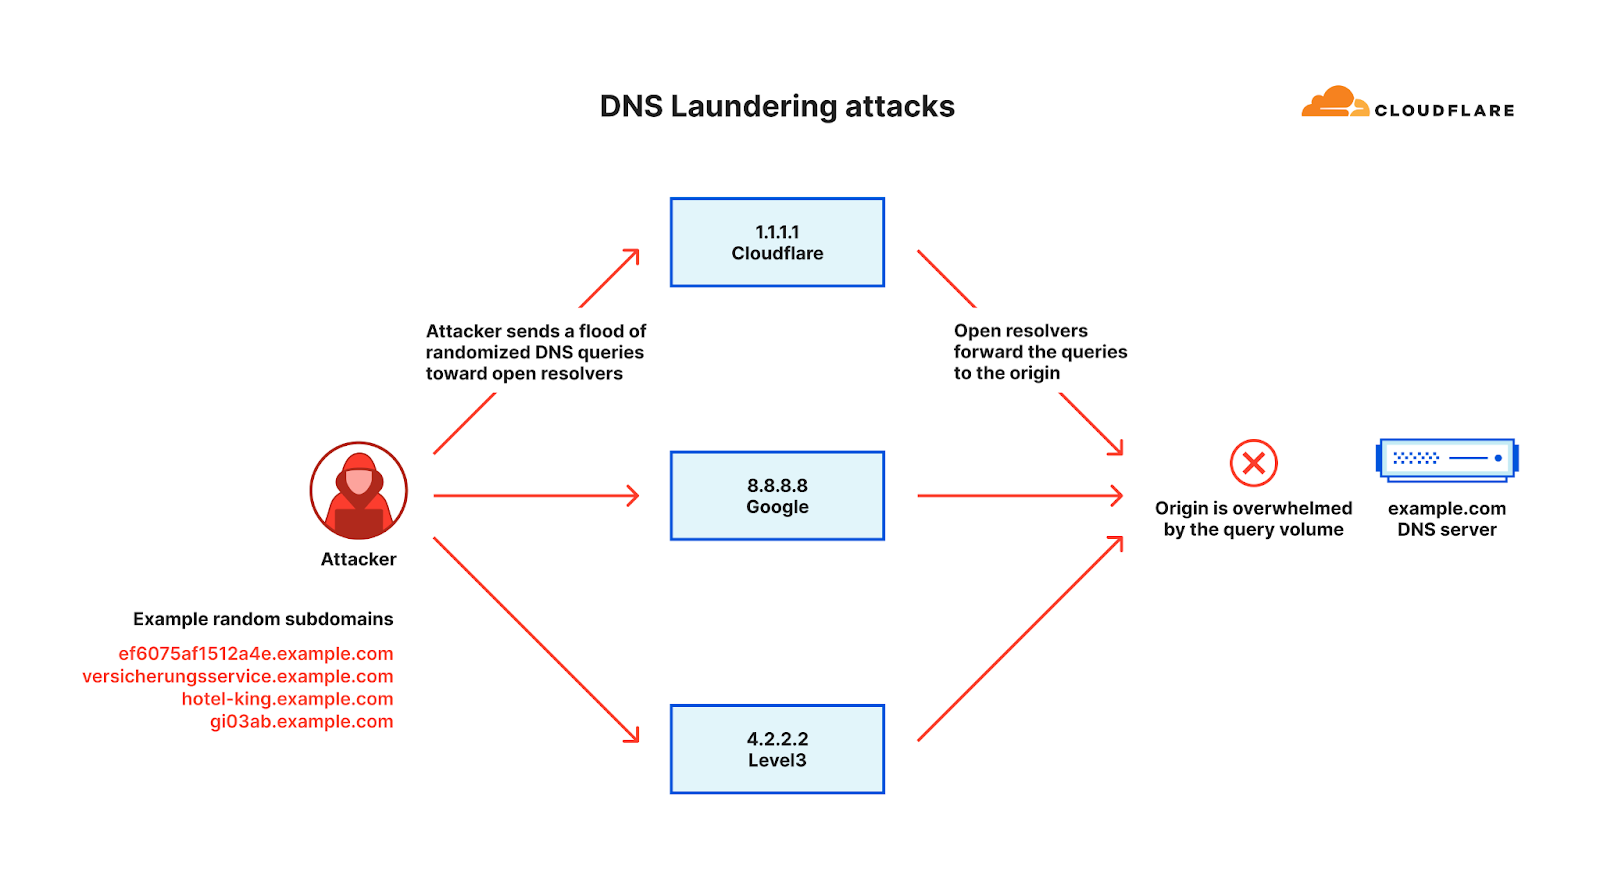
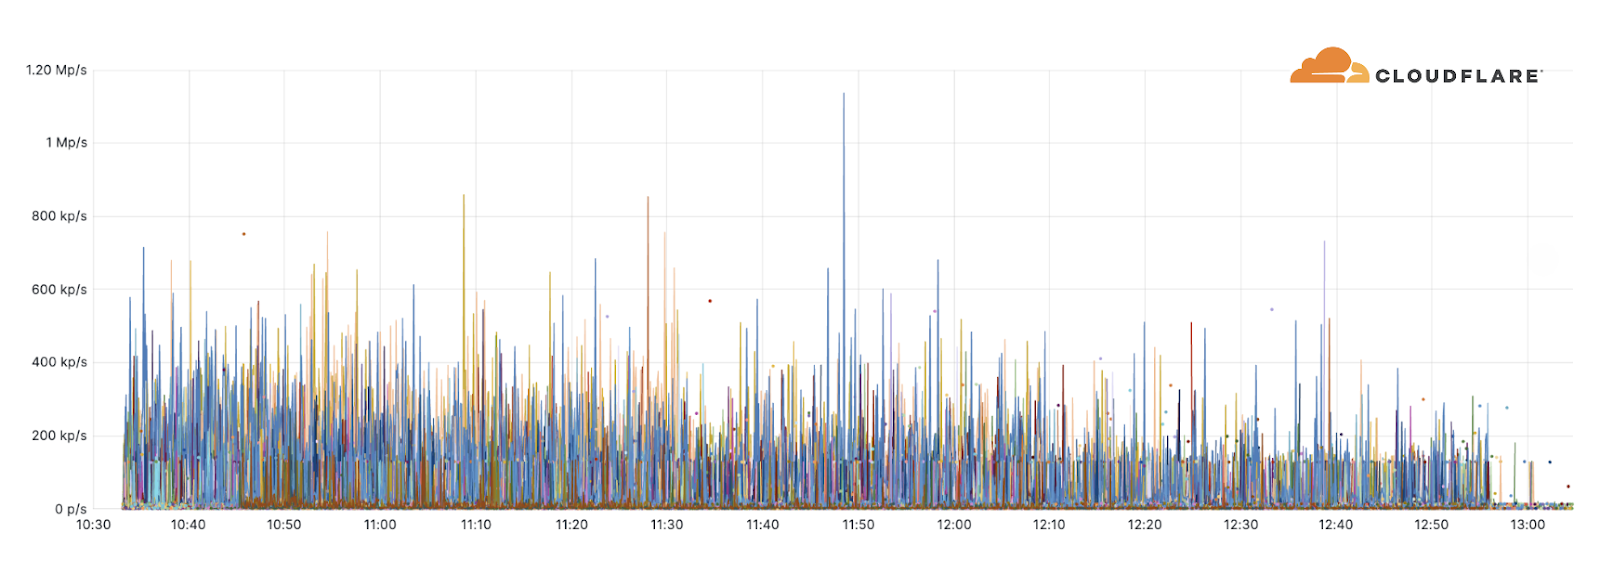
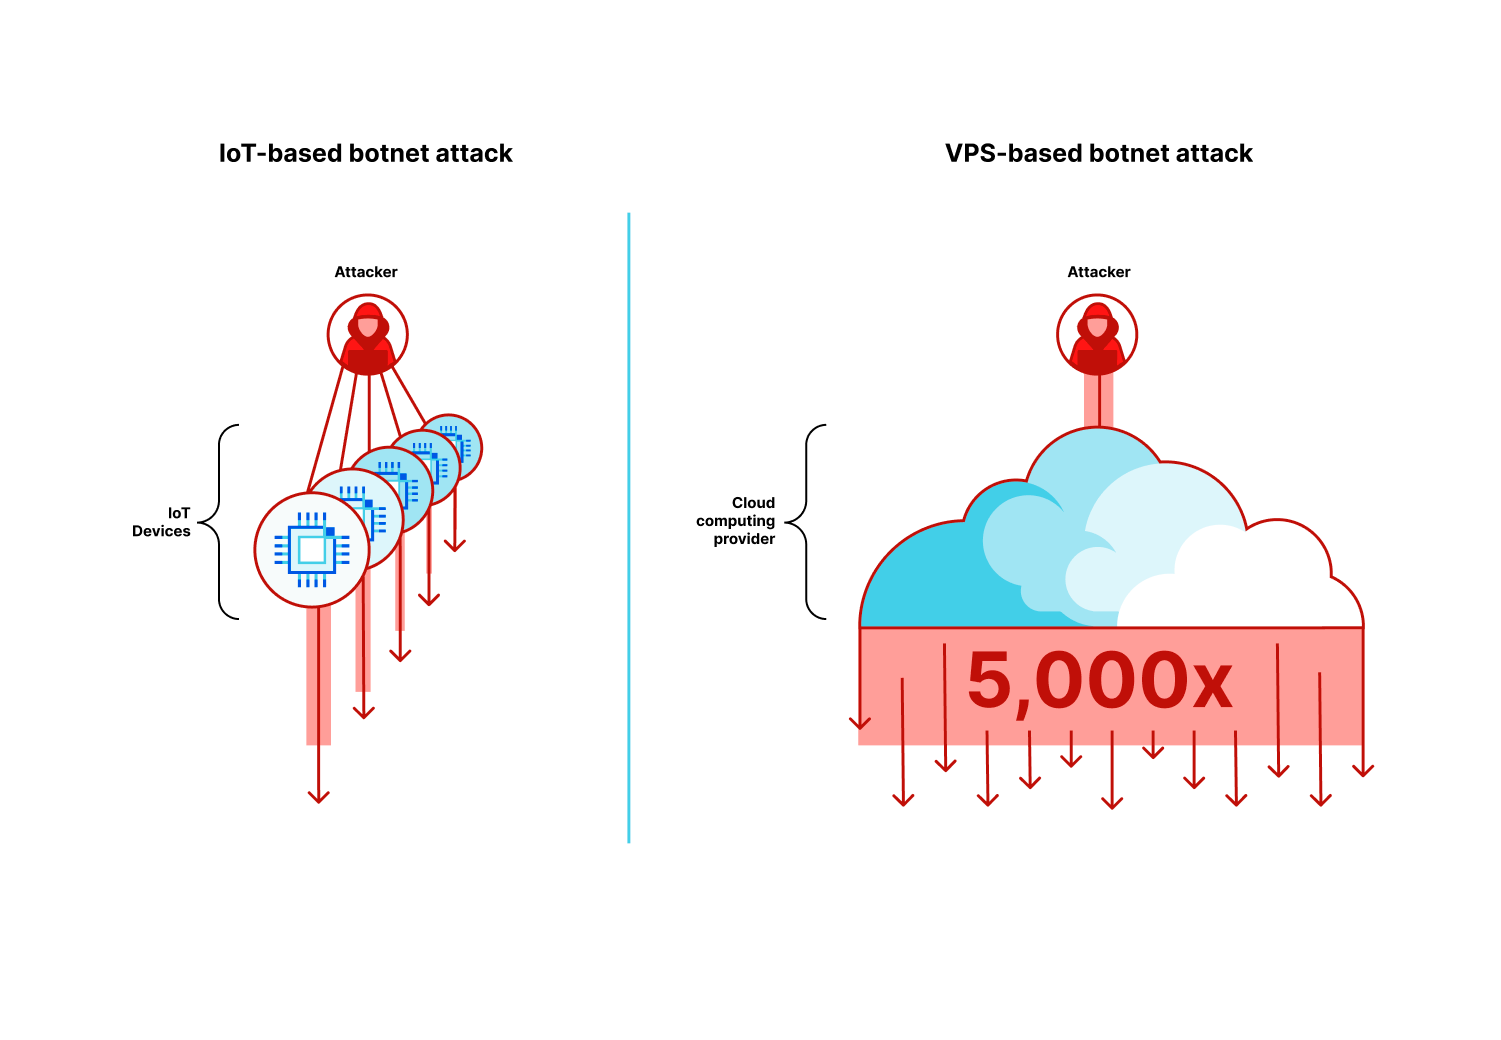
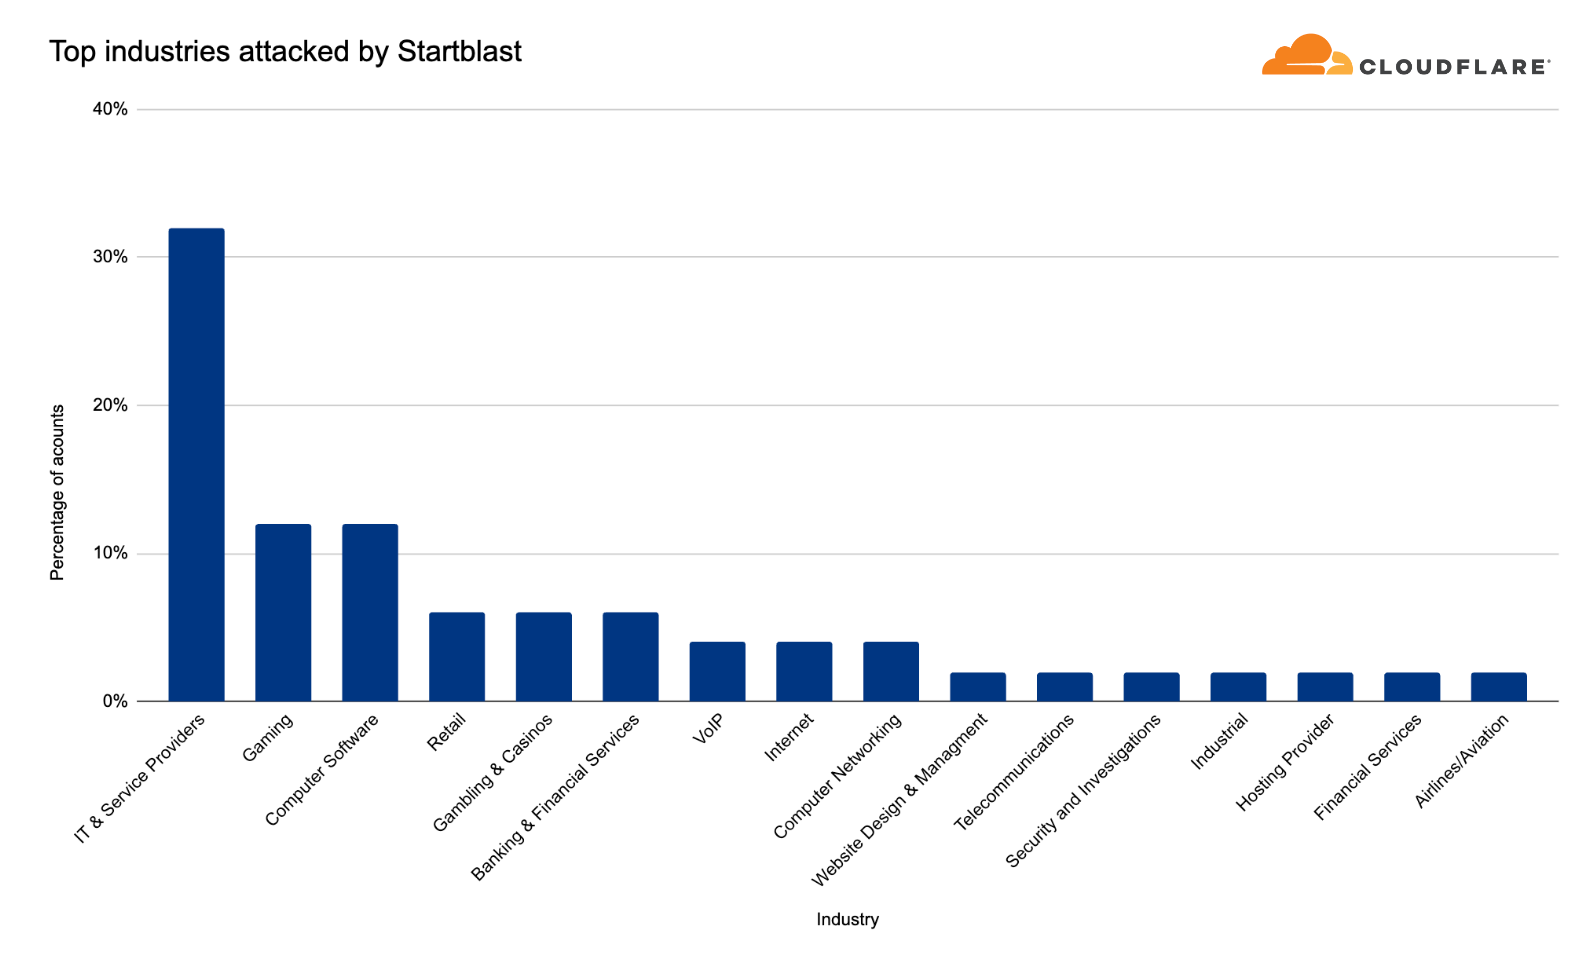
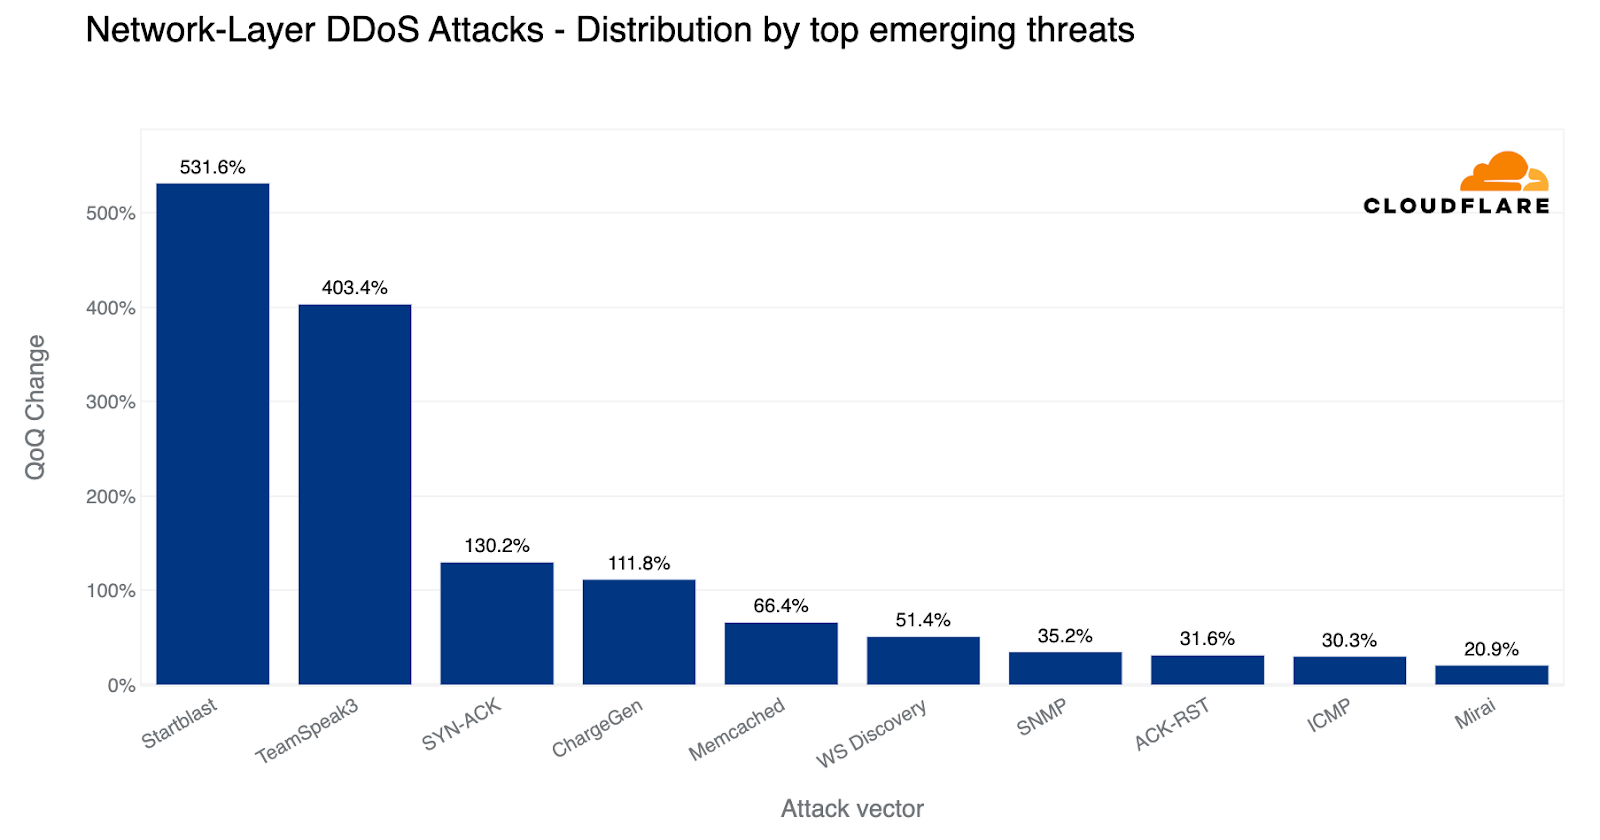
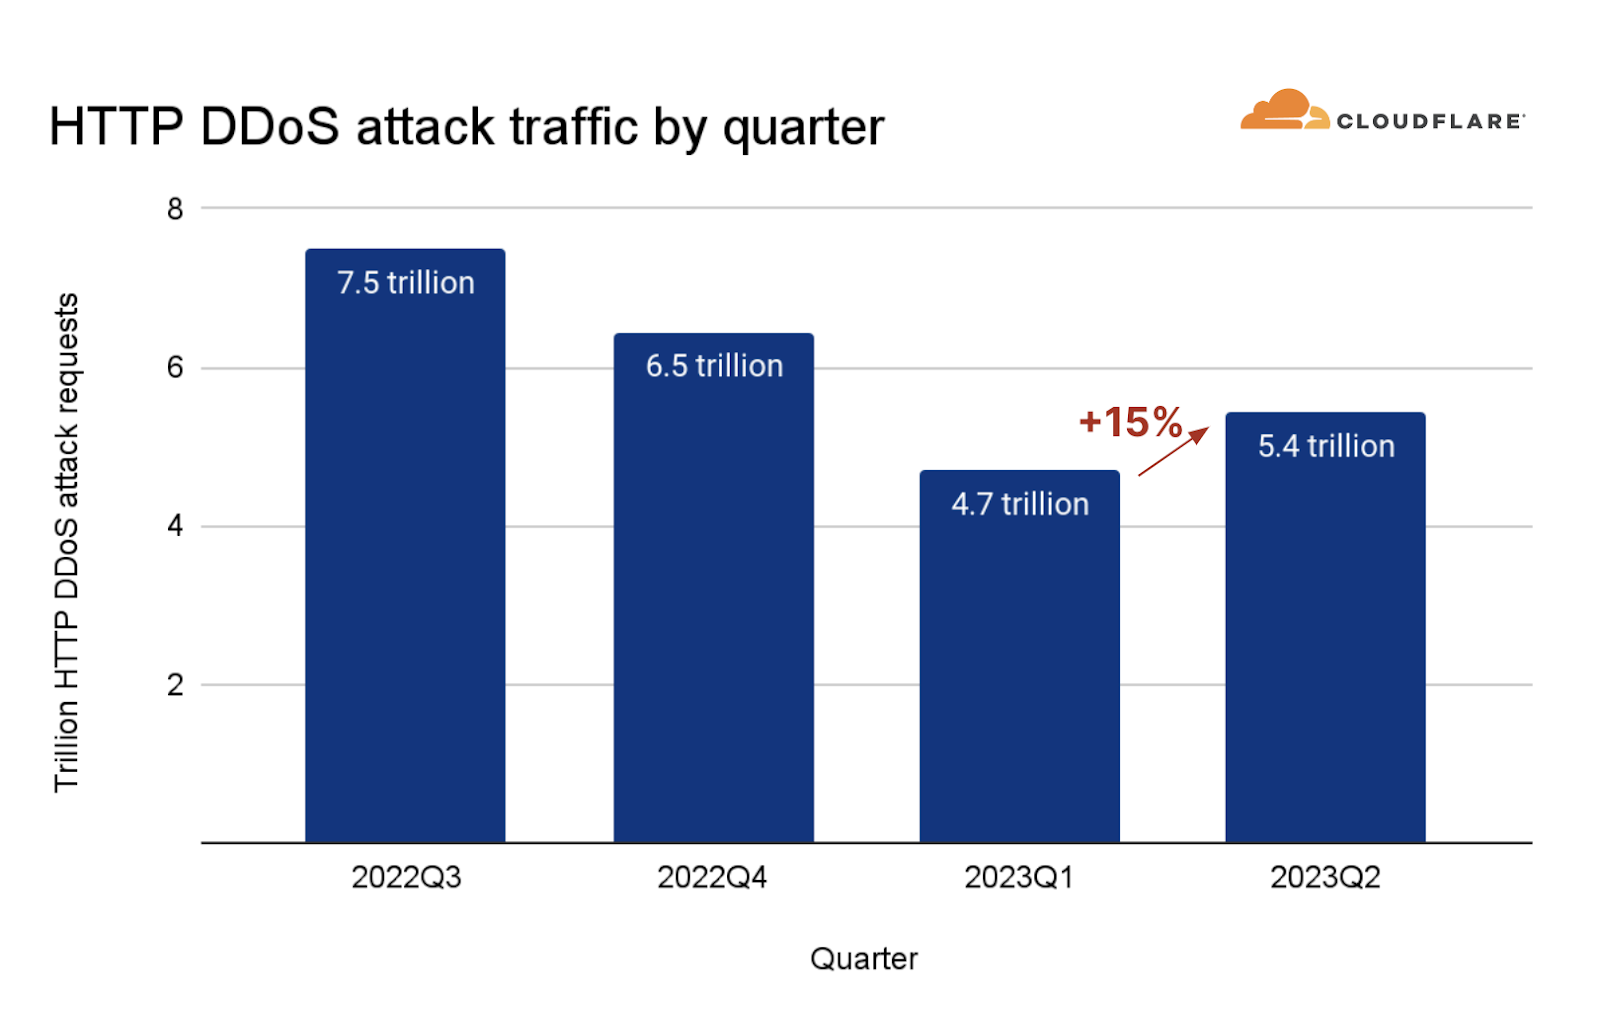
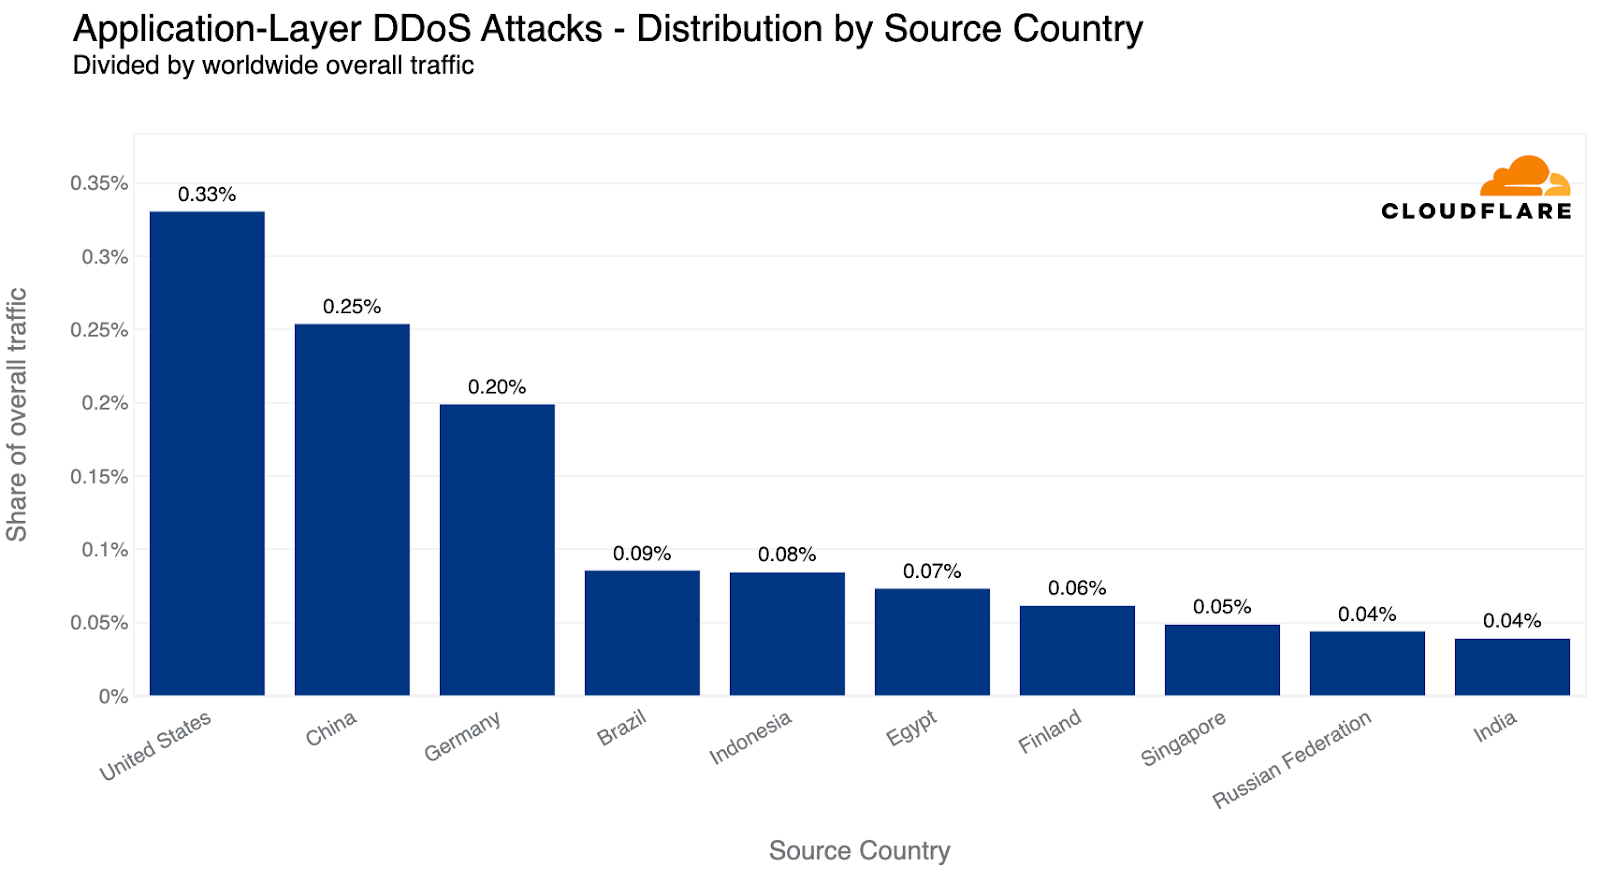
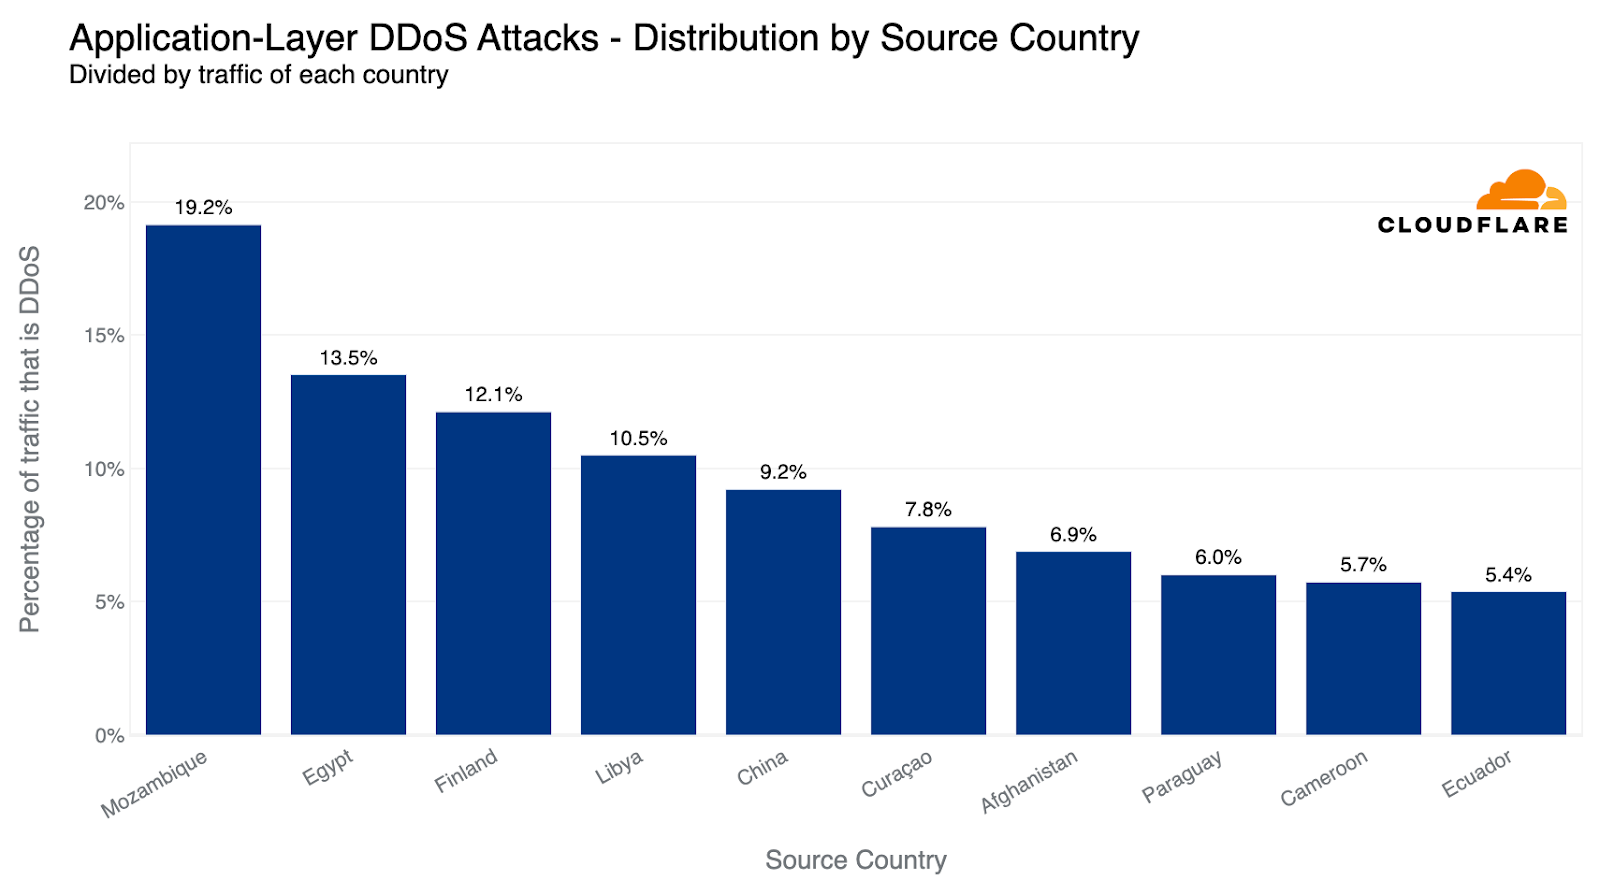
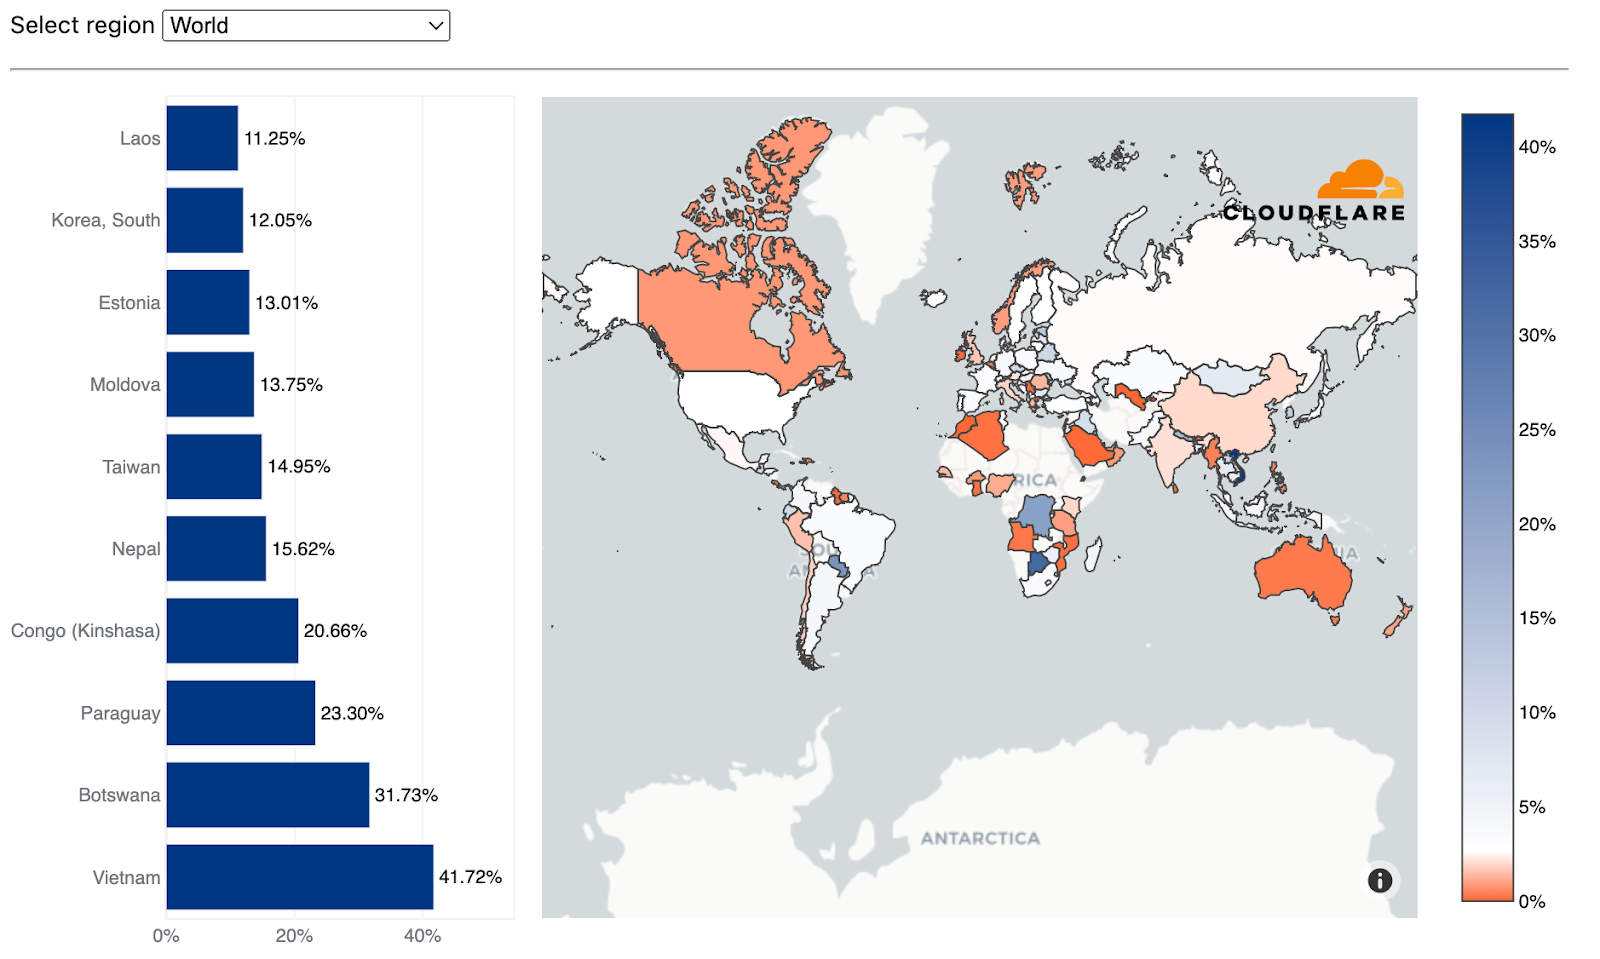
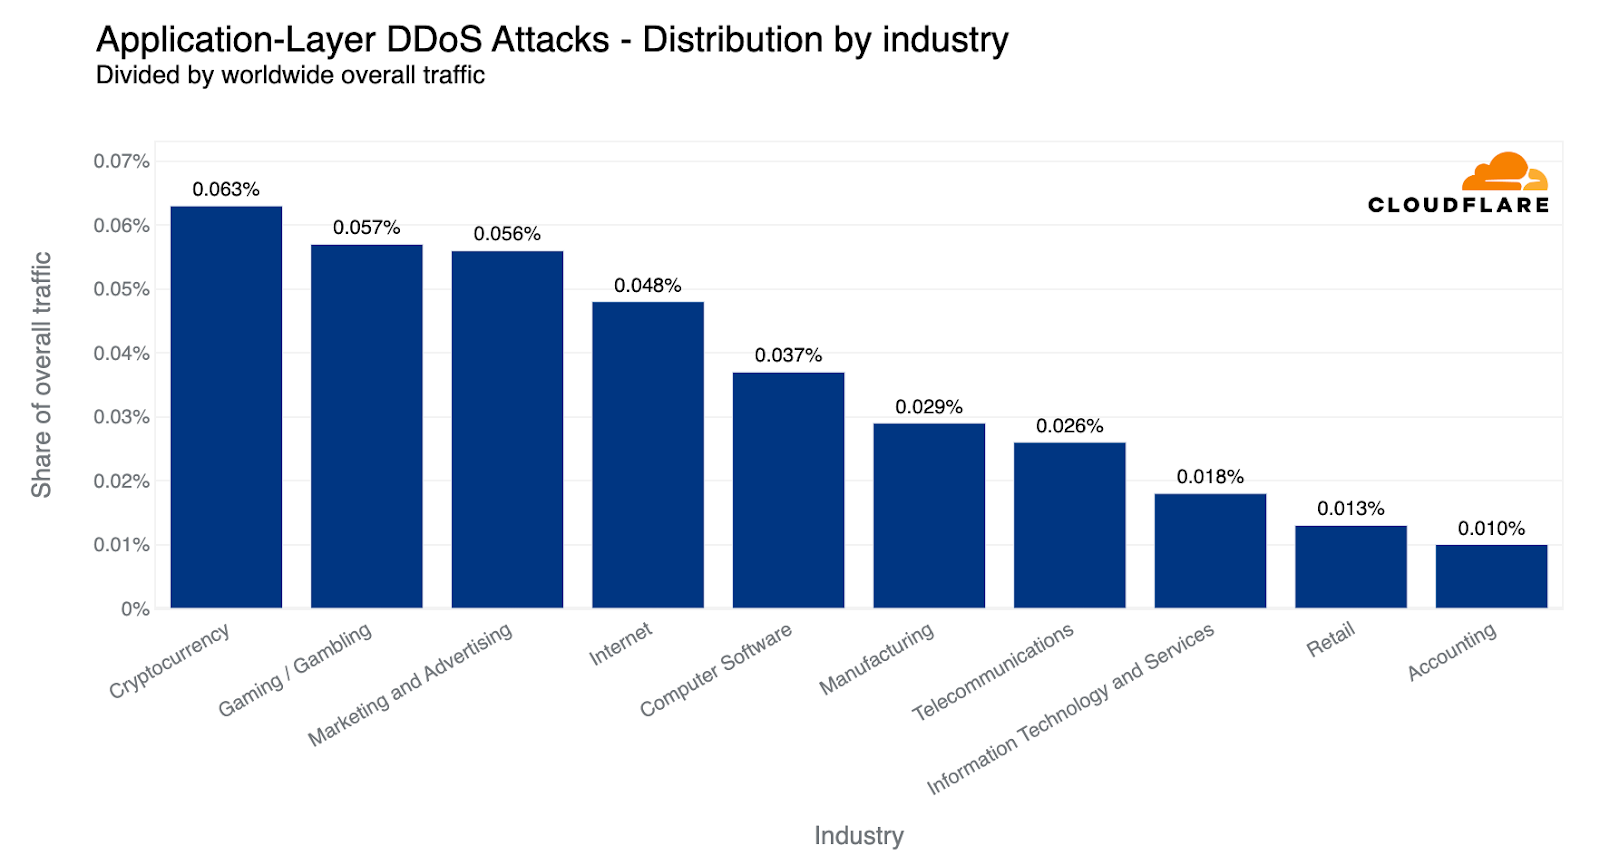
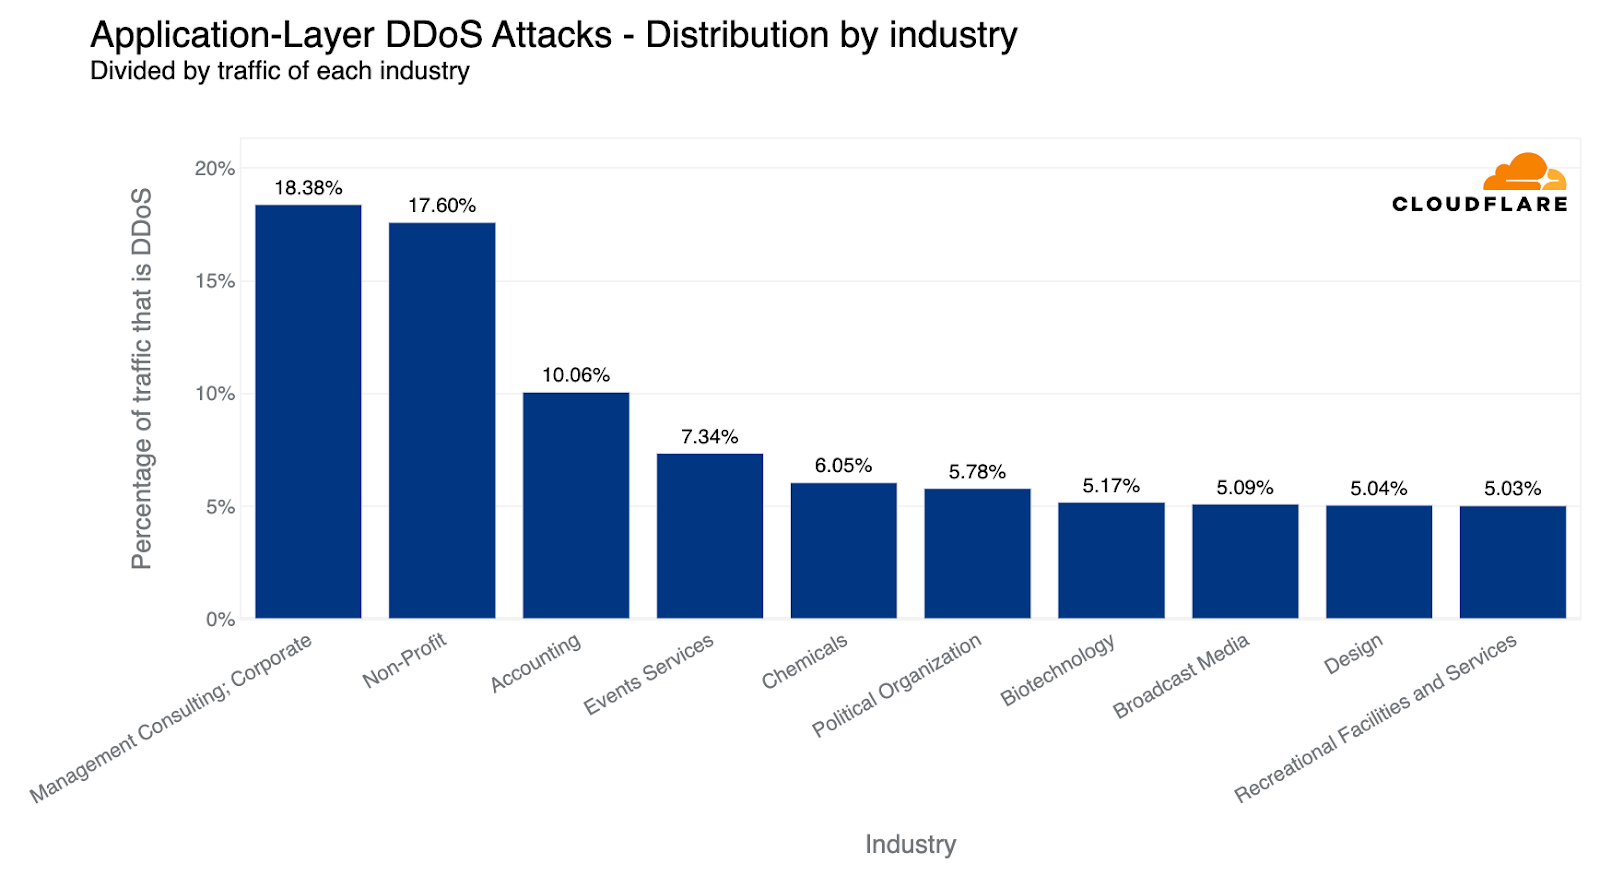
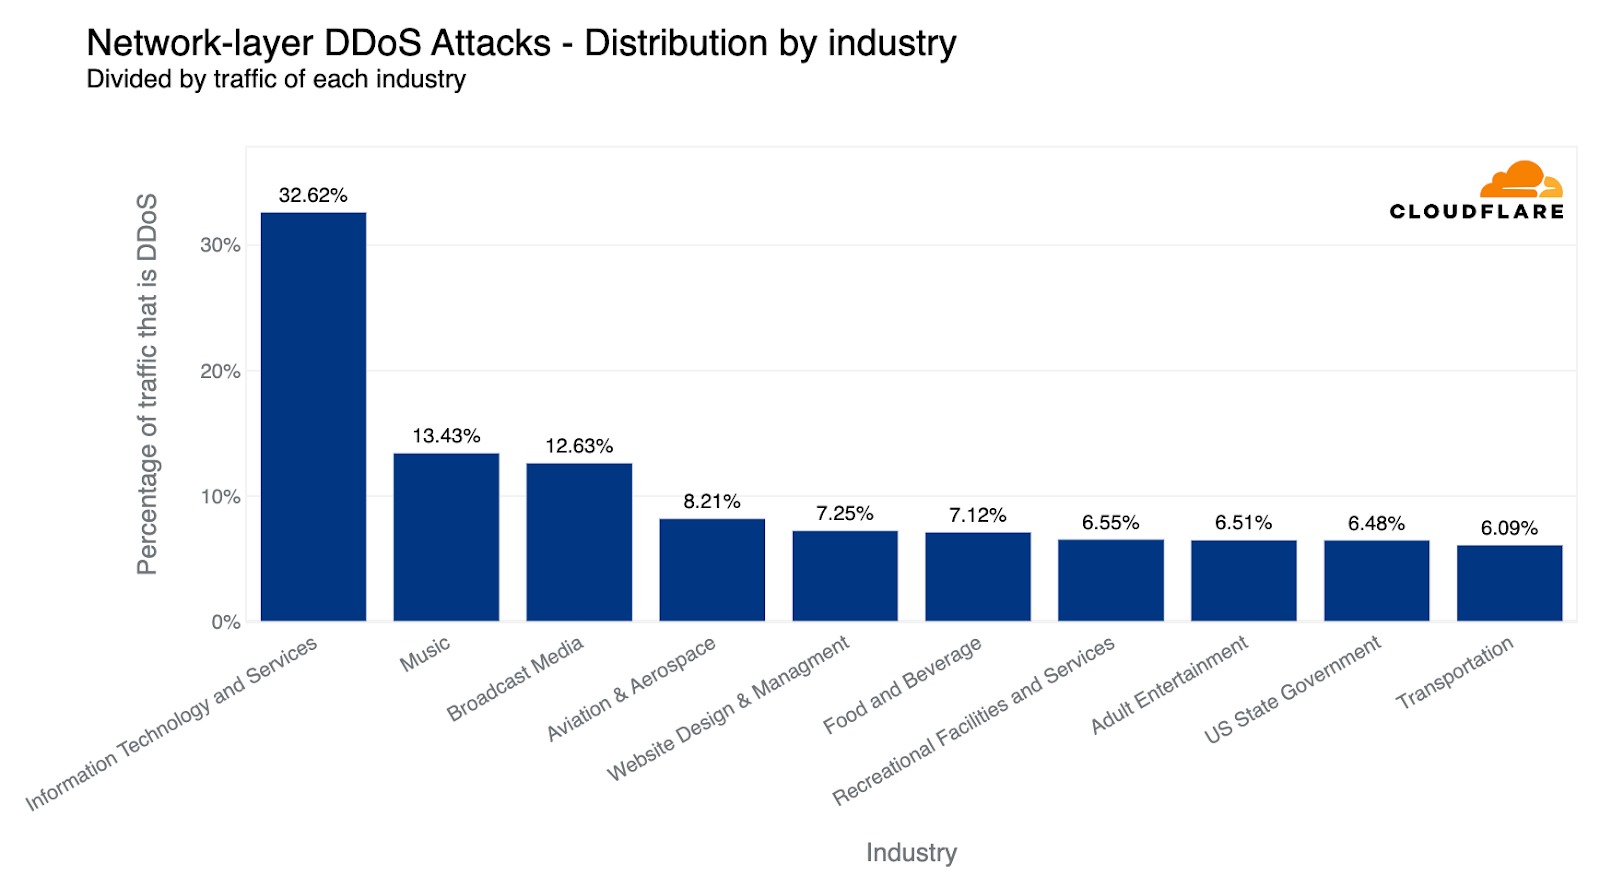
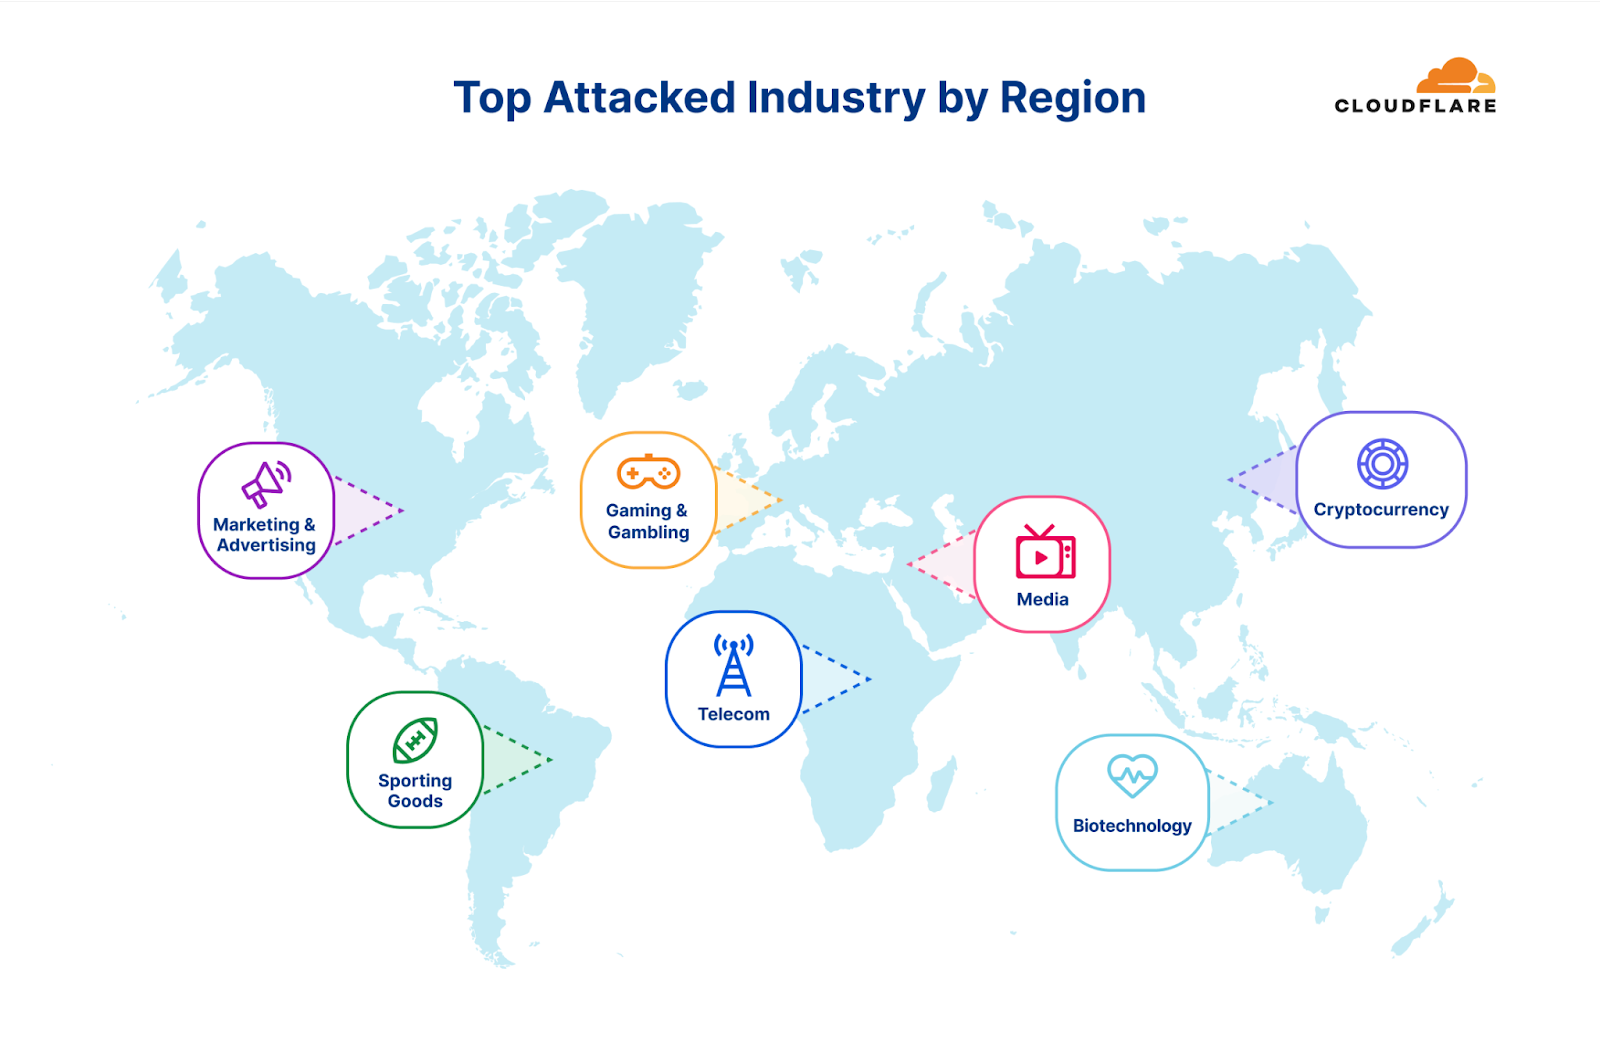
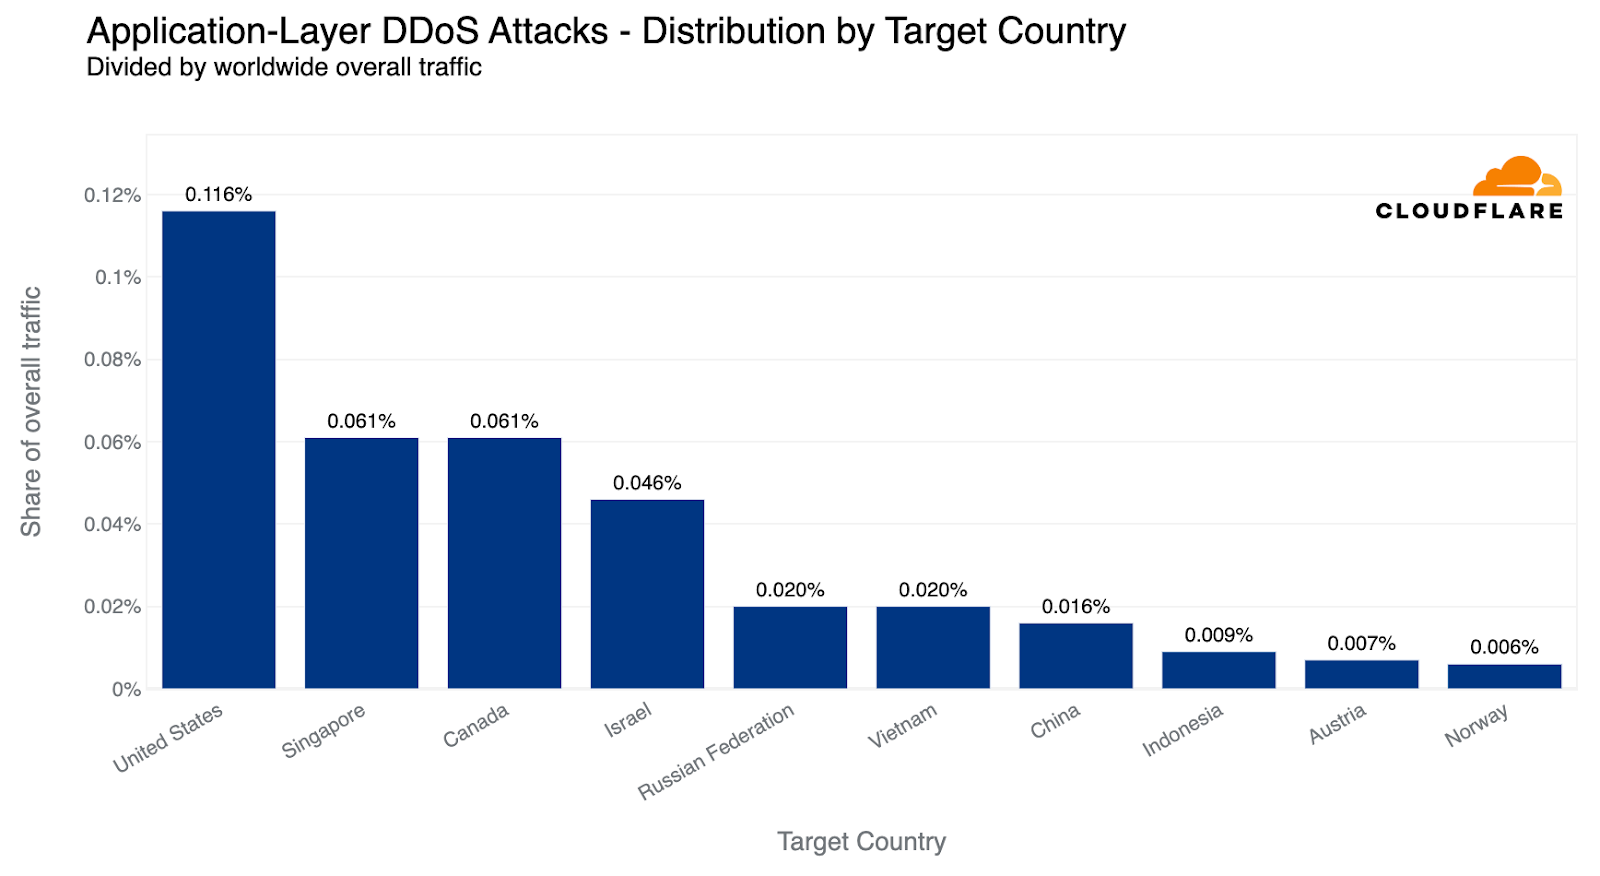
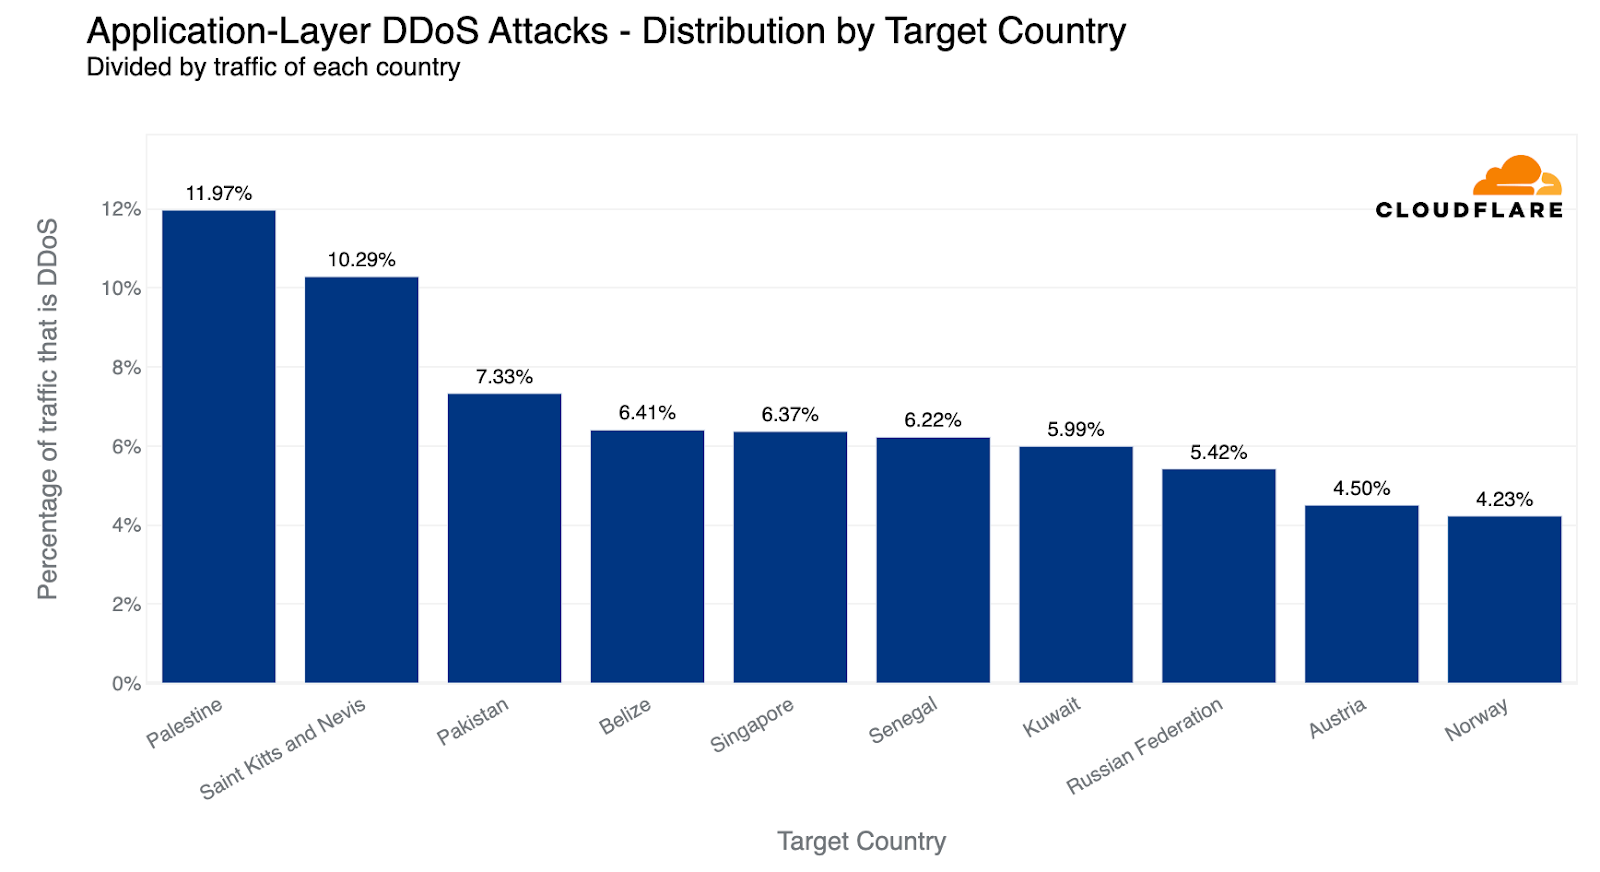
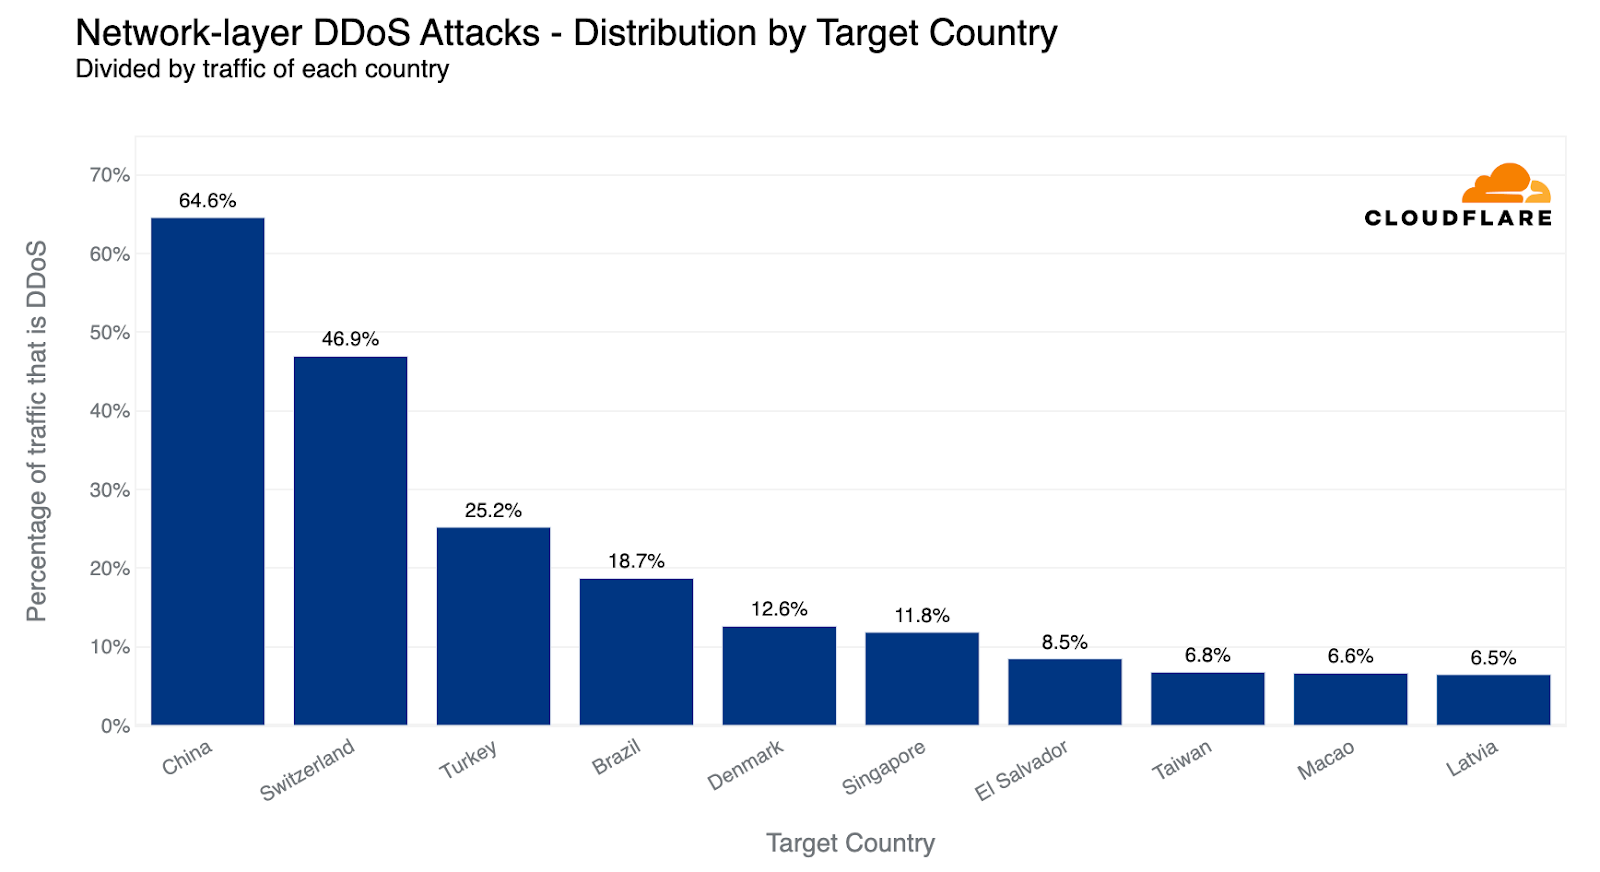
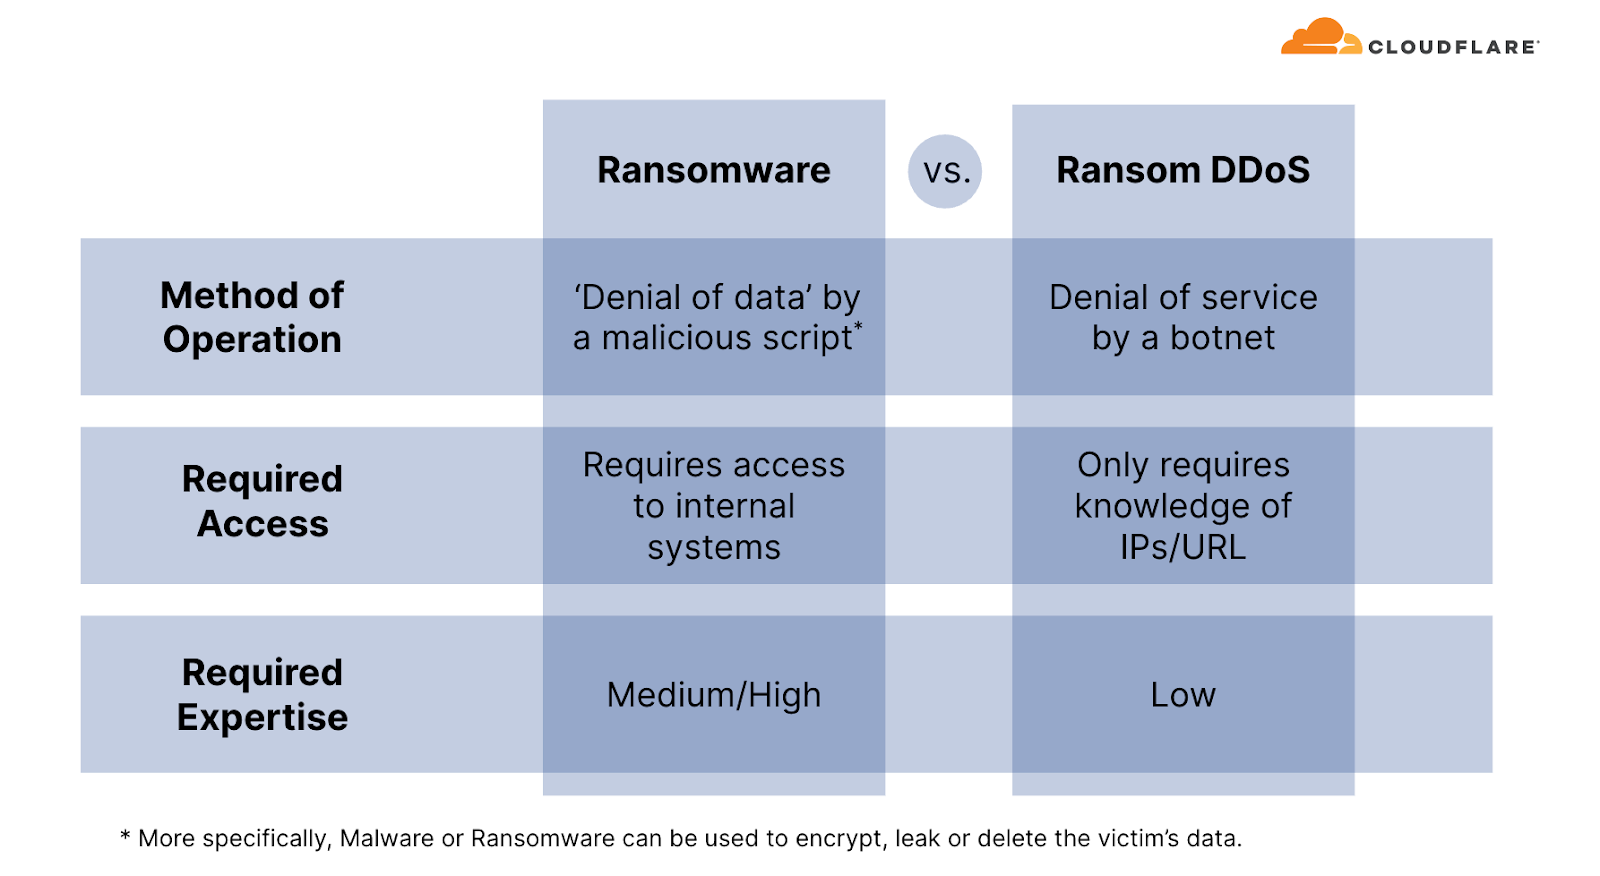
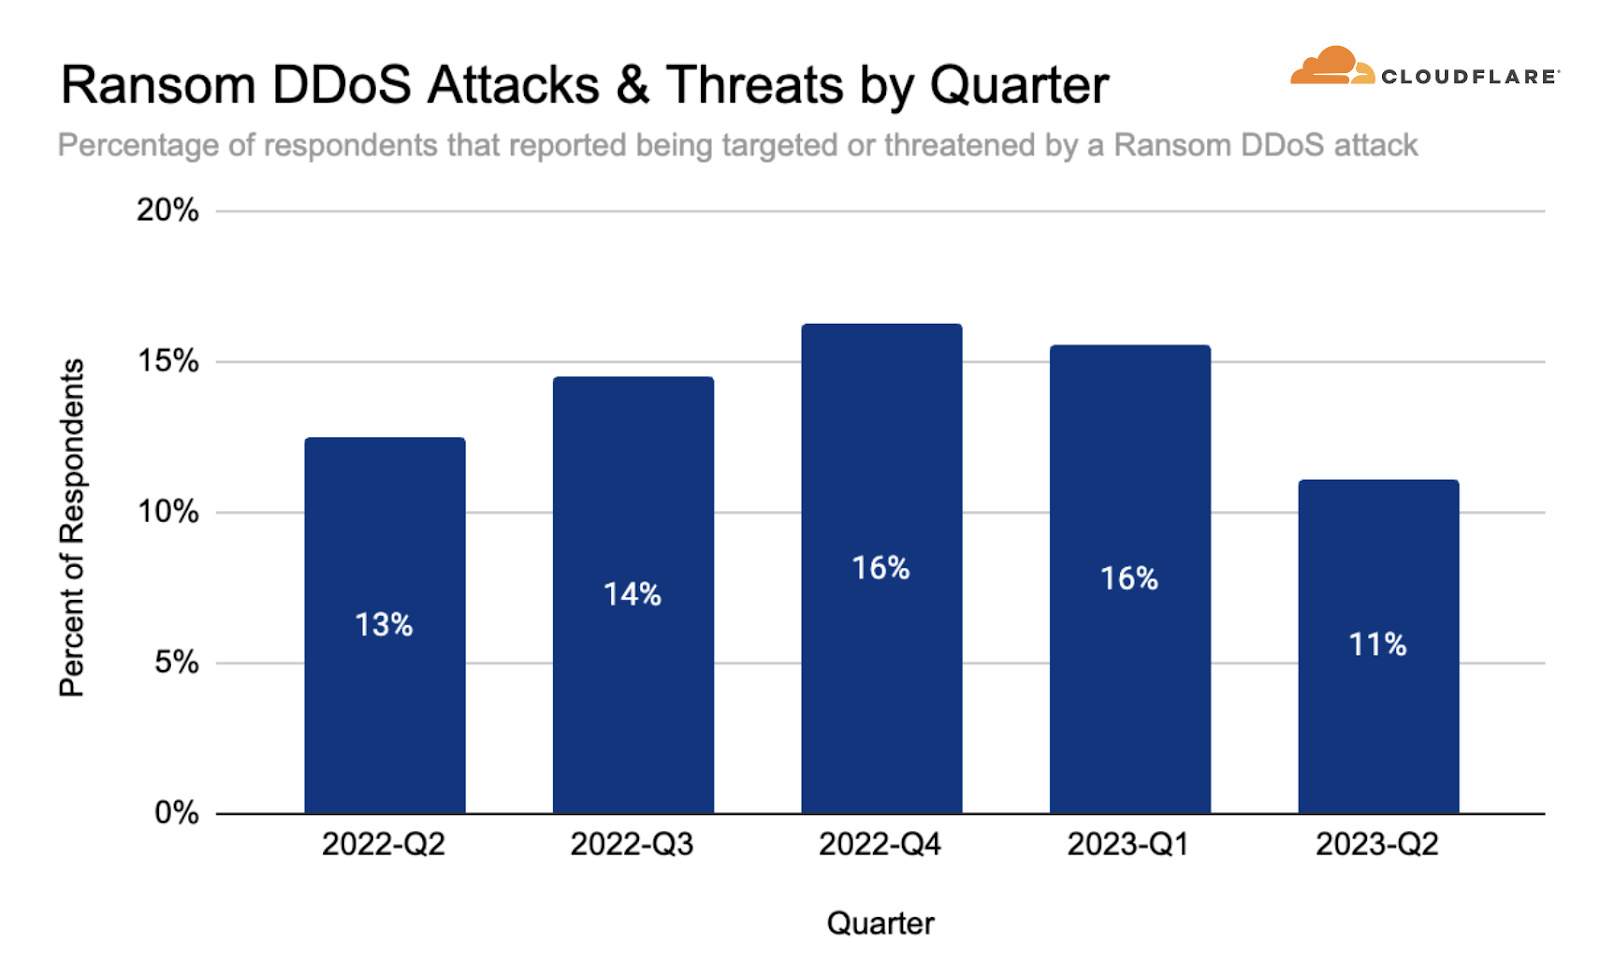


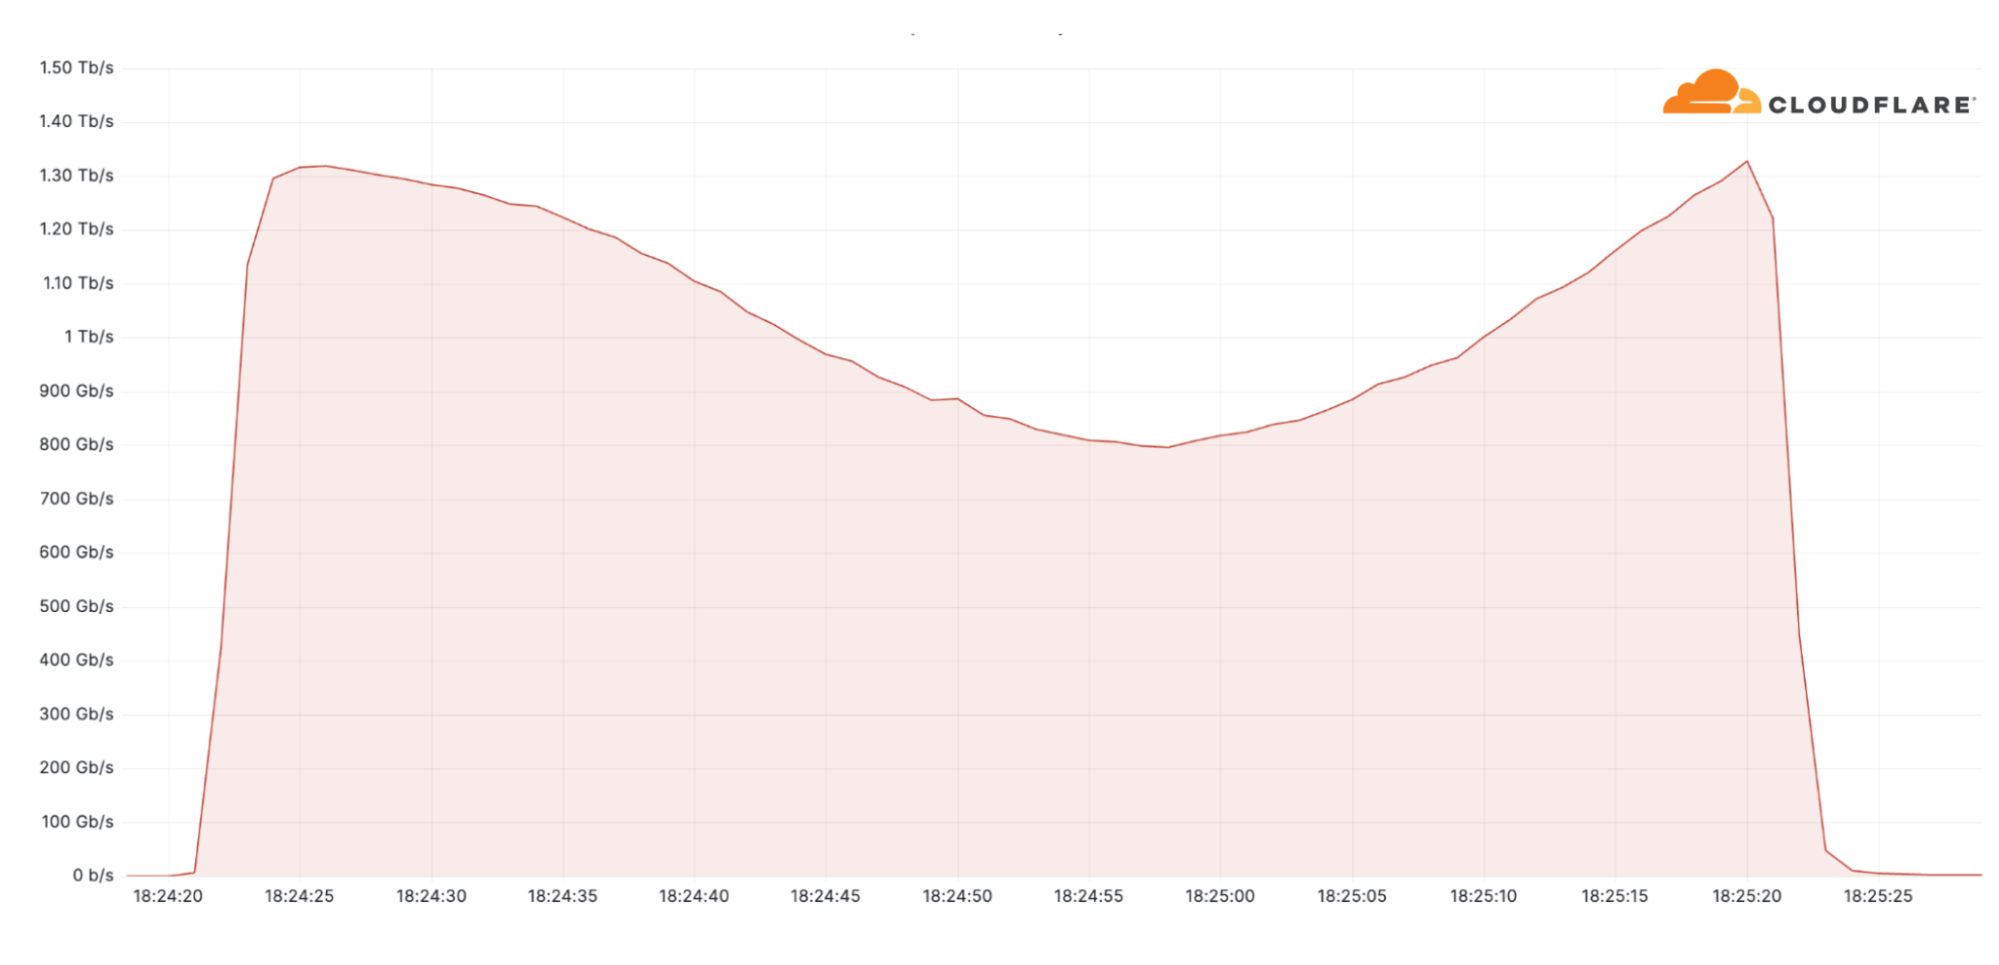
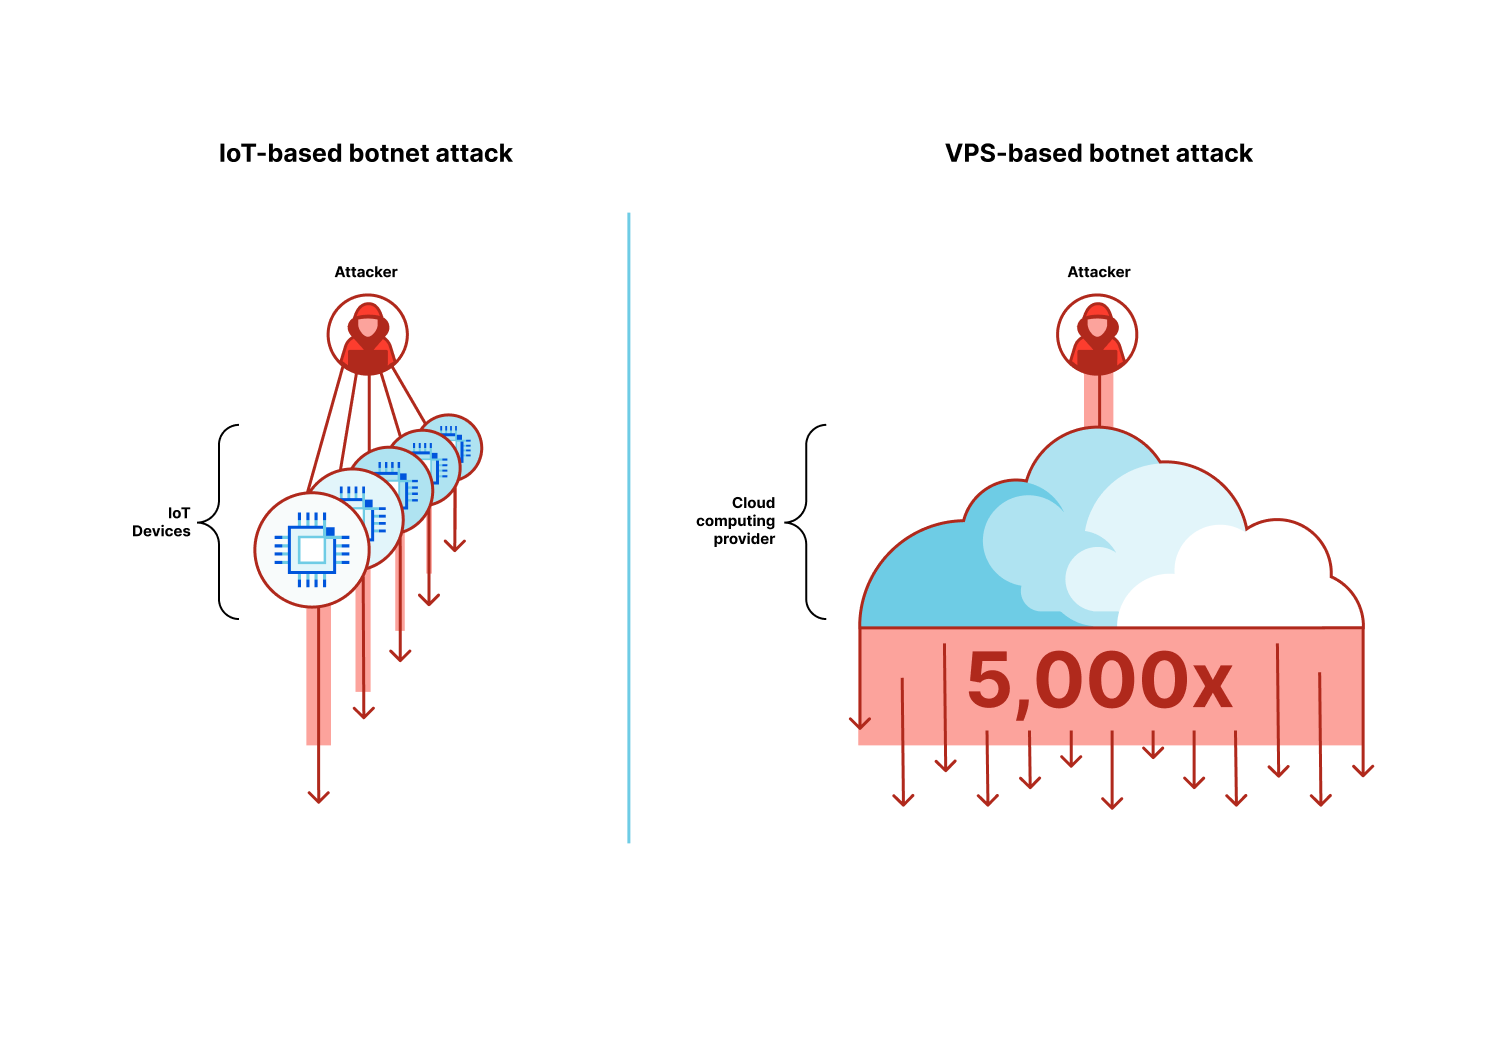

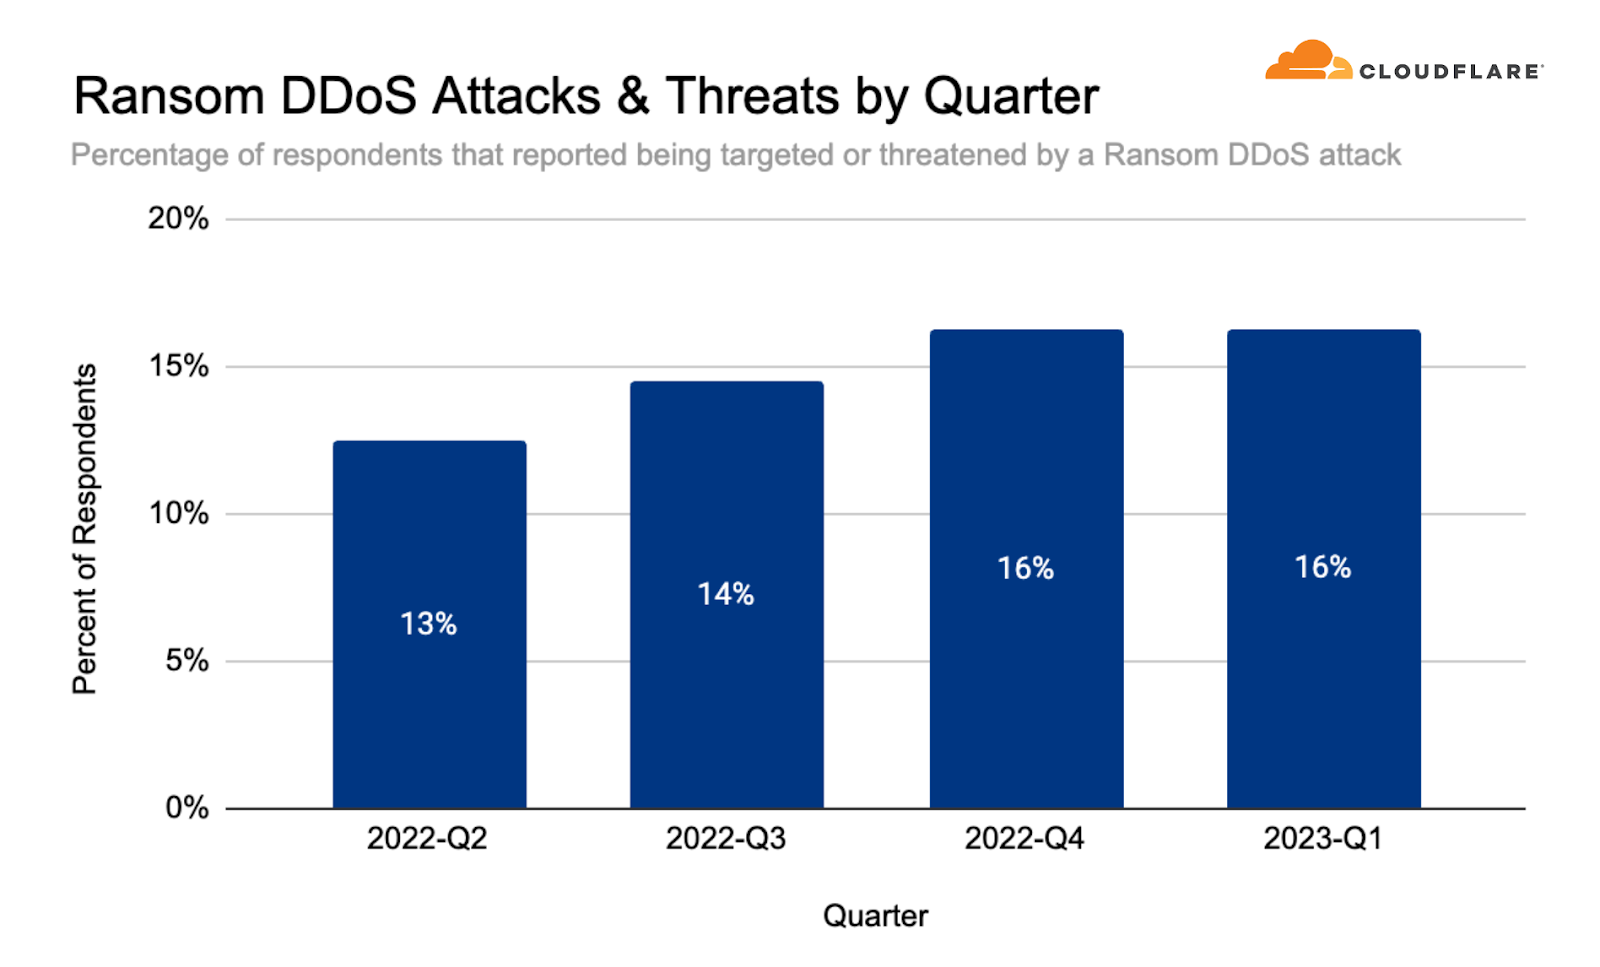

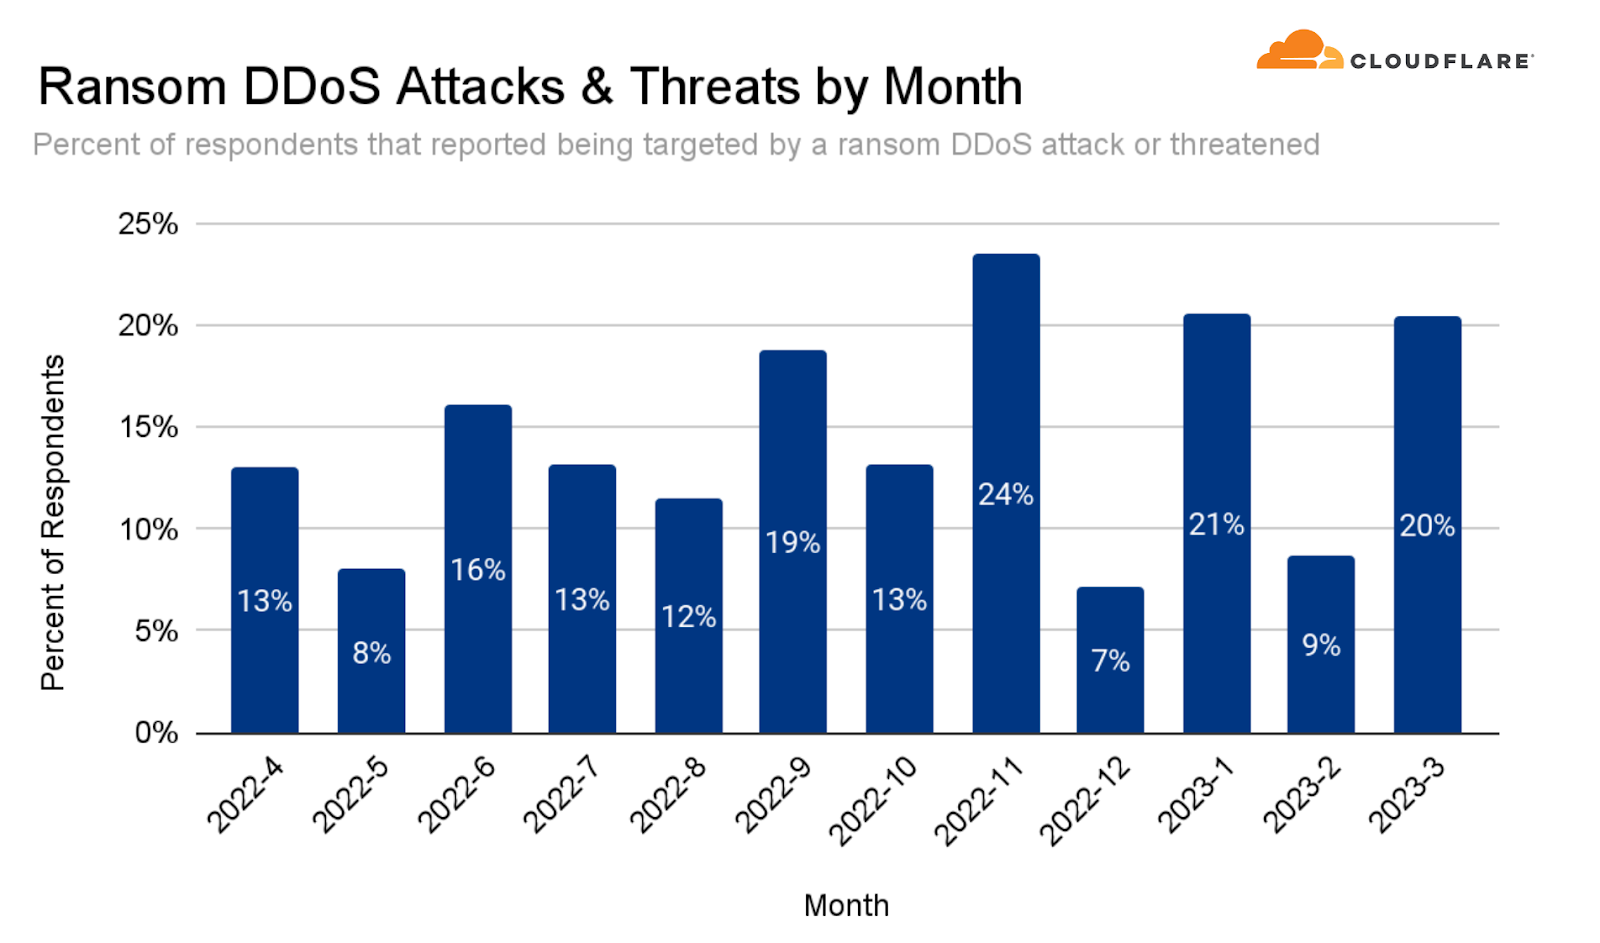
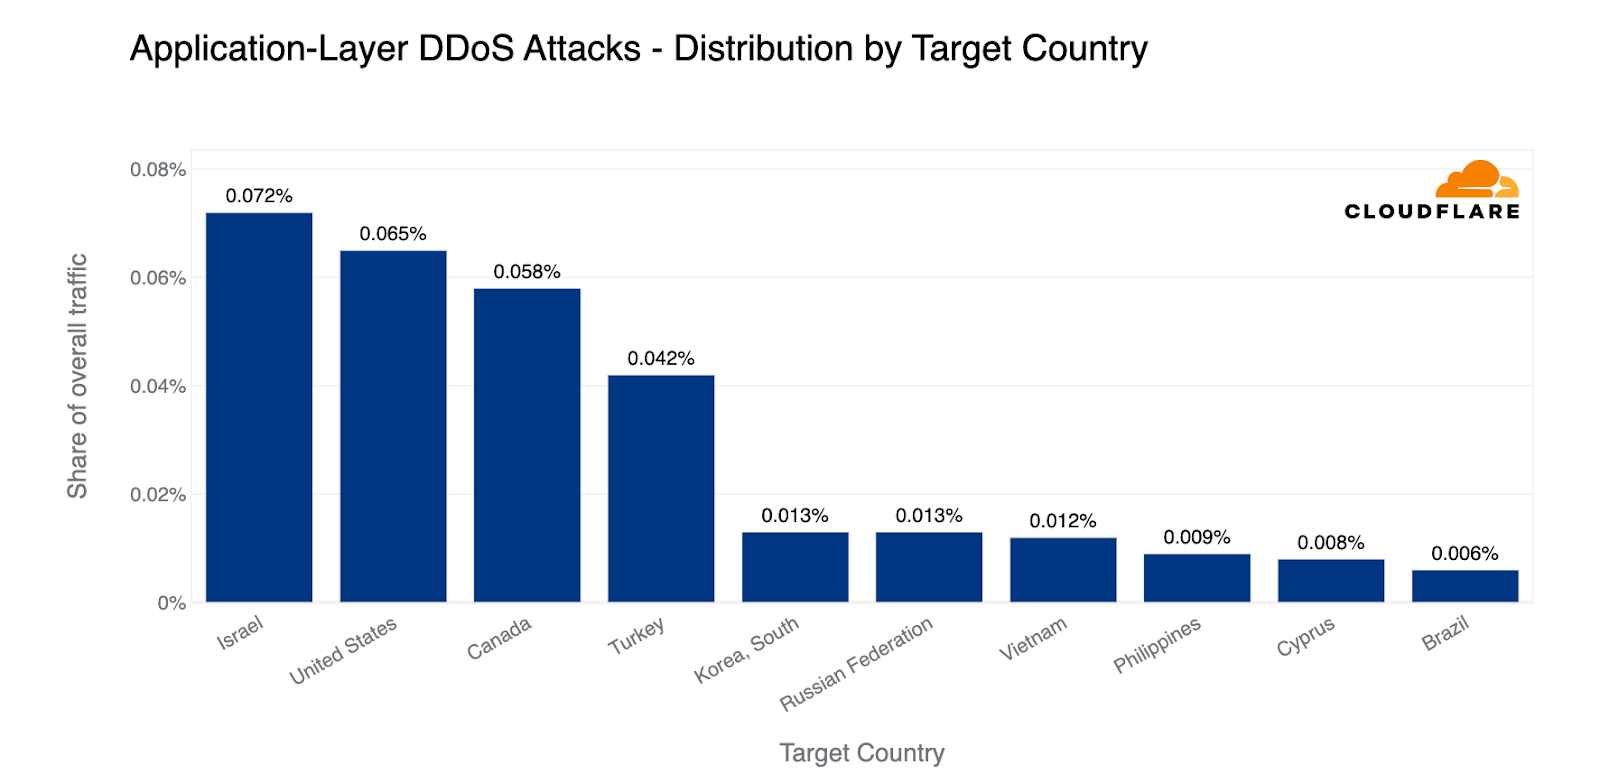
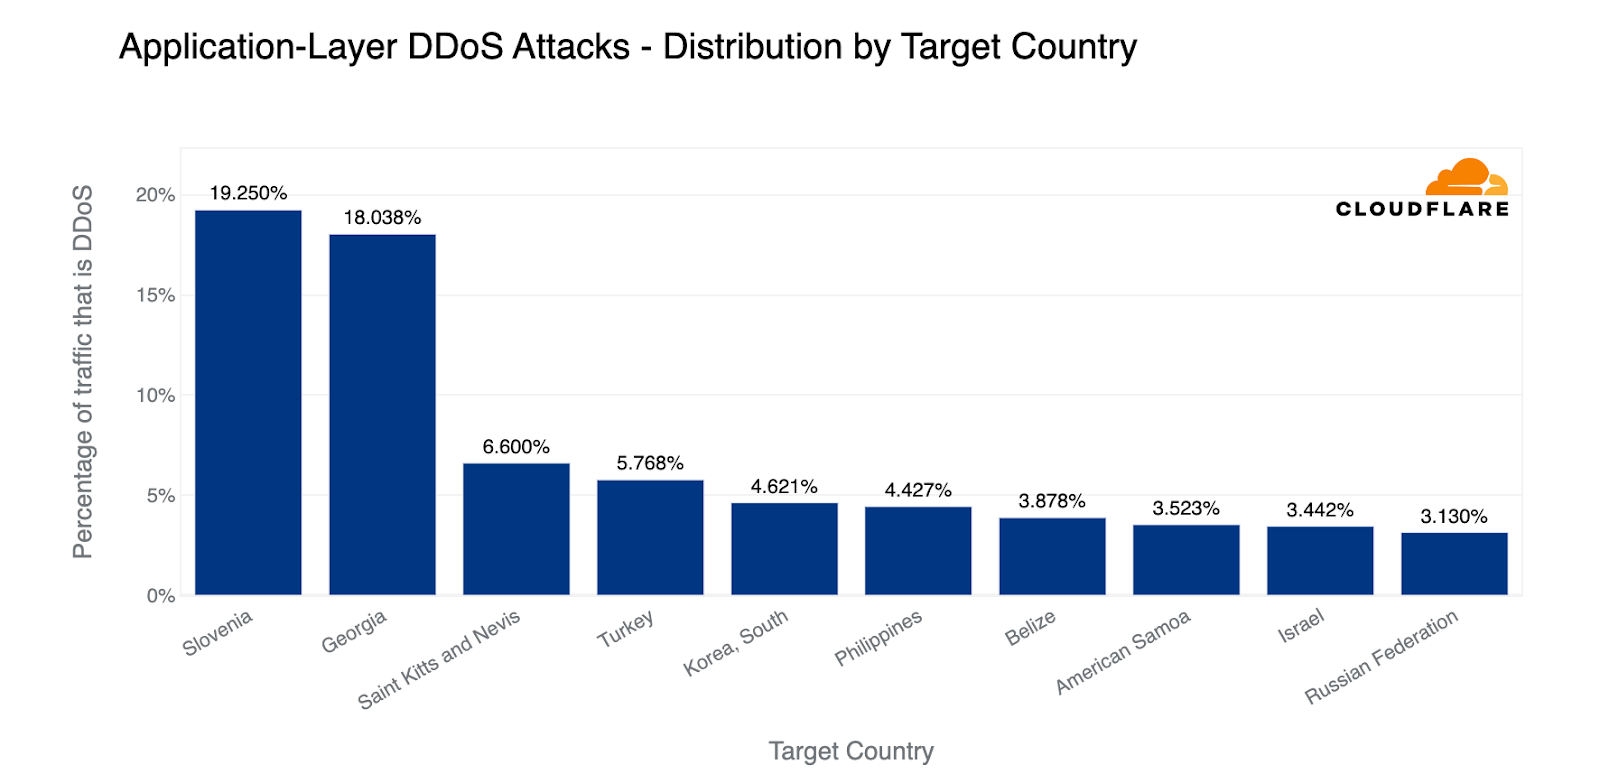
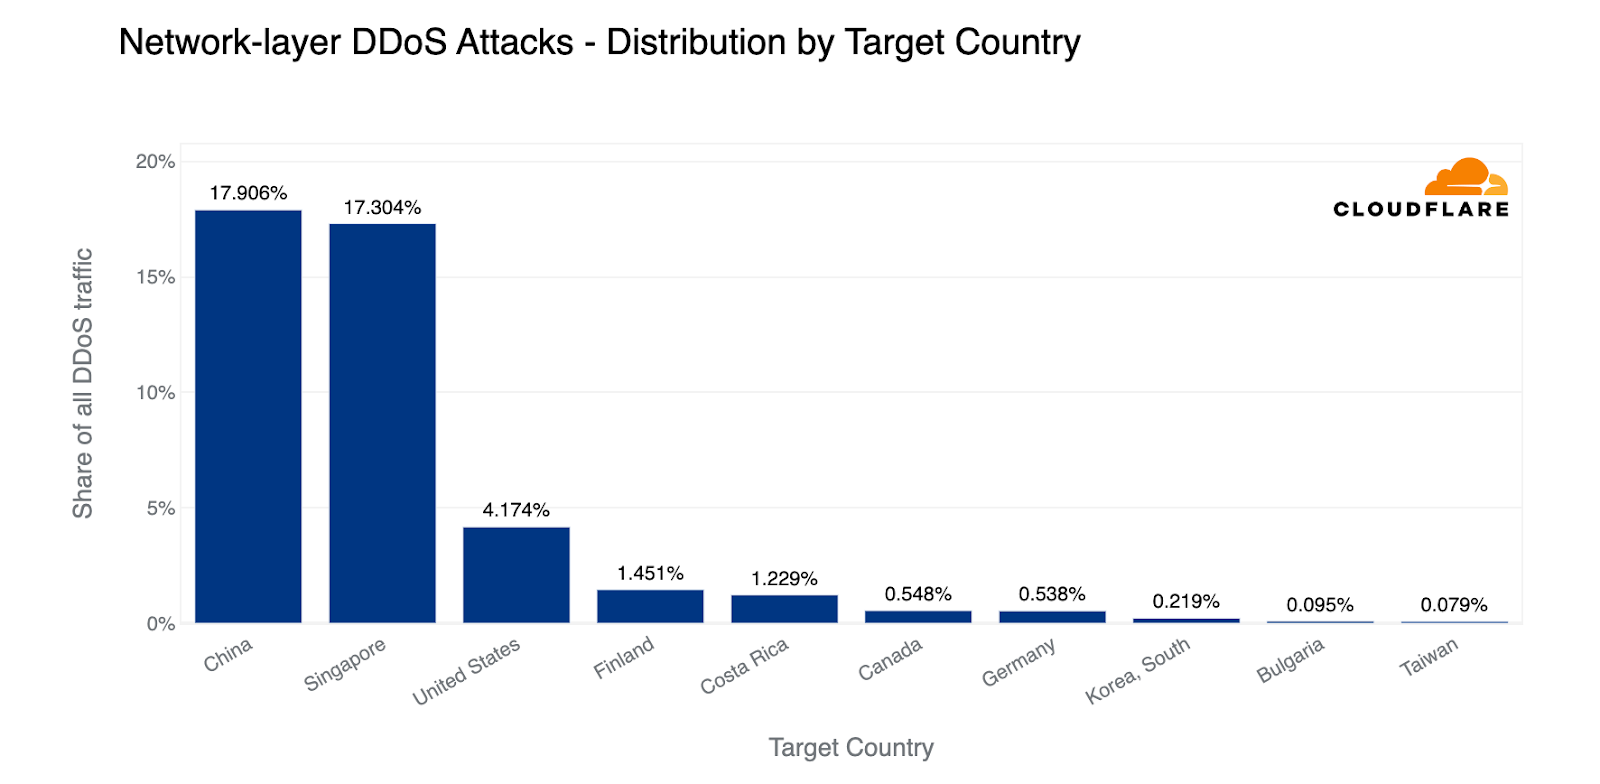
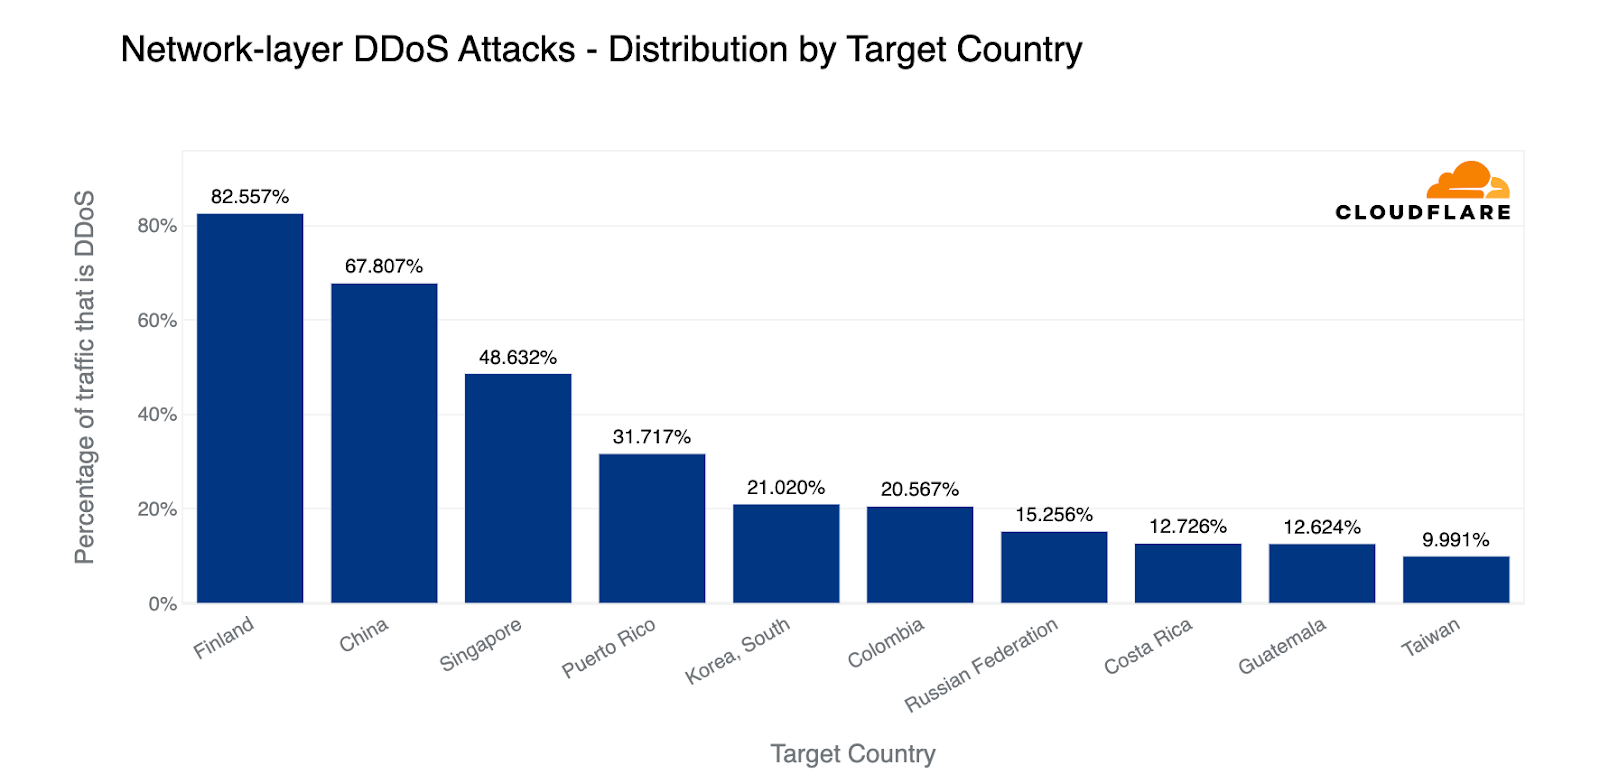
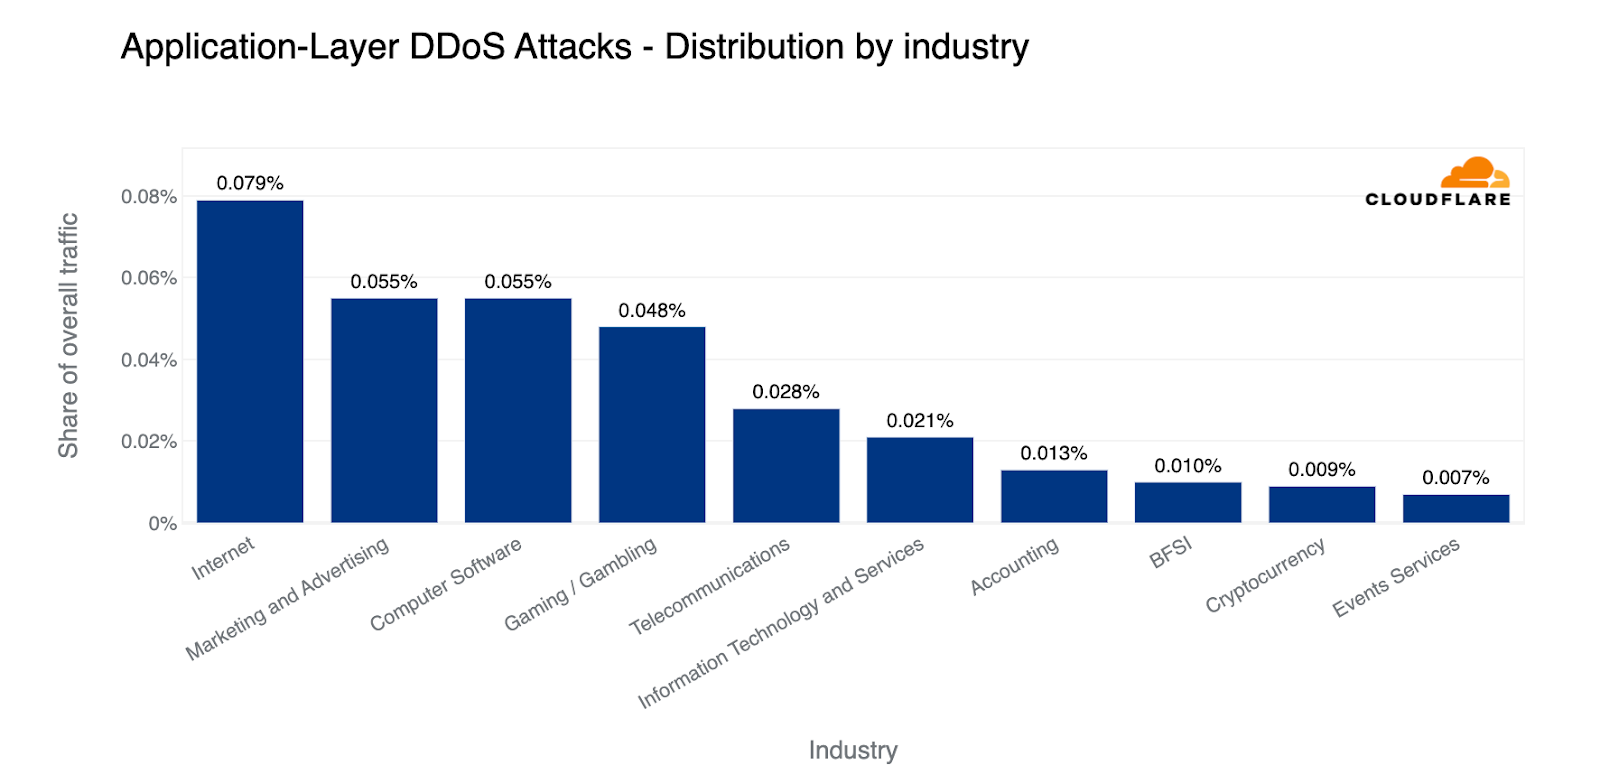
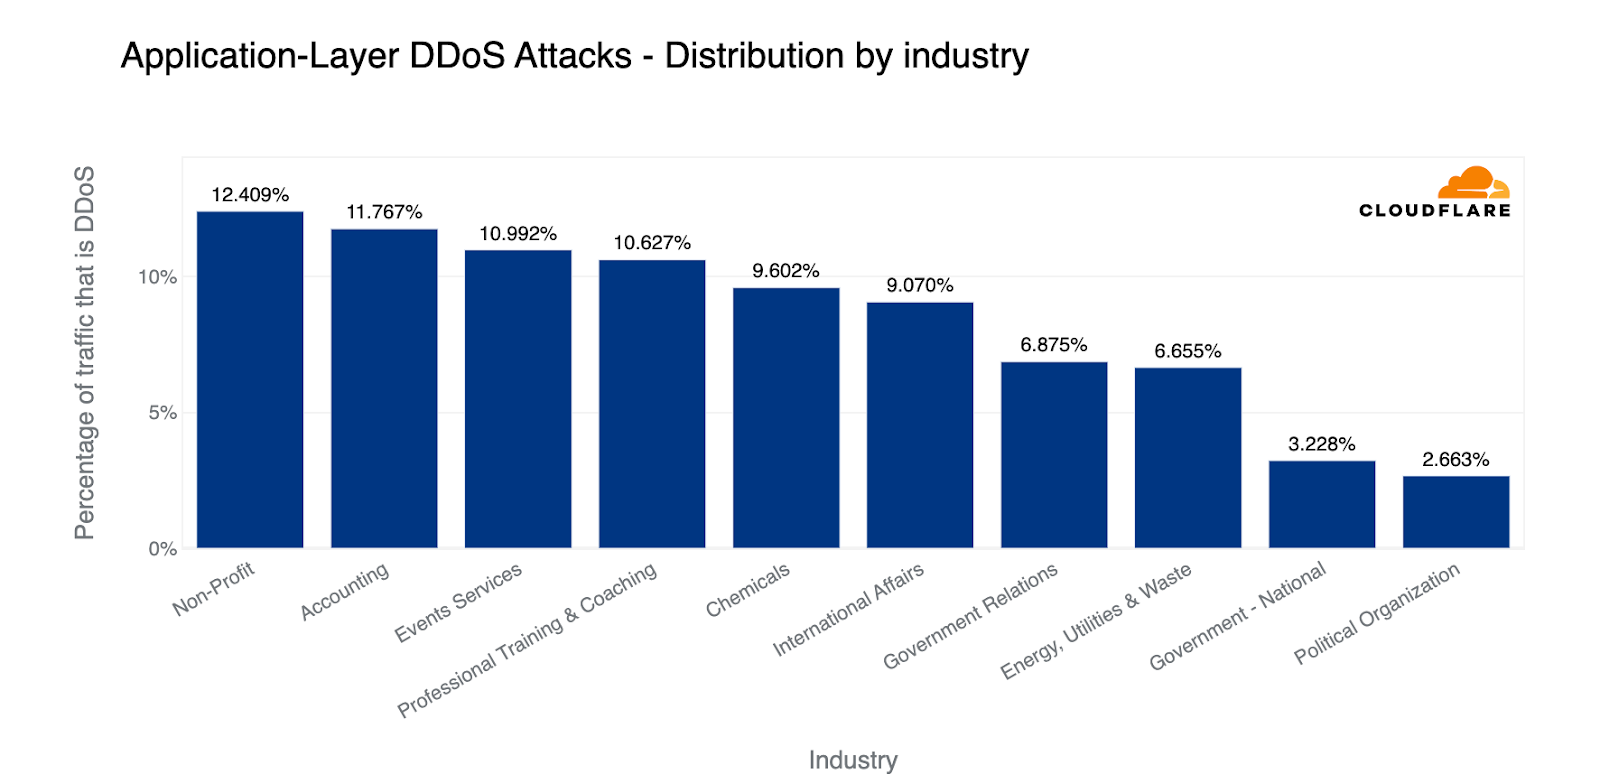
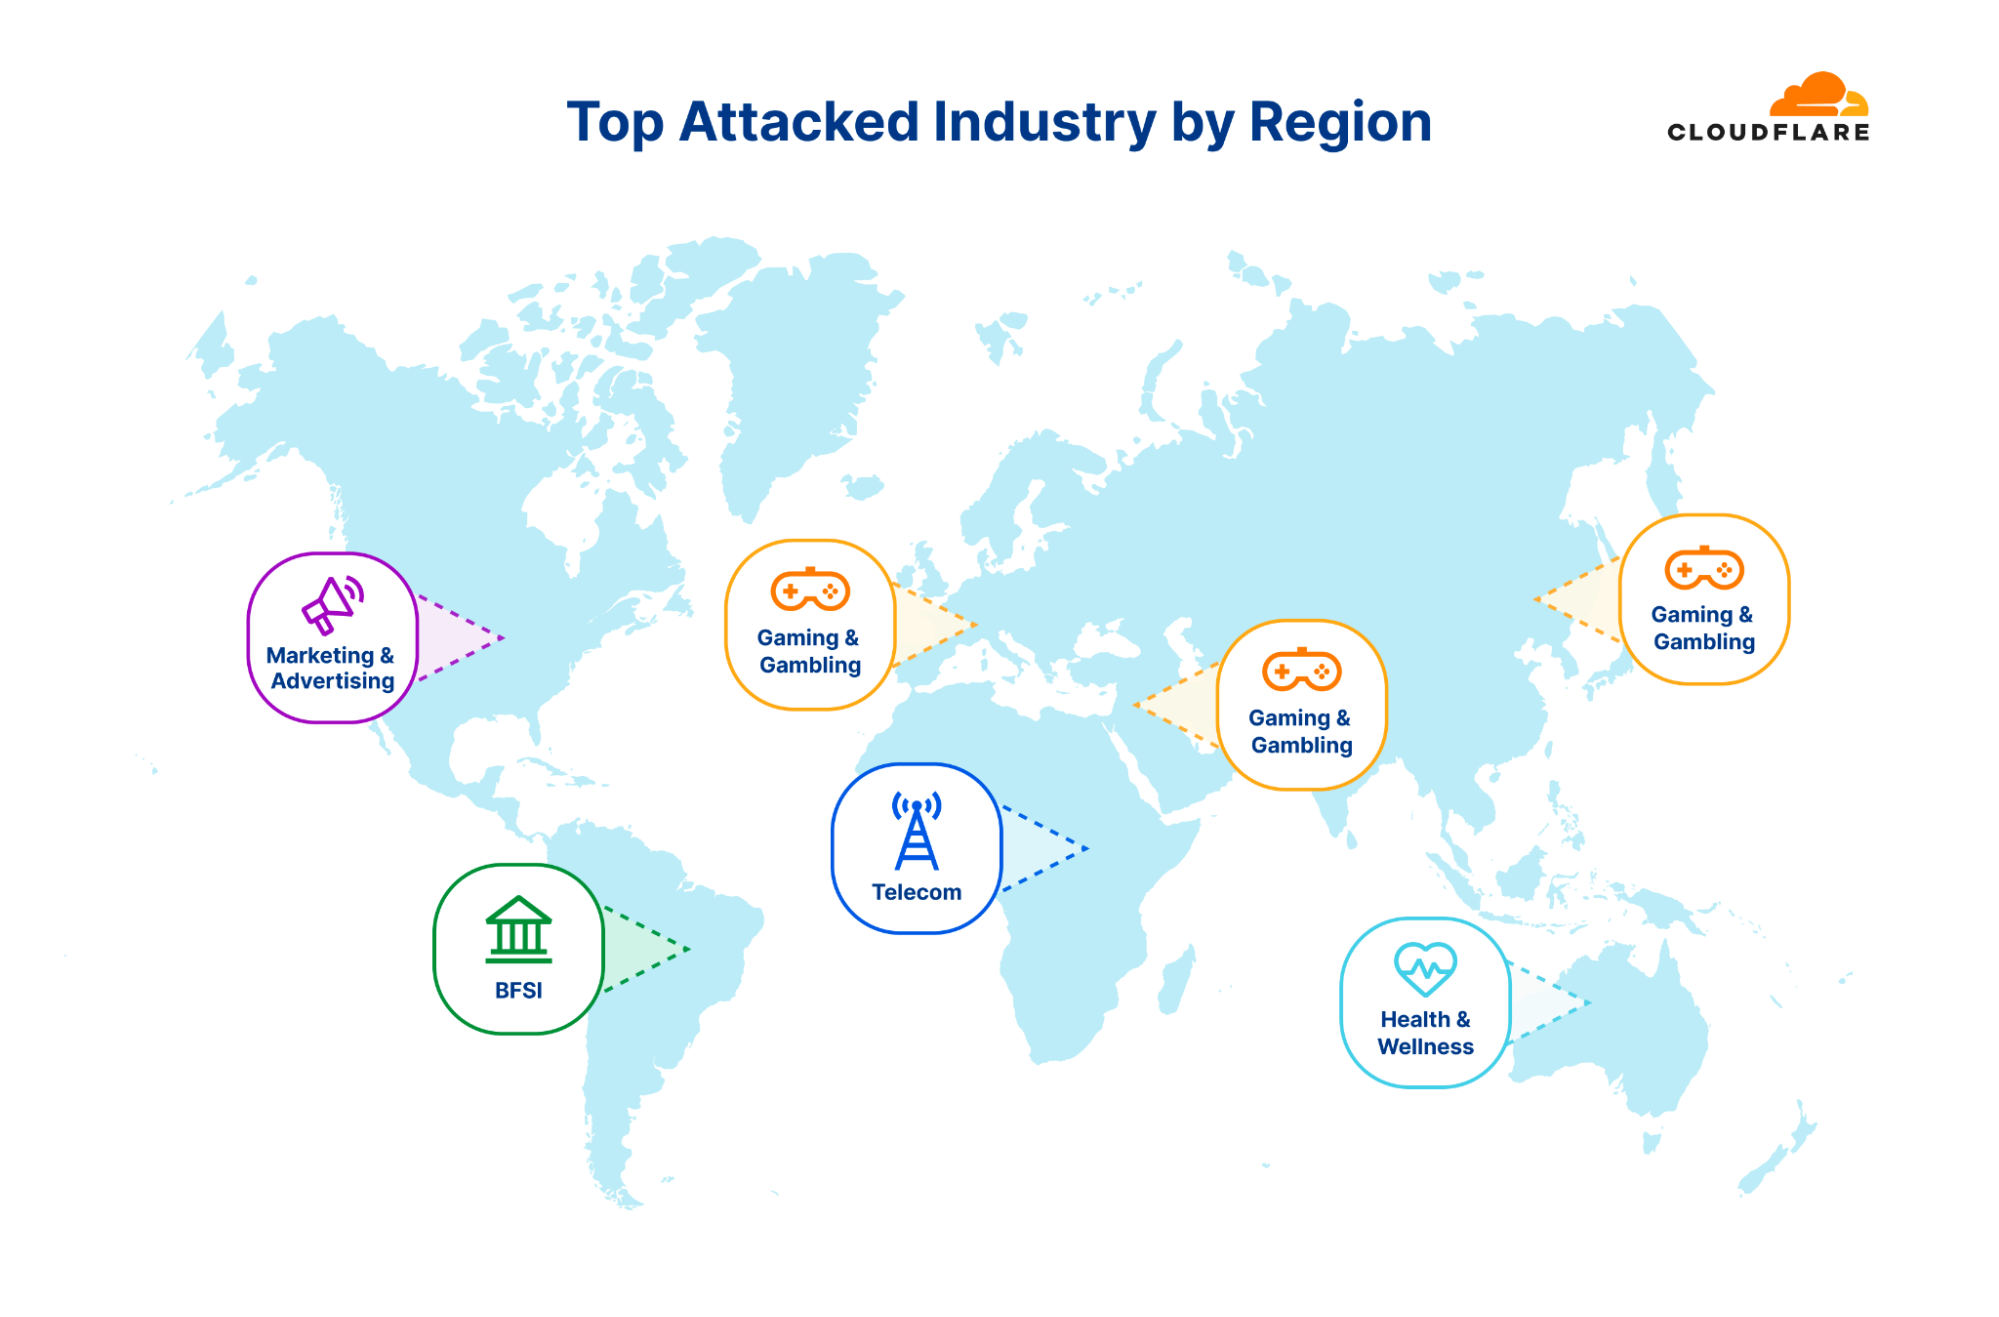
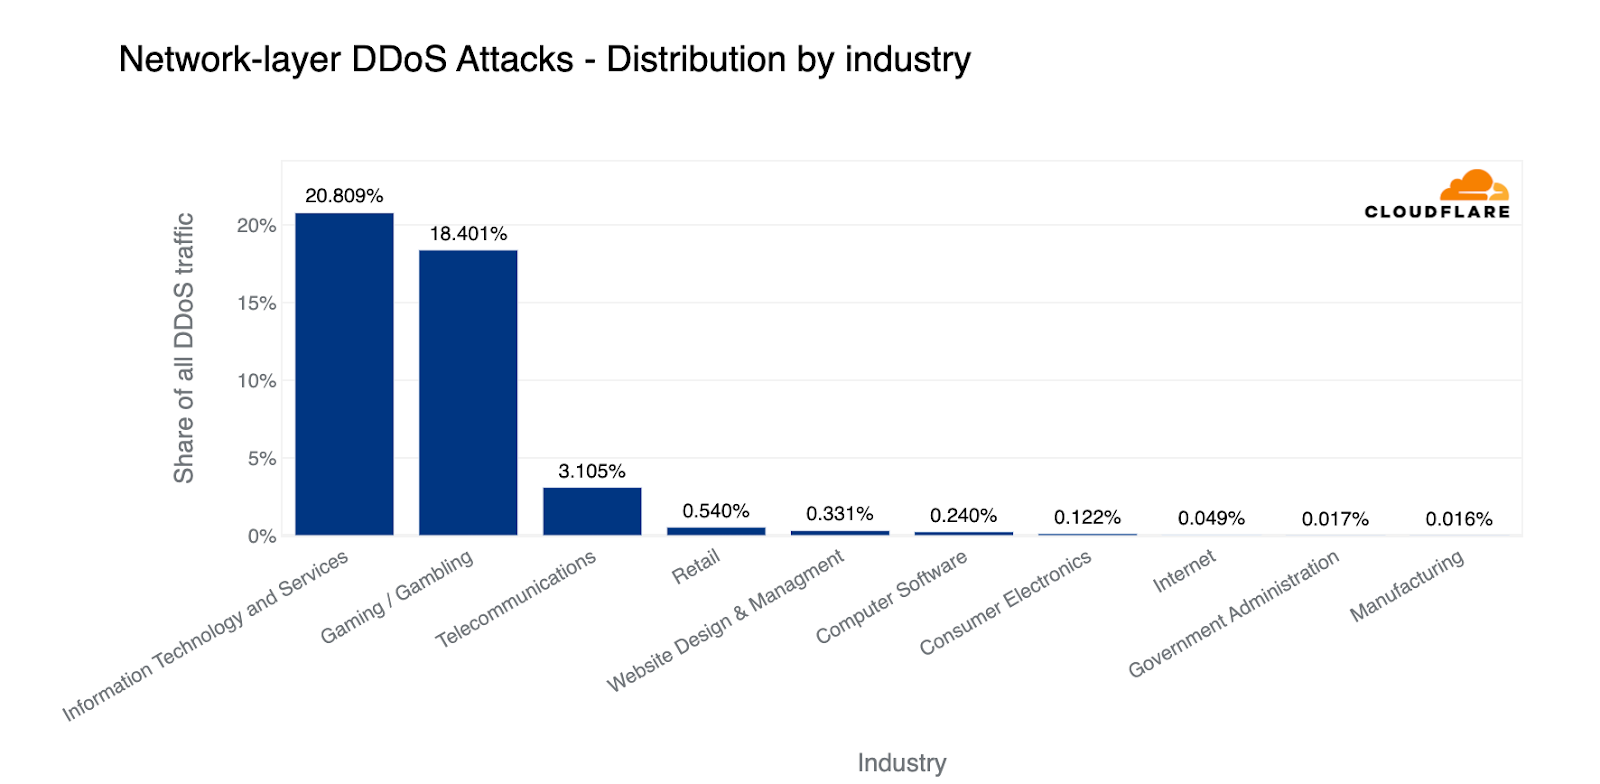

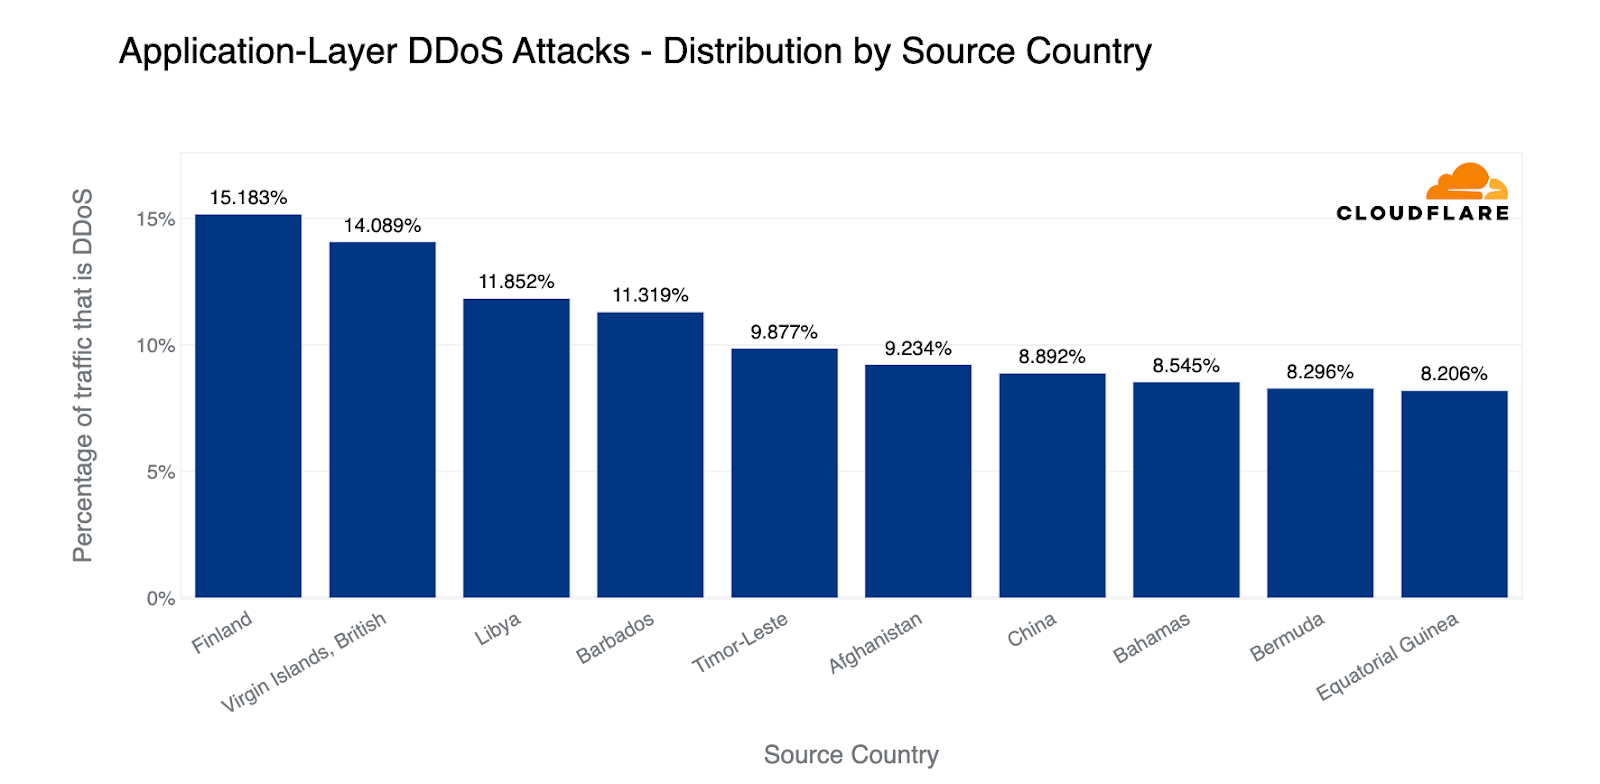
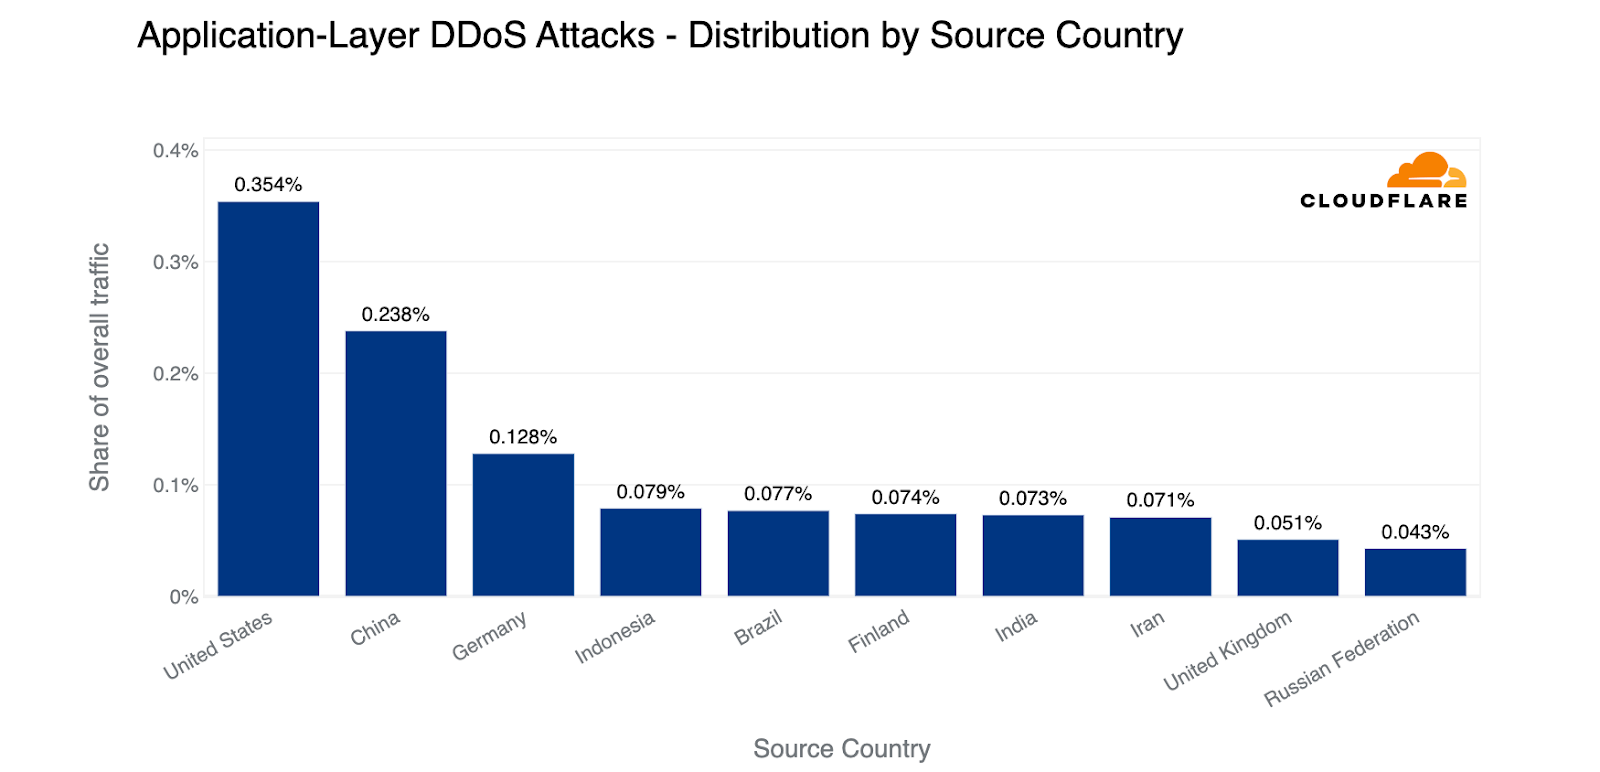
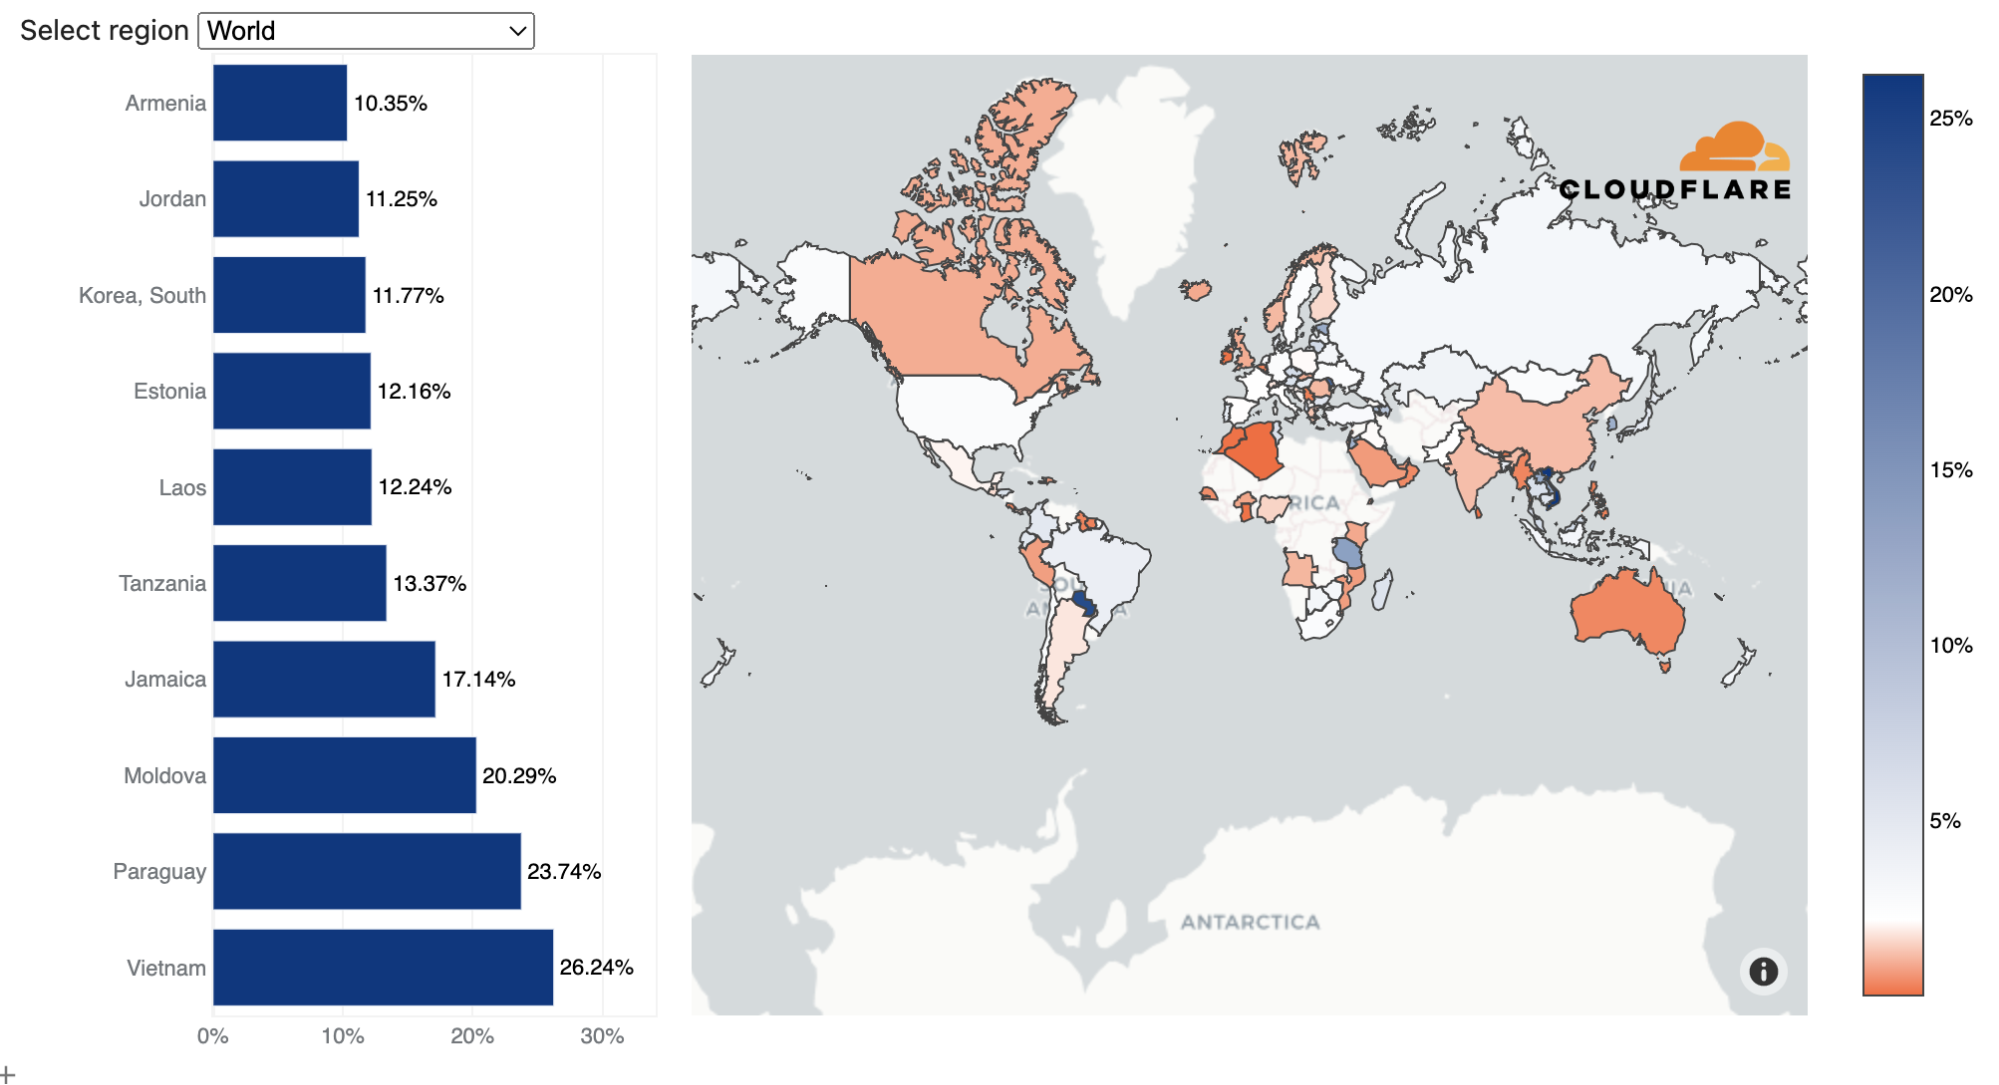
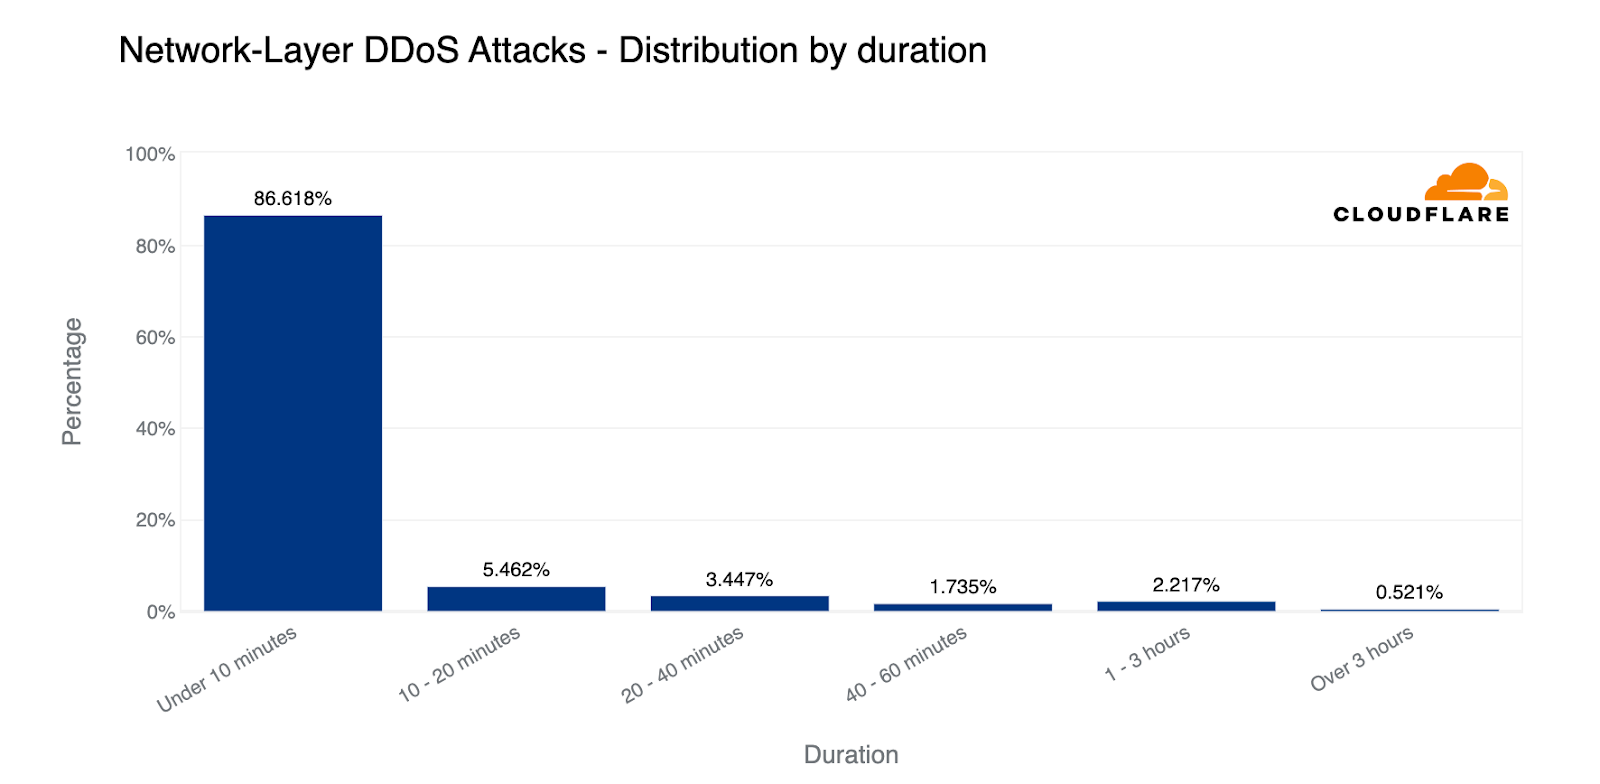
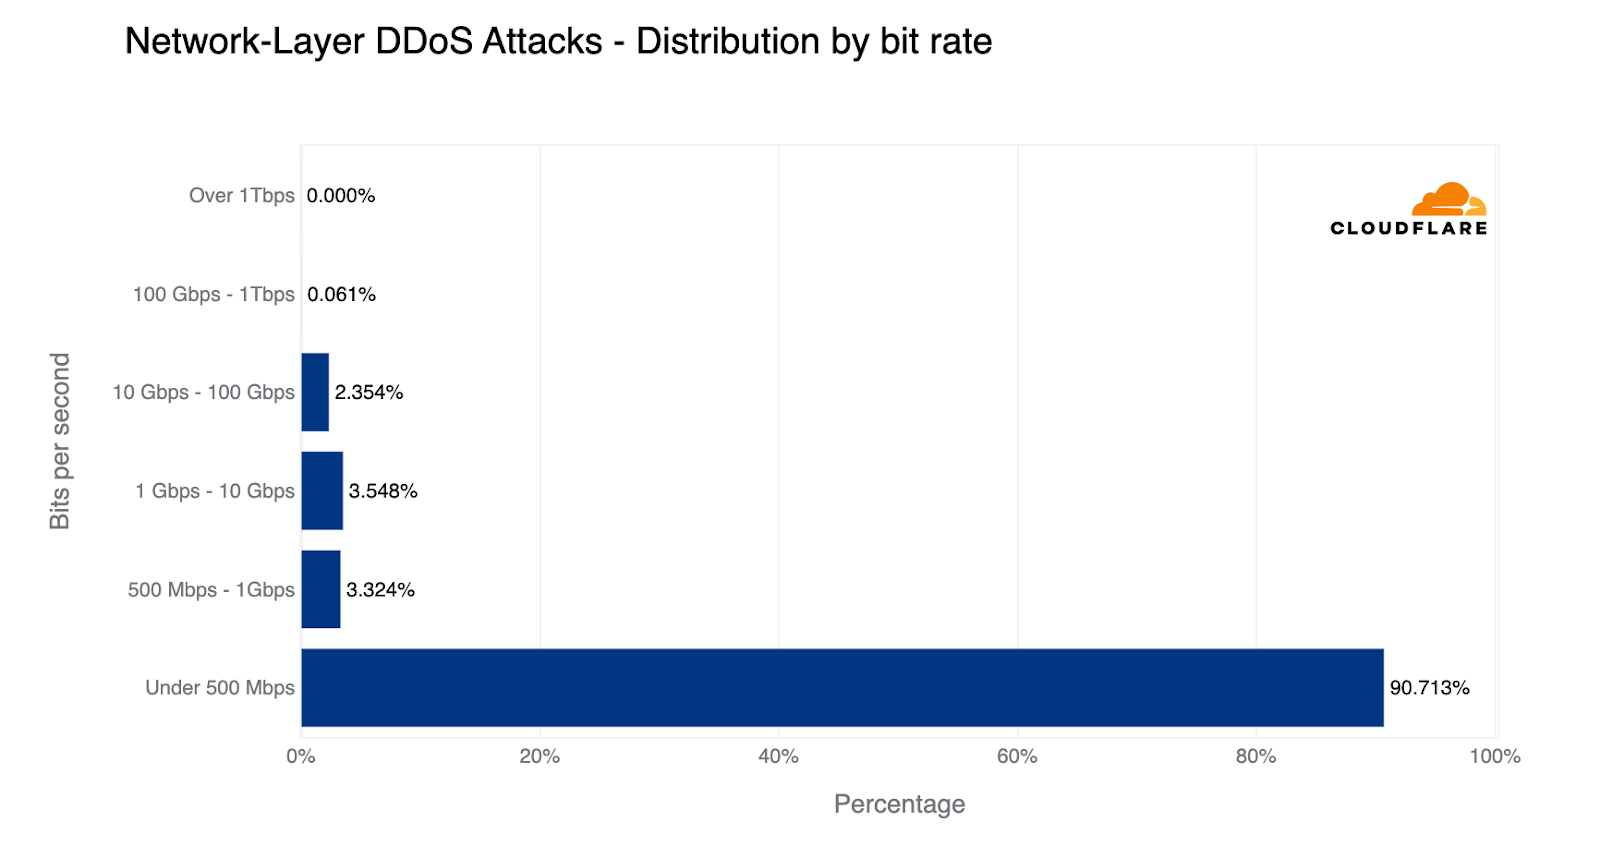
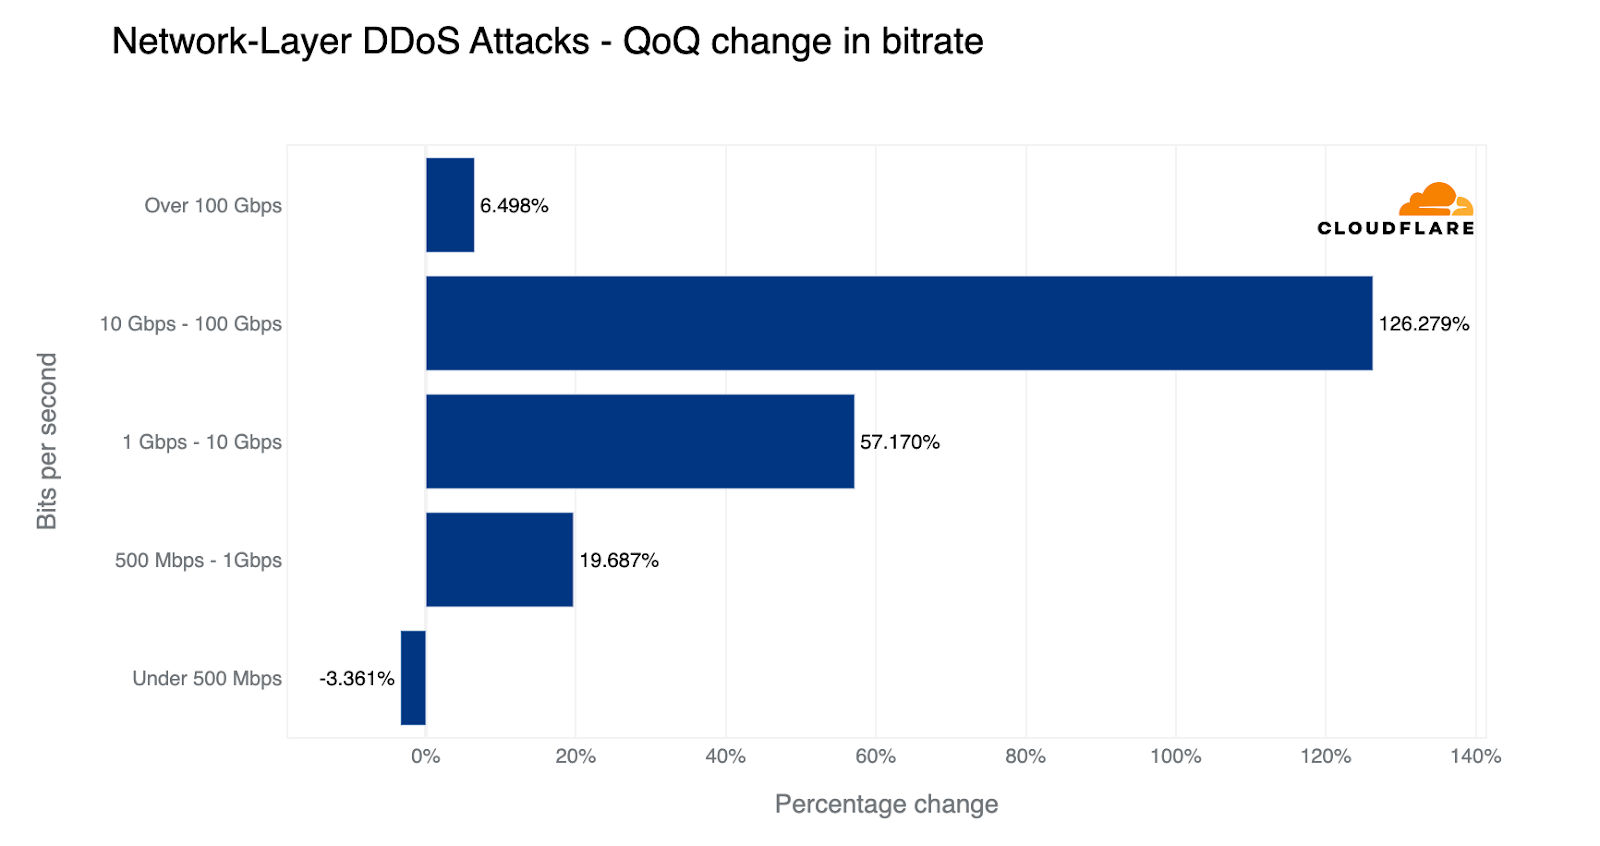
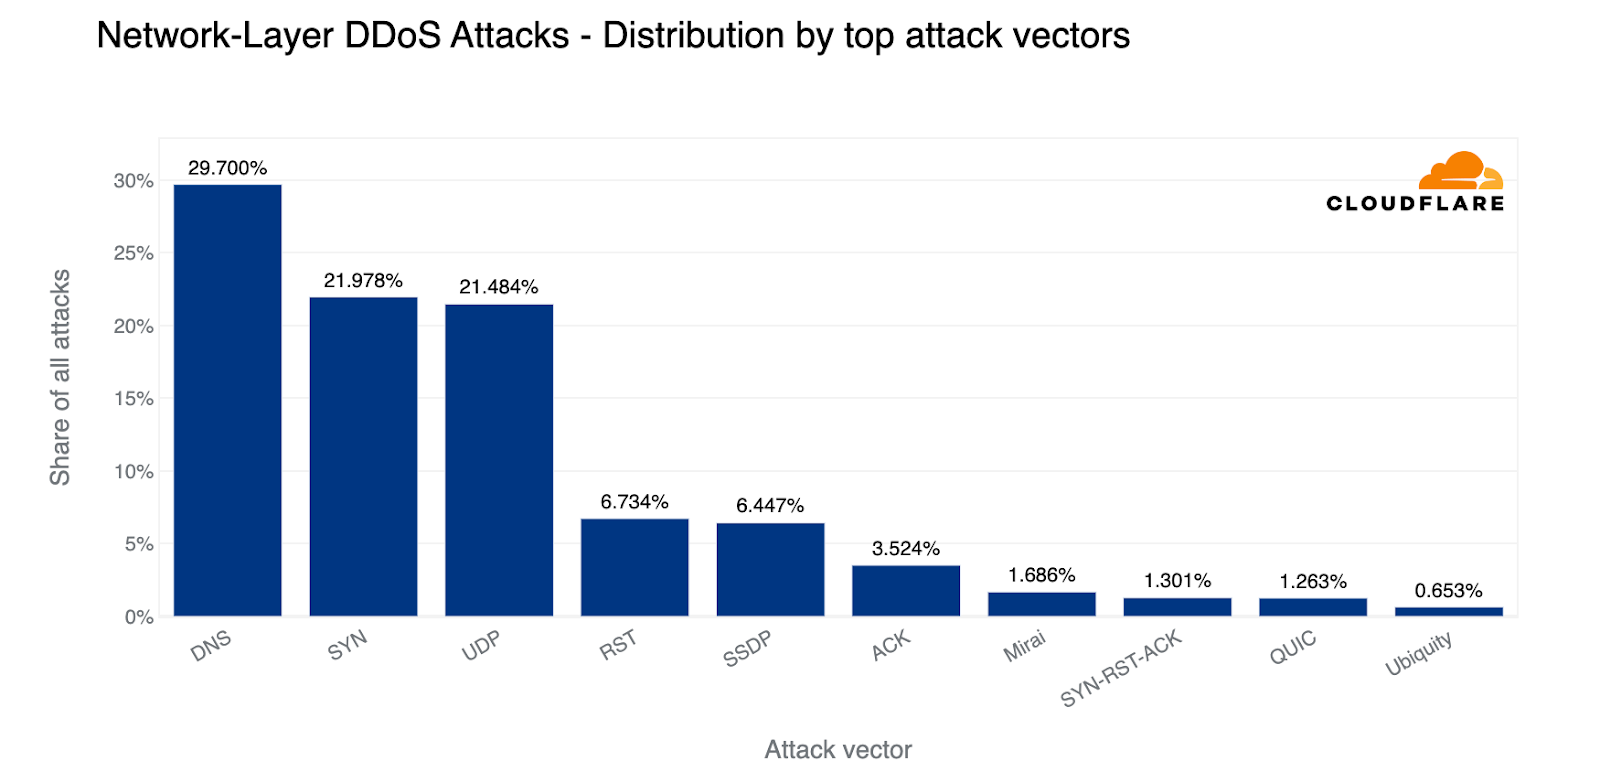
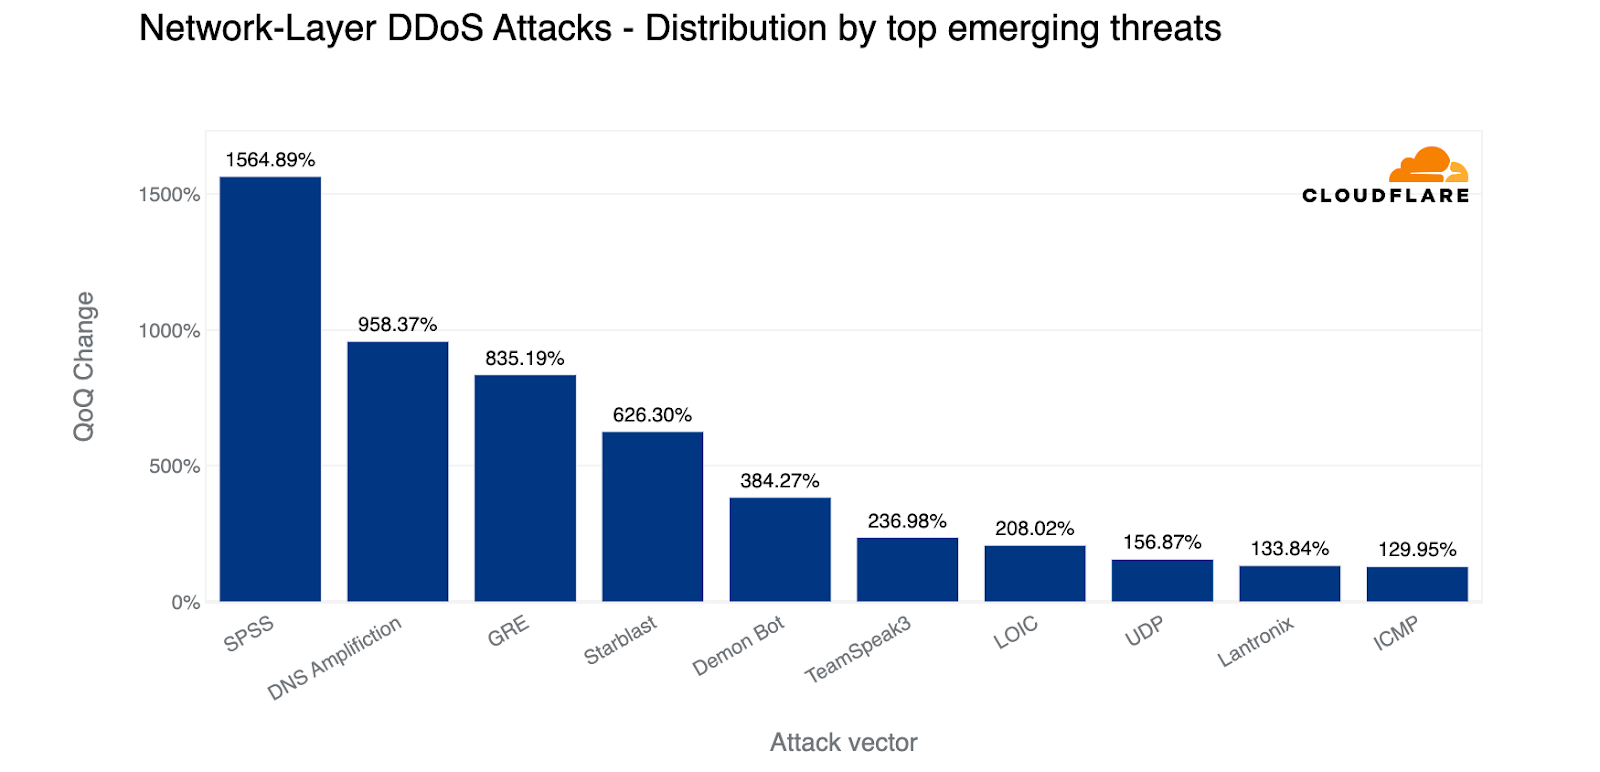


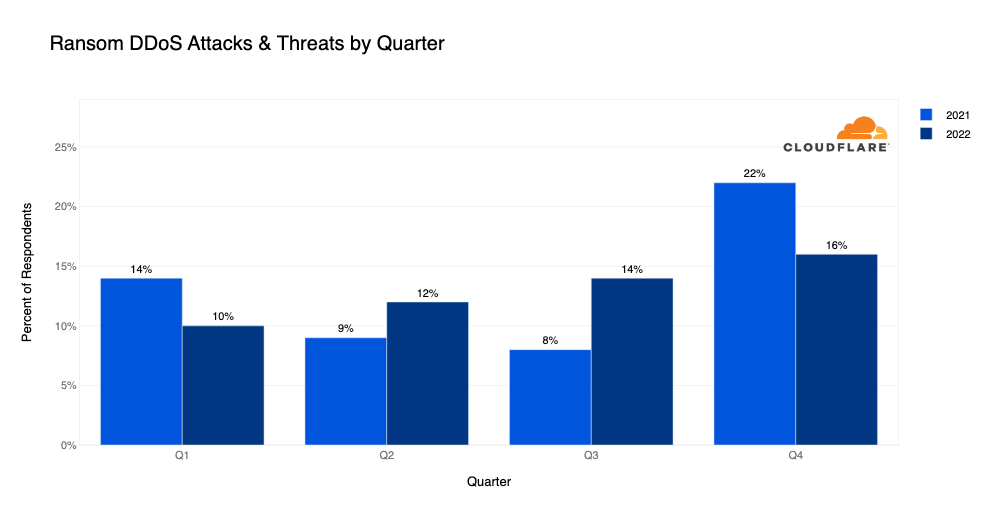
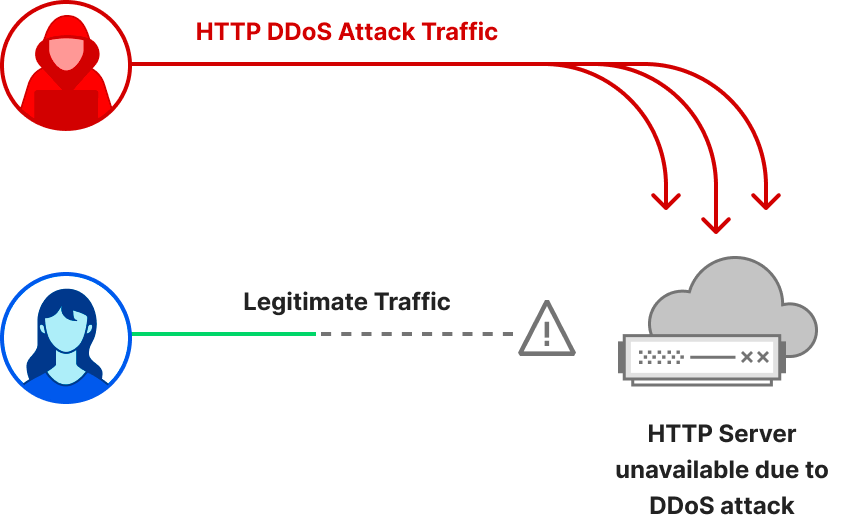
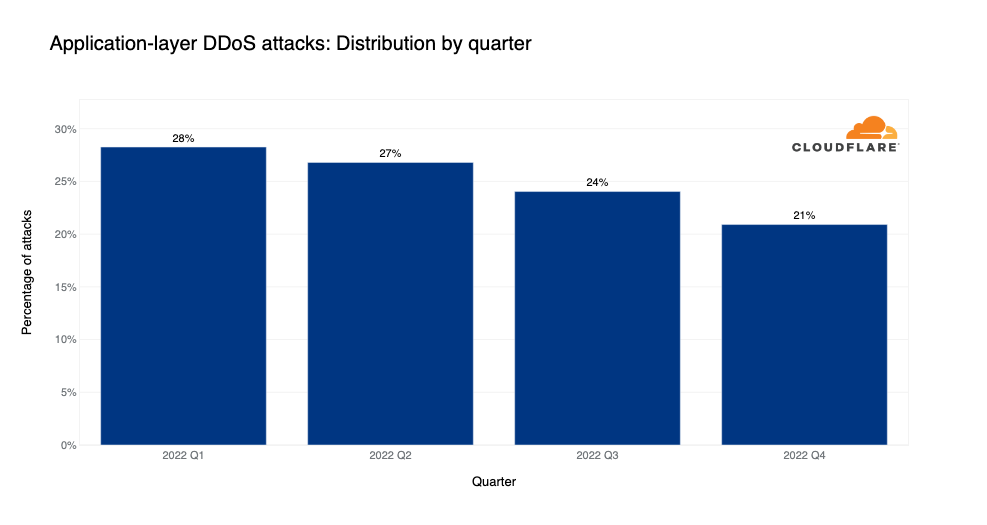
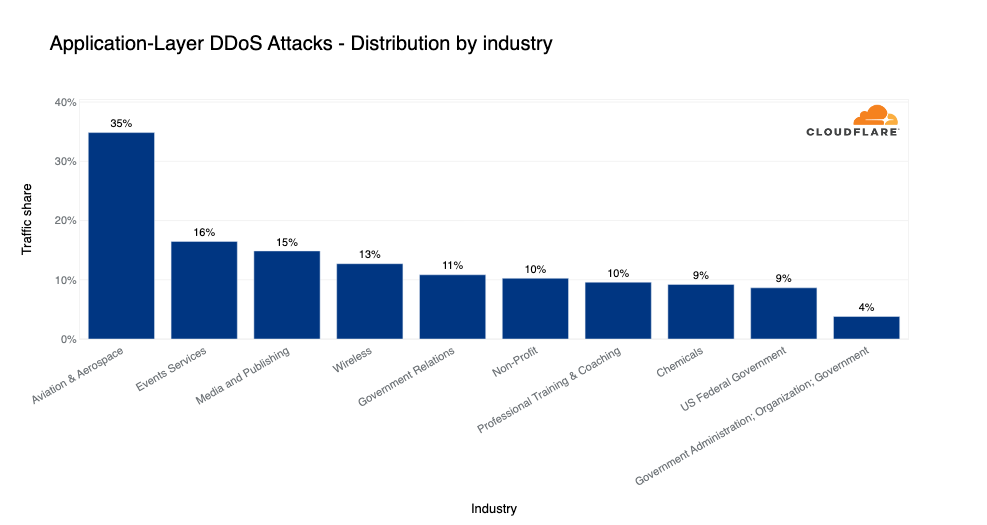
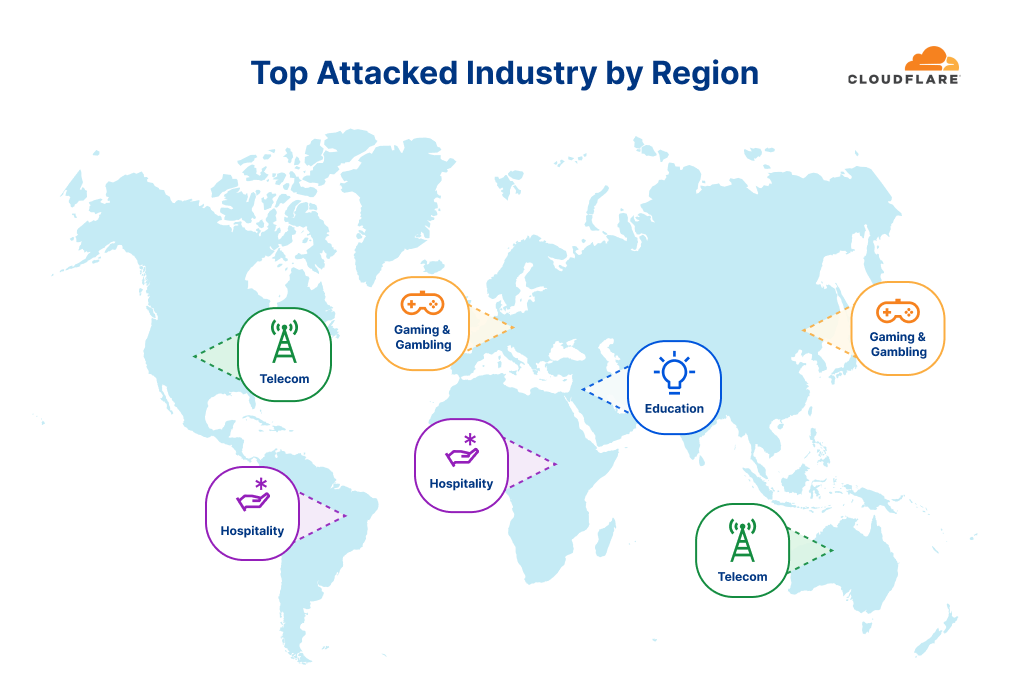
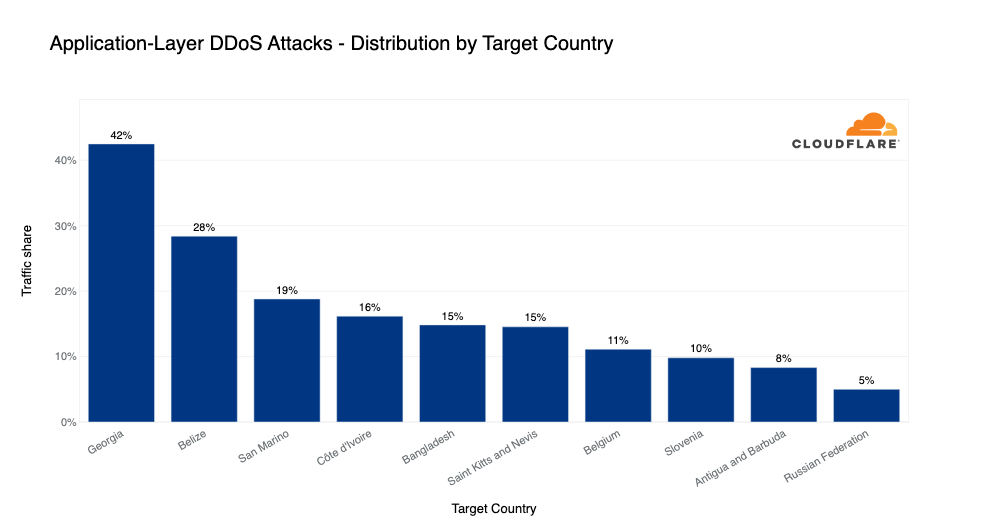
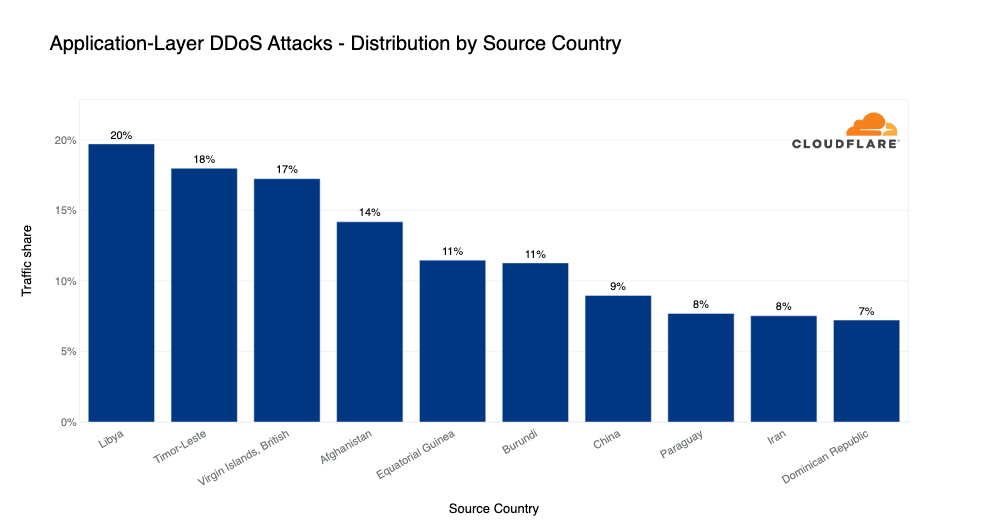

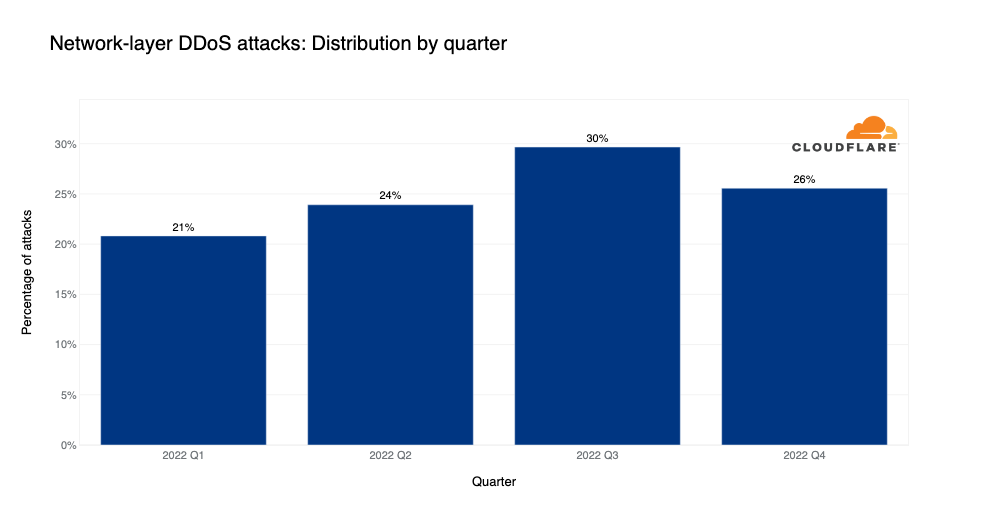
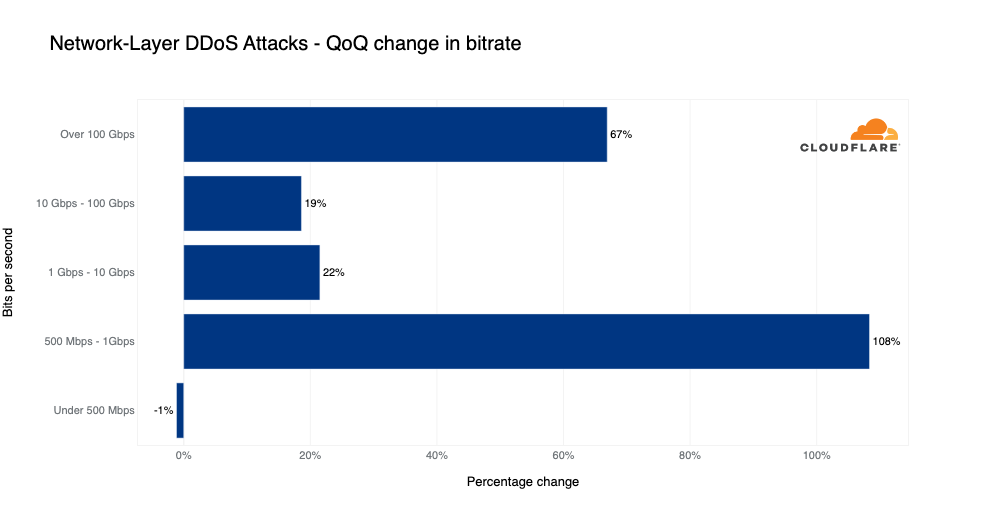
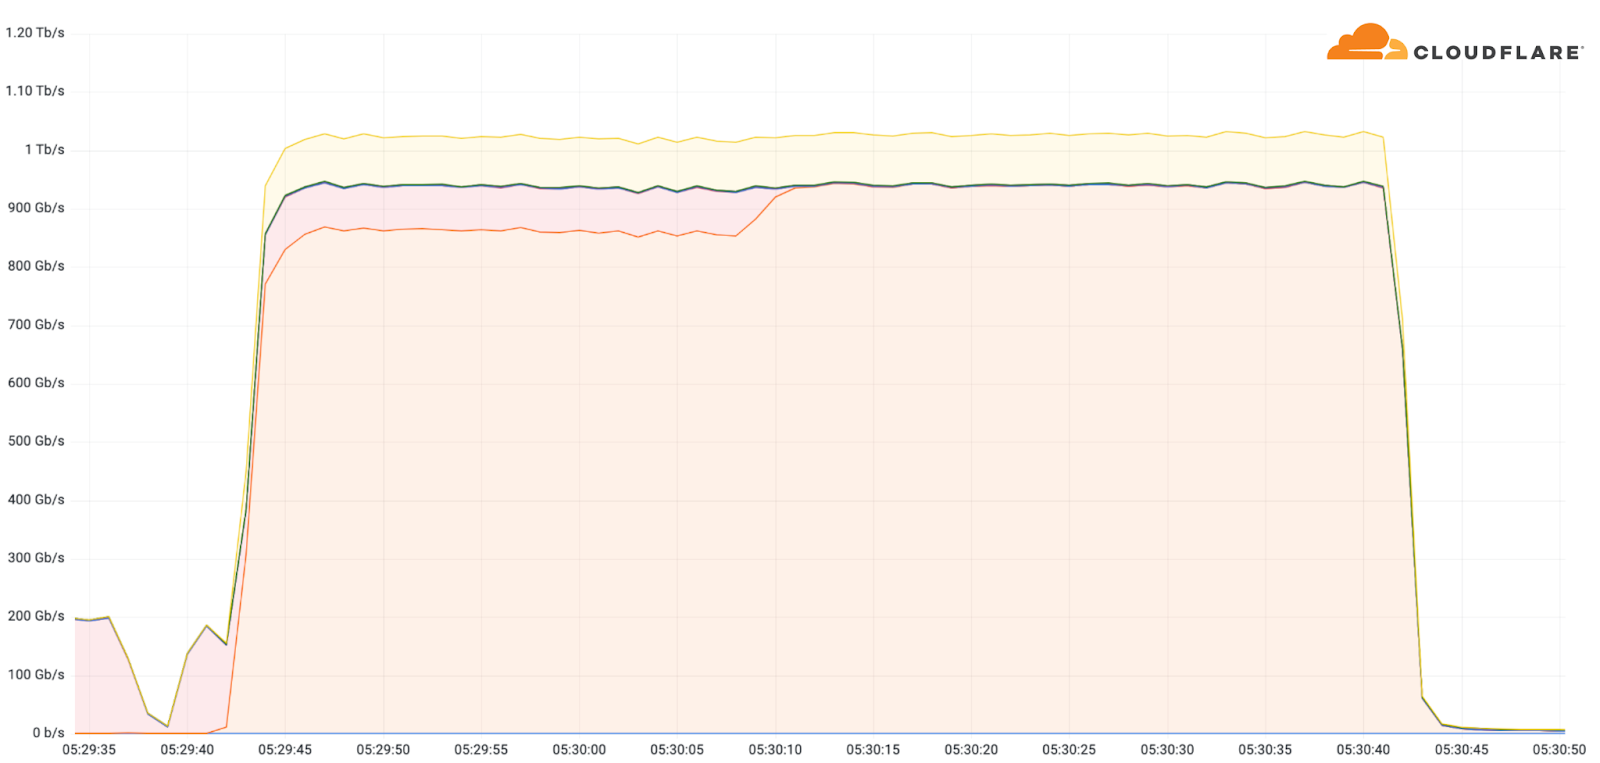
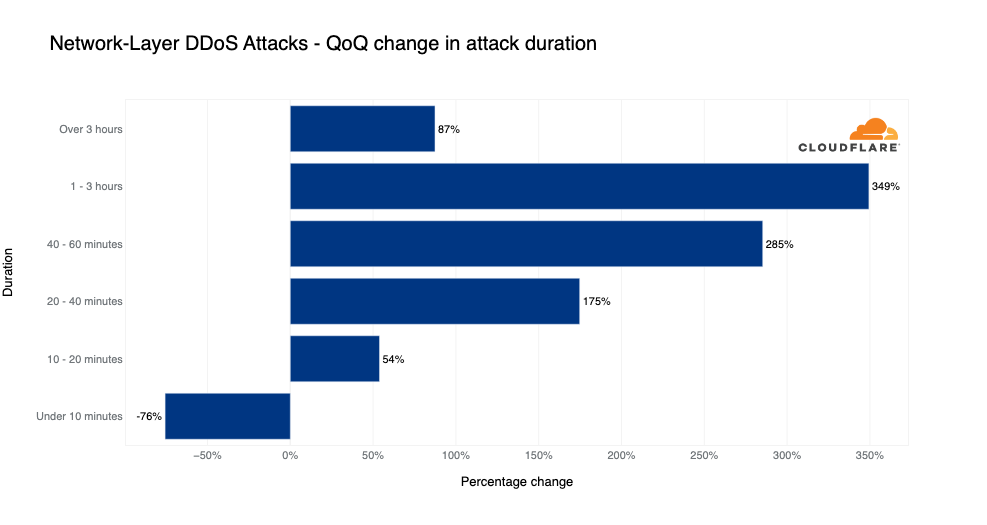
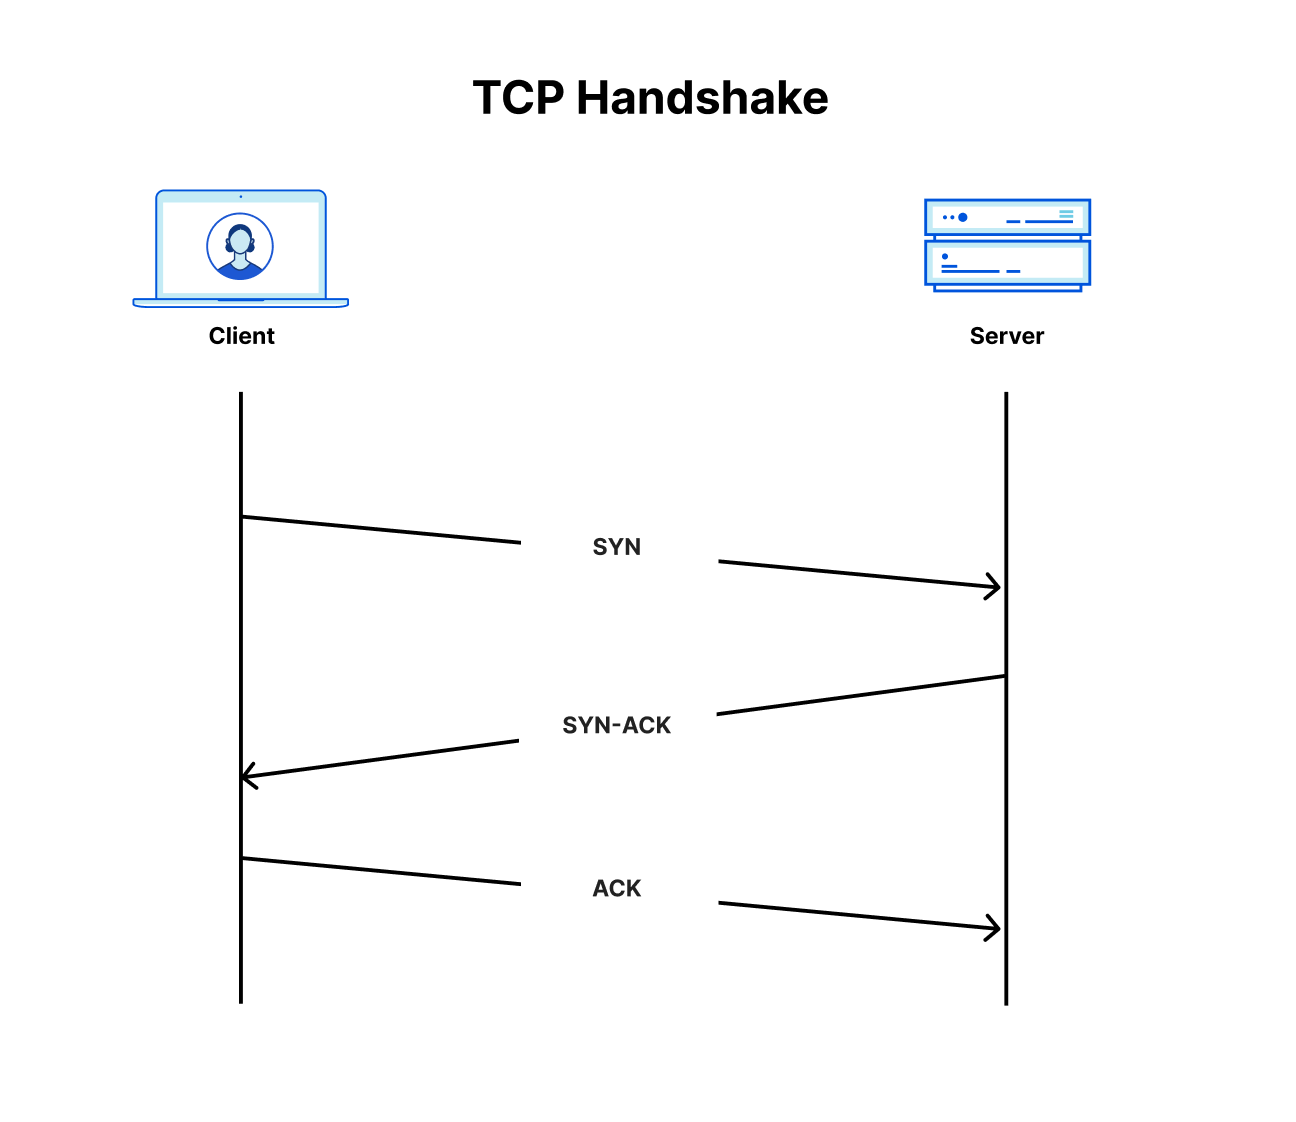

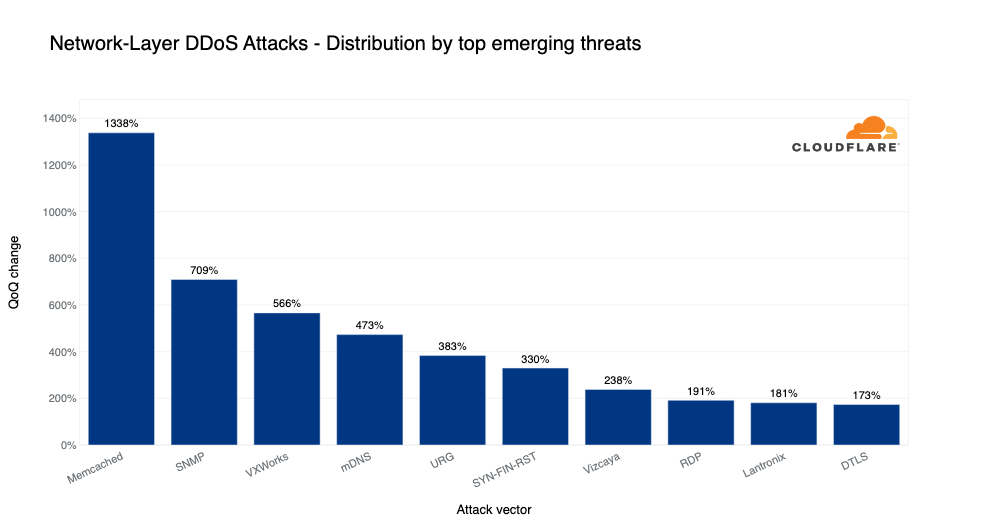
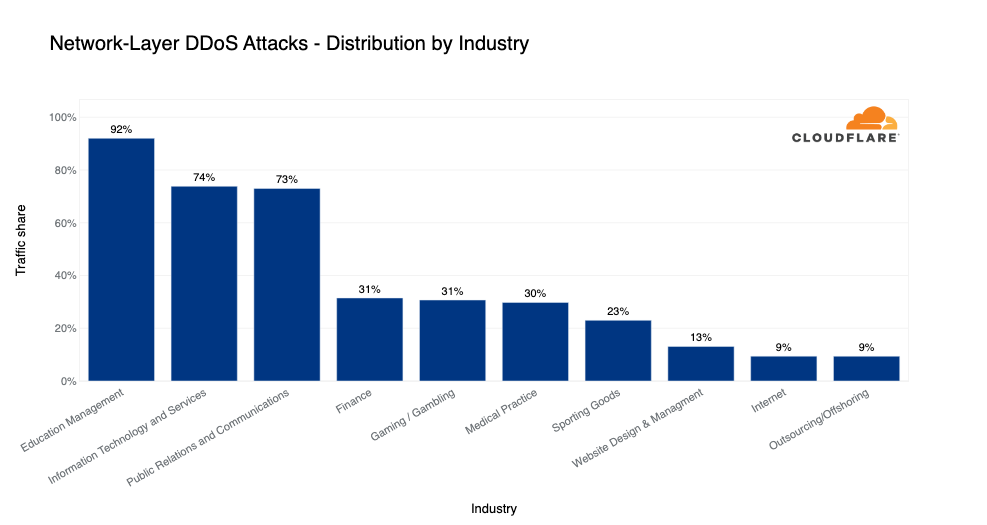
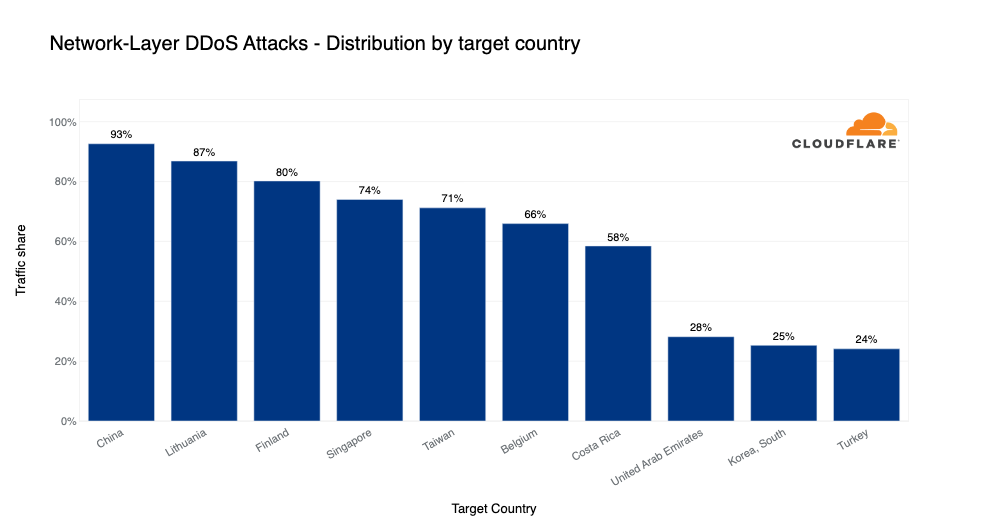
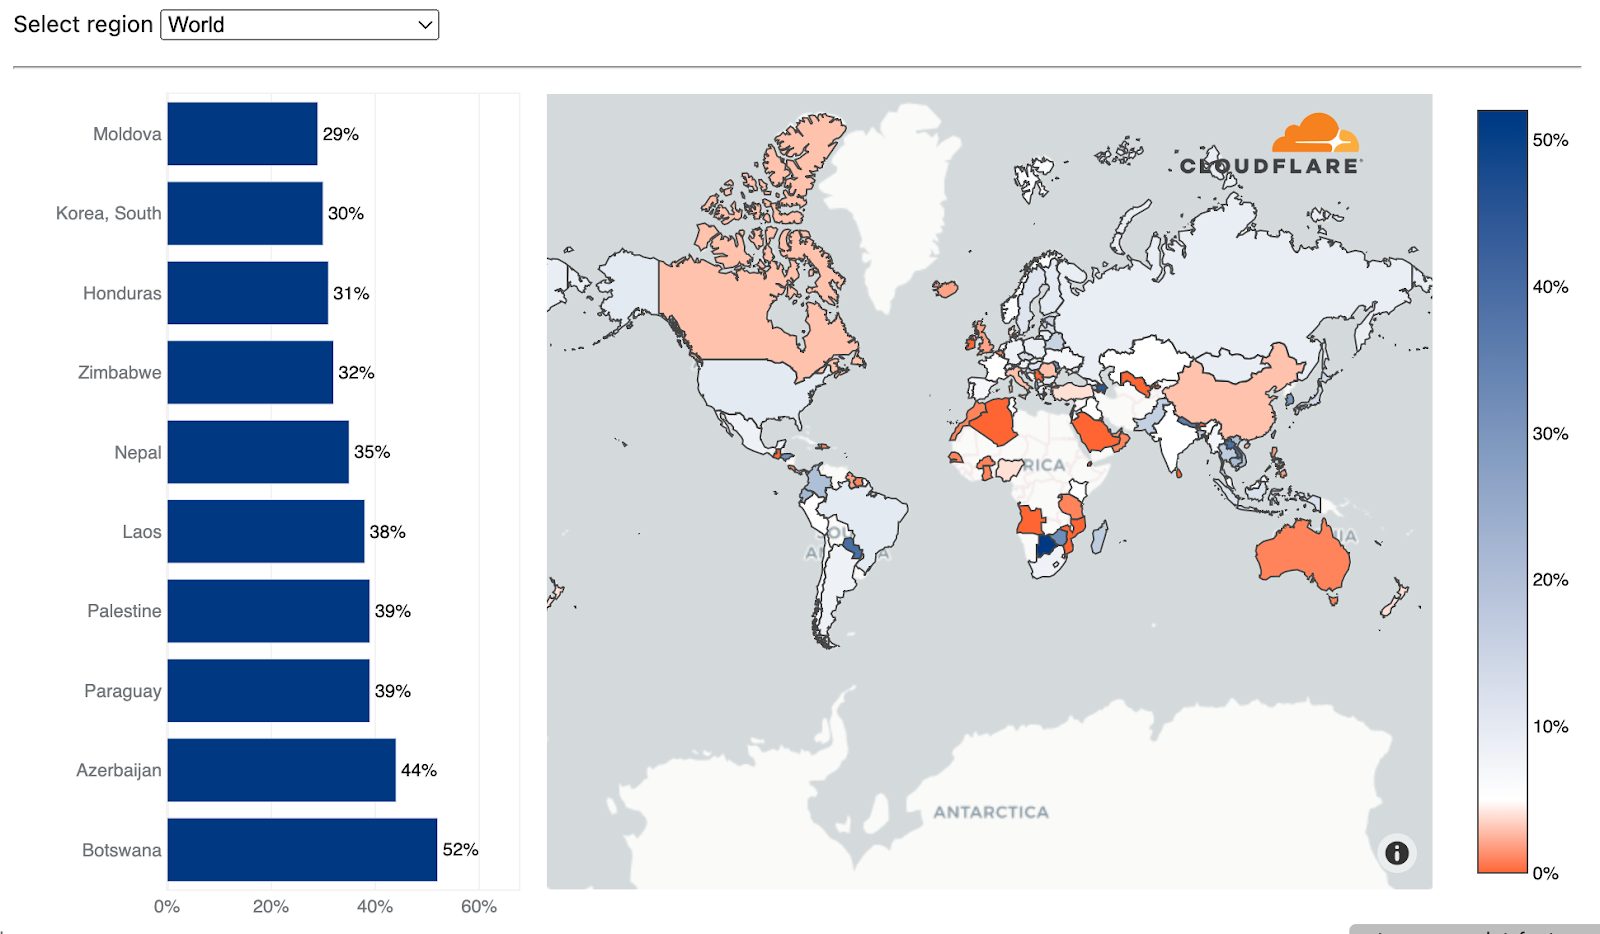

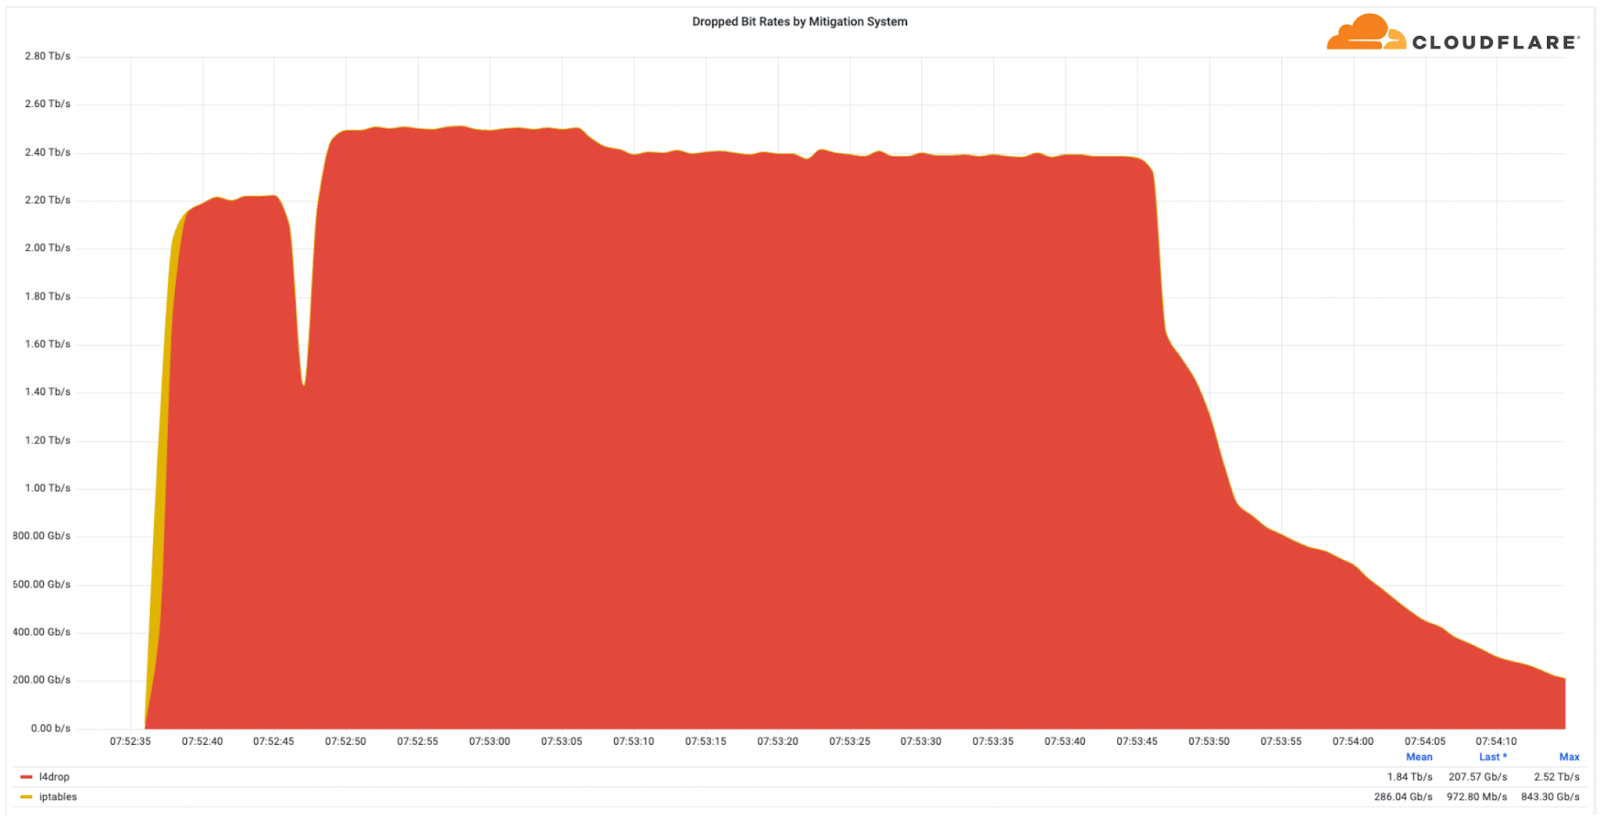


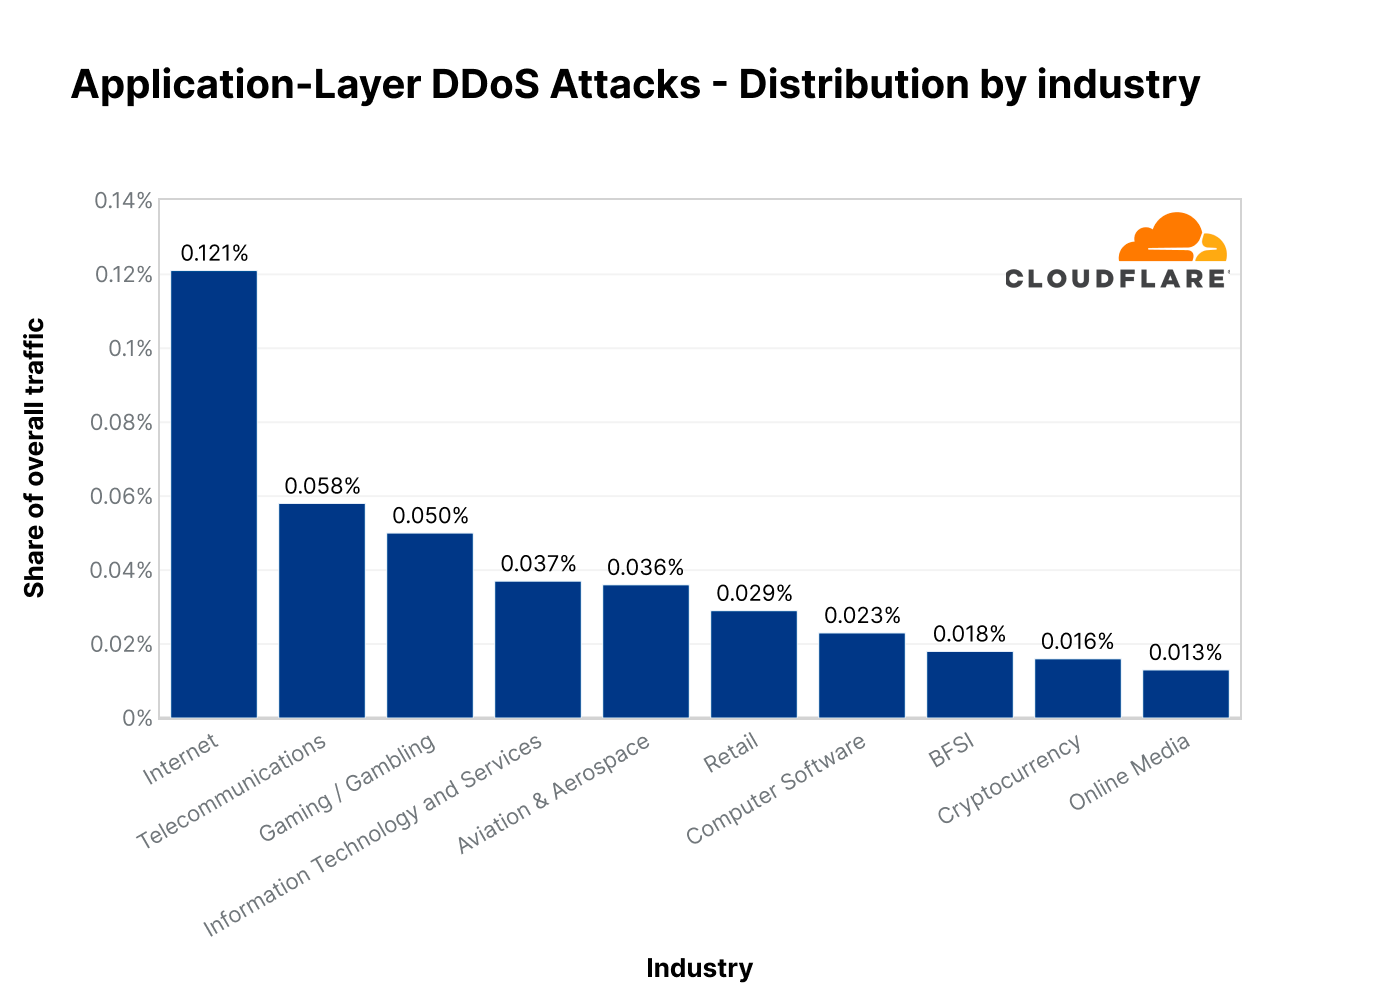
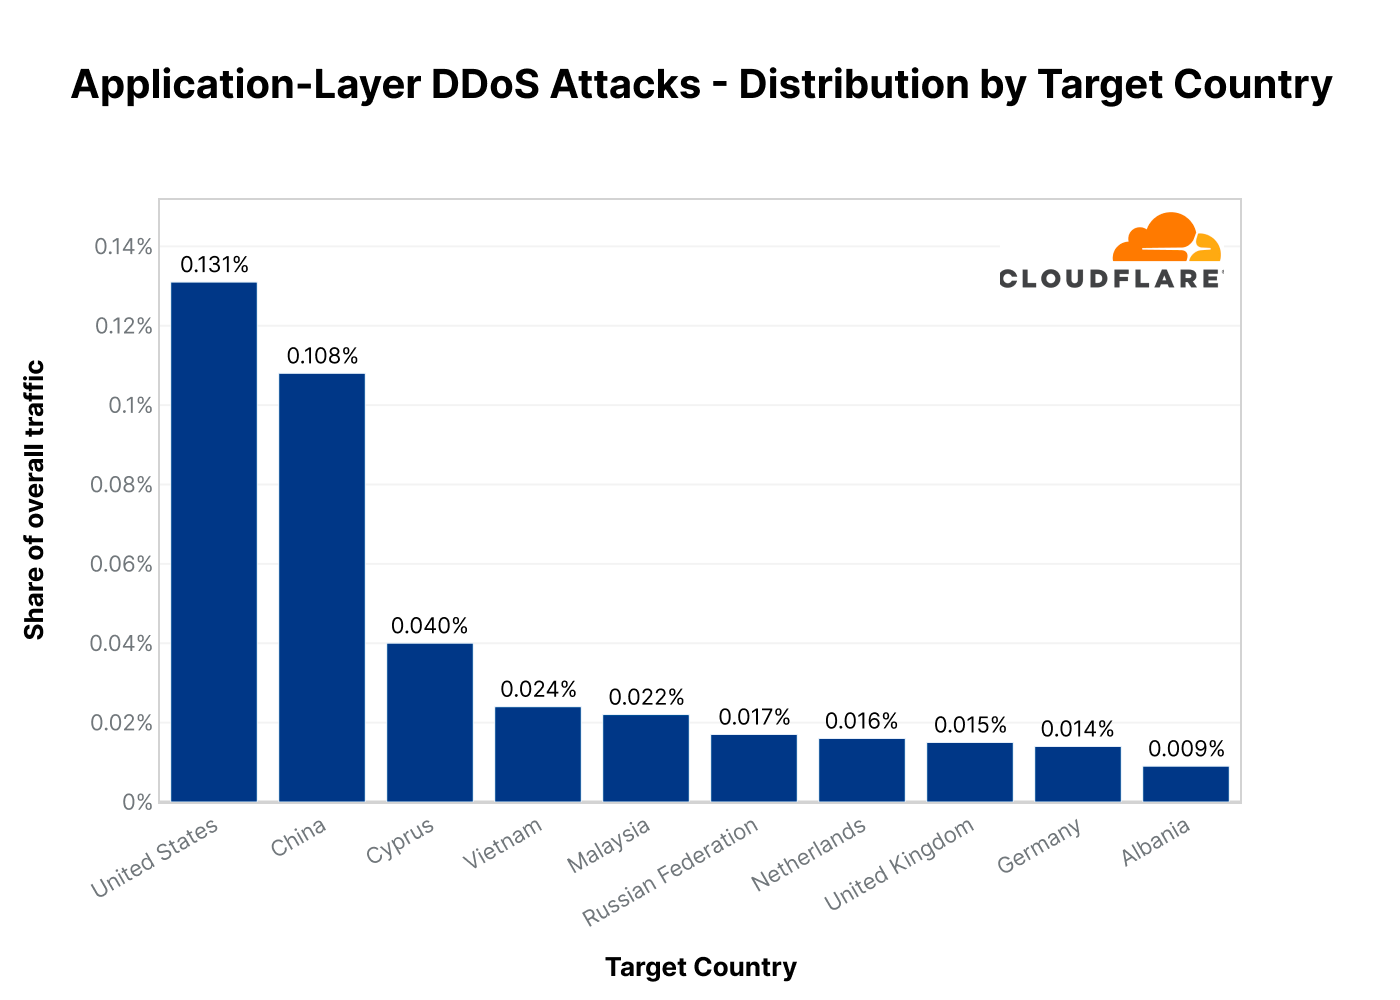
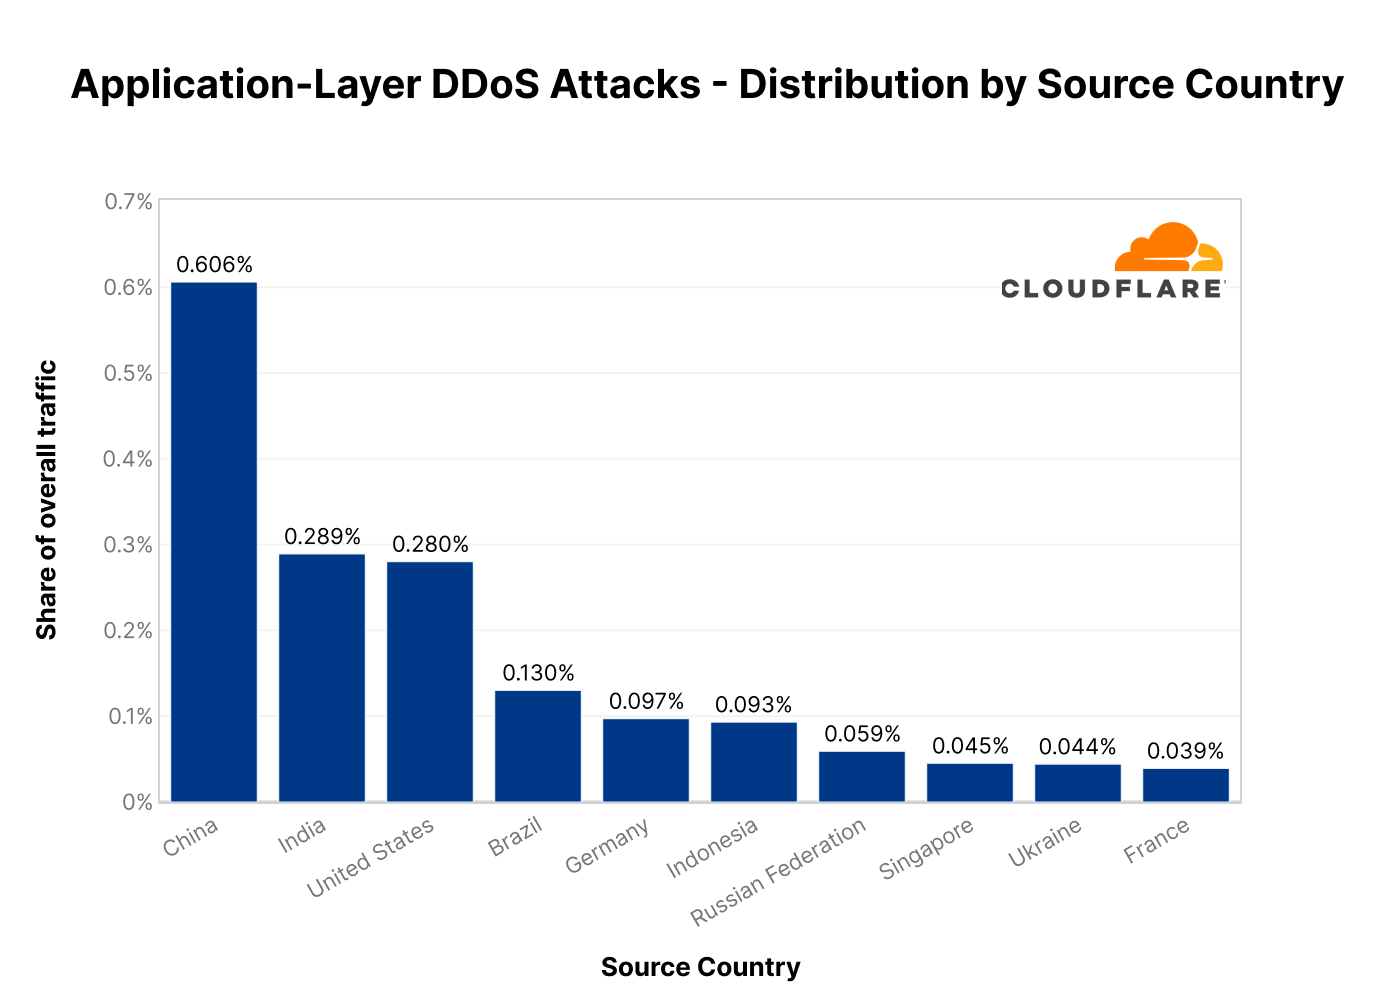
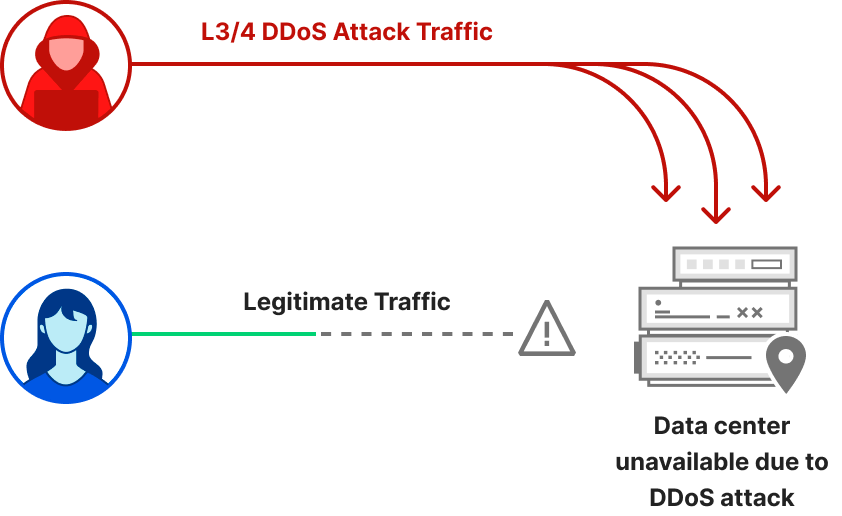


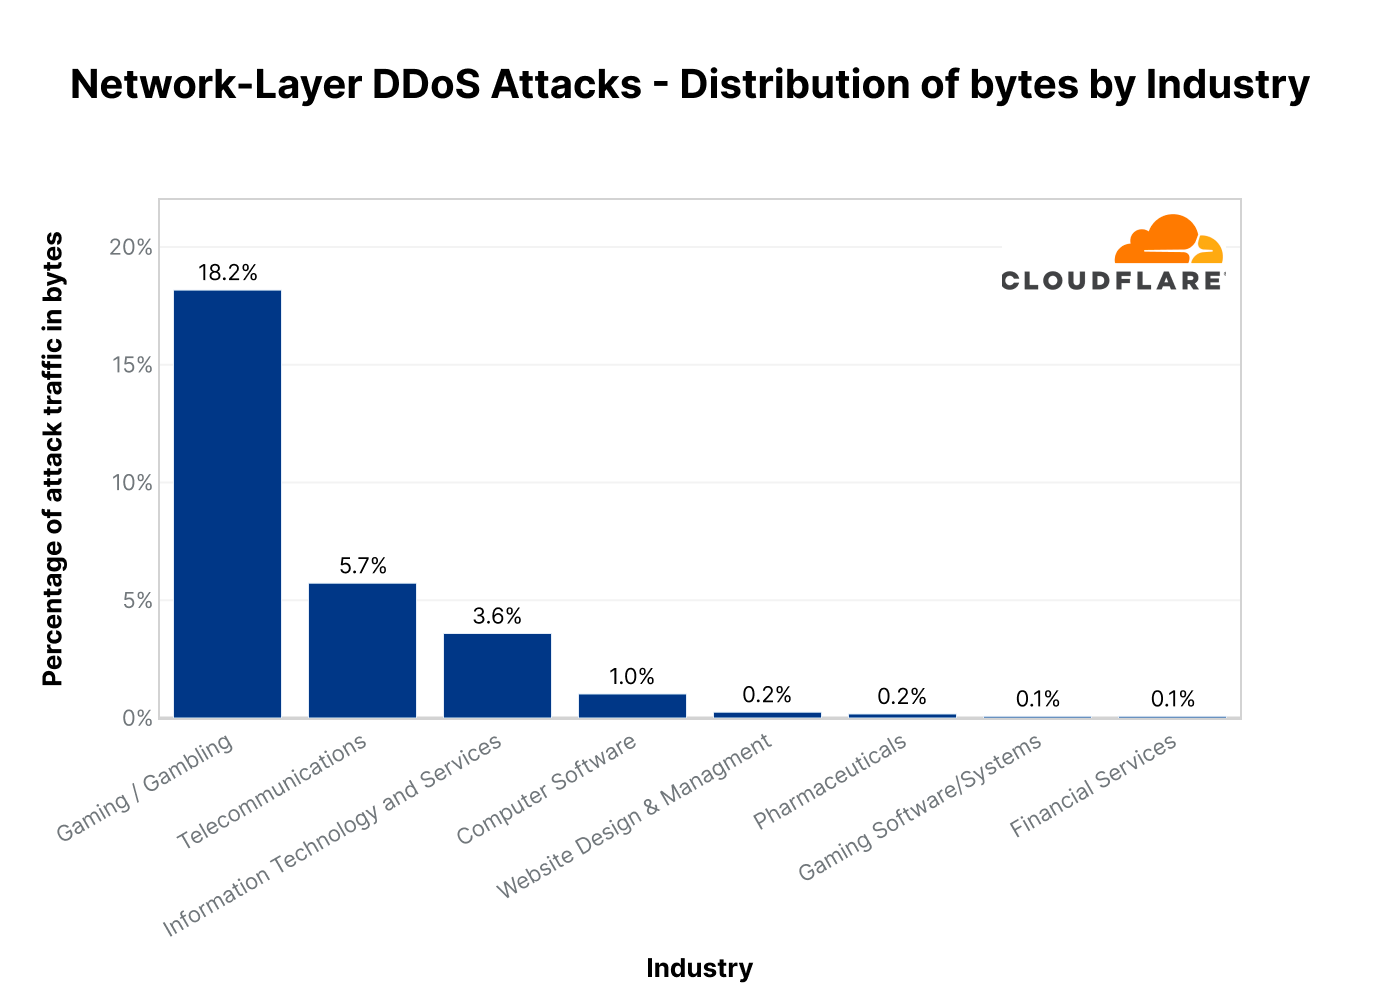
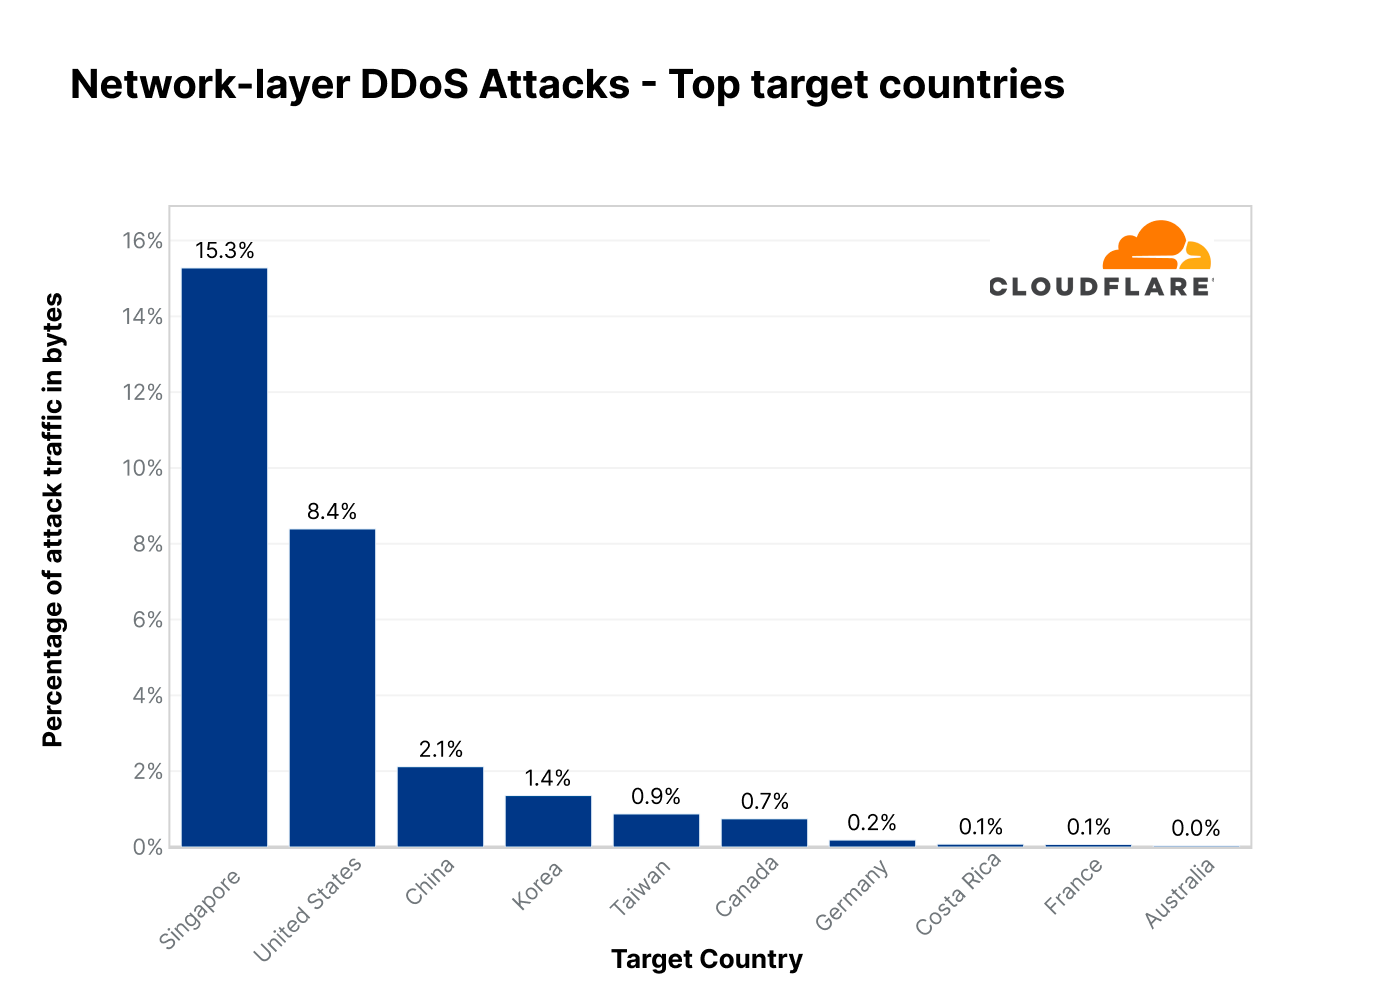

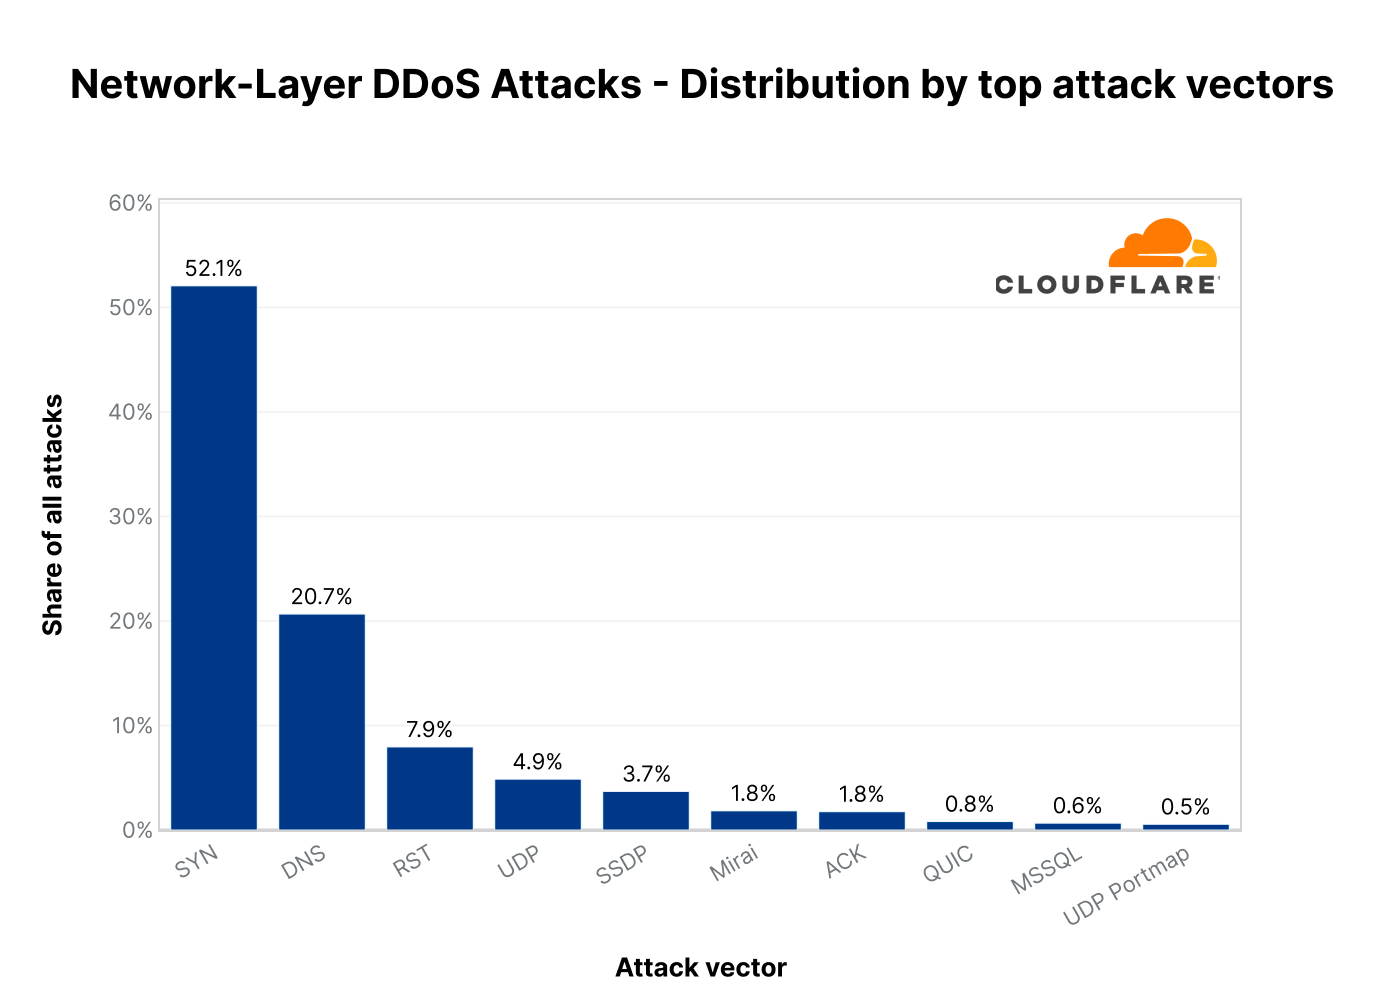
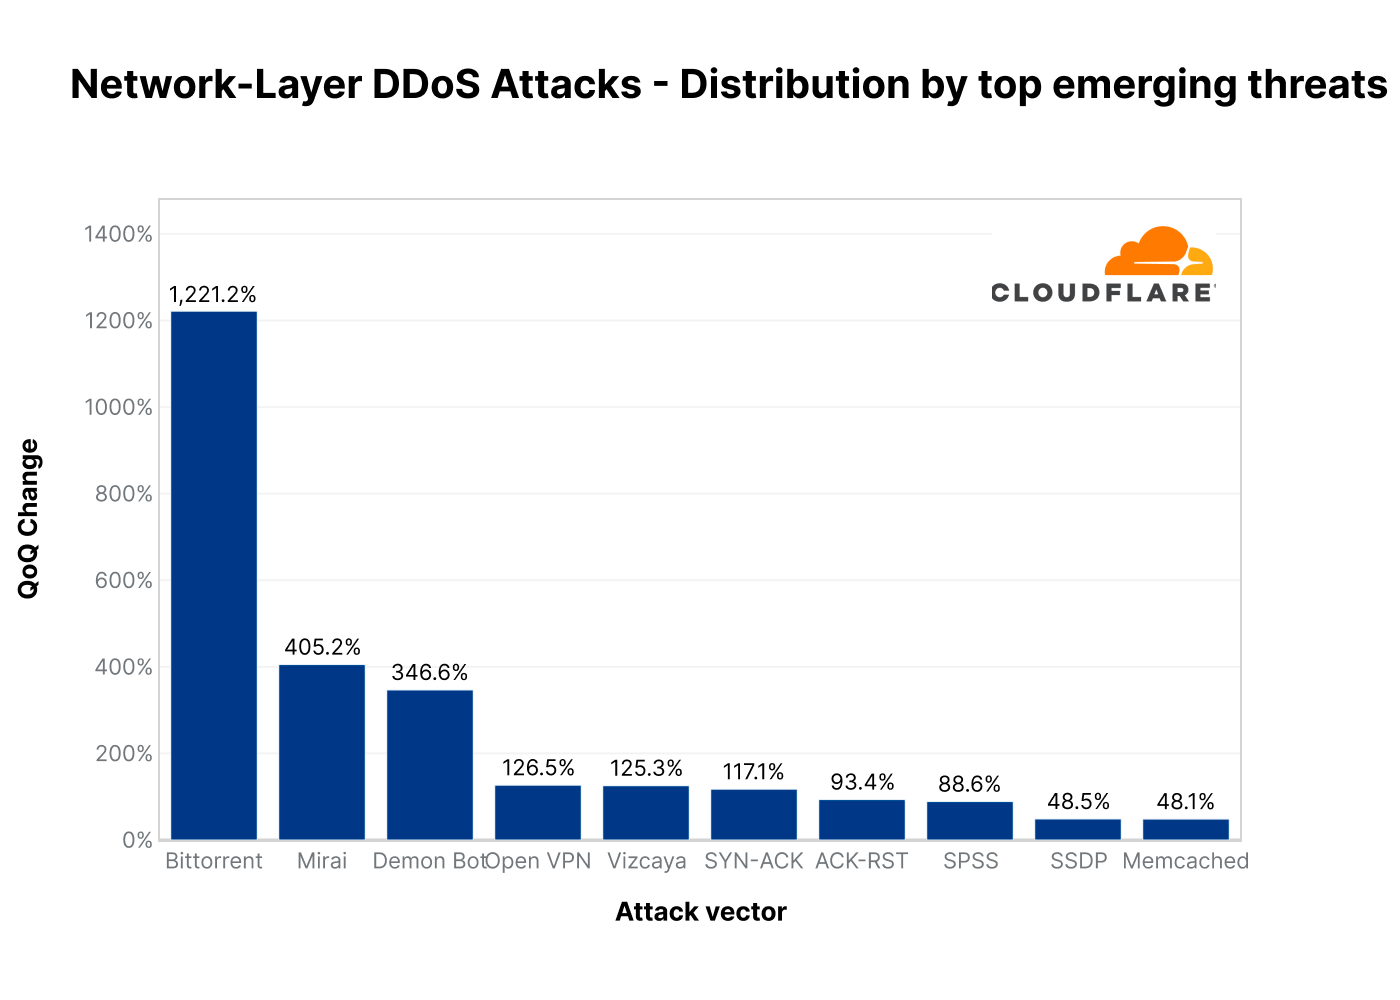
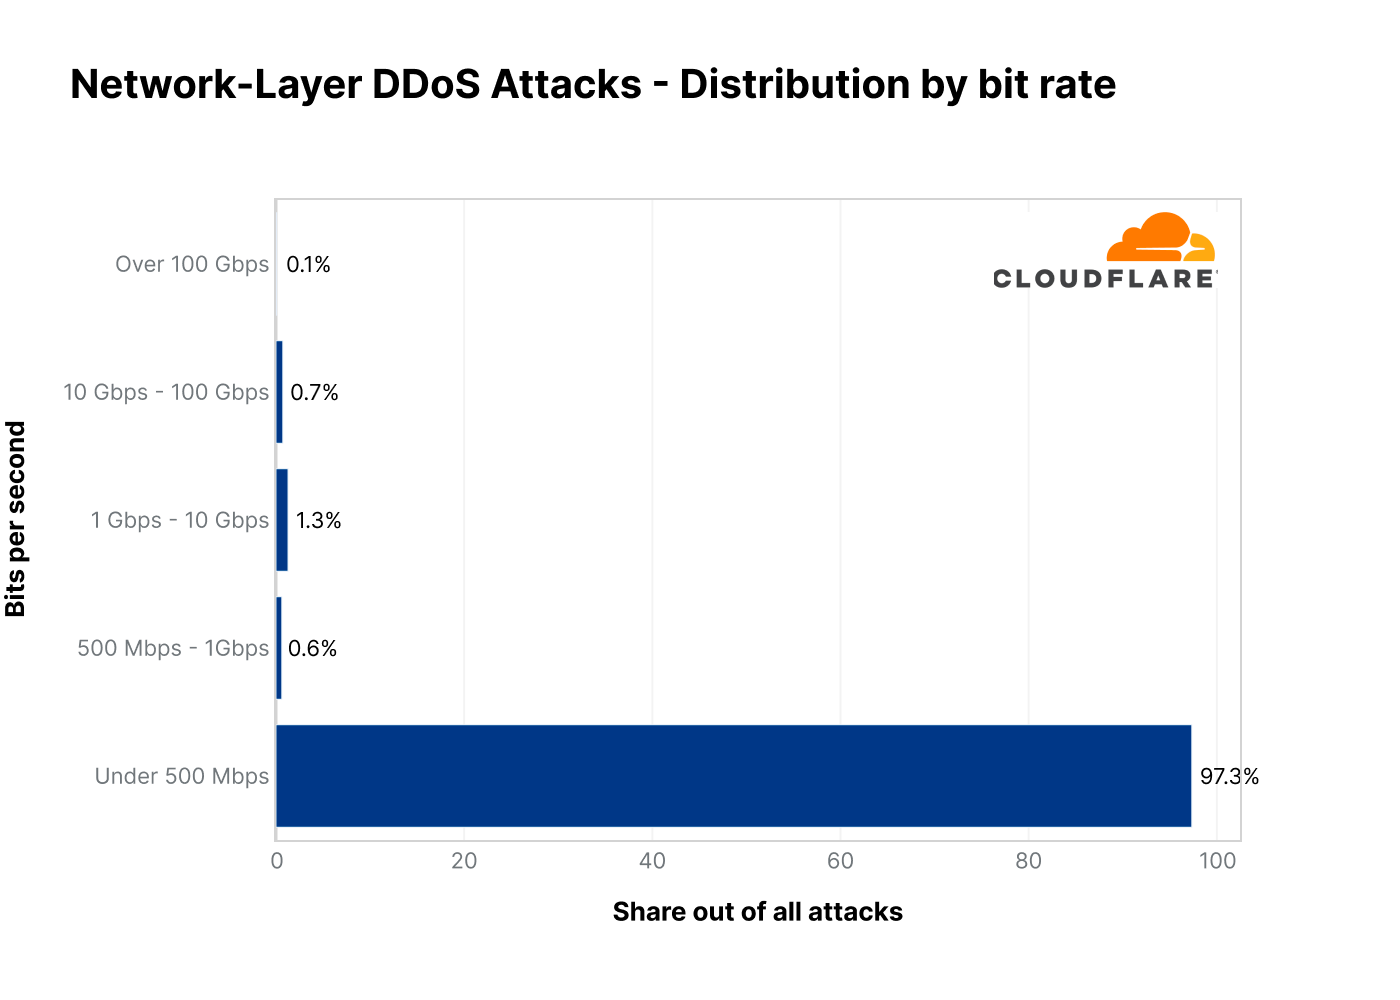
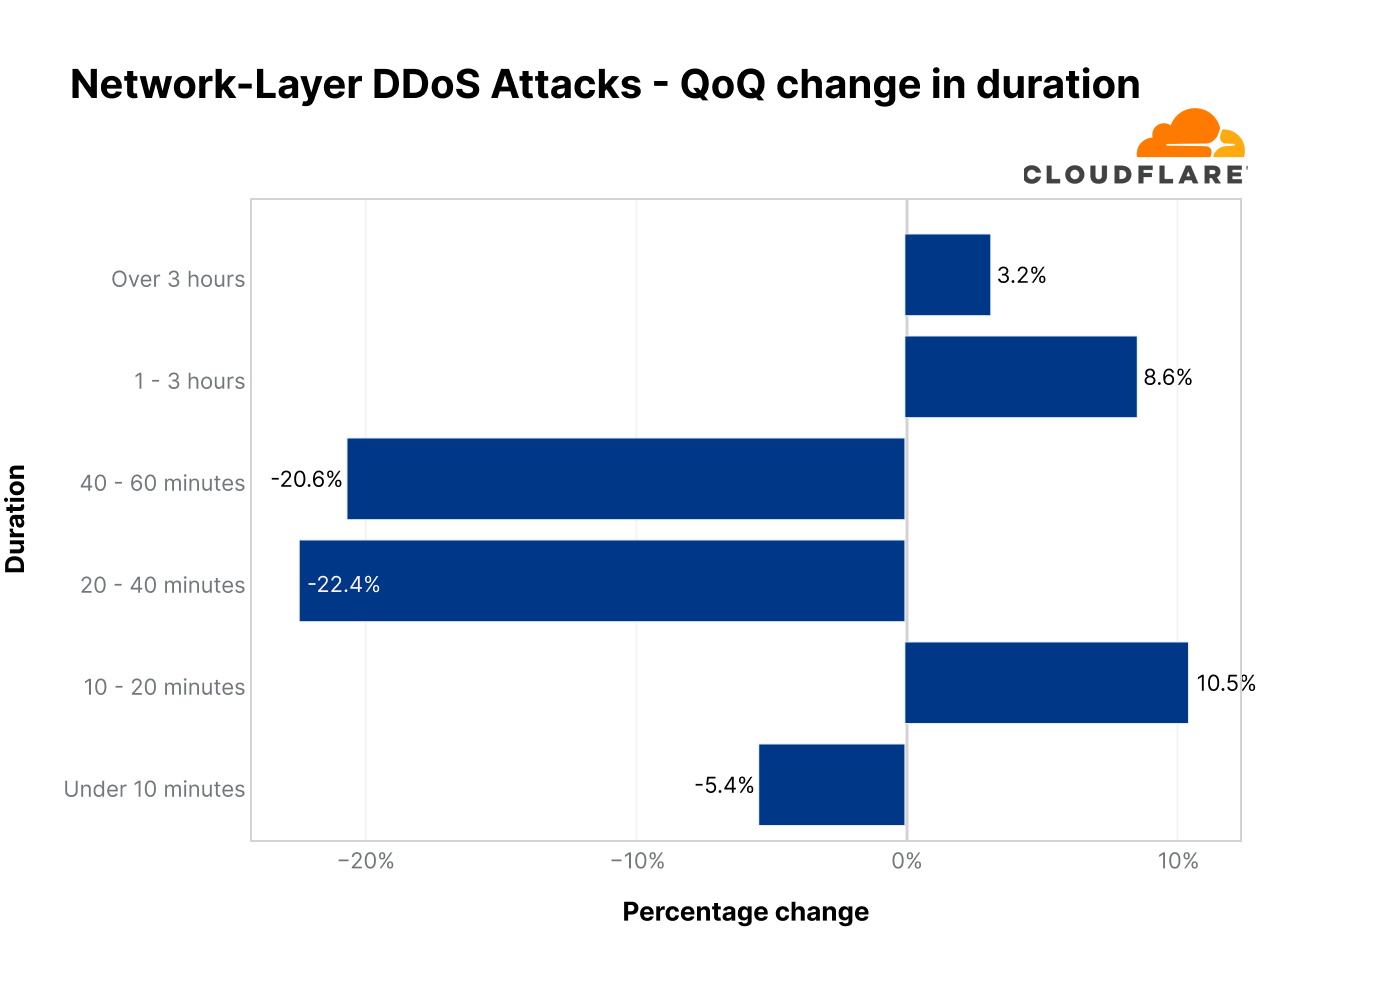


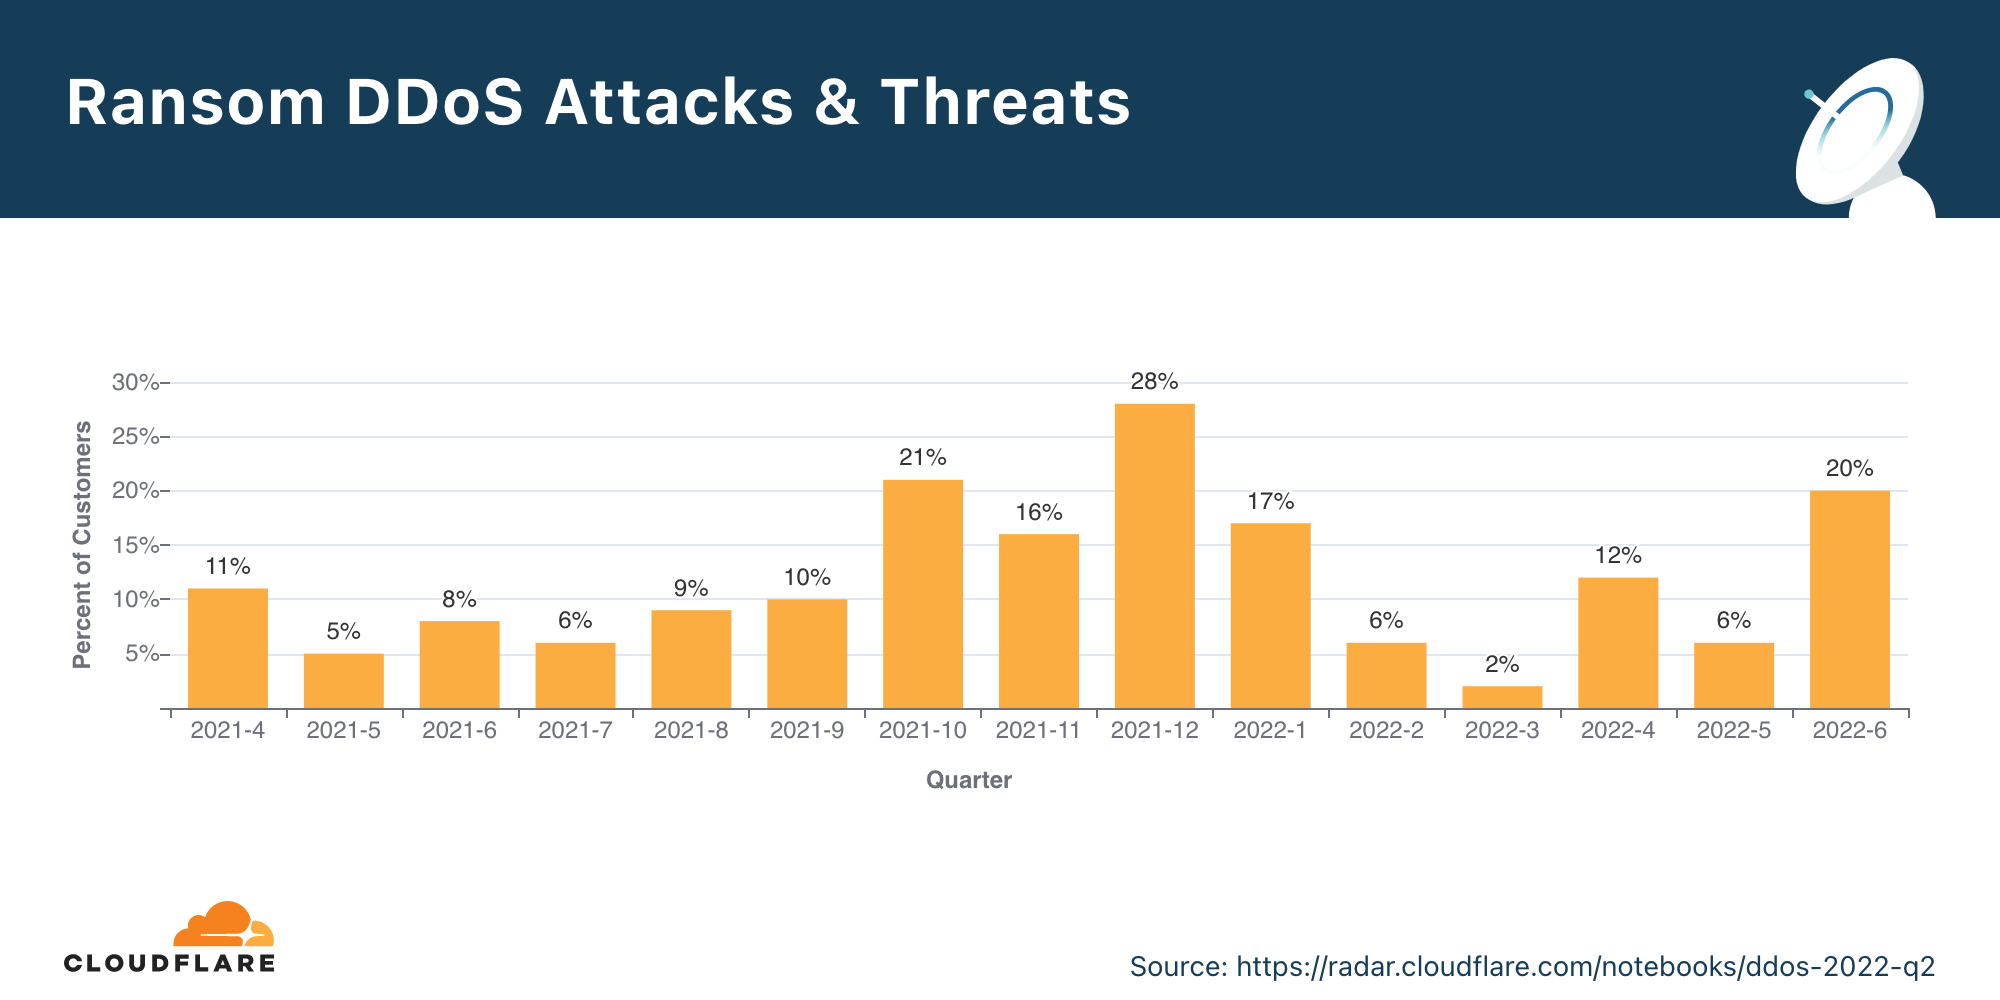

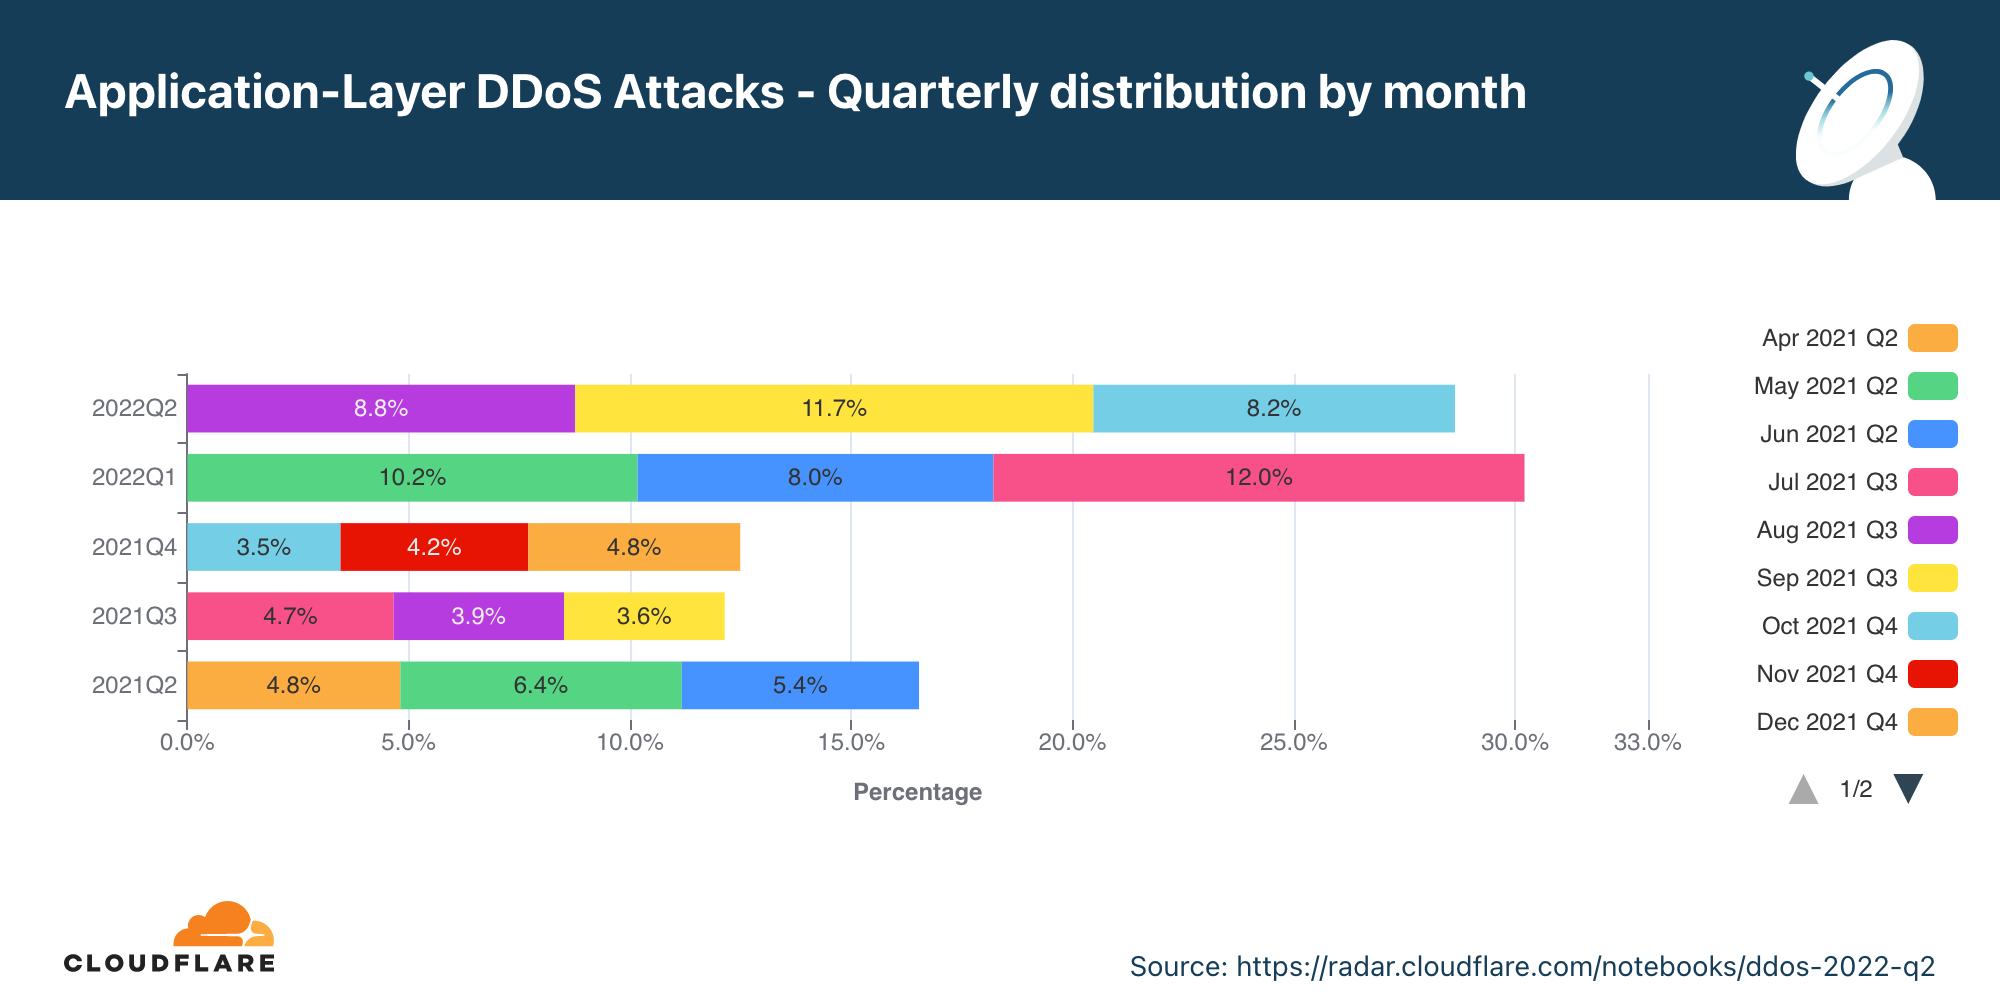
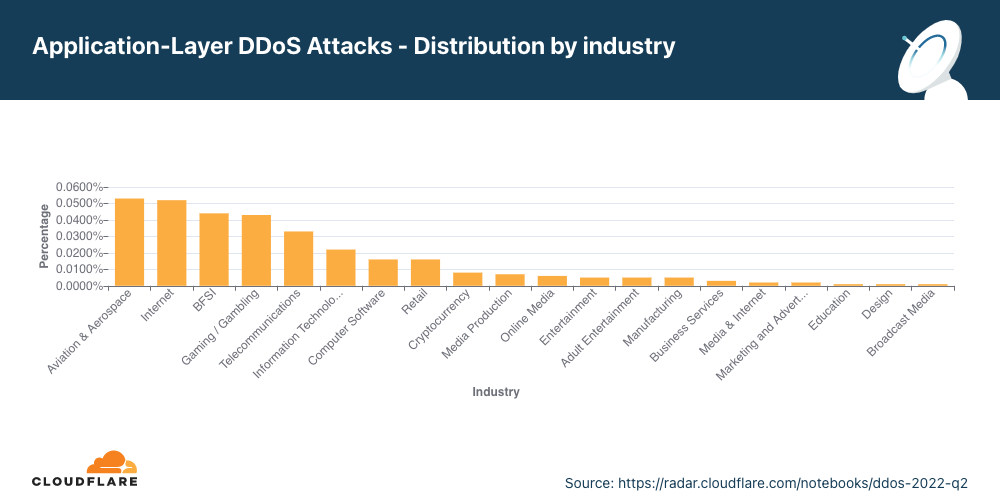
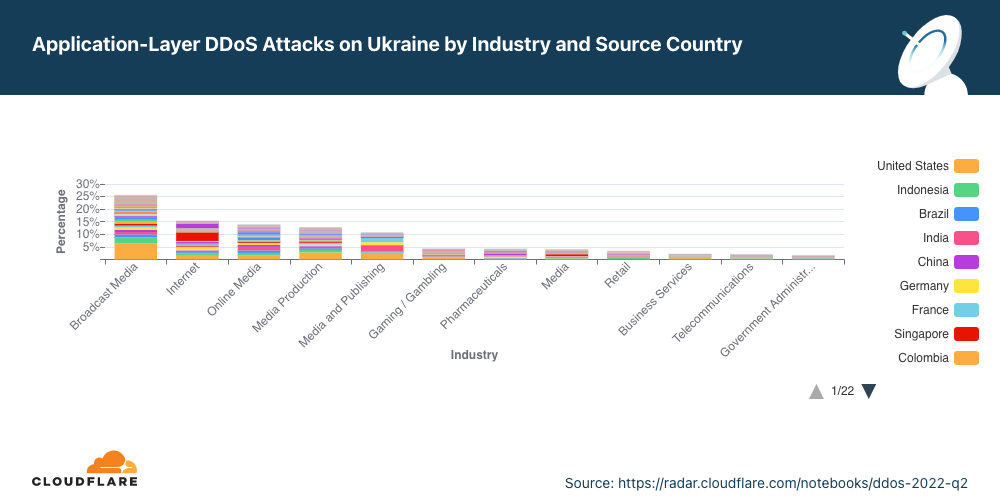
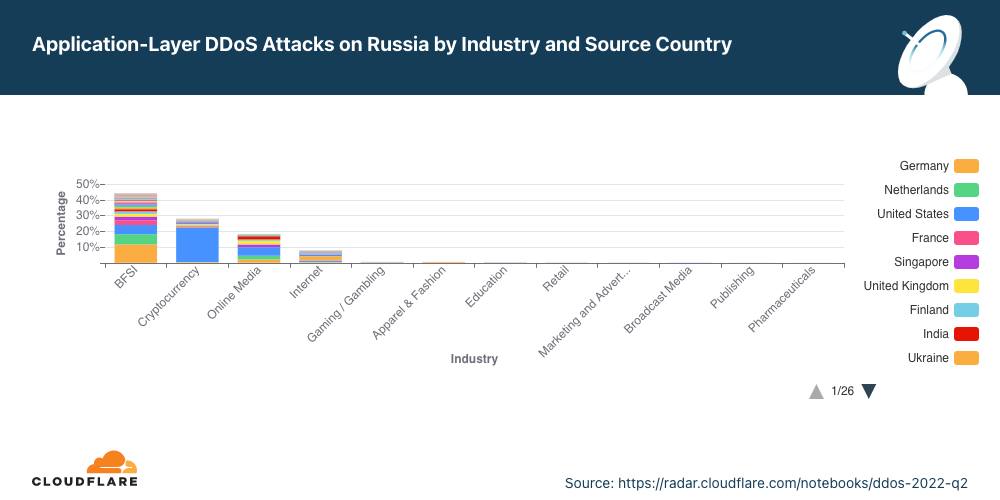
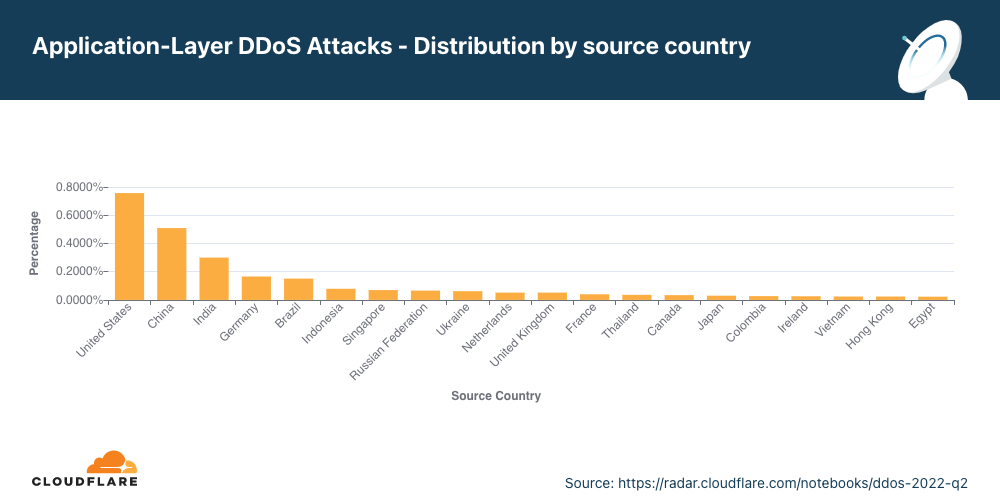
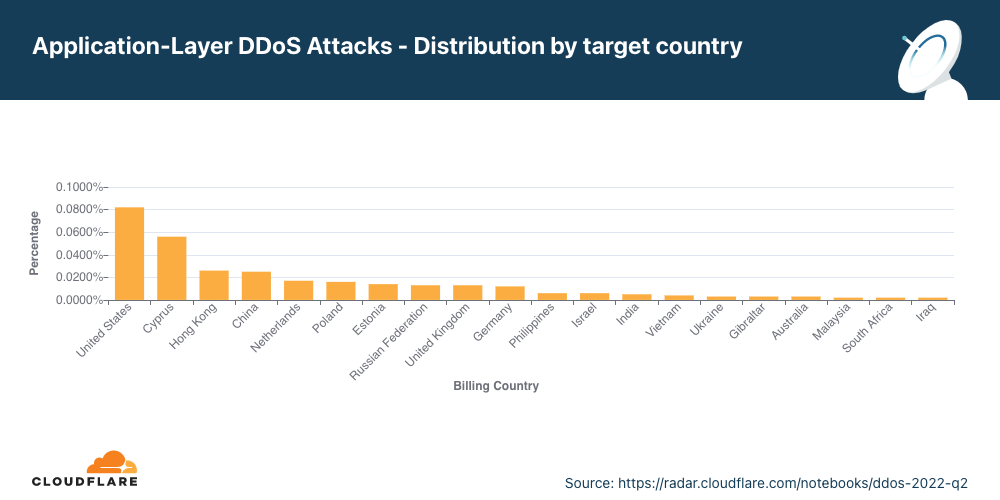
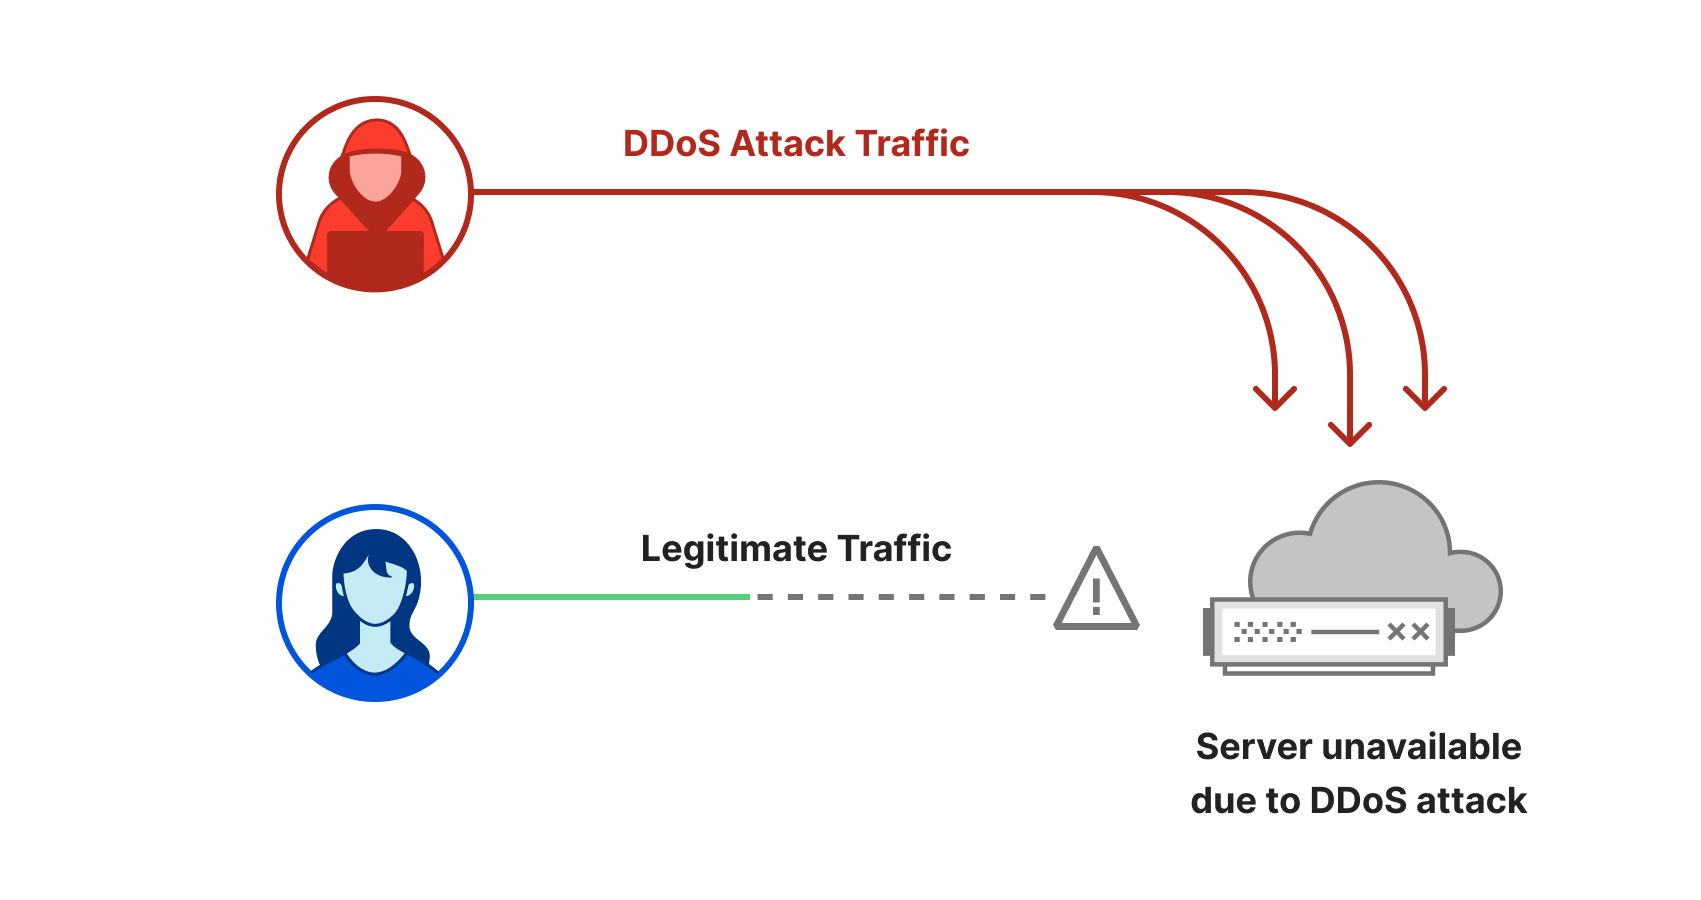
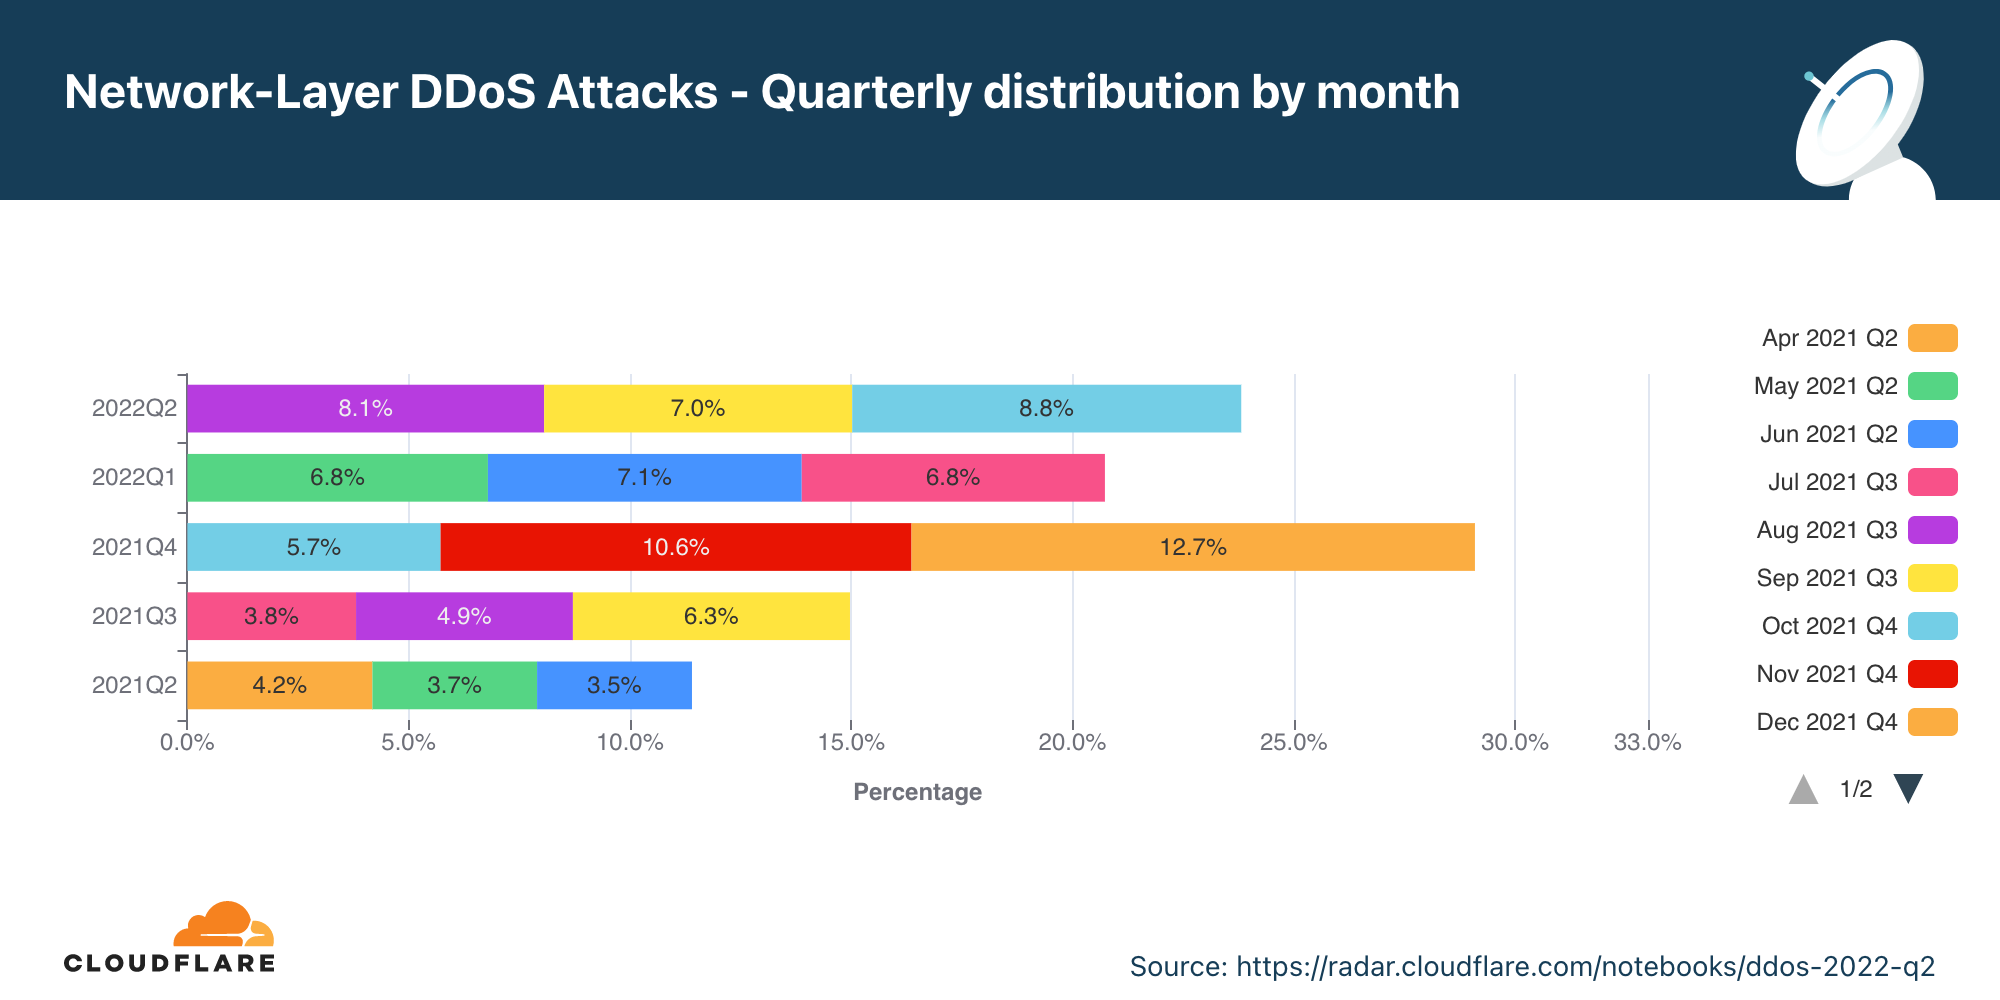
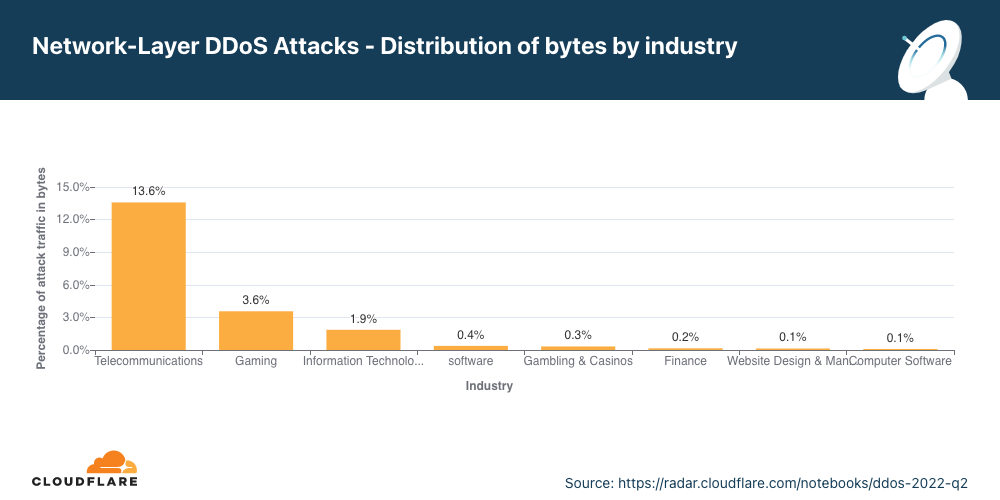
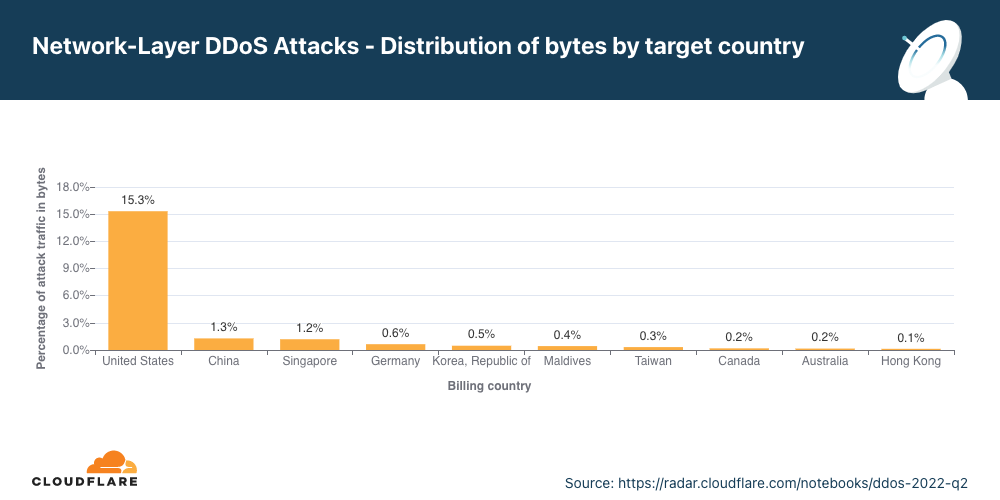
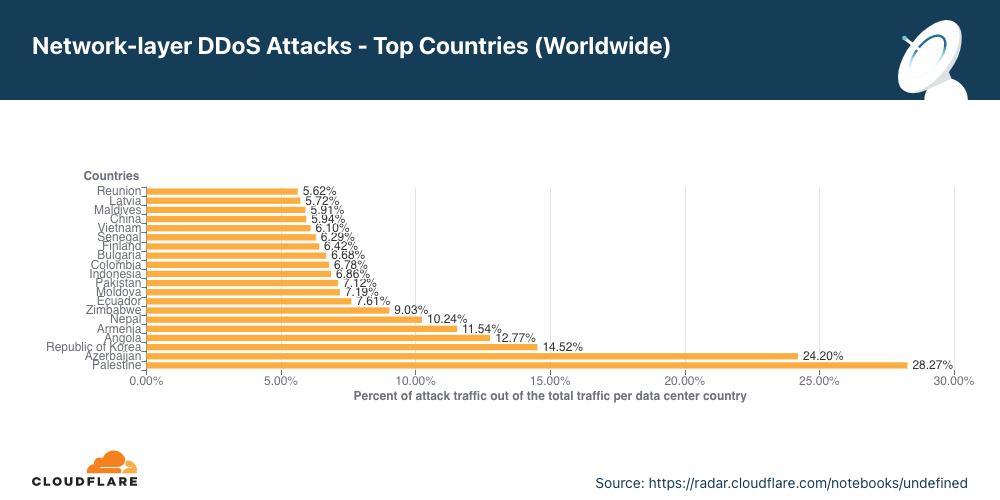
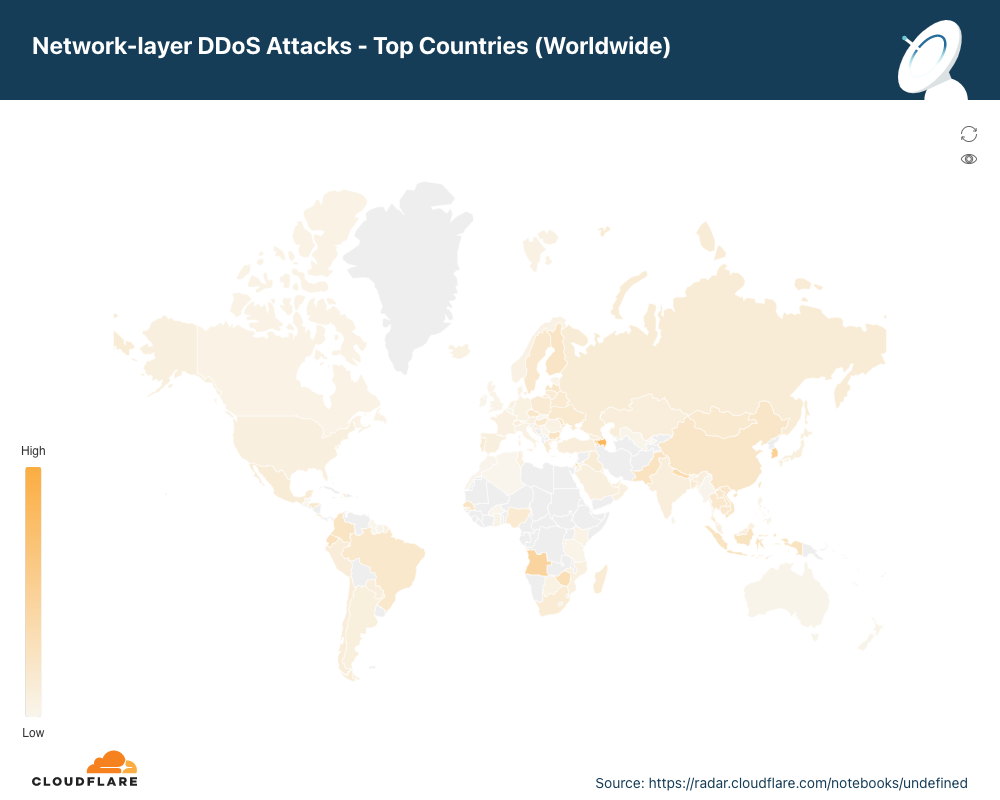
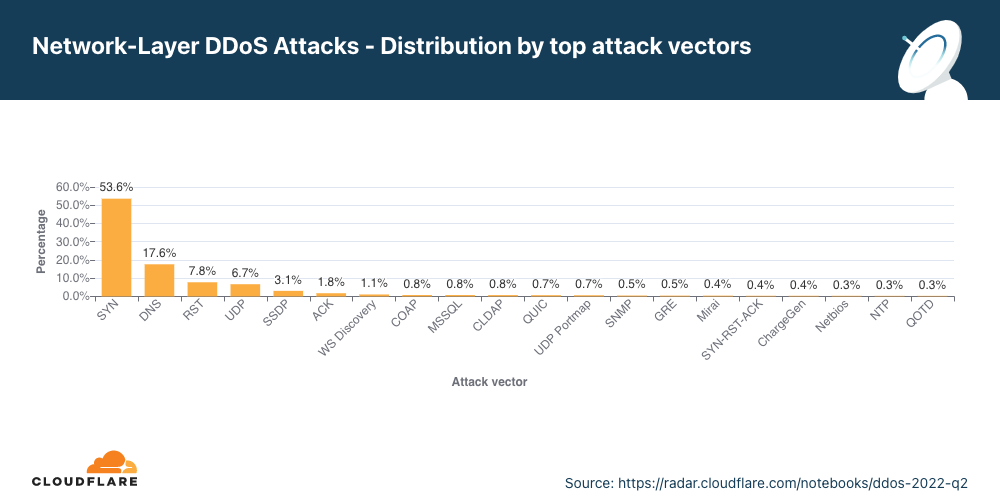
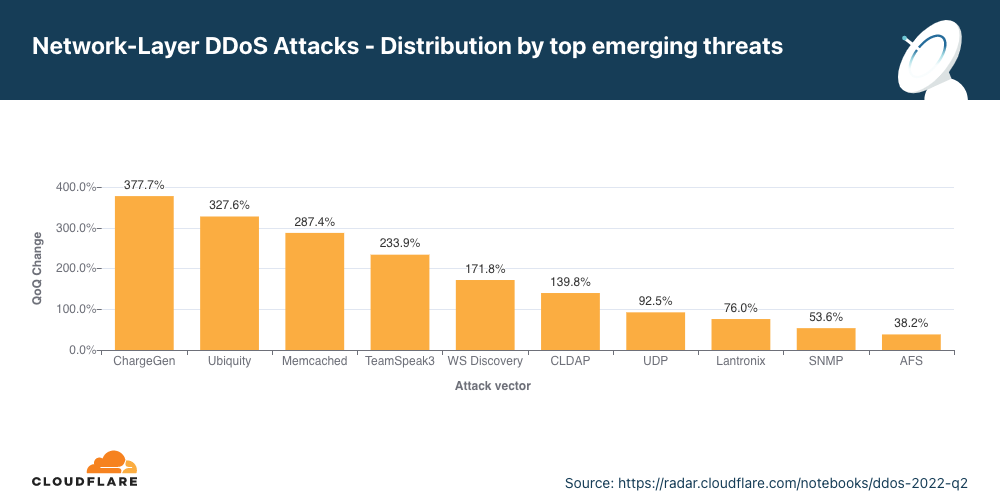
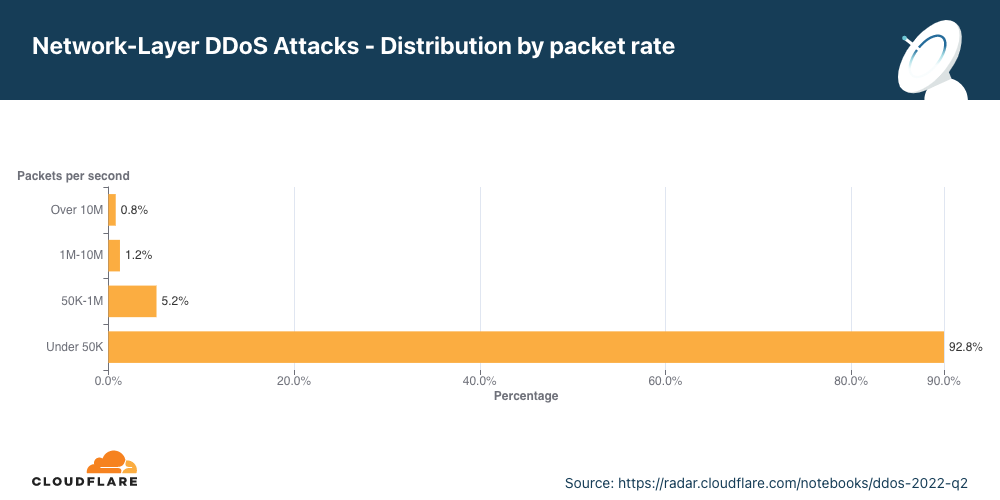
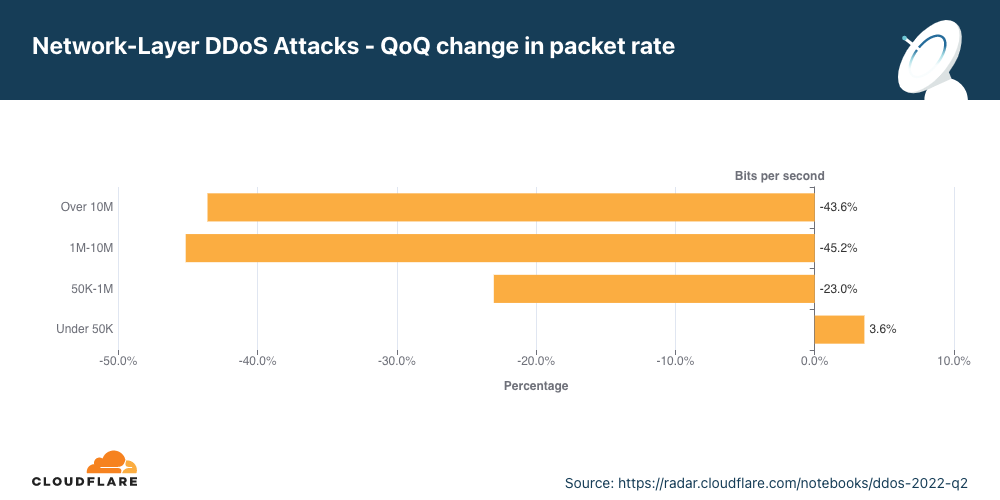
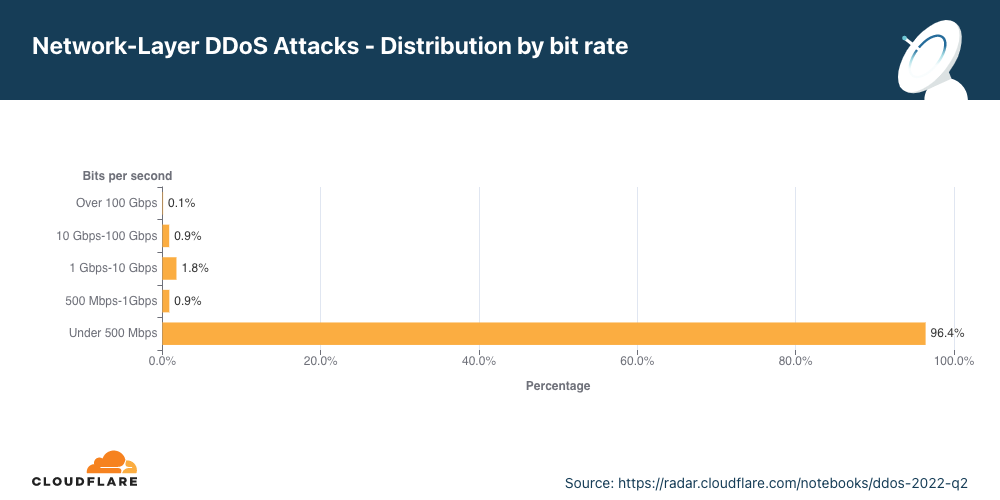
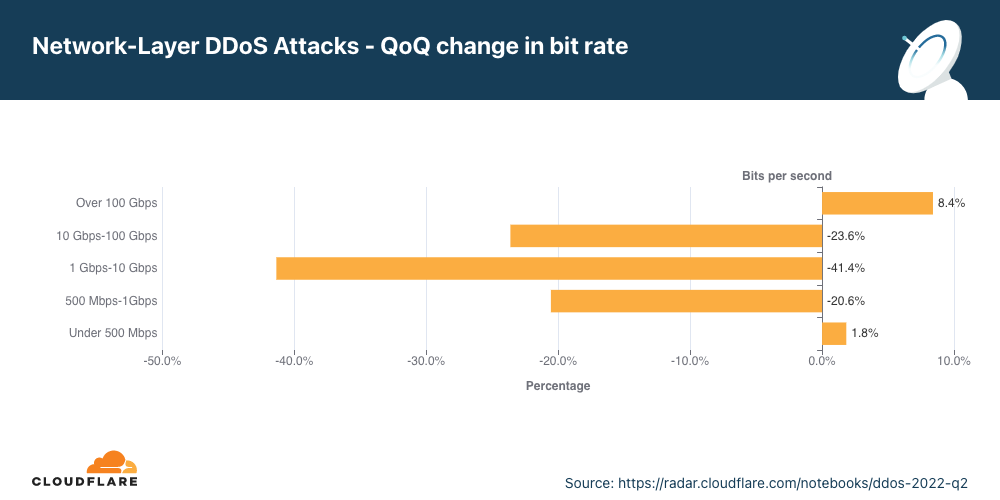
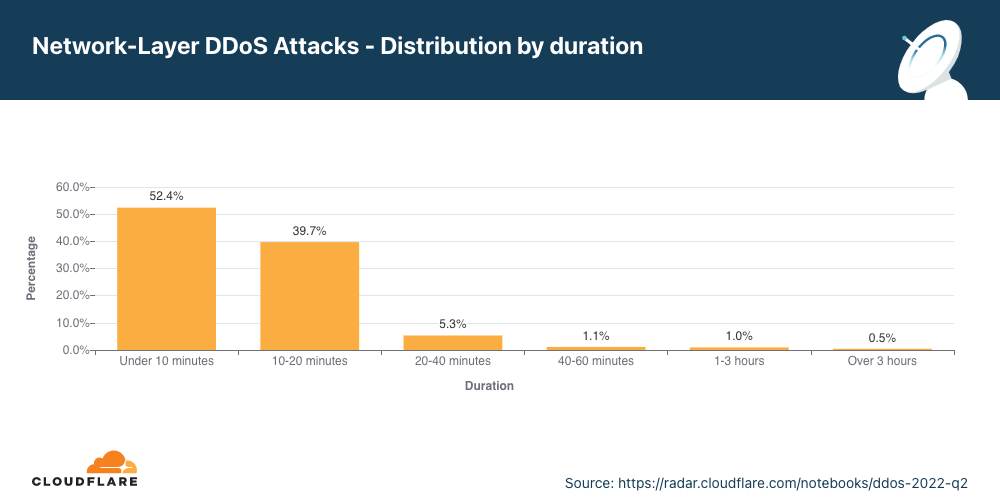
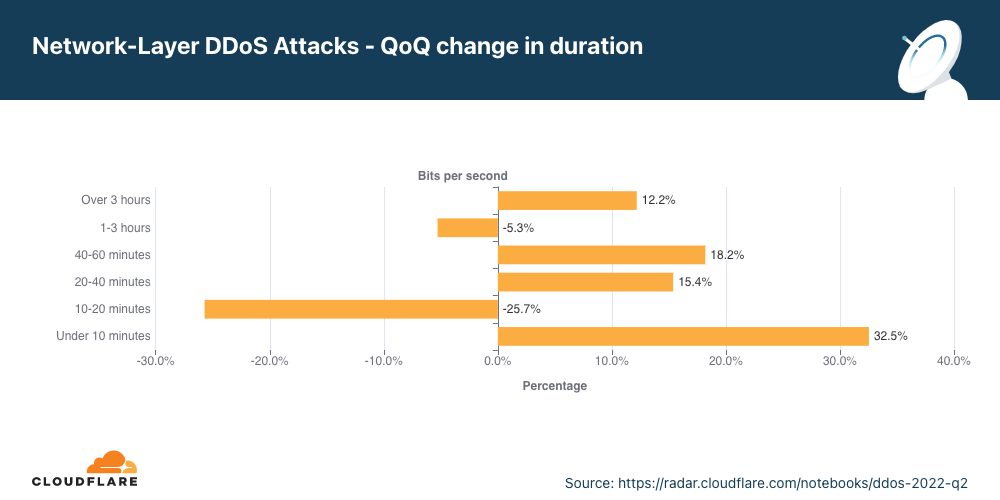
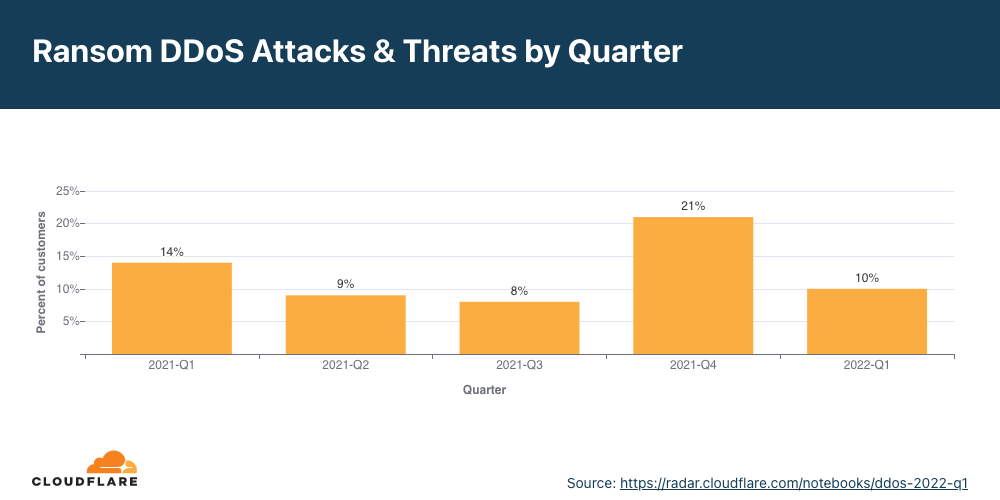
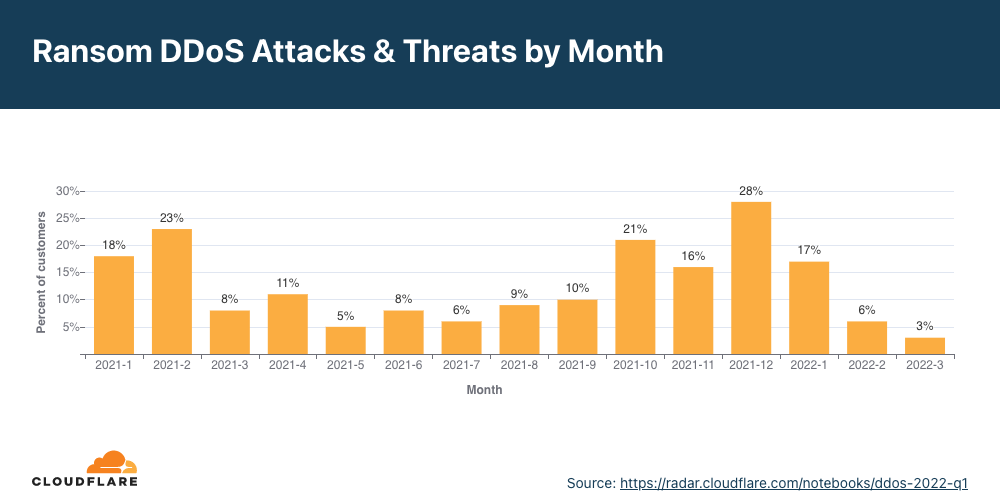
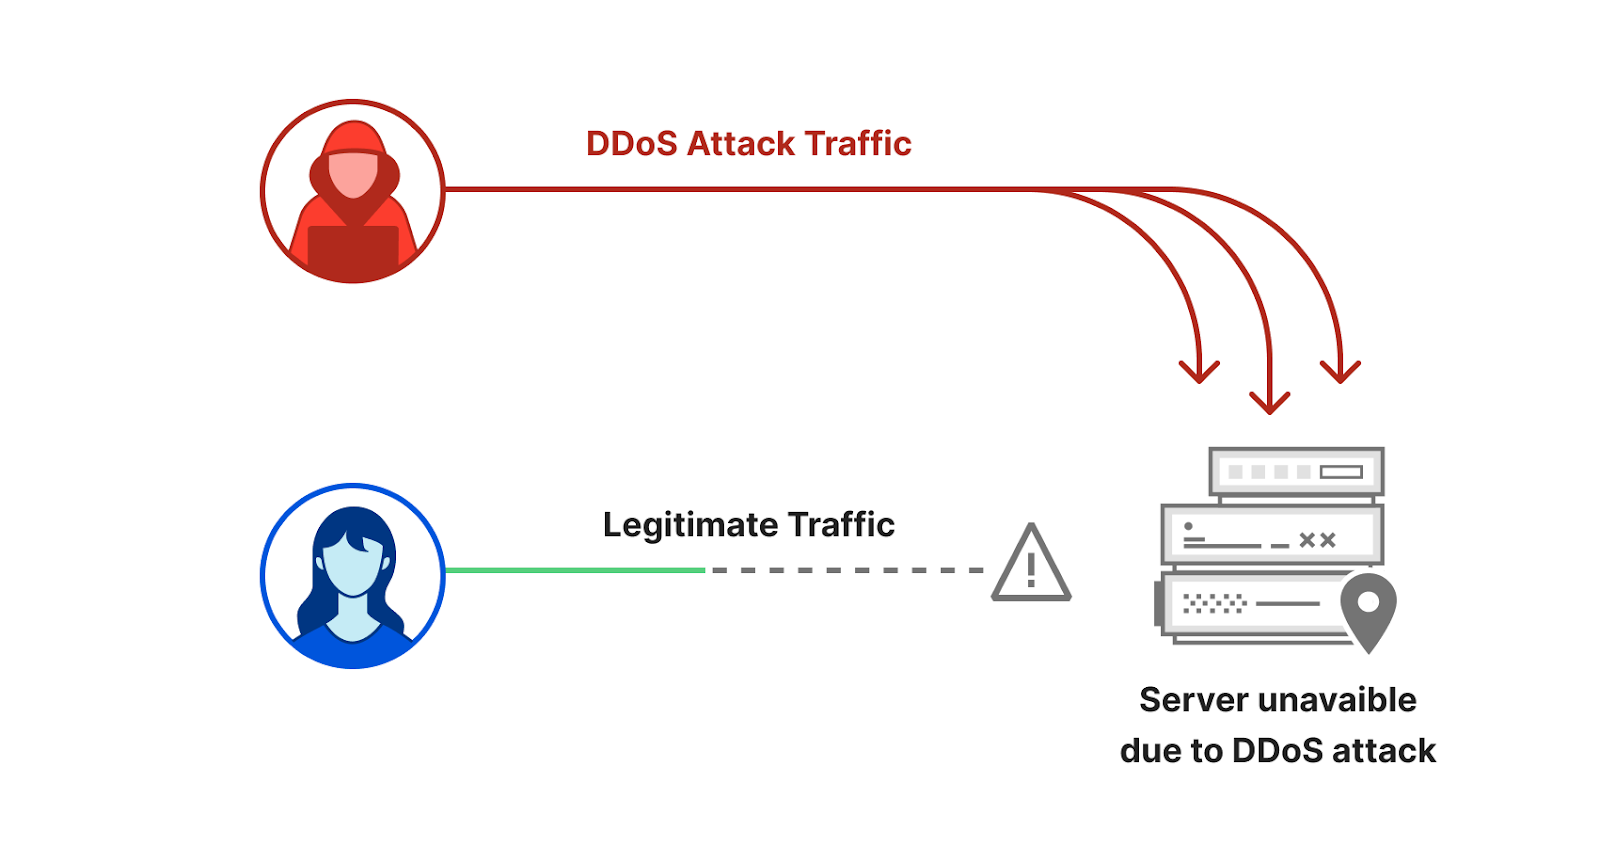
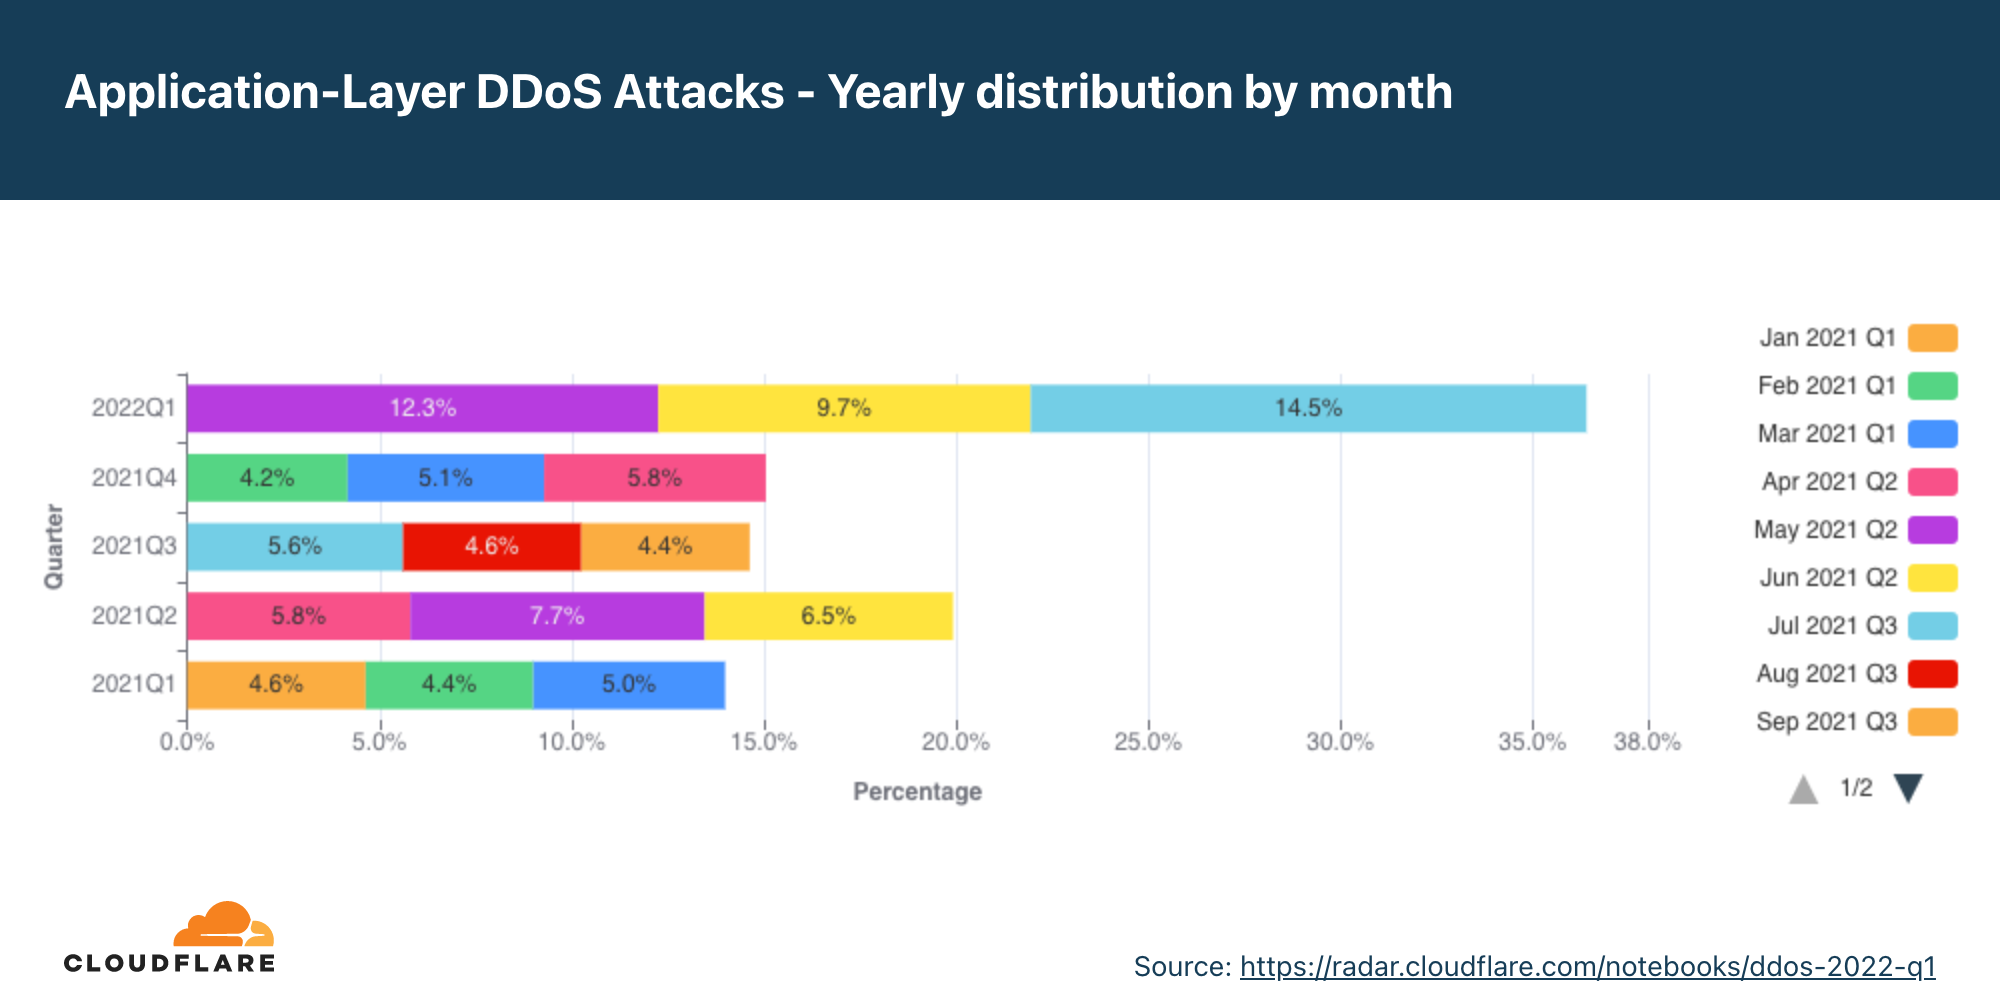
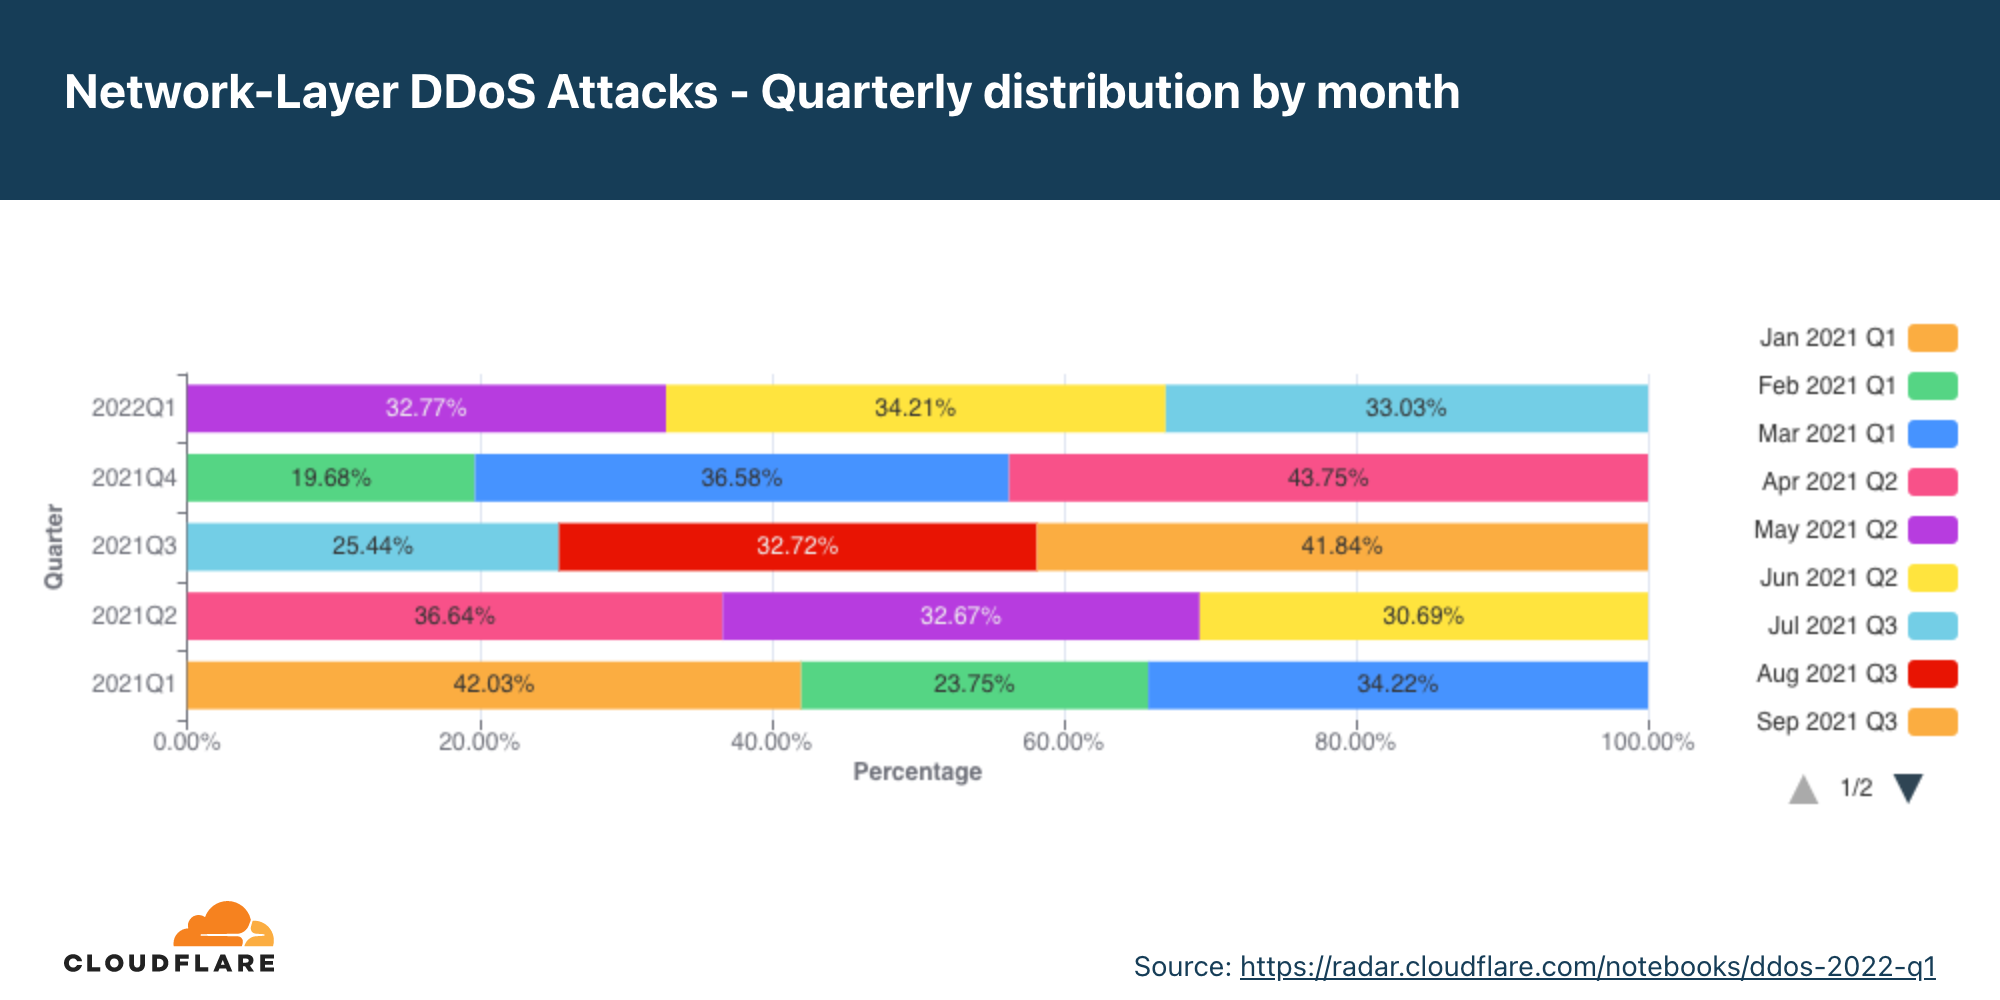
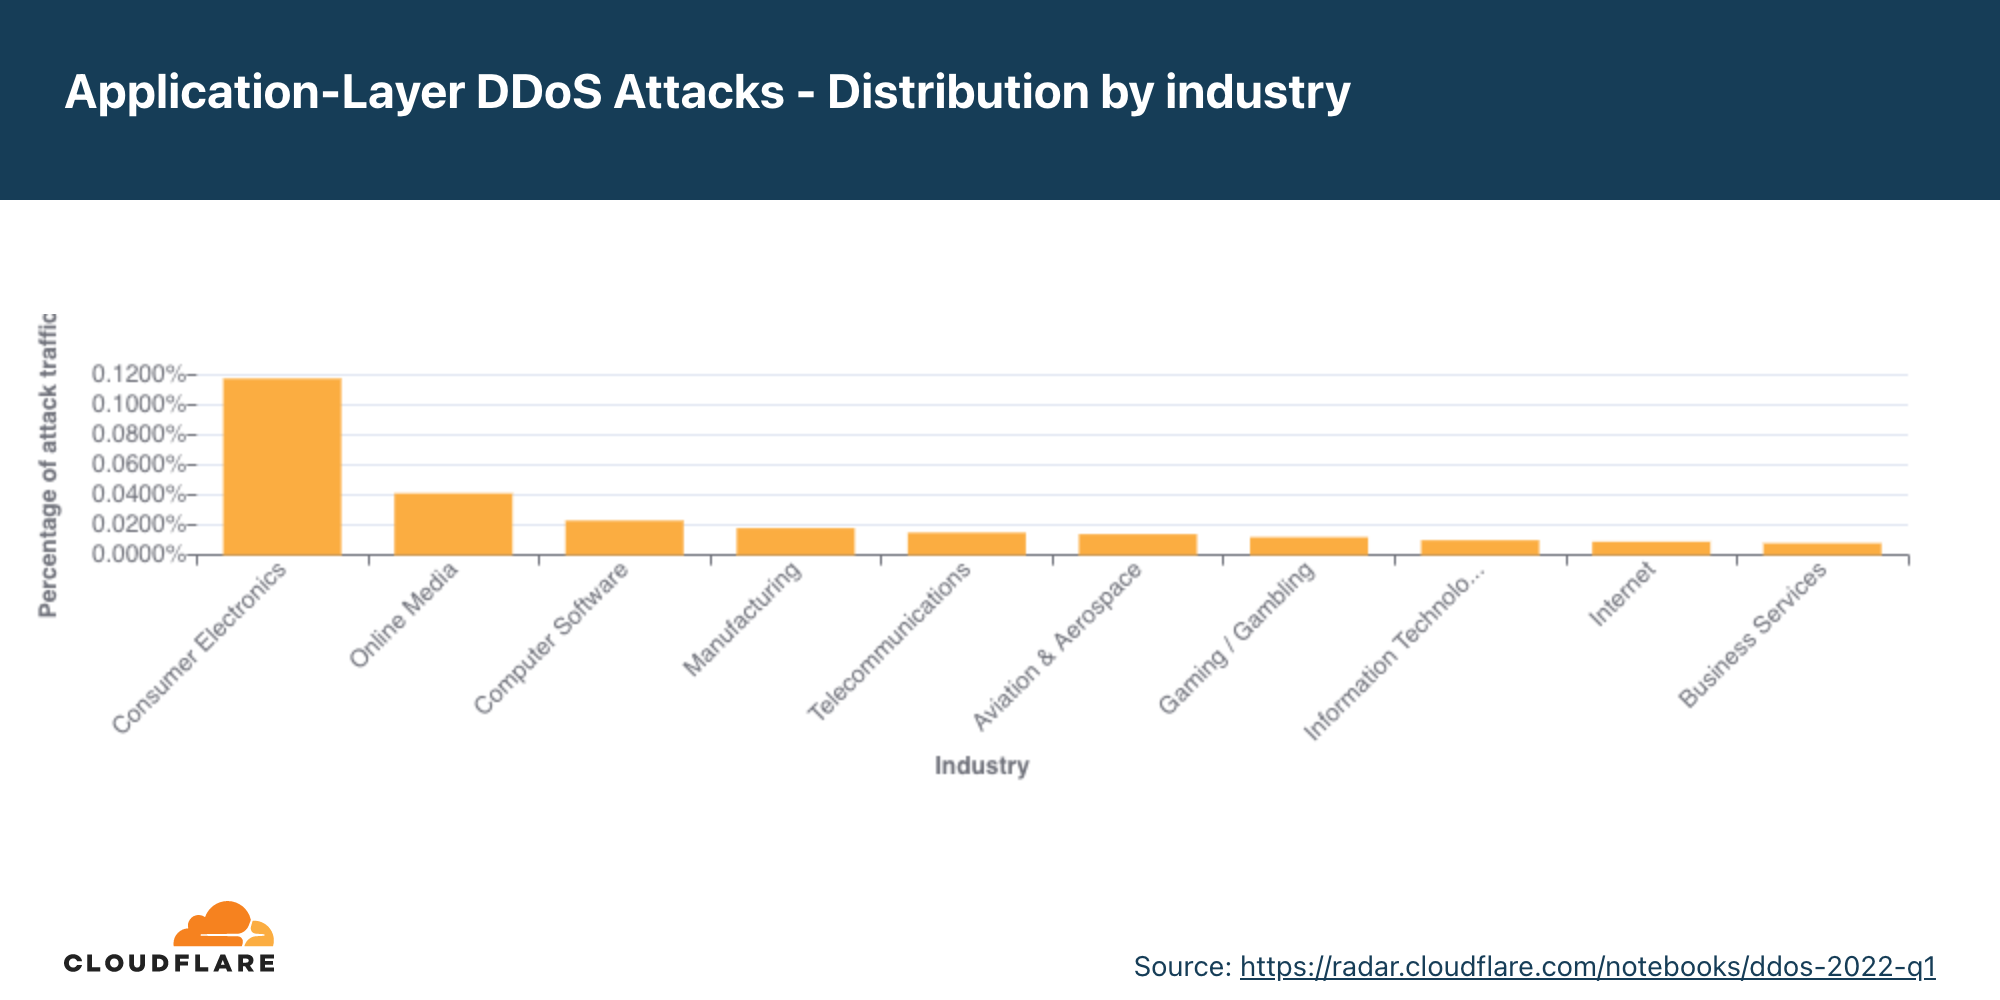
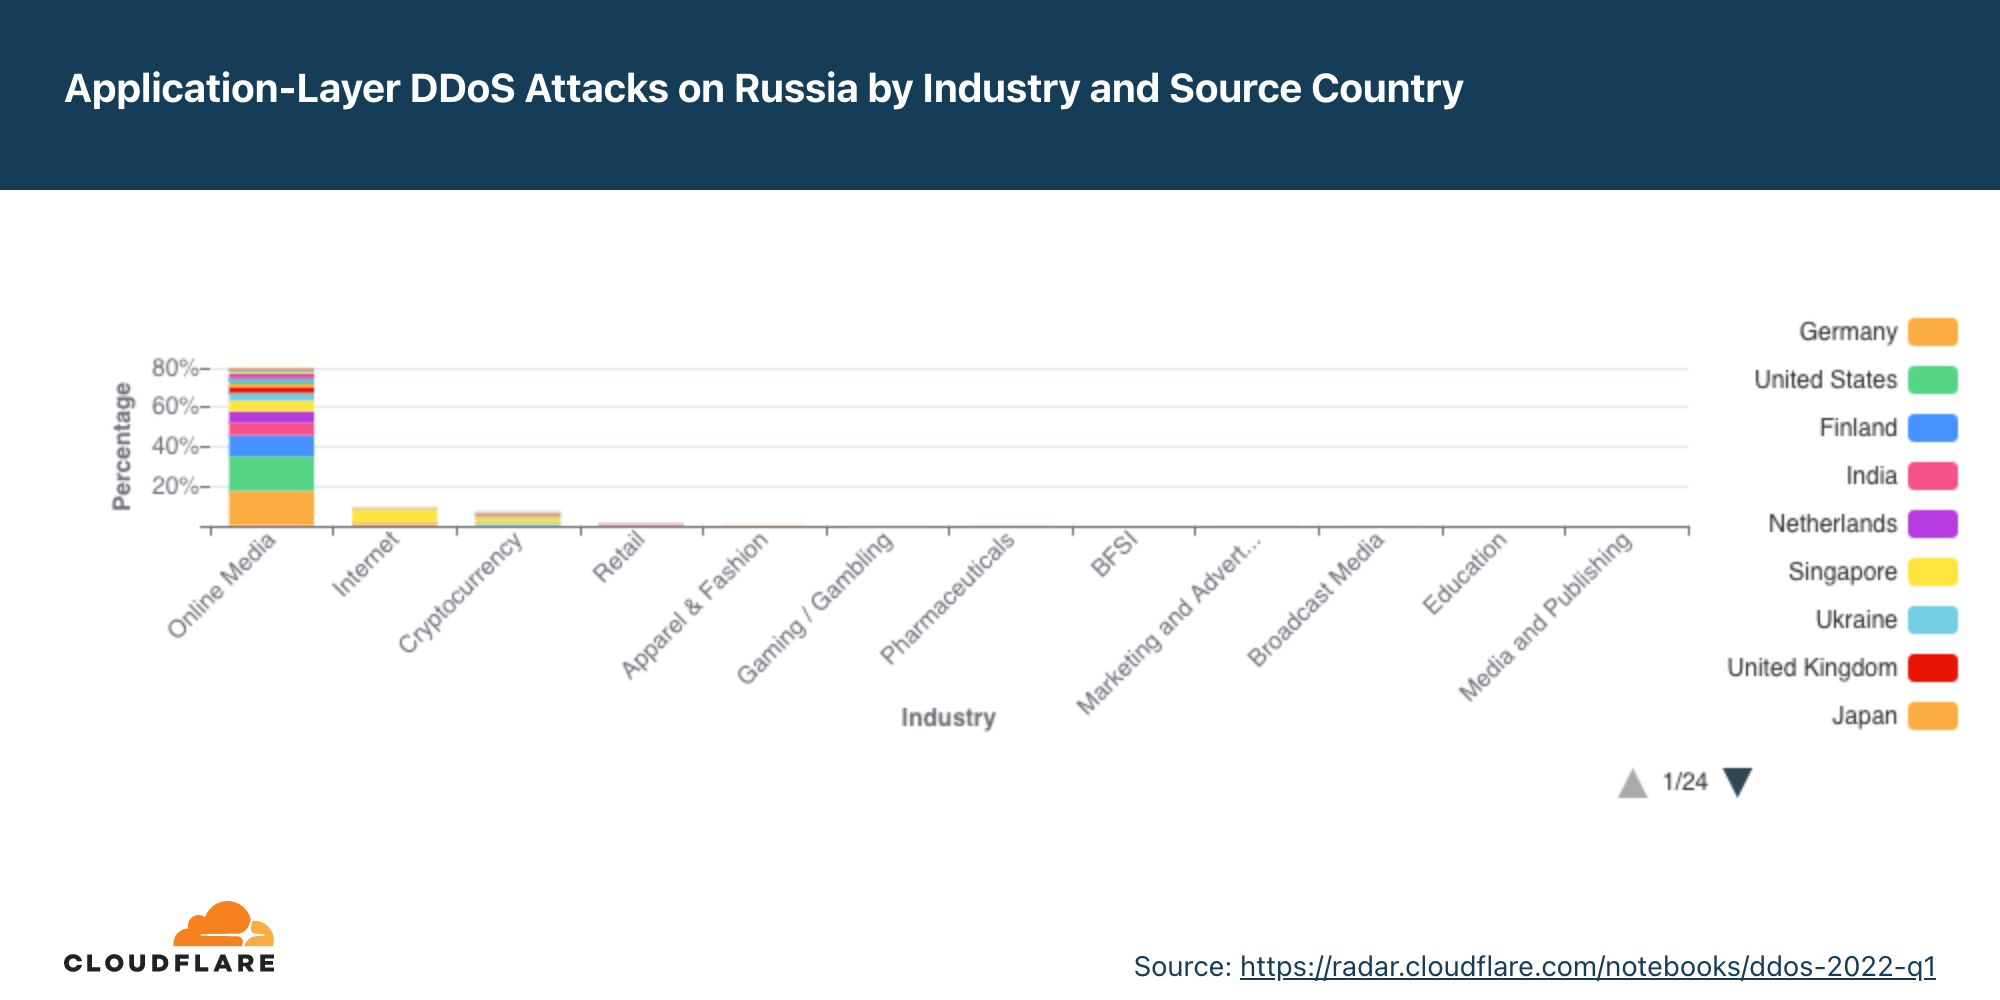
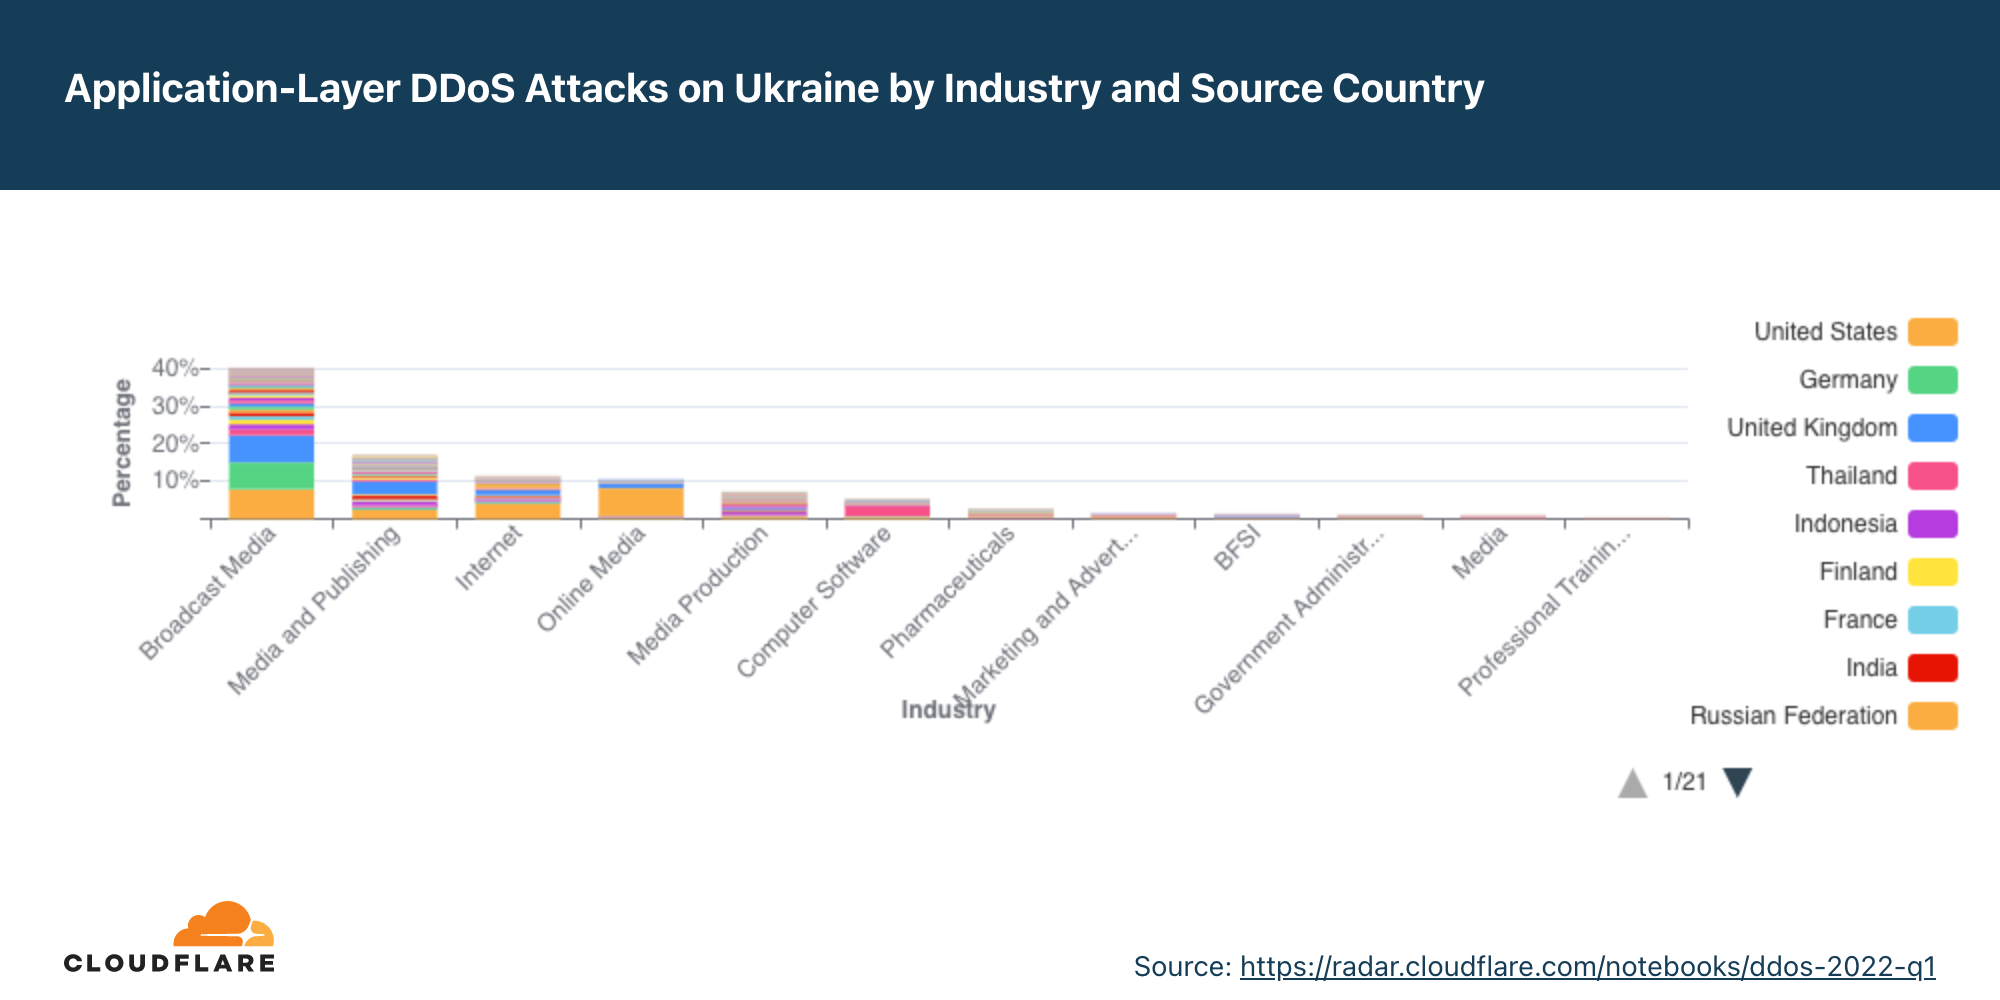
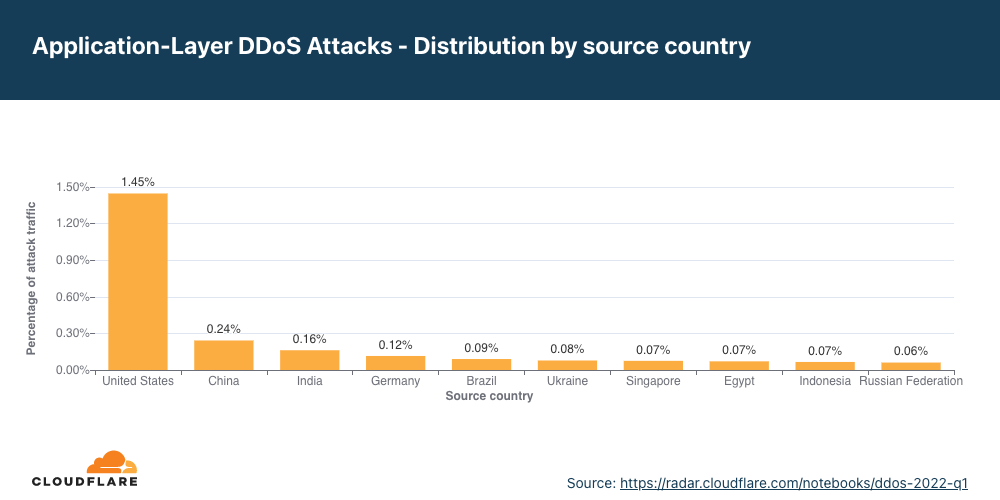
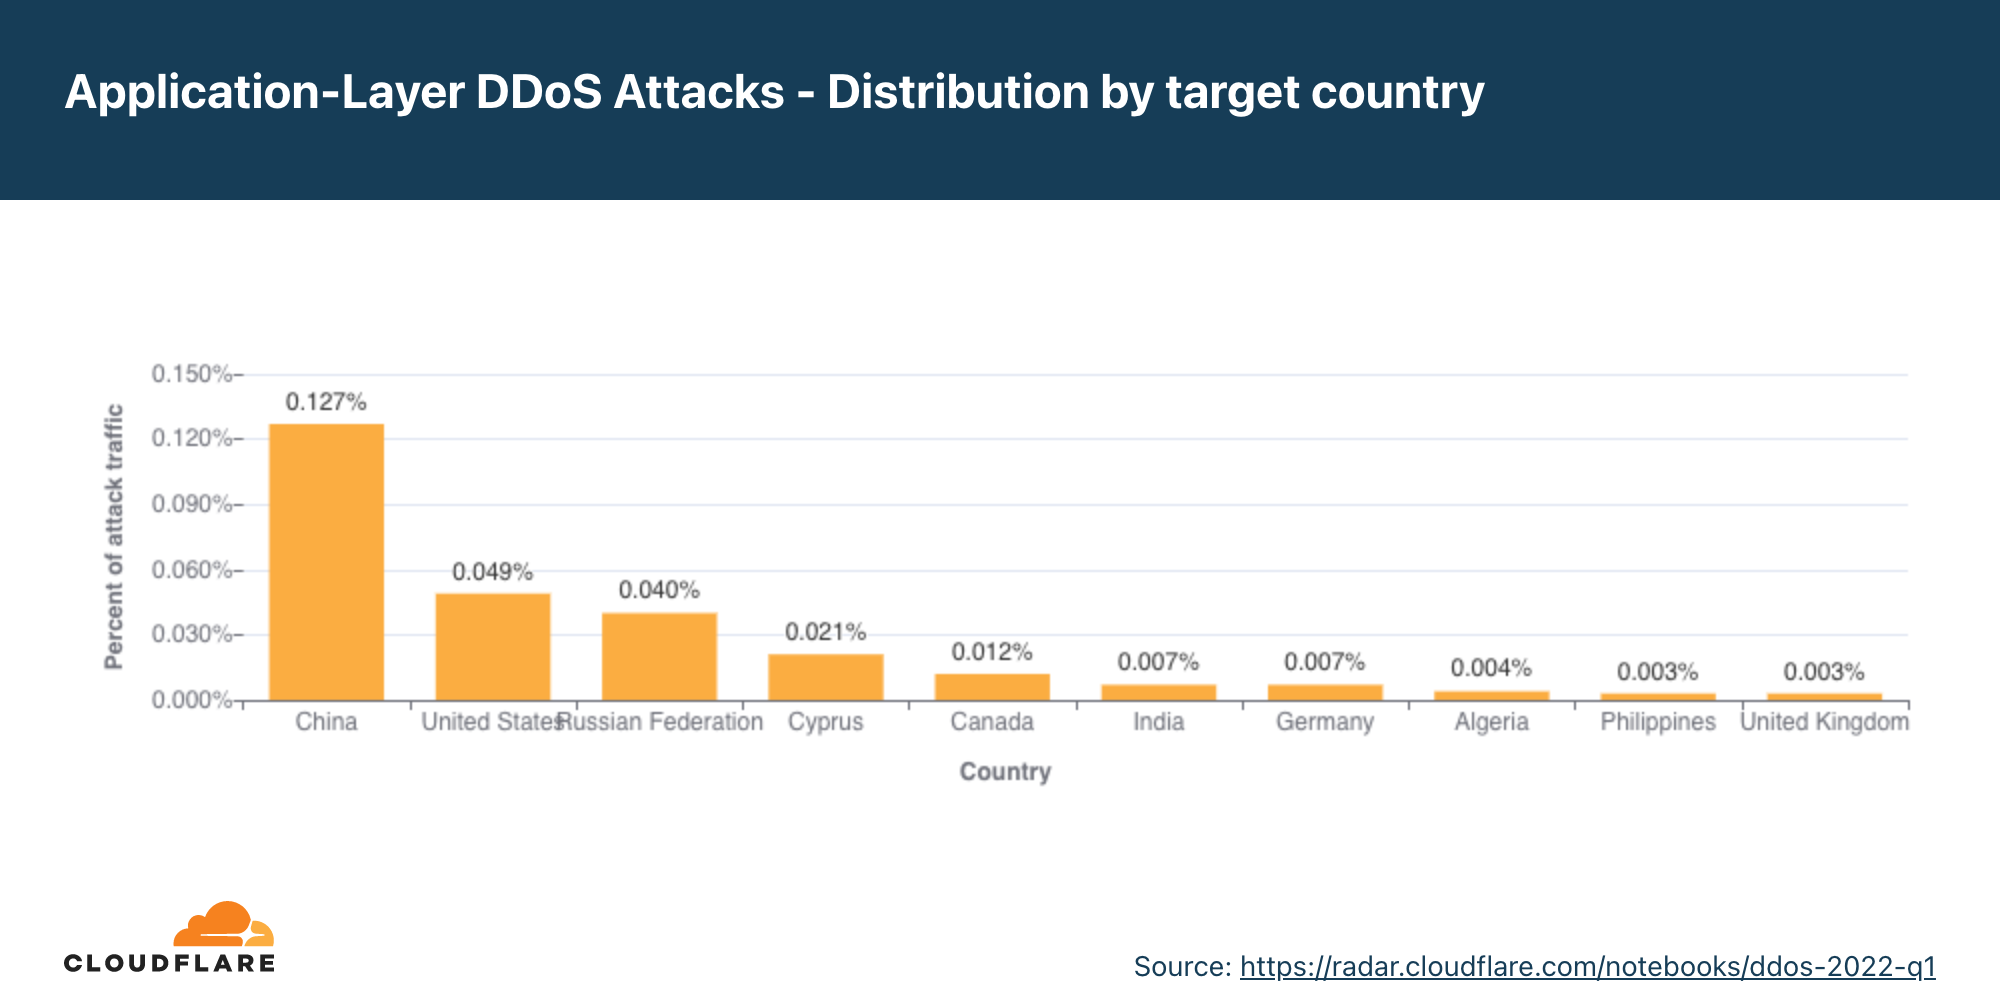
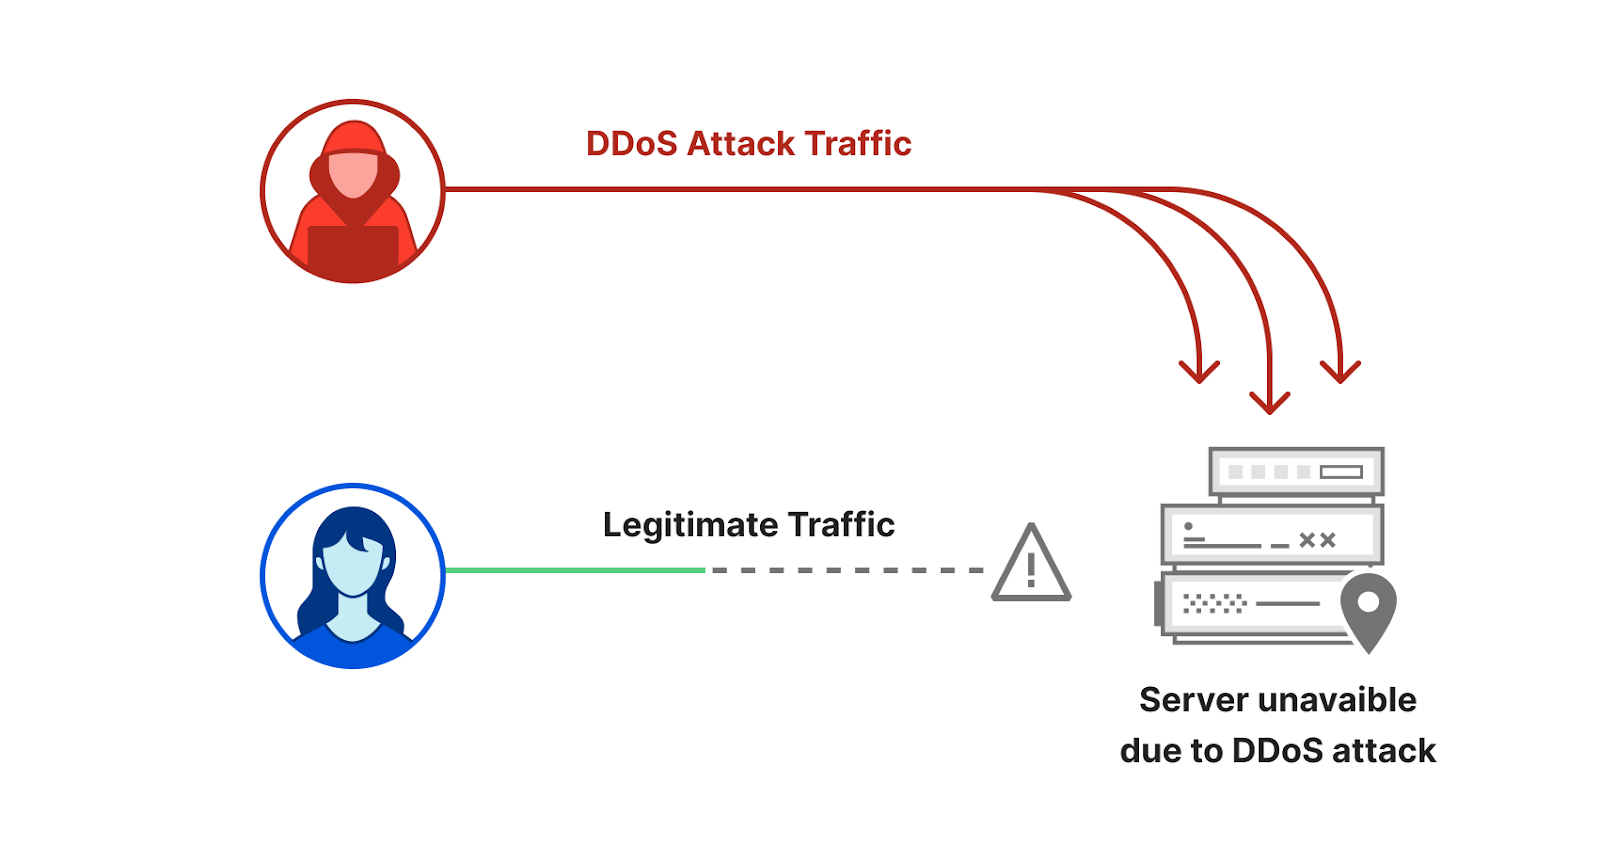
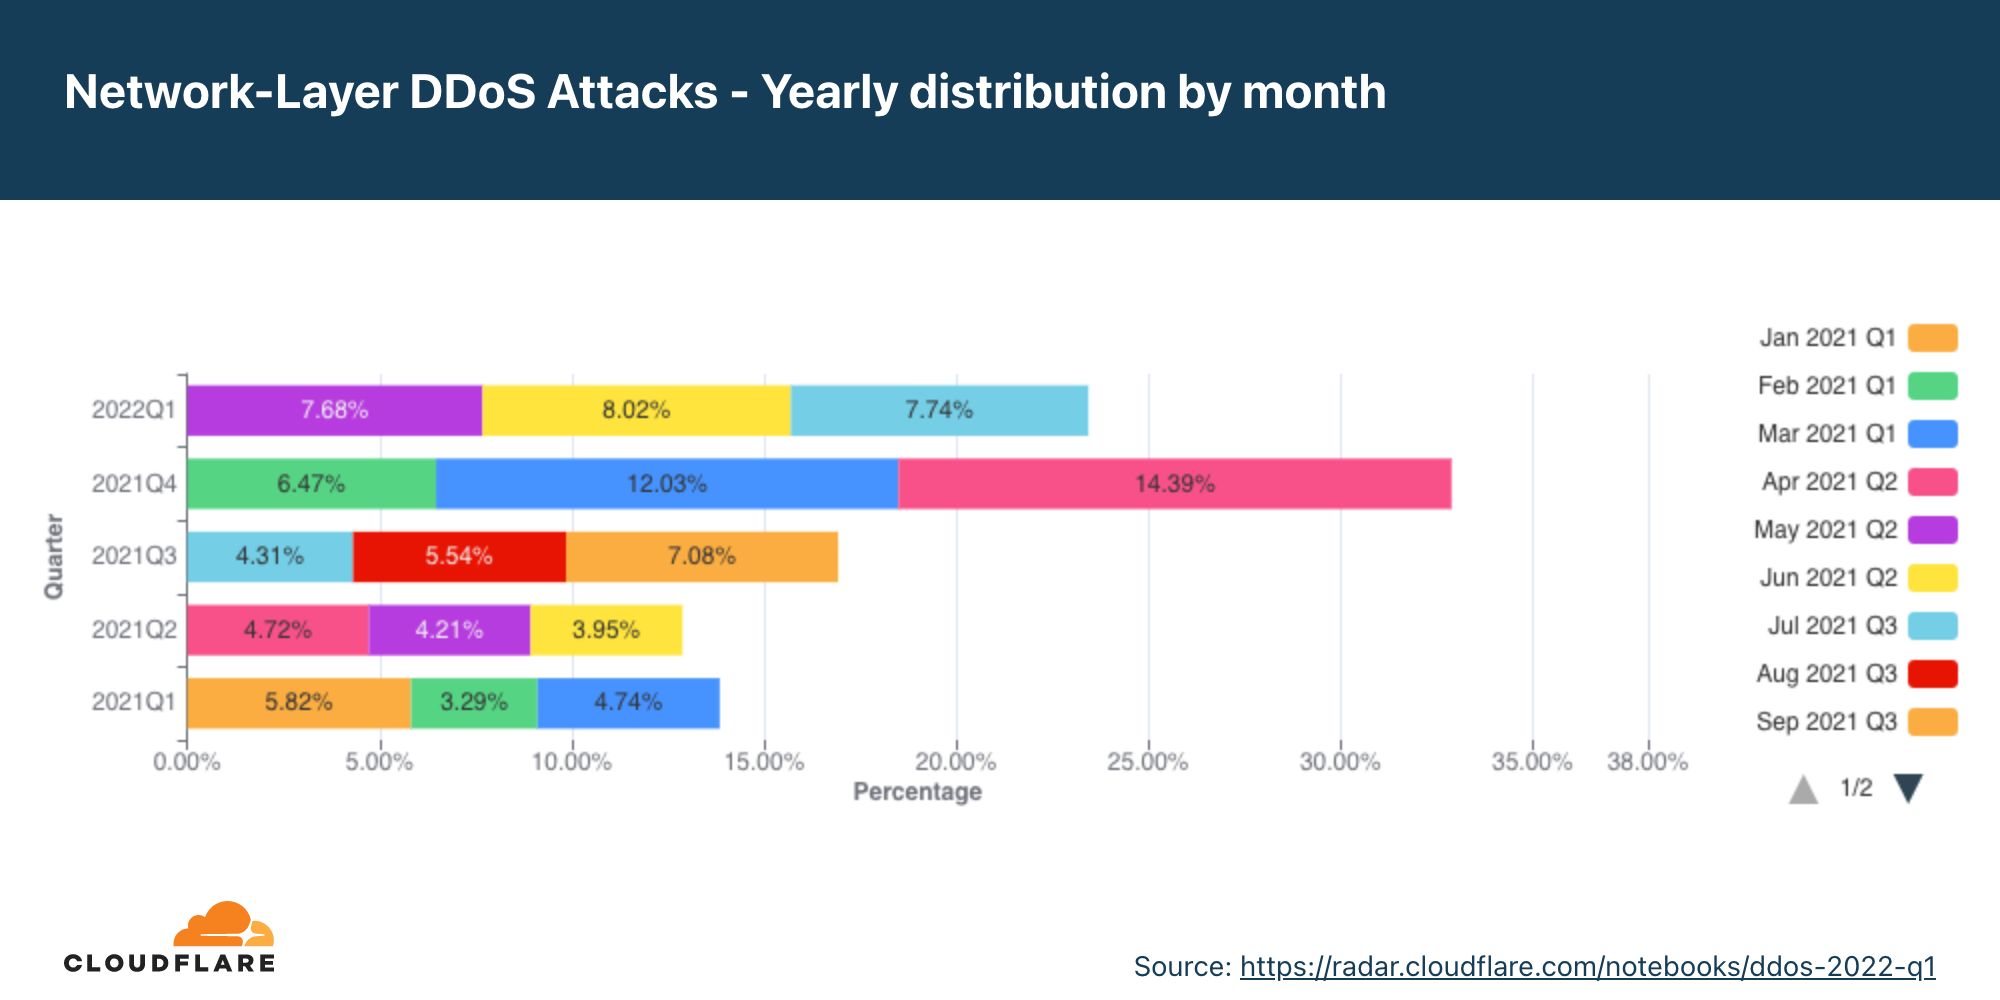
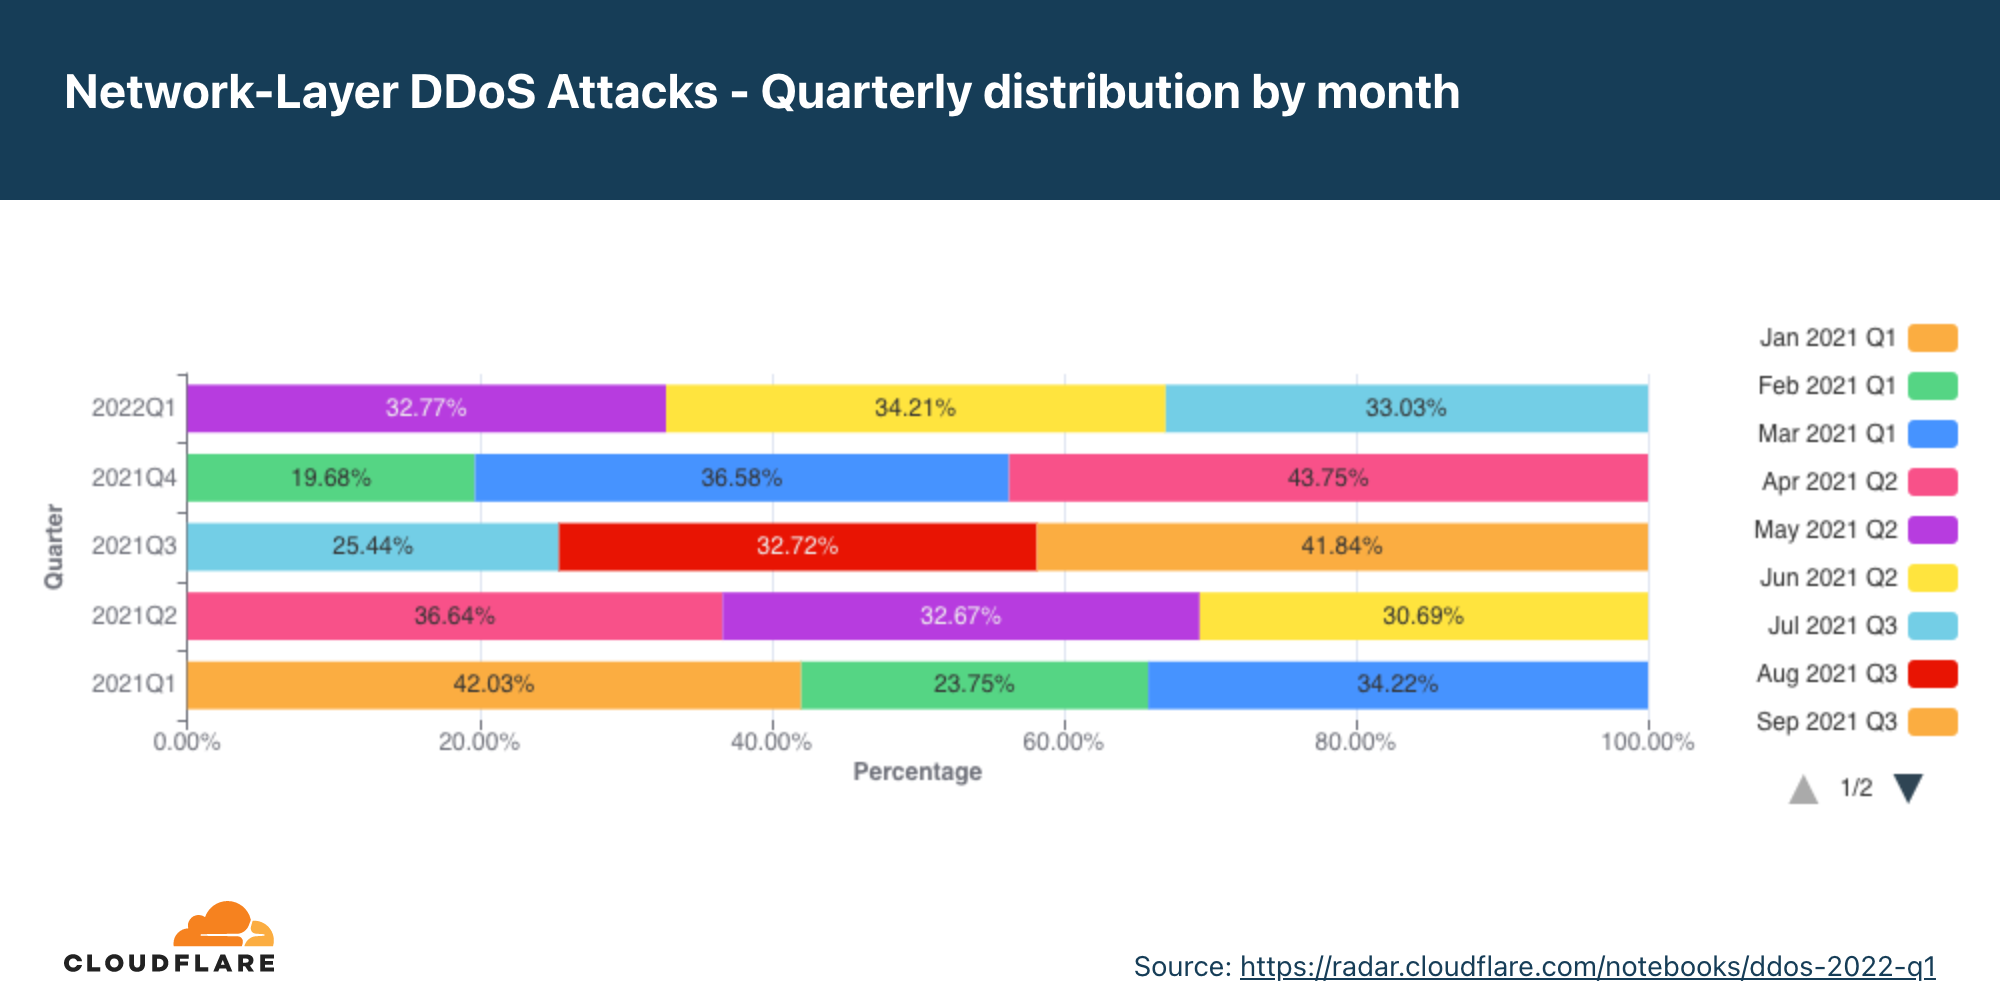
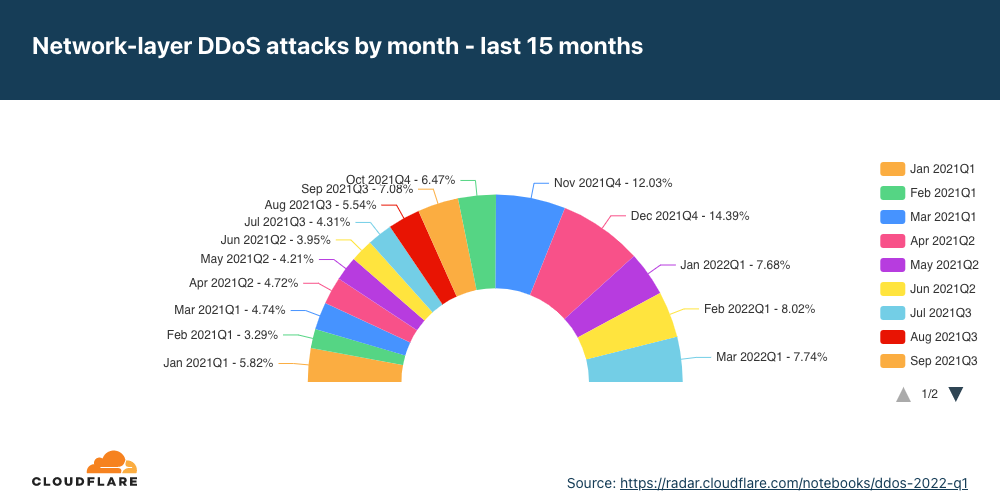
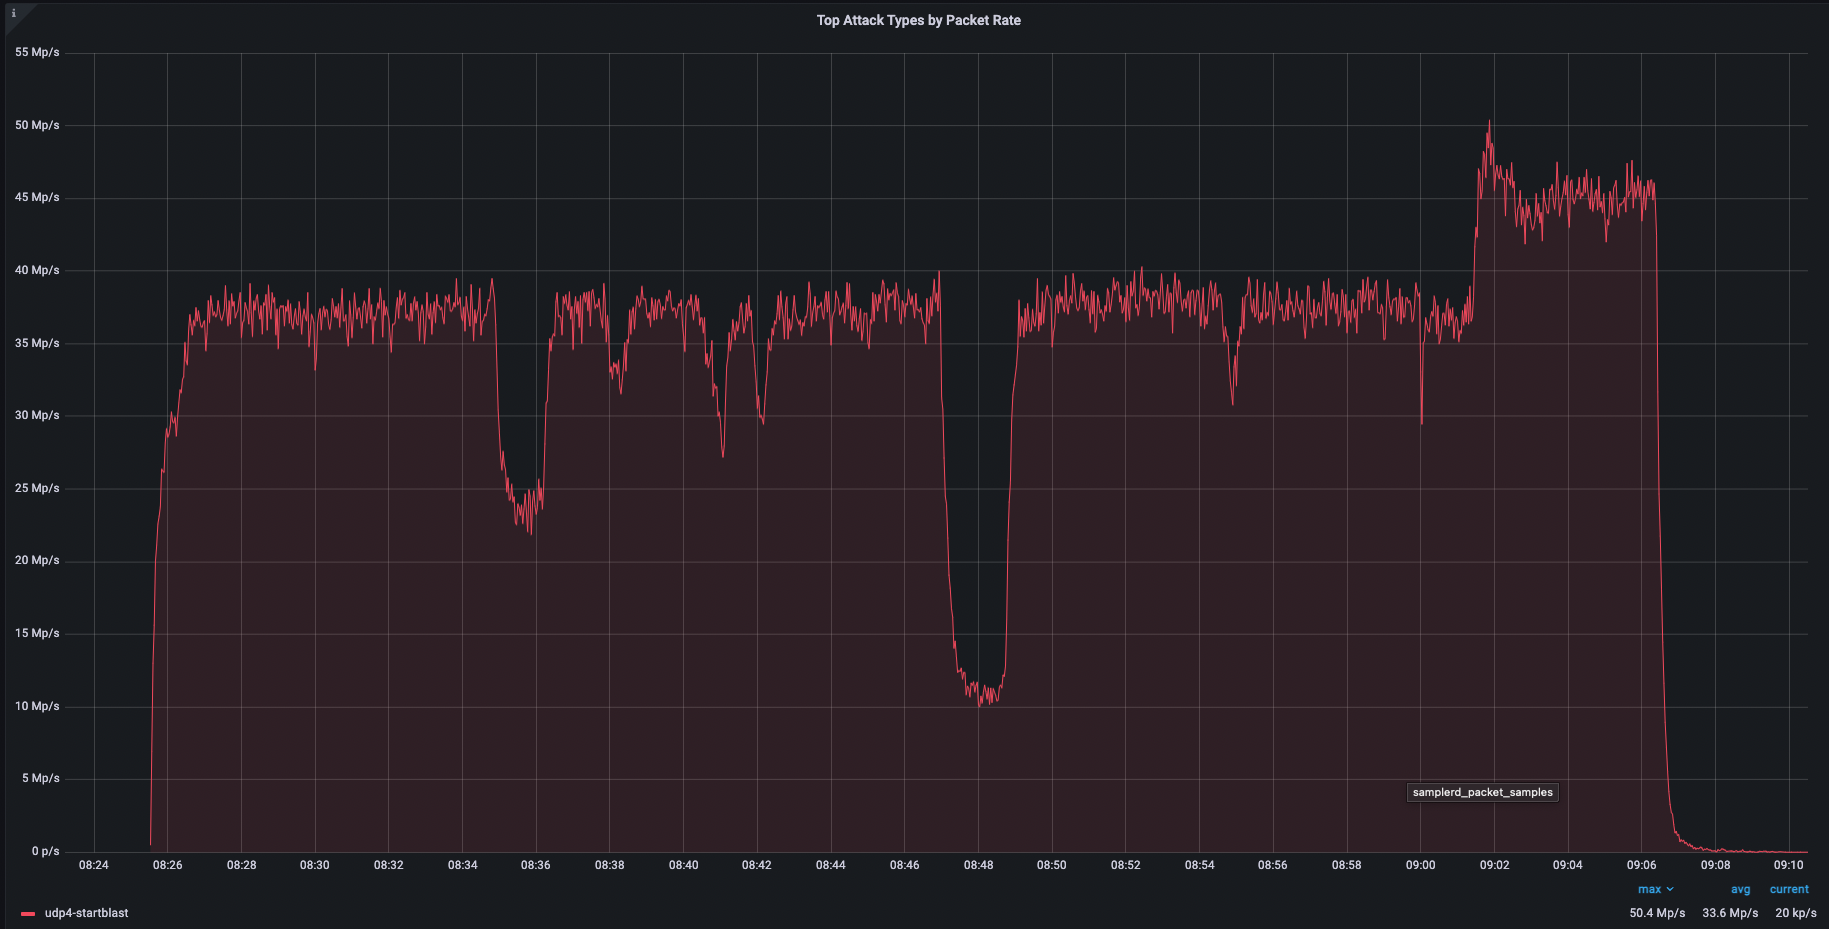
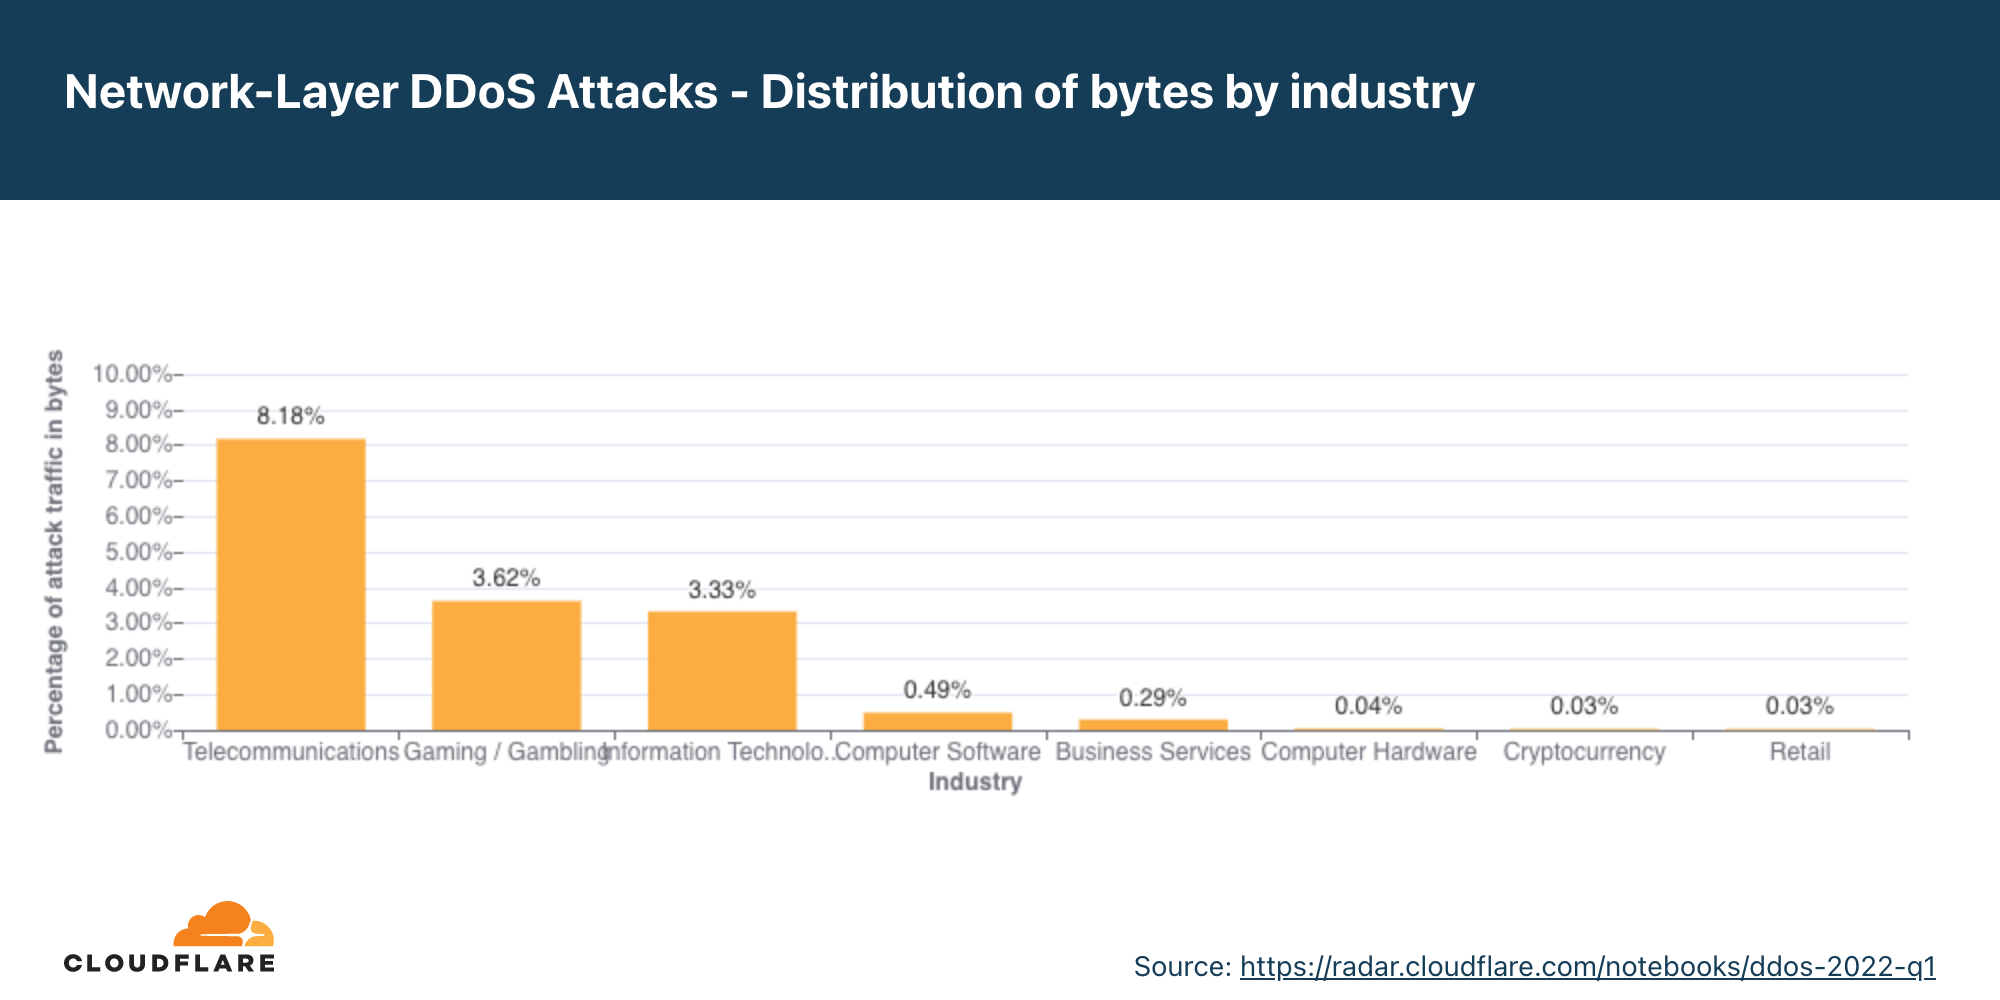
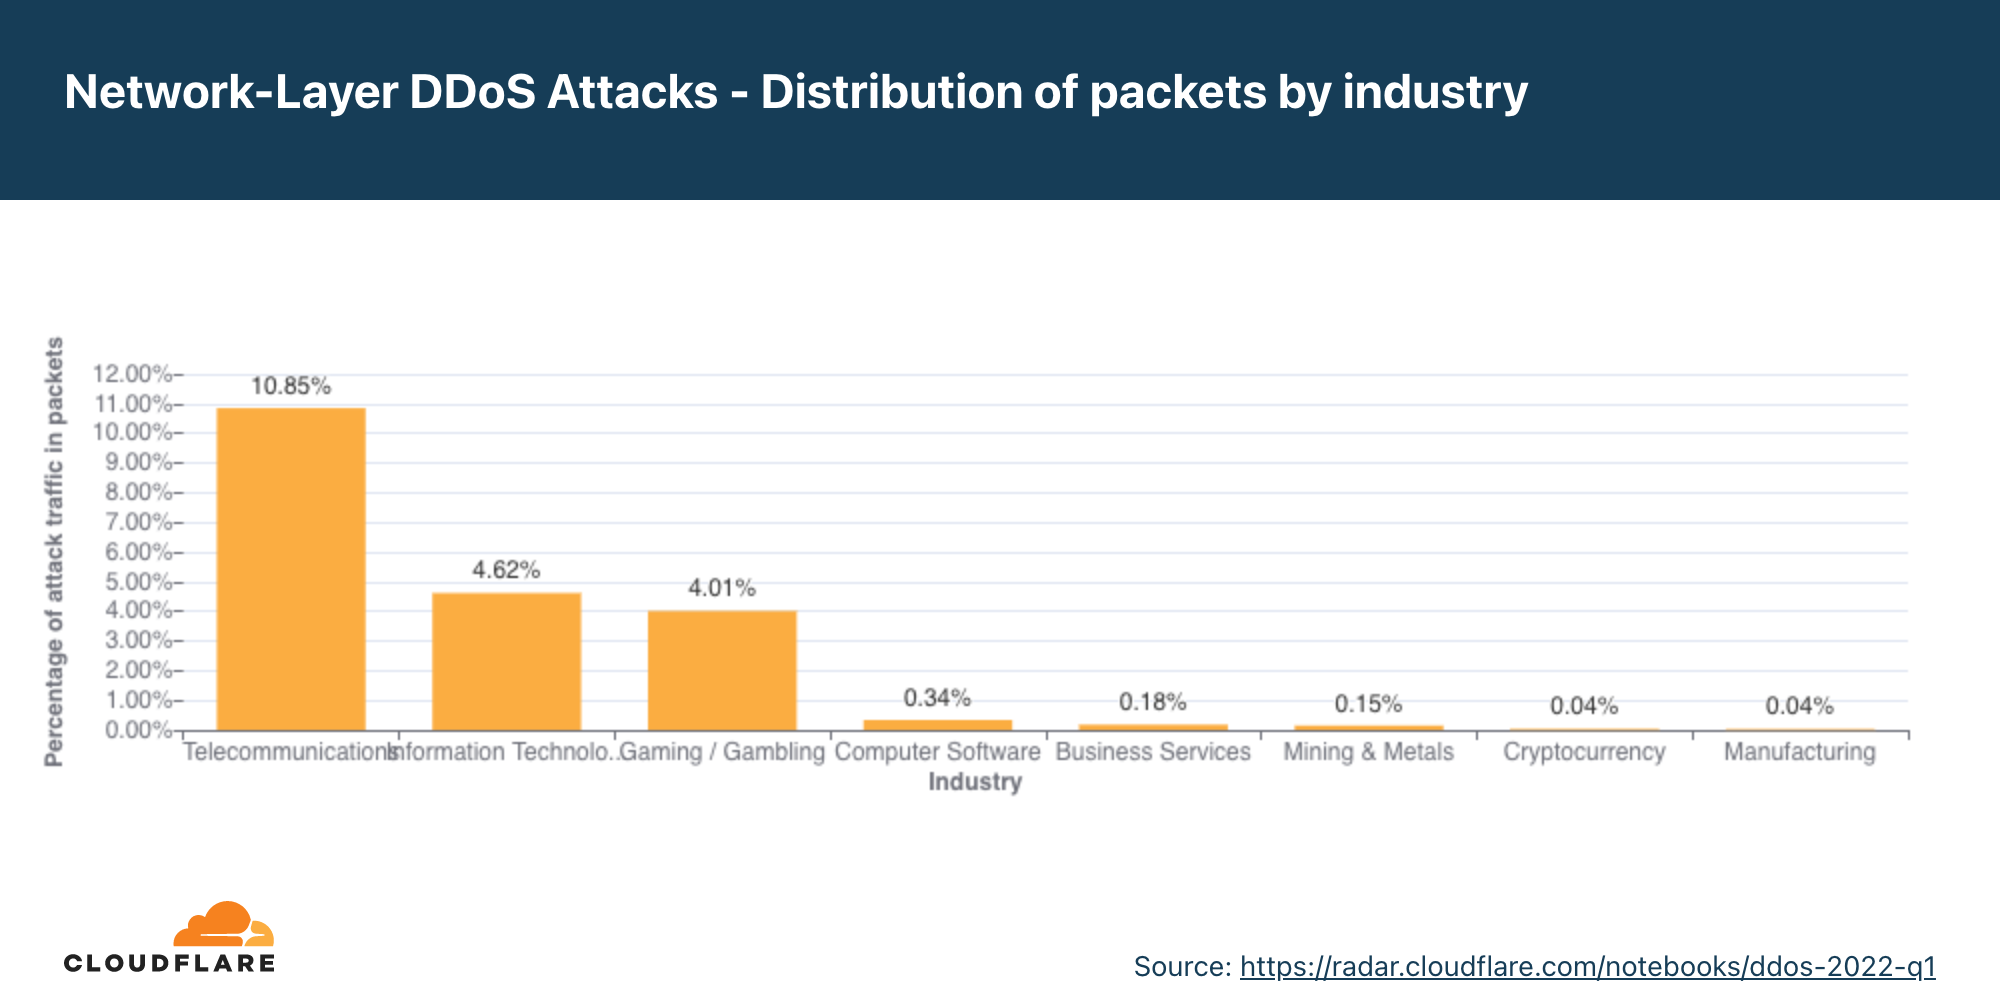
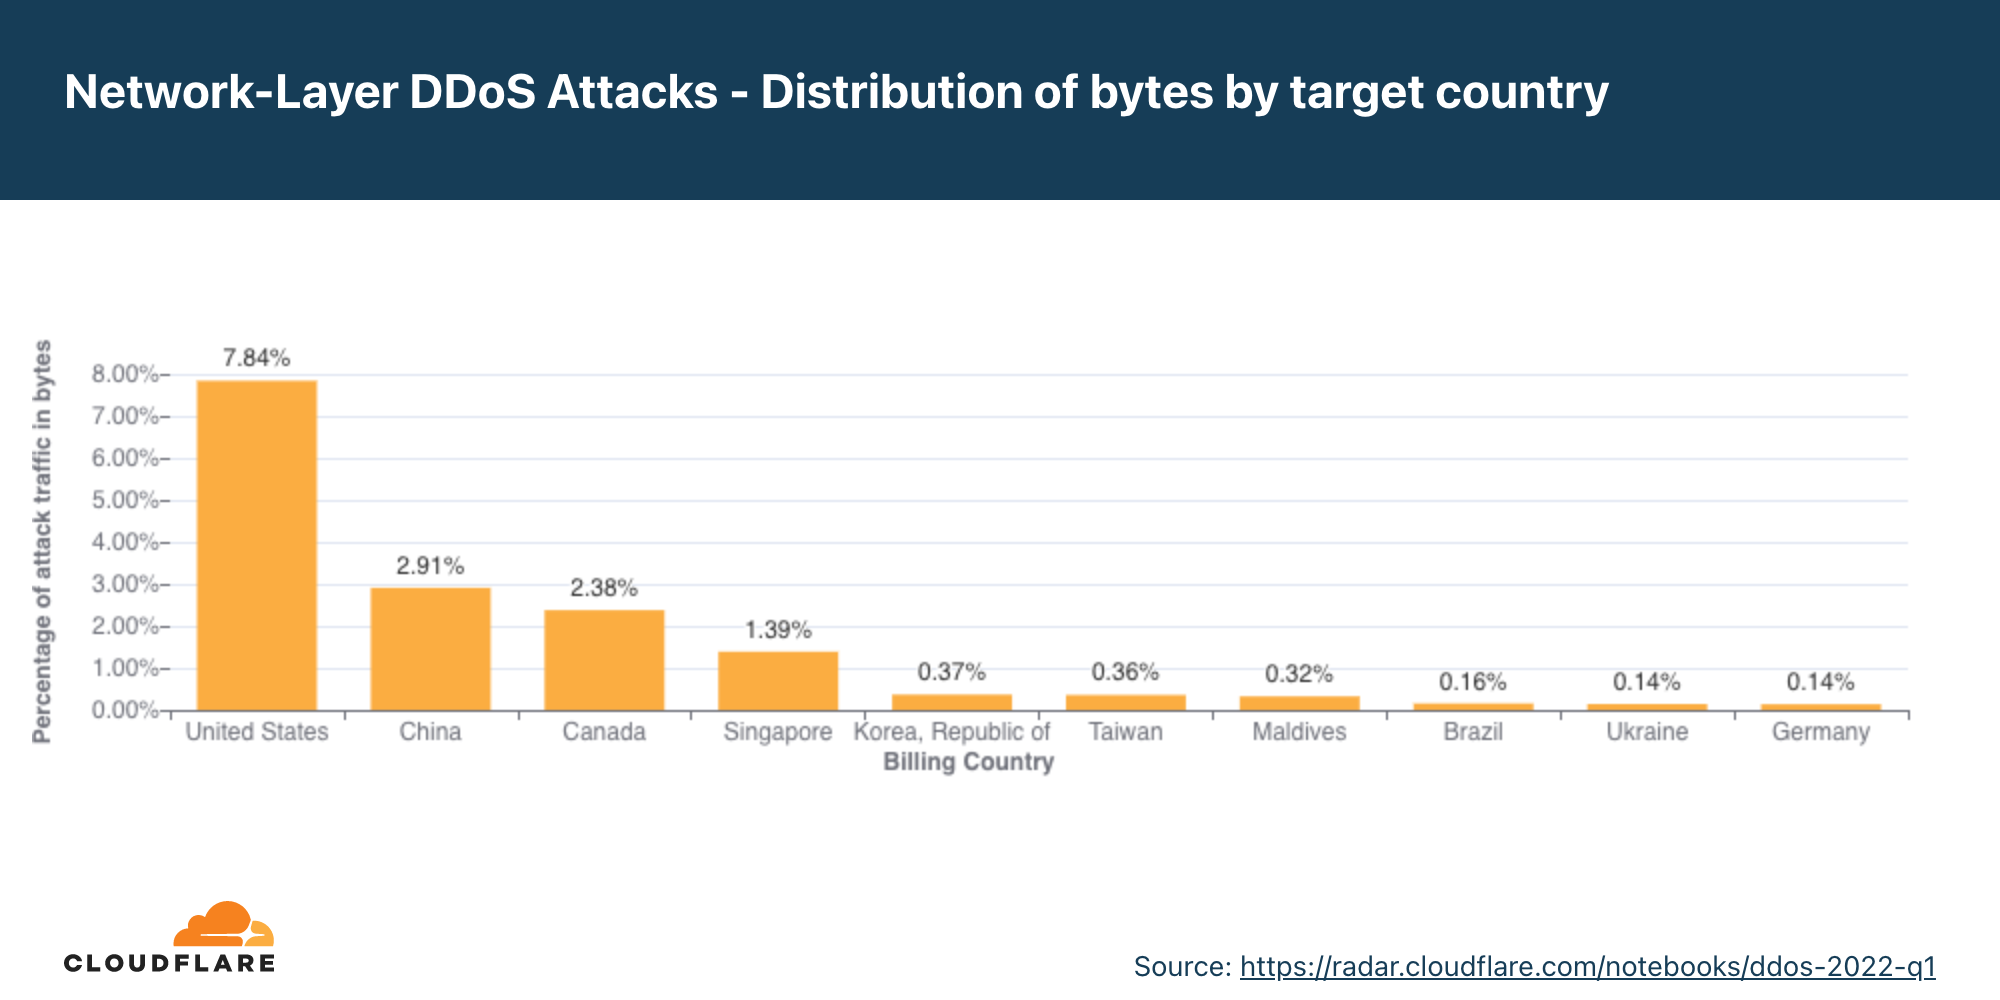
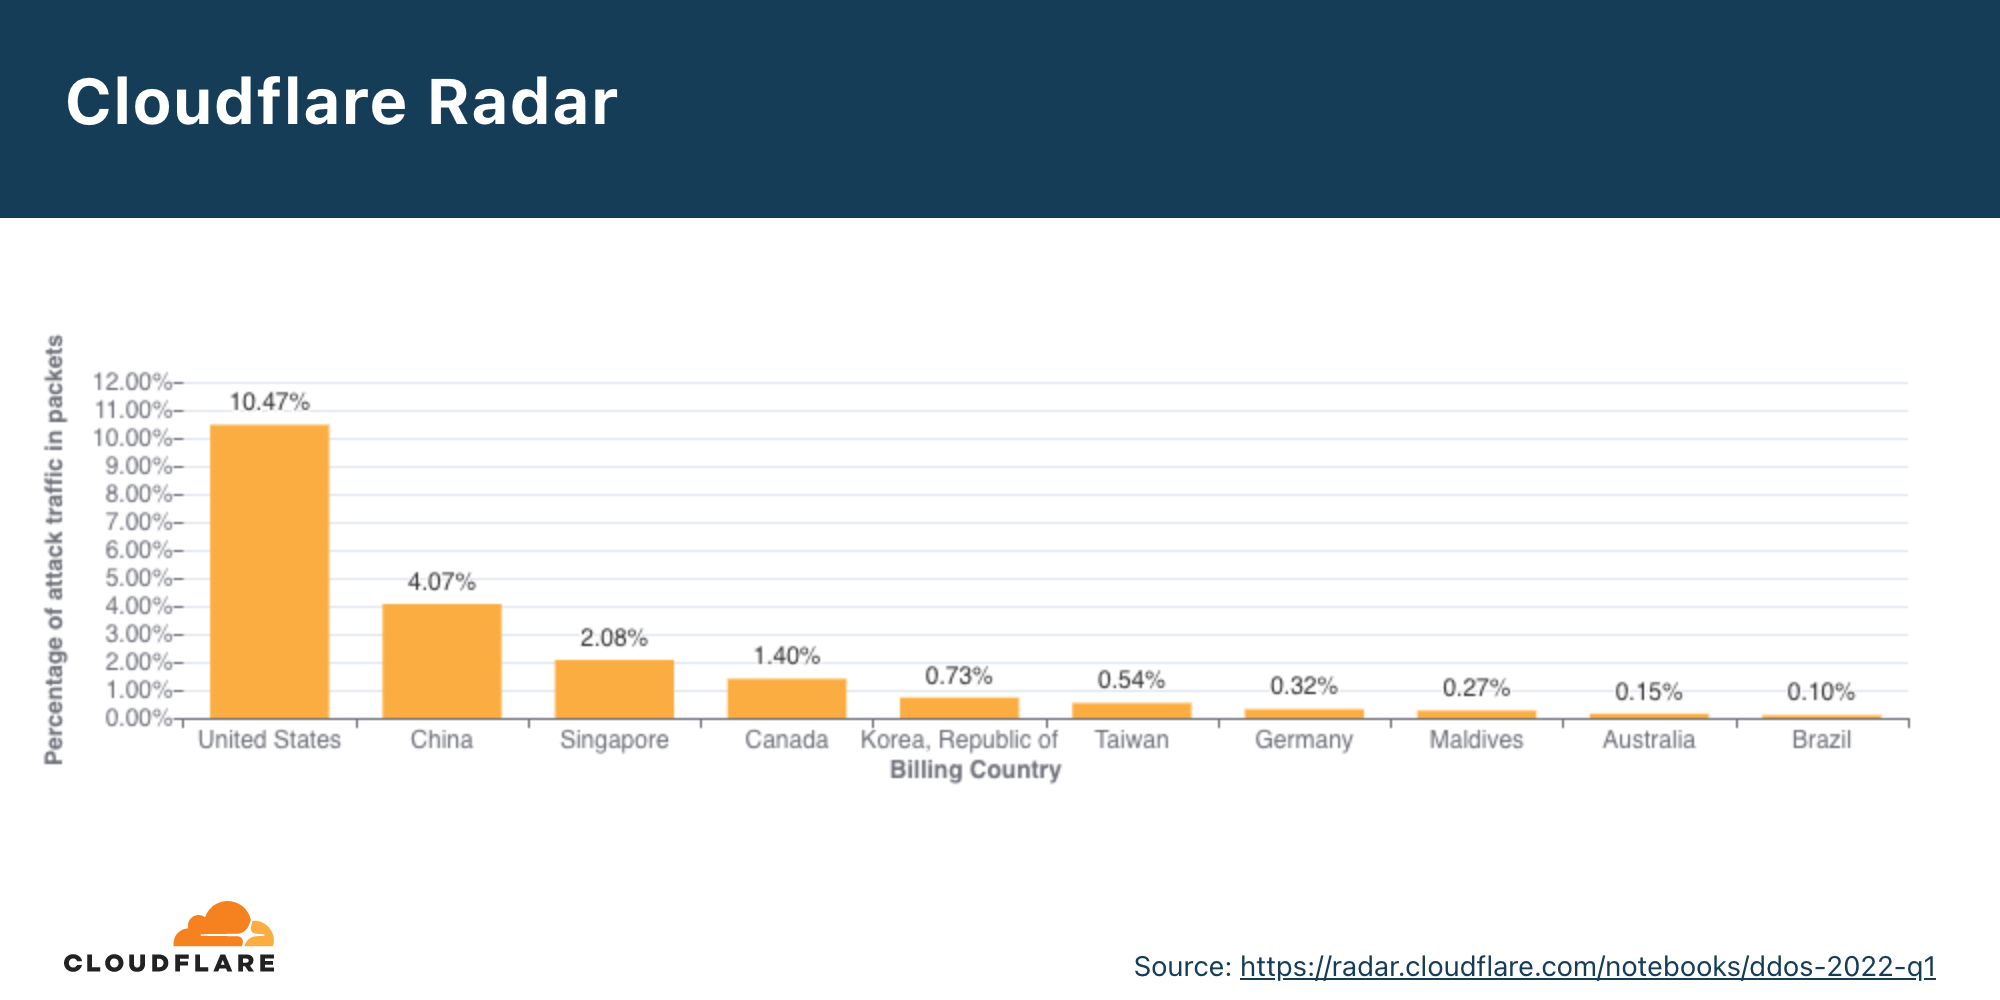
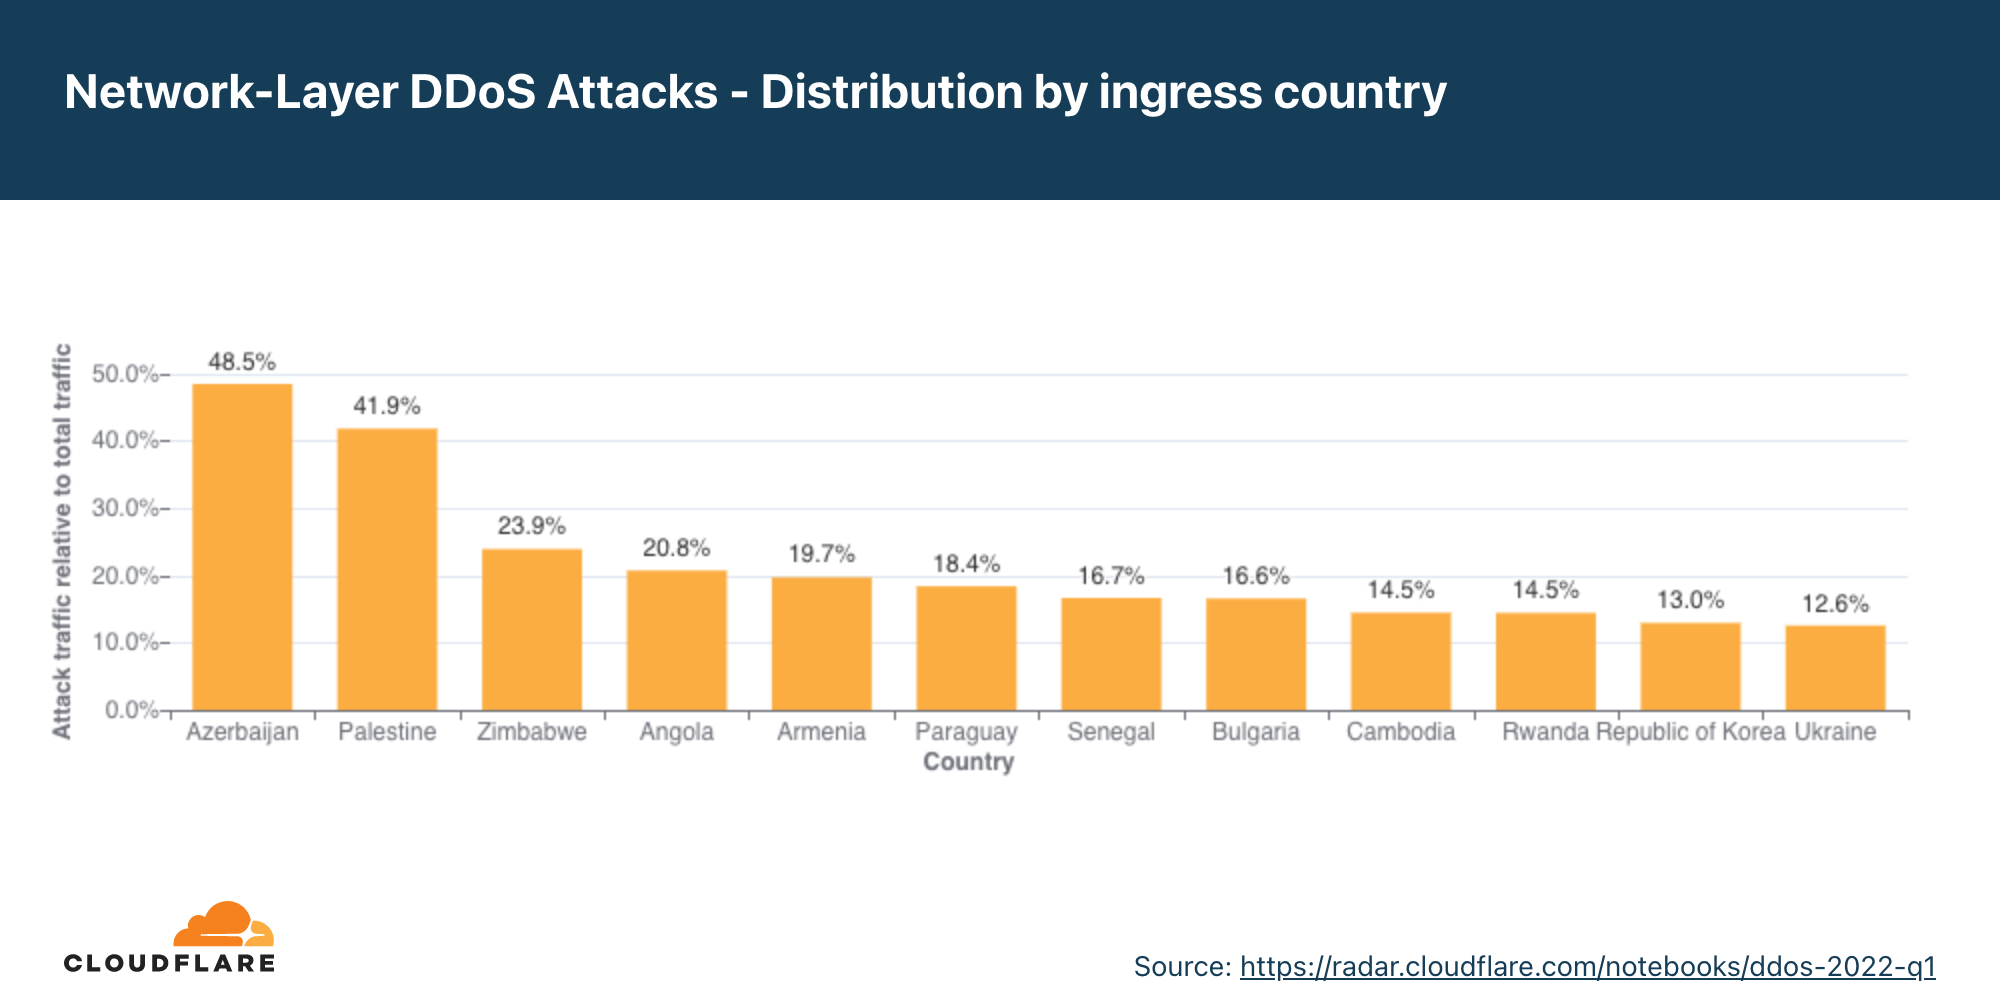
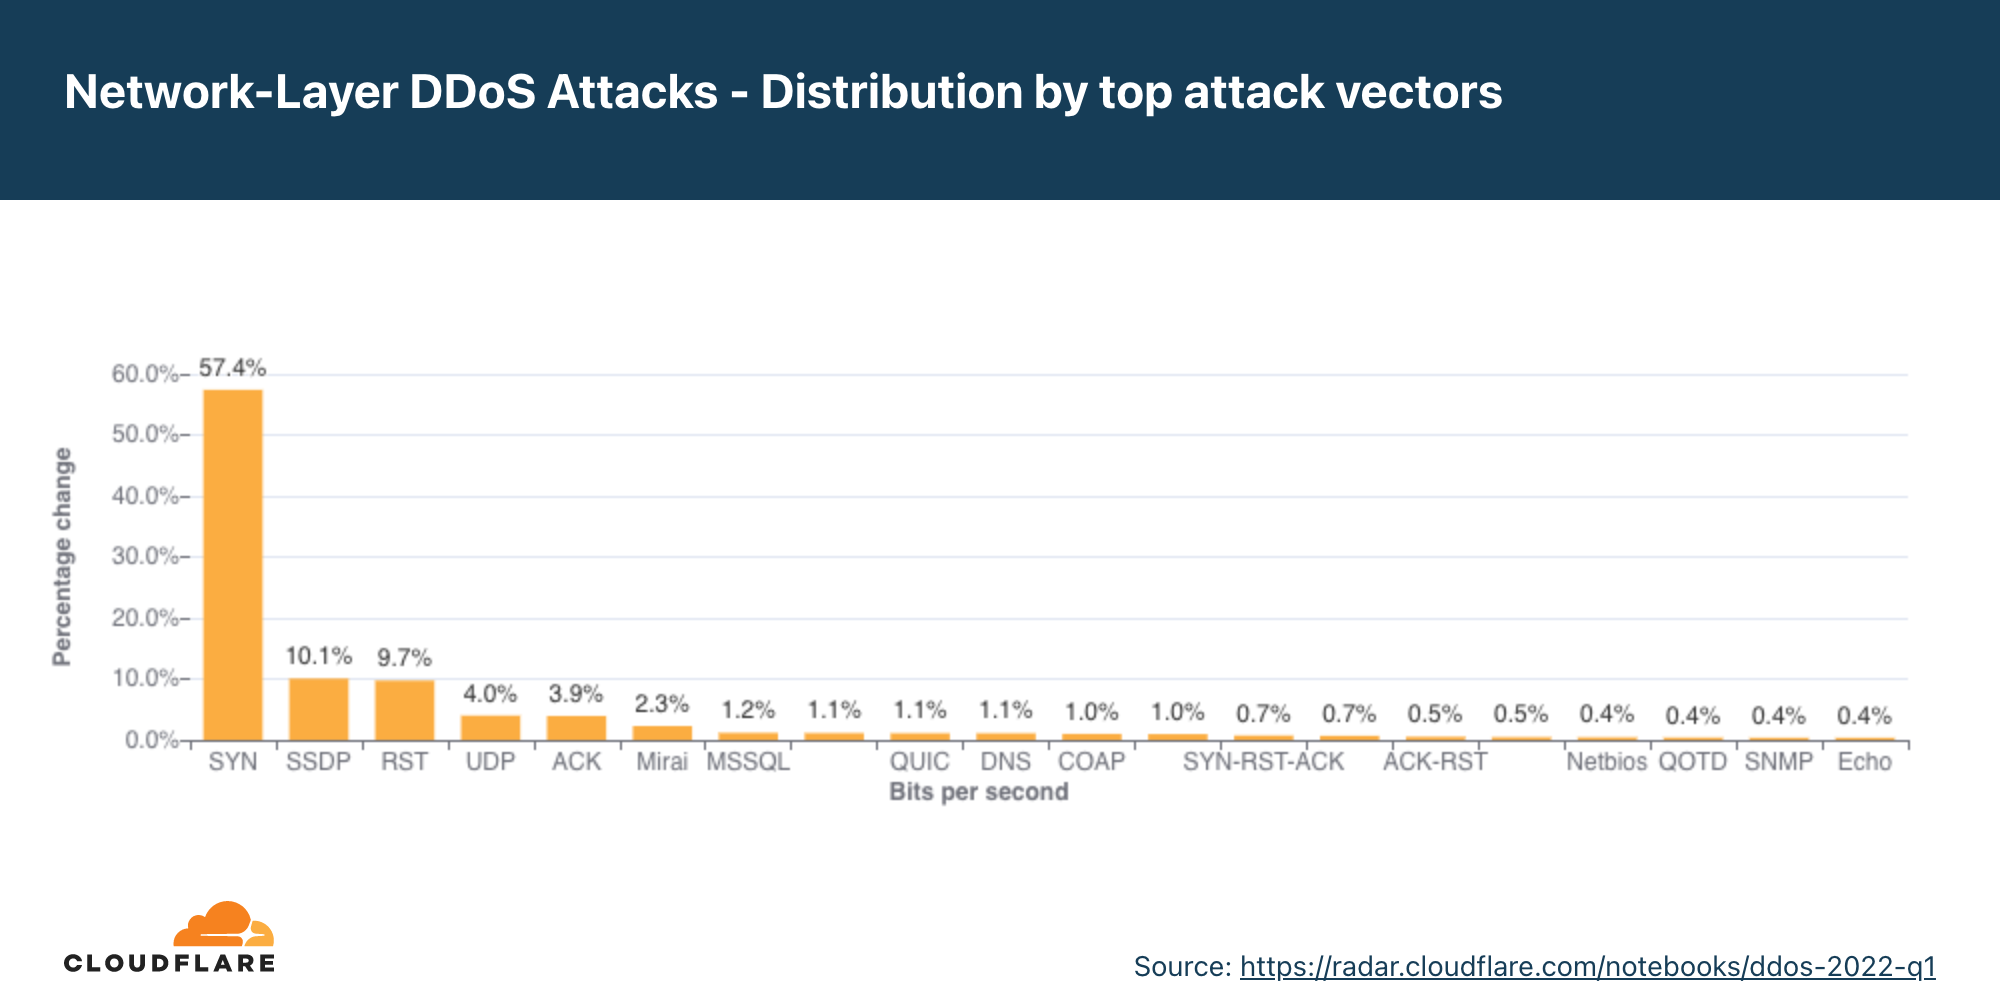
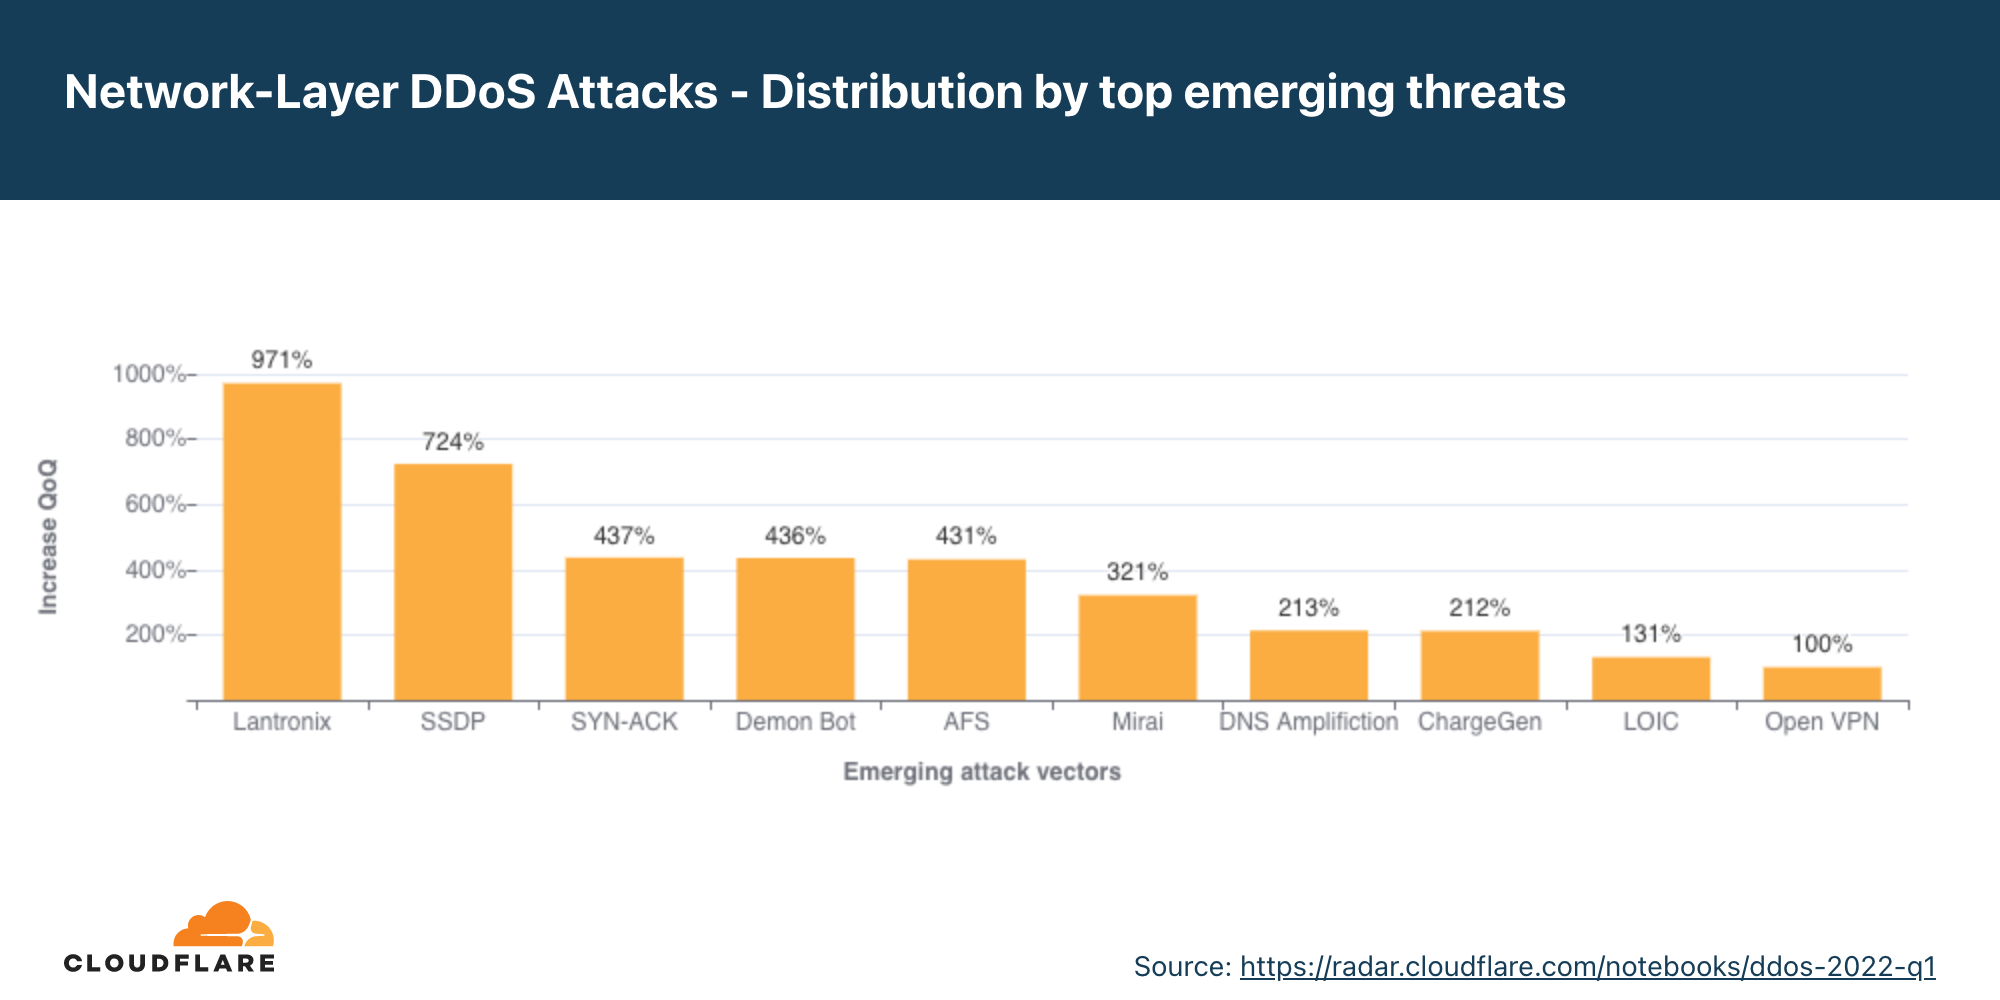

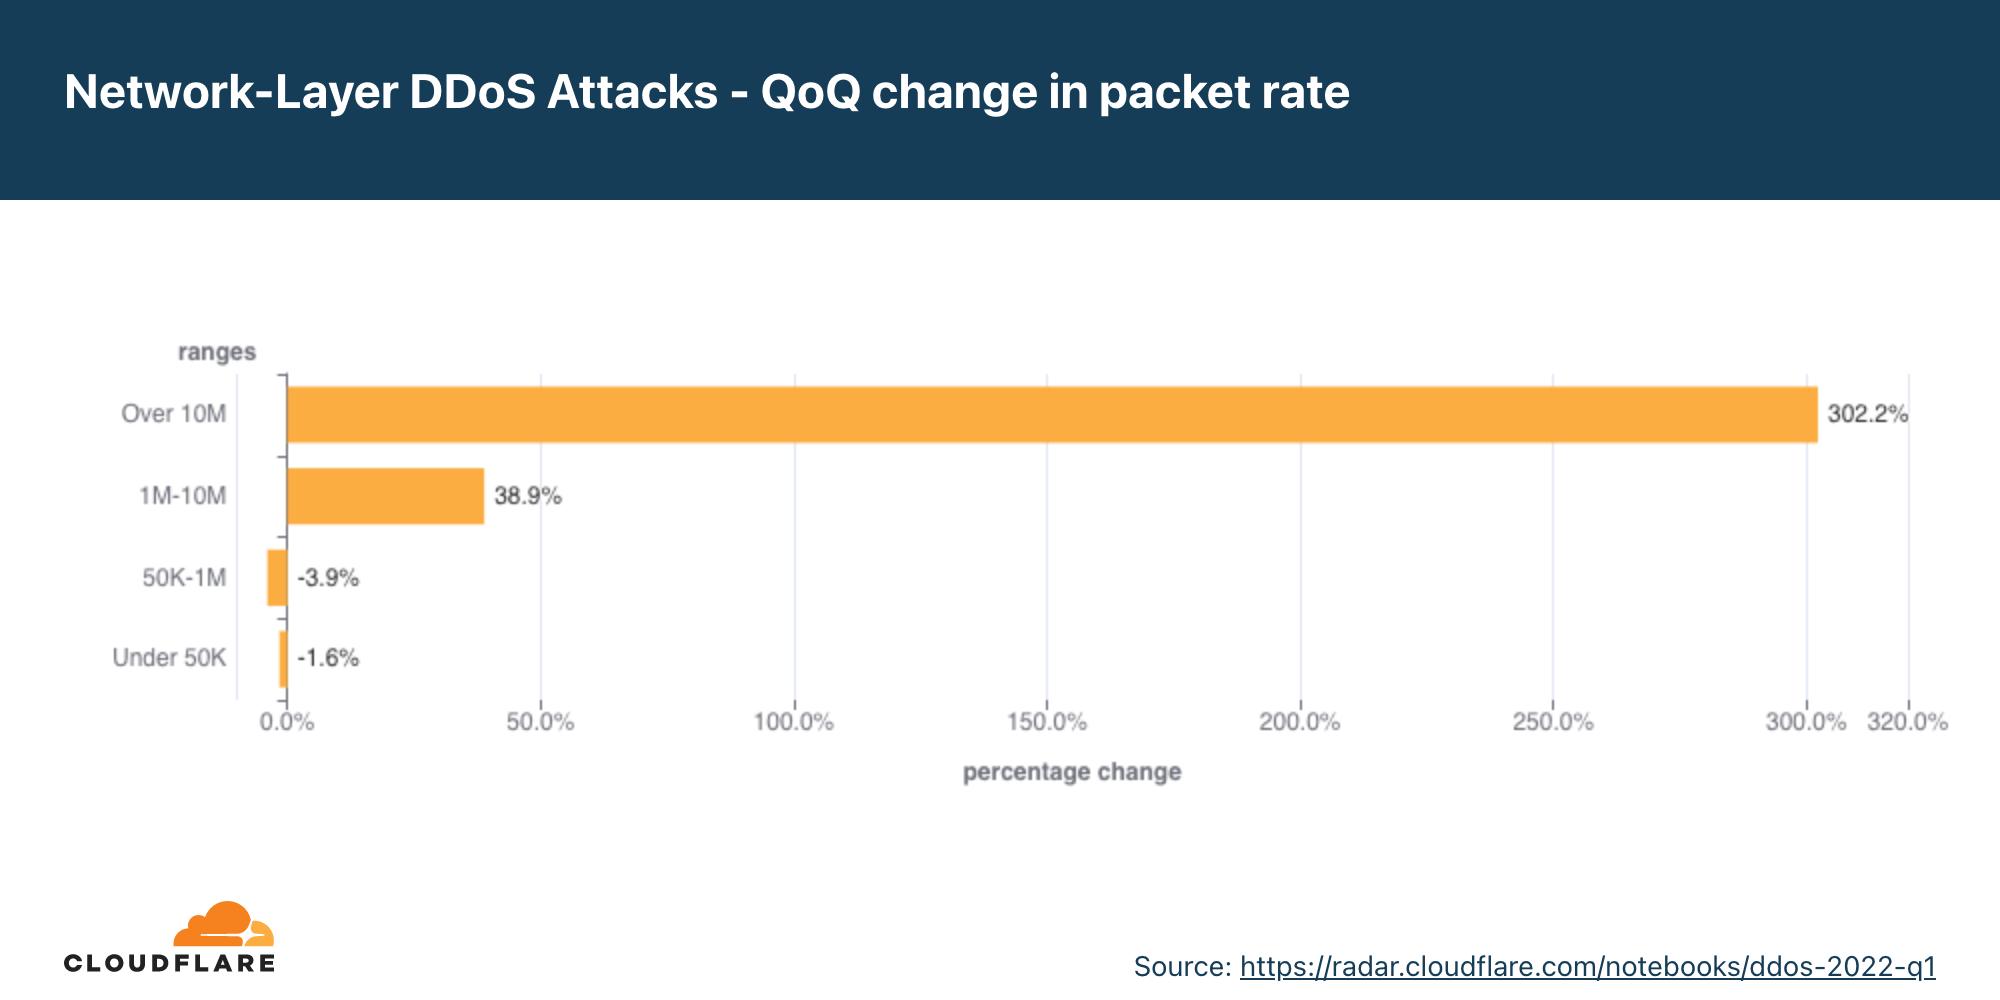
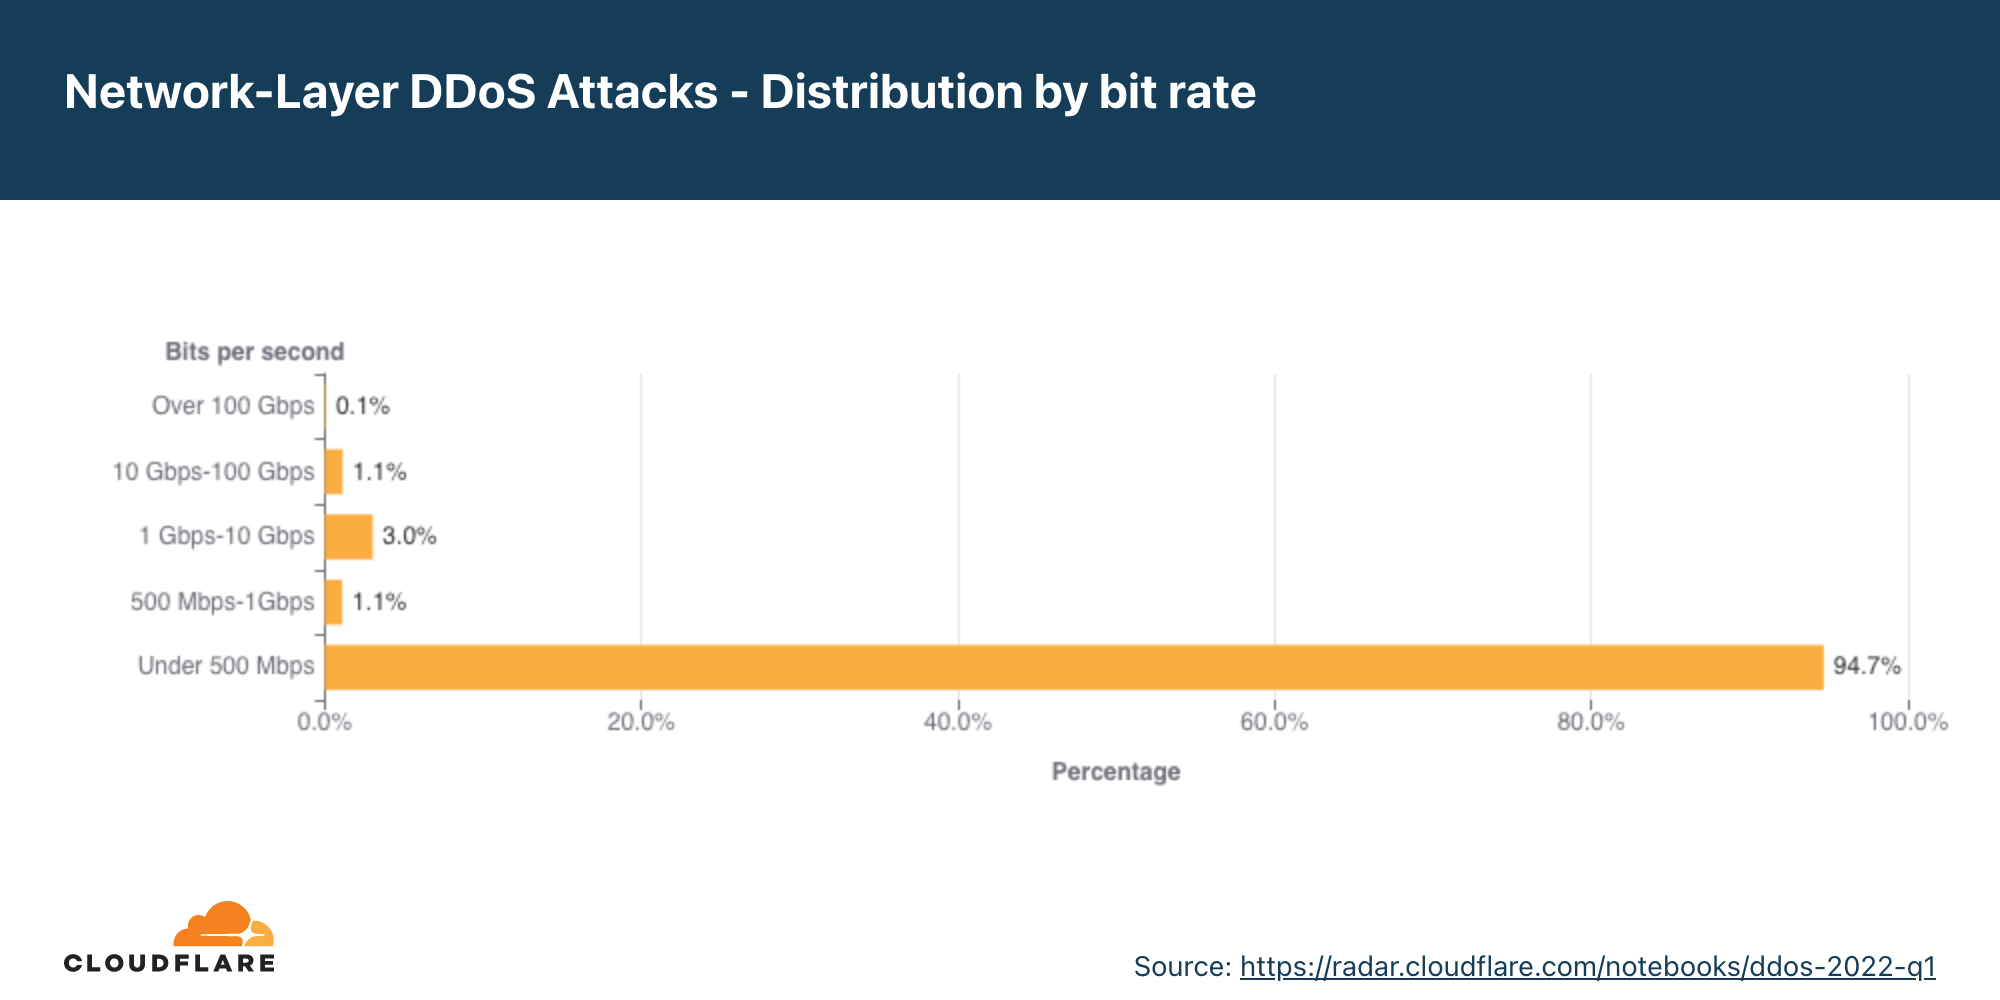
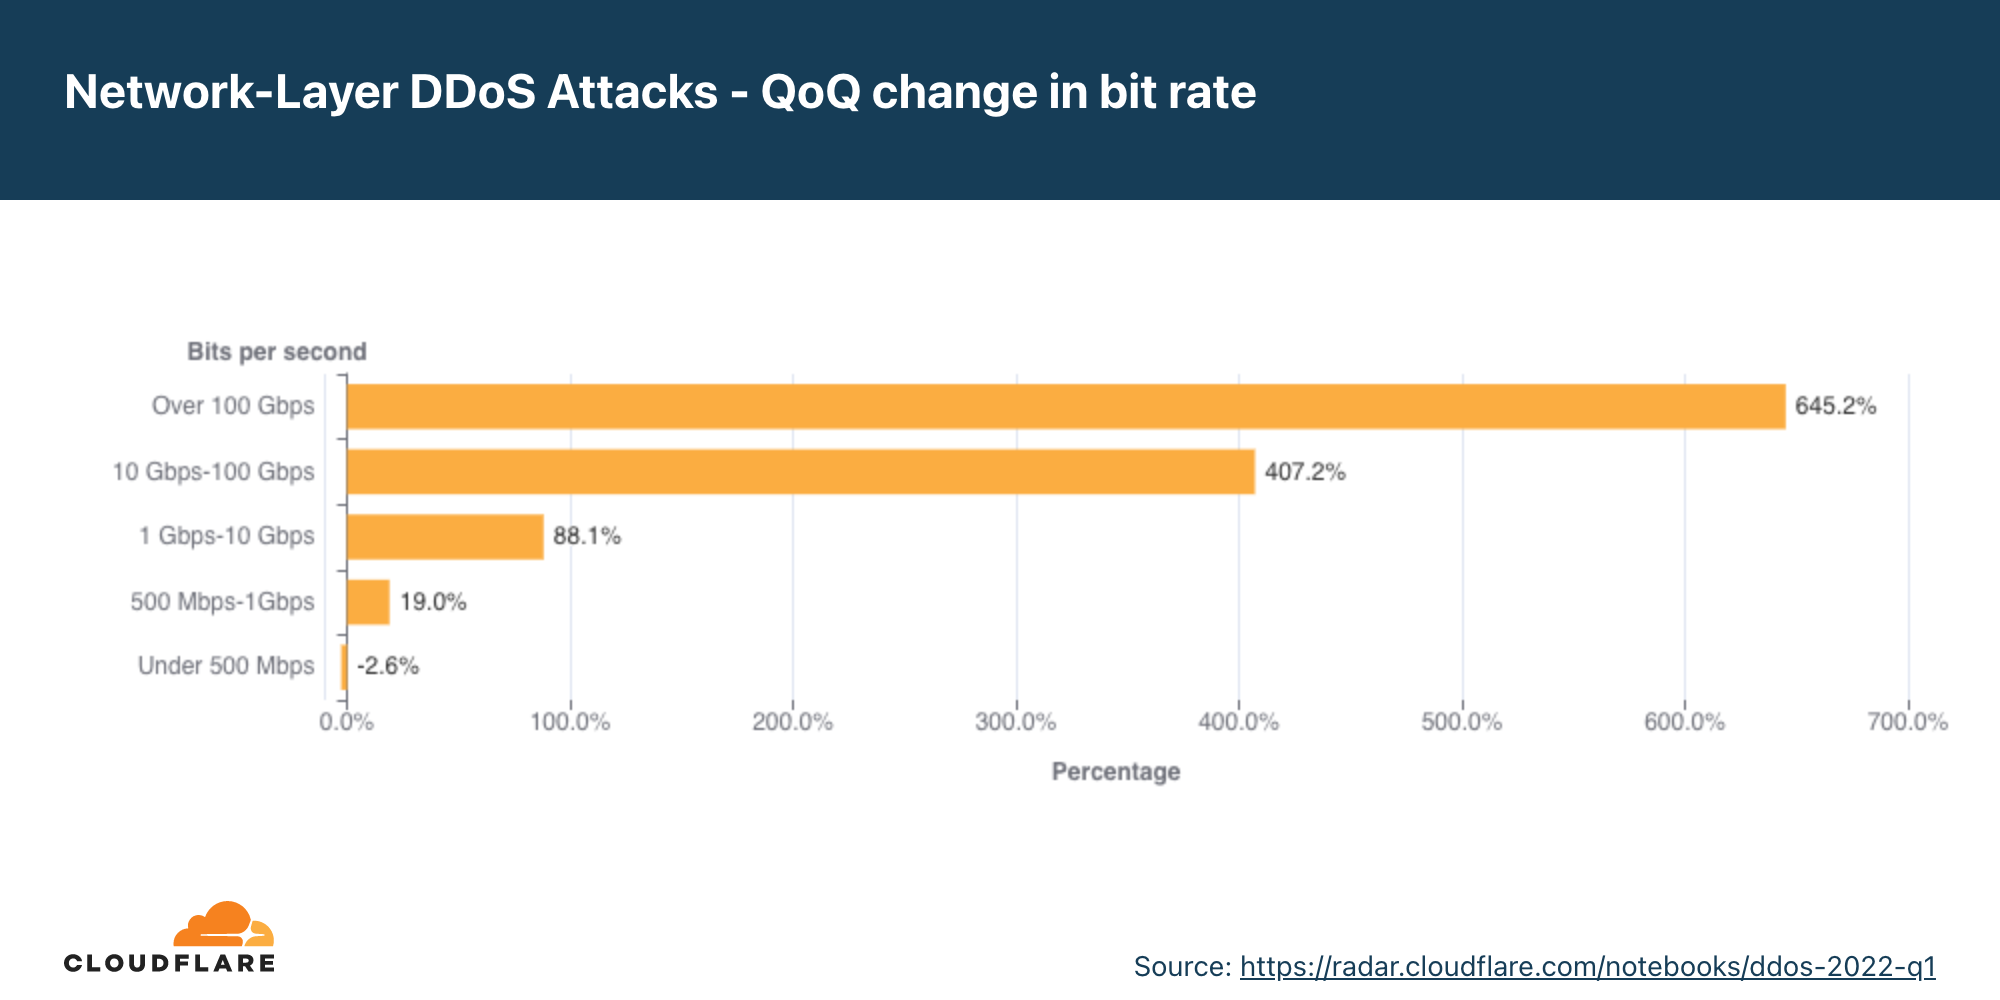
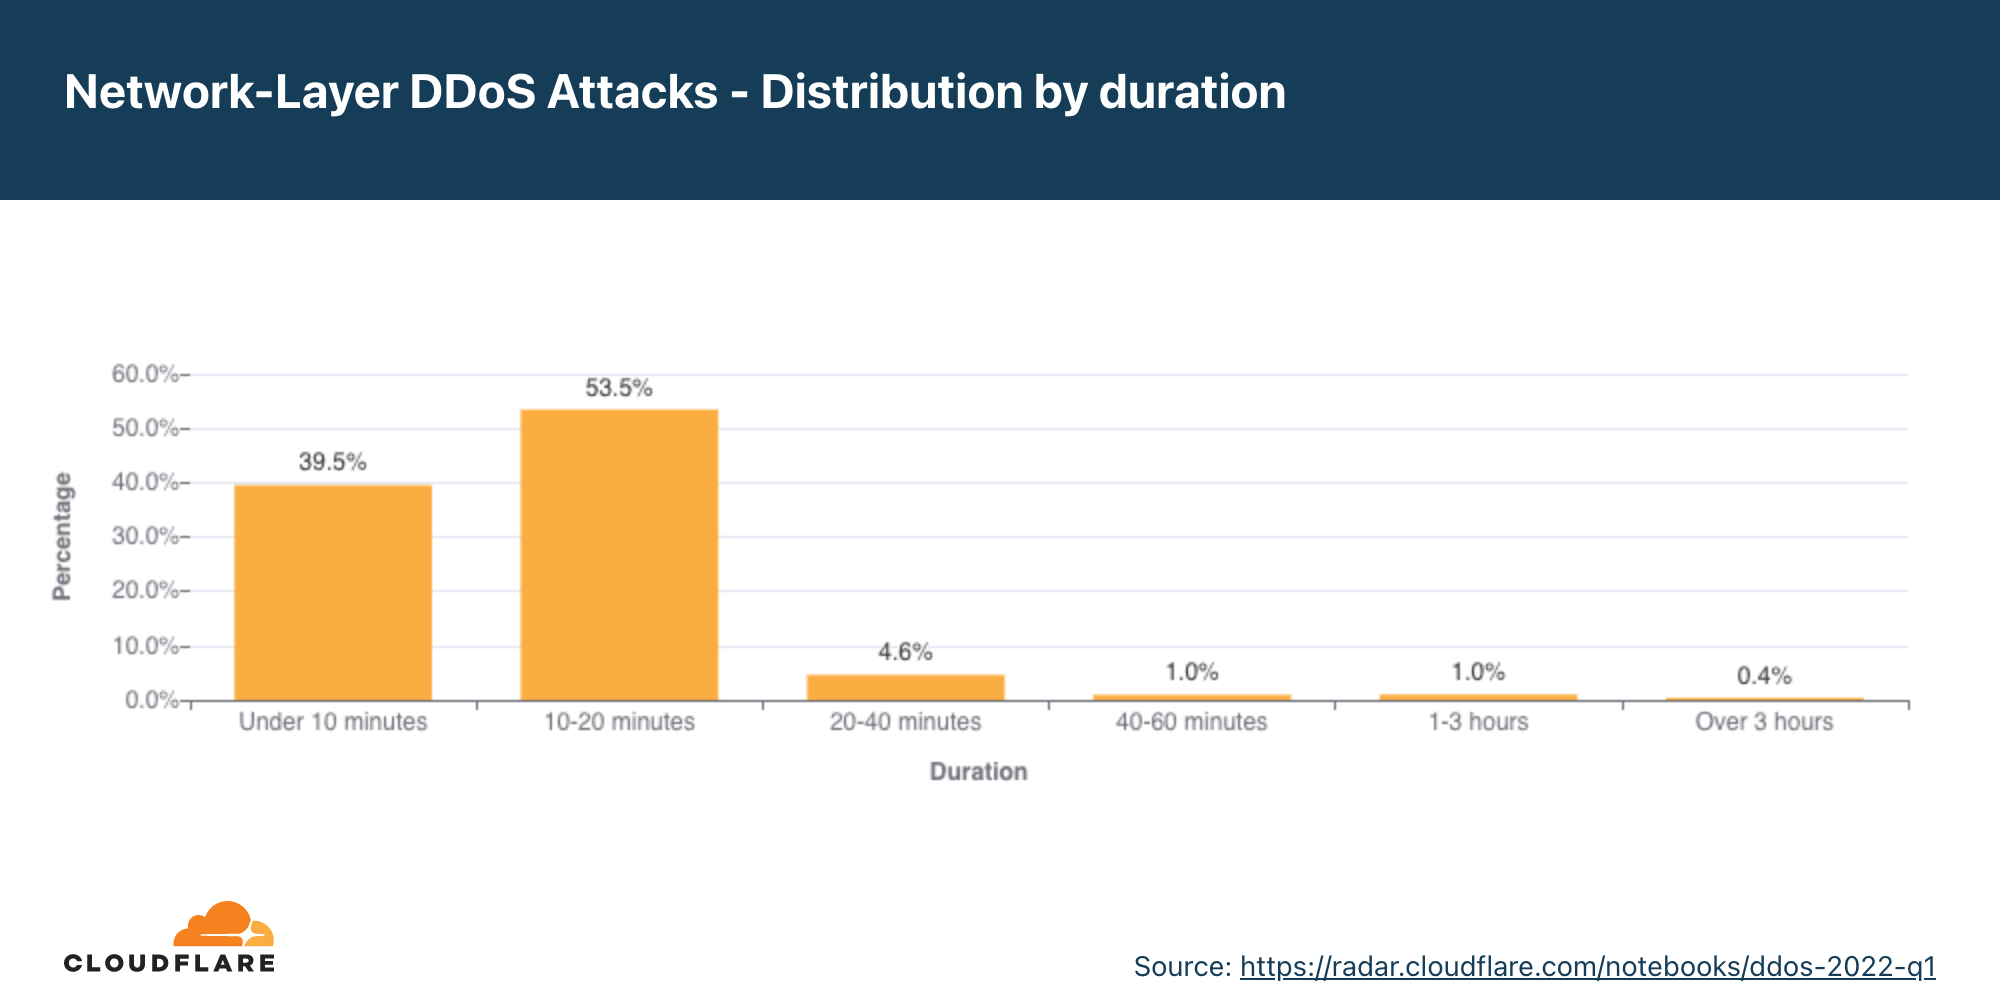