Post Syndicated from Radwa Radwan original https://blog.cloudflare.com/block-unsafe-llm-prompts-with-firewall-for-ai/
Security teams are racing to secure a new attack surface: AI-powered applications. From chatbots to search assistants, LLMs are already shaping customer experience, but they also open the door to new risks. A single malicious prompt can exfiltrate sensitive data, poison a model, or inject toxic content into customer-facing interactions, undermining user trust. Without guardrails, even the best-trained model can be turned against the business.
Today, as part of AI Week, we’re expanding our AI security offerings by introducing unsafe content moderation, now integrated directly into Cloudflare Firewall for AI. Built with Llama, this new feature allows customers to leverage their existing Firewall for AI engine for unified detection, analytics, and topic enforcement, providing real-time protection for Large Language Models (LLMs) at the network level. Now with just a few clicks, security and application teams can detect and block harmful prompts or topics at the edge — eliminating the need to modify application code or infrastructure.
This feature is immediately available to current Firewall for AI users. Those not yet onboarded can contact their account team to participate in the beta program.
Cloudflare’s Firewall for AI protects user-facing LLM applications from abuse and data leaks, addressing several of the OWASP Top 10 LLM risks such as prompt injection, PII disclosure, and unbound consumption. It also extends protection to other risks such as unsafe or harmful content.
Unlike built-in controls that vary between model providers, Firewall for AI is model-agnostic. It sits in front of any model you choose, whether it’s from a third party like OpenAI or Gemini, one you run in-house, or a custom model you have built, and applies the same consistent protections.
Just like our origin-agnostic Application Security suite, Firewall for AI enforces policies at scale across all your models, creating a unified security layer. That means you can define guardrails once and apply them everywhere. For example, a financial services company might require its LLM to only respond to finance-related questions, while blocking prompts about unrelated or sensitive topics, enforced consistently across every model in use.
Effective AI moderation is more than blocking “bad words”, it’s about setting boundaries that protect users, meeting legal obligations, and preserving brand integrity, without over-moderating in ways that silence important voices.
Because LLMs cannot be fully scripted, their interactions are inherently unpredictable. This flexibility enables rich user experiences but also opens the door to abuse.
Key risks from unsafe prompts include misinformation, biased or offensive content, and model poisoning, where repeated harmful prompts degrade the quality and safety of future outputs. Blocking these prompts aligns with the OWASP Top 10 for LLMs, preventing both immediate misuse and long-term degradation.
One example of this is Microsoft’s Tay chatbot. Trolls deliberately submitted toxic, racist, and offensive prompts, which Tay quickly began repeating. The failure was not only in Tay’s responses; it was in the lack of moderation on the inputs it accepted.
Cloudflare has integrated Llama Guard directly into Firewall for AI. This brings AI input moderation into the same rules engine our customers already use to protect their applications. It uses the same approach that we created for developers building with AI in our AI Gateway product.
Llama Guard analyzes prompts in real time and flags them across multiple safety categories, including hate, violence, sexual content, criminal planning, self-harm, and more.
With this integration, Firewall for AI not only discovers LLM traffic endpoints automatically, but also enables security and AI teams to take immediate action. Unsafe prompts can be blocked before they reach the model, while flagged content can be logged or reviewed for oversight and tuning. Content safety checks can also be combined with other Application Security protections, such as Bot Management and Rate Limiting, to create layered defenses when protecting your model.
The result is a single, edge-native policy layer that enforces guardrails before unsafe prompts ever reach your infrastructure — without needing complex integrations.
Before diving into the architecture of Firewall for AI engine and how it fits within our previously mentioned module to detect PII in the prompts, let’s start with how we detect unsafe topics.
A key challenge in building safety guardrails is balancing a good detection with model helpfulness. If detection is too broad, it can prevent a model from answering legitimate user questions, hurting its utility. This is especially difficult for topic detection because of the ambiguity and dynamic nature of human language, where context is fundamental to meaning.
Simple approaches like keyword blocklists are interesting for precise subjects — but insufficient. They are easily bypassed and fail to understand the context in which words are used, leading to poor recall. Older probabilistic models such as Latent Dirichlet Allocation (LDA) were an improvement, but did not properly account for word ordering and other contextual nuances.
Recent advancements in LLMs introduced a new paradigm. Their ability to perform zero-shot or few-shot classification is uniquely suited for the task of topic detection. For this reason, we chose Llama Guard 3, an open-source model based on the Llama architecture that is specifically fine-tuned for content safety classification. When it analyzes a prompt, it answers whether the text is safe or unsafe, and provides a specific category. We are showing the default categories, as listed here. Because Llama 3 has a fixed knowledge cutoff, certain categories — like defamation or elections — are time-sensitive. As a result, the model may not fully capture events or context that emerged after it was trained, and that’s important to keep in mind when relying on it.
For now, we cover the 13 default categories. We plan to expand coverage in the future, leveraging the model’s zero-shot capabilities.
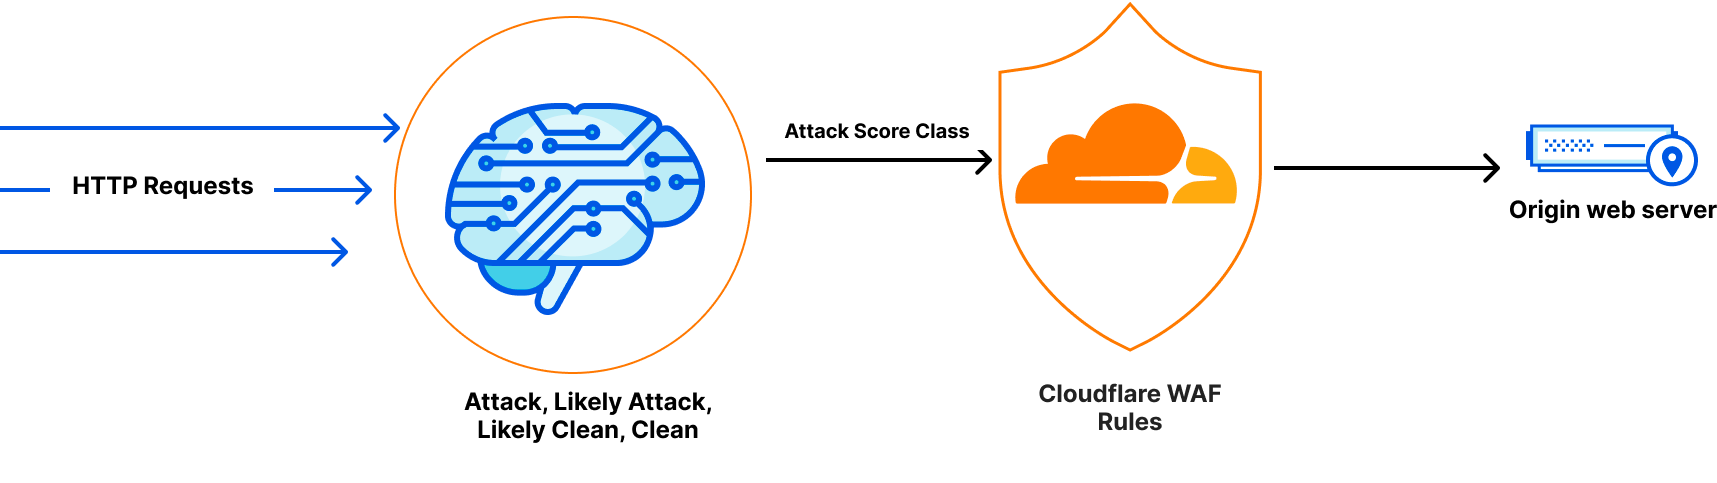
We designed Firewall for AI to scale without adding noticeable latency, including Llama Guard, and this remains true even as we add new detection models.
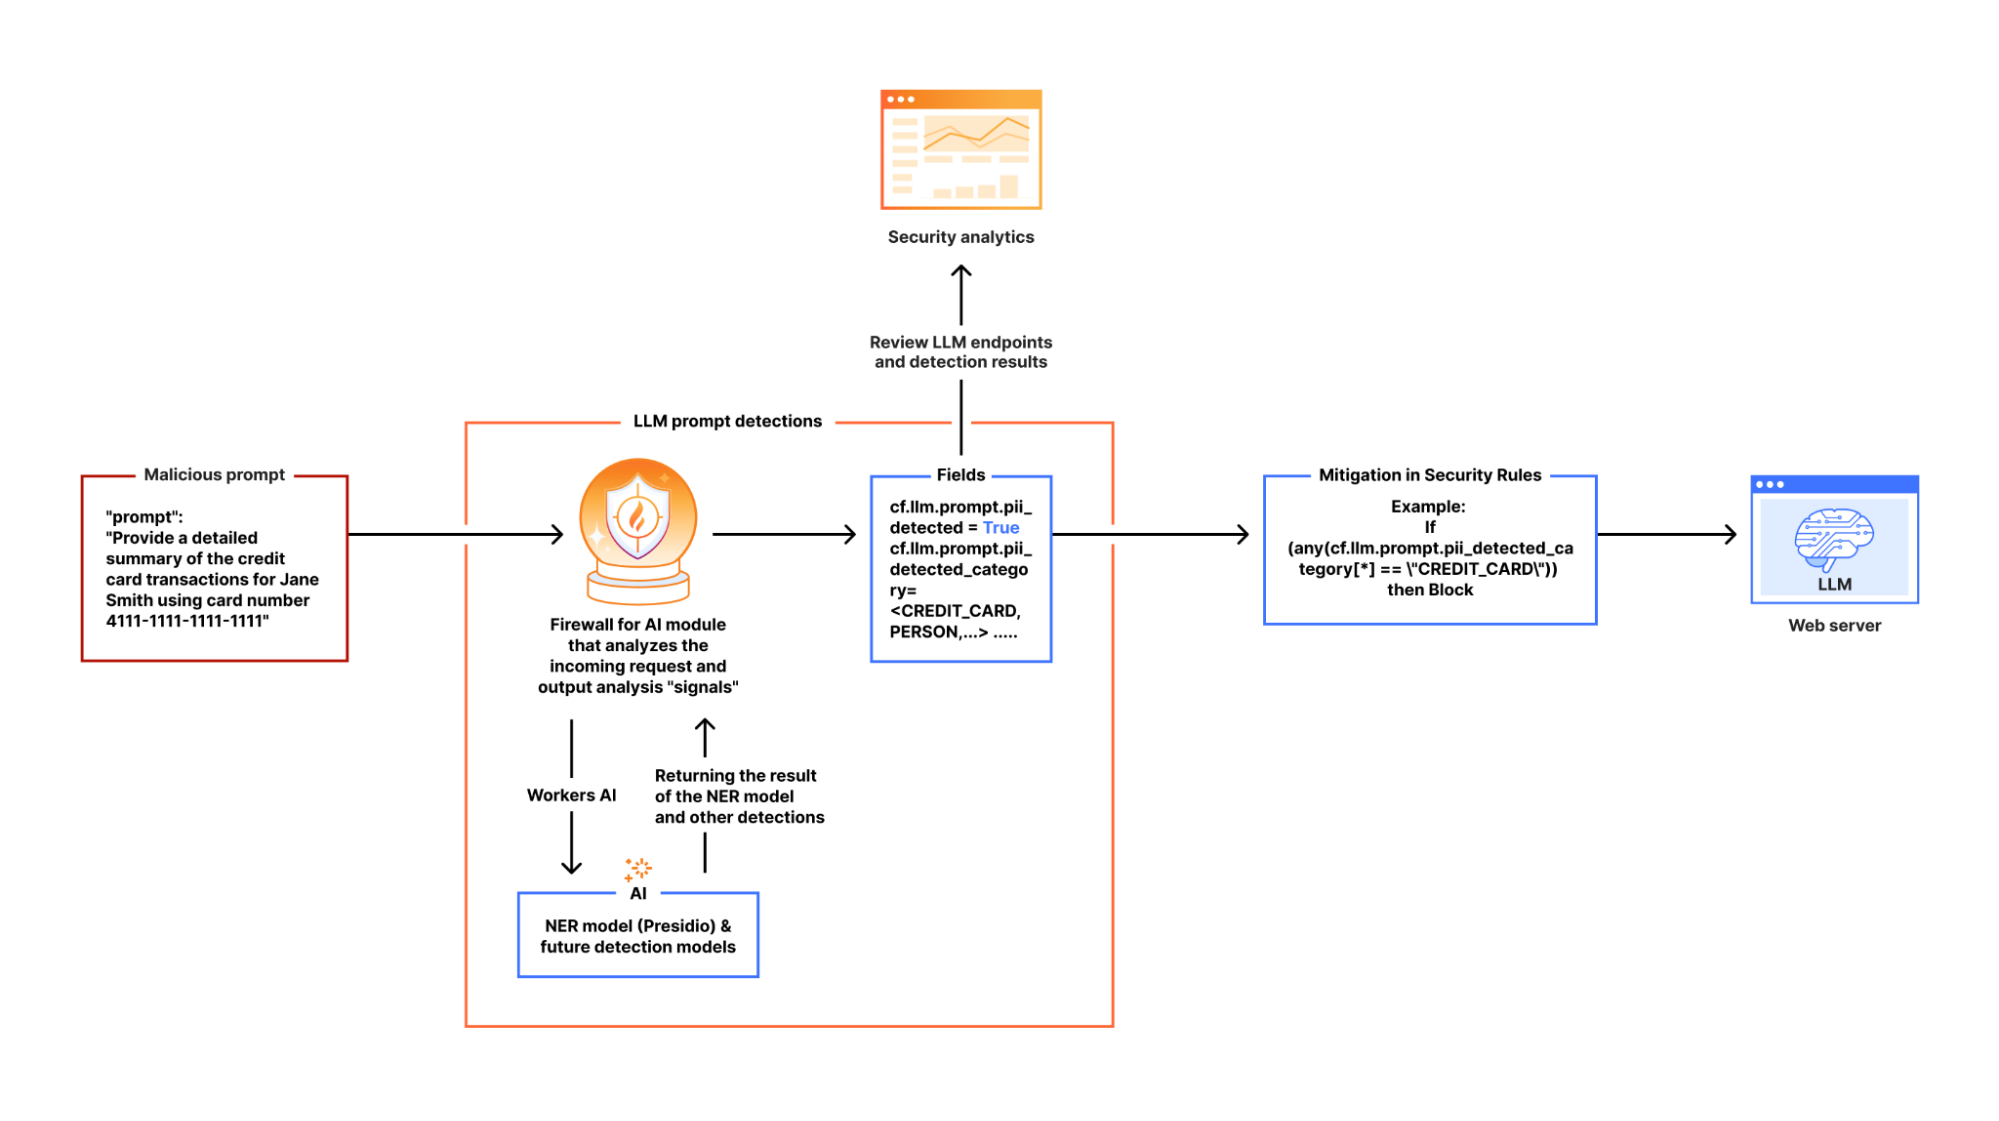
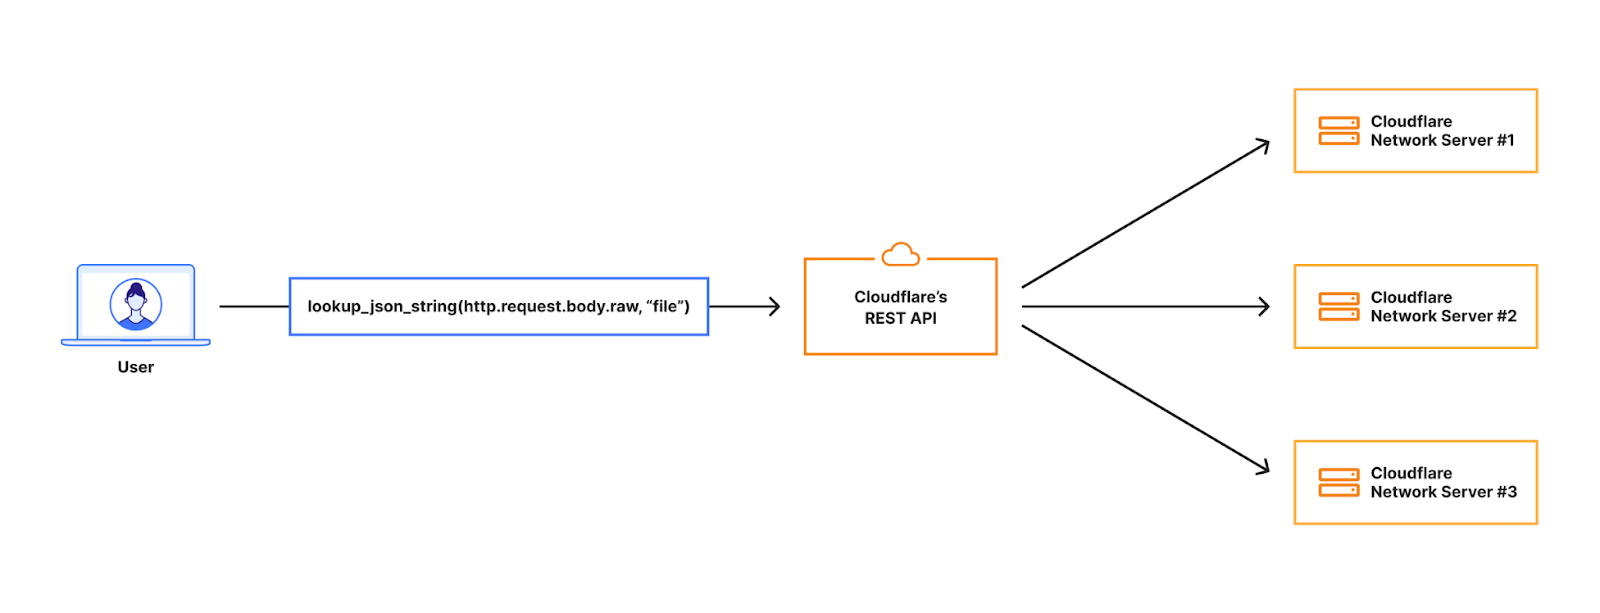
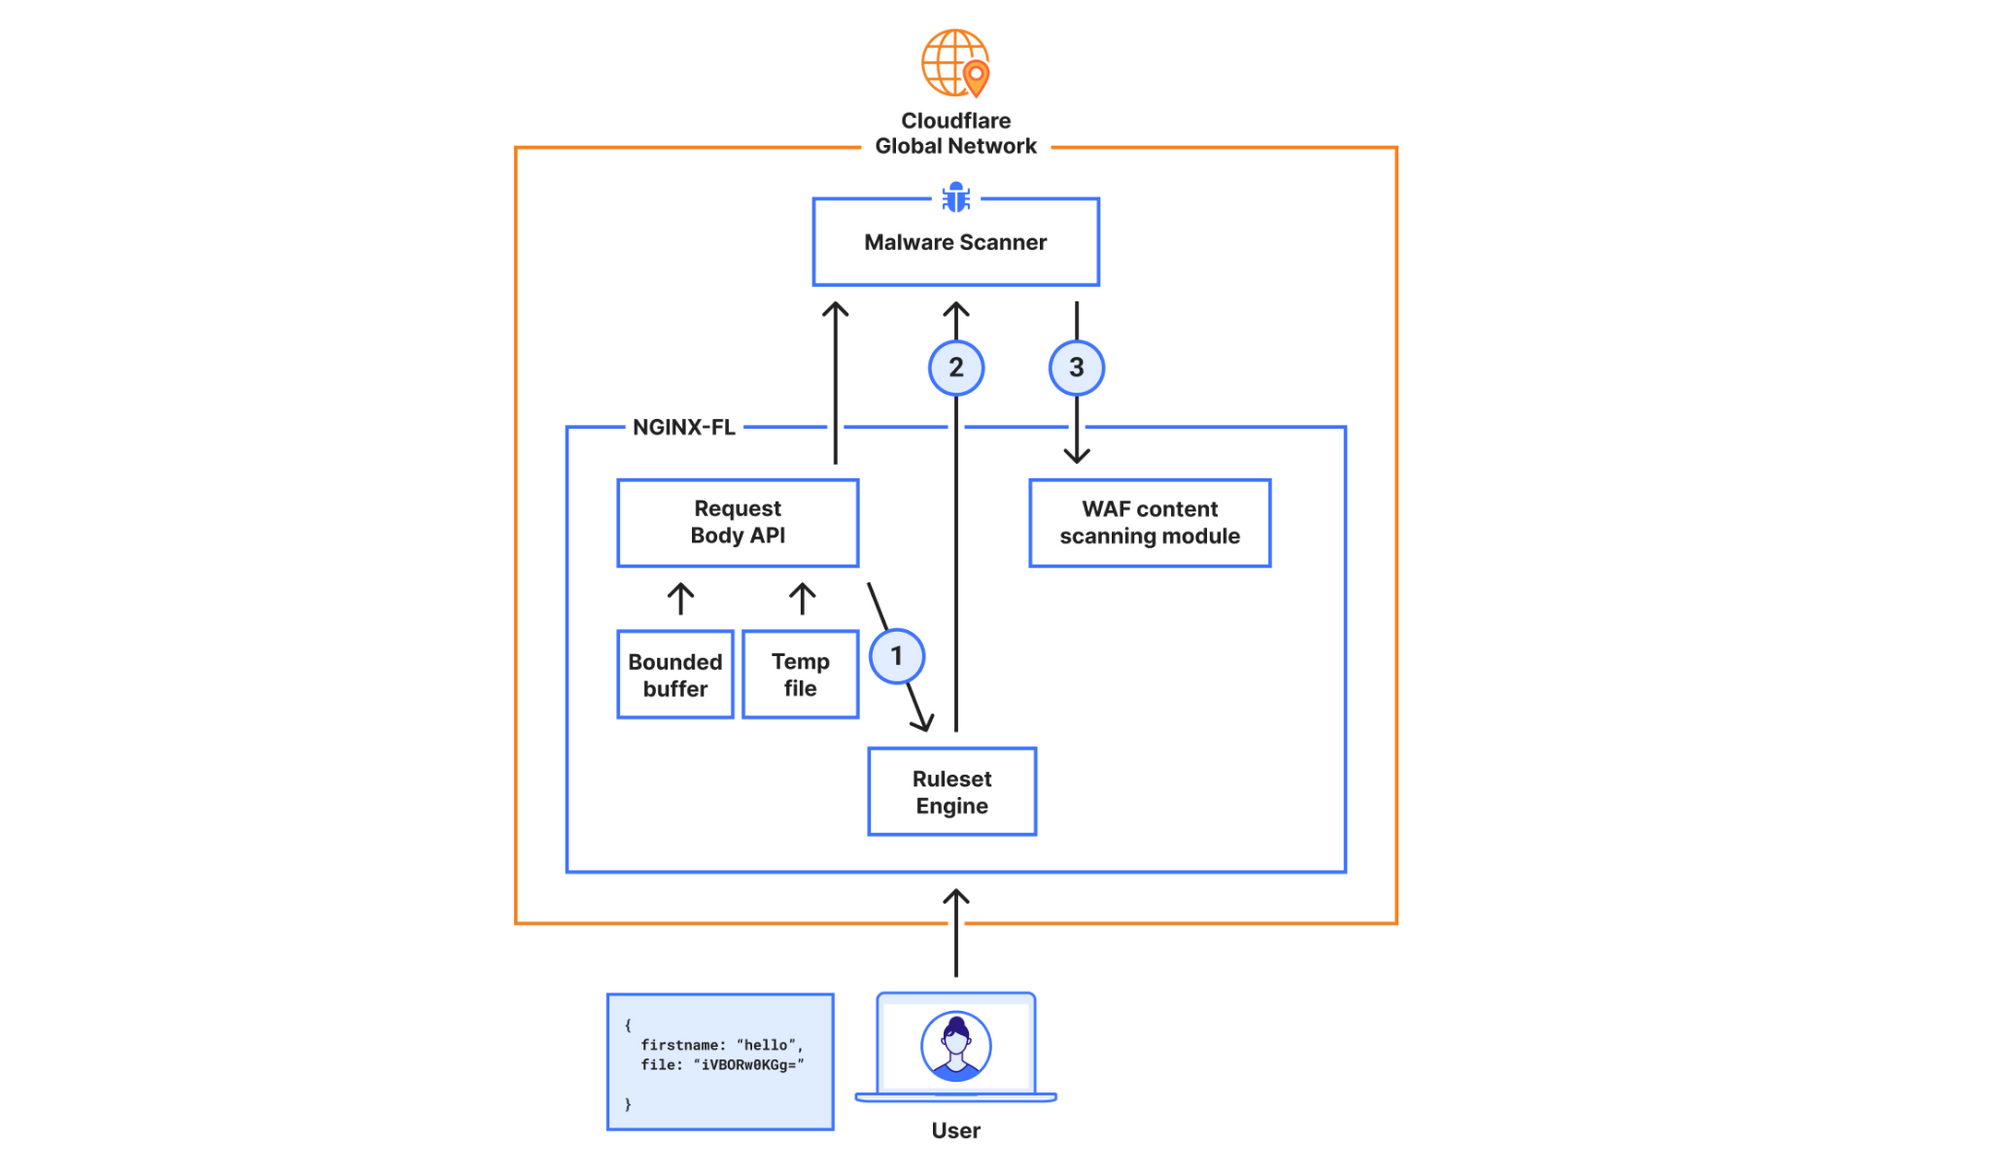
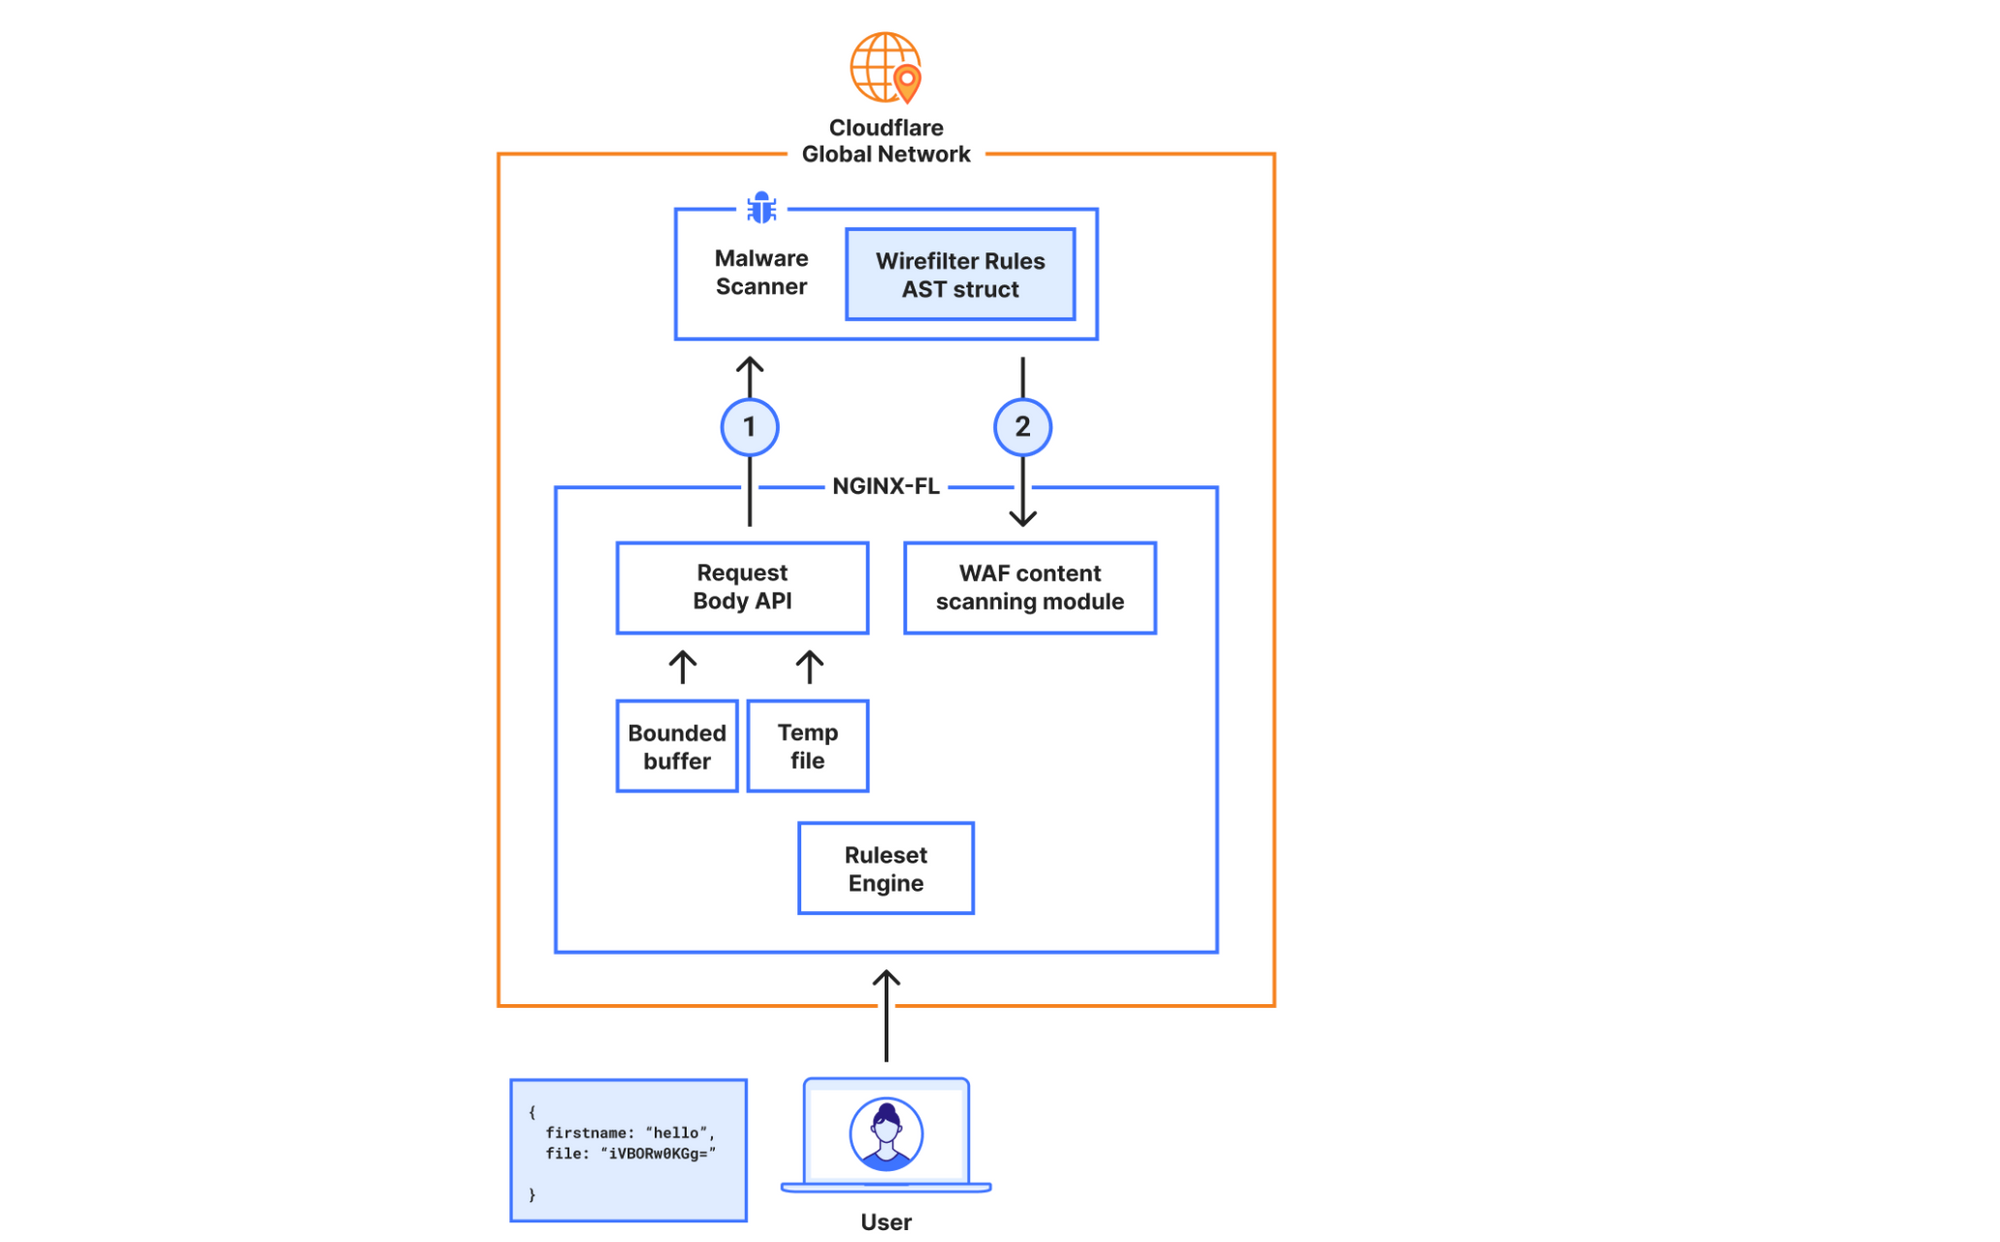
To achieve this, we built a new asynchronous architecture. When a request is sent to an application protected by Firewall for AI, a Cloudflare Worker makes parallel, non-blocking requests to our different detection modules — one for PII, one for unsafe topics, and others as we add them.
Thanks to the Cloudflare network, this design scales to handle high request volumes out of the box, and latency does not increase as we add new detections. It will only be bounded by the slowest model used.

We optimize to keep the model utility at its maximum while keeping the guardrail detection broad enough.
Llama Guard is a rather large model, so running it at scale with minimal latency is a challenge. We deploy it on Workers AI, leveraging our large fleet of high performance GPUs. This infrastructure ensures we can offer fast, reliable inference throughout our network.
To ensure the system remains fast and reliable as adoption grows, we ran extensive load tests simulating the requests per second (RPS) we anticipate, using a wide range of prompt sizes to prepare for real-world traffic. To handle this, the number of model instances deployed on our network scales automatically with the load. We employ concurrency to minimize latency and optimize for hardware utilization. We also enforce a hard 2-second threshold for each analysis; if this time limit is reached, we fall back to any detections already completed, ensuring your application’s requests latency is never further impacted.
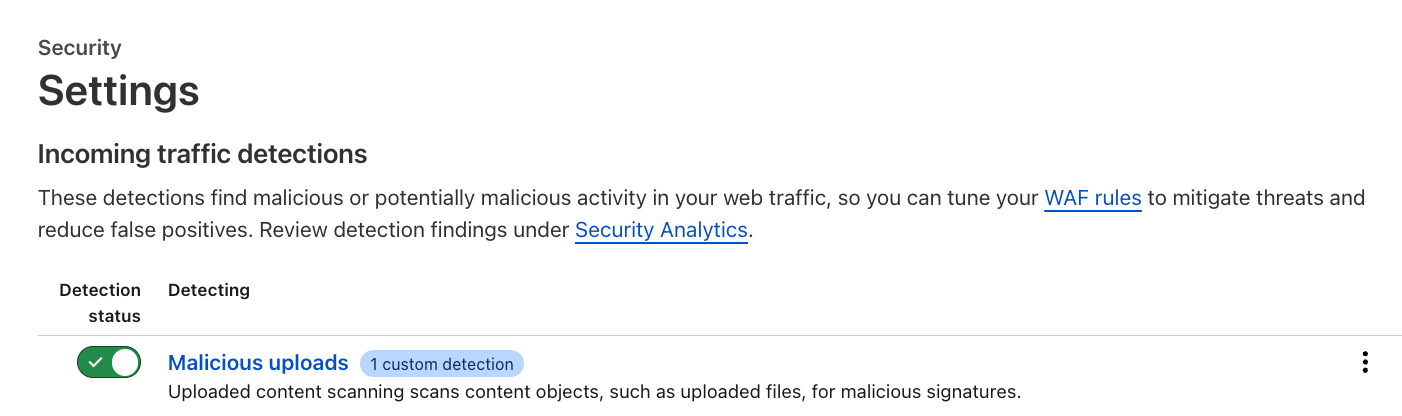
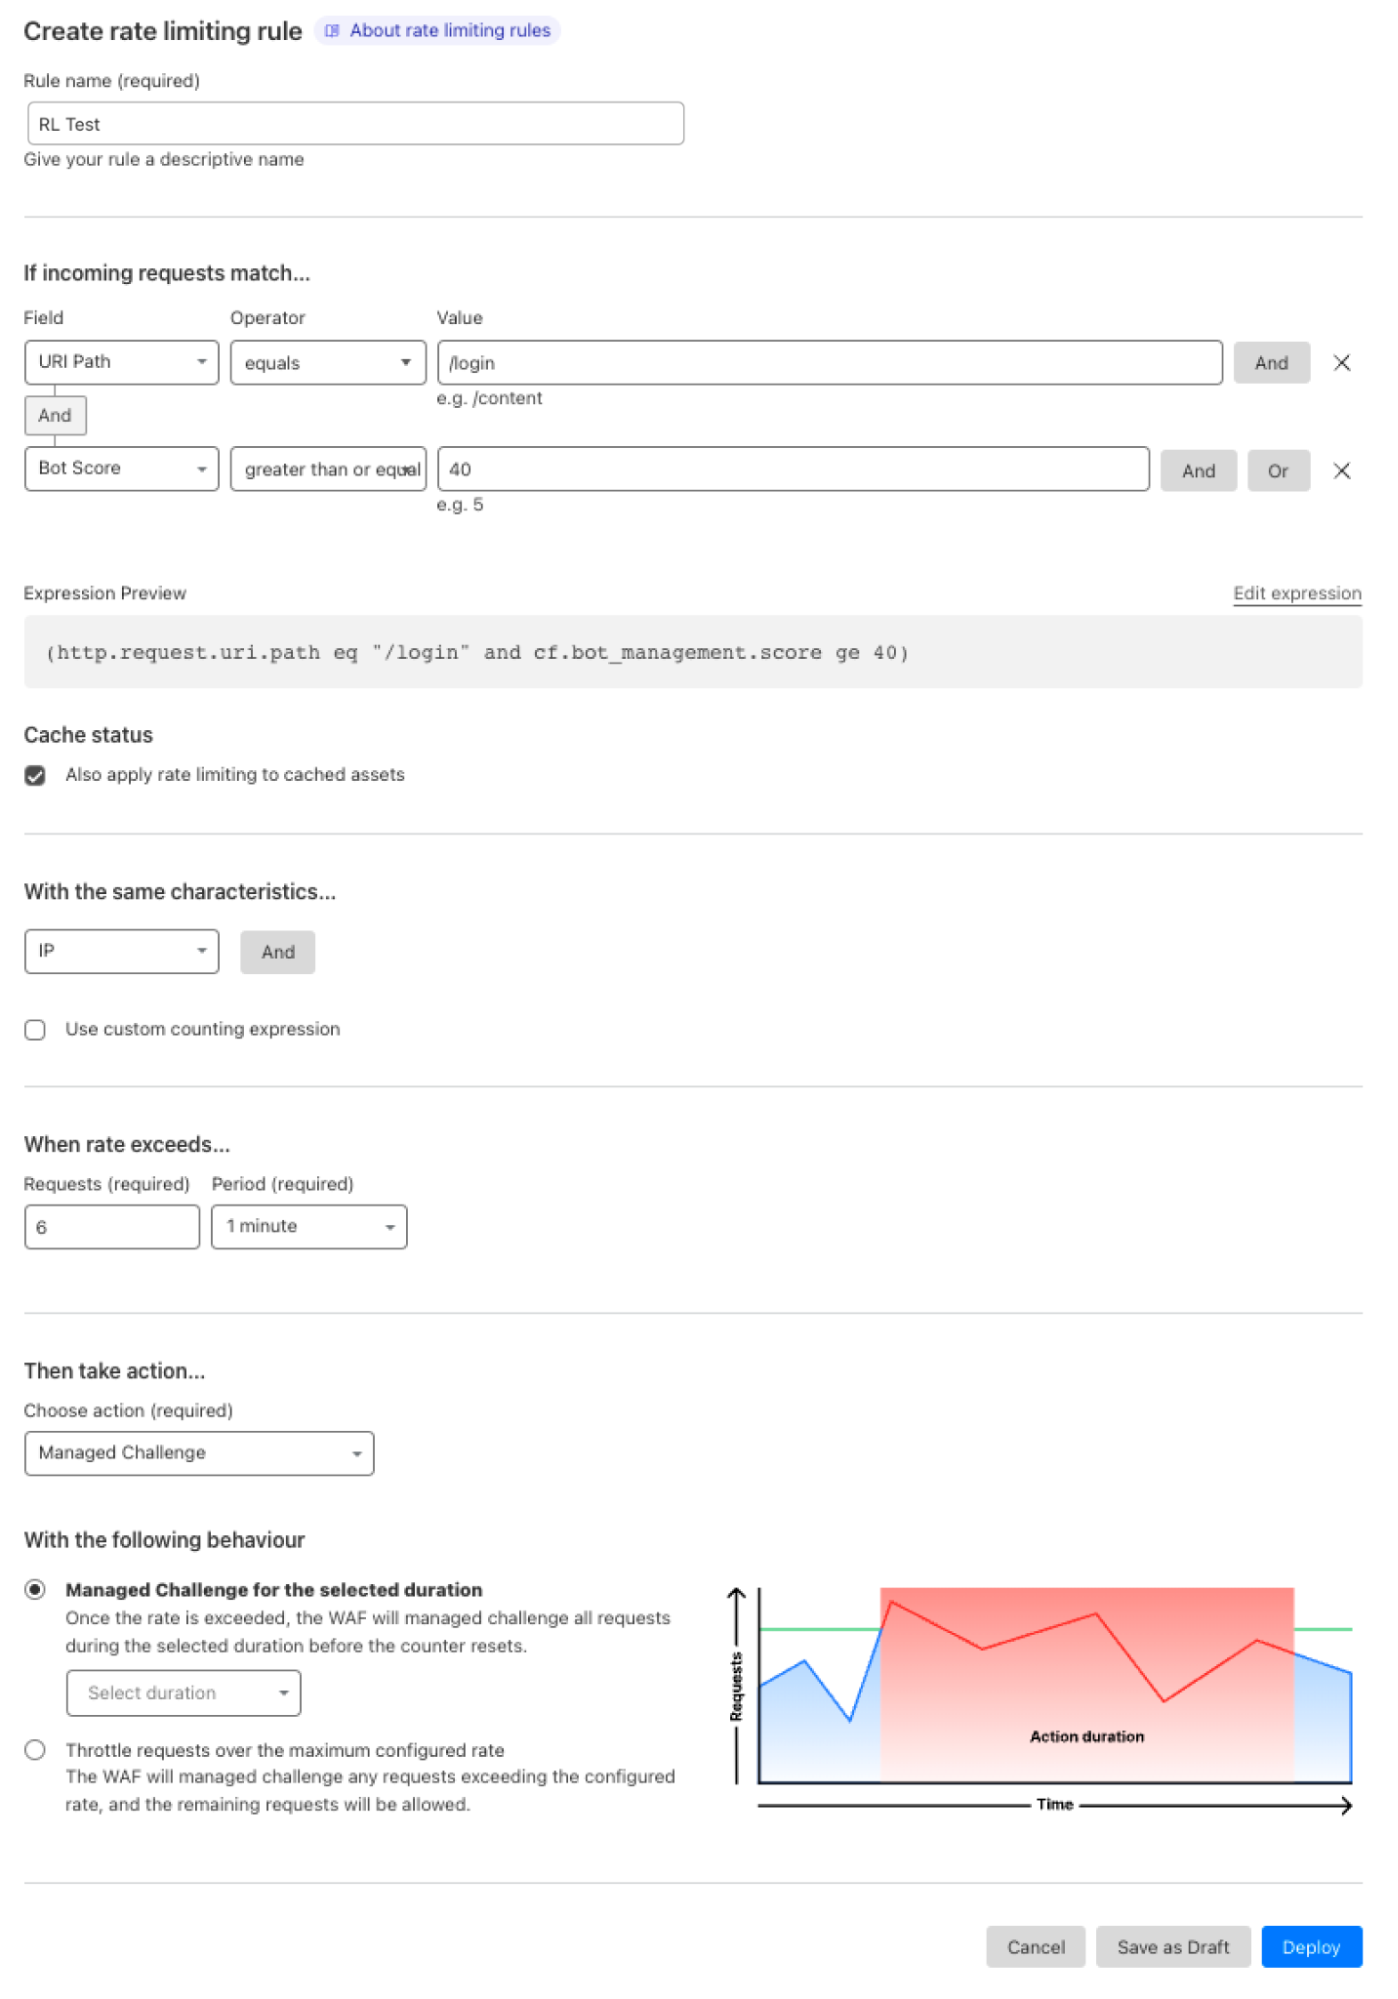
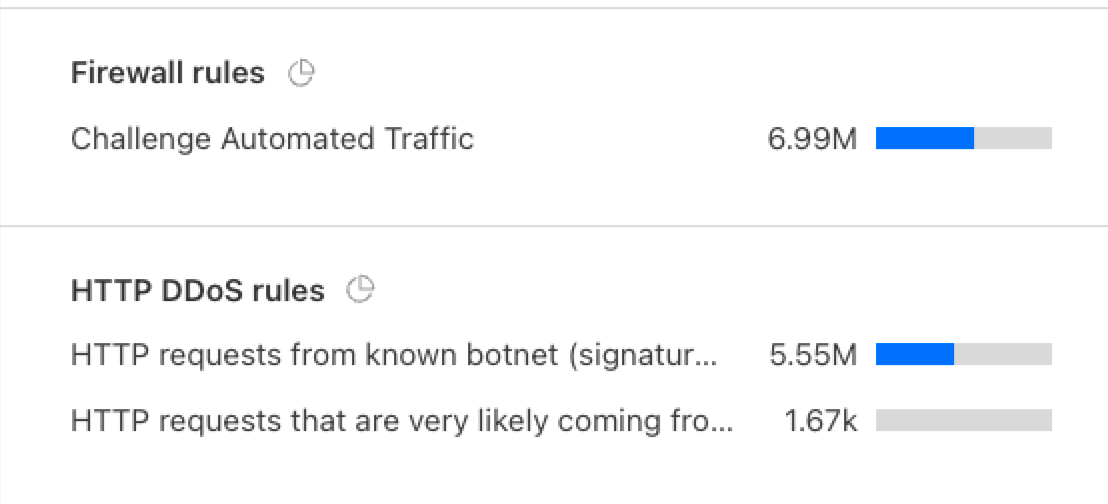
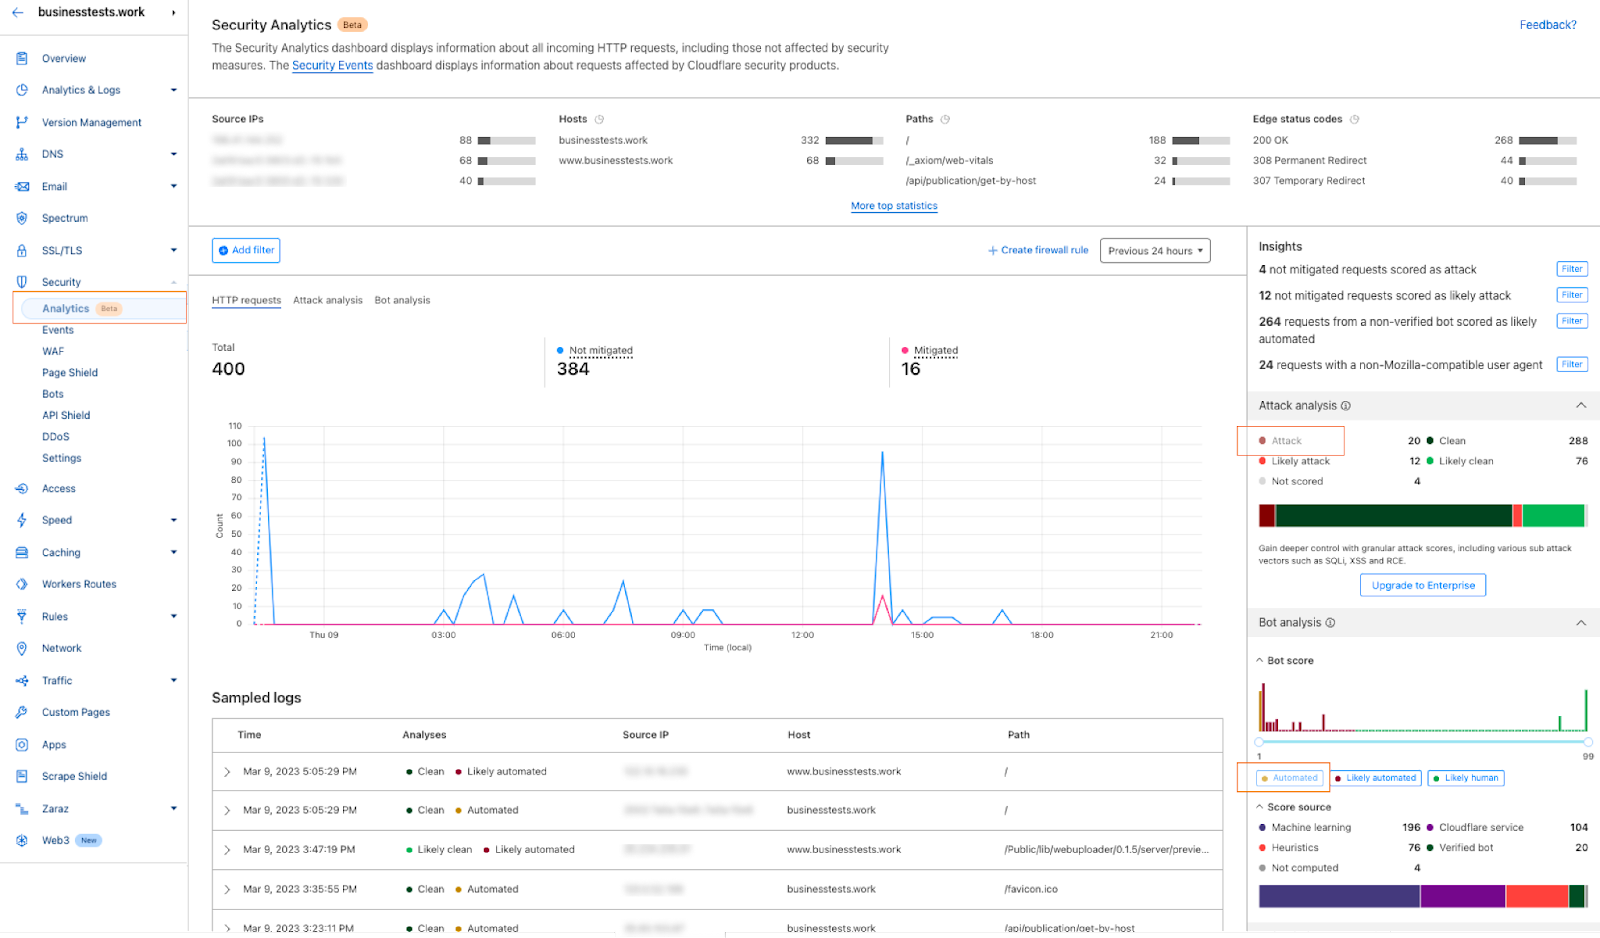
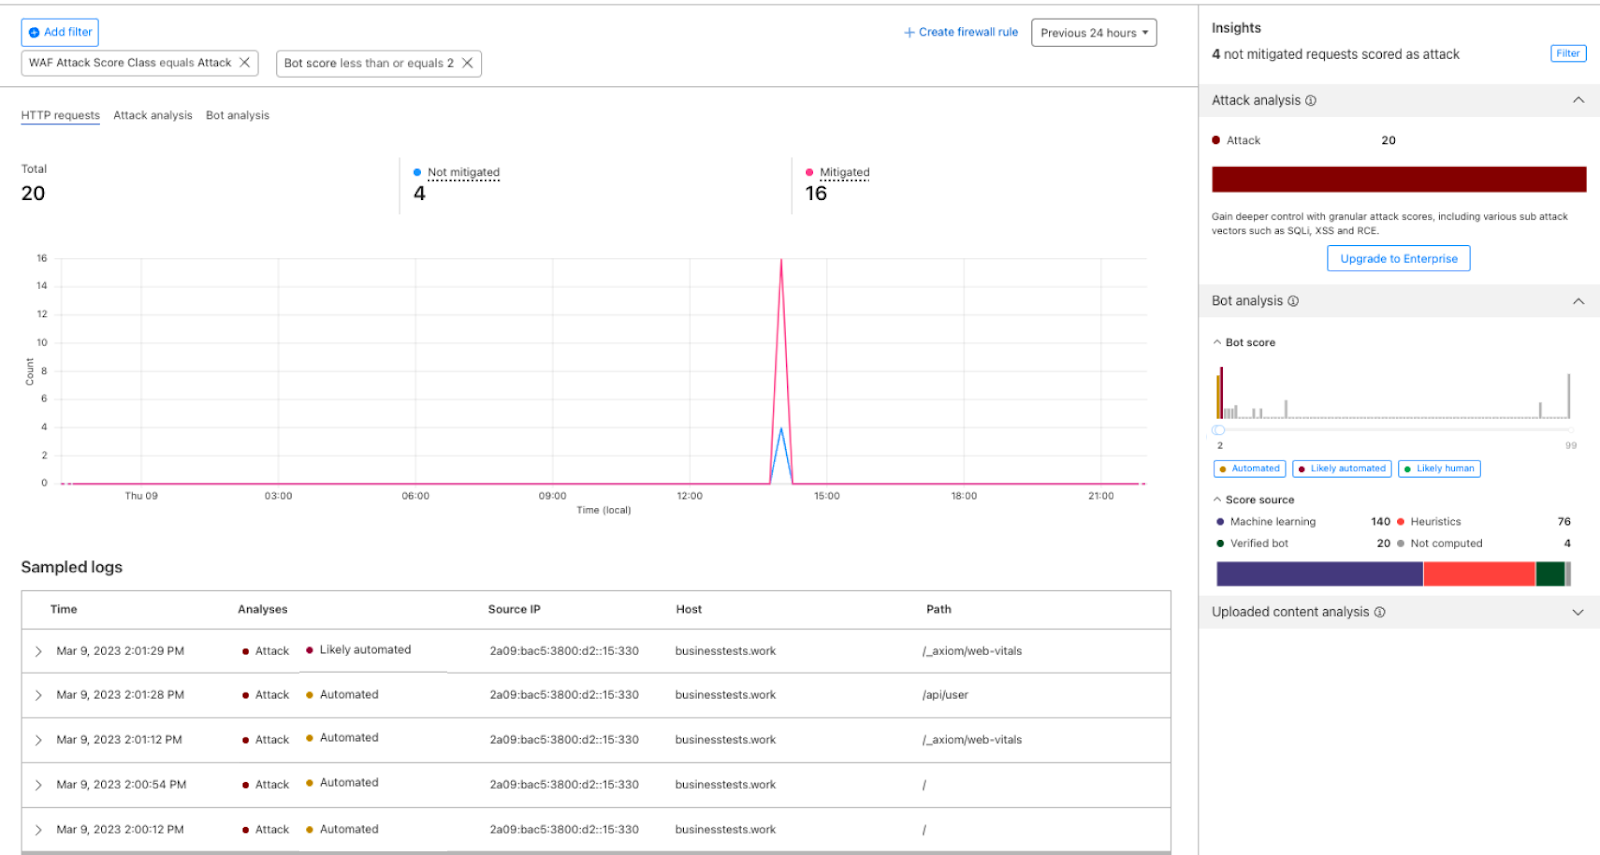
Firewall for AI follows the same familiar pattern as other Application Security features like Bot Management and WAF Attack Score, making it easy to adopt.
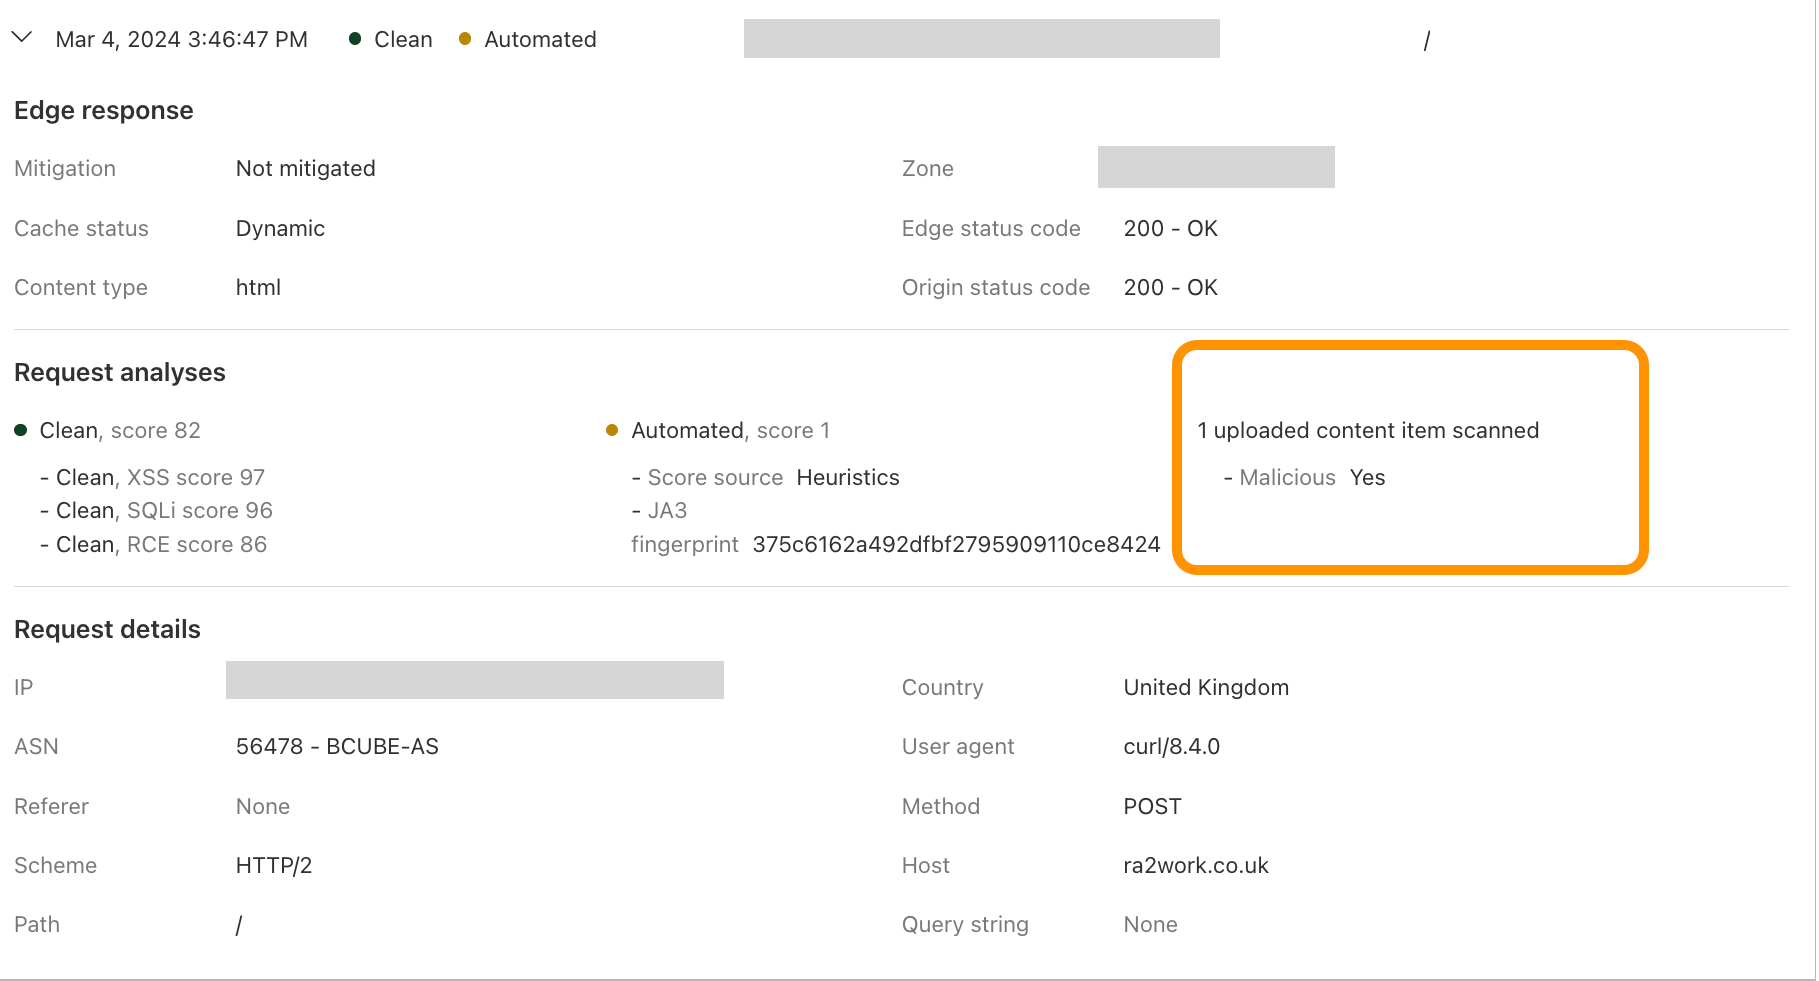
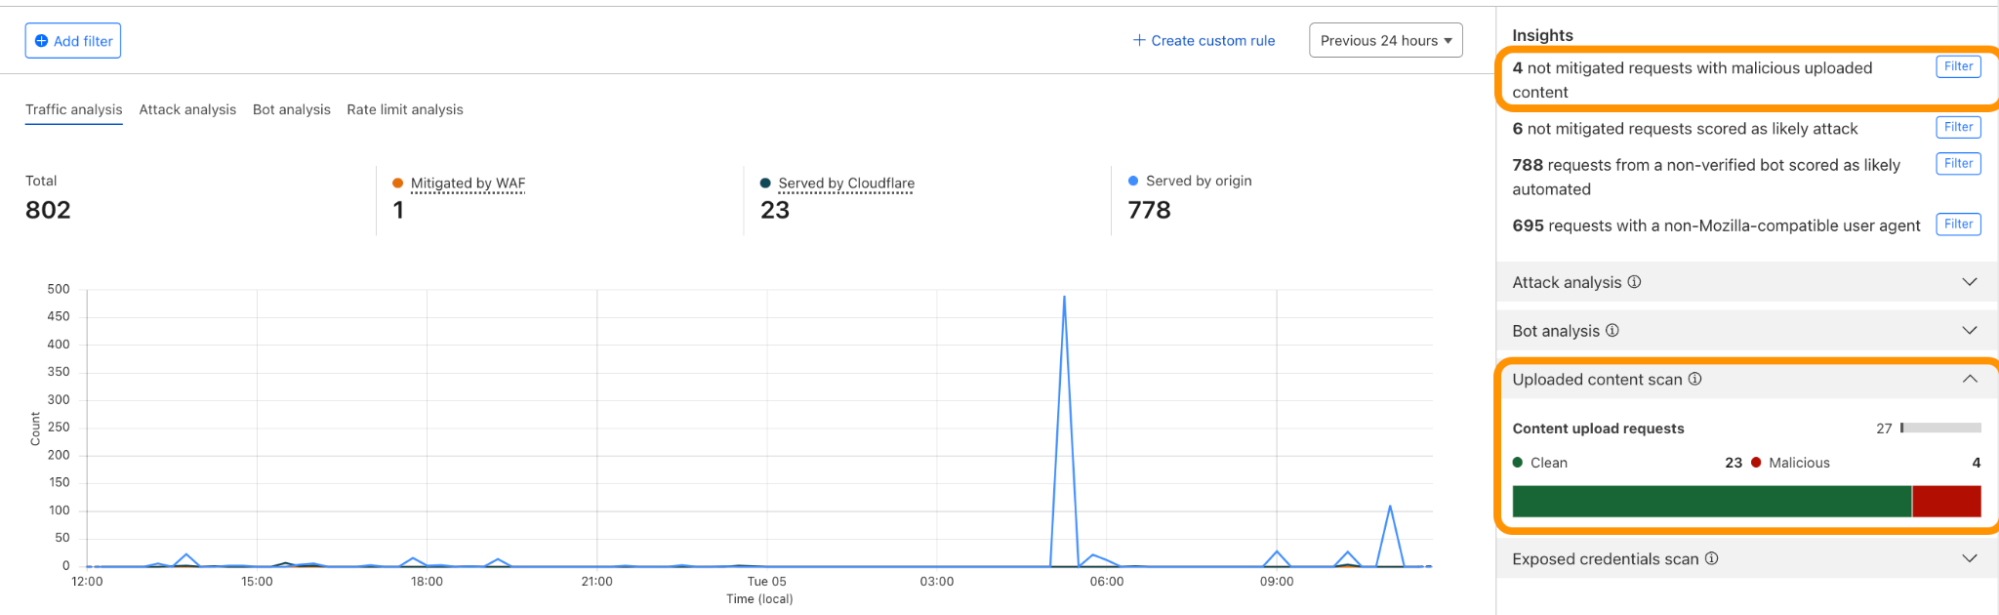
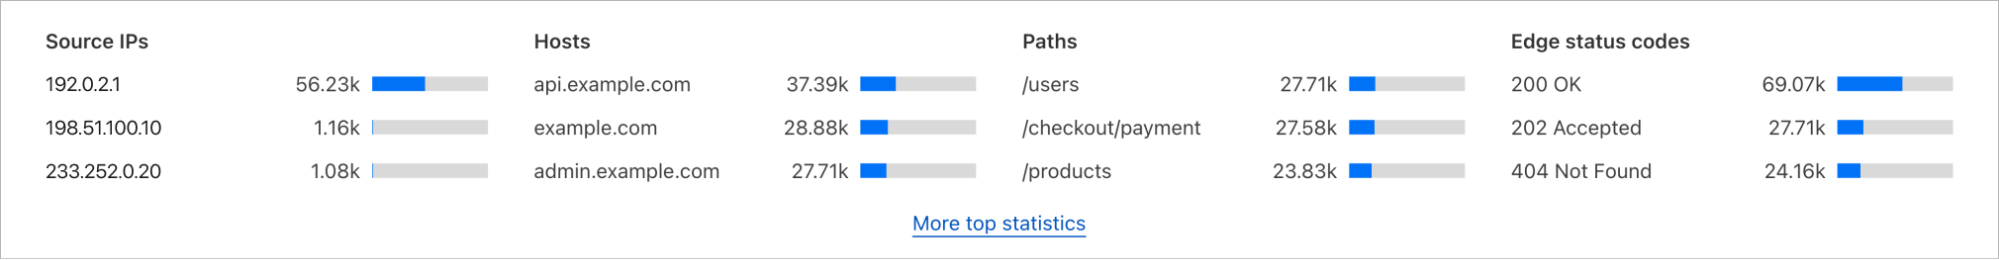
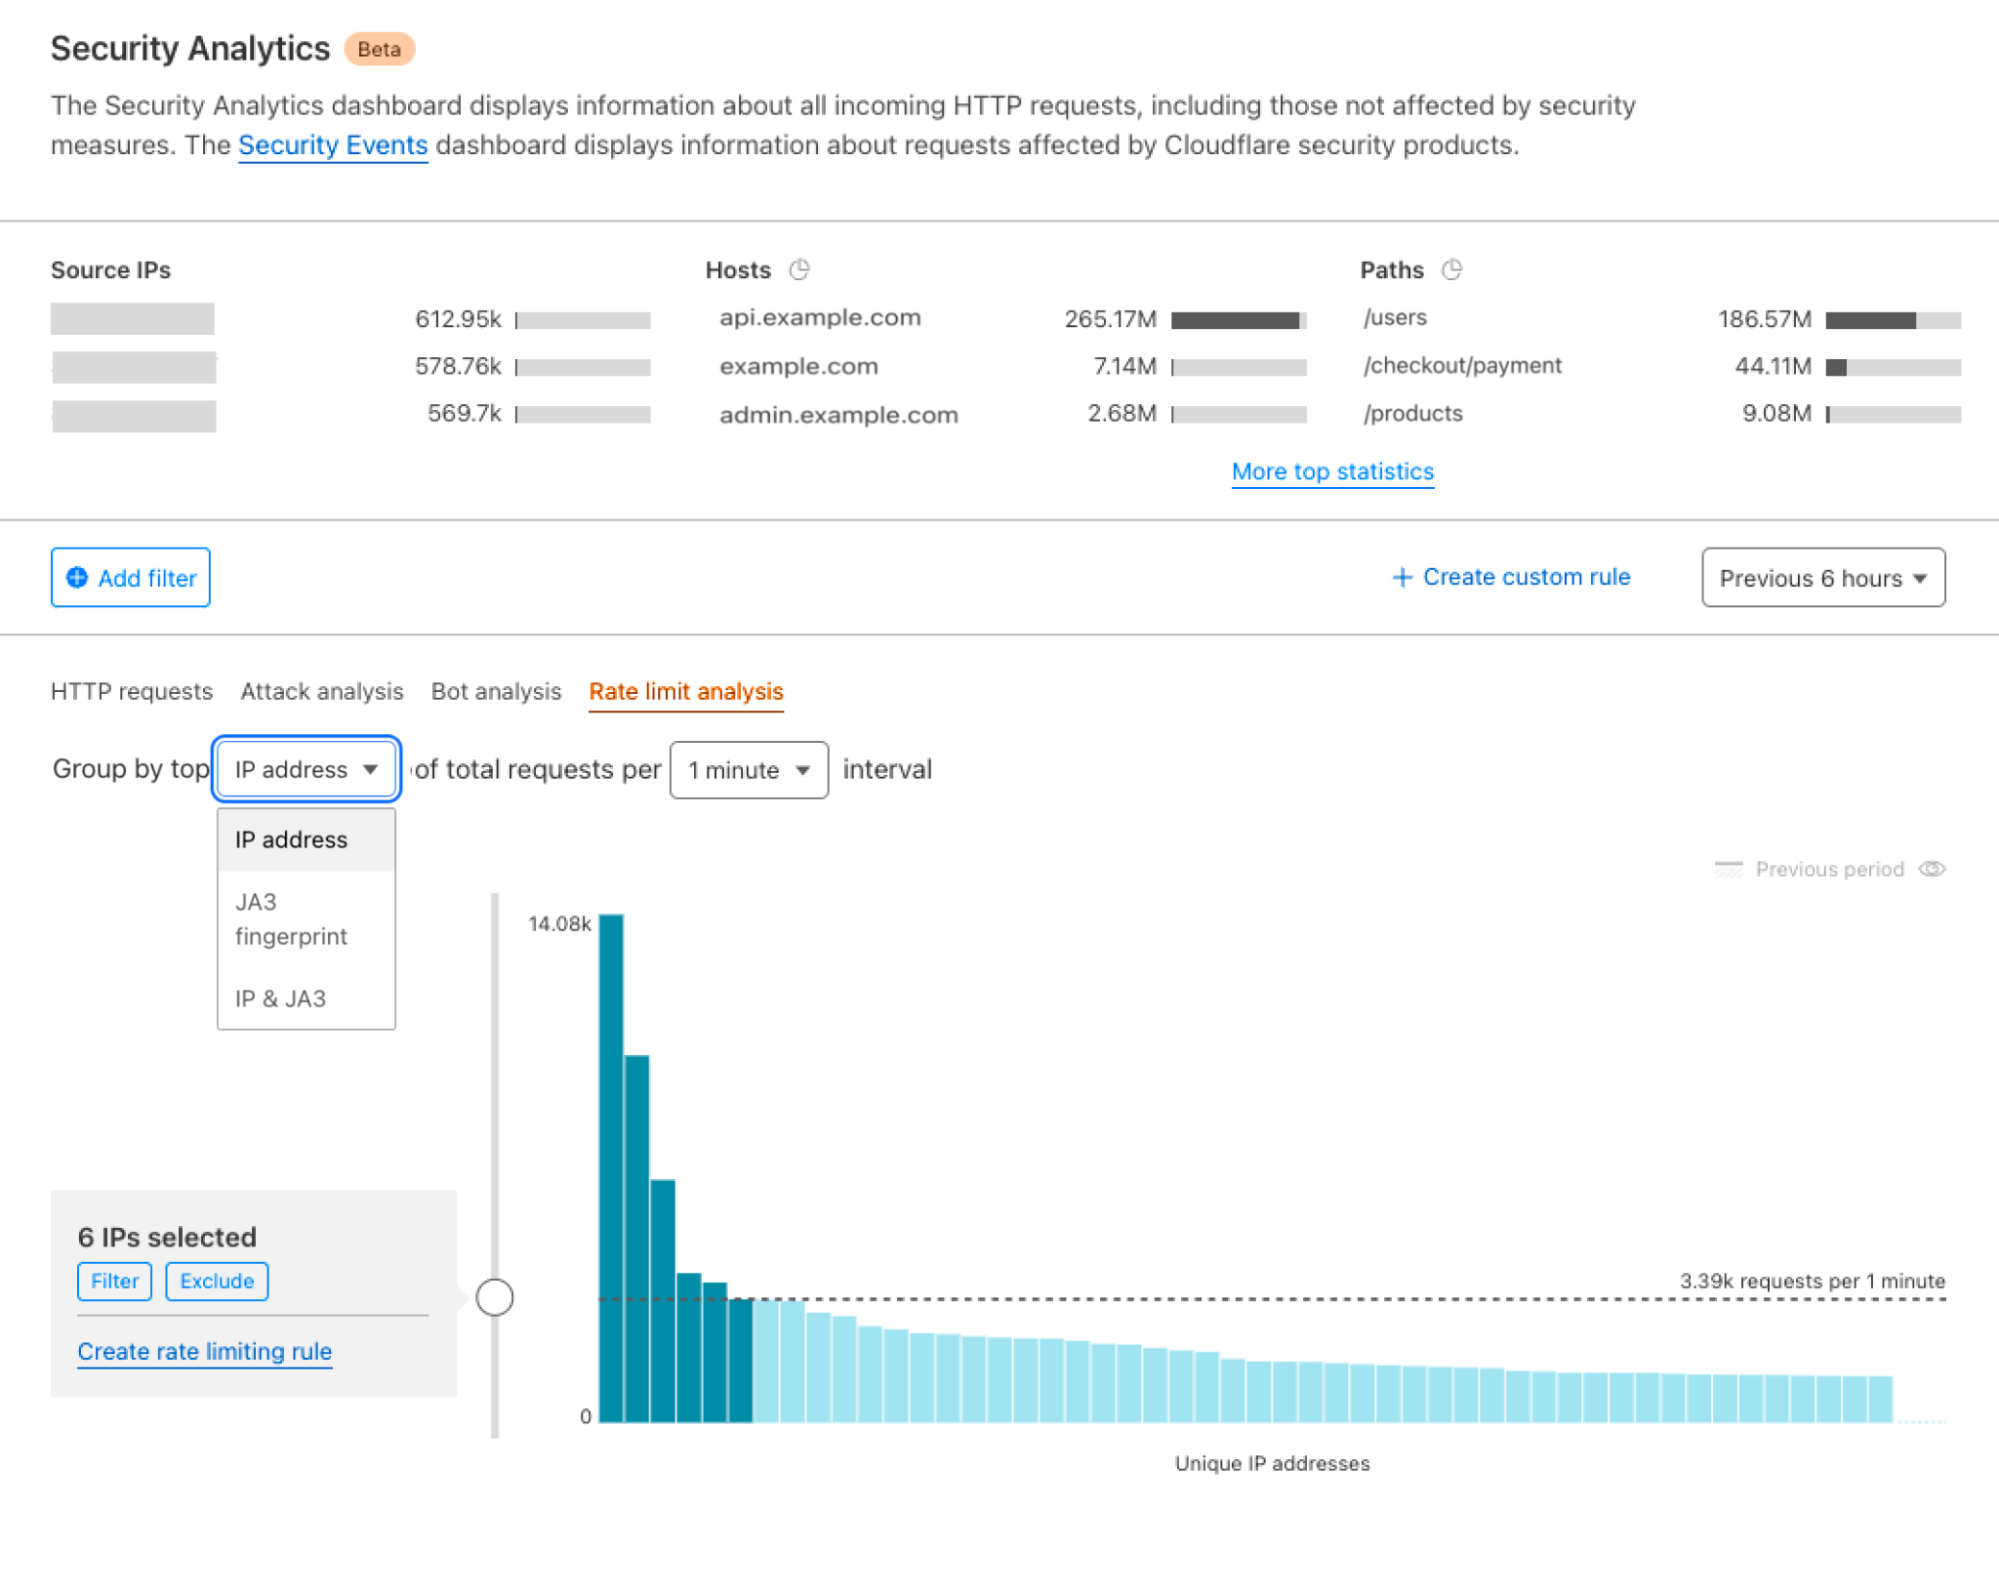
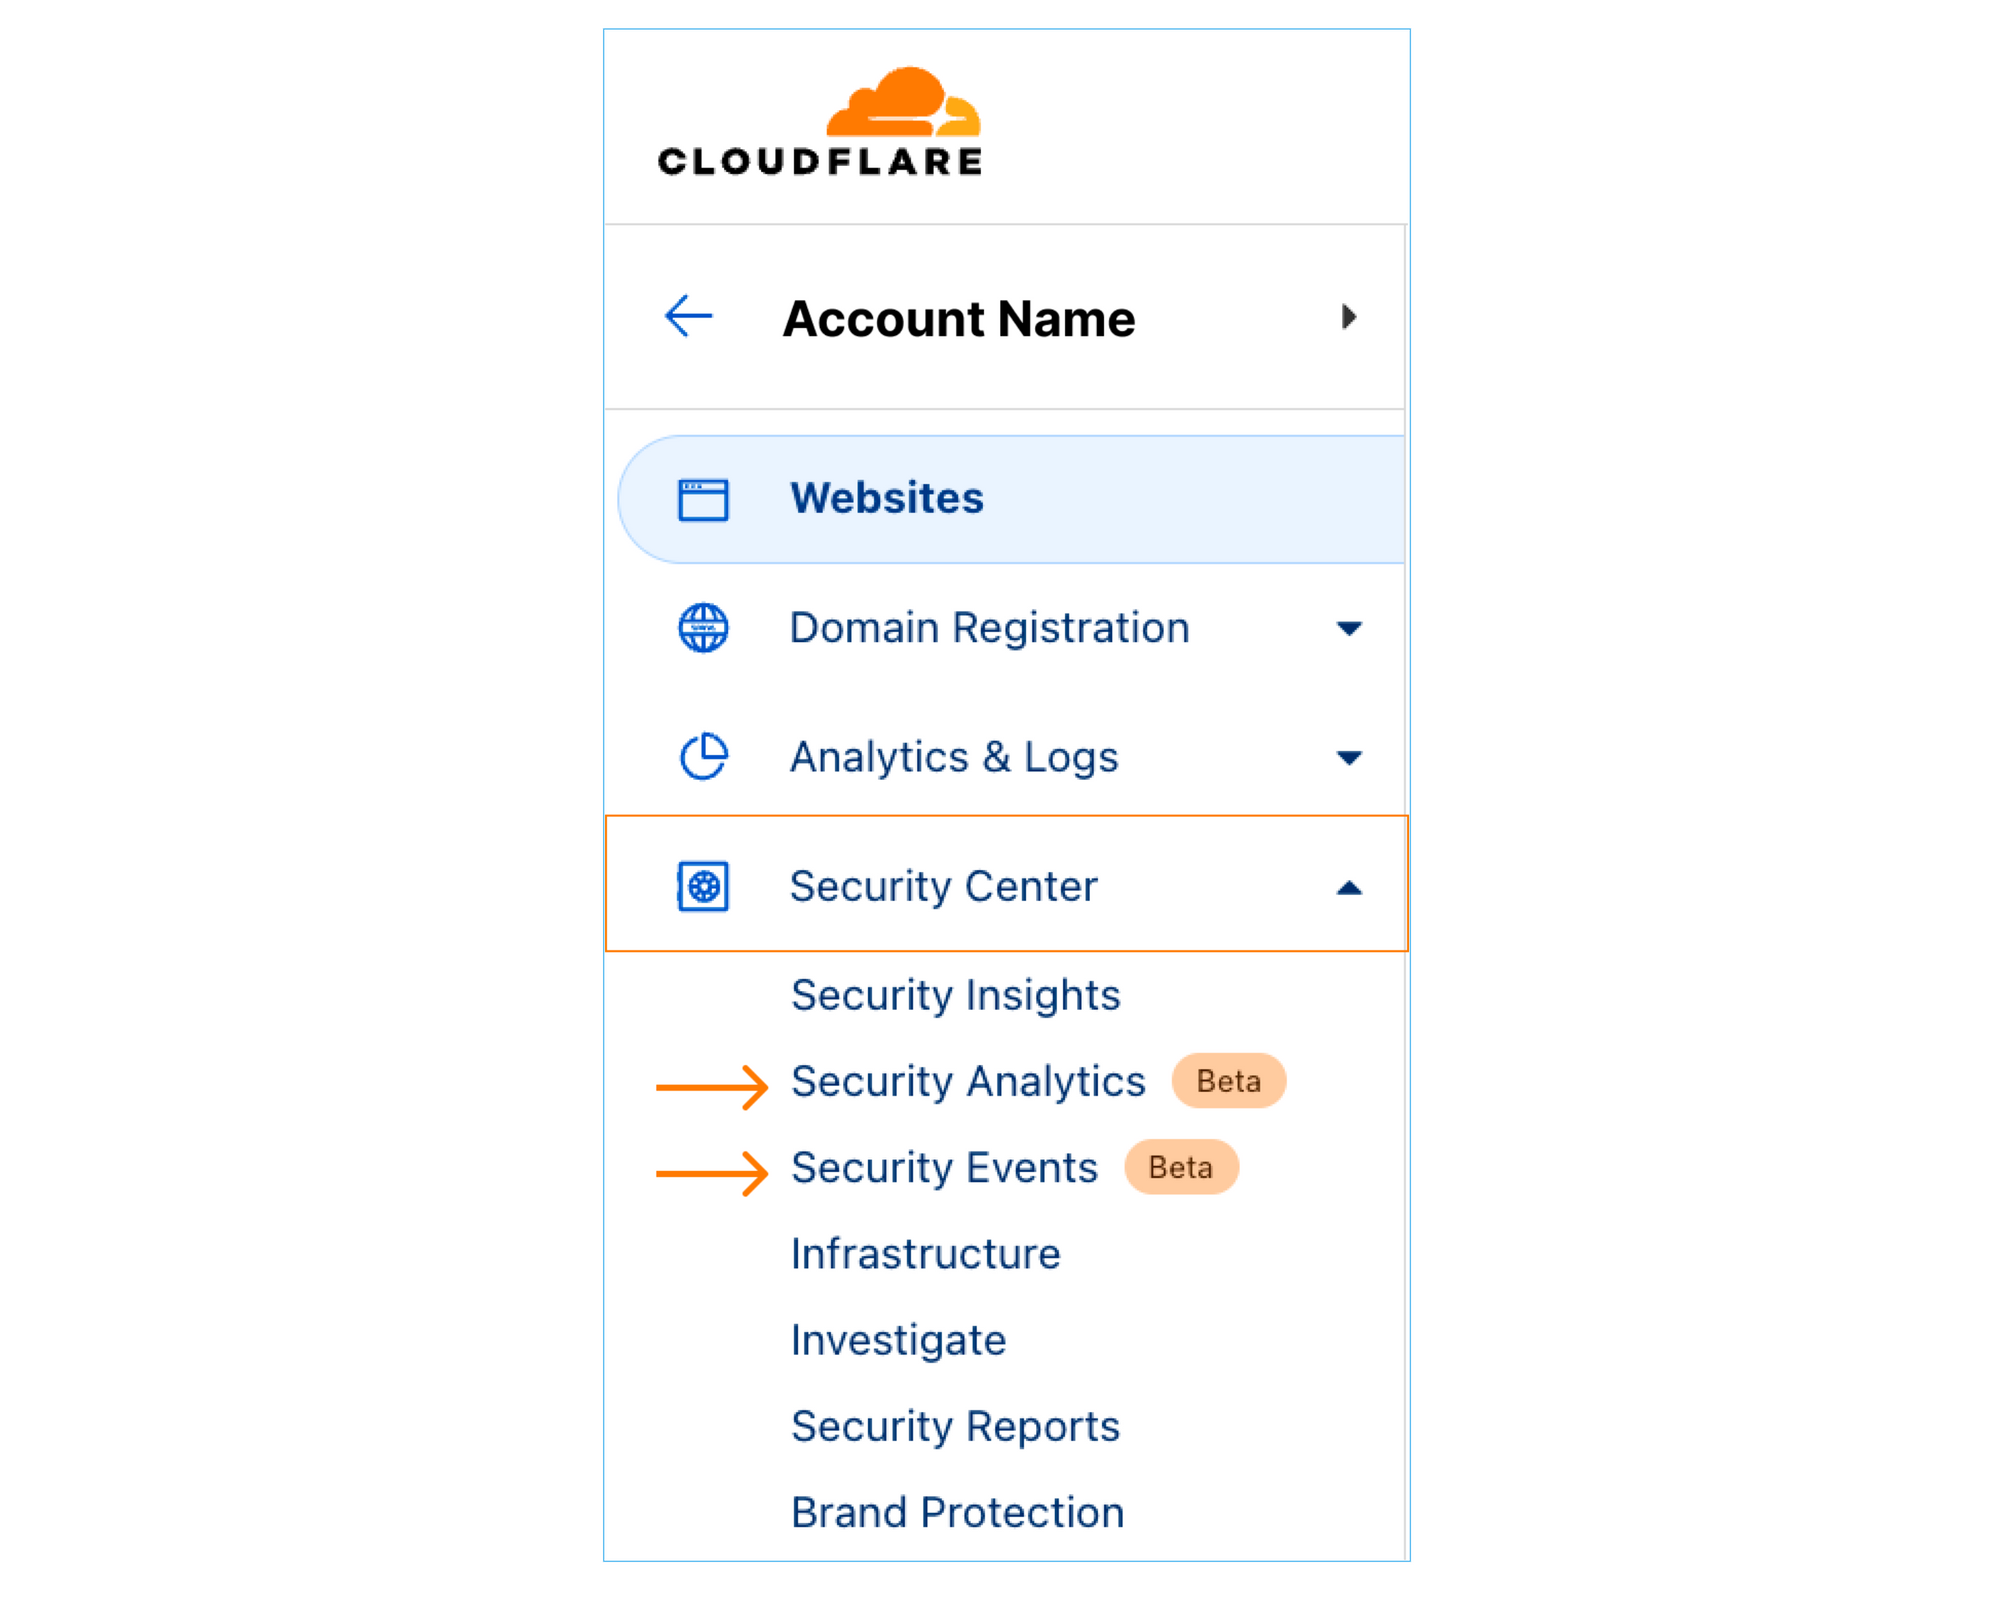
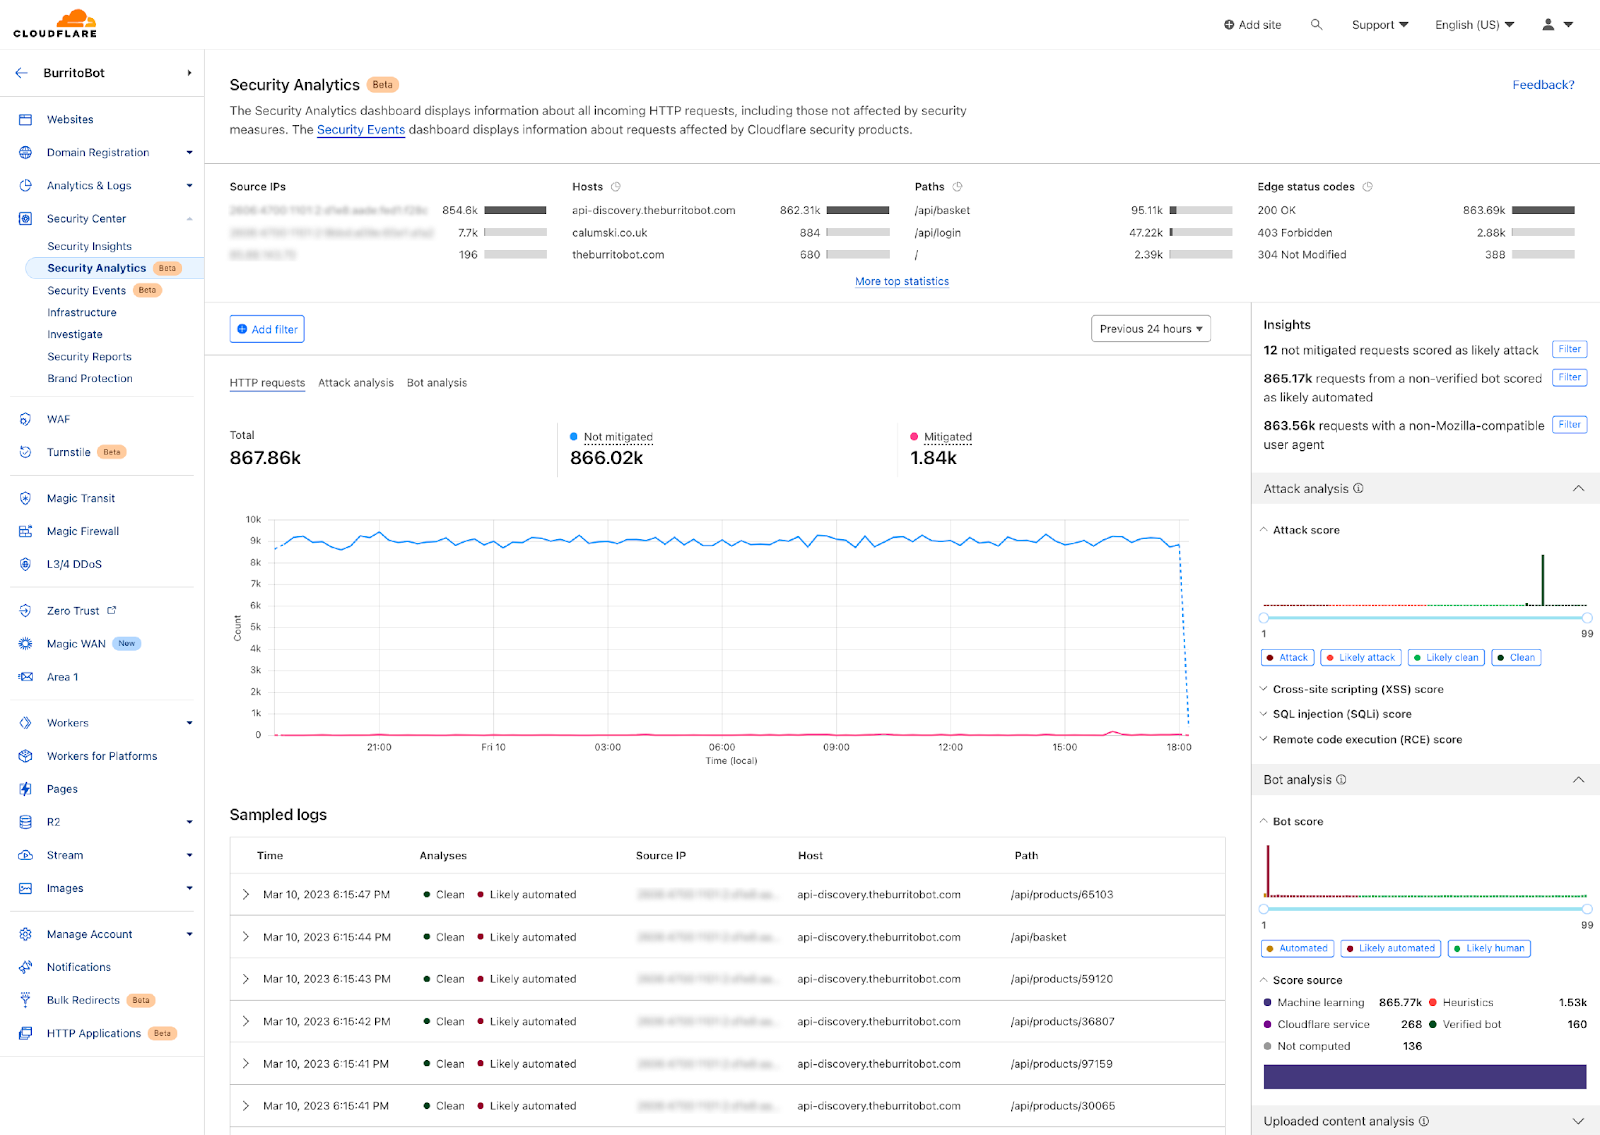
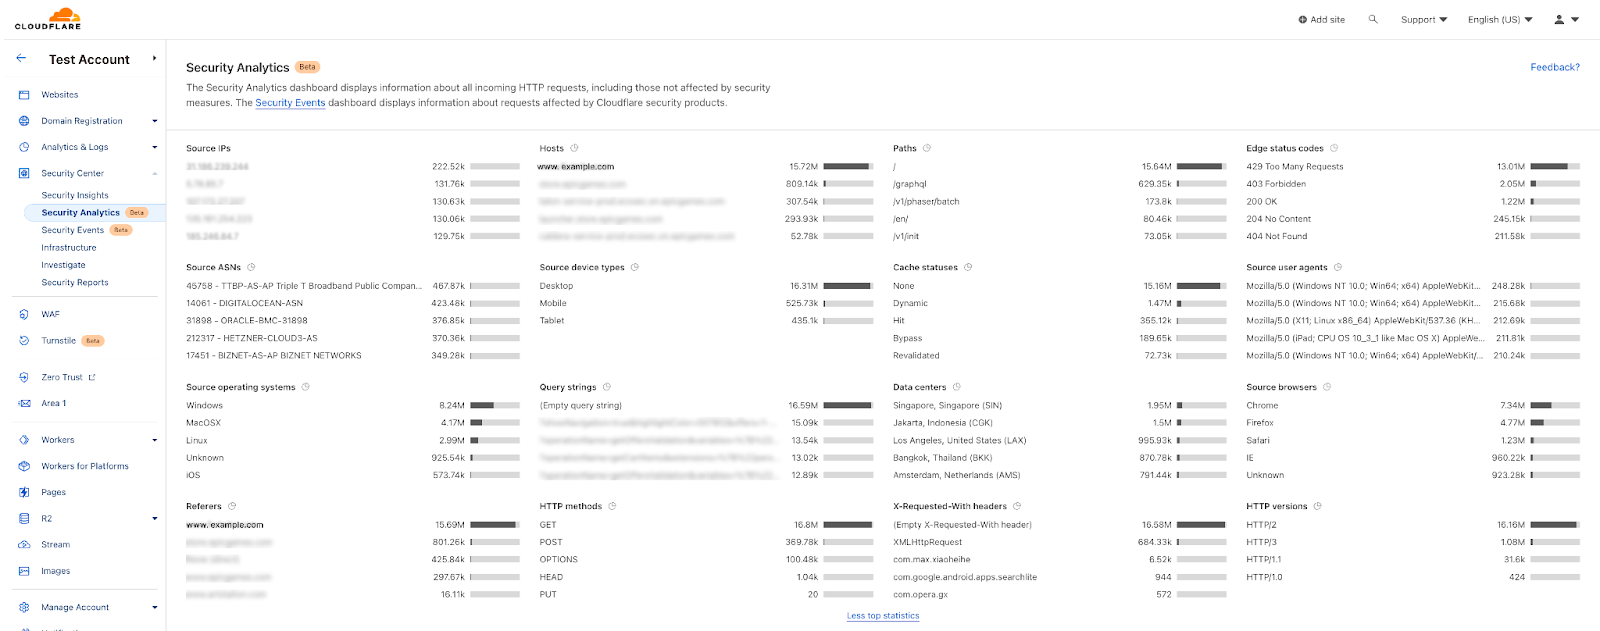
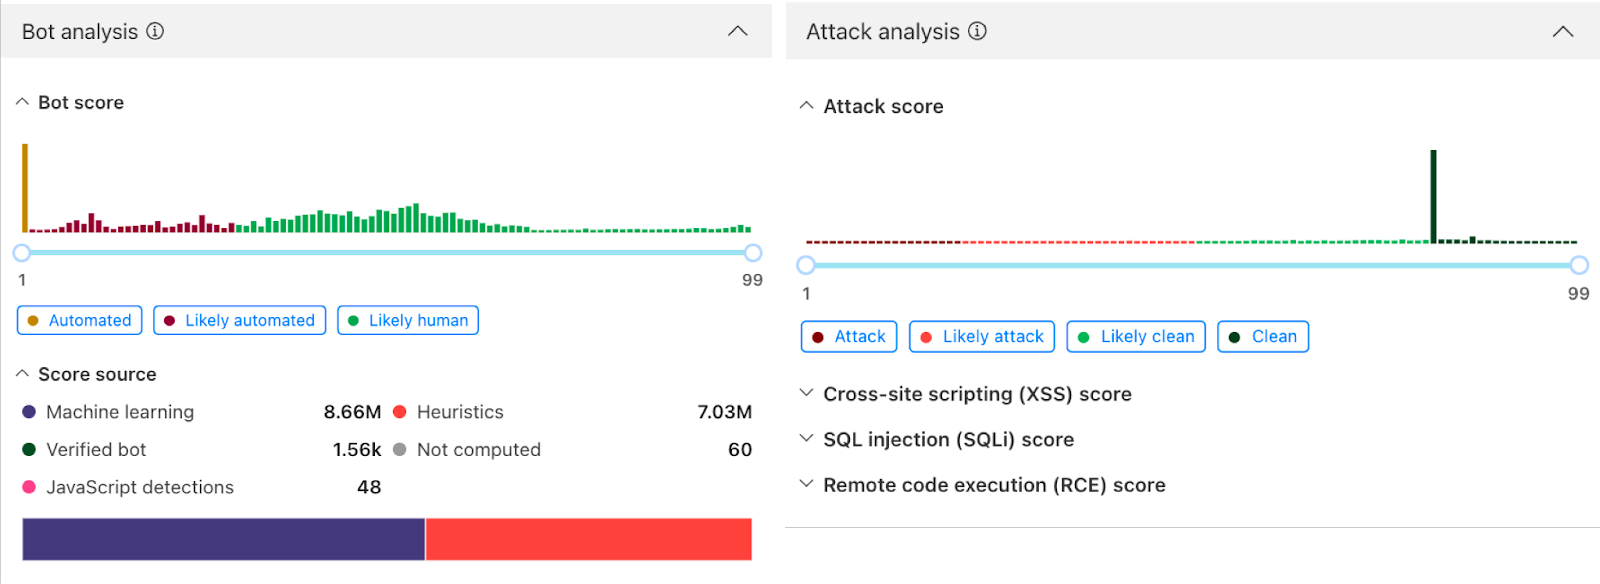
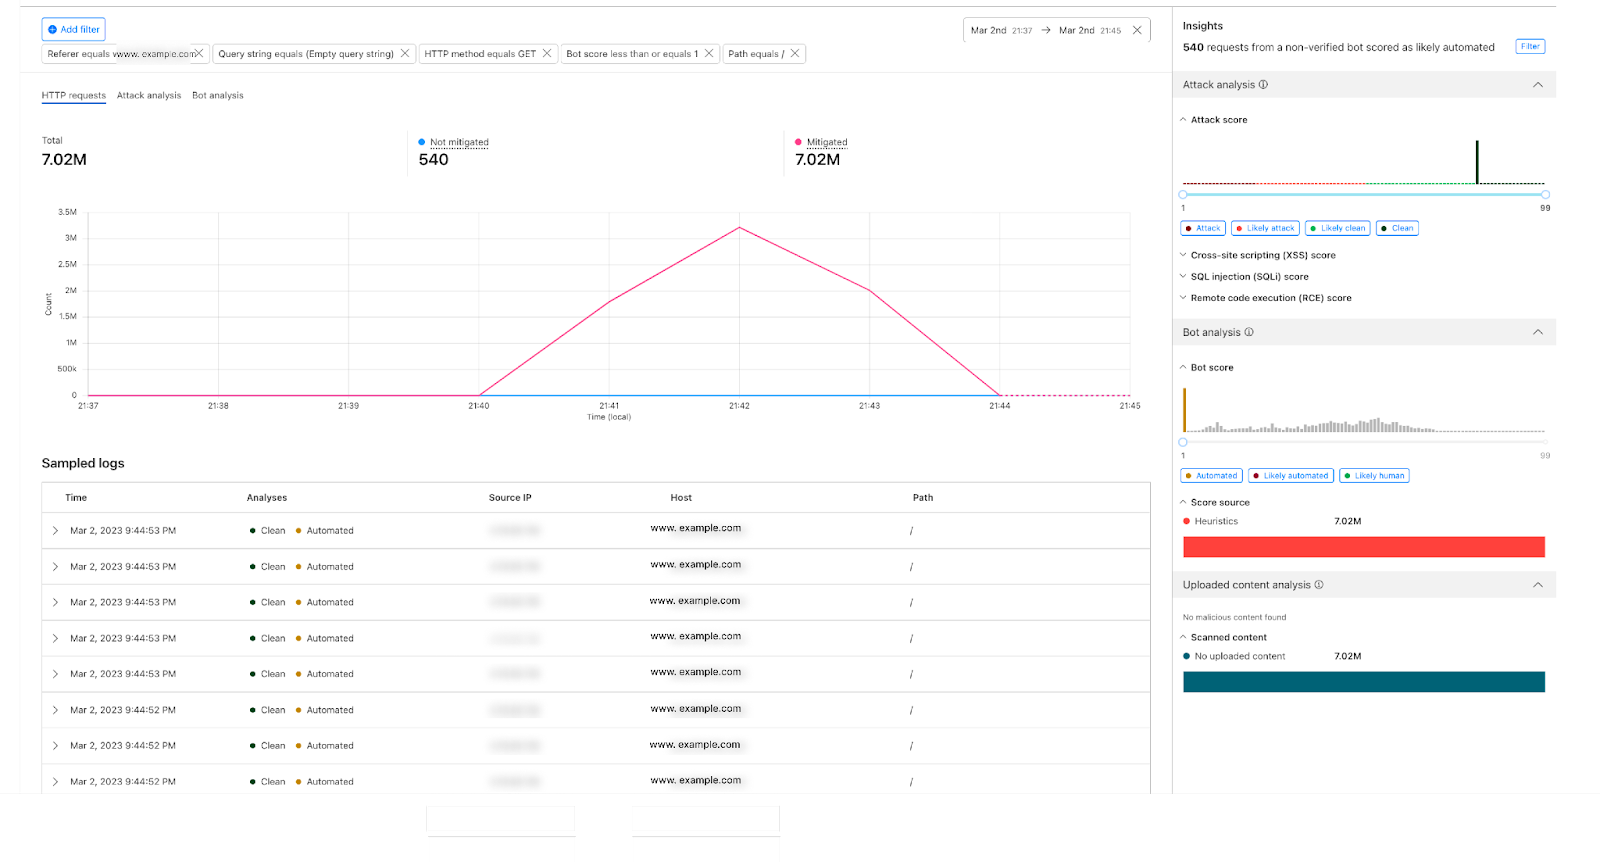
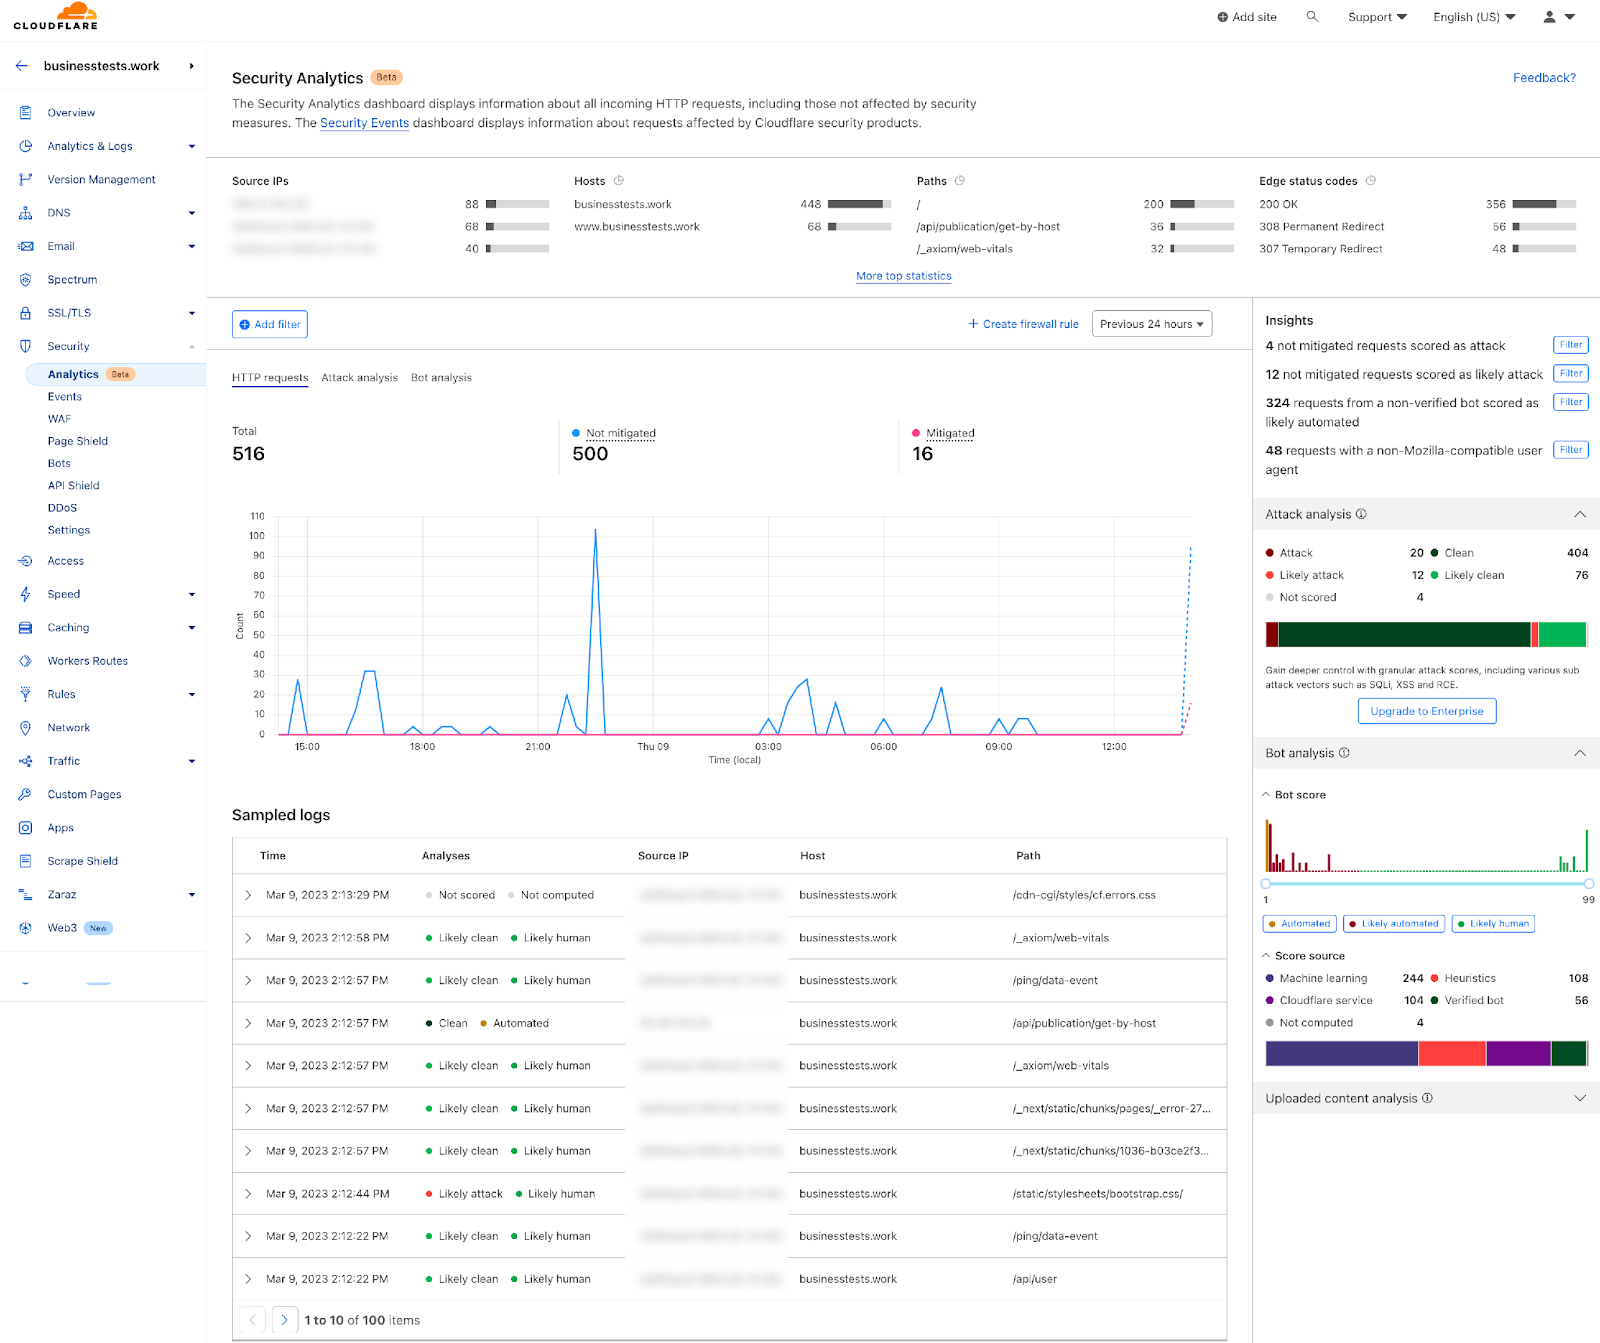
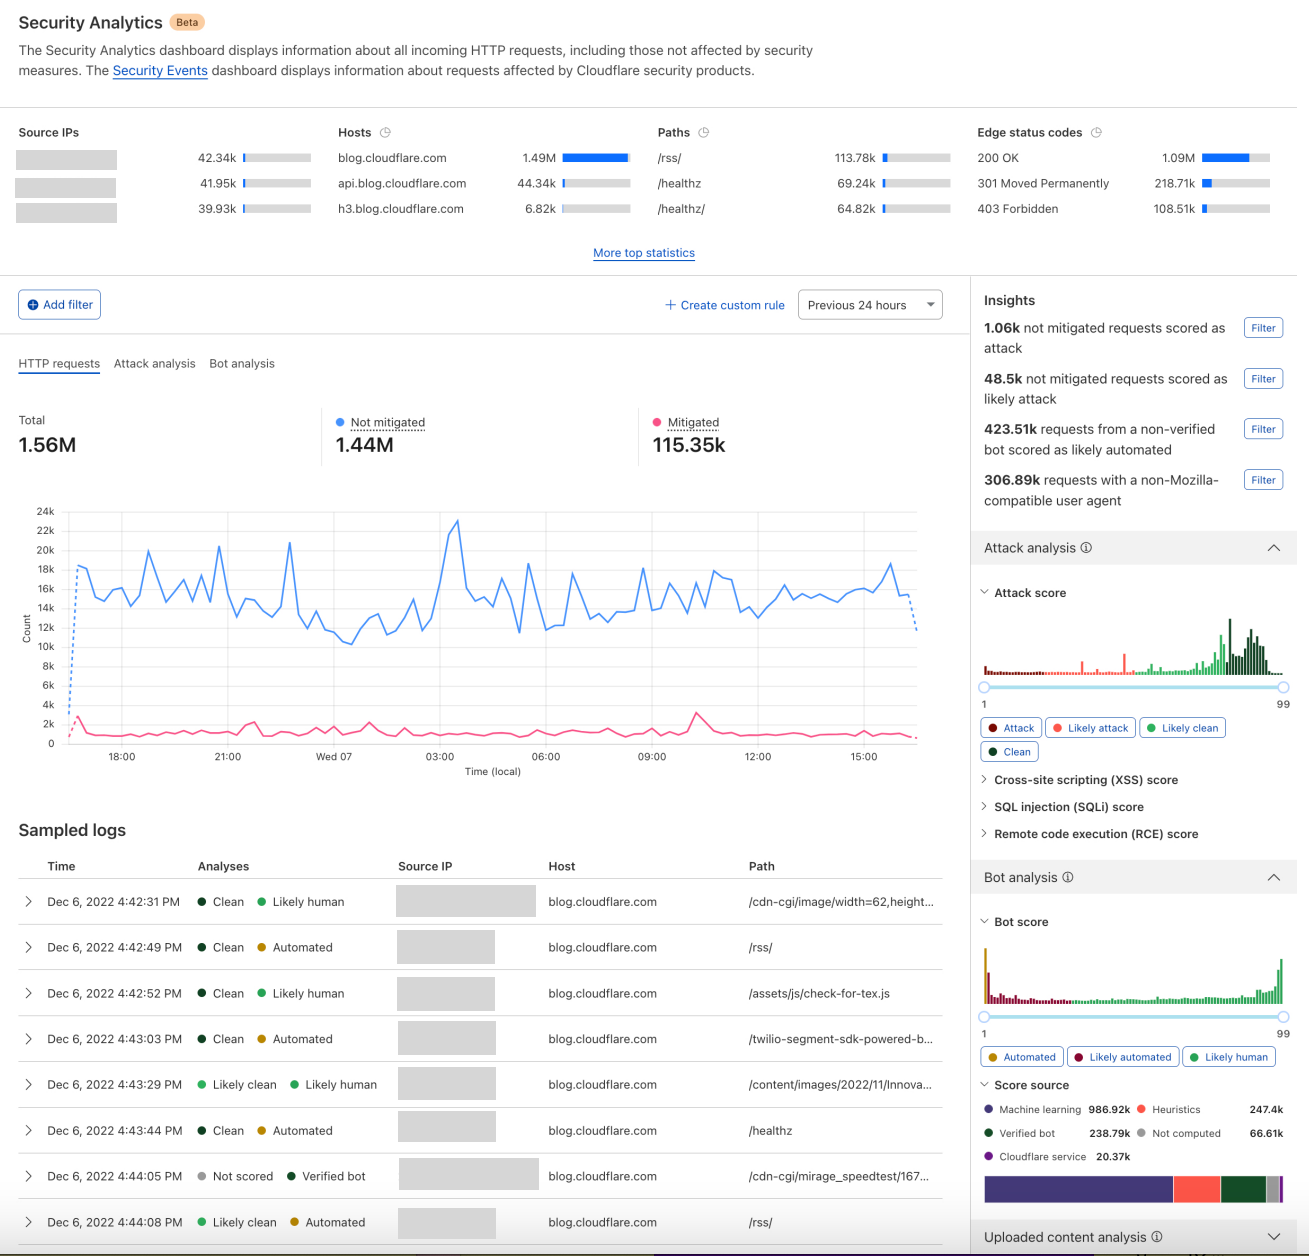
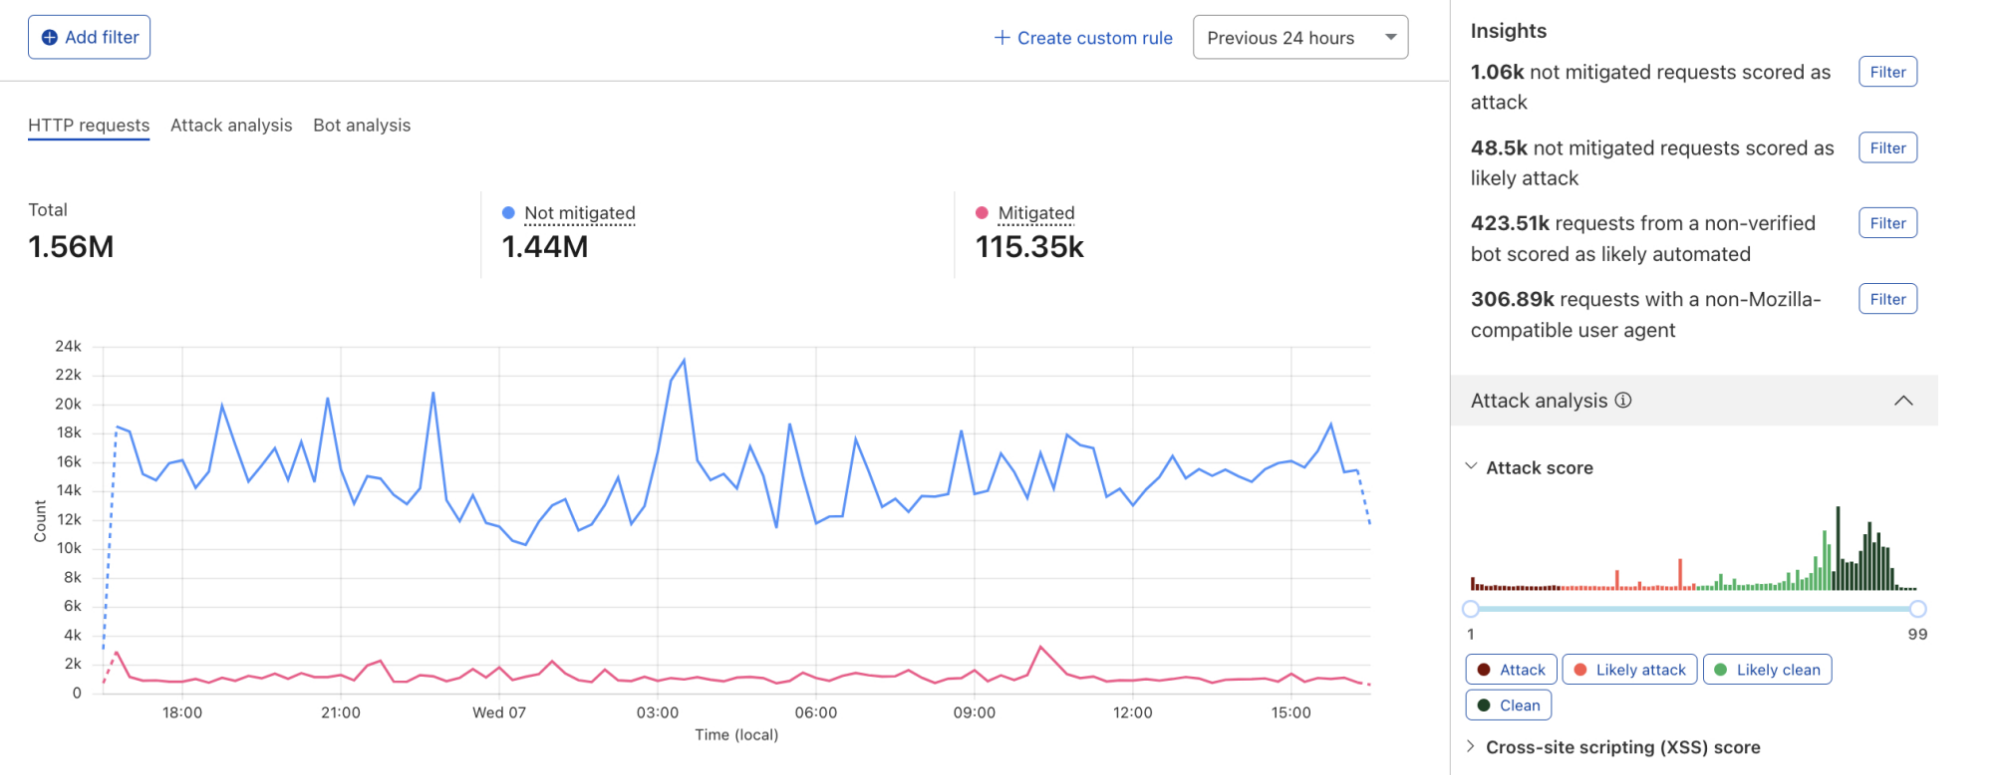
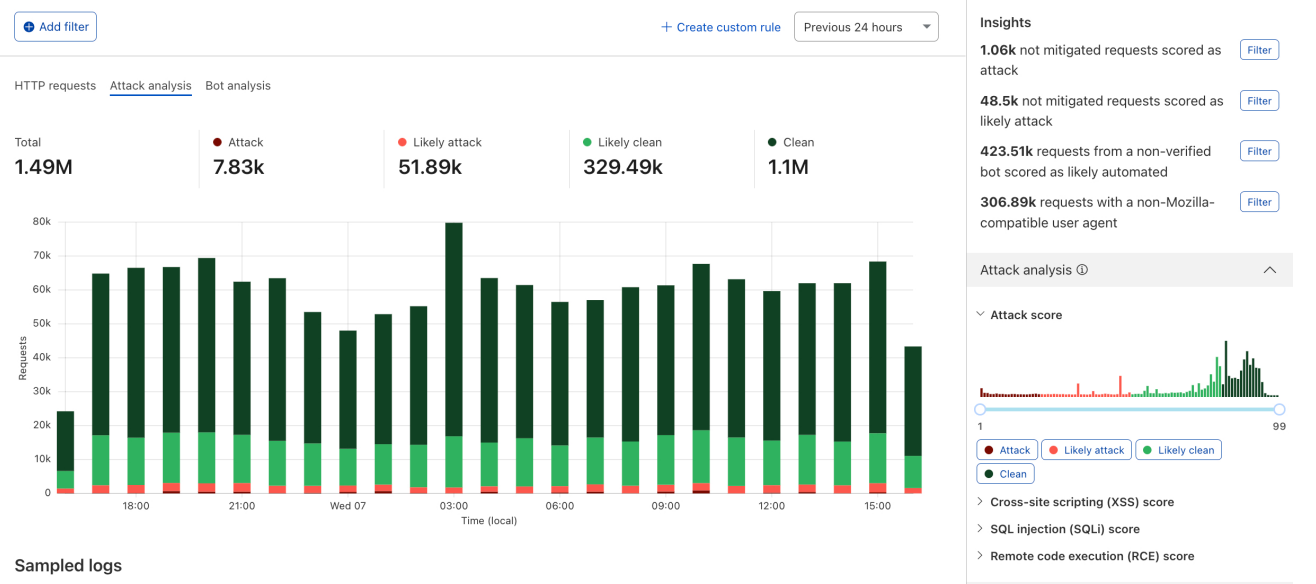
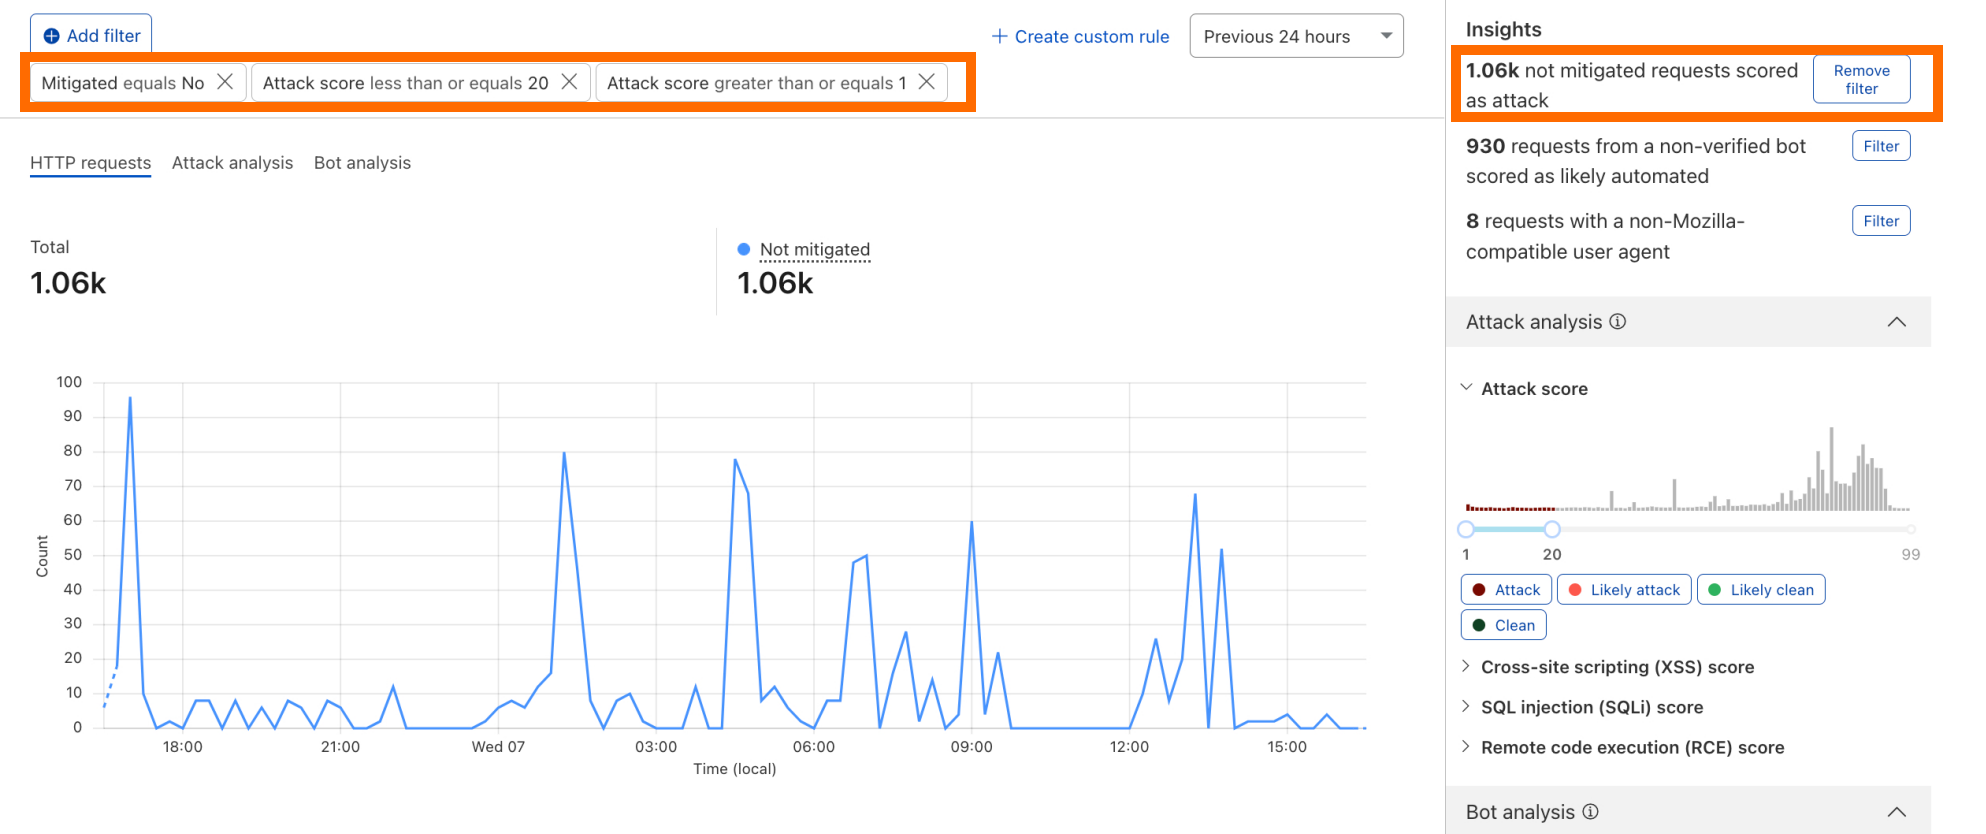
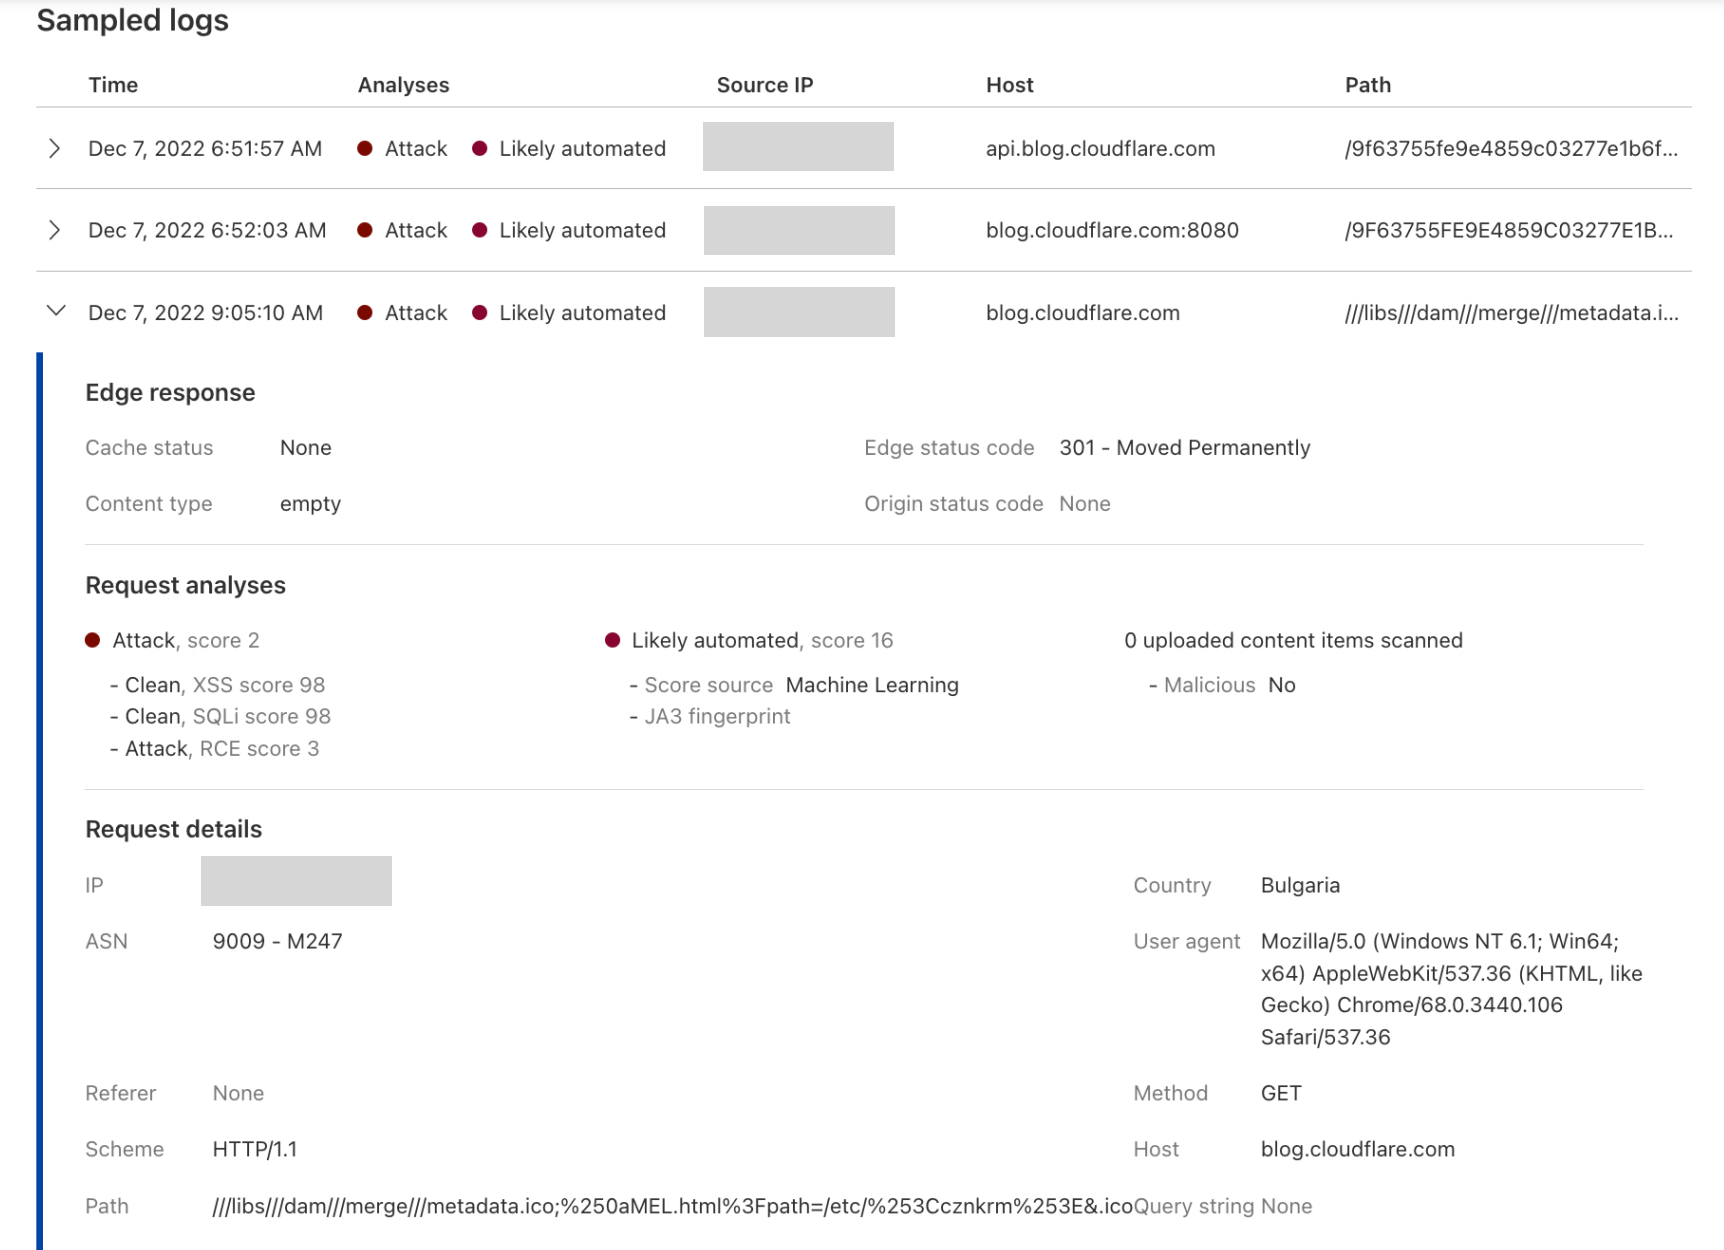
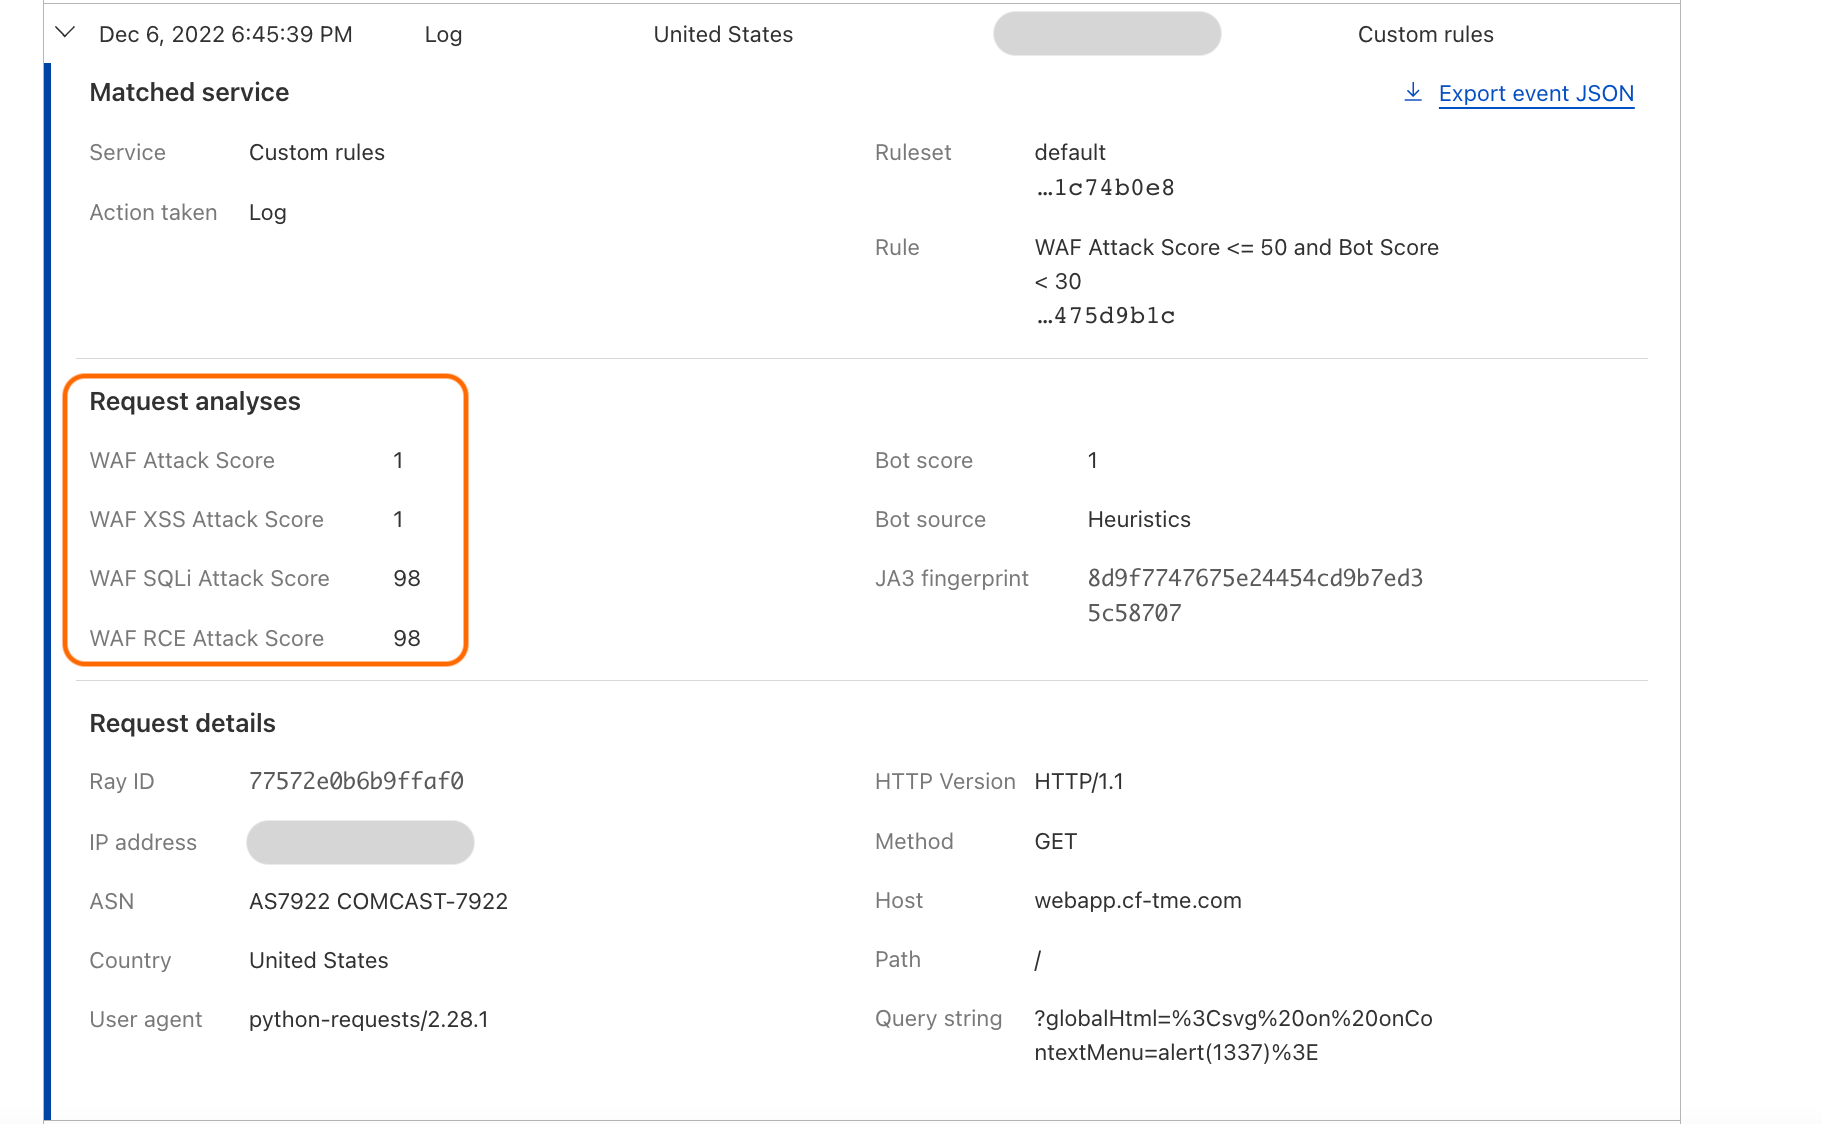
Once enabled, the new fields appear in Security Analytics and expanded logs. From there, you can filter by unsafe topics, track trends over time, and drill into the results of individual requests to see all detection outcomes, for example: did we detect unsafe topics, and what are the categories. The request body itself (the prompt text) is not stored or exposed; only the results of the analysis are logged.

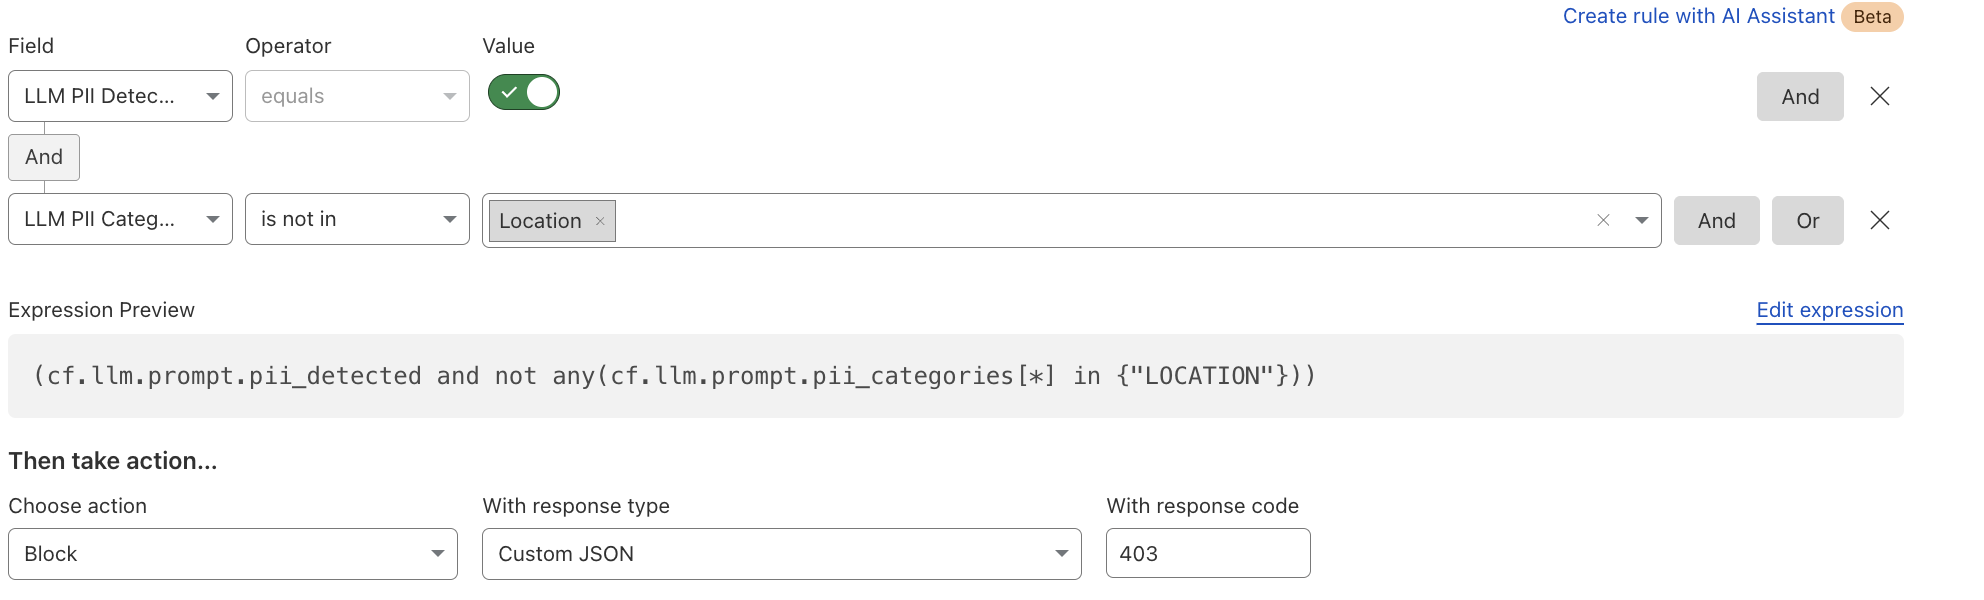
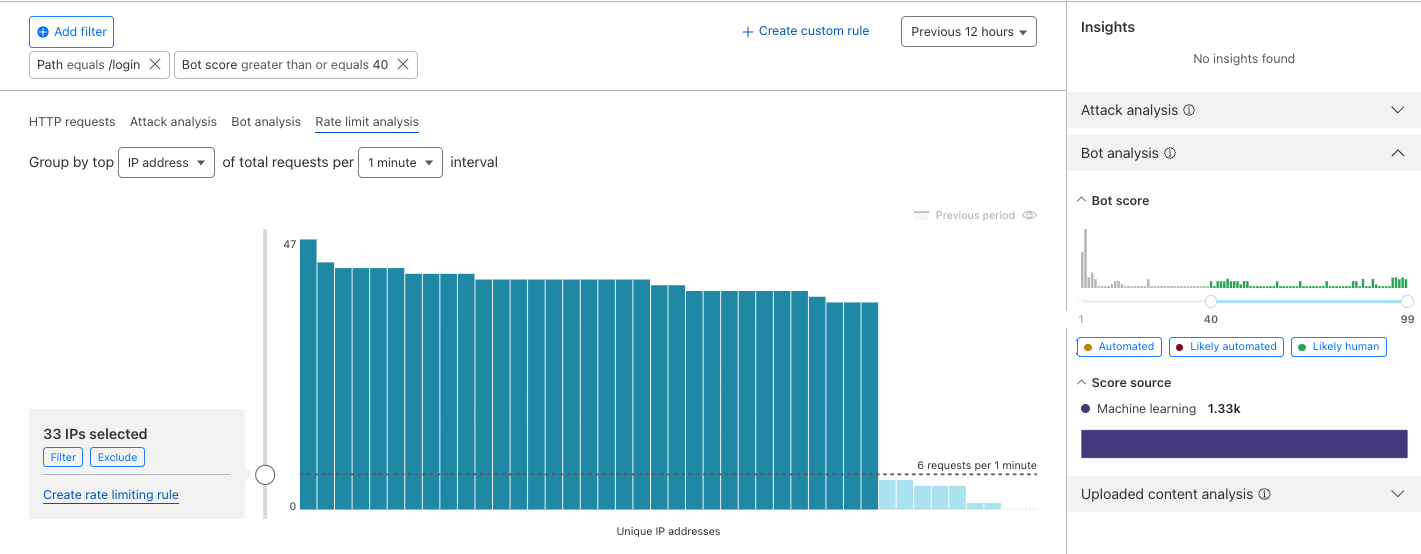
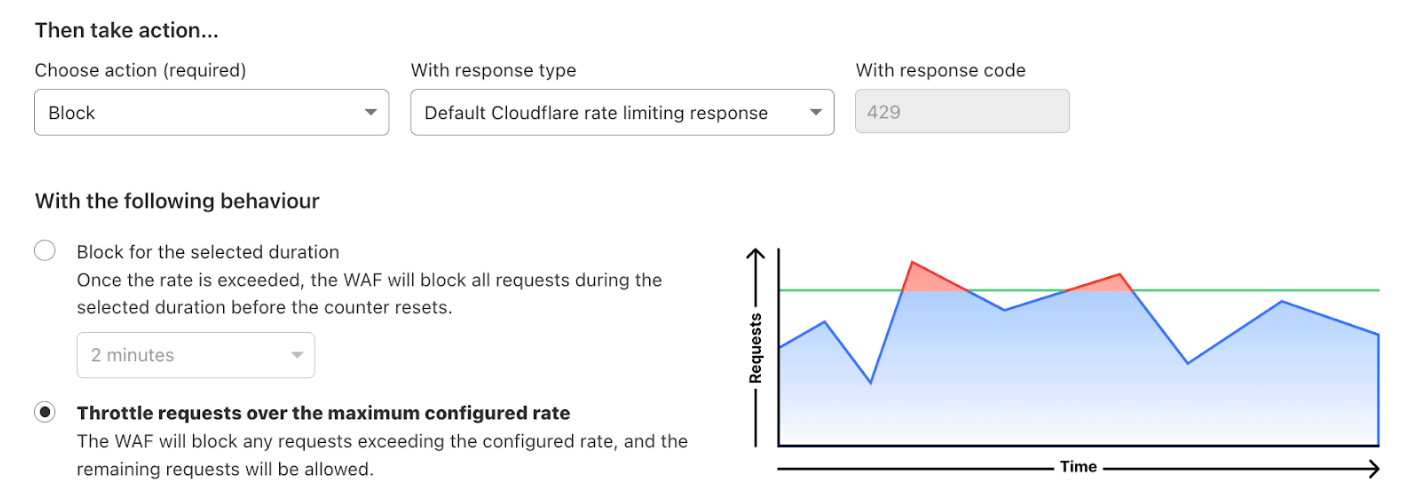
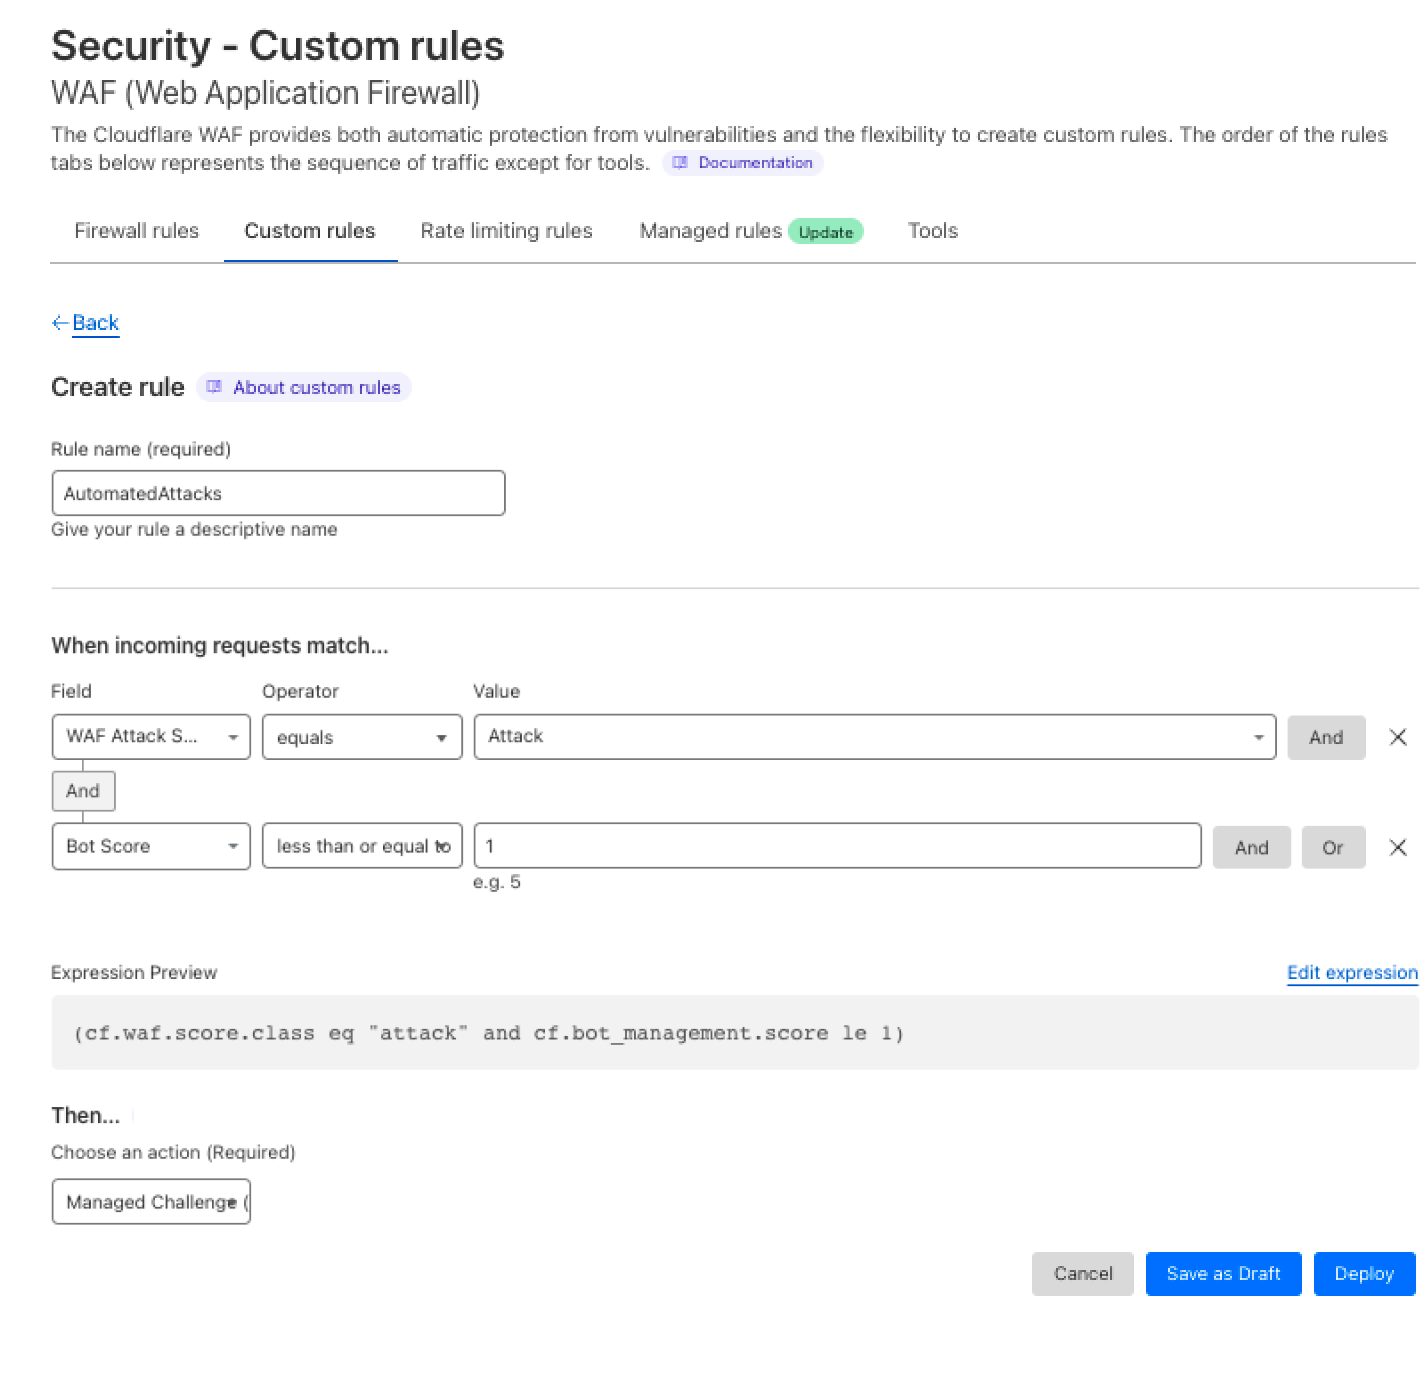
After reviewing the analytics, you can enforce unsafe topic moderation by creating rules to log or block based on prompt categories in Custom rules.
For example, you might log prompts flagged as sexual content or hate speech for review.
You can use this expression:
If (any(cf.llm.prompt.unsafe_topic_categories[*] in {"S10" "S12"})) then Log
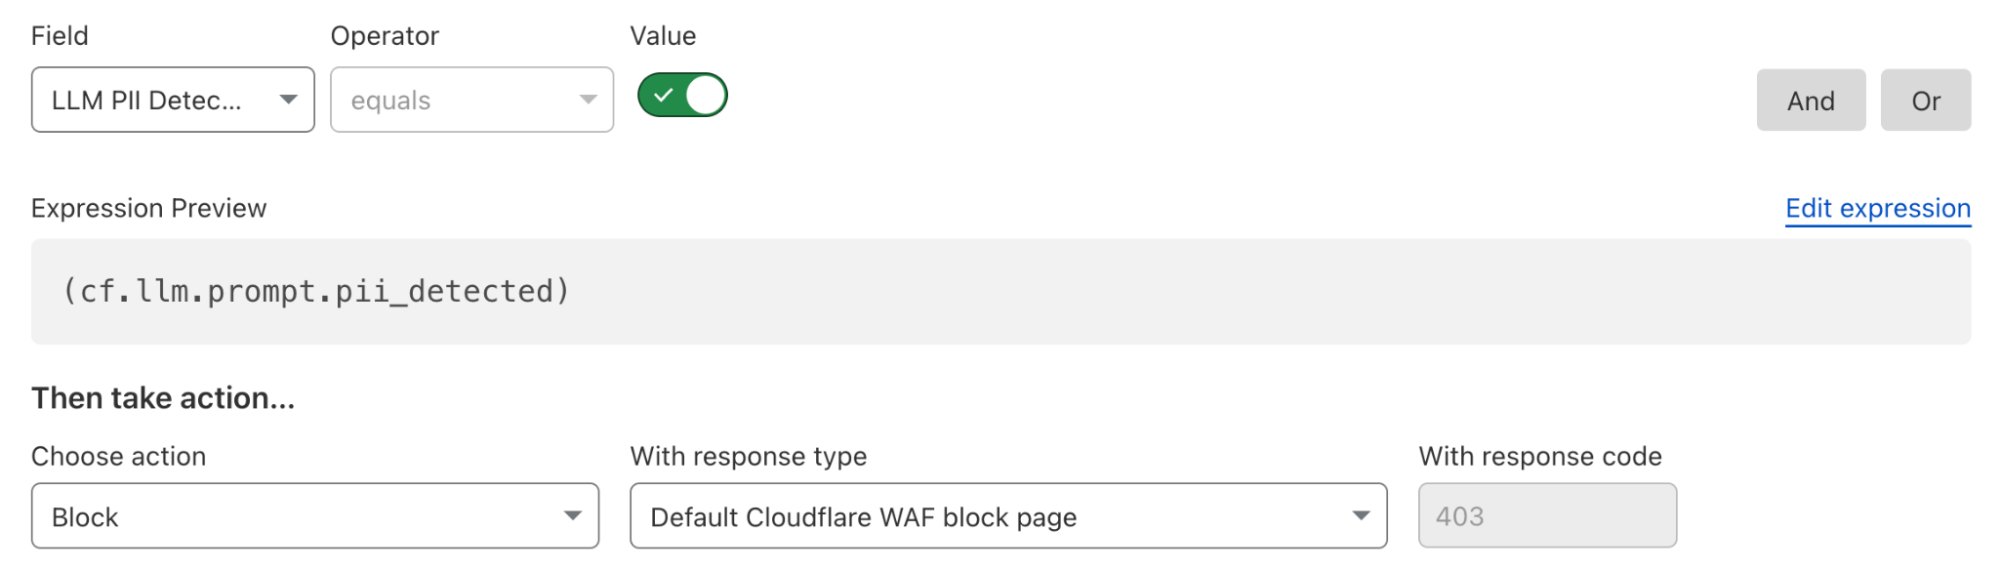
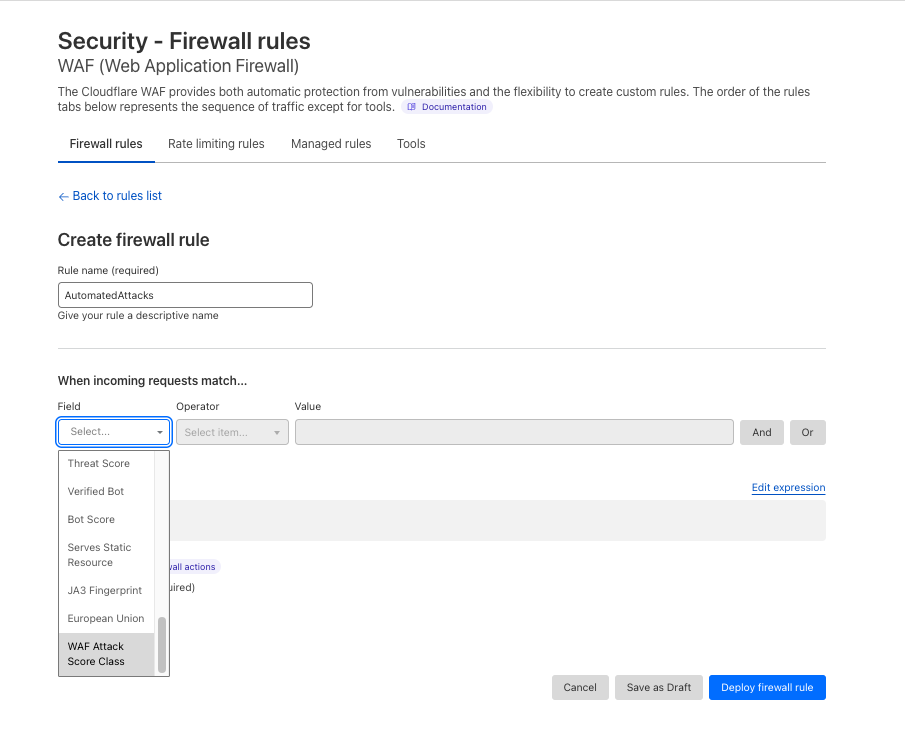
Or deploy the rule with the categories field in the dashboard as in the below screenshot.

You can also take a broader approach by blocking all unsafe prompts outright:
If (cf.llm.prompt.unsafe_topic_detected)then Block

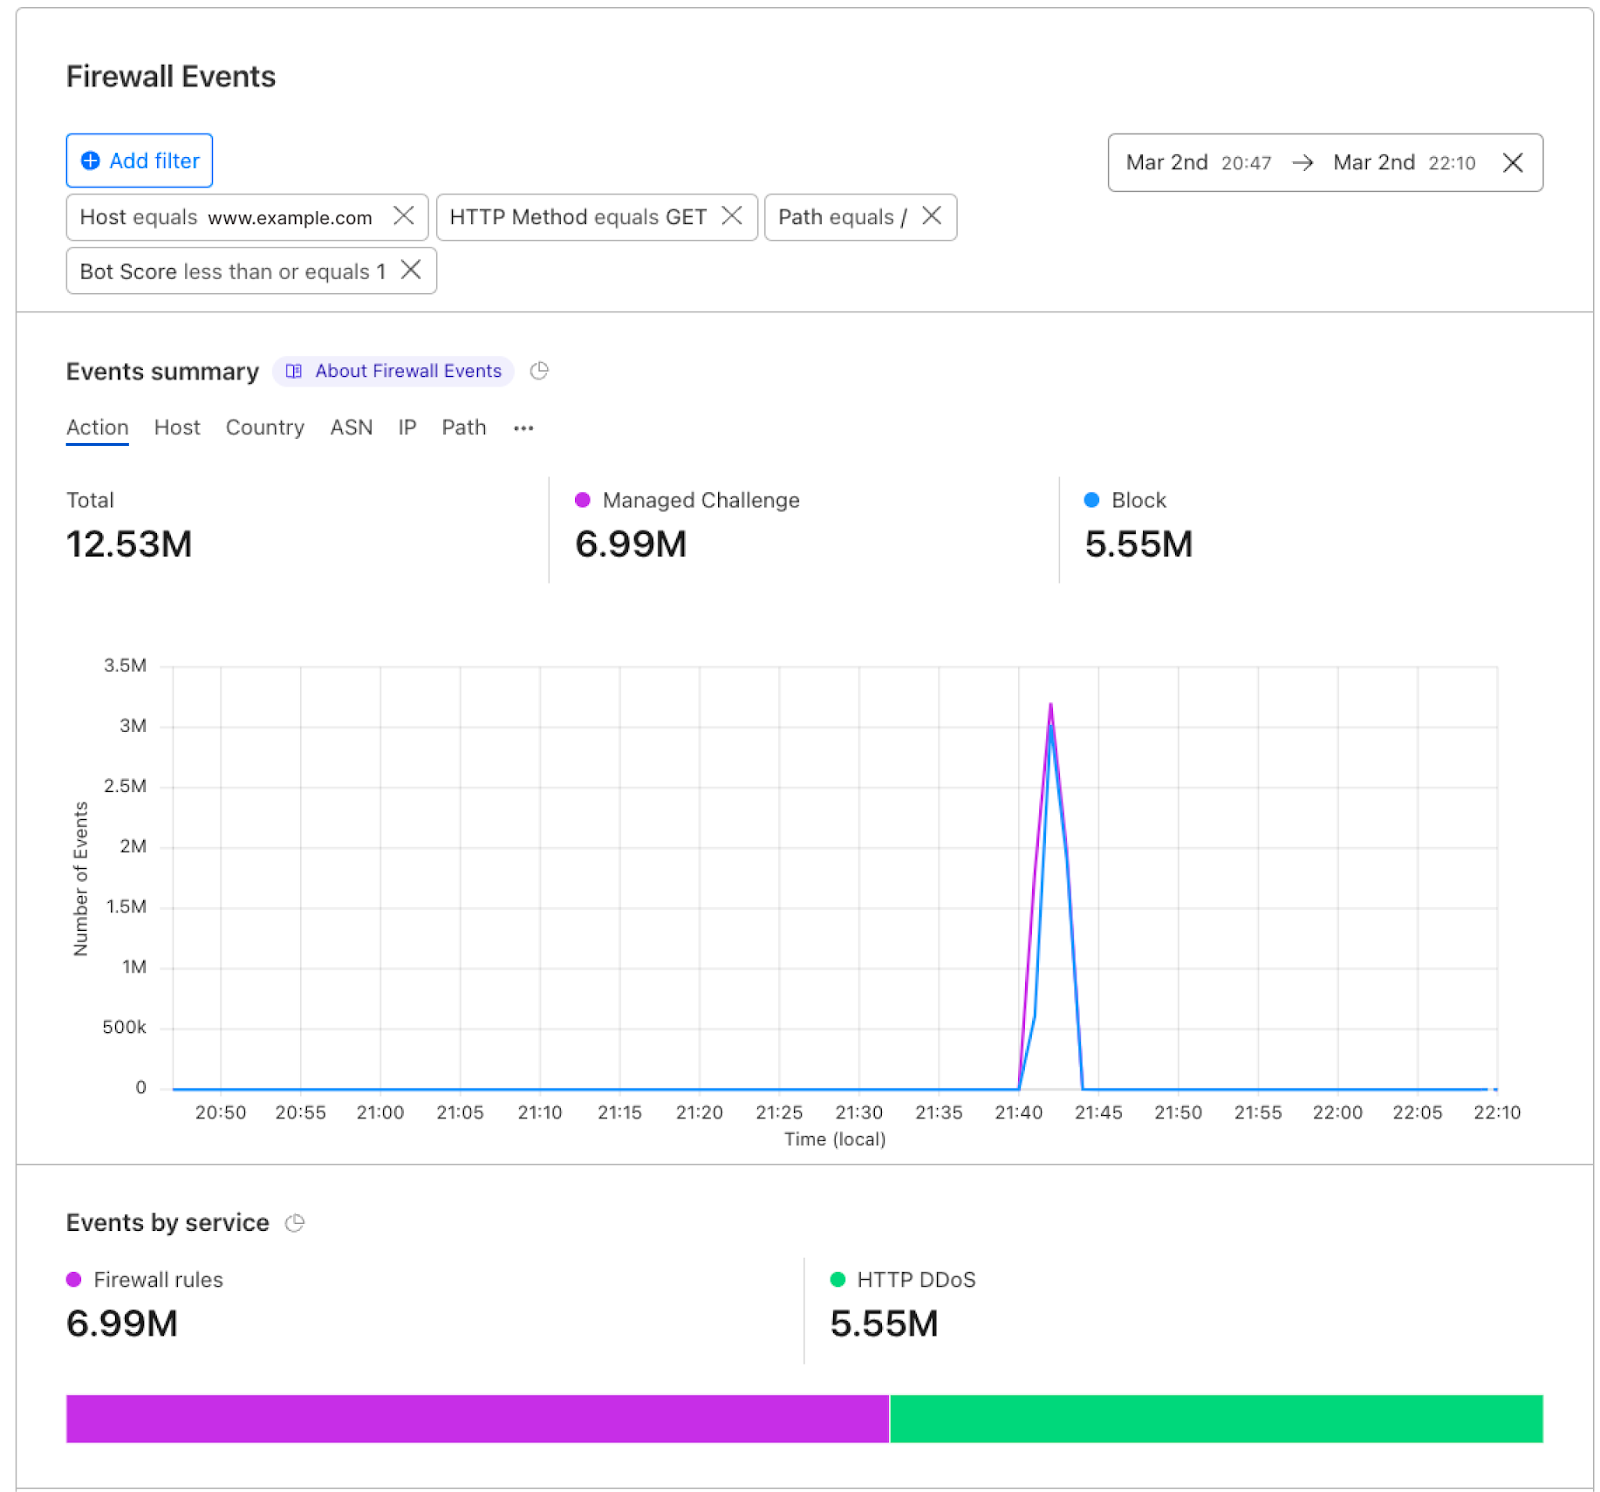
These rules are applied automatically to all discovered HTTP requests containing prompts, ensuring guardrails are enforced consistently across your AI traffic.
In the coming weeks, Firewall for AI will expand to detect prompt injection and jailbreak attempts. We are also exploring how to add more visibility in the analytics and logs, so teams can better validate detection results. A major part of our roadmap is adding model response handling, giving you control over not only what goes into the LLM but also what comes out. Additional abuse controls, such as rate limiting on tokens and support for more safety categories, are also on the way.
Firewall for AI is available in beta today. If you’re new to Cloudflare and want to explore how to implement these AI protections, reach out for a consultation. If you’re already with Cloudflare, contact your account team to get access and start testing with real traffic.
Cloudflare is also opening up a user research program focused on AI security. If you are curious about previews of new functionality or want to help shape our roadmap, express your interest here.