All posts by Steve Roberts

Announcing General Availability of Construct Hub and AWS Cloud Development Kit Version 2

Post Syndicated from Steve Roberts original https://aws.amazon.com/blogs/aws/announcing-general-availability-of-construct-hub-and-aws-cloud-development-kit-version-2/

Today, I’m happy to announce that both the Construct Hub and AWS Cloud Development Kit (AWS CDK) version 2 are now generally available (GA).

The AWS CDK is an open-source framework that simplifies working with cloud resources using familiar programming languages: C#, TypeScript, Java, Python, and Go (in developer preview). Within their applications, developers create and configure cloud resources using reusable types called constructs, which they use just as they would any other types in their chosen language. It’s also possible to write custom constructs, which can then be shared across your teams and organization.

With the new releases generally available today, defining your cloud resources using the CDK is now even more simple and convenient, and the Construct Hub enables sharing of open-source construct libraries within the wider cloud development community.

Construct Hub home page

AWS Cloud Development Kit (AWS CDK) Version 2
Version 2 of the AWS CDK focuses on productivity improvements for developers working with CDK projects. The individual packages (libraries) used in version 1 to distribute and consume the constructs available for each AWS service have been consolidated into a single monolithic package. This simplifies dependency management in your CDK applications and when publishing construct libraries. It also makes working with CDK projects that reference constructs from multiple services more convenient, especially when those services have peer dependencies (for example, an Amazon Simple Storage Service (Amazon S3) bucket that needs to be configured with an AWS Key Management Service (KMS) key).

Version 1 of the CDK contained some APIs that were experimental. Over time, some of these were marked as deprecated in favor of other preferred approaches based on community experience and feedback. The deprecated APIs have been removed in version 2 to aid clarity for developers working with construct properties and methods. Additionally, the CDK team has adopted a new release process for creating and releasing experimental constructs without needing to include them in the monolithic GA package. From version 2 onwards, the monolithic CDK package will contain only stable APIs that customers can always rely on. Experimental APIs will be shipped in separate packages, making it easier for the team and community to revise them and ensure customers don’t incur the accidental breaking changes that caused some issues in version 1.

You can read about all the changes in version 2 of the AWS CDK, and how you can update your CDK applications to use it, in the Developer Guide.

Construct Hub
The Construct Hub is a single home where the open-source community, AWS, and cloud technology providers can discover and share construct libraries for all CDKs. The most popular CDKs today are AWS CDK, which generates AWS CloudFormation templates; cdk8s, which generates Kubernetes manifests; and cdktf, which generates Terraform JSON files. Anyone can create a CDK, and we are open to adding other construct-based tools as they evolve!

As of this post’s publication, the Construct Hub contains over 700 CDK libraries, including core AWS CDK modules, to help customers build their cloud applications using their preferred programming languages, for their preferred use case, and with their preferred provisioning engine (CloudFormation, Terraform, or Kubernetes). For example, there are 99 libraries for working with containers, 210 libraries for serverless development, 53 libraries for websites, 65 libraries for integrations with cloud services providers like Datadog, Logz.io, Cloudflare, Snyk, and more, and dozens of additional libraries which integrate with Slack, Twitter, GitLab, Grafana, Prometheus, WordPress, Next.js, and more. Many of these were created by the open-source community.

Anyone can contribute construct libraries to the Construct Hub. New libraries that you wish to share need to be published to the npm public registry and tagged. The Construct Hub will automatically detect the published libraries and make them visible and discoverable to consumers on the hub. Consumers can search and filter for construct libraries for familiar technologies, third-party integrations, AWS services, and use cases such as compliance, monitoring, websites, containers, serverless, and more. Filters are available for publisher, language, CDK type, and keywords. In the screenshot below, I’m searching the hub for .NET and TypeScript libraries related to databases and Kubernetes across all CDKs. I could also filter to a specific CDK or a CDK version.

Searching across publishers

Publishers determine which programming languages should be supported by their packages. Construct Hub then automatically generates API references for all the supported languages and transliterates all code samples the authors provide to those supported languages. The screenshots below show an example of language-specific API documentation for the cdk-spa-deploy construct library, which you can use to deploy a single-page web application (SPA). First, the documentation for .NET developers working with the library:

Generated sample code and documentation for a .NET construct library

The second image below shows the generated documentation for the same construct library, but this time for TypeScript developers:

Generated sample code and documentation for the same library in TypeScript

All construct libraries published to the Construct Hub must be open-source. This enables users to exercise their good judgment and perform due diligence to verify that the libraries meet their security and compliance needs, just as they would with any other third-party package source consumed in their applications. Issues with a published construct library can be raised on the library’s GitHub repository using convenient links accessible from the hub entry for the library.

The Construct Hub employs a trust-through-transparency model. Users can report libraries for abuse by clicking the ‘Report abuse’ link in the hub, which will engage AWS Support teams to investigate the issue and remove the offending packages from Construct Hub listings if problems are found. Users can also send us feedback by clicking a ‘Provide feedback to Construct Hub’ link, which allows them to open an issue on our GitHub repository. And last but not least, they can click ‘Provide feedback to publisher’, which redirects to the repository the publisher provided with the package.

Feedback links in the Construct Hub

Just like the AWS CDK, the Construct Hub is open-source, built as a construct, and is, in fact, itself available on the Construct Hub! If you’re interested, you can see how the CDK team uses the CDK to develop the hub in their GitHub repository.

Construct Hub - on the Construct Hub!

Get Started with the AWS CDK Version 2 and the Construct Hub, Today
If you’ve built CDK applications to define your cloud infrastructure using version 1 of the AWS Cloud Development Kit (AWS CDK), then I encourage you to take a look at the documented changes for version 2 and see how the new version can help simplify your project setup going forward. And, if you’re interested in sharing new constructs with the wider community, please get involved with the Construct Hub.

— Steve

Network Address Management and Auditing at Scale with Amazon VPC IP Address Manager

Post Syndicated from Steve Roberts original https://aws.amazon.com/blogs/aws/network-address-management-and-auditing-at-scale-with-amazon-vpc-ip-address-manager/

Managing, monitoring, and auditing IP address allocation for at-scale networks, as the growth in cloud workloads and connected devices continues at a rapid pace, is a complex, time-consuming, and potentially error-prone task. Traditionally, network administrators have resorted to using combinations of spreadsheets, home-grown tools, and scripts to track address assignments across multiple accounts, virtual private clouds (VPCs), and Regions. Manually updating spreadsheets when application development teams request IP address assignments takes time, and care, to avoid errors. Errors which, should they go unnoticed, can lead to address conflicts and subsequent downtime, causing serious operational and business issues. In turn, the time taken to make these updates, sometimes several days, causes delays in onboarding new applications or expanding existing applications, impacting the velocity of development teams. The need to keep those home-grown tools and scripts up-to-date and error-free also results in taking staff hours away from more strategic and business-impacting projects.

Today, I’m happy to announce Amazon VPC IP Address Manager, a new feature that provides network administrators with an automated IP management workflow. IPAM makes it easier for network administrators to organize, assign, monitor, and audit IP addresses in at-scale networks, lowering the management and monitoring burden and eliminating the manual processes that can lead to delays and unintended errors.

Amazon VPC IP Address Manager dashboard homepage

Introducing Amazon VPC IP Address Manager
IPAM enables management and auditing of IP address assignments across an organization’s accounts, Amazon Virtual Private Cloud (VPC)‘s, and AWS Regions, using a single operational dashboard. From this centralized view, you can manage your IP addresses across AWS.

In each Region in which you have resources needing IP addresses, you create a regional pool. Pools are collections of CIDRs and help you to organize your IP space. Unused address space from your top-level pools can be used to fill your regional pools. Further, if you have applications or environments with different security needs, you can create additional pools. For example, you could create different pools for ‘dev’ and ‘prod’ environments if they are subject to different connectivity requirements. The screenshots below illustrate the process of creating a global pool and, from it, three regional pools. Although my example stops after configuring regional pools, in production, you would continue subdividing the regional pools further as needed.

Creating the global IPAM pool

Next, I configure a set of regional pools. Below, I’m creating a regional pool for my US East (N. Virginia) Region resources, scoped within my global pool.

Creating a regional pool, step 1

As part of configuring a regional pool, I must specify the CIDRs to provision from the global pool and can optionally enable automatic discovery of resources and rules for allocation.

Configuring a regional pool

After repeating the process of creating and configuring regional pools for my two remaining Regions, US East (Ohio) and Europe (Ireland) in this example, this is my final pool hierarchy. As I noted above, this hierarchy ends at a regional set of pools but could be subdivided further.

IPAM pool hierarchy

Once the IPAM pools have been configured, development teams and resources needing new IP address assignments are able to make use of an automated, self-service process, unblocking the developers, and eliminating errors from using manual processes that can lead to connectivity issues. To govern IP address assignments, you can make use of automated and simple business rules. With IPAM‘s self-service model, developers can now directly create resources and receive IP addresses based on business rules in seconds, removing the delays in onboarding applications and improving the velocity of the development team. In the screenshot below, I’m referencing my pools to set the address ranges to be used when creating a new VPC.

Assigning address ranges for a new VPC from IPAM pools

You can also share your IPAM with your organization, created using AWS Organizations, and AWS Resource Access Manager (RAM). When you share your IPAM, you gain fully automated CIDR allocation to your Amazon VPCs across member accounts in your organization and Regions.

For network administrators, IPAM provides observability and auditing capabilities, helping to speed up troubleshooting, and providing oversight and monitoring of the used and unused addresses across an organization’s global network address pool using a single dashboard. For each assigned address, IPAM tracks critical information, for example, the AWS account, the VPC, routing, and the security domain, eliminating the bookkeeping work that burdens administrators. Having used IPAM to eliminate IP assignment errors, customers can use IPAM to monitor assigned addresses and receive alerts when potential issues are detected – for example, depleting IP addresses that can stall their network’s growth or overlapping IP addresses that can result in erroneous routing. You can proactively act on those alerts and fix issues before they can become major outages.

The screenshot below illustrates monitoring pool utilization across a set of VPCs.

Monitoring an IPAM pool

Utilization of address space within a pool can also be monitored. You can add Amazon CloudWatch Alarms that you can configure to trigger at your chosen utilization percentage value so that you can take proactive action before the address space is exhausted.

Monitoring pool utilization with alarms

Overlapping address spaces are another headache that network administrators need to manage, usually discovered after the fact during an outage. IPAM can help lower the burden here, too, providing a view of resources that warns of overlapping address ranges.

Detecting overlapping address spaces

To further help troubleshoot network issues and audits of network security and routing policies, network administrators can also take advantage of the current and historical data that IPAM makes available to gain usage insights.

IPAM historical insights

IPAM works with any VPC resource where an IP address needs to be assigned, including public and private addresses and Elastic IP Addresses (EIP), and also supports bring your own IP (BYOIP) for both IPv4 and IPv6 addresses.

Start managing and auditing your IP addresses at scale today
Amazon VPC IP Address Manager is available today in all commercial AWS Regions. Get started today, first creating your IPAM for all Regions and accounts, then creating your pools, and finally setting application policy. Then, you can take advantage of IPAM to automate IP address assignment, monitor, troubleshoot, and audit your network addresses assignments.

For those of you with existing VPCs, after you create IPAM it will start monitoring, without any action on your part, to create an inventory of all your VPCs and EIPs. Once you create pools, IPAM will then backfill your VPCs into the pool. This means you can create VPCs today, using your existing workflow, and use IPAM for monitoring and audit only. Later on, you can switch your workflow to IPAM-based automated VPC assignment.

— Steve

Improved, Automated Vulnerability Management for Cloud Workloads with a New Amazon Inspector

Post Syndicated from Steve Roberts original https://aws.amazon.com/blogs/aws/improved-automated-vulnerability-management-for-cloud-workloads-with-a-new-amazon-inspector/

Amazon Inspector is a service used by organizations of all sizes to automate security assessment and management at scale. Amazon Inspector helps organizations meet security and compliance requirements for workloads deployed to AWS, scanning for unintended network exposure, software vulnerabilities, and deviations from application security best practice.

Since the original launch of Amazon Inspector in 2015, vulnerability management for cloud customers has changed considerably. Over the last six years, the team delivered several new customer-requested features, including assessment reporting, support for proxy environments, and integration with Amazon CloudWatch Metrics. However, the team also recognized that there were new requirements to meet – enabling frictionless deployment at scale, support for an expanded set of resource types needing assessment, and a critical need to detect and remediate at speed. Today I’m happy to announce a new Amazon Inspector, able to meet these requirements with the following features:

  • Continual, automated assessment scans—replaces periodic, manual scanning.
  • Automated resource discovery – once enabled, the new Amazon Inspector automatically discovers all running Amazon Elastic Compute Cloud (Amazon EC2) instances and Amazon Elastic Container Registry repositories.
  • New support for container-based workloads—workloads are now assessed on both EC2 and container infrastructure.
  • Integration with AWS Organizations—allowing security and compliance teams to enable and take advantage of Amazon Inspector across all accounts in an organization.
  • Removal of the stand-alone Amazon Inspector scanning agent—assessment scanning now uses the widely deployed AWS Systems Manager agent, eliminating the need for a separate agent installation.
  • Improved risk scoring—a highly contextualized risk score is now generated for each finding by correlating Common Vulnerability and Exposures (CVE) metadata with environmental factors for resources, such as network accessibility. This makes it easier to identify the most critical vulnerabilities to address as a priority.
  • Integration with Amazon EventBridge—integrate with event management and workflow systems such as Splunk and Jira. And, you can trigger automated remediation, for example, system patching using Systems Manager or virtual machine image rebuilds using EC2 Image Builder.
  • Integration with AWS Security Hub—helping your teams to more easily identify those resources with critical vulnerabilities or deviations from security best practices.

Automatically Assessing your Workloads with Amazon Inspector
Tens of thousands of vulnerabilities exist, with new ones being discovered and made public on a regular basis. With this continually growing threat, manual assessment can lead to customers being unaware of an exposure and thus potentially vulnerable between assessments. Additionally, customers with manual processes for managing their inventories of applications resources, the deployment of stand-alone security agents on those resources, and the scheduling of periodic assessments may find the whole process to be a costly and time-consuming exercise. That’s before they have to then sift through the mass of assessment findings to determine the most critical issues to address.

With the new Amazon Inspector, all you need to do is enable the service. It will auto-discover and start continual assessment of your EC2 and your Amazon Elastic Container Registry-based container workloads to evaluate your security posture, even as the underlying resources change.

EC2 instances are discovered and assessed for unintended exposure to external networks and software vulnerabilities using the Systems Manager agent, already included by default in images provided by AWS for instance management, automated patching, and more. Container-based workloads are assessed as the images are pushed to Amazon Elastic Container Registry. Without needing additional software or agents, container images and EC2 instances are assessed in near real time when an event occurs.

Automated assessment is driven by changes in workload configuration and newly published vulnerabilities to ensure resources are only assessed when needed. The new Amazon Inspector collects events from over 50 vulnerability intelligence sources, including CVE, the National Vulnerability Database (NVD), and MITRE. Images that may be affected by a newly identified entry, for example, a new CVE notification, will be automatically rescanned. Image rescanning is enabled for 30 days from the date they are pushed to the registry. You can also enable an option to only scan on image push and not subsequently perform rescans.

Summary page for Amazon Inspector

Selecting either Accounts, Instances, or Repositories from your Dashboard page takes you to a detail summary for the selected resource. Below, I’m viewing summary data for EC2 instances across a couple of accounts.

Viewing instances scanned by Amazon Inspector across accounts

If vulnerabilities are found, you receive actionable assessment findings in a report. Starting today, these findings are summarized with enhanced risk scoring and improved resource detail to help you prioritize the most at-risk resources needing to be addressed. Also new today, the Amazon Inspector console has been redesigned to surface all findings and recommendations for remediation.

Vulnerabilities in container images are also sent to Amazon Elastic Container Registry to be summarized for the owner. And, as I noted earlier, new integrations with AWS Security Hub and Amazon EventBridge allow findings to be sent downstream for additional visibility and remediation by automated workflows. For example, automation can be created to isolate instances, trigger system patching, software image rebuilds, and more. The availability of multiple integration points makes it easier for security and application teams to collaborate to manage remediation. Below, I’m viewing findings from Amazon Inspector in the AWS Security Hub console.

Viewing findings from Amazon Inspector in the Security Hub console

Assessments can result in hundreds of thousands, or more, findings that need to be filtered and sifted to determine the most critical to action. Also available today, organizations can determine which of the findings they consider to be acceptable and mark those findings for temporary or permanent suppression. This helps reduce the volume of alerts, further assisting with prioritization and automated remediation. Suppression filters can be set from several screens. Rules specify one or more filters, such as Severity, that will cause findings that match the filters to be removed from display. When defining rules, a list is shown of the findings that will be suppressed, helping you fine-tune the filter values to match your specific needs.

Setting up suppression rules for Amazon Inspector findings

I mentioned earlier that the new Amazon Inspector implements a contextualized risk assessment score for findings. The screenshot below shows an example of Amazon Inspector‘s risk assessment score, compared to a generic Common Vulnerability Scoring System (CVSS) score. Contextual risk assessment takes into account additional factors such as accessibility to the internet and ease of exploitability to make the score more meaningful. In the image below, Amazon Inspector‘s risk assessment score is lower than the CVSS score because the attack vector requires network access. Amazon Inspector knows that the vulnerability identified in the GNOME Glib will be difficult to exploit because in this resource, there is no network access, and therefore it lowered the risk score.

Risk assessment score

Start a Free Trial with Amazon Inspector Today
The new Amazon Inspector is available now in the US East (Ohio), US East (N. Virginia), US West (Oregon), Asia Pacific (Hong Kong), Asia Pacific (Mumbai), Asia Pacific (Seoul), Asia Pacific (Singapore), Asia Pacific (Sydney), Asia Pacific (Tokyo), Canada (Central), Europe (Frankfurt), Europe (Ireland), Europe (London), Europe (Milan), Europe (Paris), Europe (Stockholm), Middle East (Bahrain), and South America (São Paulo) Regions.

Amazon Inspector offers a free 15-day trial, so you can put it to work to see how Amazon Inspector can help your security and compliance teams reduce operational complexity and cost associated with managing resource inventories, stand-alone security agents, and repetitive manual assessments.

— Steve

Announcing Pull Through Cache Repositories for Amazon Elastic Container Registry

Post Syndicated from Steve Roberts original https://aws.amazon.com/blogs/aws/announcing-pull-through-cache-repositories-for-amazon-elastic-container-registry/

Organizations, development teams, and individual developers who have chosen to use containers to host their applications may prefer, or perhaps are required, to source all images from Amazon Elastic Container Registry to take advantage of its high availability and security. To satisfy those requirements, customers have needed to take on the burden of manually pulling images from public registries into their private Amazon Elastic Container Registry repositories, and then keeping them in sync. This adds operational complexity and maintenance costs, thereby impacting developer productivity. Additionally, some registries may have limitations or restrictions on how frequently images can be downloaded. When reached, those limitations then begin impacting developers and the release velocity of their business, due to build errors when image pulls are throttled, or even rejected.

Today, we have announced pull through cache repository support in Amazon Elastic Container Registry, for publicly accessible registries that do not require authentication. Pull through cache repositories offer developers the improved performance, security, and availability of Amazon Elastic Container Registry for container images that they source from public registries. Images in pull through cache repositories are automatically kept in sync with the upstream public registries, thereby eliminating the manual work of pulling images and periodically updating.

Pull through cache repositories provide the benefits of the built-in security capabilities in Amazon Elastic Container Registry, such as AWS PrivateLink enabling you to keep all of the network traffic private, image scanning to detect vulnerabilities, encryption with AWS Key Management Service (KMS) keys, cross-region replication, and lifecycle policies. When enabled, cross-region replication is designed to automatically distribute updated images to additional Regions. All you need to do is update the pull URL so that the image is downloaded from the relevant Region.

When consuming images from pull through cache repositories, download throttling is also no longer a problem for developers, as well as the build and deployment infrastructure that supports their applications. While Amazon Elastic Container Registry is designed to automatically keep the cache repository in sync, you can also manually sync a repository at any time. And, if you wish, the automatic sync can be turned off.

Getting Started with Amazon Elastic Container Registry Pull Through Cache Repositories
Setting up pull through cache repositories is a simple process. For the following example, I’m using Amazon Elastic Container Registry Public in the South America (São Paulo) Region as my upstream registry.

First, I must modify my private registry’s settings to add a rule that references the upstream, publicly accessible registry (multiple rules can be set if I need additional upstream registries). In the Amazon Elastic Container Registry console, I begin by selecting Private registry, and then select Edit in the Pull through cache panel to change settings. This takes me to the Pull through cache configuration page, where I select Add rule.

On the Create pull through cache rule page, I choose the upstream registry, which is ECR Public in this example. I also must set a namespace that I’ll use when referring to images in my pull commands. For this example, I’ll accept the suggested namespace, ecr-public.

Configuring ECR Public as the upstream registry

Selecting Save takes me back to the Pull through cache configuration page where my newly configured rule is listed. Now, I’m ready to utilize the cache repository when pulling images.

Newly configured rule for an upstream registry

To reference an image, I must specify the namespace that I chose in the pull URL, using the URL format <accountId>.dkr.ecr.<region>.amazonaws.com/<namespace>/<sourcerepo>:<tag>. When images are pulled, the cache repository associated with the namespace is checked for the image. In my case, the cache repository doesn’t exist yet, but I don’t have to create it myself. The image is fetched from the upstream repository in the public registry associated with the namespace, and then stored in a new cache repository that is created for me automatically.

In the command prompt session below, I first authenticate with my registry, and then pull an Amazon Linux 2 image from Amazon Elastic Container Registry Public into the cache:

C:\ aws ecr get-login-password --region sa-east-1 | docker login --username AWS --password-stdin 111122223333.dkr.ecr.sa-east-1.amazonaws.com/ecr-public
Login Succeeded
C:\ docker pull 111122223333.dkr.ecr.sa-east-1.amazonaws.com/ecr-public/amazonlinux/amazonlinux:latest
latest: Pulling from ecr-public/amazonlinux/amazonlinux
e11e8d46e102: Pull complete
Digest: sha256:916dbbb288948b54c94b5b9f0769085aa601d4468d099e90d8a7da5cfa551b50
Status: Downloaded newer image for 111122223333.dkr.ecr.sa-east-1.amazonaws.com/ecr-public/amazonlinux/amazonlinux:latest
111122223333.dkr.ecr.us-west-2.amazonaws.com/ecr-public/amazonlinux/amazonlinux:latest

In my Amazon Elastic Container Registry console, a check of the Repositories page shows that a new private repository has been created containing the image I pulled, together with an indication that a pull through cache is active.

Pulled image in the cache repository

Working with images and the pull through cache repository is just as straightforward in Dockerfiles. All I need do is reference the image I need using the namespace in the pull URL. If the image is not in the cache repository, then it will be pulled and stored there for me. Cached images are checked once per 24 hours to verify if the cached image is the latest version, with the timer based off the last pull time of the cached image.

Start using Pull through Cache Repositories Today
Pull through cache repositories for Amazon Elastic Container Registry are available for you to take advantage of today in all commercial AWS Regions. There is no charge for using pull through cache repositories, only standard Amazon Elastic Container Registry pricing for storage and data transfer charges applies. You can find more details on pricing at the Amazon Elastic Container Registry pricing page. Learn more about pull through cache repositories in the Amazon Elastic Container Registry User Guide, and get started today.

— Steve

Scalable, Cost-Effective Disaster Recovery in the Cloud

Post Syndicated from Steve Roberts original https://aws.amazon.com/blogs/aws/scalable-cost-effective-disaster-recovery-in-the-cloud/

Should disaster strike, business continuity can require more than just periodic data backups. A full recovery that meets the business’s recovery time objectives (RTOs) must also include the infrastructure, operating systems, applications, and configurations used to process their data. The growing threats of ransomware highlight the need to be able to perform a full point-in-time recovery. For businesses affected by a ransomware attack, restoration of data from an old, possibly manual, backup will not be sufficient.

Previously, businesses have elected to provision separate, physical disaster recovery (DR) infrastructure. However, customers tell us this can be both space- and cost-prohibitive, involving capital expenditure on hardware and facilities that remain idle until called upon. The infrastructure also incurs overhead in terms of regular inspection and maintenance, typically manual, to ensure that should it ever be called upon, it’s ready and able to handle the current business load, which may have grown considerably since initial provisioning. This also makes testing difficult and expensive.

Today, I am happy to announce AWS Elastic Disaster Recovery (DRS) a fully scalable, cost-effective disaster recovery service for physical, virtual, and cloud servers, based on CloudEndure Disaster Recovery. DRS enables customers to use AWS as an elastic recovery site without needing to invest in on-premises DR infrastructure that lies idle until needed. Once enabled, DRS maintains a constant replication posture for your operating systems, applications, and databases. This helps businesses meet recovery point objectives (RPOs) of seconds, and RTOs of minutes, after disaster strikes. In cases of ransomware attacks, for example, DRS also allows recovery to a previous point in time.

DRS provides for recovery that scales as needed to match your current setup and does not need any time-consuming manual processes to maintain that readiness. It also offers the ability to perform disaster recovery readiness drills. Just as it’s important to test restoration of data from backups, being able to conduct recovery drills in a cost-effective manner without impacting ongoing replication or user activities can help give confidence that you can meet your objectives and customer expectations should you need to call on a recovery.

AWS Elastic Disaster Recovery console home

Elastic Disaster Recovery in Action
Once enabled, DRS continuously replicates block storage volumes from physical, virtual, or cloud-based servers, allowing it to support business RPOs measured in seconds. Recovery includes applications running on physical infrastructure, VMware vSphere, Microsoft Hyper-V, and cloud infrastructure to AWS. You’re able to recover all your applications and databases that run on supported Windows and Linux operating systems, with DRS orchestrating the recovery process for your servers on AWS to support an RTO measured in minutes.

Using an agent that you install on your servers, DRS securely replicates the data to a staging area subnet in a selected Region in your AWS account. The staging area subnet reduces costs to you, using affordable storage and minimal compute resources. Within the DRS console, you can recover Amazon Elastic Compute Cloud (Amazon EC2) instances in a different AWS Region if required. With DRS automating replication and recovery procedures, you can set up, test, and operate your disaster recovery capability using a single process without the need for specialized skill sets.

DRS gives you the flexibility to pay on an hourly basis, instead of needing to commit to a long-term contract or a set number of servers, a benefit over on-premises or data center recovery solutions. DRS charges hourly, on a pay-as-you-go basis. You can find specific details on pricing at the product page.

Exploring Elastic Disaster Recovery
To set up disaster recovery for my resources I first need to configure my default replication settings. As I mentioned earlier, DRS can be used with physical, virtual, and cloud servers. For this post, I’m going to use a collection of EC2 instances as my source servers for disaster recovery.

From the DRS console home, shown earlier, choosing Set default replication settings takes me to a short initialization wizard. In the wizard, I first need to select an Amazon Virtual Private Cloud (VPC) subnet that will be used for staging. This subnet does not need to be in the same VPC as my resources, but I need to select one that is not private or blocked to the world. Below, I’ve chosen a subnet from my default VPC in my Region. I can also change the instance type used for the replication instance. I chose to keep the suggested default and clicked Next to proceed.

Choosing the staging area subnet and replication instance type for DRS

I also left the default settings unchanged for the next two pages. In Volumes and security groups, the wizard suggests I use the general-purpose SSD (gp3) Amazon Elastic Block Store (EBS) storage type and to use a security group provided by DRS. On the Additional settings page I can elect to use a private IP for data replication instead of routing over the public internet, and set the snapshot retention period, which defaults to seven days. Clicking Next one final time, I arrive at the Review and create page of the wizard. Choosing Create default completes the process of configuring my default replication settings.

Finalizing default replication settings for DRS

With my replication settings finalized (I can edit them later if I wish, from the Actions menu on the Source servers console page) it’s time to set up my servers. I’m running a test fleet in EC2 that includes two Windows Server 2019 instances, and three Amazon Linux 2 instances. The DRS User Guide contains full instructions on how to obtain and set up the agent on each server type, so I won’t repeat them here. As I run and configure the agent on each of my server instances, the Source servers list automatically updates to include the new source server. The status of the initial sync, and future replication and recovery status of each source server, are summarized in this view.

Replication sync activity on servers

Selecting a hostname entry in the list takes me to a detail page. Here I can view a recovery dashboard, information on the underlying server, disk settings (including the ability to change the staging disk type from the default gp3 type selected by the initialization wizard, or whatever you choose during setup), and launch settings, shown below, that govern the recovery instance that will be created if I choose to initiate a drill or an actual recovery job.

DRS launch settings for a recovery server

Just like data backups, where established best practice is to periodically verify that the backups can actually be used to restore data, we recommend a similar best practice for disaster recovery. So, with my servers all configured and fully replicated, I decided to start a drill for a point-in-time (PIT) recovery for two of my servers. On these instances, following initial replication, I’d installed some additional software. In my scenario, perhaps this installation had gone badly wrong, or I’d fallen victim to a ransomware attack. Either way, I wanted to know and be confident that I could recover my servers if and when needed.

In the Source servers list I selected the two servers that I’d modified and from the Initiate recovery job drop-down menu, chose Initiate drill. Next, I can choose the recovery PIT I’m interested in. This view defaults to Any, meaning it lists all recovery PIT snapshots for the servers I selected. Or, I can choose to filter to All, meaning only PIT snapshots that apply to all the selected servers will be listed. Selecting All, I chose a time just after I’d completed installing additional software on the instances, and clicked Initiate drill.

Selecting a recovery point-in-time for multiple servers

I’m returned to the Source servers list, which shows status as the recovery proceeds. However, I switched to the Recovery job history view for more detail.

In-progress recovery drill

Clicking the job ID, I can drill down further to view a detail page of the source servers involved in the recovery (and can drill down further for each), as well as an overall recovery job log.

Viewing the recovery job log

Note – during a drill, or an actual recovery, if you go to the EC2 console you’ll notice one or more additional instances, started by DRS, running in your account (in addition to the replication server). These temporary instances, named AWS Elastic Disaster Recovery Conversion Server, are used to process the PIT snapshots onto the actual recovery instance(s) and will be terminated when the job is complete.

Once the recovery is complete, I can see two new instances in my EC2 environment. These are in the state matching the point-in-time recovery I selected, and are using the instance types I selected earlier in the DRS initialization wizard. I can now connect to them to verify that the recovery drill performed as expected before terminating them. Had this been a real recovery, I would have the option of terminating the original instances to replace them with the recovery versions, or handle whatever other tasks are needed to complete the disaster recovery for my business.

New instances matching my point-in-time recovery selection

Set Up Your Disaster Recovery Environment Today
AWS Elastic Disaster Recovery is generally available now in the US East (N. Virginia), US East (Ohio), US West (Oregon), Asia Pacific (Singapore), Asia Pacific (Sydney), Asia Pacific (Tokyo), Europe (Frankfurt), Europe (Ireland), and Europe (London) Regions. Review the AWS Elastic Disaster Recovery User Guide for more details on setup and operation, and get started today with DRS to eliminate idle recovery site resources, enjoy pay-as-you-go billing, and simplify your deployments to improve your disaster recovery objectives.

— Steve

New Strategy Recommendations Service Helps Streamline AWS Cloud Migration and Modernization

Post Syndicated from Steve Roberts original https://aws.amazon.com/blogs/aws/new-strategy-recommendations-service-helps-streamline-aws-cloud-migration-and-modernization/

Determining viable strategies for successful application migration and modernization to the cloud takes time. It can also require significant effort, depending on the size and complexity of the application portfolio to analyze. To date, the analysis process has been largely manual and nonstandard in nature, making it difficult to apply at scale on large portfolios. Limited time to make decisions, a lack of domain knowledge and cloud expertise, and low awareness of the available modernization tools and services can compound the effort and complexity.

Today, I’m pleased to announce AWS Migration Hub Strategy Recommendations to help automate the analysis of your application portfolios. Strategy Recommendations analyzes your running applications to determine runtime environments and process dependencies, optionally analyzes source code and databases, and more. The data collected from analysis is assessed against a set of business objectives that you prioritize, such as license cost reduction, speed of migration, reducing operational overhead from using managed services, or modernizing infrastructure using cloud-native technologies. Then, it produces recommendations of viable paths to migrate and modernize your applications.

Any given application could have multiple paths for migration and modernization, including rehosting, replatforming, or refactoring. You’ll get recommendations on all viable paths, and you can elect to override the recommendations as you see fit. Everyone can use Strategy Recommendations, regardless of experience, to lower the effort and time required and complexity involved in assessing application portfolios, whether they’re on premises awaiting migration or already in the AWS Cloud pending further modernization.

Taking as an example a typical N-tier application, an ASP.NET web application with a Microsoft SQL Server database, Strategy Recommendations helps you analyze the various components such as the servers hosting the web front end, the backend servers, and the database itself to determine viable paths and tools you can use to migrate and modernize onto the AWS Cloud. For instance, if your goal is to reduce licensing costs for the application, Strategy Recommendations may recommend you to refactor your application to .NET on Linux using the Porting Assistant for .NET.

Registering your Application Servers for Strategy Recommendations
Registration of the servers hosting your application portfolio with AWS Application Discovery Service is a prerequisite for Strategy Recommendations. The servers to register can be running on-premises as physical servers or virtual machines (VMs), or they can be Amazon Elastic Compute Cloud (Amazon EC2) instances for applications you’ve already migrated with a “lift-and-shift” process. You can find details on the different options for registering your application servers in the AWS Application Discovery Service User Guide.

Automated Data Collection for Analysis
With your servers registered in AWS Application Discovery Service, you can set up automated collection of the process level analysis of your application portfolio using an agentless data collector provided by Strategy Recommendations. The agentless collector can be downloaded as an Open Virtualization Appliance (OVA) for VMWare vCenter environments. If you’ve already migrated some or all of your applications to EC2, there’s also an EC2 Amazon Machine Image (AMI), which includes the collector, to help further analyze these applications for modernization opportunities.

If you don’t want, or cannot use, automated collection methods, or you’ve already collected this data using another tool or service, then you can instead manually import the data for analysis. However, the recommendations you obtain for manually imported data won’t be as in-depth as those originating from automated data collection. One additional benefit of automated collection is that it’s much easier to refresh the data as you progress, too.

Application and process discovery on your servers is language-agnostic. For .NET and Java applications in GitHub and GitHub Enterprise repositories and Microsoft SQL Server databases, you can optionally include detection of cloud anti-patterns. It’s important to note that if you elect to have source code or database analysis performed, no actual code or data is uploaded to Strategy Recommendations; only the results of the analysis are sent. By the way, if you elect to manually import your data for analysis, the option to perform deeper source code and database analysis is not supported.

Analyzing your Application Portfolio
Full details on how to set up automated data collection, the analysis options, and other important prerequisites can be found in the Strategy Recommendations User Guide, so I won’t go into further detail here. Instead, I want to look at how you can start analyzing an application portfolio that’s already been migrated to EC2, with an intent to modernize further, using the agentless collector. As mentioned earlier, Strategy Recommendations supports analysis of application portfolios hosted on physical on-premises servers or virtual machines, or (as shown in this post) on EC2 instances.

To start collection of data for analysis, I need to follow a small number of steps:

  1. Start and configure the Strategy Recommendations agentless collector, using either the downloadable OVA or the provided EC2 AMI.
  2. Configure each of the Windows and Linux instances hosting my applications to allow access from the collector.
  3. Configure my initial business priorities and other application and database preferences to get my initial recommendations. I can fine-tune these options later.

My first stop is at the Migration Hub console, where I click Strategy in the navigation panel to take me to the Get started page. On clicking any of the Download data collector, Download import template, or Get recommendations buttons, I’m first asked to agree to the creation of a service-linked role, granting Strategy Recommendations the necessary permissions to access other services on my behalf. Once I agree, I start at the Configure data sources page of a short wizard. Here, I can view a list of any previously registered collectors. I can also download the OVA version of the data collector and an import template for any application data I want to import manually, outside of automated collection.

Initial data source configuration page

I’m going to use the EC2 AMI-based collector so, before proceeding with this wizard, I open the EC2 console in a new browser tab to launch it. To find the image for the Strategy Recommendations data collector I can either go to the AMIs page, select Public images, and filter by owner 703163444405, or, from the Launch Instances wizard, enter the name AWSMHubApplicationDataCollector in the Search field. Once I’ve found the image, I proceed through the launch wizard as I would for any other AMI.

Configuration of the collector is a simple process, and I’m guided using a series of questions. As I mentioned earlier, full information is in the user guide that I linked to, so I won’t go into every detail here. To start the configuration process, I first use SSH to connect to my collector instance and then run a Docker container, using the command docker exec -it application-data-collector bash. In the running container, I start the configuration Q&A with the command collector setup. During the process, you’re asked to supply data for the following items of information:

  1. Usage agreement and confirmation that all required roles have been set up, followed by a set of AWS access and secret keys.
  2. For on-premises Windows application servers that are not managed by vCenter, or EC2 Windows instances, I need to provide a user ID and password that will allow the collector to connect to my servers using WinRM.
  3. If I have any Linux application servers, I can choose whether the collector connects using SSH or certificate-based authentication.
  4. Finally, I can configure source code analysis for .NET and Java applications in repositories on GitHub or GitHub Enterprise. These require a Git username and personal access token (PAT). I can also configure additional, deeper, source code analysis for C# applications. This does, however, require a separate server running Windows, on which I’ve installed the Porting Assistant for .NET.

Once I have completed these steps, my data collector is registered and ready to start inspecting my servers. Back on the Strategy Recommendations Configure data sources page, I refresh the page and can now see my collector listed.

Registered data collector

The second step is to enable access from the collector to my application servers, details for which can be found in the Step 4: Set up the Strategy Recommendations collector topic of the user guide. For my Windows Server, I used RDP to connect and then downloaded and ran two PowerShell scripts from links provided in the guide to configure WinRM. For larger server fleets, you might consider using AWS Systems Manager Automation to perform this task. For my Linux servers, having chosen to use SSH authentication for the collector, I needed to copy public key material generated during collector configuration process to each server.

At this point, the servers to be analyzed are known to AWS Application Discovery Service, the Strategy Recommendations data collector is configured, and each server is configured to allow access from the collector. It’s now time for my third and final step; namely, to set my business and other priorities for the analysis and let the service get to work to generate my recommendations.

Back in the Get started page in Strategy Recommendations, since my collector is registered and I have no manual application data to import, I just choose Next. This takes me to the Specify Preferences page, where I set my business priorities and other preferences. I can revise these and reanalyze at any time, but for now, I use drag and drop to set License cost reduction, Modernizing infrastructure using cloud-native technologies, and Reduce operational overhead with managed services as my highest priorities. I leave the remaining options, for application and database preferences, unchanged.

Configuring my business priorities and other settings for the analysis recommendations

Choosing Next, I reach the Review page, summarizing my choices, then choose Start data analysis. One item of note, the analysis runs against all servers that you’ve configured in Application Discovery Service, so you may see more servers being processed than you imported in the earlier step (servers not configured to allow access by the collector show up in results with a collection status of “data collection failed”).

With analysis complete, my recommendations are summarized (no anti-pattern analysis has been run yet).

Initial recommendations from server analysis

One of my servers is running Windows and hosts an older version of nopCommerce, originally a .NET Framework-based application, and a related SQL Server database. As my highest business priority was license cost reduction, I start my inspection at that server. The recommendations available so far are based on inspection of just the server itself. Analysis of the source code and components comprising the application may likely influence those recommendations, so I request further analysis of the application source code by drilling down to the server and application of interest.

Adding source code analysis for the server application

Code analysis creates a JSON-format report file in Amazon Simple Storage Service (Amazon S3), which when I open it, shows anti-patterns such as accessing log files using Windows file system paths instead of a cloud-based service such as Amazon CloudWatch, fixed IP addresses, a server-specific database connection, and more.

Following code analysis, the suggested recommendations update slightly from those based on just inspection of the servers. One application component that was originally recommended for a replatforming approach is now a candidate for refactoring.

Revised recommendations

Returning to my server of interest, clicking the Strategy options tab shows me the recommendations. The results of the code analysis have played a part in the weightings, along with my business priorities. The image below shows the initial recommendations, which are based on just analysis of the server itself.

The initial recommendations

Below are the revised recommendations for the server, following source code analysis.

Revised recommendations following source code analysis

The recommendations for the server also include replatforming the application’s SQL Server database to MySQL on Amazon Relational Database Service (RDS). This is suggested because in my priorities, I requested consideration of managed services. Before following this recommendation I may want to perform an additional anti-pattern analysis of the database, which I can do after creating a secret in AWS Secrets Manager to hold the database credentials (check the user guide topic on database analysis for more details). Analysis of databases, which is currently only available for SQL Server, identifies migration incompatibilities such as unsupported data types.

In the screenshots, you’ll notice additional viable paths for migration and modernization. This applies to both servers and application components. I can choose a viable path over the recommended strategy if I so want by selecting the viable strategy option and clicking Set preferred. In the screenshot below, for the nopCommerce application component, I’ve chosen to prefer the replatform route to containers for the application, using AWS App2Container. And of course, I can always rewind to the start and adjust my business priorities and other options and reanalyze my data.

Setting a preferred approach for a recommendation

Taking the initial recommendations, then using code and database analysis, or revising your priorities for analysis and the suggested recommendations, provides scope to experiment with multiple “what if” options to discover the optimal strategy for migrating and modernizing application portfolios to the cloud. Once that optimal strategy is determined, you can communicate it to downstream teams to begin the migration and modernization process for your application portfolio.

Get Recommendations for Migration and Modernization Today
You can get started analyzing your servers and application portfolios today with AWS Migration Hub Strategy Recommendations, at no extra charge, in the US East (N. Virginia), US West (Oregon), Asia Pacific (Sydney), Asia Pacific (Tokyo), Europe (Frankfurt), Europe (Ireland), and Europe (London) Regions. You can, of course, deploy the applications you choose to migrate and modernize based on recommendations from the tool to all Regions. As I noted earlier, you can find more details on prerequisites, getting started with the collector, and working with recommendations in the user guide.

— Steve

Monitor, Evaluate, and Demonstrate Backup Compliance with AWS Backup Audit Manager

Post Syndicated from Steve Roberts original https://aws.amazon.com/blogs/aws/monitor-evaluate-and-demonstrate-backup-compliance-with-aws-backup-audit-manager/

Today, I’m happy to announce the availability of AWS Backup Audit Manager, a new feature of AWS Backup that helps you monitor and evaluate the compliance status of your backups to meet business and regulatory requirements, and enables you to generate reports that help demonstrate compliance to auditors and regulators.

AWS Backup is a fully managed service that provides the ability to initiate policy-driven backups and restores of AWS applications, simplifying the process of protecting data at scale by removing the need for custom scripts and manual processes. However, customers still needed to use their own tooling for verifying that backup policies were being enforced and, as part of proving adherence to auditors, parsing backup transcripts to convert them into auditable reports.

With AWS Backup Audit Manager, you can now continuously and automatically track your backup activity, such as changes to a backup plan or backup vault, and generate automatic daily reports. AWS Backup Audit Manager provides built-in, customizable, compliance controls. Simply put, controls are procedures with backup policy parameters, for example the backup frequency or the retention period, that align with your business compliance and regulatory requirements.

You create a framework, scoped to an account and Region, and add the controls you need to it. Backup activities are tracked against the controls, automatically detecting violations of your defined data protection policies, enabling you to take quick corrective actions. To enable tracking of backup activities, AWS Backup Audit Manager requires you to enable monitoring through AWS Config for your backup plans (AWS::Backup::BackupPlan resource type), backup selection (AWS::Backup::BackupSelection), vaults (AWS::Backup::BackupVault), recovery points (AWS::Backup::RecoveryPoint), and AWS Config resource compliance (AWS::Config::ResourceCompliance). You can check the recording status of these resources in the AWS Backup console, using the Resource Tracking section of the Frameworks page.

Once you’ve added the controls you need to your framework, you deploy it. If you have different internal or regulatory standards to meet, you can create and deploy additional frameworks of controls. Once the framework is deployed, you can set up automatic daily reports of your backup activity. These are displayed in a dashboard, and you can also request on-demand reports at any time. You can also import your findings into AWS Audit Manager, a service I wrote about during AWS re:Invent 2020 in this news blog post.

This short video gives a brief overview of the new AWS Backup Audit Manager feature.

Available Controls and Backup Reports
AWS Backup Audit Manager provides five backup governance control templates and backup activity reporting on your backup jobs, copy jobs, and restore jobs. These reports improve visibility into backup activities for a single account and Region, helping you monitor your operational posture and identify failures that may need further action.

When creating a framework, you provide a name, an optional description, and you select whether to use the provided AWS Backup framework type, which includes five pre-defined controls, or you can opt to customize your framework.

Creating an AWS Backup Audit Manager framework

Choosing Custom framework expands the panel to show the available controls, their parameters, and the option to include or exclude them from your framework. The five available controls are titled Backup resources protected by backup plan, Backup plan minimum frequency and minimum retention, Backup prevent recovery point manual deletion, Backup recovery point encrypted, and Backup recovery point minimum retention. To the right of each control’s title you’ll find an info link that describes what the control evaluates, how frequently, and what it means for a resource to be compliant with the control.

Let’s examine a couple of controls. The Backup resources protected by backup plan control enables you to select all supported resources, or those identified by a tag, by type, or a particular resource. This control helps identify gaps in your backup coverage.

Backup resources protected by backup plan control resource selection

The Backup plan minimum frequency and minimum retention control has parameters governing how frequently the backup plan should be taking backups, and for how long recovery points should be maintained. The default settings require backups to occur every hour, and recovery points should be retained for a month, but you can customize the settings to meet your business compliance requirements.

Setting backup frequency and retention period controls

You complete your selections for the remaining controls, including them and setting appropriate parameter values for your needs, or excluding them from the framework, and then click Create framework to complete the process. The new framework will be created and deployed, which will take a few minutes. If needed, you can go back and edit the controls and parameters in a framework at any time.

Once deployed, the controls in the framework will start to evaluate compliance and you can inspect compliance status in the console by selecting the framework. The summary section reports the overall compliance status of the framework and the number of controls in the framework that are compliant or non-compliant, based on your deployed control definitions.

Summary of framework and control compliance

Below the summary, you’ll find a list containing compliance details for each of the controls in the framework, which can be filtered by status. Each control details whether it’s compliant or non-compliant, and how many resources monitored by the control are non-compliant. Clicking a control title will take you directly to the AWS Config dashboard, where you can view more details on the resources identified by the control.

Control compliance detail

Automated reports on backup activity can be used to demonstrate compliance to auditors and regulators. To set up reports, first click the Reports entry in the navigation toolbar, and then click Create report plan. You’ll be asked to select a report template.

Selecting audit report template

With the template selected (I chose Backup jobs report), you fill in a name and optional description, choose where in your Amazon Simple Storage Service (Amazon S3) buckets you want the report to be delivered, and the report file formats, and then click Create report plan. Your report will update every 24 hours, and you can run an on-demand report at any time.

Editing report settings

Once a report has been run, either automatically or on-demand, you can view the report data by first selecting the report in your Report plans list, followed by clicking View report. You’ll be taken directly to the chosen S3 location of the report files, where you’ll see one object (report) per chosen file type.

Selecting a report to view

Report files in Amazon S3

Downloading the file shows you the time period in which the resources were evaluated, the backup job details, failure or completion status, status messages, the resource type and backup plan, and more. Here I’ve opened the CSV format file in a spreadsheet.

Backup report data

Open Raven Launch Partnership
With this launch, we’re excited to have Open Raven join us as an AWS Backup partner. Open Raven is a cloud-native data security platform purpose-built for protecting modern data lakes and warehouses. From finding all data locations to proactively identifying exposure, their platform solves a broad spectrum of problems that organizations commonly face when living with large amounts of cloud-based data.

Open Raven Chief Technology Officer Mark Curphey had this to say about the new AWS Backup feature: “To successfully recover from a ransomware attack, organizations need to plan ahead by completing two foundational tasks, identifying critical data and systems and backing them up as per organizational requirements so that they can be protected and recovered. The combination of AWS Backup Audit Manager and Open Raven streamlines this effort, eliminating guesswork and hours of manual toil.”

Start Using AWS Backup Audit Manager Today
AWS Backup Audit Manager is available today in the US East (N. Virginia, Ohio), US West (N. California, Oregon), Canada (Central), EU (Frankfurt, Ireland, London, Paris, Stockholm), South America (Sao Paulo), Asia Pacific (Hong Kong, Mumbai, Seoul, Singapore, Sydney, Tokyo), and Middle East (Bahrain) Regions.

For more information about Backup Audit Manager, refer to this section in the AWS Backup Developer Guide. To get started, visit the AWS Backup console.

— Steve

Introducing a Public Registry for AWS CloudFormation

Post Syndicated from Steve Roberts original https://aws.amazon.com/blogs/aws/introducing-a-public-registry-for-aws-cloudformation/

AWS CloudFormation and the AWS Cloud Development Kit (CDK) provide scalable and consistent provisioning of AWS resources (for example, compute infrastructure, monitoring tools, databases, and more). We’ve heard from many customers that they’d like to benefit from the same consistency and scalability when provisioning resources from AWS Partner Network (APN) members, third-party vendors, and open-source technologies, regardless of whether they are using CloudFormation templates or have adopted the CDK to define their cloud infrastructure.

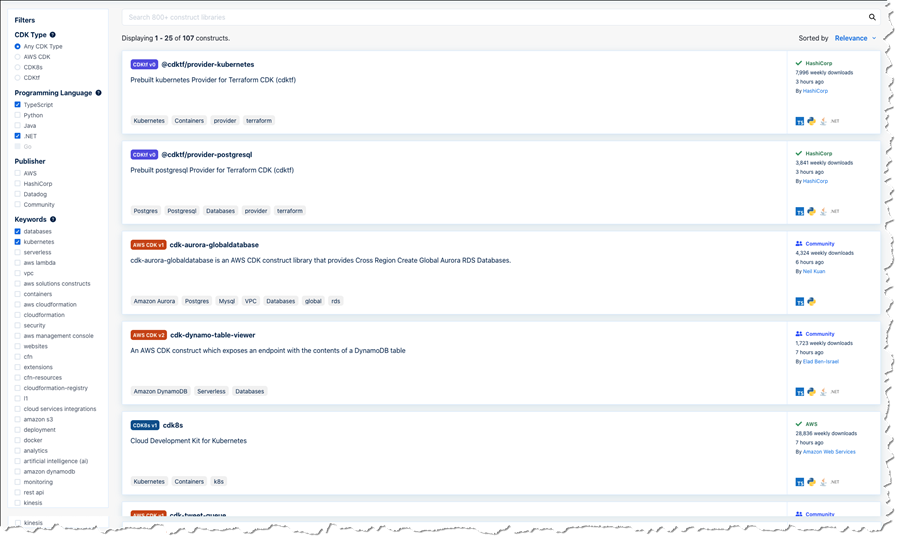
I’m pleased to announce a new public registry for CloudFormation, providing a searchable collection of extensions – resource types or modules – published by AWS, APN partners, third parties, and the developer community. The registry makes it easy to discover and provision these extensions in your CloudFormation templates and CDK applications in the same manner you use AWS-provided resources. Using extensions, you no longer need to create and maintain custom provisioning logic for resource types from third-party vendors. And, you are able to use a single infrastructure as code tool, CloudFormation, to provision and manage AWS and third-party resources, further simplifying the infrastructure provisioning process (the CDK uses CloudFormation under the hood).

Launch Partners
We’re excited to be joined by over a dozen APN Partners for the launch of the registry, with more than 35 extensions available for you to use today. Blog posts and announcements from the APN Partners who collaborated on this launch, along with AWS Quick Starts, can be found below (some will be added in the next few days).

Registries and Resource Types
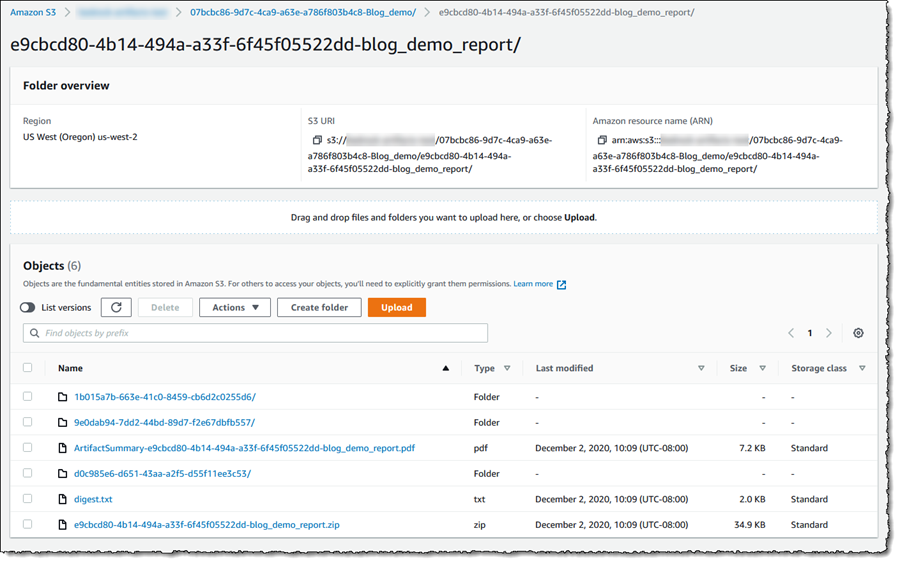
In 2019, CloudFormation launched support for private registries. These enabled registration and use of resource providers (Lambda functions) in your account, including providers from AWS and third-party vendors. After you registered a provider you could use resource types, comprised of custom provisioning logic, from the provider in your CloudFormation templates. Resource types were uploaded by providers to an Amazon Simple Storage Service (Amazon S3) bucket, and you used the types by referencing the relevant S3 URL. The public registry provides consistency in the sourcing of resource types and modules, and you no longer need to use a collection of Amazon Simple Storage Service (Amazon S3) buckets.

Third-party resource types in the public registry also integrate with drift detection. After creating a resource from a third-party resource type, CloudFormation will detect changes to the resource from its template configuration, known as configuration drift, just as it would with AWS resources. You can also use AWS Config to manage compliance for third-party resources consumed from the registry. The resource types are automatically tracked as Configuration items when you have configured AWS Config to record them, and used CloudFormation to create, update, and delete them. Whether the resource types you use are third-party or AWS resources, you can view configuration history for them, in addition to being able to write AWS Config rules to verify configuration best practices.

The public registry also supports Type Configuration, enabling you to configure third-party resource types with API keys and OAuth tokens per account and region. Once set, the configuration is stored securely and can be updated. This also provides a centralized way to configure third-party resource types.

Publishing Extensions to the Public Registry
Extension publishers must be verified as AWS Marketplace sellers, or as GitHub or BitBucket users, and extensions are validated against best practices. To publish extensions (resource types or modules) to the registry, you must first register in an AWS Region, using one of the mentioned account types.

After you’ve registered, you next publish your extension to a private registry in the same Region. Then, you need to test that the extension meets publishing requirements. For a resource type extension, this means it must pass all the contract tests defined for the type. Modules are subject to different requirements, and you can find more details in the documentation. With testing complete, you can publish your extension to the public registry for your Region. See the user guide for detailed information on publishing extensions.

Using Extensions in the Public Registry
I decided to try a couple of extensions related to Kubernetes, contributed by AWS Quick Starts, to make configuration changes to a cluster. Personally, I don’t have a great deal of experience with Kubernetes and its API so this was a great chance to examine how extensions could save me significant time and effort. During the process of writing this post I learned from others that using the Kubernetes API (the usual way to achieve the changes I had in mind) would normally involve effort even for those with more experience.

For this example I needed a Kubernetes cluster, so I followed this tutorial to set one up in Amazon Elastic Kubernetes Service (EKS), using the Managed nodes – Linux node type. With my cluster ready, I want to make two configuration changes.

First, I want to add a new namespace to the cluster. A namespace is a partitioning construct that lets me deploy the same set of resources to different namespaces in the same cluster without conflict thanks to the isolation namespaces provide. Second, I want to set up and use Helm, a package manager for Kubernetes. I’ll use Helm to install the kube-state-metrics package from the Prometheus helm-charts repository for gathering cluster metrics. While I can use CloudFormation to provision clusters and compute resources, previously, to perform these two configuration tasks, I’d have had to switch to the API or various bespoke tool chains. With the registry, and these two extensions, I can now do everything using CloudFormation (and of course, as I mentioned earlier, I could also use the extensions with the CDK, which I’ll show later).

Before using an extension, it needs to be activated in my account. While activation is easy to do for single accounts using the console, as we’ll see in a moment, if I were using AWS Organizations and wanted to activate various third-party extensions across my entire organization, or for a specific organization unit (OU), I could achieve this using Service-Managed StackSets in CloudFormation. Using the resource type AWS::CloudFormation::TypeActivation in a template submitted to a Service-Managed StackSet, I can target an entire Organization, or a particular OU, passing the Amazon Resource Name (ARN) identifying the third-party extension to be activated. Activation of extensions is also very easy to achieve (whether using AWS Organizations or not) using the CDK with just a few lines of code, again making use of the aforementioned TypeActivation resource type.

To activate the extensions, I head to the CloudFormation console and click Public extensions from the navigation bar. This takes me to the Registry:Public extensions home page, where I switch to viewing third party resource type extensions.

Viewing third-party types in the registry

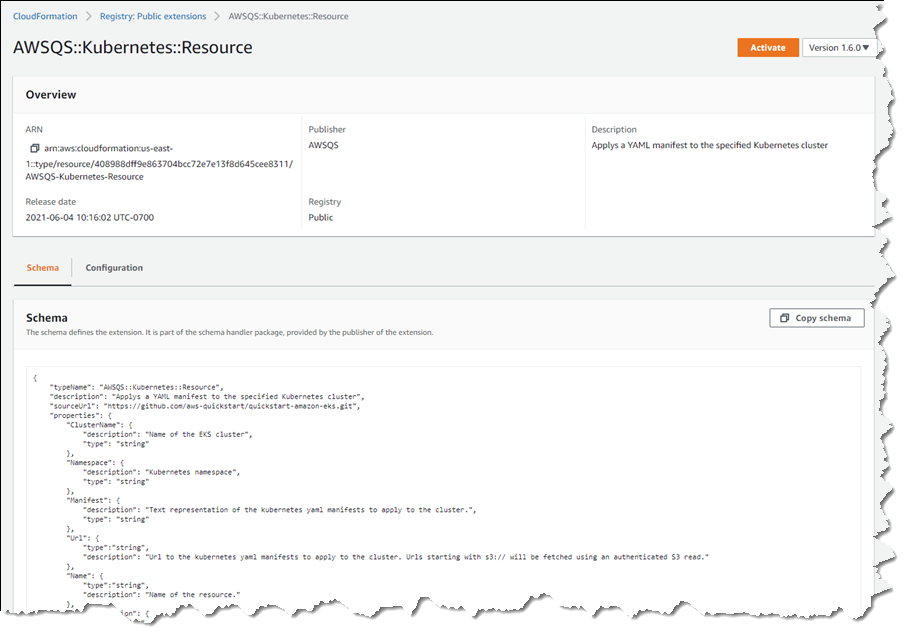
The extensions I want are AWSQS::Kubernetes::Resource and AWSQS::Kubernetes::Helm. The Resource extension is used to apply a manifest describing configuration changes to a cluster. In my case, the manifest requests a namespace be created. Clicking the name of the AWSQS::Kubernetes::Resource extension takes me to a page where I can view schema, configuration details, and versions for the extension.

Viewing details of the Resource extension

What happens if you deactivate an extension you’re using, or an extension is withdrawn by the publisher? If you deactivate an extension a stack depends on, any resources created from that extension won’t be affected, but you’ll be unable to perform further stack operations, such as Read, Update, Delete, and List (these will fail until the extension is re-activated). Publishers must request their extensions be withdrawn from the registry (there is no “delete” API). If the request is granted, customers who activated the extension prior to withdrawal can still perform Create/Read/Update/Delete/List operations, using what is effectively a snapshot of the extension in their account.

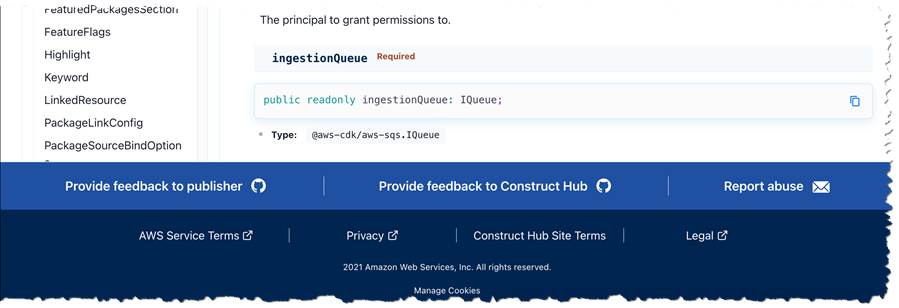
Clicking Activate takes me to a page where I need to specify the ARN of an execution role that CloudFormation will assume when it runs the code behind the extension. I create a role following this user guide topic, but the basic trust relationship is below for reference.

{
  "Version": "2012-10-17",
  "Statement": [
    {
      "Effect": "Allow",
      "Principal": {
        "Service": "resources.cloudformation.amazonaws.com"
      },
      "Action": "sts:AssumeRole"
    }
  ]
}

I also add permissions for the resource types I’m using to my execution role. Details on the permissions needed for the types I chose can be found on GitHub, for Helm, and for Kubernetes (note the GitHub examples include the trust relationship too).

When activating an extension, I can elect to use the default name, which is how I will refer to the type in my templates or CDK applications, or I can enter a new name. The name chosen has to be unique within my account, so if I’ve enabled a version of an extension with its default name, and want to enable a different version, I must change the name. Once I’ve filled in the details, and chosen my versioning strategy (extensions use semantic versioning, and I can elect to accept automatic updates for minor version changes, or to “lock” to a specific version) clicking Activate extension completes the process.

Activating an extension from the registry

That completes the process for the first extension, and I follow the same steps for the AWSQS::Kubernetes::Helm extension. Navigating to Activated extensions I can view a list of all my enabled extensions.

Viewing the list of enabled extensions

I have one more set of permissions to update. Resource types make calls to the Kubernetes API on my behalf so I need to update the aws-auth ConfigMap for my cluster to reference the execution role I just used, otherwise the calls made by the resource types I’m using will fail. To do this, I run the command kubectl edit cm aws-auth -n kube-system at a command prompt. In the text editor that opens, I update the ConfigMap with a new group referencing my CfnRegistryExtensionExecRole, shown below (if you’re following along, be sure to change the account ID and role name to match yours).

apiVersion: v1
data:
  mapRoles: |
    - groups:
      - system:bootstrappers
      - system:nodes
      rolearn: arn:aws:iam::111122223333:role/myAmazonEKSNodeRole
      username: system:node:{{EC2PrivateDNSName}}
    - groups:
      - system:masters
      rolearn: arn:aws:iam::111122223333:role/CfnRegistryExtensionExecRole
      username: cfnresourcetypes
kind: ConfigMap
metadata:
  creationTimestamp: "2021-06-04T20:44:24Z"
  name: aws-auth
  namespace: kube-system
  resourceVersion: "6355"
  selfLink: /api/v1/namespaces/kube-system/configmaps/aws-auth
  uid: dc91bfa8-1663-45d0-8954-1e841913b324

Now I’m ready to use the extensions to configure my cluster with a new namespace, Helm, and the kube-state-metrics package. I create a CloudFormation template that uses the extensions, adding parameters for the elements I want to specify when creating a stack: the name of the cluster to update, and the namespace name. The properties for the KubeStateMetrics resource reference the package I want Helm to install.

AWSTemplateFormatVersion: "2010-09-09"
Parameters:
  ClusterName:
    Type: String
  Namespace:
    Type: String
Resources:
  KubeStateMetrics:
    Type: AWSQS::Kubernetes::Helm
    Properties:
      ClusterID: !Ref ClusterName
      Name: kube-state-metrics
      Namespace: !GetAtt KubeNamespace.Name
      Repository: https://prometheus-community.github.io/helm-charts
      Chart: prometheus-community/kube-state-metrics
  KubeNamespace:
    Type: AWSQS::Kubernetes::Resource
    Properties:
      ClusterName: !Ref ClusterName
      Namespace: default
      Manifest: !Sub |
        apiVersion: v1
        kind: Namespace
        metadata:
          name: ${Namespace}
          labels:
            name: ${Namespace}

On the Stacks page of the CloudFormation console, I click Create stack, upload my template, and then give my stack a name and the values for my declared parameters.

Launching a stack with my activated extensions

I click Next to proceed through the rest of the wizard, leaving other settings at their default values, and then Create stack to complete the process.

Once stack creation is complete, I verify my changes using the kubectl command line tool. I first check that the new namespace, newsblog-sample-namespace, is present with the command kubectl get namespaces. I then run the kubectl get all --namespace newsblog-sample-namespace command to verify the kube-state-metrics package is installed.

Verifying the extensions applied by changes

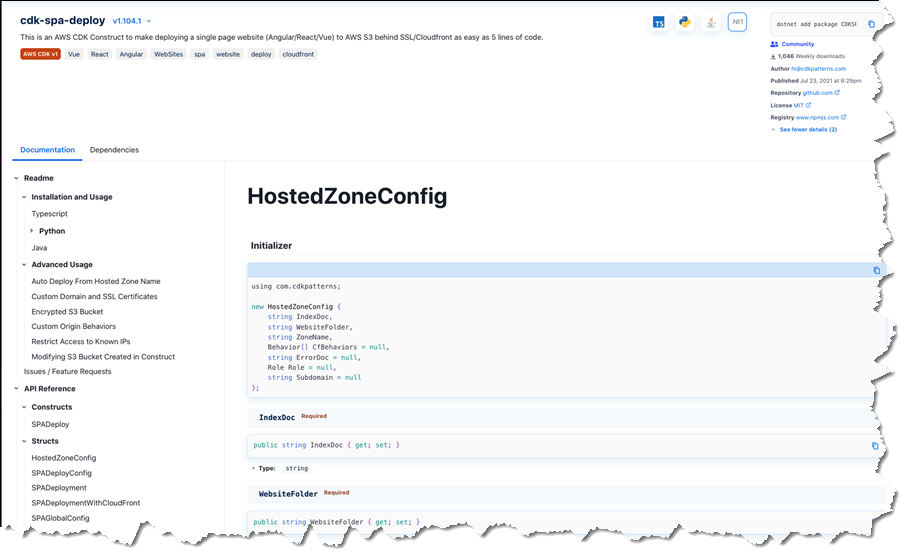
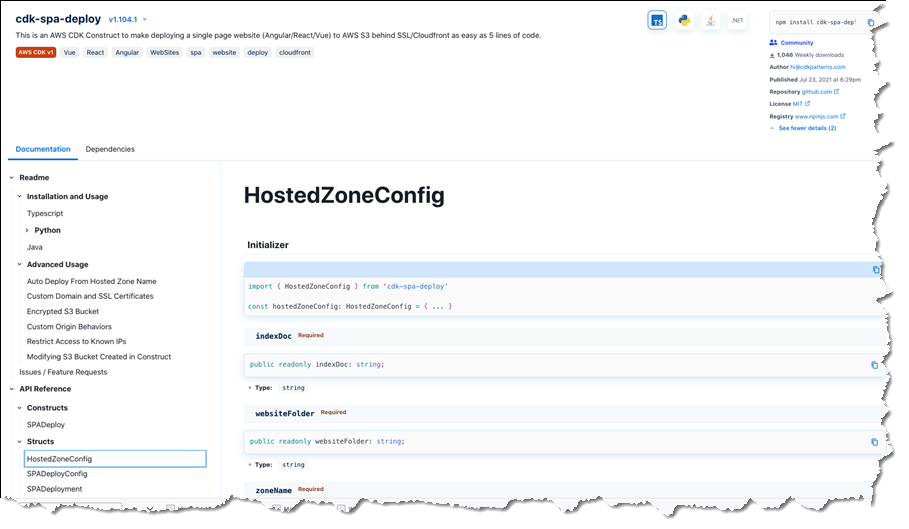
Extensions can also be used with the AWS Cloud Development Kit. To wrap up this exploration of using the new registry, I’ve included an example below of a CDK application snippet in TypeScript that achieves the same effect, using the same extensions, as the YAML template I showed earlier (I could also have written this using any of the languages supported by the CDK – C#, Java, or Python).

import {Stack, Construct, CfnResource} from '@aws-cdk/core';
export class UnoStack extends Stack {
  constructor(scope: Construct, id: string) {
    super(scope, id);
    const clusterName = 'newsblog-cluster';
    const namespace = 'newsblog-sample-namespace';

    const kubeNamespace = new CfnResource(this, 'KubeNamespace', {
      type: 'AWSQS::Kubernetes::Resource',
      properties: {
        ClusterName: clusterName,
        Namespace: 'default',
        Manifest: this.toJsonString({
          apiVersion: 'v1',
          kind: 'Namespace',
          metadata: {
            name: namespace,
            labels: {
              name: namespace,
            }
          },
        }),
      },
    });
    
    new CfnResource(this, 'KubeStateMetrics', {
      type: 'AWSQS::Kubernetes::Helm',
      properties: {
        ClusterID: clusterName,
        Name: 'kube-state-metrics',
        Namespace: kubeNamespace.getAtt('Name').toString(),
        Repository: 'https://prometheus-community.github.io/helm-charts',
        Chart: 'prometheus-community/kube-state-metrics',
      },
    });
  }
};

As mentioned earlier in this post, I don’t have much experience with the Kubernetes API, and Kubernetes in general. However, by making use of the resource types in the public registry, in conjunction with CloudFormation, I was able to easily configure my cluster using a familiar environment, without needing to resort to the API or bespoke tool chains.

Get Started with the CloudFormation Public Registry
Pricing for the public registry is the same as for the existing registry and private resource types. There is no additional charge for using native AWS resource types; for third-party resource types you will incur charges based on the number of handler operations (add, delete, list, etc.) you run per month. For details, see the AWS CloudFormation Pricing page. The new public registry is available today in the US East (N. Virginia, Ohio), US West (Oregon, N. California), Canada (Central), Europe (Ireland, Frankfurt, London, Stockholm, Paris, Milan), Asia Pacific (Hong Kong, Mumbai, Osaka, Singapore, Sydney, Seoul, Tokyo), South America (Sao Paulo), Middle East (Bahrain), and Africa (Cape Town) AWS Regions.

For more information, see the AWS CloudFormation User Guide and User Guide for Extension Development, and start publishing or using extensions today!

— Steve

Migrate Your Workloads with the Graviton Challenge!

Post Syndicated from Steve Roberts original https://aws.amazon.com/blogs/aws/migrate-your-workloads-with-the-graviton-challenge/

Today, Dave Brown, VP of Amazon EC2 at AWS, announced the Graviton Challenge as part of his session on AWS silicon innovation at the Six Five Summit 2021. We invite you to take the Graviton Challenge and move your applications to run on AWS Graviton2. The challenge, intended for individual developers and small teams, is based on the experiences of customers who’ve already migrated. It provides a framework of eight, approximately four-hour chunks to prepare, port, optimize, and finally deploy your application onto Graviton2 instances. Getting your application running on Graviton2, and enjoying the improved price performance, aren’t the only rewards. There are prizes and swag for those who complete the challenge!

AWS Graviton2 is a custom-built processor from AWS that’s based on the Arm64 architecture. It’s supported by popular Linux operating systems including Amazon Linux 2, Red Hat Enterprise Linux, SUSE Linux Enterprise Server, and Ubuntu. Compared to fifth-generation x86-based Amazon Elastic Compute Cloud (Amazon EC2) instance types, Graviton2 instance types have a 20% lower cost. Overall, customers who have moved applications to Graviton2 typically see up to 40% better price performance for a broad range of workloads including application servers, container-based applications, microservices, caching fleets, data analytics, video encoding, electronic design automation, gaming, open-source databases, and more.

Before I dive in to talk more about the challenge, check out the fun introductory video below from Jeff Barr, Chief Evangelist, AWS and Dave Brown, Vice President, EC2. As Jeff mentions in the video: same exact workload, same or better performance, and up to 40% better price performance!

After you complete the challenge, we invite you to tell us about your adoption journey and enter the contest. If you post on social media with the hashtag #ITookTheGravitonChallenge, you’ll earn a t-shirt. To earn a hoodie, include a short video with your post.

To enter the competition, you’ll need to create a 5 to 10-minute video that describes your project and the application you migrated, any hurdles you needed to overcome, and the price performance benefits you realized.

All valid contest entries will each receive a $500 AWS credit (limited to 500 quantity). A panel of judges will evaluate the content entries and award additional prizes across six categories. All category winners will receive an AWS re:Invent 2021 conference pass, flight, and hotel for one company representative, and winners will be able to meet with senior members of the Graviton2 team at the conference. Here are additional category-specific prizes:

  • Best adoption – enterprise
    Based on the performance gains, total cost savings, number of instances the workload is running on, and time taken to migrate the workload (faster is better), for companies with over 1000 employees. The winner will also receive a chance to present at the conference.
  • Best adoption – small/medium business
    Based on the performance gains, total cost savings, number of instances the workload is running on, and time taken to migrate the workload (faster is better), for companies with 100-1000 employees. The winner will also receive a chance to present at the conference.
  • Best adoption – startup
    Based on the performance gains, total cost savings, number of instances the workload is running on, and time taken to migrate the workload (faster is better), for companies with fewer than 100 employees. The winner will also receive a chance to present at the conference.
  • Best new workload adoption
    Awarded to a workload that’s new to EC2 (migrated to Graviton2 from on-premises, or other cloud) based on the performance gains, total cost savings, number of instances the workload is running on, and time taken to migrate the workload (faster is better). The winner will also receive a chance to participate in a video or written case study.
  • Most impactful adoption
    Awarded to the workload with the biggest social impact based on details provided about what the workload/application does. Applications in this category are related to fields such as sustainability, healthcare and life sciences, conservation, learning/education, justice/equity. The winner will also receive a chance to participate in a video or written case study.
  • Most innovative adoption
    Applications in this category solve unique problems for their customers, address new use cases, or are groundbreaking. The award will be based on the workload description, price performance gains, and total cost savings. The winner will also receive a chance to participate in a video or written case study.

Competition submissions open on June 22 and close August 31. Winners will be announced on October 1 2021.

Identifying a workload to migrate
Now that you know what’s possible with Graviton2, you’re probably eager to get started and identify a workload to tackle as part of the challenge. The ideal workload is one that already runs on Linux and uses open-source components. This means you’ll have full access to the source code of every component and can easily make any required changes. If you don’t have an existing Linux workload that is entirely open-source based, you can, of course, move other workloads. A robust ecosystem of ISVs and AWS services already support Graviton2. However, if you are using software from a vendor that does not support Arm64/Graviton2, reach out to the Graviton Challenge Slack channel for support.

What’s involved in the challenge?
The challenge includes eight steps performed over four days (but you don’t have to do the challenge in four consecutive days). If you need assistance from Graviton2 experts, a dedicated Slack channel is available and you can sign up for emails containing helpful tips and guidance. In addition to support on Slack and supporting emails, you also get $25 AWS credit to cover the cost of the taking the challenge. Graviton2-based burstable T4g instances also have a free trial, available until December 31 2021, that can be used to qualify your workloads.

You can download the complete whitepaper can be downloaded from the Graviton Challenge page, but here is an outline of the process.

Day 1: Learn and explore
The first day you’ll learn about Graviton2 and then assess your selected workload. I recommend that you start by checking out the 2020 AWS re:Invent session, Deep dive on AWS Graviton2 processor-powered EC2 instances. The Getting Started with AWS Graviton GitHub repository will be a useful reference as you work through the challenge.

Assessment involves identifying the application’s dependencies and requirements. As with all preparatory work, the more thorough you are at this stage, the better positioned you are for success. So, don’t skimp on this task!

Day 2: Create a plan and start porting
On the second day, you’ll create a Graviton2 environment. You can use EC2 virtual machine instances with AWS-provided images or build your own custom images. Alternatively, you can go the container route, because both Amazon Elastic Container Service (Amazon ECS) and Amazon Elastic Kubernetes Service (EKS) support Graviton2-based instances.

After you have created your environment, you’ll bootstrap the application. The Getting Started Guide on GitHub contains language-specific getting started information. If your application uses Java, Python, Node.js, .NET, or other high-level languages, then it might run as-is or need minimal changes. Other languages like C, C++, or Go will need to be compiled for the 64-bit Arm architecture. For more information, see the guides on GitHub.

Day 3: Debug and optimize
Now that the application is running on a Graviton2 environment, it’s time to test and verify its functionality. When you have a fully functional application, you can test performance and compare it to x86-64 environments. If you don’t observe the expected performance, reach out to your account team, or get support on the Graviton Challenge Slack channel. We’re here to help analyze and resolve any potential performance gaps.

Day 4: Update infrastructure and start deployments
It’s shipping day! You’ll update your infrastructure to add Graviton2-based instances, and then start deploying. We recommend that you use canary or blue-green deployments so that a portion of your traffic is redirected to the new environments. When you’re comfortable, you can transition all traffic.

At this point, you can celebrate completing the challenge, publish a post on social media using the #ITookTheGravitonChallenge hashtag, let us know about your success, and consider entering the competition. Remember, entries for the competition are due by August 31, 2021.

Start the challenge today!
Now that you have some details about the challenge and rewards, it’s time to start your (migration) engines. Download the whitepaper from the Graviton Challenge landing page, familiarize yourself with the details, and off you go! And, if you do decide to enter the competition, good luck!

Footnote
In my role as a .NET Developer Advocate at AWS, I would be remiss if I failed to mention that this challenge is equally applicable to .NET applications using .NET Core or .NET 5 and later! In fact, .NET 5 includes ARM64-specific optimizations. For information about performance improvements my colleagues found for .NET applications running on AWS Graviton2, see the Powering .NET 5 with AWS Graviton2: Benchmarks blog post. There’s also a lab for .NET 5 on Graviton2. I invite you to check out the getting started material for .NET in the aws-graviton-getting-started GitHub repository and start migrating.

— Steve

New – AWS Systems Manager Consolidates Application Management

Post Syndicated from Steve Roberts original https://aws.amazon.com/blogs/aws/new-aws-systems-manager-consolidates-application-management/

A desire for consolidated, and simplified operational oversight isn’t limited to just cloud infrastructure. Increasingly, customers ask us for a “single pane of glass” approach for also monitoring and managing their application portfolios.

These customers tell us that detection and investigation of application issues takes additional time and effort, due to the typical use of multiple consoles, tools, and sources of information such as resource usage metrics, logs, and more, to enable their DevOps engineers to obtain context about the application issue under investigation. Here, an “application” means not just the application code but also the logical group of resources that act as a unit to host the application, along with ownership boundaries for operators, and environments such as development, staging, and production.

Today, I’m pleased to announce a new feature of AWS Systems Manager, called Application Manager. Application Manager aggregates operational information from multiple AWS services and Systems Manager capabilities into a single console, making it easier to view operational data for your applications.

To make it even more convenient, the service can automatically discover your applications. Today, auto-discovery is available for applications running in AWS CloudFormation stacks and Amazon Elastic Kubernetes Service (EKS) clusters, or launched using AWS Launch Wizard. Applications can also be discovered from Resource Groups.

A particular benefit of automated discovery is that application components and resources are automatically kept up-to-date on an ongoing basis, but you can also always revise applications as needed by adding or deleting components manually.

With applications discovered and consolidated into a single console, you can more easily diagnose operational issues and resolve them with minimal time and effort. Automated runbooks targeting an application component or resource can be run to help remediate operational issues. For any given application, you can select a resource and explore relevant details without needing to leave the console.

For example, the application can surface Amazon CloudWatch logs, operational metrics, AWS CloudTrail logs, and configuration changes, removing the need to engage with multiple tools or consoles. This means your on-call engineers can understand issues more quickly and reduce the time needed to resolve them.

Exploring an Application with Application Manager
I can access Application Manager from the Systems Manager home page. Once open, I get an overview of my discovered applications and can see immediately that there are some alarms, without needing to switch context to the Amazon CloudWatch console, and some operations items (“OpsItems”) that I might need to pay attention to. I can also switch to the Applications tab to view the collections of applications, or I can click the buttons in the Applications panel for the collection I’m interested in.

Screenshot of the <span title="">Application Manager</span> overview page

In the screenshot below, I’ve navigated to a sample application and again, have indicators showing that alarms have raised. The various tabs enable me to drill into more detail to view resources used by the application, config resource and rules compliance, monitoring alarms, logs, and automation runbooks associated with the application.

Screenshot of application components and overview

Clicking on the Alarm indicator takes me into the Monitoring tab, and it shows that the ConsumedWriteCapacityUnits alarm has been raised. I can change the timescale to zero in on when the event occurred, or I can use the View recent alarms dashboard link to jump into the Amazon CloudWatch Alarms console to view more detail.

Screenshot of alarms on the <span title="">Application Manager</span> Monitoring tab

The Logs tab shows me a consolidated list of log groups for the application, and clicking a log group name takes me directly to the CloudWatch Logs where I can inspect the log streams, and take advantage of Log Insights to dive deeper by querying the log data.

OpsItems shows me operational issues associated with the resources of my application, and enables me to indicate the current status of the issue (open, in progress, resolved). Below, I am marking investigation of a stopped EC2 instance as in progress.

Screenshot of <span title="">Application Manager</span> OpsItems tab

Finally, Runbooks shows me automation documents associated with the application and their execution status. Below, it’s showing that I ran the AWS-RestartEC2Instance automation document to restart the EC2 instance that was stopped, and I would now resolve the issue logged in the OpsItems tab.

Screenshot of <span title="">Application Manager</span>'s Runbooks tab

Consolidating this information into a single console gives engineers a single starting location to monitor and investigate issues arising with their applications, and automatic discovery of applications and resources makes getting started simple. AWS Systems Manager Application Manager is available today, at no extra charge, in all public AWS Regions where Systems Manager is available.

Learn more about Application Manager and get started at AWS Systems Manager.

— Steve

New – AWS Systems Manager Fleet Manager

Post Syndicated from Steve Roberts original https://aws.amazon.com/blogs/aws/new-aws-systems-manager-fleet-manager/

Organizations, and their systems administrators, routinely face challenges in managing increasingly diverse portfolios of IT infrastructure across cloud and on-premises environments. Different tools, consoles, services, operating systems, procedures, and vendors all contribute to complicate relatively common, and related, management tasks. As workloads are modernized to adopt Linux and open-source software, those same systems administrators, who may be more familiar with GUI-based management tools from a Windows background, have to continually adapt and quickly learn new tools, approaches, and skill sets.

AWS Systems Manager is an operational hub enabling you to manage resources on AWS and on-premises. Available today, Fleet Manager is a new console based experience in Systems Manager that enables systems administrators to view and administer their fleets of managed instances from a single location, in an operating-system-agnostic manner, without needing to resort to remote connections with SSH or RDP. As described in the documentation, managed instances includes those running Windows, Linux, and macOS operating systems, in both the AWS Cloud and on-premises. Fleet Manager gives you an aggregated view of your compute instances regardless of where they exist.

All that’s needed, whether for cloud or on-premises servers, is the Systems Manager agent installed on each server to be managed, some AWS Identity and Access Management (IAM) permissions, and AWS Key Management Service (KMS) enabled for Systems Manager‘s Session Manager. This makes it an easy and cost-effective approach for remote management of servers running in multiple environments without needing to pay the licensing cost of expensive management tools you may be using today. As noted earlier, it also works with instances running macOS. With the agent software and permissions set up, Fleet Manager enables you to explore and manage your servers from a single console environment. For example, you can navigate file systems, work with the registry on Windows servers, manage users, and troubleshoot logs (including viewing Windows event logs) and monitor common performance counters without needing the Amazon CloudWatch agent to be installed.

Exploring an Instance With Fleet Manager
To get started exploring my instances using Fleet Manager, I first head to the Systems Manager console. There, I select the new Fleet Manager entry on the navigation toolbar. I can also select the Managed Instances option – Fleet Manager replaces Managed Instances going forward, but the original navigation toolbar entry will be kept for backwards compatibility for a short while. But, before we go on to explore my instances, I need to take you on a brief detour.

When you select Fleet Manager, as with some other views in Systems Manager, a check is performed to verify that a role, named AmazonSSMRoleForInstancesQuickSetup, exists in your account. If you’ve used other components of Systems Manager in the past, it’s quite possible that it does. The role is used to permit Systems Manager to access your instances on your behalf and if the role exists, then you’re directed to the requested view. If however the role doesn’t exist, you’ll first be taken to the Quick Setup view. This in itself will trigger creation of the role, but you might want to explore the capabilities of Quick Setup, which you can also access any time from the navigation toolbar.

Quick Setup is a feature of Systems Manager that you can use to set up specific configuration items, such as the Systems Manager and CloudWatch agents on your instances (and keep them up-to-date), and also IAM roles permitting access to your resources for Systems Manager components. For this post, all the instances I’m going to use already have the required agent set up, including the role permissions, so I’m not going to discuss this view further but I encourage you to check it out. I also want to remind you that to take full advantage of Fleet Manager‘s capabilities you first need to have KMS encryption enabled for your instances and secondly, the role attached to your Amazon Elastic Compute Cloud (EC2) instances must have the kms:Decrypt role permission included, referencing the key you selected when you enabled KMS encryption. You can enable encryption, and select the KMS key, using the Preferences section of the Session Manager console, and of course you can set up the role permission in the IAM console.

That’s it for the diversion; if you have the role already, as I do, you’ll now be at the Managed instances list view. If you’re at Quick Setup instead, simply click the Fleet Manager navigation button once more.

The Managed instances view shows me all of my instances, in the cloud or on-premises, that I can access. Selecting an instance, in this case an EC2 Windows instance launched using AWS Elastic Beanstalk, and clicking Instance actions presents me with a menu of options. The options (less those specific to Windows) are available for my Amazon Linux instance too, and for instances running macOS I can use the View file system option.

Screenshot of <span title="">Fleet Manager</span>'s Managed instances view

The File system view displays a read-only view onto the file system of the selected instance. This can be particularly useful for viewing text-based log files, for example, where I can preview up to 10,000 lines of a log file and even tail it to view changes as the log updates. I used this to open and tail an IIS web server log on my Windows Server instance. Having selected the instance, I next select View file system from the Instance actions dropdown (or I can click the Instance ID to open a view onto that instance and select File system from the menu displayed on the instance view).

Having opened the file system view for my instance, I navigate to the folder on the instance containing the IIS web server logs.

Screenshot of <span title="">Fleet Manager</span>'s File system view

Selecting a log file, I then click Actions and select Tail file. This opens a view onto the log file contents, which updates automatically as new content is written.

Screenshot of tailing a log file in <span title="">Fleet Manager</span>

As I mentioned, the File system view is also accessible for macOS-based instances. For example, here is a screenshot of viewing the Applications folder on an EC2 macOS instance.

Screenshot of macOS file system view in <span title="">Fleet Manager</span>

Next, let’s examine the Performance counters view, which is available for both Windows and Linux instances. This view displays CPU, memory, network traffic, and disk I/O and will be familiar to Windows users from Task Manager. The metrics shown reflect the guest OS metrics, whereas EC2 instance metrics you may be used to relate to the hypervisor. On this particular instance I’ve deployed an ASP.NET Core 5 application, which generates a varying length collection of Fibonacci numbers on page refresh. Below is a snapshot of the counters, after I’ve put the instance under a small amount of load. The view updates automatically every 5 seconds.

Screenshot of <span title="">Fleet Manager</span>'s Performance Counters view

There are more views available than I have space for in this post. Using the Windows Registry view, I can view and edit the registry on the selected Windows instance. Windows event logs gives me access to the Application and Service logs, and common Windows logs such as System, Setup, Security, etc. With Users and groups I can manage users or groups, including assignment of users to groups (again for both Windows and Linux instances). For all views, Fleet Manager enables me to use a single and convenient console.

Getting Started
AWS Systems Manager Fleet Manager is available today for use with managed instances running Windows, Linux, and macOS. Information on pricing, for this and other Systems Manager features, can be found at this page.

Learn more, and get started with Fleet Manager today, at AWS Systems Manager.

— Steve

AWS Audit Manager Simplifies Audit Preparation

Post Syndicated from Steve Roberts original https://aws.amazon.com/blogs/aws/aws-audit-manager-simplifies-audit-preparation/

Gathering evidence in a timely manner to support an audit can be a significant challenge due to manual, error-prone, and sometimes, distributed processes. If your business is subject to compliance requirements, preparing for an audit can cause significant lost productivity and disruption as a result. You might also have trouble applying traditional audit practices, which were originally designed for legacy on-premises systems, to your cloud infrastructure.

To satisfy complex and evolving sets of regulation and compliance standards, including the General Data Protection Regulation (GDPR), Health Insurance Portability and Accountability Act (HIPAA), and Payment Card Industry Data Security Standard (PCI DSS), you’ll need to gather, verify, and synthesize evidence.

You’ll also need to constantly reevaluate how your AWS usage maps to those evolving compliance control requirements. To satisfy requirements you may need to show data encryption was active, and log files showing server configuration changes, diagrams showing application high availability, transcripts showing required training was completed, spreadsheets showing that software usage did not exceed licensed amounts, and more. This effort, sometimes involving dozens of staff and consultants, can last several weeks.

Available today, AWS Audit Manager is a fully managed service that provides prebuilt frameworks for common industry standards and regulations, and automates the continual collection of evidence to help you in preparing for an audit. Continuous and automated gathering of evidence related to your AWS resource usage helps simplify risk assessment and compliance with regulations and industry standards and helps you maintain a continuous, audit-ready posture to provide a faster, less disruptive preparation process.

Built-in and customizable frameworks map usage of your cloud resources to controls for different compliance standards, translating evidence into an audit-ready, immutable assessment report using auditor-friendly terminology. You can also search, filter, and upload additional evidence to include in the final assessment, such as details of on-premises infrastructure, or procedures such as business continuity plans, training transcripts, and policy documents.

Given that audit preparation typically involves multiple teams, a delegation workflow feature lets you assign controls to subject-matter experts for review. For example, you might delegate reviewing evidence of network security to a network security engineer.

The finalized assessment report includes summary statistics and a folder containing all the evidence files, organized in accordance with the exact structure of the associated compliance framework. With the evidence collected and organized into a single location, it’s ready for immediate review, making it easier for audit teams to verify the evidence, answer questions, and add remediation plans.

Getting started with Audit Manager
Let’s get started by creating and configuring a new assessment. From Audit Manager‘s console home page, clicking Launch AWS Audit Manager takes me to my Assessments list (I can also reach here from the navigation toolbar to the left of the console home). There, I click Create assessment to start a wizard that walks me through the settings for the new assessment. First, I give my assessment a name, optional description, and then specify an Amazon Simple Storage Service (S3) bucket where the reports associated with the assessment will be stored.

Next, I choose the framework for my assessment. I can select from a variety of prebuilt frameworks, or a custom framework I have created myself. Custom frameworks can be created from scratch or based on an existing framework. Here, I’m going to use the prebuilt PCI DSS framework.

Screenshot of framework selectionAfter clicking Next, I can select the AWS accounts to be included in my assessment (Audit Manager is also integrated with AWS Organizations). Since I have a single account, I select it and click Next, moving on to select the AWS services that I want to be included in evidence gathering. I’m going to include all the suggested services (the default) and click Next to continue.

Screenshot of service selection for assessmentNext I need to select the owners of the assessment, who have full permission to manage it (owners can be AWS Identity and Access Management (IAM) users or roles). You must select at least one owner, so I select my account and click Next to move to the final Review and create page. Finally, clicking Create assessment starts the gathering of evidence for my new assessment. This can take a while to complete, so I’m going to switch to another assessment to examine what kinds of evidence I can view and choose to include in my assessment report.

Back in the Assessments list view, clicking on the assessment name takes me to details of the assessment, a summary of the controls for which evidence is being collected, and a list of the control sets into which the controls are grouped. Total evidence tells me the number of events and supporting documents that are included in the assessment. The additional tabs can be used to give me insight into the evidence I select for the final report, which accounts and services are included in the assessment, who owns it, and more. I can also navigate to the S3 bucket in which the evidence is being collected.

Screenshot of assessment home pageExpanding a control set shows me the related controls, with links to dive deeper on a given control, together with the status (Under review, Reviewed, and Inactive), whom the control has been delegated to for review, the amount of evidence gathered for that control, and whether the control and evidence have been added to the final report. If I change a control to be Inactive, meaning automated evidence gathering will cease for that control, this is logged.

Screenshot of assessment controlLet’s take a closer look at a control to show how the automated evidence gathering can help identify compliance issues before I start compiling the audit report. Expanding Default control set, I click control 8.1.2 For a sample of privileged user IDs… which takes me to a view giving more detailed information on the control and how it is tested. Scrolling down, there is a set of evidence folders listed and here I notice that there are some issues. Clicking the issue link in the Compliance check column summarizes where the data came from. Here, I can also select the evidence that I want included in my final report.

Screenshot of issue summaryGoing further, I can click on the evidence folder to note that there was a failure, and in turn clicking on the time of the failure takes me to a detailed summary of the issues for this control, and how to remediate.

Screenshot of evidence for a controlScreenshot of evidence detailWith the evidence gathered, it’s a simple task to select sufficient controls and appropriate evidence to include in my assessment report that can then be passed to my auditors. For the purposes of this post I’ve gone ahead and selected evidence for a handful of controls into my report. Then, I selected the Assessment report selection tab, where I review my evidence selections, and clicked Generate assessment report. In the dialog that appeared I gave my report a name, and then clicked Generate assessment report. When the dialog closes I am taken to the Assessment reports view and, when my report is ready, I can select it and download a zip file containing the report and the selected evidence. Alternatively, I can open the S3 bucket associated with the assessment (from the assessment’s details page) and view the report details and evidence there, as shown in the screenshot below. The overall report is listed (as a PDF file) and if I drill into the evidence folders, I can also view PDF files related to the specific items of evidence I selected.

Screenshot of assessment report output in S3And to close, below is a screenshot of the beginning of the assessment report PDF file showing the number of selected controls and evidence, and services that I selected to be in scope when I created the assessment. Further pages go into more details.

Screenshot of assessment reportAudit Manager is available today in 10 AWS Regions: US East (Northern Virginia, Ohio), US West (Northern California, Oregon), Asia Pacific (Singapore, Sydney, Tokyo), and Europe (Frankfurt, Ireland, London).

Get all the details about AWS Audit Manager and get started today.

— Steve

Using Amazon CloudWatch Lambda Insights to Improve Operational Visibility

Post Syndicated from Steve Roberts original https://aws.amazon.com/blogs/aws/using-amazon-cloudwatch-lambda-insights-to-improve-operational-visibility/

To balance costs, while at the same time ensuring the service levels needed to meet business requirements are met, some customers elect to continuously monitor and optimize their AWS Lambda functions. They collect and analyze metrics and logs to monitor performance, and to isolate errors for troubleshooting purposes. Additionally, they also seek to right-size function configurations by measuring function duration, CPU usage, and memory allocation. Using various tools and sources of data to do this can be time-consuming, and some even go so far as to build their own customized dashboards to surface and analyze this data.

We announced Amazon CloudWatch Lambda Insights as a public preview this past October for customers looking to gain deeper operational oversight and visibility into the behavior of their Lambda functions. Today, I’m pleased to announce that CloudWatch Lambda Insights is now generally available. CloudWatch Lambda Insights provides clearer and simpler operational visibility of your functions by automatically collating and summarizing Lambda performance metrics, errors, and logs in prebuilt dashboards, saving you from time-consuming, manual work.

Once enabled on your functions, CloudWatch Lambda Insights automatically starts collecting and summarizing performance metrics and logs, and, from a convenient dashboard, provides you with a one-click drill-down into metrics and errors for Lambda function requests, simplifying analysis and troubleshooting.

Exploring CloudWatch Lambda Insights
To get started, I need to enable Lambda Insights on my functions. In the Lambda console, I navigate to my list of functions, and then select the function I want to enable for Lambda Insights by clicking on its name. From the function’s configuration view I then scroll to the Monitoring tools panel, click Edit, enable Enhanced monitoring, and click Save. If you want to enable enhanced monitoring for many functions, you may find it more convenient to use AWS Command Line Interface (CLI), AWS Tools for PowerShell, or AWS CloudFormation approaches instead. Note that once enhanced monitoring has been enabled, it can take a few minutes before data begins to surface in CloudWatch.

Screenshot showing enabling of <span title="">Lambda Insights</span> In the Amazon CloudWatch Console, I start by selecting Performance monitoring beneath Lambda Insights in the navigation panel. This takes me to the Multi-function view. Metrics for all functions on which I have enabled Lambda Insights are graphed in the view. At the foot of the page there’s also a table listing the functions, summarizing some data in the graphs and adding Cold starts. The table gives me the ability to sort the data based on the metric I’m interested in.

Screenshot of metric graphs on the <span title="">Lambda Insights</span> Multi-function viewScreenshot of the <span title="">Lambda Insights</span> Multi-function view summary listAn interesting graph on this page, especially if you are trying to balance cost with performance, is Function Cost. This graph shows the direct cost of your functions in terms of megabyte milliseconds (MB-MS), which is how Lambda computes the financial charge of a function’s invocation. Hovering over the graph at a particular point in time shows more details.

Screenshot of function cost graphLet’s examine my ExpensiveFunction further. Moving to the summary list at the bottom of the page I click on the function name which takes me to the Single function view (from here I can switch to my other functions using the controls at the top of the page, without needing to return to the multiple function view). The graphs show me metrics for invocations and errors, duration, any throttling, and memory, CPU, and network usage on the selected function and to add to the detail available, the most recent 1000 invocations are also listed in a table which I can sort as needed.

Clicking View in the Trace column of a request in the invocations list takes me to the Service Lens trace view, showing where my function spent its time on that particular invocation request. I could use this to determine if changes to the business logic of the function might improve performance by reducing function duration, which will have a direct effect on cost. If I’m troubleshooting, I can view the Application or Performance logs for the function using the View logs button. Application logs are those that existed before Lambda Insights was enabled on the function, whereas Performance logs are those that Lambda Insights has collated across all my enabled functions. The log views enable me to run queries and in the case of the Performance logs I can run queries across all enabled functions in my account, for example to perform a top-N analysis to determine my most expensive functions, or see how one function compares to another.

Here’s how I can make use of Lambda Insights to check if I’m ‘moving the needle’ in the correct direction when attempting to right-size a function, by examining the effect of changes to memory allocation on function cost. The starting point for my ExpensiveFunction is 128MB. By moving from 128MB to 512MB, the data shows me that function cost, duration, and concurrency are all reduced – this is shown at (1) in the graphs. Moving from 512MB to 1024MB, (2), has no impact on function cost, but it further reduces duration by 50% and also affected the maximum concurrency. I ran two further experiments, first moving from 1024MB to 2048MB, (3), which resulted in a further reduction in duration but the function cost started to increase so the needle is starting to swing in the wrong direction. Finally, moving from 2048MB to 3008MB, (4), significantly increased the cost but had no effect on duration. With the aid of Lambda Insights I can infer that the sweet spot for this function (assuming latency is not a consideration) lies between 1024MB and 2048MB. All these experiments are shown in the graphs below (the concurrency graph lags slightly, as earlier invocations are finishing up as configuration changes are made).

Screenshot of function cost experiments

CloudWatch Lambda Insights gives simple and convenient operational oversight and visibility into the behavior of my AWS Lambda functions, and is available today in all regions where AWS Lambda is present.

Learn more about Amazon CloudWatch Lambda Insights in the documentation and get started today.

— Steve

Coming Soon – Amazon EC2 G4ad Instances Featuring AMD GPUs for Graphics Workloads

Post Syndicated from Steve Roberts original https://aws.amazon.com/blogs/aws/new-amazon-ec2-g4ad-instances-featuring-amd-gpus-for-graphics-workloads/

Customers with high performance graphic workloads, such as game streaming, animation, and video rendering for example, are always looking for higher performance with less cost. Today, I’m happy to announce new Amazon Elastic Compute Cloud (EC2) instances in the G4 instance family are in the works and will be available soon, to improve performance and reduce cost for graphics-intensive workloads. The new G4ad instances feature AMD’s latest Radeon Pro V520 GPUs and 2nd generation EPYC processors, and are the first in EC2 to feature AMD GPUs.

G4dn instances, released in 2019 and featuring NVIDIA T4 GPUs, were previously the most cost-effective GPU-based instances in EC2. G4dn instances are ideal for deploying machine learning models in production and also graphics-intensive applications. However, when compared to G4dn the new G4ad instances enable up to 45% better price performance for graphics-intensive workloads, including the aforementioned game streaming, remote graphics workstations, and rendering scenarios. Compared to an equally-sized G4dn instance, G4ad instances offer up to 40% improvement in performance.

G4dn instances will continue to be the best option for small-scale machine learning (ML) training and GPU-based ML inference due to included hardware optimizations like Tensor Cores. Additionally, G4dn instances are still best suited for graphics applications that need access to NVIDIA libraries such as CUDA, CuDNN, and NVENC. However, when there is no dependency on NVIDIA’s libraries, we recommend customers try the G4ad instances to benefit from the improved price and performance.

AMD Radeon Pro V520 GPUs in G4ad instances support DirectX 11/12, Vulkan 1.1, and OpenGL 4.5 APIs. For operating systems, customers can choose from Windows Server 2016/2019, Amazon Linux 2, Ubuntu 18.04.3, and CentOS 7.7. Instances using G4ad can be purchased as On-Demand, Savings Plan, Reserved Instances, or Spot Instances. Three instance sizes are available, from G4ad.4xlarge, with 1 GPU, to G4ad.16xlarge with 4 GPUs, as shown below.

Instance Size GPUs GPU Memory (GB) vCPUs Memory (GB) Storage EBS Bandwidth (Gbps) Network Bandwidth (Gbps)
g4ad.4xlarge 1 8 16 64 600 Up to 3 Up to 10
g4ad.8xlarge 2 16 32 128 1200 3 15
g4ad.16xlarge 4 32 64 256 2400 6 25

The new G4ad instances will be available soon in US East (N. Virginia), US West (Oregon), and Europe (Ireland).

Learn more about G4ad instances.

— Steve

Announcing a second Local Zone in Los Angeles

Post Syndicated from Steve Roberts original https://aws.amazon.com/blogs/aws/announcing-a-second-local-zone-in-los-angeles/

In December 2019, Jeff Barr published this post announcing the launch of a new Local Zone in Los Angeles, California. A Local Zone extends existing AWS regions closer to end-users, providing single-digit millisecond latency to a subset of AWS services in the zone. Local Zones are attached to parent regions – in this case US West (Oregon) – and access to services and resources is performed through the parent region’s endpoints. This makes Local Zones transparent to your applications and end-users. Applications running in a Local Zone have access to all AWS services, not just the subset in the zone, via Amazon’s redundant and very high bandwidth private network backbone to the parent region.

At the end of the post, Jeff wrote (and I quote) – “In the fullness of time (as Andy Jassy often says), there could very well be more than one Local Zone in any given geographic area. In 2020, we will open a second one in Los Angeles (us-west-2-lax-1b), and are giving consideration to other locations.”

Well – that time has come! I’m pleased to announce that following customer requests, AWS today launched a second Local Zone in Los Angeles to further help customers in the area (and Southern California generally) to achieve even greater high-availability and fault tolerance for their applications, in conjunction with very low latency. These customers have workloads that require very low latency, such as artist workstations, local rendering, gaming, financial transaction processing, and more.

The new Los Angeles Local Zone contains a subset of services, such as Amazon Elastic Compute Cloud (EC2), Amazon Elastic Block Store (EBS), Amazon FSx for Windows File Server and Amazon FSx for Lustre, Elastic Load Balancing, Amazon Relational Database Service (RDS), and Amazon Virtual Private Cloud, and remember, applications running in the zone can access all AWS services and other resources through the zone’s association with the parent region.

Enabling Local Zones
Once you opt-in to use one or more Local Zones in your account, they appear as additional Availability Zones for you to use when deploying your applications and resources. The original zone, launched last December, was us-west-2-lax-1a. The additional zone, available to all customers now, is us-west-2-lax-1b. Local Zones can be enabled using the new Settings section of the EC2 Management Console, as shown below

As noted in Jeff’s original post, you can also opt-in (or out) of access to Local Zones with the AWS Command Line Interface (CLI) (aws ec2 modify-availability-zone-group command), AWS Tools for PowerShell (Edit-EC2AvailabilityZoneGroup cmdlet), or by calling the ModifyAvailabilityZoneGroup API from one of the AWS SDKs.

Using Local Zones for Highly-Available, Low-Latency Applications
Local Zones can be used to further improve high availability for applications, as well as ultra-low latency. One scenario is for enterprise migrations using a hybrid architecture. These enterprises have workloads that currently run in existing on-premises data centers in the Los Angeles metro area and it can be daunting to migrate these application portfolios, many of them interdependent, to the cloud. By utilizing AWS Direct Connect in conjunction with a Local Zone, these customers can establish a hybrid environment that provides ultra-low latency communication between applications running in the Los Angeles Local Zone and the on-premises installations without needing a potentially expensive revamp of their architecture. As time progresses, the on-premises applications can be migrated to the cloud in an incremental fashion, simplifying the overall migration process. The diagram below illustrates this type of enterprise hybrid architecture.

Anecdotally, we have heard from customers using this type of hybrid architecture, combining Local Zones with AWS Direct Connect, that they are achieving sub-1.5ms latency communication between the applications hosted in the Local Zone and those in the on-premises data center in the LA metro area.

Virtual desktops for rendering and animation workloads is another scenario for Local Zones. For these workloads, latency is critical and the addition of a second Local Zone for Los Angeles gives additional failover capability, without sacrificing latency, should the need arise.

As always, the teams are listening to your feedback – thank you! – and are working on adding Local Zones in other locations, along with the availability of additional services, including Amazon ECS Amazon Elastic Kubernetes Service, Amazon ElastiCache, Amazon Elasticsearch Service, and Amazon Managed Streaming for Apache Kafka. If you’re an AWS customer based in Los Angeles or Southern California, with a requirement for even greater high-availability and very low latency for your workloads, then we invite you to check out the new Local Zone. More details and pricing information can be found at Local Zone.

— Steve