Post Syndicated from Technology Connextras original https://www.youtube.com/watch?v=NeopkvAP-ag
Security updates for Thursday
Post Syndicated from original https://lwn.net/Articles/880039/rss
Security updates have been issued by Debian (advancecomp, apache-log4j2, postgis, spip, uw-imap, and xorg-server), Mageia (kernel and kernel-linus), Scientific Linux (log4j), and SUSE (kernel-firmware and mariadb).
How Belcorp decreased cost and improved reliability in its big data processing framework using Amazon EMR managed scaling
Post Syndicated from Diego Benavides original https://aws.amazon.com/blogs/big-data/how-belcorp-decreased-cost-and-improved-reliability-in-its-big-data-processing-framework-using-amazon-emr-managed-scaling/
This is a guest post by Diego Benavides and Luis Bendezú, Senior Data Architects, Data Architecture Direction at Belcorp.
Belcorp is one of the main consumer packaged goods (CPG) companies providing cosmetics products in the region for more than 50 years, allocated to around 13 countries in North, Central, and South America (AMER). Born in Peru and with its own product factory in Colombia, Belcorp always stayed ahead of the curve and adapted its business model according to customer needs and strengthened its strategy with technological trends, providing each time a better customer experience. Focused on this, Belcorp began to implement its own data strategy encouraging the use of data for decision-making. Based on this strategy, the Belcorp data architecture team designed and implemented a data ecosystem allowing business and analytics teams to consume functional data that they use to generate hypotheses and insights that are materialized in better marketing strategies or novel products. This post aims to detail a series of continuous improvements carried out during 2021 in order to reduce the number of platform incidents reported at the end of 2020, optimize SLAs required by the business, and be more cost-efficient when using Amazon EMR, resulting in up to 30% savings for the company.
To stay ahead of the curve, stronger companies have built a data strategy that allows them to improve main business strategies, or even create new ones, using data as a main driver. As one of the main consumer packaged goods (CPG) companies in the region, Belcorp is not an exception—in recent years we have been working to implement data-driven decision-making.
We know that all good data strategy is aligned to business objectives and based on main business use cases. Currently, all our team efforts are focused on the final consumers, and almost all business initiatives are related to hyper-personalization, pricing, and customer engagement.
To support these initiatives, the data architecture department provides data services like data integration, only one source of truth, data governance and data quality frameworks, data availability, data accessibility, and optimized time to market, according to business requirements like other big companies. To provide minimal capabilities to support all these services, we needed a scalable, flexible, and cost-efficient data ecosystem. Belcorp started this adventure a couple of years ago using AWS services like Amazon Elastic Compute Cloud (Amazon EC2), AWS Lambda, AWS Fargate, Amazon EMR, Amazon DynamoDB, and Amazon Redshift, which currently feed our main analytical solutions with data.
As we were growing, we had to continually improve our architecture design and processing framework in regards to data volume and more complex data solution requirements. We also had to adopt quality and monitoring frameworks in order to guarantee data integrity, data quality, and service level agreements (SLAs). As you can expect, it’s not an easy task, and requires its own strategy. At the beginning of 2021 and due to critical incidents we were finding, operational stability was affected, directly impacting business outcomes. Billing was also impacted, due to more new complex workloads being included, which caused an unexpected increase in platform costs. In response, we decided to focus on three challenges:
- Operational stability
- Cost-efficiency
- Service level agreements
This post details some action points we carried out during 2021 over Belcorp’s data processing framework based on Amazon EMR. We also discuss how these actions helped us face the challenges previously mentioned, and also provide economic savings to Belcorp, which was the data architecture team’s main contribution to the company.
Overview of solution
Belcorp’s data ecosystem is composed by seven key capability pillars (as shown in the following diagram) that define our architectural design and give us more or less technological flexible options. Our data platform can be classified as a part of the second generation of data platforms, as mentioned by Zhamak Dehghani in How to Move Beyond a Monolithic Data Lake to a Distributed Data Mesh. In fact, it has all the limitations and restrictions of a Lakehouse approach as mentioned in the paper Lakehouse: A New Generation of Open Platforms that Unify Data Warehousing and Advanced Analytics .
Belcorp’s data platform supports two main use cases. On one side, it provides data to be consumed using visualization tools, encouraging self-service. On the other side, it provides functional data to end-users, like data scientists or data analysts, through distributed data warehouses and object storage more suited to advanced analytical practices.
The following reference design explains the main two layers in charge of providing functional data for these use cases. The data processing layer is composed of two sub-layers. The first is Belcorp’s Data Lake Integrator, which is a built-in, in-house Python solution with a set of API REST services in charge of organizing all the data workloads and data stages inside the analytics repositories. It also works as a point of control to distribute resources to be allocated for each Amazon EMR Spark job. The processing sub-layer is mainly composed of the EMR cluster, which is in charge of orchestrating, tracking, and maintaining all the Spark jobs developed using a Scala framework.

For the persistent repository layer, we use Amazon Simple Storage Service (Amazon S3) object storage as a data repository for analytics workloads, where we have designed a set of data stages that have operational and functional purposes based on the reference architecture design. Discussing the repository design in more depth is out of scope for this post, but we must note that it covers all the common challenges related to data availability, data accessibility, data consistency, and data quality. In addition, it achieves all Belcorp’s needs required by its business model, despite all limitations and restrictions we inherit by the design previously mentioned.
We can now move our attention to the main purpose of this post.
As we mentioned, we experienced critical incidents (some of which existed before) and unexpected cost increases at the beginning of 2021, which motivated us to take action. The following table lists some of the main issues that attracted our attention.
| Reported Incidents | Impact |
| Delay in Spark jobs on Amazon EMR | Core workloads take a long time |
| Delay in Amazon EMR nodes auto scaling | Workloads take a long time |
| Increase in Amazon EMR computational usage per node | Unexpected cost increase |
| Lost resource containers | Workloads process a huge data crash |
| Overestimated memory and CPUs | Unexpected cost increase |
To face these issues, we decided to change strategies and started to analyze each issue in order to identify the cause. We defined two action lines based on three challenges that the leaders wanted us to work on. The following figure summarizes these lines and challenges.
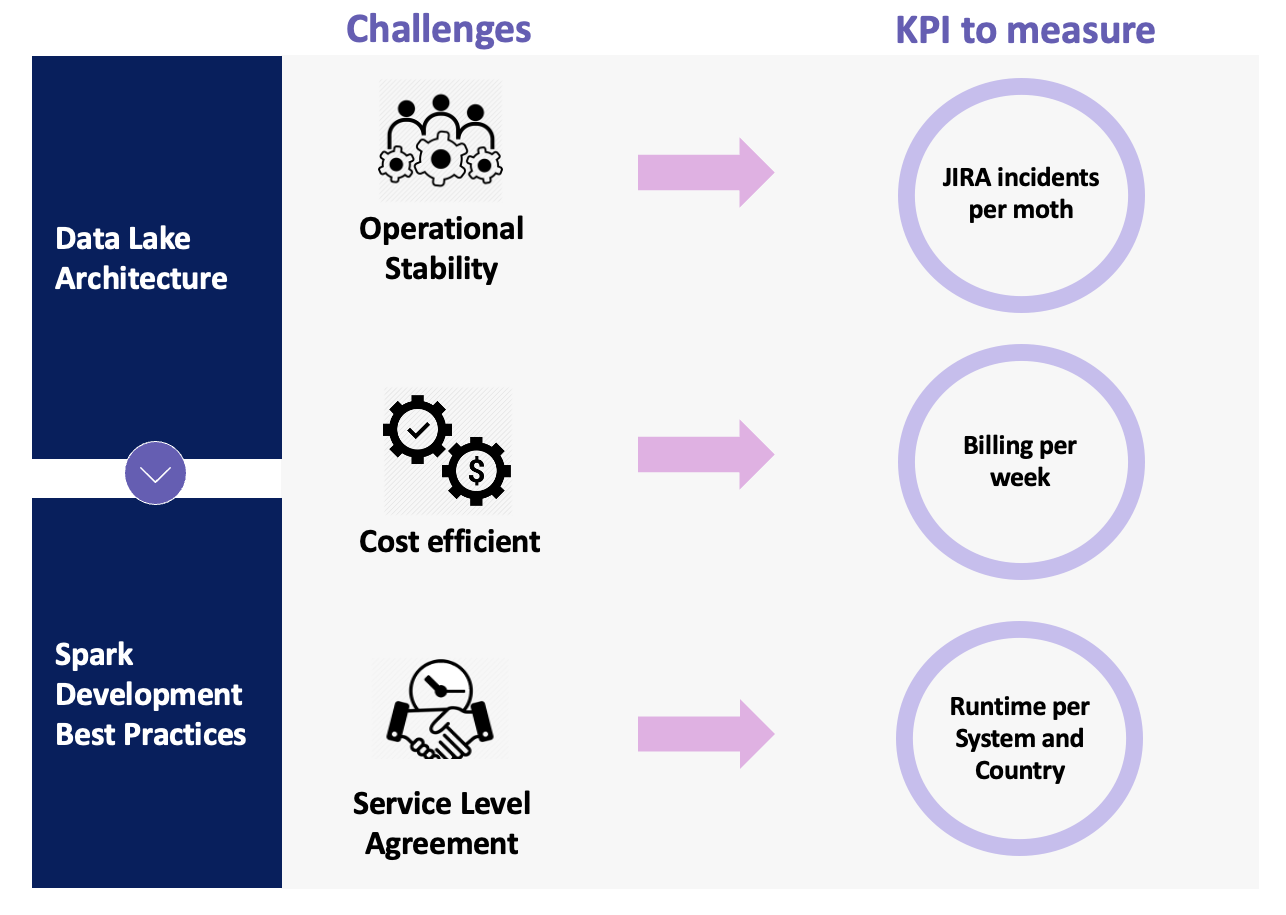
The data lake architecture action line refers to all the architectural gaps and deprecated features that we determined as part of the main problems that were generating the incidents. The Spark development best practices action line is related to the developed Spark data solution that had been causing instability due to bad practices during the development lifecycle. Focusing on these action lines, our leaders defined three challenges in order to decrease the number of incidents and guarantee the quality of the service we provide: operational stability, cost-efficiency, and SLAs.
Based on these challenges, we defined three KPIs to measure the success of the project. Jira incidents allow us to validate that our changes are having a positive impact; billing per week shows the leaders that part of the changes we applied will gradually optimize cost; and runtime provides the business users with a better time to market.
Next, we defined the next steps and how to measure progress. Based on our monitoring framework, we determined that almost all incidents that arose were related to the data processing and persistent repository layers. Then we had to decide how to solve them. We could make reactive fixes in order to achieve operational stability and not have an impact on business, or we could change our usual way of working, analyze each issue, and provide a final solution to optimize our framework. As you can guess, we decided to change our way of working.
We performed a preliminary analysis to determine the main impacts and challenges. We then proposed the following actions and improvements based on our action lines:
- Data lake architecture – We redesigned the EMR cluster; we’re now using core and task nodes
- Spark development best practices – We optimized Spark parameters (RAM memory, cores, CPUs, and executor number)
In the next section, we explain in detail the actions and improvements proposed in order to achieve our goals.
Actions and improvements
As we mentioned in the previous section, the analysis made by the architecture team resulted in a list of actions and improvements that would help us face three challenges: operational stability, a cost-efficient data ecosystem, and SLAs.
Before going further, it’s a good time to provide more details about the Belcorp data processing framework. We built it based on Apache Spark using the Scala programming language. Our data processing framework is a set of scalable, parameterizable, and reusable Scala artifacts that provide development teams with a powerful tool to implement complex data pipelines, achieving the most complex business requirements using Apache Spark technology. Through the Belcorp DevOps framework, we deploy each artifact to several non-production environments. Then we promote into production, where the EMR cluster launches all the routines using the Scala artifacts that reference each conceptual area inside the analytical platform. This part of the cycle provides the teams with some degree of flexibility and agility. However, we forgot, for a moment, the quality of the software we were developing using Apache Spark technology.
In this section, we dive into the actions and improvements we applied in order to optimize the Belcorp data processing framework and improve the architecture.
Redesigning the EMR cluster
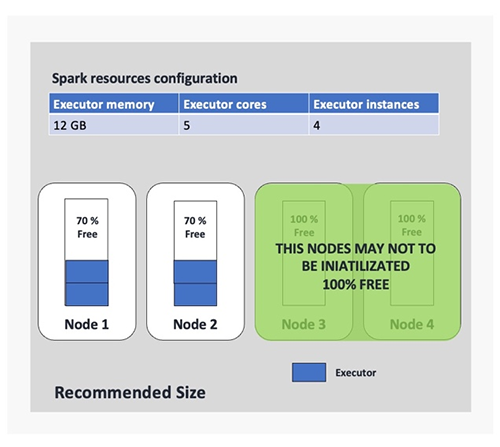
The current design and implementation of the Belcorp data lake is not the first version. We’re currently in version 2.0, and from the beginning of the first implementation until now, we’ve tried different EMR cluster designs to implement the data processing layer. Initially, we used a fixed cluster with four nodes (as shown in the following figure), but when the auto scaling capability was launched and Belcorp’s data workloads increased, we decided to move it there to optimize resource usage and costs. However, an auto scaled EMR cluster has different options too. You can choose between core and task nodes with a minimal and maximum number of each. In addition, you can select On-Demand or Spot Instances. You can also implement an optimized allocation strategy using EMR instance fleets to reduce the probability of Spot Instance loss. For more information about Amazon EMR resources allocation strategies, see Spark enhancements for elasticity and resiliency on Amazon EMR and Optimizing Amazon EMR for resilience and cost with capacity-optimized Spot Instances.

We tested all these capabilities, but we found some problems.
First, although AWS offers many capabilities and functionalities around Amazon EMR, if you don’t have some degree of knowledge about the technology that you want to use, you may encounter many issues as the use cases arise. As we mentioned, we decided to use the Apache Spark data processing engine through Amazon EMR as a part of Belcorp data ecosystem, but we faced many issues. Whenever an incident appeared, it motivated the data architect team in charge to fix it, as a part of the operational and support tasks. Almost all these reactive fixes were related to changing Amazon EMR configuration to try different alternatives in order to efficiently solve these incidents.
We figured out that almost all incidents were related to resource allocation, so we tested many configuration options such as instance types, increasing the number of nodes, customized rules for auto scaling, and fleet strategies. This last option was used to reduce node loss. At the end of 2020, we validated that an EMR cluster with automatic scaling enabled with a minimum capacity of three On-Demand core nodes 24/7 and the ability to scale up to 25 On-Demand core nodes provided us with a stable data processing platform. At the beginning of 2021, more complex Spark jobs were deployed as a part of the data processing routines inside the EMR cluster, causing operational instability again. In addition, the billing was increasing unexpectedly, which alerted leaders whose team needed to redesign the EMR cluster in order to keep healthy operational stability and optimize the costs.
We soon realized that it was possible to reduce up to 40% of the current billing using Spot Instances, instead of keeping all core nodes in On-Demand consumption. Another infrastructure optimization that we wanted to apply was to replace a number of core nodes with task nodes, because almost all Belcorp data workloads are memory-intensive and use Amazon S3 to read the source data and write the result dataset. The question here was how to do that without losing the benefits of the current design. To answer this question, we had the guidance of the AWS Account Team and our AWS Analytics and Big Data Specialist SA, in order to clarify questions about the following:
- Apache Spark implementation in Amazon EMR
- Core and task node best practices for production environments
- Spot Instance behavior in Amazon EMR
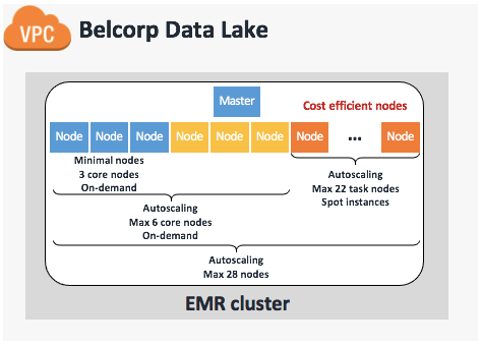
We definitely recommend addressing these three main points before applying any changes because, according to our previous experience, making modifications in the dark can lead to costly and underperforming Amazon EMR implementation. With that in mind, we redesigned the EMR cluster to utilize EMR managed scaling, which automatically resizes your cluster for best performance at the lowest possible cost. We defined a maximum of 28 capacity units with three On-Demand core nodes always on (24/7) in order to support data workloads during the day. We then set an auto scaling limit of six On-Demand cores in order to provide minimal HDFS capabilities to support the remaining 22 task nodes composed of Spot Instances. This final configuration is based on advice from AWS experts that we have at least one core node to support six task nodes, keeping a 1:6 ratio. The following table summarizes our cluster design.
| Cluster Scaling Policy | Amazon EMR Managed Scaling Enabled |
Minimum node units (MinimumCapacityUnits) |
3 |
Maximum node units (a) |
28 |
On-demand limit (MaximumOnDemandCapacityUnits) |
6 |
Maximum core nodes (MaximumCoreCapacityUnits) |
6 |
| Instance type | m4.10xlarge |
| Number of primary nodes | 1 |
| Primary node instance type | m4.4xlarge |
The following figure illustrates our updated and current cluster design.
Tuning Spark parameters
As any good book about Apache Spark can tell you, Spark parameter tuning is the main topic you need to look into before deploying a Spark application in production.
Adjusting Spark parameters is the task of setting up the resources (CPUs, memory, and the number of executors) to each Spark application. In this post, we don’t focus on driver instance resources; we focus on the executors because that’s the main issue we found inside Belcorp’s implementation.
After we applied improvements around join operation and cache strategies in Spark application development, we realized that some of those applications were assigned with overestimated resources in the EMR cluster. That means Spark applications assigned resources, but only 30% of the resources were used. The following Ganglia report illustrates the overestimation of resource allocation for one Spark application job, which we captured during one of our tests.
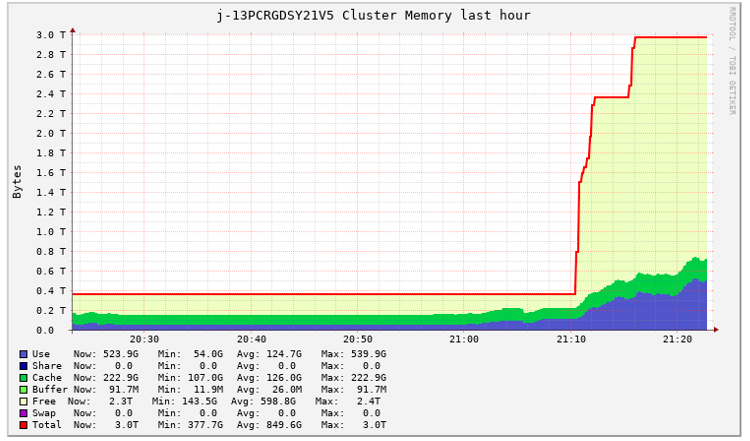
A big consequence of this behavior was the massive deployment of EMR nodes that weren’t being properly utilized. That means that numerous nodes were provisioned because of the auto scaling feature required by a Spark application submit, but much of the resources of these nodes were kept free. We show a basic example of this later in this section.
With this evidence, we began to suspect that we needed to adjust the Spark parameters of some of our Spark applications.
As we mentioned in previous sections, as part of the Belcorp data ecosystem, we built a Data Pipelines Integrator, which has the main responsibility of maintaining centralized control of the runs of each Spark application. To do that, it uses a JSON file containing the Spark parameter configuration and performs each spark-submit using Livy service, as shown in the following example code:
This JSON file contains the Spark parameter configuration of each Spark application related to an internal system and country we submit to the EMR cluster. In the following example, CM is the name of the system and PE is the country code that the data comes from:
The problem with this approach is that as we add more applications, the management of these configuration files becomes more complex. In addition, we had a lot of Spark applications set up with a default configuration that was defined a long time ago when workloads were less expensive. So, it was expected that some things would change. One example of a Spark application with uncalibrated parameters is shown in the following figure (we use four executor instances only for the example). In this example, we realized we were allocating executors with a lot of resources without following any of the Spark best practices. This was causing the provisioning of fat executors (using Spark slang) allocating each of those in at least one node. That means that if we define a Spark application to be submitted using 10 executors, we require at least 10 nodes of the cluster and use 10 nodes for only one run, which was very expensive for us.

When you deal with Spark parameter tuning challenges, it’s always a good idea to follow expert advice. Perhaps one of the most important pieces of advice is related to the number of executor cores you should use in one Spark application. Experts suggest that an executor should have up to four or five cores. We were familiar with this restriction because we formerly developed Spark applications in the Hadoop ecosystem because of Hadoop File Systems I/O restrictions. That is, if we have more cores configured for one executor, we perform more I/O operations in a single HDFS data node, and it’s well known that HDFS degrades due to high concurrency. This constraint isn’t a problem if we use Amazon S3 as storage, but the suggestion remains due to the overload of the JVM. Remember, while you have more operational tasks, like I/O operations, the JVM of each executor has more work to do, so the JVM is degraded.
With these facts and previous findings, we realized that for some of our Spark applications, we were using only 30% of the assigned resources. We needed to recalibrate the Spark job parameters in order to allocate only the best-suited resources and significantly reduce the overuse of EMR nodes. The following figure provides an example of the benefits of this improvement, where we can observe a 50% of node reduction based on our earlier configuration.
We used the following optimized parameters to optimize the Spark application related to the CM system:
Results
In this post, we wanted to share the success story of our project to improve the Belcorp data ecosystem, based on two lines of actions and three challenges defined by leaders using AWS data technologies and in-house platforms.
We were clear about our objectives from the beginning based on the defined KPIs, so we’ve been able to validate that the number of JIRA incidents reported at the end of May 2021 had a notable reduction. The following figures shows a reduction of up to 75% in respect to previous months, highlighting March as a critical peak.

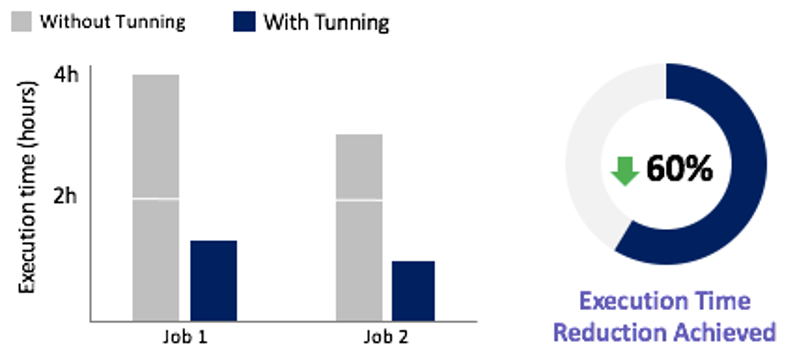
Based on this incident reduction, we figured out that almost all Spark job routines running in the EMR cluster benefitted from a runtime optimization, including the two most complex Spark jobs, with a reduction up to 60%, as shown in the following figure.
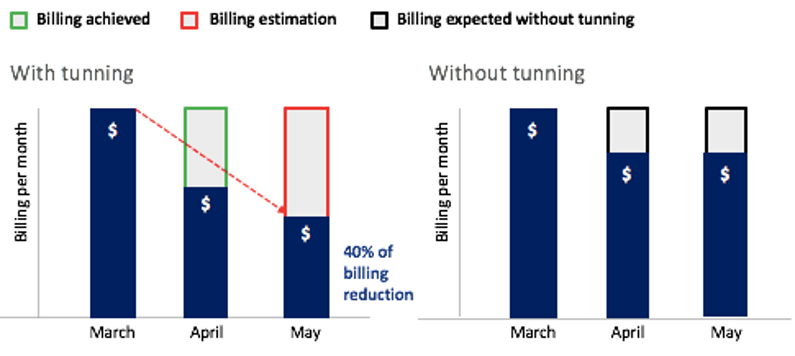
Perhaps the most important contribution of the improvements made by the team is directly related to the billing per week. For example, Amazon EMR redesigning, the join operation improvements, cache best practices applied, and Spark parameter tuning—all of these produced a notable reduction in the use of cluster resources. As we know, Amazon EMR calculates billing based on the time that the cluster nodes have been on, regardless of whether they do any work. So, when we optimized EMR cluster usage, we optimized the costs we were generating as well. As shown in the following figure, only in 2 months, between March and May, we achieved a billing reduction of up to 40%. We estimate that we will save up to 26% of the annual billing that would have been generated without the improvements.
Conclusion and next steps
The data architecture team is in charge of the Belcorp data ecosystem’s continuous improvements, and we’re always being challenged to achieve a best-in-class architecture, craft better architectural solution designs, optimize cost, and create the most automated, flexible, and scalable frameworks.
At the same time, we’re thinking about the future of this data ecosystem—how we can adapt to new business needs, generate new business models, and address current architectural gaps. We’re working now on the next generation of the Belcorp data platform, based on novel approaches like data products, data mesh, and lake houses. We believe these new approaches and concepts are going to help us to cover our current architectural gaps in the second generation of our data platform design. Additionally, it’s going to help us better organize the business and development teams in order to obtain greater agility during the development cycle. We’re thinking of data solutions as a data product, and providing teams with a set of technological components and automated frameworks they can use as building blocks.
Acknowledgments
We would like to thank our leaders, especially Jose Israel Rico, Corporate Data Architecture Director, and Venkat Gopalan, Chief Technology, Data and Digital Officer, who inspire us to be customer centric, insist on the highest standards, and support every technical decision based on a stronger knowledge of the state of the art.
About the Authors
 Diego Benavides is the Senior Data Architect of Belcorp in charge of the design, implementation, and the continuous improvement of the Global and Corporate Data Ecosystem Architecture. He has experience working with big data and advanced analytics technologies across many industry areas like telecommunication, banking, and retail.
 Luis Bendezú works as a Senior Data Engineer at Belcorp. He’s in charge of continuous improvements and implementing new data lake features using a number of AWS services. He also has experience as a software engineer, designing APIs, integrating many platforms, decoupling applications, and automating manual jobs.
 Mar Ortiz is a bioengineer who works as a Solutions Architect Associate at AWS. She has experience working with cloud compute and diverse technologies like media, databases, compute, and distributed architecture design.
 Raúl Hugo is an AWS Sr. Solutions Architect with more than 12 years of experience in LATAM financial companies and global telco companies as a SysAdmin, DevOps engineer, and cloud specialist.
assetfinder – Find Related Domains and Subdomains
Post Syndicated from original https://www.darknet.org.uk/2021/12/assetfinder-find-related-domains-and-subdomains/?utm_source=rss&utm_medium=social&utm_campaign=darknetfeed

assetfinder is a Go-based tool to find related domains and subdomains that are potentially related to a given domain from a variety of sources including Facebook, ThreatCrowd, Virustotal and more.
assetfinder uses a variety of sources including those in the infosec space and social networks which can give relevant info:
- crt.sh
- certspotter
- hackertarget
- threatcrowd
- wayback machine
- dns.bufferover.run
- facebook – Needs FB_APP_ID and FB_APP_SECRET environment variables set (https://developers.facebook.com/) and you need to be careful with your app’s rate limits
- virustotal – Needs VT_API_KEY environment variable set (https://developers.virustotal.com/reference)
- findsubdomains – Needs SPYSE_API_TOKEN environment variable set (the free version always gives the first response page, and you also get “25 unlimited requests”) — (https://spyse.com/apidocs)
Sources to be implemented:
- http://api.passivetotal.org/api/docs/
- https://community.riskiq.com/ (?)
- https://riddler.io/
- http://www.dnsdb.org/
- https://certdb.com/api-documentation
Usage of assetfinder to Find Related Domains and Subdomains
The usage is very simple with only one option basically, to limit the search to subdomains only – by default it will scan for all associated domains and subdomains.
Read the rest of assetfinder – Find Related Domains and Subdomains now! Only available at Darknet.
Richard Thaler | Nudge | Talks at Google
Post Syndicated from Talks at Google original https://www.youtube.com/watch?v=UKEWv35kVMw
A story about a camera with very old batteries that haven’t leaked and still work somehow
Post Syndicated from Technology Connextras original https://www.youtube.com/watch?v=m5s6xerRqVY
My Home Assistant setup – 2021 revision
Post Syndicated from BeardedTinker original https://www.youtube.com/watch?v=ONMqqOgQJ8M
Long Range Zigbee Network – How far will it go?
Post Syndicated from digiblurDIY original https://www.youtube.com/watch?v=4aLxw48ZCQo
The last stable kernels for 2021
Security updates for Wednesday
Post Syndicated from original https://lwn.net/Articles/879995/rss
Security updates have been issued by Debian (firefox-esr, python-gnupg, resiprocate, and ruby-haml), Fedora (mod_auth_mellon), openSUSE (thunderbird), Slackware (wpa_supplicant), and SUSE (gegl).
2021-12-29 равносметъчно
Post Syndicated from original https://vasil.ludost.net/blog/?p=3452
Някаква равносметка.
(чудех се дали да го пусна догодина, че да имам поне един post за тогава, но сега имам малко време)
Та, поред на случките:
– Случихме online FOSDEM (и догодина пак ще е online);
– Случихме един малък OpenFest в парка, присъствено, да се видят разни хора, че се бяха забравили. Не умряхме от жега, и се получи прилично събитие. Огромното ми желание е догодина да случим истинското, в голяма зала, както си трябва, ама да видим;
– Успяхме да си вземем апартамент и да го ремонтираме дотолкова, че да се нанесем (има неща за довършване, ама доколкото знам това винаги си е така). Зверовете са много щастливи 🙂
– Лятото успях да изкарам една двойна пневмония, от която май още имам някакви последствия, но като цяло съм добре.
– Работата е as usual много, но си остава интересна. Продължаваме да си търсим хора (както и всички останали), ако на някой му е скучно, може да пише.
Годината мина като някой натоварен работен ден – от тоя тип, в който си правил толкова много неща, че накрая не може да се сетиш за нито едно. Кога почна, кога свърши, тотално не е ясно, ако не растяха децата, можеше да не се усетя, че нещо се е променило 🙂
Отказвам да имам очаквания за идващата година. Някои хора казват, че поне supply chain проблема може да почне да се пооправя към края ѝ, а дано.
Top 10 reasons to migrate to Zabbix 6.0 LTS by Dmitry Krupornitsky / Zabbix Summit Online 2021
Post Syndicated from Arturs Lontons original https://blog.zabbix.com/top-10-reasons-to-migrate-to-zabbix-6-0-lts-by-dmitry-krupornitsky-zabbix-summit-online-2021/18445/
Today we will take a look at the top 10 reasons to migrate to Zabbix 6.0 LTS. We will discuss features and changes included not only in Zabbix 6.0 LTS but also in intermediate major versions – Zabbix 5.2 and Zabbix 5.4.
The full recording of the speech is available on the official Zabbix Youtube channel.
High availability
With Zabbix 6.0 LTS, native support for Zabbix server high availability clusters is finally here. High availability setups can protect you from software and hardware failures and allow you to minimize downtime while performing maintenance tasks. Before Zabbix 6.0 LTS, users were required to use a dedicated piece of clustering software to enable high availability. Most users used a combination of Corosync + pacemaker software. This required additional knowledge related to these tools, to ensure a proper high availability cluster setup, configuration, maintenance, and other tasks related to managing your Zabbix high availability cluster. You could also use other 3rd party vendor solutions, but such solutions also require additional knowledge and in many cases incur additional licensing costs.
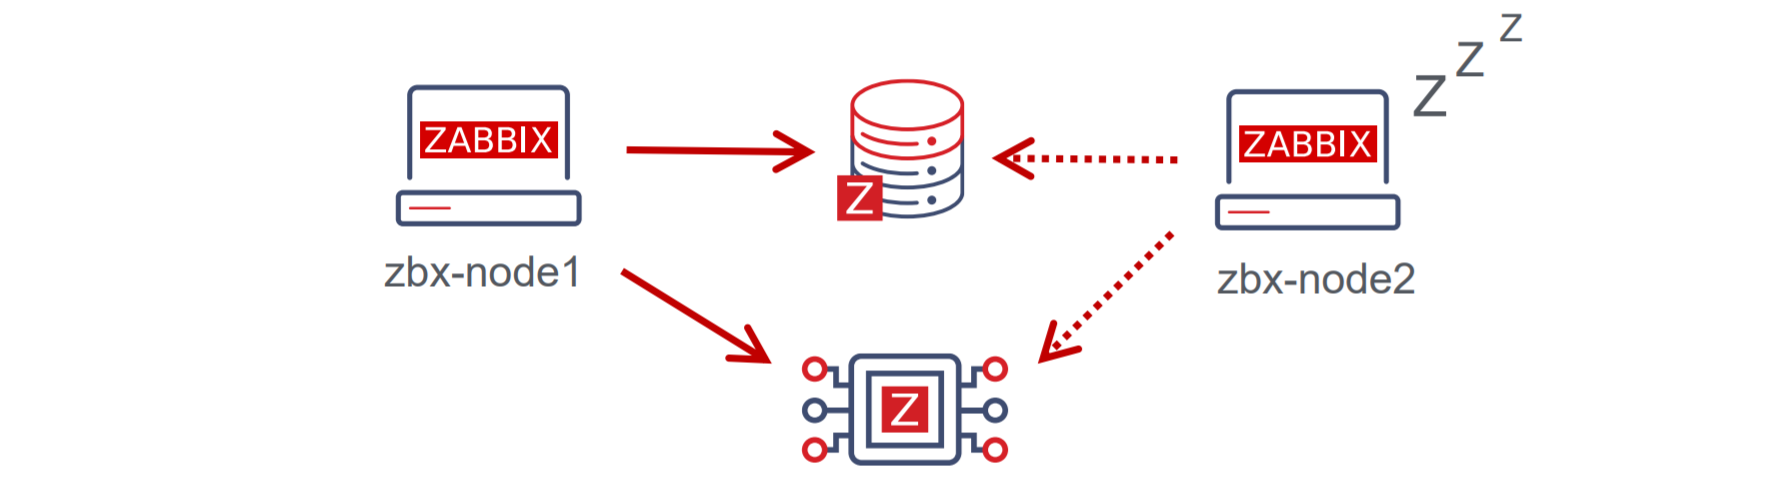
The native Zabbix server high availability cluster is an opt-in solution that provides high availability for the Zabbix server component. This solution consists of multiple Zabbix server instances – nodes, where each node is configured separately and uses the same database. Each node has two modes of operation – active or standby. Only a single node can be active at a time. The standby nodes do not perform any data collection, data processing, or any other Zabbix server activities. The standby nodes do not listen for connection on ports and have a minimal number of connections established to the Zabbix backend database. The high availability nodes are compatible with one another across different minor Zabbix server versions.
Learn how to deploy your own Zabbix server high availability cluster by following the steps provided in our Zabbix Summit blog post dedicated to this topic.
New Zabbix interface options
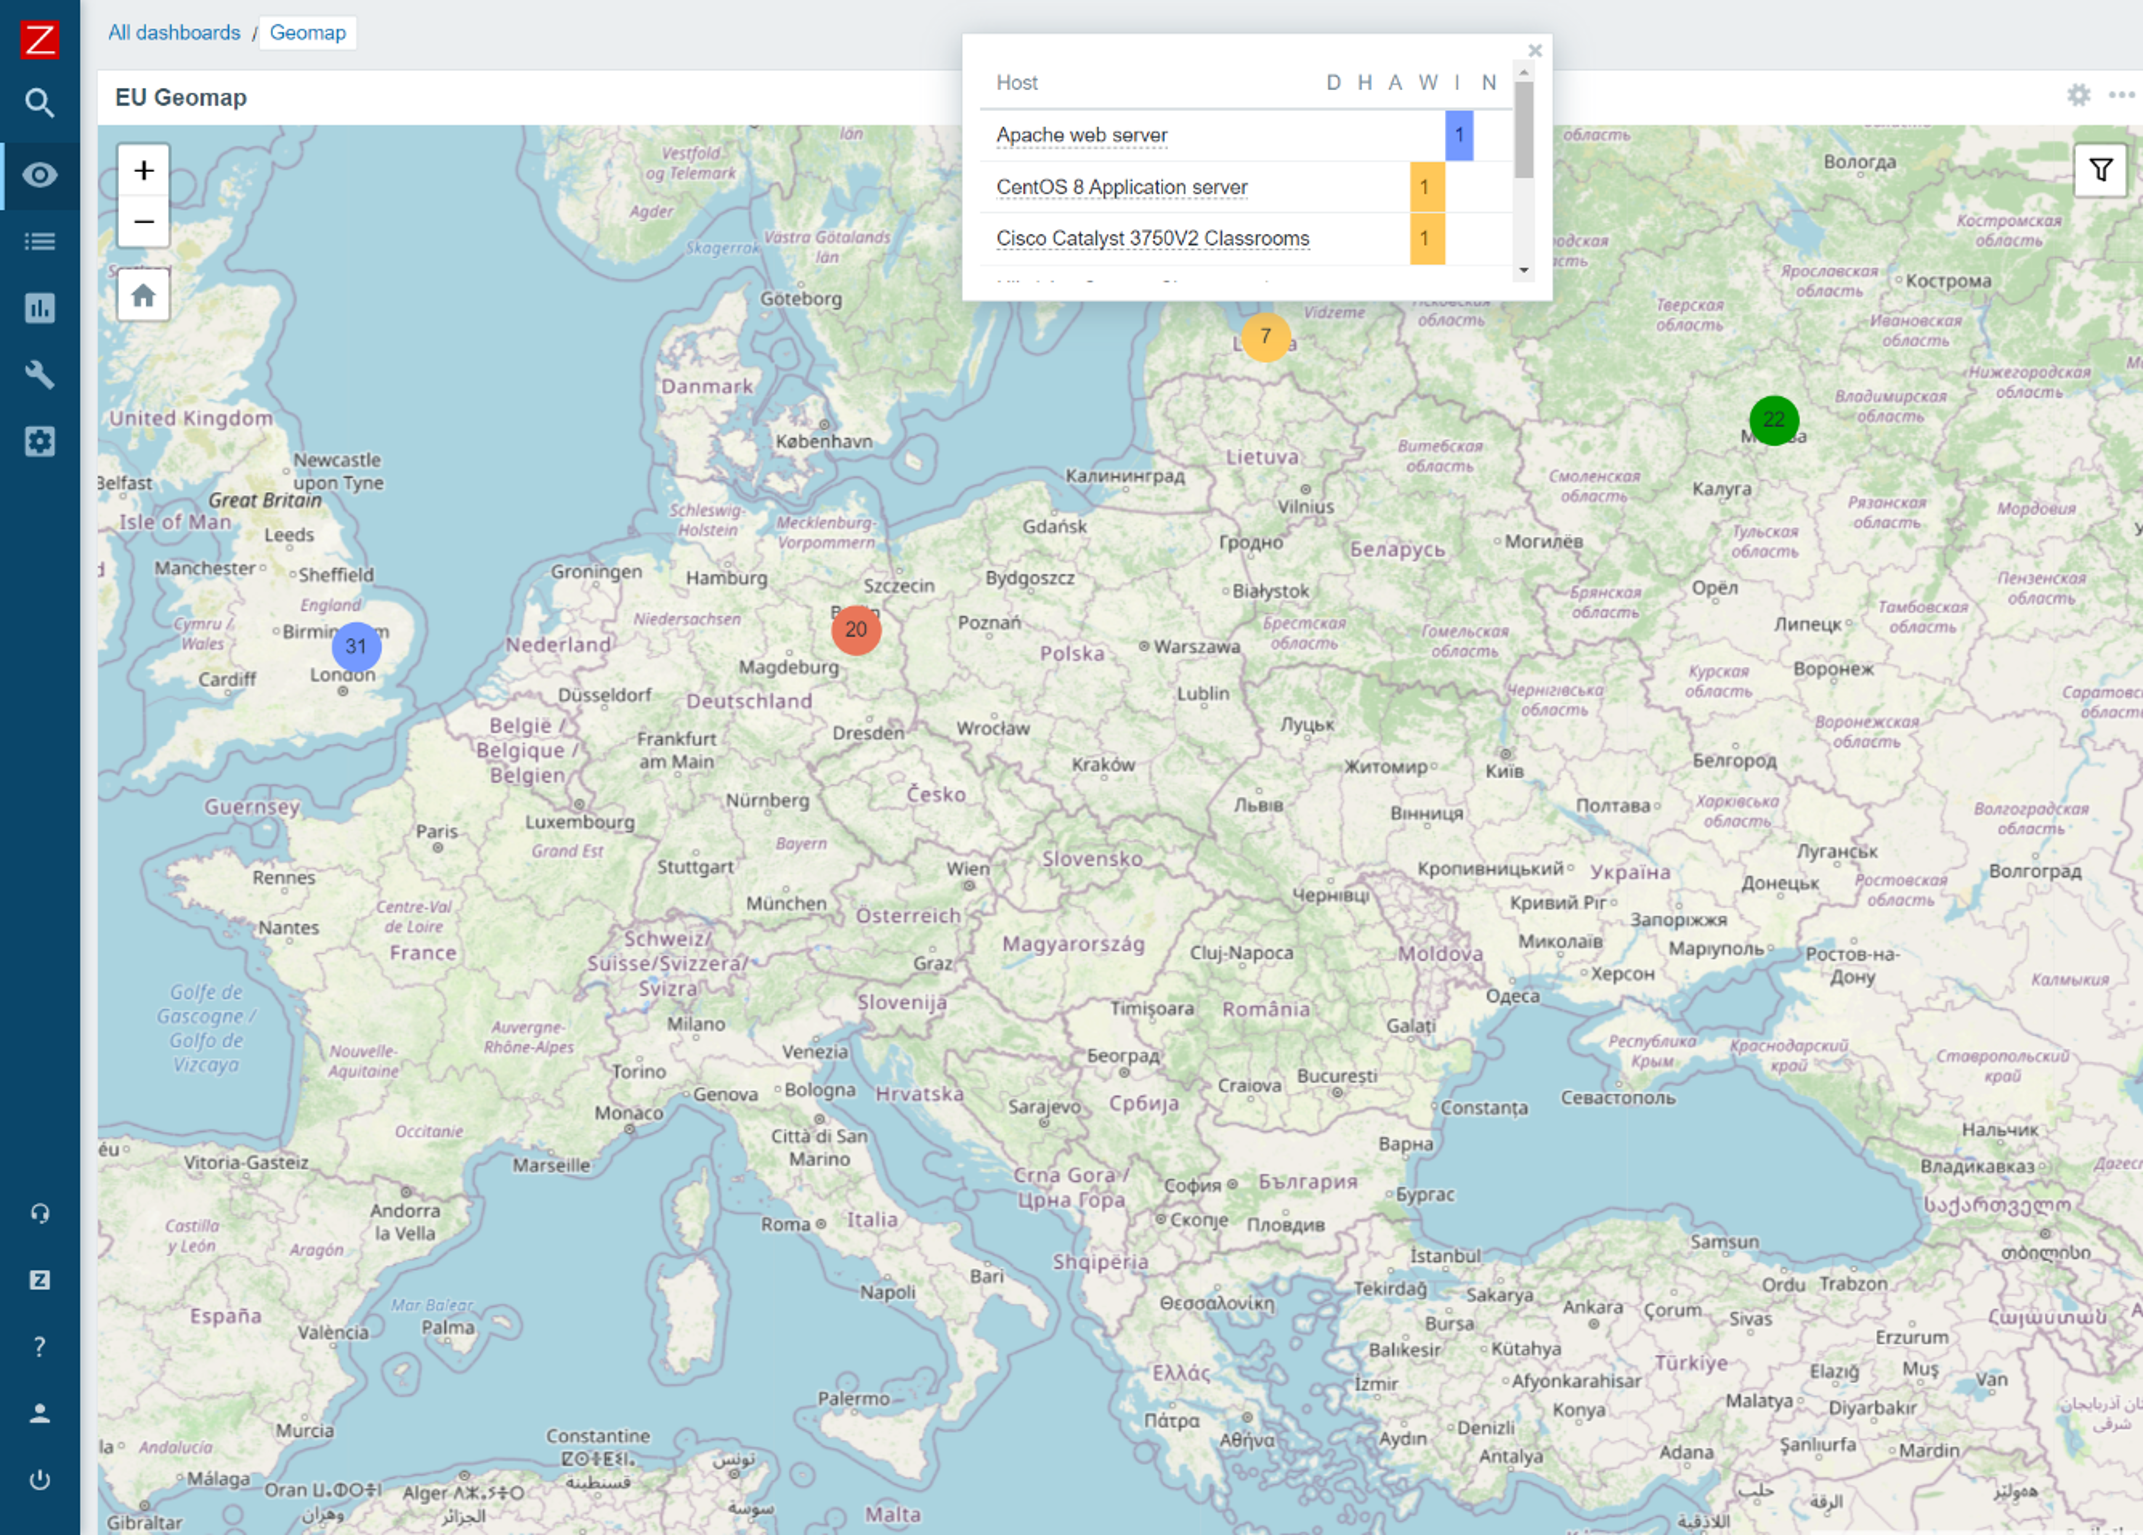
Zabbix 6.0 LTS provides multiple Zabbix interface improvements. One of the major changes that the users will notice when switching to Zabbix 6.0 LTS is the migration from screens to dashboards. The screens will be migrated to dashboards automatically during the upgrade. Dashboards consist of multiple highly customizable widgets, which can be placed on a dashboard with a click of a button. With Zabbix 6.0 LTS many new widgets will be available for different purposes – more flexible views of your metrics with the Single item value widget, a Geomap widget for a better overview of your infrastructure state, Top N/Bottom N views provide a whole new way to look at your metrics and more.
Now you will be able to save your favorite problem filters and access your filters in tabs for more simple filtering of the commonly accessed problem views.
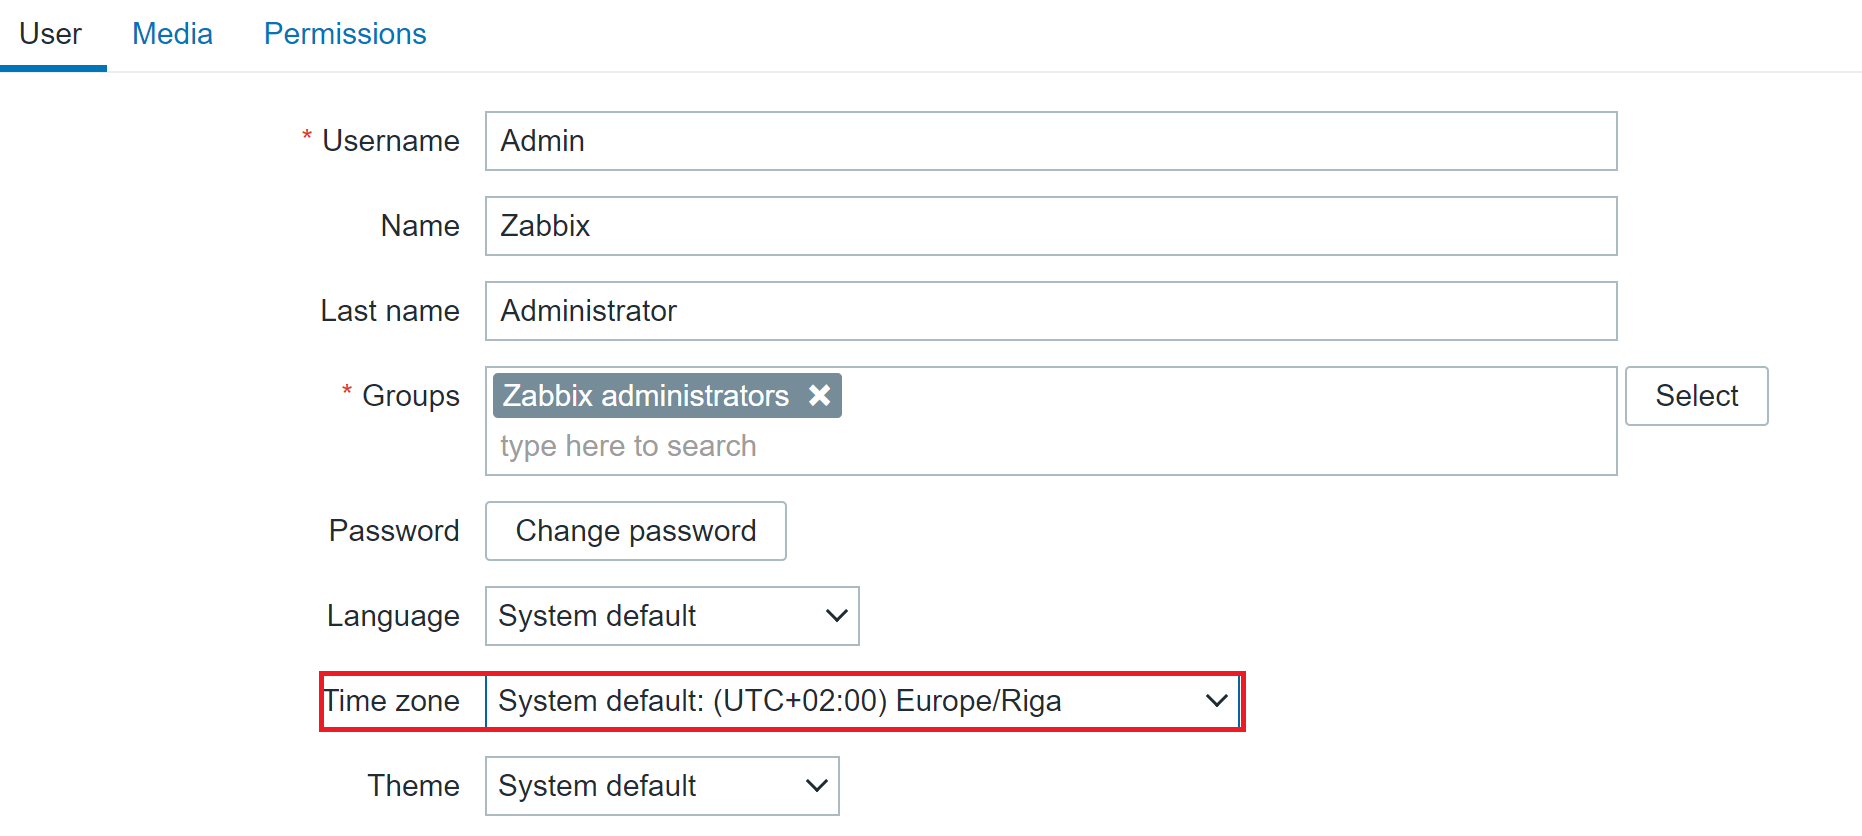
Zabbix 6.0 LTS introduces timezone configuration on a per-user basis. Users can now have their preferred timezone configured via the user settings in the Zabbix frontend. The same is also true for language – this can also now be configured individually for each user.
The Zabbix frontend is now more customizable than ever. There are several ways in which you can customize your Zabbix frontend:
- Replace the Zabbix logo with your company’s branding
- Hide links to Zabbix support/integration pages
- Set a custom help page link
- Change the copyright notice in the footer of the frontend.
Implementing these changes requires customizing the underlying PHP code – we tried to make this as simple and accessible as possible, so you can quickly make the necessary changes yourself.
There are also many other Interface improvements, such as multi-page dashboards, third-level menus, graph improvements, and many others.
Improved security
Security is always something that we focus on when developing Zabbix. Zabbix 6.0 LTS brings many new security-related improvements and features:
- User roles allow you to define roles with granular permissions related to the frontend access and the actions that each user role is permitted to perform
- Roles are still based on user types – Zabbix User, Admin, Super admin, and user type restrictions still apply, but can be further customized per each role
- User group to host group permissions (Read, Read/Write, Deny) still need to be used in combination with roles to ensure granular access to your data
- For example, now we can define users that have access to host configuration but restrict access to other configuration sections.
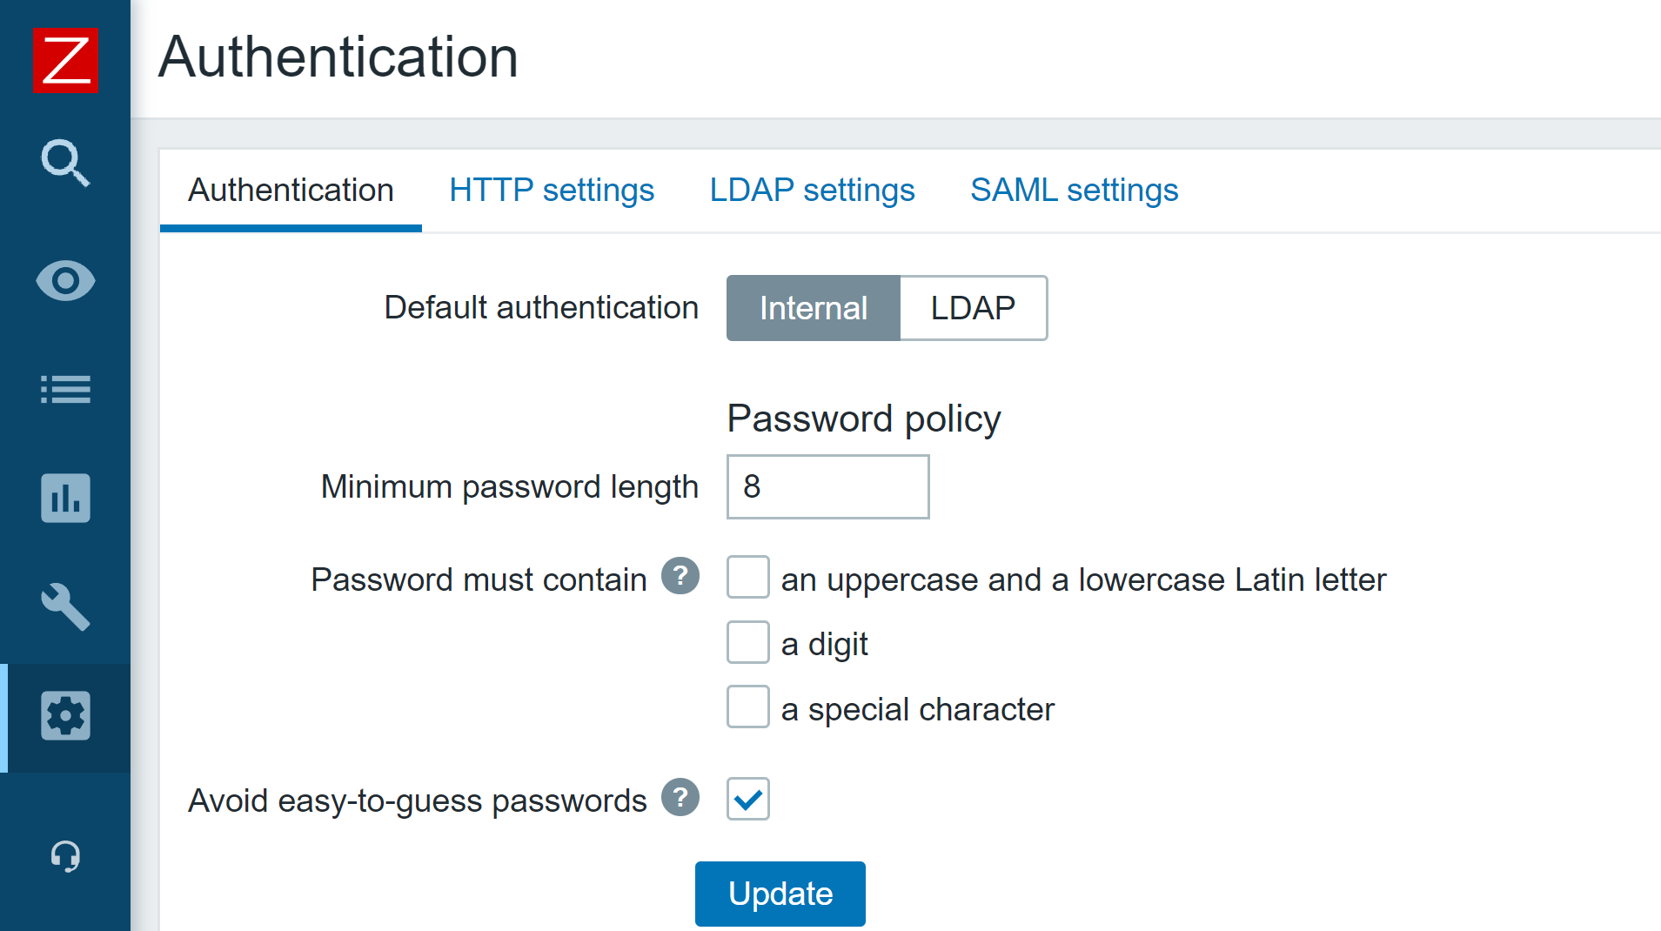
In Zabbix 6.0 LTS it is possible to define custom password complexity requirements for Zabbix frontend logins. We can define password length/complexity policies and prohibit the usage of easy to guess common passwords.
The Zabbix API has also seen some security improvements. Now it is possible to generate a persistent API token for a particular user, define an expiration date and use the token in your API calls, without the need to regularly re-issue a new API token.
Zabbix 5.2 release also added the ability to store sensitive information in an external vault. As of the release of Zabbix 6.0 LTS, only HashiCorp Vault is supported, but CyberArk Vault support is also coming in Zabbix 6.2 release.
A set of architectural and structural measures have been taken to completely restructure the Zabbix Audit log. The updated Audit log entry contains records of all configuration changes made by the Zabbix server and Zabbix frontend. The new Audit log also contains additional filtering options, such as filtering Audit log entries based on the operation during which the changes were performed. The new Audit log is not only more detailed but also reworked with minimum performance impact in mind.
Scalability improvements
Many scalability improvements have been introduced between the Zabbix 5.0 LTS release and Zabbix 6.0 LTS release. These improvements not only improve the performance of existing Zabbix instances but also lay the groundwork for the design of upcoming features in later releases.
Previously, trend-based trigger functions would always use database queries to obtain the required data. Starting from Zabbix 5.4, a new type of cache – Trend function cache, has been introduced. This cache stores the results of calculated trend functions. When processing the trend functions, the Zabbix server will check the Trend function cache for the cached results. In case of failure, the Zabbix server will read the data from the database and cache the results.
The scalability improvements allow for better parallel data processing on Zabbix servers with heavy loads. Zabbix Instances with tens of thousands or more new values per second will greatly benefit from the improved performance.
The introduction of the graceful startup of the Zabbix server can help you improve performance and prevent unwanted downtimes, especially with large distributed environments. Whenever a Zabbix server gets started up after downtime, the existing Zabbix proxies start sending the data backlog to the Zabbix server. it is extremely important to maintain the stability and performance of the Zabbix server during this time window. Graceful startup improves the Zabbix server data backlog handling logic during such situations.
To prevent unwanted delays and other issues when using zabbix_get and zabbix_sender command-line tools, it is now possible to define a custom Timeout parameter for these tools.
Advanced business service monitoring
The new Busines service monitoring features allow Zabbix users to not only define complex service trees but also receive alerts in situations where the status of a business service has been changed. This is valuable to every user that wishes to monitor their business services, no matter how simple or complex the service is.
Combined with a large number of new and improved service status calculation rules. By defining custom service weights and advanced service status propagation rules, the business services can be defined in an extremely flexible fashion. Services are also not linked to individual triggers anymore, instead, we use tag-based service mapping to map our services to problem events.
The service functionality has also received scalability improvements. Zabbix can support the monitoring of over 100 000 business services. The scalability improvements have been implemented from both the UI/UX and the performance perspectives.
The old all-or-nothing business service permission approach has been redesigned to a granular read/write permissions for individual business services. This is not only an improvement from the security perspective, but also adds the ability to define services in a multi-tenant fashion, where each tenant has access only to the services that they own.
With the redesign of the business services, we have added the support for root cause analysis, allowing users to see the underlying problem which caused a particular service to change its state.
You can read more about Business service monitoring in our Zabbix Summit blog post dedicated to this topic.
Tag and template improvements
Item applications have been replaced with tags. This design decision adds consistency to filtering, mapping, grouping, and other tag-related functions when it comes to different Zabbix entities. Tags can also be used to provide additional information related to your entities in a manner that is much more flexible than it was with applications.
Universal template IDs introduced for each of the template elements allow you to define much more robust template management workflows, especially when you combine this with a CI/CD template management approach. These IDs are unique and can be used to match a particular template entity, such as item, trigger, graph, and so on. By utilizing the Universal template IDs, Zabbix now understands which entity we are trying to update, which entity no longer exists, whether it is a new entity or we are adjusting an existing entity. The default template export format is now YAML, though JSON and XML formats are still supported. This was done to improve the template management usability since the YAML format is more user-friendly and easier to edit manually. All of the official Zabbix templates available on the Zabbix git page have already been converted to the YAML format.
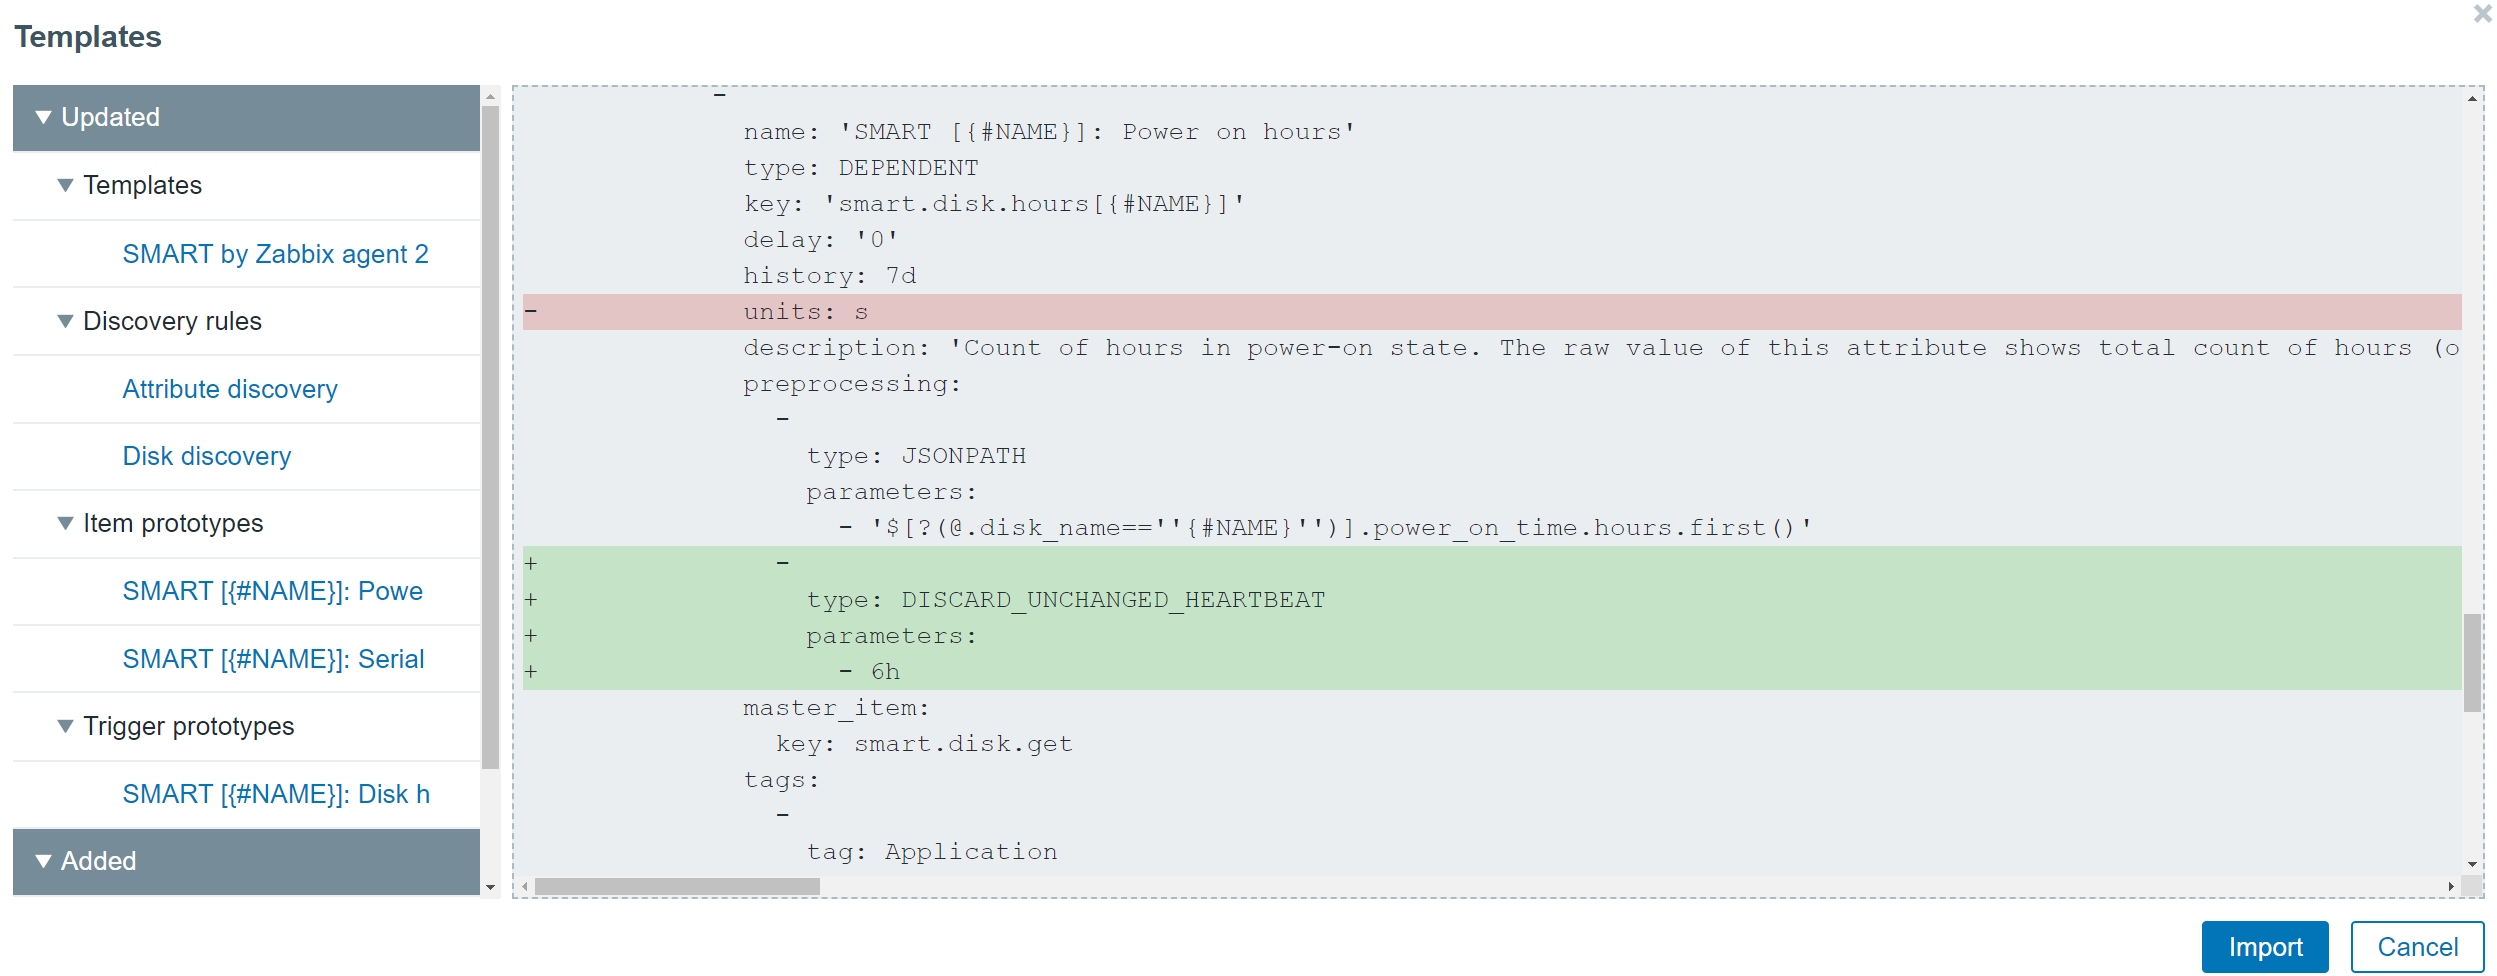
The redesign of the templates has also allowed us to improve the visualization of the changes made when importing a template. Now users can see the list of changes in a diff-like display and understand the impact that the template import will have on the Zabbix entities.
Value maps have been moved to host and template levels. This is another design decision that we made to enable support for fully self-contained templates, that are easy to manage and deploy, and can be easily imported into different Zabbix environments. While global value maps might be easy to manage in small environments, this is not the case in larger environments, where different teams are working with a single or between multiple Zabbix instances. Therefore, the global value maps have been removed.
Reporting and visualization
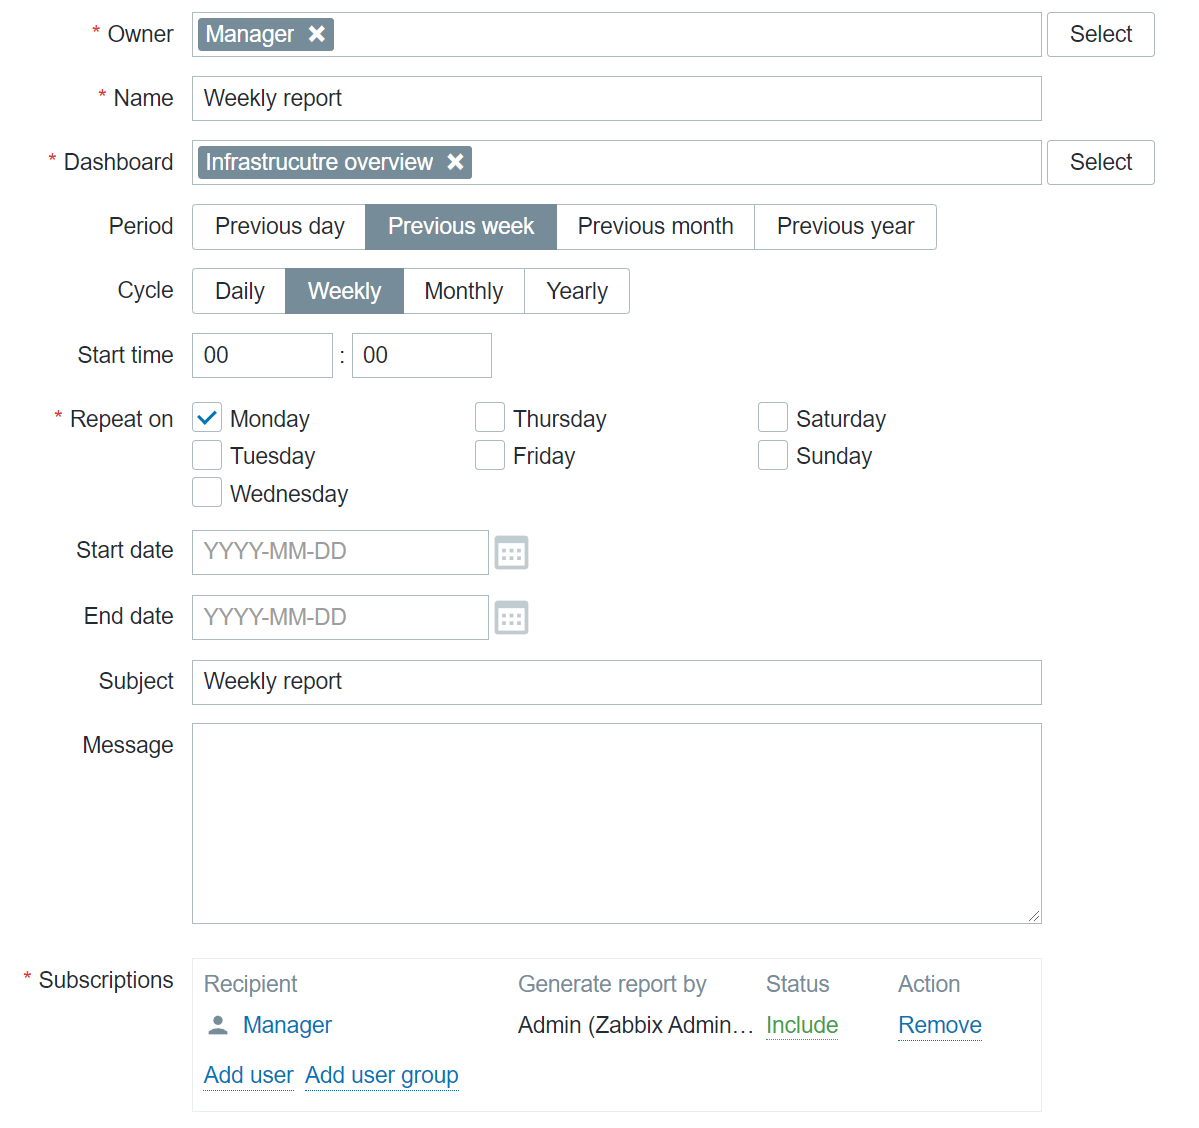
With the addition of Scheduled reports functionality, any dashboard can now be converted into a scheduled report. While this feature was originally added in Zabbix 5.4, with the release of Zabbix 6.0 LTS and a set of new widgets, the reporting functionality has gained a lot of additional value that these widgets grant specifically from the reporting perspective. Users can create scheduled reports and receive them in their mailbox at a specific time either on a daily, weekly, monthly, or yearly basis. The time period for which the report will provide the information can also be selected.
The new Geographical map widget allows you to quickly deploy a geomap with an overview of the state of your infrastructure. The geomap widget supports filters, so we can display only a particular part of your infrastructure. Zabbix uses an open-source Javascript interactive maps library called Leaflet and supports multiple map providers such as OpenStreetMap, OpenTopoMap, USGS US Topo, and more. Users also have the ability to define and use a custom map tile provider. The map will display your infrastructure and also highlight any detected problems as well as display problem counters. This is a major step forward from the old approach, which required users to use the regular map functionality together with Zabbix API scripting, to provide information on a geographical map.
Advanced problem detection
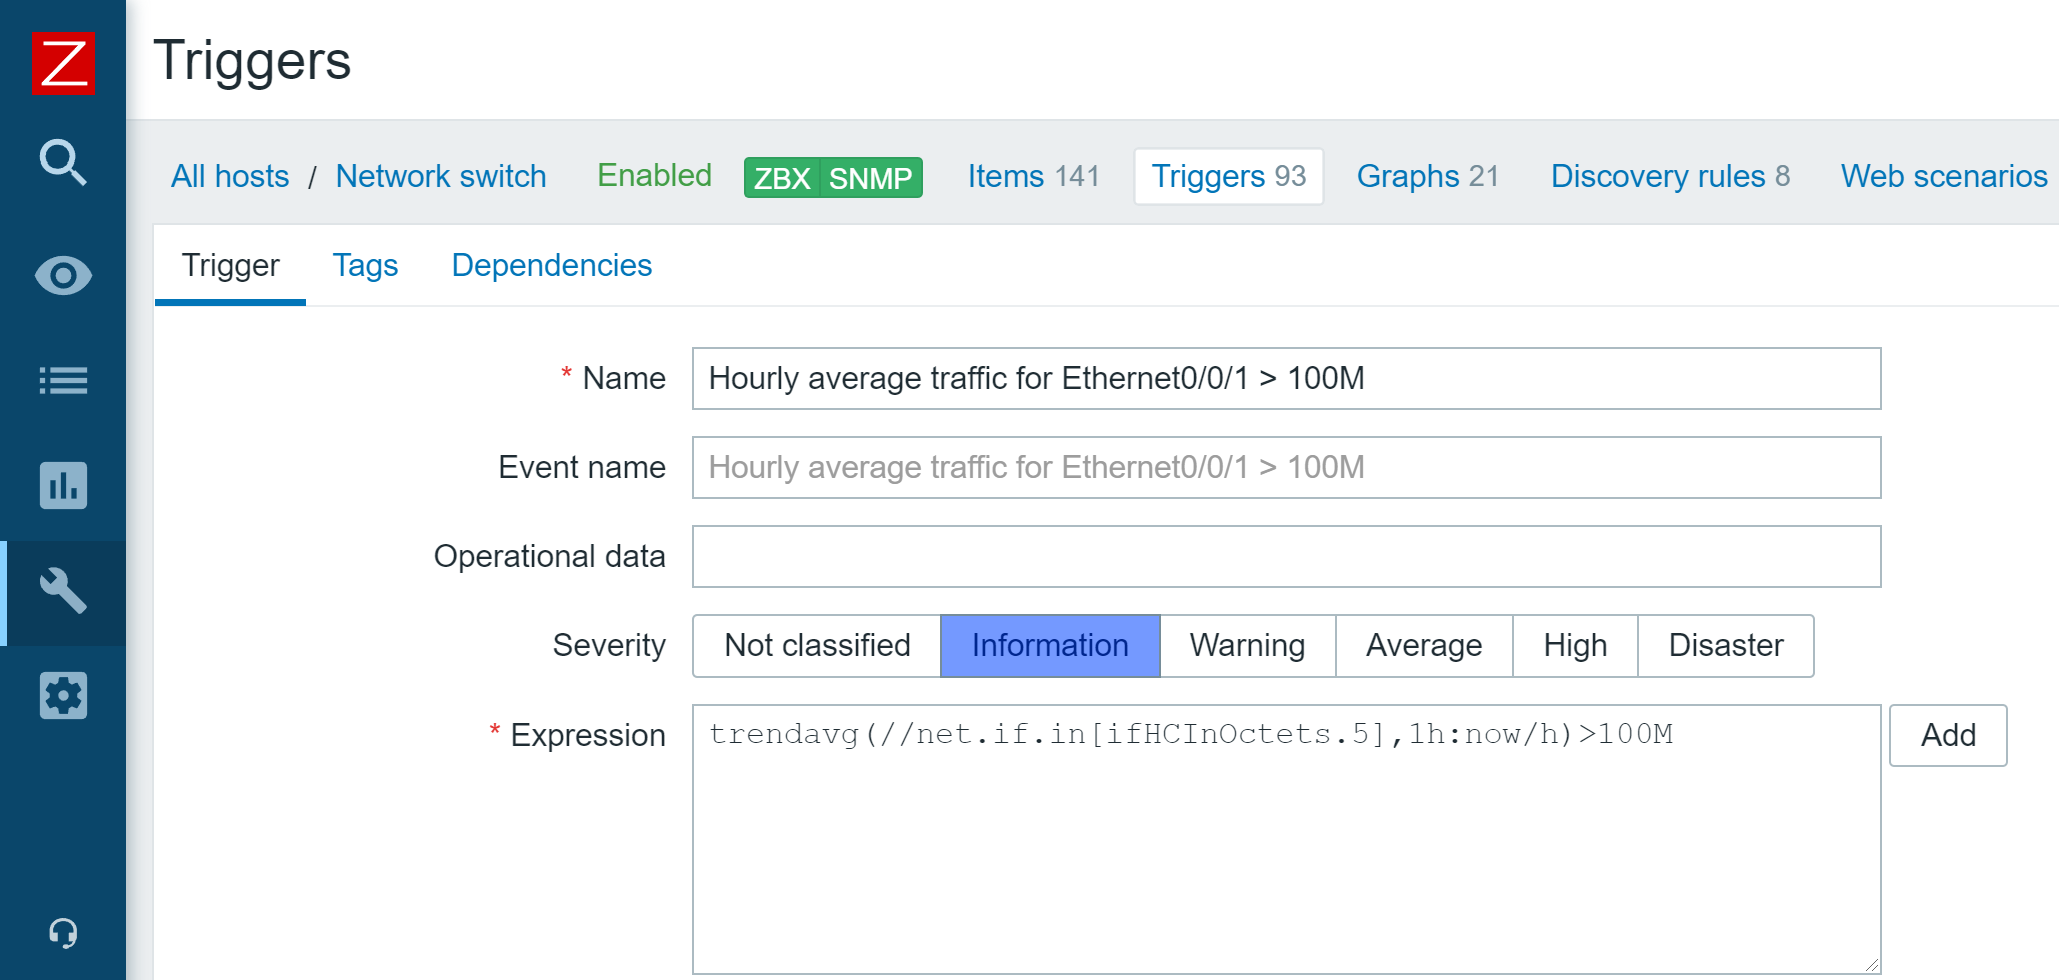
Zabbix 5.4 release introduced a new unified syntax for defining trigger expressions, calculated, and aggregated items. There are multiple benefits that come with the new trigger syntax. First off – the syntax is now unified and can be used for defining triggers, calculated items, and providing values in maps or graph names. The syntax also has a more functional approach, instead of being object-oriented. This allows us to solve many complex use cases, for example dynamically calculate or aggregate a value from all hosts tagged with a specific tag or belonging to a specific host group. Aggregated item type has also been removed and users can now define aggregate checks under the calculated item type.
New monitoring functionality and integrations
As with every major release, Zabbix 6.0 LTS comes with a set of new items and improves the functionality of already existing items:
- It is now possible to monitor SSL certificate validity and expiration data, such as the expiry date, issuer, version, subject, and more
- New Zabbix Agent 2 metrics allow you to collect file owner information, file properties, extended interface info, extended TCP info, SHA2 hashes for files, and more
- New templates for NGINX+, HPE/Dell servers, CISCO ASAv, Cloudflare
Finally – Zabbix 6.0 LTS
Many of our users and customers prefer sticking with the LTS releases instead of upgrading between each major version. As with every LTS release, there are major benefits to sticking with Zabbix 6.0 LTS:
- LTS release receive thorough testing and full long term support
- 3 years of full support – general, critical, and security fixes/improvements
- 5 years of limited support – critical and security fixes
Questions
Q: Which of the current versions are still supported and for how long are they going to remain supported? What updates can we expect these versions to receive?
A: Currently we have three supported major versions available. Zabbix 5.4, which will not be supported after the release of Zabbix 6.0 LTS. We also still provide support for Zabbix 5.0 LTS and Zabbix 4.0 LTS. Zabbix 5.0 LTS will continue receiving full support until the middle of 2023 and limited support until the middle of 2025, while Zabbix 4.0 LTS will receive limited support until November 2023.
Q: Could you elaborate on how tags are more flexible than applications and are there any other benefits to using tags?
A: Zabbix already supports tags for most of the essential Zabbix objects, such as triggers, hosts, host prototypes, and templates. With the introduction of tags for items, tags can now be found everywhere. This way you can have tags that provide different additional information and assign values for your objects. Tags have several usages – for example, we can use them to mark events. If we have an item with a tag, this tag will mark any problem related to this item. Problem events will inherit tags from the whole tag chain – hosts, templates, triggers, items, and more. Further down the line, we can use our actions to react to specific tags. If you recall, Business services are also mapped to problems based on the tag mapping. Of course, tags can also be used for filtering and grouping different Zabbix objects.
Q: Is there a guideline to the migration process from an older version to Zabbix 6.0 LTS? Is there a change list that I can look at to see what other features have received an overhaul?
A: Regarding the upgrade itself – our documentation contains guidelines for both upgrading from packages and upgrading from sources. The documentation may also contain upgrade notes regarding any extra steps or precautions required when upgrading to a particular version. Regarding the feature changes – we recommend reading through the major version release notes. For example, if you’re upgrading from Zabbix 5.0 LTS to Zabbix 6.0 LTS, make sure to familiarize yourself not only with the Zabbix 6.0 LTS release notes, but also read through the Zabbix 5.2 and Zabbix 5.4 release notes, since changes introduced in these versions will also be a part of Zabbix 6.0 LTS.
The post Top 10 reasons to migrate to Zabbix 6.0 LTS by Dmitry Krupornitsky / Zabbix Summit Online 2021 appeared first on Zabbix Blog.
Moonfall
Post Syndicated from original https://xkcd.com/2561/

The BEST Intro! #homeautomation
Post Syndicated from digiblurDIY original https://www.youtube.com/watch?v=nujouDRtbZY
Was LastPass Hacked?!? 12/28/2021
Post Syndicated from Crosstalk Solutions original https://www.youtube.com/watch?v=hG5Rqbatw2E
The BEST Outro #homeautomation
Post Syndicated from digiblurDIY original https://www.youtube.com/watch?v=Ywx30yNI7PM
Ubiquiti’s 6U Toolless Mini Rack – Unboxing, Setup, and Review
Post Syndicated from Crosstalk Solutions original https://www.youtube.com/watch?v=NeRJyOM3vBA
Top Ten Blog Posts of 2021 & All Time
Post Syndicated from original https://www.backblaze.com/blog/top-ten-blog-posts-of-2021-all-time/

It’s that time of year again—our annual roundup of the best of our blog. As 2021 comes to a close and we all get ready to celebrate the start of a new year, we wanted to take a moment to look back at the posts that you, our readers, loved the most.
We looked at the data from this year and sorted out the top 10 blog posts we published in 2021 by unique views. If you’re an avid reader of our blog, you might not be surprised that these posts made it to the top ten, but you might enjoy the trip down memory lane. And if you’re curious about our top blog posts of all time, we’ve listed those, too. Read on to see which posts made it to the top of the Backblaze blog.
Top Blog Posts of 2021
- “Backblaze Drive Stats for Q1 2021.” You know them, you love them—it’s our quarterly Drive Stats data. The information from our first quarterly report of the year made it to the very top of the list with all the excitement of seeing how the drives in our data centers have been faring.
- “Backblaze Drive Stats for Q2 2021.” Following in a close second is our second Drive Stats report of 2021, with even more data on the lifetime hard drive failure rates of our HDD and SSD boot drives.
- “Are SSDs Really More Reliable Than Hard Drives?” Do SSDs really fail less often than HDDs? We took a look at this common question in response to our Drive Stats to see if the failure rate data could offer a definitive response. Turns out you were curious, too.
- “The Next Backblaze Storage Pod.” A lot has changed since we first open-sourced the designs for our Storage Pods, so we shared the steps for our thought process on building the next generation of our storage servers. Pod posts are a perennial powerhouse, and this year was no different.
- “Hold On, Back Up: This Is How to Save Your TikToks.” Here at Backblaze, we’re on the cutting edge of cloud storage and the latest social trends, plus we’re all about being proactive about protecting data, especially considering data loss can happen with social media apps at any moment. This guide walks you through downloading TikTok videos and making sure they’re backed up to the cloud.
- “Chia Analysis: To Farm, or Not to Farm?” With the arrival of Chia, and after we open-sourced software to store Chia plots, we wondered if farming Chia was right for our business. We shared the analysis and what we learned from proving out if it was right for us.
- “Easy Storage + Easy Provisioning: Backblaze Is Now a Terraform Provider.” In this post, we announced that Backblaze B2 Cloud Storage is a provider in the Terraform registry, which means that developers can provision and manage B2 Cloud Storage resources directly from a Terraform configuration file.
- “NAS 101: A Buyer’s Guide to the Features and Capacity You Need.” Network attached storage (NAS) allows you to easily store and manage data, but if it’s your first time buying a NAS device or you’re looking to upgrade your setup, the number of options can be overwhelming. This guide aims at making that process easier.
- “A Cloud Storage Experiment to Level Up Chia Farming.” As a precursor to our post sharing the analysis about whether Backblaze would choose to farm Chia, we open-sourced an experimental solution to store Chia plots on Backblaze B2. How’d it go? Read on!
- “Backblaze Drive Stats for Q3 2021.” It’s no surprise to see the Q3 Hard Drive Stats make it to this list, rounding out the top 10, and you can check out all of the data we’ve published over the years here.

Top Blog Posts of All Time
After looking at the top 10 blog posts of 2021, we felt like some of our most popular blog posts of all time deserved some end-of-year attention as well. You may know them well. They’re the posts you return to year after year. And if you don’t know them well, we’ve rounded them up here for you to bookmark for the next time you’re wondering how to wipe a hard drive or recover from a ransomware attack.

- “Guide to How to Wipe a Mac or Macbook Clean.” If you’re looking to upgrade your Mac or replace its drive, it’s important to make sure your data is backed up and securely erased before you toss out your old computer or pass it on to someone else. (Oh, and we have one for PCs as well.)
- “SSD 101: How to Upgrade Your Computer With an SSD.” An SSD can boost performance in a computer, especially if you’re replacing a hard drive with an SSD. This guide walks through the process of upgrading your computer with an SSD.
- “What’s the Diff: RAM vs. Storage.” People often use memory and storage interchangeably, but RAM and storage affect your computer’s performance in different ways. This post explains the difference.
- “SSD 101: How Reliable Are SSDs?” All drives fail, but how do we know if SSDs fail more often than HDDs? In this post we take a deep dive into SSD reliability factors.
- “What’s the Diff: Programs, Processes, and Threads.” If your computer is running slowly, knowing the difference between programs, processes, and threads can help you troubleshoot performance issues. We clarify the difference between the terms and describe the disadvantages and advantages of processes vs. threads.
- “Guide to How to Recover and Prevent a Ransomware Attack.” Ransomware attacks are on the rise, so it’s more important than ever to make sure you’re protected against a potential cyber security threat and know how to recover from one.
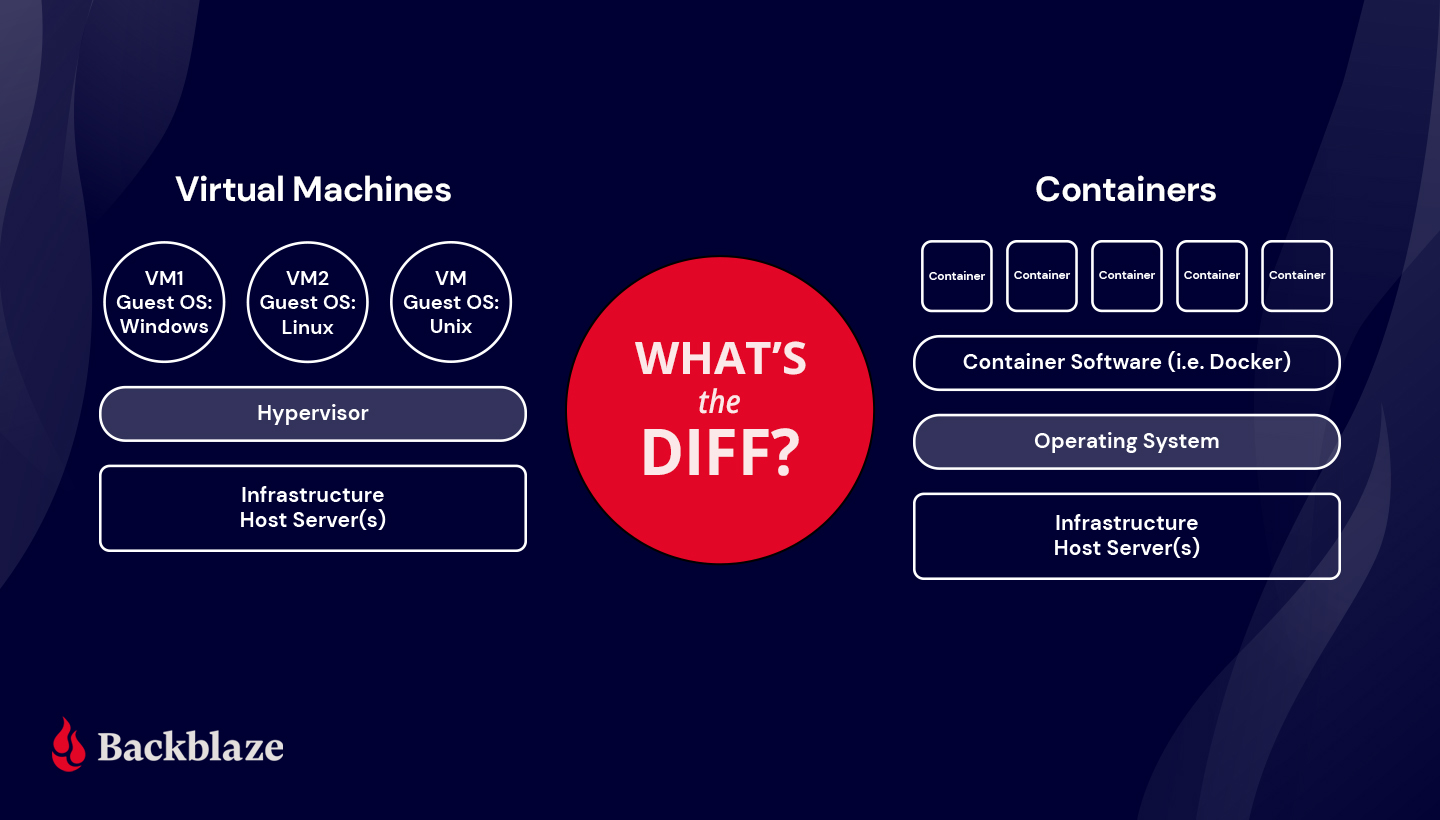
- “What’s the Diff: VMs vs. Containers.” Both VMs and containers can help get the most out of available hardware and software resources. We explain the differences between them and the best uses for both virtualization technologies.
- “Hard Disk Drive (HDD) vs. Solid-state Drive (SSD): What’s the Diff?” We spend a lot of time thinking about drives, so we put together this guide on the two drive types we receive the most questions about.
- “Hard Drive Cost Per Gigabyte.” This post from 2017 provides our own purchase data to explain the hard drive pricing curve from 2009 to 2017.
- “What’s the Diff: NAS vs. SAN.” A NAS device and a storage area network (SAN) are two different ways to store data—this guide helps clarify which is right for you and the pros and cons of either choice.
Thanks for Reading the Backblaze Blog in 2021
It’s been another great year of writing about cloud storage, entrepreneurship, how to back up data, and more. We want to thank you for joining us on the blog and sharing your thoughts in the comments. Did you have a favorite post that didn’t make it to either of these lists? We’d love to hear from you below!
The post Top Ten Blog Posts of 2021 & All Time appeared first on Backblaze Blog | Cloud Storage & Cloud Backup.
The Great European Famine: The First Catastrophe of the 14th Century
Post Syndicated from Geographics original https://www.youtube.com/watch?v=7yWT-iFn7HI
Sights and Sounds: Pioneer CLD-M301 (LD player / 5-disc CD changer)
Post Syndicated from Technology Connextras original https://www.youtube.com/watch?v=UOIFxgid0uk