Last year, AMD Bought ZT Systems in a Surprise Move. The motivation quickly became apparent as AMD needed to move into rack-scale and data center scale infrastructure, not just individual systems and 8 GPU baseboards. ZT Systems both designed and manufactured these systems for hyper-scalers like Microsoft Azure. Along with that $4.9B deal announcement, AMD also […]
Closing out their hour-long, AI-focused Computex keynote, Qualcomm CEO Cristiano Amon ended his presentation with a brief teaser of what’s in store for the server side of Qualcomm’s hardware business. The company has repeatedly dabbled in the server market with products such as their Cloud AI 100 inference accelerators. But thus far Qualcomm has not […]
IPv4 addresses have become a costly commodity, driven by their growing scarcity. With the original pool of 4.3 billion addresses long exhausted, organizations must now rely on the secondary market to acquire them. Over the years, prices have surged, often exceeding $30–$50 USD per address, with costs varying based on block size and demand. Given the scarcity, these prices are only going to rise, particularly for businesses that haven’t transitioned to IPv6. This rising cost and limited availability have made efficient IP address management more critical than ever. In response, we’ve evolved how we handle BYOIP (Bring Your Own IP) prefixes to give customers greater flexibility.
Historically, when customers onboarded a BYOIP prefix, they were required to assign it to a single service, binding all IP addresses within that prefix to one service before it was advertised. Once set, the prefix’s destination was fixed — to direct traffic exclusively to that service. If a customer wanted to use a different service, they had to onboard a new prefix or go through the cumbersome process of offboarding and re-onboarding the existing one.
As a step towards addressing this limitation, we’ve introduced a new level of flexibility: customers can now use parts of any prefix — whether it’s bound to Cloudflare CDN, Spectrum, or Magic Transit — for additional use with CDN or Spectrum. This enhancement provides much-needed flexibility, enabling businesses to optimize their IP address usage while keeping costs under control.
The challenges of moving onboarded BYOIP prefixes between services
Migrating BYOIP prefixes dynamically between Cloudflare services is no trivial task, especially with thousands of servers capable of accepting and processing connections. The problem required overcoming several technical challenges related to IP address management, kernel-level bindings, and orchestration.
Dynamic reallocation of prefixes across services
When configuring an IP prefix for a service, we need to update IP address lists and firewall rules on each of our servers to allow only the traffic we expect for that service, such as opening ports 80 and 443 to allow HTTP and HTTPS traffic for the Cloudflare CDN. We use Linux iptables and IP sets for this.
Migrating IP prefixes to a different service involves dynamically reassigning them to different IP sets and iptable rules. This requires automated updates across a large-scale distributed environment.
As prefixes shift between services, it is critical that servers update their IP sets and iptable rules dynamically to ensure traffic is correctly routed. Failure to do so could lead to routing loops or dropped connections.
Updating Tubular – an eBPF-based IP and port binding service
Most web applications bind to a list of IP addresses at startup, and listen on only those IPs until shutdown. To allow customers to change the IPs bound to each service dynamically, we needed a way to add and remove IPs from a running service, without restarting it. Tubular is a BPF program we wrote that runs on Cloudflare servers that allows services to listen on a single socket, dynamically updating the list of addresses that are routed to that socket over the lifetime of the service, without requiring it to restart when those addresses change.
A significant engineering challenge was extending Tubular to support traffic destined for Cloudflare’s CDN. Without this enhancement, customers would be unable to leverage dynamic reassignment to bind prefixes onboarded through Spectrum to the Cloudflare CDN, limiting flexibility across services.
Cloudflare’s CDN depends on each server running an NGINX ingress proxy to terminate incoming connections. Due to the scale and performance limitations of NGINX, we are actively working to replace it by 2026. In the interim, however, we still depend on the current ingress proxy to reliably handle incoming connections.
One limitation is that this ingress proxy does not support systemd socket activation, a mechanism Tubular relies on to integrate with other Cloudflare services on each server. For services that do support systemd socket activation, systemd independently starts the sockets for the owning service and passes them to Tubular, allowing Tubular to easily detect and route traffic to the correct terminating service.
Since this integration model is not feasible, an alternative solution was required. This was addressed by introducing a shared Unix domain socket between Tubular and the ingress proxy service on each server. Through this channel, the ingress proxy service explicitly transmits socket information to Tubular, enabling it to correctly register the sockets in its datapath.
The final challenge was deploying the Tubular-ingress proxy integration across the fleet of servers without disrupting active connections. As of April 2025, Cloudflare handles an average of 71 million HTTP requests per second, peaking at 100 million. To safely deploy at this scale, the necessary Tubular and ingress proxy configuration changes were staged across all Cloudflare servers without disrupting existing connections. The final step involved adding bindings — IP addresses and ports corresponding to Cloudflare CDN prefixes — to the Tubular configuration. These bindings direct connections through Tubular via the Unix sockets registered during the previous integration step. To minimize risk, bindings were gradually enabled in a controlled rollout across the global fleet.
Tubular data plane in action
This high-level representation of the Tubular data plane binds together the Layer 4 protocol (TCP), prefix (192.0.2.0/24 – which is 254 usable IP addresses), and port number 0 (any port). When incoming packets match this combination, they are directed to the correct socket of the service — in this case, Spectrum.
In the following example, TCP 192.0.2.200/32 has been upgraded to the Cloudflare CDN via the edge Service Bindings API. Tubular dynamically consumes this information, adding a new entry to its data plane bindings and socket table. Using Longest Prefix Match, all packets within the 192.0.2.0/24 range port 0 will be routed to Spectrum, except for 192.0.2.200/32 port 443, which will be directed to the Cloudflare CDN.
Coordination and orchestration at scale
Our goal is to achieve a quick transition of IP address prefixes between services when initiated by customers, which requires a high level of coordination. We need to ensure that changes propagate correctly across all servers to maintain stability. Currently, when a customer migrates a prefix between services, there is a 4-6 hour window of uncertainty where incoming packets may be dropped due to a lack of guaranteed routing. To address this, we are actively implementing systems that will reduce this transition time from hours to just a matter of minutes, significantly improving reliability and minimizing disruptions.
Smarter IP address management
Service Bindings are mappings that control whether traffic destined for a given IP address is routed to Magic Transit, the CDN pipeline, or the Spectrum pipeline.
Consider the example in the diagram below. One of our customers, a global finance infrastructure platform, is using BYOIP and has a /24 range bound to Spectrum for DDoS protection of their TCP and UDP traffic. However, they are only using a few addresses in that range for their Spectrum applications, while the rest go unused. In addition, the customer is using Cloudflare’s CDN for their Layer 7 traffic and wants to set up Static IPs, so that their customers can allowlist a consistent set of IP addresses owned and controlled by their own network infrastructure team. Instead of using up another block of address space, they asked us whether they could carve out those unused sub-ranges of the /24 prefix.
From there, we set out to determine how to selectively map sub-ranges of the onboarded prefix to different services using service bindings:
192.0.2.0/24 is already bound to Spectrum
192.0.2.0/25 is updated and bound to CDN
192.0.2.200/32 is also updated bound to CDN
Both the /25 and /32 are sub-ranges within the /24 prefix and will receive traffic directed to the CDN. All remaining IP addresses within the /24 prefix, unless explicitly bound, will continue to use the default Spectrum service binding.
As you can see in this example, this approach provides customers with greater control and agility over how their IP address space is allocated. Instead of rigidly assigning an entire prefix to a single service, users can now tailor their IP address usage to match specific workloads or deployment needs. Setting this up is straightforward — all it takes is a few HTTP requests to the Cloudflare API. You can define service bindings by specifying which IP addresses or subnets should be routed to CDN, Spectrum, or Magic Transit. This allows you to tailor traffic routing to match your architecture without needing to restructure your entire IP address allocation. The process remains consistent whether you’re configuring a single IP address or splitting up larger subnets, making it easy to apply across different parts of your network. The foundational technical work addressing the underlying architectural challenges outlined above made it possible to streamline what could have been a complex setup into a straightforward series of API interactions.
Conclusion
We envision a future where customers have granular control over how their traffic moves through Cloudflare’s global network, not just by service, but down to the port level. A single prefix could simultaneously power web applications on CDN, protect infrastructure through Magic Transit, and much more. This isn’t just flexible routing, but programmable traffic orchestration across different services. What was once rigid and static becomes dynamic and fully programmable to meet each customer’s unique needs.
If you are an existing BYOIP customer using Magic Transit, CDN, or Spectrum, check out our configuration guide here. If you are interested in bringing your own IP address space and using multiple Cloudflare services on it, please reach out to your account team to enable setting up this configuration via API or reach out to [email protected] if you’re new to Cloudflare.
As part of today’s headline Computex keynote, NVIDIA announced a new member in their suite of NVLink interconnect technologies: NVLink Fusion. And this latest entry may be the most interesting yet, as NVIDIA is taking a big step towards opening up the NVLink ecosystem to third-party CPUs and accelerators, releasing IP and hardware designed to […]
Weirdly, this is the second time the NSA has declassified the document. John Young got a copy in 2019. This one has a few less redactions. And nothing that was provided in 2019 was redacted here.
If you find anything interesting in the document, please tell us about it in the comments.
Dashboard widgets have received substantial improvements in the latest Zabbix releases – everything from brand-new widgets to greatly expanding upon existing widget features. The post will cover some of the new improvements as well as lesser-known dashboard and widget features, while discussing multiple dashboard use cases targeted at large organizations and MSPs.
Table of Contents
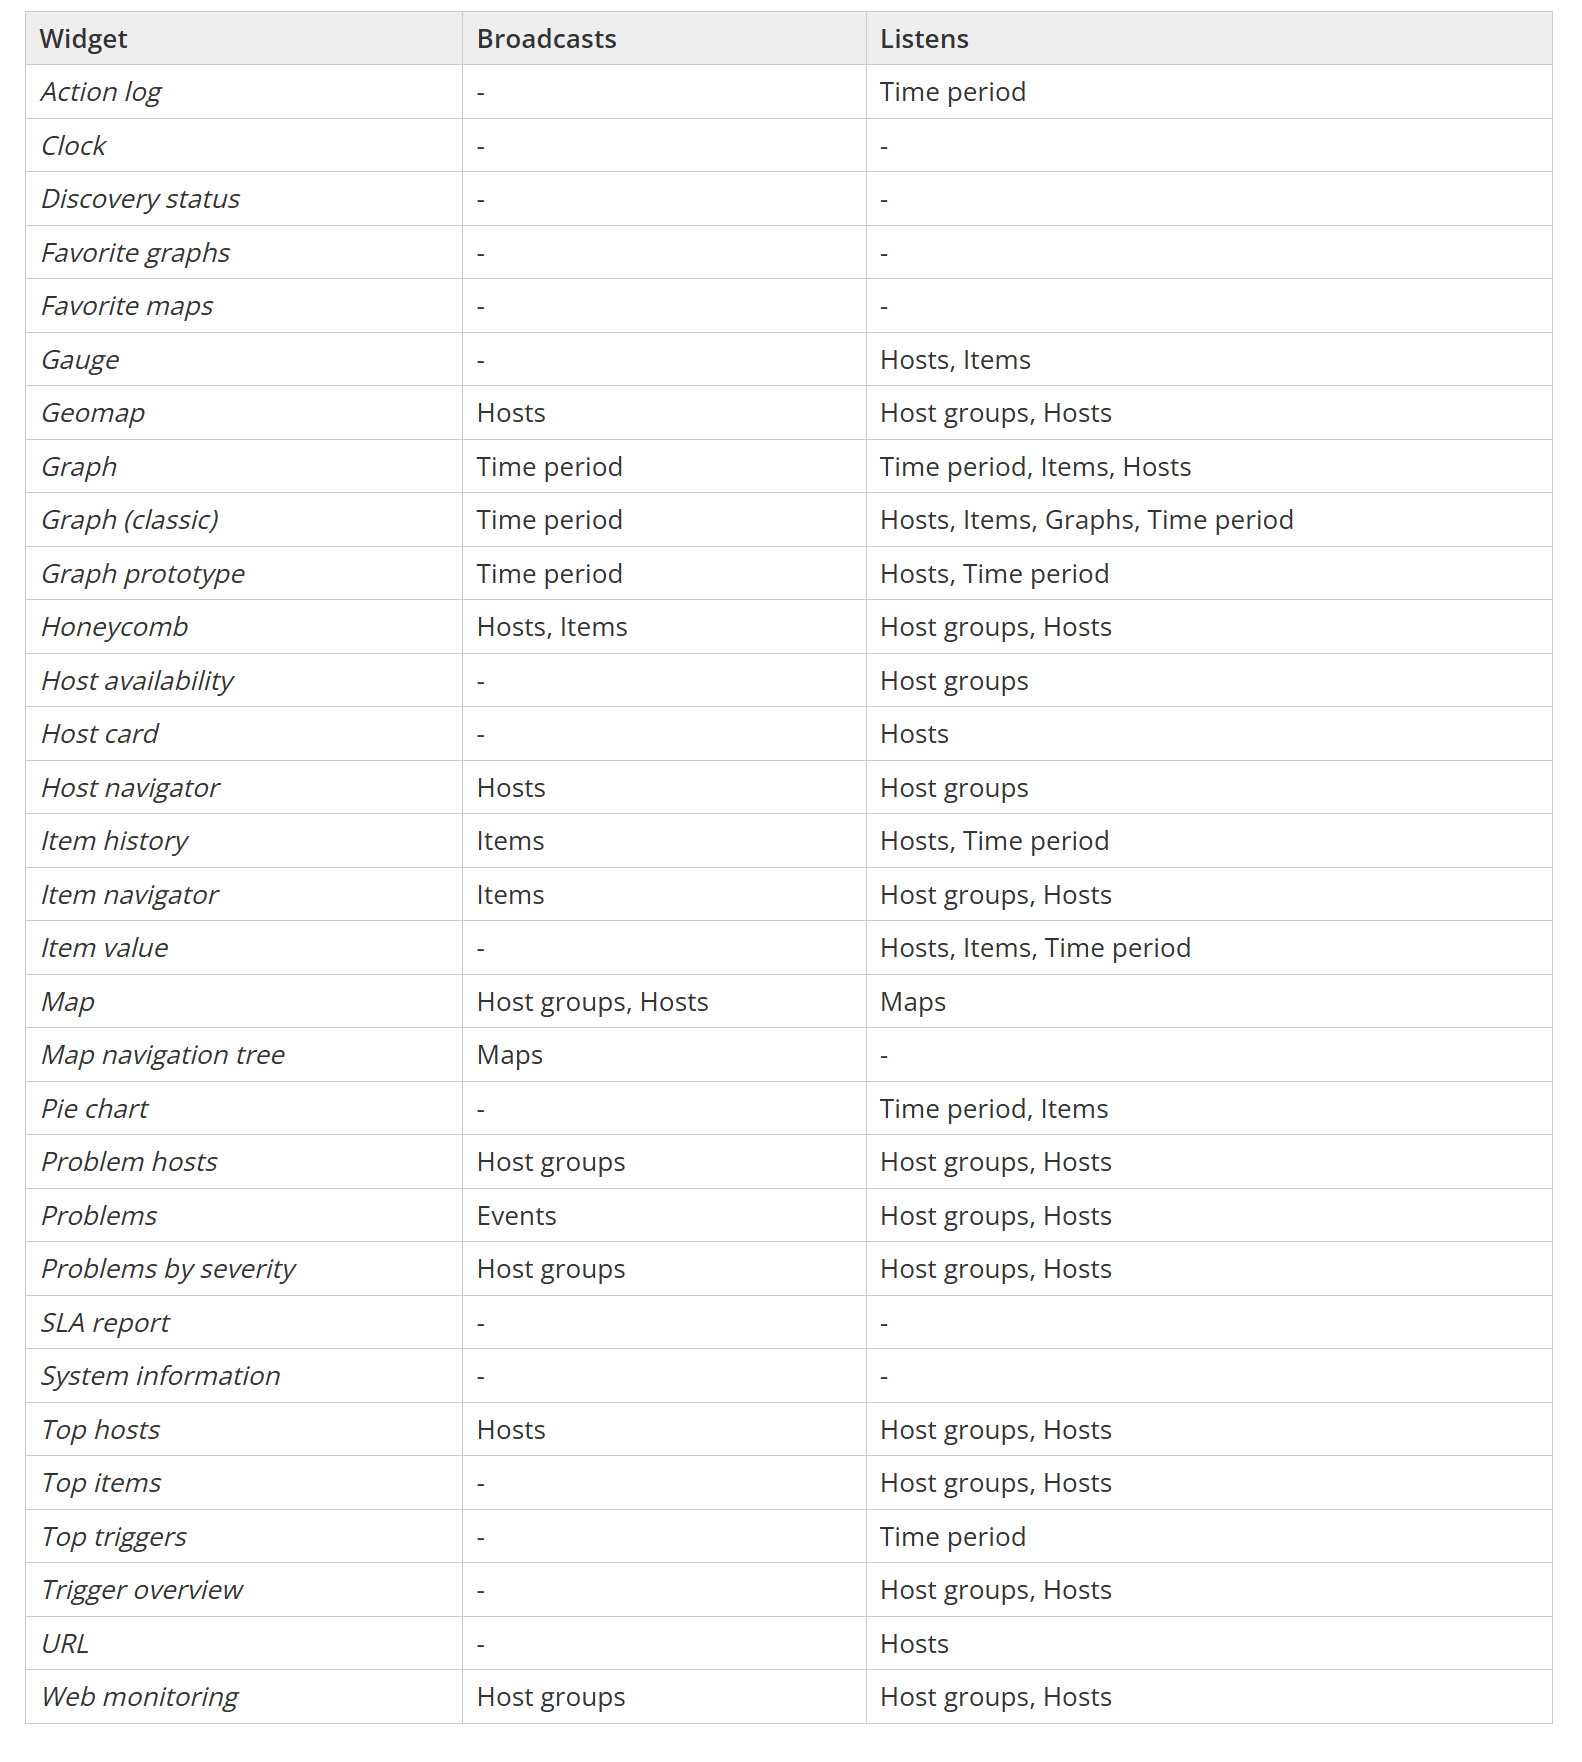
Broadcast and listen capabilities
Zabbix widgets can be used to not only display static data, but they can also be linked together by using widget broadcast and listen capabilities. Depending on the built-in capabilities, widgets can either broadcast data (such as the item, host, event, or time interval selected in the widget) or listen and display the selected data points – multiple widgets support both broadcast and listen capabilities.
Widgets can broadcast and listen for the following entities:
Hosts
Host groups
Time periods
Items
Events
Maps
Zabbix documentation contains the full list of widget broadcast and listen capabilities.
Widget broadcast and listen capabilities
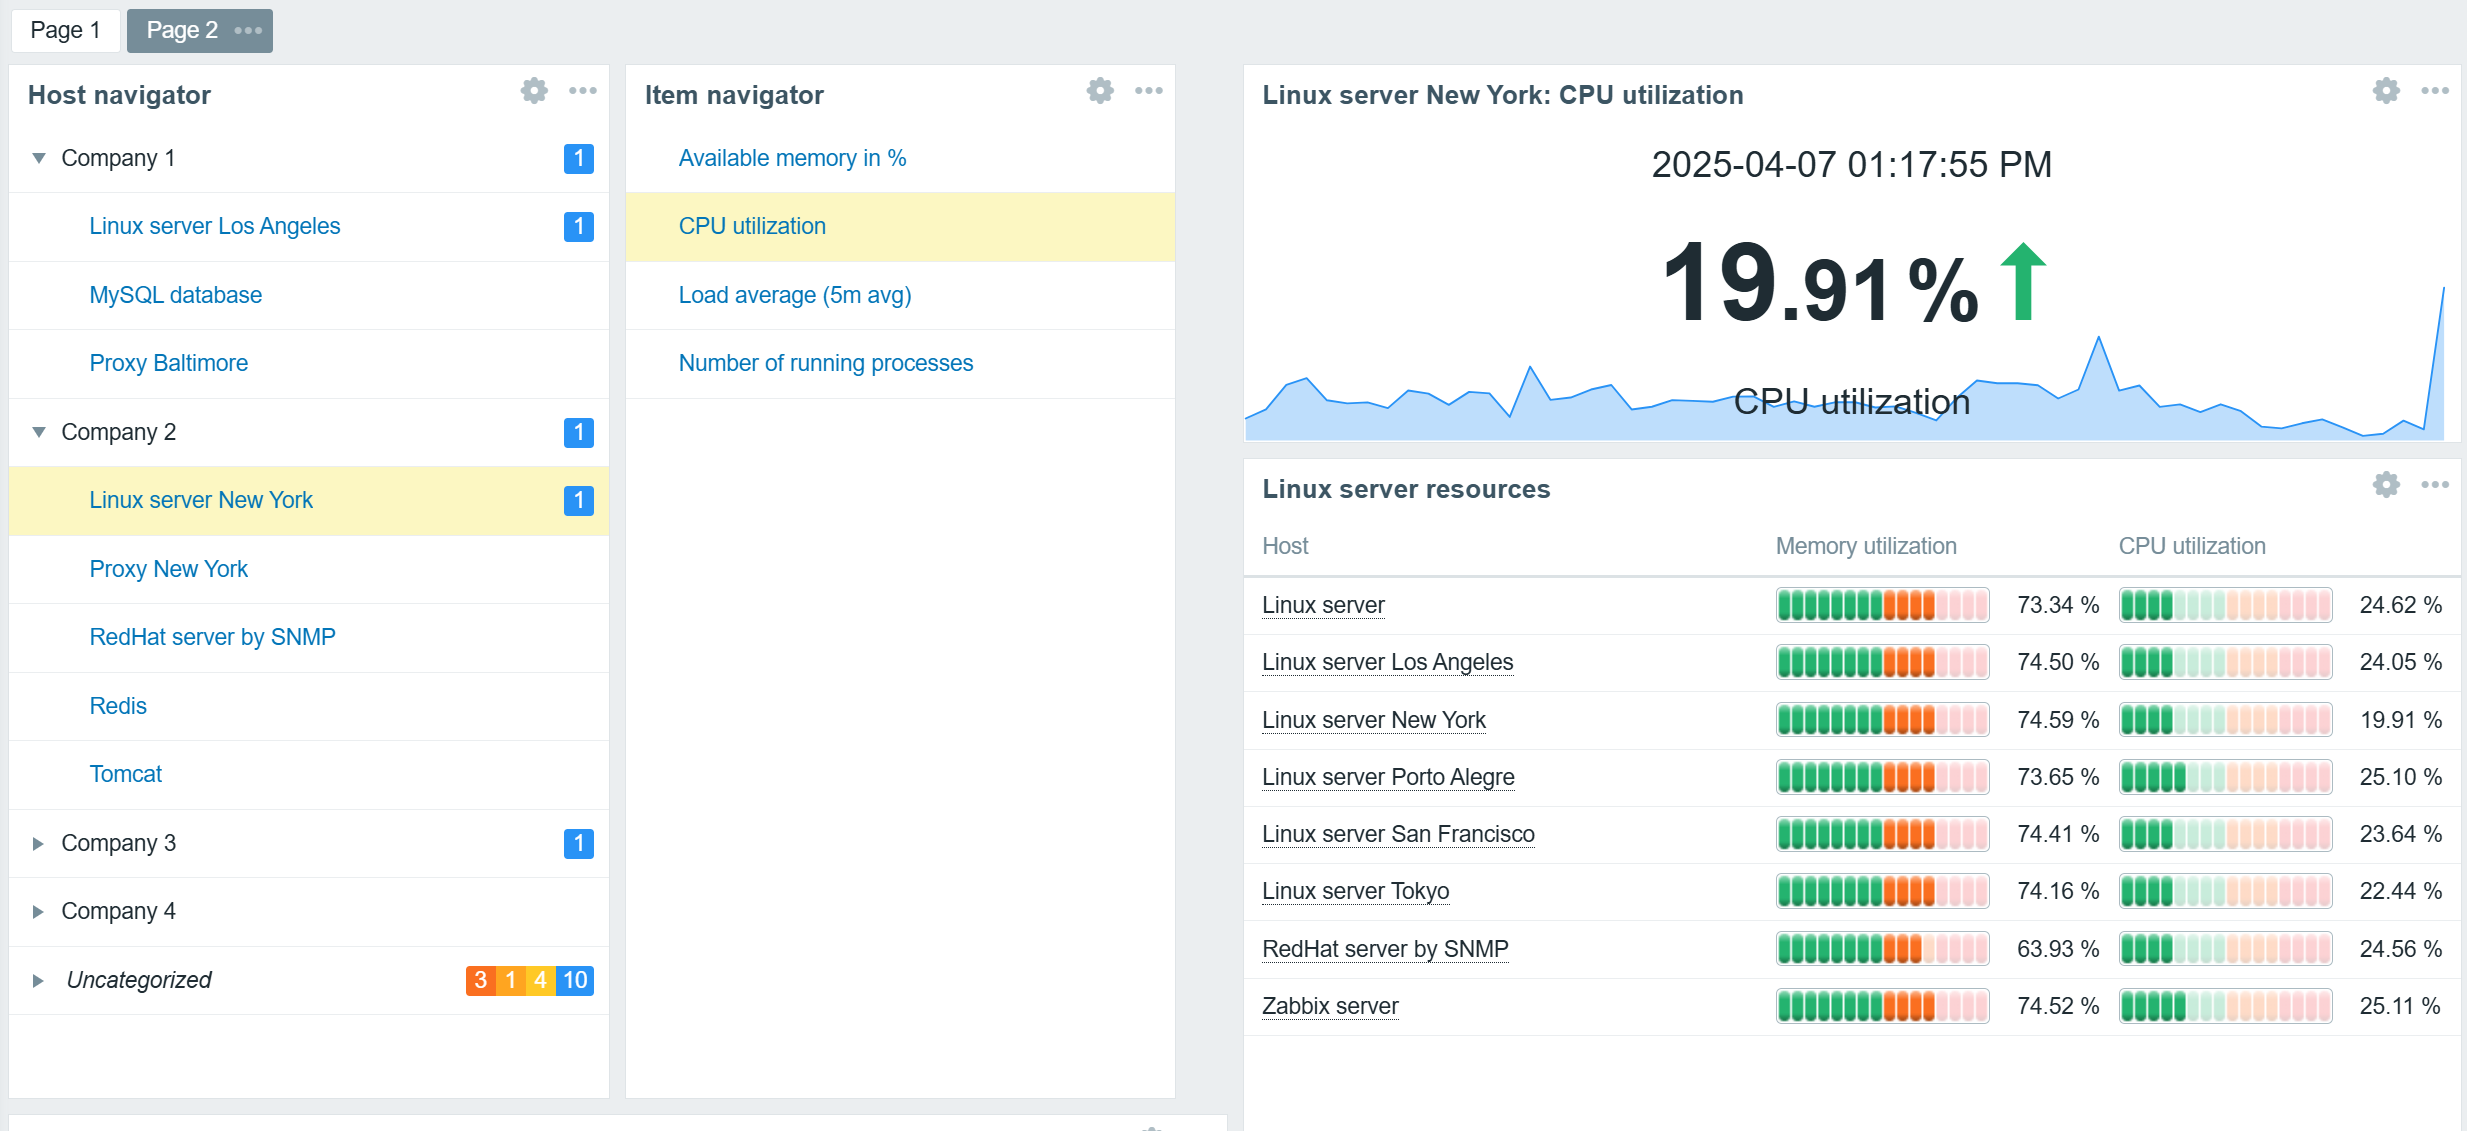
Navigator widgets
Host and Item navigator widgets serve as simple examples of broadcast widgets. The sole purpose of these widgets is to display an organized, interactive list of hosts or items. The selected hosts and items can be broadcast to other widgets such as graphs, gauges, problem widgets, an item value widget, and many others.
In addition to regular widget filters based on hosts, host groups, and tags, navigator widgets can be configured to group hosts or items based on tags, host groups, and existing problem severities. This can be used to provide an organized overview of hosts or items based on MSP clients, organization departments, and any other grouping.
Hosts grouped by MSP clients based on host group names
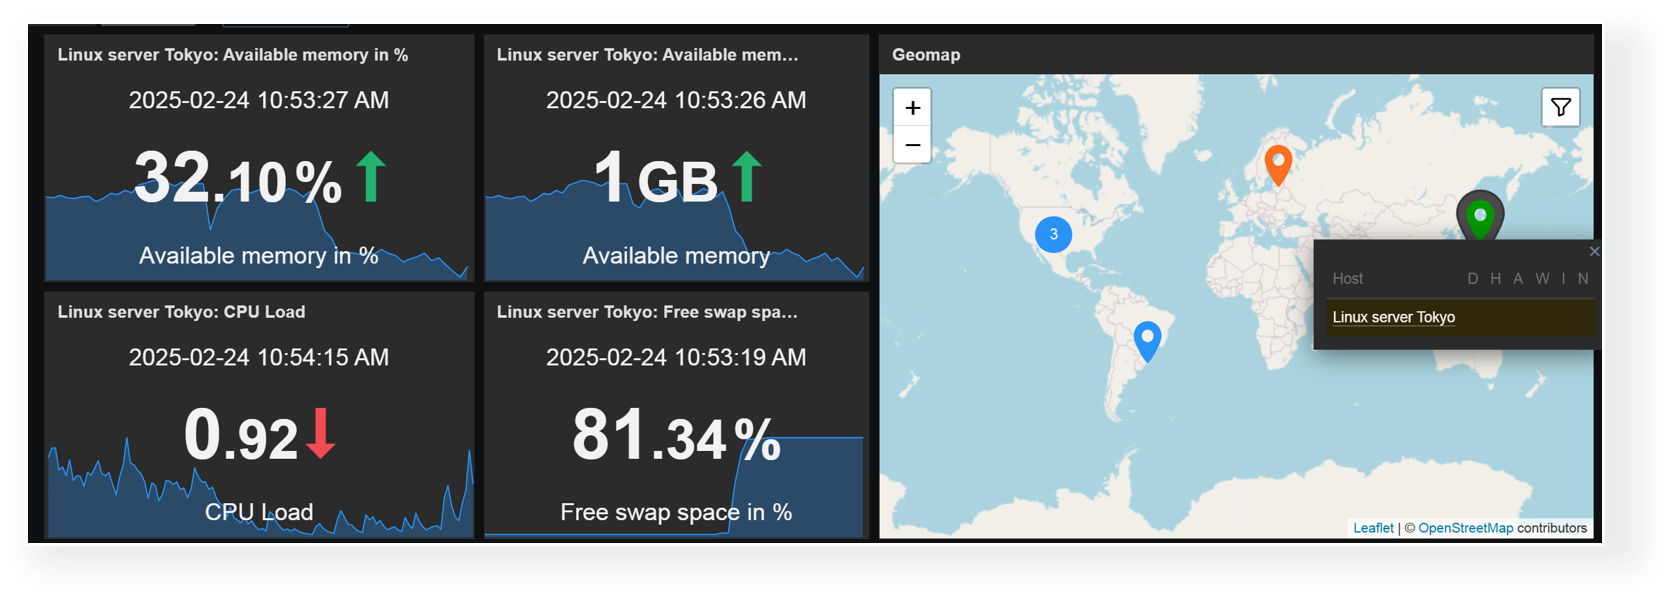
Any combination of widgets from the above table can be used to create interactive dashboards. For example, you could combine the Item value widget listen capabilities with the Geomap widget broadcast capabilities to display item values for hosts selected on the Geomap.
Broadcast hosts from the Geomap widget to Item value widgets
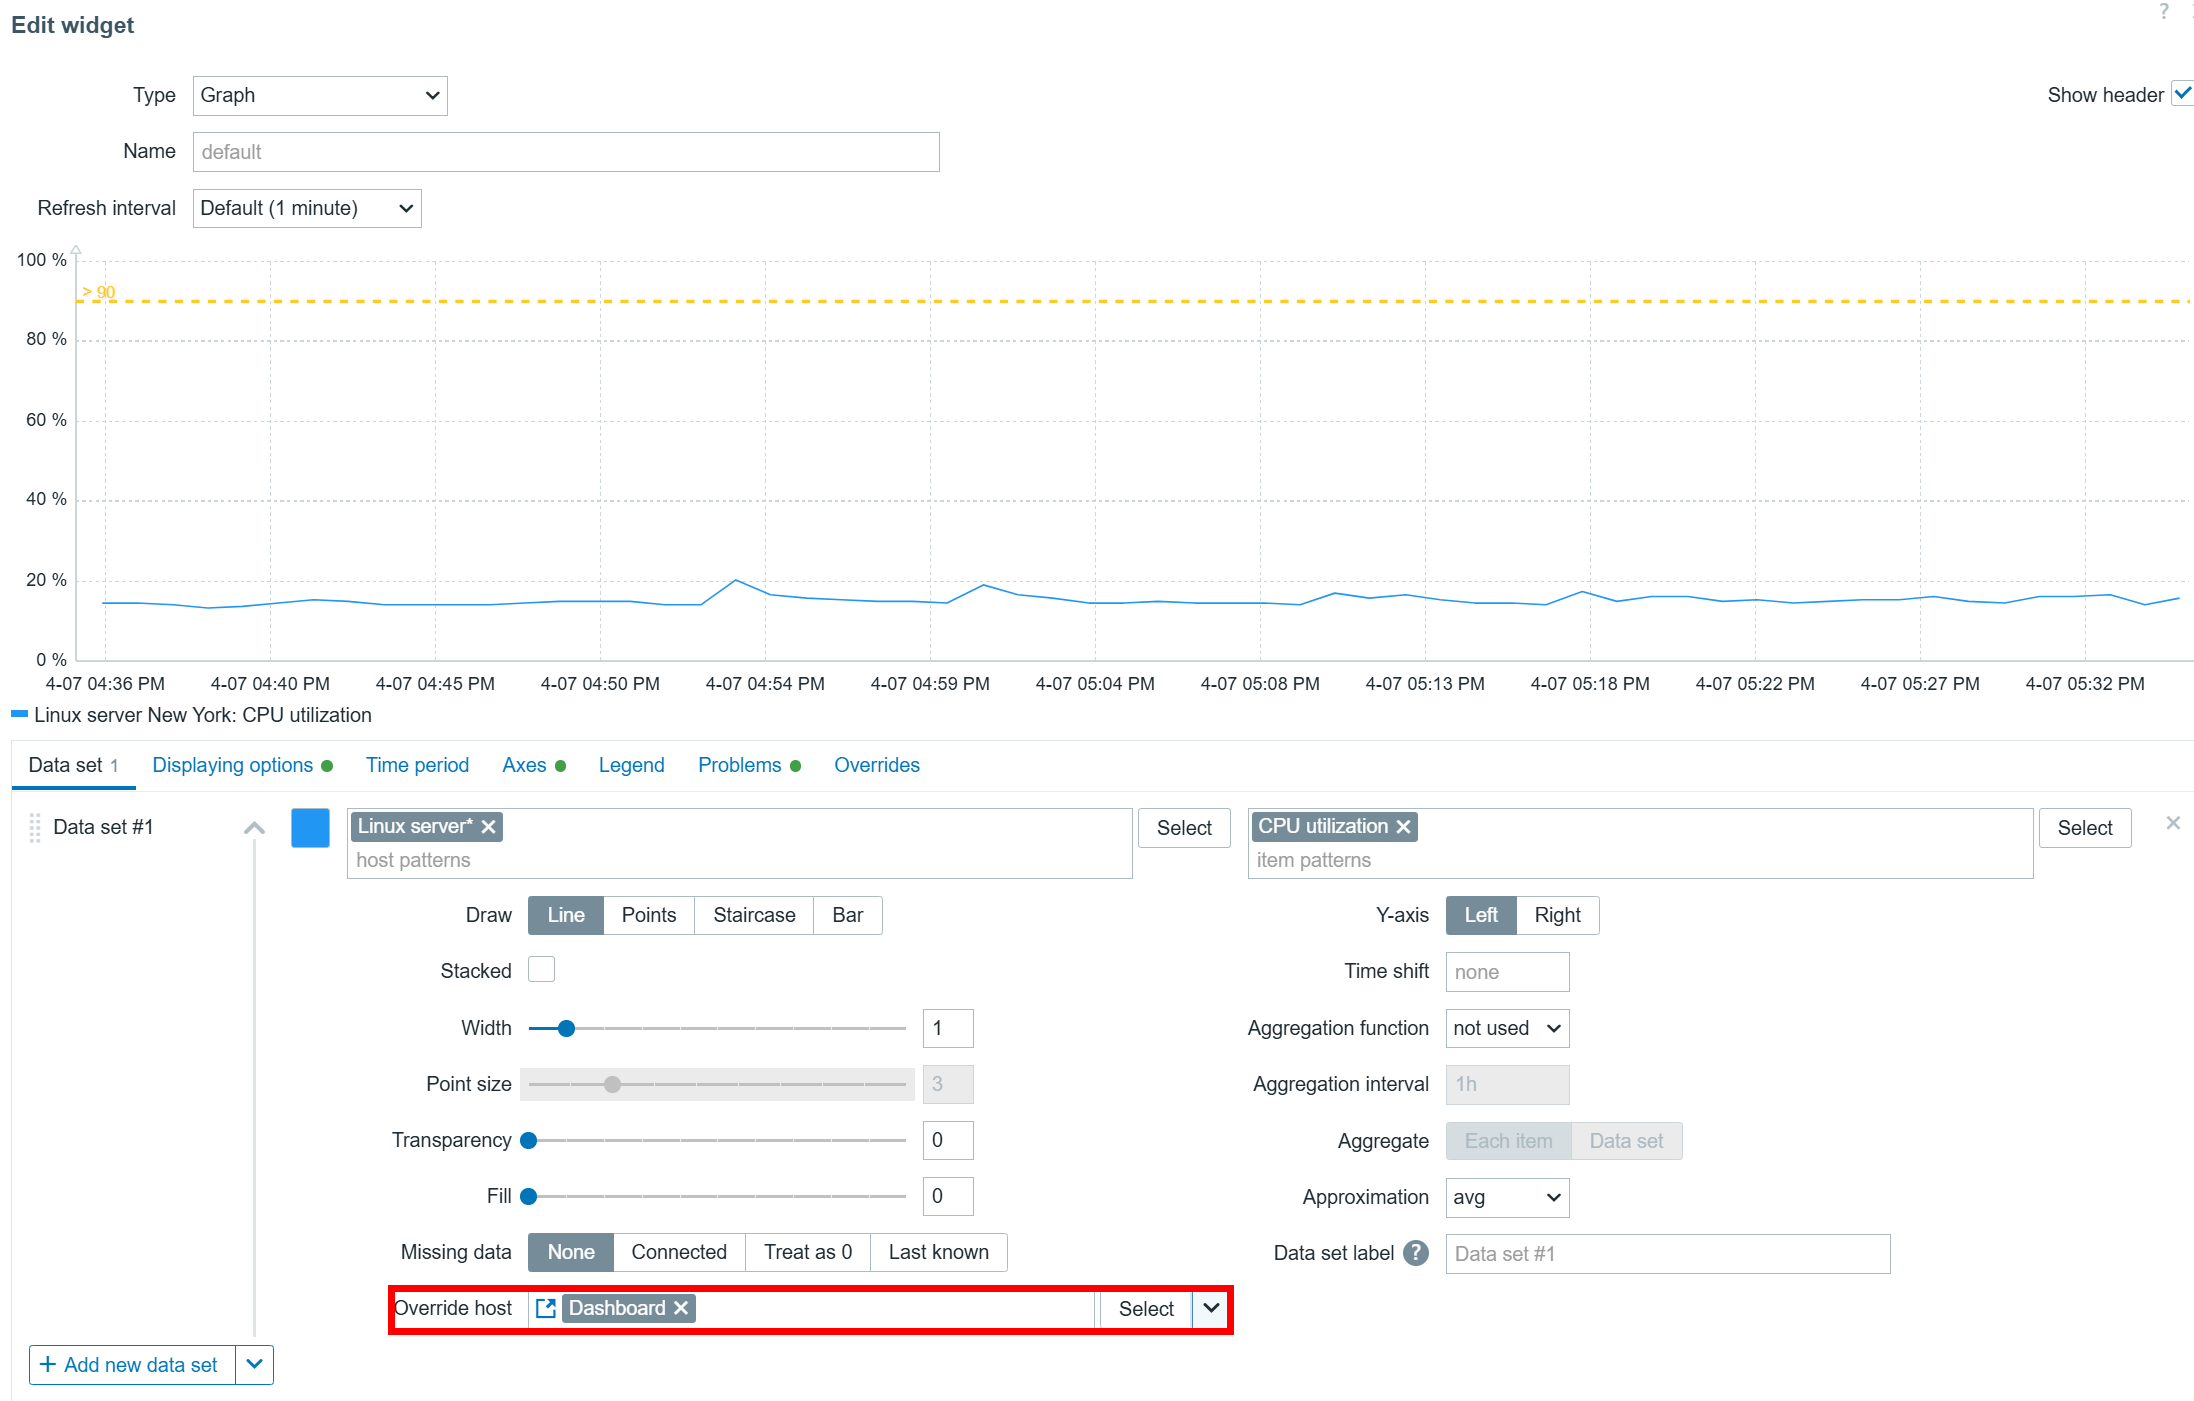
Dashboard-level host broadcast
Host overrides can also be performed on a dashboard level. Once you have set the Override host setting in your widgets to Dashboard, you can select the host in the top right corner of the dashboard. After the host is selected, the widgets will start displaying information related to the selected host.
Host information can also be broadcast on Dashboard level
Selecting non-existing items
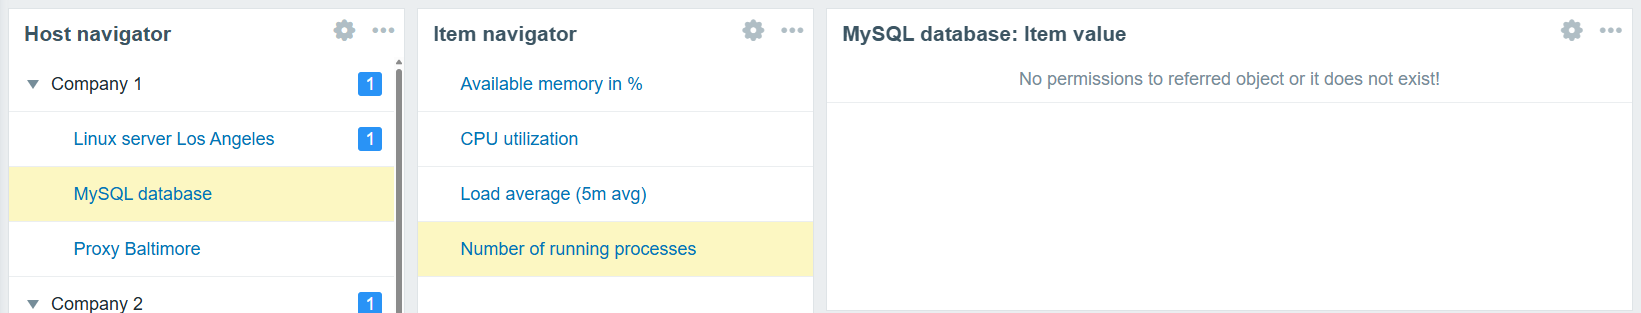
One final thing you should consider when implementing widgets with host/item sources from broadcast widgets is what happens if the selected item does not exist on the selected host. In that case, your widget will display a message “No permission to referred object or it does not exist!” – the same error message the users will see if they lack the read permissions on an item. Ideally, you’d want to define widget filters and broadcast/listen configuration in a way where such errors can be avoided – especially if Zabbix is used as a central monitoring hub for users from multiple departments or organizations.
The item value widget displays an error message since the selected item does not exist on the selected host
Advanced graph widget use cases
The Zabbix graph widget has a variety of advanced features that can enable many new use cases and provide new insights based on the collected item values.
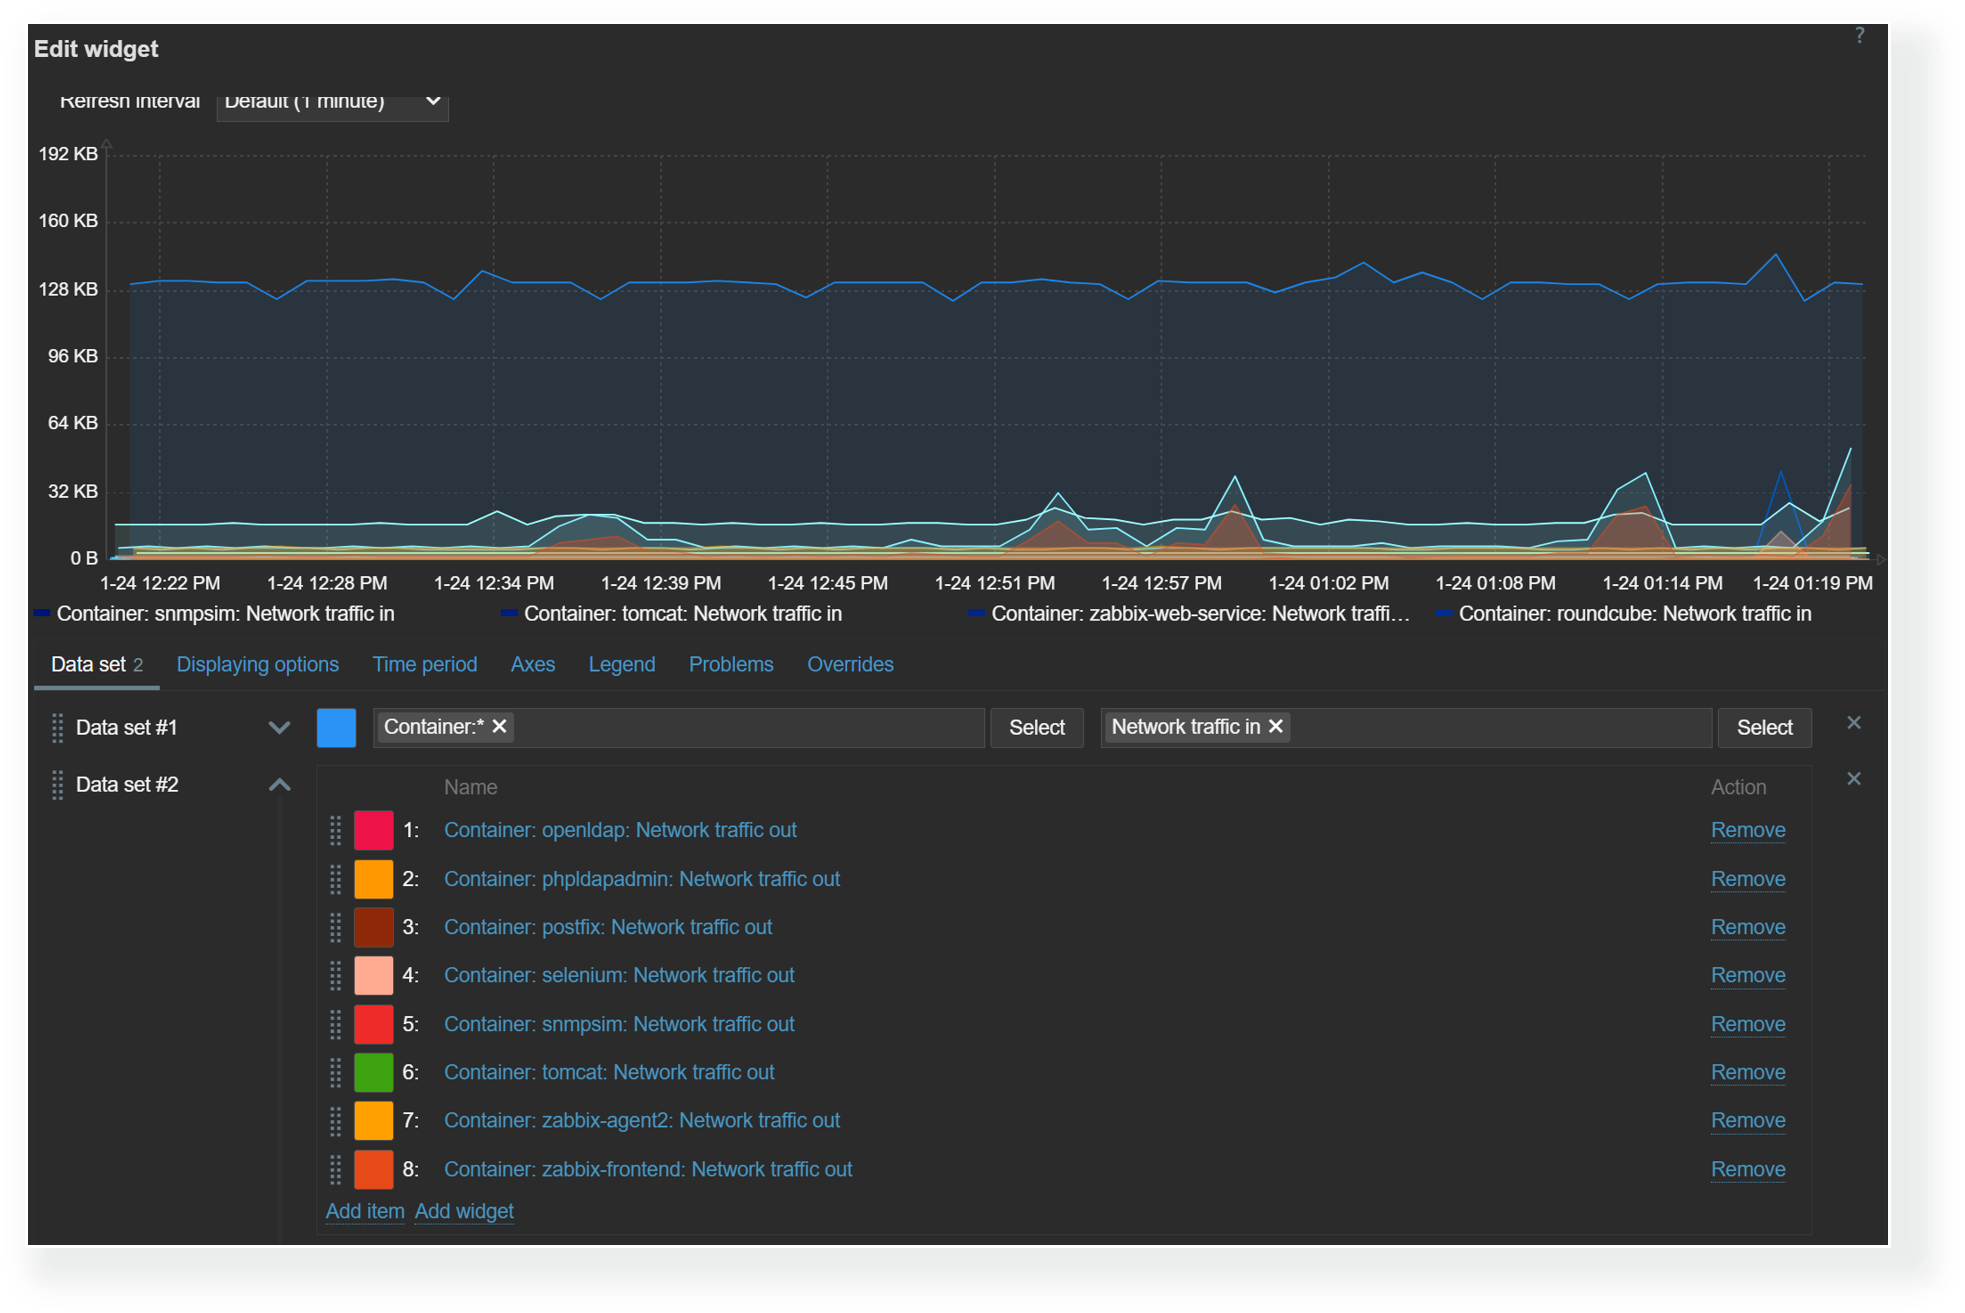
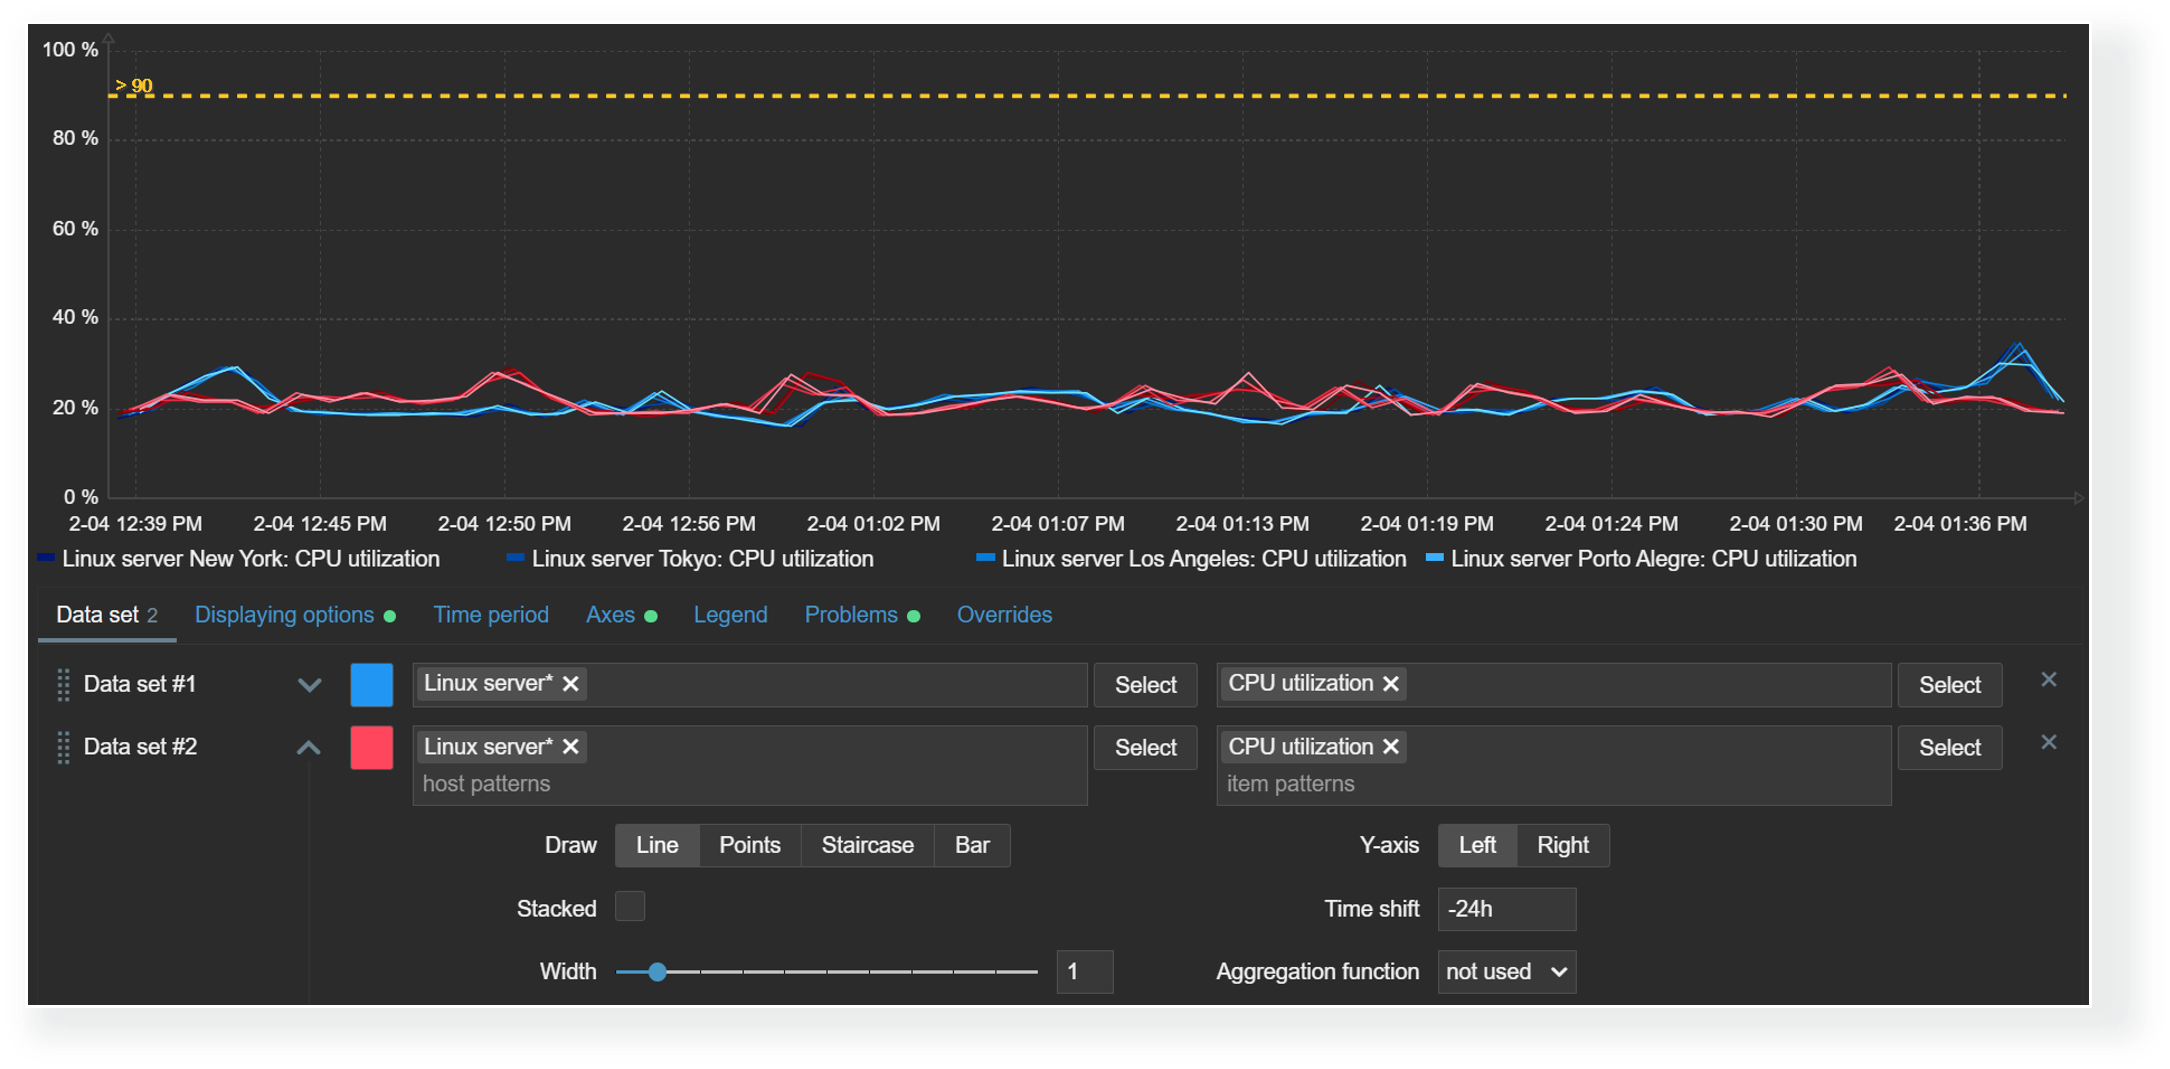
Data sets
The graph widget utilizes data sets to select, match, and group items that would be displayed in the graph. There are two types of data sets – item pattern and item list. When using item list data sets, you have to individually select each item that you wish to display on the graph. On the other hand, item pattern data sets provide more flexibility. Here we can utilize wildcards in host and item names to match items and hosts by name. This is especially useful for items discovered by low-level discovery in dynamic environments. With item pattern data sets, the addition or removal of items matching the pattern will be automatically reflected in the graph.
Item list and item pattern data sets in the graph widget
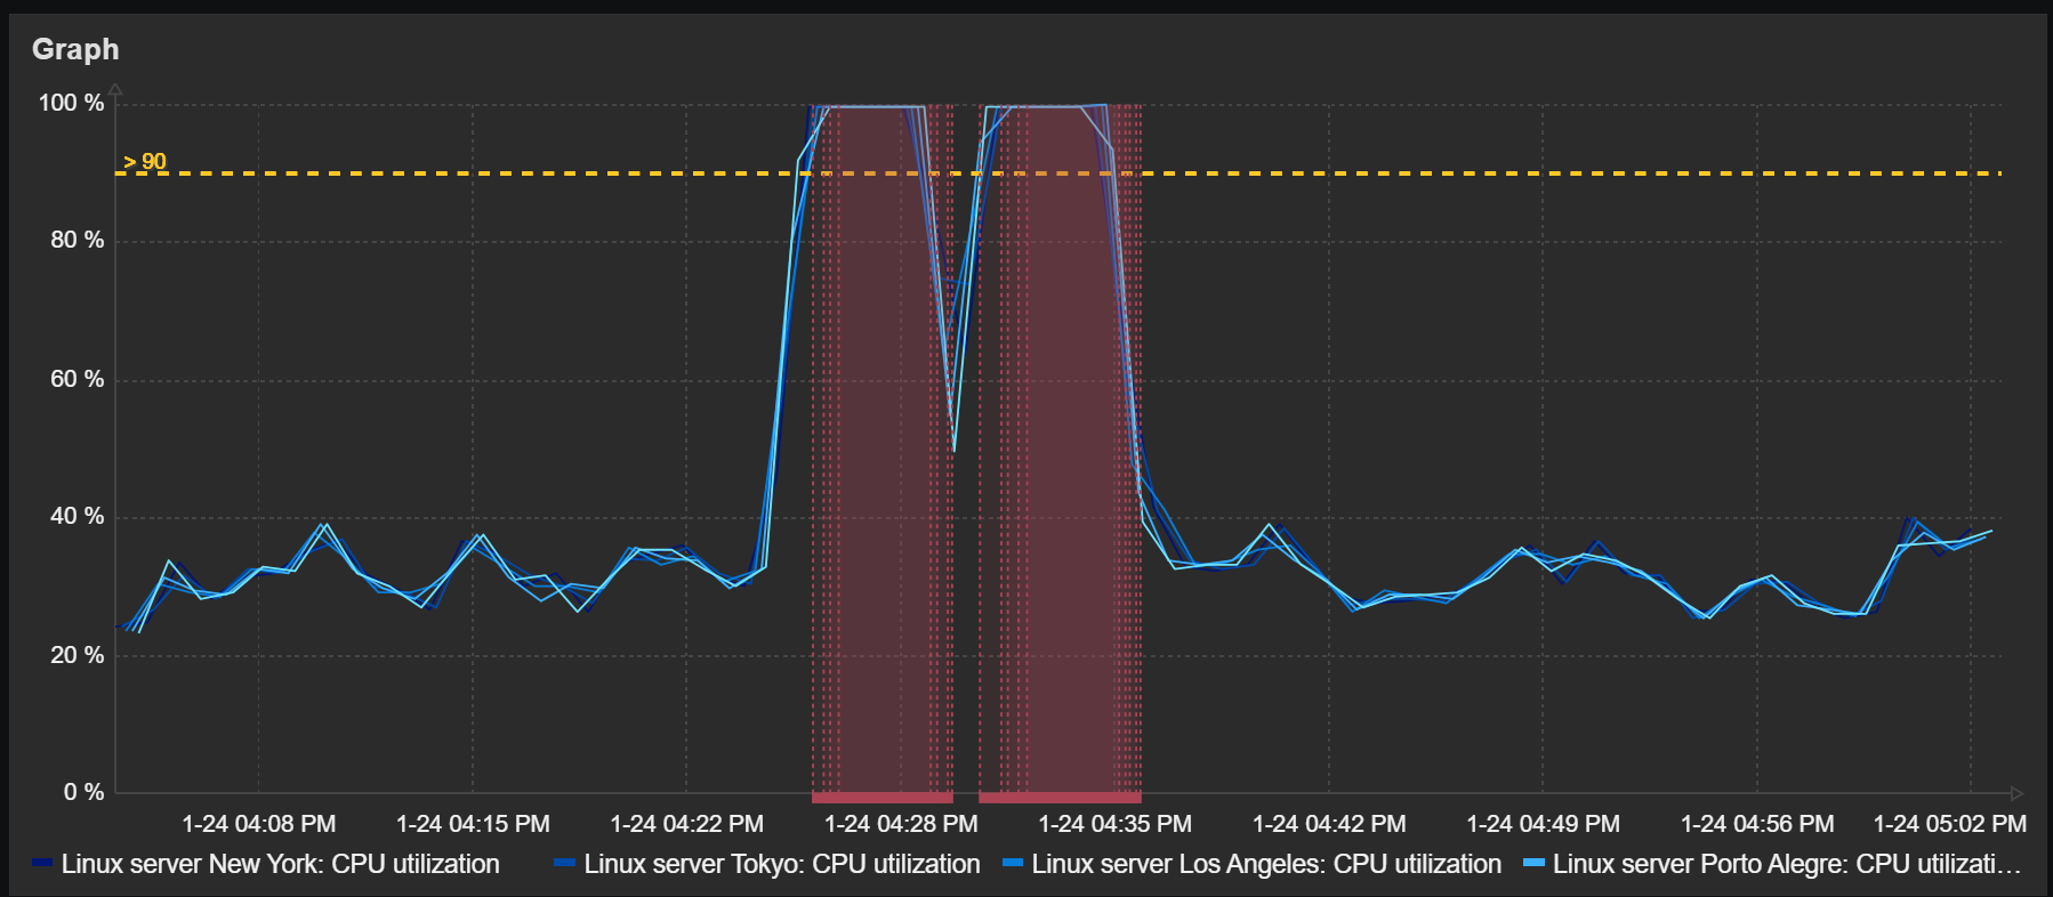
Trigger and problem display
Detected problems and trigger thresholds can also be displayed in dashboard graph widgets. The time periods during which a trigger related to the displayed items has been in a problem state will be highlighted in red. The graphs also provide an option to display a trigger line for triggers utilizing last, min, max, and avg functions.
Graph widget can display a trigger line and highlight periods during which a problem was active
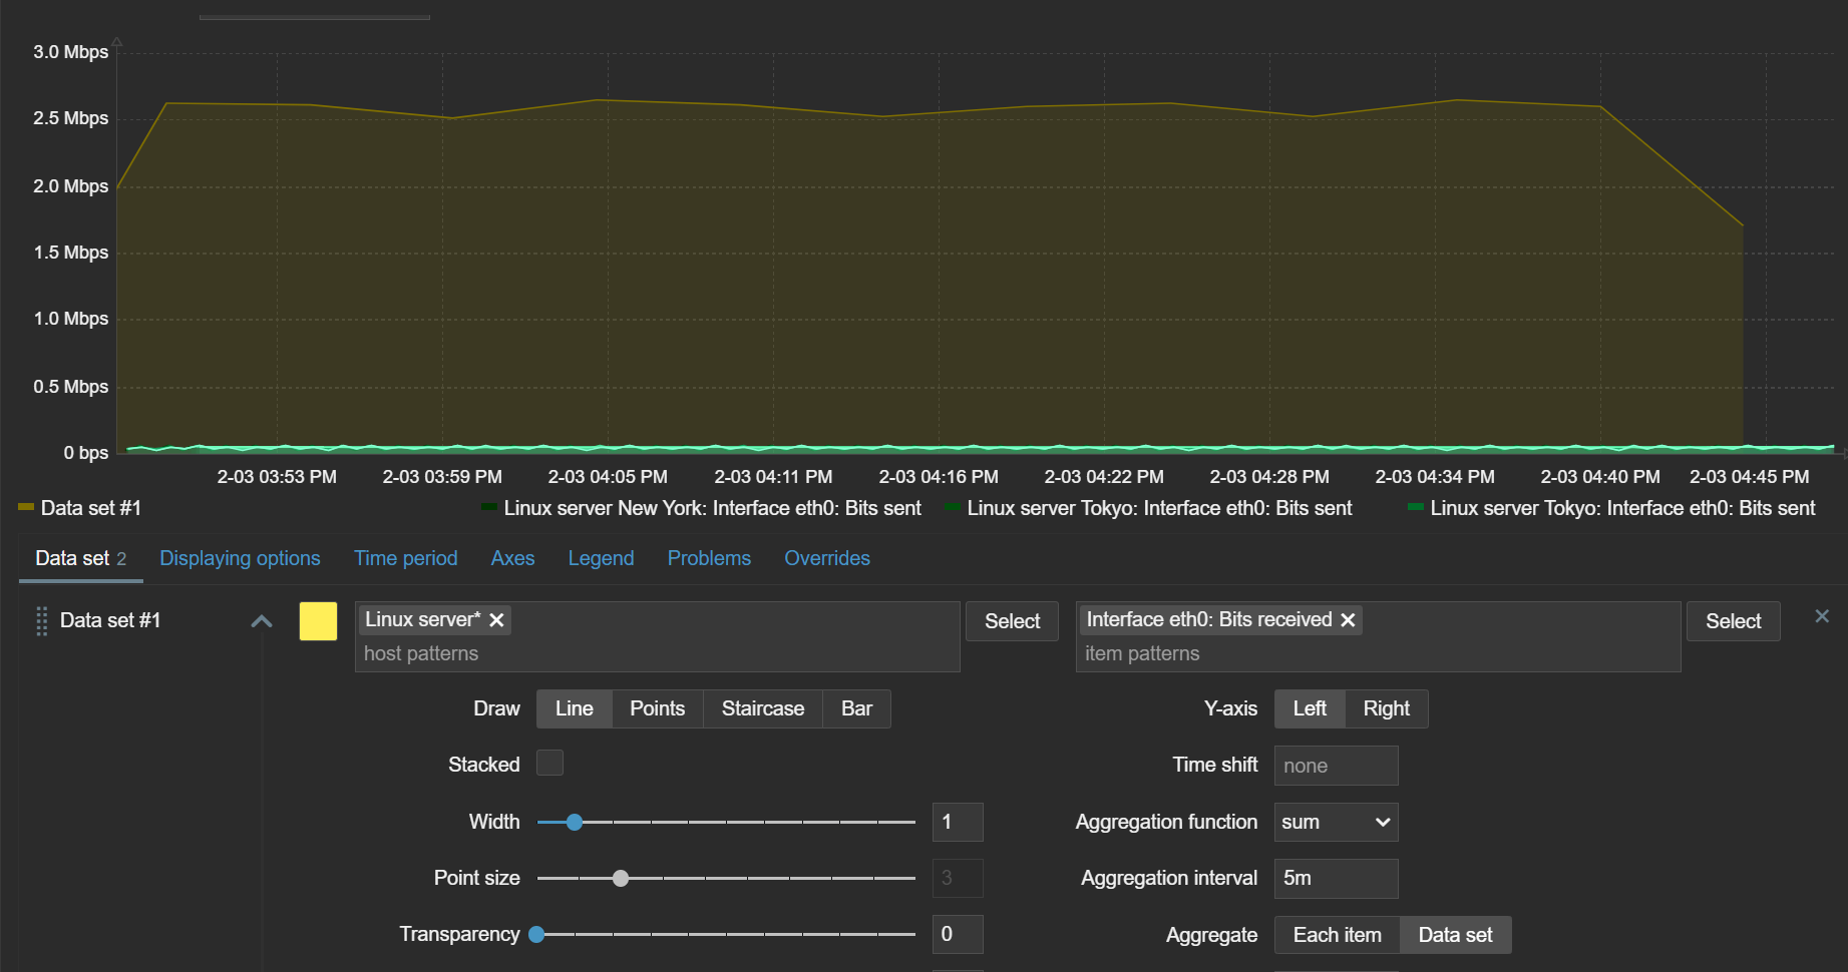
Aggregation
The ability to aggregate data directly within the widget can be an extremely useful tool for gaining new insights from existing data. With graph widget aggregations, it is possible to aggregate each individual item (for example, displaying hourly averages for network traffic on each interface) or the whole data set (total hourly traffic from all interfaces).
Aggregations can be performed on each item or the whole data set
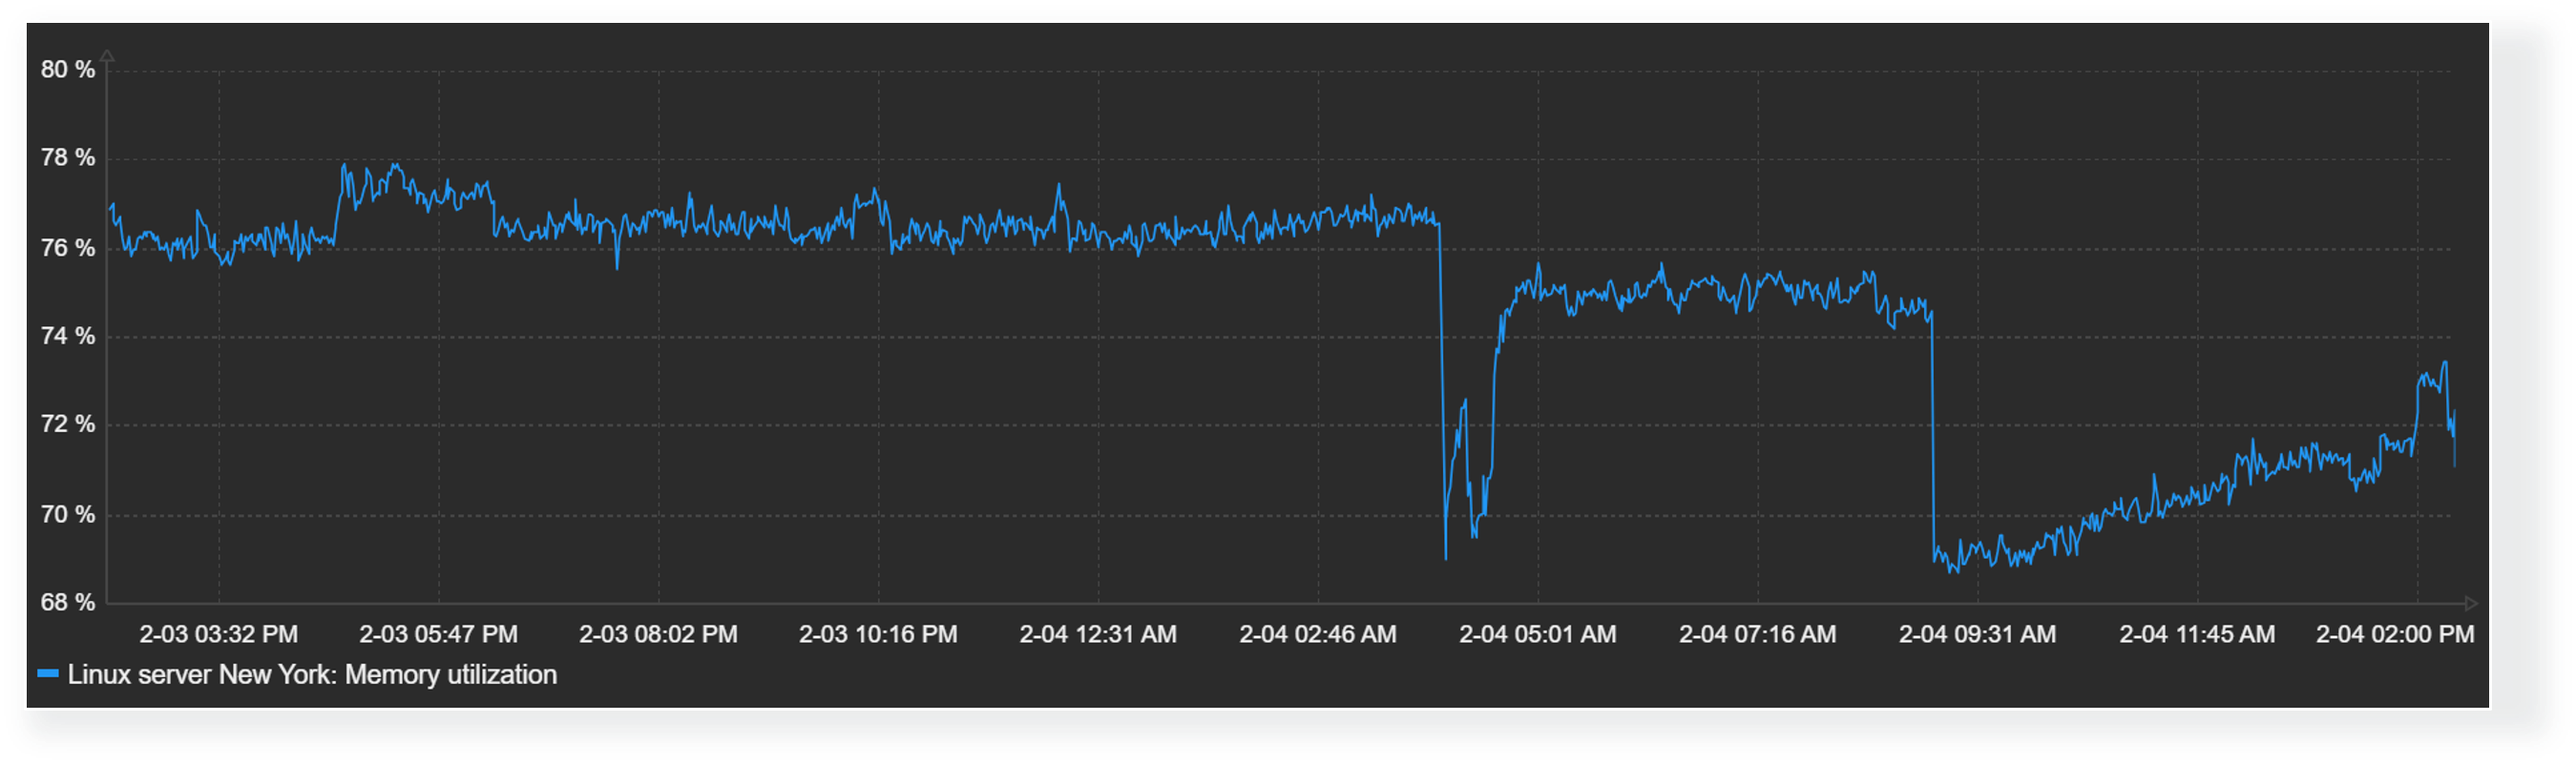
Time shift
The time shift feature is useful for visually comparing current values with values collected some time in the past. For example, we could compare the current CPU load on our application server with the CPU load for the same time period yesterday. This could allow us to detect unexpected deviations just by glancing over the graph.
With the graph widget time shift feature, you can compare current values with values collected in the past
Missing data
Finally, the graph widget enables Zabbix users to choose how they wish to display missing values. Values for items could be missing for a variety of reasons – anything from data collection errors to various preprocessing workflows that could discard item values by design. Accordingly, it makes sense to design your graphs with the correct representation of missing data in mind.
Missing values in graphs can be displayed in the following formats:
Treat missing values as 0
Do not display missing values
Connect the last known value with the current value
Treat missing values as the last known value
Missing values are treated as 0Missing values are selected to not be displayed
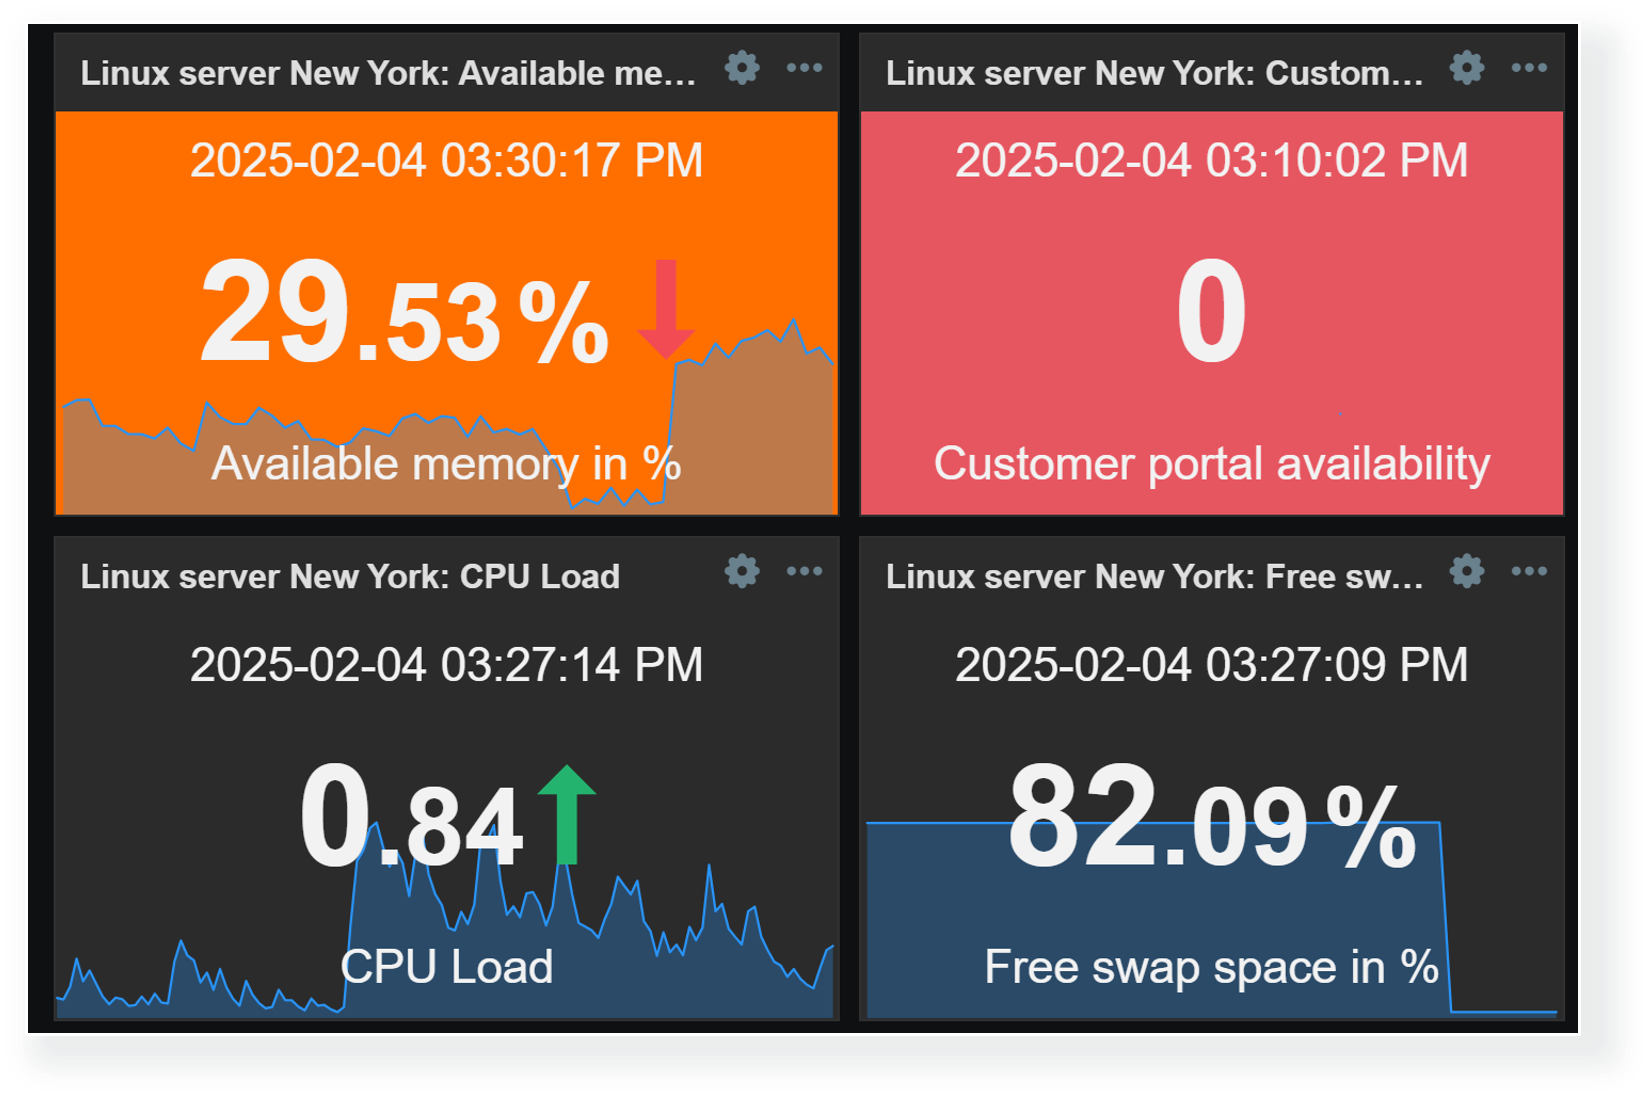
Defining widget value thresholds
Threshold values can be defined for multiple widgets to make the visualization of data more dynamic. This way, Zabbix dashboards can instantly highlight resources exceeding warning/critical thresholds, services in unexpected states, unreachable endpoints, and a variety of other issues. As of Zabbix 7.2, widget thresholds are available only for numeric item values.
Widgets with threshold support
Multiple widgets provide the ability to define value thresholds:
Item value
Gauge
Top hosts
Top items
Honeycomb
Thresholds can be defined in widget configuration. By defining one or multiple thresholds, we specify that whenever values for the selected item reach or exceed the threshold, they will be highlighted in the selected color.
Item value widget can be used to highlight problematic resources or services
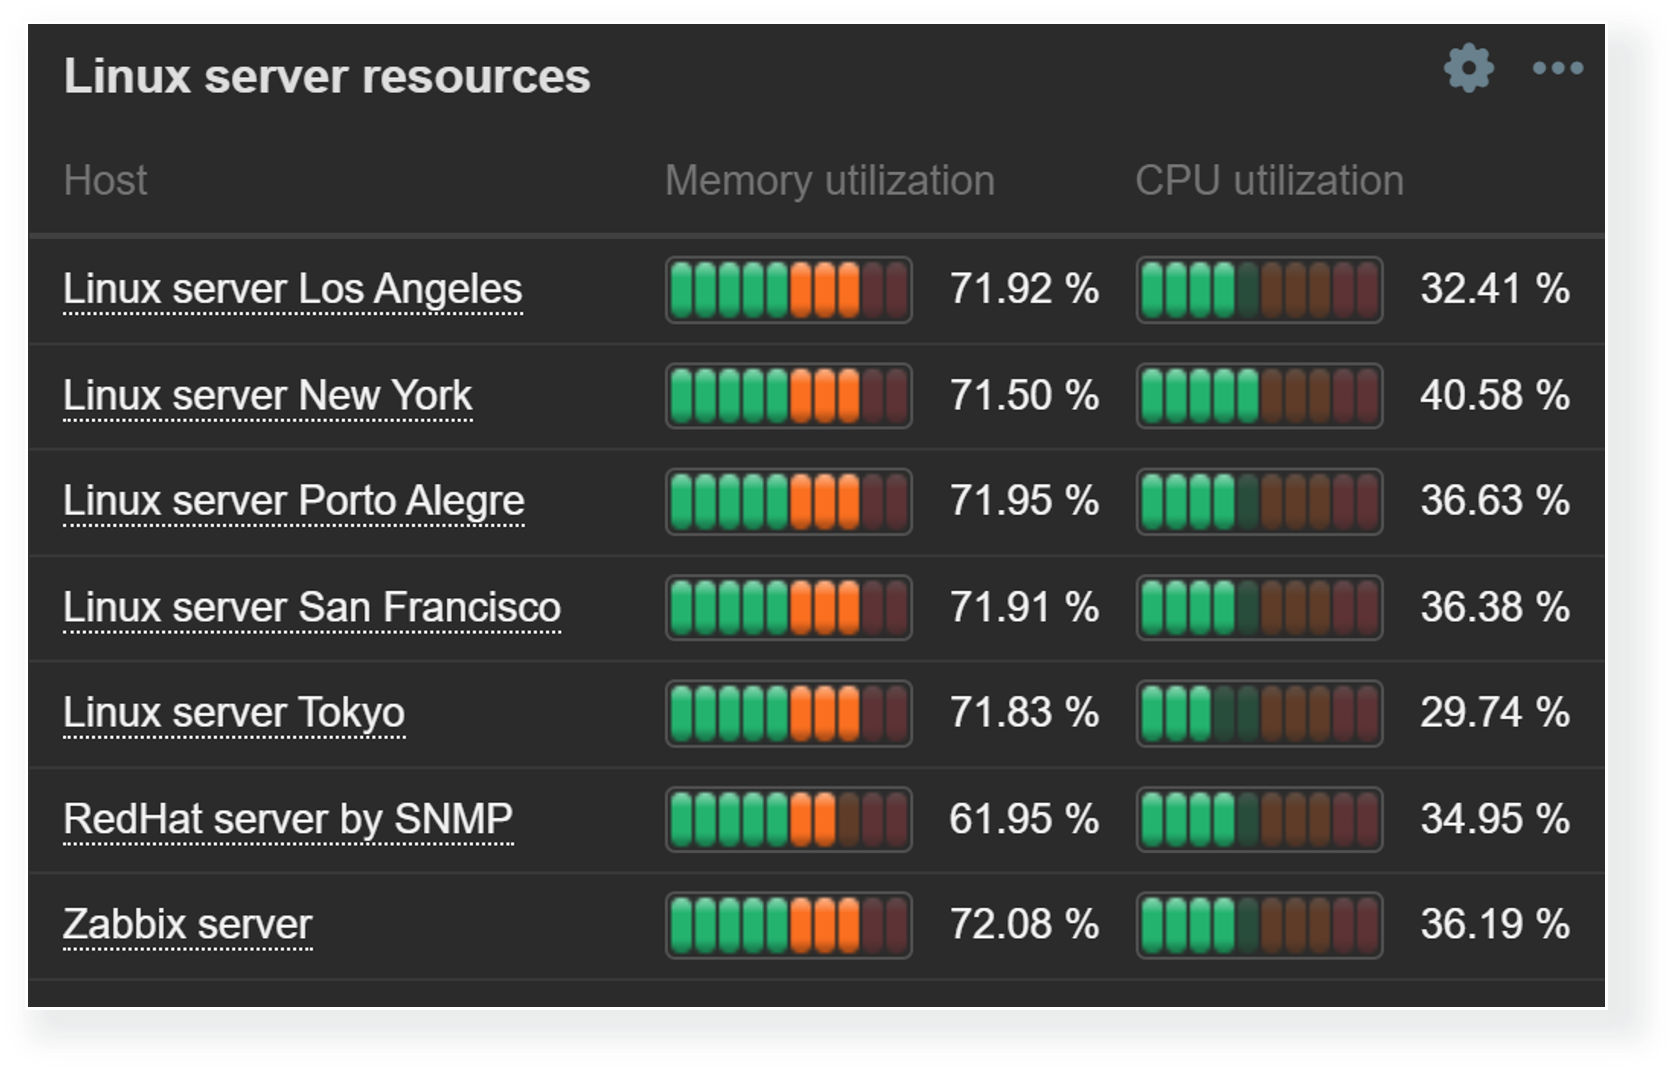
Thresholds are useful for not only highlighting the problematic items in Item value or Gauge widgets, but can also be used to provide a broader view of overall resource utilization with Top hosts and Top items widgets. Since we aren’t limited to a single item, Top hosts and Top items widgets enable us to do a surface-level correlation by looking at the utilization of various resources and highlighting the resources nearing critical utilization thresholds.
Top hosts and Top items widgets can display a comprehensive overview of host resource usage
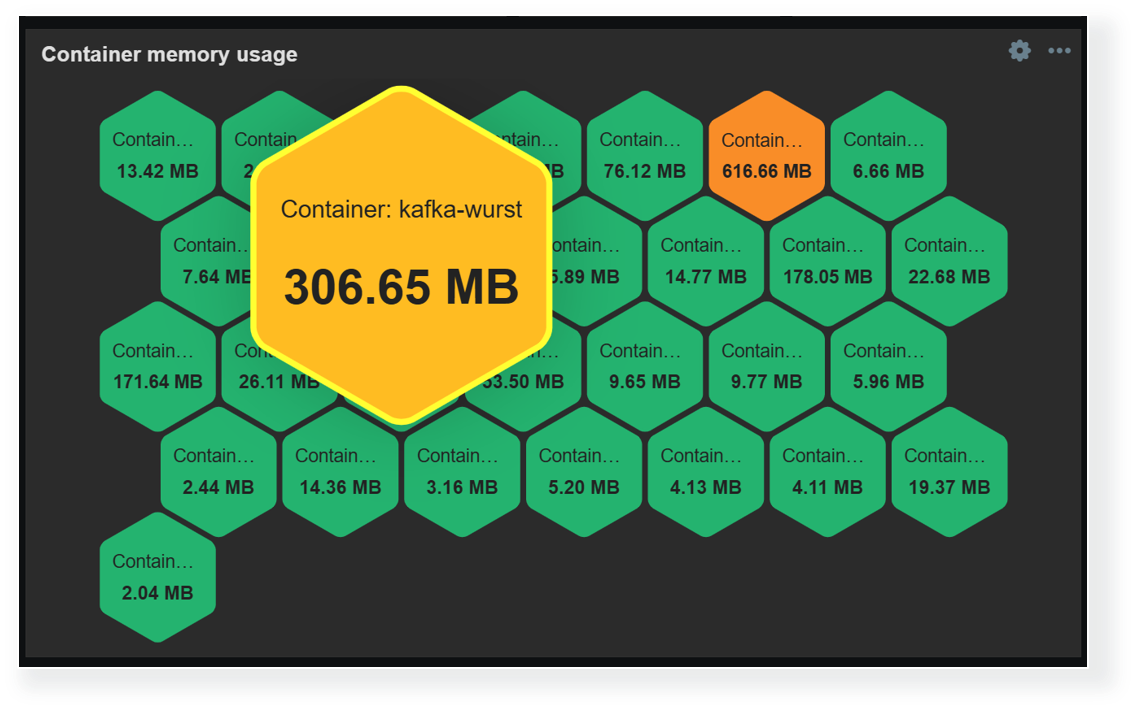
Another way to display and highlight our infrastructure state on a larger scale is by using the Honeycomb widget. The Honeycomb widget utilizes item patterns to display the matching item values. Here, thresholds can be combined with color interpolation to provide a more dynamic view of our environment. The Honeycomb widget is also capable of broadcasting the selected item and host, which enables us to quickly gain more information about the problematic host by clicking the corresponding cell in the widget.
Honeycomb widgets provide a dynamic overview of enterprise resource usage by supporting color interpolation features
Dashboards for MSPs
The previous sections have already highlighted a variety of features, useful widgets, and widget features for large organizations and MSPs. But let’s not forget that MSPs require granular access permission and control features. MSPs must also ensure that each client’s information (Hosts, items, dashboards) is fully isolated and secure from outside access.
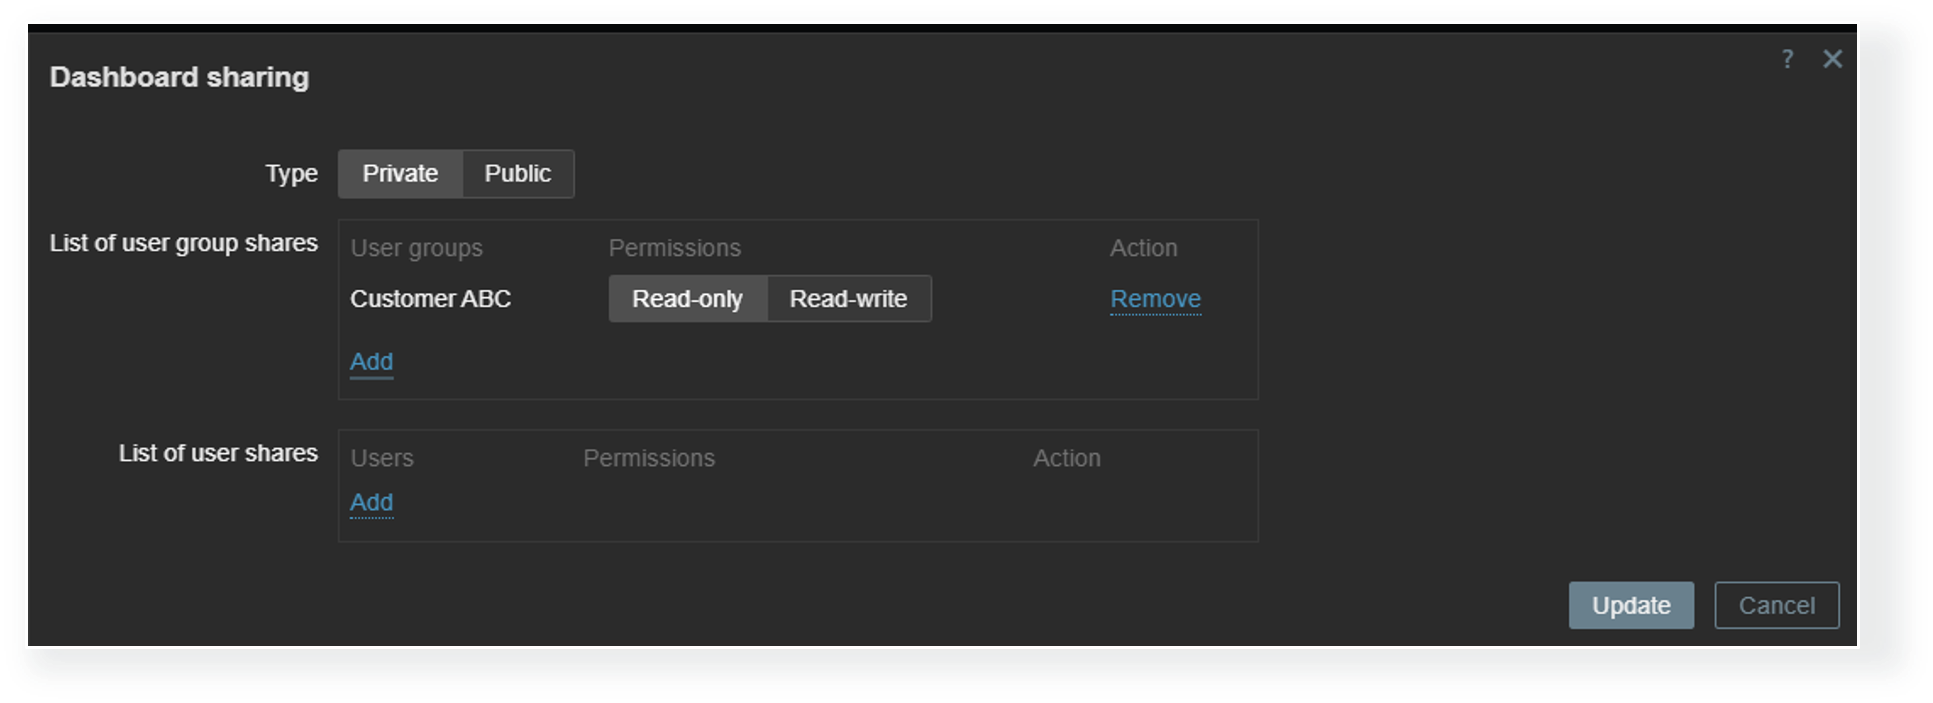
Dashboard visibility
Each dashboard can be deployed either as a public or a private dashboard. Public dashboards are available to every user in read-only mode, while private dashboards require explicit read and write permissions for users who need access to them. MSPs can utilize private client organization dashboards to allow each client to view information about their environment in multiple views while completely hiding the dashboards assigned to other organizations.
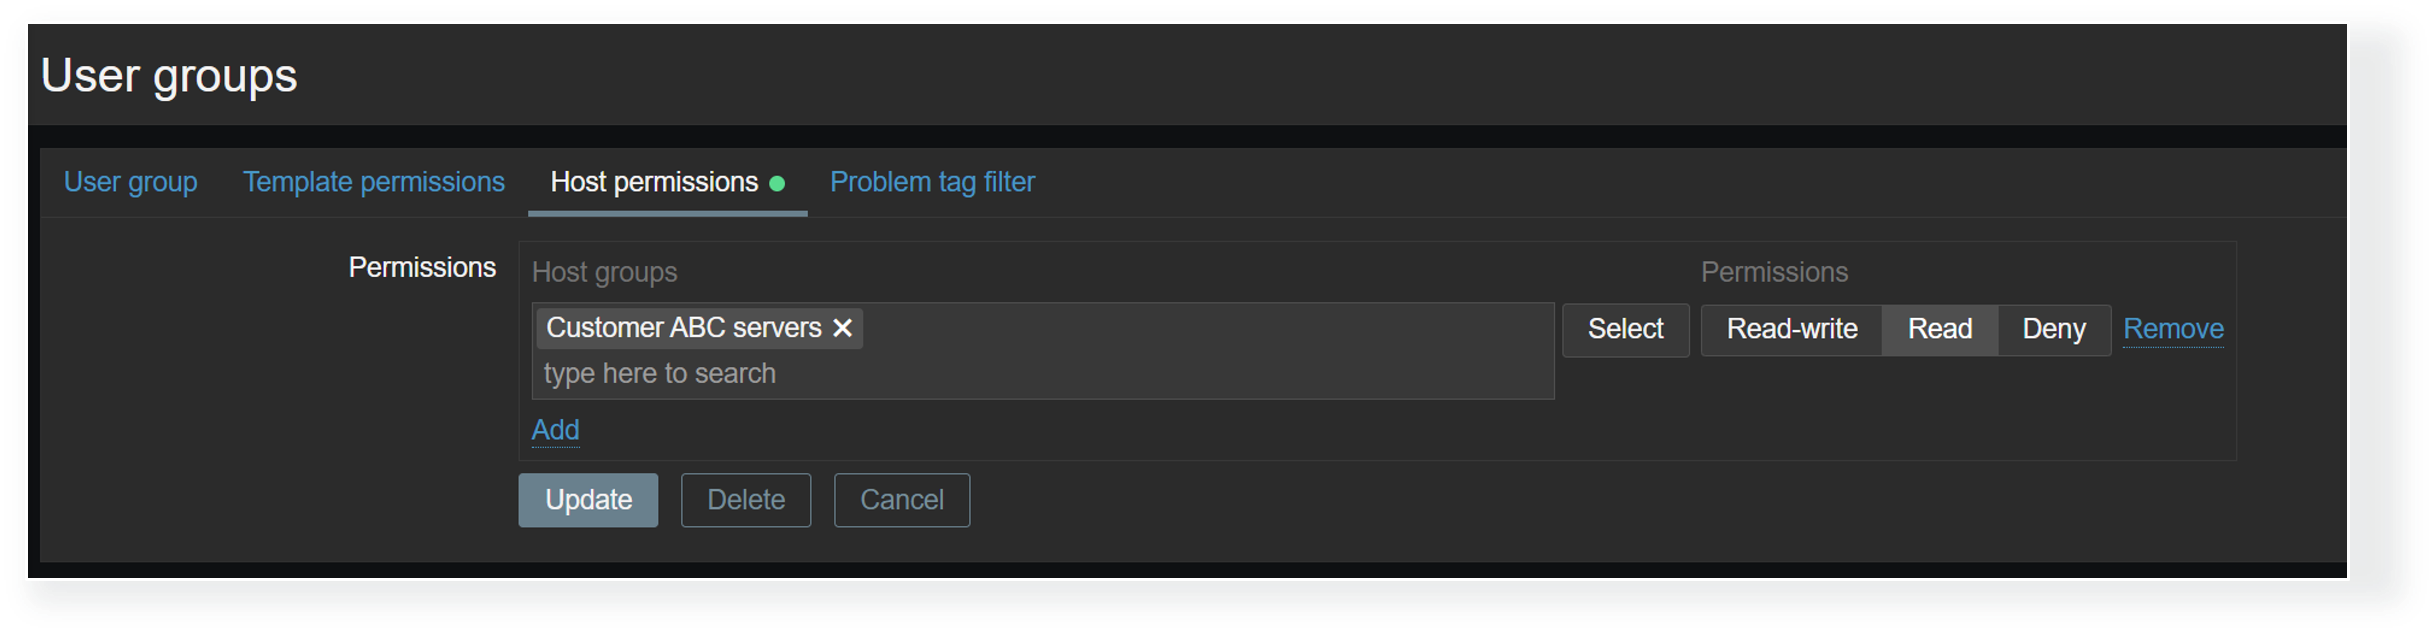
Dashboard visibility is only the first access control layer. Even when a Zabbix user has access to a dashboard, we must ensure that the user also belongs to a user group that has at least read permissions on the hosts displayed on a dashboard. Without at least read permissions, the hosts will not be displayed in dashboard widgets. This way, MSPs can utilize a single dashboard where each organization’s users can only see the information related to their environments, as opposed to having many duplicate dashboards, where each has a custom host filter that matches just the particular organization’s hosts.
User group-to-host group permissions have a direct impact on host visibility in dashboards
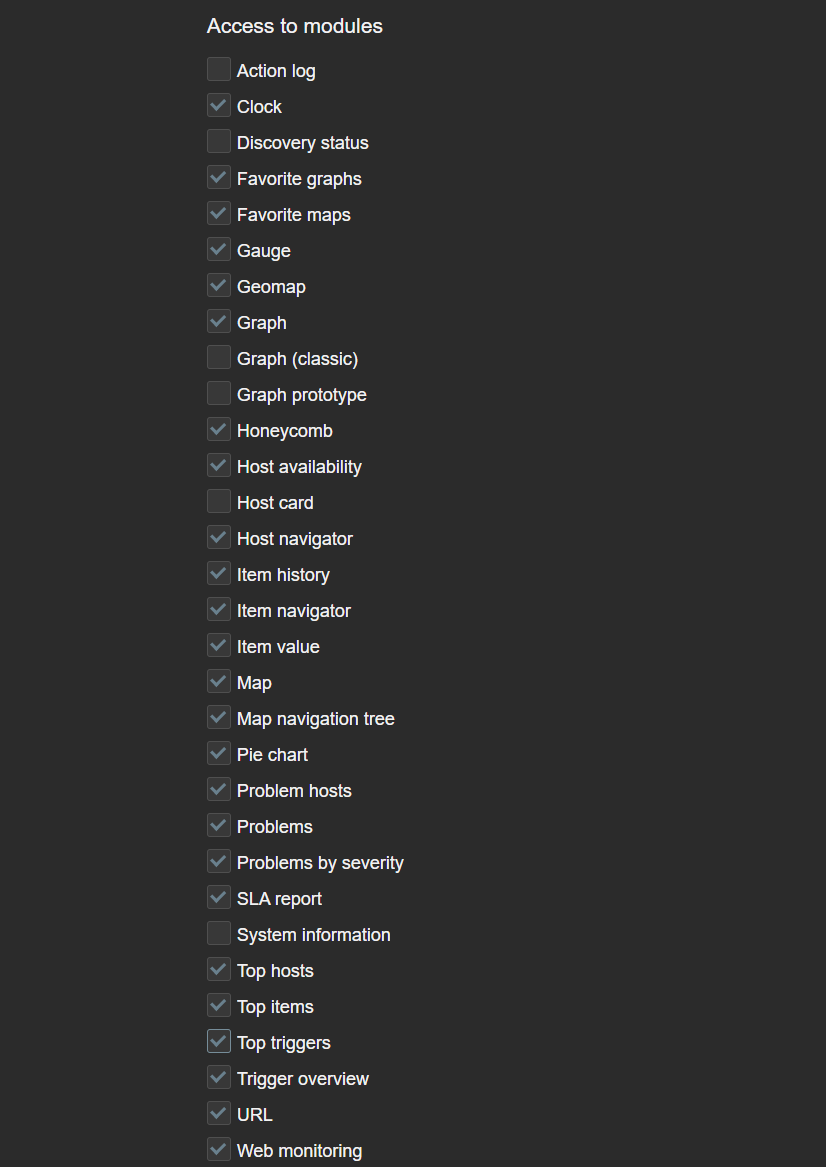
Restricting access to widgets
Access to each widget can also be restricted in Zabbix. This can be done globally by disabling widget modules under Administration—General—Modules or by disabling access to modules on an individual user role level. This can come in handy if the Zabbix environment in question enables users from various departments or organizations to create their own dashboards or edit existing ones. In addition, we may also have some custom community or in-house widgets which are utilized only by Zabbix administrators. which we may want to restrict access to.
If a Zabbix user opens a dashboard containing the restricted widget, the widget will be replaced with the message “No permissions to referenced object or it does not exist!” Ideally, it is recommended to avoid situations where users encounter such widgets, since such a message can be confusing to a user not familiar with various Zabbix permission and access error messages.
Access to modules can be restricted per each user role
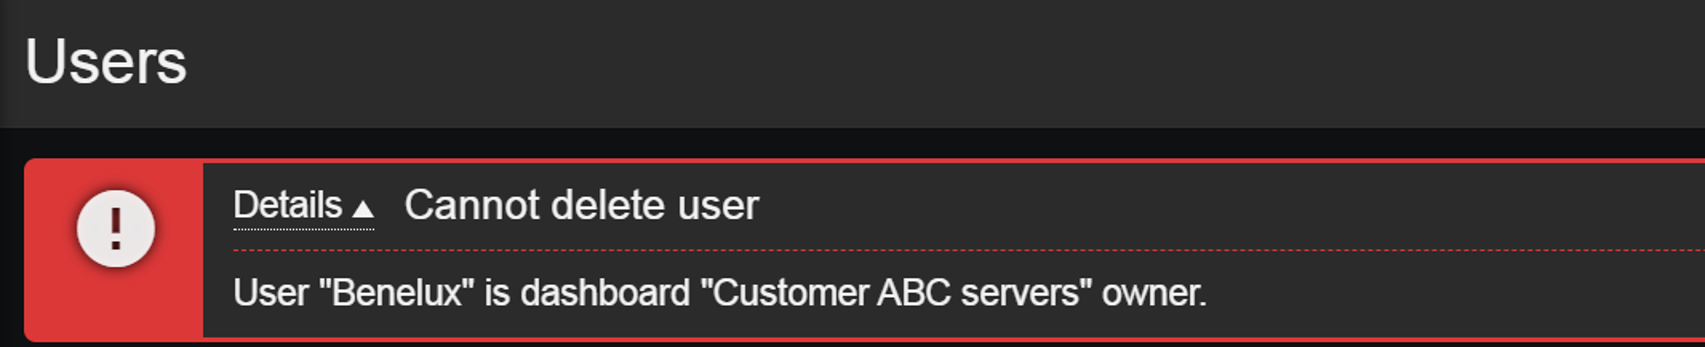
Dashboard ownership
Dashboard ownership can also play a role in our user onboarding and offboarding process. Dashboard owners can edit permissions on the dashboards they own, but this can add an extra step in our user offboarding process since dashboards cannot remain without an owner! Therefore, before deleting a Zabbix user, we need to ensure that either their dashboards have also been removed or have their owners be changed. If we attempt to delete a user who is also a dashboard owner, Zabbix will display an error message.
Users who are owners of an existing dashboard cannot be deleted
This article touches upon only a few of the latest and lesser-known features useful to MSPs and large organizations. There are many more advanced ways of utilizing Zabbix widgets, permissions, tags, low-level discovery rules, and many other features that come in handy to organizations of various sizes, utilizing Zabbix for a variety of use cases. Follow our blog, watch the latest Zabbix videos on our YouTube channel, and check out our on-premise and online events to learn more about the flexibility of Zabbix data collection, alerting, and visualization features.
The 6.15-rc7 kernel prepatch is out for
testing. “So while I wish we hadn’t had some of the excitement of last
week, on the whole it all still looks pretty solid, and unless something
strange happens I’ll do the final 6.15 release next weekend.“
The second major Computex keynote for the day comes from Qualcomm, who is quickly becoming a regular presenter at the show. This year’s keynote is being presented by company CEO Cristiano Amon, and the theme is “The heart of your PC.” Qualcomm is making it clear from the start that this year’s keynote is going […]
Kicking off today is the annual Computex tradeshow in Taiwan. Home to countless system and device manufacturers, Computex is a cornucopia of consumer electronics, and these days is also the biggest PC-centric show of the year. And even though it takes place in May, barely half-way through the year, the show routinely sets the stage […]
In March 2023, I embarked on a mission to explore the potential of Large Language Models (LLMs) within Grab. What started off as an attempt to solve a specific problem—reducing the burden on our ML Platform team’s support channels, ended up becoming something much bigger. The creation of GrabGPT, an internal ChatGPT-like tool that has transformed how folks in Grab interact with AI. This is the story of how a failed experiment led to one of Grab’s most impactful internal tools.
The problem: Overwhelmed support channels
As part of Grab’s machine learning platform team, we were drowning in user inquiries. Slack channels were flooded with questions and our on-call engineers were spending more time answering repetitive queries than building innovative solutions. This led me to ponder on this question, “could we use LLMs to build a chatbot that understands our platform’s documentation and answers these questions automatically?”
The first attempt: A chatbot for platform support
I started by exploring open-source frameworks to build a chatbot. I stumbled upon chatbot-ui, a simple yet powerful tool that could be wired up with LLMs. My idea was to feed the chatbot our platform’s Q\&A documentation (over 20,000 words) and let it handle user queries.
But there was a catch: GPT-3.5-turbo could only handle 8,000 tokens (~2,000 words). I spent days summarising the documentation, reducing it to less than 800 words. While the chatbot worked for a handful of frequently asked questions, it was clear that this approach wasn’t scalable. I tried with embedding search and it didn’t work that well too, so I decided to give up on this idea.
The pivot: Why not build Grab’s own ChatGPT?
As I stepped back, a new thought struck me: Grab doesn’t have its own ChatGPT-like tool yet. I had the frameworks, the LLM knowledge, and most importantly—access to Grab’s model-serving platform, catwalk. Why not build an internal tool that any Grabber could use?
Over a weekend, I extended the existing frameworks, added Google login for authentication, and deployed the tool internally. I called it Grab’s ChatGPT. Little did I know, this would become one of the most widely used tools in the company.
The tool quickly became a staple for Grabbers, especially in regions where ChatGPT was inaccessible (e.g., China). The name evolved too—our PM suggested GrabGPT, and it stuck.
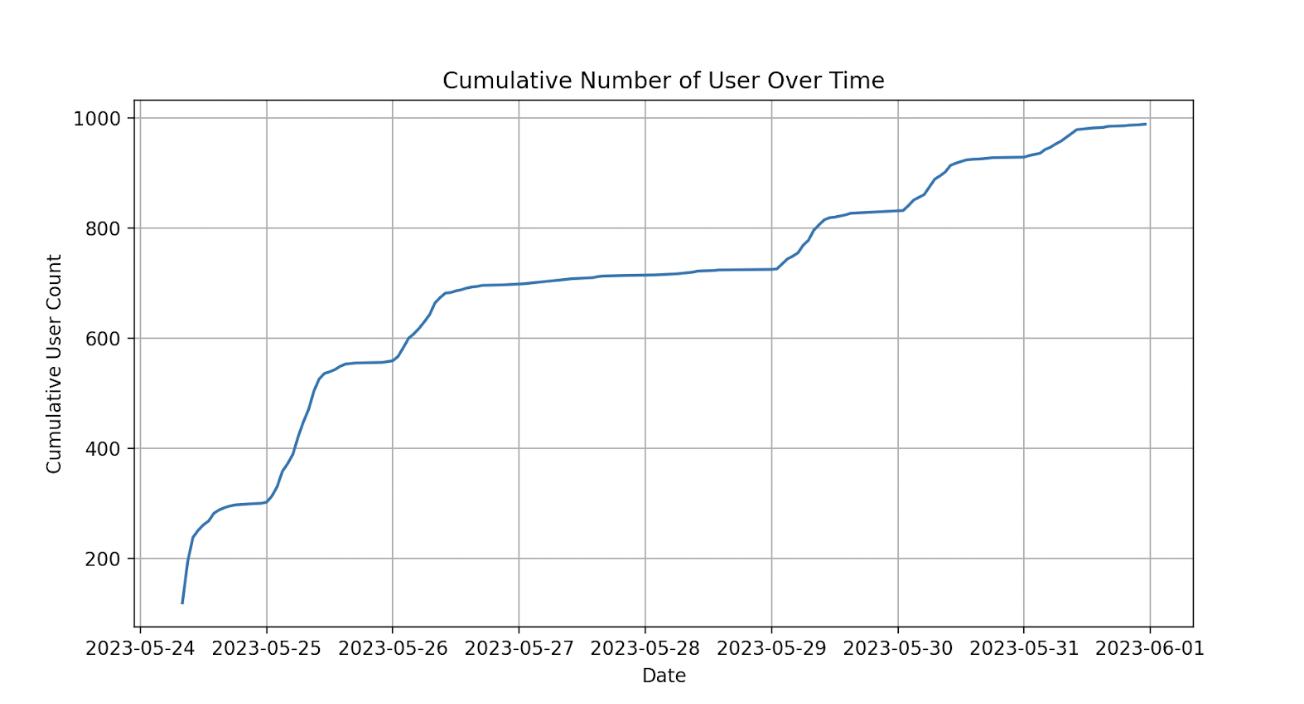
The Success: GrabGPT takes off
The response was overwhelming:
Day 1: 300 users registered.
Day 2: 600 new users.
Week 1: 900 new users
Month 3: Over 3000 users, with 600 daily active users
Today: Almost all Grabbers are using GrabGPT.
Figure 1: Number of GrabGPT users in one month
Why GrabGPT works: More than just technology
The success of GrabGPT isn’t just about the tech,it’s about timing, security, and accessibility. Here’s why it resonated so deeply within Grab:
Data security: GrabGPT operates on a private route, ensuring that sensitive company data never leaves our infrastructure.
Global accessibility: Unlike ChatGPT, which is banned in some regions, GrabGPT is accessible to all Grabbers, regardless of location.
Model agnosticism: GrabGPT isn’t tied to a single LLM provider. It supports models from OpenAI, Claude, Gemini, and more.
Auditability: Every interaction on GrabGPT is auditable, making it a favorite of our data security and governance teams.
The broader impact: A catalyst for LLM strategy
GrabGPT didn’t just solve an immediate problem, it sparked a broader conversation about how LLMs can be leveraged across Grab. It showed that a single engineer, provided with the right tools and timing, can create something transformative. Today, GrabGPT is more than a tool; it’s a testament to the power of experimentation and adaptability.
Lessons learned
Failure is a stepping stone: My initial failure with the support chatbot which then led me to a much bigger opportunity.
Timing matters: GrabGPT succeeded because it addressed a critical need at the right time.
Think big, start small: What began as a weekend project became a company-wide tool.
Collaboration is key: The enthusiasm and contributions from other Grabbers were instrumental in scaling GrabGPT.
Conclusion
GrabGPT is a story of resilience, innovation, and the unexpected rewards from thinking outside the box. It’s a reminder that sometimes, the best solution comes from pivoting away from what doesn’t work and embracing new possibilities. As LLMs continue to evolve, I’m excited to see how GrabGPT will grow and inspire even more innovation within Grab.
I would like to end this article by letting readers know that if you’re working on a project and feel stuck, don’t be afraid to pivot. You never know, your next failure might just be the beginning of your greatest success. And if you’re at Grab, give GrabGPT a try. It might just change the way you work!
Join us
Grab is a leading superapp in Southeast Asia, operating across the deliveries, mobility and digital financial services sectors. Serving over 800 cities in eight Southeast Asian countries, Grab enables millions of people everyday to order food or groceries, send packages, hail a ride or taxi, pay for online purchases or access services such as lending and insurance, all through a single app. Grab was founded in 2012 with the mission to drive Southeast Asia forward by creating economic empowerment for everyone. Grab strives to serve a triple bottom line – we aim to simultaneously deliver financial performance for our shareholders and have a positive social impact, which includes economic empowerment for millions of people in the region, while mitigating our environmental footprint.
Powered by technology and driven by heart, our mission is to drive Southeast Asia forward by creating economic empowerment for everyone. If this mission speaks to you, join our team today!
To provide the best experiences, we use technologies like cookies to store and/or access device information. Consenting to these technologies will allow us to process data such as browsing behavior or unique IDs on this site. Not consenting or withdrawing consent, may adversely affect certain features and functions.
Functional
Always active
The technical storage or access is strictly necessary for the legitimate purpose of enabling the use of a specific service explicitly requested by the subscriber or user, or for the sole purpose of carrying out the transmission of a communication over an electronic communications network.
Preferences
The technical storage or access is necessary for the legitimate purpose of storing preferences that are not requested by the subscriber or user.
Statistics
The technical storage or access that is used exclusively for statistical purposes.The technical storage or access that is used exclusively for anonymous statistical purposes. Without a subpoena, voluntary compliance on the part of your Internet Service Provider, or additional records from a third party, information stored or retrieved for this purpose alone cannot usually be used to identify you.
Marketing
The technical storage or access is required to create user profiles to send advertising, or to track the user on a website or across several websites for similar marketing purposes.