Post Syndicated from jzb original https://lwn.net/Articles/1003462/
Security updates have been issued by Fedora (sympa and tomcat), Red Hat (kernel), and SUSE (poppler).
Post Syndicated from jzb original https://lwn.net/Articles/1003462/
Security updates have been issued by Fedora (sympa and tomcat), Red Hat (kernel), and SUSE (poppler).
Post Syndicated from The History Guy: History Deserves to Be Remembered original https://www.youtube.com/watch?v=0mhhAW1RWig
Post Syndicated from E Lopez original https://www.servethehome.com/what-all-of-the-markings-on-sd-microsd-and-microsdxc-cards-mean/
A quick guide to what all of the markings on SD, microSD, and microSDXC cards mean including speeds, capacities, and more
The post What All of the Markings on SD microSD and microSDXC Cards Mean appeared first on ServeTheHome.
Post Syndicated from The History Guy: History Deserves to Be Remembered original https://www.youtube.com/watch?v=mhnbBtpSe4E
Post Syndicated from Explosm.net original https://explosm.net/comics/christmas-2024
New Cyanide and Happiness Comic
Post Syndicated from xkcd.com original https://xkcd.com/3029/

Post Syndicated from The History Guy: History Deserves to Be Remembered original https://www.youtube.com/watch?v=iKIU9tn4xEE
Post Syndicated from Crosstalk Solutions original https://www.youtube.com/watch?v=mtonw7wJ684
Post Syndicated from jzb original https://lwn.net/Articles/1002398/
The systemd v257 release brings a number of incremental
enhancements to various components and utilities for working with
Linux systems. This includes more support for varlink, automated
downloading of disk images at boot time, and a number of improvements
to the secure-boot process for unified kernel images (UKIs), which we
have covered in a separate
article.
Post Syndicated from corbet original https://lwn.net/Articles/1003381/
Security updates have been issued by AlmaLinux (containernetworking-plugins, edk2:20240524, gstreamer1-plugins-base, gstreamer1-plugins-good, kernel, libsndfile:1.0.31, mpg123:1.32.9, pam, php:8.1, php:8.2, python3.11, python3.11-urllib3, python3.12, python3.9:3.9.21, skopeo, and unbound:1.16.2), Debian (intel-microcode), Fedora (python3-docs and python3.12), Mageia (emacs), Red Hat (podman), and SUSE (gdb, govulncheck-vulndb, libparaview5_12, mozjs115, mozjs78, and vhostmd).
Post Syndicated from daroc original https://lwn.net/Articles/1001730/
The systemd project has been working for some time on
promoting
unified kernel
images (UKIs), a format that bundles a kernel, initial disk image, kernel command line, and
other associated data into a single file. The advantage of the format is the ability to
authenticate the entire collection with secure boot, which makes it easier for
end users to know that their operating system hasn’t been tampered with. The
downside is the lack of flexibility and increase in disk usage, since all of the
things packaged in a UKI must be updated together. But the
recent systemd 257 release (along with other changes to be covered in
a future article) includes some
major changes to the UKI format, and the rest of the boot process, that
partially mitigate those downsides. The release also includes improvements for
hardware-locked disk encryption, which may also help secure some computers.
Post Syndicated from Taylor Smith original https://blog.cloudflare.com/un-experimento-rapido-translating-cloudflare-stream-captions-with-workers-ai/
Cloudflare Stream launched AI-powered automated captions to transcribe English in on-demand videos in March 2024. Customers’ immediate next questions were about other languages — both transcribing audio from other languages, and translating captions to make subtitles for other languages. As the Stream Product Manager, I’ve thought a lot about how we might tackle these, but I wondered…
What if I just translated a generated VTT (caption file)? Can we do that? I hoped to use Workers AI to conduct a quick experiment to learn more about the problem space, challenges we may find, and what platform capabilities we can leverage.
There is a sample translator demo in Workers documentation that uses the “m2m100-1.2b” Many-to-Many multilingual translation model to translate short input strings. I decided to start there and try using it to translate some of the English captions in my Stream library into Spanish.
I started with my short demo video announcing the transcription feature. I wanted a Worker that could read the VTT captions file from Stream, isolate the text content, and run it through the model as-is.
The first step was parsing the input. A VTT file is a text file that contains a sequence of numbered “cues,” each with a number, a start and end time, and text content.
WEBVTT
X-TIMESTAMP-MAP=LOCAL:00:00:00.000,MPEGTS:900000

1
00:00:00.000 --> 00:00:02.580
Good morning, I'm Taylor Smith,

2
00:00:02.580 --> 00:00:03.520
the Product Manager for Cloudflare

3
00:00:03.520 --> 00:00:04.460
Stream. This is a quick

4
00:00:04.460 --> 00:00:06.040
demo of our AI-powered automatic

5
00:00:06.040 --> 00:00:07.580
subtitles feature. These subtitles

6
00:00:07.580 --> 00:00:09.420
were generated with Cloudflare WorkersAI

7
00:00:09.420 --> 00:00:10.860
and the Whisper Model,

8
00:00:10.860 --> 00:00:12.020
not handwritten, and it took

9
00:00:12.020 --> 00:00:13.940
just a few seconds.I started with a simple Worker that would fetch the VTT from Stream directly, run it through a function I wrote to deconstruct the cues, and return the timestamps and original text in an easier to review format.
export default {
  async fetch(request: Request, env: Env, ctx): Promise<Response> {
    // Step One: Get our input.
    const input = await fetch(PLACEHOLDER_VTT_URL)
      .then(res => res.text());

    // Step Two: Parse the VTT file and get the text
    const captions = vttToCues(input);

    // Done: Return what we have.
    return new Response(captions.map(c =>
      (`#${c.number}: ${c.start} --> ${c.end}: ${c.content.toString()}`)
    ).join('\n'));
  },
};
That returned this text:
#1: 0 --> 2.58: Good morning, I'm Taylor Smith,
#2: 2.58 --> 3.52: the Product Manager for Cloudflare
#3: 3.52 --> 4.46: Stream. This is a quick
#4: 4.46 --> 6.04: demo of our AI-powered automatic
#5: 6.04 --> 7.58: subtitles feature. These subtitles
#6: 7.58 --> 9.42: were generated with Cloudflare WorkersAI
#7: 9.42 --> 10.86: and the Whisper Model,
#8: 10.86 --> 12.02: not handwritten, and it took
#9: 12.02 --> 13.94: just a few seconds.As a proof of concept, I adapted a snippet from the demo into my Worker. In the example, the target language and input text are extracted from the user’s request. In my experiment, I decided to hardcode the languages. Also, I had an array of input objects, one for each cue, not just a string. After interpreting the caption input but before returning a response, I used a map callback to parallelize all the AI.run() calls to translate each cue, so they could execute asynchronously and in-place, then awaited them all to resolve. Ultimately, the AI inference call itself is the simplest part of the script.
await Promise.all(captions.map(async (q) => {
  const translation = await env.AI.run(
    "@cf/meta/m2m100-1.2b",
    {
      text: q.content,
      source_lang: "en",
      target_lang: "es",
    }
  );

  q.content = translation?.translated_text ?? q.content;
}));
Then the script returns the translated output in the format from before.
Of course, this is not a scalable or error-tolerant approach for production use because it doesn’t make affordances for rate limiting, failures, or processing bigger throughput. But for a few minutes of tinkering, it taught me a lot.
#1: 0 --> 2.58: Buen día, soy Taylor Smith.
#2: 2.58 --> 3.52: El gerente de producto de Cloudflare
#3: 3.52 --> 4.46: Rápido, esto es rápido
#4: 4.46 --> 6.04: La demostración de nuestro automático AI-powered
#5: 6.04 --> 7.58: Los subtítulos, estos subtítulos
#6: 7.58 --> 9.42: Generado con Cloudflare WorkersAI
#7: 9.42 --> 10.86: y el modelo de susurro,
#8: 10.86 --> 12.02: No se escribió, y se tomó
#9: 12.02 --> 13.94: Sólo unos segundos.
A few immediate observations: first, these results came back surprisingly quickly and the Workers AI code worked on the first try! Second, evaluating the quality of translation results is going to depend on having team members with expertise in those languages. Because — third, as a novice Spanish speaker, I can tell this output has some issues.
Cues 1 and 2 are okay, but 3 is not (“Fast, this is fast” from “[Cloudflare] Stream. This is a quick…”). Cues 5 through 9 had several idiomatic and grammatical issues, too. I theorized that this is because Stream splits the English captions into groups of 4 or 5 words to make them easy to read quickly in the overlay. But that also means sentences and grammatical constructs are interrupted. When those fragments go to the translation model, there isn’t enough context.
I speculated that reconstructing sentences would be the most effective way to improve translation quality, so I made that the one problem I attempted to solve within this exploration. I added a rough pre-processor in the Worker that tries to merge caption cues together and then splits them at sentence boundaries instead. In the process, it also adjusts the timing of the resulting cues to cover the same approximate timeframe.
Looking at each cue in order:
// Break this cue up by sentence-ending punctuation.
const sentences = thisCue.content.split(/(?<=[.?!]+)/g);

// Cut here? We have one fragment and it has a sentence terminator.
const cut = sentences.length === 1 && thisCue.content.match(/[.?!]/);
But if there’s a cue that splits into multiple sentences, cut it up and split the timing. Leave the final fragment to roll into the next cue:
else if (sentences.length > 1) {
  // Save the last fragment for later
  const nextContent = sentences.pop();

  // Put holdover content and all-but-last fragment into the content
  newContent += ' ' + sentences.join(' ');

  const thisLength = (thisCue.end - thisCue.start) / 2;

    result.push({
      number: newNumber,
      start: newStart,
      end: thisCue.start + (thisLength / 2), // End this cue early
      content: newContent,
    });

    // … then treat the next cue as a holdover
    cueLength = 1;
    newContent = nextContent;
    // Start the next consolidated cue halfway into this cue's original duration
    newStart = thisCue.start + (thisLength / 2) + 0.001;
    // Set the next consolidated cue's number to this cue's number
    newNumber = thisCue.number;
  }
}
Applying that to the input, it generates sentence-grouped output, visualized here in green:

There are only 3 “new” cues, each starts at the beginning of a sentence. The consolidated cues are longer and might be harder to read when overlaid on a video, but they are complete grammatical units:
#1: 0 --> 3.755:  Good morning, I'm Taylor Smith, the Product Manager for Cloudflare Stream.
#3: 3.756 --> 6.425:  This is a quick demo of our AI-powered automatic subtitles feature.
#5: 6.426 --> 12.5:  These subtitles were generated with Cloudflare Workers AI and the Whisper Model, not handwritten, and it took just a few seconds.
Translating this “prepared” input the same way as before:
#1: 0 --> 3.755: Buen día, soy Taylor Smith, el gerente de producto de Cloudflare Stream.
#3: 3.756 --> 6.425: Esta es una demostración rápida de nuestra función de subtítulos automáticos alimentados por IA.
#5: 6.426 --> 12.5: Estos subtítulos fueron generados con Cloudflare WorkersAI y el Modelo Whisper, no escritos a mano, y solo tomó unos segundos.
¡Mucho mejor! [Much better!]
To use these translated captions on a video, they need to be formatted back into a VTT with renumbered cues and properly formatted timestamps. Ultimately, the solution should automatically upload them back to Stream, too, but that is an established process, so I set it aside as out of scope. The final VTT result from my Worker is this:
WEBVTT

1
00:00:00.000 --> 00:00:03.754
Buen día, soy Taylor Smith, el gerente de producto de Cloudflare Stream.

2
00:00:03.755 --> 00:00:06.424
Esta es una demostración rápida de nuestra función de subtítulos automáticos alimentados por IA.

3
00:00:06.426 --> 00:00:12.500
Estos subtítulos fueron generados con Cloudflare WorkersAI y el Modelo Whisper, no escritos a mano, y solo tomó unos segundos.
I saved it to a file locally and, using the Cloudflare Dashboard, I added it to the video which you may have noticed embedded at the top of this post! Captions can also be uploaded via the API.
I tested this script on a variety of videos from many sources, including short social media clips, 30-minute video diaries, and even a few clips with some specialized vocabulary. Ultimately, I was surprised at the level of prototype I was able to build on my first afternoon with Workers AI. The translation results were very promising! In the process, I learned a few key things that I will be bringing back to product planning for Stream:
We have the tools. Workers AI has a model called “m2m100-1.2b” from Hugging Face that can do text translations between many languages. We can use it to translate the plain text cues from VTT files — whether we generate them or they are user-supplied. We’ll keep an eye out for new models as they are added, too.
Quality is prone to “copy-of-a-copy” effect. When auto-translating captions that were auto-transcribed, issues that impact the English transcription have a huge downstream impact on the translation. Editing the source transcription improves quality a lot.
Good grammar and punctuation counts. Translations are significantly improved if the source content is grammatically correct and punctuated properly. Punctuation is often missing when captions are auto-generated, but not always — I would like to learn more about how to predict that and if there are ways we can increase punctuation in the output of transcription jobs. My cue consolidator experiment returns giant walls of text if there’s no punctuation on the input.
Translate full sentences when possible. We split our transcriptions into cues of about 5 words for several reasons. However, this produces lower quality output when translated because it breaks grammatical constructs. Translation results are better with full sentences or at least complete fragments. This is doable, but easier said than done, particularly as we look toward support for additional input languages that use punctuation differently.
We will have blind spots when evaluating quality. Everyone on our team was able to adequately evaluate English transcriptions. Sanity-checking the quality of translations will require team members who are familiar with those languages. We state disclaimers about transcription quality and offer tips to improve it, but at least we know what we’re looking at. For translations, we may not know how far off we are in many cases. How many readers of this article objected to the first translation sample above?
Clear UI and API design will be important for these related but distinct workflows. There are two different flows being requested by Stream customers: “My audio is in English, please make translated subtitles” alongside “My audio is in another language, please transcribe captions as-is.” We will need to carefully consider how we shape user-facing interactions to make it really clear to a user what they are asking us to do.
Workers AI is really easy to use. Sheepishly, I will admit: although I read Stream’s code for the transcription feature, this was the first time I’ve ever used Workers AI on my own, and it was definitely the easiest part of this experiment!
Finally, as a product manager, it is important I remain focused on the outcome. From a certain point of view, this experiment is a bit of an XY Problem. The need is “I have audio in one language and I want subtitles in another.” Are there other avenues worth looking into besides “transcribe to captions, then restructure and translate those captions?” Quite possibly. But this experiment with Workers AI helped me identify some potential challenges to plan for and opportunities to get excited about!
I’ve cleaned up and shared the sample code I used in this experiment at https://github.com/tsmith512/vtt-translate/. Try it out and share your experience!
Post Syndicated from Bruce Schneier original https://www.schneier.com/blog/archives/2024/12/spyware-maker-nso-group-found-liable-for-hacking-whatsapp.html
A judge has found that NSO Group, maker of the Pegasus spyware, has violated the US Computer Fraud and Abuse Act by hacking WhatsApp in order to spy on people using it.
Jon Penney and I wrote a legal paper on the case.
Post Syndicated from Explosm.net original https://explosm.net/comics/replaced
New Cyanide and Happiness Comic
Post Syndicated from The Atlantic original https://www.youtube.com/watch?v=eBtvr97fzIM
Post Syndicated from João Tomé original https://blog.cloudflare.com/when-the-world-logs-off-christmas-new-years-and-the-internets-holiday-rhythm/
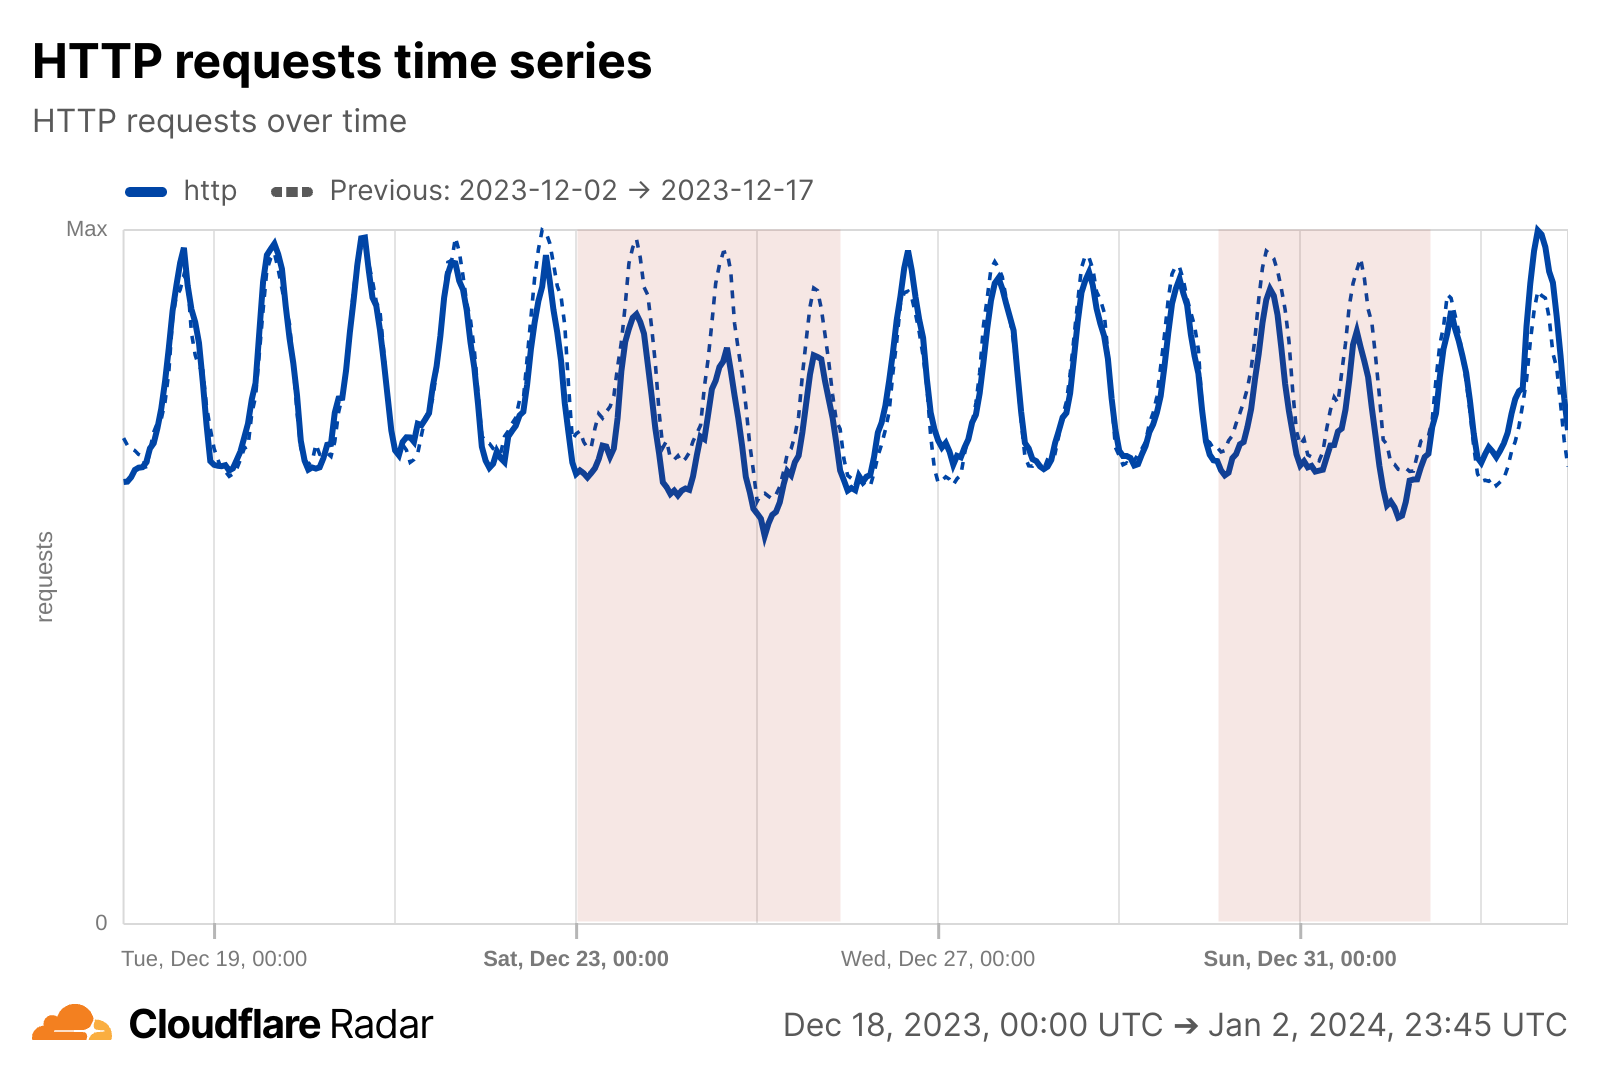
As January approaches and the year comes to a close, distinct changes in global Internet usage emerge. Year-end traditions — ranging from Christmas feasts to New Year’s Eve (NYE) countdowns — shape online behavior across continents and cultures. Looking back at Christmas and NYE 2023 offers insights into how these trends may repeat this year, and by January 2025, we’ll be able to directly compare patterns. Examining data from 50 countries and regions reveals how people celebrated in 2023-2024, providing a timely reminder of typical holiday trends.
With Cloudflare’s global reach, we observe planet-wide and local Internet habits during the holiday season. In the past, unintended trends during Christmas and New Year’s Eve have surfaced through our Outage Center, which uses automatic traffic anomaly alerts to detect Internet outages or unusual patterns. In the 2023 overview below, traffic dropped enough on those days to trigger dozens of anomaly alerts (orange and pink bubbles):

While Christmas dominates in many regions, other cultural and religious holidays — like Hanukkah or regional festivities — shape online rhythms in places where Western traditions are less central.
In countries and regions where Christmas is deeply rooted, Internet traffic slows during Christmas Eve dinners, midnight masses, morning gift exchanges, and Christmas Day lunches.
This blog post focuses exclusively on non-bot-related Internet traffic requests, filtering out automated activity to provide a clearer view of genuine human behavior during the holiday season. Before going into location-specific perspectives, here’s a global hourly view of Internet traffic during Christmas and New Year’s Eve 2023 from Cloudflare Radar Data Explorer, highlighting notable drops (in UTC, so it captures impacts across more days due to time zones spanning over 23 hours, from New Zealand to Hawaii in the US):
Let’s start with a ranking of countries and regions and their top low-traffic holiday dates, showing each day’s percentage drop. Many locations like the US see clear dips on December 24 and 25 as people celebrate Christmas Eve and Christmas Day offline, and some show smaller declines (compared to Christmas) around December 31 as the New Year approaches. Still, the exact order and magnitude differ, reflecting cultural nuances — some nations experience greater drops on Christmas Eve, others on Christmas Day, and others signal unique patterns tied to New Year’s Eve or January 1 celebrations.
In the next table, locations are listed first (in the left column) by those with the lowest traffic on December 24 (and the highest percentage of traffic drop), followed by December 25, and finally December 31 (in the right column).
Top days with the lowest Internet traffic in December 2023 – January 2024
(with respective percentage drops, if any, from the previous week)
|
Denmark #1 December 24 (-35%) #2 December 25 (-11%) #3 December 31 |
South Africa #1 December 25 (-27%) #2 December 24 (-15%) #3 December 31 (-5%) |
|
Norway #1 December 24 (-32%) #2 December 25 (-12%) #3 December 31 |
United Kingdom #1 December 25 (-26%) #2 December 24 (-19%) #3 December 31 |
|
Portugal #1 December 24 (-32%) #2 December 25 (-24%) #3 December 31 |
Italy #1 December 25 (-25%) #2 December 24 (-25%) #3 December 31 |
|
Poland #1 December 24 (-31%) #2 December 25 (-21%) #3 December 31 |
Australia #1 December 25 (-25%) #2 December 24 (-15%) #3 December 31 (-1%) |
|
Spain #1 December 24 (-28%) #2 December 25 (-25%) #3 December 31 |
Ireland #1 December 25 (-24%) #2 December 24 (-22%) #3 December 23 |
|
Sweden #1 December 24 (-26%) #2 December 25 (-6%) #3 December 31 |
New Zealand #1 December 25 (-22%) #2 December 24 (-8%) #3 December 31 (-4%) |
|
Chile #1 December 24 (-23%) #2 December 25 (-24%) #3 December 31 (-3%) |
Canada #1 December 25 (-19%) #2 December 24 (-15%) #3 December 31 |
|
Finland #1 December 24 (-23%) #2 December 25 (-16%) #3 December 31 |
Nigeria #1 December 25 (-18%) #2 December 24 (-19%) #3 January 1 |
|
France #1 December 24 (-22%) #2 December 25 (-19%) #3 December 23 |
Philippines #1 December 25 (-16%) #2 December 24 (-7%) #3 December 31 |
|
Germany #1 December 24 (-21%) #2 December 25 (-9%) #3 December 31 |
Hong Kong #1 December 25 (-9%) #2 December 24 (-6%) #3 December 23 |
|
Mexico #1 December 24 (-21%) #2 December 25 (-19%) #3 December 31 |
Belgium #1 December 31 (-1%) #2 December 24 (-20%) #3 December 25 (-17%) |
|
Belgium #1 December 24 (-20%) #2 December 25 (-17%) #3 December 31 (-1%) |
Indonesia #1 December 31 (-1%) #2 December 25 (-7%) #3 December 24 |
|
Romania #1 December 24 (-20%) #2 December 25 (-14%) #3 December 31 (-3%) |
Netherlands #1 December 31 (-10%) #2 December 24 (-10%) #3 December 25 (-20%) |
|
United States #1 December 24 (-16%) #2 December 25 (-21%) #3 December 31 |
Ukraine #1 December 31 (-10%) #2 December 24 (-5%) #3 December 30 |
|
Brazil #1 December 24 (-14%) #2 December 25 (-26%) #3 December 31 |
Thailand #1 December 31 (-6%) #2 January 1 (-2%) #3 December 25 (-2%) |
|
Colombia #1 December 24 (-14%) #2 December 25 (-26%) #3 December 31 (-4%) |
The data shows that in many European countries — such as Denmark, Norway, the United Kingdom, Portugal, Italy, Poland, Spain, Ireland, Sweden, Finland, France, Germany, Belgium, the Netherlands, and Romania — Christmas Eve (December24) and Christmas Day (December25) consistently register the biggest drops in Internet traffic. These dips suggest that in much of Europe, Christmas traditions take people firmly offline, whether it’s for family gatherings, festive meals, or religious observances. Outside Europe, similar patterns appear in predominantly Christian-influenced regions, including Australia, New Zealand, Canada, the United States, and several Latin American countries (like Brazil, Chile, and Colombia), confirming that the holiday’s cultural importance is mirrored in their online habits.
In contrast, locations less influenced by Western Christmas traditions, such as those in Asia, show subtler or different patterns. For example, Hong Kong and the Philippines do show declines in traffic, reflecting a hybrid of local and global influences, while places like Thailand and Indonesia present smaller dips on Christmas compared to other days or emphasize different holidays altogether. These variations highlight that while Christmas exerts a strong pull offline in many parts of the world, its impact on Internet usage is shaped by local cultural contexts.
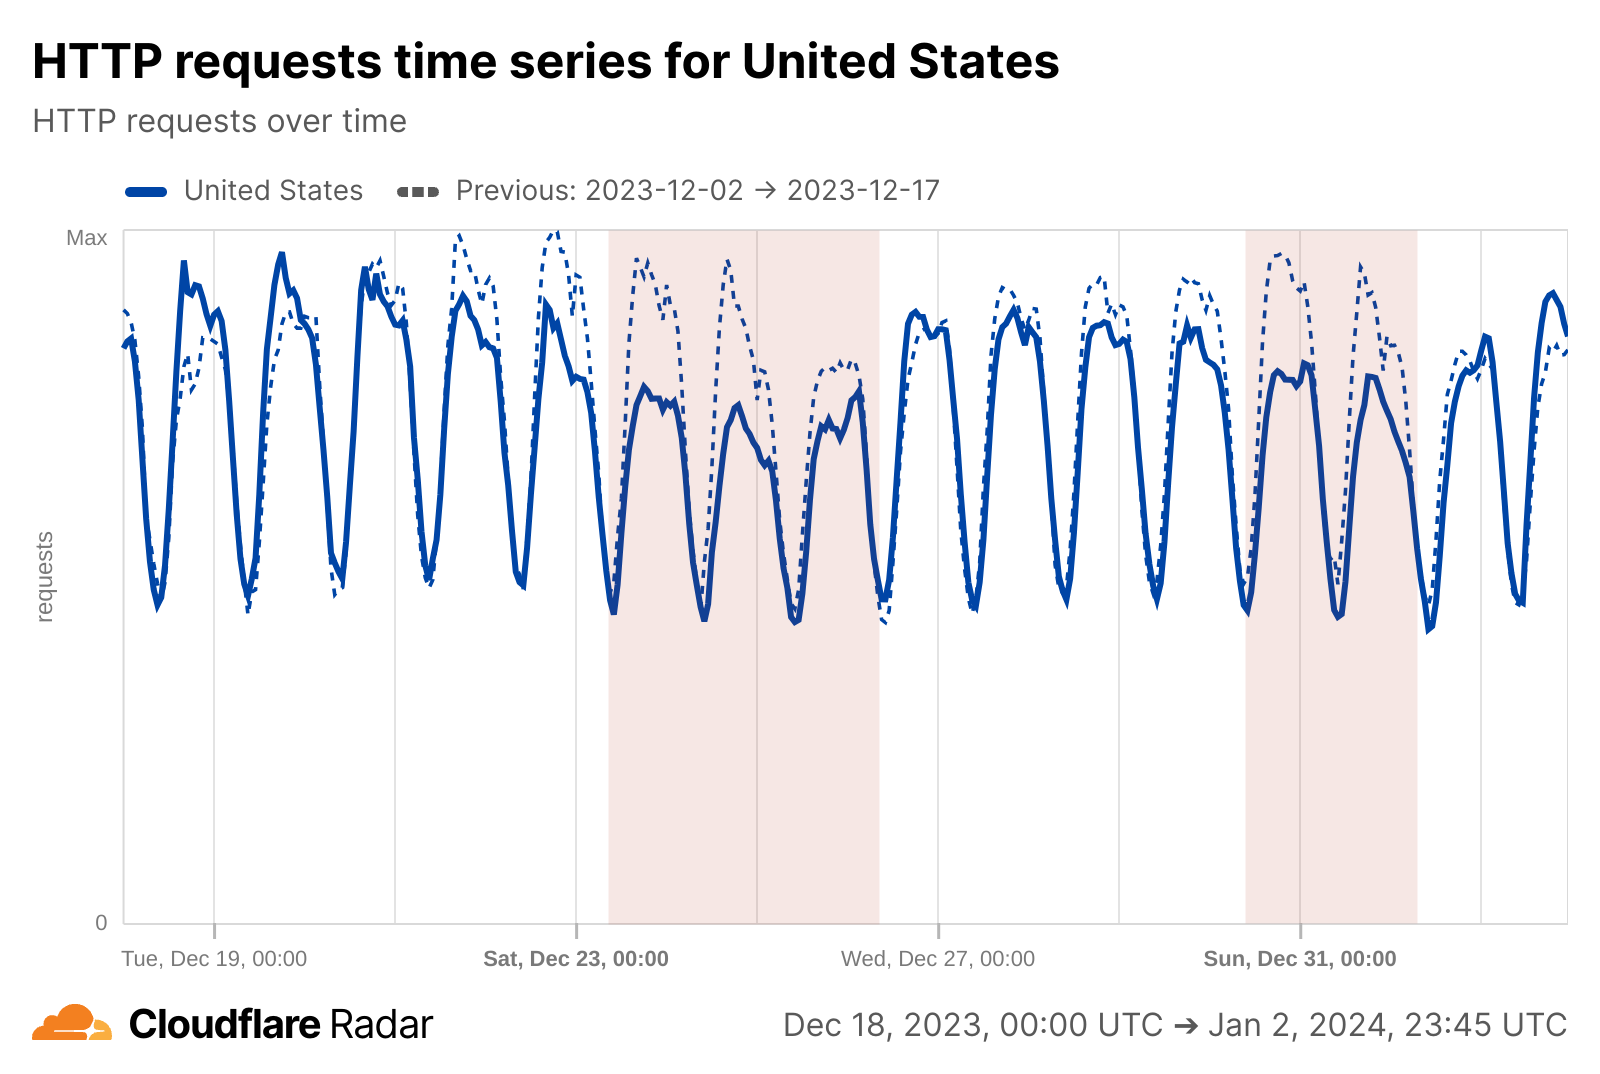
As an example, here’s the US perspective from Cloudflare Radar Data Explorer, where the drop in traffic during Christmas and New Year 2023 is evident:
Not every country’s December revolves around Christmas. In Israel, for example, Hanukkah’s timing changes year to year, influencing when people log off. In 2023, Hanukkah started on December 7, leading to an 8% traffic drop that day and 7% on the following days through December 10. Interestingly, in some years like 2024, Hanukkah begins closer to December 25, potentially overlapping with Western Christmas.
Countries where Christmas didn’t have a clear impact
|
Turkey #1 December 31 (-18%) #2 December 29 #3 December 30 |
Israel #1 December 29 #2 January 5 #3 December 30 |
|
Japan #1 December 31 (-8%) #2 January 1 #3 December 30 — December 24 with -3% |
Vietnam #1 January 1 (-7%) #2 December 31 (-3%) #3 January 2 |
|
Russia #1 December31 (-23%) #2 January 1 (-15%) #3 December 30 |
Singapore #1 December 16 #2 December 17 #3 December 18 |
|
India #1 December 17 #2 December 16 #3 December 24 |
Bangladesh #1 December 15 #2 December 16 #3 December 18 |
|
Saudi Arabia #1 January 5 #2 January 6 #3 January 8 |
China #1 December 19 #2 December 15 #3 December 18 |
Now, let’s focus on a more granular perspective of these trends, showing the impact of Christmas dinners and lunches, and also New Year’s Eve drops in traffic.
Note: Unless otherwise noted, all times used in this blog post are local ones; in countries with several timezones, we’re using the timezone where more people live (for the US, Eastern time is used).

In Europe, Christmas traditions dominate, leading to the most significant Internet traffic drops. Christmas Eve dinner is a near-universal offline moment, with countries like Spain (-70% at 21:45), Portugal (-70% at 20:30), and Denmark (-68% at 19:45) experiencing the steepest declines. On Christmas Day, mornings are quieter as people relax or attend religious services, while festive lunches drive further drops, with traffic down 43% at 13:45 in Portugal and 44% at 07:15 in France.
By Boxing Day (December 26), digital activity rebounds as people return online for sales or socializing. For instance, the UK shows a 16% increase at 13:00, while Canada records a 19% rise at 08:15. In Australia, traffic climbs by 20% at 09:30, illustrating regional differences in how the day is celebrated.
In the Americas, holiday patterns reflect a mix of cultural traditions. In the United States, Christmas Eve traffic drops by 29% at 20:15, aligning with evening family gatherings, and Christmas Day sees a 32% decline at 09:15, reflecting quieter mornings.
In Latin America, Christmas Eve (Nochebuena) takes center stage, with significant traffic declines aligning with late-night traditions like the Midnight Toast (in Argentina, the late-night feast is quite popular) and Misa de Gallo (Midnight Mass). For example:
Colombia: -48% at 21:45
Argentina: -58% at 22:00; -67% at midnight
Chile: -64% at 22:45
Mexico: -50% at 21:45
Brazil: -22% at 21:45
These late-night traffic dips highlight the region’s emphasis on midnight celebrations, family feasts, and religious observances.
Asian locations influenced by Western traditions, such as the Philippines and Hong Kong, experience moderate Christmas dips but shift focus to New Year’s celebrations — more on NYE below.
In the Southern Hemisphere, Australia and New Zealand experience their steepest traffic drops during Christmas lunch, with Australia seeing a 43% decrease at 13:45 and New Zealand recording a 42% decline.
In regions less influenced by Christmas, holiday traffic patterns vary significantly. For example, Nigeria sees a 26% drop at lunchtime on Christmas Day, while South Africa records a 37% decline at 14:15, reflecting offline family gatherings.
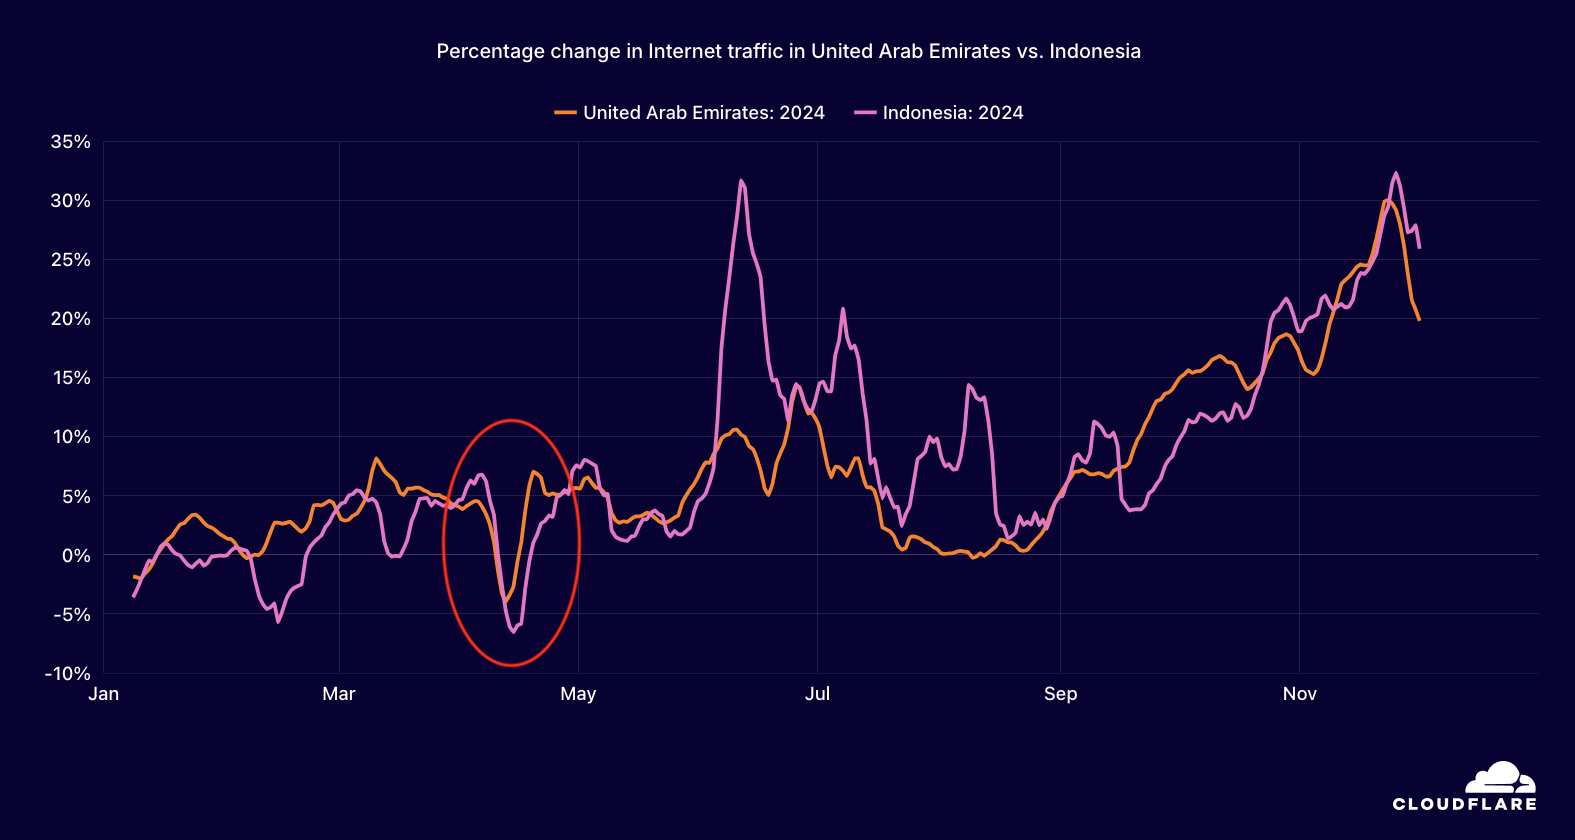
In predominantly non-Christian countries like Egypt and Saudi Arabia, December 24-25 does not show significant dips; instead, other cultural holidays drive offline moments. For example, as we’ve noted, Israel experienced up to an 8% drop in 2023 during Hanukkah, particularly in the first four days after December 7. In previous blog posts, we have shown how events like Ramadan clearly impact Internet traffic in countries with large Muslim populations. One example from our Year in Review 2024 highlights Indonesia and the United Arab Emirates, where traffic dropped during Eid al-Fitr, the festival marking the end of Ramadan (April 9-10, 2024).
Boxing Day on December 26 marks a significant digital rebound in countries like the UK, Canada, Australia (where there is a higher increase from the previous week, with daily traffic growing 9%), and New Zealand, as people return online after the Christmas break. Traditionally associated with charitable activities, family gatherings, and shopping, the day sees traffic spikes across these regions:
|
Location |
December 26 increase in daily traffic |
Higher traffic increase on December 26 |
|
Australia |
+9% |
December 26; 09:30: +20% |
|
United Kingdom |
+2% |
December 26; 13:00: +16% |
|
Canada |
+1% |
December 26, 08:15: +19% |
Here is the list of locations that saw a clear drop in traffic on Christmas Eve or Christmas Day morning or lunch. We selected the time (morning or lunch) with the bigger drop compared to the previous week for further analysis. The list is ordered by the Christmas Eve dinner drop. Countries like Russia (where Orthodox Christians celebrate Christmas later, on January 7), Japan, China, Indonesia, Turkey, Israel, Thailand, Egypt, Singapore, Vietnam, and Bangladesh showed no impact during Christmas Eve dinner or Christmas Day morning or lunch.
|
Location |
Christmas Eve Dinner Drop |
Christmas Day Morning/Lunch Drop |
|
Spain |
-70% at 21:45 |
-51% at 08:00 (morning) |
|
Portugal |
-70% at 20:30 |
-43% at 13:45 (lunch) |
|
Denmark |
-68% at 19:45 |
-43% at 06:15 (morning) |
|
Chile |
-64% at 22:45; (-65% at 00:00, December 25) |
-49% at 09:00 (morning) |
|
Norway |
-63% at 18:45 |
-50% at 06:45 (morning) |
|
Czech Republic |
-60% at 18:15 |
-43% at 06:30 (morning) |
|
Poland |
-59% at 17:15 |
-51% at 07:15 (morning) |
|
Argentina |
-58% at 22:00 (-67% at 00:00, December 25) |
-52% at 09:00 (morning) |
|
Italy |
-55% at 21:15 |
-44% at 07:00 (morning) |
|
France |
-55% at 20:45 |
-44% at 07:15 (morning) |
|
Mexico |
-50% at 21:45 |
-38% at 08:15 (morning) |
|
Belgium |
-50% at 20:15 |
-46% at 07:15 (morning) |
|
Switzerland |
-50% at 19:45 |
-46% at 06:30 (morning) |
|
Austria |
-50% at 19:15 |
-42% at 06:15 (morning) |
|
Nigeria |
-49% at 18:00 |
-26% at 12:30 (lunch) |
|
Colombia |
-48% at 21:45 |
-49% at 08:00 (morning) |
|
Germany |
-47% at 19:15 |
-36% at 07:15 (morning) |
|
Sweden |
-47% at 16:30 |
-36% at 07:00 (morning) |
|
Finland |
-42% at 17:45 |
-42% at 08:00 (morning) |
|
Ireland |
-40% at 18:15 |
-36% at 15:15 (lunch) |
|
South Africa |
-37% at 19:00 |
-37% at 14:15 (lunch) |
|
Romania |
-34% at 20:45 |
-34% at 06:30 (morning) |
|
United Kingdom |
-34% at 18:00 |
-38% at 14:45 (lunch) |
|
Canada |
-32% at 20:30 |
-31% at 09:30 (morning) |
|
Netherlands |
-30% at 20:45 |
-35% at 06:45 (morning) |
|
United States |
-29% at 20:15 |
-32% at 09:15 (morning) |
|
Australia |
-23% at 20:45 |
-43% at 13:45 (lunch) |
|
New Zealand |
-23% at 18:30 |
-42% at 13:15 (lunch) |
|
Brazil |
-22% at 21:45 |
-42% at 08:00 (morning) |
|
Philippines |
-22% at 21:30 |
-29% at 06:45 (morning) |

Midnight, December 31 is a shared offline moment worldwide, as people step away from their screens to celebrate. To provide a more accurate assessment of New Year’s Eve’s impact, we compare traffic at 00:00 on January 1 with 00:00 on December 18, avoiding distortions caused by Christmas-related patterns. This approach highlights the distinct drop in Internet activity due to New Year’s celebrations.
Across Europe, countries like Portugal (-60%) and Romania (-60%) see dramatic traffic drops, reflecting widespread offline gatherings. Spain (-56%) and Germany (-49%) also experience steep declines, emphasizing the importance of this tradition across the region. Even Northern Europe mirrors this trend, with Denmark (-41%), Norway (-39%), and Sweden (-29%) showing significant dips.
In the Americas, this offline moment is particularly pronounced in Latin America, where family and communal gatherings dominate. Argentina (-66%) and Chile (-74%) lead the region, with Brazil (-46%) and Colombia (-44%) following closely. In North America, the impact is less dramatic due to time zone variations — in this case, with millions of people spread out in distinct time zones. Canada records a 14% drop, and the United States shows a modest 12% decline compared to December 18.
In Asia and the Pacific, New Year’s Eve celebrations heavily influence Internet trends. Thailand saw a 31% drop, Indonesia 23%, and Japan 16%, also reflecting this region’s focus on communal gatherings and celebrations. Australia (-21%) and New Zealand (-11%), among the first countries to welcome the New Year, also show noticeable declines as midnight festivities take center stage.
In the Middle East and Africa, Turkey (-23%), South Africa (-32%), and Nigeria (-15%) exhibit significant offline engagement at midnight. Israel records a smaller but notable 6% dip before midnight, reflecting localized variations in celebration styles.
Of course, this offline intermission doesn’t last long. After a few hours, people return to their devices. France sees a 37% surge at 3:15 on January 1, while Turkey experiences a 36% upswing in the early hours.
Next, we present the list of locations with clear drops in traffic at midnight on New Year’s Eve, compared to December 18, ordered by percentage of drop.
|
Locations |
January 1, 00:00 drop compared to December 18 |
Locations |
January 1, 00:00 drop compared to December 18 |
|
Chile |
-74% |
Thailand |
-31% |
|
Argentina |
-66% |
Italy |
-30% |
|
Romania |
-60% |
Sweden |
-29% |
|
Portugal |
-60% |
Vietnam |
-27% |
|
Spain |
-56% |
United Kingdom |
-25% |
|
Germany |
-49% |
Ukraine |
-25% |
|
Brazil |
-46% |
Indonesia |
-23% |
|
Mexico |
-44% |
Turkey |
-23% |
|
Colombia |
-44% |
Australia |
-21% |
|
Philippines |
-43% |
Hong Kong |
-21% |
|
Netherlands |
-42% |
Ireland |
-19% |
|
Poland |
-41% |
France |
-17% |
|
Denmark |
-41% |
Japan |
-16% |
|
Austria |
-40% |
South Korea |
-16% |
|
Switzerland |
-39% |
Nigeria |
-15% |
|
Norway |
-39% |
Canada |
-14% |
|
Czech Republic |
-33% |
Finland |
-14% |
|
Russia |
-32% |
Singapore |
-13% |
|
Belgium |
-32% |
United States |
-12% |
|
South Africa |
-32% |
China |
-12% |
What emerges from these patterns is a rich tapestry of cultural habits. While Christmas Eve and Day are central offline moments in Europe and the Americas, other regions mark their quiet days on different dates, shaped by unique holidays and customs. The insights from 50 countries and regions confirm how cultural traditions guide when people step away from screens.
As the Gregorian calendar year comes to a close, the universal appeal of stepping offline becomes clear. Whether raising glasses at the stroke of midnight, exchanging greetings, or lighting candles for festivals like Hanukkah, these moments remind us that while the Internet connects billions, cultural rhythms still shape our relationship with technology. Whether feasting with loved ones or counting down to a new year, humans everywhere find reasons to unplug — if only for a moment.
If you’re interested in more trends and insights about the Internet, check out Cloudflare Radar. Follow us on social media at @CloudflareRadar (X), https://noc.social/@cloudflareradar (Mastodon), and radar.cloudflare.com (Bluesky), or contact us via email.
Post Syndicated from Боян Юруков original https://yurukov.net/blog/2024/opendata-logging/
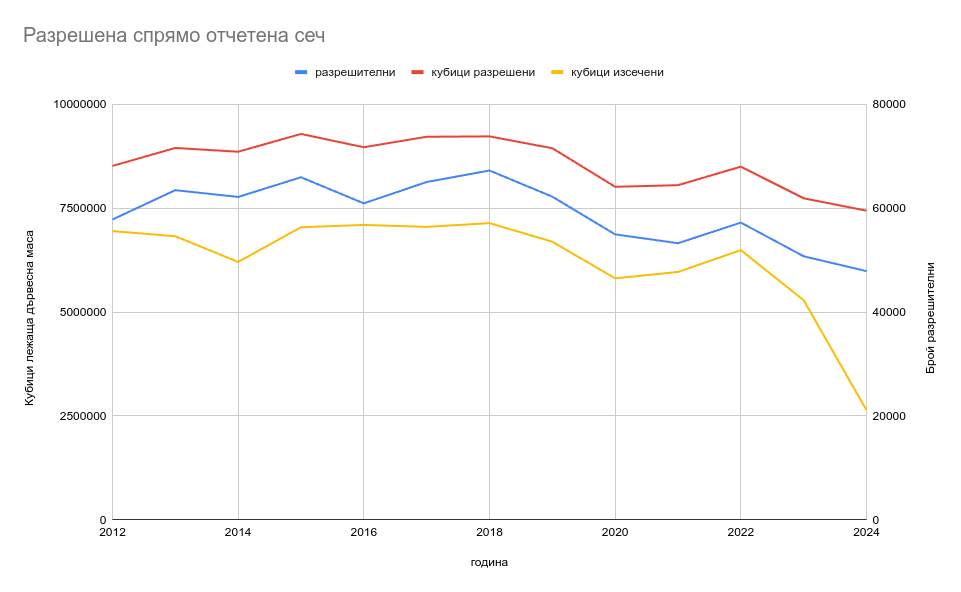
Преди почти 10 години си зададох въпрос – къде в България се сече законно и в какви количества. Агенцията по горите нямаше отворени данни за това. Имат обаче регистър на позволителните за сеч, който макар не в достъпен формат, поне е достатъчно структуриран, за да се изведе нещо. На база тези числа тогава успях да покажа данните за сеч с точност до землище на населено място, а след това направих анализ и предложения.
Десет години по-късно малко се е променило. Някои от регионалните дирекции по горите и самата агенция са в портала за отворени данни на правителството. Има дори ресурс с позволителните за сеч, макар покриващ само част от данните и само за четири години. Регистърът си е същия, със същите грешки и 1.57 млн. документа – позволителни за сеч и протоколи след това.
Причината да знам това число е, че в последните седмици свалих цялата информация от средата на 2011-та, когато е започнал регистъра, до декември 2024-та. Там информацията е във вид на обикновена HTML страница подходяща за печат и подпис на хартия, но открих структура в нея. Така обърнах всеки документ в json формат с точната категория и вид дървета, позволена и реална сеч. Включва също констатации за нарушения, актове, кой е глобен и прочие. Разбира се, тук говорим само за законната сеч и документите свързани с нея. Ако не е в този списък, значи не е законно.
Тъй като изглежда самият им формуляр за генериране на тези документи не се използва съвсем коректно, някои от номерата и датите на заповедите не са попълнени. Също кадастриалните идентификатори посочващи точните парцели не са в правилен формат. Това ще се опитам да го оправят в друг момент. Има и други грешки, които съм се опитал да компенсирам в изходните данни.
Освен документите, съм публикувал и списък с обобщена информация за всяка сеч от търсачката им. Там може да се видят дати и количества на сеч и позволява да се свържат позволителните и протоколите, където това не е отбелязано в самия протокол.
Публикувам всички данни в отворен формат свободно, без лиценз и ограничения за използване. Ще се радвам, все пак, ако направите нещо с тях, да ми пишете, защото ми е интересно как са влезли в употреба. Ще създам интерактивен инструмент за филтриране и изследването им в скоро време, но искам първо да пусна данните, ако някой има идея за такъв или друга употреба.
Може да свалите данните от тази папка. Там ще намерите описание на полетата, файл с номерата на землищата и техните имена и ЕКАТТЕ номера, обобщенията списък, който споменах (95М, 18М zip) и архив с документите (6.2G, 1.1G zip)
The post Отворени данни на разрешителните за сеч 2011-2024 first appeared on Блогът на Юруков.
Post Syndicated from Matt Granger original https://www.youtube.com/watch?v=dl5aQ-KDuGg
Post Syndicated from Patrick Kennedy original https://www.servethehome.com/we-lost-a-great-one-gordon-mah-ung/
The industry lost a great one today with the passing of Gordon Mah Ung editor at PCWorld and longtime PC industry journalist
The post We Lost a Great One Gordon Mah Ung appeared first on ServeTheHome.
Post Syndicated from The History Guy: History Deserves to Be Remembered original https://www.youtube.com/watch?v=UXlNhRZlH00