Here at Cloudflare, we frequently use and write about data in the present. But sometimes understanding the present begins with digging into the past.
We recently learned of a 2024 turkmen.news article (available in Russian) that reports Turkmenistan experienced “an unprecedented easing in blocking,” causing over 3 billion previously-blocked IP addresses to become reachable. The same article reports that one of the reasons for unblocking IP addresses was that Turkmenistan may have been testing a new firewall. (The Turkmen government’s tight control over the country’s Internet access is well-documented.)
Indeed, Cloudflare Radar shows a surge of requests coming from Turkmenistan around the same time, as we’ll show below. But we had an additional question: Does the firewall activity show up on Radar, as well? Two years ago, we launched the dashboard on Radar to give a window into the TCP connections to Cloudflare that close due to resets and timeouts. These stand out because they are considered ungraceful mechanisms to close TCP connections, according to the TCP specification.
In this blog post, we go back in time to share what Cloudflare saw in connection resets and timeouts. We must remind our readers that, as passive observers, there are limitations on what we can glean from the data. For example, our data can’t reveal attribution. Even so, the ability to observe our environment can be insightful. In a recent example, our visibility into resets and timeouts helped corroborate reports of large-scale blocking and traffic tampering by Russia.
Turkmenistan requests where there were none before
Let’s look first at the number of requests, since those should increase if IP addresses are unblocked. In mid-June 2024 Cloudflare started receiving a noticeable increase in HTTP requests, consistent with reports of Turkmenistan unblocking IPs.
The Transmission Control Protocol (TCP) is a lower-layer mechanism used to create a connection between clients and servers, and also carries 70% of HTTP traffic to Cloudflare. A TCP connection works much like a telephone call between humans, who follow graceful conventions to end a call—and who are acutely aware when conventions are broken if a call ends abruptly.
TCP also defines conventions to end the connection gracefully, and we developed mechanisms to detect when they don’t. An ungraceful end is triggered by a reset instruction or a timeout. Some are due to benign artifacts of software design or human user behaviours. However, sometimes they are exploited by third parties to close connections in everything from school and enterprise firewalls or software, to zero-rating on mobile plans, to nation-state filtering.
When we look at connections from Turkmenistan, we see that on June 13, 2024, the combined proportion of the four coloured regions increases; each coloured region represents ungraceful ends at a distinct stage of the connection lifetime. In addition to the combined increase, the relative proportions between stages (or colours) changes as well.
Further changes appeared in the weeks that followed. Among them are an increase in Post-PSH (orange) anomalies starting around July 4; a reduction in Post-ACK (light blue) anomalies around July 13; and an increase in anomalies later in connections (green) starting July 22.
The shifts above could be explained by a large firewall system. It’s important to keep in mind that data in each of the connection stages (captured by the four coloured regions in the graphs) can be explained by browser implementations or user actions. However, the scale of the data would need a great number of browsers or users doing the same thing to show up. Similarly, individual changes in behaviour would be lost unless they occur in large numbers at the same time.
Digging down to individual networks
We’ve learned that it can be helpful to look at the data for individual networks to reveal common patterns between different networks in different regions operated by single entities.
Looking at individual networks within Turkmenistan, trends and timelines appear more pronounced. July 22 in particular sees greater proportions of anomalies associated with the Server Name Indication, or domain name, rather than the IP address (dark blue), although the connection stage where the anomalies appear varies by individual network.
A different picture emerges from AS51495 (Ashgabat City Telephone Network). Post-ACK anomalies almost completely disappear on July 12, corresponding with an increase in anomalies during the Post-PSH stage. An increase of anomalies in the Later (green) connection stage on July 22 is apparent for this AS as well.
Finally, for AS59974 (Altyn Asyr), you can see below that there is a clear spike in Post-ACK anomalies starting July 22. This is the stage of the connection where a firewall could have seen the SNI, and chooses to drop the packets immediately, so they never reach Cloudflare’s servers.
We’ve previously discussed how to use the resets and timeouts data because, while useful, it can also be misinterpreted. Radar’s data on resets and timeouts is unique among operators, but in isolation it’s incomplete and subject to human bias.
Take the figure above for AS59974 where Post-ACK (light blue) anomalies markedly increased on July 22. The Radar view is proportional, meaning that the increase in proportion could be explained by greater numbers of anomalies – but could also be explained, for example, by a smaller number of valid requests. Indeed, looking at the HTTP request levels for the same AS, there was a similarly pronounced drop starting on the same day, as shown below.
If we look at the same two graphs before July 22, however, rates of reset and timeout anomalies do not appear to mirror the very large shifts up and down in HTTP requests.
Looking ahead can also mean looking behind
These charts from Radar above offer a way to analyze news events from a different angle, by looking at requests and TCP connection resets and timeouts. Does this data tell us definitively that new firewalls were being tested in Turkmenistan? No. But the trends in the data are consistent with what we could expect to see if that were the case.
If thinking about ways to use the resets and timeouts data going forward, we’d encourage also looking at the data in retrospect—or even further past to improve context.
A natural question might be, for example, “If Turkmenistan stopped blocking IPs in mid-2024, what did the data say beforehand?” The figure below captures October and November 2023. (The red-shaded region contains missing data due to the Nov. 2 Cloudflare control plane and metrics outage.) Signals about the Internet in Turkmenistan were evolving well before the news article that prompted us to look.
We’re proud to offer a unique view of TCP connection anomalies on Radar. It’s a testament to the long-lived benefits that emerge when approaching Internet measurement as a science. In keeping with the open spirit of science, we’ve also shared how we detect and log resets and timeouts so that others can reproduce the observability on their servers, whether by hobbyists or other large operators.
In the third quarter, we observed Internet disruptions with a wide variety of known causes, as well as several with no definitive or published cause. Once again, we unfortunately saw a number of government-directed shutdowns, including exam-related shutdowns in Sudan, Syria, and Iraq. Cable cuts, both submarine and terrestrial, caused Internet outages, including one caused by a stray bullet. A rogue contractor, among other events, caused power outages that impacted Internet connectivity. Damage from an earthquake and a fire caused service disruptions, as did a targeted cyberattack. And a myriad of technical issues, including issues with China’s Great Firewall, resulted in traffic losses across multiple countries.
As we have noted in the past, this post is intended as a summary overview of observed and confirmed disruptions, and is not an exhaustive or complete list of issues that have occurred during the quarter. A larger list of detected traffic anomalies is available in the Cloudflare Radar Outage Center. These anomalies are detected through significant deviations from expected traffic patterns observed across our network. Note that both bytes-based and request-based traffic graphs are used within the post to illustrate the impact of the observed disruptions — the choice of metric to include was generally made based on which better illustrated the impact of the disruption.
Government-directed shutdowns
Sudan
Regular drops in traffic from Sudan were observed between 12:00-15:00 UTC (14:00-17:00 local time) each day from July 7-10. Partial outages were observed at Sudatel (AS15706), and near-complete outages at SDN Mobitel (AS36998) and MTN Sudan (AS36972). Similar drops were also seen in traffic to our 1.1.1.1 DNS resolver from these impacted ASNs.
We have observed Sudan implementing government-directed Internet shutdowns in the past (2021, 2022), and given that the timing aligns with the last four days of postponed 2024 secondary school certificate examinations, in addition to fitting the pattern of short-duration disruptions repeating across multiple days, we believe that these drops in traffic were exam-related shutdowns as well.
Syria
In our second quarter post, we covered the cellular connectivity-focused exam-related Internet shutdowns that Syria chose to implement this year in an effort to limit their impact. During the second quarter, the shutdowns associated with the “Basic Education Certificate” took place on June 21, 24, and 29 between 05:15 – 06:00 UTC (08:15 – 09:00 local time). Exams and associated shutdowns for the “Secondary Education Certificate” were scheduled to take place between July 12 and August 3, and during that period, we observed six additional Internet disruptions in Syria on July 12, 17, 21, 28, 31, and August 3, as shown in the graph below.
“As part of its efforts to ensure the integrity of the examination process, and in coordination with relevant authorities, the Ministry of Education was able to uncover organized exam cheating networks in three examination centers in Lattakia Governorate. These networks used advanced electronic technologies and devices in their attempt to manipulate the exam process.
The network was seized in cooperation with the Lattakia Education Directorate, following close monitoring and detection of suspicious attempts. It was found that members of the network used small earphones, wireless communication devices, and mobile phones equipped with advanced transmission and reception technologies, which contradict educational values and violate the integrity of the examination process and the principle of justice.”
Venezuela
A slightly more unusual government directed shutdown took place in Venezuela on August 18 when Venezuelan provider SuperCable (AS22313) ceased service. An X post from Venezuelan industry watcher VE sin Filtro published a notification from CONATEL, the National Commission of Telecommunications in Venezuela, that notified SuperCable that as of March 14, 2025, its authority to operate in the country had been revoked, and established a 60 day transition period so that users could find another provider. Another X post from VE sin Filtro shared an email that SuperCable subscribers received from the company announcing the end of the service and, and noted that half an hour after the email was sent, subscribers were left without Internet connectivity. Traffic began to fall at 15:00 UTC (11:00 local time), and was gone after 15:30 UTC (11:30 local time). Connectivity remained shut down through the end of the quarter.
Interestingly, we did not see a corresponding full loss of announced IP address space when traffic disappeared. However, such full losses did occur between August 19-21, and again briefly on September 16. The number of announced /24s (blocks of 256 IPv4 addresses) fell from 95 to 63 on September 25, and remained at that level through the end of the quarter.
Iraq
Similar to Syria, we covered the latest rounds of exam-related Internet shutdowns in Iraq in our second quarter blog post. In that post, we noted that the shutdowns in the main part of the country ran until July 3 for preparatory school exams, and through July 6 in the Kurdistan region. These can be seen in the graph below.
In mid-September, the Taliban ordered the shutdown of fiber optic Internet connectivity in multiple provinces across Afghanistan, as part of a drive to “prevent immorality”. It was the first such ban issued since the Taliban took full control of the country in August 2021. As many as 15 provinces experienced shutdowns, and these regional shutdowns blocked Afghani students from attending online classes, impacted commerce and banking, and limited access to government agencies and institutions such as passport and registration offices, customs offices.
Less than two weeks later, just after 11:30 UTC (16:00 local time) on Monday, September 29, 2025, subscribers of wired Internet providers in Afghanistan experienced a brief service interruption, lasting until just before 12:00 UTC (16:30 local time). Mobile providers Afghan Wireless (AS38472) and Etisalat (AS131284) remained available during that period. However, just after 12:30 UTC (17:00 local time), the Internet was completely shut down, taking the country completely offline.
On July 7, a post on X from Claro alerted subscribers to a service disruption caused by damage to two fiber optic cables. According to a subsequent post, one was damaged by work being done by CORAAVEGA (La Vega Water And Sewerage Corporation) and the other by work being done by the Dominican Electric Transmission Company. As a result of the damage, traffic from Claro (AS6400) began to drop just before 16:00 UTC (12:00 local time), falling just over two-thirds compared to the prior week. Claro’s technicians were able to quickly locate the faults and repair them, with traffic recovering around 18:00 UTC (14:00 local time).
Angola
Between 12:45-15:45 UTC (13:45-16:45 local time) on July 19, users in Angola experienced an Internet disruption, with Unitel Angola (AS37119) experiencing as much as a 95% drop in traffic as compared to the previous week, and Connectis (AS327932) suffering a complete outage. According to an X post from Unitel Angola, it “was caused by a disruption at our partner Angola Cables, resulting from public road works that affected the national fiber optic interconnections.”
However, the timing of the disruption coincided with protests over the rise in diesel fuel prices, and local non-governmental organizations disputed Unitel Angola’s explanation, claiming that it was actually due to a government-directed Internet shutdown. Multiple Angolan network providers experienced a drop in announced IP address space during the period the Internet disruption occurred, and analysis of routing information for these networks finds that they share Angola Cables (AS37468) as an upstream provider, lending some credence to the explanation from Unitel Angola.
Haiti
Digicel Haiti (AS27653) is no stranger to Internet disruptions caused by damage to both terrestrial and submarine cables, experiencing such problems during the first and second quarters of 2025, as well as first, second, and third quarters of 2024. The most recent such disruption occurred on August 26, when they experienced two different cuts on their fiber optic infrastructure, according to an X post from the company’s Director General. Traffic dropped by approximately 80% during the disruption, which lasted from 19:30-23:00 UTC (15:30-19:00 UTC).
Pakistan & United Arab Emirates
Telegeography’s Submarine Cable Map shows that the Red Sea has a high density of submarine cables that carry data between Europe, Africa, and Asia. Cuts to these cables can significantly impact connectivity, ranging from increased latency on international connections to complete outages. The impacts may only affect a single country, or they may disrupt multiple countries connected to a damaged cable. On September 6, Pakistan Telecom (AS17557)posted a message on X that stated “We would like to inform that submarine cable cuts have occurred in Saudi waters near Jeddah, impacting partial bandwidth capacity on SMW4 and IMEWE systems. As a result, internet users in Pakistan may experience some service degradation during peak hours.” (Initial reporting that the cable cuts occurred near Jeddah were apparently incorrect, as the damage occurred in Yemeni waters.)
Looking at the impact in Pakistan, we observed traffic drop by 25-30% in Sindh and Punjab between 12:00-20:00 UTC (17:00 – 01:00 local time).
In the United Arab Emirates, Etisalat alerted customers via a post on X that they “may experience slowness in data services due to an interruption in the international submarine cables.” Between 11:00-22:00 UTC (15:00-02:00 local time) on September 6, traffic from AS8966 (Etisalat)dropped as much as 28%.
Also in the UAE, service provider du (AS15802) told their customers via a post on X that “You may experience some slowness in our data services due to an International submarine cable cut.” This slowness is visible in Radar’s Internet quality metrics for the network between 11:00-22:00 UTC (15:00-02:00 local time) on September 6, with median bandwidth dropping by more than half, from 25 Mbps to as low as 9.8 Mbps, and median latency doubling from 30 ms to over 60 ms.
The graphs below provide another view of the impact of the cable cuts, based on Cloudflare network probes between New Delhi (del-c) to London (lhr-a) and Bombay (bom-c) to Frankfurt (fra-a). For the former pair of data centers, mean latency grew by approximately 20%, and for the latter pair, by approximately 30%, starting around 23:00 UTC on September 5. (The stable latency line at the bottom of both graphs represents probes going over the Cloudflare backbone, which was not impacted by the cable cuts.)
Texas, United States
Fiber optic cables are frequently damaged by errant ship anchors (submarine) or construction equipment (terrestrial), but on September 26, a stray bullet damaged a cable in the Dallas, Texas area, disrupting Internet connectivity for Spectrum (AS11427) customers. Spectrum acknowledged the service interruption in a post on X, followed by another post four and a half hours later stating that the issue had been resolved. Although neither post cited the bullet as the cause of the disruption, news reports attributed the claim to a Spectrum spokesperson. Overall, the disruption was fairly nominal, lasting for just two hours between 18:00-20:00 UTC (13:00-15:00 local time), with traffic dropping less than 25% as compared to the prior week.
South Africa
“Major cable breaks” disrupted Internet connectivity for customers of Telkom (AS37457) in South Africa on September 27. Although Telkom acknowledged the initial service disruption and its subsequent resolution in posts on X, it didn’t provide any information about the cause in these posts. However, it apparently later issued a statement, stating “Telkom confirms that mobile voice and data services, which were disrupted earlier on Saturday due to major cable breaks, have now been fully restored nationwide.” The disruption lasted six hours, from 08:00-14:00 UTC (10:00-16:00 local time), with traffic dropping as much as 50% as compared to the previous week.
Power outages cause Internet disruptions
Tanzania
A reported power outage at one of Airtel Tanzania’s data centers on July 1 resulted in a multi-hour disruption in connectivity for its mobile customers. The service interruption occurred between 11:30-18:00 UTC (14:30-21:00 local time), with traffic dropping on Airtel Tanzania (AS37133) by as much as 40% as compared to the previous week.
Czech Republic
According to the Industry and Trade Ministry in the Czech Republic, a fallen power cable caused a widespread power outage on July 4. This power outage impacted Internet connectivity within the country, with traffic dropping by as much as 32%. Traffic fell just after the power outage began at 10:00 UTC (12:00 local time), and although it was “nearly fully resolved” by 16:00 UTC (18:00 local time), traffic did not return to expected levels until closer to 20:00 UTC (22:00 local time). This trailing traffic recovery aligns with a published report that noted “While ČEPS, the national transmission system operator, restored full grid functionality by mid-afternoon, tens of thousands remained without electricity into the evening.”
St. Vincent and the Grenadines
On St. Vincent and the Grenadines, the St Vincent Electricity Services Limited (VINLEC) stated in a Facebook post that a “system failure” caused a power outage that affected customers on mainland St. Vincent. According to VINLEC, the system failed at approximately 11:30 local time on August 16 (03:30 UTC on August 17), and power was restored to all customers just after 04:00 local time on August 17 (08:00 UTC). During the four-hour power outage, which also disrupted Internet connectivity, traffic dropped by as much as 80% below expected levels.
Curaçao
In Curaçao, a series of Facebook posts from Aqualectra, the island’s water and power company, confirmed that there was a power outage, and provided updates on the progress towards restoration. The impact of the power outage to Internet connectivity was visible in traffic disruptions across several Internet service providers, including Flow (AS52233) and UTS (AS11081). The observed disruptions lasted for most of the day, with traffic dropping around 06:45 UTC (02:45 local time) and recovering to expected levels around 23:45 UTC (19:45 local time). During the disruption, the country’s traffic dropped by over 80% as compared to the previous week, with Flow experiencing a near complete outage.
Cuba
Wide-scale power outages occur all too frequently in Cuba, and when power is lost, Internet connectivity follows. We have covered many such events in this series of blog posts over the last several years, and the latest occurred on September 10. That morning, an X post from the Unión Eléctrica de Cuba reported the collapse of the national electric power system at 09:14 local time (13:14 UTC) following the unexpected shutdown of the Antonio Guiteras Thermoelectric Power Plant (CTE). The island’s Internet traffic dropped by nearly 60% (as compared to expected levels) almost immediately, and remained lower than normal for over a day, returning to expected levels around 17:15 UTC on September 11 (13:15 local time) when the Ministerio de Energía y Minas de Cuba posted on X that the national electric system had been restored.
Gibraltar
A contractor cutting through three high voltage cables caused a nationwide power outage in Gibraltar on September 16, according to a Facebook post from the Gibraltar government. This power outage resulted in a disruption to Internet traffic between 11:15-18:30 UTC (13:15-20:30 local time), falling as low as 80% below the previous week.
Earthquake
Kamchatka Peninsula, Russia
A magnitude 8.8 earthquake struck the Kamchatka Peninsula in Russia at 23:24 UTC on July 29 (11:24 local time on July 30), and was powerful enough to trigger tsunami warnings for Japan, Alaska, Hawaii, Guam, and other Russian regions. The graphs below show that there was an immediate impact to Internet traffic across several networks in the region, including Rostelecom (AS12389) and InterkamService (AS42742), where traffic dropped by 75% or more. While traffic started to recover almost immediately across both providers, traffic on Rostelecom approached expected levels much more quickly than on InterkamService.
Targeted cyberattack
Yemen
A cyberattack targeting Houthi-controlled YemenNet(AS30873) on August 11 briefly disrupted connectivity across the network in Yemen. A significant drop in traffic occurred at around 14:15 UTC (17:15 local time), recovering by 15:00 UTC (18:00 local time). This observed drop in traffic aligns with the reported timing and duration of the attack, which was focused on YemenNet’s ADSL infrastructure.
The attack also apparently impacted YemenNet’s routing, as announced IPv4 address space began to decline as the attack commenced. Although the attack ended within an hour after it started, announced address space remained depressed for approximately an additional hour, reaching as low as 510 /24s (blocks of 256 IPv4 addresses) being announced, down from a “steady state” of 870 /24s.
Fire causes infrastructure damage
Egypt
A fire at the Ramses Central Exchange in Cairo, Egypt on July 7 disrupted telecommunications services for a number of providers with infrastructure in the facility. The fire broke out in a Telecom Egypt equipment room, and impacted connectivity across multiple providers, including Etisalat (AS36992), Mobinil (AS37069), Orange Egypt (AS24863), and Vodafone Egypt (AS24835). Internet traffic across these providers initially dropped at 14:30 UTC (17:30 local time). Recovery to expected levels varied across the providers, with Etisalat recovering by July 9, Vodafone and Mobinil by July 10, and Orange Egypt on July 11.
On July 10, Telecom Egypt announced that services affected by the fire had been restored, after operations were transferred to alternative exchanges.
Technical problems
Starlink
Global satellite Internet service provider Starlink (AS14593) acknowledged a July 24 network outage through a post on X. The Vice President of Network Engineering at SpaceX explained, in a subsequent X post, that “The outage was due to failure of key internal software services that operate the core network.”
Traffic initially dropped around 19:15 UTC, and the disruption lasted approximately 2.5 hours. The impact of the Starlink outage was particularly noticeable in countries including Yemen and Sudan, where traffic dropped by approximately 50%, as well as in Zimbabwe, South Sudan, and Chad.
China
At around 16:30 UTC on August 19 (00:30 local time on August 20), we observed an anomalous 25% drop in China’s Internet traffic. Our analysis of related metrics found that this disruption caused a drop in the share of IPv4 traffic, as well as a spike in the share of HTTP traffic (meaning that HTTPS traffic share had fallen), as shown in the graphs below.
Further analysis also found the share of TCP connections terminated in the Post SYN stage doubled during the observed outage, from 39% to 78%, as shown below. The cause of these unusual observations was ultimately uncovered by a Great Firewall Report blog post, which stated, in part: “Between approximately 00:34 and 01:48 (Beijing Time, UTC+8) on August 20, 2025, the Great Firewall of China (GFW) exhibited anomalous behavior by unconditionally injecting forged TCP RST+ACK packets to disrupt all connections on TCP port 443. This incident caused massive disruption of the Internet connections between China and the rest of the world. … The responsible device does not match the fingerprints of any known GFW devices, suggesting that the incident was caused by either a new GFW device or a known device operating in a novel or misconfigured state.” This explanation is consistent with the anomalies visible in the Radar graphs.
Pakistan
Subscribers of Nayatel (AS23674) experienced an approximately 90 minute disruption to Internet connectivity on September 24, due to a reported outage at an upstream provider. Traffic dropped as much as 57% between around 09:15-10:45 UTC (14:15-15:45 local). Transworld (AS38193) is one of several upstream providers to Nayatel, and a more significant drop in traffic is visible for that network, lasting from around 09:15-12:15 UTC (14:15-17:15 local time). The Nayatel disruption was likely less significant than the one seen at Transworld because Transworld is upstream of only a portion of the prefixes originated by Nayatel — traffic from other Nayatel prefixes was carried by other providers that remained available.
No definitive cause
Iran
Several weeks after experiencing a full Internet shutdown, Iran again experienced a sudden drop in Internet traffic around 21:00 UTC on July 5 (00:30 local time on July 6), with traffic falling 80% as compared to the prior week. While most of the “unknown” disruptions covered in this series of posts are observed but have no associated acknowledgement or explanation, this disruption had multiple competing explanations.
A published report noted “IRNA, Iran’s official news agency, cited the state-run Telecommunications Infrastructure Company, reporting a national-level disruption in international connectivity that affected most internet service providers Saturday night. Yet government officials have not publicly addressed the cause.” However, posts from civil society groups that follow Internet connectivity in Iran (net4people, FilterWatch) suggested that the disruption was again due to an intentional shutdown. And a post thread on X referenced, and disputed, a claim that the disruption was due to a DDoS attack. Unfortunately, no definitive root cause for this disruption could be found.
Colombia
Customers of Claro Colombia experienced an Internet disruption that lasted just over 30 minutes on August 6, with traffic falling two-thirds or more as compared to the prior week between 16:45 – 17:20 UTC. The disruption affected multiple ASNs owned by Claro, including AS10620, AS14080, and AS26611. (The Telmex Colombia and Comcel names shown in the graphs below are historical – Telmex and Comcel merged in 2012 and have operated under the Claro brand since then.) Claro did not acknowledge the disruption on social media, nor did it provide any explanation for it.
Pakistan
A near-complete outage at Pakistani backbone provider PTCL (AS17557) caused traffic from the network provider to drop 90% at 16:10 UTC (21:10 local time) on August 19. PTCL acknowledged the issue in a post on X, noting “We are currently facing data connectivity challenges on our PTCL and Ufone services.” Although they published a subsequent post several hours later after service was restored, they did not provide any additional information about the cause of the outage. However, one published report claimed “The disruption was primarily caused by a technical fault in PTCL’s fiber optic infrastructure.” while another report claimed “According to industry sources, the internet disruption in Pakistan may be connected to a technical fault in the fiber optic backbone or issues with main internet providers responsible for international online traffic.
Interestingly, traffic from PTCL to Cloudflare’s 1.1.1.1 DNS resolver spiked as the outage began, and the share of requests made over UDP grew from 94% to 99%. In addition, routing data shows that there was also a small drop in announced IPv4 address space coincident with the outage. However, these additional observations do not necessarily confirm a “technical fault in PTCL’s fiber optic infrastructure” as the ultimate cause of the disruption.
South Africa
To their credit, South African provider RSAWEB (AS37053)quickly acknowledged an issue with their FTTx and Enterprise connectivity on September 10, but neither their initial post nor subsequent updates provided any information on the cause of the problem. Whatever the cause, it resulted in a near-complete loss of Internet traffic from RSAWEB between 15:00 and 16:30 UTC (17:00 – 18:30 local time).
Routing data also shows a loss of just two announced /24 address blocks concurrent with the outage, dropping from 470 to 468. Unless all of RSAWEB’s outbound traffic was flowing through this limited amount of IP address space, it seems unusual that the withdrawal of just 512 IPv4 addresses from the=e routing table would have such a significant impact on the network’s traffic.
SpaceX Starlink
After experiencing a brief disruption in July due to a software failure, Starlink (AS14593) suffered another short disruption between 04:00-05:00 UTC on September 15. Although Starlink generally acknowledges disruptions to their global network on their X account, and often providing a root cause, in this case they apparently published an acknowledgement on X, but deleted it after the issue was resolved. In addition to the drop in traffic, we observed a concurrent drop in announced IPv4 address space and spike in BGP announcements (likely withdrawals), suggesting that the disruption may have been caused by a network-related issue.
Conclusion
The recent launch of regional traffic insights on Radar brings yet another perspective to our ability to investigate observed Internet traffic anomalies. We can now drill down at regional and network levels, as well as exploring the impact across DNS traffic, connection bandwidth and latency, TCP connection tampering, and announced IP address space, helping us understand the impact of such events. And while these blog posts feature graphs from Radar and the Radar Data Explorer, the underlying data is available from our rich API. You can use the API to retrieve data to do your own local monitoring or analysis, or the Radar MCP server to incorporate Radar data into your AI tools.
Readers of a certain age may remember the so-called “dot com boom” that took place in the early 2000’s. The boom’s “dot com” is what is known as a Top-Level Domain (TLD). Originally intended to organize domain names into a small set of categorical groupings, over the past 40+ years, the set of TLDs has expanded to include country code top-level domains (ccTLDs, like .us, .pt, and .cn), as well as additional generic top-level domains (gTLDs) beyond the initial seven, such as .biz, .shop, and .nyc. Internationalized TLDs, such as .сайт, .онлайн,.شبكة, .游戏, and brand TLDs, like .google and .nike have also been added. As of October 2025, over 1,400 entries can be found in ICANN’s list of all valid top-level domains, and a further expansion is expected to begin in April 2026.
Building on this, today we are launching a new TLD page on Radar that, based on aggregated data from multiple Cloudflare services, provides insights into TLD popularity, activity, and security, along with links directly into Cloudflare Registrar to enable users to register domain names in supported TLDs.
Initial security-related insights
Before today, Radar already offered insights into TLDs, though these were distributed across a couple of different pages and datasets.
In March 2024, when we launched the Email Security page, we introduced the “Most abused TLDs” metric. This chart highlights TLDs associated with the largest shares of malicious and spam email. The analysis is based on the sending domain’s TLD, extracted from the From: header in email messages, with data sourced from Cloudflare’s cloud email security service.
More recently, during 2025’s Birthday Week, we introducedCertificate Transparency (CT) insights on Radar, leveraging data from CT logs monitored by Cloudflare. One highlight is the Certificate Coverage section, which visualizes the distribution of pre-certificates across the top 10 TLDs. These insights give a different perspective on TLD activity, complementing email-based metrics by showing which domains are actively securing web traffic.
A new aggregate overview based on DNS Magnitude
Today, we’re excited to announce the new TLD page on Radar. The landing page and the dedicated per-TLD pages provide TLD managers and site owners with a perspective on the relative popularity of TLDs they manage or may be considering domains in, as well as insights into TLD traffic volume and distribution.
Located under the DNS menu, the landing page introduces a ranking of top-level domains based on DNS Magnitude — a metric originally developed by nic.at to estimate a domain’s overall visibility on the Internet.
Instead of simply counting the total number of DNS queries, DNS Magnitude incorporates a sense of how many unique clients send queries to domains within the TLD. This approach gives a more accurate picture of a TLD’s reach, since a small number of sources can generate a large number of queries. Our ranking is based on queries observed at Cloudflare’s 1.1.1.1 resolver. We aggregate individual client IP addresses into subnets, referred to here as “networks”.
The magnitude value ranges from 0 to 10, with higher values (closer to 10) indicating that the TLD is queried by a broader range of networks. This reflects greater global visibility and, in some cases, a higher likelihood of name collision across different systems. According to ICANN, a name collision occurs when an attempt to resolve a name used in a private name space (such as under a non-delegated Top-Level Domain) results in a query to the public Domain Name System (DNS). When the administrative boundaries of private and public namespaces overlap, name resolution may yield unintended or harmful results. For example, if ICANN were to delegate .home, that could cause significant issues for hobbyists that use the (currently non-delegated) TLD within their local networks.
The table displays a paginated ranking of the top 2,500 TLDs, along with several key attributes. Each entry includes the TLD itself — which links to a dedicated page for delegated TLDs — as well as its type:
gTLD (generic TLD): used for general purposes, such as .com or.info.
grTLD (generic restricted TLD): limited to specific communities or uses, such as.name.
ccTLD (country code TLD): assigned to individual countries or territories, such as.uk or .jp.
iTLD (infrastructure TLD): reserved for technical infrastructure, such as .arpa.
sTLD (sponsored TLD): operated by a sponsoring organization representing a defined community, such as .edu or .gov.
The status column indicates whether the TLD is delegated, meaning it is officially assigned and active in the root zone of the DNS, or non-delegated, meaning it is not currently part of the public DNS. The table also shows the manager of each TLD — typically the organization or registry responsible for its operation — and the corresponding DNS magnitude value.
While the top 10 TLDs include stalwarts such as .com/.net/.org and ccTLDs that have been commercially repurposed, such as .io/.co/.tv, the TLD at the top of the list may be a bit surprising: .su.
This TLD was delegated for the Soviet Union back in 1990, but its use waned after the dissolution of the USSR, with constituent republics becoming independent and using their own dedicated ccTLDs. (ICANN reportedly plans to retire.su in 2030.) Looking at a single day’s worth of data, the .su TLD does not rank #1 by unique networks. However, over a longer period of time, such as seven days, it sees queries from more unique networks than other TLDs, placing it atop the magnitude list. Further analysis of the top hostnames observed within this TLD suggests that they are mostly associated with a popular online world-building game. Interestingly, over half of the queries for .su domains come from the United States, Germany, and Brazil.
More detailed TLD insights
The new TLD section also offers dedicated pages for individual TLDs. By clicking on a TLD in the DNS Magnitude table or searching for a TLD in the top search bar, users can access a page with detailed insights and information about that TLD. It’s important to note that while non-delegated TLDs are included in the DNS Magnitude ranking, TLD-specific pages are only available for delegated TLDs. The list of delegated TLDs, along with their type and manager, is sourced from the IANA’s Root Zone Database.
When a user enters an individual TLD page, they see two main cards. The first card provides general information about the TLD, including its type, manager, DNS magnitude value, DNSSEC support, and RDAP support. DNSSEC support is determined by checking whether the TLD has a Delegation Signer (DS) record in the root zone. We also parse the record to get the associated DNSSEC algorithm. RDAP support is indicated if the TLD is listed in the IANA RDAP bootstrap file. RDAP (Registration Data Access Protocol) is a new standard for querying domain contact and nameserver information for all registered domains.
The second card contains WHOIS data for the TLD, including its creation date, the date of the last update, and the list of nameservers. If the TLD is supported by Cloudflare Registrar, an additional card appears, giving users direct access to registration options. As of today, Cloudflare Registrar supports over 400 TLDs.
Below these cards, the page features the DNS query volume section, which presents insights based on queries to Cloudflare’s 1.1.1.1 resolver for domains under the TLD. This section includes a chart showing DNS queries over the selected time period, along with a donut chart breaking down queries by type, response code, and DNSSEC support. A choropleth map further illustrates the percentage of DNS queries by country, highlighting which regions generate the most queries for domains under the TLD.
Each individual TLD page also includes a Certificate Transparency section, offering visibility into TLS/SSL certificate issuance for the TLD. This section displays a line chart showing the total number of certificates issued over the selected period, as well as a donut chart depicting the distribution of certificate issuance among the top Certificate Authorities.
When we launched the DNS page earlier in 2025, we provided query volumes by TLDs, but this was limited to ccTLDs. Today, we’re extending that dataset to include all delegated TLDs. With these new insights, we’ve added the “Top-level domain distribution” section to the DNS page, featuring a line chart that shows the distribution of queries to 1.1.1.1 across the top 10 TLDs, alongside a table extending this ranking to the top 100. Not surprisingly, .com tops the ranking with more than 60% of queries, followed by .net, .arpa (an infrastructure TLD), and .org.
Because TLDs are a foundational component of the Domain Name System, it is critical that the associated name servers are highly performant. Based on billions of daily queries to these name servers, we plan to add insights into their performance to Radar’s TLD pages in 2026. These insights will provide TLD managers with an external perspective on query responsiveness, and will give developers and site owners a perspective on the potential impact of the performance of the associated TLD name servers as they look to register new domain names.
The underlying data for these new TLD pages is available via the API and can be interactively explored in more detail using Radar’s Data Explorer and AI Assistant. And as always, Radar and Data Assistant charts and graphs are downloadable for sharing, and embeddable for use in your own blog posts, websites, or dashboards.
If you share our TLD charts and graphs on social media, be sure to tag us: @CloudflareRadar (X), noc.social/@cloudflareradar (Mastodon), and radar.cloudflare.com (Bluesky). If you have questions or comments, or suggestions for data that you’d like to see us add to Radar, you can reach out to us on social media, or contact us via email.
The Internet is constantly changing in ways that are difficult to see. How do we measure its health, spot new threats, and track the adoption of new technologies? When we launched Cloudflare Radar in 2020, our goal was to illuminate the Internet’s patterns, helping anyone understand what was happening from a security, performance, and usage perspective, based on aggregated data from Cloudflare services. From the start, Internet measurement, transparency, and resilience has been at the core of our mission.
The launch blog post noted, “There are three key components that we’re launching today: Radar Internet Insights, Radar Domain Insights and Radar IP Insights.” These components have remained at the core of Radar, and they have been continuously expanded and complemented by other data sets and capabilities to support that mission. By shining a brighter light on Internet security, routing, traffic disruptions, protocol adoption, DNS, and now AI, Cloudflare Radar has become an increasingly comprehensive source of information and insights. And despite our expanding scope, we’ve focused on maintaining Radar’s “easy access” by evolving our information architecture, making our search capabilities more powerful, and building everything on top of a powerful, publicly-accessible API.
Now more than ever, Internet observability matters. New protocols and use cases compete with new security threats. Connectivity is threatened not only by errant construction equipment, but also by governments practicing targeted content blocking. Cloudflare Radar is uniquely positioned to provide actionable visibility into these trends, threats, and events with local, network, and global level insights, spanning multiple data sets. Below, we explore some highlights of Radar’s evolution over the five years since its launch, looking at how Cloudflare Radar is building one of the industry’s most comprehensive views of what is happening on the Internet.
Making Internet security more transparent
The Cloudflare Research team takes a practical approach to research, tackling projects that have the potential to make a big impact. A number of these projects have been in the security space, and for three of them, we’ve collaborated to bring associated data sets to Radar, highlighting the impact of these projects.
The 2025 launch of the Certificate Transparency (CT) section on Radar was the culmination of several months of collaborative work to expand visibility into key metrics for the Certificate Transparency ecosystem, enabling us to deprecate the original Merkle Town CT dashboard, which was launched in 2018. Digital certificates are the foundation of trust on the modern Internet, and Certificate Authorities (CAs) serve as trusted gatekeepers, issuing those certificates, with CT logs providing a public, auditable record of every certificate issued, making it possible to detect fraudulent or mis-issued certificates. The information available in the new CT section allows users to explore information about these certificates and CAs, as well as about the CT logs that capture information about every issued certificate.
In 2024, members of Cloudflare’s Research team collaborated with outside researchers to publish a paper titled “Global, Passive Detection of Connection Tampering”. Among the findings presented in the paper, it noted that globally, about 20% of all connections to Cloudflare close unexpectedly before any useful data exchange occurs. This unexpected closure is consistent with connection tampering by a third party, which may occur, for instance, when repressive governments seek to block access to websites or applications. Working with the Research team, we added visibility into TCP resets and timeouts to the Network Layer Security page on Radar. This graph, such as the example below for Turkmenistan, provides a perspective on potential connection tampering activity globally, and at a country level. Changes and trends visible in this graph can be used to corroborate reports of content blocking and other local restrictions on Internet connectivity.
The research team has been working on post-quantum encryption since 2017, racing improvements in quantum computing to help ensure that today’s encrypted data and communications are resistant to being decrypted in the future. They have led the drive to incorporate post-quantum encryption across Cloudflare’s infrastructure and services, and in 2023 we announced that it would be included in our delivery services, available to everyone and free of charge, forever. However, to take full advantage, support is needed on the client side as well, so to track that, we worked together to add a graph to Radar’s Adoption & Usage page that tracks the post-quantum encrypted share of HTTPS request traffic. Starting 2024 at under 3%, it has grown to just over 47%, thanks to major browsers and code libraries activating post-quantum support by default.
Measuring AI bot & crawler activity
The rapid proliferation and growth of AI platforms since the launch of OpenAI’s ChatGPT in November 2022 has upended multiple industries. This is especially true for content creators. Over the last several decades, they generally allowed their sites to be crawled in exchange for the traffic that the search engines would send back to them — traffic that could be monetized in various ways. However, two developments have changed this dynamic. First, AI platforms began aggressively crawling these sites to vacuum up content to use for training their models (with no compensation to content creators). Second, search engines have evolved into answer engines, drastically reducing the amount of traffic they send back to sites. This has led content owners to demand solutions.
Among these solutions is providing customers with increased visibility into how frequently AI crawlers are scraping their content, and Radar has built on that to provide aggregated perspectives on this activity. Radar’s AI Insights page provides graphs based on crawling traffic, including traffic trends by bot and traffic trends by crawl purpose, both of which can be broken out by industry set as well. Customers can compare the traffic trends we show on the dashboard with trends across their industry.
One key insight is the crawl-to-refer ratio: a measure of how many HTML pages a crawler consumes in comparison to the number of page visits that they refer back to the crawled site. A view into these ratios by platform, and how they change over time, gives content creators insight into just how significant the reciprocal traffic imbalances are, and the impact of the ongoing transition of search engines into answer engines.
Over the three decades, the humble robots.txt file has served as something of a gatekeeper for websites, letting crawlers know if they are allowed to access content on the site, and if so, which content. Well-behaved crawlers read and parse the file, and adjust their crawling activity accordingly. Based on the robots.txt files found across Radar’s top 10,000 domains, Radar’s AI Insights page shows how many of these sites explicitly allow or disallow these AI crawlers to access content, and how complete that access/restriction is. With the ability to filter the data by domain category, this graph can provide site owners with visibility into how their peers may be dealing with these AI crawlers.
Improving Internet resilience with routing visibility
Routing is the process of selecting a path across one or more networks, and in the context of the Internet, routing selects the paths for Internet Protocol (IP) packets to travel from their origin to their destination. It is absolutely critical to the functioning of the Internet, but lots of things can go wrong, and when they do, they can take a whole network offline. (And depending on the network, a larger blast radius of sites, applications, and other service providers may be impacted.
Routing visibility provides insights into the health of a network, and its relationship to other networks. These insights can help identify or troubleshoot problems when they occur. Among the more significant things that can go wrong are route leaks and origin hijacks. Route leaks occur when a routing announcement propagates beyond its intended scope — that is, when the announcement reaches networks that it shouldn’t. An origin hijack occurs when an attacker creates fake announcements for a targeted prefix, falsely identifying an autonomous systems (AS) under their control as the origin of the prefix — in other words, the attacker claims that their network is responsible for a given set of IP addresses, which would cause traffic to those addresses to be routed to them.
In 2022 and 2023 respectively, we added route leak and origin hijack detection to Radar, providing network operators and other interested groups (such as researchers) with information to help identify which networks may be party to such events, whether as a leaker/hijacker, or a victim. And perhaps more importantly, in 2023 we also launched notifications for route leaks and origin hijacks, automatically notifying subscribers via email or webhook when such an event is detected, enabling them to take immediate action.
In 2025, we further improved this visibility by adding two additional capabilities. The first was real-time BGP route visibility, which illustrates how a given network prefix is connected to other networks — what is the route that packets take to get from that set of IP addresses to the large “tier 1” network providers? Network administrators can use this information when facing network outages, implementing new deployments, or investigating route leaks.
An AS-SET is a grouping of related networks, historically used for multiple purposes such as grouping together a list of downstream customers of a particular network provider. Our recently announced AS-SET monitoring enables network operators to monitor valid and invalid AS-SET memberships for their networks, which can help prevent misuse and issues like route leaks.
Not just pretty pictures
While Radar has been historically focused on providing clear, informative visualizations, we have also launched capabilities that enable users to get at the underlying data more directly, enabling them to use it in a more programmatic fashion. The most important one is the Radar API, launched in 2022. Requiring just an access token, users can get access to all the data shown on Radar, as well as some more advanced filters that provide more specific data, enabling them to incorporate Radar data into their own tools, websites, and applications. The example below shows a simple API call that returns the global distribution of human and bot traffic observed over the last seven days.
The Model Context Protocol is a standard way to make information available to large language models (LLMs). Somewhat similar to the way an application programming interface (API) works, MCP offers a documented, standardized way for a computer program to integrate services from an external source. It essentially allows AI programs to exceed their training, enabling them to incorporate new sources of information into their decision-making and content generation, and helps them connect to external tools. The Radar MCP server allows MCP clients to gain access to Radar data and tools, enabling exploration using natural language queries.
Radar’s URL Scanner has proven to be one of its most popular tools, scanning millions of sites since launching in 2023. It allows users to safely determine whether a site may contain malicious content, as well as providing information on technologies used and insights into the site’s headers, cookies, and links. In addition to being available on Radar, it is also accessible through the API and MCP server.
Finally, Radar’s user interface has seen a number of improvements over the last several years, in service of improved usability and a better user experience. As new data sets and capabilities are launched, they are added to the search bar, allowing users to search not only for countries and ASNs, but also IP address prefixes, certificate authorities, bot names, IP addresses, and more. Initially launching with just a few default date ranges (such as last 24 hours, last 7 days, etc.), we’ve expanded the number of default options, as well as enabling the user to select custom date ranges of up to one year in length. And because the Internet is global, Radar should be too. In 2024, we launched internationalized versions of Radar, marking availability of the site in 14 languages/dialects, including downloaded and embedded content.
This is a sampling of the updates and enhancements that we have made to Radar over the last five years in support of Internet measurement, transparency, and resilience. These individual data sets and tools combine to provide one of the most comprehensive views of the Internet available. And we’re not close to being done. We’ll continue to bring additional visibility to the unseen ways that the Internet is changing by adding more tools, data sets, and visualizations, to help users answer more questions in areas including AI, performance, adoption and usage, and security.
Visit radar.cloudflare.com to explore all the great data sets, capabilities, and tools for yourself, and to use the Radar API or MCP server to incorporate Radar data into your own tools, sites, and applications. Keep an eye on the Radar changelog feed, Radar release notes, and the Cloudflare blog for news about the latest changes and launches, and don’t hesitate to reach out to us with feedback, suggestions, and feature requests.
However, just after 12:30 UTC (17:00 local time), the Internet was completely shut down, with Afghani news outlet TOLOnews initially reporting in a post on X that “Sources have confirmed to TOLOnews that today (Monday), afternoon, fiber-optic Internet will be shut down across the country.” This shutdown is likely an extension of the regional shutdowns of fiber optic connections that took place earlier in September, and it will reportedly remain in force “until further notice”. (The earlier regional shutdowns are discussed in more detail below.)
While Monday’s first shutdown was only partial, with mobile connectivity apparently remaining available, the graphs below show that the second event took the country completely offline, with web and DNS traffic dropping to zero at a national level, as seen in the graphs below.
HTTP request traffic is traffic coming from web browsers, applications, and automated tools, and is a clear signal of the availability of Internet connectivity. The graph below shows this request volume dropping sharply as the shutdown was implemented.
HTTP request traffic from Afghanistan, September 29, 2025
Cloudflare sends bytes back in response to those HTTP requests (“HTTP bytes”), as well as sending bytes back in response to traffic associated with other services, such as our 1.1.1.1 DNS resolver, authoritative DNS, WARP, etc. (“total bytes”). Cloudflare stopped receiving client traffic from the services when the shutdown began, causing the bytes transferred in response to drop to zero.
Internet traffic from Afghanistan, September 29, 2025
1.1.1.1 is Cloudflare’s privacy-focused DNS resolver, and processes DNS lookup requests from clients. As connectivity was cut, traffic to the service disappeared.
DNS query traffic to Cloudflare’s 1.1.1.1 resolver from Afghanistan, September 29, 2025
At a regional level, it appears that traffic from Kabul fell slightly later than traffic from the other regions, trailing them by approximately a half hour.
HTTP request traffic from the top five provinces in Afghanistan, September 29, 2025
The delay in traffic loss seen in Kabul may be associated with a more gradual loss of traffic seen at AS38742 (Afghan Wireless), which saw traffic approach zero just after 13:00 UTC (17:30 local time). This conjecture is supported by a published report that noted “Residents across Kabul and several provincial cities reported on Monday that fiber-optic services were no longer available, with only limited mobile data functioning briefly before signal towers stopped working altogether.”
Interestingly, it appears that as of 00:00 UTC (04:30 local time) on September 30, we continue to see a very small amount of traffic from this network. (This is in contrast to other networks, whose lines disappeared from the graph around 12:30 UTC (17:00 local time)).
HTTP request traffic from the top 10 ASNs in Afghanistan, September 29, 2025
Network providers announce IP address space that they are responsible for to other networks, enabling the routing of traffic to and from those IP addresses. When these announcements are withdrawn, the resources in that address space, whether clients or servers, can no longer reach, or are no longer reachable from, the rest of the Internet.
In Afghanistan, announced IPv4 address space dropped rapidly as the shutdown was implemented, falling by two-thirds from 604 to 197 announced /24s (blocks of 256 IPv4 addresses) in the first 20 minutes, and then dropping further over the next 90 minutes. Through the end of the day, several networks continued to announce a small amount of IPv4 address space: four /24s from AS38742 (Afghan Wireless), two from AS149024 (Afghan Bawar ICT Services), and one each from AS138322 (Afghan Wireless) and AS136479 (Cyber Telecom).
Announced IPv4 address space from Afghanistan, September 29, 2025
Announced IPv6 address space fell as well, though not quite as catastrophically, dropping by three-fourths almost immediately, from 262,407 /48s (blocks of over 1.2 septillion IPv6 addresses) to 65,542.
Announced IPv6 address space from Afghanistan, September 29, 2025
Regional shutdowns by the Taliban to prevent “immoral activities”
In mid-September, the Taliban ordered the shutdown of fiber optic Internet connectivity in multiple provinces across Afghanistan, as part of a drive to “prevent immorality”. It was the first such ban issued since the Taliban took full control of the country in August 2021.
These regional shutdowns blocked Afghani students from attending online classes, impacted commerce and banking, and limited access to government agencies and institutions such as passport and registration offices, customs offices. As many as 15 provinces experienced shutdowns, and we review the observed impacts across several of them below, using the regional traffic data recently made available on Cloudflare Radar.
Balkh appeared to be one of the earliest targeted provinces, with traffic dropping midday (UTC) on September 15. While some nominal recovery occurred on September 23, traffic remained well below pre-shutdown levels.
Internet traffic from Balkh, Afghanistan, September 1-28, 2025
After several days of peak traffic levels double those seen in previous weeks, traffic in Takhar fell on September 16, remaining near zero until September 21, when a small amount of connectivity was apparently restored.
Internet traffic from Takhar, Afghanistan, September 1-28, 2025
In Kandahar, lower peak traffic volumes are visible between September 17 and September 21. The partial restoration of traffic is coincident with the restoration of Internet services highlighted in a published report, though it notes that “The restoration of services is limited to point-to-point connections for key government offices, including banks, customs offices, and the Directorate for National ID Cards.”
Internet traffic from Kandahar, Afghanistan, September 1-28, 2025
Baghlan experienced an anomalous spike in traffic on September 16, with total traffic spiking 3x higher than peaks seen during the previous weeks. However, on September 17, traffic dropped to a fraction of pre-shutdown levels. Except for a return to near-normal levels on September 21 & 22, the disruption remained in place through the end of the month.
Internet traffic from Baghlan, Afghanistan, September 1-28, 2025
Traffic in Nangarhar was disrupted between September 19-22, but quickly recovered to pre-shutdown levels once restored.
Internet traffic from Nangarhar, Afghanistan, September 1-28, 2025
After experiencing an apparent issue at the start of the month, Internet traffic in Oruzgan, again fell on September 19. After an apparent complete shutdown, on September 23, a small amount of traffic was again visible.
Internet traffic from Oruzgan, Afghanistan, September 1-28, 2025
Internet connectivity was also disrupted in the province of Herat, although differently. From September 22-25, partial Internet outages were implemented between 16:30-03:30 UTC (21:00-08:00 local time), with traffic volumes dropping to approximately half of those seen at the same time the prior weeks. The intent of these “Internet curfew” shutdowns is unclear, but Herat residents noted that they “severely disrupted their business and educational activities”.
Internet traffic from Herat, Afghanistan, September 16-29, 2025
While Internet shutdowns remain all too common around the world, most (though not all) are comparatively short-lived, and are generally in response to a local event, such as exams, unrest/riots, elections, etc. Given the broad impact of this shutdown across all facets of daily personal, social, and professional life in Afghanistan, analysts state that it “could deepen Afghanistan’s digital isolation, further damage its struggling economy and drive more Afghans out of work at a time when humanitarian needs are already severe.”
An AS-SET, not to be confused with the recently deprecated BGP AS_SET, is an Internet Routing Registry (IRR) object that allows network operators to group related networks together. AS-SETs have been used historically for multiple purposes such as grouping together a list of downstream customers of a particular network provider. For example, Cloudflare uses the AS13335:AS-CLOUDFLARE AS-SET to group together our list of our own Autonomous System Numbers (ASNs) and our downstream Bring-Your-Own-IP (BYOIP) customer networks, so we can ultimately communicate to other networks whose prefixes they should accept from us.
In other words, an AS-SET is currently the way on the Internet that allows someone to attest the networks for which they are the provider. This system of provider authorization is completely trust-based, meaning it’s not reliable at all, and is best-effort. The future of an RPKI-based provider authorization system is coming in the form of ASPA (Autonomous System Provider Authorization), but it will take time for standardization and adoption. Until then, we are left with AS-SETs.
Because AS-SETs are so critical for BGP routing on the Internet, network operators need to be able to monitor valid and invalid AS-SET memberships for their networks. Cloudflare Radar now introduces a transparent, public listing to help network operators in our routing page per ASN.
AS-SETs and building BGP route filters
AS-SETs are a critical component of BGP policies, and often paired with the expressive Routing Policy Specification Language (RPSL) that describes how a particular BGP ASN accepts and propagates routes to other networks. Most often, networks use AS-SET to express what other networks should accept from them, in terms of downstream customers.
Back to the AS13335:AS-CLOUDFLARE example AS-SET, this is published clearly on PeeringDB for other peering networks to reference and build filters against.
When turning up a new transit provider service, we also ask the provider networks to build their route filters using the same AS-SET. Because BGP prefixes are also created in IRR registries using the route or route6 objects, peers and providers now know what BGP prefixes they should accept from us and deny the rest. A popular tool for building prefix-lists based on AS-SETs and IRR databases is bgpq4, and it’s one you can easily try out yourself.
For example, to generate a Juniper router’s IPv4 prefix-list containing prefixes that AS13335 could propagate for Cloudflare and its customers, you may use:
Restricted to 10 lines, actual output of prefix-list would be much greater
This prefix list would be applied within an eBGP import policy by our providers and peers to make sure AS13335 is only able to propagate announcements for ourselves and our customers.
How accurate AS-SETs prevent route leaks
Let’s see how accurate AS-SETs can help prevent route leaks with a simple example. In this example, AS64502 has two providers – AS64501 and AS64503. AS64502 has accidentally messed up their BGP export policy configuration toward the AS64503 neighbor, and is exporting all routes, including those it receives from their AS64501 provider. This is a typical Type 1 Hairpin route leak.
Fortunately, AS64503 has implemented an import policy that they generated using IRR data including AS-SETs and route objects. By doing so, they will only accept the prefixes that originate from the AS Cone of AS64502, since they are their customer. Instead of having a major reachability or latency impact for many prefixes on the Internet because of this route leak propagating, it is stopped in its tracks thanks to the responsible filtering by the AS64503 provider network. Again it is worth keeping in mind the success of this strategy is dependent upon data accuracy for the fictional AS64502:AS-CUSTOMERS AS-SET.
Monitoring AS-SET misuse
Besides using AS-SETs to group together one’s downstream customers, AS-SETs can also represent other types of relationships, such as peers, transits, or IXP participations.
For example, there are 76 AS-SETs that directly include one of the Tier-1 networks, Telecom Italia / Sparkle (AS6762). Judging from the names of the AS-SETs, most of them are representing peers and transits of certain ASNs, which includes AS6762. You can view this output yourself at https://radar.cloudflare.com/routing/as6762#irr-as-sets
There is nothing wrong with defining AS-SETs that contain one’s peers or upstreams as long as those AS-SETs are not submitted upstream for customer->provider BGP session filtering. In fact, an AS-SET for upstreams or peer-to-peer relationships can be useful for defining a network’s policies in RPSL.
However, some AS-SETs in the AS6762 membership list such as AS-10099 look to attest customer relationships.
We know AS6762 is transit free and this customer membership must be invalid, so it is a prime example of AS-SET misuse that would ideally be cleaned up. Many Internet Service Providers and network operators are more than happy to correct an invalid AS-SET entry when asked to. It is reasonable to look at each AS-SET membership like this as a potential risk of having higher route leak propagation to major networks and the Internet when they happen.
AS-SET information on Cloudflare Radar
Cloudflare Radar is a hub that showcases global Internet traffic, attack, and technology trends and insights. Today, we are adding IRR AS-SET information to Radar’s routing section, freely available to the public via both website and API access. To view all AS-SETs an AS is a member of, directly or indirectly via other AS-SETs, a user can visit the corresponding AS’s routing page. For example, the AS-SETs list for Cloudflare (AS13335) is available at https://radar.cloudflare.com/routing/as13335#irr-as-sets
The AS-SET data on IRR contains only limited information like the AS members and AS-SET members. Here at Radar, we also enhance the AS-SET table with additional useful information as follows.
Inferred ASN shows the AS number that is inferred to be the creator of the AS-SET. We use PeeringDB AS-SET information match if available. Otherwise, we parse the AS-SET name to infer the creator.
IRR Sources shows which IRR databases we see the corresponding AS-SET. We are currently using the following databases: AFRINIC, APNIC, ARIN, LACNIC, RIPE, RADB, ALTDB, NTTCOM, and TC.
AS Members and AS-SET members show the count of the corresponding types of members.
AS Cone is the count of the unique ASNs that are included by the AS-SET directly or indirectly.
Upstreams is the count of unique AS-SETs that includes the corresponding AS-SET.
Users can further filter the table by searching for a specific AS-SET name or ASN. A toggle to show only direct or indirect AS-SETs is also available.
In addition to listing AS-SETs, we also provide a tree-view to display how an AS-SET includes a given ASN. For example, the following screenshot shows how as-delta indirectly includes AS6762 through 7 additional other AS-SETs. Users can copy or download this tree-view content in the text format, making it easy to share with others.
We built this Radar feature using our publicly available API, the same way other Radar websites are built. We have also experimented using this API to build additional features like a full AS-SET tree visualization. We encourage developers to give this API (and other Radar APIs) a try, and tell us what you think!
Looking ahead
We know AS-SETs are hard to keep clean of error or misuse, and even though Radar is making them easier to monitor, the mistakes and misuse will continue. Because of this, we as a community need to push forth adoption of RFC9234 and implementations of it from the major vendors. RFC9234 embeds roles and an Only-To-Customer (OTC) attribute directly into the BGP protocol itself, helping to detect and prevent route leaks in-line. In addition to BGP misconfiguration protection with RFC9234, Autonomous System Provider Authorization (ASPA) is still making its way through the IETF and will eventually help offer an authoritative means of attesting who the actual providers are per BGP Autonomous System (AS).
If you are a network operator and manage an AS-SET, you should seriously consider moving to hierarchical AS-SETs if you have not already. A hierarchical AS-SET looks like AS13335:AS-CLOUDFLARE instead of AS-CLOUDFLARE, but the difference is very important. Only a proper maintainer of the AS13335 ASN can create AS13335:AS-CLOUDFLARE, whereas anyone could create AS-CLOUDFLARE in an IRR database if they wanted to. In other words, using hierarchical AS-SETs helps guarantee ownership and prevent the malicious poisoning of routing information.
While keeping track of AS-SET memberships seems like a chore, it can have significant payoffs in preventing BGP-related incidents such as route leaks. We encourage all network operators to do their part in making sure the AS-SETs you submit to your providers and peers to communicate your downstream customer cone are accurate. Every small adjustment or clean-up effort in AS-SETs could help lessen the impact of a BGP incident later.
Since launching during Birthday Week in 2020, Radar has announced significant new capabilities and data sets during subsequent Birthday Weeks. We continue that tradition this year with a two-part launch, adding more dimensions to Radar’s ability to slice and dice the Internet.
First, we’re adding regional traffic insights. Regional traffic insights bring a more localized perspective to the traffic trends shown on Radar.
Both features extend Radar’s mission of providing deeper, more granular visibility into the health and security of the Internet. Below, we dig into these new capabilities and data sets.
Introducing regional Internet traffic insights on Radar
However, sometimes Internet usage shifts on a more local level — maybe a sporting event in a particular region drives people online to find out more information. Or maybe a storm or other natural disaster causes infrastructure damage and power outages in a given state, impacting Internet traffic.
For the last few years, the Radar team relied on internal data sets and Jupyter notebooks to visualize these “sub-national” traffic shifts. But today, we are bringing that insight to Cloudflare Radar, and to you, with the launch of regional traffic insights. With this new capability, you’ll be able to see traffic trends at a more local level, including bytes and requests, as well as breakouts of desktop/mobile device and bot/human traffic shares. And for even more granular visibility, within the Data Explorer, you’ll also be able to select an autonomous system to join with the regional selection — for example, looking at AS7922 (Comcast) in Massachusetts (United States).
Geographic guidance
In line with common industry practice, the region names displayed on Radar are sourced in data from GeoNames (geonames.org), a crowdsourced geographical database. Specifically, we are using the “first-order administrative divisions” listed for each country — for example, the states of America, the departments of Honduras, or the provinces of Canada. Those geographical names reflect data provided by GeoNames; for more information, please refer to their About page.
Requests logged by Cloudflare’s services include the IP address of the device making the request. The address range (“prefix”) that includes this address is associated with a GeoNames ID within our IP address geolocation data, and we then match that GeoNames ID with the associated country and “first order administrative division” found in the GeoNames dataset. (For example: 155.246.1.142 → 155.246.0.0/16 → GeoNames ID 5101760 → United States > New Jersey)
Drilling down into Radar traffic data
Within Cloudflare Radar, there are several ways to get to this regional data. If you know the name of the region of interest, you can type it into the search bar at the top of the page, and select it from the results. For example, beginning to type Massachusetts returns the U.S. state, linked to its regional traffic page. Typing the region name into the Traffic in dropdown at the top of a Traffic page will also return the same set of results.
Radar’s country-level pages now have a new Traffic characteristics by region card that includes both summary and time series views of regional traffic. The summary view is presented as a map and table, similar to the Traffic characteristics card in the Worldwide traffic view. After selecting a metric from the dropdown at the top right of the card, the table and map are updated to reflect the relevant summary values for the chosen time period. Within the paginated table, the region names are linked, and clicking one will take you to the relevant page. Within the map, the summary values are represented by circles placed in the centroid of each region, sized in relation to their value. Clicking a circle will take you to the relevant page.
Below the summary map and table, the card also includes a time series graph of traffic at a regional level for the top five highest traffic regions within the country. These graphs can reveal interesting regional differences in traffic patterns. For example, the Traffic volume by region in Iraq graph for HTTP request traffic shown below highlights the differing Internet shutdown schedules (Kurdistan Region, central and southern Iraq) across the different governorates. On days when the schedules do not overlap, such as September 2 and 7, traffic from the Erbil and Sulaymaniyah governorates, which are located in the Kurdistan Region, does not drop concurrent with the loss in traffic observed in Baghdad and Basra.
Mobile vs. desktop device traffic trends
Over the past several years, a number of Radar blog posts have explored how human activity impacts Internet traffic, including holiday celebrations, elections, and the Paris 2024 Summer Olympics. With the new regional views, this impact now becomes even clearer at a more local level. For instance, mobile devices account for, on average, just over half of the request traffic seen from Nairobi Country in Kenya. A clear diurnal pattern is seen on weekdays, where mobile device usage drops during workday hours, and then rises again in the evening. However, during the weekends, mobile traffic remains elevated, presumably due to fewer people using desktop computers in office environments, as well as fewer desktop computers in use at home, in line with Kenya’s mobile-first culture.
Bot vs human traffic trends
Similar to how the mobile vs. desktop view exposes shifts in human activity, bot vs. human traffic insights do as well. One interpretation of the graph below is that overnight bot activity from Lisbon increased significantly during the first few days of September. However, since the graph shows traffic shares, and given the timing of the apparent increases, the more likely cause is increasingly larger drops in human-driven traffic – users in Lisbon appear to begin logging off around 23:00 UTC (midnight local time), and start getting back online around 05:00 UTC (06:00 local time). The shares and shifts will obviously vary by country and region, but they can provide a perspective on the nocturnal habits of users in a region.
Customize regional analysis with Radar’s Data Explorer
Within the Data Explorer, you can use the breakdown options and filters to customize your analysis of regional traffic data.
At a country level, choosing to breakdown by regions generates a stacked area graph that shows the relative traffic shares of the top 20 regions in the selected country, along with a bar graph showing summary share values. For example, the graph below shows that in aggregate, Virginia and California are responsible for just over a quarter of the HTTP request volume in the United States.
You can also use Data Explorer to drill down on traffic at a network (ASN) level in a given region, in both summary and timeseries views. For example, looking at HTTP request traffic for Massachusetts by ASN, we can see that AS7922 (Comcast), accounts for a third, followed by AS701 (Verizon Fios, 15%), AS21928 (T-Mobile, 8.8%), AS6167 (Verizon Wireless, 5.1%), AS7018 (AT&T, 4.7%), and AS20115 (Charter/Spectrum, 4.5%). Over 70% of the request traffic is concentrated in these six providers, with nearly half of that from one provider.
Going a level deeper, you can also look at traffic trends over time for an ASN within a given region, and even compare it with another time period. The graph below shows traffic for AS7922 (Comcast) in Massachusetts over a seven-day period, compared with the prior week. While the traffic volumes on most days were largely in line with the previous week, Saturday and Sunday were noticeably higher. These differences may reflect a shift in human activity, as September 6 & 7 were quite rainy in Massachusetts, so people may have spent more time indoors and online. (The prior weekend was Labor Day weekend, but those Saturday and Sunday traffic levels were in line with the preceding weekend.) You can also add another ASN to the traffic trends comparison. Selecting Massachusetts (Location) and AS701 (ASN) (Verizon Fios) in the Compare section finds that traffic on that network was higher on Saturday and Sunday as well, lending credence to the rainy weekend theory.
Regional comparisons, whether within the same country or across different countries, are also possible in Data Explorer. For instance, if the Kansas City Chiefs and Philadelphia Eagles were to meet yet again in the Super Bowl, the configuration below could be used to compare traffic patterns in the teams’ respective home states, as well as comparing the trends with the previous week, showing how human activity impacted it over the course of the game.
As always, the data powering the visualizations described above are also available through the Radar API. The timeseries_groups and summary methods for the NetFlows and HTTP endpoints now have an ADM1 dimension, allowing traffic to be broken down by first-order administrative divisions. In addition, the new geoId filter for the NetFlows and HTTP endpoints allows you to filter the results by a specific geolocation, using its GeoNames ID. And finally, there are new get and list endpoints for fetching geolocation details.
A note regarding data quantity and quality
As you’d expect, the more traffic we see from a given geography, the better the “signal”, and the clearer the associated graph is — this is generally the case when traffic is aggregated at a country level. However, for some smaller or less populous regions, especially in developing countries or countries with poor Internet connectivity, lower traffic will likely cause the signal to be weaker, resulting in graphs that appear spiky or incomplete. (Note that this will also be true for region+ASN views.) An illustrative example is shown below, for Northern Darfur State in Sudan. Traffic is observed somewhat inconsistently, resulting in the spikes seen in the graph. Similarly, the “Previous 7 days” line is largely incomplete, indicating a lack of traffic data for that period. In these cases, it will be hard to draw definitive conclusions from such graphs.
Although the Internet arguably transcends geographical boundaries, the reality is that usage patterns can vary by location, with traffic trends that reflect more localized human activity. The new regional insights on Cloudflare Radar traffic pages, and in the Data Explorer, provide a perspective at a sub-national level. We are exploring the potential to go a level deeper in the future, providing traffic data for “second-order administrative divisions” (such as counties, cities, etc.).
If you share our regional traffic graphs on social media, be sure to tag us: @CloudflareRadar (X), noc.social/@cloudflareradar (Mastodon), and radar.cloudflare.com (Bluesky). If you have questions or comments, you can reach out to us on social media, or contact us via email.
Introducing Certificate Transparency insights on Radar
Just as we’re bringing more granular detail to traffic patterns, we’re also shedding more light on the very foundation of trust on the Internet: TLS certificates. Certificate Authorities (CAs) serve as trusted gatekeepers for the Internet: any website that wants to prove its identity to clients must present a certificate issued by a CA that the client trusts. But how do we know that CAs themselves are trustworthy and only issue certificates they are authorized to issue?
That’s where Certificate Transparency (CT) comes in. Clients that enforce CT (most major browsers) will only trust a website certificate if it is both signed by a trusted CA and has proof that the certificate has been added to a public, append-only CT log, so that it can be publicly audited. Only recently, CT played a key role in detecting the unauthorized issuance of certificates for 1.1.1.1, a public DNS resolver service that Cloudflare operates.
In addition to its role as a vital safety mechanism for the Internet, CT has proven to be invaluable in other ways, as it provides publicly-accessible lists of all website certificates used on the Internet. This dataset is a treasure trove of intelligence for researchers measuring the Internet, security teams detecting malicious activity like phishing campaigns, or penetration testers mapping a target’s external attack surface.
The sheer amount of data (multiple terabytes) available in CT makes it difficult for regular Internet users to download and explore themselves. Instead, services like crt.sh, Censys, and Merklemap provide easy search interfaces to allow discoverability for specific domain names and certificates. We launchedMerkle Town in 2018 to share broad insights into the CT ecosystem using data from our own CT monitoring service.
Certificate Transparency on Cloudflare Radar is the next evolution of Merkle Town, providing integration with security and domain information already on Radar and more interactive ways to explore and analyze CT data. (For long-time Merkle Town users, we’re keeping it around until we’ve reached full feature parity.)
In the sections below, we’ll walk you through the features available in the new dashboard.
Certificate volume and characteristics
The CT page leads with a view of how many certificates are being issued and logged over time. Because the same certificate can appear multiple times within a single log or be submitted to several logs, the total count can be inflated. To address this, two distinct lines are shown: one for total entries and another for unique entries. Uniqueness, however, is calculated only within the selected time range — for example, if certificate C is added to log A in one period and to log B in another, it will appear in the unique count for both periods. It is also important to note that the CT charts and date filters use the log timestamp, which is the time a certificate was added to a CT log. Additionally, the data displayed on the page was collected from the logs monitored by Cloudflare — delays, backlogs, or other inconsistencies may exist, so please report any issues or discrepancies.
Alongside this chart is a comparison between certificates and pre-certificates. A pre-certificate is a special type of certificate used in CT that allows a CA to publicly log a certificate before it is officially issued. CAs are not required to log full certificates if corresponding pre-certificates have already been logged (although many CAs do anyway), so typically there are more pre-certificates logged than full certificates, as seen in the chart.
While certificate issuance trends are interesting on their own, analyzing the characteristics of issued certificates provides deeper insight into the state of the web’s trust infrastructure. Starting with the public key algorithm, which defines how secure connections are established between clients and servers, we found that more than 65% of certificates still use RSA, while the remainder use ECDSA. RSA remains dominant due to its long-standing compatibility with a wide range of clients, while ECDSA is increasingly adopted for its efficiency and smaller key sizes, which can improve performance and reduce computational overhead. In the coming years, we expect post-quantum signature algorithms like ML-DSA to appear when public CAs begin to offer support.
Next, a breakdown of certificates by signature algorithm reveals how Certificate Authorities (CAs) sign the certificates they issue. Most certificates (over 65%) use RSA with SHA-256, followed by ECDSA with SHA-384 at 19%, ECDSA with SHA-256 at 12%, and a small fraction using other algorithms. The choice of signature algorithm reflects a balance between widespread support, security, and performance, with stronger algorithms like ECDSA gradually gaining traction for modern deployments.
Certificates are also categorized by validation level, which reflects the degree to which the CA has verified the identity of the certificate requester. The main validation types are Domain Validation (DV), Organization Validation (OV), and Extended Validation (EV). DV certificates verify only control of the domain, OV certificates verify both domain control and the organization behind it, and EV certificates involve more rigorous checks and display additional identity information in browsers. The industry trend is toward simpler, automated issuance, with DV certificates now making up almost 98% of issued certificates, while EV issuance has become largely obsolete.
Finally, the chart on certificate duration shows the difference between the NotBefore and NotAfter dates embedded in each certificate, which define the period during which the certificate is valid. Currently, the majority (92%) of issued certificates have durations between 47 and 100 days. Shorter certificate lifetimes improve security by limiting exposure if a certificate is compromised, and the industry is moving toward even shorter durations, driven by browser policies and automated renewal systems.
Certificate issuance
Certificate issuance is the process by which CAs generate certificates for domain owners. Many CAs are operated by larger organizations that manage multiple subordinate CAs under a single corporate umbrella. The CT page highlights the distribution of certificate issuance across the top CA owners. At the moment, the Internet Security Research Group (ISRG), also known as Let’s Encrypt, issues more than 66% of all certificates, followed by other widely used CA owners including Google Trust Services, Sectigo, and GoDaddy.
The impact of events like the July 21-22 Let’s Encrypt API outage due to internal DNS failures that significantly reduced certificate issuance rates are visible in this visualization, as issuance rates dropped significantly during the two-day period.
In addition to CA owners, the page provides a breakdown of certificate issuance by individual CA certificates. Among the top five CAs, Let’s Encrypt’s four intermediate CAs — R12, R13, E7, and E8 — represent the bulk of its issuance. The bar chart can also be filtered by CA owner to display only the certificates associated with a specified organization.
The CT section also offers dedicated CA-specific pages. By searching for a CA name or fingerprint in the top search bar, you can reach a page showing all insights and trends available on the main CT page, filtered by the selected CA. The page also includes an additional CA information card, which provides details such as the CA’s owner, revocation status, parent certificate, validity period, country, inclusion in public root stores, and a list of all CAs operated by the same owner. All of this information is derived from the Common CA Database (CCADB).
Certificate Transparency logs
Next on the CT page is a section focused on CT logs. This section shows the distribution of certificates across CT log operators, identifying the organizations that manage the infrastructure behind the logs. Over the last three months, Sectigo operated the logs containing the largest number of certificates (2.8 billion), followed by Google (2.5 billion), Cloudflare (1.6 billion), and Let’s Encrypt (1.4 billion). Note that the same certificate can be logged multiple times across CT logs, so organizations that operate multiple CT logs with overlapping acceptance criteria may log certificates at an elevated rate. As such, the relative rank of the operators in this graph should not be construed as a measure of how load-bearing the logs are within the ecosystem.
Below this, a bar chart displays the distribution of certificates across individual CT logs. Among the top five logs are Google’s xenon2025h1 and argon2025h2, Cloudflare’s nimbus2025, and Let’s Encrypt’s oak2025h2. This chart can also be filtered by operator to show only the logs associated with a specific owner. Next to the chart, another view shows the distribution of certificates by log API, distinguishing between logs following the original RFC 6962 API versus those compatible with the newer and more efficient static CT API.
Similar to the dedicated CA pages, the CT section also provides log-specific pages. By searching for a log name in the top search bar, you can access a page showing all insights and trends available on the main CT page, filtered by the selected log. Two additional cards are included: one showing information about the log, derived from Google Chrome’s log list, including details such as the operator, API type, documentation, and a list of other logs operated by the same organization; and another displaying performance metrics with two radar charts tracking uptime and response time over the past 90 days, as observed by Cloudflare’s CT monitor. These metrics are useful to determine if logs are meeting the ongoing requirements for inclusion in CT programs like Google’s.
Certificate coverage
Last but not least, the CT page includes a section on certificate coverage. Certificates can cover multiple top-level domains (TLDs), include wildcard entries, and support IP addresses in Subject Alternative Names (SANs).
Next to this view, two half-donut charts provide further insights into certificate coverage: one shows the share of certificates that include wildcard entries — almost 25% of certificates use wildcards to cover multiple subdomains — while the other shows certificates that include IP addresses, revealing that the vast majority of certificates do not contain IPs in their SAN fields
Expanded domain certificate data
The domain information page has also been updated to provide richer details about certificates. The certificates table, which displays certificates recorded in active CT logs for the specified domain, now includes expandable rows. Expanding a row reveals further information, including the certificate’s SHA-256 fingerprint, subject and issuer details — Common Name (CN), Organization (O), and Country (C) — the validity period (NotBefore and NotAfter), and the CT log where the certificate was found.
While the charts above highlight key insights in the CT ecosystem, all underlying data is accessible via the API and can be explored interactively across time periods, CAs, logs, and additional filters and dimensions using Radar’s Data Explorer. And as always, Radar charts and graphs can be downloaded for sharing or embedded directly into blogs, websites, and dashboards for further analysis. Don’t hesitate to reach out to us with feedback, suggestions, and feature requests — we’re already working through a list of early feedback from the CT community!
In 2025, Generative AI is reshaping how people and companies use the Internet. Search engines once drove traffic to content creators through links. Now, AI training crawlers — the engines behind commonly-used LLMs — are consuming vast amounts of web data, while sending far fewer users back. We covered this shift, along with related trends and Cloudflare features (like pay per crawl) in early July. Studies from Pew Research Center (1, 2) and Authoritas already point to AI overviews — Google’s new AI-generated summaries shown at the top of search results — contributing to sharp declines in news website traffic. For a news site, this means lots of bot hits, but far fewer real readers clicking through — which in turn means fewer people clicking on ads or chances to convert to subscriptions.
Cloudflare’s data shows the same pattern. Crawling by search engines and AI services surged in the first half of 2025 — up 24% year-over-year in June — before slowing to just 4% year-over-year growth in July. How is the space evolving? Which crawling purposes are most common, and how is that changing? Spoiler: training-related crawling is leading the way. In this post, we track AI and search bot crawl activity, what purposes dominate, and which platforms contribute the least referral traffic back to creators.
Key takeaways
Training crawling grows: Training now drives nearly 80% of AI bot activity, up from 72% a year ago.
Publisher referrals drop: Google referrals to news sites fell, with March 2025 down ~9% compared to January.
AI & search crawling increase: Crawling rose 32% year-over-year in April 2025, before slowing to 4% year-over-year growth in July.
AI-only crawler shifts: OpenAI’s GPTBot more than doubled in share of AI crawling traffic (4.7% to 11.7%), Anthropic’s ClaudeBot rose (6% to ~10%), while ByteDance’s Bytespider fell from 14.1% to 2.4%.
Crawl-to-refer imbalance (how many pages a bot crawls per page that a user clicks back to): Anthropic increased referrals but still leads with 38,000 crawls per visitor in July (down from 286,000:1 in January). Perplexity decreased referrals in 2025 — with more crawling but fewer referrals at 194 crawls per visitor in July.
Referral traffic from search is already shifting, as we noted above and as studies have shown. In our dataset of news-related customers (spanning the Americas, Europe, and Asia), Google’s referrals have been clearly declining since February 2025. This drop is unusual, since overall Internet traffic (and referrals as well) historically has only dipped during July and August — the summer months when the Northern Hemisphere is largely on break from school or work. The sharpest and least seasonal decline came in March. Despite being a 31-day month, March had almost the same referral volume as the shorter, 28-day February.
Looking at longer comparisons: March 2025 referral traffic from Google was 9% lower than January, the same drop seen in June. April was worse, down 15% compared with January.
This drop seems to coincide with some of Google’s changes. AI Overviews launched in the U.S. in May 2024, but in March 2025, Google upgraded AI Overviews with Gemini 2.0, introduced AI Mode in Labs, and expanded Overviews to more European countries. By May 2025, AI Mode rolled out broadly in the U.S. with Gemini 2.5, adding conversational search, Deep Search, and personalized recommendations.
The search-to-news site pipeline seems to be weakening, replaced in part by AI-driven results.
Looking at a daily perspective, we can also spot a clear U.S.-election-related peak in referrals from Google to the cohort of known news sites on November 5–6, 2024.
AI and search crawling: spring surge (+24%), summer slowdown
In June, we talked about search and AI crawler growth, and our picture of the trend is now more complete with more data. To focus only on AI and search crawlers, and to remove the bias of customer growth, we analyzed a fixed set of customers from specific weeks, a method we’ve also used in the Cloudflare Radar Year in Review.
What the data shows: crawling spiked twice: first in November 2024, then again between March and April 2025. April 2025 alone was up 32% compared with May 2024, the first full month where we have comparable data. After that surge, growth stabilized. In June 2025, crawling traffic was still 24% higher year-over-year, but by July the increase was down to just 4%. That shift highlights how quickly crawler activity can accelerate and then cool down.
As the chart below shows, crawling traffic rose sharply in March and April. It remained high but slightly lower in May, before starting to drop in June. The seasonal dip is similar to what we see in overall Internet traffic during the Northern Hemisphere’s summer months (August and September are often the quietest), though in the case of crawlers, this is likely due to reduced overall web activity rather than bots themselves taking a “break.” Historically, activity tends to rise again in November — as it did in 2024 for AI and search bot traffic — when people spend more time online for shopping and seasonal habits (a pattern we’ve seen in past years).
Googlebot is still the anchor, accounting for 39% of all AI and search crawler traffic, but the fastest growth now comes from AI-specific crawlers, though bots related to Amazon and ByteDance (Bytespider) have lost significant ground. GPTBot’s share grew from 4.7% in July 2024 to 11.7% in July 2025. ClaudeBot also increased, from 6% to nearly 10%, while Meta’s crawler jumped from 0.9% to 7.5%. By contrast, Amazonbot dropped from 10.2% to 5.9%, and ByteDance’s Bytespider dropped from 14.1% to just 2.4%.
The table below shows how market shares have shifted between July 2024 and July 2025:
Bot name
% share July 2024
% share July 2025
Δ percentage-point change
1
Googlebot
37.5
39
1.5
2
GPTBot
4.7
11.7
7
3
ClaudeBot
6
9.9
3.9
4
Bingbot
8.7
9.3
0.6
5
Meta-ExternalAgent
0.9
7.5
6.5
6
Amazonbot
10.2
5.9
-4.3
7
Googlebot-Image
4.1
3.3
-0.8
8
Yandex
5
2.9
-2.1
9
GoogleOther
4.6
2.7
-1.8
10
Bytespider
14.1
2.4
-11.6
11
Applebot
1.8
1.5
-0.3
12
ChatGPT-User
0.1
0.9
0.9
13
OAI-SearchBot
0
0.9
0.9
14
Baiduspider
0.5
0.5
0
15
Googlebot-Mobile
0.2
0.4
0.2
AI-only crawlers: OpenAI rises, ByteDance falls
Looking only at AI bot traffic (as tracked on our Radar AI page), the trend is clear. Since January 2025, GPTBot has steadily increased its crawling volume, driven mainly by training-related activity. ClaudeBot crawling accelerated in June, while Amazonbot and Bytespider activity slowed.
The chart below shows how GPTBot surged over the past 12 months, overtaking Amazonbot and Bytespider, which both fell sharply:
A comparison between July 2024 and July 2025 makes the shift even more obvious. GPTBot gained 16 percentage points, Meta’s crawler rose by more than 15, and ClaudeBot grew by 8. On the shrinking side, Amazonbot dropped 12 percentage points and Bytespider dropped over 31 percentage points.
AI-only bots
July 2024 %
July 2025 %
Δ percentage-point change
1
GPTBot
11.9
28.1
16.1
2
ClaudeBot
15
23.3
8.3
3
Meta-ExternalAgent
2.4
17.7
15.3
4
Amazonbot
26.4
14.1
-12.3
5
Bytespider
37.3
5.8
-31.5
6
Applebot
4.9
3.7
-1.2
7
ChatGPT-User
0.2
2.4
2.2
8
OAI-SearchBot
0
2.2
2.2
9
TikTokSpider
0
0.7
0.7
10
imgproxy
0
0.7
0.7
11
PerplexityBot
0
0.4
0.4
12
Google-CloudVertexBot
0
0.3
0.3
13
AI2Bot
0
0.2
0.2
14
Timpibot
0.6
0.1
-0.5
15
CCBot
0.1
0.1
0
We covered the functionality of these bots in our June blog post.
Crawling by purpose: training dominates
Training is the clear leader. (We classify purpose based on operator disclosures and industry sources, a method we explained in this AI Week blog.) Over the past 12 months, 80% of AI crawling was for training, compared with 18% for search and just 2% for user actions. In the last six months, the share for training rose further to 82%, while search dropped to 15% and user actions increased slightly to 3%.
The chart below shows how training-related crawling steadily grew over the past year, far outpacing other purposes:
The year-over-year comparison reinforces this trend. In July 2024, training accounted for 72% of AI crawling. By July 2025, it had risen to 79%. Over the same period, search fell from 26% to 17%, while user actions grew modestly from 2% to 3.2%.
Crawl-to-refer ratios shifts: tens of thousands of bot crawls per human click
The crawl-to-refer ratio measures how many pages a platform crawls compared with how often it drives users to a website. In practice, a high ratio means heavy crawling but little referral traffic. For example, for every visitor Anthropic refers back to a website, its crawlers have already visited tens of thousands of pages.
Why does this metric matter? It highlights the imbalance between how much content AI systems consume and how little traffic they return. For publishers, it can feel like giving away the raw material for free. With that in mind, here’s how different platforms compare from January to July 2025.
Anthropic remains the most crawl-heavy platform. Even after an 87% decline this year, it still crawled 38,000 pages for every referred page visit in July 2025 — the highest imbalance among major AI players. Referrals may be improving, though, after Anthropic added web search to Claude in March 2025 (initially for U.S. paid users) and expanded it globally by May to all users, including the free tier. The feature introduced direct citations with clickable URLs, creating new referral pathways.
The full dataset is below, showing January–July 2025 ratios by platform ordered by the highest ratio average:
(Note: a rising ratio means more bot crawling per human click sent back, while a falling ratio means less bot crawling per human click sent back)
Anthropic recorded the steepest decrease in bot to human traffic, down 86.7%. From 286,930 bots per human in January, to 38,065 bots per human in July, the change shows a dramatic increase in referrals. Despite the change, it remains by far the most crawl-heavy platform, with tens of thousands of pages still crawled for every referral.
Perplexity moved in the opposite direction, with bot crawling increasing +256.7% relative to human visitors; climbing from 54 bots per human in January to 195 bots per human in July. While the ratio is still far below Anthropic, the increase shows it is crawling more heavily, relative to the traffic it refers, than it did earlier.
OpenAI ratio dropped slightly, from 1,217 bots per human in January to 1,091 in July (-10%). The shift is smaller than Anthropic’s but suggests OpenAI is sending a bit more referral traffic relative to its crawling.
Microsoft stayed steady, with its ratio moving only slightly, from 38.5 bots per human in January to 40.7 in July (+6%). This consistency suggests stable behavior from Bing-linked services.
Yandex increased from 15.5 bots per human in January to 21.4 in July (+38%). The overall ratio is far smaller than Anthropic’s or Perplexity’s, but it shows Yandex is crawling more heavily relative to the traffic it sends back.
Alongside measuring crawling volumes and referral traffic (now also visible on the AI Insights page of Cloudflare Radar), it’s worth looking at whether AI operators follow good practices when deploying their bots. Cloudflare data shows that most leading AI crawlers are on our verified bots list, meaning their IP addresses match published ranges and they respect robots.txt. But adoption of newer standards like WebBotAuth — which uses cryptographic signatures in HTTP messages to confirm a request comes from a specific bot, and is especially relevant today — is still missing.
Google, Meta, and OpenAI run distinct bots for different purposes, while Anthropic lags in verification. That makes it easier for bad actors to spoof its crawler and ignore robots.txt, since without verification, it’s hard to distinguish real from fake traffic — leaving its compliance effectively unclear. (A longer list of AI bots is available here).
Conclusion and what’s next
If training-related crawling continues to dominate while referrals stay flat, creators face a paradox: feeding AI systems without gaining traffic in return. Many want their content to appear in chatbot answers, but without monetization or cooperation, the incentive to produce quality work declines.
The Web now stands at a fork in the road. Either a new balance emerges — one where the new AI era helps sustain publishers and creators — or AI turns the open web into a one-way training set, extracting value with little flowing back.
You can learn more about some of these data trends on Cloudflare Radar’s updated AI Insights page.
On July 31, 2025, just as Portugal entered the peak of another intense wildfire season, João Pina, also known as Tomahock, received an automated alert from Cloudflare. His volunteer-run project, fogos.pt, now a trusted source of real-time wildfire information for millions across Portugal, was under attack.
One of the several alerts fogos.pt received related to the DDoS attack
What started in 2015 as a late-night side project with friends around a dinner table in Aveiro has grown into a critical public resource. During wildfires, the site is where firefighters, journalists, citizens, and even government agencies go to understand what’s happening on the ground. Over the years, fogos.pt has evolved from parsing PDFs into visual maps to a full-featured app and website with historical data, weather overlays, and more. It’s also part of Project Galileo, Cloudflare’s initiative to protect vulnerable but important public interest sites at no cost.
Wildfires are not just a Portuguese challenge. They are frequent across southern Europe (Spain, Greece, currently also under alert), California, Australia, and in Canada, which in 2023 faced record-setting fires. In all these cases, reliable information can be crucial, sometimes life-saving. Other organizations offering similar public services can also apply to join Project Galileo to receive protection and handle heavy traffic.
A side project that became a national reference
Fogos.pt began with a simple question: why was fire data only available in hard-to-read PDF documents? João and a group of friends, including volunteer firefighters, decided to build something better. They pulled the data, geolocated the fire reports, and visualized them on a map.
Soon, thousands of people were using it. Then tens of thousands. Today, fogos.pt is integrated into official communications, including mentions from the Portuguese government on social media and direct links from the national wildfire information portal (SGIFR.gov.pt).
In 2018, fogos.pt formally joined forces with VOST Portugal, a digital volunteer organization that was early on also part of our Project Galileo — whose story was also featured in an earlier case study. João Pina is also a co-founder of VOSTPT. Together, they created a complementary model: fogos.pt provides data and the platform; VOSTPT validates and communicates it to the public in real-time during emergencies.
It’s an operation run entirely by volunteers, with no funding, no formal team — just passion, and the help of partners.
Homepage of fogos.pt on August 20, 2025, highlighting a major wildfire near Piódão in central Portugal.
Under attack during fire season
On July 31 and August 1, 2025, two Distributed Denial of Service (DDoS) attacks targeted fogos.pt. Cloudflare automatically detected and mitigated both attacks.
July 31 attack:
• Duration: 7 minutes
• Peak: 33,000 requests per second at 11:27 UTC
• Bandwidth: 1.7 Gbps (Max)
How the attack looks like in requests per second:
August 1 attack:
• Duration: 5 minutes
• Peak: 31,000 requests per second at 10:24 UTC
• Bandwidth: 849 Mbps (Max)
How the attack looks like in requests per second from our perspective:
By Cloudflare’s standards, these were small. For comparison, last year we mitigated an attack exceeding 700,000 requests per second against a high-profile US election campaign site. But for an civic project like fogos.pt, even tens of thousands of requests per second — if unprotected — can be enough to take services offline at the worst possible time.
Attackers typically use three main methods for DDoS attacks:
IoT devices: hacked cameras, routers, or smart gadgets sending traffic.
Proxies: open or misconfigured servers, residential proxy networks, or anonymity tools that hide attackers’ IPs.
Cloud machines: compromised or rented servers from cloud providers.
The July 31 attack likely relied on open proxies, with much of the traffic arriving unencrypted (a common sign of proxy-based attacks). The August 1 attack, in contrast, came largely from cloud machines, matching patterns we see from botnets that exploit cloud infrastructure.
These attacks were blocked without disruption. Cloudflare’s autonomous mitigation systems kicked in, and email alerts were automatically sent to João and the team. No downtime, no manual intervention required.
The role of Project Galileo: traffic surges
Fogos.pt has used Cloudflare’s free services since the beginning, starting with DNS and gradually expanding to DDoS mitigation, caching, rate limiting, and more. The site joined Project Galileo, which protects journalists, human rights defenders, and public service projects, to get stronger, upgraded features and service at no cost.
“Without Cloudflare, the site would have gone down many times during fire season,” says João Pina. “We use almost every product — but protection against attacks is critical.”
August 11, 2025, detail the area of interest of a wildfire in central Portugal.
Traffic to fogos.pt surges when wildfires hit the news or get mentioned by authorities. These spikes can bring tens of thousands of visitors per day. And as attention grows, so does the risk. Attacks can be used to silence or disrupt critical services, or simply as distractions for more malicious activity. In August 2025, the site often had close to 60,000 people browsing at the same time, with around 40,000 being the norm across the web and app services.
In just two weeks (with an August 15 peak of almost 70 million requests), fogos.pt handled over 550 million requests (more than 25 million per day) 9 TB of data transfer, nearly 100 million page views, 15 million visits, and 240 million API calls. A massive load for a volunteer-run project, as the next screenshot from the fogos.pt team shows:
In a time when timely wildfire updates can mean the difference between safety and danger, keeping the site online is essential.
Built by community, supported by allies
Fogos.pt is a reminder of what’s possible when public service meets technology, and why we launched Project Galileo: to protect the digital infrastructure that keeps people informed and safe. Built with no formal funding or full-time team, it runs on volunteers, partners, and a shared sense of purpose, an authenticity that João Pina believes is why it works, and why it matters.
And while this story is about Portugal, wildfires are a global challenge. Other organizations providing critical public services can also apply to join Project Galileo and receive this protection.
From a dinner-table idea by an engineer to critical national infrastructure, fogos.pt shows the Internet at its best. Cloudflare is proud to help protect it.
Cloudflare’s network currently spans more than 330 cities in over 125 countries, and we interconnect with over 13,000 network providers in order to provide a broad range of services to millions of customers. The breadth of both our network and our customer base provides us with a unique perspective on Internet resilience, enabling us to observe the impact of Internet disruptions at both a local and national level, as well as at a network level.
As we have noted in the past, this post is intended as a summary overview of observed and confirmed disruptions, and is not an exhaustive or complete list of issues that have occurred during the quarter. A larger list of detected traffic anomalies is available in the Cloudflare Radar Outage Center. Note that both bytes-based and request-based traffic graphs are used within the post to illustrate the impact of the observed disruptions — the choice of metric was generally made based on which better illustrated the impact of the disruption.
In our Q1 2025 summary post, we noted that we had not observed any government-directed Internet shutdowns during the quarter. Unfortunately, that forward progress was short-lived — in the second quarter of 2025, we observed shutdowns in Libya, Iran, Iraq, Syria, and Panama. The Internet’s reliance on a stable electric grid was made abundantly clear during the quarter, with a massive power outage impacting Spain and Portugal disrupting connectivity within those countries. Fiber optic cable cuts impacted providers in Haiti and Malawi, major North American providers saw technical problems disrupt Internet traffic, and a Russian provider was once again targeted by a significant cyberattack, knocking the network offline. Unfortunately, official attribution of an Internet outage’s root cause isn’t always available — and we observed several significant, yet unexplained, Internet outages during the quarter.
Government-directed shutdowns
Libya
On May 16, Internet disruptions were observed across multiple Libyan network providers, with connectivity reportedly shut down in response to public protests against the Government of National Unity. Starting at 13:30 UTC (15:30 local time), traffic dropped by more than 50% as compared to the prior week at Libyan International Company for Technology (AS329129), Giga Communication (AS328539), Aljeel Aljadeed for Technology (AS37284), and Awal Telecom (AS328733), with the latter experiencing a complete outage. Lower traffic volumes were observed until around 00:00 UTC (02:00 local time), with traffic restoration occurring within an hour or so on either side. Giga Communication (AS328539) experienced a second disruption on May 17 between 02:00 – 11:30 UTC (04:00 – 13:30 local time).
Iran
Multiple Internet shutdowns occurred in Iran in June following Israel’s initial attacks on the country’s nuclear sites. The first, on June 13, occurred between 07:15 – 09:45 UTC (10:45 – 13:15 local time). Iran’s Ministry of Communications issued a statement that announced the shutdown: “In light of the country’s special circumstances and based on the measures taken by the competent authorities, temporary restrictions have been imposed on the country’s Internet. It is obvious that these restrictions will be lifted once normal conditions are restored.” This shutdown order impacted network providers including FanapTelecom (AS24631), Rasana (AS205647 and AS31549), MCCI (AS197207), and TCI (AS58224), as well as others.
Just a day later, on June 18, an extended third shutdown was put into place, this one lasting from 12:50 UTC (16:20 local time) through 05:00 UTC (08:30 local time) on June 25. Once again, the shutdown was reportedly implemented as a means of protecting against cyberattacks, with a government spokesperson commenting “We have previously stated that if necessary, we will certainly switch to a national internet and restrict global internet access. Security is our main concern, and we are witnessing cyberattacks on the country’s critical infrastructure and disruptions in the functioning of banks. Many of the enemy’s drones are managed and controlled via the internet, and a large amount of information is exchanged this way. A cryptocurrency exchange was also hacked, and considering all these issues, we have decided to impose Internet restrictions.” This shutdown resulted in a near-complete loss of traffic through 02:00 UTC (05:30 local time) on June 21, when some traffic recovery was observed, though at levels remaining well-below pre-shutdown volumes. Traffic from this partial recovery settled into a consistent cycle for several days, until returning to expected levels on June 25. The same network providers impacted by the previous shutdowns were affected by this one as well.
Iraq
Consistent with measures taken over the past several years (2024, 2023, 2022), governments in Iraq again implemented regular Internet shutdowns in an effort to prevent cheating on national exams. (We say “governments” here because the shutdowns took place both in the main part of the country and in the Iraqi Kurdistan region in the northern part of the country.)
As Iraq does, Syria also implements nationwide Internet shutdowns to prevent cheating on exams, and has been doing so for several years (2021, 2022, 2023, 2024). However, in contrast to previous years, in 2025, the government only ordered the cutoff of cellular connectivity, with a published statement noting (translated) “As part of our commitment to ensuring the integrity of public examinations and safeguarding the future of our dear students, and based on our national responsibility to secure a fair and transparent examination environment, a temporary cellular communications blackout will be implemented in areas near examination centers across the Syrian Arab Republic. … The cellular communications blackout will be implemented exclusively within the narrowest possible geographical and timeframe, during the time students are in exam halls.”
During the second quarter, the shutdowns associated with the “Basic Education Certificate” took place on June 21, 24, and 29 between 05:15 – 06:00 UTC (08:15 – 09:00 local time). Exams and associated shutdowns for the “Secondary Education Certificate” are scheduled to take place between July 12 and August 3.
Because these shutdowns only impacted mobile connectivity, they only resulted in a partial drop in announced IP address space, as opposed to a more complete loss as seen in previous years.
Panama
On June 21, an X post from ASEP Panamá (the telecommunications regulating agency) announced that (translated) “…in compliance with Cabinet Decree No. 27 of June 20, 2025, and by formal instruction from the Ministry of Government, the temporary suspension of mobile telephony and residential internet services in the province of Bocas del Toro has been coordinated.” The suspension, according to the post, was supposed to be in place until June 25, however a subsequent X post noted that it would be extended until Sunday, June 29, 2025.
The suspension of Internet connectivity was implemented in response to protests and demonstrations against reforms to the Social Security Fund, retirement, and pensions, specifically in the province of Bocas del Toro.
The graph below shows an effective loss of traffic from Cable Onda (AS18809) in Bocas Del Toro, Panama around 03:30 UTC on June 21 (22:30 local time on June 20), recovering around 06:00 UTC (01:00 local time) on June 30. The recovery is in line with the final related X post from ASEP, which noted (translated) “… Internet and cellular telephone services in the province of Bocas del Toro have been restored as of 12:01 a.m. on Monday, June 30…”.
In Portugal, Internet traffic dropped as the power grid failed — when compared with the previous week, traffic fell ~50 % immediately and within five hours it was ~90% below the week before.
In Spain, Internet traffic dropped as the power grid failed, with traffic immediately dropping by around 60% as compared to the previous week, falling to approximately 80% below the previous week within the next five hours.
In both countries, traffic returned to expected levels around 01:00 local time (midnight UTC) on April 29. More details about the outage can be found in the blog post linked above.
Morocco
It appears that Morocco may have also been impacted in some fashion by the Portugal/Spain power outage, or at least Orange Maroc was. In a post on X, the provider stated (translated) “Internet traffic has been disrupted following a massive power outage in Spain and Portugal, which is affecting international connections.” Traffic from the network (AS36925) fell sharply around 12:00 UTC (13:00 local time), 90 minutes after the power outage began, with a full outage beginning around 15:00 UTC (16:00 local time). Traffic returned to expected levels around 23:30 UTC on April 28 (00:30 local time on April 29).
Puerto Rico
Genera PR, a power company in Puerto Rico, posted on X on April 16 that they had (translated) “…experienced a massive power outage across the island due to the unexpected shutdown of all generating plants, including those of Genera PR and other private generators. This situation has caused a significant disruption to electrical service…” Luma Energy, the private power company that is responsible for power distribution and power transmission in Puerto Rico, published their own X post that stated (translated) “Approximately at 12:40pm, an event was recorded that affects the service island-wide.”
Although the reported power outage was “massive” and “island-wide”, it did not have an outsized impact on Puerto Rico’s Internet traffic, which initially dropped by about 40%. Over the next several days, both companies published multiple updates to their X accounts detailing the progress being made in restoring service. By 15:00 UTC (11:00 local time) on April 18, traffic had returned to expected levels, in line with a post from Luma Energy that noted (translated) “As of 10:00 a.m. on April 18, and thanks to LUMA’s extraordinary response and the tireless efforts of the island’s workforce—in coordination with the Puerto Rico government and generating companies—LUMA has restored electric service to 1,450,367 customers, representing 98.8% of total customers, in less than 38 hours since the island-wide outage began.”
As seen in the graphs below, the power outage not only impacted end-user connectivity, driving the observed drop in traffic, but also had some impact on local Internet infrastructure, with some disturbance visible to announced IP address space.
Saint Kitts and Nevis
A Facebook post from SKELEC (The St. Kitts Electricity Company) on May 9 alerted customers on St. Kitts and Nevis that “…a fault developed at our Needsmust Power Plant resulting in an island wide outage. Restoration has begun, and complete restoration will be in two hours.” The post was published at 17:31 UTC (13:31 local time), approximately 30 minutes after the island’s Internet traffic initially dropped. Traffic recovery initially began around 17:45 UTC (13:45 local time), well within the two-hour estimate for complete power restoration. However, Internet traffic did not fully return to expected levels until 20:15 UTC (16:15 local time).
North Macedonia
On May 18, it was reported that “High voltages in the regional 400 kV network amid low consumption caused a short-term outage in North Macedonia‘s 110 kV transmission network…”, according to state-owned power company MEPSO. While the outage reportedly impacted most of the country, MEPSO also noted that the country’s power supply was normalized within an hour after the outage began. Although brief, the power outage caused the country’s Internet traffic to drop by nearly 60% as compared to the previous week during the disruption, which occurred between 03:00 – 04:45 UTC (05:00 – 06:45 local time).
Maldives
On June 1, Internet traffic in the Maldives dropped by nearly half as compared to the previous week when a widespread power outage affected the Greater Malé region. Local Internet service providers including Ooredoo and Dhiraagu took to social media to warn subscribers of potential interruptions to both fixed and mobile broadband connections. At a country level, Internet traffic was disrupted between 07:30 – 13:00 UTC (12:30 – 18:00 local time).
The power outage also had a nominal impact on Internet infrastructure, as announced IPv4 address space saw a nominal drop (from 355 to 350 /24s) that began shortly after the initial drop in traffic was observed, but returned to normal as the disruption ended.
Curaçao
A near-complete Internet outage at provider Flow Curaçao (AS52233) on June 14-15 sparked outrage and demands for answers by the country’s telecommunications regulator. Flow’s Internet traffic dropped significantly at 18:00 UTC (14:00 local time) on June 14, falling further in the following hours. Signs of recovery became visible around 11:00 UTC (07:00 local time) on June 15, with more complete recovery occurring at 14:00 UTC (10:00 local time). A Facebook post from Flow Barbados, posted on June 18, referenced a local disruption that began on June 14, but pointed at a commercial power outage at one of their key regional network facilities in Curaçao, which was likely the driver of this Internet outage.
Fiber optic cable damage
Digicel Haiti
Two instances of damage to its fiber optic infrastructure caused a complete Internet outage at Digicel Haiti (AS27653) as of 21:00 UTC (17:00 local time) on May 28, according to a (translated) X post from the company’s Director General. The cable damage took the network completely off the Internet, as announced IPv4 and IPv6 address space also dropped to zero. Digicel Haiti remained offline until 00:45 on May 29 (20:45 local time on May 28), when both traffic and announced IP address space returned to expected levels.
Airtel Malawi
Airtel Malawi (AS37440) experienced a 90-minute Internet outage on June 24, caused by ongoing vandalism on their fiber network. Although traffic effectively disappeared between 12:30 – 14:00 UTC (14:30 – 16:00 local time), the network remained at least partially online as at least some of the network’s IPv4 address space continued to be announced to the Internet. Announced IPv6 address space, however, fell to zero during the duration of the outage.
Technical problems
Bell Canada
A router update gone awry disrupted Internet service for Bell Canada (AS577) customers in Ontario and Quebec on May 21. An initial X post from the provider, posted at 13:52 UTC (09:52 local time), alerted customers to the service interruption. The post trailed the start of the disruption by approximately a half hour, as traffic dropped around 13:15 UTC (09:15 local time), falling by as much as 70% as compared to the same time a week prior. Request traffic to Cloudflare’s 1.1.1.1 DNS Resolver also saw a significant drop. A negligible decline in announced IPv4 address space was also observed.
The disruption was fairly short-lived, with traffic returning to expected levels just an hour later. A subsequent X post confirmed that services had been fully restored by 15:00 UTC (11:00 local time), with another post noting that the initial update had been rolled back quickly to restore service.
Lumen/CenturyLink
Across parts of the United States, Lumen/CenturyLink (AS209) customers experienced a widespread Internet service disruption on June 19. Traffic volumes dropped by over 50% as compared to the prior week starting around 21:45 UTC. The disruption only lasted a couple of hours, with traffic returning to normal by 00:00 UTC on June 20.
Social media posts from affected subscribers suggested that the problem might have been DNS related, as those that switched their DNS resolver to Cloudflare’s 1.1.1.1 were once again able to access the Internet. The graph below shows that traffic to 1.1.1.1 from Lumen/CenturyLink exceeded levels seen the previous week as the disruption began, and remained elevated through June 20. Problems with an Internet service provider’s DNS resolver can appear to subscribers like an Internet outage, as they become unable to access anything requiring a DNS lookup (effectively, all Internet resources), ultimately resulting in a drop in traffic to those resources (from the affected user base), as seen in the graph above.
Cyberattack impact
ASVT (Russia)
Russian Internet provider ASVT (AS8752) was reportedly targeted by a major DDoS attack that resulted in a multi-day complete Internet outage. This attack followed one targeting Russian provider Nodex (AS29329) in March, which also caused a complete service outage. Reaching 70.07 Gbps/6.92 million packets/second, the attack caused traffic to drop to near zero around 05:00 UTC on May 28 (08:00 Moscow time), with the effective outage lasting for approximately 10 hours. Although traffic began to return around 15:00 UTC (18:00 Moscow time), it remained below expected levels throughout the following week.
Interestingly, query volume to Cloudflare’s 1.1.1.1 DNS Resolver from ASVT saw a rapid increase as traffic began to return after the initial outage, and remained elevated throughout the duration of the disruption. It isn’t clear whether the increase could be related to problems with ASVT’s native DNS resolver during the attack, forcing users to seek alternative resolvers, or if it could be related to ASVT subscribers seeking ways around damage from the attack.
Unexplained disruptions
Telia Finland (April 1)
According to a (now unavailable) “Disturbance bulletin” and an associated X post from Telia Finland (AS1759), the company acknowledged that “A widespread disruption has been detected in the operation of mobile network data connections and fixed broadband.” The widespread disruption resulted in a brief near-complete outage for subscribers between 06:30 – 07:15 UTC (09:30 – 10:15 local time).
Telia Finland did not disclose the cause of the disruption, but it is clear that it impacted IPv4 connectivity, as seen in the graph below showing announced IPv4 address space. (Announced IPv6 address space did not see any change.) This loss of IPv4 connectivity resulted in a concurrent spike in the share of traffic from Telia Finland over IPv6 — normally below 5%, it spiked above 30% during the disruption. Request traffic to Cloudflare’s 1.1.1.1 resolver from Telia Finland also spiked at that time.
SkyCable
Around 19:15 UTC on May 7 (03:15 local time on May 8), subscribers of SkyCable (AS23944) in the Philippines experienced a complete Internet outage. Internet traffic from the network dropped to zero, as did announced IPv4 address space. The disruption lasted until 03:00 UTC on May 8 (11:00 local time), and SkyCable did not publish any information regarding the cause of the eight-hour service outage.
TrueMove H
On May 22, Thai mobile provider TrueMove H (AS132061)suffered a nationwide outage, impacting connectivity for subscribers. The provider acknowledged and apologized for the disruption, but did not provide an official reason for the outage. (An article in the local press reported “that the outage was caused by technical errors on True’s computer servers” and also stated that others suggested that “the problem might have been caused by an error on True’s DNS servers”.)
At 03:00 UTC (10:00 local time), traffic initially dropped by over 80% as compared to the prior week. Almost immediately, traffic began to slowly recover, and returned to expected levels around 08:00 UTC (15:00 local time). A brief partial drop in announced IPv4 address space was also observed during the first hour of the disruption.
Digicel Haiti
Two days after experiencing an outage due to cable damage, Digicel Haiti (AS27653) experienced another complete outage on May 30. In contrast to the previous outage, no additional information about this one was published on social media by Digicel Haiti or its Director General. The network effectively disappeared from the Internet at 14:15 UTC (10:15 local time), with both traffic and announced IP address space (IPv4 & IPv6) dropping to zero. The outage lasted nearly three hours, with traffic and announced IP space all returning around 17:00 UTC (13:00 local time).
Syria
On June 10, an Internet outage in Syriareportedly affected the ADSL landline network across multiple provinces. Traffic dropped by as much as two-thirds below the same time the previous week at 08:15 UTC (11:15 local time), with the disruption lasting two hours. Announced IPv4 address space also fell during the course of the outage, indicating a potential infrastructure issue. However, as seen below, request volume from Syria to Cloudflare’s 1.1.1.1 DNS resolver was also elevated during the outage. This behavior has been observed in the past during government-directed shutdowns of Internet connectivity in Syria, when traffic can leave the country, but not return. There was no other indication that this outage was due to an intentional shutdown, but no official explanation for the disruption was available.
Conclusion
Government-directed Internet shutdowns returned with a vengeance in the second quarter, and that trend continues into the third quarter, though the latest ones have been exam-related, and not driven by protests. And while power-outage related Internet disruptions have frequently been observed in the past, often in smaller countries with less stable infrastructure, the massive outage in Spain and Portugal on April 28 reminds us that much like the Internet, electrical infrastructure is often interconnected across countries, meaning that problems in one can potentially cause significant problems in others.
Welcome to the 22nd edition of the Cloudflare DDoS Threat Report. Published quarterly, this report offers a comprehensive analysis of the evolving threat landscape of Distributed Denial of Service (DDoS) attacks based on data from the Cloudflare network. In this edition, we focus on the second quarter of 2025. To view previous reports, visit www.ddosreport.com.
June was the busiest month for DDoS attacks in 2025 Q2, accounting for nearly 38% of all observed activity. One notable target was an independent Eastern European news outlet protected by Cloudflare, which reported being attacked following its coverage of a local Pride parade during LGBTQ Pride Month.
Key DDoS insights
DDoS attacks continue to break records. During 2025 Q2, Cloudflare automatically blocked the largest ever reported DDoS attacks, peaking at 7.3 terabits per second (Tbps) and 4.8 billion packets per second (Bpps).
Overall, in 2025 Q2, hyper-volumetric DDoS attacks skyrocketed. Cloudflare blocked over 6,500 hyper-volumetric DDoS attacks, an average of 71 per day.
Although the overall number of DDoS attacks dropped compared to the previous quarter — which saw an unprecedented surge driven by a large-scale campaign targeting Cloudflare’s network and critical Internet infrastructure protected by Cloudflare — the number of attacks in 2025 Q2 were still 44% higher than in 2024 Q2. Critical infrastructure continues to face sustained pressure, with the Telecommunications, Service Providers, and Carriers sector jumping again to the top as the most targeted industry.
All the attacks in this report were automatically detected and blocked by our autonomous defenses.
To learn more about DDoS attacks and other types of cyber threats, refer to our Learning Center. Visit Cloudflare Radar to view an interactive version of this report where you can drill down further. Radar also offers a free API for those interested in investigating Internet trends. You can also learn more about the methodologies used in preparing these reports.
DDoS attacks in numbers
In 2025 Q2, Cloudflare mitigated 7.3 million DDoS attacks — down sharply from 20.5 million in Q1, when an 18-day campaign against Cloudflare’s own and other critical infrastructure protected by Cloudflare, drove 13.5 million of those attacks.
DDoS attacks by quarter
We’ve just crossed halfway through 2025, and so far Cloudflare has already blocked 27.8 million DDoS attacks, equivalent to 130% of all the DDoS attacks we blocked in the full calendar year 2024.
DDoS attacks by year
Breaking it down further, Layer 3/Layer 4 (L3/4) DDoS attacks plunged 81% quarter-over-quarter to 3.2 million, while HTTP DDoS attacks rose 9% to 4.1 million. Year-over-year changes remain elevated. Overall attacks were 44% higher than 2024 Q2, with HTTP DDoS attacks seeing the largest increase of 129% YoY.
DDoS attacks by month
Hyper-volumetric DDoS attacks
In 2025 Q2, Cloudflare blocked over 6,500 hyper-volumetric DDoS attacks, averaging 71 hyper-volumetric attacks per day. Hyper-volumetric attacks include L3/4 DDoS attacks exceeding 1 Bpps or 1 Tbps, and HTTP DDoS attacks exceeding 1 million requests per second (Mrps).
The number of hyper-volumetric DDoS attacks exceeding 100 million packets per second (pps) surged by 592% compared to the previous quarter, and the number exceeding 1 billion pps and 1 terabits per second (Tbps) doubled compared to the previous quarter. The number of HTTP DDoS attacks exceeding 1 million rps (rps) remained the same at around 20 million in total, an average of almost 220,000 attacks every day.
Hyper-volumetric DDoS attacks in 2025 Q2
Threat actors
When asked who was behind the DDoS attacks they experienced in 2025 Q2, the majority (71%) of respondents said they didn’t know who attacked them. Of the remaining 29% of respondents that claimed to have identified the threat actor, 63% pointed to competitors, a pattern especially common in the Gaming, Gambling and Crypto industries. Another 21% attributed the attack to state-level or state-sponsored actors, while 5% each said they’d inadvertently attacked themselves (self-DDoS), were targeted by extortionists, or suffered an assault from disgruntled customers/users.
Top threat actors reported in 2025 Q2
Ransom DDoS attacks
The percentage of attacked Cloudflare customers that reported being targeted by a Ransom DDoS attack or that were threatened increased by 68% compared to the previous quarter, and by 6% compared to the same quarter in 2024.
Ransom DDoS attacks by quarter 2025 Q2
Diving deeper, Ransom DDoS attacks soared in June 2025. Around a third of respondents reported being threatened or subjected to Ransom DDoS attacks.
Ransom DDoS attacks by month 2025 Q2
Top attacked locations
The ranking of the top 10 most attacked locations in 2025 Q2 shifted significantly. China climbed two spots to reclaim first place, Brazil jumped four spots to second place, Germany slipped two spaces to third place, India edged up one to fourth, and South Korea rose four to fifth. Turkey fell four places to sixth, Hong Kong dropped three to seventh, and Vietnam vaulted an astonishing fifteen spots into eighth. Meanwhile, Russia rocketed forty places to ninth, and Azerbaijan surged thirty-one to round out the top ten.
The locations most targeted by DDoS attacks for 2025 Q2
It’s important to note that these attacked locations are determined by the billing country of the Cloudflare customer whose services were targeted — not that those nations themselves are under attack. In other words, a high rank simply means more of our registered customers in that billing jurisdiction were targeted by DDoS traffic, rather than implying direct geopolitical targeting.
Top attacked industries
The ranking of the top 10 most attacked industries in 2025 Q2 also saw notable movement. Telecommunications, Service Providers and Carriers climbed one spot to claim first place, while the Internet sector jumped two spots to second place. Information Technology & Services held its placement as third most attacked, and Gaming rose one spot to fourth place. Gambling & Casinos slipped four spots to fifth place, and the Banking & Financial Services industry remained in sixth place. Retail inched up one spot to seventh place, and Agriculture made a dramatic 38-place leap into eighth. Computer Software climbed two spots to ninth place, and Government hopped two places to round out the top ten most attacked industries.
The top attacked industries of DDoS attacks for 2025 Q2
Top sources of DDoS attacks
The ranking of the top 10 largest sources of DDoS attacks in 2025 Q2 also saw several shifts compared to the previous quarter. Indonesia climbed one spot to claim the first place, Singapore jumped two places to second place, Hong Kong dropped two places to third, Argentina slipped one space as fourth and Ukraine held on as the fifth-largest source of DDoS attacks. Russia surged six spots as the sixth-largest source, followed by Ecuador who jumped seven places. Vietnam inched up one place as the eighth-largest source. The Netherlands moved up four places as the ninth-largest source, and Thailand fell three places as the tenth-largest source of DDoS attacks.
The top sources of DDoS attacks for 2025 Q2
It’s important to note that these “source” rankings reflect where botnet nodes, proxy or VPN endpoints reside — not the actual location of threat actors. For L3/4 DDoS attacks, where IP spoofing is rampant, we geolocate each packet to the Cloudflare data center that first ingested and blocked it, drawing on our presence in over 330 cities for truly granular accuracy.
Top source networks of DDoS attacks
An ASN (Autonomous System Number) is a unique identifier assigned to a network or group of IP networks that operate under a single routing policy on the Internet. It’s used to exchange routing information between systems using protocols like BGP (Border Gateway Protocol).
For the first time in about a year, the German-based Hetzner (AS24940) network dropped from the first place as the largest source of HTTP DDoS attack to the third place. In its place, Austrian-based Drei (AS200373) jumped 6 places as the number one largest source of HTTP DDoS attacks. The US-based DigitalOcean (AS14061) hopped one spot to the second place.
The top 10 ASN sources of HTTP DDoS attacks
As can be seen in the chart above, 8 out of 10 ASNs listed offer virtual machines (VMs), hosting, or cloud services which indicate the common use of VM-based botnets. These botnets are estimated to be 5,000x stronger than IoT-based botnets. Only Drei (AS200373) and ChinaNet Backbone (AS4134) are primarily ISPs or telecom carriers without significant public VM/cloud offerings.
IoT-based botnets versus VM-based botnets
To help hosting providers, cloud computing providers and any Internet service providers identify and take down the abusive accounts that launch these attacks, we leverage Cloudflare’s unique vantage point to provide a free DDoS Botnet Threat Feed for Service Providers. Over 600 organizations worldwide have already signed up for this feed, and we’ve already seen great collaboration across the community to take down botnet nodes. This is possible thanks to the threat feed which provides these service providers a list of offending IP addresses from within their ASN that we see launching HTTP DDoS attacks. It’s completely free and all it takes is opening a free Cloudflare account, authenticating the ASN via PeeringDB, and then fetching the threat intelligence via API.
With a simple API call, service providers can get a list of offending IPs from within their network. An example response is provided below.
Example response from the free ISP DDoS Botnet Threat Feed API
Attack vectors
Defending against DDoS Botnets
In Q2 2025, the majority (71%) of HTTP DDoS attacks were launched by known botnets. Rapid detection and blocking of these attacks was possible as a result of operating a massive network and seeing many different types of attacks and botnets. By leveraging real-time threat intelligence, our systems are able to incriminate DDoS botnets very fast, contributing to a more effective mitigation. Even if a DDoS botnet has been incriminated while targeting only one website or IP address, our entire network and customer base is immediately protected against it. This real-time threat intelligence system adapts with botnets as they morph and change nodes.
The top HTTP DDoS attack vectors for 2025 Q2
L3/4 attack vectors
In Q2 2025, DNS flood attacks were the top L3/4 attack vector accounting for almost a third of all L3/4 DDoS attacks. SYN floods was the second most common attack vector, dipping from 31% in Q1 to 27% in Q2.
In third place, UDP floods also grew meaningfully, rising from 9% in Q1 to 13% in Q2. RST floods, another form of TCP-based DDoS attacks, accounting for 5% of all L3/4 attacks, was the fourth most common vector. Rounding out the top five, SSDP floods edged into fifth place at 3% despite a decline from 4.3% last quarter, but enough to push the previously prevalent Mirai attacks (which fell from 18% in Q1 to just 2% in Q2) out of the top five altogether.
The top L3/4 DDoS attack vectors for 2025 Q2
Breakdown of the top 3 L3/4 DDoS attack vectors
Below are details about the top 3 most common L3/4 DDoS attacks. We provide recommendations on how organizations can avoid becoming a reflection and amplification element, and also recommendations on how to defend against these attacks whilst avoiding impact to legitimate traffic. Cloudflare’s customers are protected against these attacks.
DNS Flood Attack
Type: Flood
How it works: A DNS flood aims to overwhelm a DNS server with a high volume of DNS queries—either valid, random, or malformed—to exhaust CPU, memory, or bandwidth. Unlike amplification attacks, this is a direct flood aimed at degrading performance or causing outages, often over UDP port 53, but sometimes over TCP as well (especially for DNS-over-TCP or DNSSEC-enabled zones).
How to defend against the attack: Use Cloudflare DNS as primary or secondary, Cloudflare DNS Firewall and/or Cloudflare Magic Transit to absorb and mitigate query floods before they reach your origin. Cloudflare’s global network handles tens of millions of DNS queries per second with built-in DDoS filtering and query caching, blocking malformed or excessive traffic while answering legitimate requests.
How to avoid unintended impact: Avoid blocking all DNS traffic or disabling UDP port 53, which would break normal resolution. Rely on Cloudflare’s DNS-specific protection such as the Advanced DNS Protection system, and deploy DNSSEC-aware protection to handle TCP-based query floods safely.
SYN Flood Attack
Type: Flood
How it works: In a SYN flood, threat actors send a large volume of TCP SYN packets—often with spoofed IP addresses—to initiate connections that are never completed. This leaves the target system with half-open connections, consuming memory and connection tracking resources, potentially exhausting server limits and preventing real clients from connecting.
How to defend against the attack: Use Cloudflare Magic Transit to intercept and mitigate TCP SYN floods at the edge. Cloudflare leverages SYN cookies, connection tracking, and behavioral analysis to distinguish real clients from spoofed or malicious sources, ensuring legitimate TCP connections are completed successfully. Using Cloudflare’s CDN/WAF services or Cloudflare Spectrum which are both reverse-proxy services for HTTP or TCP, respectively. Using a reverse-proxy basically eliminates the possible impact of TCP-based DDoS attacks.
How to avoid unintended impact: Blocking all SYN traffic or applying aggressive timeouts can block real users. Instead, rely on Cloudflare’s Advanced TCP protection system, which uses SYN rate shaping, anomaly detection, and spoofed-packet filtering to mitigate attacks without affecting genuine client connections.
UDP DDoS attack
Type: Flood
How it works: A high volume of UDP packets is sent to random or specific ports on the target IP address(es). It may attempt to saturate the Internet link or overwhelm its in-line appliances with more packets than it can handle in order to create disruption or an outage.
How to defend against the attack: Deploy cloud-based volumetric DDoS protection that can fingerprint attack traffic in real-time such as Cloudflare Magic Transit or Cloudflare Spectrum, apply smart rate-limiting on UDP traffic, and drop unwanted UDP traffic altogether with the Magic Firewall.
How to avoid unintended impact: Aggressive filtering may disrupt legitimate UDP services such as VoIP, video conferencing, or online games. Apply thresholds carefully.
Emerging threats
Among emerging L3/4 DDoS threats in 2025 Q2, Teeworlds flood saw the biggest spike. These attacks jumped 385% QoQ, followed by the RIPv1 flood, which surged 296%. RDP floods climbed by 173%, and Demon Bot floods increased by 149%. Even the venerable VxWorks flood made a comeback, rising 71% quarter-over-quarter. These dramatic upticks highlight threat actors’ ongoing experimentation with lesser-known and legacy protocols to evade standard defenses.
The top emerging threats for 2025 Q2
Breakdown of the top emerging threats
Below are details about the emerging threats for 2025 Q2, mostly recycling of very old attack vectors. We provide recommendations on how organizations can avoid becoming a reflection and amplification element, and also recommendations on how to defend against these attacks whilst avoiding impact to legitimate traffic. Cloudflare’s customers are protected against these attacks.
Teeworlds DDoS Attack
Type: Flood
How it works:Teeworlds is a fast-paced, open-source 2D multiplayer shooter game that uses a custom UDP-based protocol for real-time gameplay. Threat actors flood the target’s game server with spoofed or excessive UDP packets that mimic in-game actions or connection attempts. This can overwhelm server resources and cause lag or outages.
How to defend against the attack: Use Cloudflare Spectrum or Cloudflare Magic Transit to protect the servers. Cloudflare automatically detects and mitigates these types of attacks using real-time fingerprinting, blocking attack traffic while allowing real players through. Magic Transit also provides a packet-level firewall capability, the Magic Firewall which can be used to craft custom protection.
How to avoid unintended impact: When crafting custom rules, avoid blocking or aggressively rate-limiting UDP port 8303 directly as it can disrupt overall gameplay. Instead, rely on intelligent detection and mitigation services to avoid affecting legitimate users.
How it works: Exploits the Routing Information protocol version 1 (RIPv1), an old unauthenticated distance-vector routing protocol that uses UDP/520. Threat actors send spoofed routing updates to flood or confuse networks.
How to prevent becoming a reflection / amplification element: Disable RIPv1 on routers. Use RIPv2 with authentication where routing is needed.
How to defend against the attack: Block inbound UDP/520 from untrusted networks. Monitor for unexpected routing updates.
How to avoid unintended impact: RIPv1 is mostly obsolete; disabling it is generally safe. If legacy systems rely on it, validate routing behavior before changes.
RDP DDoS Attack
Type: Reflection + Amplification
How it works: The Remote Desktop Protocol (RDP) is used for remote access to Windows systems and typically runs over TCP port 3389. In some misconfigured or legacy setups, RDP can respond to unauthenticated connection attempts, making it possible to abuse for reflection or amplification. Threat actors send spoofed RDP initiation packets to exposed servers, causing them to reply to a victim, generating high volumes of unwanted traffic.
How to defend against the attack: Use Cloudflare Magic Transit to protect your network infrastructure. Magic Transit provides L3/L4 DDoS protection, filtering out spoofed or malformed RDP traffic before it reaches your origin. For targeted application-layer abuse, Cloudflare Gateway or Zero Trust Network Access (ZTNA) can help secure remote desktop access behind authenticated tunnels.
How to avoid unintended impact: Do not block TCP/3389 globally if RDP is actively used. Instead, restrict RDP access to known IPs or internal networks, or use Cloudflare Tunnel with Zero Trust Network Access (ZTNA) to remove public exposure altogether while maintaining secure access for legitimate users.
DemonBot DDoS Attack
Type: Botnet-based Flood
How it works: DemonBot is a malware strain that infects Linux-based systems—particularly unsecured IoT devices—via open ports or weak credentials. Once infected, devices become part of a botnet that can launch high-volume UDP, TCP, and application-layer floods. Attacks are typically command-and-control (C2) driven and can generate significant volumetric traffic, often targeting gaming, hosting, or enterprise services. To avoid infection, leverage antivirus software and domain filtering.
How to defend against the attack: Use Cloudflare Magic Transit to absorb and filter large-scale network-layer floods before they reach your infrastructure. Cloudflare’s real-time traffic analysis and signature-based detection neutralize traffic originating from DemonBot-infected devices. For application-layer services, Cloudflare DDoS protection and WAF can mitigate targeted HTTP floods and connection abuse.
How to avoid unintended impact: Instead of broadly blocking traffic types or ports, rely on Cloudflare’s adaptive mitigation to distinguish between legitimate users and botnet traffic. Combine with IP reputation filtering, geo-blocking, and rate limiting to reduce false positives and maintain service availability.
VxWorks Flood DDoS Attack
Type: Flood (IoT-based)
How it works:VxWorks is a real-time operating system (RTOS) used in millions of embedded and IoT devices (e.g., routers, industrial controllers). Devices running outdated or misconfigured versions of VxWorks can be compromised and used to launch DDoS attacks. Once infected—often via public exploits or weak credentials—they send high volumes of UDP, TCP, or ICMP traffic to overwhelm targets, similar to traditional IoT botnets.
How to defend against the attack: Deploy Cloudflare Magic Transit to block volumetric traffic at the network edge. Cloudflare uses real-time fingerprinting and proprietary heuristics to identify traffic from compromised VxWorks devices and mitigate it in real-time. For application services, Cloudflare’s DDoS mitigationandGateway services provide additional protection against protocol-level abuse.
How to avoid unintended impact: Avoid over-blocking UDP or ICMP traffic, as it may disrupt legitimate diagnostics or real-time services. Instead, use Cloudflare’s intelligent filtering, rate limiting, and geo/IP reputation tools to safely mitigate attacks while avoiding impact to legitimate traffic.
Most DDoS attacks are small and short. In 2025 Q2, 94% of L3/4 DDoS attacks didn’t exceed 500 Mbps. Similarly, around 85% of L3/4 DDoS attacks didn’t exceed 50,000 pps. The majority of HTTP DDoS attacks are also small, 65% stay below 50K rps. “Small”, though, is a relative term.
An average modern server typically refers to a general-purpose physical or virtual machine with around 4–8 CPU cores (e.g. Intel Xeon Silver), 16–64 GB RAM, and a 1 Gbps NIC, running a Linux OS like Ubuntu or CentOS with NGINX or similar software. This setup can handle ~100,000–500,000 pps, up to ~940 Mbps throughput, and around 10,000–100,000 rps for static content or 500–1,000 rps for database-backed dynamic applications, depending on tuning and workload.
Assuming the server is unprotected by a cloud DDoS protection service, if it’s targeted by “small” DDoS attacks during peak time traffic rates, it is very likely that the server won’t be able to handle it. Even “small” DDoS attacks can cause significant impact to unprotected servers.
DDoS attacks size and duration in 2025 Q2
While the majority of DDoS attacks are small, hyper-volumetric DDoS attacks are increasing in size and frequency. 6 out of every 100 HTTP DDoS attacks exceed 1M rps, and 5 out of every 10,000 L3/4 DDoS attacks exceed 1 Tbps — a 1,150% QoQ increase.
The largest attack in the world: 7.3 Tbps
Most DDoS attacks are short in duration, even the largest and most intense ones. Threat actors often rely on brief bursts of concentrated traffic—sometimes lasting as little as 45 seconds as seen with the monumental 7.3 Tbps DDoS attack — in an attempt to avoid detection, overwhelm targets and cause maximum disruption before defenses can fully activate. This tactic of short, high-intensity bursts makes detection and mitigation more challenging and underscores the need for always-on, real-time protection. Thankfully, Cloudflare’s autonomous DDoS defenses kick in immediately.
Helping build a better Internet
At Cloudflare, we’re committed to helping build a better Internet. A part of that mission is offering free, unmetered DDoS protection regardless of size, duration and quantity. We don’t just defend against DDoS attacks. The best defense is a good offense, and using our free ISP Botnet Threat Feed, we contribute to botnet takedowns.
While many still adopt protection reactively or rely on outdated solutions, our data shows proactive, always-on security is far more effective. Powered by a global network with 388 Tbps capacity across 330+ cities, we provide automated, in-line, battle-proven defense against all types of DDoS attacks.
Web crawlers are not new. The World Wide Web Wanderer debuted in 1993, though the first web search engines to truly use crawlers and indexers were JumpStation and WebCrawler. Crawlers are part of one of the backbones of the Internet’s success: search. Their main purpose has been to index the content of websites across the Internet so that those websites can appear in search engine results and direct users appropriately. In this blog post, we’re analyzing recent trends in web crawling, which now has a crucial and complex new role with the rise of AI.
Not all crawlers are the same. Bots, automated scripts that perform tasks across the Internet, come in many forms: those considered non-threatening or “good” (such as API clients, search indexing bots like Googlebot, or health checkers) and those considered malicious or “bad” (like those used for credential stuffing, spam, or scraping content without permission). In fact, around 30% of global web traffic today, according to Cloudflare Radar data, comes from bots, and even exceeds human Internet traffic in some locations.
A new category, AI crawlers, has emerged in recent years. These bots collect data from across the web to train AI models, improving tools and experiences, but also raising issues around content rights, unauthorized use, and infrastructure overload. We aimed to confirm the growth of both search and AI crawlers, examine specific AI crawlers, and understand broader crawler usage.
This is increasingly relevant with the rapid adoption of AI, growing content rights concerns, and data privacy discussions. Some sites and creators are looking to limit or block AI crawlers using tools like robots.txt or firewall rules. Others, like Dutch indie maker and entrepreneur Pieter Levels, have embraced them: “I’m 100% fine with AI crawlers… very important to rank in LLMs [large language models]”.
It’s important to note that crawlers serve different purposes. For example, the facebookexternalhit bot is not included in this analysis, as it is used by Facebook to fetch page content when generating previews for shared links. However, within this post, we are only focusing on AI and search crawlers that are indexing or scraping website content.
AI-only crawlers perspective
Let’s start with an AI-only crawler perspective that we currently have on Cloudflare Radar, focused only on crawlers advertised as AI-related. To identify them, we’re using here a list derived from an open-source project that helps website owners manage and control access to AI crawlers — especially those used to train large language models (LLMs). It also provides guidance on what to include in robots.txtfiles (more on that below). The data shown below is based on matching those crawler names with user-agent strings in HTTP requests. (Further details, including one exception, about this method can be found at the end of the blog post.)
The AI crawler landscape saw a significant shift between May 2024 and May 2025, with GPTBot (from OpenAI) emerging as the dominant force, surging from 5% to 30% share, and Meta-ExternalAgent (from Meta) making a strong new entry at 19%. This growth came at the expense of former leader Bytespider, which plummeted from 42% to 7%, as well as other AI crawlers like ClaudeBot and Amazonbot, which also saw declines. Our data clearly indicates a reordering of top AI crawlers, highlighting the increasing prominence of OpenAI and Meta in this category.
May 2024
May 2025
Rank
Bot Name
Share (May 2024)
Rank
Bot Name
Share (May 2025)
1
Bytespider
42%
1
GPTBot
30%
2
ClaudeBot
27%
2
ClaudeBot
21%
3
Amazonbot
21%
3
Meta-ExternalAgent
19%
4
GPTBot
5%
4
Amazonbot
11%
5
Applebot
4.1%
5
Bytespider
7.2%
Rank
Bot Name
Share (May 2024)
Rank
Bot Name
Share (May 2025)
1
Bytespider
42%
1
GPTBot
30%
2
ClaudeBot
27%
2
ClaudeBot
21%
3
Amazonbot
21%
3
Meta-ExternalAgent
19%
4
GPTBot
5%
4
Amazonbot
11%
5
Applebot
4.1%
5
Bytespider
7.2%
For additional context, the list below includes further information about the bots with higher crawling shares seen above. This information comes from the same open-source list mentioned above and from publications by companies like OpenAI, which explain how their crawlers are used.
GPTBot – OpenAI’s crawler used to improve and train large language models like ChatGPT.
ClaudeBot – Anthropic’s crawler for training and updating the Claude AI assistant.
Meta-ExternalAgent – Meta’s bot likely used for collecting data to train or fine-tune LLMs.
Amazonbot – Amazon’s crawler that gathers data for its search and AI applications.
Bytespider – ByteDance’s AI data collector, often linked to training models like Ernie or TikTok-related AI.
Applebot – Apple’s web crawler primarily for Siri and Spotlight search, possibly used in AI development.
OAI-SearchBot – OpenAI’s search-focused crawler, likely used for retrieving real-time web info for models.
ChatGPT-User – Represents API-based or browser usage of ChatGPT in connection with user interactions.
PerplexityBot – Crawler from Perplexity.ai, which powers their AI answer engine using real-time web data.
Webmasters can inform crawler operators of whether they want these bots and crawlers to access their content by setting out rules in a file called robots.txt, which tells crawlers what pages they should or shouldn’t access. As we’ve seen recently, crawlers honoring your robots.txt policies is voluntary, but Cloudflare announced tools like AI Audit to help content creators to enforce it.
Now, as we’ve seen, the landscape of web crawling is evolving rapidly, driven by the merging roles of search engines and AI. AI is now deeply integrated into search, seen in Google’s AI Overviews and AI Mode, but also in social media platforms, like Meta AI on Instagram. So, let’s broaden our analysis to include these wider AI-driven crawling activities.
General AI and search crawling growth: +18%
A broader view reveals the growth of crawling traffic from both search and AI crawlers over the first few months of 2025. To remove customer growth bias, we’ll analyze trends using a fixed set of customers from specific weeks (a method we’ve used in our Cloudflare Radar Year in Review): the first week of May 2024, a week in November 2024, and the first week of April 2025.
Using that method, we found that AI and search crawler traffic grew by 18% from May 2024 to May 2025 (comparing full-month periods). The increase was even higher, at 48%, when including new Cloudflare customers added during that time. Peak AI and search crawling traffic occurred in April 2025, with a 32% increase compared to May 2024. This confirms that crawling traffic has clearly risen over the past year, but also that growth is not always constant. Google remains the dominant player, and its share is growing too, as we’ll see in the next section.
As the next chart shows, crawling traffic increased sharply in March and April 2025 and remained high, though slightly lower, in May.
The patterns on the above crawling chart also seem to reflect broader seasonal patterns and general human Internet traffic patterns. In 2024, traffic dropped during the summer in the Northern Hemisphere, with August and September being the least active months. And like overall Internet traffic, it then rose in November, when people are typically more online due to shopping and seasonal habits, as we’ve seen in past analyses.
Googlebot crawling grew 96% in one year
Googlebot, which indexes content for Google Search, was clearly the top crawler throughout the period and showed strong growth, up 96% from May 2024 to May 2025, reflecting increased crawling by Google. Crawling traffic peaked in April 2025, reaching 145% higher than in May 2024. It’s also important to mention that Google made changes to its search and launched AI Overviews in its search engine during this time — first in the US in May 2024, then in more countries later.
Two trends stand out when looking at daily data for Google-related crawlers, as shown in the graph below. First, Googlebot and the more recent GoogleOther (a web crawler from 2023 for “research and development”) account for most of Google’s crawling activity. Second, there were two visible drops in crawling traffic: one on December 14, 2024 (around a Google Search update), and another from May 20 to May 28, 2025. That May 20 drop occurred around the same time as the rollout of AI Mode on Google Search in the US, although the timing may be coincidental.
Breakdown of top 20 AI and search web crawlers
Ranking crawlers by their share of total requests gives a clearer picture of which bots are gaining or losing ground, especially among those focused on search and AI. The table below shows a clear trend: some AI bots have grown rapidly since last year (with growth beginning even earlier), while many traditional search crawlers have remained flat or lost share (as in the case of Bing and its Bingbot crawler). The main exception is Googlebot.
The next table shows the percentage share of each crawler out of all crawling traffic generated by this specific cohort of over 30 AI & search crawlers observed by Cloudflare in May 2024 and May 2025. The table below also includes the change in percentage points and the growth or decline in raw request volume. Crawlers are ranked by their share in May 2025. Key crawler shifts include GPTBot rising sharply (+305%), while Bytespider dropped dramatically (-85%).
Rank
Bot name
Share
May 2024
Share
May 2025
Δ percentage-point change
Raw requests growth (May 2024 to May 2025)
1
Googlebot
30%
50%
+20 pp
96%
2
Bingbot
10%
8.7%
-1.3 pp
2%
3
GPTBot
2.2%
7.7%
+5.5 pp
305%
4
ClaudeBot
11.7%
5.4%
-6.3 pp
-46%
5
GoogleOther
4.4%
4.3%
-0.1 pp
14%
6
Amazonbot
7.6%
4.2%
-3.4 pp
-35%
7
Googlebot-Image
4.5%
3.3%
-1.2 pp
-13%
8
Bytespider
22.8%
2.9%
-19.8 pp
-85%
9
Yandex
2.8%
2.2%
-0.7 pp
-10%
10
ChatGPT-User
0.1%
1.3%
+1.2 pp
2,825%
11
Applebot
1.9%
1.2%
-0.7 pp
-26%
12
Timpibot
0.3%
0.6%
+0.3 pp
133%
13
Baiduspider
0.5%
0.4%
-0.1 pp
7%
14
PerplexityBot
<0.01%
0.2%
+0.2 pp
157,490%
15
DuckDuckBot
0.2%
0.1%
-0.1 pp
-16%
16
SeznamBot
0.1%
0.1%
2%
17
Yeti
0.1%
0.1%
47%
18
coccocbot
0.1%
0.1%
-3%
19
Sogou
0.1%
0.1%
-22%
20
Yahoo! Slurp
0.1%
0.0%
-0.1 pp
-8%
Rank
Bot name
Share May 2024
Share May 2025
Δ percentage-point change
Raw requests growth (May 2024 to May 2025)
1
Googlebot
30%
50%
+20 pp
96%
2
Bingbot
10%
8.7%
-1.3 pp
2%
3
GPTBot
2.2%
7.7%
+5.5 pp
305%
4
ClaudeBot
11.7%
5.4%
-6.3 pp
-46%
5
GoogleOther
4.4%
4.3%
-0.1 pp
14%
6
Amazonbot
7.6%
4.2%
-3.4 pp
-35%
7
Googlebot-Image
4.5%
3.3%
-1.2 pp
-13%
8
Bytespider
22.8%
2.9%
-19.8 pp
-85%
9
Yandex
2.8%
2.2%
-0.7 pp
-10%
10
ChatGPT-User
0.1%
1.3%
+1.2 pp
2,825%
11
Applebot
1.9%
1.2%
-0.7 pp
-26%
12
Timpibot
0.3%
0.6%
+0.3 pp
133%
13
Baiduspider
0.5%
0.4%
-0.1 pp
7%
14
PerplexityBot
<0.01%
0.2%
+0.2 pp
157,490%
15
DuckDuckBot
0.2%
0.1%
-0.1 pp
-16%
16
SeznamBot
0.1%
0.1%
2%
17
Yeti
0.1%
0.1%
47%
18
coccocbot
0.1%
0.1%
-3%
19
Sogou
0.1%
0.1%
-22%
20
Yahoo! Slurp
0.1%
0.0%
-0.1 pp
-8%
Based on this data, two major shifts in web crawling occurred between May 2024 and May 2025:
1. Some AI crawlers rose sharply. GPTBot (from OpenAI) increased its share from 2.2% to 7.7% (+5.5 pp), with a 305% rise in requests. This underscores the data demand for training large language models like ChatGPT. GPTBot jumped from #9 in May 2024 to #3 in May 2025.
Another OpenAI crawler, ChatGPT-User, saw requests surge by 2,825%, reaching a 1.3% share. This reflects a large rise in ChatGPT user activity or API-based interactions that involve accessing web content. PerplexityBot (from Perplexity.ai), despite a small 0.2% share, recorded the highest growth rate: a staggering 157,490% increase in raw requests.
Meanwhile, some AI crawlers saw steep declines. ClaudeBot (Anthropic) fell from 11.7% to 5.4% of total traffic and dropped 46% in requests. Bytespider plummeted 85% in request volume, falling from #2 to #8 in crawler share (now at just 2.9%).
Both Amazonbot and Applebot, also considered AI crawlers, saw decreases in share and in raw requests (–35% and –26%, respectively).
2. Google’s dominance expanded. Googlebot’s share rose from 30% to 50%, supporting search indexing, but potentially also having AI-related purposes (such as new AI Overviews in Google Search). And GoogleOther (the crawler introduced in 2023) also increased in crawling traffic, 14%. Other Google crawlers not in the top 20, like Googlebot-News, also grew significantly (+71% in requests). There’s a clear trend of growth in these Google-related web crawlers at a time when the company is investing heavily in combining AI with search.
Also in the search category, Bingbot’s share (from Microsoft) declined slightly from 10% to 8.7% (-1.3 pp), though its raw requests still grew modestly by 2%.
These trends show that web crawling is increasingly dominated by bots from Google and OpenAI, reflecting clear shifts over the course of a year. Google also appears to be adapting how it collects data to support both traditional search and AI-driven features.
Also worth noting is FriendlyCrawler, which no longer appears in the top 20 list as of May 2025 (now ranked #35). It was #14 in May 2024 with a 0.2% share, but saw a 100% drop in requests by May 2025. This bot is known to index and analyze website content, although its owner and purpose remain unclear. Typically, crawlers like this are used for improving search results, market research, or analytics.
robots.txt & AI bots: GPTBot leads twice
Recent data from June 6, 2025, from Cloudflare Radar shows that out of 3,816 domains (from the top 10,000) where we were able to find a robots.txt file, 546 (about 14%) had “allow” or “disallow” (fully or partially) directives targeting AI bots in particular.
This leaves many site owners in a gray area because it’s not always clear how effective robots.txt is in managing AI crawlers. Some site owners may not think to use it specifically for AI bots, while others might be unsure whether these bots even respect robots.txt rules, especially newer or less transparent crawlers. In other cases, sites use partial rules to fine-tune access, trying to balance visibility and protection without fully opting in or out.
The “disallow” rules appear far more often than “allow” rules. The most frequently blocked bot was GPTBot, disallowed by 312 domains (250 fully, 62 partially), followed by CCBot and Google-Extended, as shown in the following graph.
Although GPTBot was the most blocked, it was also the most explicitly allowed, with 61 domains granting access (18 fully, 43 partially). Still, very few sites openly and explicitly allow AI bots, and when they do, it’s usually for limited sections. Note that bots not listed in a site’s robots.txt are effectively allowed by default.
As AI crawling increases, more websites are moving from passive signals like robots.txt to active protections like Web Application Firewalls. The ecosystem is shifting, with a growing focus on enforceable controls.
Note: When we analyze crawler traffic, we compare user-agent tokens found in robots.txt files (like those for AI crawlers) with the actual user-agent strings in HTTP requests. It’s important to note that some robots.txt tokens, such as Google-Extended, aren’t user-agent substrings. As described in RFC 9309, one goal of these token may be to signal the purpose of the crawler. For instance, Google uses Google-Extended in robots.txt to see if your content can be used for AI training, but the traffic itself still comes from standard Google user-agents like Googlebot. Because of this, not every robots.txt entry will have a direct match in HTTP request logs.
Conclusion
As AI crawlers reshape the Internet, websites face both new challenges and new opportunities in managing their online presence.
This analysis highlights the growing impact of AI on web crawling, showing a clear shift from traditional search indexing to data collection for training AI models. The detailed statistics, such as Googlebot’s continued growth and the rapid rise of AI-specific crawlers, offer context for understanding how this space is evolving and what it means for the future of web content access.
The trend toward stronger, enforceable blocking methods, something Cloudflare has also been invested, signals a key shift in how websites may control their interactions with AI systems going forward.
Content publishers welcomed crawlers and bots from search engines because they helped drive traffic to their sites. The crawlers would see what was published on the site and surface that material to users searching for it. Site owners could monetize their material because those users still needed to click through to the page to access anything beyond a short title.
Artificial Intelligence (AI) bots also crawl the content of a site, but with an entirely different delivery model. These Large Language Models (LLMs) do their best to read the web to train a system that can repackage that content for the user, without the user ever needing to visit the original publication.
The AI applications might still try to cite the content, but we’ve found that very few users actually click through relative to how often the AI bot scrapes a given website. We have discussed this challenge in smaller settings, and today we are excited to publish our findings as a new metric shown on the AI Insights page on Cloudflare Radar.
Visitors to Cloudflare Radar can now review how often a given AI model sends traffic to a site relative to how often it crawls that site. We are sharing this analysis with a broad audience so that site owners can have better information to help them make decisions about which AI bots to allow or block and so that users can understand how AI usage in aggregate impacts Internet traffic.
How does this measurement work?
As HTML pages are arguably the most valuable content for these crawlers, the ratios displayed are calculated by dividing the total number of requests from relevant user agents associated with a given search or AI platform where the response was of Content-type: text/html by the total number of requests for HTML content where the Referer header contained a hostname associated with a given search or AI platform.
The diagrams below illustrate two common crawling scenarios, and show that companies may use different user agents depending on the purpose of the crawler. The top one represents a simple transaction where the example AI platform is requesting content for the purposes of training an LLM, representing itself as AIBot. The bottom one represents a scenario where the example AI platform is requesting content to service a user request — looking for flight information, for example. In this case, it is representing itself as AIBot-User. Request traffic from both of these user agents would be aggregated under a single platform name for the purposes of our analysis.
When a user clicks on a link on a website or application, the client will often send a Referer: header as part of the request to the target site. In the diagram below, the example AI platform has returned content that contains links to external sites in response to a user interaction. When the user clicks on a link, a request is made to the content provider that includes ai.example.com in the Referer: header, letting them know where that request traffic came from. Hostnames are associated with their respective platforms for the purpose of our analysis.
Observations
Reviewing the ratios
The new metric is presented as a simple table, comparing the number of aggregate HTML page requests from crawlers (user agents) associated with a given platform to the number of HTML page requests from clients referred by a hostname associated with a given platform. The calculated ratio is always normalized to a single referral request.
The table below shows that for the period June 19-26, 2025, as an example, the ratios range from Anthropic’s 70,900:1 down to Mistral’s 0.1:1. This means that Anthropic’s AI platform Claude made nearly 71,000 HTML page requests for every HTML page referral, while Mistral sent 10x as many referrals as crawl requests. (However, traffic referred by Claude’s native app does not include a Referer: header, and we believe that the same holds true for traffic generated from other native apps as well. As such, because the referral counts only include traffic from the Web-based tools from these providers, these calculations may overstate the respective ratios, but it is unclear by how much.)
Of course, due in part to changes in crawling patterns, these ratios will change over time. The table above also displays the ratio changes as compared to the previous period, with changes ranging from increases of over 6% for DuckDuckGo and Yandex to Google’s 19.4% decrease. The week-over-week drop in Google’s ratio is related to an observed drop in crawling traffic from GoogleBot starting on June 24, while Yandex’s week-over-week growth is related to an observed increase in YandexBot crawling activity that started on June 21, as seen in the graphs below.
Changes and trends in the underlying activity can be seen in the associated Data Explorer view, as well as in the raw data available via API endpoints (timeseries, summary). Note that the shares of both referral and crawl traffic are relative to the sets of referrers and crawlers included in the graphs, and not Cloudflare traffic overall.
For example, in the referrer-centric view below, covering nearly the first four weeks of June 2025, we can see that referral traffic is dominated by search platform Google, with a fairly consistent diurnal pattern visible in the data. (The google.* entry covers referral traffic from the main google.com site, as well as local sites, such as google.es or google.com.tw.) Because of prefetching driven by the use of speculation rules, referral traffic coming from Google’s ASN (AS15169) is specifically excluded from analysis here, as it doesn’t represent active user consumption of content.
Clear diurnal patterns are also visible in the referral request shares of other search platforms, although the request shares are a fraction of what is seen from Google.
Throughout June, the share of traffic referred by AI platforms was significantly lower, even in aggregate, than the share of traffic referred by search platforms.
Changes in crawling traffic
As noted above, the change in ratio values over time can be driven by shifts in crawling activity. These shifts are visible in the crawling traffic shares available in Data Explorer, as well as in the raw data available via API endpoints (timeseries, summary). In the crawler-centric view below, covering nearly the first four weeks of June 2025, we can see that the share of requests related to Google’s crawling activity for both their Googlebot and GoogleOther identifiers falls over the course of the month, with several peak/valley periods. A similar pattern observed in HTTP request traffic from Google’s AS15169 during that same time period loosely matches this observed drop in share.
In addition, it appears that OpenAI’s GPTBot saw multiple periods where little-to-no crawling activity was observed throughout the month.
What this means for content providers
These ratios directly impact the viability of content publication on the Internet. While they will vary over time, the trend continues to be more crawls and fewer referrals when compared in relation to each other. Legacy search index crawlers would scan your content a couple of times, or less, for each visitor sent. A site’s availability to crawlers made their revenue model more viable, not less.
The new data we are observing suggests that is no longer the case. These models continue to consume more content, more frequently, despite sending the same or less traffic to the source of its content.
We have released new tools over the last year to help site owners take control back. With a single click, publishers can block the kinds of AI crawlers that train against their content. And today, we announced new ways to make the exchange of value fair for both sides of the equation. However, we continue to recommend that content creators audit and then enforce their preferred policies for AI crawlers.
One more thing…
In addition to providing these new insights around crawling and referral traffic and associated trends, we’ve also taken the opportunity to launch expanded Verified Bots content. The Bots page on Cloudflare Radar includes a paginated list of Verified Bots, displaying the bot name, owner, category, and rank (based on request volume). This list has now been expanded into a standalone directory in a new Bots section. The directory, shown below, displays a card for each Verified Bot, showing the bot name, a description, the bot owner and category, and verification status. Users can search the directory by bot name, owner, or description, and can also filter by category (selecting just Monitoring & Analytics bots, for example).
Clicking on a bot name within a card brings up a bot-specific page that includes metadata about the bot, information on how the bot’s user agent is represented in HTTP request headers and how it should be specified in robots.txt directives, and a traffic graph that shows associated HTTP request volume trends for the selected time period (with a default comparison to the previous period). Associated data is also available via the API. As we add additional information to these bot-specific pages in the future, we will document the updates in Changelog entries.
The Internet relies on the Border Gateway Protocol (BGP) to exchange IP address reachability information. This information outlines the path a sender or router can use to reach a specific destination. These paths, conveyed in BGP messages, are sequences of Autonomous System Numbers (ASNs), with each ASN representing an organization that operates its own segment of Internet infrastructure.
Throughout this blog post, we’ll use the terms “BGP routes” or simply “routes” to refer to these paths. In essence, BGP functions by enabling autonomous systems to exchange routes to IP address blocks (“IP prefixes”), allowing different entities across the Internet to construct their routing tables.
When network operators debug reachability issues or assess a resource’s global reach, BGP routes are often the first thing they examine. Therefore, it’s critical to have an up-to-date view of the routes toward the IP prefixes of interest. Some networks provide tools called “looking glasses” — public routing information services offering data directly from their own BGP routers. These allow external operators to examine routes from that specific network’s perspective. Furthermore, services like bgp.tools, bgp.he.net, RouteViews, or the NLNOG RING looking glass offer aggregated, looking glass-like lookup capabilities, drawing on data sources from multiple organizations rather than just a single one.
However, individual looking glass instances offer a limited scope, typically restricted to the infrastructure of the service provider’s network. While aggregated routing information services provide broader vantage points, they often lack the API access necessary for building automated tools on top of them. For example, systems designed for automated tasks, such as BGP leak or hijack detection, depend on programmatic API access.
We’re excited to introduce Cloudflare Radar’s new real-time BGP route lookup service, described below. Built using public data sources, this service provides visualizations of real-time routes directly on the corresponding IP prefix pages within Radar (see the page for 1.1.1.0/24 as an example). We are also offering API access through our free-to-use Cloudflare Radar API, empowering developers to leverage this data to build their own innovative systems and tools.
Cloudflare Radar provides real-time routes
We are excited to announce the launch of our new real-time BGP route lookup service, now accessible through both Cloudflare Radar web interface and the Cloudflare Radar API. This enhancement provides users with a near instantaneous view into global BGP routing data.
Cloudflare Radar prefix pages
Cloudflare Radar’s real-time routes feature now offers a Sankey diagram illustrating the BGP routes for a given prefix. To minimize visual complexity, the visualization displays routes directed towards the Tier 1 networks. For example, the diagram below shows that 1.1.1.0/24 is announced by AS13335 (Cloudflare) and that Cloudflare has direct connections to almost all U.S.-based and international Tier 1 network providers.
Expanding on this more concise view, users also have the option to ‘Show full paths’ and visualize every BGP route from the prefix of interest to the collectors. (The role of the collectors in gathering this data is discussed below.) The interactive view allows panning and zooming, and hovering over the links provides tooltip information on which collector saw the route and when it was last updated.
For both views, the prefix origin table is displayed above the route’s visualization. The table shows the originating Autonomous System (AS), the visibility percentage (representing the proportion of route collectors observing the origin ASN announcement), and RPKI validation outcomes.
During a recently detected BGP misconfiguration, we saw two origin ASNs for a prefix, with AS3 incorrectly used instead of the intended origin being prepended three times. The visualization reveals AS3 as RPKI invalid with low visibility, indicating limited network acceptance. Operators can analyze these issues visually or in the table and monitor real-time corrections by refreshing the page.
Whether facing network outages, implementing new deployments, or investigating route leaks, users can leverage this feature for any scenario where a clear, global understanding of a prefix’s routing paths is essential.
To allow easier access to this information, users can now search for any prefix using the Radar search bar and navigate to the corresponding prefix routing pages. Prefixes involved in BGP route leak and origin hijack events are also linked to this enhanced routing information page, helping operators debug BGP anomalies in real-time.
Cloudflare Routes API
Cloudflare Radar real-time route data is also accessible via the Radar API, and users can follow this guide to get started.
The following example shows an HTTP GET request to query all the current routes for a prefix of interest:
curl -X GET
"https://api.cloudflare.com/client/v4/radar/bgp/routes/realtime?prefix=1.1.1.0/24" -H
"Authorization: Bearer <API_TOKEN>"
With the help of JSON data processing tools like jq, users can further filter data results by routes containing a certain ASN. In the following example, we make a request to ask for all current routes toward the prefix 1.1.1.0/24 and filter all routes with AS paths containing AS174:
The command output is a JSON array of route objects. Each object details a route that includes AS174 in its AS path. Additional information provided for each route includes the BGP route collector, BGP community values, and the timestamp of the last update.
The API also offers supplementary metadata alongside BGP route information, including insights into BGP route collector status and aggregated prefix-to-origin data. Recalling the earlier example of an AS path prepending misconfiguration, the RPKI invalid AS3 origin is now directly visible to users and API clients in the JSON response, showing that just 9% of all collectors observed its announcements.
In brief, RIPE RIS and RouteViews maintain several BGP route collectors, each connected to BGP routers across a diverse set of networks. These routers forward BGP messages to the collectors, which generate periodic data dumps for public access. These data dumps include both collections of BGP message updates and full routing table snapshots (RIB dump files).
For services monitoring stable routing information, like global routing statistics, we process RIB dump files from the archives as they become available. Conversely, for detecting dynamic events such as route leaks and hijacks, we process periodic BGP update files in batches. Services depending on this historical BGP data may experience processing delays of 10 to 30 minutes at the route collectors.
For the new real-time BGP routes feature, we aim to reduce the data delay from minutes or tens of minutes down to seconds. With the real-time stream capability provided by the BGP archiver services — RIS Live WebSocket from RIPE RIS and OpenBMP Kafka stream from RouteViews — we designed an additional real-time data stream component that enhances the routes snapshots built with MRT archive files by constantly updating the snapshots.
System design
At its core, the system enables a user to look up a prefix’s routes stored in BGP routes snapshots. The BGP routes snapshots serve as a queryable data repository, organized hierarchically. The snapshots use a trie structure to allow for the retrieval of route information (such as AS paths and community values) associated with specific address prefixes. Each node in the hierarchy stores routing information from different peering routers, providing a consolidated global view. To handle the large data volumes from multiple BGP route collectors, the system partitions routing data into separate BGP routes snapshots, where each snapshot receives data streamed from its corresponding collector. This architecture enables horizontal scalability, allowing for dynamic adjustment of data sources by selecting which independent collectors’ data to include or exclude.
Because the collectors’ BGP route information is maintained independently, to query for a global status, we apply the actor model software architecture for the implementation. Each collector is considered an actor that runs completely independently and communicates with a central controller via a dedicated communication channel. The central controller starts all actors by sending a signal to each of them, triggering actors to start collecting archival and real-time BGP data, on their separate threads.
Upon queries from users, the central controller will relay the query to all running actors via a query message. The actors will retrieve the corresponding route information on its prefix-trie and return the results to the controller with another message. The controller aggregates all messages from the actors and compiles them into a reply response to the user. During the whole process, the real-time BGP streaming and snapshots’ updating processes continue to run in the background without interruptions.
Our actor-model implementation enables a single node to efficiently store hundreds of full routing tables in its memory. Our current deployment uses eight route collectors, housing a total of 261 full routing tables. This in-memory system operating on a single node consumes approximately 45 GB of memory, which translates to about 170 MB per full routing table.
Summary
Cloudflare Radar now offers a real-time BGP route lookup service, providing near-instantaneous insights into global Internet routing. This feature leverages real-time data streams from RouteViews and RIPE RIS, moving beyond historical archives to deliver up-to-the-minute information. Users can now visualize routes in real time on Cloudflare Radar’s prefix pages with intuitive Sankey diagrams that detail complete route information. Furthermore, the Cloudflare Radar API provides programmatic access to this data, allowing for seamless integration into custom tools and workflows.
A massive power outage struck significant portions of Portugal and Spain at 10:34 UTC on April 28, grinding transportation to a halt, shutting retail businesses, and otherwise disrupting everyday activities and services. Parts of France were also reportedly impacted by the power outage. Portugal’s electrical grid operator blamed the outage on a “fault in the Spanish electricity grid”, and later stated that “due to extreme temperature variations in the interior of Spain, there were anomalous oscillations in the very high voltage lines (400 kilovolts), a phenomenon known as ‘induced atmospheric vibration’” and that “These oscillations caused synchronisation failures between the electrical systems, leading to successive disturbances across the interconnected European network.”
The breadth of Cloudflare’s network and our customer base provides us with a unique perspective on Internet resilience, enabling us to observe the Internet impact of this power outage at both a local and national level, as well as at a network level, across traffic, network quality, and routing metrics.
Impacts in Portugal
Country level
In Portugal, Internet traffic dropped as the power grid failed, with traffic immediately dropping by half as compared to the previous week, falling to approximately 90% below the previous week within the next five hours.
Request traffic from users in Portugal to Cloudflare’s 1.1.1.1 DNS resolver also fell when the power went out, initially dropping by 40% as compared to the previous week, and falling further over the next several hours.
Network level
At a network level, the loss of Internet traffic from local providers including NOS, Vodafone, MEO, and NOWO was swift and significant. The Cloudflare Radar graphs below show that traffic from those networks effectively evaporated over the hours after the power outage began. The autonomous systems (ASNs) shown below for these providers may carry a mix of fixed and mobile broadband traffic. However, MEO breaks out at least some of their mobile traffic onto a separate ASN, and the graph below for MEO-MOVEL (AS42863) shows that request traffic from that network more than doubled after the power went out, as subscribers turned to their mobile devices for information about what was happening. However, despite the initial spike, this mobile traffic also fell over the next several hours, dropping to approximately half of the volume seen the prior week.
Regional level
In addition to looking at traffic at a national and network level, we can also look at traffic at a regional level. As noted above, the power outage did not impact every region of the country. The traffic graphs below show the changes in Internet traffic from the parts of Portugal where an impact was observed.
In Lisbon and Porto, a sharp, but limited drop in traffic was observed as the power outage began, with traffic recovering slightly almost as quickly. However, traffic gradually declined in the subsequent hours, in contrast to the other regions reviewed below.
The most significant immediate traffic drops were observed in Aveiro, Beja, Bragança, Castelo Branco, Évora, Faro, Guarda, Portalegre, Santarém, Viana do Castelo, Vila Real, and Viseu. In these areas, traffic fell and then quickly stabilized at very low volumes. In Braga and Setúbal, traffic declined more gradually after the initial drop.
Network quality
The power outage also impacted the quality of connectivity at a national level in Portugal. Prior to the loss of power, median download speeds across the country were around 40 Mbps, but within several hours after the state of the outage, fell as low as 15 Mbps. As expected, latency at a country level saw an opposite impact. Prior to the loss of power, median latency was around 20 ms. However, it gradually grew to as much as 50 ms. The lower download speeds and higher latency are likely due to the congestion of the network links that remained available.
Routing
Network infrastructure in Portugal was also impacted by the power outage, with the impact seen as a drop in announced IP address space. (This means that portions of Portuguese providers’ networks are no longer visible to the rest of the Internet.) The number of announced IPv4 /24s (blocks of 256 IPv4 addresses) dropped by ~300 (around 1.2%), and the number of announced IPv6 /48s (blocks of over 1.2 octillion IPv6 addresses) dropped from 17,928,551 to 16,355,607 (around 9%). Address space began to drop further after 16:00 UTC, possibly as a result of backup power being exhausted and associated network infrastructure falling offline.
Impacts in Spain
Country level
In Spain, Internet traffic dropped as the power grid failed, with traffic immediately dropping by around 60% as compared to the previous week, falling to approximately 80% below the previous week within the next five hours.
Request traffic from users in Spain to Cloudflare’s 1.1.1.1 DNS resolver also fell when the power went out, initially dropping by 54% as compared to the previous week, but quickly stabilizing.
Network level
At a network level, traffic volumes from the top five ASNs in Spain fell rapidly once power was lost, with most declining gradually over the next several hours. In contrast, traffic from Digi Spain Telecom (AS57269) fell quickly, but then stabilized at the lower level. In comparison to the previous week, traffic from these providers fell between 75% and 93% in the hours after the power outage began.
Regional level
In most of the impacted regions in Spain, traffic dropped off quickly and stabilized, or continued to fall further. However, some recovery in traffic is also evident, and can be seen in Navarre, La Rioja, Cantabria, and Basque Country. This traffic recovery is likely associated with an initial restoration of power in those regions, as an update from Red Eléctrica (operator of Spain’s national electricity grid) noted that “Electricity is now available in parts of Catalonia, Aragon, the Basque Country, Galicia, Asturias, Navarre, Castile and León, Extremadura, Andalusia, and La Rioja.”
Network quality
The power outage also impacted the quality of connectivity at a national level in Spain. Prior to the loss of power, median download speeds across the country were around 35 Mbps, but within several hours after the state of the outage, fell as low as 19 Mbps. Interestingly, the median bandwidth didn’t see the clean gradual decline as it did in Portugal, instead falling and recovering twice before gradually declining.
As expected, latency at a country level saw a significant increase. Prior to the loss of power, median latency was around 22 ms, but grew to as much as 40 ms. As in Portugal, the lower download speeds and higher latency are likely due to the congestion of the network links that remained available.
Routing
Similar to Portugal, network infrastructure in Spain was also impacted by the power outage, with the impact seen as a drop in announced IP address space. By 14:30 UTC, the number of announced IPv4 /24 address blocks had fallen by around 2.4%, and continued to drop further over the following hours. The number of announced IPv6 /48 address blocks fell by over 8% during that same time span, and also continued to drop in the following hours.
Impacts in other European countries
Parts of Andorra and France were also reportedly impacted by the power outage, with additional outages reported as far away as Belgium. At a national level, no traffic disruptions were evident in any of the countries.
Analysis of traffic at a regional level in France shows a slight decline concurrent with the power outage in several regions, but the drops were nominal in comparison to Spain and Portugal, and traffic volumes recovered to expected levels within 90 minutes. No impact was evident at a regional level in Andorra.
It appears that Morocco may have been impacted in some fashion by the power outage, or at least Orange Maroc was. In a post on X, the provider stated (translated) “Internet traffic has been disrupted following a massive power outage in Spain and Portugal, which is affecting international connections.” Cloudflare Radar shows that traffic from the network fell sharply around 12:00 UTC, 90 minutes after the power outage began, with a full outage beginning around 15:00 UTC.
Conclusion
Power restoration in Spain had already started as this post was being written, and full recovery will likely take hours to days. As power is restored, Internet traffic and other metrics will recover as well. The current state of Internet connectivity in Spain and Portugal can be tracked on Cloudflare Radar.
Welcome to the 21st edition of the Cloudflare DDoS Threat Report. Published quarterly, this report offers a comprehensive analysis of the evolving threat landscape of Distributed Denial of Service (DDoS) attacks based on data from the Cloudflare network. In this edition, we focus on the first quarter of 2025. To view previous reports, visit www.ddosreport.com.
While this report primarily focuses on 2025 Q1, it also includes late-breaking data from a hyper-volumetric DDoS campaign observed in April 2025, featuring some of the largest attacks ever publicly disclosed. In a historic surge of activity, we blocked the most intense packet rate attack on record, peaking at 4.8 billion packets per second (Bpps), 52% higher than the previous benchmark, and separately defended against a massive 6.5 terabits-per-second (Tbps) flood, matching the highest bandwidth attacks ever reported.
Key DDoS insights
In the first quarter of 2025, Cloudflare blocked 20.5 million DDoS attacks. That represents a 358% year-over-year (YoY) increase and a 198% quarter-over-quarter (QoQ) increase.
Around one third of those, 6.6 million, targeted the Cloudflare network infrastructure directly, as part of an 18-day multi-vector attack campaign.
Furthermore, in the first quarter of 2025, Cloudflare blocked approximately 700 hyper-volumetric DDoS attacks that exceeded 1 Tbps or 1 Bpps — an average of around 8 attacks per day.
To learn more about DDoS attacks and other types of cyber threats, refer to our Learning Center. Visit Cloudflare Radar to view this report in its interactive version where you can drill down further. There’s a free API for those interested in investigating Internet trends. You can also learn more about the methodologies used in preparing these reports.
DDoS attacks in numbers
In the first quarter of 2025, we blocked 20.5 million DDoS attacks. For comparison, during the calendar year 2024, we blocked 21.3 million DDoS attacks. In just this past quarter, we blocked 96% of what we blocked in 2024.
The most significant increase was in network-layer DDoS attacks. In 2025 Q1, we blocked 16.8M network-layer DDoS attacks. That’s a 397% QoQ increase and a 509% YoY increase. HTTP DDoS attacks also increased — a 7% QoQ increase and a 118% YoY increase.
We count DDoS attacks based on unique real-time fingerprints generated by our systems. In some instances, a single attack or campaign may generate multiple fingerprints, particularly when different mitigation strategies are applied. While this can occasionally lead to higher counts, the metric offers a strong overall indicator of attack activity during a given period.
Attacks target the Cloudflare network and Internet infrastructure
Of the 20.5 million DDoS attacks blocked in Q1, 16.8 million were network-layer DDoS attacks, and of those, 6.6M targeted Cloudflare’s network infrastructure directly. Another 6.9 million targeted hosting providers and service providers protected by Cloudflare.
In the graph below, daily aggregates of attacks against Cloudflare are represented by the blue line, and the other colors represent the various hosting providers and Internet service providers using Cloudflare’s Magic Transit service that were attacked simultaneously.
Hyper-volumetric DDoS attacks
Hyper-volumetric DDoS attacks are attacks that exceed 1-2 Tbps or 1 Bpps. In 2025 Q1, we blocked over 700 of these attacks. Approximately 4 out of every 100,000 network-layer DDoS attacks were hyper-volumetric. Hyper-volumetric DDoS attacks tend to take place over UDP.
Hyper-volumetric attacks continue spill into Q2
While this report primarily focuses on 2025 Q1, we believe it is important to also highlight the significant hyper-volumetric record-breaking DDoS attacks that continued into Q2. As such, we have included initial insights from that campaign.
In the second half of April 2025, Cloudflare’s systems automatically detected and blocked dozens of hyper-volumetric DDoS attacks as part of an intense campaign. The largest attacks peaked at 4.8 Bpps and 6.5 Tbps, with these massive surges typically lasting between 35 and 45 seconds. At 6.5 Tbps, this attack matches the largest publicly disclosed DDoS attack to date. The 4.8 Bpps attack is the largest ever to be disclosed from the packet intensity perspective, approximately 52% larger than the previous 3.15 Bpps record.
The attacks originated from 147 countries and targeted multiple IP addresses and ports of a hosting provider that is protected by Cloudflare Magic Transit. All the attacks were successfully blocked by Cloudflare’s network.
Threat actors
When surveying Cloudflare customers that were targeted by DDoS attacks, the majority said they didn’t know who attacked them. The ones that did know reported their competitors as the number one threat actor behind the attacks (39%), which is similar to last quarter. This is quite common in the gaming and gambling industry.
Another 17% reported that a state-level or state-sponsored threat actor was behind the attack, and a similar percentage reported that a disgruntled user or customer was behind the attack.
Another 11% reported that they mistakenly inflicted the DDoS attack on themselves (self-DDoS) and a similar percentage said an extortionist was behind the attacks. 6% reported that the attacks were launched by disgruntled or former employees.
Anatomy of a DDoS attack
On the network-layer, SYN flood remains the most common Layer 3/4 DDoS attack vector, followed by DNS flood attacks. Mirai-launched DDoS attacks take the third place, replacing UDP flood attacks.
In the HTTP realm, over 60% of the attacks were identified and blocked as known botnets, 21% were attacks with suspicious HTTP attributes, another 10% were launched by botnets impersonating browsers, and the remaining 8% were generic floods, attacks of unusual request patterns, and cache busting attacks.
Emerging threats
In 2025 Q1, we saw a 3,488% QoQ increase in CLDAP reflection/amplification attacks. CLDAP (Connectionless Lightweight Directory Access Protocol) is a variant of LDAP (Lightweight Directory Access Protocol), used for querying and modifying directory services running over IP networks. CLDAP is connectionless, using UDP instead of TCP, making it faster but less reliable. Because it uses UDP, there’s no handshake requirement, which allows attackers to spoof the source IP address, thus allowing attackers to exploit it as a reflection vector. In these attacks, small queries are sent with a spoofed source IP address (the victim’s IP), causing servers to send large responses to the victim, overwhelming it. Mitigation involves filtering and monitoring unusual CLDAP traffic.
We also saw a 2,301% QoQ increase in ESP reflection/amplification attacks. The ESP (Encapsulating Security Payload) protocol is part of IPsec and provides confidentiality, authentication, and integrity to network communications. However, it can be abused in DDoS attacks if malicious actors exploit misconfigured or vulnerable systems to reflect or amplify traffic towards a target, leading to service disruption. Like with other protocols, securing and properly configuring the systems using ESP is crucial to block the risks of DDoS attacks.
Attack size & duration
Despite the increase in hyper-volumetric attacks, most DDoS attacks are small. In 2025 Q1, 99% of Layer 3/4 DDoS attacks were under 1 Gbps and 1 Mpps. Similarly, 94% of HTTP DDoS attacks were 1 million requests per second (rps). However, ‘small’ is a relative term and most Internet properties wouldn’t be able to withstand even those small attacks. They can easily saturate unprotected Internet links and crash unprotected servers.
Furthermore, most attacks are very short-lived. 89% of Layer 3/4 DDoS attacks and 75% of HTTP DDoS attacks end within 10 minutes. Even the largest, record-breaking, hyper-volumetric DDoS attacks can be very short, such as the 35-second attack seen in the examples above. 35 seconds, or even 10 minutes, is not a sufficient time for manual mitigation or activating an on-demand solution: by the time a security analyst receives the alert, and analyzes the attack, it’s already over. And while the attacks may be very short, the trickle effect of attack leads to network and applications failures that can take days to recover from — all whilst services are down or degraded. The current threat landscape leaves no time for human intervention. Detection and mitigation should be always-on, in-line and automated — with sufficient capacity and global coverage to handle the attack traffic along with legitimate peak time traffic.
On the other hand, hyper-volumetric HTTP DDoS attacks that exceed 1 Mrps doubled their share. In 2025 Q1, 6 out of every 100 HTTP DDoS attacks exceeded 1 Mrps. On the network-layer, 1 out of every 100,000 attacks exceeded 1 Tbps or 1 Bpps.
Attack example
One example of such an attack targeted a Cloudflare Magic Transit customer. The customer itself is a US-based hosting provider that offers web servers, Voice over IP (VoIP) servers, and game servers amongst its solutions. This specific attack targeted port 27015. This port is most commonly associated with multiplayer gaming servers, especially Valve’s Source engine games, such as Counter-Strike: Global Offensive (CS:GO), Team Fortress 2, Garry’s Mod, Left 4 Dead, and Half-Life 2: Deathmatch.
It’s used for the game server connection, letting clients connect to the server to play online. In many cases, this port is open for both UDP and TCP, depending on the game and what kind of communication it’s doing. This customer was targeted with multiple hyper-volumetric attacks that were autonomously blocked by Cloudflare.
Top attacked locations
The first quarter of 2025 saw a significant shift in the top 10 most attacked locations globally. Germany made a notable jump, climbing four spots — making it the most attacked country. In second place, Turkey also experienced a surge of 11 spots. In third, China, on the other hand, slipped two spots compared to the previous quarter, while Hong Kong remained unchanged. India rose four spots, and Brazil stayed the same. Taiwan dropped four positions. The Philippines experienced the largest decline, falling 6 spots. South Korea and Indonesia, however, both jumped up by two spots each.
Top attacked industries
The top 10 most attacked industries in 2025 Q1 saw some notable changes. The Gambling & Casinos industry jumped up four spots as the most attacked industry, while the Telecommunications, Service Providers and Carriers industry slid down one spot. The Information Technology & Services and Internet industries both saw minor fluctuations, moving up one and down two spots, respectively. The Gaming and Banking & Financial Services industries both saw a one-spot increase, while the Cyber Security industry made a massive leap of 37 spots compared to the previous quarter. Retail saw a slight decline of one spot, while the Manufacturing, Machinery, Technology & Engineering industry surged 28 spots. The Airlines, Aviation & Aerospace industry had the biggest jump of all, moving up 40 spots making it the tenth most attacked industry.
Top attack sources
The ranking of the top 10 largest sources of DDoS attacks in 2025 Q1 also shifted notably. Hong Kong soared to the number one position, climbing three spots from the previous quarter. Indonesia edged down to second place, while Argentina rose two spots to third. Singapore slipped two spots to fourth, and Ukraine dropped one to fifth. Brazil made a striking leap, climbing seven places to land in sixth place, closely followed by Thailand, which also rose seven spots to seventh. Germany also increased, moving up two positions to eighth. Vietnam made the most dramatic climb, jumping 15 spots to claim ninth place, while Bulgaria rounded out the list, dipping two spots to tenth.
Top source ASNs
An ASN (Autonomous System Number) is a unique identifier assigned to a network or group of IP networks that operate under a single routing policy on the Internet. It’s used to exchange routing information between systems using protocols like BGP (Border Gateway Protocol).
When looking at where the DDoS attacks originate from, specifically HTTP DDoS attacks, there are a few autonomous systems that stand out. In 2025 Q1, the German-based Hetzner (AS24940) retained its position as the largest source of HTTP DDoS attacks. It was followed by the French-based OVH (AS16276) in second, the US-based DigitalOcean (AS14061) in third, and another German-based provider, Contabo (AS51167), in fourth.
To help hosting providers, cloud computing providers and any Internet service providers identify and take down the abusive accounts that launch these attacks, we leverage Cloudflare’s unique vantage point to provide a free DDoS Botnet Threat Feed for Service Providers. Over 600 organizations worldwide have already signed up for this feed. It gives service providers a list of offending IP addresses from within their ASN that we see launching HTTP DDoS attacks. It’s completely free and all it takes is opening a free Cloudflare account, authenticating the ASN via PeeringDB, and then fetching the threat intelligence via API.
Helping build a better Internet
At Cloudflare, our mission is to help build a better Internet. A key part of that commitment is offering free protection against DDoS attacks, as well as supporting the broader Internet community by providing free tools to help other networks detect and dismantle botnets operating within their infrastructure.
As the threat landscape continues to evolve, we see that many organizations still adopt DDoS protection only after experiencing an attack or rely on outdated, on-demand solutions. In contrast, our data shows that those with proactive security strategies are far more resilient. That’s why we focus on automation and a comprehensive, always-on, in-line security approach to stay ahead of both existing and emerging threats.
Backed by our global network with 348 Tbps of capacity spanning 335 cities, we remain dedicated to delivering unmetered, unlimited DDoS protection, regardless of the size, duration, or frequency of attacks.
Cloudflare’s network spans more than 330 cities in over 125 countries, where we interconnect with over 13,000 network providers in order to provide a broad range of services to millions of customers. The breadth of both our network and our customer base provides us with a unique perspective on Internet resilience, enabling us to observe the impact of Internet disruptions at both a local and national level, as well as at a network level.
As we have noted in the past, this post is intended as a summary overview of observed and confirmed disruptions, and is not an exhaustive or complete list of issues that have occurred during the quarter. A larger list of detected traffic anomalies is available in the Cloudflare Radar Outage Center. Note that both bytes-based and request-based traffic graphs are used within the post to illustrate the impact of the observed disruptions — the choice of metric was generally made based on which better illustrated the impact of the disruption.
In the first quarter of 2025, we observed a significant number of Internet disruptions due to cable damage and power outages. Severe storms caused outages in Ireland and Réunion, and an earthquake caused ongoing connectivity issues in Myanmar. Russian networks were taken offline by a reported cyberattack and purported technical problems, while a fire took a telecom provider in Haiti offline briefly. In Q4 2024, we observed only a single government-directed Internet shutdown, and this quarter, no such shutdowns were observed. Unfortunately, this is an unusual occurrence, and in the three-year history of this blog post series, has only occurred previously in Q4 2023 and Q1 2022.
Submarine and terrestrial cable damage
Pakistan
Just after the new year, Internet connectivity in Pakistan was disrupted by a fault in the AAE-1 submarine cable. According to a January 2 alert published on social media by the Pakistan Telecommunications Authority, the cable fault occurred near Qatar, and would likely impact user experience across the country. Because there are seven submarine cables carrying international Internet traffic to/from Pakistan, the loss of AAE-1 did not cause an observable outage. However, the impact of the disruption was visible in the bandwidth and latency graphs for Pakistan. On January 2 and 3, median latency peaked at around 125 ms, up from a pre-disruption median of approximately 80 ms. Concurrent drops in bandwidth were observed, with media download speeds dropping to around 6 Mbps from a pre-disruption media of around 9 Mbps. In an “Important Update” posted to their Instagram account, Pakistan Telecom (PTCL, AS17557) also highlighted the potential for “slow browsing” — the Internet Quality graphs for that network show similarly-timed shifts in median bandwidth and latency.
Pakistan is currently connected to seven submarine cables, with two additional connections on the way in 2026. This connection diversity means that damage to or an issue with one cable will likely have minimal impact on Internet availability within the country, as traffic can be re-routed across other paths.
Syria
According to an announcement from the Syrian Ministry of Communications, a widespread Internet outage spanning January 23-24 was caused by sabotage that damaged two fiber optic cables that run along the highway between Damascus and Homs. The graphs below show that both HTTP and DNS request traffic from Syria dropped to near zero between 00:30 and 03:30 local time on January 24 (21:30 on January 23 – 00:30 on January 24 UTC). Traffic began recovering shortly thereafter, and returned to expected levels by 09:00 local time (06:00 UTC). Announced IPv4 address space for the country, almost exclusively from Syria Telecom (AS29256), also saw an approximately 90% drop during this period, which suggests that these fiber cuts caused a significant amount of Syria Telecom’s network to become unreachable during the incident.
Echoing the disruption above, Syria experienced another Internet outage on March 25, again caused by sabotage that damaged fiber optic cables. According to an announcement from the Syrian Ministry of Communications, the damage occurred in the Maaloula and Hasiya regions, resulting in a near complete outage between 03:00 – 13:15 local time (00:00 – 10:15 UTC). Similar to the January outage, the graphs below show a near complete loss of HTTP request traffic and a significant loss of announced IPv4 address space.
Somewhat paradoxically, DNS request volume from Syria was elevated during this outage, in contrast to the behavior observed during the January event. It isn’t clear what drove the additional traffic to Cloudflare’s 1.1.1.1 DNS resolver in this case.
Published reports disagree on the underlying cause of the Airtel issue, with one source claiming that it was related to an ongoing payment dispute, while another claims that it was due to reported fiber cuts in Airtel’s network.
Show less
Widespread power outages
Angola
Eleven provinces in Angola lost electrical power on January 6 due to an interruption in the North and Center Interconnected System, according to the National Electricity Transmission Network (RNT). The widespread power outage disrupted Internet connectivity across the country, leading to a drop in traffic between 14:45 – 22:00 local time (13:45 – 21:00 UTC). Published reports said that RNT was investigating the cause of the power outage, but no subsequent information was available confirming a specific cause.
Sri Lanka
Monkey business at the Pandura electrical substation caused an island-wide power outage in Sri Lanka on February 9. More seriously, a monkey coming into contact with a grid transformer caused the power outage, which resulted in a multi-hour disruption to Internet traffic from the country. Traffic initially dropped around 11:30 local time (06:00 UTC), and recovered by around 21:00 local time (15:30 UTC). The graph below for AS18001 (Dialog), a major Sri Lankan network services provider, illustrates the impact on traffic.
Chile
On February 25, a massive power outage in Chilereportedly impacted 98.5% of the country. A published report noted that there was an interruption in the power supply from Arica to the Los Lagos region, caused by a disconnection of the 500 kV transmission system in the Norte Chico. The power outage resulted in an immediate and significant drop in Internet traffic, as seen at a country level, as well at a network level, as shown in the graphs below. Traffic initially fell at around 14:15 local time (18:15 UTC) and recovered to expected levels approximately 12 hours later, around 02:00 local time (06:00 UTC). It was reported that as of an hour after traffic had recovered, approximately 94% of customers had power restored.
Honduras
A ground fault at the 15 de Septiembre electrical substation in El Salvador was reportedly the cause of a power outage that resulted in a multi-hour Internet disruption in Honduras on March 1. The Regional Operator Entity (OER) stated that the failure occurred at 09:22 local time (15:22 UTC), which resulted in traffic from the country dropping by about half. The disruption to Internet connectivity was relatively short-lived, as traffic returned to expected levels approximately two hours later.
Cuba
According to an X post from @EnergiasMinasCub (the Cuban state agency responsible for promoting the sustainable development of the country’s energy, geological, and mining sectors), at around 20:15 local time on March 14 (00:15 UTC on March 15) “a failure at the Diezmero substation caused a significant loss of generation in the west of #Cuba and with it the failure of the National Electric System, SEN”. This widespread power outage resulted in an immediate drop in request traffic from Cuba. Over the following two days, X posts from @EnergiasMinasCub, @OSDE_UNE (the Cuban Electric Union), and @ETECSA_Cuba (the Cuban Telecommunications Company) kept impacted subscribers apprised of the status of ongoing repairs. Traffic levels returned to expected levels around 20:00 local time on March 16 (00:00 on March 17 UTC), two full days after the incident began.
Panama
An explosion and fire at the La Chorrera Thermoelectric Power Plant in Panama caused a massive power outage across the country, starting at 23:40 local time on March 15 (04:40 on March 16 UTC). As expected, traffic dropped immediately, as seen in the HTTP and DNS request graphs below. However, recovery was fairly swift, as the electric system saw 75% recovery by 03:00 local time (08:00 UTC), with full restoration completed at 06:08 local time (11:08 UTC). Traffic volumes began to increase after power was restored.
Severe weather
Ireland
Storm Éowynwreaked havoc on Ireland in late January, knocking out power and water, causing property damage, and limiting air and train travel. The storm’s impacts also disrupted Internet connectivity, as we observed traffic from Connacht and Ulster fall by 75% as compared to the previous week at 06:30 local time (06:30 UTC) on January 24. As recovery from the storm progressed over the next several days, Internet traffic gradually recovered as well, with traffic in the two provinces reaching levels near those seen the prior week by mid-day on January 28.
Réunion
Cyclone Garance made landfall over the French territory of Réunion at ~10:00 local time (06:00 UTC) on February 28. Damage from the storm’s 100+ miles/hour (160+ km/hour) winds caused power outages and infrastructure damage, resulting in disruptions to Internet connectivity. The most significant impacts to traffic were observed in the hours after the storm made landfall, but it took several days before traffic returned to expected levels, reaching that point around 08:00 local time (04:00 UTC) on March 4.
While recovery efforts stretch into April, regular traffic patterns and volumes bounced back within days, as seen in the HTTP and DNS request graphs below.
However, at a network level, recovery has been mixed. Both AS134840 (MCCL) and AS136442 (Oceanwave) saw significant drops in traffic after the earthquake occurred, and traffic remained disrupted on both networks through the end of the first quarter. Peak traffic on MCCL has increased slightly, but nearly two weeks on, remains significantly lower than pre-earthquake levels. Traffic on Oceanwave saw steady growth after the initial disruption, and as of this writing is approaching pre-earthquake peaks. (It is unclear what caused the significant spike in request traffic seen from Oceanwave on April 3-4.) In contrast to these two providers, traffic from AS163255 (Mytel) saw a significantly smaller disruption, and a significantly faster recovery, as did traffic from AS135300 (Myanmar Broadband Telecom).
Cyberattack
Russia
On January 7, Russian Internet provider Nodex (AS29329) said in a post on Russian social media platform VKontakte (translated) “Dear Subscribers, our technical staff is still working on restoring the network. The process is painstaking and long. We express our deep gratitude to those who support us in this difficult moment! This is really important for us. Let me remind you that our network was attacked by Ukrainian hackers, which resulted in its complete failure. At the moment, its functioning is being restored. There will be communication. When, is still unknown.” The Ukrainian Cyber Alliance, a community of pro-Ukraine cyber activists formed in 2016, claimed responsibility for the attack in a Telegram post.
The “complete failure” of the Nodex network is visible in the traffic graph below, where Internet traffic from the network began to drop after 03:00 local time (00:00 UTC) on January 7, reaching zero around 05:30 local time (02:30 UTC). Traffic from the network remained essentially non-existent until around 14:00 local time (11:00 UTC) the next day, recovering fairly quickly after that. Announced IPv4 address space fell by two-thirds at the same time that traffic volume dropped to zero, but recovered at 21:20 local time (18:20 UTC).
Fire damage
Los Angeles, California
Between January 7-9, during the early days of the 2025 Southern California wildfires — which affected the Palisades and Eaton areas in Los Angeles — there were clear Internet disruptions in at least 13 Los Angeles neighborhoods. According to Cloudflare’s data, traffic drops of over 50% compared to the previous week were especially noticeable in cities like Pacific Palisades, Altadena, Malibu, Temple City, and Monrovia, among others. In the weeks that followed, traffic remained significantly lower than before the fires, particularly in Pacific Palisades and Altadena, reflecting the devastation in those areas. However, traffic recovery occurred significantly sooner in Malibu, Temple City, and Monrovia, although peak traffic levels remain somewhat below pre-fire levels.
Haiti
On January 15, an X post from the Director General of Digicel Haiti (AS27653) stated (translated) “Dear customers, last night at 8:30 pm we suffered damage to 2 of our international fiber optic cables caused by a fire in the metropolitan area. At 10:30 am a 3rd outage affected all international services, Internet and Moncash. Our teams are mobilized to resolve the problem as quickly as possible.” These fires ultimately caused two complete Internet outages for Digicel Haiti’s customers, as seen in the graphs below.
Both traffic and announced IP address space (IPv4 & IPv6) dropped to zero between 20:30 – 21:45 local time on January 14 (01:30 – 02:45 on January 15 UTC) and again between 10:15 – 11:00 local time on January 15 (15:15 – 16:00 UTC).
Subscribers to Magticom (AS16010), one of the largest Internet providers in Georgia, experienced a complete outage on January 27. Request traffic and announced IP address space disappeared at 21:25 local time (17:25 UTC), recovering at 01:55 local time on January 28 (21:55 UTC). A (translated) Facebook post from Magticom explained that the company’s Internet connectivity comes through “channels from Europe” and that “damage was reported in Turkey, where heavy snowfall and avalanche risks have prevented the partner company’s technical teams from reaching the affected area”. Further, it noted that on the backup channel, “suspicious damage was reported at three points on the Georgian side, in the territory of Adjara…” Magticom’s published start and end times for the outage align with the loss and recovery of traffic and announced IP address space observed in Cloudflare data.
France
Subscribers of Bouygues Telecom (AS5410) in France experienced a brief disruption to their Internet connectivity on March 11. According to a (translated) X post from the provider, “Following a technical incident between 5 a.m. and 7 a.m. you may have encountered difficulties using your services.” As seen in the request traffic graphs below, a drop in traffic is visible between 05:00 – 06:45 local time (04:00 – 05:45 UTC), aligning with the provider’s stated timeframe. Bouyges Telecom did not provide any subsequent details around the cause of the “technical incident”.
Unknown cause
Syria
Major Internet outages and disruptions in Syria are generally well documented, such as the cable cuts discussed above. However, on February 3, a multi-hour disruption was observed in the country, but no underlying cause was ever publicly disclosed. Starting approximately 14:00 local time (11:00 UTC), traffic from the country dropped by approximately 80%, along with a ~60% drop in announced IPv4 address space. Both traffic and announced IP address space returned to expected levels around 23:00 local time (20:00 UTC). The outage was confirmed in an X post from Syrian Television.
Conclusion
While the single government-directed shutdown last quarter, and the lack of such shutdowns this quarter, is an encouraging trend, we expect that it will be short-lived if countries like Iraq and Syria once again take such measures to prevent cheating on nationwide exams. As always, we encourage governments to recognize the collateral damage of such actions, and suggest that they explore alternative solutions to this problem.
Security and attacks continues to be a very active environment, and the visibility that Cloudflare Radar provides on this dynamic landscape has evolved and expanded over time. To that end, during 2023’s Security Week, we launched our URL Scanner, which enables users to safely scan any URL to determine if it is safe to view or interact with. During 2024’s Security Week, we launched an Email Security page, which provides a unique perspective on the threats posed by malicious emails, spam volume, the adoption of email authentication methods like SPF, DMARC, and DKIM, and the use of IPv4/IPv6 and TLS by email servers. For Security Week 2025, we are adding several new DDoS-focused graphs, new insights into leaked credential trends, and a new Bots page to Cloudflare Radar. We are also taking this opportunity to refactor Radar’s Security & Attacks page, breaking it out into Application Layer and Network Layer sections.
Below, we review all of these changes and additions to Radar.
Layered security
Since Cloudflare Radar launched in 2020, it has included both network layer (Layers 3 & 4) and application layer (Layer 7) attack traffic insights on a single Security & Attacks page. Over the last four-plus years, we have evolved some of the existing data sets on the page, as well as adding new ones. As the page has grown and improved over time, it risked becoming unwieldy to navigate, making it hard to find the graphs and data of interest. To help address that, the Security section on Radar now features separate Application Layer and Network Layer pages. The Application Layer page is the default, and includes insights from analysis of HTTP-based malicious and attack traffic. The Network Layer page includes insights from analysis of network and transport layer attacks, as well as observed TCP resets and timeouts. Future security and attack-related data sets will be added to the relevant page. Email Security remains on its own dedicated page.
A geographic and network view of application layer DDoS attacks
Radar’s quarterly DDoS threat reports have historically provided insights, aggregated on a quarterly basis, into the top source and target locations of application layer DDoS attacks. A new map and table on Radar’s Application Layer Security page now provide more timely insights, with a global choropleth map showing a geographical distribution of source and target locations, and an accompanying list of the top 20 locations by share of all DDoS requests. Source location attribution continues to rely on the geolocation of the IP address originating the blocked request, while target location remains the billing location of the account that owns the site being attacked.
Over the first week of March 2025, the United States, Indonesia, and Germany were the top sources of application layer DDoS attacks, together accounting for over 30% of such attacks as shown below. The concentration across the top targeted locations was quite different, with customers from Canada, the United States, and Singapore attracting 56% of application layer DDoS attacks.
In addition to extended visibility into the geographic source of application layer DDoS attacks, we have also added autonomous system (AS)-level visibility. A new treemap view shows the distribution of these attacks by source AS. At a global level, the largest sources include cloud/hosting providers in Germany, the United States, China, and Vietnam.
For a selected country/region, the treemap displays a source AS distribution for attacks observed to be originating from that location. In some, the sources of attack traffic are heavily concentrated in consumer/business network providers, such as in Portugal, shown below. However, in other countries/regions that have a large cloud provider presence, such as Ireland, Singapore, and the United States, ASNs associated with these types of providers are the dominant sources. To that end, Singapore was listed as being among the top sources of application layer DDoS attacks in each of the quarterly DDoS threat reports in 2024.
Have you been pwned?
Every week, it seems like there’s another headline about a data breach, talking about thousands or millions of usernames and passwords being stolen. Or maybe you get an email from an identity monitoring service that your username and password were found on the “dark web”. (Of course, you’re getting those alerts thanks to a complementary subscription to the service offered as penance from another data breach…)
This credential theft is especially problematic because people often reuse passwords, despite best practices advising the use of strong, unique passwords for each site or application. To help mitigate this risk, starting in 2024, Cloudflare began enabling customers to scan authentication requests for their websites and applications using a privacy-preserving compromised credential checker implementation to detect known-leaked usernames and passwords. Today, we’re using aggregated data to display trends in how often these leaked and stolen credentials are observed across Cloudflare’s network. (Here, we are defining “leaked credentials” as usernames or passwords being found in a public dataset, or the username and password detected as being similar.)
Leaked credentials detection scans incoming HTTP requests for known authentication patterns from common web apps and any custom detection locations that were configured. The service uses a privacy-preserving compromised credential checking protocol to compare a hash of the detected passwords to hashes of compromised passwords found in databases of leaked credentials. A new Radar graph on the worldwide Application Layer Security page provides visibility into aggregate trends around the detection of leaked credentials in authentication requests. Filterable by authentication requests from human users, bots, or all (human + bot), the graph shows the distribution requests classified as “clean” (no leaked credentials detected) and “compromised” (leaked credentials, as defined above, were used). At a worldwide level, we found that for the first week of March 2025, leaked credentials were used in 64% of all, over 65% of bot, and over 44% of human authorization requests.
This suggests that from a human perspective, password reuse is still a problem, as is users not taking immediate actions to change passwords when notified of a breach. And from a bot perspective, this suggests that attackers know that there is a good chance that leaked credentials for one website or application will enable them to access that same user’s account elsewhere.
As a complement to the leaked credentials data, Radar is also now providing a worldwide view into the share of authentication requests originating from bots. Note that not all of these requests are necessarily malicious — while some may be associated with credential stuffing-style attacks, others may be from automated scripts or other benign applications accessing an authentication endpoint. (Having said that, automated malicious attack request volume far exceeds legitimate automated login attempts.) During the first week of March 2025, we found that over 94% of authentication requests came from bots (were automated), with the balance coming from humans. Over that same period, bot traffic only accounted for 30% of overall requests. So although bots don’t represent a majority of request traffic, authentication requests appear to comprise a significant portion of their activity.
Bots get a dedicated page
As a reminder, bot traffic describes any non-human Internet traffic, and monitoring bot levels can help spot potential malicious activities. Of course, bots can be helpful too, and Cloudflare maintains a list of verified bots to help keep the Internet healthy. Given the importance of monitoring bot activity, we have launched a new dedicated Bots page in the Traffic section of Cloudflare Radar to support these efforts. For both worldwide and location views over the selected time period, the page shows the distribution of bot (automated) vs. human HTTP requests, as well as a graph showing bot traffic trends. (Our bot score, combining machine learning, heuristics, and other techniques, is used to identify automated requests likely to be coming from bots.)
Both the 2023 and 2024 Cloudflare Radar Year in Review microsites included a “Bot Traffic Sources” section, showing the locations and networks that Cloudflare determined that the largest shares of automated/likely automated traffic was originating from. However, these traffic shares were published just once a year, aggregating traffic from January through the end of November.
In order to provide a more timely perspective, these insights are now available on the new Radar Bots page. Similar to the new DDoS attacks content discussed above, the worldwide view includes a choropleth map and table illustrating the locations originating the largest shares of all bot traffic. (Note that a similar Traffic Characteristics map and table on the Traffic Overview page ranks locations by the bot traffic share of the location’s total traffic.) Similar to Year in Review data linked above, the United States continues to originate the largest share of bot traffic.
In addition, the worldwide view also breaks out bot traffic share by AS, mirroring the treemap shown in the Year in Review. As we have noted previously, cloud platform providers account for a significant amount of bot traffic.
At a location level, depending on the country/region selected, the top sources of bot traffic may be cloud/hosting providers, consumer/business network providers, or a mix. For instance, France’s distribution is shown below, and four ASNs account for just over half of the country’s bot traffic. Of these ASNs, two (AS16276 and AS12876) belong to cloud/hosting providers, and two (AS3215 and AS12322) belong to network providers.
In addition, the Verified Bots list has been moved to the new Bots page on Radar. The data shown and functionality remains unchanged, and links to the old location will automatically be redirected to the new one.
Summary
The Cloudflare dashboard provides customers with specific views of security trends, application and network layer attacks, and bot activity across their sites and applications. While these views are useful at an individual customer level, aggregated views at a worldwide, location, and network level provide a macro-level perspective on trends and activity. These aggregated views available on Cloudflare Radar not only help customers understand how their observations compare to the larger whole, but they also help the industry understand emerging threats that may require action.
The underlying data for the graphs and data discussed above is available via the Radar API (Application Layer, Network Layer, Bots, Leaked Credentials). The data can also be interactively explored in more detail across locations, networks, and time periods using Radar’s Data Explorer and AI Assistant. And as always, Radar and Data Explorer charts and graphs are downloadable for sharing, and embeddable for use in your own blog posts, websites, or dashboards.
AI (Artificial Intelligence) is a broad concept encompassing machines that simulate or duplicate human cognitive tasks, with Machine Learning (ML) serving as its data-driven engine. Both have existed for decades but gained fresh momentum when Generative AI, AI models that can create text, images, audio, code, and video, surged in popularity following the release of OpenAI’s ChatGPT in late 2022. In this blog post, we examine the most popular Generative AI services and how they evolved throughout 2024 and early 2025. We also try to answer questions like how much traffic growth these Generative AI websites have experienced from Cloudflare’s perspective, how much of that traffic was malicious, and other insights.
To accomplish this, we use aggregated data from our 1.1.1.1 DNS resolver to measure the popularity of specific Generative AI services. We typically do this for our Year in Review and now also on the DNS domain rankings page of Cloudflare Radar, where we aggregate related domains for each service and identify sites that provide services to users. For overall traffic growth and attack trends, we rely on aggregated data from the cohort of Generative AI customers that use Cloudflare for performance (including AI inference) and security.
Key takeaways:
ChatGPT maintains the top spot: OpenAI’s ChatGPT remains #1 in Generative AI popularity, hovering around the top 50 Internet domains overall, up from #200 in late 2023.
Rapid traffic growth: Monthly traffic to Generative AI services grew by 251% over the past year, between February 1, 2024, and March 1, 2025.
New entrants on the rise: Chinese chatbot DeepSeek and Grok/xAI quickly climbed the ranks, illustrating how fast newcomers can gain traction in the AI space.
Global reach with regional variations: The U.S. leads with 23% of Generative AI visitors, but Asia dominates certain platforms like poe.com. Brazil also shows up as a strong user of multiple AI services.
Targeted by cyberattacks: Over 197 billion potential attack requests were blocked by Cloudflare in the past year, with 39 billion part of DDoS attack campaigns — particularly affecting general AI chatbots and image-generation sites.
Generative AI services popularity ranking: new kids in town
We begin by looking at Generative AI service popularity using the new AI tab on Cloudflare Radar. The newest entrant to our Top 10 is DeepSeek, a Chinese chatbot launched on January 10, 2025. It debuted at #9 on January 26, 2025, climbed to #3 on January 29 (coinciding with Lunar/Chinese New Year), and maintained that position until February 4, before settling at its current position of #6.
Also highlighted here is another AI chatbot that has recently gained popularity — X’s Grok/xAI. This Generative AI service released its Android app in February and gained attention after February 17, 2025, when it launched the Grok-3 model. In our Generative AI ranking, it first entered the top 10 on February 21, 2025, at #9, briefly reached Claude’s typical spot at #8, and is now fluctuating between #9 and #10.
Here is the current Generative AI Top 10 from the Cloudflare Radar AI page, as of March 9, 2025, with ChatGPT/OpenAI as #1 since the start of the year (a trend also observed in previous years, as the table below shows).
To make ranking changes and trends easier to spot, the table below shows the February 1 – March 1, 2025 (monthly average) standings on the left, with color-coded comparisons to 2024’s list: services that dropped since 2024 appear in red, while new or higher-ranked ones appear in green. For reference, the second column presents the top 10 from our 2024 Year in Review (including comparisons to the previous year), and the third column displays the 2023 Top 10.
Top 10 Generative AI services in February 2025 ChatGPT / OpenAI (=) Character.AI (=) QuillBot (#4 in 2024) Codeium (#3) GitHub Copilot (#7) DeepSeek (new) Perplexity (#6) Claude / Anthropic (#5) Hugging Face (new) Suno AI (new)
Top 10 Generative AI services in 2023 (Radar Year in Review) ChatGPT / OpenAI Character.AI QuillBot Hugging Face Poe Perplexity Wordtune Google Bard ProWritingAid Voicemod
Other than the previously mentioned DeepSeek, Grok/xAI and ChatGPT/OpenAI, the top 10 includes other chatbots like Anthropic’s Claude, as well as other types of Generative AI services. Character.AI — a specialized platform for creating and interacting with character-based personalities — is #2, then there’s Perplexity (#7) that functions as an AI search engine, while QuillBot (#3) is an AI-powered writing assistant for paraphrasing, grammar, and summarizing. Codeium (4#), which includes developer productivity services like Windsurf AI, and GitHub Copilot (#5) serve as AI coding assistants.
There’s also Hugging Face (#9), an open-source hub for AI models (we’re including it here as a Generative AI platform, just as we do for other AI model enablers like Replicate and Stability AI), and Suno AI (#10), a music generator that creates songs from text prompts.
We saw that Grok/xAI entered the top 10 during the last days of February, but since we’re using February’s monthly average, it appears at #11 here. Curious about the rest of the February 2025 Top 20? Here it is, with AI coding services having a strong presence — beyond Codeium and GitHub Copilot, Sider AI and Tabnine also make the list.
11 Grok / xAI
12 Poe
13 Sider AI
14 Civitai
15 Tabnine
16 Google Gemini
17 Voicemod
18 GliaCloud
19 Runway ml
20 Midjourney
We have published Generative AI popularity rankings in both the 2023 and 2024 Cloudflare Radar Year in Review, and in both, OpenAI’s ChatGPT has consistently held the #1 spot. In 2024, as explained in our blog post, ChatGPT also moved in our overall rankings, nearly breaking into the top 50 by the end of the year. (It was just outside the top 100 in 2023).
ChatGPT’s influence in the overall ranking
A recent addition to Cloudflare Radar is the updated domains ranking page in our DNS section, which includes a number of detailed trends. There, we now show the top 100 overall Internet services ranking next to a top 100 domains list. ChatGPT / OpenAI, the leading Generative AI service, is typically ranked in the mid-50’s on weekdays and close to #60 on weekends (based on early March 2025 insights), next to non-AI services like Temu, eBay, or Disney Plus.
Looking at previous trends, as noted in our Year in Review blog, ChatGPT / OpenAI ranked around #200 in early 2023 and climbed to near the top 100 by the end of the year. In 2024, it started just outside the top 100, reached the top 60 in May with the release of the 4o model, and has been near the top 50 since September 2024, aligning with the return of employees and students to their routines.
Visitor location distribution: Americas, Europe and Asia
The Domain Information page on Cloudflare Radar enables users to look at the location popularity of a specific domain (from the last seven days), derived from Cloudflare 1.1.1.1 resolver traffic data in a period of 48 hours (Radar’s default) on March 3-4, 2025.
In this case, the chatgpt.com domain has most of its DNS traffic from the United States (17%), followed by Germany(7%), Brazil (4%), Indonesia (4%), and India (4%).
In the case of the new kid in town, deepseek.com, the U.S. is #1 location, with 14% of that domain’s DNS traffic, followed by China (11%), Germany (10%), Brazil (7%), and Hong Kong (5%).
Grok.com, on the other hand, has 20% of its traffic from the U.S., 8% from Hong Kong, 6% from Germany, 6% from Japan, and 6% from Vietnam, reflecting a strong presence in Asia within its top 5 locations. Asia is even more dominant for another well-known Generative AI chatbot domain, poe.com, with Hong Kong ranking #1 (29% of traffic), followed by the U.S. (13%), Japan (6%), China (6%), and Singapore (5%).
Hugging Face (huggingface.co), the Generative AI models platform, also has the U.S. as its top location (34% of traffic), but its top 5 includes four European countries: France (6%), the United Kingdom (6%), Germany (4%), and Sweden (4%).
Looking more specifically at AI-powered coding tools, DNS traffic for githubcopilot.com is primarily driven by the United States (22%), followed by Germany (6%), Hong Kong (5%), India (5%), and Japan (5%). A similar pattern appears for codeium.com, where the U.S. leads with 15%, followed by Hong Kong (8%), Japan (7%), Brazil (5%), and the Netherlands (5%). Likewise, cursor.com has 20% of its DNS traffic from the U.S., followed by Hong Kong (10%), India (6%), China (6%), and Japan (5%). Tabnine.com, another AI code completion tool, has its highest traffic from the U.S. (15%), followed by India (6%), Brazil (5%), Germany (5%), and Hong Kong (5%).
The DNS traffic data from Cloudflare Radar highlights strong U.S. usage across all major Generative AI and AI coding tools, with regional adoption varying by platform. (It is worth noting that 1.1.1.1 has a larger user base in the U.S., but these specific trends vary depending on the domains.)
Asia dominates poe.com and AI coding tools like Codeium and Cursor.
Europe plays a significant role in Hugging Face and GitHub Copilot.
Brazil emerges as a notable player, particularly in DeepSeek and Tabnine.
Generative AI general traffic growth
Cloudflare, in terms of Generative AI customers, has a unique perspective on the industry. We power many Generative AI services, both large and small. From a cohort of Generative AI customers — some recently popular, others established chatbots or image AI generators, and some just starting — we’ve aggregated both HTTP request data over the past months and application-layer attack trends.
Let’s start with HTTP requests traffic growth in the past year. From February 1, 2024, through March 1, 2025 (a 13-month period to compare February 2024 with February 2025), monthly traffic grew a total of 251%, and over 2% of the requests processed by Cloudflare were mitigated as potential attacks.
Note that there was an increase over most of the entities in the cohort of Generative AI websites, and this 251% growth also includes recent Generative AI customers, although those mostly don’t influence the growth trend that much — if we exclude Generative AI customers that onboarded to Cloudflare in late 2024 and early 2025, year growth is 234%.
In this next perspective, shown at a daily level, the expected drop during Christmas and the end of the year holidays is quite clear. Another trend surfaces: the cohort of Cloudflare’s Generative AI customers definitely see more use during weekdays than weekends, suggesting a workplace focus. The clear drop during the holidays also includes the summer in the Northern Hemisphere — there’s a slight drop in peak traffic in July, for example (similar to what we typically see in terms of general traffic in most countries).
We also have a perspective on the top visitor locations to Generative AI websites, where the U.S. ranks #1, with 23% of all requests in this category, followed by India (8%), Brazil (5%), Indonesia (4%), and Philippines (4%) in the top 5. European countries, such as the U.K. and Germany, come next in the ranking. Below, we show the top 50 for further exploration. Note that Egypt is the first African country appearing in the ranking, at #32, with the same 0.7% as South Africa.
Top locations by share of traffic to Generative AI websites
Rank
Country
Percentage of total
Rank
Country
Percentage of total
1
United States
22.7%
26
Singapore
1.1%
2
India
8.3%
27
Ukraine
1%
3
Brazil
4.9%
28
Taiwan
0.9%
4
Indonesia
4.2%
29
Thailand
0.9%
5
Philippines
4%
30
Chile
0.8%
6
United Kingdom
3.8%
31
United Arab Emirates
0.7%
7
Germany
3.7%
32
Egypt
0.7%
8
Canada
3.2%
33
Saudi Arabia
0.7%
9
France
3%
34
South Africa
0.7%
10
Mexico
2.7%
35
Sweden
0.6%
11
Japan
2.4%
36
Belgium
0.6%
12
Russian Federation
2.2%
37
Bangladesh
0.6%
13
Spain
2%
38
Switzerland
0.6%
14
Australia
2%
39
Morocco
0.6%
15
South Korea
1.8%
40
Ecuador
0.6%
16
Vietnam
1.6%
41
Israel
0.5%
17
Italy
1.5%
42
Nigeria
0.5%
18
Malaysia
1.5%
43
Romania
0.5%
19
Turkey
1.4%
44
Portugal
0.5%
20
Poland
1.4%
45
Kazakhstan
0.5%
21
Netherlands
1.4%
46
Austria
0.4%
22
Argentina
1.2%
47
Czech Republic
0.4%
23
Colombia
1.2%
48
Hong Kong
0.4%
24
Pakistan
1.2%
49
Algeria
0.4%
25
Peru
1.1%
50
Denmark
0.4%
Attacks targeting Generative AI websites
On the security front, Generative AI websites have become key targets for DDoS attacks as they have gained attention and grown in popularity. Recently, our Cloudforce One team published a threat analysis on attacks by Anonymous Sudan targeting AI-related companies: Inside LameDuck: Analyzing Anonymous Sudan’s Threat Operations. In this report, they explained how the U.S. Department of Justice indicted two Sudanese brothers behind LameDuck, linking them to 35,000+ DDoS attacks via the Skynet Botnet. The case exposes both political and financial motives behind their operations and underscores the global effort — including Cloudflare’s — to strengthen cybersecurity.
Over the last 13 months, from February 1, 2024, until March 1, 2025, Cloudflare blocked 197 billion requests as potential attacks. Of that number, 39 billion requests were part of DDoS attacks targeting Generative AI websites.
In terms of malicious requests that were blocked, June 2024 saw the highest number of potential attacks blocked by Cloudflare, followed by January 2025. For DDoS attacks, January 2025 recorded the highest activity, followed by November 2024 and February 2024.
Looking more closely at DDoS traffic at a daily level, the largest attack occurred on February 23, 2024, when 3.7 billion requests were blocked as part of a DDoS attack. The second largest was a 1.5 billion request DDoS attack on November 13, 2024. Additionally, a series of multiday DDoS attacks took place between January 20 and 31, 2025, with January 29 seeing the highest number of DDoS attack-related requests, at over one billion (7.3 billion in total for the month).
During the February 23, 2024, DDoS attack, which targeted a specific Generative AI customer, more than 20% of all requests across all Generative AI customers were blocked as part of the attack.
Taking a more granular view of DDoS attacks against that particular Generative AI customer, the attack began on February 22, 2024, at 22:45 UTC, lasting for over eight hours of continuous traffic spikes, peaking at 270,000 requests per second. Further attacks followed, with the most significant occurring on February 26, 2024, at 03:45 UTC, lasting three minutes and peaking at 309,000 requests per second.
Another popular Generative AI customer was targeted in a DDoS campaign from January 25 to January 31, 2025, with traffic peaking on January 30, reaching 523,000 requests per second.
Another perspective to consider over the same February 2024 to February 2025 period is the type of Generative AI websites most targeted by DDoS attacks. General AI chatbots accounted for over 80% of all blocked requests, making them the primary targets.
DDoS attacks targets by Generative AI category
Category
Percentage
General Chatbots
82.7%
Image AI Generators
8.2%
Code Assistants
3.4%
Other
2.6%
AI Research & Infra
1.3%
AI Music Creation
1.2%
Writing & Content AI
0.4%
Voice & Video AI
0.3%
However, when looking at the percentage of total traffic blocked as DDoS attacks within each category, image AI-related websites had the highest proportion, with over 50% of their total traffic being blocked.
Websites category with the highest percentage of traffic blocked as DDoS attacks
Category
Blocked DDoS (%)
Image AI
50.8%
AI Chatbot
31%
AI Search
9.4%
AI Code Assistant
6.8%
AI Model
5.8%
AI Music
3.6%
AI Company
2.9%
Conclusion: AI transformation
Generative AI continues to grow and transform Internet usage, driving traffic growth of over 250% for AI services over the course of the last year. ChatGPT is definitely the most popular service, and nears the top 50 of all Internet services as seen through analysis of traffic from our 1.1.1.1 DNS resolver. New entrants like DeepSeek and Grok/xAI have quickly climbed the popularity rankings, while regional adoption patterns show the U.S., India, and Brazil leading in visitor traffic.
This rapid rise has also drawn cyberattacks, with 39 billion requests identified as DDoS attacks targeting specific Generative AI websites over the past year. While most attacks focus on general AI chatbots, image-generation sites show the highest percentage of blocked requests, at over 50%. As Generative AI evolves, tracking these trends provides a historical record of growth surges, global reach, and emerging threats.
No joke – Cloudflare’s 1.1.1.1 resolver was launched on April Fool’s Day in 2018. Over the last seven years, this highly performant and privacy–conscious service has grown to handle an average of 1.9 Trillion queries per day from approximately 250 locations (countries/regions) around the world. Aggregated analysis of this traffic provides us with unique insight into Internet activity that goes beyond simple Web traffic trends, and we currently use analysis of 1.1.1.1 data to power Radar’s Domains page, as well as the Radar Domain Rankings.
In December 2022, Cloudflare joined the AS112 Project, which helps the Internet deal with misdirected DNS queries. In March 2023, we launched an AS112 statistics page on Radar, providing insight into traffic trends and query types for this misdirected traffic. Extending the basic analysis presented on that page, and building on the analysis of resolver data used for the Domains page, today we are excited to launch a dedicated DNS page on Cloudflare Radar to provide increased visibility into aggregate traffic and usage trends seen across 1.1.1.1 resolver traffic. In addition to looking at global, location, and autonomous system (ASN) traffic trends, we are also providing perspectives on protocol usage, query and response characteristics, and DNSSEC usage.
The traffic analyzed for this new page may come from users that have manually configured their devices or local routers to use 1.1.1.1 as a resolver, ISPs that set 1.1.1.1 as the default resolver for their subscribers, ISPs that use 1.1.1.1 as a resolver upstream from their own, or users that have installed Cloudflare’s 1.1.1.1/WARP app on their device. The traffic analysis is based on anonymised DNS query logs, in accordance with Cloudflare’s Privacy Policy, as well as our 1.1.1.1 Public DNS Resolver privacy commitments.
Below, we walk through the sections of Radar’s new DNS page, reviewing the included graphs and the importance of the metrics they present. The data and trends shown within these graphs will vary based on the location or network that the aggregated queries originate from, as well as on the selected time frame.
Traffic trends
As with many Radar metrics, the DNS page leads with traffic trends, showing normalized query volume at a worldwide level (default), or from the selected location or autonomous system (ASN). Similar to other Radar traffic-based graphs, the time period shown can be adjusted using the date picker, and for the default selections (last 24 hours, last 7 days, etc.), a comparison with traffic seen over the previous period is also plotted.
For location-level views (such as Latvia, in the example below), a table showing the top five ASNs by query volume is displayed alongside the graph. Showing the network’s share of queries from the selected location, the table provides insights into the providers whose users are generating the most traffic to 1.1.1.1.
When a country/region is selected, in addition to showing an aggregate traffic graph for that location, we also show query volumes for the country code top level domain (ccTLD) associated with that country. The graph includes a line showing worldwide query volume for that ccTLD, as well as a line showing the query volume based on queries from the associated location. Anguilla’s ccTLD is .ai, and is a popular choice among the growing universe of AI-focused companies. While most locations see a gap between the worldwide and “local” query volume for their ccTLD, Anguilla’s is rather significant — as the graph below illustrates, this size of the gap is driven by both the popularity of the ccTLD and Anguilla’s comparatively small user base. (Traffic for .ai domains from Anguilla is shown by the dark blue line at the bottom of the graph.) Similarly, sizable gaps are seen with other “popular” ccTLDs as well, such as .io (British Indian Ocean Territory), .fm (Federated States of Micronesia), and .co (Colombia). A higher “local” ccTLD query volume in other locations results in smaller gaps when compared to the worldwide query volume.
Depending on the strength of the signal (that is, the volume of traffic) from a given location or ASN, this data can also be used to corroborate reported Internet outages or shutdowns, or reported blocking of 1.1.1.1. For example, the graph below illustrates the result of Venezuelan provider CANTV reportedly blocking access to 1.1.1.1 for its subscribers. A comparable drop is visible for Supercable, another Venezuelan provider that also reportedly blocked access to Cloudflare’s resolver around the same time.
Individual domain pages (like the one for cloudflare.com, for example) have long had a choropleth map and accompanying table showing the popularity of the domain by location, based on the share of DNS queries for that domain from each location. A similar view is included at the bottom of the worldwide overview page, based on the share of total global queries to 1.1.1.1 from each location.
Query and response characteristics
While traffic trends are always interesting and important to track, analysis of the characteristics of queries to 1.1.1.1 and the associated responses can provide insights into the adoption of underlying transport protocols, record type popularity, cacheability, and security.
Published in November 1987, RFC 1035 notes that “The Internet supports name server access using TCP [RFC-793] on server port 53 (decimal) as well as datagram access using UDP [RFC-768] on UDP port 53 (decimal).” Over the subsequent three-plus decades, UDP has been the primary transport protocol for DNS queries, falling back to TCP for a limited number of use cases, such as when the response is too big to fit in a single UDP packet. However, as privacy has become a significantly greater concern, encrypted queries have been made possible through the specification of DNS over TLS (DoT) in 2016 and DNS over HTTPS (DoH) in 2018. Cloudflare’s 1.1.1.1 resolver has supported both of these privacy-preserving protocols since launch. The DNS transport protocol graph shows the distribution of queries to 1.1.1.1 over these four protocols. (Setting up 1.1.1.1 on your device or router uses DNS over UDP by default, although recent versions of Android support DoT and DoH. The 1.1.1.1 app uses DNS over HTTPS by default, and users can also configure their browsers to use DNS over HTTPS.)
Note that Cloudflare’s resolver also services queries over DoH and Oblivious DoH (ODoH) for Mozilla and other large platforms, but this traffic is not currently included in our analysis. As such, DoH adoption is under-represented in this graph.
Aggregated worldwide between February 19 – February 26, distribution of transport protocols was 86.6% for UDP, 9.6% for DoT, 2.0% for TCP, and 1.7% for DoH. However, in some locations, these ratios may shift if users are more privacy conscious. For example, the graph below shows the distribution for Egypt over the same time period. In that country, the UDP and TCP shares are significantly lower than the global level, while the DoT and DoH shares are significantly higher, suggesting that users there may be more concerned about the privacy of their DNS queries than the global average, or that there is a larger concentration of 1.1.1.1 users on Android devices who have set up 1.1.1.1 using DoT manually. (The 2024 Cloudflare Radar Year in Review found that Android had an 85% mobile device traffic share in Egypt, so mobile device usage in the country leans very heavily toward Android.)
RFC 1035 also defined a number of standard and Internet specific resource record types that return the associated information about the submitted query name. The most common record types are A and AAAA, which return the hostname’s IPv4 and IPv6 addresses respectively (assuming they exist). The DNS query type graph below shows that globally, these two record types comprise on the order of 80% of the queries received by 1.1.1.1. Among the others shown in the graph, HTTPS records can be used to signal HTTP/3 and HTTP/2 support, PTR records are used in reverse DNS records to look up a domain name based on a given IP address, and NS records indicate authoritative nameservers for a domain.
A response code is sent with each response from 1.1.1.1 to the client. Six possible values were originally defined in RFC 1035, with the list further extended in RFC 2136 and RFC 2671. NOERROR, as the name suggests, means that no error condition was encountered with the query. Others, such as NXDOMAIN, SERVFAIL, REFUSED, and NOTIMP define specific error conditions encountered when trying to resolve the requested query name. The response codes may be generated by 1.1.1.1 itself (like REFUSED) or may come from an upstream authoritative nameserver (like NXDOMAIN).
The DNS response code graph shown below highlights that the vast majority of queries seen globally do not encounter an error during the resolution process (NOERROR), and that when errors are encountered, most are NXDOMAIN (no such record). It is worth noting that NOERROR also includes empty responses, which occur when there are no records for the query name and query type, but there are records for the query name and some other query type.
With DNS being a first-step dependency for many other protocols, the amount of queries of particular types can be used to indirectly measure the adoption of those protocols. But to effectively measure adoption, we should also consider the fraction of those queries that are met with useful responses, which are represented with the DNS record adoption graphs.
The example below shows that queries for A records are met with a useful response nearly 88% of the time. As IPv4 is an established protocol, the remaining 12% are likely to be queries for valid hostnames that have no A records (e.g. email domains that only have MX records). But the same graph also shows that there’s still a significant adoption gap where IPv6 is concerned.
When Cloudflare’s DNS resolver gets a response back from an upstream authoritative nameserver, it caches it for a specified amount of time — more on that below. By caching these responses, it can more efficiently serve subsequent queries for the same name. The DNS cache hit ratio graph provides insight into how frequently responses are served from cache. At a global level, as seen below, over 80% of queries have a response that is already cached. These ratios will vary by location or ASN, as the query patterns differ across geographies and networks.
As noted in the preceding paragraph, when an authoritative nameserver sends a response back to 1.1.1.1, each record inside it includes information about how long it should be cached/considered valid for. This piece of information is known as the Time-To-Live (TTL) and, as a response may contain multiple records, the smallest of these TTLs (the “minimum” TTL) defines how long 1.1.1.1 can cache the entire response for. The TTLs on each response served from 1.1.1.1’s cache decrease towards zero as time passes, at which point 1.1.1.1 needs to go back to the authoritative nameserver. Hostnames with relatively low TTL values suggest that the records may be somewhat dynamic, possibly due to traffic management of the associated resources; longer TTL values suggest that the associated resources are more stable and expected to change infrequently.
The DNS minimum TTL graphs show the aggregate distribution of TTL values for five popular DNS record types, broken out across seven buckets ranging from under one minute to over one week. During the third week of February, for example, A and AAAA responses had a concentration of low TTLs, with over 80% below five minutes. In contrast, NS and MX responses were more concentrated across 15 minutes to one hour and one hour to one day. Because MX and NS records change infrequently, they are generally configured with higher TTLs. This allows them to be cached for longer periods in order to achieve faster DNS resolution.
DNS security
DNS Security Extensions (DNSSEC) add an extra layer of authentication to DNS establishing the integrity and authenticity of a DNS response. This ensures subsequent HTTPS requests are not routed to a spoofed domain. When sending a query to 1.1.1.1, a DNS client can indicate that it is DNSSEC-aware by setting a specific flag (the “DO” bit) in the query, which lets our resolver know that it is OK to return DNSSEC data in the response. The DNSSEC client awareness graph breaks down the share of queries that 1.1.1.1 sees from clients that understand DNSSEC and can require validation of responses vs. those that don’t. (Note that by default, 1.1.1.1 tries to protect clients by always validating DNSSEC responses from authoritative nameservers and not forwarding invalid responses to clients, unless the client has explicitly told it not to by setting the “CD” (checking-disabled) bit in the query.)
Unfortunately, as the graph below shows, nearly 90% of the queries seen by Cloudflare’s resolver are made by clients that are not DNSSEC-aware. This broad lack of client awareness may be due to several factors. On the client side, DNSSEC is not enabled by default for most users, and enabling DNSSEC requires extra work, even for technically savvy and security conscious users. On the authoritative side, for domain owners, supporting DNSSEC requires extra operational maintenance and knowledge, and a mistake can cost your domain to disappear from the Internet, causing significant (including financial) issues.
The companion End-to-end security graph represents the fraction of DNS interactions that were protected from tampering, when considering the client’s DNSSEC capabilities and use of encryption (use of DoT or DoH). This shows an even greater imbalance at a global level, and highlights the importance of further adoption of encryption and DNSSEC.
For DNSSEC validation to occur, the query name being requested must be part of a DNSSEC-enabled domain, and the DNSSEC validation status graph represents the share of queries where that was the case under the Secure and Invalid labels. Queries for domains without DNSSEC are labeled as Insecure, and queries where DNSSEC validation was not applicable (such as various kinds of errors) fall under the Other label. Although nearly 93% of generic Top Level Domains (TLDs) and 65% of country code Top Level Domains (ccTLDs) are signed with DNSSEC (as of February 2025), the adoption rate across individual (child) domains lags significantly, as the graph below shows that over 80% of queries were labeled as Insecure.
Conclusion
DNS is a fundamental, foundational part of the Internet. While most Internet users don’t think of DNS beyond its role in translating easy-to-remember hostnames to IP addresses, there’s a lot going on to make even that happen, from privacy to performance to security. The new DNS page on Cloudflare Radar endeavors to provide visibility into what’s going on behind the scenes, at a global, national, and network level.
While the graphs shown above are taken from the DNS page, all the underlying data is available via the API and can be interactively explored in more detail across locations, networks, and time periods using Radar’s Data Explorer and AI Assistant. And as always, Radar and Data Assistant charts and graphs are downloadable for sharing, and embeddable for use in your own blog posts, websites, or dashboards.
To provide the best experiences, we use technologies like cookies to store and/or access device information. Consenting to these technologies will allow us to process data such as browsing behavior or unique IDs on this site. Not consenting or withdrawing consent, may adversely affect certain features and functions.
Functional
Always active
The technical storage or access is strictly necessary for the legitimate purpose of enabling the use of a specific service explicitly requested by the subscriber or user, or for the sole purpose of carrying out the transmission of a communication over an electronic communications network.
Preferences
The technical storage or access is necessary for the legitimate purpose of storing preferences that are not requested by the subscriber or user.
Statistics
The technical storage or access that is used exclusively for statistical purposes.The technical storage or access that is used exclusively for anonymous statistical purposes. Without a subpoena, voluntary compliance on the part of your Internet Service Provider, or additional records from a third party, information stored or retrieved for this purpose alone cannot usually be used to identify you.
Marketing
The technical storage or access is required to create user profiles to send advertising, or to track the user on a website or across several websites for similar marketing purposes.


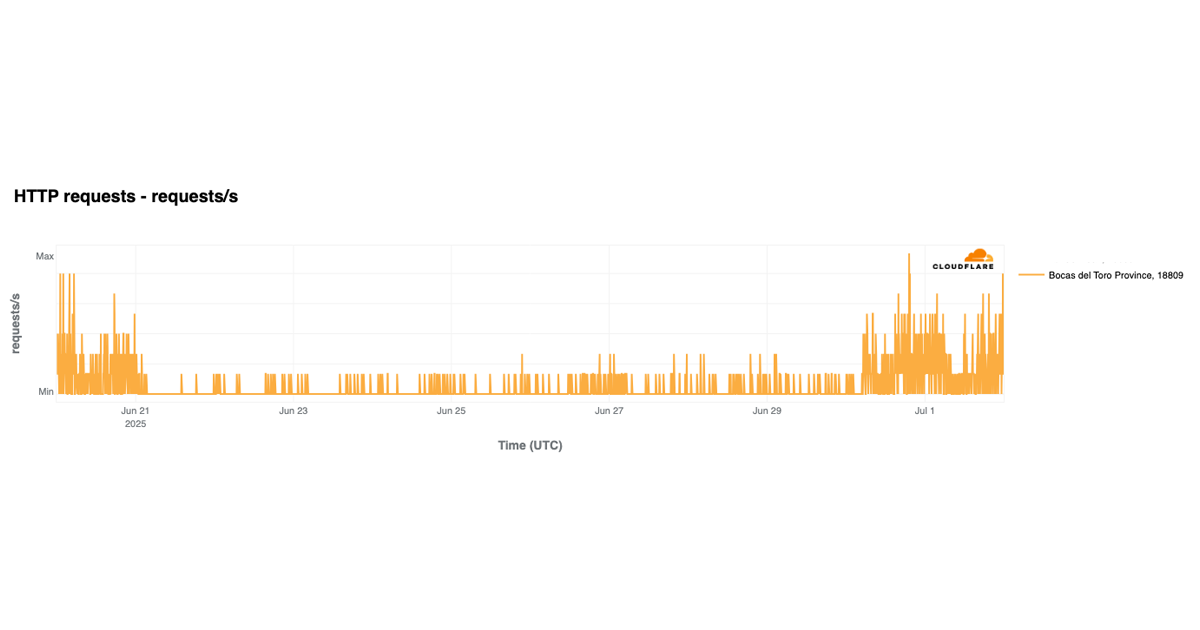
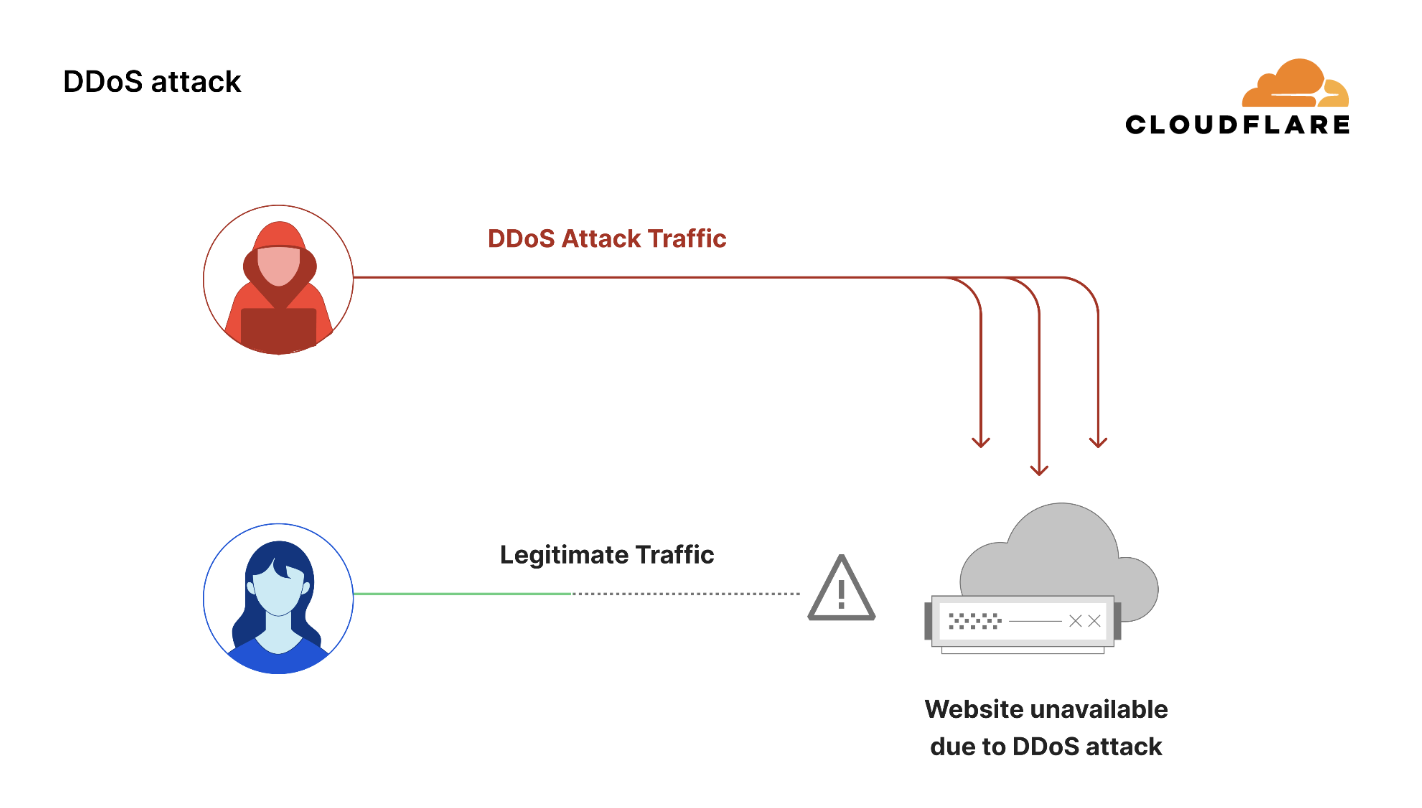
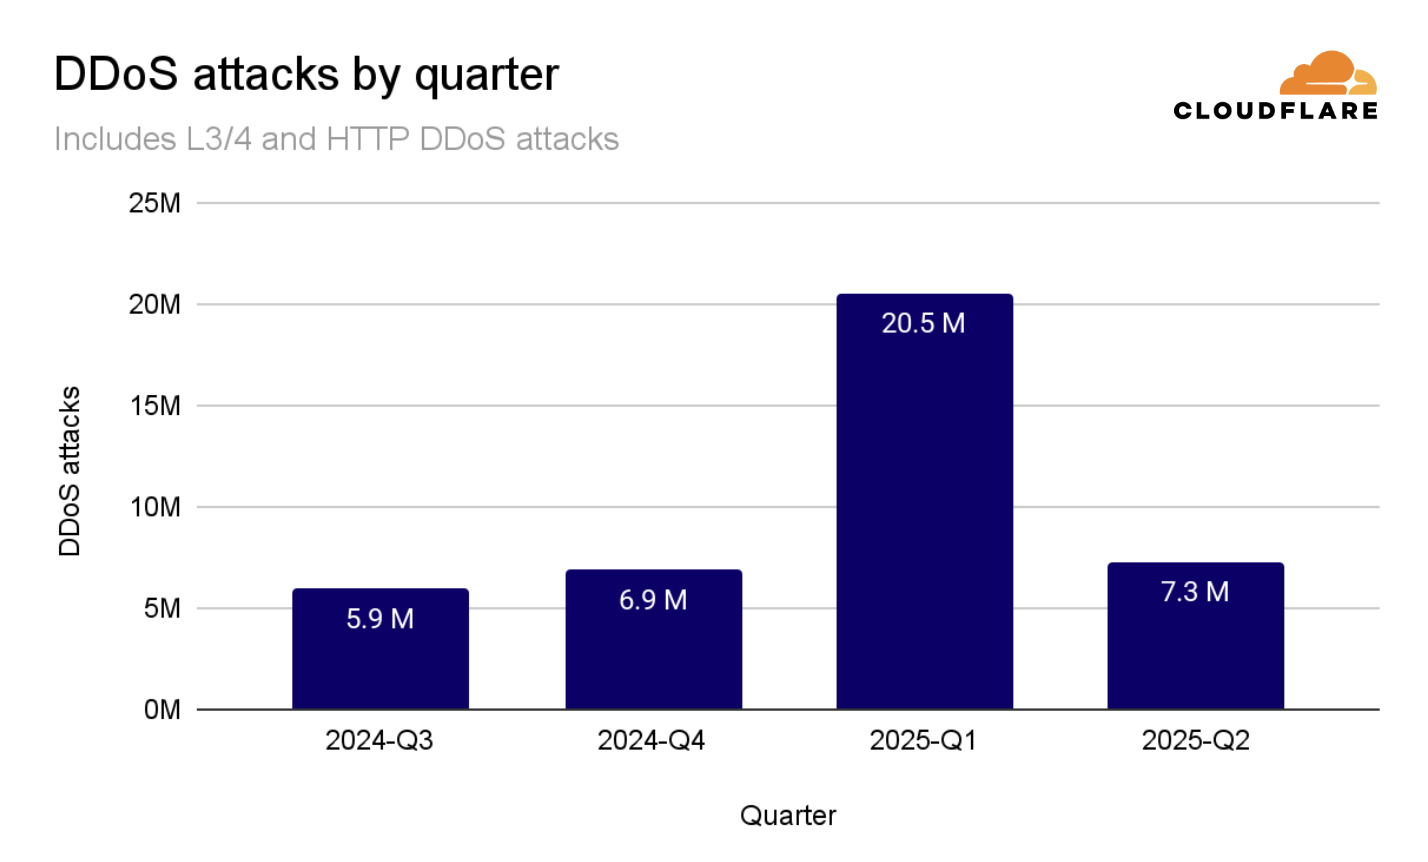
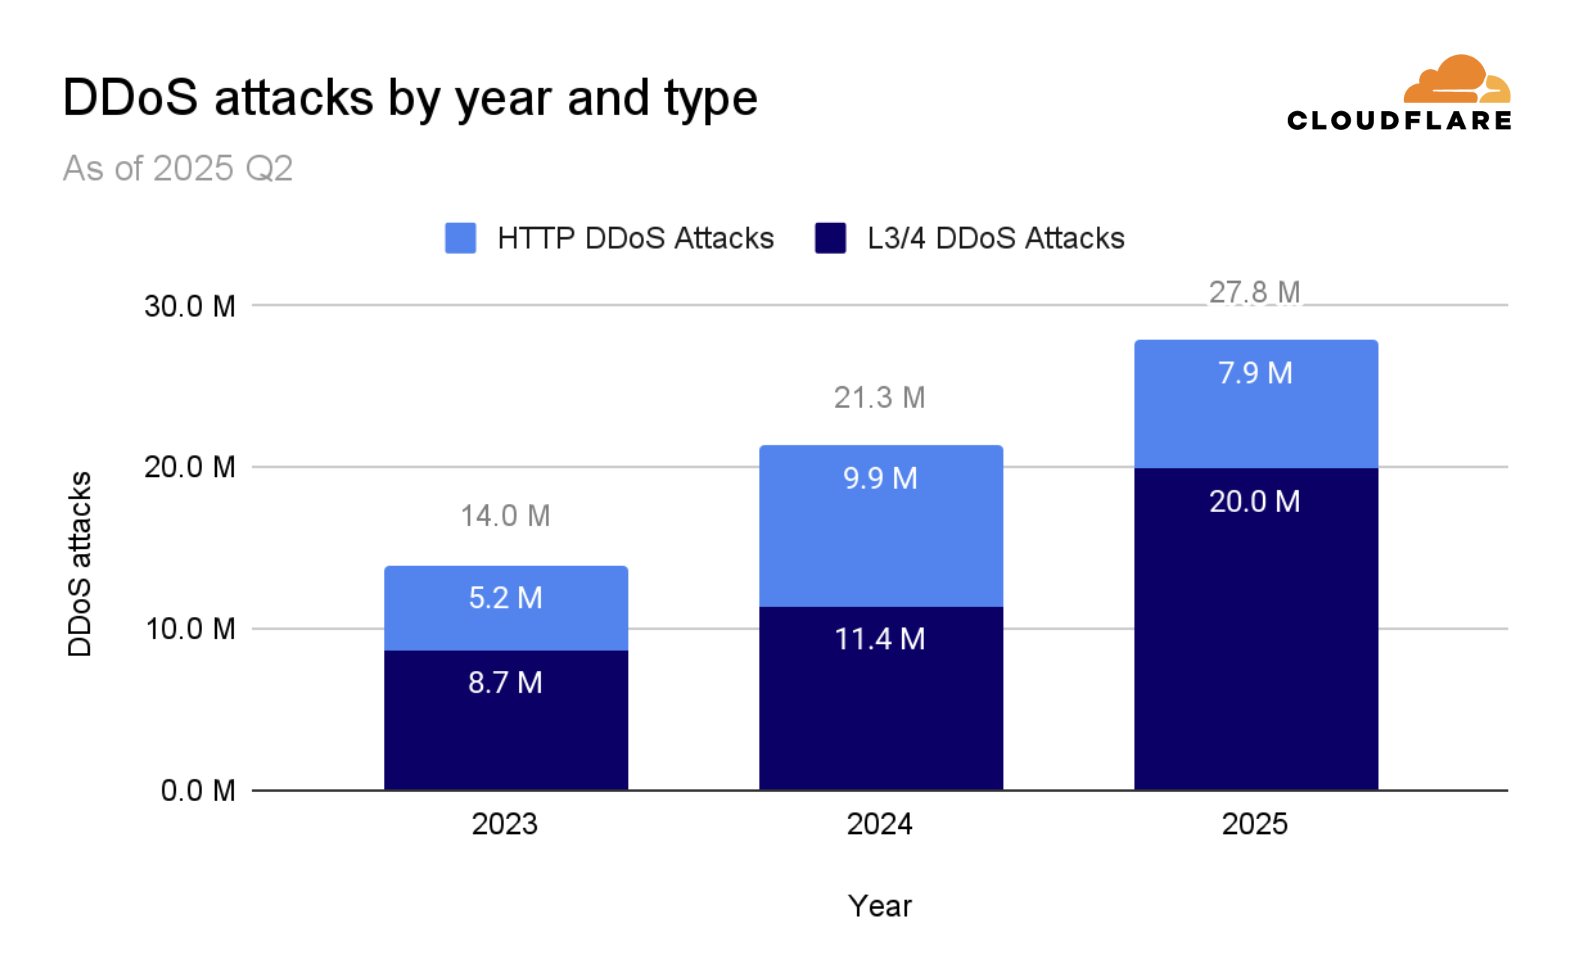
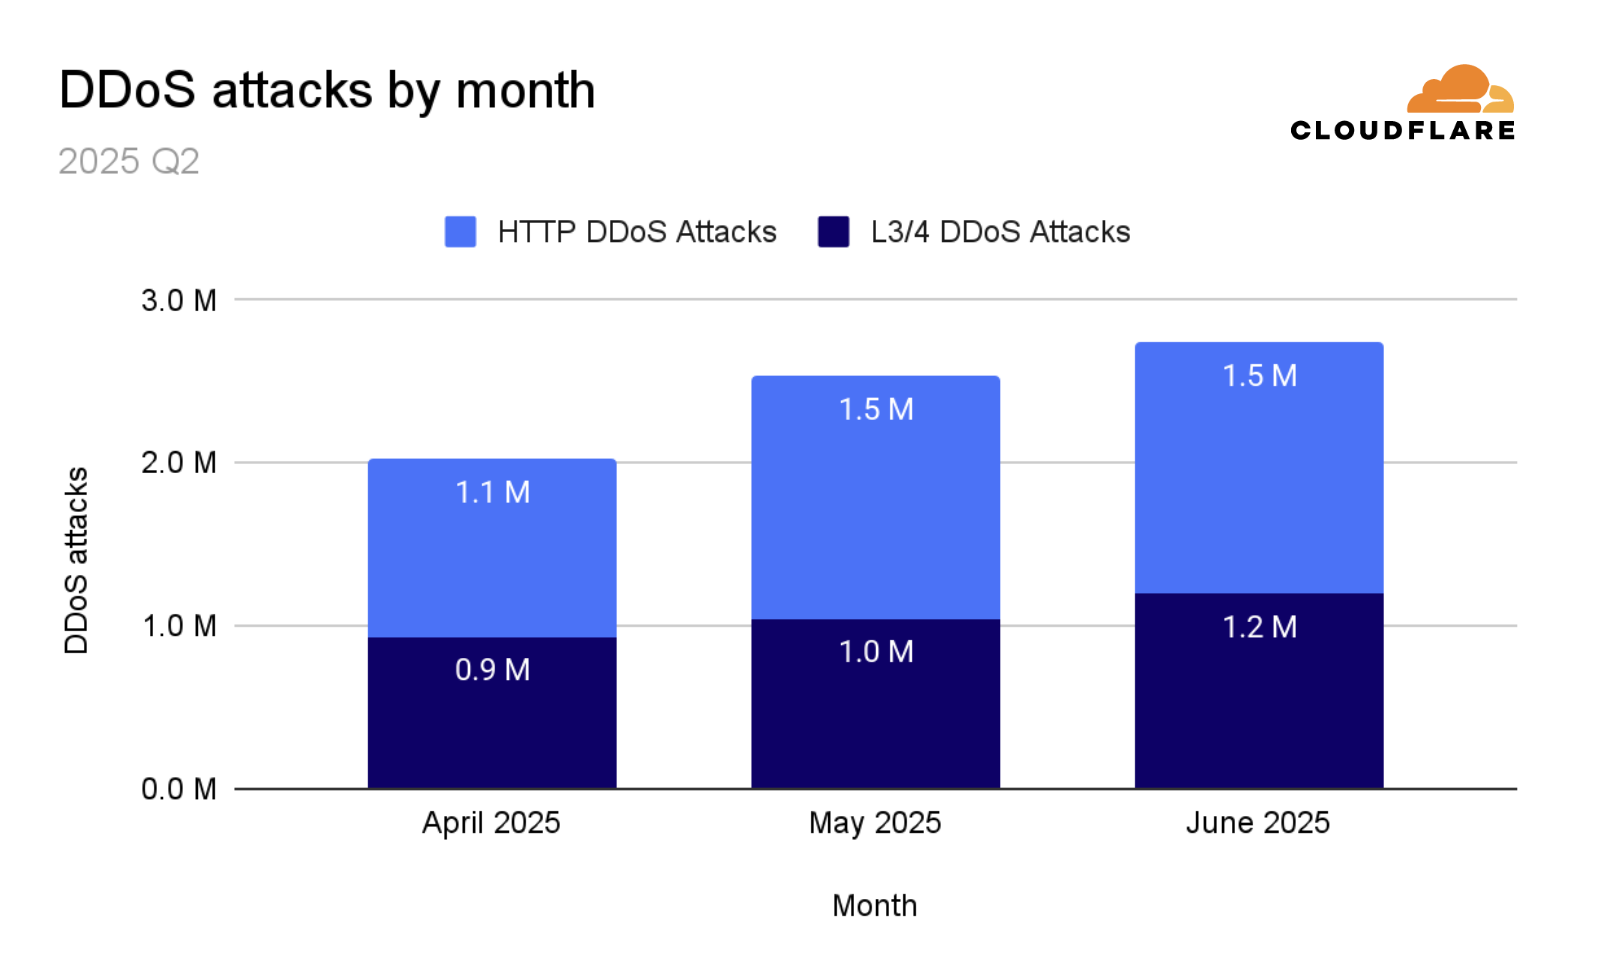
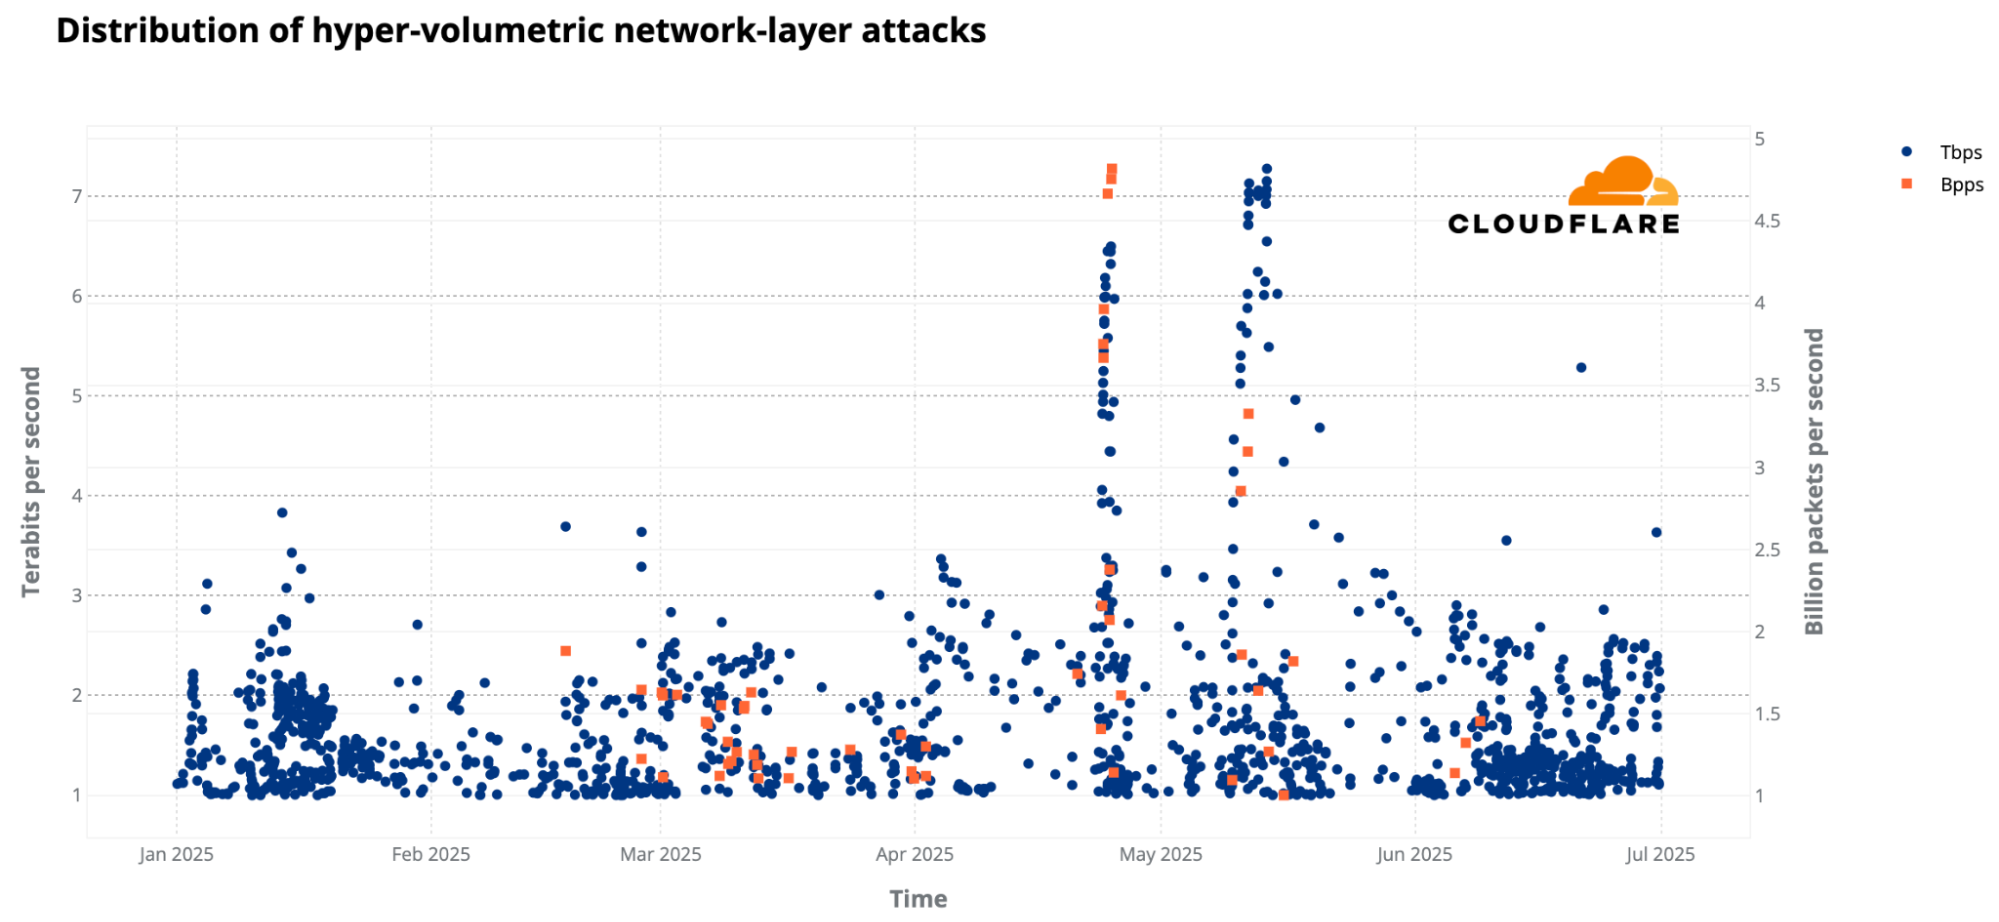
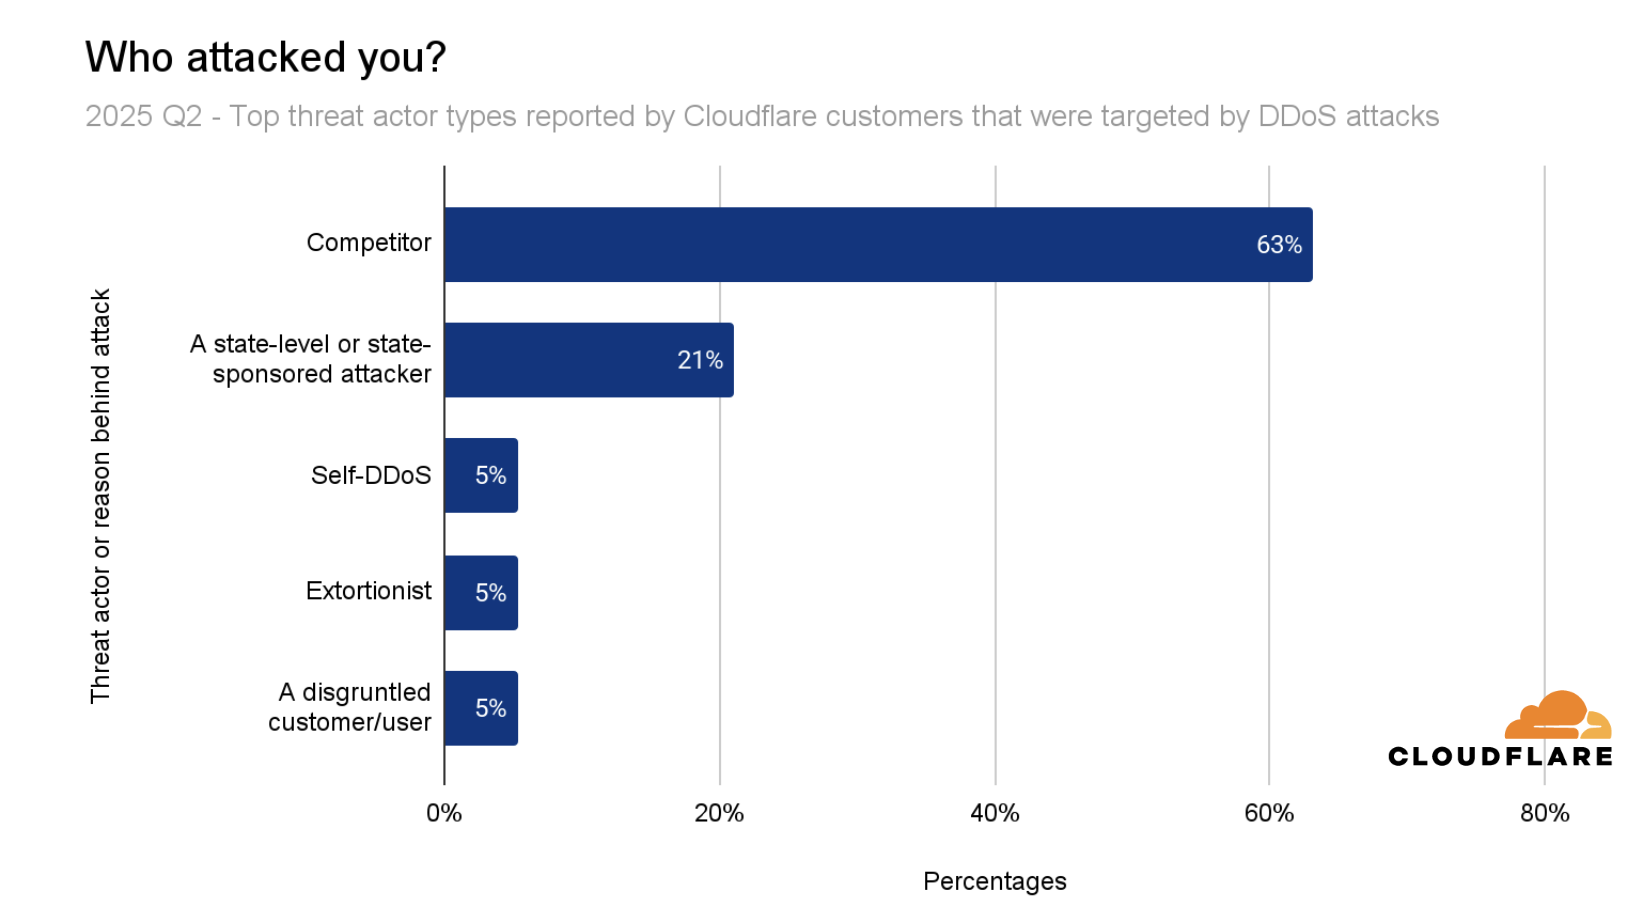
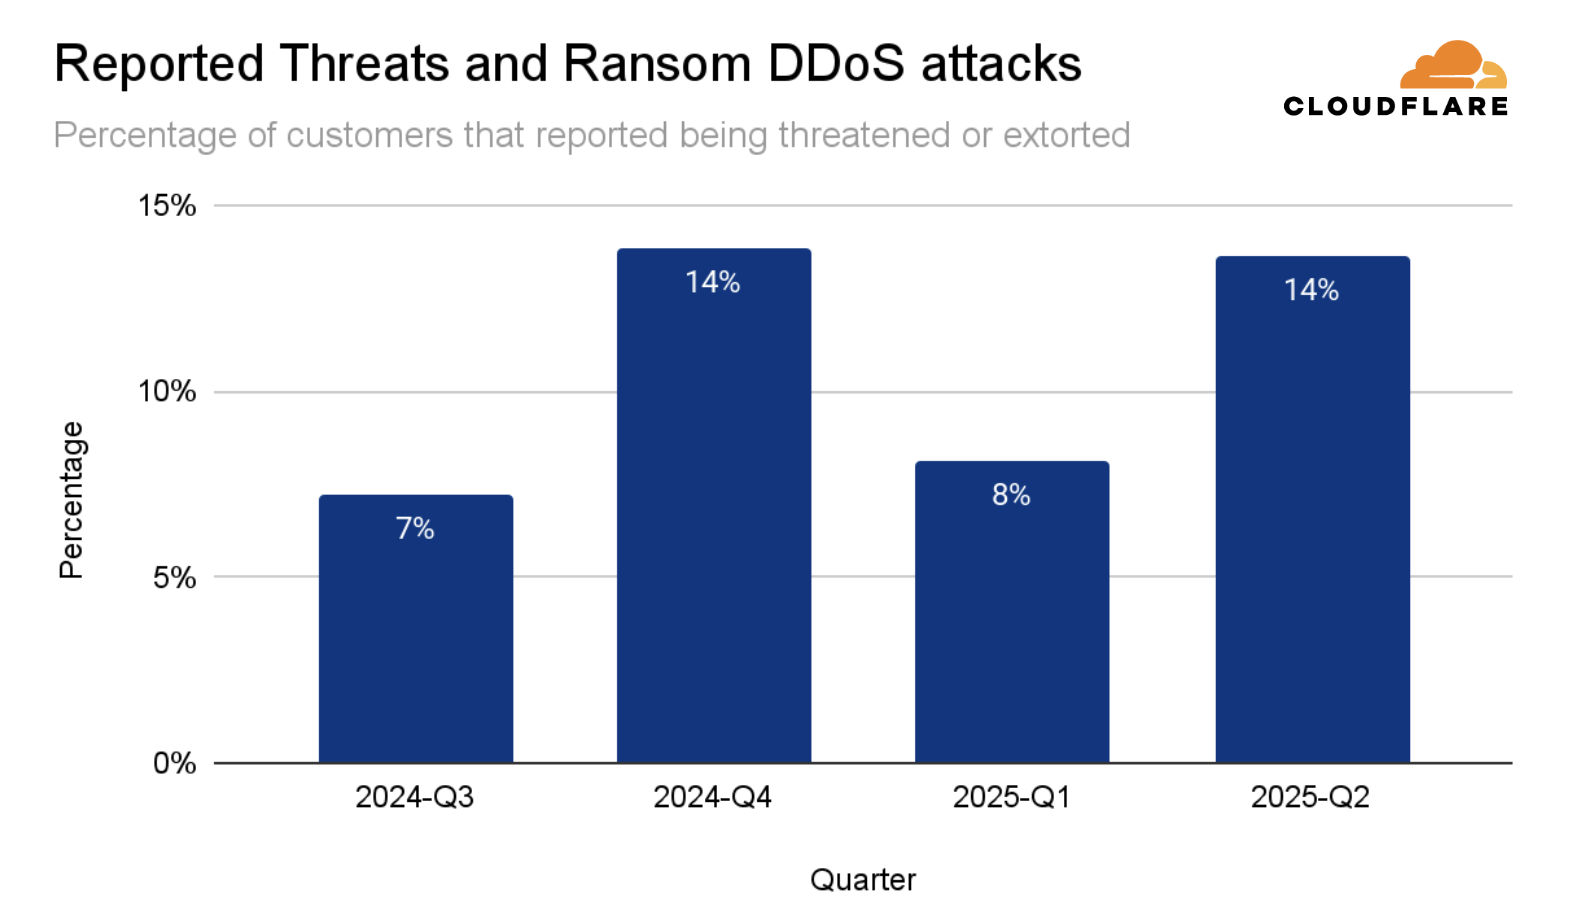
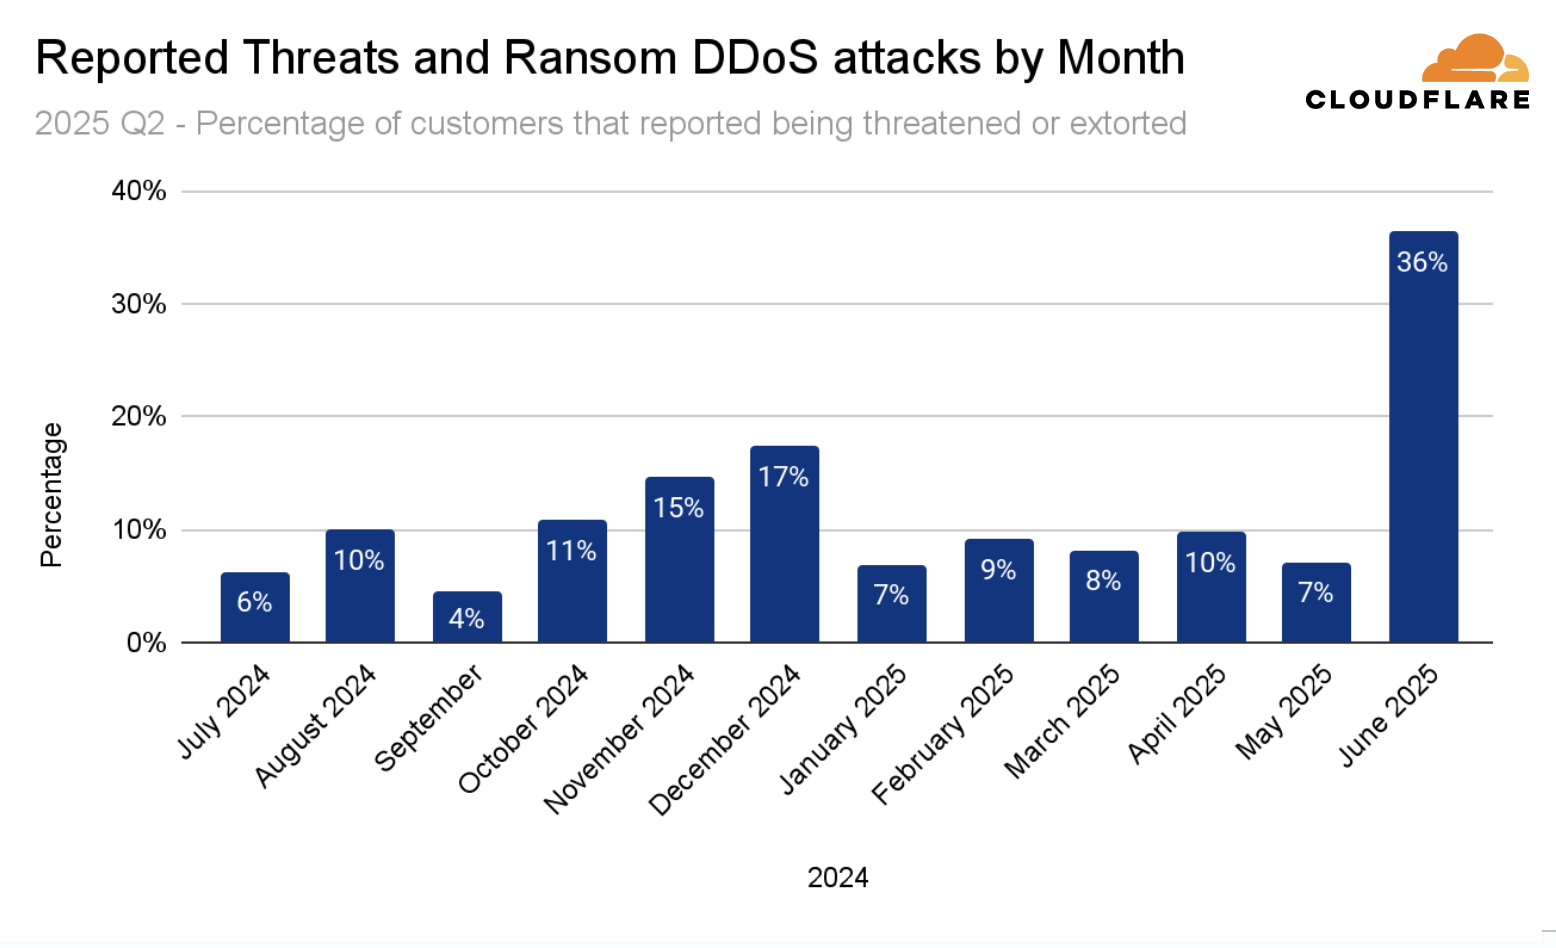
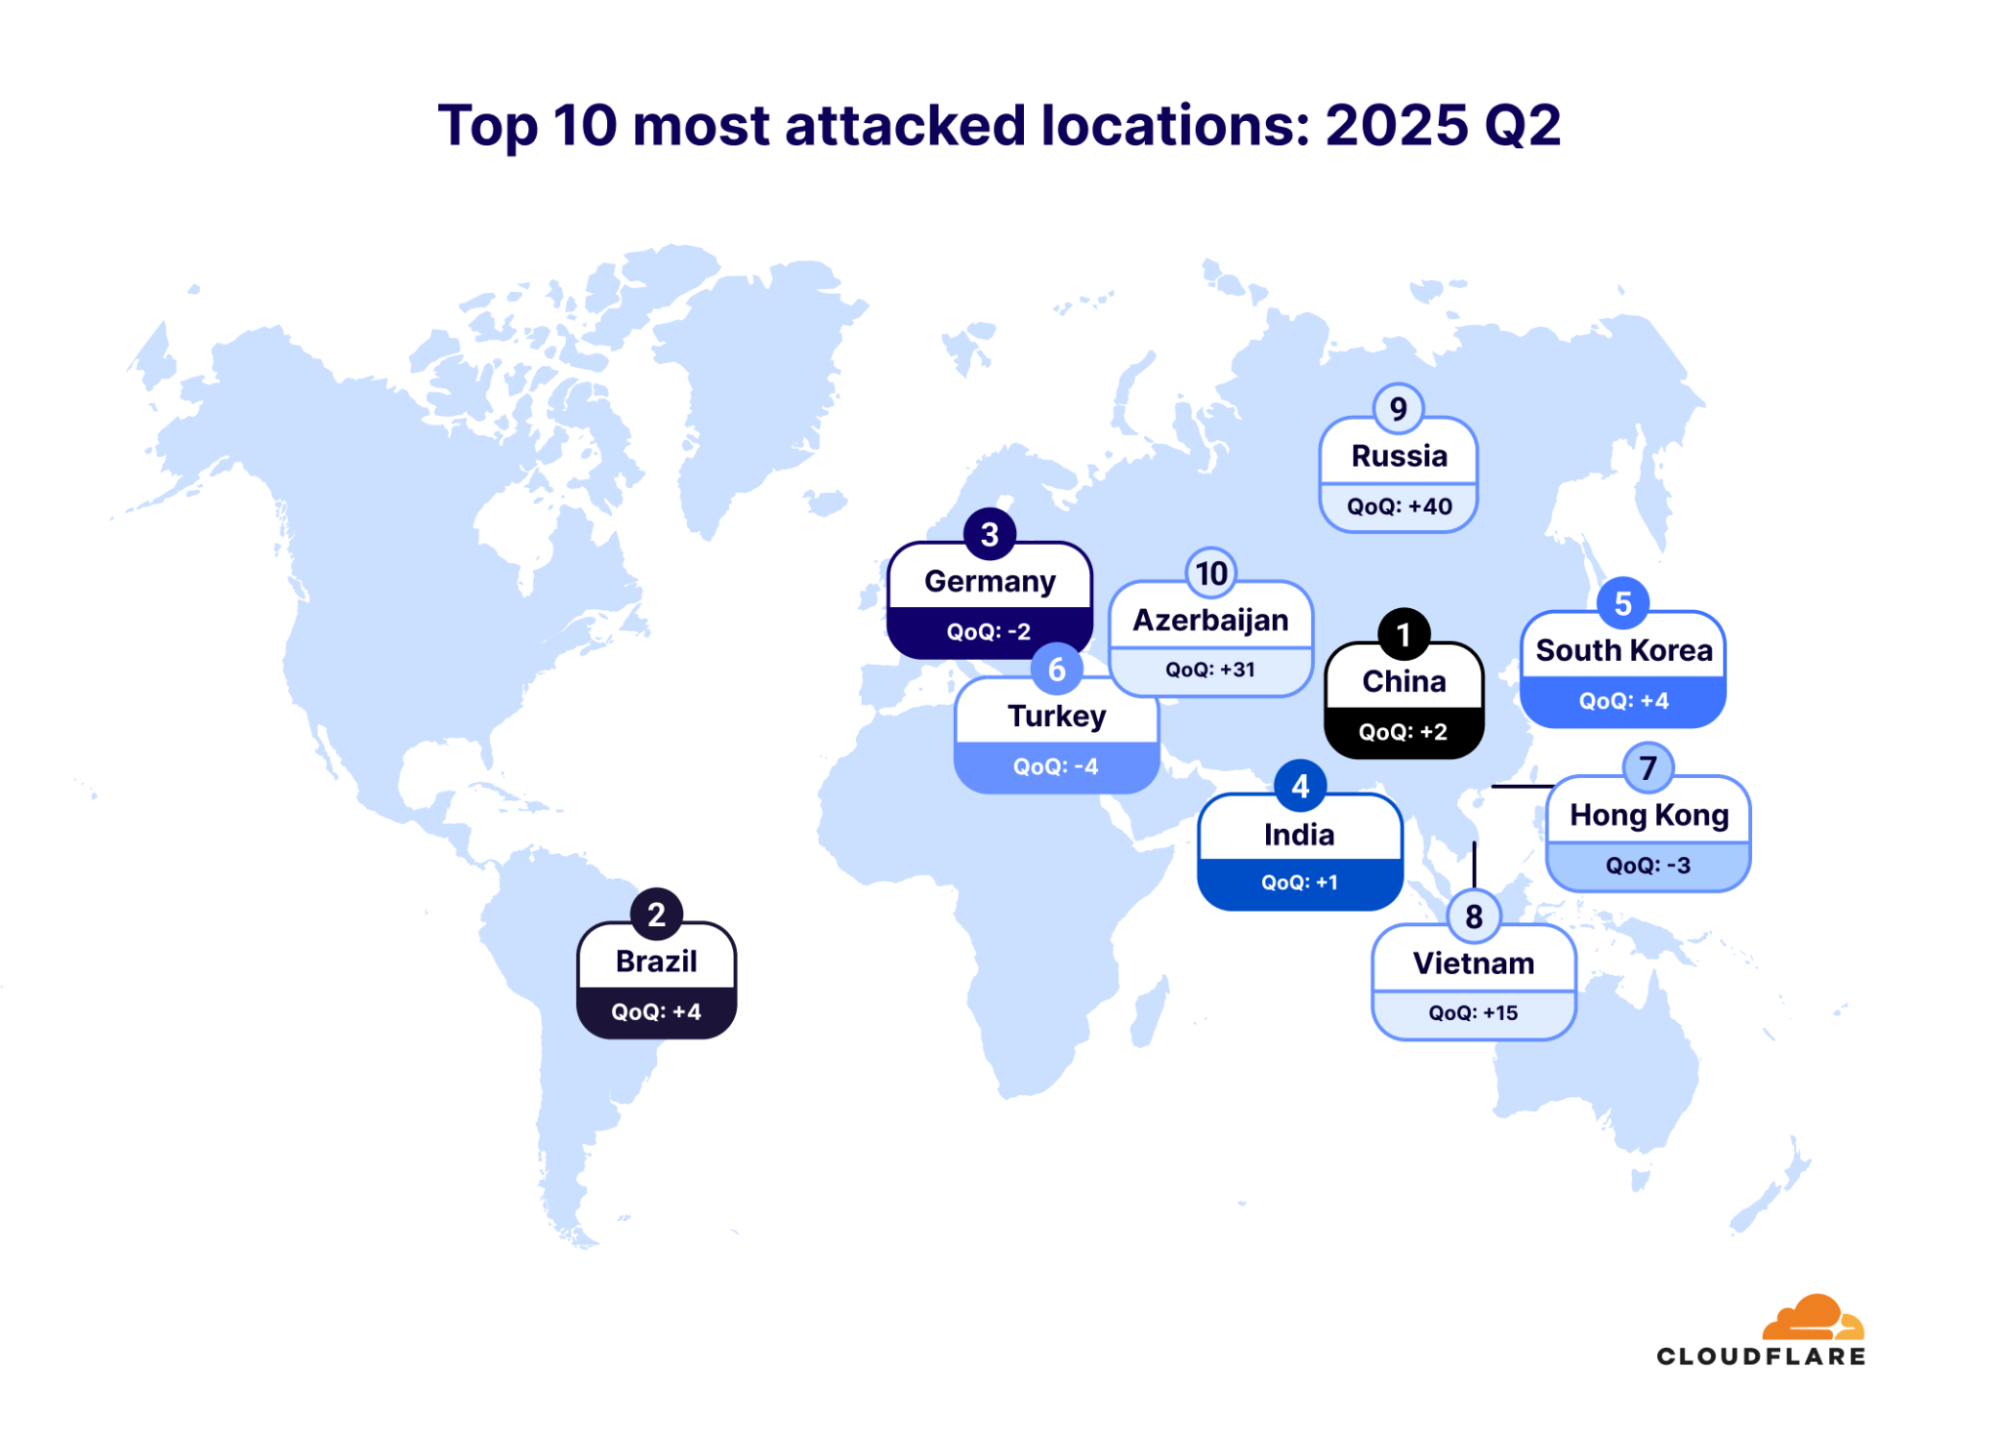
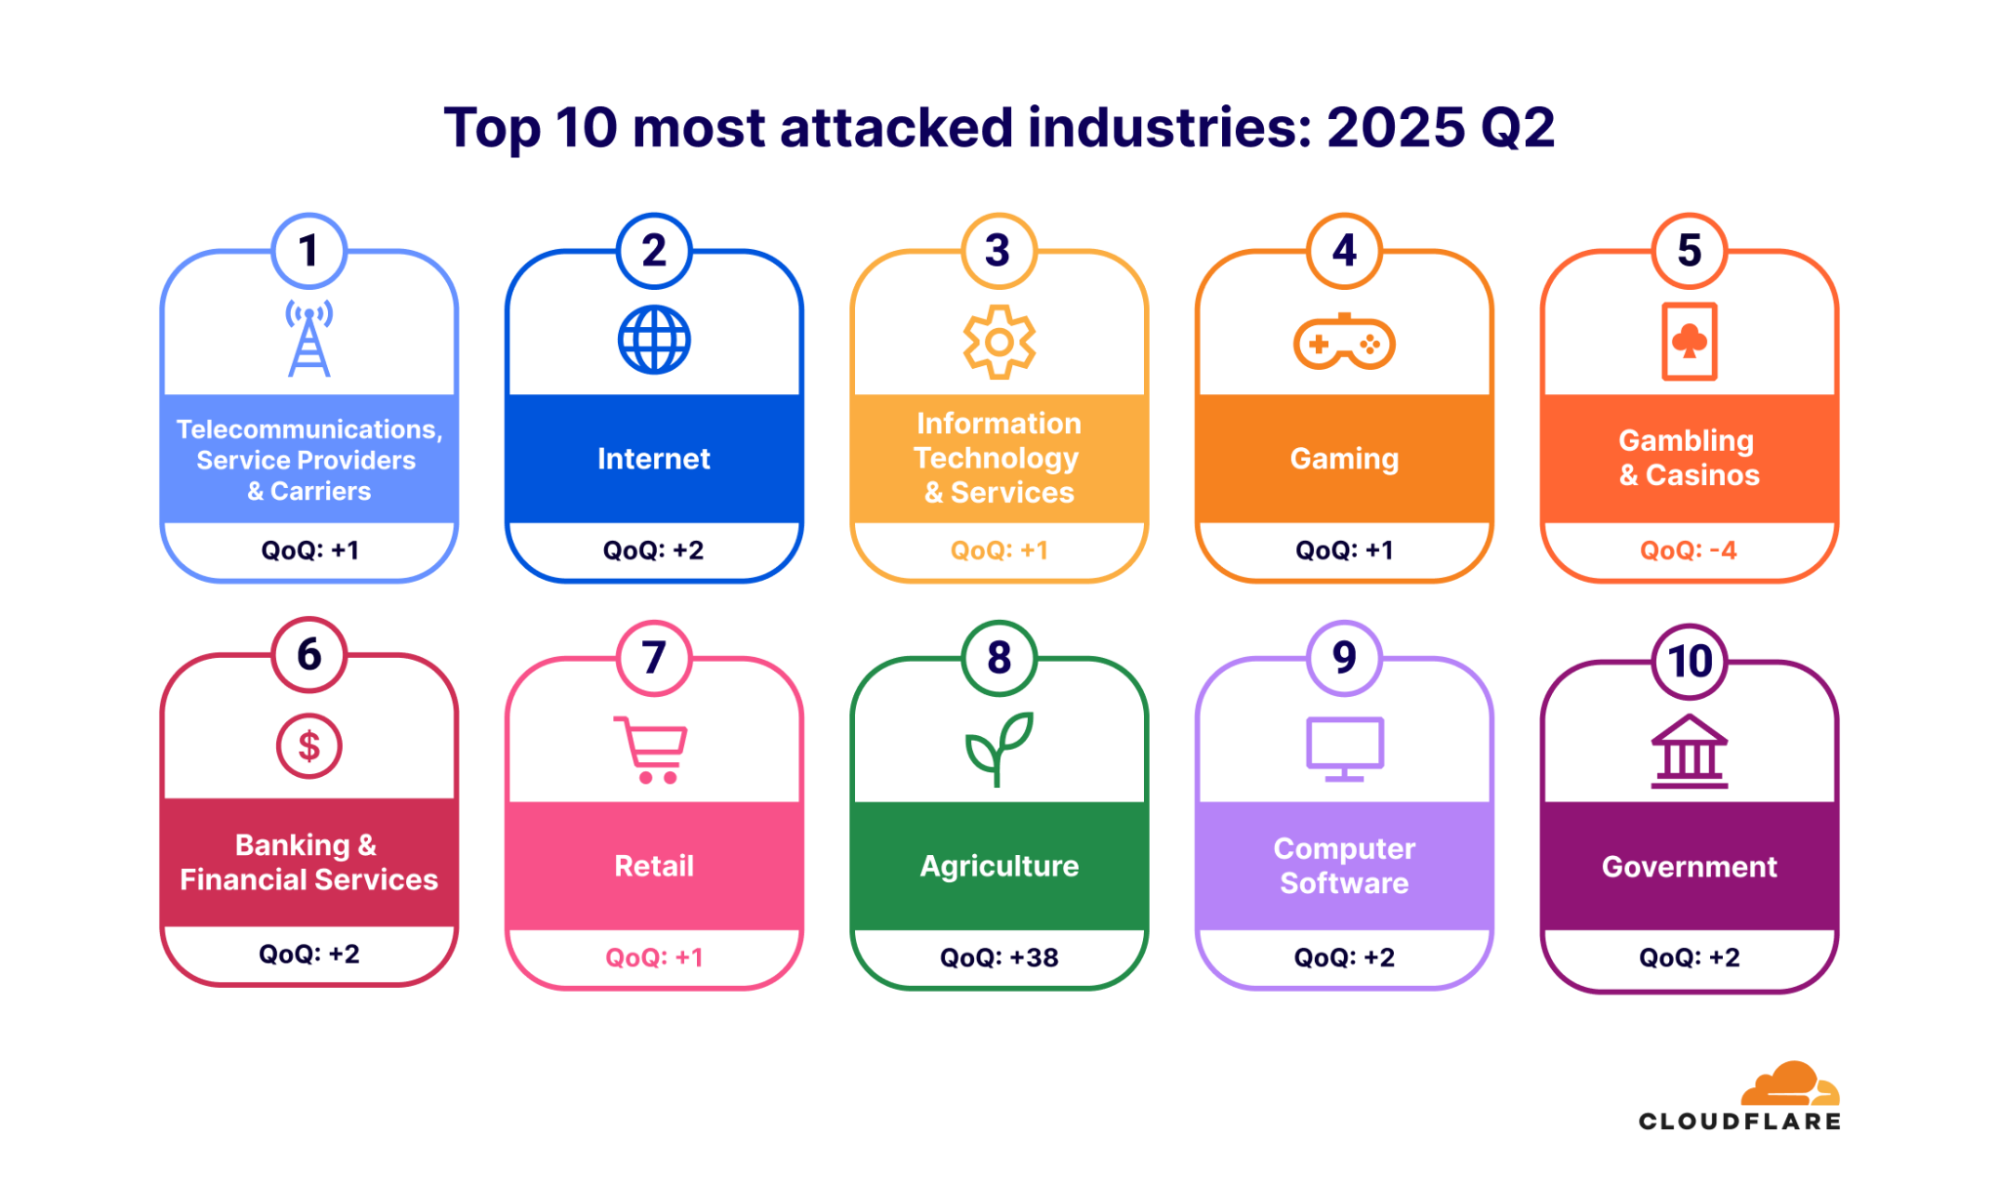
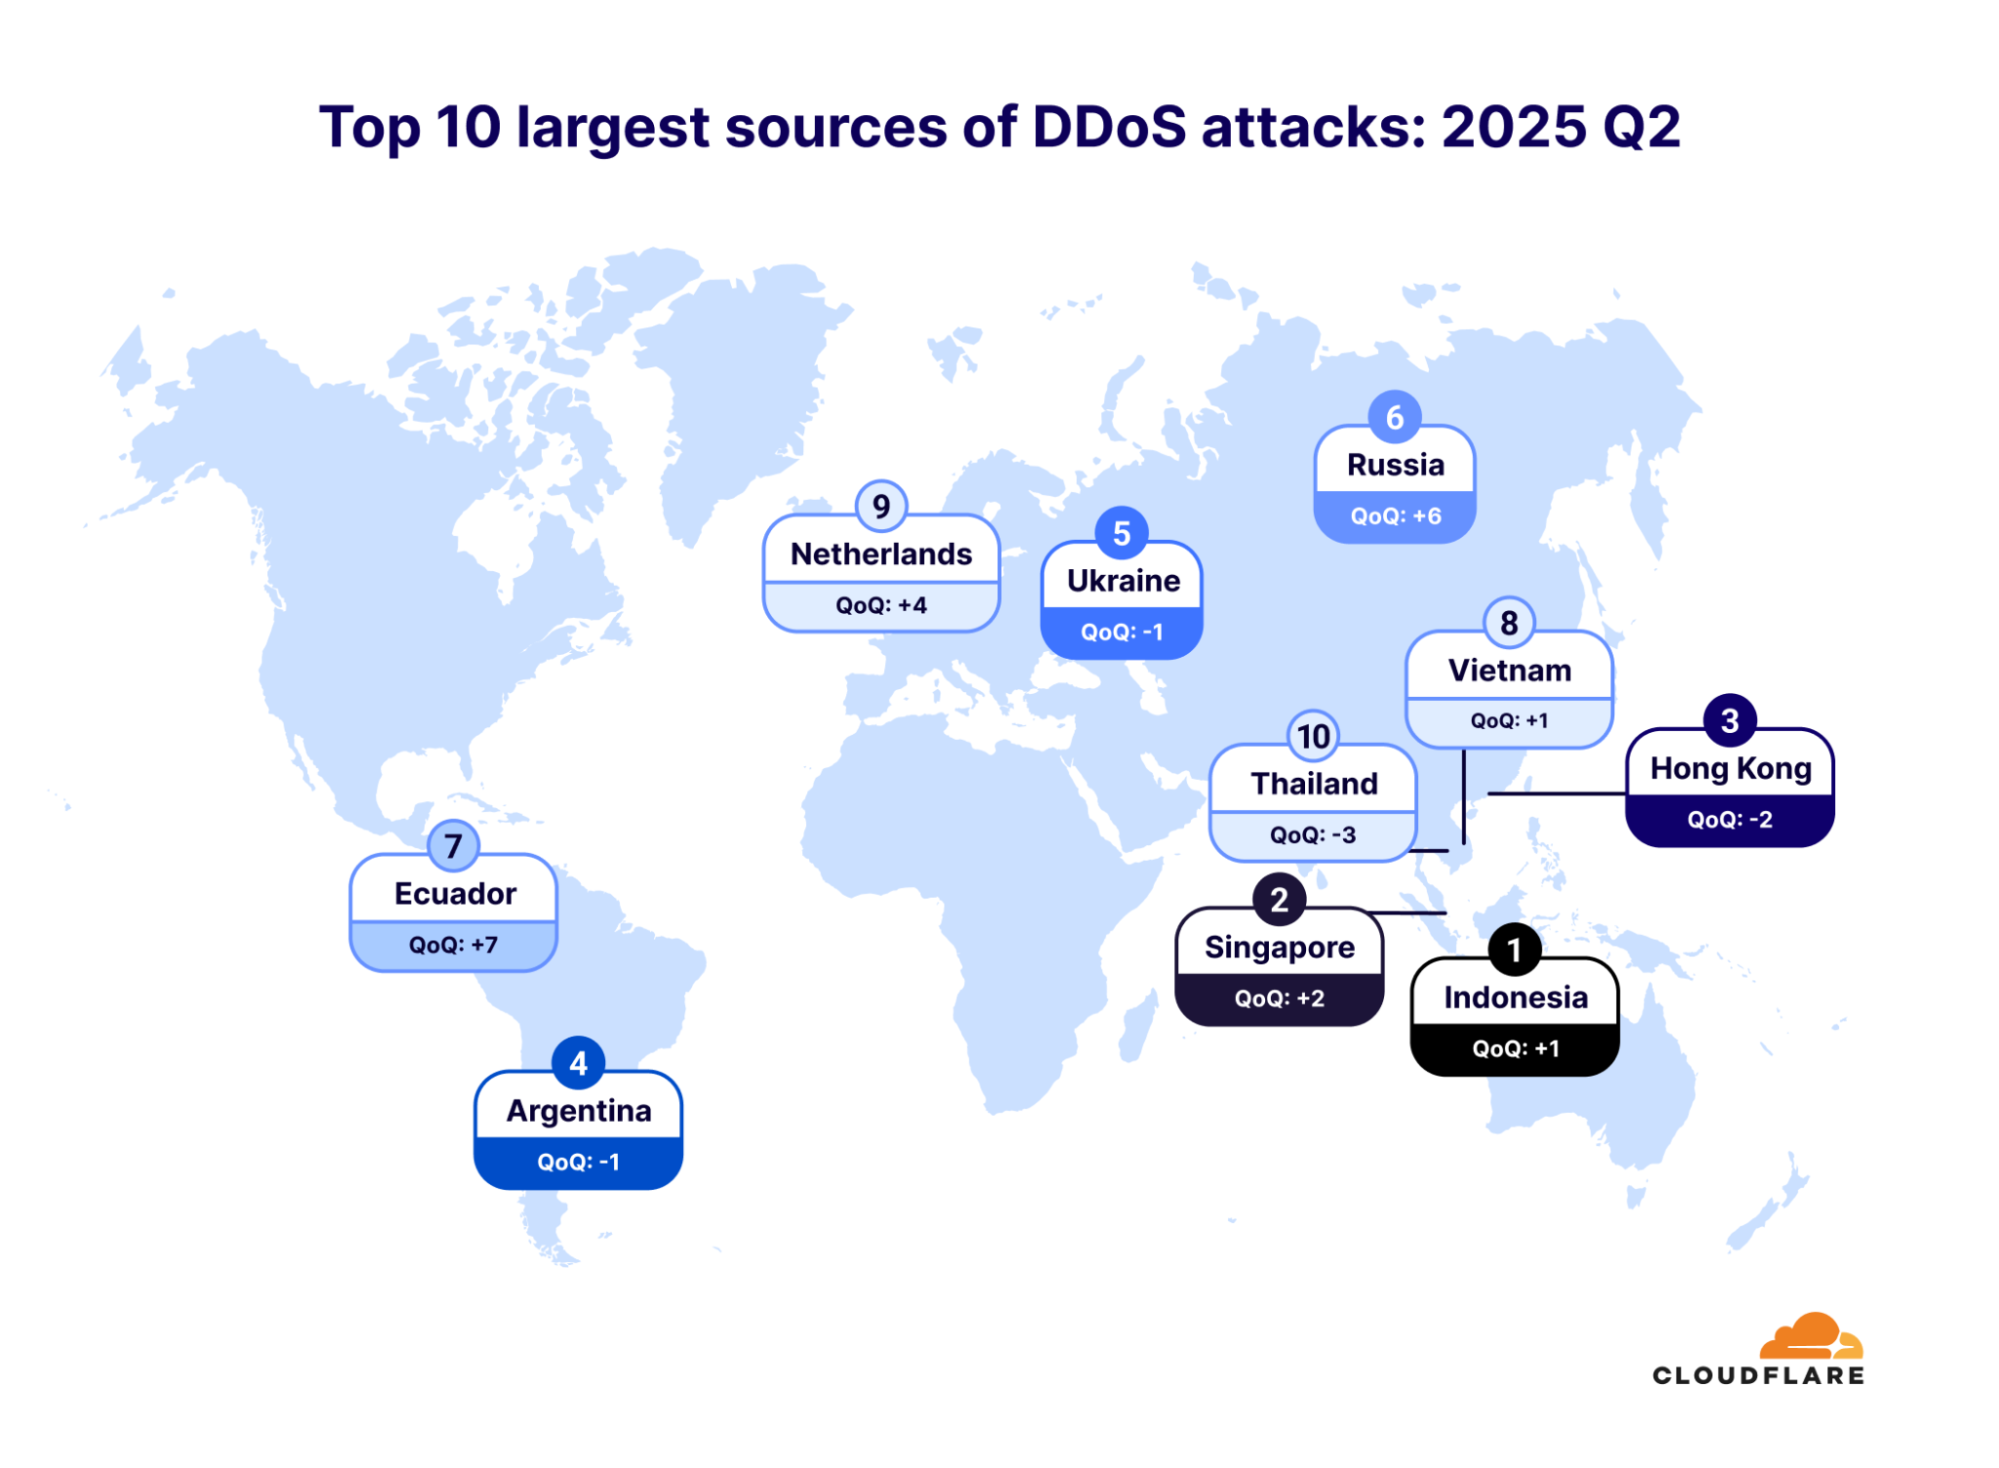
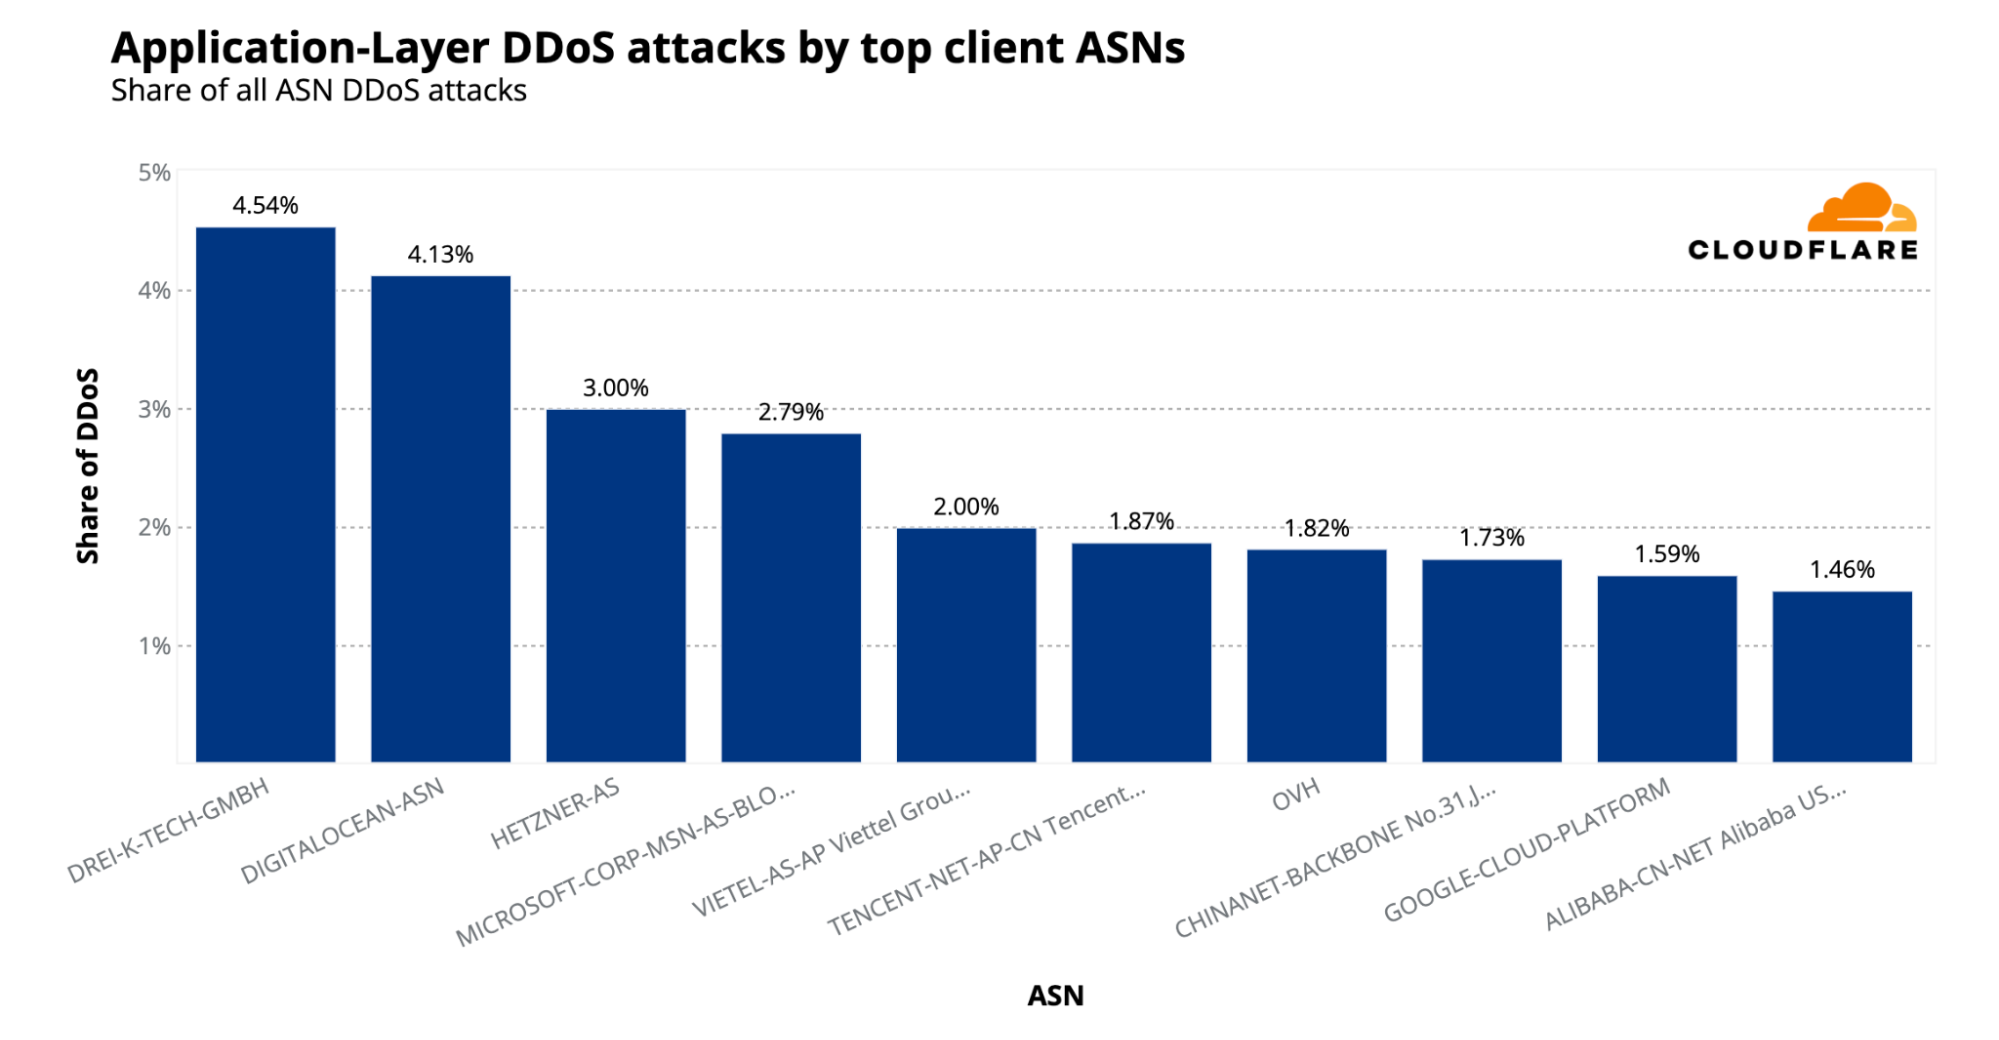
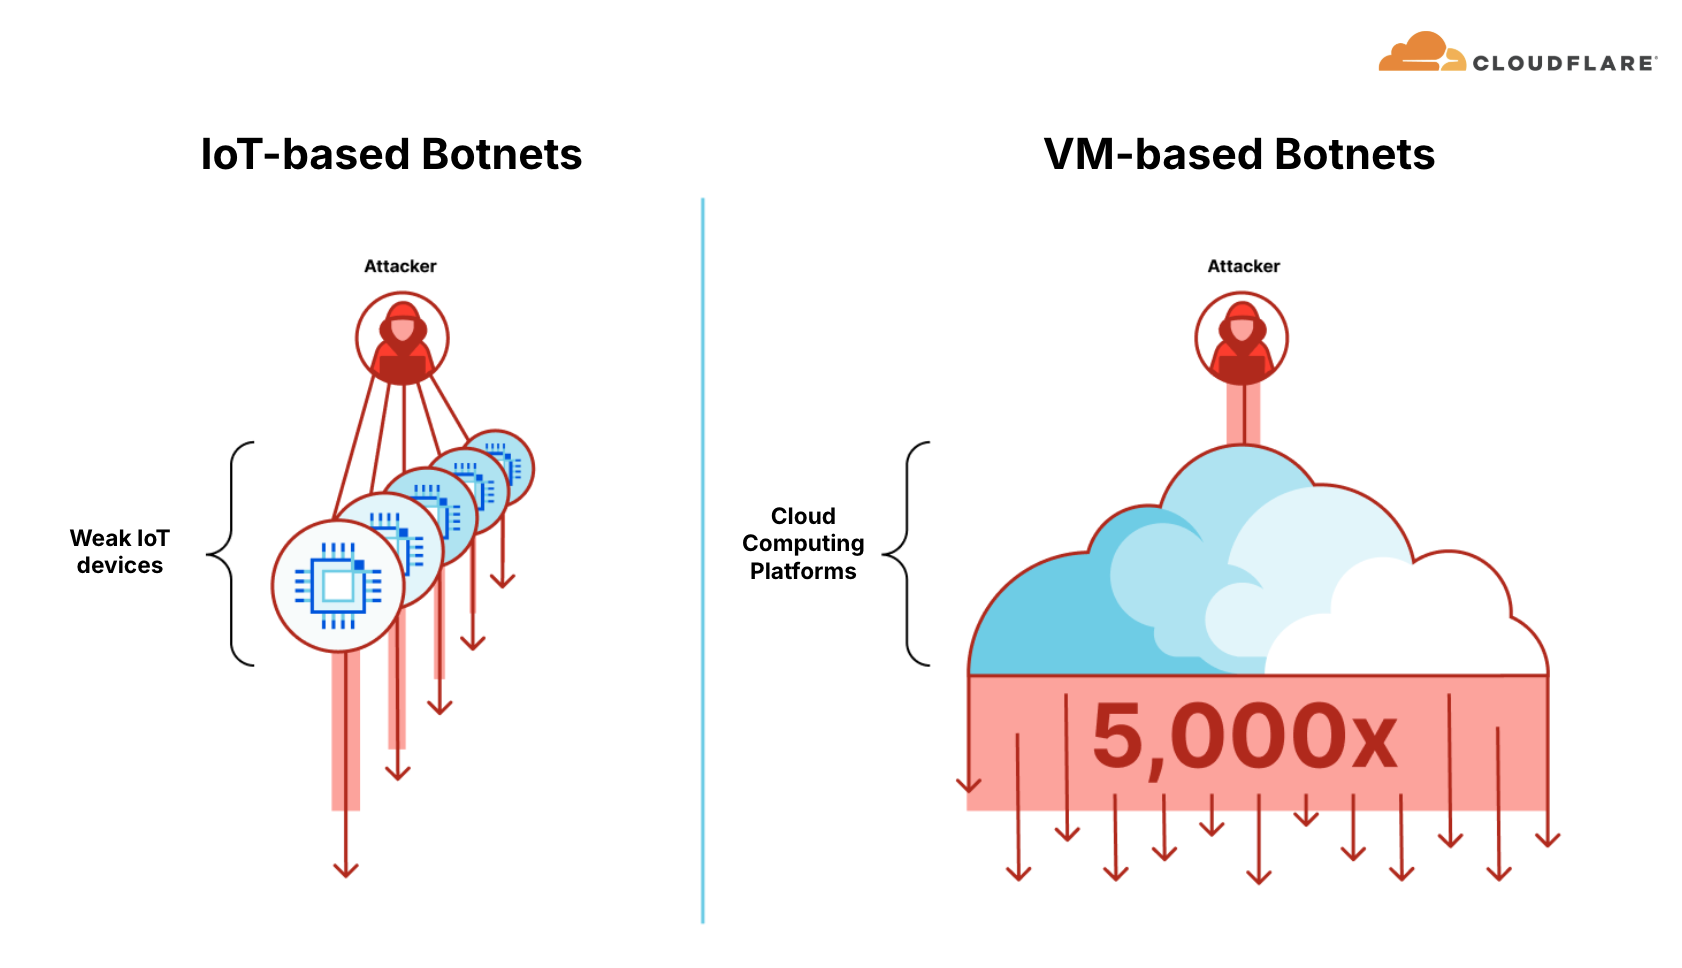
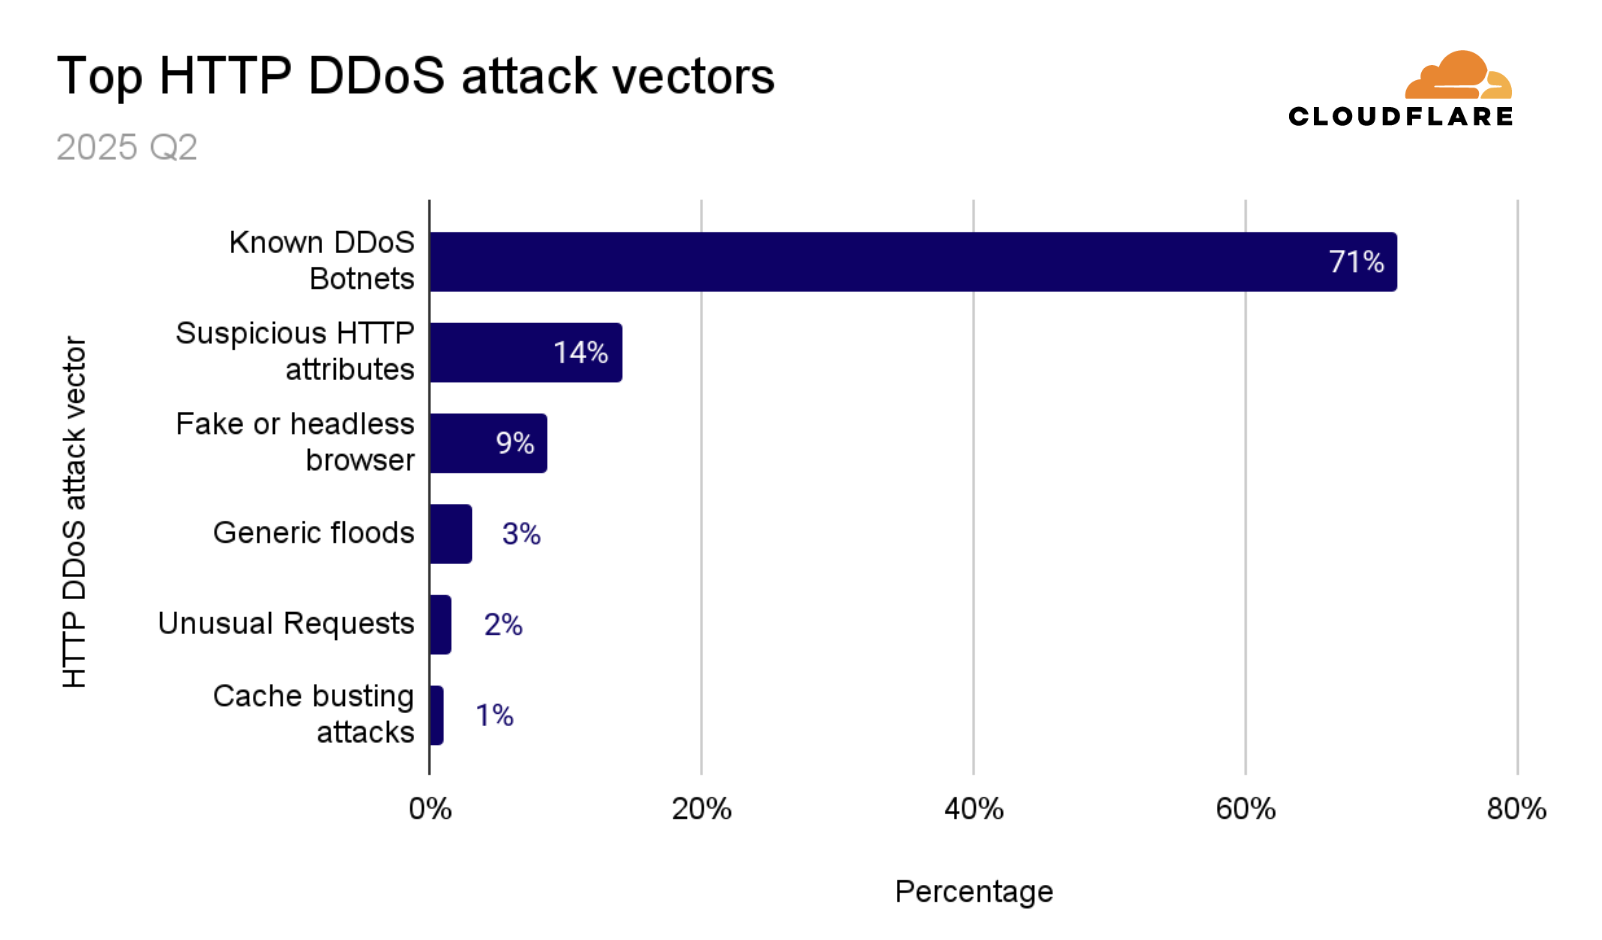
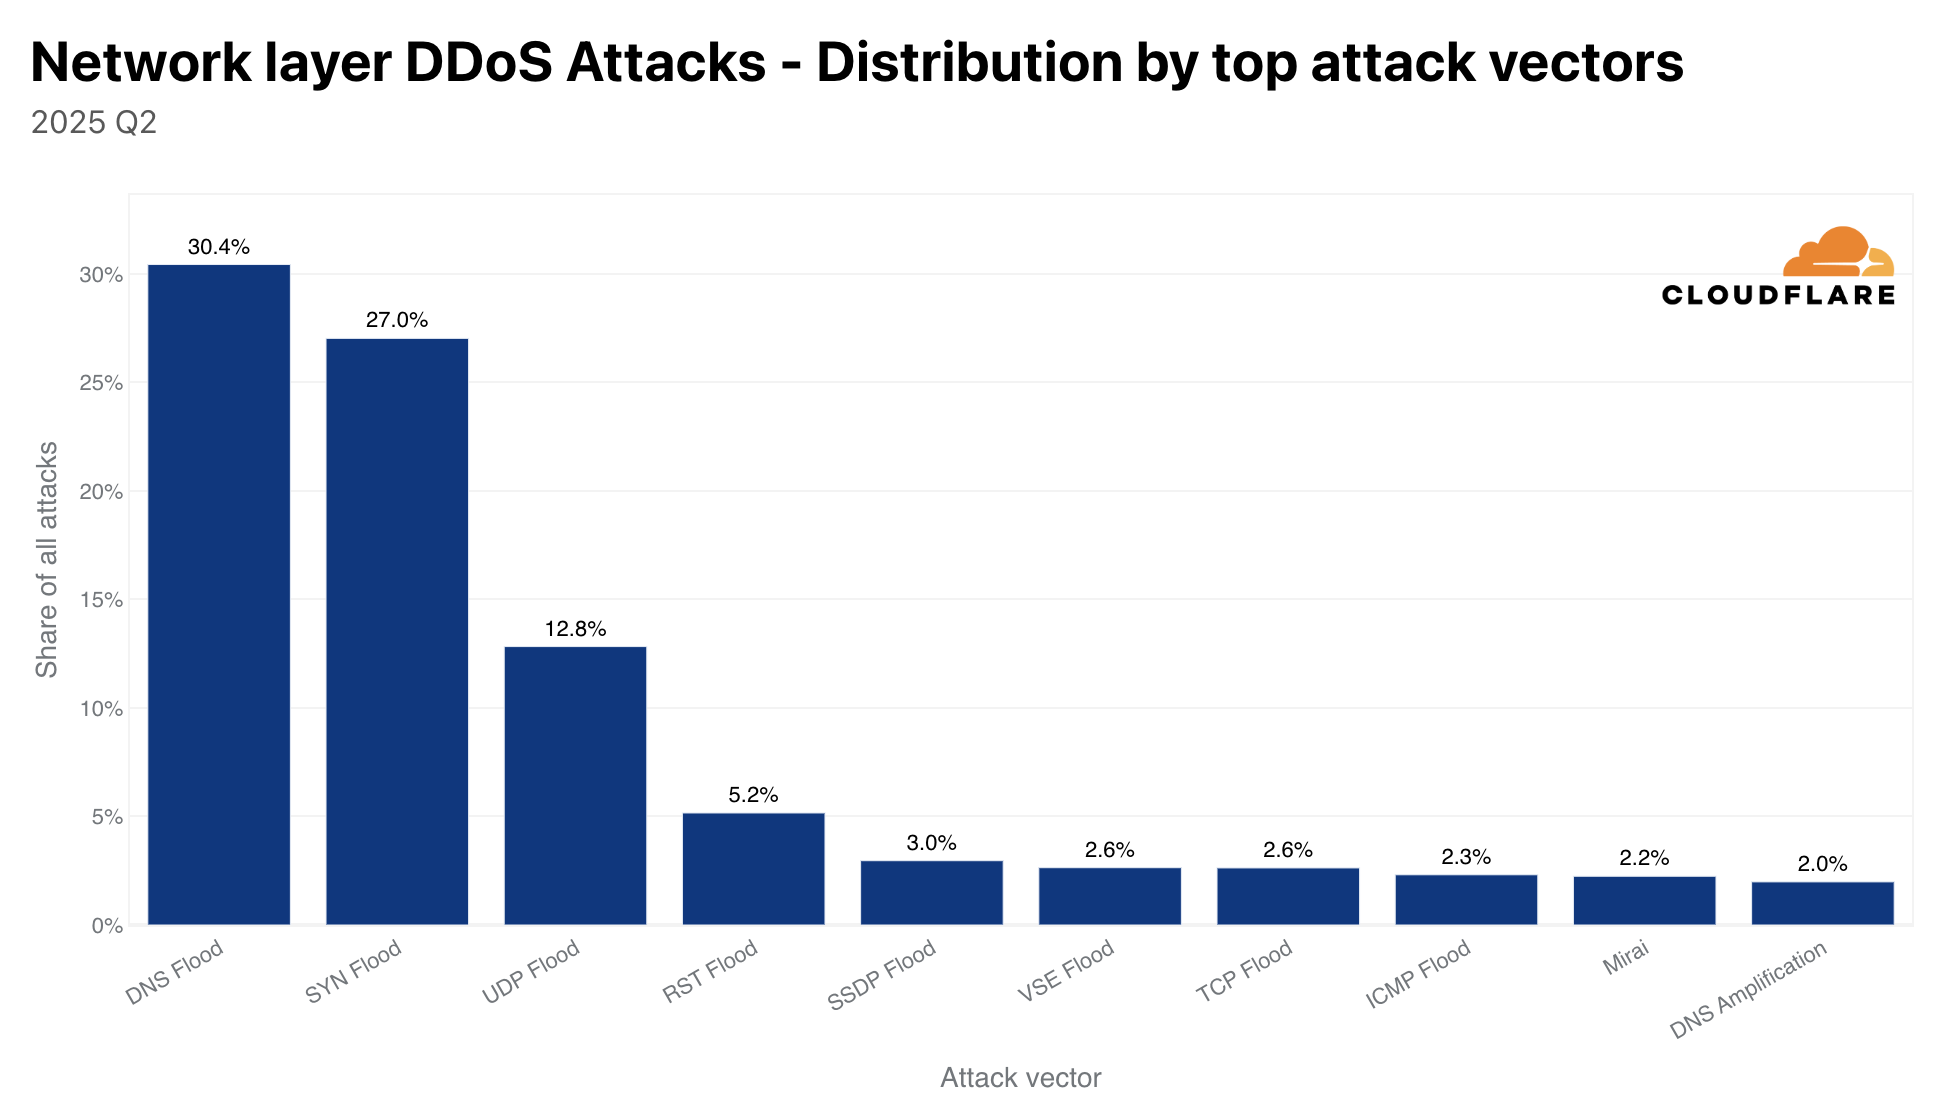
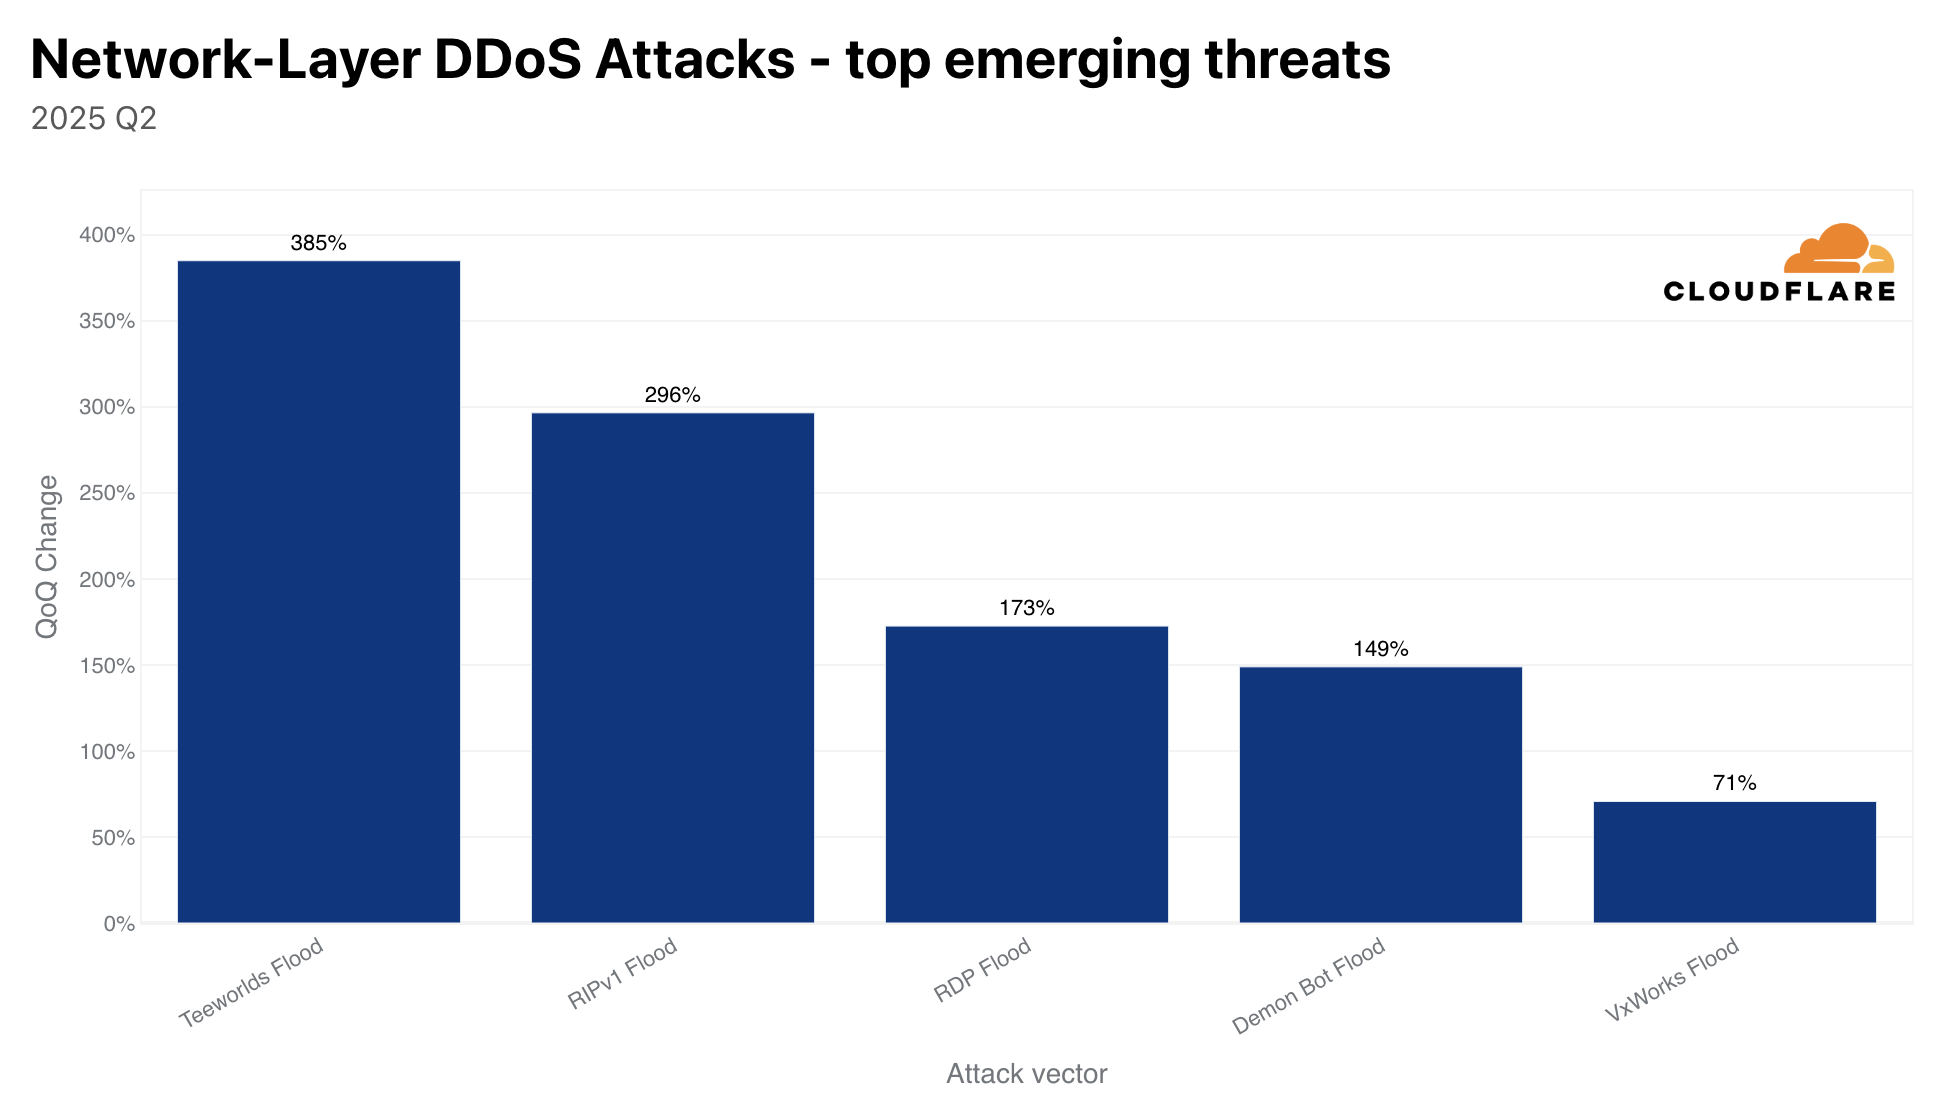

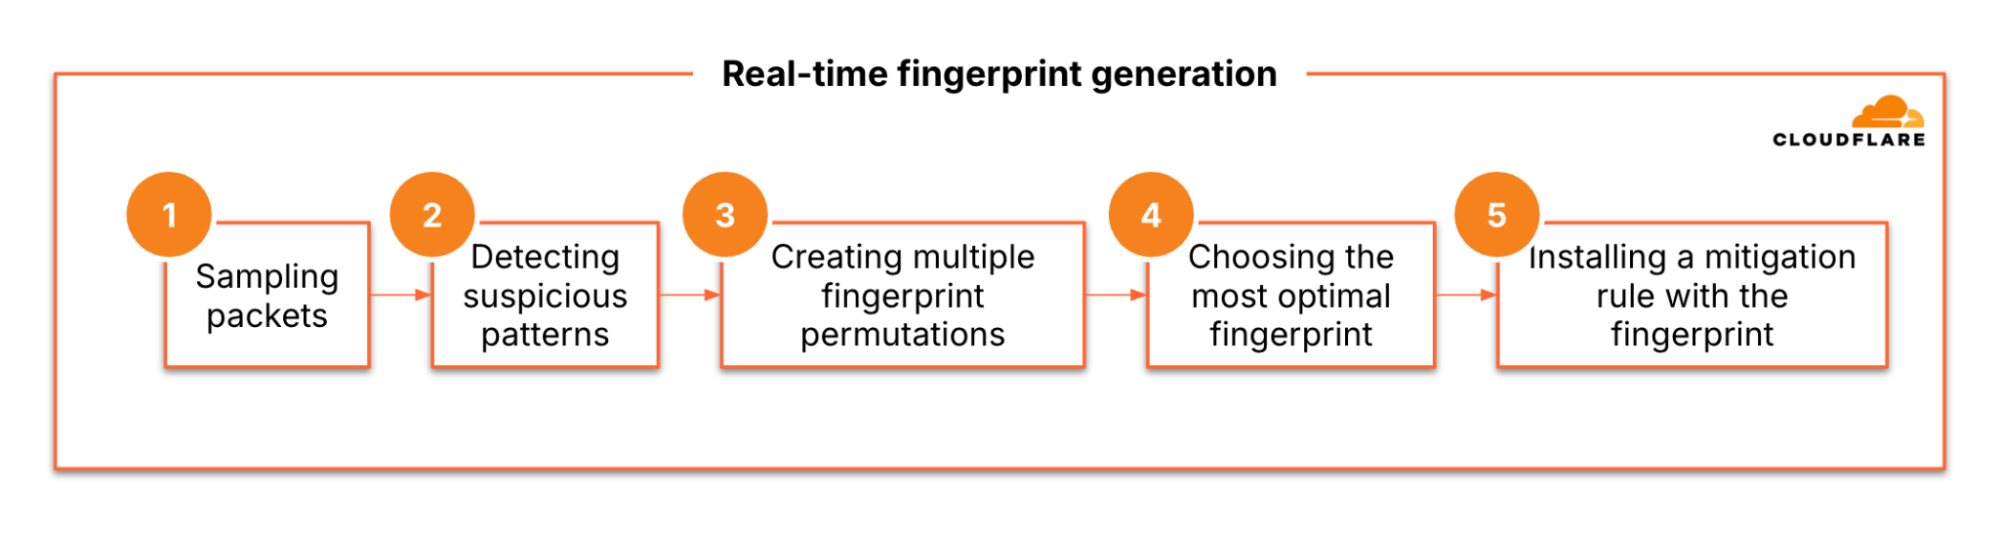
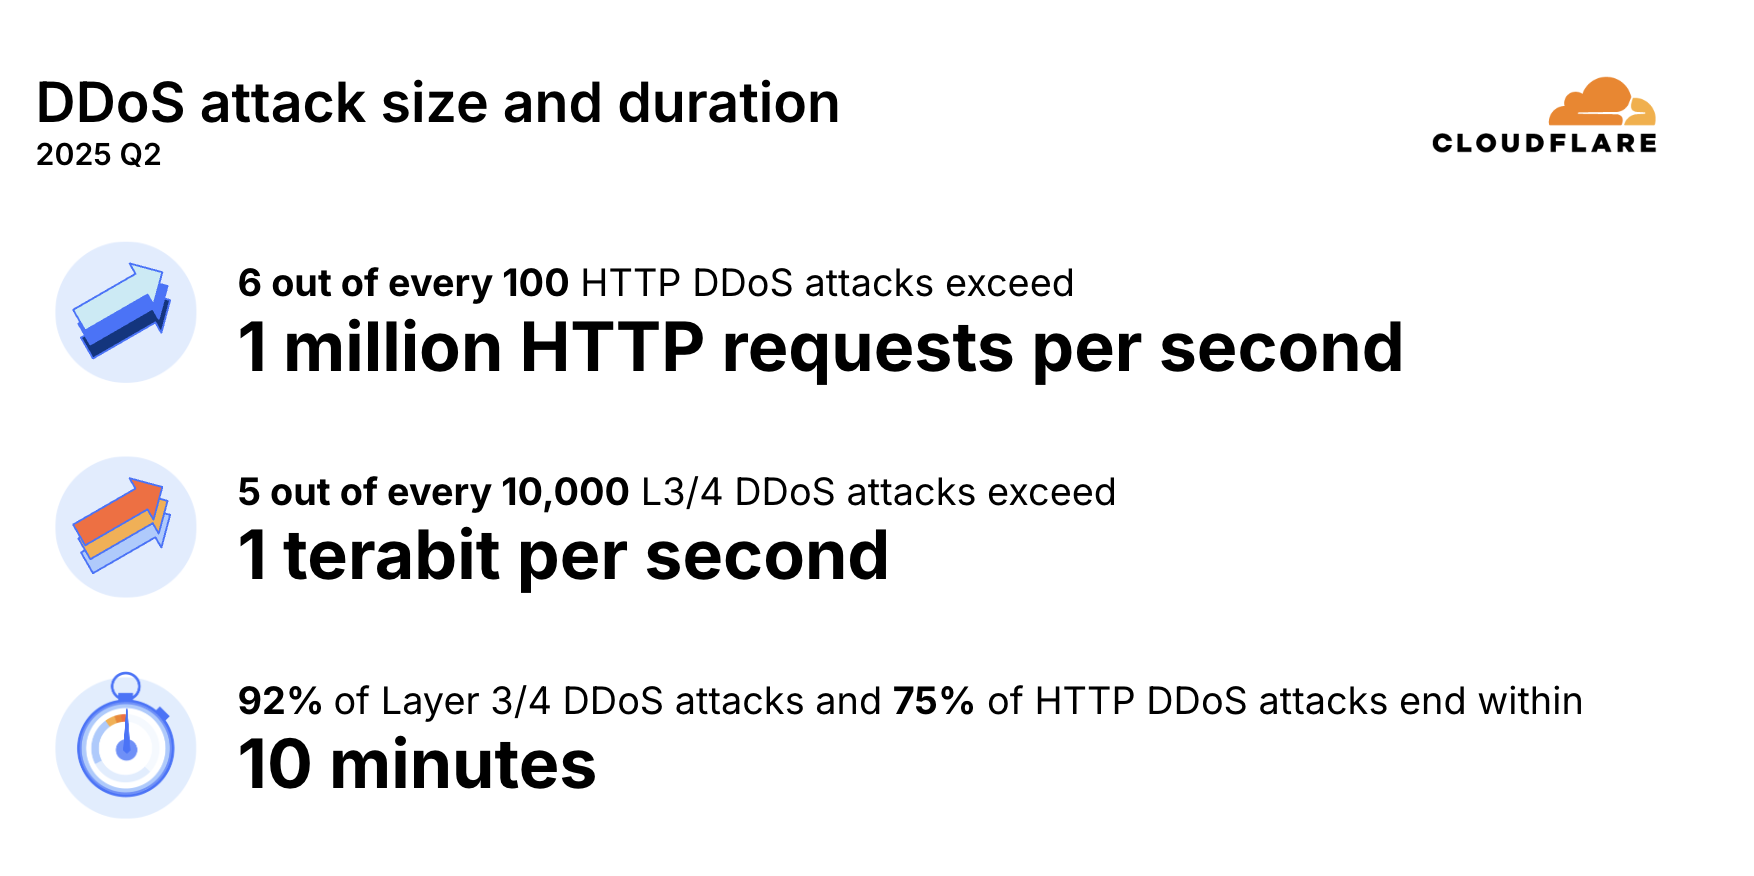
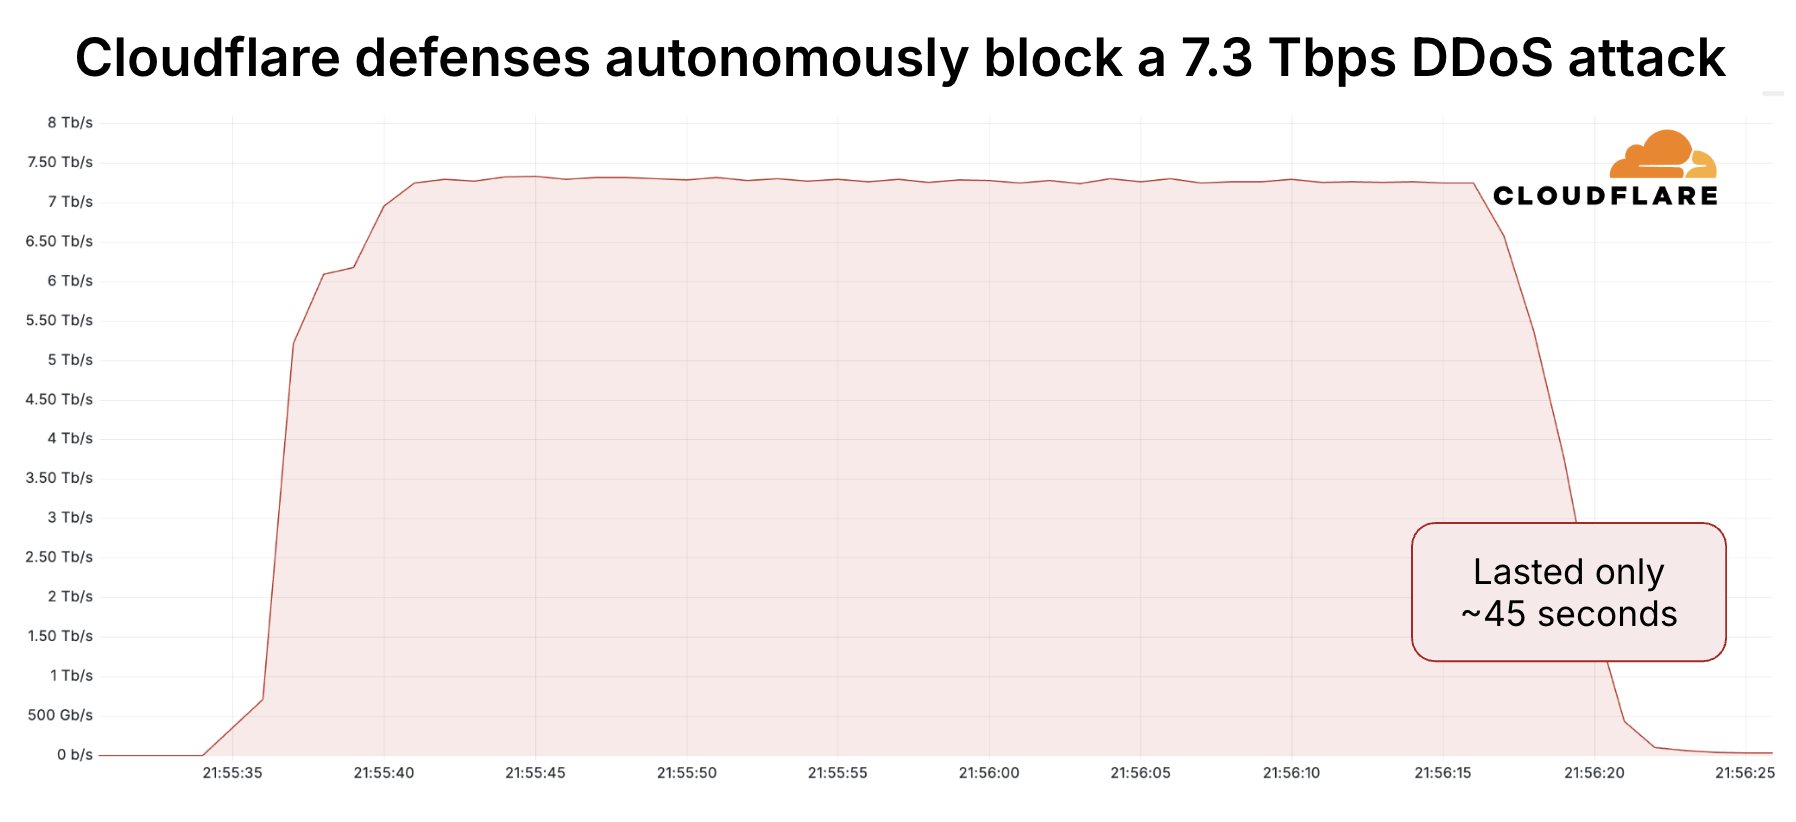
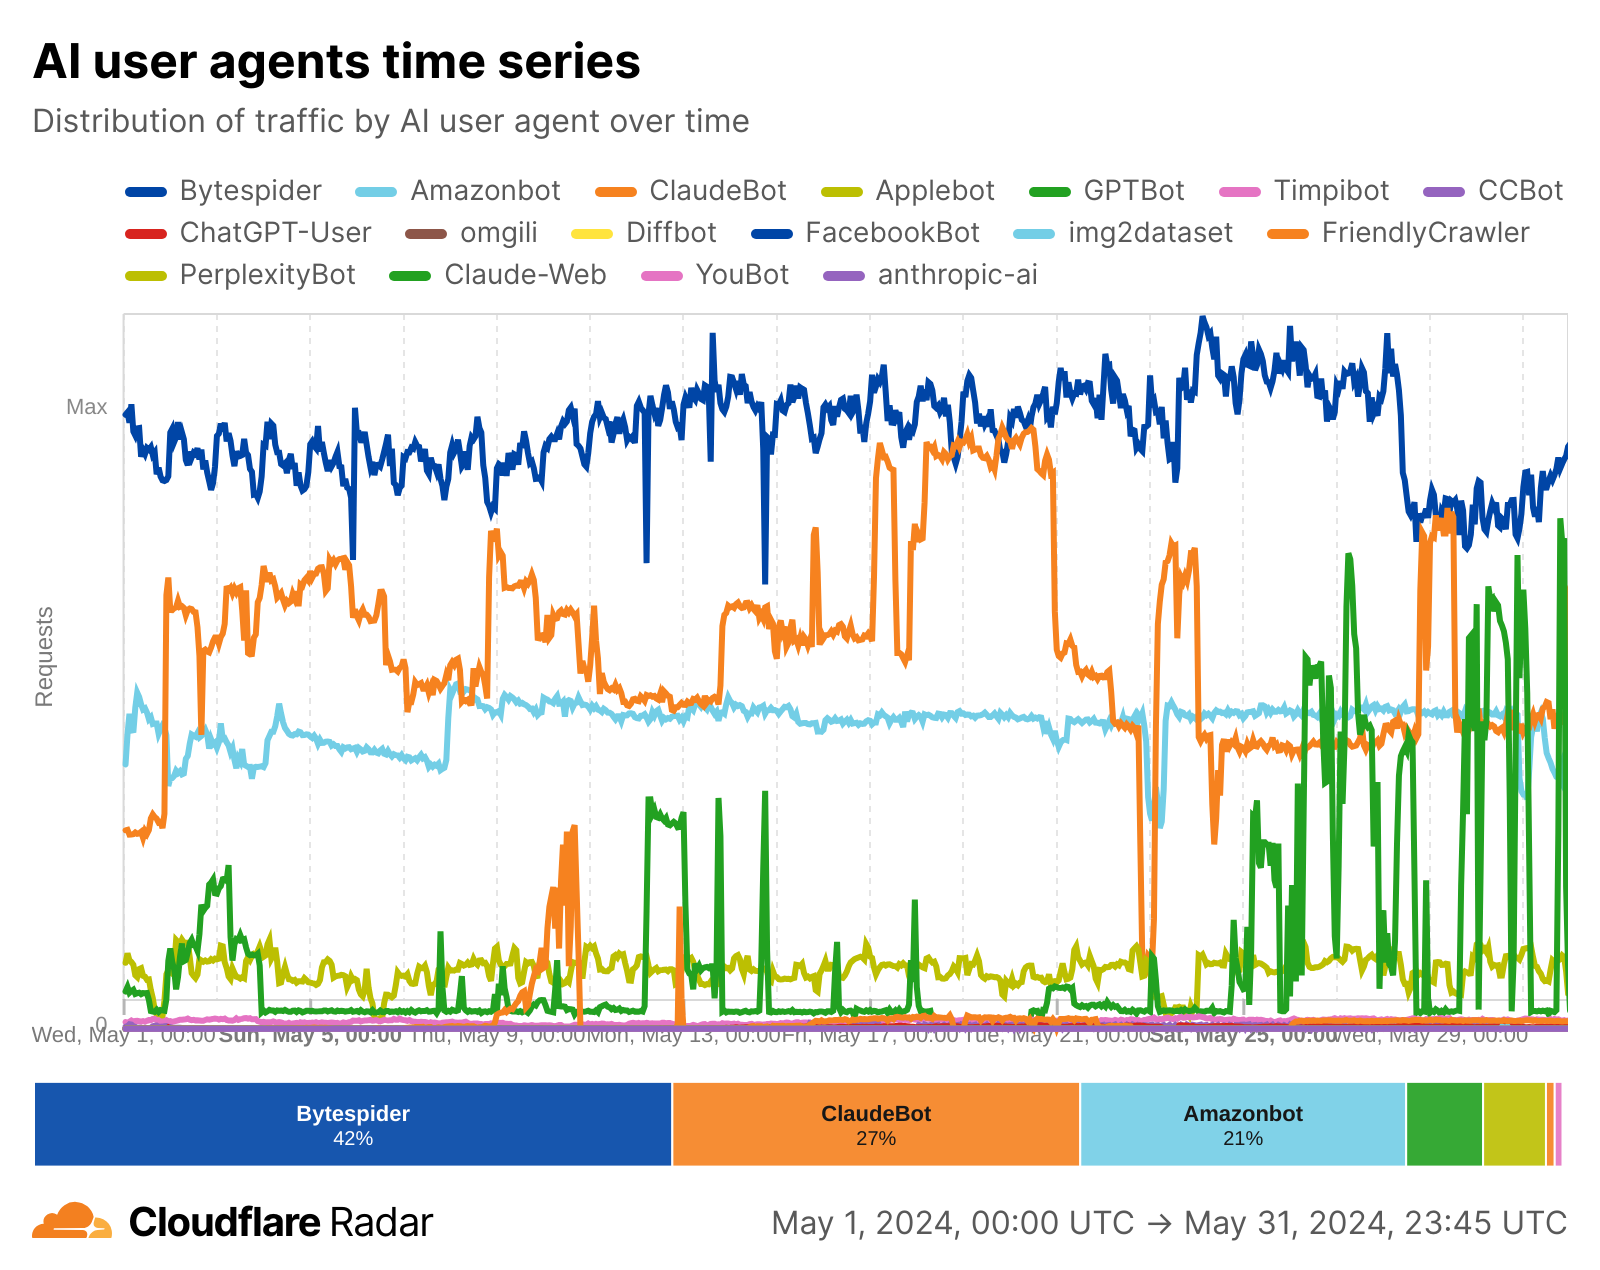
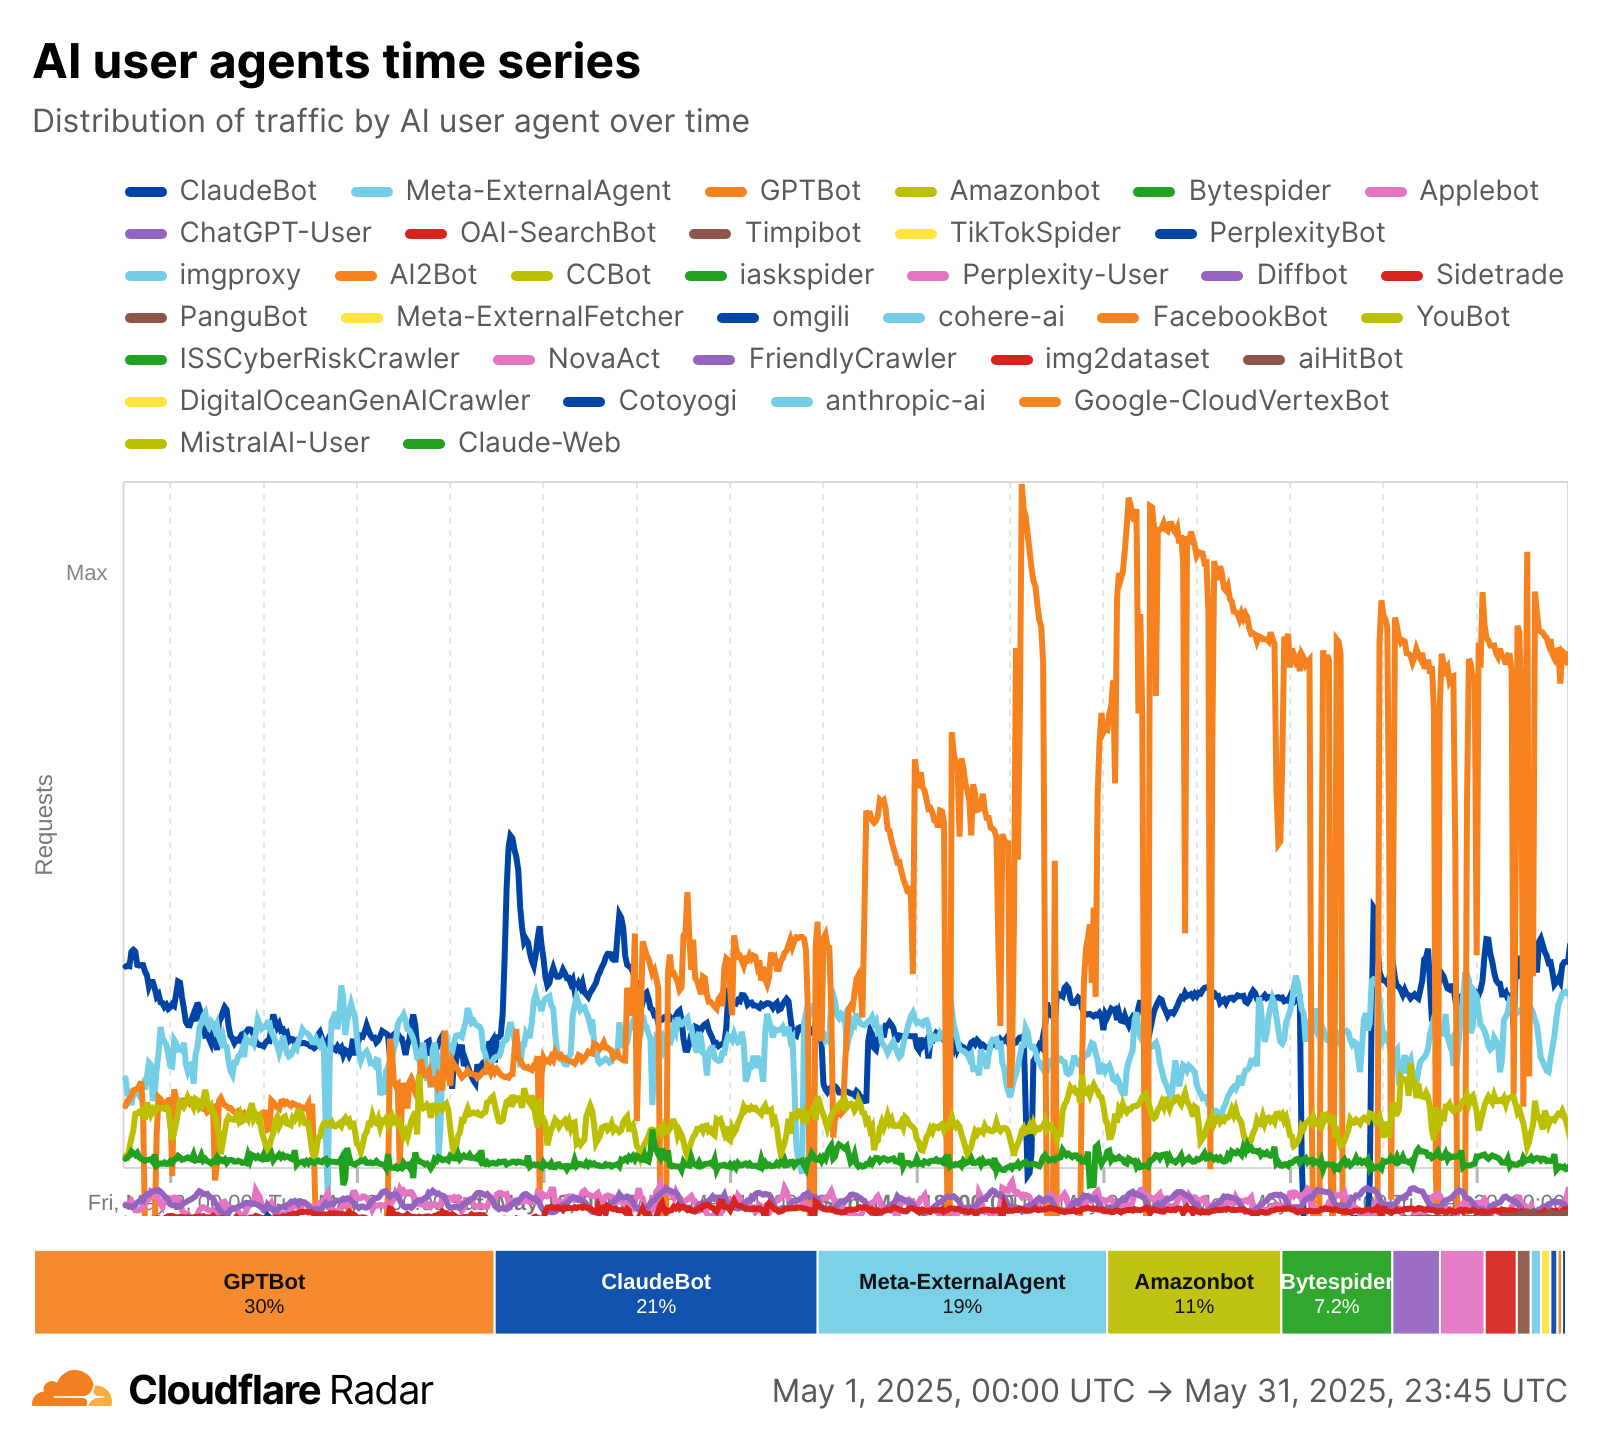
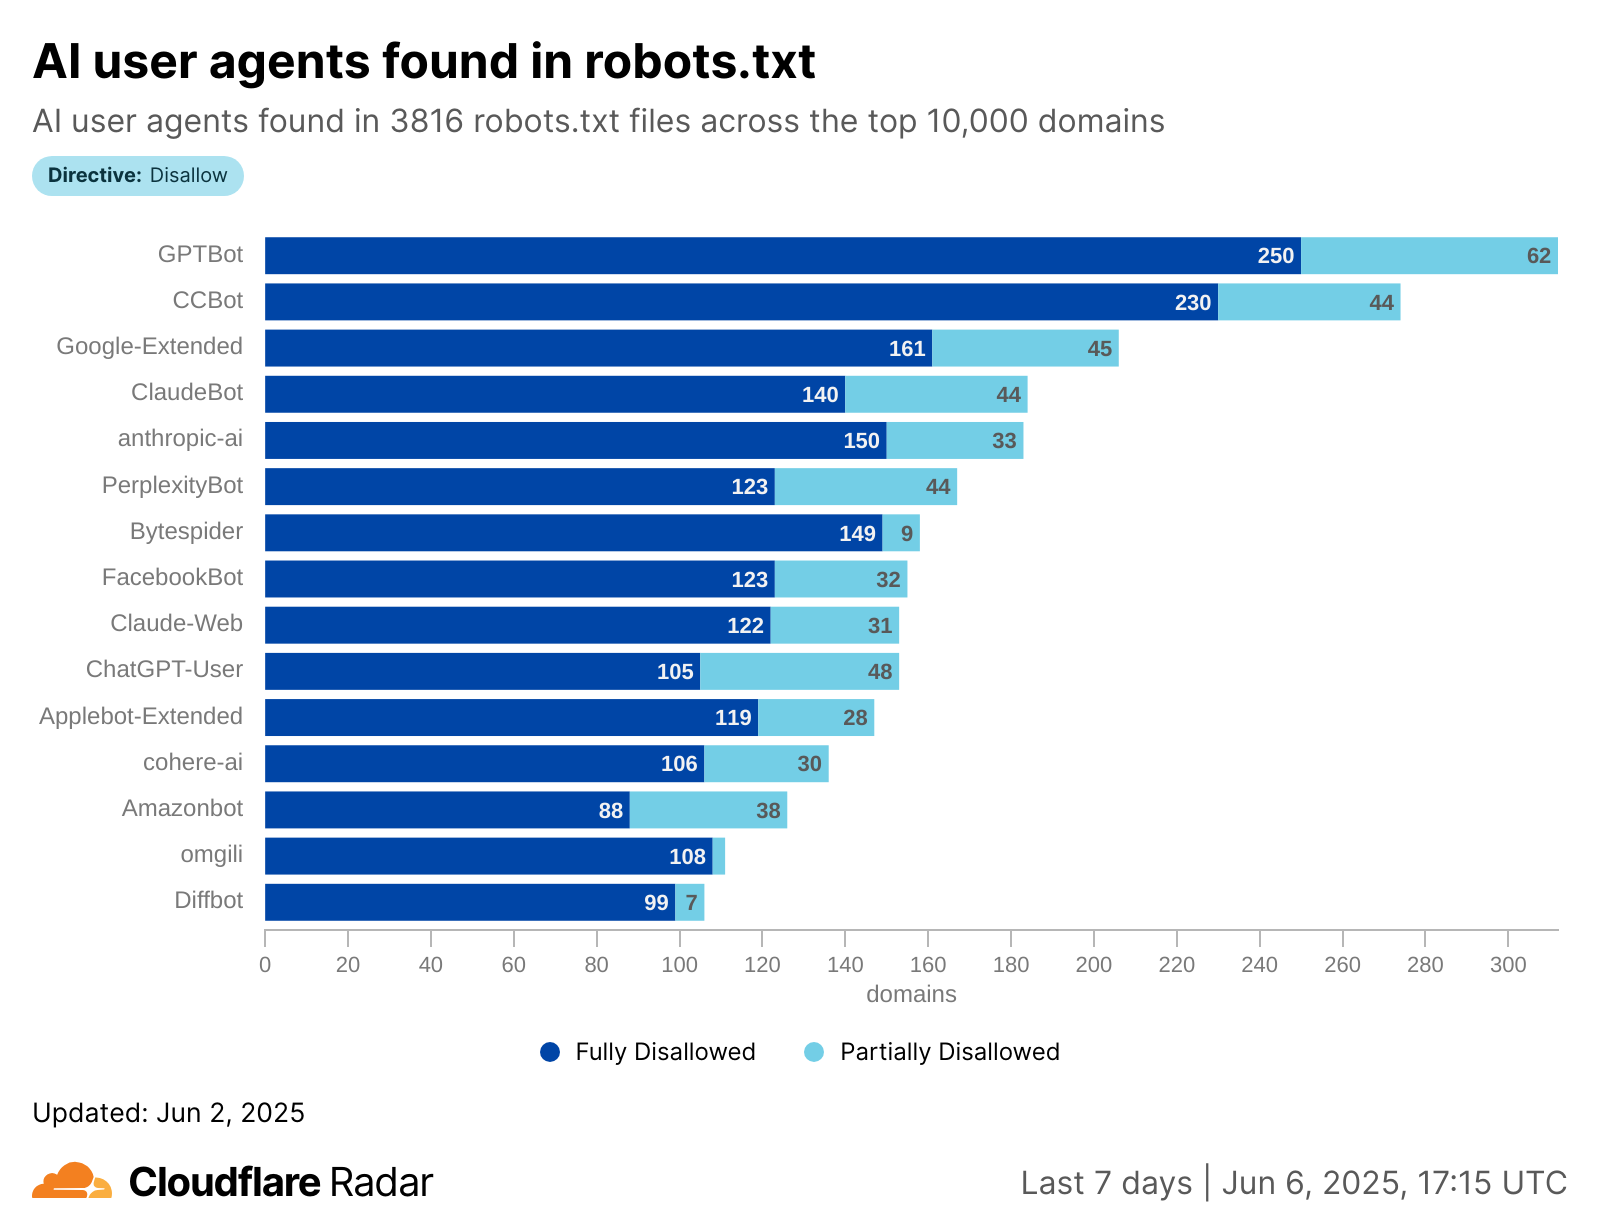
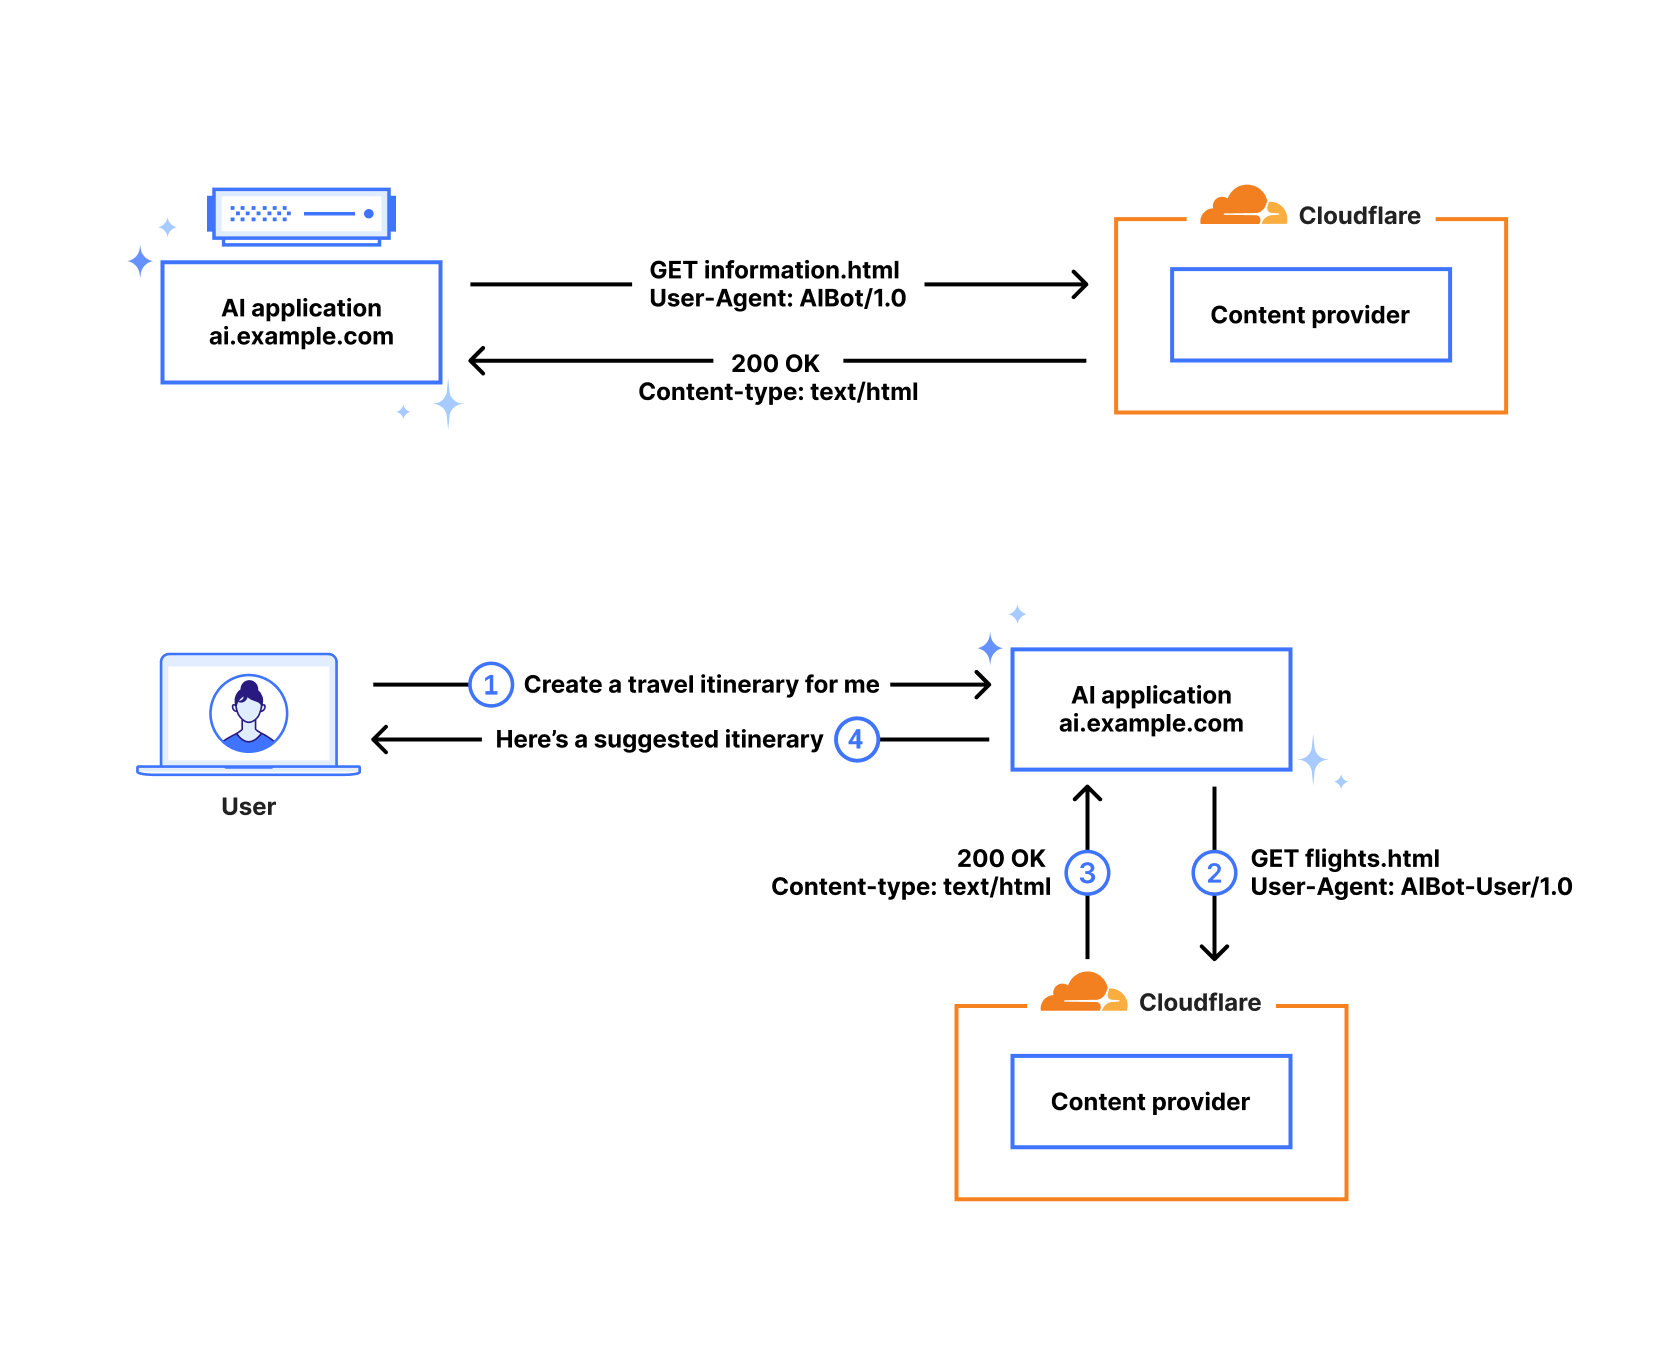

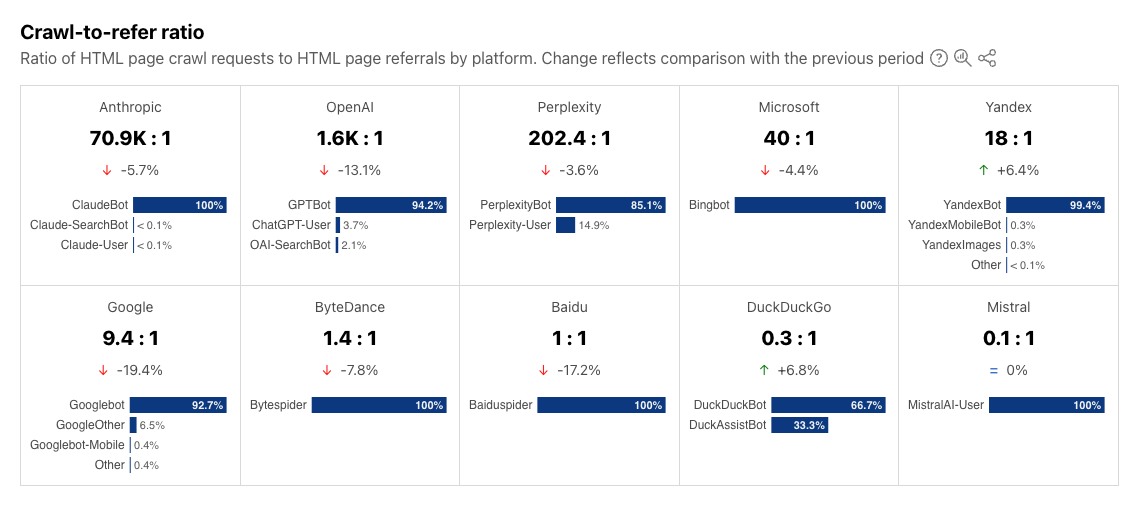
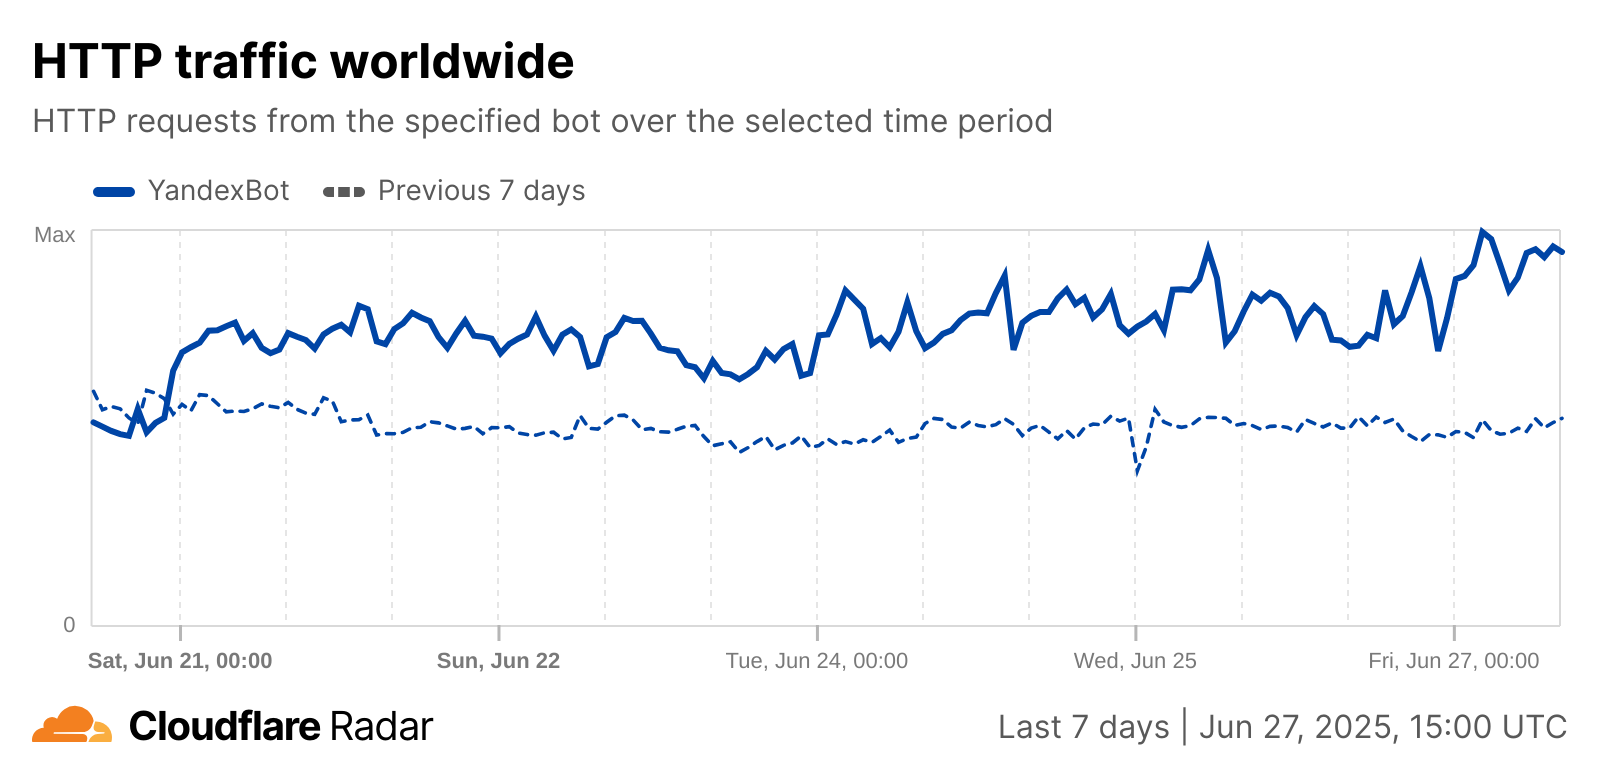
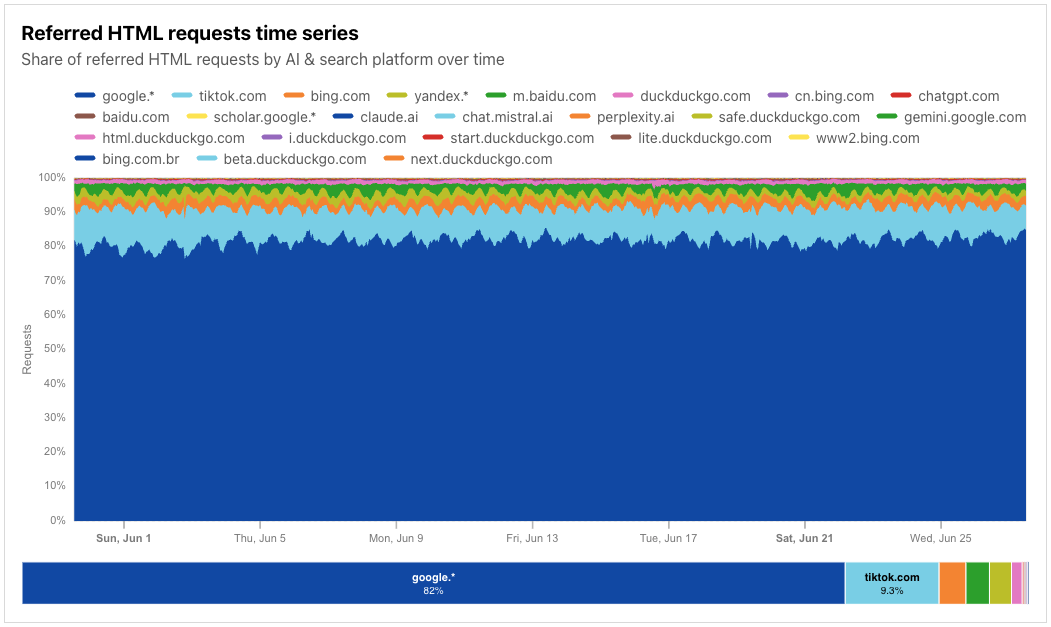
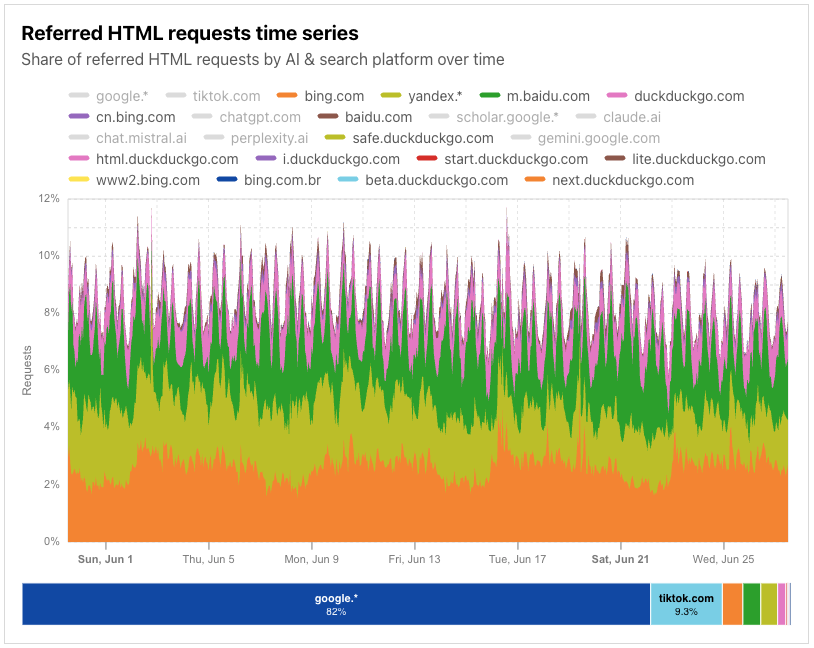
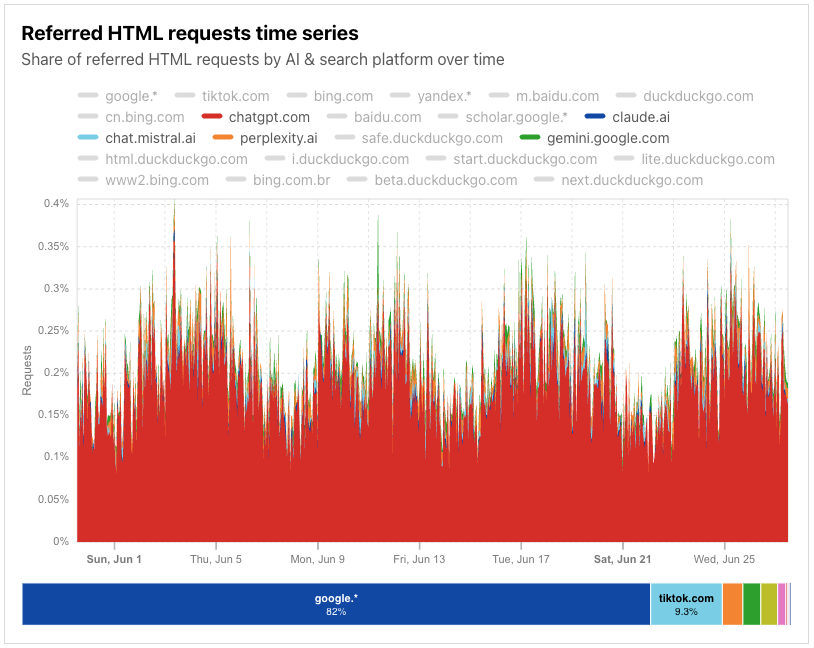
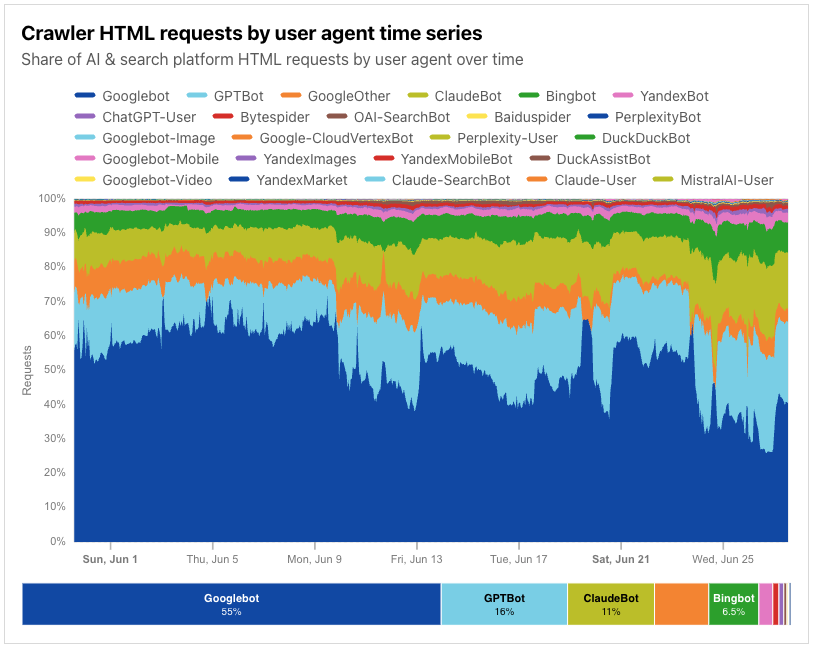
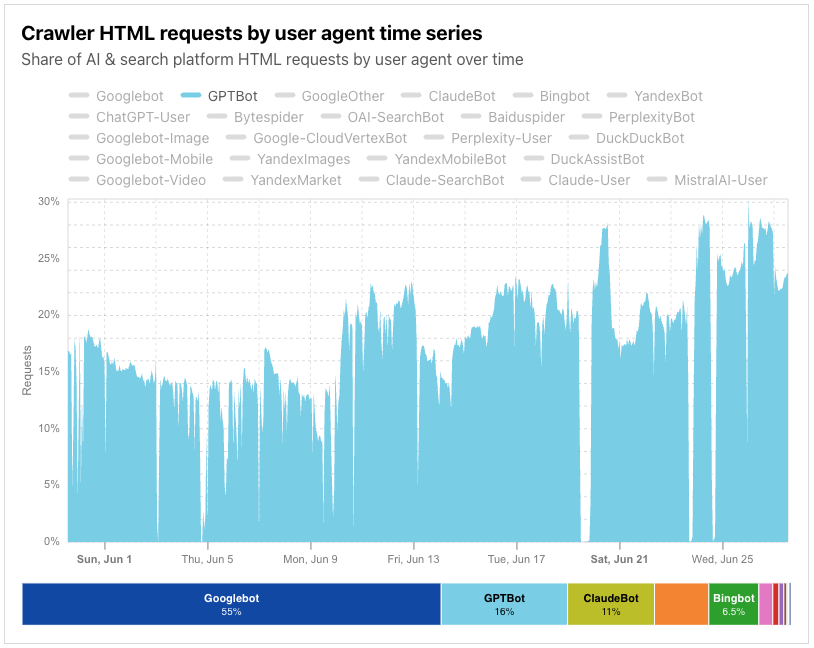
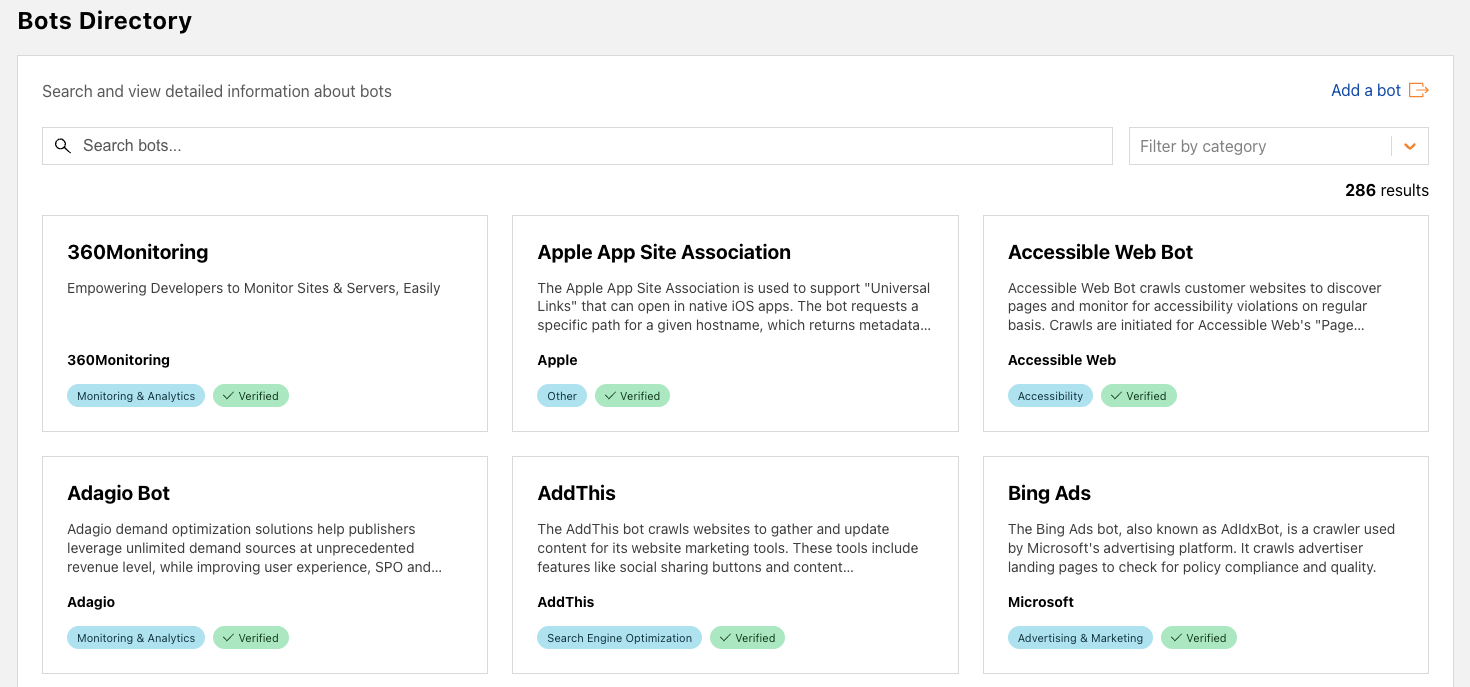
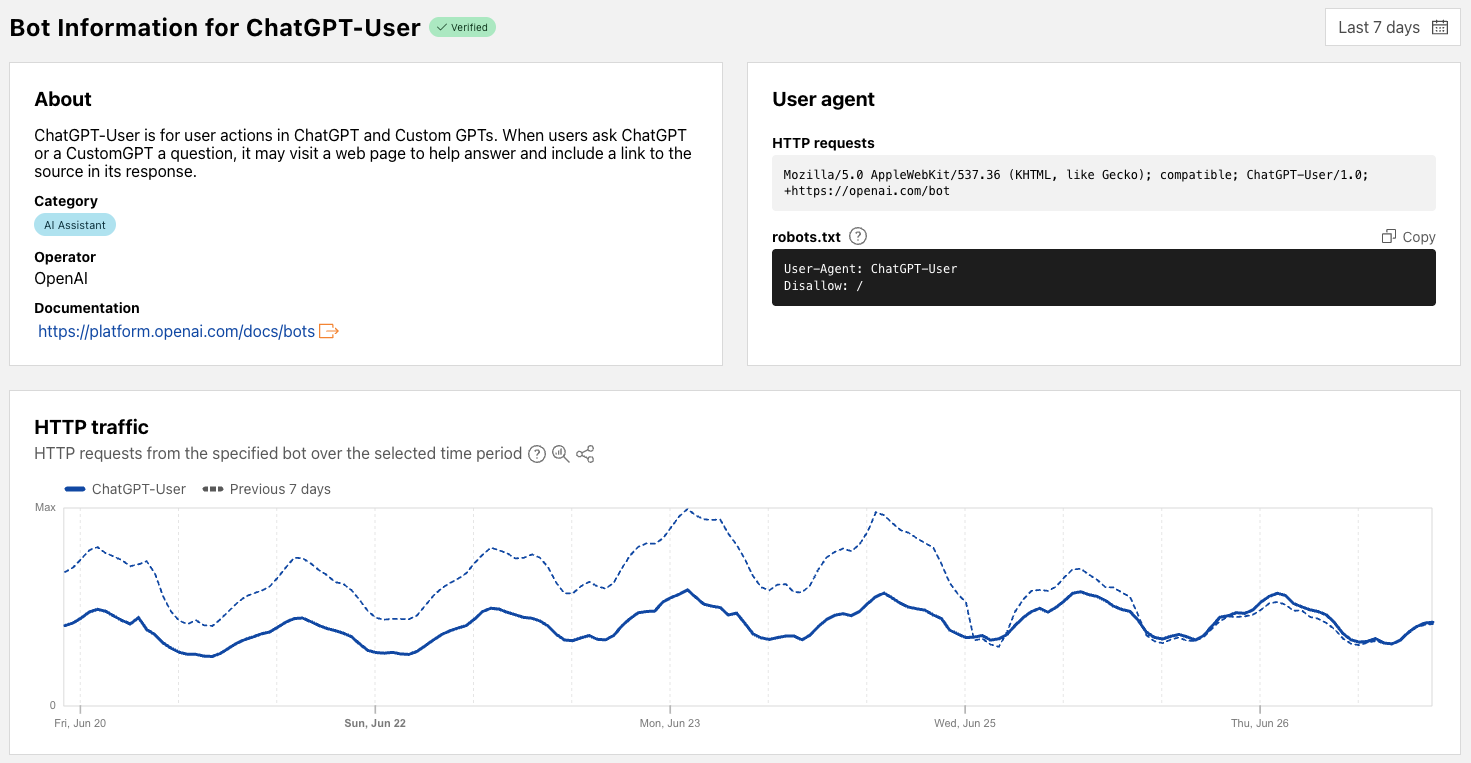


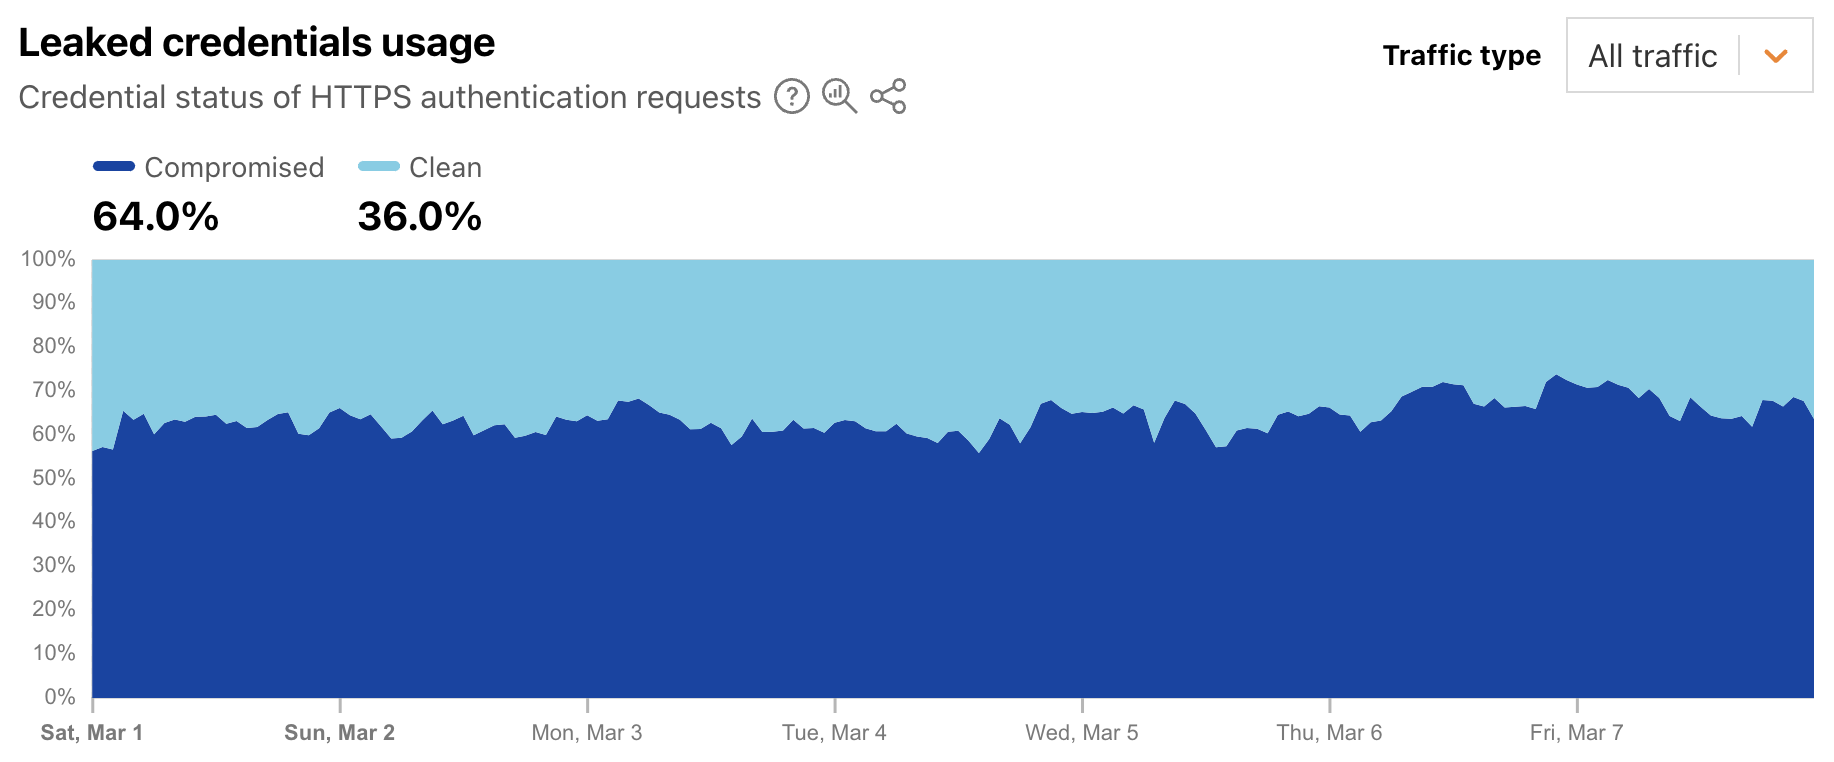
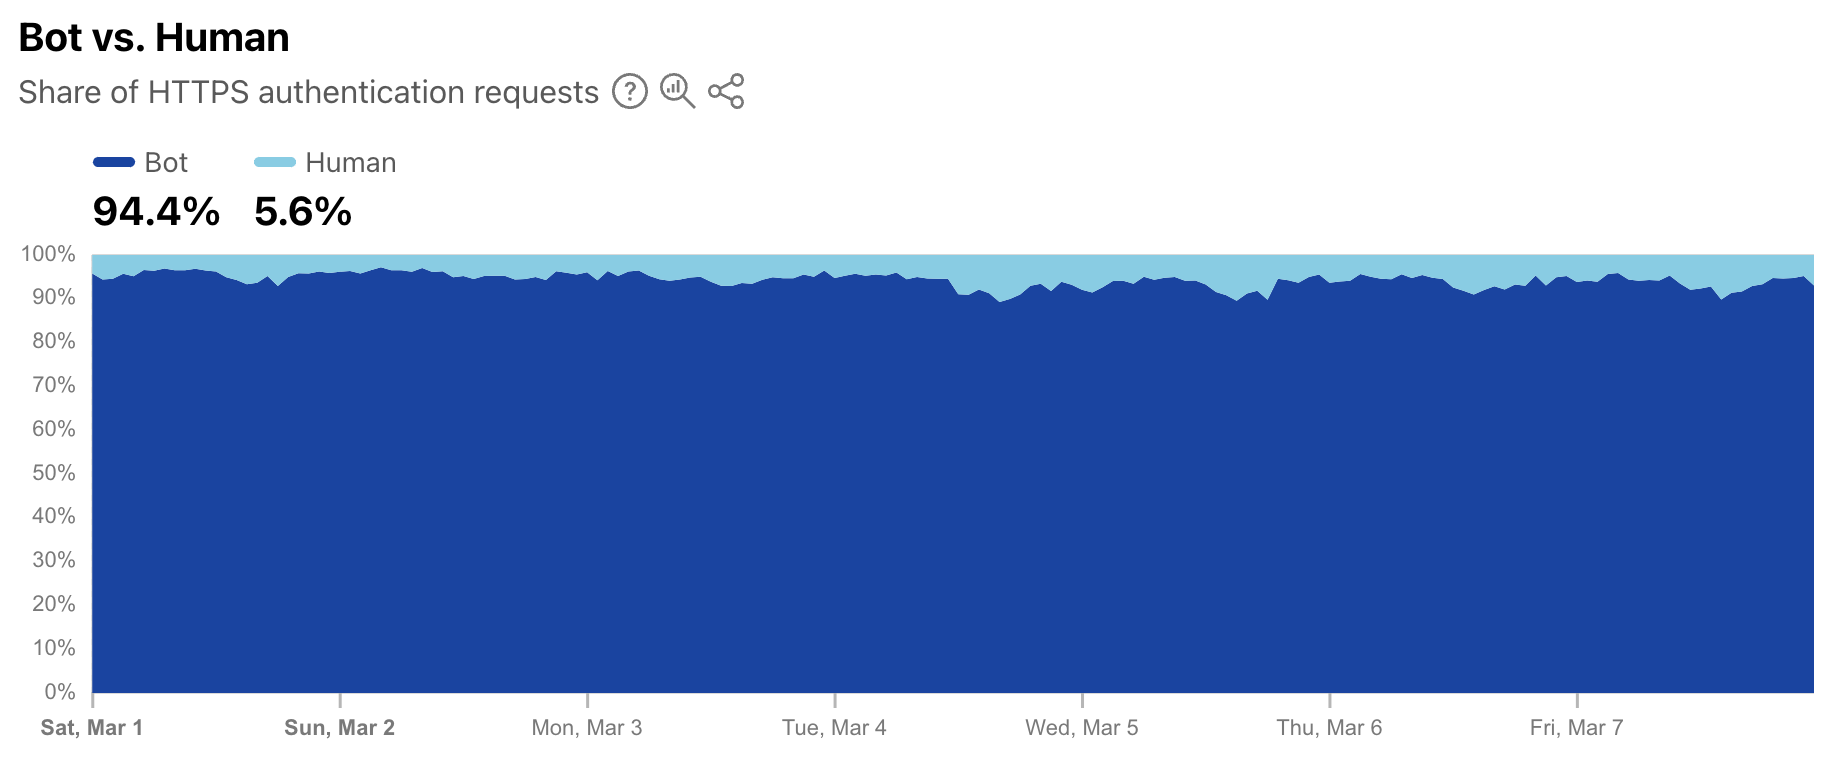
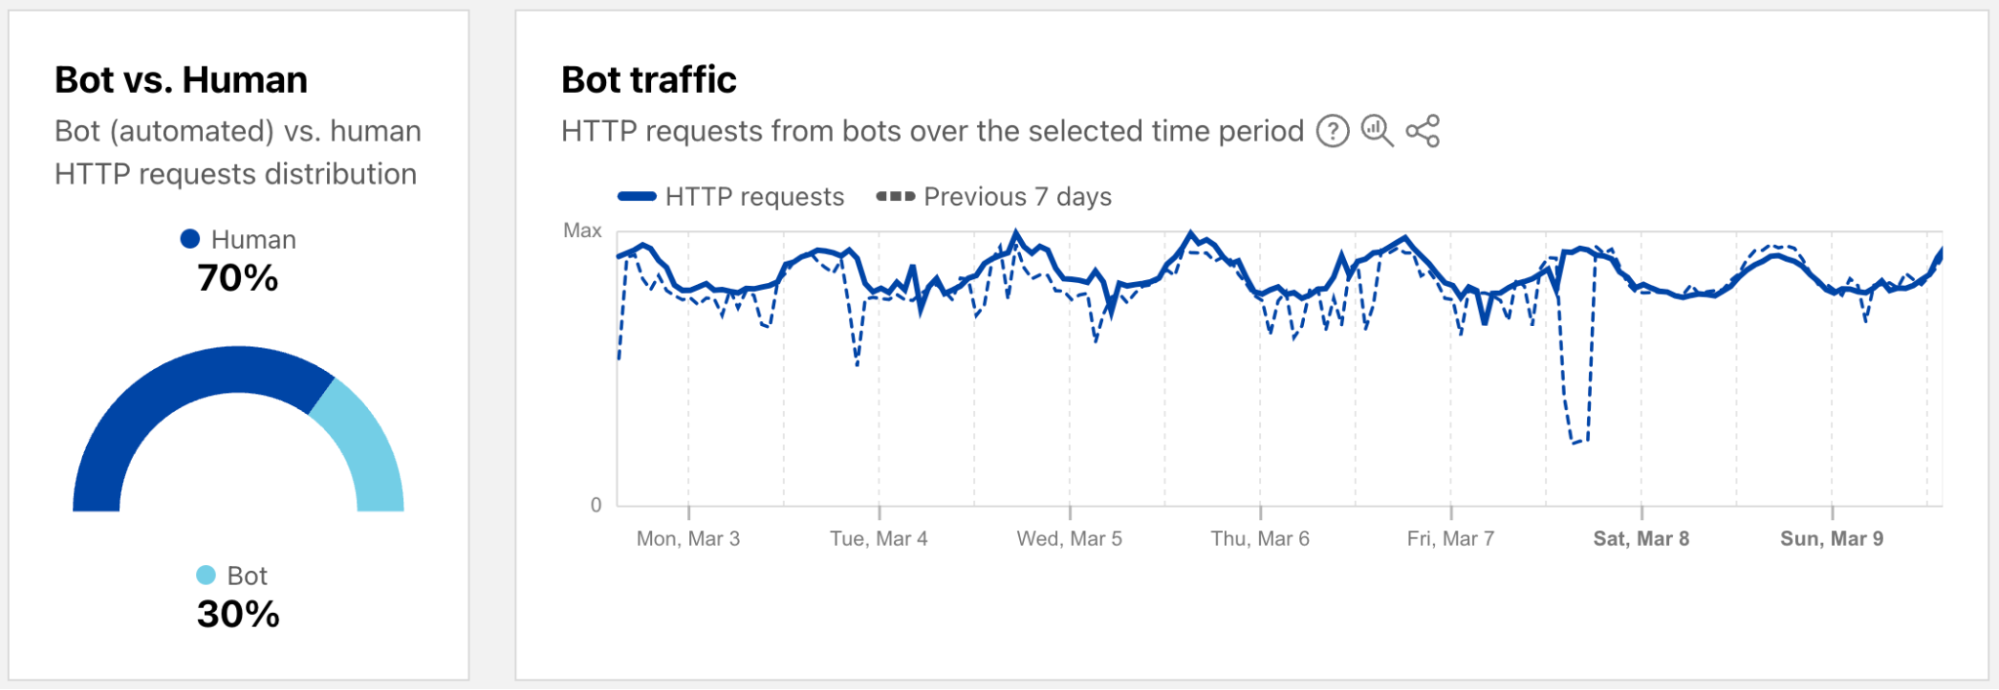
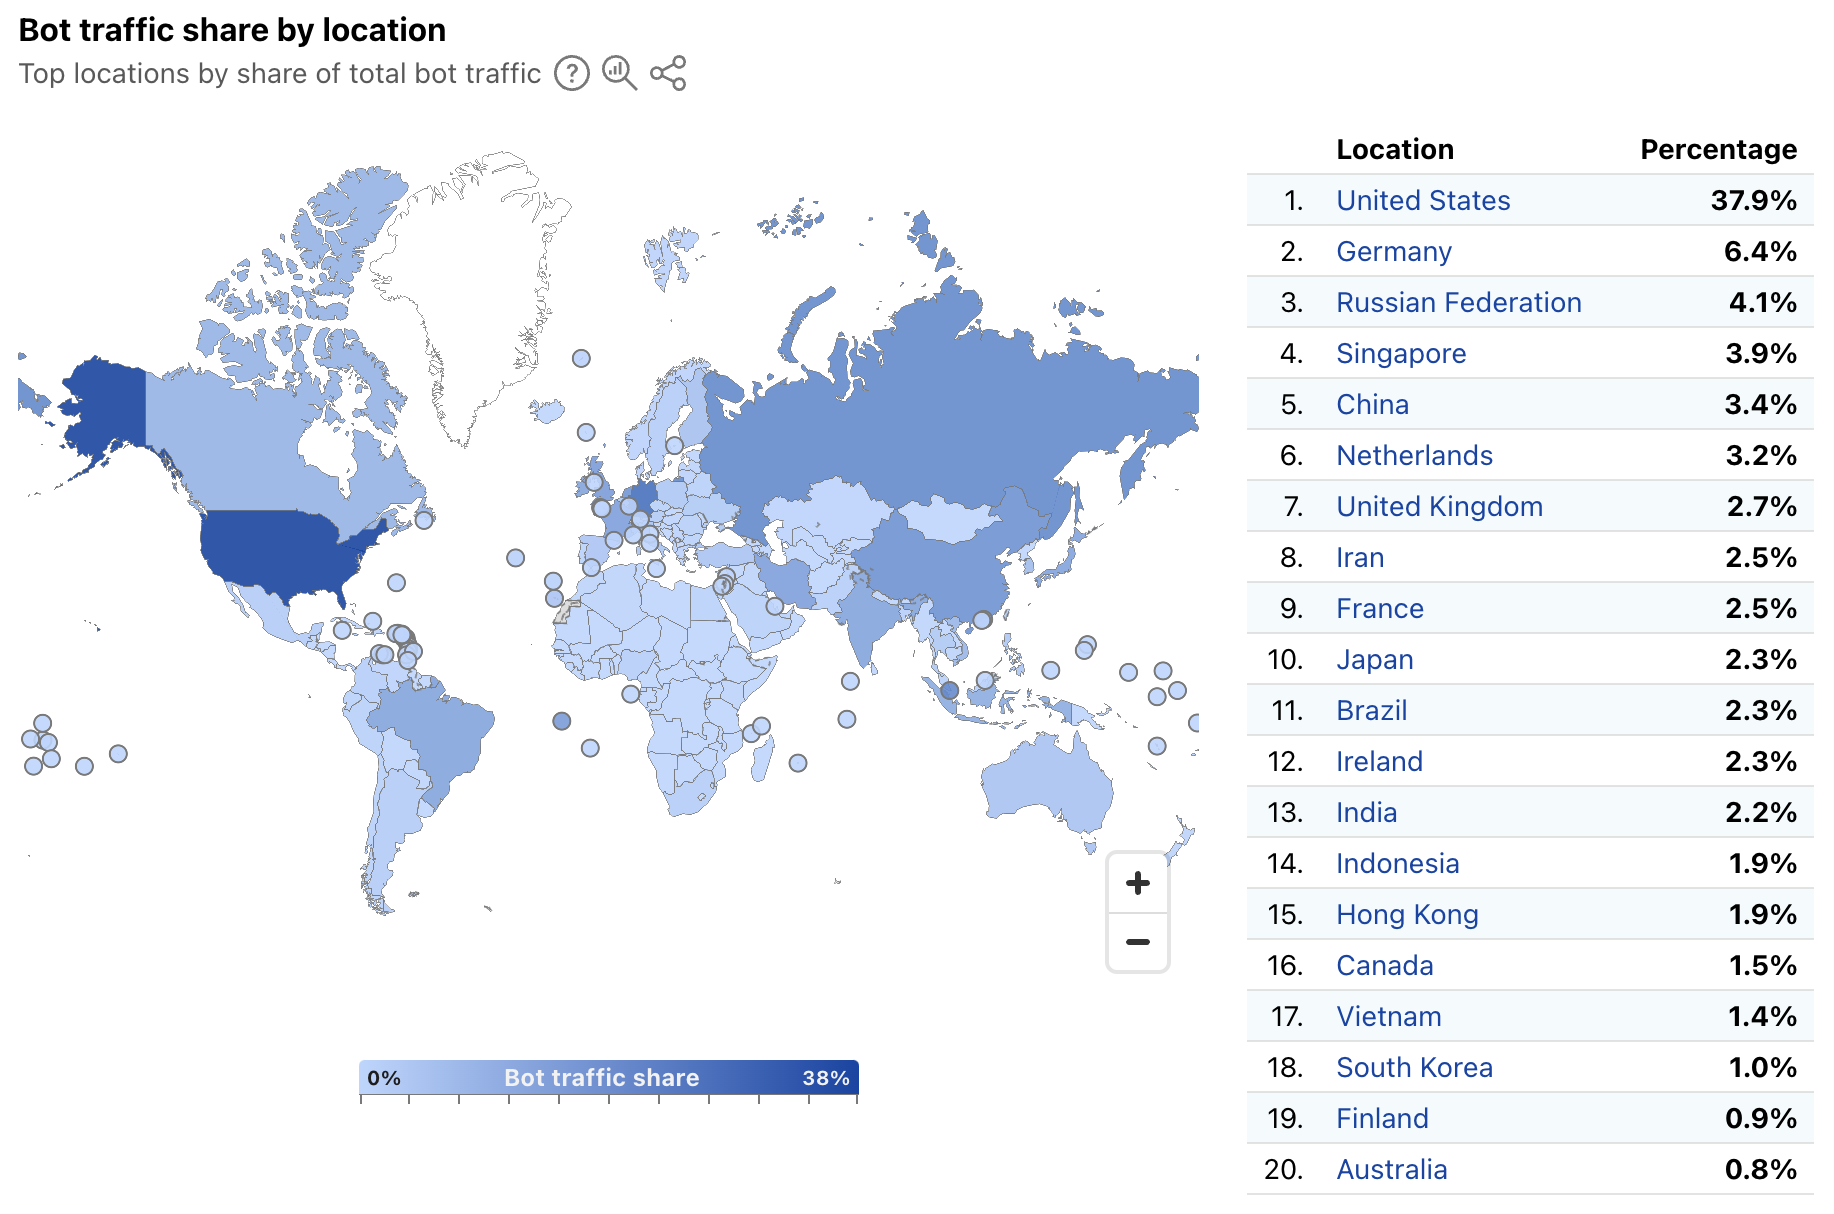
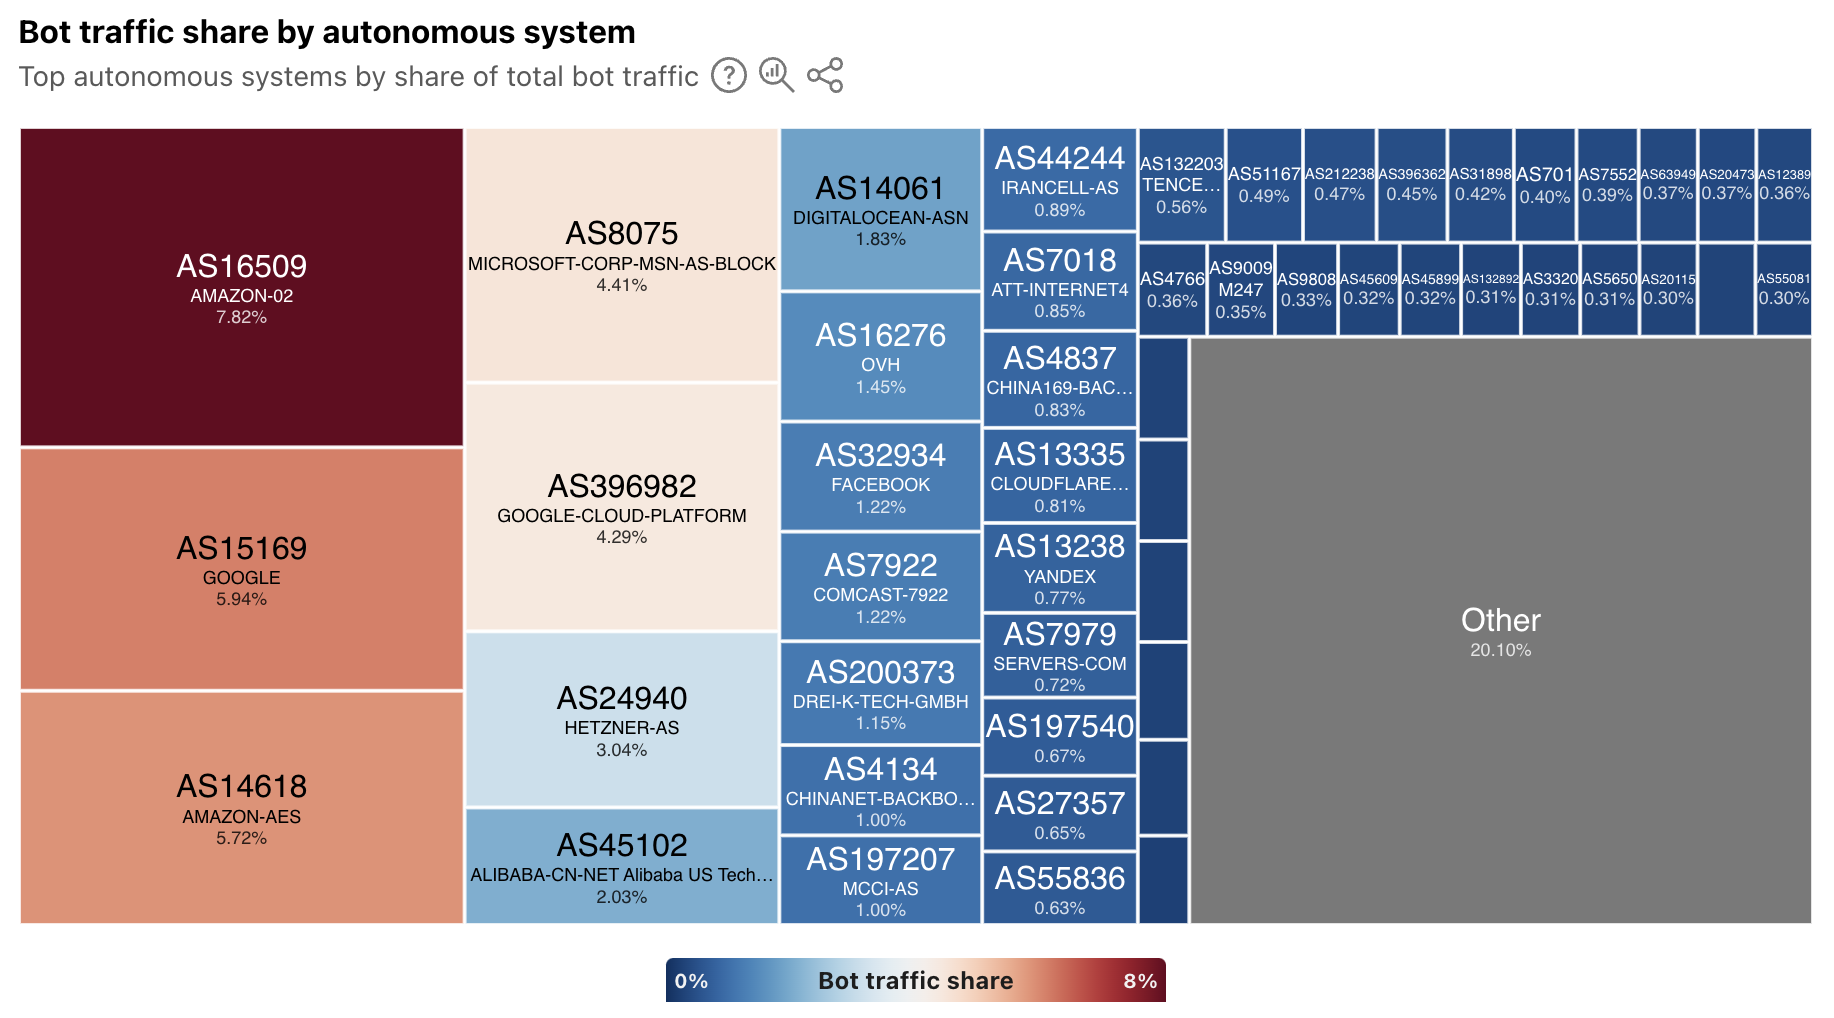
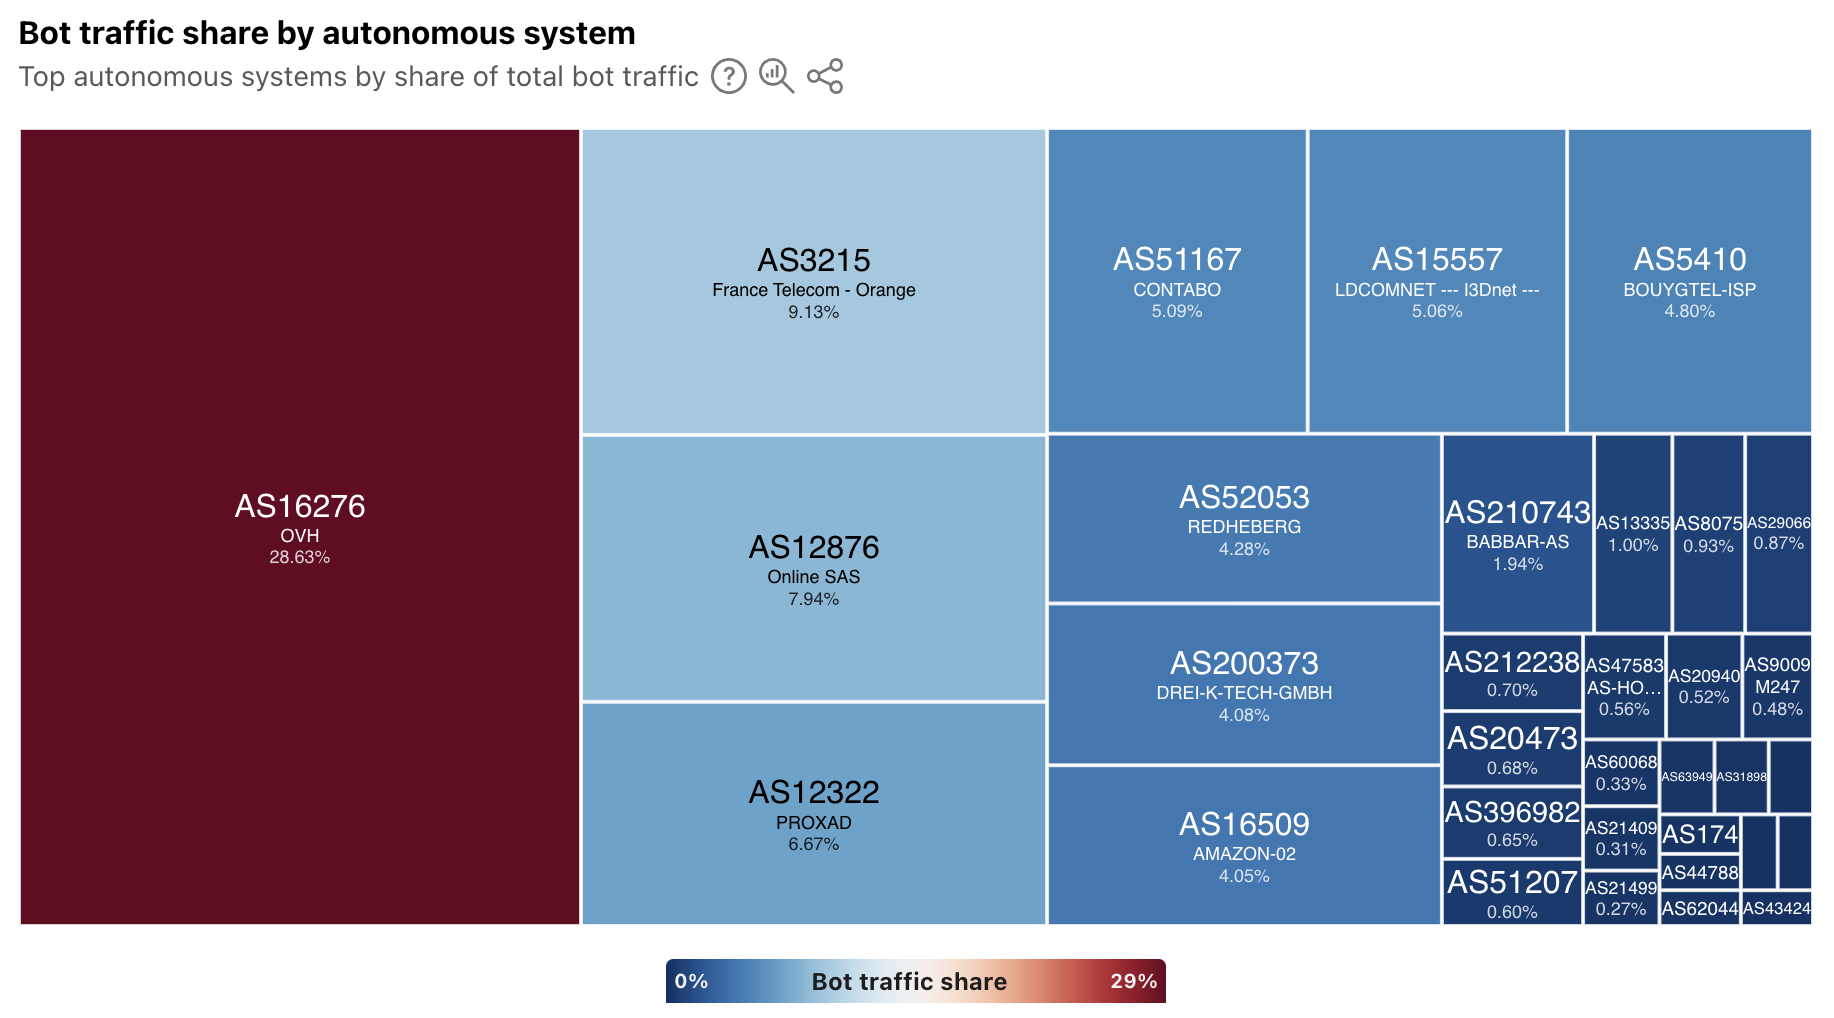
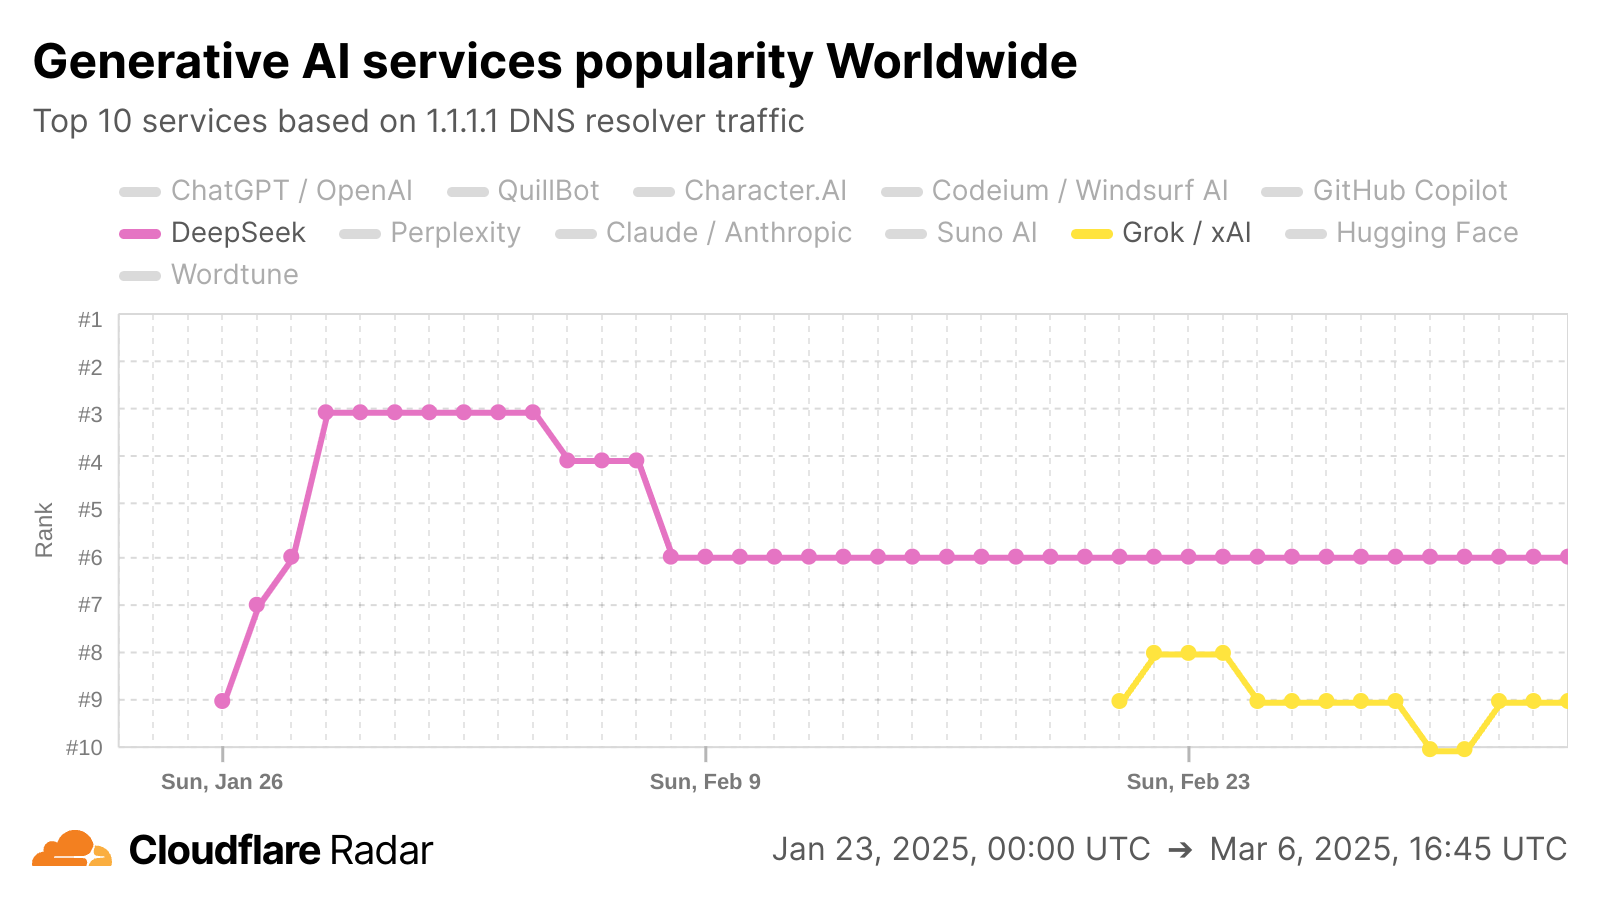
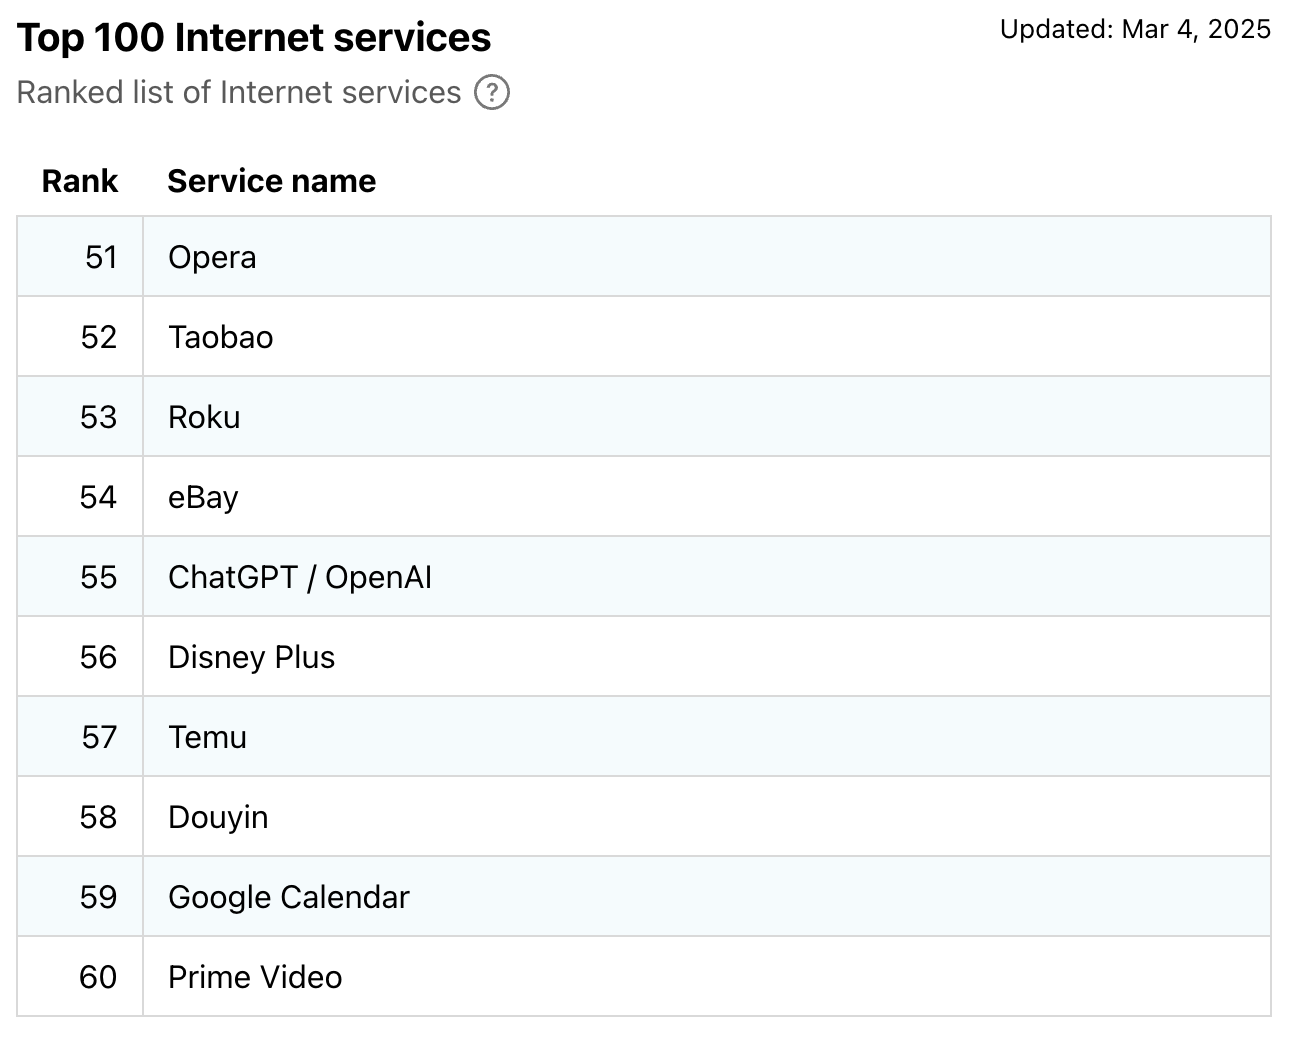
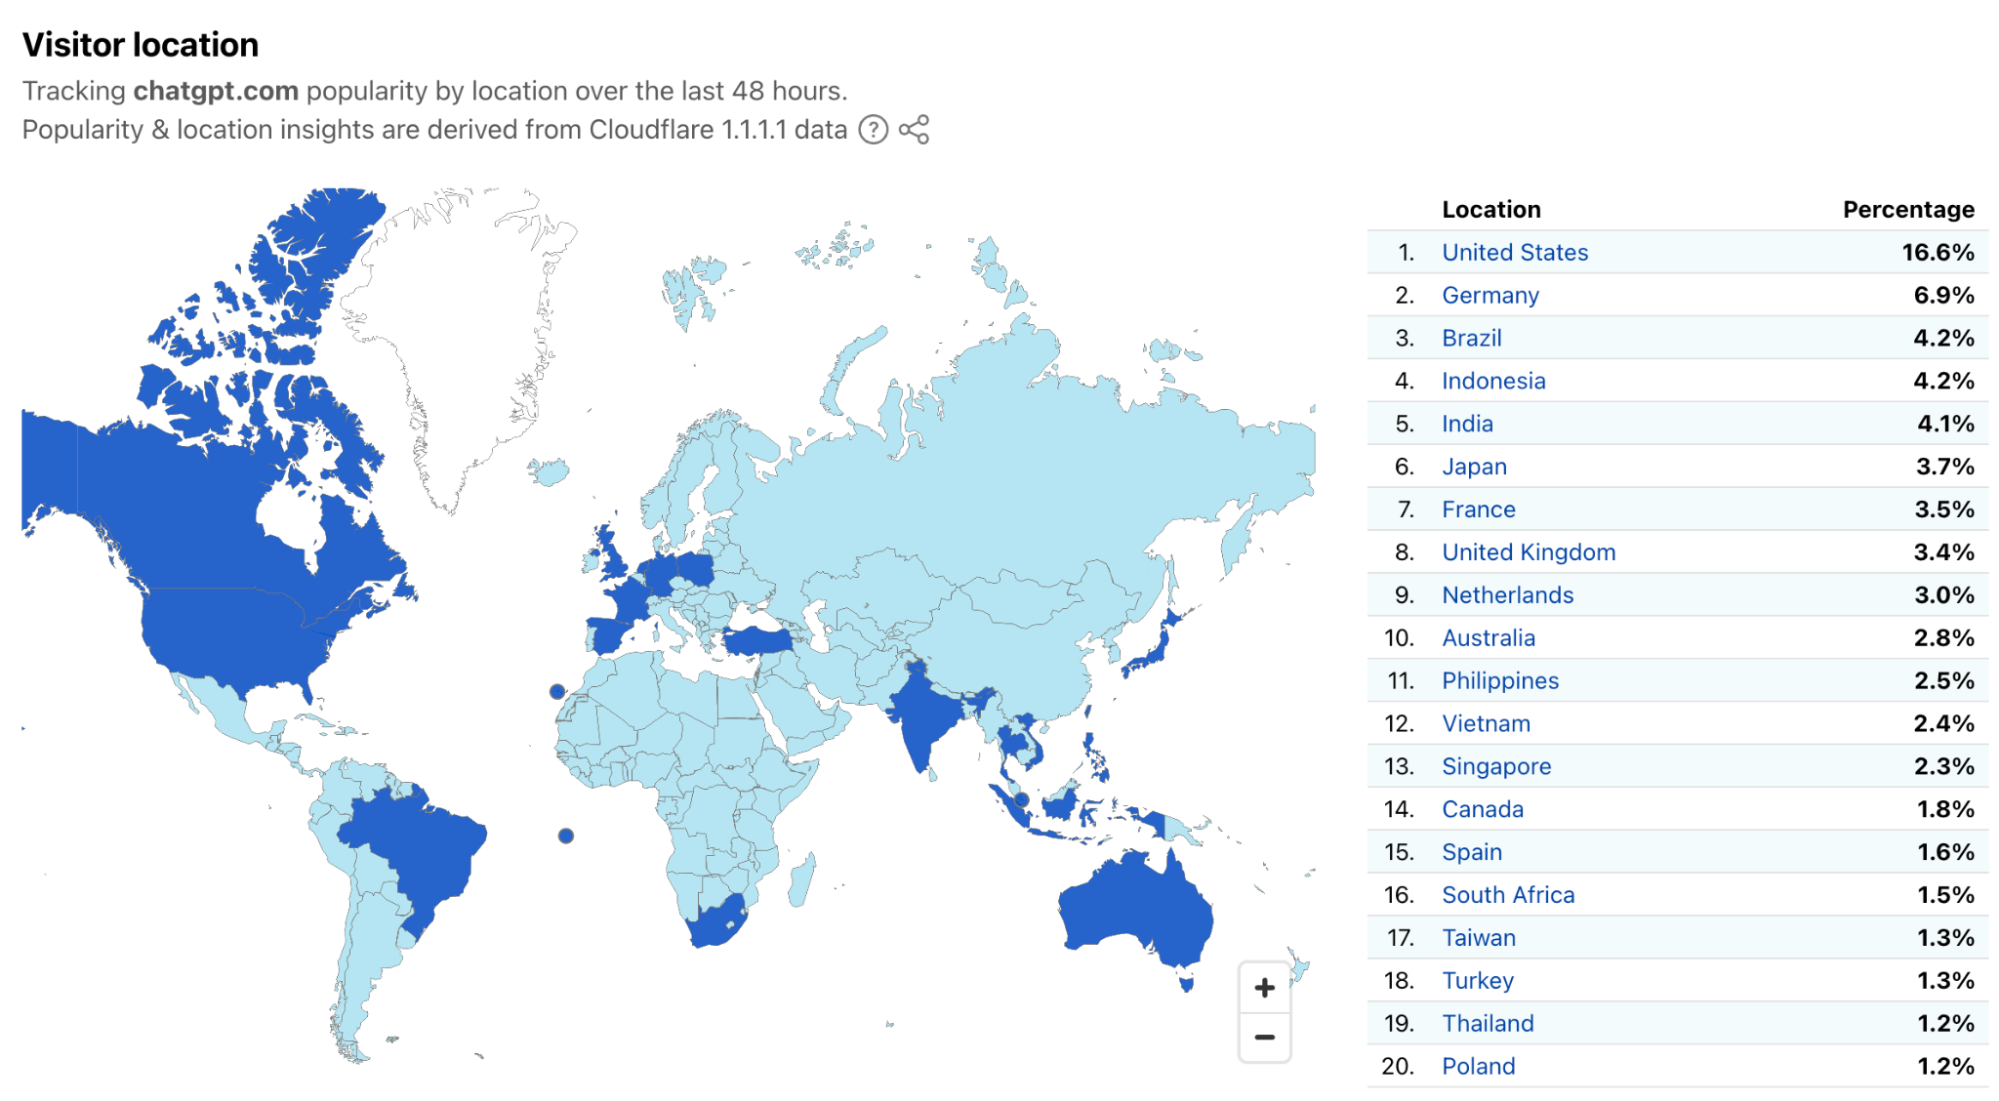
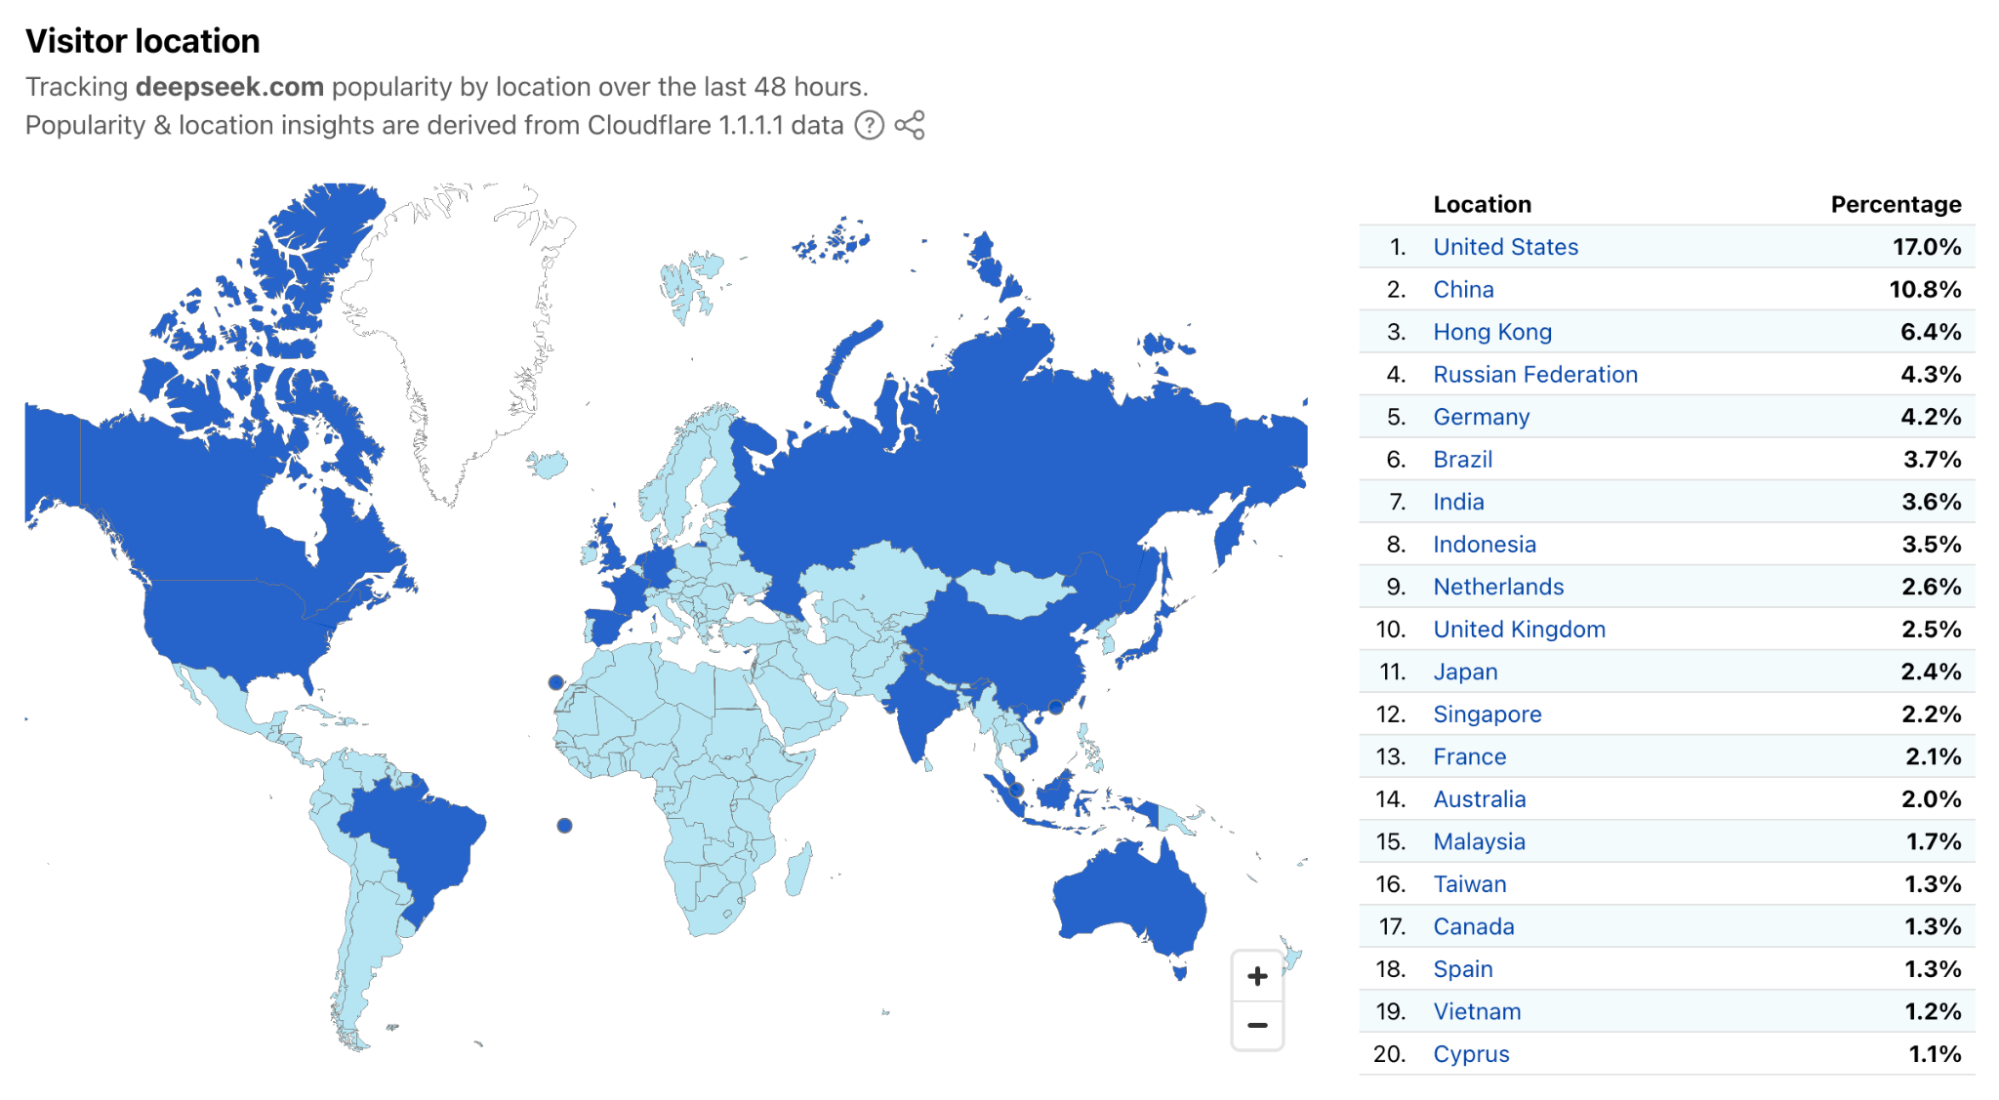
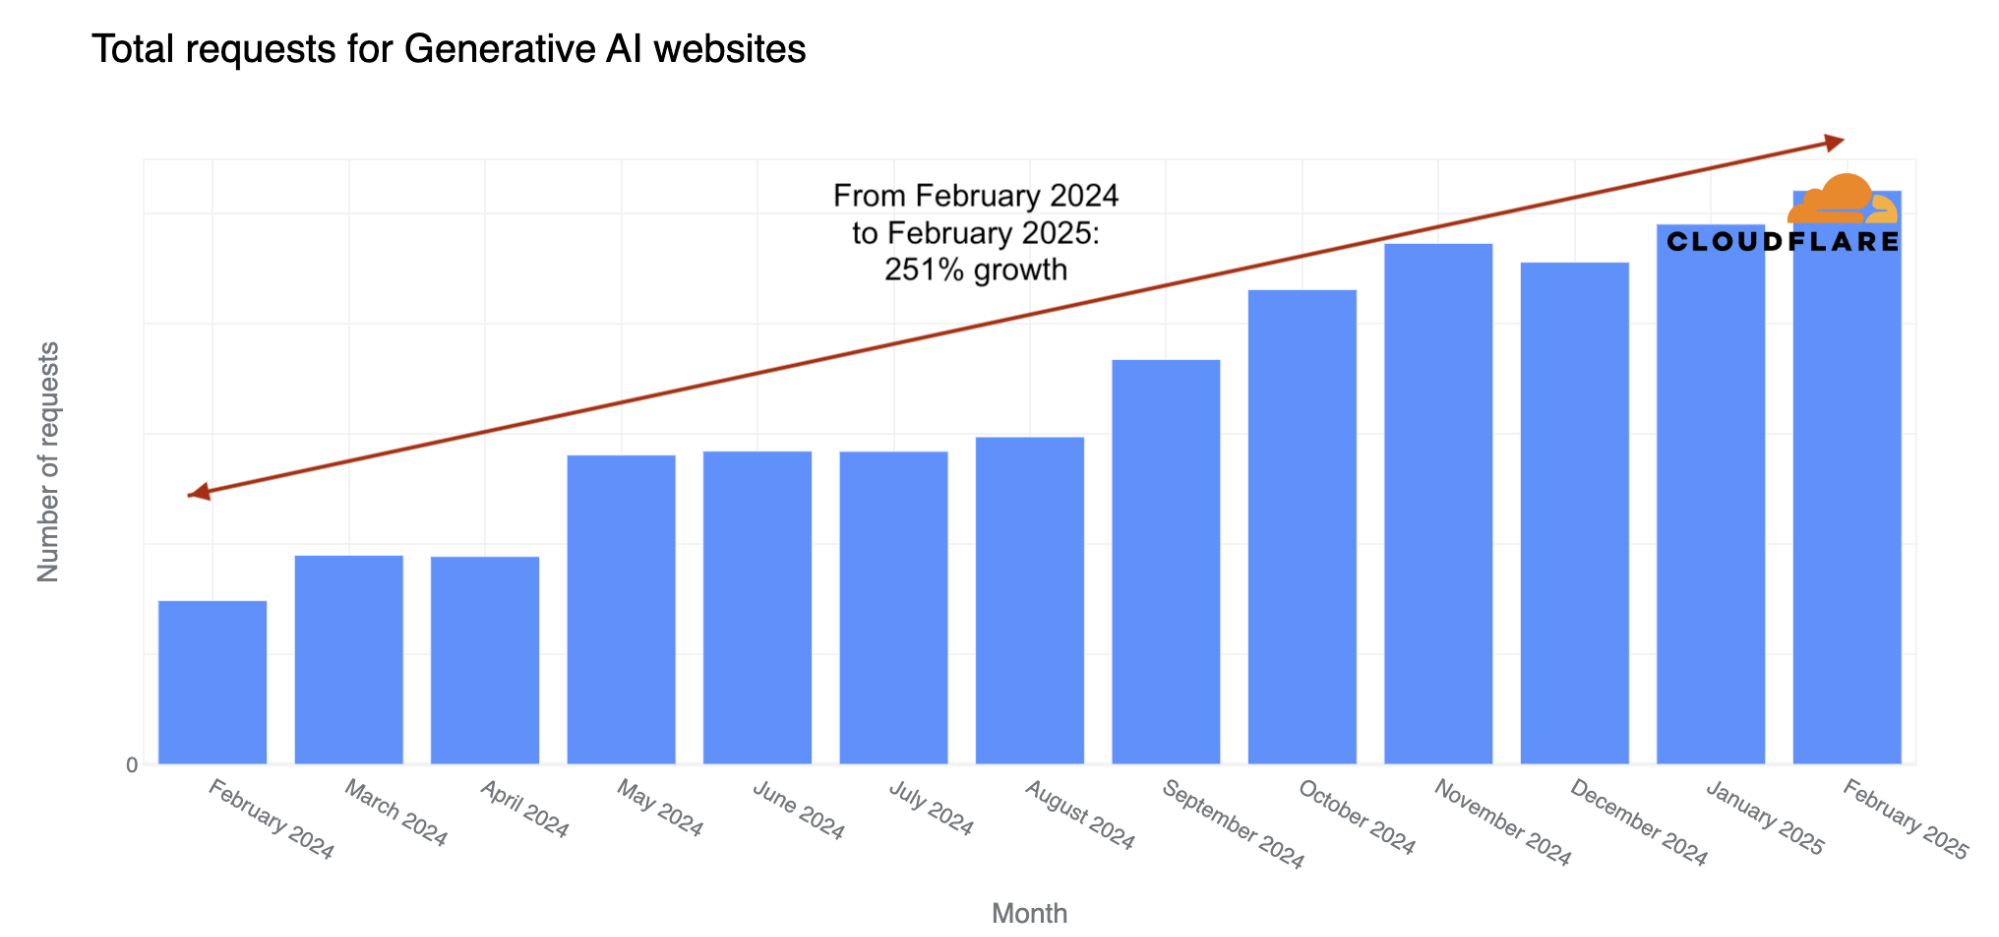
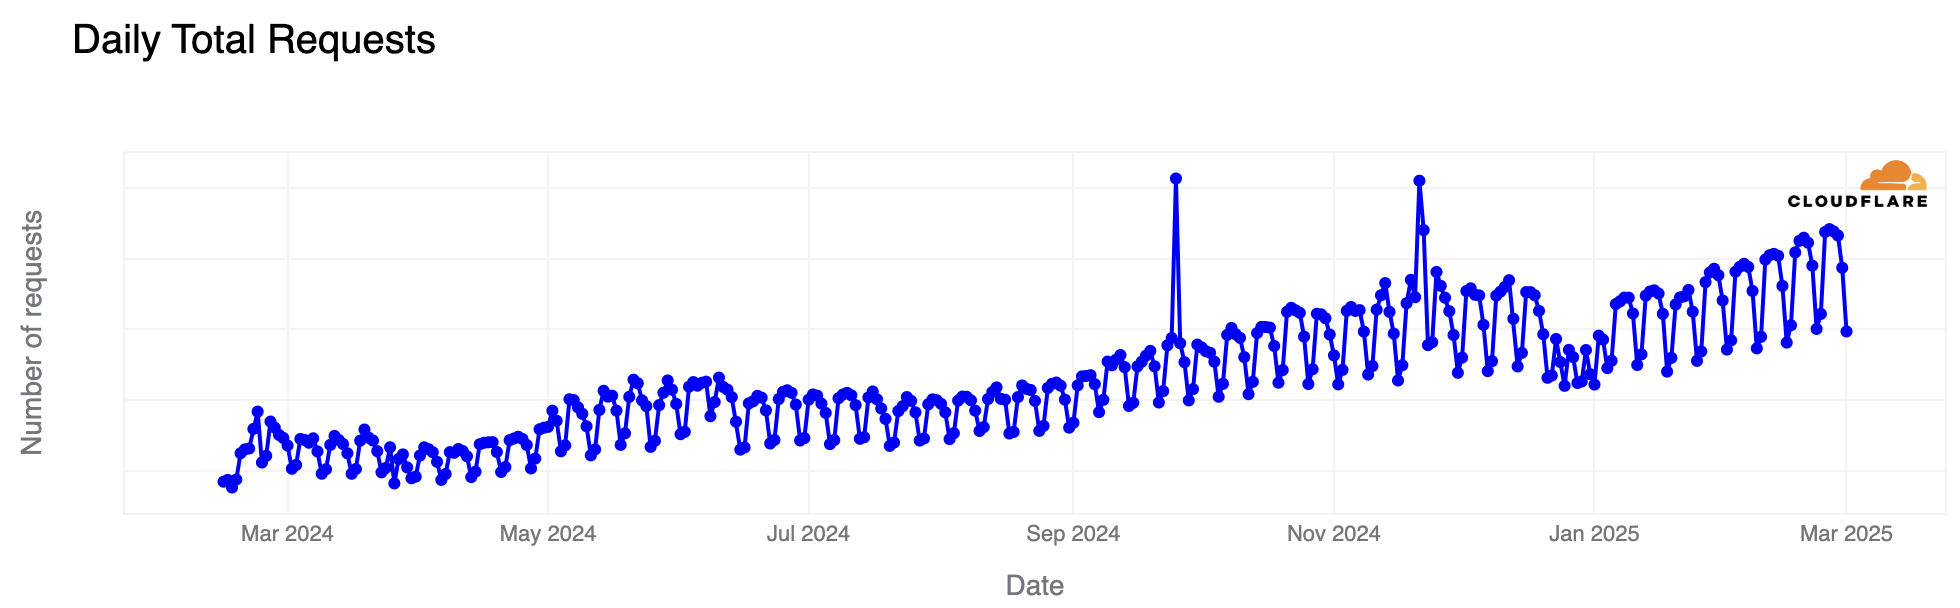
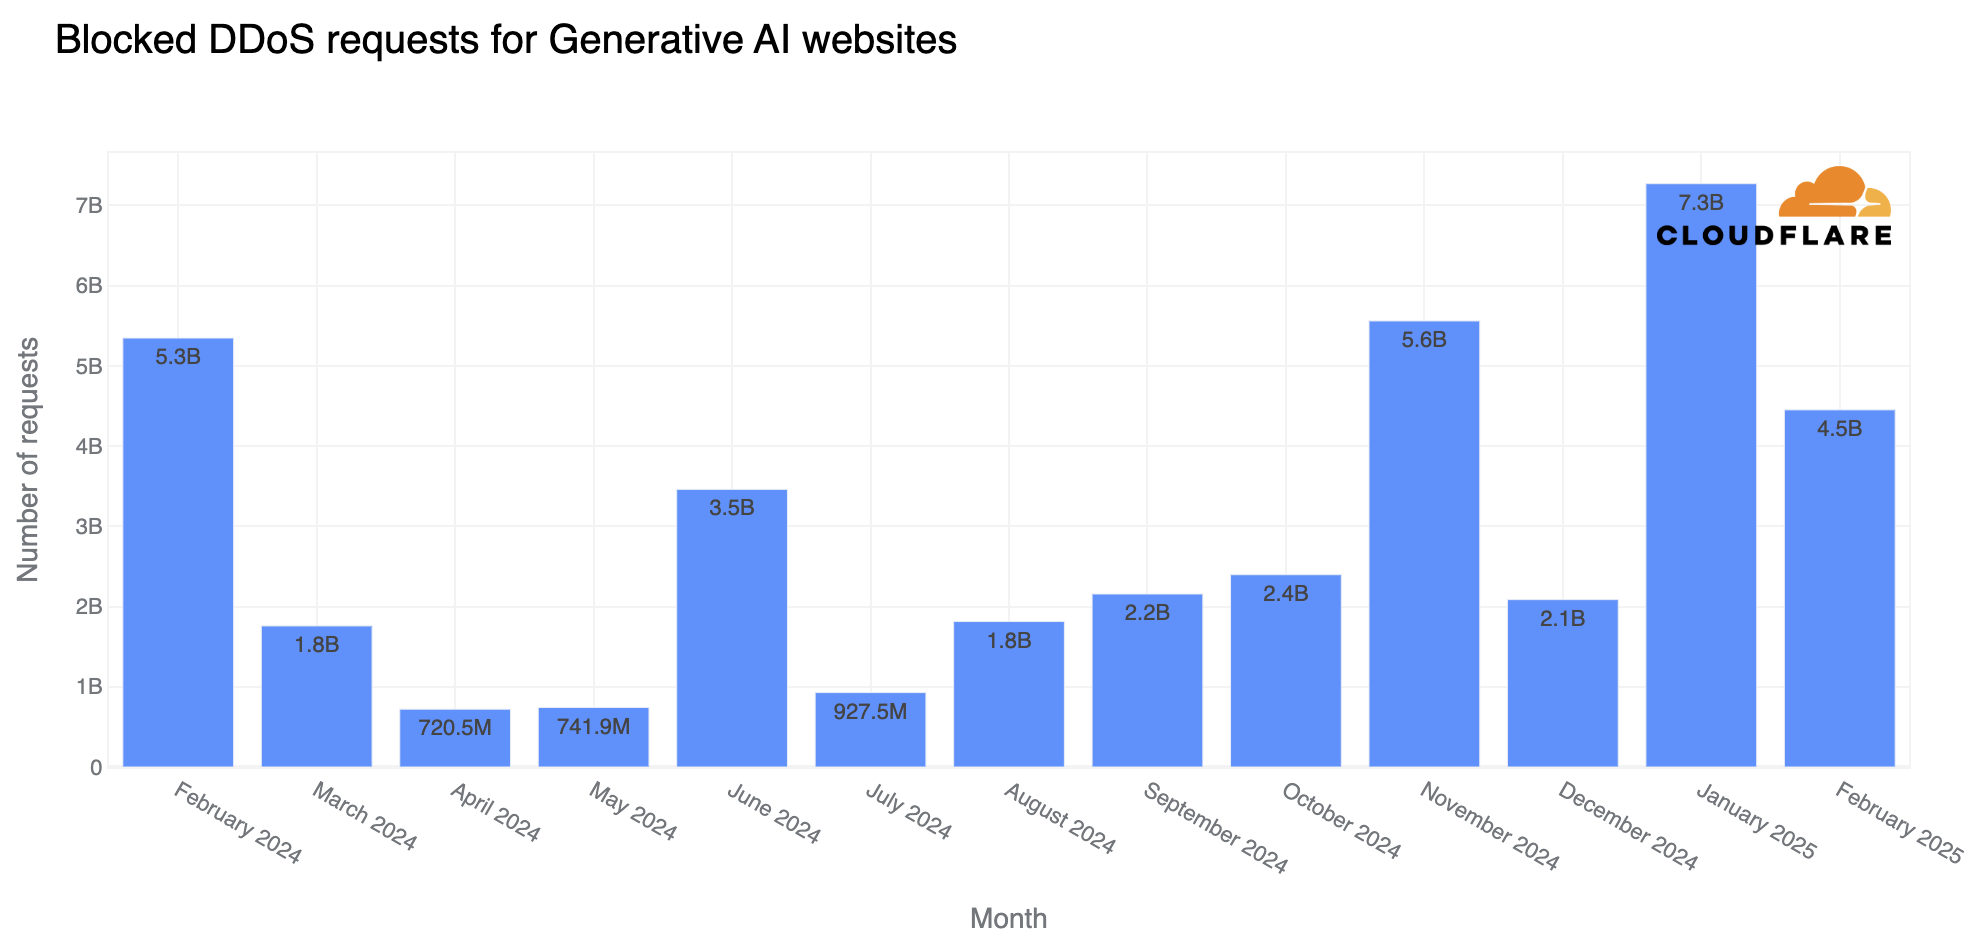
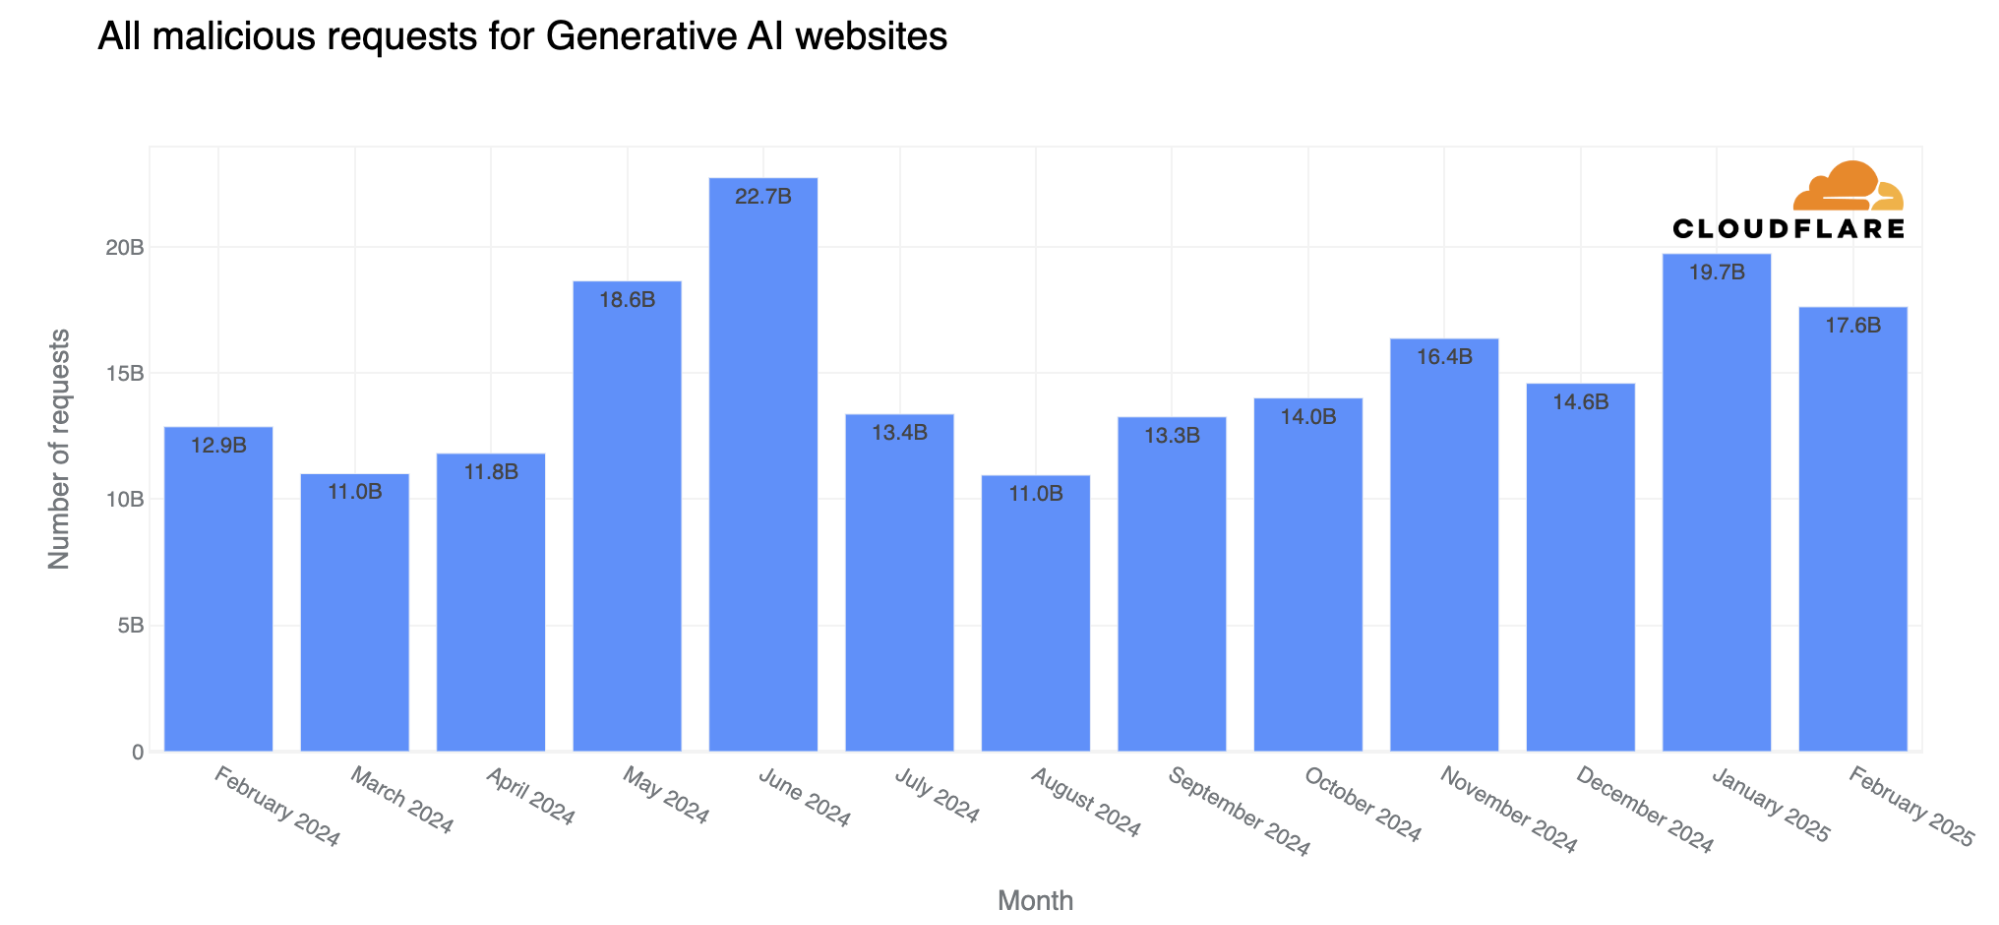
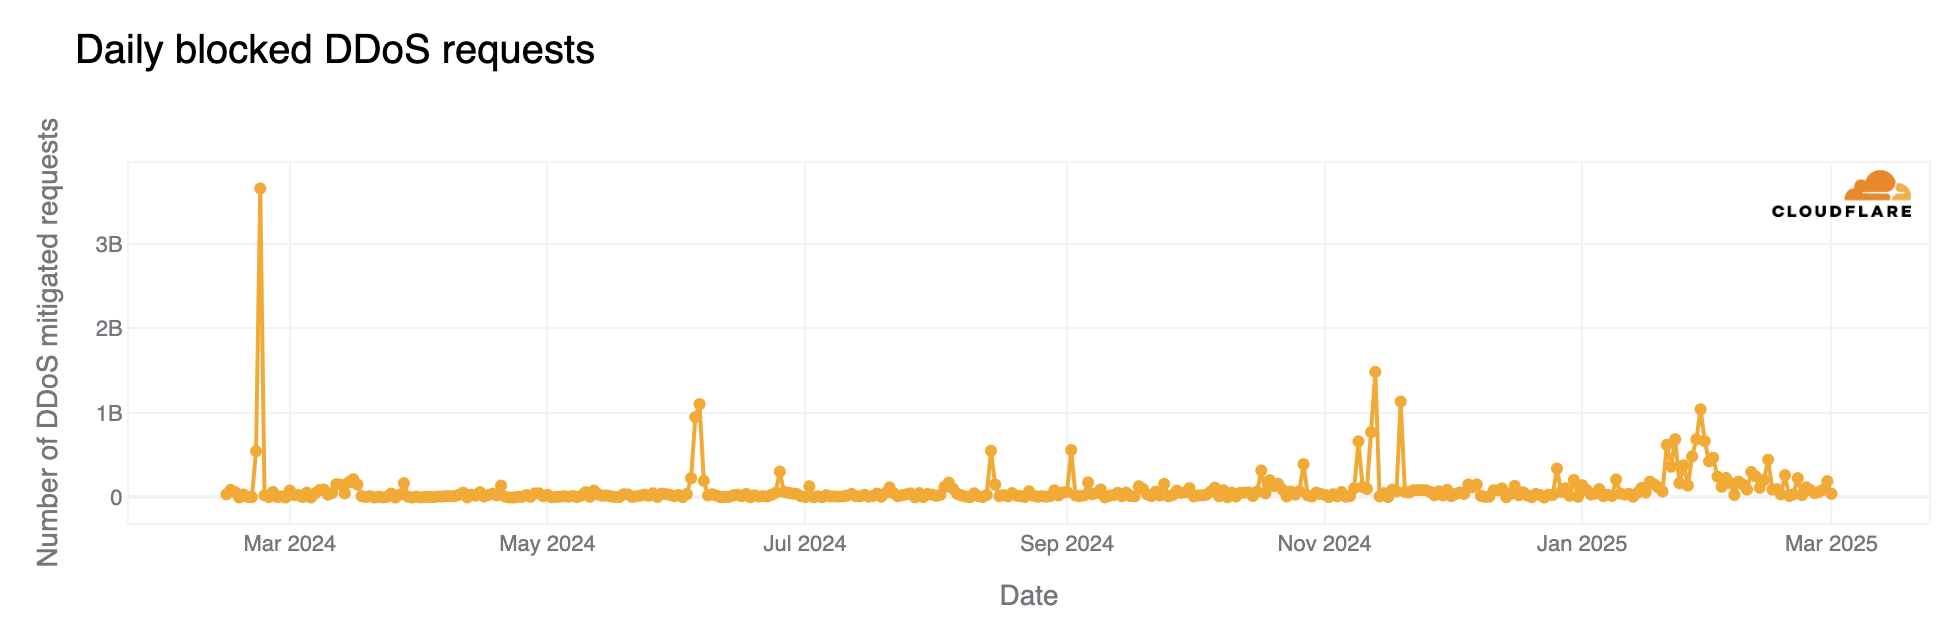
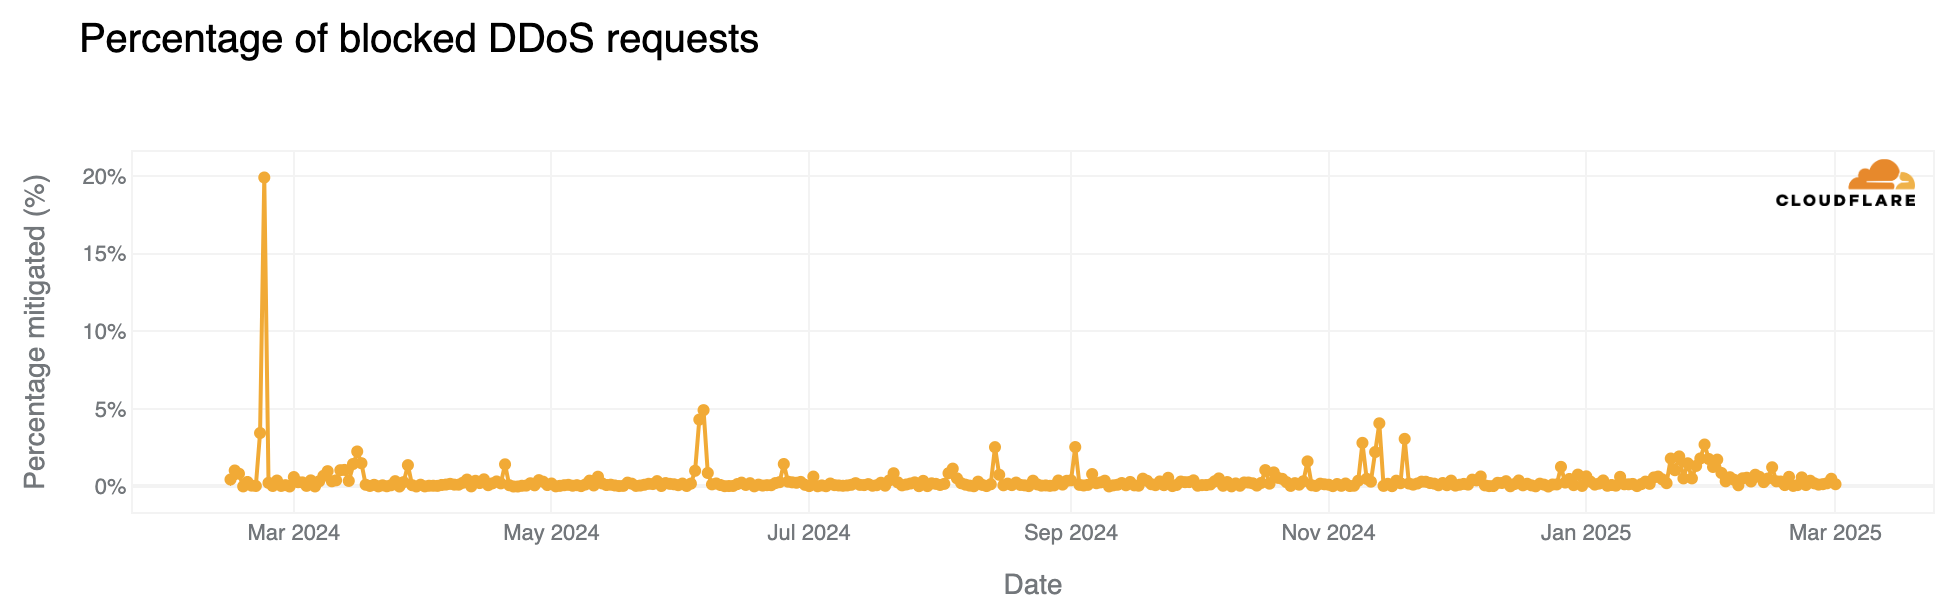
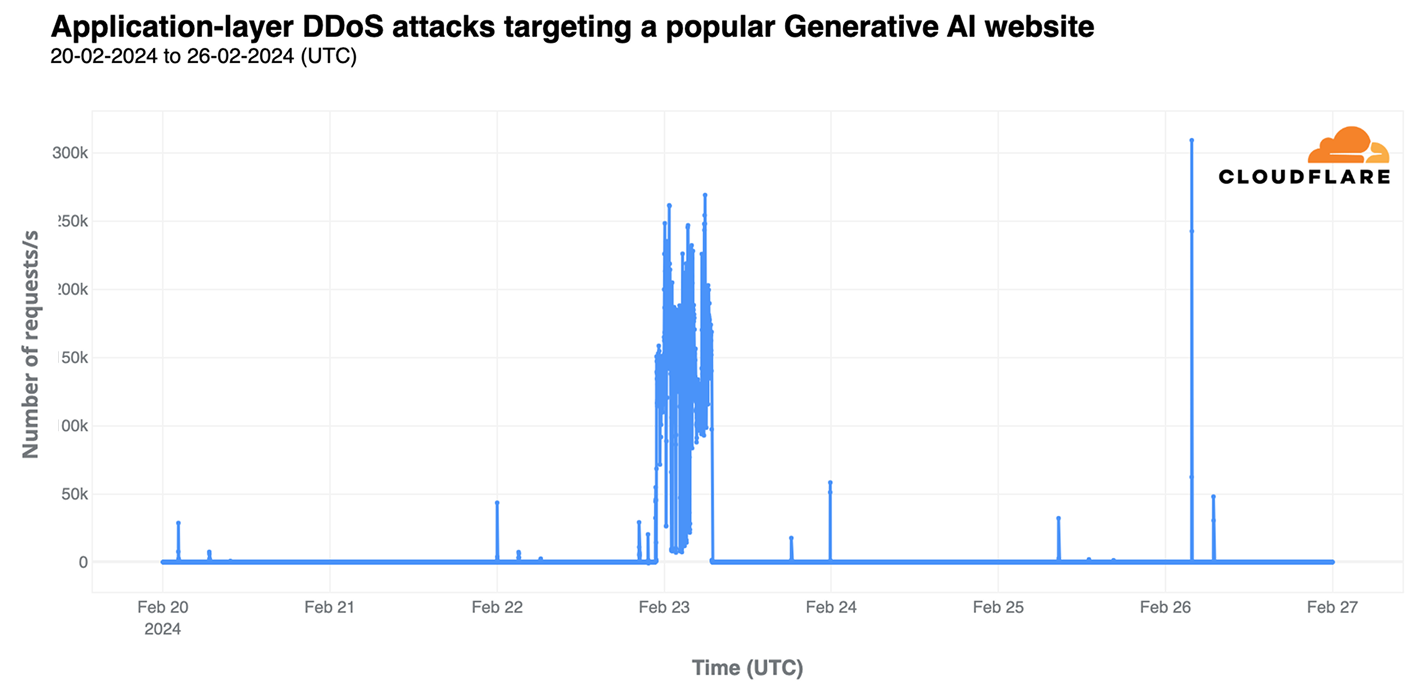


