Tag Archives: data-mesh

Streaming SQL in Data Mesh

Post Syndicated from Netflix Technology Blog original https://netflixtechblog.com/streaming-sql-in-data-mesh-0d83f5a00d08

Democratizing Stream Processing @ Netflix

By Guil Pires, Mark Cho, Mingliang Liu, Sujay Jain

Data powers much of what we do at Netflix. On the Data Platform team, we build the infrastructure used across the company to process data at scale.

In our last blog post, we introduced “Data Mesh” — A Data Movement and Processing Platform. When a user wants to leverage Data Mesh to move and transform data, they start by creating a new Data Mesh pipeline. The pipeline is composed of individual “Processors” that are connected by Kafka topics. The Processors themselves are implemented as Flink jobs that use the DataStream API.

Since then, we have seen many use cases (including Netflix Graph Search) adopt Data Mesh for stream processing. We were able to onboard many of these use cases by offering some commonly used Processors out of the box, such as Projection, Filtering, Unioning, and Field Renaming.

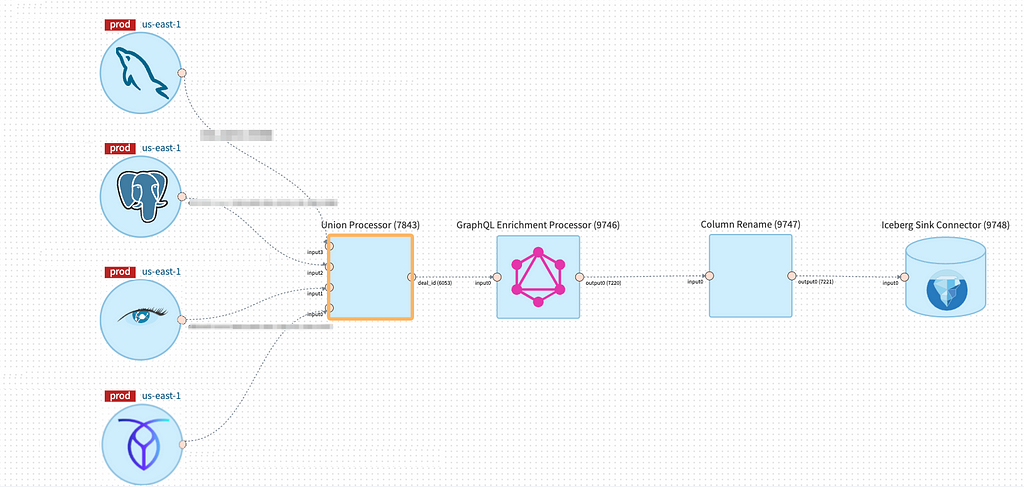
An example of a Data Mesh pipeline which moves and transforms data using Union, GraphQL Enrichment, and Column Rename Processor before writing to an Iceberg table.

By keeping the logic of individual Processors simple, it allowed them to be reusable so we could centrally manage and operate them at scale. It also allowed them to be composable, so users could combine the different Processors to express the logic they needed.

However, this design decision led to a different set of challenges.

Some teams found the provided building blocks were not expressive enough. For use cases which were not solvable using existing Processors, users had to express their business logic by building a custom Processor. To do this, they had to use the low-level DataStream API from Flink and the Data Mesh SDK, which came with a steep learning curve. After it was built, they also had to operate the custom Processors themselves.

Furthermore, many pipelines needed to be composed of multiple Processors. Since each Processor was implemented as a Flink Job connected by Kafka topics, it meant there was a relatively high runtime overhead cost for many pipelines.

We explored various options to solve these challenges, and eventually landed on building the Data Mesh SQL Processor that would provide additional flexibility for expressing users’ business logic.

The existing Data Mesh Processors have a lot of overlap with SQL. For example, filtering and projection can be expressed in SQL through SELECT and WHERE clauses. Additionally, instead of implementing business logic by composing multiple individual Processors together, users could express their logic in a single SQL query, avoiding the additional resource and latency overhead that came from multiple Flink jobs and Kafka topics. Furthermore, SQL can support User Defined Functions (UDFs) and custom connectors for lookup joins, which can be used to extend expressiveness.

Data Mesh SQL Processor

Since Data Mesh Processors are built on top of Flink, it made sense to consider using Flink SQL instead of continuing to build additional Processors for every transform operation we needed to support.

The Data Mesh SQL Processor is a platform-managed, parameterized Flink Job that takes schematized sources and a Flink SQL query that will be executed against those sources. By leveraging Flink SQL within a Data Mesh Processor, we were able to support the streaming SQL functionality without changing the architecture of Data Mesh.

Underneath the hood, the Data Mesh SQL Processor is implemented using Flink’s Table API, which provides a powerful abstraction to convert between DataStreams and Dynamic Tables. Based on the sources that the processor is connected to, the SQL Processor will automatically convert the upstream sources as tables within Flink’s SQL engine. User’s query is then registered with the SQL engine and translated into a Flink job graph consisting of physical operators that can be executed on a Flink cluster. Unlike the low-level DataStream API, users do not have to manually build a job graph using low-level operators, as this is all managed by Flink’s SQL engine.

SQL Experience on Data Mesh

The SQL Processor enables users to fully leverage the capabilities of the Data Mesh platform. This includes features such as autoscaling, the ability to manage pipelines declaratively via Infrastructure as Code, and a rich connector ecosystem.

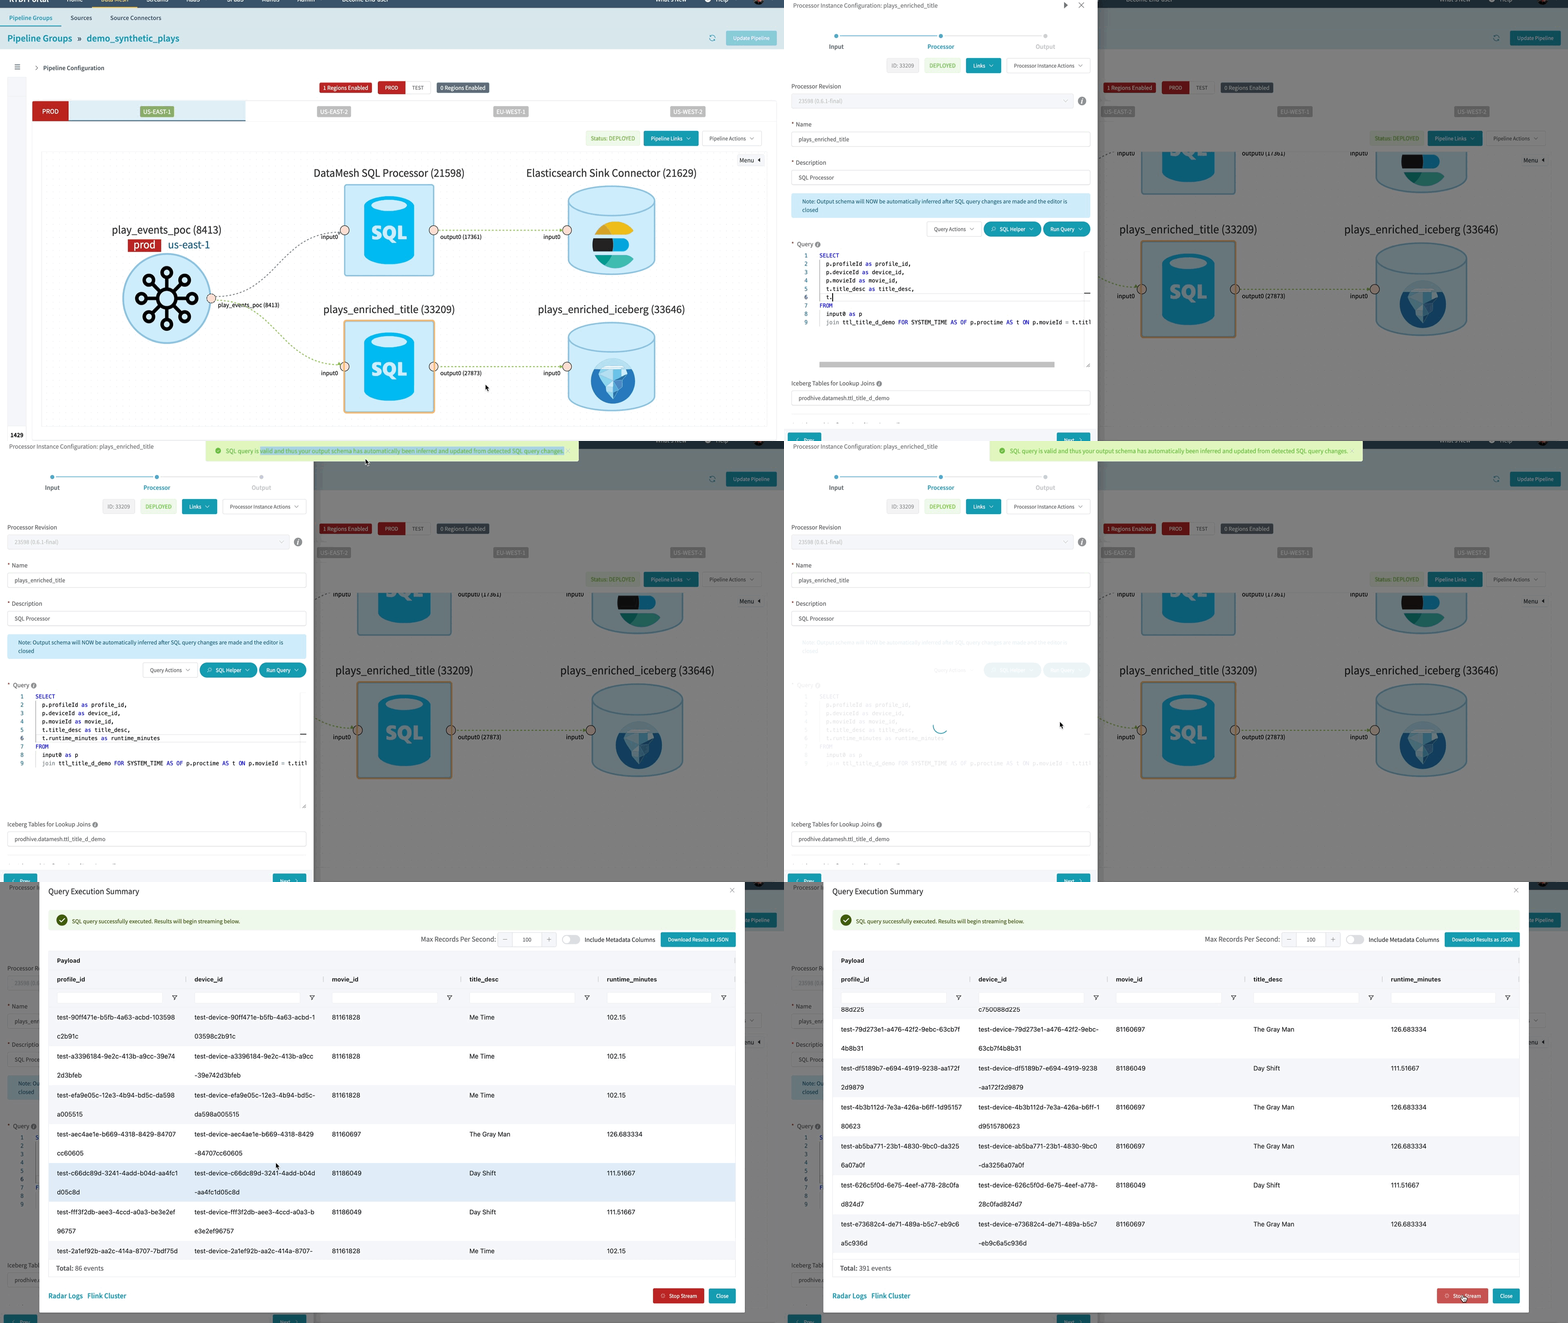
In order to ensure a seamless user experience, we’ve enhanced the Data Mesh platform with SQL-centric features. These enhancements include an Interactive Query Mode, real-time query validation, and automated schema inference.

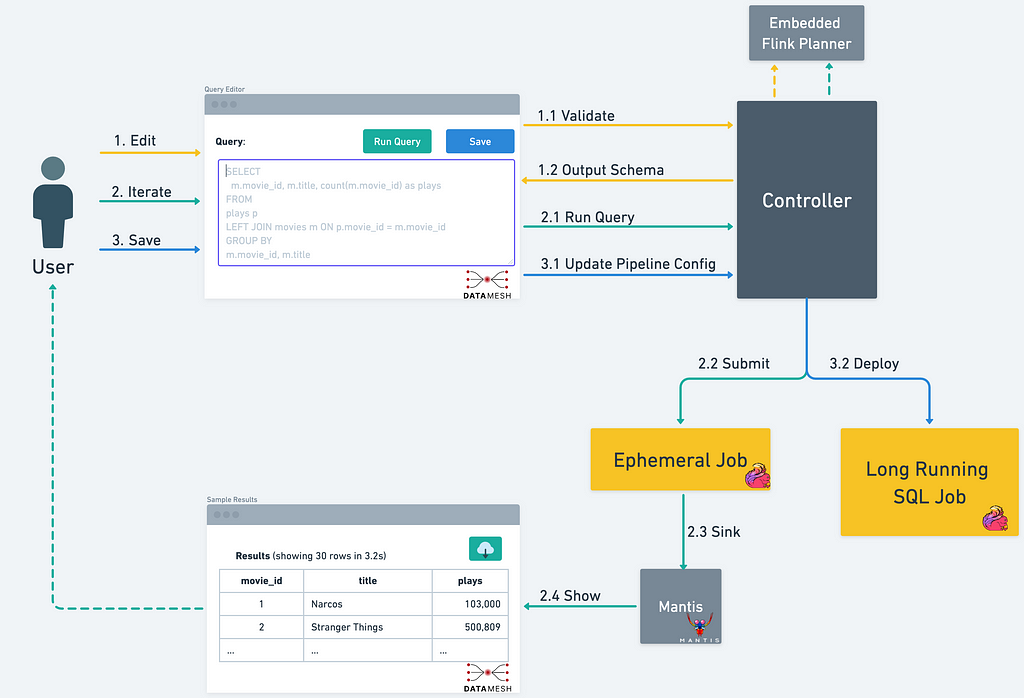
To understand how these features help the users be more productive, let’s take a look at a typical user workflow when using the Data Mesh SQL Processor.

  • Users start their journey by live sampling their upstream data sources using the Interactive Query Mode.
  • As the user iterate on their SQL query, the query validation service provides real-time feedback about the query.
  • With a valid query, users can leverage the Interactive Query Mode again to execute the query and get the live results streamed back to the UI within seconds.
  • For more efficient schema management and evolution, the platform will automatically infer the output schema based on the fields selected by the SQL query.
  • Once the user is done editing their query, it is saved to the Data Mesh Pipeline, which will then be deployed as a long running, streaming SQL job.
Overview of the SQL Processor workflow.

Users typically iterate on their SQL query multiple times before deploying it. Validating and analyzing queries at runtime after deployment will not only slow down their iteration, but also make it difficult to automate schema evolution in Data Mesh.

To address this challenge, we have implemented a query validation service that can verify a Flink SQL query and provide a meaningful error message for violations in real time. This enables users to have prompt validation feedback while they are editing the query. We leverage Apache Flink’s internal Planner classes to parse and transform SQL queries without creating a fully-fledged streaming table environment. This makes the query service lightweight, scalable, and execution agnostic.

To effectively operate thousands of use cases at the platform layer, we built opinionated guardrails to limit some functionalities of Flink SQL. We plan on gradually expanding the supported capabilities over time. We implemented the guardrails by recursively inspecting the Calcite tree constructed from user’s query. If the tree contains nodes that we currently don’t support, the query will be rejected from being deployed. Additionally, we translate Flink’s internal exceptions containing cryptic error messages into more meaningful error messages for our users. We plan on continuing our investments into improving the guardrails, as having proper guardrails help to improve the user experience. Some ideas for the future include rules to reject expensive and suboptimal queries.

To help Data Mesh users iterate quickly on their business logic, we have built the Interactive Query Mode as part of the platform. Users can start live sampling their streaming data by executing a simple `SELECT * FROM <table>` query. Using the Interactive Query Mode, Data Mesh platform will execute the Flink SQL query and display the results in the UI in seconds. Since this is a Flink SQL query on streaming data, new results will continue to be delivered to the user in real-time.

Users can continue to iterate and modify their Flink SQL query and once they’re satisfied with their query output, they can save the query as part of their stream processing pipeline.

To provide this interactive experience, we maintain an always-running Flink Session Cluster that can run concurrent parameterized queries. These queries will output their data to a Mantis sink in order to stream the results back to the user’s browser.

An animated gif showing the interactive query mode in action
Interactive Query mode in action

Learnings from our journey

In hindsight, we wish we had invested in enabling Flink SQL on the DataMesh platform much earlier. If we had the Data Mesh SQL Processor earlier, we would’ve been able to avoid spending engineering resources to build smaller building blocks such as the Union Processor, Column Rename Processor, Projection and Filtering Processor.

Since we’ve productionized Data Mesh SQL Processor, we’ve seen excitement and quick adoption from our Data Mesh users. Thanks to the flexibility of Flink SQL, users have a new way to express their streaming transformation logic other than writing a custom processor using the low-level DataStream API.

While Flink SQL is a powerful tool, we view the Data Mesh SQL Processor as a complimentary addition to our platform. It is not meant to be a replacement for custom processors and Flink jobs using low-level DataStream API. Since SQL is a higher-level abstraction, users no longer have control over low-level Flink operators and state. This means that if state evolution is critical to the user’s business logic, then having complete control over the state can only be done through low-level abstractions like the DataStream API. Even with this limitation, we have seen that there are many new use cases that are unlocked through the Data Mesh SQL Processor.

Our early investment in guardrails has helped set clear expectations with our users and keep the operational burden manageable. It has allowed us to productionize queries and patterns that we are confident about supporting, while providing a framework to introduce new capabilities gradually.

Future of SQL on Data Mesh

While introducing the SQL Processor to the Data Mesh platform was a great step forward, we still have much more work to do in order to unlock the power of stream processing at Netflix. We’ve been working with our partner teams to prioritize and build the next set of features to extend the SQL Processor. These include stream enrichment using Slowly-Changing-Dimension (SCD) tables, temporal joins, and windowed aggregations.

Stay tuned for more updates!


Streaming SQL in Data Mesh was originally published in Netflix TechBlog on Medium, where people are continuing the conversation by highlighting and responding to this story.

The art and science of data product portfolio management

Post Syndicated from Faris Haddad original https://aws.amazon.com/blogs/big-data/the-art-and-science-of-data-product-portfolio-management/

This post is the first in a series dedicated to the art and science of practical data mesh implementation (for an overview of data mesh, read the original whitepaper The data mesh shift). The series attempts to bridge the gap between the tenets of data mesh and its real-life implementation by deep-diving into the functional and non-functional capabilities essential to a working operating model, laying out the decisions that need to be made for each capability, and describing the key business and technical processes required to implement them. Taken together, the posts in this series lay out some possible operating models for data mesh within an organization.

Kudzu

Kudzu—or kuzu (クズ)—is native to Japan and southeast China. First introduced to the southeastern United States in 1876 as a promising solution for erosion control, it now represents a cautionary tale about unintended consequences, as Kudzu’s speed of growth outcompetes everything from native grasses to tree systems by growing over and shading them from the sunlight they need to photosynthesize—eventually leading to species extinction and loss of biodiversity. The story of Kudzu offers a powerful analogy to the dangers and consequences of implementing data mesh architectures without fully understanding or appreciating how they are intended to be used. When the “Kudzu” of unmanaged pseudo-data products (methods of sharing data that masquerade as data products while failing to fulfill the myriad obligations associated with them) has overwhelmed the local ecosystem of true data products, eradication is costly and prone to failure, and can represent significant wasted effort and resources, as well as lost time.

Desert

While Kudzu was taking over the south in the 1930s, desertification caused by extensive deforestation was overwhelming the Midwest, with large tracts of land becoming barren and residents forced to leave and find other places to make a living. In the same way, overly restrictive data governance practices that either prevent data products from taking root at all, or pare them back too aggressively (deforestation), can over time create “data deserts” that drive both the producers and consumers of data within an organization to look elsewhere for their data needs. At the same time, unstructured approaches to data mesh management that don’t have a vision for what types of products should exist and how to ensure they are developed are at high risk of creating the same effect through simple neglect. This is due to a  common misconception about data mesh as a data strategy, which is that it is effectively self-organizing—meaning that once presented with the opportunity, data owners within the organization will spring to the responsibilities and obligations associated with publishing high-quality data products. In reality, the work of a data producer is often thankless, and without clear incentive strategies, organizations may end up with data deserts that create more data governance issues as producers and consumers go elsewhere to seek out the data they need to perform work.

Bonsai

Bonsai (盆栽) is an art form originating from an ancient Chinese tradition called penjing (盆景), and later shaped by the minimalist teachings of Zen Buddhism into the practice we know and recognize today. The patient practice of Bonsai offers useful analogies to the concepts and processes required to avoid the chaos of Kudzu as well as the specter of organizational data deserts. Bonsai artists carefully observe the naturally occurring buds that are produced by the tree and encourage those that add to the overall aesthetics of the tree, while pruning those that don’t work well with their neighbors. The same ideas apply equally well to data products within a data mesh—by encouraging the growth and adoption of those data products that add value to our data mesh, and continuously pruning those that do not, we maximize the value and sustainability of our data mesh implementations. In a similar vein, Bonsai artists must balance their vision for the shape of the tree with a respect for the natural characteristics and innate structure of the species they have chosen to work with—to ignore the biology of the tree would be disastrous to the longevity of the tree, as well as to the quality of the art itself. In the same way, organizations seeking to implement successful data mesh strategies must respect the nature and structure (legal, political, commercial, technology) of their organizations in their implementation.

Of the key capabilities proposed for the implementation of a sustainable data mesh operating model, the one that is most relevant to the problems we’ve described—and explore later in this post—is data product portfolio management.

Overview of data product portfolio management

Data mesh architectures are, by their nature, ideal for implementation within federated organizations, with decentralized ownership of data and clear legal, regulatory, or commercial boundaries between entities or lines of business. The same organizational characteristics that make data mesh architectures valuable, however, also put them at risk of turning into one of the twin nightmares of Kudzu or data deserts.

To define the shape and nature of an organizational data mesh, a number of key questions need to be answered, including but not limited to:

  • What are the key data domains within the organization? What are the key data products within these domains needed to solve current business problems? How do we iterate on this discovery process to add value while we are mapping our domains?
  • Who are the consumers in our organization, and what logical, regulatory, physical, or commercial boundaries might separate them from producers and their data products?
  • How do we encourage the development and maintenance of key data products in a decentralized organization?
  • How do we monitor data products against their SLAs, and ensure alerting and escalation on failure so that the organization is protected from bad data?
  • How do we enable those we see as being autonomous producers and consumers with the right skills, the right tools, and the right mindset to actually want to (and be able to) take more ownership of independently publishing data as a product and consuming it responsibly?
  • What is the lifecycle of a data product? When do new data products get created, and who is allowed to create them? When are data products deprecated, and who is accountable for the consequences to their consumers?
  • How do we define “risk” and “value” in the context of data products, and how can we measure this? Whose responsibility is it to justify the existence of a given data product?

To answer questions such as these and plan accordingly, organizations must implement data product portfolio management (DPPM). DPPM does not exist in a vacuum—by its nature, DPPM is closely related to and interdependent with enterprise architecture practices like business capability management and project portfolio management. DPPM itself may therefore also be considered, in part, an enterprise architecture practice.

As an enterprise architecture practice, DPPM is responsible for its implementation, which should reside within a function whose remit is appropriately global and cross-functional. This may be within the CDO office for those organizations that have a CDO or equivalent central data function, or the enterprise architecture team in organizations that do not.

Goals of DPPM

The goals of DPPM can be summarized as follows:

  • Protect value – DPPM protects the value of the organizational data strategy by developing, implementing, and enforcing frameworks to measure the contribution of data products to organizational goals in objective terms. Examples may include associated revenue, savings, or reductions in operational losses. Earlier in their lifecycle, data products may be measured by alternative metrics, including adoption (number of consumers) and level of activity (releases, interaction with consumers, and so on). In the pursuit of this goal, the DPPM capability is accountable for engaging with the business to continuously priorities where data as a product can add value and align delivery priority accordingly. Strategies for measuring value and prioritizing data products are explored later in this post.
  • Manage risk – All data products introduce risk to the organization—risk of wasted money and effort through non-adoption, risk of operational loss associated with improper use, and risk of failure on the part of the data product to meet requirements on availability, completeness, or quality. These risks are exacerbated in the case of proliferation of low-quality or unsupervised data products. DPPM seeks to understand and measure these risks on an individual and aggregated basis. This is a particularly challenging goal because what constitutes risk associated with the existence of a particular data product is determined largely by its consumers and is likely to change over time (though like entropy, is only ever likely to increase).
  • Guide evolution – The final goal of DPPM is to guide the evolution of the data product landscape to meet overarching organizational data goals, such as mutually exclusive or collectively exhaustive domains and data products, the identification and enablement of single-threaded ownership of product definitions, or the agile inclusion of new sources of data and creation of products to serve tactical or strategic business goals. Some principles for the management of data mesh evolution, and the evaluation of data products against organizational goals, are explored later in this post.

Challenges of DPPM

In this section, we explore some of the challenges of DPPM, and the pragmatic ways some of these challenges could be addressed.

Infancy

Data mesh as a concept is still relatively new. As such, there is little standardization associated with practical operating models for building and managing data mesh architectures, and no access to fully fledged out-of-the-box reference operating models, frameworks, or tools to support the practice of DPPM.

Some elements of DPPM are supported in disparate tools (for example, some data catalogs include basic community features that contribute to measuring value), but not in a holistic way. Over time, standardization of the processes associated with DPPM will likely occur as a side-effect of commoditization, driven by the popularity and adoption of new services that take on and automate more of the undifferentiated heavy lifting associated with mesh supervision. In the meantime, however, organizations adopting data mesh architectures are left largely to their own devices around how to operate them effectively.

Resistance

The purest expression of democracy is anarchy, and the more federated an organization is (itself a supporting factor in choosing data mesh architectures), the more resistance may be observed to any forms of centralized governance. This is a challenge for DPPM, because in some way it must come together in one place. Just as the Bonsai artist knows the vision for the entire tree, there must be a cohesive vision for and ability to guide the evolution of a data mesh, no matter how broadly federated and autonomous individual domains or data products might be.

Balancing this with the need to respect the natural shape (and culture) of an organization, however, requires organizations that implement DPPM to think about how to do so in a way that doesn’t conflict with the reality of the organization. This might mean, for example, that DPPM may need to happen at several layers—at minimum within data domains, possibly within lines of business, and then at an enterprise level through appropriate data committees, guilds, or other structures that bring stakeholders together. All of this complicates the processes and collaboration needed to perform DPPM effectively.

Maturity

Data mesh architectures, and therefore DPPM, presume relatively high levels of data maturity within an organization—a clear data strategy, understanding of data ownership and stewardship, principles and policies that govern the use of data, and a moderate-to-high level of education and training around data within the organization. A lack of data maturity within the organization, or a weak or immature enterprise architecture function, will face significant hurdles in the implementation of any data mesh architecture, let alone a strong and useful DPPM practice.

In reality, however, data maturity is not uniform across organizations. Even in seemingly low-maturity organizations, there are often teams who are more mature and have a higher appetite to engage. By leaning into these teams and showing value through them first, then using them as evangelists, organizations can gain maturity while benefitting earlier from the advantages of data mesh strategies.

The following sections explore the implementation of DPPM along the lines of people, process, and technology, as well as describing the key characteristics of data products—scope, value, risk, uniqueness, and fitness—and how they relate to data mesh practices.

People

To implement DPPM effectively, a wide variety of stakeholders in the organization may need to be involved in one capacity or another. The following table suggests some key roles, but it’s up to an individual organization to determine how and if these map to their own roles and functions.

Function RACI Role Responsibility
Senior Leadership A Chief Data Officer Ultimately accountable for organizational data strategy and implementation. Approves changes to DPPM principles and operating model. Acts as chair of, and appoints members to, the data council.
. R Data Council** Stakeholder body representing organizational governance around data strategy. Acts as steering body for the governance of DPPM as a practice (KPI monitoring, maturity assessments, auditing, and so on). Approves changes to guidelines and methodologies. Approves changes to data product portfolio (discussed later in this post). Approves and governs centrally funded and prioritized data product development activities.
Enterprise Architecture AR Head of Enterprise Architecture Responsible for development and enforcement of data strategy. Accountable and responsible for the design and implementation of DPPM as an organizational capability.
. R Domain Architect Responsible for the implementing screening, data product analysis, periodic evaluation, and optimal portfolio selection practices. Responsible for the development of methodologies and their selection criteria.
Legal & Compliance C Legal & Compliance Officer Consults on permissibility of data products with reference to local regulation. Consults on permissibility of data sharing with reference to local regulation or commercial agreements.
. C Data Privacy Officer Consults on permissibility of data use with reference to local data privacy law. Consults on permissibility of cross-entity or border data sharing with reference to data privacy law.
Information Security RC Information Security Officer Consults on maturity assessments (discussed later in this post) for information security-relevant data product capabilities. Approves changes to data product technology architecture. Approves changes to IAM procedures relating to data products.
Business Functions A Data Domain Owner Ultimately accountable for the appropriate use of domain data, as well as its quality and availability. Accountable for domain data products. Approves changes to the domain data model and domain data product portfolio.
c R Data Domain Steward Responsible for implementing data domain responsibilities, including operational (day-to-day) governance of domain data products. Approves use of domain data in new data products, and performs regular (such as yearly) attestation of data products using domain data.
. A Data Owner Ultimately accountable for the appropriate use of owned data (for example, CRM data), as well as its quality and availability.
. R Data Steward Responsible for implementing data responsibilities. Approves use of owned data in new data products, and performs regular (such as yearly) attestation of data products using owned data.
. AR Data Product Owner Accountable and responsible for the design, development, and delivery of data products against their stated SLOs. Contributes to data product analysis and portfolio adjustment practices for own data products.

** The data council typically consists of permanent representatives from each function (data domain owners), enterprise architecture, and the chief data officer or equivalent.

Process

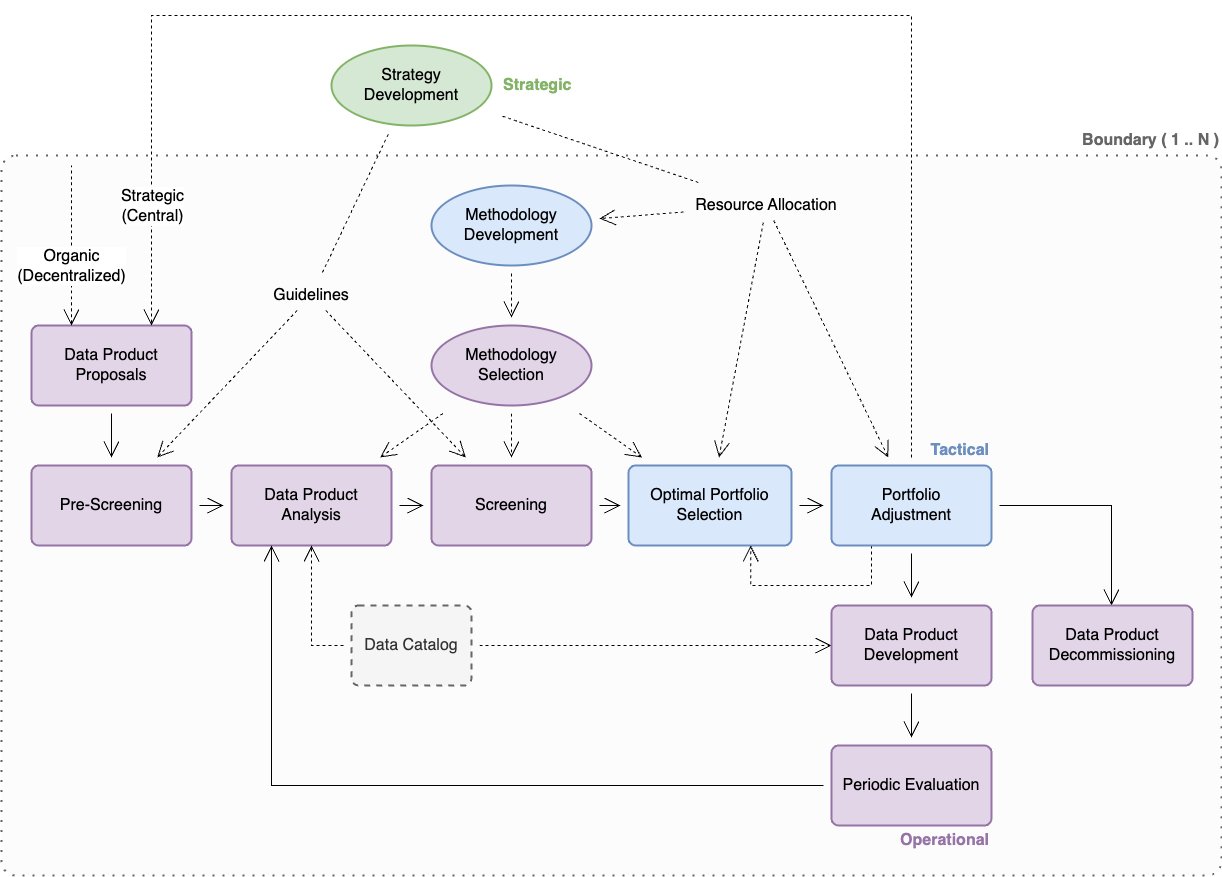
The following diagram illustrates the strategic, tactical, and operational practices associated with DPPM. Some considerations for the implementation of these practices is explored in more detail in this post, though their specific interpretation and implementation is dependent on the individual organization.

Boundaries

When reading this section, it’s important to bear in mind the impact of boundaries—although strategy development may be established as a global practice, other practices within DPPM must respect relevant organizational boundaries (which may be physical, geographical, operational, legal, commercial, or regulatory in nature). In some cases, the existence of boundaries may require some or all tactical and operational practices to be duplicated within each associated boundary. For example, an insurance company with a property and casualty legal entity in North America and a life entity in Germany may need to implement DPPM separately within each entity.

Strategy development

This practice deals with answering questions associated with the overall data mesh strategy, including the following:

  • The overall scope (data domains, participating entities, and so on) of the data mesh
  • The degree of freedom of participating entities in their definition and implementation of the data mesh (for example, a mesh of meshes vs. a single mesh)
  • The distribution of responsibilities for activities and capabilities associated with the data mesh (degree of democratization)
  • The definition and documentation of key performance indicators (KPIs) against which the data mesh should be governed (such as risk and value)
  • The governance operating model (including this practice)

Key deliverables include the following:

  • Organizational guidelines for operational processes around pre-screening and screening of data products
  • Well-defined KPIs that guide methodology development and selection for practices like data product analysis, screening, and optimal portfolio selection
  • Allocation of organizational resources (people, budget, time) to the implementation of tactical processes around methodology development, optimal portfolio selection, and portfolio adjustment

Key considerations

In this section, we discuss some key considerations for strategy development.

Data mesh structure

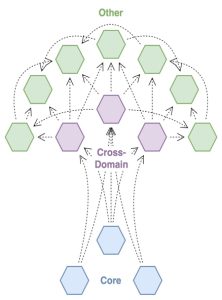
This diagram illustrates the analogous relationship between data products in a data mesh, and the structure of the mesh itself.

The following considerations relate to screening, data product analysis, and optimal portfolio selection.

  • Trunk (core data products) – Core data products are those that are central to the organization’s ability to function, and from which the majority of other data products are derived. These may be data products consumed in the implementation of key business activities, or associated with critical processes such as regulatory reporting and risk management. Organizational governance for these data products typically favors availability and data accuracy over agility.
  • Branch (cross-domain data products) – Cross-domain data products represent the most common cross-domain use cases for data (for example, joining customer data with product data). These data products may be widely used across business functions to support reporting and analytics, and—to a lesser extent—operational processes. Because these data products may consume a variety of sources, organizational governance may favor a balanced view on agility vs. reliability, accepting some degree of risk in return for being able to adapt to changes in data sources. Data product versioning can offer mitigation of risks associated with change.
  • Leaf (everything else) – These are the myriad data products that may arise within a data mesh, either as permanent additions to support individual teams and use cases or as temporary data products to fill data gaps or support time-limited initiatives. Because the number of these data products may be high and risks are typically limited to a single process or a small part of the organization, organizational governance typically favors a light touch and may prefer to govern through guidelines and best practices, rather than through active participation in the data product lifecycle.

Data products vs. data definitions

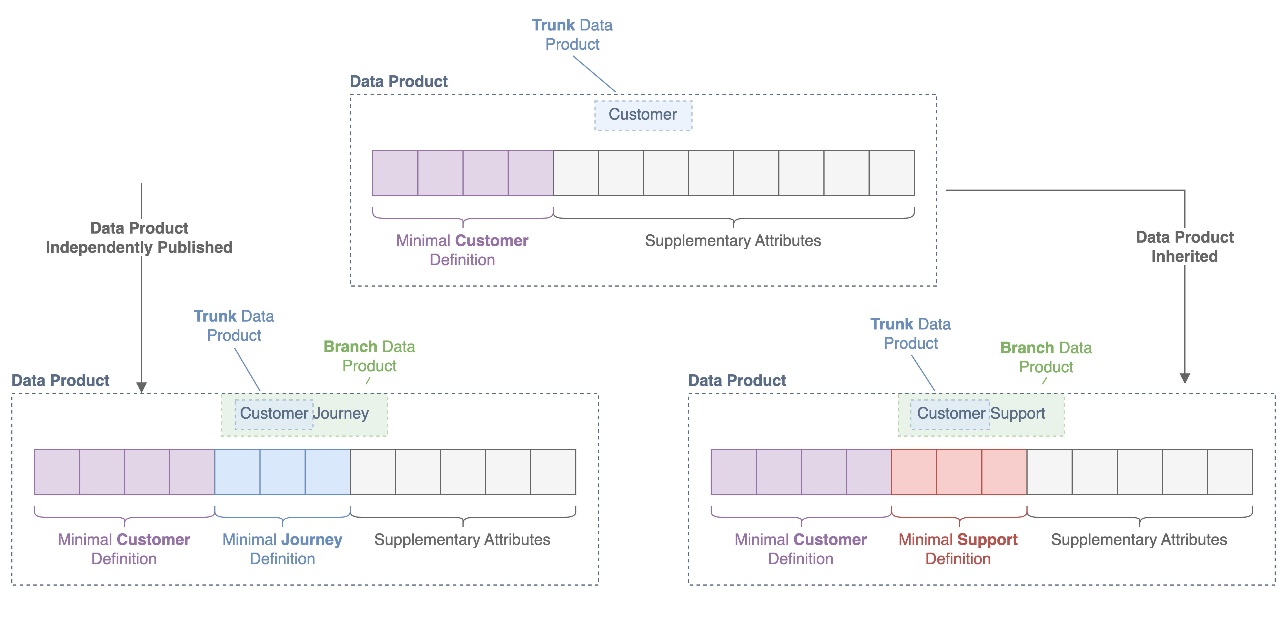
The following figure illustrates how data definitions are defined and inherited throughout the lineage of data products.

In a data mesh architecture, data products may inherit data from each other (one data product consumes another in its data pipeline) or independently publish data within (or related to) the same domain. For example, a customer data product may be inherited by a customer support data product, while another the customer journey data product may directly publish customer-relevant data from independent sources. When no standards are applied to how domain data attributes are used and published, data products even within the same data domain may lose interoperability because it becomes difficult or impossible to join them together for reporting or analytics purposes.

To prevent this, it can be useful to distinguish between data products and data definitions. Typically, organizations will select a single-threaded owner (often a data owner or steward, or a domain data owner or steward) who is responsible for defining minimal data definitions for common and reusable data entities within data domains. For example, a data owner responsible for the sales and marketing data domain may identify a customer data product as a reusable data entity within the domain and publish a minimal data definition that all producers of customer-relevant data must incorporate within their data products, to ensure that all data products associated with customer data are interoperable.

DPPM can assist in the identification and production of data definitions as part of its data product analysis activities, as well as enforce their incorporation as part of oversight of data product development.

Service management thinking

These considerations relate to data product analysis, periodic evaluation, and methodology selection.

Data products are services provided to the organization or externally to customers and partners. As such, it may make sense to adapt a service management framework like ITIL, in combination with the ITIL Maturity Model, for use in evaluating the fitness of data products for their scope and audience, as well as in describing the roles, processes, and acceptable technologies that should form the operating model for any data product.

At the operational level, the stakeholders required to implement each practice may change depending on the scope of the data product. For example, the release management practice for a core data product may require involvement of the data council, whereas the same practice for a team data product may only involve the team or functional head. To avoid creating decision-making bottlenecks, organizations should aim to minimize the number of stakeholders in each case and focus on single-threaded owners wherever possible.

The following table proposes a subset of capabilities and how they might be applied to data products of different scopes. Suggested target maturity levels, between 1 and 5, are included for each scope. (1= Initial, 5= Optimizing)

Target Maturity Data Product Scope.
4 – 5 3 – 4 2 – 3 2
Capability    Core
  Cross-Domain
  Function / Team
  Personal
Information Security Management X X X X
Knowledge Management X X X .
Release Management X X X .
Service-Level Management X X X .
Measurement and Reporting X X . .
Availability Management X X . .
Capacity and Performance Management X X . .
Incident Management X X . .
Monitoring and Event Management X X . .
Service Validation and Testing X X . .

Methodology development

This practice deals with the development of concrete, objective frameworks, metrics, and processes for the measurement of data product value and risk. Because the driving factors behind risk and value are not necessarily the same between products, it may be necessary to develop several methodologies or variants thereof.

Key deliverables include the following:

  • Well-defined frameworks for measuring risk and value of data products, as well as for determining the optimal portfolio of data products
  • Operationally feasible, measurable metrics associated with value and risk

Key considerations

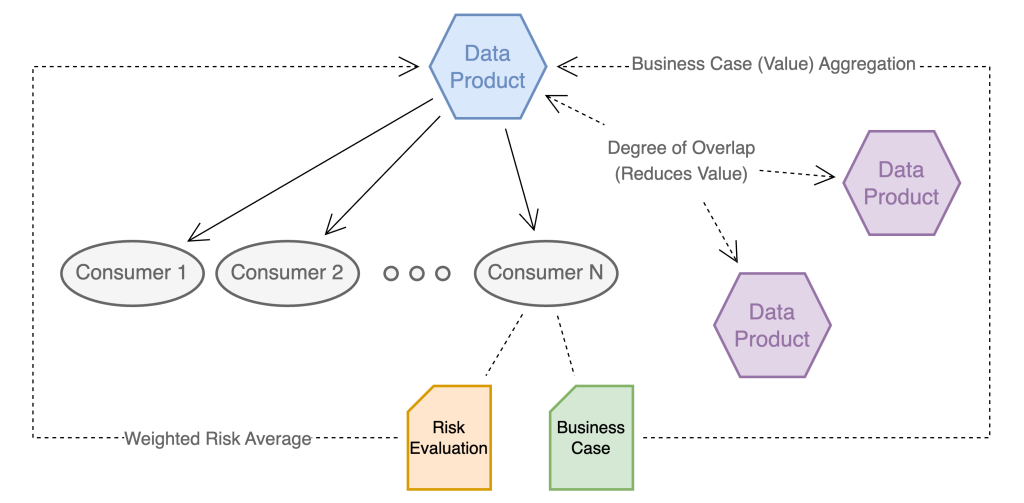
A key consideration for assessing data products is that of consumer value or risk vs. uniqueness. The following diagram illustrates how value and risk of a data product are driven by its consumers.

Data products don’t inherently present risk or add value, but rather indirectly pose—in an aggregated fashion—the risk and value created by their consumers.

In a consumer-centric value and risk model, governance of consumers ensures that all data use meets the following requirements:

  • Is associated with a business case justifying the use of data (for example, new business, cost reduction through business process automation, and so on)
  • Is regularly evaluated with reference to the risk associated with the use case (for example, regulatory reporting

The value and risk associated with the linked data products are then calculated as an aggregation. Where organizations already track use cases associated with data, either as part of data privacy governance or as a by-product of the access approval process, these existing systems and databases can be reused or extended.

Conversely, where data products overlap with each other, their value to the organization is reduced accordingly, because redundancies between data products represent an inefficient use of resources and increase organizational complexity associated with data quality management.

To ensure that the model is operationally feasible (see the key deliverables of methodology development), it may be sufficient to consider simple aggregations, rather than attempting to calculate value and risk attribution at a product or use case level.

Optimal portfolio selection

This practice deals with the determination of which combination of data products (existing, new, or potential) would best meet the organization’s current and known future needs. This practice takes input from data product analysis and data product proposals, as well as other enterprise architecture practices (for example, business architecture), and considers trade-offs between data-debt and time-to-value, as well as other considerations such as redundancy between data products to determine the optimal mix of permanent and temporary data products at any given point in time.

Because the number of data products in an organization may become significant over time, it may be useful to apply heuristics to the problem of optimal portfolio selection. For example, it may be sufficient to consider core and cross-domain data products (trunk and branches) during quarterly portfolio reviews, with other data products (leaves) audited on a yearly basis.

Key deliverables include the following:

  • A target state definition for the data mesh, including all relevant data products
  • An indication of organizational priorities for use by the portfolio adjustment practice

Key considerations

The following are key considerations regarding the data product half-life:

  • Long-term or strategic data products – These data products fill a long-term organizational need, are often associated with key source systems in various domains, and anchor the overall data strategy. Over time, as an organization’s data mesh matures, long-term data products should form the bulk of the mesh.
  • Time-bound data products – These data products fill a gap in data strategy and allow the organization to move on data opportunities until core data products can be updated. An example of this might be data products created and used in the context of mergers and acquisitions transactions and post-acquisition, to provide consistent data for reporting and business intelligence until mid-term and long-term application consolidation has taken place. Time-bound data products are considered as data-debt and should be managed accordingly.
  • Purpose-driven data products – These data products serve a narrow, finite purpose. Purpose-driven data products may or may not be time-bound, but are characterized primarily by a strict set of consumers known in advance. Examples of this might include:
    • Data products developed to support system-of-record harmonization between lines of business (for example, deduplication of customer records between insurance lines of business using separate CRM systems
    • Data products created explicitly for the monitoring of other data products (data quality, update frequency, and so on)

Portfolio adjustment

This practice implements the feasibility analysis, planning and project management, as well as communication and organizational change management activities associated with changes to the optimal portfolio. As part of this practice, a gap analysis is conducted between the current and target data product portfolio, and a set of required actions and estimated time and effort prepared for review by the organization. During such a period, data products may be marked for development (new data products to fill a need), changes, consolidation (merging two or more data products into a single data product), or deprecation. Several iterations of optimal portfolio selection and portfolio adjustment may be required to find an appropriate balance between optimality and feasibility of implementation.

Key deliverables include the following:

  • A gap analysis between the current and target data product portfolio, as well as proposed remediation activities
  • High-level project plans and effort or budget assessments associated with required changes, for approval by relevant stakeholders (such as the data council)

Data product proposals

This practice organizes the collection and prioritization of requests for new, or changes to existing, data products within the organization. Its implementation may be adapted from or managed by existing demand management processes within the organization.

Key deliverables include a registry of demand against new or existing data products, including metadata on source systems, attributes, known use cases, proposed data product owners, and suggested organizational priority.

Methodology selection

This practice is associated with the identification and application of the most appropriate methodologies (such as value and risk) during data product analysis, screening, and optimal portfolio selection. The selection of an appropriate methodology for the type, maturity, and scope of a data product (or an entire portfolio) is a key element in avoiding either a “Kudzu” mesh or a “data desert.”

Key deliverables include reusable selection criteria for mapping methodologies to data products during data product analysis, screening, and optimal portfolio selection.

Pre-screening

This optional practice is primarily a mechanism to avoid unnecessary time and effort in the comparatively expensive practice of data product analysis by offering simple self-service applications of guidelines to the evaluation of data products. An example might include the automated approval of data products that fall under the classification of personal data products, requiring only attestation on the part of the requester that they will uphold the relevant portions of the guideline that governs such data products.

Key deliverables include tools and checklists for the self-service evaluation of data products against guidelines and automated registration of approved data products.

Data product analysis

This practice incorporates guidelines, methodologies, as well as (where available) metadata relating to data products (performance against SLOs, service management metrics, degree of overlap with other data products) to establish an understanding of the value and risk associated with individual data products, as well as gaps between current and target capability maturities, and compliance with published product definitions and standards.

Key deliverables include a summary of findings for a particular data product, including scores for relevant value, risk, and maturity metrics, as well as operational gaps requiring remediation and recommendations on next steps (repair, enhance, decommission, and so on).

Screening

This optional practice is a mechanism to reduce complexity in optimal portfolio selection by ensuring the early removal of data products from consideration that fail to meet value or risk targets, or have been identified as redundant to other data products already available in the organization.

Key deliverables include a list of data products that should be slated for removal (direct-to-decommissioning).

Data product development

This practice is not performed directly under DPPM, but is managed in part by the portfolio adjustment practice, and may be governed by standards that are developed as part of DPPM. In the context of DPPM, this practice is primarily associated with ensuring that data products are developed according to the specifications agreed as part of portfolio adjustment.

Key deliverables include project management and software or service development deliverables and artefacts.

Data product decommissioning

This practice manages the decommissioning of data products and the migration of affected consumers to new or other data products where relevant. Unmanaged decommissioning of data products, especially those with many downstream consumers, can threaten the stability of the entire data mesh, as well as have significant consequences to business functions.

Key deliverables include a decommissioning plan, including stakeholder assessment and sign-off, timelines, migration plans for affected consumers, and back-out strategies.

Periodic evaluation

This practice manages the calendar and implementation of periodic reviews of the data mesh, both in its entirety as well as at the data product level, and is primarily an exercise in project management.

Key deliverables include the following:

  • yearly review calendar, published and made available to all data product owners and affected stakeholders
  • Project management deliverables and artefacts, including evidence of evaluations having been performed against each data product

Technology

Although most practices within DPPM don’t rely heavily on technology and automation, some key supporting applications and services are required to implement DPPM effectively:

  • Data catalog – Core to the delivery of DPPM is the organizational data catalog. Beyond providing transparency into what data products exist within an organization, a data catalog can provide key insights into data lineage between data products (key to the implementation of portfolio adjustment) and adoption of data products by the organization. The data catalog can also be used to capture and make available both the documented as well as the realized SLO for any given data product, and—through the use of a business glossary—assist in the identification of redundancy between data products.
  • Service management – Service management solutions (such as ServiceNOW) used in the context of data product management offer important insights into the fitness of data products by capturing and tracking incidents, problems, requests, and other metrics against data products.
  • Demand management – A demand management solution supports self-service implementation and automation of data product proposal and pre-screening activities, as well as prioritization activities associated with selection and development of data products.

Conclusion

Although this post focused on implementing DPPM in the context of a data mesh, this capability—like data product thinking—is not exclusive to data mesh architectures. The practices outlined here can be practiced at any scale to ensure that the production and use of data within the organization is always in line with its current and future needs, that governance is implemented in a consistent way, and that the organization can have Bonsai, not Kudzu.

For more information about data mesh and data management, refer to the following:

In upcoming posts, we will cover other aspects of data mesh operating models, including data mesh supervision and service management models for data product owners.


About the Authors


Maximilian Mayrhofer
is a Principal Solutions Architect working in the AWS Financial Services EMEA Go-to-Market team. He has over 12 years experience in digital transformation within private banking and asset management. In his free time, he is an avid reader of science fiction and enjoys bouldering.


Faris Haddad
is the Data & Insights Lead in the AABG Strategic Pursuits team. He helps enterprises successfully become data-driven.
Extend your data mesh with Amazon Athena and federated views

Post Syndicated from Saurabh Bhutyani original https://aws.amazon.com/blogs/big-data/extend-your-data-mesh-with-amazon-athena-and-federated-views/

Amazon Athena is a serverless, interactive analytics service built on the Trino, PrestoDB, and Apache Spark open-source frameworks. You can use Athena to run SQL queries on petabytes of data stored on Amazon Simple Storage Service (Amazon S3) in widely used formats such as Parquet and open-table formats like Apache Iceberg, Apache Hudi, and Delta Lake. However, Athena also allows you to query data stored in 30 different data sources—in addition to Amazon S3—including relational, non-relational, and object stores running on premises or in other cloud environments.

In Athena, we refer to queries on non-Amazon S3 data sources as federated queries. These queries run on the underlying database, which means you can analyze the data without learning a new query language and without the need for separate extract, transform, and load (ETL) scripts to extract, duplicate, and prepare data for analysis.

Recently, Athena added support for creating and querying views on federated data sources to bring greater flexibility and ease of use to use cases such as interactive analysis and business intelligence reporting. Athena also updated its data connectors with optimizations that improve performance and reduce cost when querying federated data sources. The updated connectors use dynamic filtering and an expanded set of predicate pushdown optimizations to perform more operations in the underlying data source rather than in Athena. As a result, you get faster queries with less data scanned, especially on tables with millions to billions of rows of data.

In this post, we show how to create and query views on federated data sources in a data mesh architecture featuring data producers and consumers.

The term data mesh refers to a data architecture with decentralized data ownership. A data mesh enables domain-oriented teams with the data they need, emphasizes self-service, and promotes the notion of purpose-built data products. In a data mesh, data producers expose datasets to the organization and data consumers subscribe to and consume the data products created by producers. By distributing data ownership to cross-functional teams, a data mesh can foster a culture of collaboration, invention, and agility around data.

Let’s dive into the solution.

Solution overview

For this post, imagine a hypothetical ecommerce company that uses multiple data sources, each playing a different role:

  • In an S3 data lake, ecommerce records are stored in a table named Lineitems
  • Amazon ElastiCache for Redis stores Nations and ActiveOrders data, ensuring ultra-fast reads of operational data by downstream ecommerce systems
  • On Amazon Relational Database Service (Amazon RDS), MySQL is used to store data like email addresses and shipping addresses in the Orders, Customer, and Suppliers tables
  • For flexibility and low-latency reads and writes, an Amazon DynamoDB table holds Part and Partsupp data

We want to query these data sources in a data mesh design. In the following sections, we set up Athena data source connectors for MySQL, DynamoDB, and Redis, and then run queries that perform complex joins across these data sources. The following diagram depicts our data architecture.

Architecture diagram

As you proceed with this solution, note that you will create AWS resources in your account. We have provided you with an AWS CloudFormation template that defines and configures the required resources, including the sample MySQL database, S3 tables, Redis store, and DynamoDB table. The template also creates the AWS Glue database and tables, S3 bucket, Amazon S3 VPC endpoint, AWS Glue VPC endpoint, and other AWS Identity and Access Management (IAM) resources that are used in the solution.

The template is designed to demonstrate how to use federated views in Athena, and is not intended for production use without modification. Additionally, the template uses the us-east-1 Region and will not work in other Regions without modification. The template creates resources that incur costs while they are in use. Follow the cleanup steps at the end of this post to delete the resources and avoid unnecessary charges.

Prerequisites

Before you launch the CloudFormation stack, ensure you have the following prerequisites:

  • An AWS account that provides access to AWS services
  • An IAM user with an access key and secret key to configure the AWS Command Line Interface (AWS CLI), and permissions to create an IAM role, IAM policies, and stacks in AWS CloudFormation

Create resources with AWS CloudFormation

To get started, complete the following steps:

  1. Choose Launch Stack: Cloudformation Launch Stack
  2. Select I acknowledge that this template may create IAM resources.

The CloudFormation stack takes approximately 20–30 minutes to complete. You can monitor its progress on the AWS CloudFormation console. When status reads CREATE_COMPLETE, your AWS account will have the resources necessary to implement this solution.

Deploy connectors and connect to data sources

With our resources provisioned, we can begin to connect the dots in our data mesh. Let’s start by connecting the data sources created by the CloudFormation stack with Athena.

  1. On the Athena console, choose Data sources in the navigation pane.
  2. Choose Create data source.
  3. For Data sources, select MySQL, then choose Next.
  4. For Data source name, enter a name, such as mysql. The Athena connector for MySQL is an AWS Lambda function that was created for you by the CloudFormation template.
  5. For Connection details, choose Select or enter a Lambda function.
  6. Choose mysql, then choose Next.
  7. Review the information and choose Create data source.
  8. Return to the Data sources page and choose mysql.
  9. On the connector details page, choose the link under Lambda function to access the Lambda console and inspect the function associated with this connector.
    mysql Data Soruce details
  10. Return to the Athena query editor.
  11. For Data source, choose mysql.
  12. For Database, choose the sales database.
  13. For Tables, you should see a listing of MySQL tables that are ready for you to query.
  14. Repeat these steps to set up the connectors for DynamoDB and Redis.

After all four data sources are configured, we can see the data sources on the Data source drop-down menu. All other databases and tables, like the lineitem table, which is stored on Amazon S3, are defined in the AWS Glue Data Catalog and can be accessed by choosing AwsDataCatalog as the data source.

This image shows AwsDataCatalog is being selected as Data Source

Analyze data with Athena

With our data sources configured, we are ready to start running queries and using federated views in a data mesh architecture. Let’s start by trying to find out how much profit was made on a given line of parts, broken out by supplier nation and year.

For such a query, we need to calculate, for each nation and year, the profit for parts ordered in each year that were filled by a supplier in each nation. Profit is defined as the sum of [(l_extendedprice*(1-l_discount)) - (ps_supplycost * l_quantity)] for all line items describing parts in the specified line.

Answering this question requires querying all four data sources—MySQL, DynamoDB, Redis, and Amazon S3—and is accomplished with the following SQL:

SELECT 
    n_name nation,
	year(CAST(o_orderdate AS date)) as o_year,
	((l_extendedprice * (1 - l_discount)) - (CAST(ps_supplycost AS double) * l_quantity)) as amount
FROM
    awsdatacatalog.data_lake.lineitem,
    dynamo.default.part,
    dynamo.default.partsupp,
    mysql.sales.supplier,
    mysql.sales.orders,
    redis.redis.nation
WHERE 
    ((s_suppkey = l_suppkey)
    AND (ps_suppkey = l_suppkey)
	AND (ps_partkey = l_partkey)
	AND (p_partkey = l_partkey)
	AND (o_orderkey = l_orderkey)
	AND (s_nationkey = CAST(Regexp_extract(_key_, '.*-(.*)', 1) AS int)))

Running this query on the Athena console produces the following result.

Result of above query

This query is fairly complex: it involves multiple joins and requires special knowledge of the correct way to calculate profit metrics that other end-users may not possess.

To simplify the analysis experience for those users, we can hide this complexity behind a view. For more information on using views with federated data sources, see Querying federated views.

Use the following query to create the view in the data_lake database under the AwsDataCatalog data source:

CREATE OR REPLACE VIEW "data_lake"."federated_view" AS
SELECT 
    n_name nation,
	year(CAST(o_orderdate AS date)) as o_year,
	((l_extendedprice * (1 - l_discount)) - (CAST(ps_supplycost AS double) * l_quantity)) as amount
FROM
    awsdatacatalog.data_lake.lineitem,
    dynamo.default.part,
    dynamo.default.partsupp,
    mysql.sales.supplier,
    mysql.sales.orders,
    redis.redis.nation
WHERE 
    ((s_suppkey = l_suppkey)
    AND (ps_suppkey = l_suppkey)
	AND (ps_partkey = l_partkey)
	AND (p_partkey = l_partkey)
	AND (o_orderkey = l_orderkey)
	AND (s_nationkey = CAST(Regexp_extract(_key_, '.*-(.*)', 1) AS int)))

Next, run a simple select query to validate the view was created successfully: SELECT * FROM federated_view limit 10

The result should be similar to our previous query.

With our view in place, we can perform new analyses to answer questions that would be challenging without the view due to the complex query syntax that would be required. For example, we can find the total profit by nation:

SELECT nation, sum(amount) AS total
from federated_view
GROUP BY nation 
ORDER BY nation ASC

Your results should resemble the following screenshot.

Result of above query

As you now see, the federated view makes it simpler for end-users to run queries on this data. Users are free to query a view of the data, defined by a knowledgeable data producer, rather than having to first acquire expertise in each underlying data source. Because Athena federated queries are processed where the data is stored, with this approach, we avoid duplicating data from the source system, saving valuable time and cost.

Use federated views in a multi-user model

So far, we have satisfied one of the principles of a data mesh: we created a data product (federated view) that is decoupled from its originating source and is available for on-demand analysis by consumers.

Next, we take our data mesh a step further by using federated views in a multi-user model. To keep it simple, assume we have one producer account, the account we used to create our four data sources and federated view, and one consumer account. Using the producer account, we give the consumer account permission to query the federated view from the consumer account.

The following figure depicts this setup and our simplified data mesh architecture.

Multi-user model setup

Follow these steps to share the connectors and AWS Glue Data Catalog resources from the producer, which includes our federated view, with the consumer account:

  1. Share the data sources mysql, redis, dynamo, and data_lake with the consumer account. For instructions, refer to Sharing a data source in Account A with Account B. Note that Account A represents the producer and Account B represents the consumer. Make sure you use the same data source names from earlier when sharing data. This is necessary for the federated view to work in a cross-account model.
  2. Next, share the producer account’s AWS Glue Data Catalog with the consumer account by following the steps in Cross-account access to AWS Glue data catalogs. For the data source name, use shared_federated_catalog.
  3. Switch to the consumer account, navigate to the Athena console, and verify that you see federated_view listed under Views in the shared_federated_catalog Data Catalog and data_lake database.
  4. Next, run a sample query on the shared view to see the query results.

Result of sample query

Clean up

To clean up the resources created for this post, complete the following steps:

  1. On the Amazon S3 console, empty the bucket athena-federation-workshop-<account-id>.
  2. If you’re using the AWS CLI, delete the objects in the athena-federation-workshop-<account-id> bucket with the following code. Make sure you run this command on the correct bucket.
    aws s3 rm s3://athena-federation-workshop-<account-id> --recursive
  3. On the AWS CloudFormation console or the AWS CLI, delete the stack athena-federated-view-blog.

Summary

In this post, we demonstrated the functionality of Athena federated views. We created a view spanning four different federated data sources and ran queries against it. We also saw how federated views could be extended to a multi-user data mesh and ran queries from a consumer account.

To take advantage of federated views, ensure you are using Athena engine version 3 and upgrade your data source connectors to the latest version available. For information on how to upgrade a connector, see Updating a data source connector.


About the Authors

Saurabh Bhutyani is a Principal Big Data Specialist Solutions Architect at AWS. He is passionate about new technologies. He joined AWS in 2019 and works with customers to provide architectural guidance for running scalable analytics solutions and data mesh architectures using AWS analytics services like Amazon EMR, Amazon Athena, AWS Glue, AWS Lake Formation, and Amazon DataZone.

Pathik Shah is a Sr. Big Data Architect on Amazon Athena. He joined AWS in 2015 and has been focusing in the big data analytics space since then, helping customers build scalable and robust solutions using AWS analytics services.

Let’s Architect! Architecting a data mesh

Post Syndicated from Luca Mezzalira original https://aws.amazon.com/blogs/architecture/lets-architect-architecting-a-data-mesh/

Data architectures were mainly designed around technologies rather than business domains in the past. This changed in 2019, when Zhamak Dehghani introduced the data mesh. Data mesh is an application of the Domain-Driven-Design (DDD) principles to data architectures: Data is organized into data domains and the data is the product that the team owns and offers for consumption.

A data mesh architecture unites the disparate data sources within an organization through centrally managed data-sharing and governance guidelines. Business functions can maintain control over how shared data is accessed because data mesh also solves advanced data security challenges through distributed, decentralized ownership.

This edition of Let’s Architect! introduces data mesh, highlights the foundational concepts of data architectures, and covers the patterns for designing a data mesh in the AWS cloud with supporting resources.

Data lakes, lake houses and data mesh: what, why, and how?

Let’s explore a video introduction to data lakes, lake houses, and data mesh. This resource explains how to leverage those concepts to gain greater data insights across different business segments, with a special focus on best practices to build a well-architected, modern data architecture on AWS. It also gives an overview of the AWS cloud services that can be used to create such architectures and describes the fundamental pillars of designing them.

Take me to this intro to data lakes, lake houses, and data mesh video!

Data mesh is an architecture pattern where data are organized into domains and seen as products to expose for consumption

Data mesh is an architecture pattern where data are organized into domains and seen as products to expose for consumption

Building data mesh architectures on AWS

Knowing what a data mesh architecture is, here is a step-by-step video from re:Invent 2022 on designing one. It covers a use case on how GoDaddy considered and implemented data mesh, in addition to:

  • The fundamental pillars behind a well-architected data mesh in the cloud
  • Finding an approach to build a data mesh architecture using native AWS services
  • Reasons for considering a data mesh architecture where data lakes provide limitations in some scenarios
  • How data mesh can be applied in practice to overcome them
  • The mental models to apply during the data mesh design process

Take me to this re:Invent 2022 video!

In the data mesh architecture the producers expose their data for consumption to the consumers. Access is regulated through a centralized governance layer.

In the data mesh architecture the producers expose their data for consumption to the consumers. Access is regulated through a centralized governance layer.

Amazon DataZone: Democratize data with governance

Now let’s explore data accessibility as it relates to data mesh architectures.

Amazon DataZone is a new AWS business data catalog allowing you to unlock data across organizational boundaries with built-in governance. This service provides a unified environment where everyone in an organization—from data producers to data consumers—can access, share, and consume data in a governed manner.

Here is a video to learn how to apply AWS analytics services to discover, access, and share data across organizational boundaries within the context of a data mesh architecture.

Take me to this re:Invent 2022 video!

Amazon DataZone accelerates the adoption of the data mesh pattern by making it scalable to high number of producers and consumers.

Amazon DataZone accelerates the adoption of the data mesh pattern by making it scalable to high number of producers and consumers.

Build a data mesh on AWS

Feeling inspired to build? Hands-on experience is a great way to learn and see how the theoretical concepts apply in practice.

This workshop teaches you a data mesh architecture building approach on AWS. Many organizations are interested in implementing this architecture to:

  1. Move away from centralized data lakes to decentralized ownership
  2. Deliver analytics solutions across business units

Learn how a data mesh architecture can be implemented with AWS native services.

Take me to this workshop!

The diagrams shows how to separate the producers, consumers and governance components through a multi-account strategy.

The diagrams shows how to separate the producers, consumers and governance components through a multi-account strategy.

See you next time!

Thanks for exploring architecture tools and resources with us!

Next time we’ll talk about monitoring and observability.

To find all the posts from this series, check out the Let’s Architect! page of the AWS Architecture Blog.

Build a multi-Region and highly resilient modern data architecture using AWS Glue and AWS Lake Formation

Post Syndicated from Vivek Shrivastava original https://aws.amazon.com/blogs/big-data/build-a-multi-region-and-highly-resilient-modern-data-architecture-using-aws-glue-and-aws-lake-formation/

AWS Lake Formation helps with enterprise data governance and is important for a data mesh architecture. It works with the AWS Glue Data Catalog to enforce data access and governance. Both services provide reliable data storage, but some customers want replicated storage, catalog, and permissions for compliance purposes.

This post explains how to create a design that automatically backs up Amazon Simple Storage Service (Amazon S3), the AWS Glue Data Catalog, and Lake Formation permissions in different Regions and provides backup and restore options for disaster recovery. These mechanisms can be customized for your organization’s processes. The utility for cloning and experimentation is available in the open-sourced GitHub repository.

This solution only replicates metadata in the Data Catalog, not the actual underlying data. To have a redundant data lake using Lake Formation and AWS Glue in an additional Region, we recommend replicating the Amazon S3-based storage using S3 replication, S3 sync, aws-s3-copy-sync-using-batch or S3 Batch replication process. This ensures that the data lake will still be functional in another Region if Lake Formation has an availability issue. The Data Catalog setup (tables, databases, resource links) and Lake Formation setup (permissions, settings) must also be replicated in the backup Region.

Solution overview

This post shows how to create a backup of the Lake Formation permissions and AWS Glue Data Catalog from one Region to another in the same account. The solution doesn’t create or modify AWS Identity and Access Management (IAM) roles, which are available in all Regions. There are three steps to creating a multi-Region data lake:

  1. Migrate Lake Formation data permissions.
  2. Migrate AWS Glue databases and tables.
  3. Migrate Amazon S3 data.

In the following sections, we look at each migration step in more detail.

Lake Formation permissions

In Lake Formation, there are two types of permissions: metadata access and data access.

Metadata access permissions allow users to create, read, update, and delete metadata databases and tables in the Data Catalog.

Data access permissions allow users to read and write data to specific locations in Amazon S3. Data access permissions are managed using data location permissions, which allow users to create and alter metadata databases and tables that point to specific Amazon S3 locations.

When data is migrated from one Region to another, only the metadata access permissions are replicated. This means that if data is moved from a bucket in the source Region to another bucket in the target Region, the data access permissions need to be reapplied in the target Region.

AWS Glue Data Catalog

The AWS Glue Data Catalog is a central repository of metadata about data stored in your data lake. It contains references to data that is used as sources and targets in AWS Glue ETL (extract, transform, and load) jobs, and stores information about the location, schema, and runtime metrics of your data. The Data Catalog organizes this information in the form of metadata tables and databases. A table in the Data Catalog is a metadata definition that represents the data in a data lake, and databases are used to organize these metadata tables.

Lake Formation permissions can only be applied to objects that already exist in the Data Catalog in the target Region. Therefore, in order to apply these permissions, the underlying Data Catalog databases and tables must already exist in the target Region. To meet this requirement, this utility migrates both the AWS Glue databases and tables from the source Region to the target Region.

Amazon S3 data

The data that underlies an AWS Glue table can be stored in an S3 bucket in any Region, so replication of the data itself isn’t necessary. However, if the data has already been replicated to the target Region, this utility has the option to update the table’s location to point to the replicated data in the target Region. If the location of the data is changed, the utility updates the S3 bucket name and keeps the rest of the prefix hierarchy unchanged.

This utility doesn’t include the migration of data from the source Region to the target Region. Data migration must be performed separately using methods such as S3 replication, S3 sync, aws-s3-copy-sync-using-batch or S3 Batch replication.

This utility has two modes for replicating Lake Formation and Data Catalog metadata: on-demand and real-time. The on-demand mode is a batch replication that takes a snapshot of the metadata at a specific point in time and uses it to synchronize the metadata. The real-time mode replicates changes made to the Lake Formation permissions or Data Catalog in near-real time.

The on-demand mode of this utility is recommended for creating existing Lake Formation permissions and Data Catalogs because it replicates a snapshot of the metadata. After the Lake Formation and Data Catalogs are synchronized, you can use real-time mode to replicate any ongoing changes. This creates a mirror image of the source Region in the target Region and keeps it up to date as changes are made in the source Region. These two modes can be used independently of each other, and the operations are idempotent.

The code for the on-demand and real-time modes is available in the GitHub repository. Let’s look at each mode in more detail.

On-demand mode

On-demand mode is used to copy the Lake Formation permissions and Data Catalog at a specific point in time. The code is deployed using the AWS Cloud Development Kit (AWS CDK). The following diagram shows the solution architecture for this mode.

The AWS CDK deploys an AWS Glue job to perform the replication. The job retrieves configuration information from a file stored in an S3 bucket. This file includes details such as the source and target Regions, an optional list of databases to replicate, and options for moving data to a different S3 bucket. More information about these options and deployment instructions is available in the GitHub repository.

The AWS Glue job retrieves the Lake Formation permissions and Data Catalog object metadata from the source Region and stores it in a JSON file in an S3 bucket. The same job then uses this file to create the Lake Formation permissions and Data Catalog databases and tables in the target Region.

This tool can be run on demand by running the AWS Glue job. It copies the Lake Formation permissions and Data Catalog object metadata from the source Region to the target Region. If you run the tool again after making changes to the target Region, the changes are replaced with the latest Lake Formation permissions and Data Catalog from the source Region.

This utility can detect any changes made to the Data Catalog metadata, databases, tables, and columns while replicating the Data Catalog from the source to the target Region. If a change is detected in the source Region, the latest version of the AWS Glue object is applied to the target Region. The utility reports the number of objects modified during its run.

The Lake Formation permissions are copied from the source to the target Region, so any new permissions are replicated in the target Region. If a permission is removed from the source Region, it is not removed from the target Region.

Real-time mode

Real-time mode replicates the Lake Formation permissions and Data Catalog at a regular interval. The default interval is 1 minute, but it can be modified during deployment. The code is deployed using the AWS CDK. The following diagram shows the solution architecture for this mode.

The AWS CDK deploys two AWS Lambda jobs and creates an Amazon DynamoDB table to store AWS CloudTrail events and an Amazon EventBridge rule to run the replication at a regular interval. The Lambda jobs retrieve the configuration information from a file stored in an S3 bucket. This file includes details such as the source and target Regions, options for moving data to a different S3 bucket, and the lookback period for CloudTrail in hours. More information about these options and deployment instructions is available in the GitHub repository.

The EventBridge rule triggers a Lambda job at a fixed interval. This job retrieves the configuration information and queries CloudTrail events related to the Data Catalog and Lake Formation that occurred in the past hour (the duration is configurable). All relevant events are then stored in a DynamoDB table.

After the event information is inserted into the DynamoDB table, another Lambda job is triggered. This job retrieves the configuration information and queries the DynamoDB table. It then applies all the changes to the target Region. If the tool is run again after making changes to the target Region, the changes are replaced with the latest Lake Formation permissions and Data Catalog from the source Region. Unlike on-demand mode, this utility also removes any Lake Formation permissions that were removed from the source Region from the target Region.

Limitations

This utility is designed to replicate permissions within a single account only. The on-demand mode replicates a snapshot and doesn’t remove existing permissions, so it doesn’t perform delete operations. The API currently doesn’t support replicating changes to row and column permissions.

Conclusion

In this post, we showed how you can use this utility to migrate the AWS Glue Data Catalog and Lake Formation permissions from one Region to another. It can also keep the source and target Regions synchronized if any changes are made to the Data Catalog or the Lake Formation permissions. Implementing it across Regions (multi-Region) is a good option if you are looking for the most separation and complete independence of your globally diverse data workloads. Also consider the trade-offs. Implementing and operating this strategy, particularly using multi-Region, can be more complicated and more expensive, than other DR strategies.

To get started, checkout the github repo. For more resources, refer to the following:


About the authors

Vivek Shrivastava is a Principal Data Architect, Data Lake in AWS Professional Services. He is a Bigdata enthusiast and holds 13 AWS Certifications. He is passionate about helping customers build scalable and high-performance data analytics solutions in the cloud. In his spare time, he loves reading and finds areas for home automation

Raza Hafeez is a Senior Data Architect within the Shared Delivery Practice of AWS Professional Services. He has over 12 years of professional experience building and optimizing enterprise data warehouses and is passionate about enabling customers to realize the power of their data. He specializes in migrating enterprise data warehouses to AWS Modern Data Architecture.

Nivas Shankar  is a Principal Product Manager for AWS Lake Formation. He works with customers around the globe to translate business and technical requirements into products that enable customers to improve how they manage, secure and access data lake. Also leads several data and analytics initiatives within AWS including support for Data Mesh.

Let’s Architect! Modern data architectures

Post Syndicated from Luca Mezzalira original https://aws.amazon.com/blogs/architecture/lets-architect-modern-data-architectures/

With the rapid growth in data coming from data platforms and applications, and the continuous improvements in state-of-the-art machine learning algorithms, data are becoming key assets for companies.

Modern data architectures include data mesh—a recent style that represents a paradigm shift, in which data is treated as a product and data architectures are designed around business domains. This type of approach supports the idea of distributed data, where each business domain focuses on the quality of the data it produces and exposes to the consumers.

In this edition of Let’s Architect!, we focus on data mesh and how it is designed on AWS, plus other approaches to adopt modern architectural patterns.

Design a data mesh architecture using AWS Lake Formation and AWS Glue

Domain Driven Design (DDD) is a software design approach where a solution is divided into domains aligned with business capabilities, software, and organizational boundaries. Unlike software architectures, most data architectures are often designed around technologies rather than business domains.

In this blog, you can learn about data mesh, an architectural pattern that applies the principles of DDD to data architectures. Data are organized into domains and considered the product that each team owns and offers for consumption.

A data mesh design organizes around data domains. Each domain owns multiple data products with their own data and technology stacks

A data mesh design organizes around data domains. Each domain owns multiple data products with their own data and technology stacks

Building Data Mesh Architectures on AWS

In this video, discover how to use the data mesh approach in AWS. Specifically, how to implement certain design patterns for building a data mesh architecture with AWS services in the cloud.

This is a pragmatic presentation to get a quick understanding of data mesh fundamentals, the benefits/challenges, and the AWS services that you can use to build it. This video provides additional context to the aforementioned blog post and includes several examples on the benefits of modern data architectures.

This diagram demonstrates the pattern for sharing data catalogs between producer domains and consumer domains

This diagram demonstrates the pattern for sharing data catalogs between producer domains and consumer domains

Build a modern data architecture on AWS with Amazon AppFlow, AWS Lake Formation, and Amazon Redshift

In this blog, you can learn how to build a modern data strategy using AWS managed services to ingest data from sources like Salesforce. Also discussed is how to automatically create metadata catalogs and share data seamlessly between the data lake and data warehouse, plus creating alerts in the event of an orchestrated data workflow failure.

The second part of the post explains how a data warehouse can be built by using an agile data modeling pattern, as well as how ELT jobs were quickly developed, orchestrated, and configured to perform automated data quality testing.

A data platform architecture and the subcomponents used to build it

A data platform architecture and the subcomponents used to build it

AWS Lake Formation Workshop

With a modern data architecture on AWS, architects and engineers can rapidly build scalable data lakes; use a broad and deep collection of purpose-built data services; and ensure compliance via unified data access, security, and governance. As data mesh is a modern architectural pattern, you can build it using a service like AWS Lake Formation.

Familiarize yourself with new technologies and services by not only learning how they work, but also to building prototypes and projects to gain hands-on experience. This workshop allows builders to become familiar with the features of AWS Lake Formation and its integrations with other AWS services.

A data catalog is a key component in a data mesh architecture. AWS Glue crawlers interact with data stores and other elements to populate the data catalog

A data catalog is a key component in a data mesh architecture. AWS Glue crawlers interact with data stores and other elements to populate the data catalog

See you next time!

Thanks for joining our discussion on data mesh! See you in a couple of weeks when we talk more about architectures and the challenges that we face every day while working with distributed systems.

Other posts in this series

Looking for more architecture content?

AWS Architecture Center provides reference architecture diagrams, vetted architecture solutions, Well-Architected best practices, patterns, icons, and more!

How Netflix Content Engineering makes a federated graph searchable

Post Syndicated from Netflix Technology Blog original https://netflixtechblog.com/how-netflix-content-engineering-makes-a-federated-graph-searchable-5c0c1c7d7eaf

By Alex Hutter, Falguni Jhaveri and Senthil Sayeebaba

Over the past few years Content Engineering at Netflix has been transitioning many of its services to use a federated GraphQL platform. GraphQL federation enables domain teams to independently build and operate their own Domain Graph Services (DGS) and, at the same time, connect their domain with other domains in a unified GraphQL schema exposed by a federated gateway.

As an example, let’s examine three core entities of the graph, each owned by separate engineering teams:

  1. Movie: At Netflix, we make titles (shows, films, shorts etc.). For simplicity, let’s assume each title is a Movie object.
  2. Production: Each Movie is associated with a Studio Production. A Production object tracks everything needed to make a Movie including shooting location, vendors, and more.
  3. Talent: the people working on a Movie are the Talent, including actors, directors, and so on.
Sample GraphQL Schema

Once entities like the above are available in the graph, it’s very common for folks to want to query for a particular entity based on attributes of related entities, e.g. give me all movies that are currently in photography with Ryan Reynolds as an actor.

In a federated graph architecture, how can we answer such a query given that each entity is served by its own service? The Movie service would need to provide an endpoint that accepts a query and filters that may apply to data the service does not own, and use those to identify the appropriate Movie entities to return.

In fact, every entity owning service could be required to do this work.

This common problem of making a federated graph searchable led to the creation of Studio Search.

The Studio Search platform was designed to take a portion of the federated graph, a subgraph rooted at an entity of interest, and make it searchable. The entities of the subgraph can be queried with text input, filtered, ranked, and faceted. In the next section, we’ll discuss how we made this possible.

Introducing Studio Search

When hearing that we want to enable teams to search something, your mind likely goes to building an index of some kind. Ours did too! So we need to build an index of a portion of the federated graph.

How do our users tell us which portion and, even more critically, given that the portion of the graph of interest will almost definitely span data exposed by many services, how do we keep the index current with all these various services?

We chose Elasticsearch as the underlying technology for our index and determined that there were three main pieces of information required to build out an indexing pipeline:

  • A definition of their subgraph of interest rooted at the entity they primarily will be searching for
  • Events to notify the platform of changes to entities in the subgraph
  • Index specific configuration such as whether a field should be used for full text queries or whether a sub-document is nested

In short, our solution was to build an index for the subgraphs of interest. This index needs to be kept up-to-date with the data exposed by the various services in the federated graph in near-real time.

GraphQL gives us a straightforward way to define the subgraph — a single templated GraphQL query that pulls all of the data the user is interested in using in their searches.

Here’s an example GraphQL query template. It’s pulling data for Movies and their related Productions and Talent.

Sample GraphQL query

To keep the index up to date, events are used to trigger a reindexing operation for individual entities when they change. Change Data Capture (CDC) events are the preferred events for triggering these operations — most teams produce them using Netflix’s CDC connectors — however, application events are also supported when necessary.

All data to be indexed is being fetched from the federated graph so all that is needed in the events is an entity id; the id can be substituted into the GraphQL query template to fetch the entity and any related data.

Using the type information present in the GraphQL query template and the user specified index configuration we were able to create an index template with a set of custom Elasticsearch text analyzers that generalized well across domains.

Given these inputs, a Data Mesh pipeline can be created that consists of the user provided CDC event source, a processor to enrich those events using the user provided GraphQL query and a sink to Elasticsearch.

Architecture

Putting this all together, below you can see a simplified view of the architecture.

Studio Search Indexing Architecture
  1. Studio applications produce events to schematized Kafka streams within Data Mesh.

a. By transacting with a database which is monitored by a CDC connector that creates events, or

b. By directly creating events using a Data Mesh client.

2. The schematized events are consumed by Data Mesh processors implemented in the Apache Flink framework. Some entities have multiple events for their changes so we leverage union processors to combine data from multiple Kafka streams.

a. A GraphQL processor executes the user provided GraphQL query to fetch documents from the federated gateway.

b. The federated gateway, in turn, fetches data from the Studio applications.

3. The documents fetched from the federated gateway are put onto another schematized Kafka topic before being processed by an Elasticsearch sink in Data Mesh that indexes them into Elasticsearch index configured with an indexing template created specifically for the fields and types present in the document.

Reverse lookups

You may have noticed something missing in the above explanation. If the index is being populated based on Movie id events, how does it stay up to date when a Production or Talent changes? Our solution to this is a reverse lookup — when a change to a related entity is made, we need to look up all of the primary entities that could be affected and trigger events for those. We do this by consulting the index itself and querying for all primary entities related to the entity that has changed.

For instance if our index has a document that looks like this:

Sample Elasticsearch document

And the pipeline observes a change to the Production with ptpId “abc”, we can query the index for all documents with production.ptpId == “abc” and extract the movieId. Then, we can pass that movieId down into the rest of the indexing pipeline.

Scaling the Solution

The solution we came up with worked quite well. Teams were easily able to share the requirements for their subgraph’s index via a GraphQL query template and could use existing tooling to generate the events to enable the index to be kept up to date in near real-time. Reusing the index itself to power reverse lookups enabled us to keep all the logic for handling related entities contained within our systems and shield our users from that complexity. In fact it worked so well that we became inundated with requests to integrate with Studio Search — it began to power a significant portion of the user experience for many applications within Content Engineering.

Early on, we did integrations by hand but as adoption of Studio Search took off this did not scale. We needed to build tools to help us automate as much of the provisioning of the pipelines as possible. In order to get there we identified four main problems we needed to solve:

  • How to collect all the required configuration for the pipeline from users.
  • Data Mesh streams are schematized with Avro. In the previous architecture diagram, in 3) there is a stream carrying the results of the GraphQL query to the Elasticsearch sink. The response from GraphQL can contain 10s of fields, often nested. Writing an Avro schema for such a document is time consuming and error prone to do by hand. We needed to make this step much easier.
  • Similarly the generation of the Elasticsearch template was time consuming and error prone. We needed to determine how to generate one based on the users’ configuration.
  • Finally, creating Data Mesh pipelines manually was time consuming and error prone as well due to the volume of configuration required.

Configuration

For collecting the indexing pipeline configuration from users we defined a single configuration file that enabled users to provide a high level description of their pipeline that we can use to programmatically create the indexing pipeline in Data Mesh. By using this high-level description we were able to greatly simplify the pipeline creation process for users by filling in common yet required configuration for the Data Mesh pipeline.

Sample .yaml configuration

Avro schema & Elasticsearch index template generation

The approach for both schema and index template generation was very similar. Essentially it required taking the user provided GraphQL query template and generating JSON from it. This was done using graphql-java. The steps required are enumerated below:

  • Introspect the federated graph’s schema and use the response to build a GraphQLSchema object
  • Parse and validate the user provided GraphQL query template against the schema
  • Visit the nodes of the query using utilities provided by graphql-java and collect the results into a JSON object — this generated object is the schema/template

Deployment

The previous steps centralized all the configuration in a single file and provided tools to generate additional configuration for the pipeline’s dependencies. Now all that was required was an entry point for users to provide their configuration file for orchestrating the provisioning of the indexing pipeline. Given our user base was other engineers we decided to provide a command line interface (CLI) written in Python. Using Python we were able to get the first version of the CLI to our users quickly. Netflix provides tooling that makes the CLI auto-update which makes the CLI easy to iterate on. The CLI performs the following tasks:

  • Validates the provided configuration file
  • Calls a service to generate the Avro schema & Elasticsearch index template
  • Assembles the logical plan for the Data Mesh pipeline and creates it using Data Mesh APIs

A CLI is just a step towards a better self-service deployment process. We’re currently exploring options for treating these indices and their pipelines as declarative infrastructure managed within the application that consumes them.

Current Challenges

Using the federated graph to provide the documents for indexing simplifies much of the indexing process but it also creates its own set of challenges. If the challenges below sound exciting to you, come join us!

Backfill

Bootstrapping a new index for the addition or removal of attributes or refreshing an established index both add considerable additional and spiky load to the federated gateway and the component DGSes. Depending on the cardinality of the index and the complexity of its query we may need to coordinate with service owners and/or run backfills off peak. We continue to manage tradeoffs between reindexing speed and load.

Reverse Lookups

Reverse lookups, while convenient, are not particularly user friendly. They introduce a circular dependency in the pipeline — you can’t create the indexing pipeline without reverse lookups and reverse lookups need the index to function — which we’ve mitigated although it still creates some confusion. They also require the definer of the index to have detailed knowledge of the eventing for related entities they want to include and that may cover many different domains depending on the index — we have one index covering eight domains.

Index consistency

As an index becomes more complex it is likely to depend on more DGSes and the likelihood of errors increases when fetching the required documents from the federated graph. These errors can lead to documents in the index being out of date or even missing altogether. The owner of the index is often required to follow up with other domain teams regarding errors in related entities and be in the unenviable position of not being able to do much to resolve the issues independently. When the errors are resolved, the process of replaying the failed events is manual and there can be a lag when the service is again successfully returning data but the index does not match it.

Stay Tuned

In this post, we described how our indexing infrastructure moves data for any given subgraph of the Netflix Content federated graph to Elasticsearch and keeps that data in sync with the source of truth. In an upcoming post, we’ll describe how this data can be queried without actually needing to know anything about Elasticsearch.

Credits

Thanks to Anoop Panicker, Bo Lei, Charles Zhao, Chris Dhanaraj, Hemamalini Kannan, Jim Isaacs, Johnny Chang, Kasturi Chatterjee, Kishore Banala, Kevin Zhu, Tom Lee, Tongliang Liu, Utkarsh Shrivastava, Vince Bello, Vinod Viswanathan, Yucheng Zeng


How Netflix Content Engineering makes a federated graph searchable was originally published in Netflix TechBlog on Medium, where people are continuing the conversation by highlighting and responding to this story.

Data Movement in Netflix Studio via Data Mesh

Post Syndicated from Netflix Technology Blog original https://netflixtechblog.com/data-movement-in-netflix-studio-via-data-mesh-3fddcceb1059

By Andrew Nguonly, Armando Magalhães, Obi-Ike Nwoke, Shervin Afshar, Sreyashi Das, Tongliang Liu, Wei Liu, Yucheng Zeng

Background

Over the next few years, most content on Netflix will come from Netflix’s own Studio. From the moment a Netflix film or series is pitched and long before it becomes available on Netflix, it goes through many phases. This happens at an unprecedented scale and introduces many interesting challenges; one of the challenges is how to provide visibility of Studio data across multiple phases and systems to facilitate operational excellence and empower decision making. Netflix is known for its loosely coupled microservice architecture and with a global studio footprint, surfacing and connecting the data from microservices into a studio data catalog in real time has become more important than ever.

Operational Reporting is a reporting paradigm specialized in covering high-resolution, low-latency data sets, serving detailed day-to-day activities¹ and processes of a business domain. Such a paradigm aspires to assist front-line operations personnel and stakeholders in “running the business”²; performing their tasks through means such as ad hoc analysis, decision-support, and tracking (of tasks, assets, schedules, etc). The paradigm spans across methods, tools, and technologies and is usually defined in contrast to analytical reporting and predictive modeling which are more strategic (vs. tactical) in nature.

At Netflix Studio, teams build various views of business data to provide visibility for day-to-day decision making. With dependable near real-time data, Studio teams are able to track and react better to the ever-changing pace of productions and improve efficiency of global business operations using the most up-to-date information. Data connectivity across Netflix Studio and availability of Operational Reporting tools also incentivizes studio users to avoid forming data silos.

The Journey

In the past few years, Netflix Studio has gone through few iterations of data movement approaches. In the initial stage, data consumers set up ETL pipelines directly pulling data from databases. With this batch style approach, several issues have surfaced like data movement is tightly coupled with database tables, database schema is not an exact mapping of business data model, and data being stale given it is not real time etc. Later on, we moved to event driven streaming data pipelines (powered by Delta), which solved some problems compared to the batch style, but had its own pain points, such as a high learning curve of stream processing technologies, manual pipeline setup, a lack of schema evolution support, inefficiency of onboarding new entities, inconsistent security access models, etc.

With the latest Data Mesh Platform, data movement in Netflix Studio reaches a new stage. This configuration driven platform decreases the significant lead time when creating a new pipeline, while offering new support features like end-to-end schema evolution, self-serve UI and secure data access. The high level diagram below indicates the latest version of data movement for Operational Reporting.

Operational Reporting Architecture Overview

For data delivery, we leverage the Data Mesh platform to power the data movement. Netflix Studio applications expose GraphQL queries via Studio Edge, which is a unified graph that connects all data in Netflix Studio and provides consistent data retrieval. Change Data Capture(CDC) source connector reads from studio applications’ database transaction logs and emits the change events. The CDC events are passed on to the Data Mesh enrichment processor, which issues GraphQL queries to Studio Edge to enrich the data. Once the data has landed in the Iceberg tables in Netflix Data Warehouse, they could be used for ad-hoc or scheduled querying and reporting. Centralized data will be moved to third party services such as Google Sheets and Airtable for the stakeholders. We will deep dive into Data Delivery and Data Consumption in the following sections.

Data Delivery via Data Mesh

What is Data Mesh?

Data Mesh is a fully managed, streaming data pipeline product used for enabling Change Data Capture (CDC) use cases. In Data Mesh, users create sources and construct pipelines. Sources mimic the state of an externally managed source — as changes occur in the external source, corresponding CDC messages are produced to the Data Mesh source. Pipelines can be configured to transform and store data to externally managed sinks.

Data Mesh provides a drag-and-drop, self-service user interface for exploring sources and creating pipelines so that users can focus on delivering business value without having to worry about managing and scaling complex data streaming infrastructure.

CDC and data source

Change data capture or CDC, is a semantic for processing changes in a source for the purpose of replicating those changes to a sink. The table changes could be row changes (insert row, update row, delete row) or schema changes (add column, alter column, drop column). As of now, CDC sources have been implemented for data stores at Netflix (MySQL, Postgres). CDC events can also be sent to Data Mesh via a Java Client Producer Library.

Reusable Processors and Configuration Driven

In Data Mesh, a processor is a configurable data processing application that consumes, transforms, and produces CDC events. A processor has 1 or more inputs and 0 or more outputs. Processors with 0 outputs are sink connectors; which write events to externally managed sinks (e.g. Iceberg, ElasticSearch, etc).

Processors with Different Inputs/Outputs

Data Mesh allows developers to contribute processors to the platform. Processors are not necessarily centrally developed and managed. However, the Data Mesh platform team strives to provide and manage the most highly leveraged processors (e.g. source connectors and sink connectors)

Processors are reusable. The same processor image package is used multiple times for all instances of the processor. Each instance is configured to fit each use case. For example, a GraphQL enrichment processor can be provisioned to query GraphQL Services to enrich data in different pipelines; an Iceberg sink processor can be initialized multiple times to write data to different databases/tables with different schema.

End-to-End Schema Evolution

Schema is a key component of Data Mesh. When an upstream schema evolves (e.g. schema change in the MySQL table), Data Mesh detects the change, checks the compatibility and applies the change to the downstream. With schema evolution, Data Mesh ensures the Operational Reporting pipelines always produce data with the latest schema.

We will cover a few core concepts in the Data Mesh Schema domain.

Consumer schema
Consumer schema defines how data is consumed by the downstream processors. See example below.

Consumer Schema Example
Consumer Schema Example

Schema Compatibility
Data Mesh uses Consumer Schema compatibility to achieve flexible yet safe schema evolution. If a field consumed by an Operational Reporting pipeline is removed from CDC source, Data Mesh categorizes this change as incompatible, pauses the pipeline processing and notifies the pipeline owner. On the other hand, if a required field is not consumed by any consumer, dropping such fields would be compatible.

Two Types of Processors
1. Pass through all fields from upstream to downstream.

  • Example: Filter Processor, Sink Processors
Opt in to schema Evolution example

2. Only uses a subset of fields from upstream.

  • Example: Project Processor, Enrichment Processor
Opt out to schema Evolution example

In Data Mesh, we introduce the Opt-in to Schema Evolution boolean flag to differentiate those two types of use cases.

  • Opt in: All the upstream fields will be propagated to the processor. For example, when a new field is added upstream, it will be propagated automatically.
  • Opt out: Only a subset of fields (defined using ‘Is Consumed’ checkboxes) is propagated and used in the processor. Upstream changes to the rest of the fields won’t affect this processor.

Schema Propagation
After the Schema Compatibility is checked, Data Mesh Platform will propagate the schema change based on the end user’s intention. With the opt-in to schema Evolution flag, Operational Reporting pipelines can keep the schema up-to-date with upstream data stores. As part of schema propagation, the platform also syncs the schema from the pipeline to the Iceberg sink.

Schema Evolution Diagram

Enrichment Processor via GraphQL

In the current Data Mesh Operational Reporting pipelines, the most commonly used intermediate processor is the GraphQL Enrichment Processor. It takes in the column value from CDC events coming from Source Connector as GraphQL query input, then submits a query to Studio Edge to enrich the data. With Studio Edge’s single data model, it centralizes data modeling efforts, which is highly leveraged by Studio UI Apps, Backend services and Search platforms. Enriching the data via Studio Edge helps us achieve consistent data modeling across the whole ecosystem for Operational Reporting.

Here is the example of GraphQL processor configuration, pipeline builder only need config the following fields to provision an enrichment processor:

GraphQL Enrichment Processor Configuration Example

The image below is a sample Operational Reporting pipeline in the production environment to sink the Movie related data. Teams who want to move their data no longer need to learn and write customized Stream Processing jobs. Instead they just need to configure the pipeline topology in the UI while getting other features like schema evolution and secure data access out of the box.

Operational Reporting Pipeline Example

Iceberg Sink

Apache Iceberg is an open source table format for huge analytics datasets. Data Mesh leverages Iceberg tables as data warehouse sinks for downstream analytics use cases. Currently Iceberg sink is appended only. Views are built on top of the raw Iceberg tables to retrieve the latest record for every primary key based on the operational timestamp, which indicates when the record is produced in the sink. Current pipeline consumers are directly consuming Views instead of raw tables.

The compaction process is needed to optimize the performance of downstream queries on the business view as well as lower costs of S3 GET OBJECT operations. A daily process ranks the records by timestamp to generate a data frame of compacted records. Old data files are overwritten with a set of new data files that contain only the compacted data.

Data Quality

Data Mesh provides metrics and dashboards at both the processor and pipeline level for operational observability. Operational Reporting pipeline owners will get alerts if something goes wrong with their pipelines. We also have two types of auditing on the data tables generated from Data Mesh pipelines to guarantee data quality: end-to-end auditing and synthetic events.

Most of the business views created on top of the Iceberg tables can tolerate a few minutes of latency. However, it is paramount that we validate the complete set of identifiers such as a list of movie ids across producers and consumers for higher overall confidence in the data transport layer of choice. For end-to-end audits, the objective is to run the audits hourly via Big data Platform Scheduler, which is a centralized and integrated tool provided by Netflix data platform for running workflows in an efficient, reliable and reproducible way. The audits check for equality (i.e. query results should be the same), the symmetric difference between two data sets should be empty across multiple runs, and the eventual consistency within the SLA. An hourly notification is sent when a set of primary keys consistently do not match between source of truth and target Data Mesh tables.

End to End (Black Box) Auditing Example

Synthetic events audits are artificially triggered change events to imitate common CUD operations of services. It is generating heartbeat signals at a constant frequency with the objective of using them as a baseline to verify the health of the pipeline regardless of traffic patterns or occasional silences.

Data Consumption

Our studio partners rely on data to make informed decisions and to collaborate during all the phases related to production. The Studio Tech Solutions team provides near real-time reports in some data tool of choice, which we call trackers to empower the decision making.

For the past few years, many of these trackers were powered by hand-curated SQL scripts and API calls being managed by CRON schedulers implemented in a Java Service called Lego. Lego was the main tool for the STS team, and at its peak, Lego managed 300+ trackers.

This strategy had its own set of challenges: being schema-less and treating every report column like a string not always worked out, the volatile reliance on direct RDS connections and rate limits from third party APIs would often make jobs fail. We had a set of “core views” which would be specifically tailored for reports, but this caused queries that just required a very small subset of fields to be slow and expensive due to the view doing a huge amount of joining and aggregation work before being able to retrieve that small subset.

Besides the issues, this worked fine when we didn’t have many trackers to maintain, but as we created more trackers to the point of having many hundreds, we started having issues around maintenance, awareness, knowledge sharing and standardization. New team members had a hard time getting onboard, figuring out which SQL powered which tracker was tough, the lack of standards made every SQL look different and having to update trackers as the data sources changed was a nightmare.

With this in mind, the Studio Tech Solutions focused efforts in building Genesis, a Semantic Data Layer that allows the team to map data points in Data Source Definitions defined as YAML files and then use those to generate the SQL needed for the trackers, based on a selection of fields, filters and formatters specified in an Input Definition file. Genesis takes care of joining, aggregating, formatting and filtering data based on what is available in the Data Source Definitions and specified by the user through the Input Definition being executed.

Genesis Data Source and Input definition example

Genesis is a stateless CLI written in Node.js that reads everything it needs from the file system based on the paths specified in the arguments. This allows us to hook Genesis into Jenkins Jobs, providing a GitOps and CI experience to maintain existing trackers, as well as create new trackers. We can simply change the data layer, trigger an empty pull request, review the changes and have all our trackers up to date with the data source changes.

As of the date of writing, Genesis powers 240+ trackers and is growing everyday, empowering thousands of partners in our studios globally to collaborate, annotate and share information using near-real-time data.

Git-based Tracker management workflow powered by Genesis and the Big Data Scheduler

The generated queries are then used in Workflow Definitions for multiple trackers. The Netflix Data Warehouse offers support for users to create data movement workflows that are managed through our Big Data Scheduler, powered by Titus.

We use the scheduler to execute our queries and move the results to a data tool, which often is a Google Sheet Tab, Airtable base or Tableau dashboard. The scheduler offers templated jobs for moving data from a Presto SQL output to these tools, making it easy to create and maintain hundreds of data movement workflows.

The diagram below summarizes the data consumption flow when building trackers:

Data Consumption Overview

As of July 2021, the Studio Tech Solutions team is finishing a migration from all the trackers built in Lego to use Genesis and the Data Portal. This strategy has increased the Studio Tech Solutions team performance and stability. Trackers are now easy for the team to create, review, change, monitor and discover.

Now and Future

In conclusion, our studio partners have a tracker available to them, populated with near real-time data and tailored to their needs. They can manipulate, annotate, and collaborate using a flexible tool they are familiar with.

Along the journey, we have learned that evolving data movement in complex domains could take multiple iterations and needs to be driven by the business impact. The great cross-functional partnership and collaboration among all data stakeholders is crucial to shape the ideal data product.

However, our story doesn’t end here. We still have a long journey ahead of us to fulfill the vision of such ideal data product, especially in areas such as:

  • Self-servicing data pipelines provisioning via configuration
  • Providing toolings for data discoverability, understandability, usage visibility and change management
  • Enabling data domain orientation and ownership/governance management
  • Bootstrapping trackers in our Studio ecosystem instead of third party tools. Along the same line as the point above, this would allow us to maintain high standards of data governance, lineage, and security.
  • Read-write reports and trackers using GraphQL mutations

These are some of the interesting areas that Netflix Studio is planning to invest in. We will have follow up blog posts on these topics in future. Please stay tuned!

Endnotes

¹ Inmon, Bill. Operational and Informational Reporting, Information Management, July 1st, 2000.
² Dehghani, Zhamak. Data Mesh: Delivering Data-driven Value at Scale, O’Reilly Media, Inc., 2021.

Acknowledgements

Data Movement via Data Mesh has been a success in Netflix Studio owing to multiple teams’ efforts. We would like to acknowledge the following colleagues: Amanda Benhamou, Andreas Andreakis, Anthony Preza, Bo Lei, Charles Zhao, Justin Cunningham, Kasturi Chatterjee, Kevin Zhu, Stephanie Barreyro, Yoomi Koh.


Data Movement in Netflix Studio via Data Mesh was originally published in Netflix TechBlog on Medium, where people are continuing the conversation by highlighting and responding to this story.