The Linux Test
Project has announced its
latest stable release for September 2026. There have been 382 patches
from 41 authors since the May 2026
release. See the announcement for a list of new tests, changes, and
more.
Rapid7 tracked a set of Linux samples that blend into the software and device conventions of the telecom environments they target. The set spans a newly observed BPFDoor variant, a BPF Rekoobe build seen against South Korean targets, a dropper, and six builds of a Linux implant we track as AVERAT, deployed against Taiwanese appliances. Additionally, we provide source code details of the Rapid7 BPFDoor controller introduced in our April 2026 blog, Stealthy BPFDoor Variants are a Needle That Looks Like Hay.
The chain uses two binaries. A dropper writes a shell script to the appliance’s storage mount and executes it. The script stages both payloads into /sbin under the names ntpdate and udevds, launches them, and deletes each file ten seconds later while the processes continue running. One of those payloads is the dropper itself, re-executing as a resident watchdog, leaving both processes running without an on-disk image.
The dropper derives its encryption key from the string ShareTech and lives in the appliance’s own add-on package directory. The BPFDoor variants seen against South Korean systems impersonate the PID file of SpamSniper, a Korean anti-spam product, and rotate through ten Linux daemon names. Across the samples, each component adopts names and conventions designed to look unremarkable in the environment it targets.
The common thread is regionalized disguise: each sample is aware of the vendor’s software running on the targeted systems and implements process spoofing accordingly. Passive BPF implants avoid conventional port scans; while outbound beacons hide inside ordinary DNS, TCP, and traffic, the threat-actor(s) are leveraging SMTP to stay under the radar. Telecommunications and network-edge operators are most affected, including embedded devices such as CCTV and DVR systems that can sit close to the network core. Readers will learn how each component works, what binds the six AVERAT builds to one another, and which behaviors and indicators to hunt for.
Technical analysis
Rapid7 BPFDoor controller
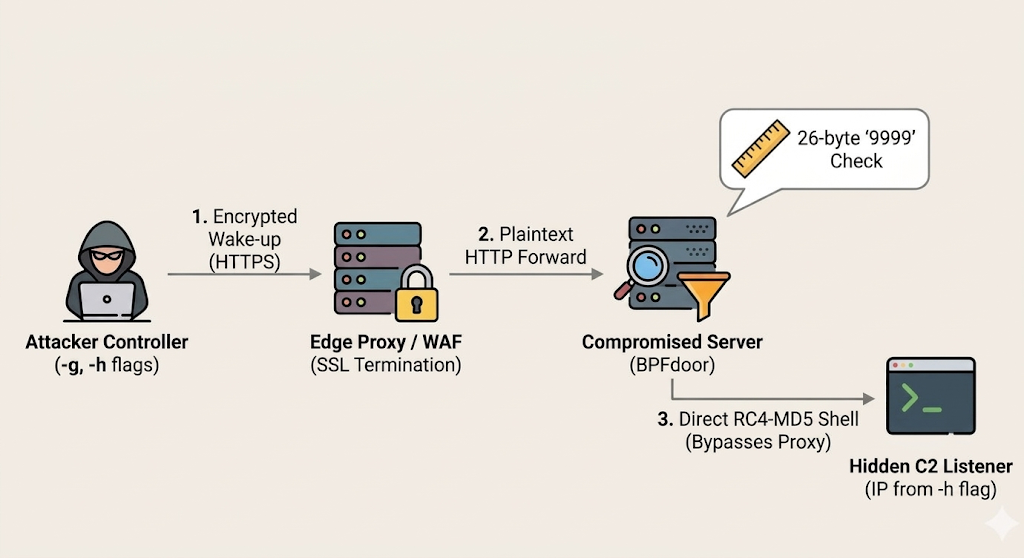
Figure 1: Overview of BPFDoor HTTP-tunneled trigger flow through edge proxy
⠀
Following our introduction of the Rapid7 BPFDoor controller, published in March, this section examines new features from the reconstructed source code.
Earlier BPFDoor variants relied on raw “magic bytes” (like 0x7255 or 0x5293) sitting in the TCP or UDP headers. Once security vendors wrote static network signatures (Suricata/Snort) to detect these Layer 4 anomalies, the operators began targeting the edge proxies. By wrapping the magic packet in standard HTTPS POST requests and relying on SSL offloading common in telecom environments, the trigger can be delivered to the BPFDoor-infected node in a way that may evade conventional deep packet inspection.
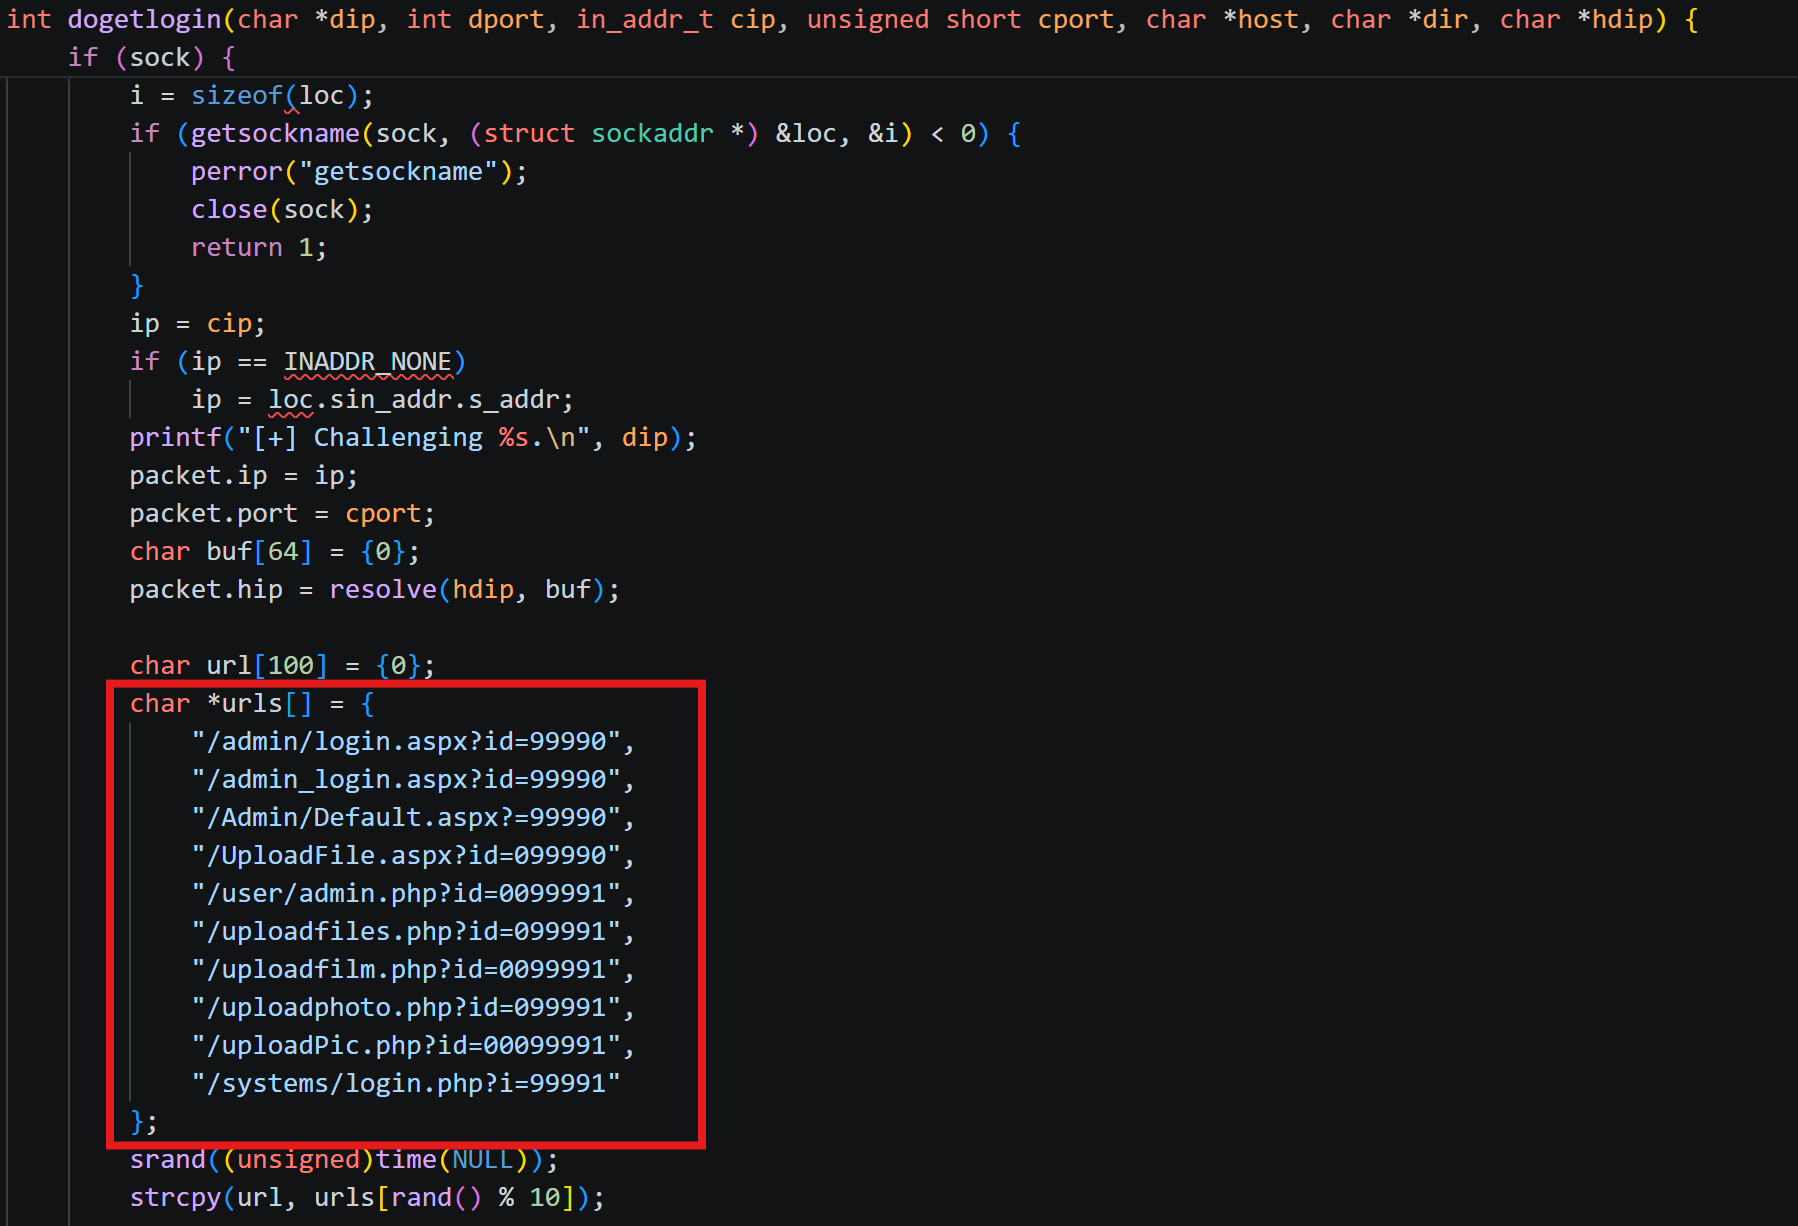
Because proxies alter HTTP headers (adding X-Forwarded-For and changing User-Agent lengths), the malware can no longer rely on static byte offsets to find its payload. To solve this, the new controller sends fake, benign-looking web requests (e.g., POST /admin/login.aspx?id=99990) that are mathematically padded. This guarantees that the string “9999” lands at exactly offset 26 of the TCP payload consistently.
The backdoor uses this “9999” as a reference point, dynamically scans for the \r\n\r\n terminator, and extracts the hex-encoded command payload from the HTTP body.
The dogetlogin function contains the hardcoded paths blending in with legitimate requests:
Figure 2: Hardcoded web login paths used by the dogetlogin function
⠀
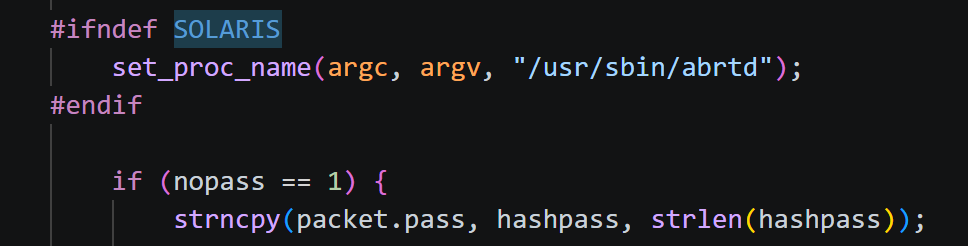
When running, the controller spoofs the identity of /usr/sbin/abrtd via set_proc_name and PR_SET_NAME. The #ifndef SOLARIS compiles safely across different operating systems, applying the abrtd disguise only where the Linux-specific prctl function is supported.
Figure 3: Process name spoofing logic applying the abrtd disguise on non-Solaris systems
⠀
The table below lists the Rapid7 controller flags, with new features identified relative to the TrendAI analysis marked accordingly.
Switch
Variable/Action
Description
-h
destip
Specifies the target host (the infected machine’s IP address) to control.
-d
dport
Sets the destination port on the infected host to send the trigger packet to.
-l
lhost
Sets the remote IP address that the infected machine will connect back to (Reverse Shell).
-s
lport
Sets the destination port to listen for incoming connections on the attacker’s machine.
-m
self = 1
Sets the attacker’s local IP address as the remote host, automatically setting up the local listener (overwrites -l).
-b
bport
Instructs the controller to bind to a specified TCP port locally (Bind Shell mode).
-n
nopass = 1
Sends the packet without prompting for a password (sends an empty/hashed password). Often used just to check if the backdoor is alive.
-i
raw = 2
ICMP mode. Embeds the magic packet into an ICMP Echo Request.
-u
raw = 3
UDP mode. Sends the magic packet via a UDP datagram.
-w
raw = 1
TCP mode. Sends the magic packet via a raw TCP SYN packet.
-f
magic_flag
Allows the operator to manually define a custom magic byte sequence (integer value).
-o
magic_flag = 0x5571
Quick-sets the magic bytes/flag to 0x5571.
-H
hdestip
[NEW] Specifies a secondary “hidden” IP address to embed inside the newly added hip field used to relay the magic packet.
-g
gethost
[NEW] Activates the HTTPS POST tunneling mode (dogetlogin).
-D
dir
[NEW] Customizes the URI directory path to blend into specific web server logs when using the -g (HTTPS POST) mode.
-v
debug = 1
[NEW] Enables verbose/debug mode, which is particularly useful for printing out the crafted HTTP requests and responses.
-t
tmout
[NEW] Sets a custom timeout value.
-c
break;
[DEPRECATED] Parses the flag but takes no actions
Table 1: Rapid7 BPFDoor Controller Flags and Descriptions
A new BPFDoor variant tied to the South Korean cluster
The BPFDoor variants create a raw PF_PACKET socket, attaching a classic BPF filter matching Rapid7 Variant F and using magic bytes 0x6693 (UDP), 0x4274 (TCP) and 0x7820 (ICMP). On a match, the implant extracts the source address and connects back to the sender if the password is gZbpx0, opens a bind shell if the password is sT21xf, and otherwise defaults to a UDP knock.
Strings are hidden with a rotating substitution alphabet. Decoding reveals a direct product-spoofing artifact and a set of service-name disguises. The SpamSniper /var/run/spamsniper.pid mutex, together with the sample provenance, ties this build to the South Korean cluster.
SpamSniper is antispam software used mainly in South Korea, so this masquerade is consistent with targeting a Korean mail or telecom environment. The variants a37ea9897221d4495b538de72b74f2aa1d2ff09b7b6dcedd395aee58931adbf3 and 7e667ba5f9df912e02275d3cfe3809d16f822fe776f4035c84b118ebd925b1b5 share the same filter, packet parser, callback, and command paths.
The data plane variant
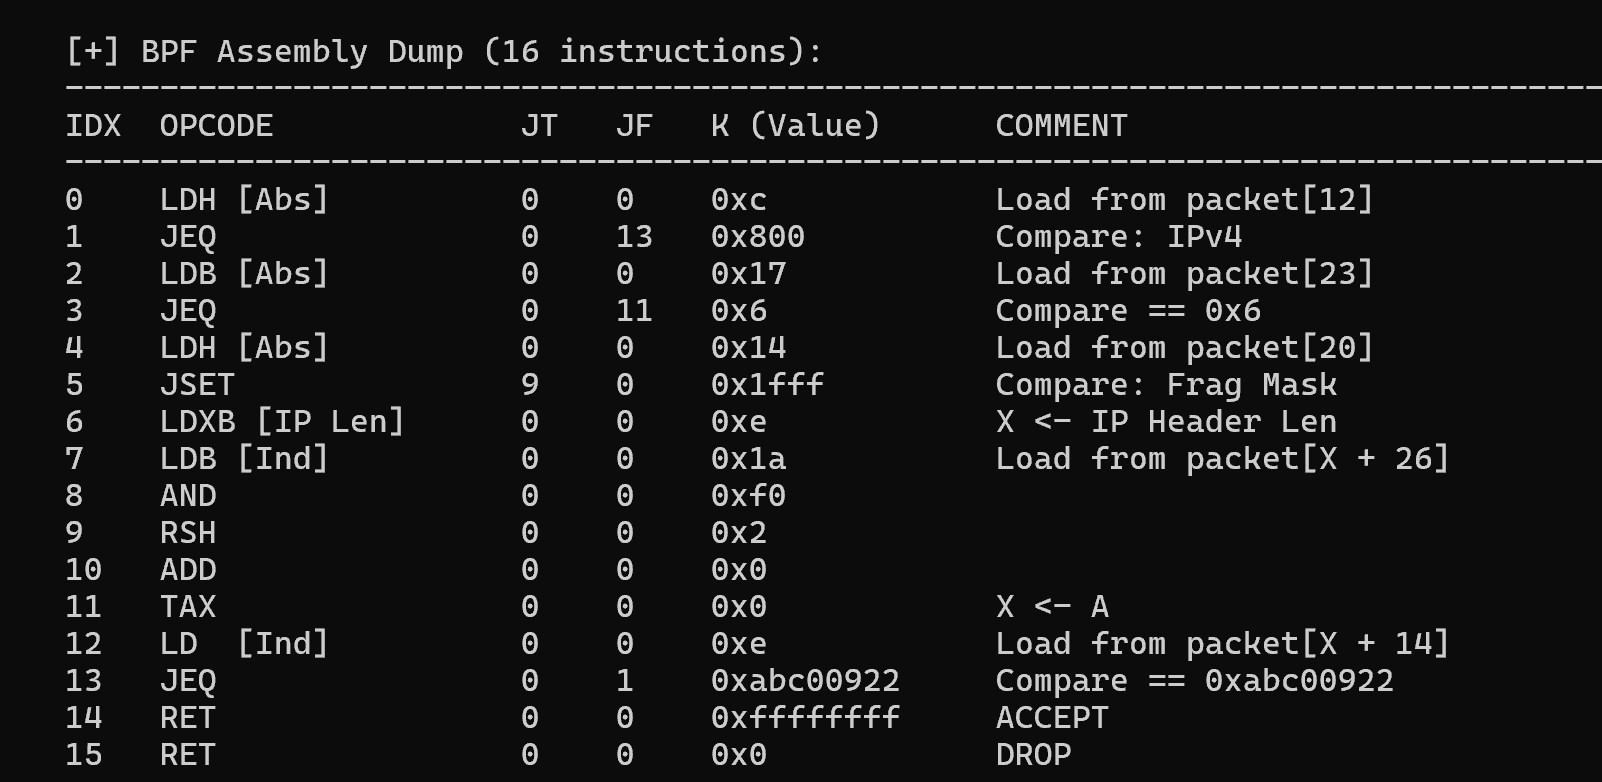
The BPFDoor sample (a6f3b7f932761fb1fd5e74123f2482e36c65dd13e769af2ce08c65da195bfa7a) attaches a SOCK_RAW 16-BPF instructions parsing IP/TCP offsets and gates on a 14-byte payload (2B 76 C0 63 83 E9 5F E1 EE 69 3F 32 CD 94, unique per sample).
Figure 4: BPF filtering for abc00922 TCP magic bytes
⠀
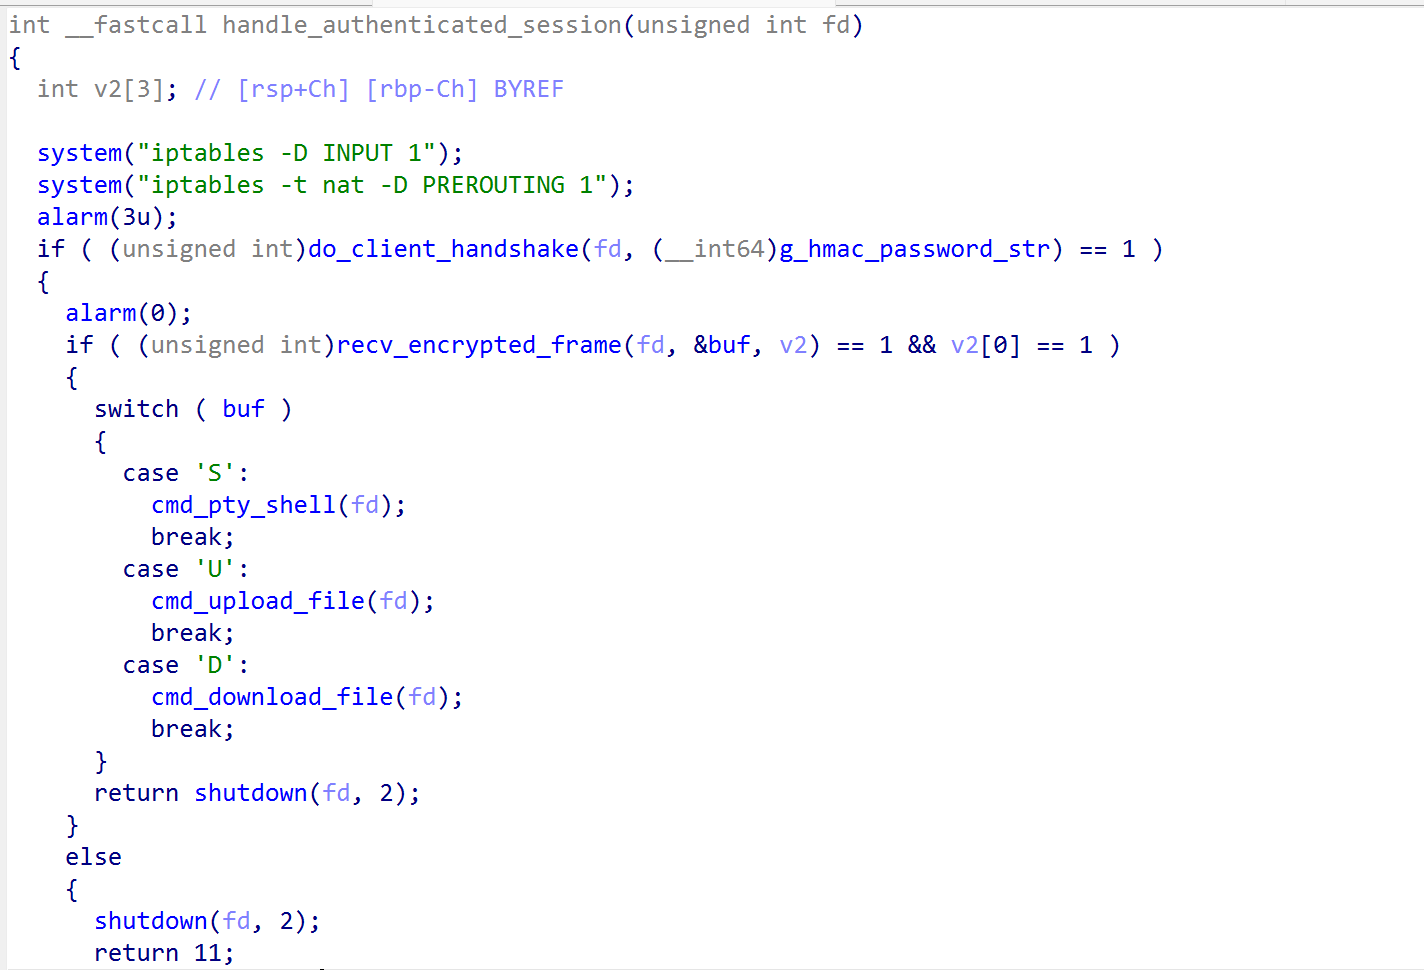
It spoofs its process name to ora_ppmond, mimicking the naming convention of Oracle-backed telecom subscriber and provisioning platforms (HSS, OSS/BSS), a disguise that only reads as legitimate on hosts actually running that class of infrastructure. Once triggered, it opens a stock Tiny Shell session and dispatches single-byte ‘S’/’U’/’D’ commands — interactive shell, upload, download — the same switch-case and iptables NAT-redirect staging/teardown logic found byte-for-byte in a second sample 4435fcd6862921092614dbeaa880e4192352984686ebcd98f0ba13ee8e226ef9 (the latter spoofing /sniper/snipe/bin/dtnpd and /sniper/bin/ofgmd). These samples show BPFDoor operating as a modular framework that adapts to the telecom layer it targets, integrating Tiny Shell and Rekoobe logic to support exfiltration.
Figure 5: Tinyshell logic integrated into BPFDoor
⠀
BPF Rekoobe
The sample 652508a9cf40bee883dc0e5e219dfeba71fe7dac591d01c89f74c21f73b4963f is a Rekoobe-based backdoor. It attaches a 26 BPF instruction filter, sniffing for TCP/UDP/SCTP IPv4 and UDP IPv6 traffic with source and destination ports equal 25. Strings are protected with a repeating-key XOR routine (uvTIgh47,@#R), which decodes internal markers and command tokens. The magic packet is authenticated against a 32-byte sequence: 5C A3 1E F9 72 84 DB 40 26 9F C8 35 E1 7D 0A B2 4D 68 93 0F E7 5A B4 21 8C D6 39 F2 47 1B 60 CE. C2 interactions begin by sending the following 12-byte handshake: 50 01 13 3F 08 5C 73 7B 1A 72 53 78 (decrypting to “%wGvo4GL62p*” using the XOR key above).
Process names are drawn from an encrypted table and set through argv rewriting (Table 2).
On a SpamSniper appliance, SMTP server-to-server relay traffic is the primary legitimate traffic type the appliance is designed to handle. A firewall in front of the appliance will commonly allow rules such as:
A magic packet withsrc=25, dst=25 would match the first rule and reach the raw socket before any stateful inspection. The implant authors understood exactly what traffic profile would be invisible on this specific class of host.
The command interface relies on the same cryptography (HMAC-SHA1, AES-CBC) and opcodes as the standard Tinyshell/Rekoobe.
By setting variables like VIMINIT=”set viminfo=”, HISTFILE=/dev/null, HISTSIZE=0, andHISTFILESIZE=0, the malware ensures that the attacker’s commands are not logged to bash history nor to vim logs. The reverse shell spoofs “/sniper/autorun/rblsmtpd –start -n 9“ and connects on the attacker’s port 25. Rblsmtpd is a standard daemon used by mail servers (like qmail) to block mail from IPs listed in Real-time Blackhole Lists (RBLs).
A dropper likely built for ShareTech appliances
The dropper (update:2bedc26d4b29b435c21962beed7db21188a0219a0d28334bba8b4fb1656d7b15) is an x86-64 ELF with a minimal import table — fopen, fwrite, fputs, fclose, chmod, system, strlen, sleep, access, memcpy, exit — and no networking. It is a local installer, run after access is already established.
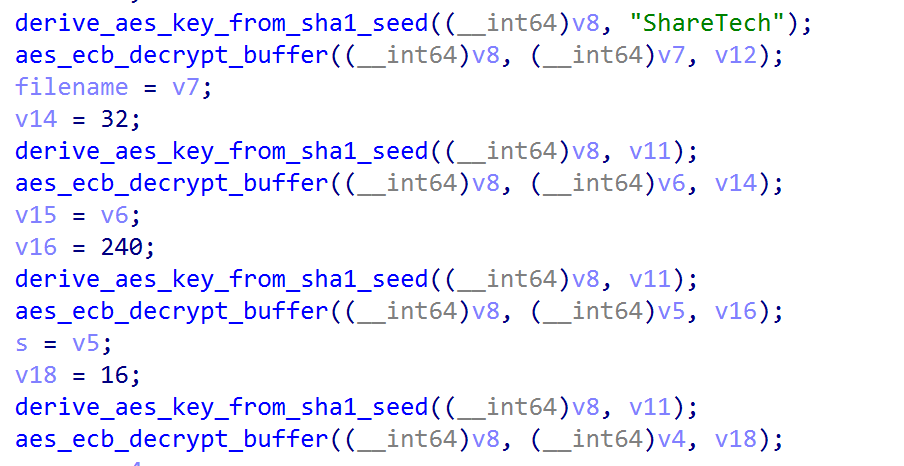
It carries four AES-128-ECB blobs keyed on the first sixteen bytes of SHA1(“ShareTech”), or 6C CA D5 17 0E 3D B8 17 B3 DF 52 E0 D9 71 B1 48. The operators seeded their own key derivation with the target vendor’s name.
Figure 6: AES key derivation seeding routine from SHA1(“ShareTech”)
Execution is gated on one precondition: the install branch fires only when /tmp/flag already exists on the filesystem and the .php script does not. When the gate passes, the dropper writes the script to the appliance’s bulk-storage mount, chmods it 0777, hands it to system(), and exits. Because system() runs sh -c against a file carrying a real shebang, /HDD must be both writable and exec-capable. A noexec mount returns EACCES, for which the shell offers no interpreter fallback.
The script then copies two malicious binaries from /addpkg into /sbin as ntpdate and udevds, runs each, and unlinks them ten seconds later. Both keep running with no on-disk image: /proc/<pid>/exe resolves to (deleted), so there is nothing to hash, quarantine or submit, and a responder grepping /sbin finds nothing at all.
The elegant part is that /sbin/ntpdate is the dropper re-executing itself; the second instance finds the .php already present, fails the gate, and drops into a two-second watchdog that recreates execProcEnd and re-writes the script whenever either disappears. That also explains the absence of any persistence code: /addpkg/sbin/ is the appliance’s own add-on package directory, so the firmware’s package startup very likely relaunches it at boot.
AVERAT: A modular implant reaching into ORB
The dropper copies AVERAT into /sbin/udevds, marks it executable, launches it, sleeps ten seconds, and removes it.
Command and control
The implant connects outbound to port 25 and speaks SMTP: it issues EHLO, requests STARTTLS, and only then begins its own encrypted session. On a mail security gateway, outbound SMTP to arbitrary mail exchangers is the device’s core function, so the traffic is indistinguishable from legitimate work in flow records.
The TLS layer is hand-built rather than linked from a standard cryptographic library. A fixed ClientHello template is compiled into the binary, including a 40-entry cipher suite list and a fixed extension ordering. Peer authentication is deferred entirely to the application layer via a shared-secret handshake carrying the magic value 1571 (0x0623).
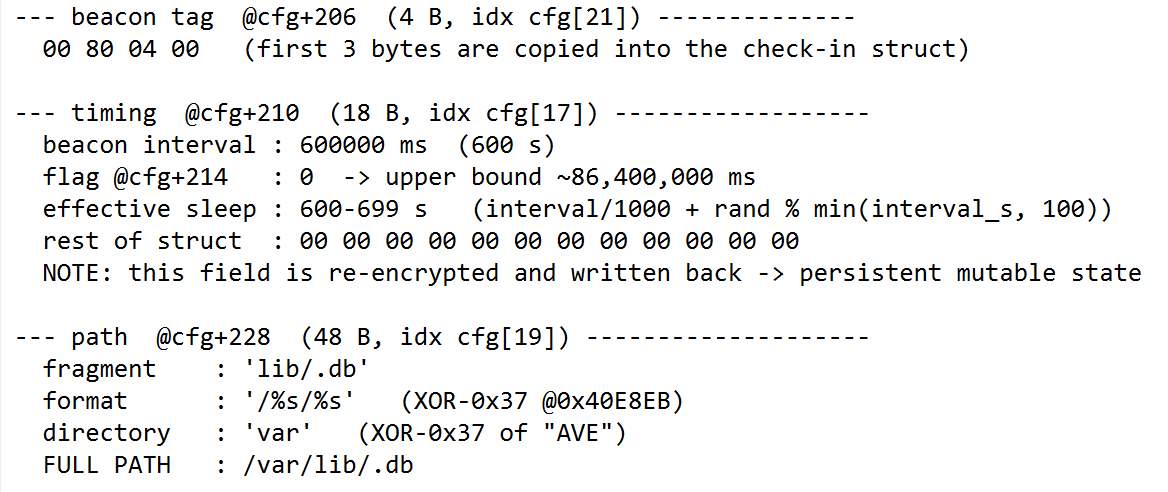
Check-ins occur every 600 to 699 seconds. Each reports hostname, current user, OS version, network interfaces, and logged-in users. The interval is stored in a hidden file at /var/lib/.db and can be changed by the operator, persisting across restarts.
Figure 7: AVERAT beacon configuration details and persistent state file path structure
⠀
AVERAT takes its name from its only disk artifact: var, which reads as AVE when XOR-encoded (Figure 7).
Configuration
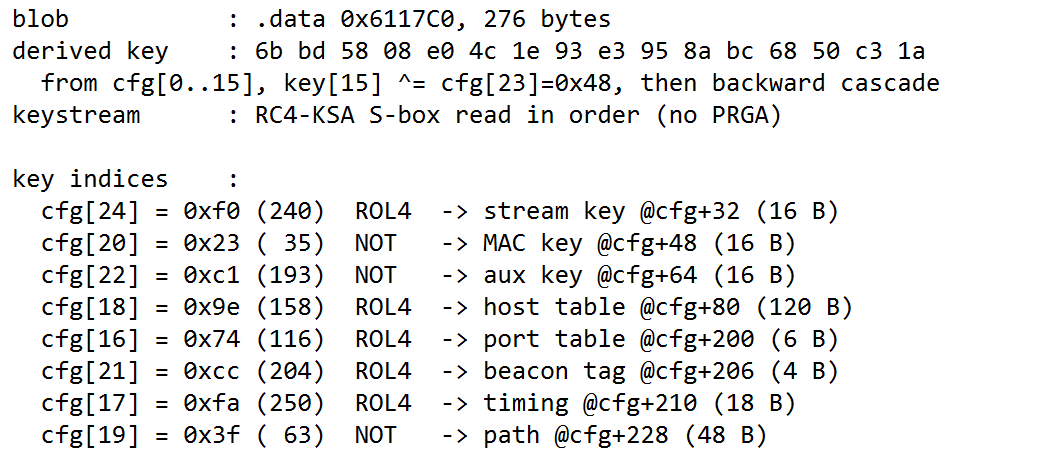
All operational values are held in a 276-byte encrypted blob. The key is derived from the blob’s own first 16 bytes, folded with a further byte and a reverse XOR cascade; that key seeds RC4’s key-scheduling algorithm, and the resulting S-box is used directly as a keystream. Each field starts at its own keystream offset, and the parity of that offset selects whether bytes are bitwise-inverted or nibble-rotated before the XOR.
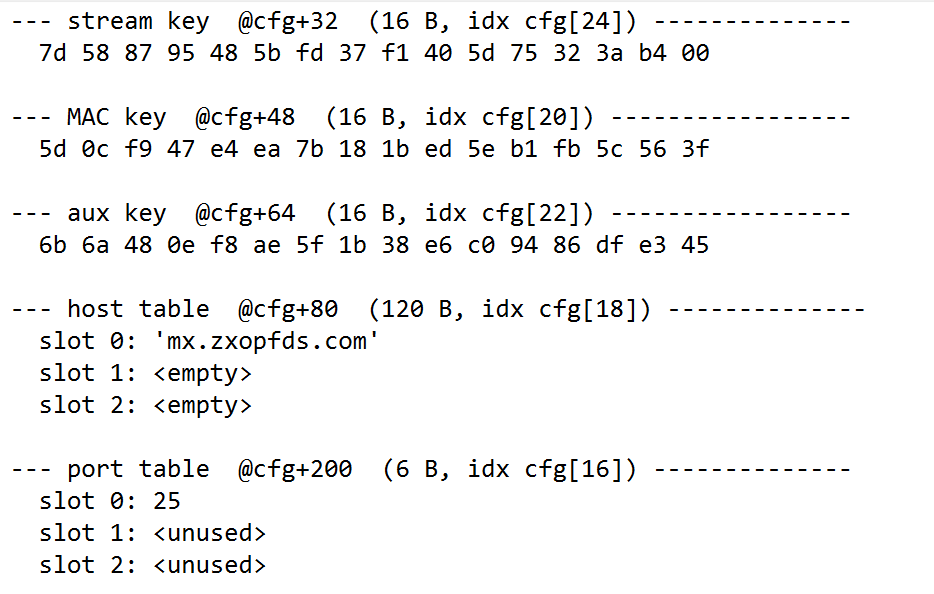
Decrypted, the blob yields three 16-byte keys (transport, authentication, and a secondary handshake secret), the host table, the port table, a three-byte build tag, the timing state, and the .db path.
Figure 8: Key derivation and keystream offset mapping
⠀
The schema provides three host and port pairs; this build populates one.
Figure 9: Decrypted AVERAT host and port table configuration slots
⠀
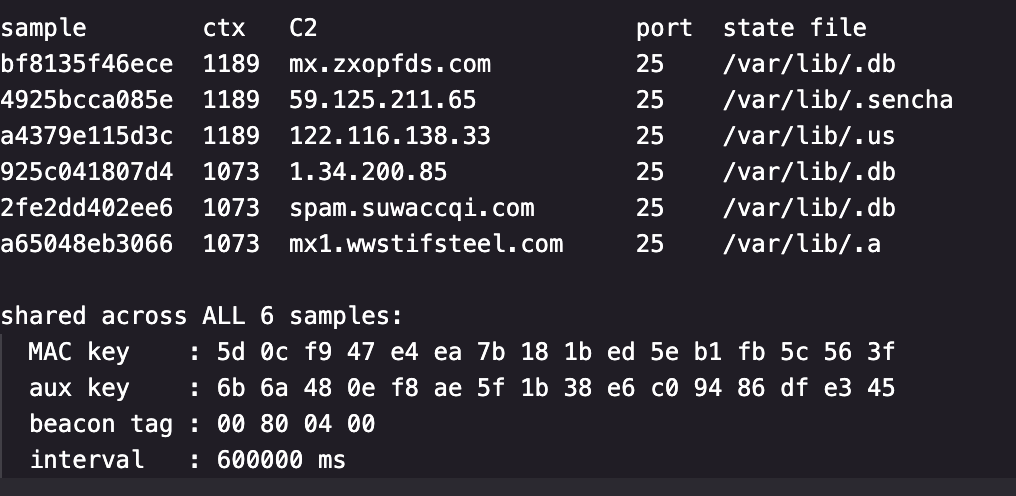
Rapid7 developed an extractor for the AVERAT family. Figure 10 shows the results for the samples identified at the time of writing.
Figure 10: AVERAT extractor results and sample hashes identified at the time of writing
⠀
The MAC key and aux key are byte-identical in all six, while only one stream key is shared between a pair (Figure 10).
Command set
Command codes are uint16 values grouped into bands by subsystem. The most operationally significant are below.
Code
Capability
20
Enumerate directory contents
21
Download a file from the host, with resume support
22
Upload a file to the host in chunks, appending on resume
25
Recursively delete a file or directory tree
30
Recursively walk a directory tree, resolving file ownership
629
Enumerate running processes with command lines
632
Terminate a process (SIGTERM)
842
Overwrite the C2 host and port tables at runtime
912
Open an interactive shell session — up to ten concurrently
914
Write a command into an open shell session
916
Reboot the appliance, flushing buffers to disk beforehand
1010
Load or unload a shared-object module, extending the implant
1576
Set the callback interval and persist it to .db
1618
Open a proxy or port-forward channel through the appliance
unknown
Close the socket and terminate the process immediately
Table 4: AVERAT Command Codes and Capabilities
Infrastructure
The three IP addresses recovered from the configs represent compromised CPE belonging to third-party victims rather than intentional operator assets. Scan data shows all three sitting in Chunghwa Telecom’s HiNet address space (AS3462), in three separate Taiwanese cities — Tainan, Banqiao and Taoyuan — each representing a distinct class of neglected, internet-facing consumer or SMB appliance.
59.125.211.65 is a Synology NAS belonging to a Taiwanese fuel-retail business, still serving a Laravel-based “cloud management system” on 81/82 behind a Let’s Encrypt certificate that expired in October 2021, alongside an exposed MariaDB 5.5.62 instance that reached end of life in 2020. 122.116.138.33 is an embedded Taiwanese ADSL/FTTH SMB network appliance — gSOAP 2.8 on 8000 with a recording-management interface, HTTP Basic realms named SMB on 8081, 8082 and 10443, and a self-signed NetKlass Technology certificate valid from 2004 to 2014, MD5-signed with a 1024-bit key. 1.34.200.85 is a Dahua DH-XVR5116HS-I3 recorder. These are victim hosts repurposed as operational relays, selected on consistent criteria: reachable, unpatched, unmonitored, and unlikely to be audited.
The detail that binds them is PPTP on 1723, present on all three, returning a byte-identical banner (Firmware: 1, Hostname: local, Vendor: linux, fingerprint 261189147). A Dahua XVR ships no PPTP server. Synology’s DSM offers one only as an optional package, disabled by default and deprecated in current releases. We assess this as operator-installed, which makes each node dual-purpose: an outbound relay terminating SMTP-disguised implant traffic, and an inbound routed VPN foothold into the host’s own LAN. Combined with the RAT’s own proxy commands, the campaign has relay capability at both ends of the connection.
The campaign is running two distinct C2 addressing strategies:
Strategy
Samples
Trade-off
Attacker-registered domain
bf8135f4, 2fe2dd40, a65048eb
Survives IP churn, re-pointable via DNS — leaves a seizable, sinkholable, monitorable name
Hardcoded consumer-broadband IP
4925bcca, a4379e11, 925c0418
No DNS artifact at all, brittle against address rotation
Table 5: C2 Addressing Strategies Comparison
The relay layer is composed of consumer and small-business broadband CPE: a fuel retailer’s NAS, an obsolete NetKlass appliance, and a CCTV recorder, each sitting on a domestic-grade line.
AVERAT’s command-and-control infrastructure matches the device-class profile that CISA, NCSC-UK, and partner agencies described in their April 2026 joint advisory (AA26-113A) as the standard building blocks of China-nexus covert/ORB networks: end-of-life NAS, edge appliances, and DVRs chosen because their vulnerabilities will never be patched. We found no infrastructure or indicator overlap with any specific named ORB network (LapDogs/UAT-7810, SPACEHOP, or FLORAHOX), whose documented targeting instead centers on SOHO routers; AVERAT’s infrastructure is consistent with the broader ORB device-class pattern rather than confirmed membership in a known network.
Operator tradecraft
Three design decisions indicate operational maturity.
The dispatcher terminates the process on any unrecognized command code. This is inexpensive to implement and raises the cost of interactive probing or automated scanning against a live implant.
Support for ten concurrent shell sessions is consistent with provisioning for parallel operator access rather than a single interactive session..
The reboot handler calls sync() before forcing a restart through the kernel rather than through init. Flushing filesystem buffers before destroying volatile state is the behavior of an operator who knows precisely which artifacts persist across a restart and which do not — and in this chain everything happens in memory while the persistence needed to re-establish access is on disk.
Detectionguidance
File-based detection on the appliance is unlikely to succeed, because no payload persists in /sbin. We recommend prioritizing the following.
On the host, hunt for processes whose executable has been unlinked, which on Linux presents as a (deleted) suffix on the /proc/<pid>/exe target. To catch fileless and unlinked process execution, monitor process descriptors for instances where /proc/<pid>/exe points to an unlinked path, and inspect memory maps for executable pages lacking backing file paths on disk.
Additionally, alert on the presence of .db state files and dropper artifacts: the directory /HDD/ms6x2xTo64/, a shell script carrying a .php extension whose first bytes are #!/bin/sh, and a marker file execProcEnd containing the literal string end. A process-tree sequence of sh -c on a .php path, followed by cp and chmod into /sbin and an rm -rf of the same path within roughly ten seconds, provides high-fidelity detection of the staging sequence.
On the network, the fixed ClientHello template means the implant’s TLS fingerprint does not vary between infections. Fingerprinting it is more durable than watching the port, because the port is configurable at runtime through command 842 while the template is compiled in. Outbound SMTP from an appliance to mail-role hostnames that resolve to consumer-grade or embedded devices warrants investigation on its own.
Mitigation
Investigate unexpected raw packet sockets and classic BPF filters on Linux systems that do not require packet capture. Review outbound TCP port-25 callbacks from processes that are not mail services, particularly when the process renames itself to a common daemon or creates hidden PID and socket markers. Preserve short-lived staged binaries and collect process arguments, open file descriptors, socket metadata, and historical DNS records. Restrict management access to routers, DVRs, and other edge appliances, and monitor NFS or SMB mounts that could let an adjacent host write executables onto an embedded device.
YARA rules and more IoCs are available in Rapid7’s Intelligence Hub along with ongoing intelligence on the latest campaigns.
What defenders should take away from these campaigns
The components form a modular access ecosystem. The dropper executes AVERAT, which beacons to changeable infrastructure, while BPFDoor and Rekoobe samples wait for a magic packet before opening interactive access.
Across both campaigns, the network edge is a consistent focus. Each targets mail-security appliances that sit inline in front of the mail server, giving an implant positioned there visibility into an organization’s inbound and outbound traffic. Both also use port 25 to blend into expected SMTP activity, although the mechanism differs between the campaigns. In either case, command-and-control traffic can hide within a protocol that is normal for the device and may therefore attract less scrutiny.
This fits the broader BPFDoor pattern, where compromised IoT and SMB devices, including NAS units and DVRs, can act as operational relays that obscure the true source of magic-packet traffic before it reaches the passive backdoor. Newer samples also show how the malware continues to adapt to the environments it targets, including a second userland-level magic-packet check layered on top of the kernel BPF gate.
Rapid7 Variant G provides another example of that adaptation. It uses three BPF filters to preserve operational resilience on high-traffic edge nodes, with the filters left unoptimized because the libpcap version running on its end-of-life targets does not support filter optimization.
For defenders, the most useful detection opportunities remain raw packet sockets, BPF filters, port-25 callbacks from unexpected processes, process masquerading, and appliance-specific staging paths. Specific attribution should remain an ongoing assessment as new samples and infrastructure emerge.
Today, we’re launching eight major updates that bring your logs, traces, analytics, alerts, dashboards, and exporting into one observability platform, with simpler and more predictable pricing.
Understanding an issue often requires data from more than one Cloudflare product. A spike in 5xx responses could come from a Worker, from your origin, or from Cloudflare failing to connect to your origin globally or regionally. But investigating it today requires knowing which product owns each signal and how to query it.
Observability should be a platform-wide capability: it should reflect how applications actually behave and give you the complete context needed to resolve an issue. Over the coming months, you’ll see more Cloudflare products, datasets, and workflows become part of this shared observability platform, with more consistent pricing, product experiences, and features. These eight updates are the first step into a more unified Observability problem.
1. Investigate all your logs in one place
The new Logs home combines Workers Observability (for debugging Workers applications and its connected resources) with Log Explorer (for searching across security logs). You can now choose from log datasets like HTTP events, firewall events, Workers, Containers, R2, and AI Gateway, and use the same investigative tools and capabilities for each.
Start with an increase in request latency, group it by hostname or data center, narrow the results to affected paths, and inspect individual requests by Ray ID. If the investigation leads to another Cloudflare product, switch datasets without leaving Logs. Support for querying across multiple datasets is coming soon, making it possible to connect related events across products in a single query.
You can query your logs with raw SQL or with built-in filters to narrow down on specific events. Create visualizations with natural language, and easily investigate and understand detected anomalies.
2. Trace requests through our entire platform — now in open beta
We’re launching Cloudflare Traces in open beta, giving you a request-level view of supported security rules, transformations, cache decisions, routing, Workers, and origin handling. You get to see how your traffic moved through our platform, and connect the dots between how you’ve configured Cloudflare, and how this influences request processing time, routing decisions, and more.
Set a baseline sampling rate for continuous visibility, then use Trace Rules to capture specific traffic at a higher rate during an investigation. Target hostnames, paths, IP addresses, or headers, search by Ray ID, and inspect the resulting spans directly in the Cloudflare dashboard.
3. Have your agent query observability data with one unified SQL API
Agents also need a consistent way to sift through your observability data, investigate issues, correlate signals, and verify fixes. We’re launching a unified SQL API, now in beta, for querying telemetry across Cloudflare. Instead of integrating separately with Workers logs, Containers security events, HTTP request logs, and analytics data, people and agents can query them using one SQL dialect, authentication model, and API.
Additionally, we’re also bringing the SQL interface directly into Workers with a native binding. Your Worker can now do things like query Analytics Engine data to meter customer usage and power billing workflows, build customer-facing analytics dashboards, generate health reports, or automate incident investigation without configuring a separate API client.
4. New pricing for all ingested and stored logs and traces
For all logs and traces ingested and stored on Cloudflare, we are moving to one unified Observability subscription and pricing. Beginning December 1, 2026, this pricing model will apply across all plans (effective upon renewal for all Enterprise customers) and cover existing Developer Platform logs, including Workers, Containers, AI Gateway, as well as all tracing data.
Because logs and traces can vary dramatically in size, the new model is based on the volume you ingest and store rather than an event-based count. This pricing adjustment will be. Check out our documentation for more details on pricing.
Plan
Included Usage
Retention
Additional usage
Free
0.5 GB of ingestion per day
7 days
Not available
Paid and Enterprise
50 GB of ingestion 10 GB-month of storage per billing cycle
Up to 1 year (coming soon)
$0.25 per GB ingested $0.10 per GB-month stored
5. Configure custom alerts on your observability data – now in beta
Notifications (now called “Alerts”) just got a major upgrade. You can now define custom alerts directly on anything supported by our new unified SQL API, including HTTP request logs, Workers events, Workers Analytics Engine datasets, analytics datasets, traces, and security events.
Choose a dataset in the dashboard or define the condition using custom SQL. Then select a threshold, anomaly, or SLO, set the evaluation window, and choose where the alert should go. You might alert when origin 5xx responses exceed a threshold for five minutes, a Container repeatedly fails, Worker errors increase after a deployment, or trace latency crosses an expected limit.
You can send alerts right to tools your teams are already using, including incident management tools, chat platforms, and webhooks. Webhooks are now available on all plans, allowing you to route alerts to custom services or even your agent to begin investigating immediately. To get started check out our documentation or give this command to your agent:
6. See your domain analytics in one place — now with 30 days retention
Understanding what is happening on your domain has often meant piecing together metrics from different Cloudflare products. We’re bringing traffic, performance, security, cache, origin, and DNS data together so you can see how they relate. If latency increases, you can quickly see whether it is tied to a specific Cloudflare data center, hostname, or origin.
In addition, you now get 30 days of domain analytics on every plan. A full month of history gives you time to investigate issues after they happen, compare today with the same day in previous weeks, and tell the difference between a one-time spike and a longer trend.
7. Build custom dashboards
Prebuilt dashboards cover common use cases, but applications often use several parts of Cloudflare. With Custom Dashboards, you can bring together analytics from across Cloudflare, logs and traces from the Workers platform, and security events in one view. Track request volume, errors, latency, storage, and blocked traffic, then share the dashboard with your team. Instead of rebuilding queries during every investigation, you have one place to monitor the signals that matter to your application.
8. Logpush is now available on all self-serve plans
Logpush, previously available only to Enterprise, is now available on all self-serve plans, letting you export all Cloudflare logs to the tools and destinations you already use. Need to apply filters, perform redaction, enrich events or reshape output before delivery? Transformers is now generally available, letting you apply any SQL transformation without operating a separate ETL pipeline.
We’re introducing usage-based pricing for Logpush and Transformers. Each includes a free monthly allowance, with simple pricing for additional usage:
Export usage
Included each month
Additional usage
Exports to Cloudflare destinations
25 GB
$0.03 per GB
Exports to external destinations
25 GB
$0.10 per GB
Logpush Transformers
1 GB
$0.04 per GB
Visit the documentation to get started with Logpush and explore complete pricing details.
What's coming up:
Longer retention for your observability data: You’ll be able to retain logging and tracing data for up to one year, making it easier to investigate recurring issues, compare historical behavior, and analyze long-term trends.
OpenTelemetry API support in Workers: We’ll continue building out our OpenTelemetry APIs to enable adding attributes to existing spans or getting trace context.
Easier metrics export with OpenTelemetry: You’ll be able to send Cloudflare metrics to OpenTelemetry-compatible destinations and analyze them alongside telemetry from the rest of your stack.
New pricing takes effect December 1, 2026: If you ingest or store observability data on Cloudflare, the unified pricing plan will apply to your usage. We’ll notify you before the change takes effect.
Ready to start investigating?
We hear you when you say Cloudflare can feel like a black box. These updates are just the beginning of exposing what’s happening, making the underlying data accessible, and giving you the context that you need to act. That transparency matters even more as agents move from writing software to operating it. An agent can only close the loop between a change and its outcome if it can query what happened, identify the failure, and verify the fix.
A year ago, Cloudflare CTO Dane Knecht announced our intention to make every Cloudflare feature available to everyone. Cloudflare launched an Enterprise tier years ago when larger customers came to us looking for procurement options beyond a credit card, like invoices, custom contracts, and dedicated support. Those offerings met a customer need but over time, a two-tier system developed where some of our most advanced and powerful features were only available to Enterprise customers. Our goal was to close that gap.
Today, teams of every size use Cloudflare, from Fortune 100 enterprises to small businesses, open-source projects, and individuals. Across the platform, we’re committed to ensuring that every user or team can make use of all of Cloudflare’s capabilities in a way that helps their organization thrive.
The underlying philosophy is that Cloudflare should offer products suitable for our most demanding customers — and make those capabilities available to everyone. Large or small, every customer would prefer not to have to call support. Building products that are easy to buy, configure, and consume means more of our products in use and a step closer to a better Internet for everybody.
Every generally available (GA) feature we launched this week that is available on an Enterprise plan is also available to Pay-as-you-go customers, and most are available on the free tier. Where our plans differ, it's in how much you can use, not what you can use. While we haven’t yet met our goal that every feature be available to everyone, in the year since Dane’s announcement, we’ve made great progress.
Here are a few products and features making the transition today from Enterprise to everyone.
Logpush and Logpush Transformers now available to all plans
Flexibility on pushing logs to third parties and how logs are formatted expanded this week from Enterprise-only to all customers.
Logpush delivers Cloudflare logs to storage, security, and analytics destinations, helping customers monitor traffic, investigate issues, and analyze their data using existing tools. Previously available only to Enterprise customers, Logpush is now available to Free, Pro, and Business customers through self-service, pay-as-you-go pricing. Datasets available to Logpush have been expanding as well. We’ve recently added account-scoped firewall events, WebSocket analytics and per-zone post-quantum visibility.
Transformers is also becoming generally available to all customers. With Transformers, customers can use SQL to filter unnecessary records, redact sensitive information, enrich events, and reformat logs before delivery without operating a separate extraction, transformation and loading (ETL) pipeline. Together, Logpush and Transformers give every customer greater control over how their Cloudflare data is prepared and delivered.
In addition, Custom Dashboards which let customers create personalized views highlighting the metrics most critical to them, is now available to all customers.
New tools for managing Cloudflare at scale
Expanding RBAC
Over the last year, we’ve dramatically expanded the availability of Role-Based Access Control (RBAC) across all Cloudflare products and for all customers. Today, nearly all products have RBAC roles available at the account and zone level. Recently, Workers joined R2 and Access in having RBAC roles available at the individual resource level as well, so Administrators can decide who on their team gets specific access to individual Workers.
Multiple Accounts
While fine-grained RBAC lets customers manage subsets of an account, this setup still relies on a small number of super administrators making choices about who gets access to what. Centralized authority works great when your problem space is small, but as the number of teams and projects being managed on Cloudflare grows, it can turn into an organizational bottleneck.
The single account model is excellent in its simplicity, but it can start to feel a little crowded for customers maintaining hundreds or thousands of zones, workers, and storage products. That’s why we’ve been expanding our capabilities around managing multiple accounts.
New Account button
Last month, we quietly launched the New Account button on the dashboard that, for the first time, lets users create additional accounts directly. The response has been overwhelmingly positive, and we’re seeing thousands of customers branching out into additional accounts every week. When you use this button, it creates a new, free, Cloudflare account that you can use to segment your open source projects, or segment the work of multiple teams in your organization. Each of these accounts is independently billed, so you can segment spending across multiple cost-centers directly. Safeguards are in place to prevent fraud and abuse.
New Accounts for Enterprises
While the New Account button is for everyone, for the time being, we recommend that Enterprise customers reach out to their account team to get new accounts provisioned instead. This lets you reuse your existing enterprise agreement and subscriptions across all of your accounts. There is no preset limit on how many accounts an enterprise can request. We will be adding additional features in the future that make this process self-serve for enterprises too.
Organizations
Once you’ve created multiple accounts, how do you organize and track them all? Organizations allow customers to group accounts together with a single analytics and shared configuration surface. It’s in beta for Enterprise customers now, will be GA in October, and will be rolling out to free accounts in early 2027. Adding your multiple accounts to a single organization makes managing them easier by providing a unified surface for visibility and management. Organizations provide shared administrators with unified analytics and audit logging as well as shared WAF, Gateway, and Access IdP configurations.
Enterprises are eligible for exactly one organization. We limit enterprises to a single organization, so there’s a single pane of glass that shows all the company’s assets in one place. This makes life easier, so you can invite the CISO, CTO, or other executive stakeholders and give them unified visibility. If you’re an Enterprise customer and haven’t tried organizations yet, you can set one up directly as long as you are a super administrator of at least one account and nobody else has already created the organization. If the organization has already been started, talk to the other Cloudflare administrators in your company to get your accounts added to it. This process ensures that there’s never an elevation of privilege as we layer on this new management plane.
Terraform and Tags
Once a customer has created multiple accounts, an organization to manage them, and set RBAC rules for the products and resources they contain, they need to be able to manage them in a way that’s auditable and repeatable. Terraform lets customers use Infrastructure as Code to manage everything using version-controlled code rather than clicking on the dashboard in a way that may not be repeatable. In the last year, Cloudflare has made dramatic progress creating a Terraform provider that is built programmatically, so it’s always up-to-date with the latest version of the Cloudflare API. Terraform, like the other features mentioned in this post, is available to all customers, Enterprise and not.
Additionally, Resource Tagging lets customers apply key value tags to a very broad set of resources within the Accounts and Organizations. Today tags can be produced interactively or via API and are useful for organizing resources in the dashboard. In the future we intend to make tags useful in billing and access control scenarios and to be manageable via Terraform.
How we use it all at Cloudflare
With the increasing menu of enterprise-ready options for everyone, one of the top questions we get is “What does Cloudflare do internally?” Within Cloudflare, we create accounts per team, or per service, depending on the nature of the team. We then use Terraform to manage account access and production configuration, giving teams a peer-reviewed, auditable path for changes. Because the scope of each account is narrow, we can grant broader permissions to the engineers responsible for that account while keeping the blast radius contained. This lets teams grow their accounts organically without bottlenecking on a small number of central administrators, and it makes operational work like on-call response faster and safer.
Every account at Cloudflare lives within Cloudflare’s organization, which provides our security team with administrative access to every account within the organization, as well as analytics, policy management, and shared configurations. This makes it easier to align every account in the organization to our security standards. Our teams have the right blend of autonomy and centralized control to go fast.
Enabling teams to quickly sort, organize, and filter their resources is critical in our production environments. While it’s still early, Resource Tagging is enabled internally and teams have begun to roll out tags to make finding the WAF rule, R2 bucket, etc. that they need to interact with easier.
More features for everyone
We launched support for the Authentik identity provider (IdP), SCIM Audit logging, and SCIM 2.0 Group Sync. MCP Server Portals moved into general availability. All these features were once in some way Enterprise-only. Even network management is going self-serve: the Network Overview page and Unified Routing both recently became available for all.
Starting with free
Solving big problems starts with first ensuring they aren’t getting any larger. This year, as part of Code Orange: Fail Small, we announced a commitment to rolling new code out by traffic cohort, starting with our free customers. As a result, today we are committed to introducing no new Enterprise-only features. Naturally there will be some carve-outs for things like Cloudflare for Government that are inherently Enterprise-oriented in nature.
Other progress for free and pay-as-you-go customers
Beyond making previously enterprise-only features available to everyone, we’ve also done a lot of work to make Cloudflare more powerful and accessible for everyone
Billable Usage Dashboard and API
In August, we introduced the billable usage dashboard and API which lets non-Enterprise customers see how much they’ve spent and download their consumption data to use offline directly or through third-party tools like Vantage. We also introduced budget alerts, which are on by default to prevent unpleasant billing surprises. We're prototyping hard spending caps now, with early availability in Q4 2026. Because Enterprise customers have dramatically more variation on contract terms and how they pay, this experience is not yet available to Enterprise customers, but we are hard at work and expect to have an announcement in 2027.
Higher limits available to all customers
Over the past year we’ve increased limits across Cloudflare products. We’re constantly working to increase these defaults, and keep our front door as open as possible to people building the next big thing.
Between exposing formerly enterprise-only features to everyone and increasing the power of features that were already available to everyone, Cloudflare is committed to building the most powerful and accessible platform for customers large and small without the need for a contract. We still have much work to do on Dane’s pledge from a year ago, but we are committed to getting there and are delighted to be able to highlight our progress over the last year.
Take advantage of these new offerings
Create additional accounts to partition the concerns of your organization.
Use RBAC to define security policies at the zone and account level.
If you’re an Enterprise customer, create an Organization and onboard these accounts. For other customers, we’ll see you in early 2027.
Use Terraform to manage the state across your whole organization.
Attend Cloudflare Connect next month to learn more about everything discussed here and meet the team that built it.
Today, end users carry too much of the burden of online privacy. To avoid third-party trackers or targeted ads, users are instructed to use a VPN, disable cookies, or install adblockers. Meanwhile, some app developers end up knowing more about their users than they’d care to: a typical client-server exchange creates a trail of user data, like the client’s IP address or TLS fingerprint. This level of visibility can be a burden.
That’s why Cloudflare builds infrastructure that helps developers bake privacy into their apps. Oblivious HTTP (OHTTP) is an IETF standard designed to enable app backends to receive HTTP requests without seeing user IP addresses.
This fall, we’re launching the Cloudflare OHTTP Gateway. Customers will be able to enable our new OHTTP Gateway as a paid add-on to their zone and start receiving OHTTP traffic with just a few clicks. Register through our form to join our waitlist. Read on to learn more.
Expanding our OHTTP product suite
With OHTTP, requests travel through two independently-operated hops: a relay and a gateway. An OHTTP relay blindly forwards encrypted requests in order to hide client identifiers from app servers. An OHTTP gateway performs the cryptographic work of decapsulating encrypted requests and encapsulating responses such that app servers can handle OHTTP requests as if they were plain HTTP. The separation of trust between relay and gateway is critical: it ensures that no single party sees both client identifiers and request contents.
In 2022, we launched an OHTTP relay product, Privacy Gateway. Privacy Gateway enables our customers to offer more privacy-preserving experiences to their users. For example, Flo Health uses OHTTP for their app’s Anonymous Mode, and Apple’s Private Cloud Compute uses OHTTP to disassociate AI inference requests from user identities. But customers who are already protecting their servers behind Cloudflare can’t also use a Cloudflare-operated relay — they need an OHTTP gateway instead.
In our experience running OHTTP relays, we’ve seen how difficult it can be to build and operate a secure, performant OHTTP gateway at scale. Today, we’re launching the closed beta for our self-serve Cloudflare OHTTP Gateway. We’re also renaming our “Privacy Gateway” to “Cloudflare OHTTP Relay” to better distinguish the two products.
Now, customers who want an OHTTP architecture with the necessary separation of trust have two options:
Use Cloudflare’s OHTTP Relay (formerly Cloudflare Privacy Gateway) and run your gateway yourself. This is best if your application servers are hosted off Cloudflare, and you’re able to run your own OHTTP gateway.
Use Cloudflare’s new OHTTP Gateway with a third-party relay. This is best if your app servers are already behind Cloudflare (on our CDN or Workers, for example), if you’re accepting OHTTP requests from a third party (like Apple’s LiveCallerID), or if you want a managed gateway to minimize latency and operational overhead.
We’re working to raise the bar for privacy across the Internet, and we believe that protocols like OHTTP can help — if we make them easy enough to adopt. It’s always been our goal to expand our OHTTP product suite and make our trusted privacy infrastructure accessible to a broader swath of the Internet.
Why we built the Cloudflare OHTTP Gateway
Since we launched our OHTTP Relay product, we’ve observed a few things.
First, we’ve seen that there's a growing appetite among developers for accessible, usable privacy infrastructure. Developers of privacy-oriented apps want to bake network privacy into their applications by default, but doing so remains harder than it should be.
Second, we’ve learned that building and operating an OHTTP gateway can be tough for customers. Any proxying architecture introduces some latency because requests must travel an extra hop or two around the Internet. Combine that with the cost to decrypt requests and encrypt responses, and the latency hit of a homegrown OHTTP setup can be significant. We’re well-positioned to solve this problem: the same building blocks that enable us to operate fast, reliable privacy infrastructure for products like 1.1.1.1 and iCloud Private Relay make us a good home for an OHTTP gateway. Because of Cloudflare’s anycast approach, our OHTTP Gateway will run on every server on Cloudflare’s global edge network, minimizing latency in relay-to-gateway hops. If you use our CDN, user requests can be decrypted by our Gateway and resolved by your app servers on the same Cloudflare metals, saving gateway-to-origin latency.
Finally, recall that OHTTP’s privacy model requires that the relay and app server be operated by separate, non-colluding parties. We want to provide our customers with the best possible range of options for their privacy infrastructure. Before, developers who protected their app servers behind Cloudflare weren’t able to use our OHTTP Relay, because Cloudflare would see both client metadata and the decrypted contents of requests, breaking OHTTP’s privacy model. Now, developers can choose whether a Cloudflare OHTTP Relay or Gateway is a better fit for their architecture.
A primer on OHTTP
A typical interaction between a client and application server reveals information about the client. When a client and app server talk to one another, the app server learns the client’s IP address because each packet in which data is sent is labeled with a source IP — similar to the “from” label on an envelope. App servers can also “fingerprint” a client based on attributes like supported TLS versions or cipher suites. These signals make it possible for app servers to link multiple requests back to the same user.
But what if I wanted to build an app that really doesn’t know much about my users? For example: Flo Health wanted to build an Anonymous Mode to enable users to access personal health data without it being linkable to possible user identifiers.
OHTTP introduces a proxy, called a “relay,” that forwards requests and responses between client and app server to obfuscate the client’s identity from the app server. The relay sees client identifiers like IP address and TLS fingerprint, but strips them before forwarding on requests. This prevents app servers from linking multiple requests back to the same user, and means that request contents can’t be associated with the user’s IP address.
For example, a regular client-server exchange might reveal the following information about a client:
A request first sent through an OHTTP relay would reveal only the relay’s information to the app server receiving the request:
This means that for each request, the app server doesn’t learn the location and TLS fingerprint of the end user. Plus, if many different users are sending requests through the relay, the app server won’t be able to distinguish which requests are coming from whom, limiting their ability to trace app activity back to a single end user. This creates a strong privacy boundary.
What really differentiates OHTTP from a basic forwarding proxy, however, is the encryption of data between client and app server. Requests and responses are encapsulated using Hybrid Public Key Encryption (HPKE) such that only the client and app server can see plaintext, and the relay sees only a jumble of ciphertext. A “gateway” sits between the relay and app server to handle all of this cryptography — decapsulating requests, encapsulating responses — and the app server handles only plain HTTP.
This creates a “double-blind” privacy model: the relay sees only client identifiers; the gateway and app server see only request contents; no party sees both.
How we built the OHTTP Gateway
In building our OHTTP gateway-as-a-service, our goal is to bring our secure, performant privacy infrastructure to a broader swath of the Internet. Performance and easy onboarding are critical. So, we built our Gateway as a flexible service deployed across our global network. With just a couple of clicks, you can enable the Gateway on your zone and start sending OHTTP to https://your-zone.com/.well-known/ohttp-gateway. We’ll scale the service up and down automatically, so you don’t need to worry about capacity.
We had a few other user needs in mind, informed by the pain points we’d seen OHTTP Relay customers run into when operating their own OHTTP gateways.
First: We wanted to abstract away as much of the complexity of OHTTP as possible for your app servers. We wanted developers to be able to start receiving OHTTP while continuing to accept regular HTTP traffic if they chose. So, we designed the Gateway as a feature of your zone, where clients send well-formatted OHTTP requests to a /.well-known/ohttp-gateway endpoint on your zone. We support both standard and chunked OHTTP — and we recommend using chunked OHTTP for better performance, because it enables us to process requests incrementally (in “chunks”).
Our Gateway service will intercept each request, decrypt it, issue a subrequest to your app server, and return an encrypted response to the client. All non-OHTTP requests will travel to your server without invoking the Gateway.
Binding your Gateway to your zone also enables us to protect your Gateway from abuse. A client sending requests to your zone `example.com` may send to `foo.example.com` or `bar.example.com`, but not wikipedia.com. Without you needing to worry about it, this prevents unauthorized clients from using your zone as a way to target other domains.
Second: Seamless key management is critical. Gateways need to maintain a public HPKE key configuration to enable clients to encrypt requests, but managing keys securely is a challenge. So, we designed the Gateway to fully manage all keys for customers, and to serve public keys as responses to GET requests to /.well-known/ohttp-gateway. For stronger privacy, clients can download keys over a different IP than they request the gateway.
Third: Gateways need to be able to authenticate relays. Because the Gateway (by design) knows very little about the client sending a given request, it places trust in the relay to authenticate clients and forward traffic responsibly. But how do you ensure that only trusted relays can send traffic to your gateway?
We designed the Gateway such that Cloudflare Access, Cloudflare’s zero trust network access product, runs before requests are decrypted, enabling you to use any standard Access policies to authenticate incoming traffic and protect your Gateway from abuse. Options include mutual TLS, static service credentials, and custom external logic.
Finally: Mistakes happen, and we anticipated that customers might accidentally break OHTTP’s privacy model by running both their relay and gateway on Cloudflare. So, to preserve OHTTP’s separation of trust and ensure that Cloudflare never sees both client identities and decrypted inner requests, our Gateway will refuseto decrypt requests sent from Cloudflare Workers or from proxied hosts on Cloudflare.
When is the OHTTP Gateway a better fit than the OHTTP Relay?
If you want to use Cloudflare’s OHTTP product suite, but you’re wondering why you’d pick Cloudflare’s OHTTP Gateway instead of the OHTTP Relay, here are a couple of considerations.
First, do you want your app servers on Cloudflare – behind our CDN or built on Workers, for example? If so, the OHTTP Gateway is a better fit to ensure adherence to OHTTP’s privacy model.
Second, what’s your use case? If you want to receive OHTTP requests from a third-party client and relay — to use Apple’s LiveCallerID SDK, for example — then the OHTTP Gateway is likely the better solution for you.
Getting started
If you have a feature request or would like to register for our waitlist, so we can notify you when the product launches, sign up here.
Then, you’ll need to implement an OHTTP client. See ohttp.info or our sample client library for some examples to help you get started. One flag as you build the client: OHTTP provides privacy at the network level, and doesn’t touch the inner request body. So, to preserve user privacy, it’s up to you not to send identifying information (e.g. a user’s email address or username) in the request body.
Next, you’ll need to bring your own relay. Relays can run on any infrastructure provider, and they’re simple: here’s some sample code. The challenge and the reason you might want a dedicated OHTTP relay provider, is to verifiably promise to your users that you won’t inspect logs with client identifiers. Otherwise, you’d be able to correlate clients at the relay with decrypted requests at your app servers.
Finally, once your OHTTP deployment is live, check out our pvcli client to help with testing and debugging.
We’re excited to bring accessible privacy infrastructure to developers everywhere. Reach out to us if you’d like to try out the new OHTTP Gateway and raise the bar for privacy online.
Traditionally, preventing online fraud relied on point-in-time proof of identity: enter the correct password, complete a biometric verification, or pass a liveness check, and gain access. To defeat these controls, fraudsters had to steal credentials and other identity evidence from a real user, which was difficult to execute and scale. Today, widespread access to AI enables fraudsters to fabricate or imitate legitimate identities by combining exposed credentials with synthetic media designed to evade identity verification. Consequently, identity checks are no longer sufficient as they capture a moment in time. Even when someone passes a check, it does not mean the account itself can be trusted.
One convincing interaction can be faked. A consistent pattern of legitimate behavior is much harder to manufacture. Modern fraud prevention must move beyond stateless decisions toward a stateful trust model. Traditional identity verification asks, “Can this person pass the check right now?” A stateful approach additionally asks, “Does it fit what we know about this account and its established behavior?” At Cloudflare, trust is continually earned and reassessed at each interaction against historical behavioral, network, and device patterns.
Cloudflare’s Account Abuse Protection (AAP) creates stateful account overviews to help website owners detect and investigate abuse across login and signup activity. Customers configure an identifier from their existing login or signup flow, such as an email address, username, or phone number. Cloudflare cryptographically hashes that value to create a privacy-preserving, per-domain Hashed User ID. Within AAP, a Hashed User ID represents an account and anchors its activity. With each login or signup, AAP adds the event and relevant network and device signals observed at Cloudflare’s edge. Over time, this accumulated history establishes context for the account’s typical behavior, making meaningful deviations easier to identify and giving fraud teams (i.e., the designated personnel for Security Intelligence, Investigations, Trust & Safety, or Risk & Compliance) a stronger foundation for investigation.
Today, we are introducing a new fraud dashboard for Account Abuse Protection, available first to Early Access customers. The workspace brings together account overviews built from activity observed across a website’s configured login and signup flows. It allows fraud analysts to view their entire user population, identify suspicious trends, and move from aggregate activity patterns into specific account investigations.
Dashboard overview: From population visibility to individual account depth
The dashboard is designed as an investigative funnel. When a suspicious event has been identified, fraud teams can review the account population overview to understand the scale and shape of suspicious patterns without needing to investigate every account individually.
Teams can review total login and signup volume, see how many accounts generated those events, and view the unique IP addresses and devices observed across those accounts. Country and ASN breakdowns provide additional context about where the activity was observed.
The account population overview helps fraud teams answer questions such as:
Did login or signup volume change unexpectedly?
Are failed logins or leaked credential matches increasing?
Which accounts show the highest login failure rates?
Are events concentrated in particular countries, ASNs, or times of day?
Did a sudden signup increase coincide with shared characteristics?
Which accounts may have been affected by the attack?
From there, fraud teams can determine the campaign’s scope, prioritize accounts for manual review, reconstruct what happened within those accounts, and decide how to respond.
AAP in Action: Investigating a credential stuffing attack
Consider a fraud prevention or security analyst team investigating unusual login activity. The team opens the Account Abuse Protection dashboard to determine how broadly a credential stuffing attack may have affected its users. The dashboard allows analysts to investigate from total event traffic all the way to individual accounts that warrant review. The individual account view provides the history and context needed to reconstruct what happened and determine the appropriate response.
1. Spot the anomaly. The investigation begins in the account population overview, where the fraud team determines whether suspicious activity is isolated or part of a broader campaign. An increase in failed login activity prompts the team to examine Leaked credential check results on login events.
In this example, a leaked credential summary shows that approximately 2.4K events produced a leaked username or password result, compared with 11.7K events where credentials were classified as clean. This pattern is an investigative lead, not confirmation that every affected account was compromised.
The team can now focus on accounts associated with leaked credential matches. Are multiple accounts connected to the same IP addresses or ASNs? Does an individual account suddenly appear across an unusually high number of IP addresses? These relationships help define the potential scope of the credential stuffing campaign and identify the accounts that should be prioritized for review. Analysts can also look at the dashboard for concentration across particular IP addresses, ASNs, locations, or devices.
2. Narrow the field of investigation. Filters help narrow the account population to specific accounts with the most concerning combination of signals and identify which ones warrant manual review. For example, filters can be set to look at accounts with at least three failed logins, at least three leaked credential matches, and observed from at least five unique IP addresses.
From this filtered cohort, analysts can select the specific Hashed User IDs, whose recent activity requires the most urgent attention.
3. Investigate an account. Analysts can review login attempts, identify new devices or locations, and reconstruct how activity unfolded. Using the event table, they can compare earlier clear events with later suspicious activity, pinpoint when the pattern began, and determine whether it was a single event or a series of repeated attempts. Each event includes a Ray ID that analysts can use to look up associated information in Security Events.
4. Decide how to respond. If review confirms that an account was compromised, analysts can begin their established recovery process. They can also use the Hashed User ID in a WAF rule to challenge or block future requests associated with it.
A closer look at an individual account
An individual account view provides another layer of depth for investigation. It summarizes the login and signup activity observed for that account, including its login success rate, leaked credential matches, and most frequently associated networks, locations, and devices. Analysts can then examine the individual events behind the account summary. Each event includes its timestamp, Ray ID, and any mitigation applied. A Cloudflare Ray ID is an identifier given to every request that goes through Cloudflare, that teams can use to look up associated information in Security Events.
This detailed summary and event log helps answer questions such as:
Was this a single login event or part of a series of repeated attempts?
Did that login introduce a new country, network, IP address, or device?
Did the user’s behavior change afterward?
What happened before and after a suspicious event?
Did concentrated login activity follow shortly after signup?
Did signup and subsequent login activity use different network or device characteristics?
Viewed together, these signals help fraud teams determine whether an account requires recovery, restricting access, or another response, depending on how the customer wants to treat these accounts. When there is enough evidence, analysts can use the Hashed User ID in a WAF rule to challenge or block future requests associated with that identifier.
Designed to minimize unnecessary data exposure
Account Abuse Protection provides account level context while also giving Cloudflare customers control over who can access account information. This launch introduces two new roles (i.e., access levels): Account Abuse Protection and Account Abuse Protection PII. The Account Abuse Protection role controls access to the dashboard, while the Account Abuse Protection PII role controls access to additional account-level PII (e.g., email) . We encourage Customer Administrators to assign these roles on a need-to-know basis, based on what each team member needs to investigate.
The Account Abuse Protection PII role is also required to create or update Logpush jobs containing PII. Separating these permissions helps customers apply least privilege access to both dashboard and data export workflows.
Take the next step in account protection today
The new dashboard is available first to Account Abuse Protection Early Access customers. Bot Management Enterprise customers interested in these capabilities can sign up for Early Access. Prospective Bot Management Enterprise customers can use the same form to contact our team.
Bot detections help customers understand whether activity is automated. Account Abuse Protection adds account level overview to help fraud teams investigate whether login and signup activity appears authentic and consistent with legitimate use. Together, these capabilities help website owners address automated and human-driven abuse across account creation and login.
Tracking how governments target dissidents living in exile. Helping people in crisis find mental health support. Advocating for legislation that protects free expression online. These are a few examples of how some of the world's leading organizations are building the future of non-profit work with Cloudflare.
AI is changing how people do their work. The goal of Cloudflare Impact is to help ensure that non-profit organizations are among the first to benefit. Today, we’re sharing what dozens of civil society organizations have built using our developer services with more than $7.5 million of Cloudflare credits. These stories show what is possible when AI applications are accessible, secure, and affordable to build and run.
From "keep us secure" to "help us build"
We believe a better Internet is one that allows people to express themselves online and access a diverse range of viewpoints. A key part of Cloudflare's mission has been making security services available for everyone and helping ensure that individuals and organizations working for the public interest are not forced offline by those more powerful. Today, Project Galileo, which provides free cybersecurity services to civil society organizations, protects more than 3,400 domains across more than 120 countries.
Through these partnerships, organizations have shared with us how their needs have evolved from not only wanting to secure existing applications, but wanting to build new ones. AI has allowed non-technical teams to design, build, and scale tools tailored specifically for their workstreams and to advance their mission.
This opportunity is arriving at a challenging moment for the sector. Many organizations report operating under financial strain after major reductions in government funding contributed to layoffs and closing of programs. As groups rebuild their work in a new environment, some have reported using AI to help do more with less. But adoption remains ad hoc. In a CIVICUS survey, more than half of civil society respondents viewed privacy concerns as a barrier to use. These groups hold sensitive data, like the location of activists or the identities of anonymous sources, and are disproportionately at risk of cyberattacks, according to our own Cloudflare data. Additionally, the cost of building and running complex automation workflows can be prohibitive. Among those surveyed by CIVICUS, 48% cited financial constraints limiting their adoption.
Cloudflare helps address these concerns. Our developer services incorporate security and privacy protections from the outset. By running on our global network, applications are automatically protected from distributed denial-of-service attacks and attempts to gain unauthorized access to internal systems. Civil society groups can also build and run applications more cost effectively. Our lightweight and serverless architecture scales with demand without requiring organizations to provision or pay for idle infrastructure. Workers AI also removes the need to operate dedicated GPU infrastructure, while AI Gateway provides rate limits, observability into how teams are using AI, and intelligent model routing to reduce unnecessary model calls and keep costs under control.
Awarding $7.5 million for the next generation of civil society work
During Birthday Week last year, we expanded Cloudflare for Startups to include non-profit and public interest organizations, providing each of them with up to $250,000 in credits for our developer services. We are proud to announce that we selected 30 organizations to participate in our first non-profit, startup cohort, and we have been thrilled to watch their ideas and tools designed to tackle problems in climate science, humanitarian aid, mental health, civic engagement, and education come to life.
Here is what a few of these non-profits have built.
LebTown — local news, rebuilt on automation:LebTown is an independent non-profit newsroom covering Lebanon County, Pennsylvania. Until this year, the editorial team ran its entire operation across two Google Docs, a Google Calendar, Discord, and Gmail. LebTown is replacing that with a custom-built editorial management system that follows stories from pitch to publication, tracks audience reach, and lets reporters log community impact directly from their app or via Discord. The team has also built tools that convert county real-estate transfer records from PDF exports into structured data, and a real-time copyeditor agent that integrates with LebTown's WordPress site.
Kaya Guides — scaling mental health support:Kaya Guides built a WhatsApp-based mental health application that pairs people experiencing depression in India with trained lay counselors, making support accessible without the cost or waitlists of traditional therapy. As of September 2026, the application has supported 10,439 people, with 2,325 currently enrolled. To keep pace with demand, the team migrated its care management system to Cloudflare and now processes around 500,000 WhatsApp messages a month. They built a live AI system that listens to counseling calls and gives counselors real-time feedback to keep sessions on track. According to Kaya, these tools have helped develop a program that is more consistent and self-correcting as it scales, without significant additional cost or complexity.
The Snorkelling Society — mapping the world’s snorkeling sites. The Snorkelling Society, is a UK non-profit building a web and mobile application for the global snorkeling community called SnorkelMap. This tool will help people discover new places to snorkel, explore information about different locations, and allow users to contribute their experiences. Because the application is built and maintained by volunteers, the Snorkeling Society uses Cloudflare to secure storage to allow for community contributions and uploaded images while also safeguarding against cyberattacks.
Working together to build automation tools for human rights
We also heard from larger civil society organizations who wanted to build complex workflows and welcomed extra engineering support. These projects included several variations of the same problem: large amounts of manually-collected, dispersed information that needed to be integrated, reviewed, and structured in order for effective analysis to be conducted. The data involved was also sensitive, like the names of human rights abuse victims, and the risk of unauthorized access, data leakage, or hallucinations in an output could have serious consequences.
Cloudflare not only provided free access to its developer service to support the development of each of these tools, but also assembled a team of volunteer engineers — product experts, front-end designers, back-end builders, and security advisors — to design and build them. Questions we’re exploring include where automation is helpful, which models align best with each task, how to incorporate the necessary security controls, and where a person must remain involved.
Freedom House — tracking transnational repression:Freedom House was founded in 1941 to advance democracy and freedom globally. They created and maintain the world's most comprehensive database of transnational repression incidents, which is when governments reach across borders to silence dissent among diaspora and exile communities. Manually identifying incidents and coding patterns of transnational repression — which involves looking at thousands of potential cases — is labor intensive and time consuming. To help automate this process, we are creating an interactive dashboard that can ingest, structure, and flag potential cases of transnational repression from public reporting. The tool is fine-tuned on the organization’s methodology to improve accuracy, with Freedom House involved in every step of the process. Given the sensitivity of the topic, security and data minimization have been priorities in every decision. Automating this initial stage in the research process can help staff focus on deeper analysis, producing reports, and working with policymakers to address transnational repression.
Prototype of Freedom House’s tool tracking transnational repression
Global Network Initiative — protecting free expression and privacy online: The Global Network Initiative (GNI) is a membership organization of civil society groups, academics, investors, and tech companies (including Cloudflare) working to advance free expression and privacy online. To do this, GNI tracks and responds to a rapidly evolving landscape of regulatory proposals, policy developments, and legal trends across dozens of jurisdictions, from online transparency requirements in the European Union to data localization mandates in the Asia Pacific region. We are building a dashboard that identifies these proposals and recommends opportunities for advocacy based on GNI’s mission and previous work. It surfaces, describes, and categorizes relevant news, calls for comment, and legislative activity. The tool also helps manage each opportunity by tracking the internal review process and alerting staff of upcoming deadlines.
Prototype of GNI’s dashboard that tracks the status of engagement opportunities
Article One — assessing human rights risk: Article One is a specialized strategy and management consultancy that advises companies on understanding and mitigating the human rights impacts of their policies, products, and operations. This involves reviewing and summarizing large amounts of documentation, from factory audits to country-context reports. We are working with Article One to build a risk assessment tool that processes and structures this information, identifies salient human rights risks, and generates draft recommendations that staff can review and refine. AI helps structure information, but Article One makes all judgments.
What’s next? Apply to join our second cohort
It’s incredible to see how civil society organizations are evolving their work in an era of AI. Cloudflare is excited to play a small role in this process. Working directly alongside these organizations not only helps advance their missions, but also helps inform how we think about the security and privacy in high-risk environments and how we can scale similar programs moving forward.
Our first non-profit startup cohort shows how automation can help the next generation of community service organizations use AI and automation to serve the public, and how they can do this securely and affordably.
We’re excited to announce that starting today we are officially opening our startup program to our second cohort of non-profit organizations.
If your organization is interested, apply here and select the non-profit checkbox. We’d love to build with you!
We launched Quick Tunnels in 2021 to give developers an easy way to share their latest service, application, or project running in their local development environment. A lot has changed since then, but the core use case remains the same.
Your coding agent has just finished the feature. The dev server is up on localhost:5173, and before you ask, the agent offers to let you try it on your phone. It runs one command and hands you a link:
That command starts a Quick Tunnel. cloudflared, Cloudflare's lightweight connector, publishes your local service at a random trycloudflare.com URL. No account, no domain, no cost. Agents now use Quick Tunnels for the same reason people do: they are the shortest path from a local port to a URL.
The catch has always been the same. Anyone with the link can open it.
Starting with cloudflared 2026.9.3, you can add --allowed-mail to the command, and your Quick Tunnel only lets in the email addresses and domains you choose. Visitors prove they own one of those addresses with a one-time PIN from Cloudflare Access. Nobody, on either side, needs a Cloudflare account.
Agents made Quick Tunnels more popular than ever
Agents that write code need somewhere to show you the result. Agents that live on a Mac mini at home need to be reachable from your phone. Model Context Protocol servers on a laptop need a public endpoint before a hosted assistant can call them. Each of these needs a URL, and a Quick Tunnel produces one from a single command an agent can run by itself. There is no signup form for it to get stuck on. Add --output json and every log line becomes a JSON object, so the agent can pick out the URL without scraping text.
Since agents took off, Cloudflare Tunnel and Quick Tunnels adoption has grown exponentially. On September 18, 2026, a link to the Quick Tunnels page climbed to the top of Hacker News and gathered more than 800 points and 300 comments. The thread reads like a catalog of agent workflows. One person's AI had found Quick Tunnels on its own to publish a site it had just built. Another called them "insanely helpful when doing agentic work on the go."
And one commenter asked this post answers: "how long until someone's agent sets up a tunnel for the world to see one's most sensitive, private and embarrassing information or insecure work-in-progress app?"
Control who can access your service
Pass an email address to --allowed-mail:
Alice opens the URL, enters her email address, types in the code sent to her inbox, and reaches your app. Anyone else is stopped before a single request reaches your machine. You still don't create a DNS record, write a configuration file, or open a dashboard.
To let in more people, repeat the flag or allow an entire domain:
If you leave out --allowed-mail, nothing changes. Public Quick Tunnels behave exactly as they always have.
To change who can get in, stop cloudflared and start a new tunnel. Access ends for everyone the moment the process exits.
For a stable hostname or richer rules, such as identity provider groups, use Cloudflare Tunnel with Cloudflare Access. To reach an agent at home from your own devices without any public URL and establish bidirectional connectivity, use Cloudflare Mesh.
Make it your agent's default
Because protection is a single flag, agents can use it as easily as people can. Add one line to the instructions file your coding agent reads, such as AGENTS.md:
From then on, the previews your agent shares should open only for you. Agents don't always follow instructions, so check what it ran: cloudflared prints whether a tunnel uses email authentication and how many rules it holds, without printing the addresses.
Start a protected tunnel from Wrangler
If you build on Workers, you can start the same kind of tunnel from the latest version of wrangler:
Wrangler supports repeated flags, comma-separated values, and wildcard domains, and it removes --allowed-mail values from its debug logs.
Cloudflare verifies the email. Your machine decides who gets in.
When someone opens a protected URL, they land on the Cloudflare Access sign-in page. They enter their email address, then the one-time PIN sent to that mailbox. Email sign-in is built for people using a browser.
That step answers one question only: does this person control this email address? It doesn't decide whether they're welcome. cloudflared makes that decision on your machine by comparing the verified address with the rules you typed.
Where does a policy live when there is no account?
Separating those two questions is the core of the design. Authentication proves who a visitor is. Authorization decides whether that visitor gets in. Every Cloudflare product that enforces access rules keeps the authorization half in the same place: your Cloudflare account. A Quick Tunnel doesn't have one. So the hard part was never sending someone a code. It was deciding where the guest list should live.
We started with four requirements. The design had to:
Keep Quick Tunnels accountless, because a signup step would defeat the point of a one-command tunnel.
Leave the request path for public Quick Tunnels untouched.
Avoid a central policy lookup on every request after a visitor signs in.
Protect the privacy of the email addresses developers type into their terminals.
Our first idea was to put a Cloudflare Access application in front of every Quick Tunnel hostname. Access already checks visitors before traffic reaches cloudflared, so reusing it looked like the shortest path. But hundreds of thousands of Quick Tunnels can be running at once, many for only a few minutes, and each would need its own application and policy. With no account to own them, we would have had to invent a new namespace and route applications dynamically, just to store a list that lives for an afternoon.
Our second idea was to build the whole flow. cloudflared would hold the rules, and a Tunnel service would send and check the codes. The authorization half of this idea was good: each connector checks its own list, which scales naturally and keeps the rules on the developer's machine. The authentication half was not. Sending a code is the easy part of email login. The hard parts are getting email delivered, stopping abuse, building secure challenges, managing sessions, and serving a sign-in page that is accessible and translated, then operating all of it safely for years. Cloudflare Access has already solved those problems.
So we kept the best half of each idea. Access verifies that the visitor controls the email address. A small authentication broker running on Cloudflare Workers turns that verified identity into a short-lived, signed handoff. The broker is stateless by design. It stores no tunnel policies, no visitor sessions, and no identity records, and it never sees a tunnel's guest list. cloudflared checks the handoff and makes the authorization decision itself, in memory, against the rules you typed.
The result is the property we cared about most: your guest list never leaves your machine. Cloudflare learns that a tunnel requires email authentication. It doesn't learn who you invited.
Following a request through a protected Quick Tunnel
A protected tunnel is created the same accountless way as a public one. The only extra thing cloudflared sends is the authentication mode, never your rules. If the service doesn't confirm that mode, cloudflared refuses to start rather than hand you a public URL by mistake.
The first time a visitor opens the URL:
cloudflared sees a request with no session. It redirects the browser to login.trycloudflare.com with a random, single-use state tied to that browser and valid for 10 minutes.
Cloudflare Access sends a one-time PIN to the visitor's email address and verifies it.
The broker checks the Access identity and returns a short-lived, signed assertion bound to the tunnel hostname and to that state. The browser delivers it in a form POST, so it never lands in a URL, browser history, or logs.
cloudflared verifies the assertion, uses up the state, and checks the email against your rules. On a match, it creates a local session and sends the visitor to the page they asked for. Otherwise, the visitor gets a generic response that reveals nothing about the list.
Later requests use that session for up to four hours (less if the visitor's Access sign-in expires sooner), or until you stop cloudflared. There is no central lookup and no policy service.
The session cookie holds a random value and an expiry time, and nothing about who the visitor is. cloudflared strips authentication credentials before forwarding requests, so your app never sees them and never has to implement a login flow. If any check fails, the request never reaches your local service. A protected tunnel never falls back to public mode.
Built by interns
Protected Quick Tunnels were shipped by two interns: Hugo Vicente on product and Alessandro Frigerio on engineering. They took it from the product requirements to the authentication broker to the cloudflared release. That's how internships work at Cloudflare: interns own real problems and deliver solutions to production.
Try it on your next demo
Email protection for Quick Tunnels is free, like Quick Tunnels themselves. Install or update cloudflared, start your local server, and add the --allowed-mail flag:
Today, we’re introducing Cloudflare Traces in open beta, extending automatic tracing beyond Workers to the rest of the request path. In one trace, you can see supported security rules, transformations, cache decisions, routing, Worker execution, and origin handling, then continue that trace through services running on Cloudflare, at your origin, or elsewhere in your stack. This is a long-term investment in OpenTelemetry and in making Cloudflare the most observable part of your stack.
Giving you the visibility we use to debug Cloudflare
When our own teams investigate, we use our own internal traces, which often include thousands of spans for a single trace, generated by dozens of services and features. This lets us dig deep into every detail of a given request. We don’t think that visibility should stop at our internal systems.
The goal of Cloudflare Traces is to bring the same level of visibility to everyone using Cloudflare, whether you’re building on Cloudflare or just have Cloudflare in front of an origin. You get to see how your traffic moved through our platform, and connect the dots between how you’ve configured Cloudflare, and how this influences request processing time, routing decisions, and more.
Follow one request end to end
A request’s path through Cloudflare can be complicated! It might pass through security rules, transformations, routing, caching, or proxied to another service entirely. Cloudflare Traces records each supported step as a span, including its timing, outcome, and relevant attributes. Instead of reconstructing the request from separate logs and configuration, you can see the request’s path through our system in one place.
You can answer questions like:
Why was the request blocked or challenged, and which security rule took action?
See when custom or managed rules evaluated the request, how long evaluation took, and the resulting action. Identify the rule responsible for a block or challenge through its span events.
Was the URL rewritten by a Transform Rule before it reached the application?
You can open the http_request_transform span to see each change, the request component it affected, and the rule responsible. You can also see where the transformation occurred relative to routing and origin handling.
Which Page Rules, Snippets, or Workers handled or changed the request?
The workers_routing span shows whether a route matched, which routing type was used, and the matching route pattern.
Was the response served from cache, and where was time spent between Cloudflare, the origin connection, and the application?
You can expand nested cache, upstream, and origin spans to see where the request spent its time. Here, you can see there was a cache miss that went to origin and spent 527ms of the 539ms getting a response.
Configure your tracing
There is no special instrumentation, config, or plugins required. Once tracing is enabled for a domain, Cloudflare generates these spans automatically. This lets you extend the trace through third-party services and back again by adhering to open standards. From there, you can control which requests are traced using a baseline sampling rate and Trace Rules.
Set a baseline sampling rate
You can enable tracing on any domain and set a baseline sampling rate to balance visibility, data volume, and cost. You might trace 1% of requests during normal operation, giving you a continuous view of request behavior without collecting a trace for every request.
Configure Trace Rules
Trace Rules let you keep a low baseline sampling rate while capturing complete traces for a specific investigation. If one customer reports a problem, you can trace 100% of traffic for their hostname, source IP, or identifying request header while leaving everyone else at 1%. Or during an investigation, you could trace 100% of requests carrying a temporary debug header, while leaving all other traffic at the baseline. This lets you reproduce an issue without increasing tracing across the entire domain.
Trace Rules use the same Cloudflare Rules language, so you can target paths, methods, headers, IP addresses, geographies, or combinations of those properties.
Accept and propagate trace context
One of the most common requests we hear is for true distributed tracing: a single trace that follows a request into Cloudflare, through our platform, and onward through the rest of your stack.
Cloudflare Traces can accept a W3C traceparent header from an incoming request, allowing Cloudflare spans to join a trace that began before the request reached our platform. An incoming propagation policy controls whether Cloudflare accepts that context.
Cloudflare can also forward a new traceparent header to your origin. Any other instrumented services can extract that context and continue the trace through APIs, databases, and services running on Cloudflare or elsewhere. To view everything as one connected trace, you can send both Cloudflare and application spans to the same OpenTelemetry-compatible backend.
Export traces to your observability platform
You can export Cloudflare spans over OTLP to a compatible observability platform, where they appear alongside telemetry from the rest of your stack. Configure an account-level destination, then choose which domains send traces to it. This is part of our commitment to OpenTelemetry: Cloudflare represents request activity as OpenTelemetry spans and delivers them using OTLP, keeping the data portable across observability tools.
Let your agent investigate Cloudflare Traces
When you ask a coding agent to debug a production issue, it might inspect your code and run tests, but it may not be able to see what happened to the request in production. With the Cloudflare Observability MCP server, your agent can leverage our SQL API to query your traces (and all of your observability data!), giving it access to your investigation production telemetry.
Let your agent find the right requests, comparing failed traces with successful ones, and identifying where their spans diverge. Since the agent can also inspect your repository, it can connect those findings to the relevant code, narrow down what needs to change, and help put up a fix for you to review.
Pricing
Cloudflare Traces will be a part of the unified Cloudflare Observability pricing model. Instead of charging by the number of spans/events, pricing is based on how much observability data you ingest and how long you retain it. New pricing will take effect across Cloudflare Tracing (and Workers Tracing!) starting December 1, 2026.
Plan
Included Usage
Retention
Additional Usage
Free
0.5 GB of ingestion per day
7 Days
Not available
Paid and Enterprise
50 GB of ingestion 10 GB-month of storage per billing cycle
Up to 1 year (coming soon)
$0.25 per GB ingested $0.10 per GB-month stored
What's next
Following the open beta, we plan to launch:
Broader automatic instrumentation: Add more spans across both the HTTP request path (e.g. DDoS rules, Access) and the Workers execution path (e.g. Workflows, Queues, Pipelines).
Authenticated context propagation: Let trusted callers continue an existing trace without accepting context from every incoming request.
Ad hoc tracing: Capture a specific request on demand without changing the baseline sampling rate.
Longer retention: Keep trace data available for up to 365 days for longer-running investigations.
Get started
Follow the Cloudflare Traces documentation to trace your first request and tune sampling with Trace Rules. Cloudflare Traces is available in open beta from the dashboard, through the API, or with Terraform, with support for exporting to an OTLP destination.
Cloudflare is now the fastest provider in 74% of the 1,000 largest networks around the world, up from 60% in April 2026. This huge improvement matters because every millisecond affects how quickly users can reach the applications, APIs, and websites they rely on. In this Birthday Week performance update, we’ll review how we get our measurements, introduce a new measurement methodology using Cloudflare Challenge Pages, and discuss where these improvements have had the biggest impact for customers.
Cloudflare is fastest in 74% of top networks
In August, Cloudflare was the fastest provider in 74% of top networks, up 14 percentage points from our last update during Agents Week in April. The figure below shows the countries where Cloudflare is the fastest provider.
We improved from 60% to 74% by becoming the fastest provider in an additional 150 networks out of that top 1,000, and there are 38 additional countries where Cloudflare now ranks as the fastest. We measure this by looking at the fastest provider for users on the networks serving the largest number of users in each country.
The graphic below shows countries where Cloudflare has become the fastest provider across those networks since April.
Here you see the number of additional networks on which Cloudflare is now the fastest.
How do we get these measurements?
Our analysis begins with the 1,000 largest networks in the world, ranked by estimated user population using data from APNIC. Because these networks cover users across a wide range of geographies and access environments, they give us a useful view into how people actually experience the Internet.
For each network, we evaluate performance using connection time: the amount of time required for a user’s device to complete a TCP handshake when requesting content. We use this because it maps closely to what people think of as a “fast” user experience. It reflects real-world factors such as distance, routing, and congestion, while still being specific enough for us to compare providers and identify where performance can improve.
To rank providers, we calculate the trimean of connection times. The trimean combines the 25th percentile, 50th percentile, and 75th percentile into a weighted average. Using this method helps reduce the influence of unusual outliers while still representing the range of experiences that most users see. You can read previous posts to learn more about why we chose this metric.
When someone reaches a Cloudflare-branded error page, their browser can run a small background measurement that fetches lightweight files from several providers, including Cloudflare, Amazon CloudFront, Google, Fastly, and Akamai. We then record how long each connection takes from that user’s browser, on that user’s network, at that moment. This gives us a picture of performance under real Internet conditions, not just in controlled test environments.
Since 2021, Cloudflare-branded error pages have provided a reliable source of real-user performance data, and they remain an important part of how we measure performance. But measurement gets better with scale. The more data we collect, and the more networks we observe, the more accurately we can understand how users experience the Internet. Since our last update, we have expanded our performance data collection by adding measurements using Cloudflare Challenge Pages.
Introducing performance benchmarking with Challenge Pages
If you're not already familiar, Cloudflare Challenge Pages are full-page screens that verify visitors before they reach a website. When a challenge is actioned — typically by a Web Application Firewall rule — the Challenge Page acts as a gate: it holds the request, evaluates the browser environment for automated signals, and only lets legitimate visitors through, usually with no interaction required. Challenge Pages are delivered by Cloudflare Turnstile, our privacy-preserving, risk-based challenge technology that runs directly in the visitor's browser.
Because Challenge Pages run across a broad set of websites and real-world network conditions, they present a novel way to collect performance measurements from the places where people actually use the Internet. If you want to add Challenge Pages to your own website, you can get started with the Cloudflare Challenge Pages documentation.
How does it work?
From an end user's perspective, Challenge Page-based measurement works much like our existing error-page measurements: it runs quietly in the browser and does not require the user to do anything extra. While the visitor is on a Challenge Page a small, non-interactive measurement runs in the background. It fetches lightweight files from a fixed set of endpoints, including Cloudflare, Amazon CloudFront, Google, Fastly, and Akamai, and records whether each request completed and how long it took.
While we care about measuring performance, we care even more about improving it. That includes making sure our measurements do not negatively affect the user experience. We designed the Challenge Page measurement to avoid adding noticeable latency for visitors, while preserving the privacy-focused properties that Turnstile brings to Challenge Pages and that make them different from traditional CAPTCHAs.
For now, we are running measurements on only a small fraction of eligible free Challenge Pages, in addition to continuing to collect data from Cloudflare-branded error pages. We will limit these measurements to free Challenge Pages and we will only increase the sampling rate if the additional data improves measurement quality and end-user performance remains unaffected.
Challenge Pages’ reach helps measurements scale
The main upgrade from the error-page method alone is reach. Cloudflare-branded error pages have given us high-quality measurements from a narrower set of use cases, while Challenge Pages let us collect similar measurements during everyday interactions, wherever a challenge is already being served. That means more measurements from more networks, without requiring users to take any additional action. By collecting measurements on Challenge Pages, we are dramatically increasing the volume of data we collect and improving the diversity of users, networks, and geographies we measure. From a data quality perspective, this takes an already informative dataset to the next level.
More measurement, more possibilities
Even though the initial results from Challenge Pages measurements are promising, we have even more ideas for how to improve the dataset. First, we want our measurements to describe the experience of as many users as possible. Because Challenge Pages runs across such a broad set of websites and visitors, it gives us measurements from networks well beyond the top 1,000 and far more samples within each one, especially as we increase our test volume. That breadth gives us more analytical options: we can explore views that a network-count ranking alone cannot support, such as weighting performance by the number of people who experience it, grouping results by country or worldwide instead of by network, and quantifying how much of total user traffic our measured networks represent.
Second, more measurements give us sharper resolution where the race is closest. In many networks, the top providers are separated by only a millisecond or two of trimean connection time such as Cloudflare at 50 ms and Fastly at 51 ms, which is a gap small enough that ordinary day-to-day variation can flip the ranking. As Challenge Pages add measurement volume, the confidence interval around each provider's trimean will narrow, letting us distinguish a genuine lead from statistical noise. The results we are sharing today are early, but as the dataset becomes larger, we expect future movement in these rankings to further reflect real changes in performance.
Improved measurements show Cloudflare as #1
This significant improvement coincides with the addition of our new measurement methodology described above. By increasing measurement volume, Cloudflare has more opportunities to compare performance against other top providers across a broader set of networks and user conditions. In practice, this gives us a clearer signal in networks where performance among top providers is very close.
For example, Cloudflare may have previously ranked second in some networks even though our trimean connection time was only 1 or 2 ms slower than the fastest provider. With more measurements, the results are less sensitive to outliers and day-to-day variation. That makes rankings more stable, especially in countries and networks where the fastest provider may have previously changed from one day to the next. As the dataset becomes larger and more representative, we get a more consistent view of which provider is actually fastest in each network.
Performance is a process
Improving performance is a continuous process, and so is improving how we measure it. This year’s results show meaningful progress: Cloudflare is now the fastest provider in 74% of the top networks we measure, and our new Challenge Pages-based methodology gives us a broader, more stable view of Internet performance around the world. We’ll keep using that data to find where we can be faster, validate the impact of our improvements, and make the Internet better for the customers and users who rely on Cloudflare every day.
Follow our blog for more performance updates as we continue to make the Internet faster.
This essay was written with Nathan E. Sanders, and originally appeared in The Guardian.
New campaign finance disclosure data shines a light on which US political campaigns are using AI tools and how much they are spending on them.
Candidates’, parties’ and committees’ spending reveals that AI is fast becoming an essential tool of politics. The candidates themselves are quiet about how they are using the technology in their own campaigns. It’s a sensitive issue that we have been tracking closely since we started writing our book, Rewiring Democracy, which examined how AI is beginning to influence politics. A September 2025 Pew survey of Americans found that more than 70% would think less of a candidate if they used AI to help write a speech.
Itemized expenditure disclosure data from the US Federal Election Commission, dating back to 2020, reveals at least $17m in disclosed spending on AI technology vendors across 523 federal candidates and campaigns. Data from four states, California, Colorado, Massachusetts and Washington, provides a more localized picture going back to 2022.
Beginning with the AI behemoths, at least 80 federal campaigns and committees have reported spending with OpenAI since 2024. The total spending is not huge: only about $50,000 reported, skewing slightly more Republican than Democratic. The Republican National Committee is the largest overall buyer, with nearly $10,000 in reported expenses. Top individual users include the campaigns of Republicans Mike Lawler, John Kennedy and Bill Cassidy, as well as the California Democrats Ro Khanna and Ted Lieu. Most of these expenses are listed as office expenses, subscriptions to ChatGPT for staff, or research tools, rather than as specific political services. The company’s policies prohibit some political uses of their ChatGPT tool.
OpenAI’s biggest competitor, Anthropic, has rapidly built a similar level of usage, but with a different split. At least 65 candidates or committees now report paying the Claude maker in 2026, up from essentially zero in previous years, with a nearly two-to-one Democrat-to-Republican ratio. However, the largest individual user is the campaign of Tom Cotton, a Republican senator from Arkansas, who reported more than $4,000 in spend on Anthropic software in his June filing. Other major users are the Montana independent Senate candidate Seth Bodnar and Jason Knapp, who lost a Democratic House primary in Virginia, and the Democratic Alaska Senate candidate Mary Peltola.
Candidates use either Claude or ChatGPT, rarely both, according to the disclosures. Only about 12% of campaigns or committees using either tool reported expenditures to both vendors. The Democratic lean of Anthropic usage may reflect the company’s alleged liberal skew and clashes with the Trump administration.
In contrast, Elon Musk’s xAI caters to Republican interests and, accordingly, its meager usage comes almost entirely from the political right. Just seven federal and two state-level candidates or committees have reported paying xAI, a total of about $5,000, the majority of which was spent by the presidential campaign of RFK Jr in 2024, but also includes Republicans Dave McCormick and Thomas Massie.
More dollars go to the vendors specializing in political campaign applications of AI. For years, AmplifAI, which provides automated text messaging, essentially a new iteration on robocalling technology, was a dominant target of spending, soaking up $4.7m in campaign spending in the 2022 cycle alone. It was used heavily by Democratic candidates including Mark Kelly, Joe Biden, Bernie Sanders and Adam Schiff. Spending on AmplifAI, now owned by the troubled media conglomerate Triller, seems to have tapered off in the years since 2022.
The new rising Democratic solution for AI-powered text messaging is Daisychain, which has so far garnered about $300,000 in reported candidate spend in the 2026 cycle—up from only about $50,000 reported in 2024. More than half of this year’s spending comes from the Senate campaign of Democrat Abdul El-Sayed in Michigan.
The closest equivalent on the Republican side has been Campaign Nucleus, associated with former Trump campaign manager Brad Parscale. The AI-powered voter engagement tool has attracted six-figure spending from the Republican National Committee, multiple PACs aligned with Donald Trump, and five-figure investments from Mike Johnson, Kari Lake and other candidates. It is displacing the legacy Republican-serving texting vendor Prompt.io, which has retained about $375,000 in 2026 spending to date, down from more than $500,000 in the 2022 cycle. But it continues to be used: the A More Affordable California PAC sponsored by Uber has single-handedly spent more than $1m on Prompt.io in 2026. The Republican Massachusetts gubernatorial nominee Michael Minogue has been a recurring customer, as has the failed Republican California gubernatorial candidate Ché Ahn and Republican-aligned Super PAC Neighbors for a Better Colorado.
At the state level
At the state level, the AI spending is smaller but growing fast. Across the four states studied, we found a total of at least $92,000 in spending confidently attributable to modern generative AI vendors since 2022. The spending is spread across at least 108 candidates and committees. The growth has been explosive; there has already been about 10 times the amount of state-level AI spending reported in 2026 as there was in all of 2024.
Much of the state spending mirrors federal patterns. Daisychain again has the highest overall spend, and OpenAI and Claude dominate among the general-purpose AI vendors. DonorAtlas—the AI-powered prospect research tool—sticks out for its usage in these states, sitting behind only Daisychain and OpenAI and buoyed up by nearly $4,000 in spending by the California Democratic party.
Even though it has dominated so much media conversation, few candidates seem to be reporting spending on AI tools designed specifically to create synthetic audio and video, also known as “deepfakes”. We found just six federal candidates or committees reporting spending on the popular AI audio generator tool from ElevenLabs, with total spending of about $1,400 led by independent candidate for Colorado’s sixth congressional district Samir Witta. The AI image generator service Midjourney has five reported federal campaign or committee users reporting about $1,600, led by Sholdon Daniels, the Republican primary runner-up in the Texas 30th district. Combined, those two firms had less than $100 in reported spend across the four states.
However, recent data from the Wesleyan Media Project shows that at least 164 political ads in this cycle have included AI-generated media, supported by at least $80m in ad spending. What this illustrates is that candidate and committee disclosure reports are just the tip of the iceberg. They don’t cover spending on AI by political consultants, media firms and other vendors hired by the campaigns or by PACs, or independent committees raising and spending money aimed at boosting candidates’ campaigns. Those entities aren’t required to disclose detailed expenditure reports, and are very likely where the bulk of campaign AI usage is happening.
Since a large fraction of all spending in the campaign cycle will happen in the final weeks leading to November, much remains to be seen about the totality of how campaigns will leverage AI and what impact its use will have on voters’ decisions.
От гараж за производство на царевични пръчици до електрически ролсройс – биографията на 53-годишния бизнесмен Илиян Филипов е приказка за успеха. Но краят ѝ с изстрел от упор между очите е криминале.
Убийството на Филипов извади наяве двете му биографии. В едната той е едър предприемач, собственик на една от най-големите транспортни компании (PIMK) и други бизнеси с близо 3000 наети, както и на футболния клуб „Ботев“ – Пловдив. В другата биография e съдружник в строителна фирма със заподозрения като негов убиец С.М., чието криминално досие съдържа присъди за убийство и грабеж и обвързаности с Христофор Аманатидис – Таки.
Убийството показа и двете му жени – съпругата му и друга, от която е очаквал дете. Разкри и близостта му с министъра на вътрешните работи Иван Демерджиев, който потвърди, че го познава – „като познат“, но отрече да му е бил адвокат. И вицепремиерът и министър на финансите Гълъб Донев отрече Филипов да e сред физическите дарители при създаването на „Прогресивна България“. Разбира се, напълно възможно е всичко това да е било извършвано и без да оставя документални следи. А собственикът на PIMK все пак беше начело на пловдивските бизнесмени при срещата с Румен Радев преди изборите на 19 април.
В България публичният разказ за забогатяването обикновено премълчава отношенията с властта. В биографиите на успелите няма място за онези, които са вземали решения в тяхна полза. Въпреки че зад много от големите богатства стоят приватизационни сделки и обществени поръчки, а нито едно от двете не може да се реализира без политически протекции.
Политическите убийства не се ограничават до убийства на политици. Техни жертви могат да бъдат и бизнесмени, когато отстраняването им е свързано с борба за власт, политически интереси или опит да се повлияе на определени политически процеси. Парите и зависимостите им ги превръщат в участници в политиката.
Самата близост с управляващите обаче не доказва политически мотив за убийството. Тя задължава разследването да провери и тази връзка – особено когато след смъртта се разкрива влияние, премълчавано приживе.
Кой и защо поръча убийствата на Илия Павлов, Емил Кюлев, Петър Христов, Алексей Петров? Различни години, различни бизнеси, различни политически връзки и все същата липса на убедителен публичен отговор. Убийствата прекъсват живота им, но оставят недосегаеми отношенията, чрез които са натрупали пари и влияние.
Неразкрито убийство – скрити зависимости
Банкерът Кюлев е показно екзекутиран през 2005 г. – застрелян е в джипа си BMW X5 на столичния булевард „България“. Президентът Георги Първанов определя престъплението като „показно убийство, което търси политически ефект“. Убитият беше негов икономически съветник.
Изборът на момента за неговото извършване е целенасочена провокация и посегателство не само срещу обществения ред в страната, но и срещу усилията за постигането на членството на България в ЕС.
А тогавашният премиер Станишев видя умисъл, тъй като било след публикуването на критичния доклад на Европейската комисия за борбата с организираната престъпност и корупцията в България.
Политическите отношения на Кюлев обаче поставят под съмнение и решимостта на властите да разкрият престъплението. В дипломатически доклади от края на 2005 г., публикувани от WikiLeaks, американският посланик Джон Байърли отчита, че шест седмици след убийството не са иззети ключови материали, включително компютърът на банкера, телефонни разпечатки и банкови данни. Посланикът изказва подозрение, че разследването се спъва от страх финансовите отношения на Кюлев да не доведат до неудобни разкрития за високопоставени политици, включително Първанов.
Така политическото измерение се оказва двойно: властта вижда в убийството удар срещу държавата, а наблюдатели допускат, че отношенията на убития с нея пречат на разследването. Неизяснени остават и поръчката за смъртта му, и зависимостите приживе.
Румъния – конфликти за пари и имоти
В съседна Румъния например също има убийства на бизнесмени, но сред проверените случаи от последното десетилетие не се откроява подобна поредица от жертви с национална значимост и тежест в политическите среди.
Предприемачът Адриан Крайнер умира след нападение при грабеж в дома му. Корнел Диаконеску е убит, а обвинението е срещу неговия син. Сорин Ангел загива при конфликт на празненство. Дори атентатът с бомба срещу Йоан Кришан, бивш тъст на депутат от Националлибералната партия, води до обвинение срещу дъщеря му и предполагаем мотив, свързан с наследството. Публично известните разследвания сочат грабежи, семейни и имуществени конфликти.
Няма такава поредица от убийства на представители на едрия капитал и в други държави от бившия социалистически блок. В Чехия през октомври 2023 г. е убит Пшемисъл Холмик – строителен предприемач и кмет на Мислинка. Първоначално се проверява дали престъплението е свързано с бизнеса му. Разследването стига до бившата му съпруга и парите от наследството. През 2025 г. апелативният съд потвърждава 20-годишните присъди за нея и нейния полубрат.
Политическото положение на жертвата не превръща автоматично убийството в политическо. Но разкритото престъпление позволява тази граница да бъде установена.
В България тя остава размита от неразкритите убийства и неизследваните докрай зависимости. Докато няма отговор кой е поръчал изстрелите и защо, политическите връзки на жертвите са основателен предмет на разследване. Не доказателство, което го замества.
От Кюлев до Филипов
При Алексей Петров бизнесът, службите и политиката се пресичаха пред очите на всички. Застрахователният предприемач беше и съветник в ДАНС, а по-рано и барета в Специализирания отряд за борба с тероризма. Шестнайсет дни след разстрела му през август 2023 г. политическите му контакти отново станаха новина. Лидерът на ГЕРБ Борисов призна, че Петров е посредничил при разговорите между ГЕРБ и „Продължаваме промяната“, за да има правителство. До днес така и не е ясно кой го уби и защо.
През януари 2014 г. Европейската комисия отчита слаб напредък в разследването на над 150 поръчкови убийства в България с едно съществено изключение – делото „Килърите“. По онова време групата вече беше осъдена на първа инстанция.
В следващите 12 години броят на поръчковите убийства се е увеличил. Убийства като тези на Петър Христов и Алексей Петров поставят същия въпрос: кой поръчва смъртта на влиятелни хора и защо държавата не може или не иска да стигне до отговора?
Сега прокуратурата сочи спор за пари като мотив за убийството на Илиян Филипов. Ако бъде доказан, той ще обясни самото убийство, но няма да обясни отношенията, които смъртта на Филипов освети – с осъждан съдружник и с представители на властта. А те заслужават проверка независимо от мотива за убийството.
Политическото измерение е и в отговора на институциите: дали ще проследят парите и влиянието, или ще спрат при извършителя?
Today, we’re announcing the public preview of AWS Well-Architected Agent, an AI-powered service that analyzes your AWS environment to deliver targeted, contextual recommendations for improving your applications’ cost, security, performance, and resilience. The AWS Well-Architected Agent analyzes your infrastructure, understands unique business goals, and delivers contextual recommendations with ready-to-implement fixes. It delivers context-aware optimization without relying on manual audits or generic checklists.
The agent evaluates your environment as an experienced cloud architect would. It automatically correlates utilization metrics, resource configurations, and application topology, and analyzes against Well-Architected best practices across 65+ AWS services. It generates recommendations aligned to your declared business goals, delivers implementation packages with every finding, and surfaces cross-pillar trade-offs making it simpler to remediate the findings.
Here are the three main features of this service:
Goal-aligned intelligence: AWS Well-Architected Agent replaces flat, undifferentiated findings with context-aware, prioritized recommendations. You declare your business objectives and share your application context. The agent automatically generates and prioritizes recommendations by impact and effort against those goals.
Three-level recommendations: AWS Well-Architected Agent provides individual resource findings with specific dollar impact (where applicable) and step-by-step remediation, consolidated findings across multiple resources scoped to your application, and broad architectural patterns and designs with Infrastructure as Code (IaC) code changes needed to align with Well-Architected best practices.
Optionality in remediation: You can choose your path on how you want to remediate with a complete implementation steps tailored to your environment: the console walk-throughs, updated IaC changes for architecture-level recommendations, and AWS Command Line Interface (AWS CLI) commands.
AWS Well-Architected Agent in action
To get started, create an agent profile to define the scope of what Well-Architected Agent can access and provide recommendations on, complete the IAM role setup to access resources, conduct architecture review, and remediate recommendations.
Create an agent profile
In the AWS Well-Architected console, choose Get started with Well-Architected Agent. You can define an agent profile that specifies which AWS accounts and applications to monitor, which optimization pillars to focus on, and the permissions required.
You can choose AWS accounts or AWS Regions to monitor and optimization pillars that matter most to your business. You can also set goals for each pillar: cost optimization, performance, resilience, and security.
To give access to the agent for your AWS environment, provision customer-managed IAM roles the agent uses to read resource configurations, utilization metrics, and application topology. To learn more, visit the IAM prerequisite for AWS Well-Architected Agent.
When you choose Get Started, the agent creates your agent profile. Resource and application recommendations will be generated within 24 hours after profile creation.
You can conduct an architecture review on pre-deployment workloads by uploading an IaC project in Terraform, AWS CloudFormation, or AWS Cloud Development Kit (CDK) to be analyzed. Choose Conduct architecture review in the dashboard, upload a.zip file containing IaC project or repository file, and select which Well-Architected lens to use for reviewing your infrastructure.
You can define your applications to add context which will enhance the relevancy and further contextualize recommendations. Choose Add application context in the dashboard, add your applications with AWS accounts, AWS Regions, AWS services, tags if you want to narrow the scope to specific resources, and the details of applications.
Review prioritized recommendations and start remediating
Now you can see generated prioritized recommendations generated by the agent across your resources and applications, selected pillars, ranked against your declared goals, with automation-ready remediation included.
When you choose the specific recommendation, you can see the details, insights into why the agent are suggesting the recommendation, impacts and trade-off, and recommended fixes across affected AWS resources.
Choose Start remediation to address recommended fixes. You can choose the console, updated IaC template, CLI commands to remediate by the resolution type. It provides detailed step-by-step instructions and you can roll out this instruction and verify the result.
When you choose Using updated IaC template, the agent provides the code changes needed to update your existing IaC templates such as the CDK function shown above which you can copy directly into your codebase.
You can also configure API access to integrate recommendations directly into your existing development and operations workflows. To interact with the agent programmatically, including calling APIs and searching documentation, try the AWS MCP Server and plugins with your preferred AI coding tool. To learn more, visit the AWS Well-Architected Agent documentation.
Things to know
Here are some things that you should know about the Well-Architected Agent.
Automation: You can receive recommendations with the exact IaC code changes needed to remediate, with risks identified by pillar, catching issues before they reach production. Recommendations are delivered through the console and API so you can act without context-switching. Recommendations are also updated periodically, so new recommendations are available for your team to track regularly.
Evaluation: Generative AI capabilities produce this recommendation, which may contain errors or incomplete information. You are responsible for evaluating the recommendation in your specific context and implementing appropriate oversight and safeguards. Learn more about AWS Responsible AI practices.
You can still use existing AWS Well-Architected Tool to manually evaluate your cloud architecture with user-defined lenses that measure your workload using your own best practices.
Join the preview
Access to the AWS Well-Architected Agent and its recommendations is available in US East (N. Virginia), US East (Ohio), and US West (Oregon). You can onboard workloads from any AWS commercial Region. AWS Well-Architected Agent is delivered by AWS Support and available to AWS customers with an AWS Support plan.
Give it a try today in the AWS Well-Architected console and send feedback through your usual AWS Support contacts.
На хората им се обича. Истината е насъщна. Хуморът е вид милосърдие. За 24-ти път в живота си гледам кино до пресита в баския град Сан Себастиан на един от най-старите европейски фестивали и се старая да изведа свързващи нишки и повтарящи се мотиви. Смърт на роднина, отбелязвам, поезия; приятелство; емпатия. И още: колко е скучна дълбоката замисленост в близък план. Или: моля ви, имайте мимика.
От 263 заглавия от 47 държави едва смогвам да избера 40: всички премиери от основния конкурс плюс 23 истории, представени за първи път другаде от януари насам и селектирани сега в разделите „Латинохоризонти“, „Перли от други фестивали“, „Нови режисьори“, „Отворено пространство“. Опитвам се да хвана настроението на света. И с изненада установявам, че през 2026-та фокусът редовно е върху семейството, а най-често споделената необходимост сякаш е от откровен разговор. Дали заради, или въпреки това (винаги може да се поспори доколко човешките ни потребности съвпадат с културните), тазгодишното издание е далеч по-удовлетворително от доста предходни.
От 18 до 27 септември Златната раковина си оспорваха 17 творби от 12 страни, от които само 5 – на режисьорки. Вярно, това е повече от една на 20 кандидати за Златния лъв на последната венецианска „Мостра“ например, но си остава знак за определени липси. (Да видим какво в този смисъл ще се промени от 2027-ма: след 15 добри години начело на фестивала директорът Хосе Луис Ребординос предава щафетата на своята заместничка и за първи път в 74-годишната си история най-важният испански филмов форум ще бъде оглавен от жена: родената в Сан Себастиан Маялен Белоки, доктор по кинознание.) Така или иначе,
в епицентъра на най-интересните екранни събития се оказаха изключително героини.
Кейт О’Флин, Марион Бейли и Алис Бейли Джонсън в „Любов и грижа“ / Режани Фария в бразилския филм „Висентина моли за извинение“
Жени поправят и проправят
При мен импровизацията има огромен дял в еволюцията на персонажите и на отношенията им: не че се отклонявам от сценария през импровизацията – сценарият ми произлиза от нея,
каза Майк Лий на журналистите след прожекцията на своя филм „Любов и грижа“(Tender loving care), който няколко дни по-късно получи именно наградата за сценарий, Златна раковина за най-добър филм и Сребърна раковина за главната роля на Кейт О’Флин (същата, която неотдавна спечели „Еми“ за сериала „Заливът на вдовицата“).
„Любов и грижа“ започва и завършва със свръхблизък план на лицето на възрастен мъж: камерата поставя чуждия човек право в личното ни пространство, там, където обикновено са най-скъпите ни, и ние, щем – не щем, го разпознаваме. И не спираме да разпознаваме като свое всичко до края… Две най-добри приятелки заживяват в една квартира и трябва да се справят не само с ежедневието си на социални работнички, но и с лош обрат в дома на родителите на едната. Налице са всички елементи за тежка драма и е възхитително как майсторски Лий и неговите съмишленици сглобяват от тях комичен разказ, който не бяга от страшното, не унижава героите си, не тероризира зрителите.
Човечността не е изчезнала, нищо че времената са трудни. Този филм не бива да се разбира като романтичен ескейпизъм: той говори за нещо много реално – съчувствието,
добави авторът на пресконференцията, на която се появи само във видеовръзка. И потвърди, че поради болест и съпътстващите я трудности това може да е последното му киноначинание. Нещо подобно обаче се чу и през 2024-та, покрай предишната му творба „Горчиви истини“, която – пределно напрегната и безнадеждна – щеше да е тъжен кариерен финал. Да се надяваме, че ни чакат още много любов и грижа от Майк Лий.
Елементите, от които е създаден „Висентина моли за извинение“ на бразилеца Габриел Мартинс (втора незаобиколима премиера от „Сан Себастиан 2026“), също са тези на тежката драма, а въздействието – също окриляващо. Докато Лий ползва за антидот на баналността и мъката огромни дози игривост, у Мартинс спасението идва чрез разнообразието: човешки поведения, ситуации, интериори и екстериори, които са пиршество за окото и за ума. Висентина е майката на шофьор, който – изглежда – нарочно е предизвикал катастрофа, за да отнеме живота си заедно с този на цял автобус непознати хора (сюжет, заимстван от злощастния случай с пилота на „Джърмануингс“ отпреди десетилетие и съпоставим в киното с този на „Трябва да поговорим за Кевин“). Жената усеща нужда да поеме отговорност и започва да се среща с близките на другите жертви, за да им поиска прошка.
Да, двата часа и половина може би идват в повече за способността на зрителите да съпреживяват интензивно и да, завършекът криволичи, но органичната игра на актьорите, дълбоко хуманната идея статистиката да бъде разглобена на личности плюс финото разбиране на автора за „социалния пърформанс“ (както нарече той липсата на прямо общуване по щекотливи теми) правят от „Висентина моли за извинение“ преживяване, което белязва.
Кадър от „Благодатта на земята“ на Ханс Петер Мулан
„Благодатта на земята“ на Ханс Петер Мулан започва с две ръце, които загребват пръст и сняг. В красива, но неприветлива пустош млад мъж, за чието минало и принадлежност няма да научим нищо, се мъчи да оцелее. Към опитите му се присъединява млада жена със „заешка уста“. Исак и Ингер започват да си помагат, да си допадат, да са заедно и всяка пречка да превръщат в стъпало. И нещата потръгват. Клетото им убежище в скалите прераства в колиба, а с годините – и в благоденстваща ферма. Двамата полудиви странници стават двойка и пълнят земята, и обладават я, и господаруват. Множат се притежанията им, децата, знанията. Но със знанията (и новостите, и отклоняването от привичките – все по почин на жената) расте и тъгата. Райската градина, която се е опитала да погуби Адам и Ева, се превръща в райска градина, чиято гибел те неволно отключват.
Дълбоко патриархалната постановка на тази 180-минутна екранизация по едноименния роман на нобелиста Кнут Хамсун, библейските препратки, романтичната (и подвеждаща) тяга към прединдустриалното общество – нищо от това не натежава в ущърб на великолепното произведение, което справедливо беше удостоено с награда за операторското майсторство на Оскар Далсбакен и със Сребърна раковина за главната роля на Аста Кама Аугюст (отличие, споделено с Кейт О’Флин от „Любов и грижа“).
Ани-Кристина Юсо в „Ледена земя“ на Аманда Кернел / Джулиан Мур в „Дебютът“ на Джеси Айзенбърг / Ю Аои в ролята на Сатоми от „В стаята на баща ми“
Сребърна раковина за режисура взе Аманда Кернел за „Ледена земя“ (оригиналното Garrat du váimmu означава нещо като „Сърцето ти плаче“, но бидейки копродукция между няколко северни страни и България, филмът вече си има определено българско заглавие). Саамско момиче наследява стадото елени на баща си и смело, но безуспешно се опитва да се докаже в изключително мъжката общност на еленовъдите. Историята на нейното поражение, което посвоему се оказва победа – сдържана, понятно изложена и увлекателна за гледане и слушане (с много ласкави близки планове и един вълнуващ йоик) – не е толкова предсказуема, колкото изглежда, че ще е. И макар да губи ритъма си във втората половина, оставя усещане за радост.
С кинодебют в официалната селекция участваше и 64-годишната японска писателка и кураторка Маха Харада. „В стаята на баща ми“ е екранизация по собствения ѝ разказ „Ненужен мъж“: пазителка в музей губи любимата си работа, обаче получава компенсация от съдбата – плик с ключ, адресиран до нея от вече покойния ѝ баща; среща с човек, който го е познавал по-добре от самата нея; признание за труда си от малословен колега. Съдържанието е толкова ефирно, че на моменти изглежда аморфно. Но докато свръхексплоатирани японски съставки (чаена церемония, сакура, дълбоко потисната емоционалност) се смесват с такива от Запада (Пучини, Белини, Ротко) и с малко самотни, изящни стихове, тук и там звънва по някоя наистина прочувствена струна.
В „Дебютът“ – друг кандидат за Златната раковина – Джеси Айзенбърг, който преди две години блесна с трагикомичния си филм „Истинска болка“, е вече не „само“ актьор, сценарист и режисьор, но и автор на музиката и текста на мюзикъла, около който се върти действието. Джулиан Мур е богата домакиня със закърняла личност, която се явява на прослушване за малка роля, а Пол Джамати – взискателен режисьор на любителски представления в Ню Йорк. Бъбривата хумореска е съвсем предвидима и без принос към растящото множество от филми, занимаващи се с терапевтичната сила на театъра (Ghostlight е последното попадение по темата, което ми е известно), а Мур сериозно преиграва.
И все пак авторът е безспорен талант. И – нещо, което едва ли ще си проличи точно в „Дебютът“, но за което държа да изразя уважение – алтруист. В края на миналата година Джеси Айзенбърг (току-що отказал да играе Марк Цукърбърг от морални съображения) дари бъбрек на непознат. Каква е връзката с творчеството му ли? Всякаква.
„Още пет минути“: Белен Куеста, Хавиер Камара и Берто Ромеро / Сцена от „Лошият баща“ с Едуард Фернандес в централната роля / Мерсѐдес Мора̀н в „Тъжните ми мъртъвци“, реж. Пабло Лараин
Колективни лудости
Два силни испански филма за дисфункционални семейства направиха фурор в конкурса – „Още пет минути“ на Хавиер Руис Калдера и „Лошият баща“ на Роберто Буесо. За първия Хавиер Камара (санитарят от „Говори с нея“) беше награден със Сребърна раковина (в Сан Себастиан няма „мъжки“ и „женски“ отличия, а само за главна и поддържаща роля, както е в случая), а вторият, колкото и да заслужаваше, не беше зачетен от журито.
„Още пет минути“ по сценарий на прочутия комик Берто Ромеро, който изпълнява и една от централните роли, е от научнофантастичния поджанр „циклично връщане във времето“ (вж. „Денят на мармота“). С тази разлика, че тук прескоците назад са само с по пет минути, всички действащи лица (двама скарани съпрузи, пристигнали във вила за уикенда, и служителят на агенцията, от която я наемат) ги осъзнават и все по-агресивно се опитват да се избавят от този „затвор от време“…
„Лошият баща“ – също комедия, също във вила – се придържа към реалността, но я обогатява с ексцентричност и пъстри отровни стрели между неспирно спорещите герои: четири отдавна пораснали деца на известен писател на прага на смъртта („Едуард Фернандес е лъв!“, съм си записала в тъмното), няколко съпрузи и съпруги от същия кръг, бохемите от антуража на бащата…
„Тъжните ми мъртъвци“ на чилиеца Пабло Лараѝн по разкази на аржентинската писателка Мариана Енрикес беше от най-чаканите на фестивала. Минисериалът на ужасите (4 епизода по 45 минути за „Нетфликс“, прожектирани в Сан Себастиан в трудносмилаема тричасова форма) смесва остро социално и свръхестествено и е колкото интригуващ, толкова и отблъскващ в хрумванията си. От дете 70-годишната Ема чува и вижда мъртвите, не се плаши от тях, утешава ги, та около нея е постоянен писък и гмеж от неотпътували души, търсещи внимание. Това, заснето в болнавия колорит на Рой Андершон и пропито с делничното насилие на буеносайреските панелни квартали, е донякъде туширано от чувството за хумор на Ема и от чудните актьорски изпълнения, но решително не е за всеки вкус.
Лали Еспо̀сито в „Глаксо“ на Бенхамин Наищат / кадър от „Граница“ на А Бяо (награда на журито) / кадър с Вики Луенго от „Светци“ на Микел Гореа
Пак в Аржентина, но в совалка между 50-те до 80-те години, се развива „Глаксо“ на Бенхамин Наищат – романова адаптация за приятелство и предателство на фона на две военни диктатури. Филмът е с твърде много персонажи (и разказвачи), които нямаме време да доопознаем, и макар да е направен с голяма вещина и да държи интереса до края, не пуска корен в ума и сърцето. „Светци“ на Микел Гуреа е друга история от конкурса, която се гледа с любопитство и голяма доза наслада (всеотдайната Вики Луенго в главната роля на хулиганка от периферията; гледките от нощните обири на църкви, в които се замесва героинята ѝ; джазовият саундтрак!), но също не смогва да се досвърже със зрителя – ритъмът и пренавитият патос не успяват да вкарат хармония в хаотичната тъкан и по-скоро отчуждават.
Само няколко филма от състезателната програма тази година бяха откровено разочарование. Но дори и сред тях два бяха способни да не изгубят симпатиите на публиката до финала: „Духове“ на Фатих Акин (дълго черно-бяло упражнение по кичозна сантименталност, в която двама красиви млади актьори разиграват съдбовно предопределена любов между живо момче и мъртво момиче) и „Клетниците“ на Фред Кавайе (превърнал романа на Юго в тричасов костюмиран екшън с гърмяща холивудска музика от ада… и все пак – какви вълнуващи Фантин, Епонин и Жавер!).
Журито на Айра Сакс направи необяснимо салтомортале в логиката си и присъди своята специална награда на най-слабия филм в тазгодишната сансебастианска подборка – „Граница“, мъчителен дебют на А Бяо. Неми хора с каменни лица, сивкави околности, убоги интериори, монголска проститутка, китайски миньори, сексуални сцени, поднесени патологоанатомично, невидими мотиви, чувства, цели…
Но за да не завършваме на тази необяснима нота, ще се върна към „Благодатта на земята“ и финалната му реплика – не примирена констатация, както може да прозвучи, а обещание за бъдеще:
Никой не е какъвто би трябвало да бъде.
Идната седмица – за разследването „Наза“ (не го пропускайте на 5 октомври от 18:30 часа в Дома на киното – единствена прожекция в рамките на „София ДокуМентал“), за „Обувките на баща ми“ на Христо Симеонов, за триумфите на „Черната топка“, за новото от Мартин Макдона и други находки в програмата на „Сан Себастиан“ 2026.
If you run large consumer groups on Apache Kafka and Amazon Managed Streaming for Apache Kafka (Amazon MSK), you’ve likely experienced the pain of slow rebalances: processing stalls across all consumers, “rebalance storms” triggered by routine scaling events, and prolonged recovery times that impact downstream applications. With the classic rebalance protocol, even a single consumer joining or leaving the group forces a global synchronization barrier, pausing every consumer regardless of whether its partition assignments changed.
The KIP-848 consumer protocol, introduced in Apache Kafka 4.0, fundamentally redesigns how consumer group rebalancing works. Also referred to as “the Next Generation Consumer Rebalance Protocol”, KIP-848 shifts coordination logic from the client to the broker-side group coordinator. This supports fully incremental, server-driven rebalancing that significantly improves performance for large consumer groups. You can use the consumer protocol on Amazon MSK on all 4.x Apache Kafka versions on both MSK Standard and Express brokers.
In this post, we explain how the consumer protocol works, how to enable it on Amazon MSK, and how to diagnose and resolve slow rebalancing issues to help improve performance.
The classic protocol compared to the consumer protocol
The classic protocol relied on client-side rebalance logic with a global synchronization barrier. Every rebalance caused all consumers in the group to pause processing simultaneously regardless of whether their partition assignments were changing. This led to “rebalance storms” in large consumer groups where cascading rebalances could take minutes to resolve. The CooperativeStickyAssignor is a client-side partition assignment strategy that supports incremental, cooperative rebalancing. It significantly improves rebalance performance and minimizes disruption to groups during rebalance events. However, it still suffers from bottlenecks as consumer group size and partition count increase. For large workloads, client-side rebalancing behavior can result in longer rebalancing times and require significant client tuning and monitoring during rebalances.
The consumer protocol addresses these limitations by moving all rebalancing logic to the server. The broker handles coordination using a continuous heartbeat mechanism and server-driven reconciliation process. Only affected partitions move during a rebalance, and consumers with unchanged assignments continue processing uninterrupted. This results in faster recovery compared to the classic protocol, and improved scalability as workloads grow.
The following table compares the classic and next generation protocols across key dimensions.
Aspect
Classic Protocol
Next Generation Protocol (KIP-848)
Rebalance logic
Client-side
Fully server-driven
Consumer impact
Depends on assignor, all consumers pause, or rebalance is limited by group size
Only affected consumers impacted, scales effectively as groups grow
Mechanism
Client-side algorithm and cross-group coordination
Incremental, async reconciliation
Commit processing
Paused during rebalance
Able to progress during rebalance
Scalability
Complex, fragile at scale
Resilient, broker-driven
Rebalance storms
Common in large groups
Eliminated
Server-side configuration
With the consumer protocol, key parameters are now configured on the server rather than the client:
group.consumer.heartbeat.interval.ms – Controls the consumer heartbeat interval (server-side).
group.consumer.session.timeout.ms – Controls the session timeout (server-side).
group.consumer.assignors – Specifies available assignors (uniform and range by default).
In Amazon MSK Express brokers, these configurations are read-only and cannot be modified. In Amazon MSK Standard brokers, these configurations are managed with broker configurations. To update these configurations in Amazon MSK Standard brokers, refer to Update the configuration of an Amazon MSK cluster.
When to use the consumer protocol
The consumer protocol provides the most benefit to workloads with the following requirements:
Large consumer groups: Groups with many consumers and partitions see the most significant improvements because of the elimination of global synchronization barriers.
High-availability applications: Applications that cannot afford processing interruptions benefit from continuous message processing during rebalances. Financial services, real-time analytics, and fraud detection systems are ideal candidates.
Frequently rebalancing environments: Automatic scaling deployments, Kubernetes with frequent pod restarts, or continuous integration and continuous delivery (CI/CD) environments experience significantly less disruption.
Dynamic partition scaling: Workloads that regularly add partitions or topics benefit from the incremental, server-driven approach.
Prerequisites
Before you begin, make sure that you have the following:
An Amazon MSK cluster running Apache Kafka version 4.0 or later (both MSK Standard and Express brokers are supported).
A Kafka client library that supports the KIP-848 consumer protocol (see Step 4 for supported versions).
Basic familiarity with Apache Kafka consumer groups and partition assignment.
An AWS account with appropriate permissions to manage your MSK cluster.
Enabling the consumer protocol on Amazon MSK
The following steps walk you through verifying your cluster version, configuring your consumer client, removing deprecated configurations, and confirming client library support.
Step 1: Verify cluster version
The consumer protocol requires Apache Kafka 4.0 or later. To use the consumer protocol on Amazon MSK, verify that your cluster is running Apache Kafka version 4.0.x or later. You can verify your cluster’s Apache Kafka version using the AWS Management Console, AWS Command Line Interface (AWS CLI), or AWS SDKs:
If your cluster is running Apache Kafka 4.0.x or later, the consumer protocol is automatically enabled on the server and ready to use. No additional server-side feature flag verification is needed.
Step 2: Configure consumer client
Set group.protocol=consumer in your consumer configuration. The protocol is not enabled by default:
# confluent-kafka-python example
config = {
    'bootstrap.servers': bootstrap_servers,
    'group.id': group_id,
    'group.protocol': 'consumer',  # Required — defaults to 'classic' if omitted
    'auto.offset.reset': 'earliest'
}
The consumer protocol can be changed in-place for existing consumer groups. When you update the group.protocol, perform a rolling restart of your consumers. The broker-side group coordinator automatically handles the upgrade to the consumer protocol and handles classic protocol requests from old clients alongside the upgraded clients.
Step 3: Remove deprecated client configurations
When the consumer protocol is enabled, the following client-side configurations are no longer supported because they are controlled by the brokers:
heartbeat.interval.ms.
session.timeout.ms.
partition.assignment.strategy.
Step 4: Verify client library support
Verify that your Kafka client version supports the consumer protocol:
Java clients: Generally available (GA) in Apache Kafka 4.0+.
confluent-kafka-python: Version 2.12.0+ (GA support for KIP-848). See the release notes.
librdkafka-based clients (Go, .NET, C/C++): Based on librdkafka 2.12.0+.
Note: For other Kafka client libraries, verify your client library’s documentation for group.protocol=consumer support before enabling the next generation protocol. If your client doesn’t support KIP-848, it will continue to use the classic protocol.
Diagnosing slow consumer group rebalancing with the consumer protocol
Even after enabling the consumer protocol, you may encounter situations where consumer group rebalancing takes longer than expected. The following sections help you diagnose and resolve these issues.
Common symptoms
Consumer group rebalancing takes longer than expected despite setting group.protocol=consumer.
Consumers pause processing during rebalances.
Broker logs show “member session expired” or “fenced” messages.
Frequent rebalances triggered during rolling deployments or pod restarts.
Step 1: Confirm the consumer protocol is active using broker logs
Before troubleshooting performance, verify which protocol your consumers are actually using. Check broker logs in Amazon CloudWatch Logs Insights. The log patterns differ significantly between protocols.
Consumer protocol expected logs:
Key indicators: “consumer protocol”, “epoch” terminology, “target assignment” with server-side assignor, “fenced” for member removal.
[GroupCoordinator id=X] [GroupId <group-id>] Member <member-id> joins the consumer group using the consumer protocol.
[GroupCoordinator id=X] [GroupId <group-id>] Bumped group epoch to 309 with metadata hash 4064309670987706693.
[GroupCoordinator id=X] [GroupId <group-id>] Computed a new target assignment for epoch 309 with 'uniform' assignor in 0ms.
[GroupCoordinator id=X] [GroupId <group-id>] Member <member-id> fenced from the group because the member session expired.
Classic protocol expected logs:
Key indicators: “PreparingRebalance” state, “old generation” terminology, “Assignment received from leader”.
If you see classic protocol logs, the consumer protocol is not active. Proceed to Step 2 to troubleshoot why.
[GroupCoordinator id=X] Preparing to rebalance group <group-id> in state PreparingRebalance with old generation X
[GroupCoordinator id=X] Stabilized group <group-id> with X members
[GroupCoordinator id=X] Assignment received from leader for group <group-id>
Step 2: Troubleshoot why the consumer protocol is not active
Verify that your client configuration, client library versions, and cluster versions support the consumer protocol, as described in the preceding Step 1 through Step 4.
Step 3: Resolve slow rebalancing when KIP-848 is active
After you verify the consumer protocol is active but rebalancing is still slow, investigate the following causes:
A. Consumer session timeout causing premature member removal
With the consumer protocol, session timeout is server-controlled through group.consumer.session.timeout.ms (default: 45 seconds). The diagnostic path depends on whether you are using static group membership. The following table outlines the diagnostic path and recommended actions for each scenario.
Scenario
Symptom
Root cause
Recommended action
With static group membership (group.instance.id configured)
Slow rebalancing when a static member terminates without calling consumer.close()
The coordinator waits for the full session timeout before reassigning partitions. This is the most common cause of slow rebalancing in containerized environments.
MSK Standard: Implement graceful shutdown to trigger an immediate leave-group request, or increase the session timeout: group.consumer.session.timeout.ms=60000 (default is 45000). MSK Express: This configuration is not editable in Amazon MSK Express clusters. For Amazon MSK Express, optimize your client’s cold starts to allow members to restart within the 45 second consumer session timeout.
Without static group membership
Session timeouts expiring during normal operations
Your consumer is freezing or becoming unresponsive, which prevents heartbeats from reaching the coordinator.
Investigate long-running message processing, garbage collection pauses, network connectivity issues, or resource exhaustion on the consumer host. Look for this in broker logs:
[GroupCoordinator id=X] [GroupId <group-id>] Member <member-id> has timed out
B. Missing graceful shutdown handling
When consumers terminate without calling consumer.close(), the coordinator waits for the full session timeout before removing the member. This is the most common cause of slow rebalancing in containerized environments.
Resolution: Implement proper SIGTERM handling to trigger an immediate leave-group:
import signal
import sys
from confluent_kafka import Consumer

class GracefulKafkaConsumer:
    def __init__(self, config):
        self.running = True
        self.consumer = Consumer(config)
        signal.signal(signal.SIGTERM, self.shutdown_handler)
        signal.signal(signal.SIGINT, self.shutdown_handler)

    def shutdown_handler(self, signum, frame):
        print(f"Received signal {signum}, initiating graceful shutdown...")
        self.running = False

    def consume_loop(self):
        self.consumer.subscribe(['your-topic'])
        while self.running:
            msg = self.consumer.poll(timeout=1.0)
            if msg is None:
                continue
            # Process message

        print("Closing consumer gracefully...")
        self.consumer.close()  # Sends LeaveGroup — triggers immediate rebalance
        sys.exit(0)
For Kubernetes, verify that terminationGracePeriodSeconds allows time for consumer.close() to complete:
Short restarts within the session timeout don’t trigger rebalances.
The consumer rejoins with the same partition assignment.
Scaling up (adding new consumers) still works. New group.instance.id values trigger assignment of unassigned partitions only.
Monitoring and validation
After applying changes, confirm the improvement:
Check broker logs: Confirm that “member session expired” messages no longer appear during normal operations or deployments.
Monitor consumer lag: Use the SumOffsetLag and EstimatedMaxTimeLagAmazon CloudWatch metrics to verify that lag returns to zero quickly after a rebalance.
Describe consumer group: Use kafka-consumer-groups.sh --describe to verify that all members are active and stable.
Conclusion
After implementing the consumer protocol, you should observe the following behavior for consumer group rebalances:
Consistently faster rebalance times compared to the classic protocol.
Fewer session timeout-related rebalances.
More stable consumer group membership.
Smooth scaling operations without disrupting existing consumers.
Fewer unnecessary rebalances during consumer restarts when using static membership.
Clean consumer departures without waiting for timeout expiration when using graceful shutdown.
To get started, try the consumer protocol in your non-production workloads and observe the rebalance improvements as you scale your workload up and down.
To learn more about Amazon MSK and the consumer rebalance protocol, see the following resources:
To provide the best experiences, we use technologies like cookies to store and/or access device information. Consenting to these technologies will allow us to process data such as browsing behavior or unique IDs on this site. Not consenting or withdrawing consent, may adversely affect certain features and functions.
Functional
Always active
The technical storage or access is strictly necessary for the legitimate purpose of enabling the use of a specific service explicitly requested by the subscriber or user, or for the sole purpose of carrying out the transmission of a communication over an electronic communications network.
Preferences
The technical storage or access is necessary for the legitimate purpose of storing preferences that are not requested by the subscriber or user.
Statistics
The technical storage or access that is used exclusively for statistical purposes.The technical storage or access that is used exclusively for anonymous statistical purposes. Without a subpoena, voluntary compliance on the part of your Internet Service Provider, or additional records from a third party, information stored or retrieved for this purpose alone cannot usually be used to identify you.
Marketing
The technical storage or access is required to create user profiles to send advertising, or to track the user on a website or across several websites for similar marketing purposes.