Post Syndicated from Techmoan original https://www.youtube.com/watch?v=KAOS1Y0DY6g
Седмицата (28 септември – 3 октомври)
Post Syndicated from Светла Енчева original https://www.toest.bg/sedmitsata-28-septemvri-3-oktomvri/

Имате ли понякога чувството, че живеете във филм? За себе си ще призная, че не мога да се отърва от усещането, че съм в някакво пародийно риалити.
Радев ни плаши, че ако не слушаме Русия, тя ще ни пусне атомна бомба, а Русия го хвали за това.
Правителството предлага закон, с който да превърне почти всички в нарушители (дори на мен ми се намира вкъщи домашна ракия, макар да не пия алкохол), а после успокоява народа, че няма да следи за спазването му.
НАТФИЗ, където от месеци не стихват студентските протести, отстранява студенти заради двойки, които те са поправили, но пропуска да ги уведоми, така че студентите надлежно си плащат таксите.
„Да, България“ предлага български аналог на инициативата на американския президент Trump Accounts. Тоест държавата да задели по 1000 евро за всяко новородено дете, средствата да се инвестират във фондове с висока доходност и след 60 години вложените средства да са се преумножили многократно. Тънкият момент е, че това не е гарантирано. Ако беше толкова лесно парите на всички да стават все повече пари, щеше да настане такъв живот, че само си викам „дано“, както се пее в песента.
(Кандидат-)президентката Илияна Йотова брани кирилицата от неизвестно кого. Но интервю с Петър Стоянов отпреди близо три години хвърля светлина върху генезиса на фалшивата новина, че азбуката ни е под заплаха. Откъсът започва в 12:01 и продължава по-малко от 3 минути:
Ако днес ви се пътува до София, ето как може да го направите без пари – отивате на гарата и казвате, че искате да посрещнете тленните останки на цар Самуил. И после се прибирате – пак с влака – в рамките на същия ден. Но трябва да побързате, защото церемонията започва в 12:30. Ех, няма ли достойни за поклонение кости, заради които БДЖ да осигури безплатни пътувания например до Русе?
Други тленни останки, които съвсем доскоро са били живо тяло, са обект не на поклонение, а на разследване. Убийството на Илиян Филипов имам предвид, за което МВР много побърза да посочи извършител и да каже, че мотивът е личен и финансов – да не помислите, че е политически. На тази тема е статията на Емилия Милчева „Политическата биография на един разстрел“, която биография според Емилия всъщност е две биографии. Не само заради двете жени. А отношенията между забогатяването и властта в България традиционно се премълчават в публичния разказ. Пък аз се чудя защо смъртността чрез убийство сред футболните шефове в Пловдив е толкова висока – от 1995 г. насам Филипов е седмият случай.
Политическата биография на един разстрел
Убийството на Илиян Филипов тепърва ще бъде разследвано, анализирано и обличано във версии. Но то вече ни напомня за една особеност на нашата действителност: показните разстрели на влиятелни бизнесмени често остават неразкрити заедно с мрежите около тях. Коментар на Емилия Милчева.
Ала докато естественият ми интелект – с присъщата си ограниченост – си задава подобни въпроси, всички са се вторачили в изкуствения. Потенциалът му е по-могъщ, отколкото на хибридните заплахи, твърди Искрен Иванов в статията си „Изкуственият интелект и новата Студена война. Ще спрат ли САЩ Китай?“
Изкуственият интелект и новата Студена война. Ще спрат ли САЩ Китай?
Изкуственият интелект се превръща в новото поле на глобално съперничество, в което САЩ и Китай търсят технологично надмощие без пряк военен сблъсък. Искрен Иванов разглежда рисковете от тази надпревара – не само за световния ред, но и за демокрацията, свободата и контрола върху самите технологии.
Китай е герой и на публикацията на Александър Малинов „Сърбия – първият китайски плацдарм в Европа“. През последните няколко години голямата азиатска държава прогресивно засилва влиянието си в западната ни съседка. Включително и на военно равнище, колкото и притеснително да звучи това. Така Сърбия все повече се отдалечава от Европа и заприличва на Китай, където всеки е следен, а лични данни на практика няма.
Сърбия – първият китайски плацдарм в Европа
Все по-трудно става връзката на Сърбия с Китай да се сведе до инвестиции и дипломация. Оръжията, технологиите и инфраструктурата очертават много по-сериозно партньорство, чиито последици вече засягат не само Белград. От Александър Малинов.
Това ми напомня колко съм благодарна, че сме в ЕС, където личните данни се уважават и няма смъртно наказание. Тези дни непрекъснато мисля за неуспешната екзекуция на Криста Пайк – жената, оцеляла на 30 септември след две инжекции, всяка от които би трябвало да е смъртоносна. Сега е в болница и лекарите се борят за живота ѝ, който съдът преди повече от 30 години е решил, че трябва да бъде отнет. Защото Криста Пайк е убила своя съученичка, когато е била още непълнолетна. И нито възрастта ѝ, нито фактът, че е била подлагана многократно на физическо и сексуално насилие, нито диагностицираните психически увреждания на момичето са допринесли за смекчаване на присъдата.
Питам се какво ли им е на палачите на Криста Пайк, неуспели да изпълнят задачата си. Как държавите, в които се прилага смъртното наказание, назначават служители, чиято работа е да убиват. И изобщо – какво е да си палач, как се прибираш у дома при семейството си, когато си екзекутирал някого. В такива моменти ми се приисква за пореден път да гледам „Балът на чудовището“.
Но и в България има много хора, които са убедени, че други хора са чудовища и не заслужават да живеят. Това си мислех, докато четях книгата на Ален Симеонов „Училище за лов на педофили“. От нея прозрях, че не е нужно човек да е крайнодесен, фен на Хитлер или на Путин или пък хомофоб, за да оправдава саморазправата. В момента, в който обявим някой човек за нечовек, за изрод, се превръщаме в Ален Симеонов. Границата е плашещо тънка.
Училище за радикализация под носа на държавата
„Училище за ловци на педофили“ уж учи как да се ловят „лошите“. Всъщност показва как саморазправата се превръща в кауза, дехуманизацията – в метод, а радикализацията – в гражданска активност. Светла Енчева чете книгата на Ален Симеонов след убийството на Георги Кузев и пита докъде води този „лов“.
За вас не знам, но след размислите за екзекуции, линчове и дехуманизация просто имам нужда от малко нежност. И ето – идва спасението с човешко лице, поразително приличащо на Нева Мичева. Може би защото наистина е Нева, която и тази година ни разказва в поредица от статии за кинофестивала в Сан Себастиан. „Нежността се завръща на екрана“, се казва още в заглавието. „На хората им се обича. Истината е насъщна. Хуморът е вид милосърдие“, започва текстът и продължава все така топло и нежно. Благодаря ти, Нева.
„Сан Себастиан 2026“. Нежността се завръща на екрана
Традиция е в началото на есента Нева Мичева да ни пише с киноновини от Сан Себастиан. В това първо за сезона нейно писмо четем какви са впечатленията ѝ от основната състезателна програма и наградените със Златна и Сребърни раковини.
Нежността в съвременния свят обаче е екзистенциална позиция, не опит за бягство в удобството. Това ни води към разговора на Антония Апостолова с ирландския писател Колъм Тойбин, според когото белетристиката трябва да бъде „без уютни събития, без лесни преживявания. Без неоспорима развръзка“. И без прикриването на новите цикли от болка, които отваря след себе си всеки акт на насилие.
Колъм Тойбин: Без уютни събития, без лесни преживявания, без неоспорима развръзка
В навечерието на гостуването си в България Колъм Тойбин отговаря на въпросите на Антония Апостолова прямо и без да щади читателите си. Писането, а и четенето като че ли винаги се случват извън зоната на комфорт. А възможността за провал е втъкана в създадената от човека литература.
Затова – повече нежност и по-малко умножаване на болката, което ме връща към мисълта за Нева и ме води към днешната ми препоръка. Защото Нева е преводачка на пиесата на италианския драматург Диего Плеутери „Както в най-добрите дни“, която ми стопли душата, когато я гледах. И която един режисьор иска да бъде забранена, защото според него някои хора нямат право на любов – не било православно и традиционно. Ако успеете да си купите билет (защото залата винаги е пълна на този спектакъл), горещо препоръчвам и да си купите програмата на постановката. Така за 3 евро ще се сдобиете с отделно произведение на изкуството, а ще ви се падне и късметче.
Разбира се, препоръчвам и да ни подкрепите, ако за вас е важно да продължавате да ни четете. Защото „Тоест“ не е даденост, а разчита на вашата подкрепа. Тъкмо погледнах финансовия отчет и установих, че резервите ни бавно, но устойчиво се топят, а през август сме на плюс само защото бяхме във ваканция.
Trump’s Latest Appeal to Russia Could Outrage Even His Allies
Post Syndicated from The Atlantic original https://www.youtube.com/shorts/hVXF4hfm7w4
Friday Squid Blogging: EU is Trying to Fight Unregulated Squid Fishing
Post Syndicated from Bruce Schneier original https://www.schneier.com/blog/archives/2026/10/friday-squid-blogging-eu-is-trying-to-fight-unregulated-squid-fishing.html
The EU is recommending import controls to combat unregulated squid fishing in the Southwest Atlantic. I’m not optimistic.
As usual, you can also use this squid post to talk about the security stories in the news that I haven’t covered.
This is BiCS NAND Close Up from Kioxia and Sandisk
Post Syndicated from Eric Smith original https://www.servethehome.com/this-is-bics-nand-close-up-from-kioxia-and-sandisk/
We saw BiCS NAND under the microscope at FMS 2026, and thought our readers might like to see close-ups of the packages
The post This is BiCS NAND Close Up from Kioxia and Sandisk appeared first on ServeTheHome.
Trump’s Latest Appeal to Russia Could Outrage Even His Allies
Post Syndicated from The Atlantic original https://www.youtube.com/shorts/ZYPRhZQcUW8
Deploy Oracle Database step by step on Amazon EVS with FSx for ONTAP
Post Syndicated from Satish Bhoi original https://aws.amazon.com/blogs/architecture/deploy-oracle-database-step-by-step-on-amazon-evs-with-fsx-for-ontap/
This post provides step-by-step procedures to deploy Oracle Database on Amazon Elastic VMware Service (Amazon EVS) with Amazon FSx for NetApp ONTAP as NFS datastore storage. You will provision storage volumes, mount NFS datastores, install Oracle, and configure SnapMirror replication for cross-region disaster recovery.
Enterprises running Oracle databases on VMware want a path to AWS that preserves their existing operational workflows with no rearchitecting and retraining. In our related post, Architect highly available Oracle Database on Amazon EVS and FSx for ONTAP, we explained how to design that environment: selecting Amazon Elastic Compute Cloud (Amazon EC2) bare metal instances, sizing VMs, splitting storage between vSAN and FSx for NetApp ONTAP, and planning SnapMirror replication for cross-region DR.
This post picks up where the architecture left off. We provide step-by-step procedures to deploy the entire stack — from provisioning your first Oracle VM and creating FSx for ONTAP volumes, through mounting NFS datastores, installing Oracle 19c, and configuring SnapMirror and SnapCenter. We also cover four migration paths for moving existing on-premises Oracle workloads to EVS and day-2 operations including snapshot backup, point-in-time recovery, and database cloning.
For architecture decisions, instance type selection, storage design rationale, and high availability planning, see our related post: Architect highly available Oracle Database on Amazon EVS and FSx for ONTAP.
Step-by-step deployment procedures
This section walks through the end-to-end deployment workflow: provisioning the Oracle VM, creating FSx for ONTAP storage volumes, mounting NFS datastores in vSphere, installing Oracle 19c, and configuring SnapMirror for cross-region DR. Complete the prerequisites first, then follow Steps 1 through 8 in order.
Prerequisites
- Amazon EVS environment deployed (VCF 9.1, ESXi 9.1. With VCF 9.x, Amazon EVS provisions the bare metal infrastructure and VLANs and you deploy VCF using Broadcom’s VCF Installer).
- Minimum 4 hosts per cluster. Dedicated DB cluster recommended for Oracle.
- Virtual private cloud (VPC) with Route Server endpoints, AWS Transit Gateway, and AWS Direct Connect configured.
- AWS Identity and Access Management (IAM) permissions for FSx for ONTAP provisioning.
- VCF license entitlement (BYOL from Broadcom).
Step 1: Deploy Oracle VM on EVS
- Log in to the vSphere Client connected to your EVS vCenter.
- Create a new Virtual Machine in the Production DB Cluster:
- Guest OS: Red Hat Enterprise Linux 8 (64-bit) or Oracle Linux 8.
- vCPU: Size per Oracle workload (8–32 vCPU typical)
- Memory: 32–256 GiB based on SGA/PGA requirements.
- Disk: 100 GiB on vSAN datastore (OS + Oracle Home + swap + temp tablespace)
- Network: Attach to DB segment on the prod-trusted Tier-1 gateway.
- Power on the VM and configure the guest OS:
For HA/DR, consider replicating the entire Oracle VM rather than maintaining a separate licensed instance in the DR cluster (see DR Licensing Consideration in the architecture post).
Oracle licensing consideration: Instance type selection affects Oracle license cost, which is an important factor to take into consideration. We recommend requesting an AWS Optimization and Licensing Assessment (AWS OLA) for further guidelines.
Step 2: Provision FSx for NetApp ONTAP
- Open the Amazon FSx console, select Create file system, then select Amazon FSx for NetApp ONTAP.
- Select Standard create and configure:
| Setting | Value |
| Deployment type | Single-AZ (required for EVS) |
| SSD storage capacity | Size for Oracle data + logs + 20% headroom |
| Throughput capacity | 512–2,048 MB/s (size for write workload. See asymmetry note) |
| IOPS | Automatic (3/GiB) or user-provisioned (up to 80,000) |
| VPC | Same VPC as EVS environment |
| Subnet | EVS service access subnet, same AZ as DB cluster |
| Security group | Allow NFS (TCP 2049, 111, 635) from EVS management VLAN |
- Set the
fsxadminpassword (required for ONTAP CLI automation). - Create an SVM (Storage Virtual Machine) with
vsadminpassword. - Disable automatic daily backups. Use SnapCenter for Oracle-aware scheduling instead.
- After creation, select SVM, select Endpoints, and copy the NFS DNS name.
Step 3: Create Oracle database volumes
Connect to the FSx for ONTAP cluster using SSH (ssh fsxadmin@management-endpoint) and create volumes:
Set -tiering-policy none to pin all data to SSD tier. Size the log volume for 24 hours of archive logs.
Step 4: Mount FSx for ONTAP as NFS datastore in vSphere
- In vSphere Client, select the DB Cluster, then select Configure > Storage > New Datastore.
- Select NFS, then select NFS 3.
- Enter:
- Server:
svm-id.fs-id.fsx.region.amazonaws.com - Folder:
/oradb1data - Datastore name:
fsx-ora-db1-data
- Server:
- Repeat for binary (
/oradb1bin) and log (/oradb1log) volumes. - Verify all three datastores show correct capacity in the cluster storage view.
Step 5: Create Oracle VMDKs on FSx for ONTAP datastores
With the NFS datastores mounted at the ESXi host level (Step 4), create virtual disks for Oracle on these datastores:
- In vSphere Client, select the Oracle VM, select Edit Settings, then select Add New Device > Hard Disk.
- Create these VMDKs:
| VMDK | Datastore | Size | Guest Mount | Purpose |
| Hard Disk 2 | fsx-ora-db1-data |
500 GiB | /u02 |
Oracle data files |
| Hard Disk 3 | fsx-ora-db1-log |
250 GiB | /u03 |
Oracle redo + archive logs |
| Hard Disk 4 | fsx-ora-db1-bin |
50 GiB | /u01 |
Oracle Home binaries |
- Select Thick Provision, Eager Zeroed for data and log VMDKs (best Oracle performance).
Oracle Database can be created on Oracle ASM or Filesystem (local/NFS). This installation is based on creating the Oracle database on local XFS filesystem.
Inside the Oracle VM guest OS, partition and mount the new disks:
Key insight: The Oracle VM accesses /u02 and /u03 as local XFS block devices. It has no awareness that the underlying storage is an NFS datastore backed by FSx for ONTAP. All NFS communication happens at the ESXi host level, where each host uses its own network path to FSx for ONTAP.
Step 6: Install and configure Oracle 19c
Create the database with data on /u02 and logs on /u03:
Oracle accesses /u02 and /u03 as local XFS filesystems. Standard Oracle ASM or filesystem-based storage management applies. No NFS-specific Oracle configuration is needed because the NFS layer is abstracted by the ESXi hypervisor.
Step 7: Set up SnapMirror for cross-region DR
Peer clusters (production → DR):
Peer SVMs:
Create DP volumes on DR FSx for ONTAP:
Create and initialize SnapMirror:
Important: Consider Oracle licensing requirements when planning your DR strategy. An alternative is to replicate the Oracle VM through NetApp SnapMirror from Production to DR. Keep the DR replicated volumes as data-protection (DP) volumes that are NOT mounted as NFS datastores on DR hosts until a failover event is declared to avoid Oracle double licensing. Only then break the SnapMirror, mount the NFS datastore on the DR Host, and power on the VM. Pre-mounting the SnapMirror volume as a datastore — even with no VM powered on — means Oracle binaries are accessible on those hosts, which Oracle may consider an “installation” requiring licenses across the entire DR cluster. We recommend requesting an AWS Optimization and Licensing Assessment (AWS OLA) for further guidelines.
Step 8: Configure SnapCenter backup
- Deploy SnapCenter Server (or use SnapCenter SaaS).
- Add FSx for ONTAP storage system using the cluster management IP.
- Install SnapCenter Plugin for Oracle on each Oracle VM.
- Create backup policies:
| Policy | Scope | Frequency | SnapMirror Update |
| Full DB Backup | Data + Control + Archive | Every 4–6 hours | Yes |
| Archive Log | Archive logs only | Every 10–15 minutes | Yes |
- Create resource groups, assign policies, and schedule.
Database migration from on-premises VMware to EVS
Option 1: VMware HCX live migration
For enterprises with existing VMware on-premises:
- Deploy HCX Connector on-premises, HCX Cloud Manager on EVS.
- Create site pairing and network extensions (L2 stretch).
- Migrate Oracle VMs using HCX vMotion (zero downtime) or Bulk Migration.
- Post-migration: storage vMotion Oracle VMDKs from vSAN to FSx for ONTAP NFS datastores for snapshot/replication capabilities.
Option 2: SnapMirror ONTAP-to-ONTAP
If on-premises Oracle already uses NetApp ONTAP storage:
- Establish SnapMirror between on-premises ONTAP and AWS FSx for ONTAP.
- Incrementally replicate until cutover.
- At switchover: quiesce Oracle, flush archive logs, final SnapMirror sync, break mirror.
- Mount FSx for ONTAP volumes on EVS Oracle VM, recover database, open for service.
Option 3: Oracle PDB relocation (multitenant)
For Oracle databases already in PDB/CDB multitenant model:
- Create target CDB on EVS with FSx for ONTAP storage.
- Use PDB hot clone to relocate PDBs from on-premises CDB to AWS CDB.
- Minimal service interruption. Only final switchover requires brief outage.
Option 4: RMAN backup/restore (non-ONTAP on-premises)
If Oracle runs on non-ONTAP storage on-premises:
- Create RMAN backup, stage to Amazon Simple Storage Service (Amazon S3) using AWS DataSync or AWS Direct Connect.
- Provision Oracle VM on EVS, mount FSx for ONTAP volumes.
- Restore from RMAN backup, apply archive logs.
- Open database and redirect applications.
Day-2 operations
Snapshot backup
SnapCenter manages full database snapshots as storage-layer operations, providing efficient backup capabilities.
Point-in-time recovery
In SnapCenter, select the SCN or timestamp, mount the log snapshot, restore the data snapshot, apply archive logs, and open with RESETLOGS.
Database cloning
SnapCenter FlexClone creates space-efficient database copies. Clones share unchanged blocks with the source and consume storage only for deltas. Use for dev/test, patch validation, and reporting.
HA failover procedure
- Break SnapMirror on DR volumes.
- Mount SnapMirror volumes as NFS datastores on DR ESXi hosts, then power on the Oracle VM.
- Recover to last available archive log.
- Open database. Update DNS/connection strings.
Clean up
To stop incurring charges after testing this deployment, remove the following resources in this order:
- Oracle VMs — Power off and delete Oracle database VMs from the vSphere inventory.
- NFS datastores — Unmount FSx for ONTAP datastores from ESXi hosts in vSphere.
- SnapMirror relationships — Delete SnapMirror relationships and DP volumes on the DR FSx for ONTAP file system.
- FSx for ONTAP file systems — Delete both production and DR file systems from the Amazon FSx console. This action deletes all volumes and data on those file systems.
- Amazon EVS environment — Delete the EVS environment from the Amazon EVS console. This terminates the underlying EC2 bare metal instances.
- Networking — Remove Transit Gateway attachments, VPC Route Server configurations, and Direct Connect connections if they were created solely for this deployment.
Important: Deleting an FSx for ONTAP file system permanently removes all data. Confirm that you have backed up any data you need before proceeding.
Conclusion
In this post, we walked through deploying Oracle Database on Amazon Elastic VMware Service (Amazon EVS) with Amazon FSx for NetApp ONTAP as NFS datastore storage. You provisioned the Oracle VM, created FSx for ONTAP volumes, mounted NFS datastores in vSphere, installed Oracle 19c, and configured SnapMirror for cross-region disaster recovery and SnapCenter for Oracle-aware backup. We also covered four migration paths for existing on-premises Oracle workloads and day-2 operations for backup, point-in-time recovery, and cloning.
To get started, review the Amazon EVS User Guide and Configure FSx for ONTAP as NFS Datastore for EVS, then deploy your first Oracle VM on Amazon EVS. For the architecture decisions behind this deployment, see our related post, Architect highly available Oracle Database on Amazon EVS and FSx for ONTAP. Share your feedback and questions in the comments.
Additional resources
- Amazon EVS User Guide
- EVS Supported VCF Versions and Instance Types
- Configure FSx for ONTAP as NFS Datastore for EVS
- FSx for NetApp ONTAP with EVS
- Amazon EVS Pricing
- Introducing Amazon EVS — AWS Blog
- NetApp Automation Toolkit for Oracle
About the authors
Architect highly available Oracle Database on Amazon EVS and FSx for ONTAP
Post Syndicated from Satish Bhoi original https://aws.amazon.com/blogs/architecture/architect-highly-available-oracle-database-on-amazon-evs-and-fsx-for-ontap/
Enterprises with existing VMware Cloud Foundation (VCF) investments want to migrate their Oracle databases to AWS without rearchitecting applications or retraining operations teams. Oracle on Amazon Elastic VMware Service (Amazon EVS) can take advantage of sub-millisecond storage latency, snapshot-based backup, cross-region disaster recovery (DR), and independent storage scaling, all while preserving existing VMware operational workflows.
In this post, we show you how to architect a complete Oracle Database environment on Amazon EVS with Amazon FSx for NetApp ONTAP. You learn how the storage, compute, networking, and disaster recovery layers work together to deliver high availability, cross-region DR, and sub-millisecond storage latency while maintaining your familiar VMware operational tooling.
In this post, you learn how to:
- Design Oracle Database architecture on Amazon EVS running VMware Cloud Foundation 9.1.
- Select optimal EC2 bare metal instance types and VM sizing for Oracle workloads.
- Architect storage using Amazon FSx for NetApp ONTAP as NFS datastores for Oracle data and log volumes.
- Plan SnapMirror replication for cross-region disaster recovery.
- Evaluate migration options for moving existing Oracle workloads from on-premises VMware to EVS.
Amazon EVS directly runs VMware Cloud Foundation (VCF) environments on Amazon Elastic Compute Cloud (Amazon EC2) bare metal instances within an Amazon Virtual Private Cloud (Amazon VPC). With VCF 9.x, Amazon EVS provisions the bare metal infrastructure and VLAN subnets, and you then deploy VCF using Broadcom’s VCF Installer (the self-deployed model). VCF 9.x also supports evaluation mode, so you can validate the design before applying license keys, and the Solutions for Amazon EVS GitHub repository provides CloudFormation and Terraform templates to automate the phased VCF 9 deployment. Amazon FSx for NetApp ONTAP provides managed ONTAP storage with NFS, SMB, iSCSI, and NVMe over TCP access. FSx for NetApp ONTAP can deliver sub-millisecond response times, multiple GBps of throughput, and up to 80,000 IOPS per file system (see FSx for ONTAP performance).
For more information, see FSx for NetApp ONTAP features.
For step-by-step deployment procedures including provisioning, storage configuration, Oracle installation, and SnapMirror setup, see our companion post: Deploy Oracle Database step by step on Amazon EVS with FSx for ONTAP.
Solution architecture
This section describes a highly available Oracle Database deployment on Amazon EVS with Amazon FSx for NetApp ONTAP storage across two AWS Regions. Figure 1 illustrates the numbered data flow from on-premises through hybrid connectivity into the production EVS environment and cross-region DR.
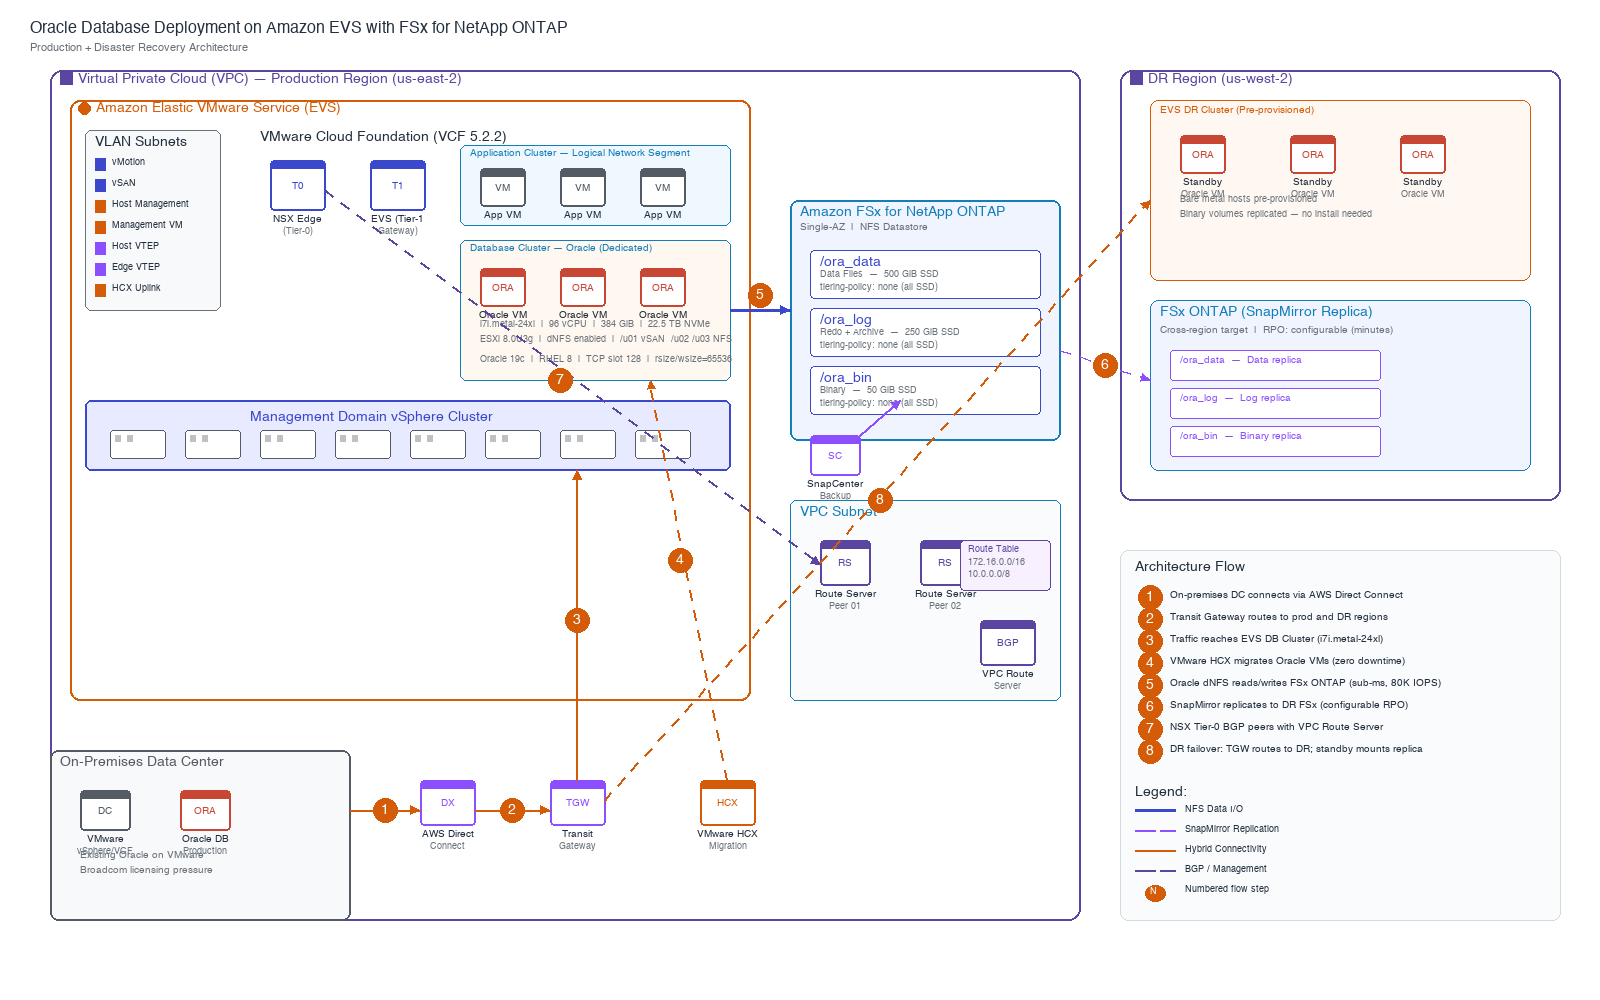
Figure 1: Oracle Database on Amazon EVS with FSx for NetApp ONTAP and cross-region SnapMirror DR
The architecture consists of eight functional components, described in the following section.
Architecture components
These numbered items correspond to the data flow shown in the diagram.
- Hybrid link — On-premises data center connects to AWS through AWS Direct Connect for dedicated, low-latency bandwidth.
- Transit routing — AWS Transit Gateway routes traffic between the production VPC, DR region, and on-premises networks.
- Workload landing — Traffic reaches the EVS Database Cluster running on i7i.metal-24xl Amazon EC2 bare metal instances with VCF 9.1.
- Live migration — VMware HCX (Hybrid Cloud Extension) migrates Oracle VMs from on-premises VMware to EVS with near-zero downtime using Replication Assisted vMotion or bulk migration.
- NFS data path — Each ESXi host mounts Amazon FSx for NetApp ONTAP as an NFS datastore. Oracle VMs access database volumes as block devices (VMDKs on the NFS datastore) with sub-millisecond latency and up to 80,000 IOPS. Each host has its own independent NFS path to FSx for ONTAP, distributing bandwidth across the cluster.
- Cross-region DR — SnapMirror asynchronously replicates FSx for ONTAP volumes (data, logs, binaries) to the DR region with configurable Recovery Point Objective (RPO).
- Dynamic routing — NSX Tier-0 gateway peers through BGP with Amazon VPC Route Server. This is one-way BGP. Route Server listens for routes advertised by NSX and writes them to the VPC route table, but does not advertise VPC routes back to NSX.
- DR failover — On failover, Transit Gateway routes to the DR region where pre-provisioned standby Oracle VMs mount the SnapMirror replica volumes.
Factors to consider for Oracle Database deployment on EVS
Before you begin deployment, evaluate your Oracle workload requirements against the available infrastructure options. The decisions you make for instance types, VM sizing, and storage architecture directly affect database performance, cost, and operational complexity.
Oracle licensing consideration: Instance type selection affects Oracle license cost, which is an important factor to take into consideration. We recommend requesting an AWS Optimization and Licensing Assessment (AWS OLA) for further guidelines.
EC2 instance type selection for ESXi hosts
Amazon EVS currently supports three bare metal instance types for ESXi hosts. The choice depends on whether you prioritize per-core compute speed (i7i) or per-host memory and storage density (i4i), and on how much you want to scale a single host vertically. For most new Oracle deployments, i7i is the better choice because Oracle query performance is sensitive to CPU instruction throughput and storage IO latency.
- i7i.metal-24xl (recommended default): 96 vCPUs (48 cores), 768 GiB RAM. 5th Gen Intel Xeon delivers improved compute performance, critical for Oracle CPU-bound queries. 3rd Gen AWS Nitro SSDs provide enhanced real-time storage performance and lower IO latency for vSAN.
- i7i.metal-48xl: Same 5th Gen Intel Xeon as the 24xl but double the capacity per host (192 vCPUs, 96 cores, 1,536 GiB RAM, up to 100 Gbps network and 60 Gbps Amazon Elastic Block Store (Amazon EBS) bandwidth). Choose this when you want to scale a single Oracle host vertically, such as for large SGAs, high core counts, or fewer and denser hosts to reduce VMware per-host licensing. It keeps the same per-core performance profile as the 24xl.
- i4i.metal: Higher per-host density (128 vCPUs, 1,024 GiB RAM, 30 TB NVMe) suits environments requiring fewer, larger hosts to reduce VMware licensing costs.
VCF compatibility: All three instance types support VCF 9.1 with ESXi 9.1 (build 9.1.0.0100.25433460). VCF 5.2.2 (ESXi 8.0U3g) remains available but is on a path to end of support, so new deployments should default to 9.x. An EVS environment supports 4–32 hosts per cluster. You can mix instance types across clusters within the same SDDC.
VM sizing for Oracle Database guests
Size Oracle Database VMs based on these workload characteristics:
- Allocate vCPU count matching Oracle CPU_COUNT parameter.
- Size memory for SGA + PGA + OS overhead (typically 75–85% of allocated VM memory for SGA)
- Configure VM swap on vSAN datastore (not NFS). vSAN uses local NVMe with single-digit millisecond latency.
- Use NUMA-aware VM placement for VMs exceeding single-socket core count.
- Place OS swap and Oracle temp tablespace on the vSAN datastore for single digit ms latency at no additional cost.
Storage architecture: vSAN + FSx for NetApp ONTAP
The recommended design splits storage responsibilities between two tiers:
- vSAN (backed by local NVMe drives on each ESXi host) handles low-latency, non-replicated workloads: VM boot disks, OS swap, and Oracle temp tablespace.
- FSx for NetApp ONTAP handles Oracle data files and redo logs that require snapshot-based backup and cross-region replication. ESXi hosts mount FSx for ONTAP volumes as NFS datastores, and Oracle VMs access standard VMDKs on those datastores.
This separation gives local NVMe speed for transient IO while adding snapshot, clone, and SnapMirror capabilities for persistent database files.
Why NFS datastore (host-level) instead of in-guest NFS (dNFS)? With in-guest NFS, all Oracle NFS traffic routes through the NSX overlay and an NSX Edge node before reaching FSx for ONTAP. This creates a single Edge chokepoint. With NFS datastores, each ESXi host talks NFS directly to FSx for ONTAP using its own network bandwidth. There is no Edge bottleneck and no extra latency hop.
FSx for NetApp ONTAP sizing considerations
Important: Use 100% SSD for Oracle. We recommend against using capacity pool tiering for Oracle database volumes. Keep tiering policy set to
nonefor all Oracle volumes.Important: SSD capacity planning. If the SSD tier fills to capacity, FSx for ONTAP blocks writes. Monitor SSD utilization and provision headroom (minimum 20% free).
Important: Read/write throughput asymmetry. On a 6 GB/s filesystem, read throughput can reach 6 GB/s, but write throughput is limited to approximately 1 GB/s. Size throughput capacity based on Oracle write workload requirements. This write ceiling applies per high-availability (HA) pair. To scale write throughput beyond a single HA pair, deploy a file system with more than one HA pair and distribute Oracle volumes across the additional aggregates so writes are spread across pairs. This placement is not automatic, so plan the layout up front to keep write-heavy datasets balanced.
Network architecture
Amazon EVS uses VLAN subnets (defined at environment creation and unchangeable later) to segment traffic.
VPC Route Server replaces static routes within the VPC. NSX Tier-0 gateways peer through BGP with Route Server endpoints. This is one-way BGP: Route Server listens for routes from NSX and programs them into the VPC route table but does not advertise VPC routes back to NSX. Beyond the VPC, routes remain static at Transit Gateway.
NSX-T segmentation for Oracle
- Dedicated Tier-1 gateway for production database segments (DB subnets)
- Separate Tier-1 for application tier (App subnets) and perimeter network.
- Distributed firewall rules restrict Oracle listener access (TCP 1521) to authorized application segments only.
- Micro-segmentation between Oracle instances prevents lateral movement.
Important: Security group rules are not enforced on VLAN subnet interfaces. Use network ACLs and NSX distributed firewall for traffic control.
High availability and disaster recovery
- SnapMirror replication frequency determines RPO. Configure based on business requirements.
- Pre-provision standby Oracle VMs in the DR cluster to reduce Recovery Time Objective (RTO).
- Replicate binary volumes so that Oracle installation is not required during recovery.
- Automate failover with Ansible/SnapCenter to reduce human error.
Oracle licensing consideration for DR: There are license impacts based on how DR replication is implemented. If you have licensing questions, we recommend requesting an AWS Optimization and Licensing Assessment (AWS OLA).
To comply with the Oracle licensing rules, an alternative is to replicate the Oracle VM through NetApp SnapMirror from Production to DR. Keep the DR replicated volumes as data-protection (DP) volumes that are NOT mounted as NFS datastores on DR hosts until a failover event is declared to avoid Oracle double licensing. Only then break the SnapMirror, mount the NFS datastore on the DR Host, and power on the VM. Pre-mounting the SnapMirror volume as a datastore, even with no VM powered on, means Oracle binaries are accessible on those hosts, which Oracle may consider an “installation” requiring licenses across the entire DR cluster.
Database migration from on-premises VMware to EVS
The following table compares migration options from on-premises VMware to EVS.
| Option | Method | Best for | Downtime |
| 1 | VMware HCX Live Migration | Existing VMware on-prem | Near-zero (vMotion) or planned bulk |
| 2 | SnapMirror ONTAP-to-ONTAP |
On-prem Oracle on NetApp ONTAP | Minutes (final sync switchover) |
| 3 | Oracle PDB Relocation | PDB/CDB multitenant model | Brief (final switchover only) |
| 4 | RMAN Backup/Restore | Non-ONTAP on-prem (universal) | Hours (backup + restore + apply) |
For detailed procedures on each migration option, see our companion post: Deploy Oracle Database step by step on Amazon EVS with FSx for ONTAP.
Security
Security for Oracle on Amazon EVS spans multiple layers from network isolation to database-level encryption. The following table summarizes the security controls across each layer.
| Layer | Control |
| Network segmentation | NSX-T Tier-1 gateways isolate DB/App/perimeter network segments |
| East-west traffic | NSX Distributed Firewall: restrict TCP 1521 to authorized app segments |
| North-south traffic | FortiGate or equivalent inspection VPC for ingress/egress filtering |
| Encryption at rest | FSx for ONTAP volumes encrypted with AWS Key Management Service (AWS KMS) |
| Encryption in transit | VPC encryption for NFS traffic, and IPsec for SnapMirror cross-region |
| Database encryption | Oracle TDE (Transparent Data Encryption) for additional protection |
| Administrative access | Zero-trust access (for example, Banyan or Zscaler) for VMware admin consoles |
| VLAN subnet security | Network ACLs (security groups not enforced on VLAN interfaces) |
Cost optimization
Cost optimization for Oracle on Amazon EVS focuses on matching infrastructure capacity to workload demands and using AWS pricing models. The following table summarizes key strategies across compute, storage, networking, and Oracle licensing. We recommend requesting an AWS Optimization and Licensing Assessment (AWS OLA) for further guidelines.
| Component | Strategy |
| EC2 bare metal hosts | Compute Savings Plans or Reserved Instances (up to 54% savings) |
| Instance type selection | i7i.metal-24xl delivers ~10% price-performance over i4i.metal |
| FSx for ONTAP throughput | Right-size for the write workload, and adjust on the fly |
| FSx for ONTAP storage | 100% SSD for Oracle, and storage efficiency for non-production |
| Data transfer | Place FSx for ONTAP in same AZ as EVS cluster |
| SnapMirror replication | Schedule frequency based on RPO (less frequent = lower cost) |
| Oracle DR licensing | Replicate the Oracle VMs through NetApp SnapMirror from Production to DR, keeping the DR replicated volumes as data-protection (DP) volumes that are NOT mounted as NFS datastores on DR hosts until a failover event is declared to avoid Oracle double licensing. When a failover event is declared, then break the SnapMirror, mount the NFS datastore on the DR Host, and power on the VM. We recommend requesting an AWS Optimization and Licensing Assessment (AWS OLA) for further guidelines. |
| Non-production | Use fewer hosts, and apply tiering for dev/test data |
Summary
Deploying Oracle databases on Amazon EVS with Amazon FSx for NetApp ONTAP provides high availability, cross-region DR, and sub-millisecond storage latency while combining VMware operational consistency with AWS cloud economics:
- Performance: i7i.metal-24xl delivers up to 23% better compute and 50% lower IO latency. FSx for ONTAP delivers sub-millisecond latency with up to 80,000 IOPS. For details, see Amazon EC2 i7i instances in the AWS GovCloud (US) Regions.
- Availability: vSphere HA, SnapMirror cross-region replication, and optional Oracle Data Guard.
- Manageability: SnapCenter for backup, clone, and recovery in seconds regardless of database size.
- Migration flexibility: HCX (live), SnapMirror (
ONTAP-to-ONTAP), PDB Relocation (multi-tenant), and RMAN (universal). - Security: NSX micro-segmentation, AWS KMS encryption, and zero-trust access.
- Cost efficiency: Improved price performance with i7i, on-the-fly throughput adjustment, and AWS Savings Plans.
This architecture provides you with high availability, cross-region DR, and storage-based backup and cloning similar to Oracle RAC and Data Guard functions while maintaining your familiar VMware operational tooling and procedures.
Next steps
To get started with this deployment:
- Provision an Amazon EVS environment in your target Region. See the Amazon EVS User Guide for setup instructions.
- Deploy an Amazon FSx for NetApp ONTAP file system in the same VPC and Availability Zone as your EVS cluster.
- Follow the step-by-step procedures in our companion post to mount NFS datastores, create Oracle VMDKs, and configure SnapMirror DR.
- Test in a non-production environment first, then migrate production Oracle workloads.
Additional resources
- Amazon EVS User Guide
- EVS Supported VCF Versions and Instance Types
- Configure FSx for ONTAP as NFS Datastore for EVS
- FSx for NetApp ONTAP with EVS
- Amazon EVS Pricing
- Introducing Amazon EVS on the AWS News Blog
- NetApp Automation Toolkit for Oracle
- Deploy Oracle Database step by step on Amazon EVS with FSx for ONTAP (companion post)
About the authors
Deploy open source Regional availability tools in your VPC
Post Syndicated from Stefan Janjic original https://aws.amazon.com/blogs/architecture/deploy-open-source-regional-availability-tools-in-your-vpc/
When you build multi-Region architectures on AWS, one question comes up early: “What services are available in each AWS Region?” The answer shapes architecture decisions, from which AWS Regions to expand into, to how you design for resilience. For teams navigating data residency requirements and compliance reporting, getting the answer wrong has real consequences: deployment failures, compliance gaps, and delayed launches.
AWS publishes Regional availability data covering services, features, APIs, and AWS CloudFormation resource types across all AWS Regions. You can explore this data on the AWS Capabilities by Region page, access it through Amazon Simple Storage Service (Amazon S3) for pipeline integration, or query it using the AWS Knowledge MCP server. These options work well for exploration and automation. However, teams told us they need this data deployed as infrastructure they own, refreshing on their schedule, inside their network, filtered to their workload. That means running availability data the same way you run the rest of your stack: in your Amazon Virtual Private Cloud (Amazon VPC), under your governance.
In this post, we introduce two open source solutions that deliver that ownership. Capability Insights for AWS deploys a Regional availability dashboard into your VPC that auto-refreshes every 24 hours. The dashboard, its API, and availability data all run in your own account, and the scheduled refresh makes the only call that leaves your account when it reads the dataset that AWS publishes. Workload Analysis scans your AWS CloudTrail logs and CloudFormation stacks, then narrows 200+ services to the 20–30 your account actually runs, significantly reducing the scope of a Regional gap analysis.
Together with the Capabilities by Region S3 Access Point, you now have three levels of control: consume from Amazon S3, deploy into your VPC, or filter to your workload. We walk through how to deploy each solution, run a workload analysis, and view personalized results during your Regional expansion planning. Whether you’re building multi-Region recovery strategies, standardizing compliance reporting, or accelerating expansion timelines, these solutions put the data and the decisions it drives inside your perimeter.
Figure 1 shows how Capability Insights for AWS integrates with the VPC and subnets in your existing AWS account. A client in the public subnet accesses the dashboard through an S3 gateway endpoint and calls the private API through an API Gateway VPC endpoint.
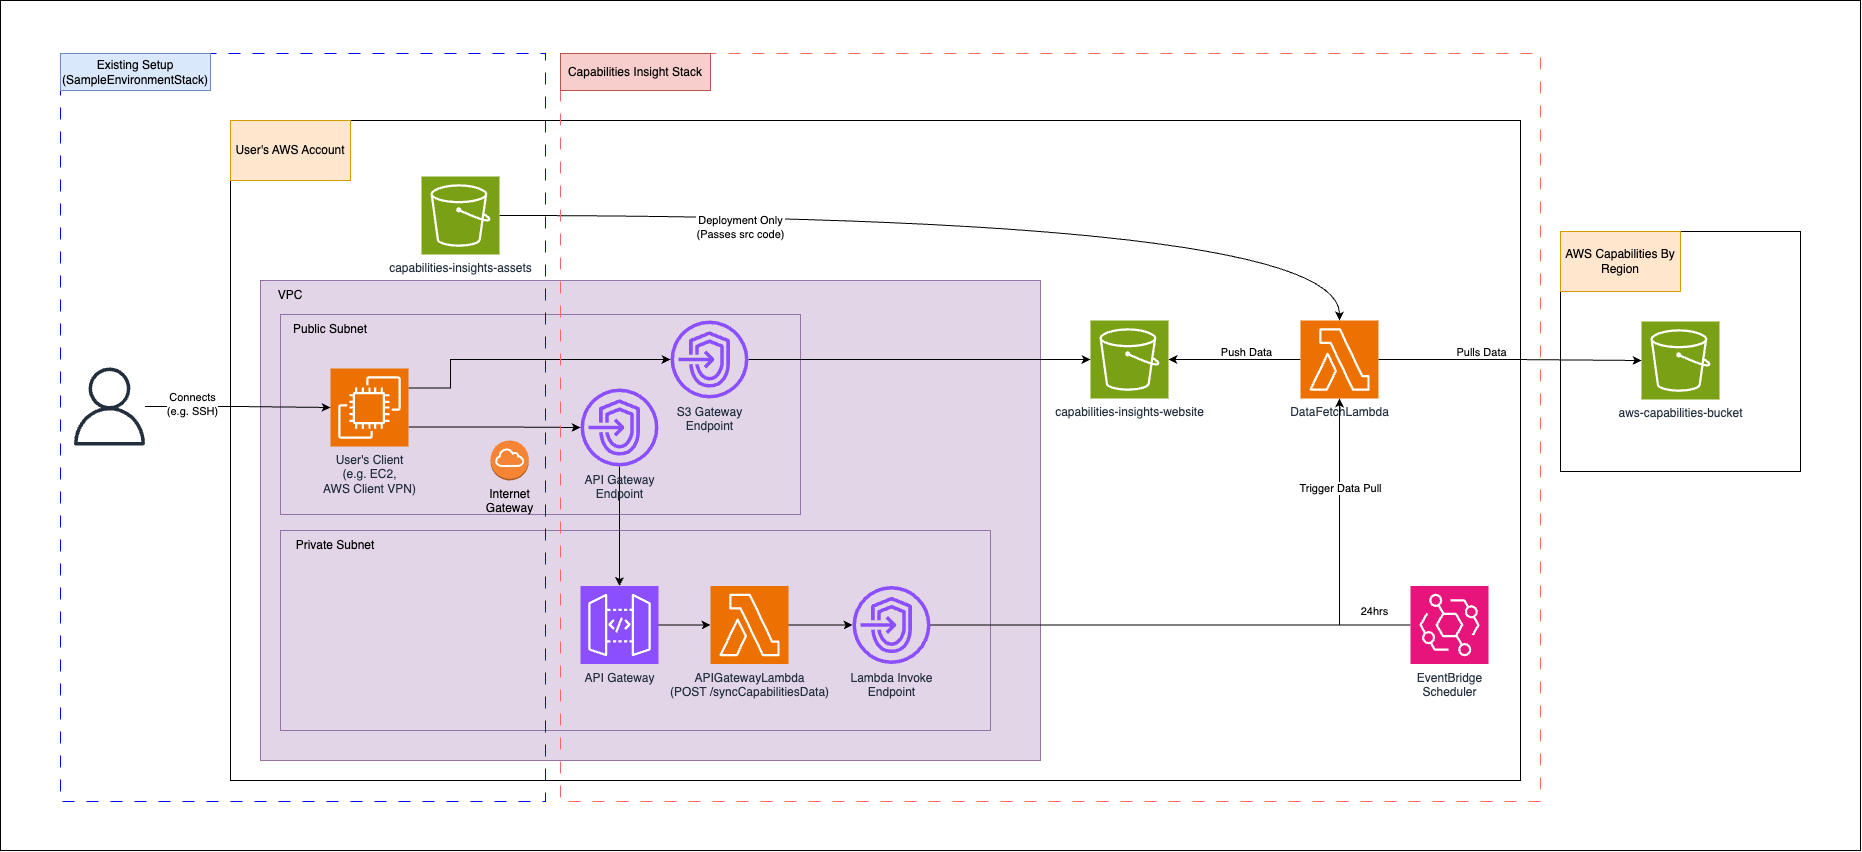
Figure 1: Capability Insights for AWS architecture, including private dashboard access and scheduled Regional availability data refreshes.
An Amazon EventBridge schedule invokes the data-fetch Lambda function every 24 hours. The data-fetch function runs outside your VPC, so it reads the S3 access point published by AWS over the AWS network. The function pulls Regional availability data from the Capabilities by Region S3 bucket published by AWS and writes it to the website bucket within your account. The dashboard application accesses the data within the website through the S3 gateway endpoint from your VPC. The API Lambda can also invoke the data-fetch function on demand through the Lambda VPC endpoint. The deployment assets bucket supplies the Lambda code during deployment only.
Prerequisites
To follow along, you need:
- An AWS account with permissions to deploy the CloudFormation stacks, including permission to create named AWS Identity and Access Management (IAM) roles. At runtime, the roles created by the stacks use scoped permissions for Amazon S3 object read and write access, AWS CloudFormation read operations, Amazon Athena queries, AWS Glue and AWS Lake Formation catalog access, AWS Lambda invocation, and AWS Step Functions execution. For starting-point deployment policies, see the documentation folder in the repository.
- AWS Command Line Interface (AWS CLI) installed and configured.
- A VPC with DNS resolution and DNS hostnames enabled, one public subnet (routed to an internet gateway) for dashboard and API access, and one private subnet (no internet route) for the in-VPC Lambda function. Both subnets need a route to Amazon S3 through a gateway VPC endpoint.
- Node.js v24.18.0 (includes npm and npx) for automated deployment.
- An S3 bucket for deployment assets.
- An active CloudTrail configuration where you store logs in an S3 bucket (required for Part 2).
Part 1: Deploy a self-hosted dashboard (Capability Insights for AWS)
Capability Insights for AWS deploys a searchable Regional availability dashboard into your own AWS account. The solution pulls data from the AWS Capabilities by Region S3 bucket, stores it inside your VPC, and serves it through a static website backed by Amazon API Gateway, AWS Lambda, and Amazon EventBridge.
If your organization has access to additional data sources beyond the public dataset, the solution incorporates those as well, giving you a unified view across all AWS partitions you have access to. To learn more about accessing additional data, work with your AWS representative.
The dashboard covers:
- Services and features: availability status, expected launch dates, and expansion plans per Region.
- API operations: individual API action availability per Region for each AWS service.
- CloudFormation resource types: which resource types each Region supports.
You provide your own VPC, subnets, and S3 bucket so the solution integrates with your existing infrastructure and security controls.
Clone and install
Create a deployment assets bucket
Create an S3 bucket with public access blocked to store the Lambda code package during deployment. We recommend naming it capability-insights-assets-<ACCOUNT_ID>-<REGION>.
Deploy the stack
Automated deployment:
The script builds all assets, prompts for parameters, deploys the CloudFormation stack, uploads the website, and triggers an initial data sync. You will be prompted for SourceFolders, a comma-separated list of data sources to pull from. The default is public.
To skip interactive prompts, pass all parameters as flags:
| Flag | Description |
| –private-vpc-id | VPC ID with DNS resolution and DNS hostnames enabled |
| –backend-subnet-id | Private subnet with no internet route. Needs a route to Amazon S3 through a gateway VPC endpoint. |
| –api-access-subnet-id | Public subnet routed to an internet gateway (user access, API Gateway VPC endpoint) |
| –deployment-assets-bucket-name | S3 bucket for deployment assets |
| –source-access-point-arn |
Public Capabilities by Region S3 access point ARN published by AWS. Account ID 686591367145 identifies the account managed by AWS that hosts the public dataset. Use the ARN as shown. For details on the public dataset, see Building automated AWS Regional availability checks with Amazon S3. |
| –source-folders | Comma-separated data sources (default: public) |
Manual deployment:
If your organization requires deploying with native AWS tooling only, download build-assets.zip from the latest release and follow these steps:
Access the dashboard
The solution hosts the website on S3, accessible only from within your VPC:
Because the solution you deploy hosts the website without public access, you need connectivity to the VPC. Common options:
- Existing VPN or AWS Direct Connect: use your organization’s existing connectivity.
- AWS Client VPN: set up a Client VPN endpoint in the VPC.
- EC2 instance with SOCKS proxy: SSH into an instance in the VPC and proxy browser traffic through it.
Explore the dashboard
Once connected, the dashboard provides:
- Search and filter: find services by name across all Regions.
- Expandable service details: select any service to see individual feature availability per Region.
- Status indicators: Available, Planning, Not Expanding, and projected dates (for example, “2026 Q3”)
- Export: download the current view as JSON or CSV for sharing or further analysis.
- Settings: view last sync time and trigger manual data refreshes.
Figure 2 shows the Capability Insights for AWS dashboard and its controls for comparing service availability across Regions.
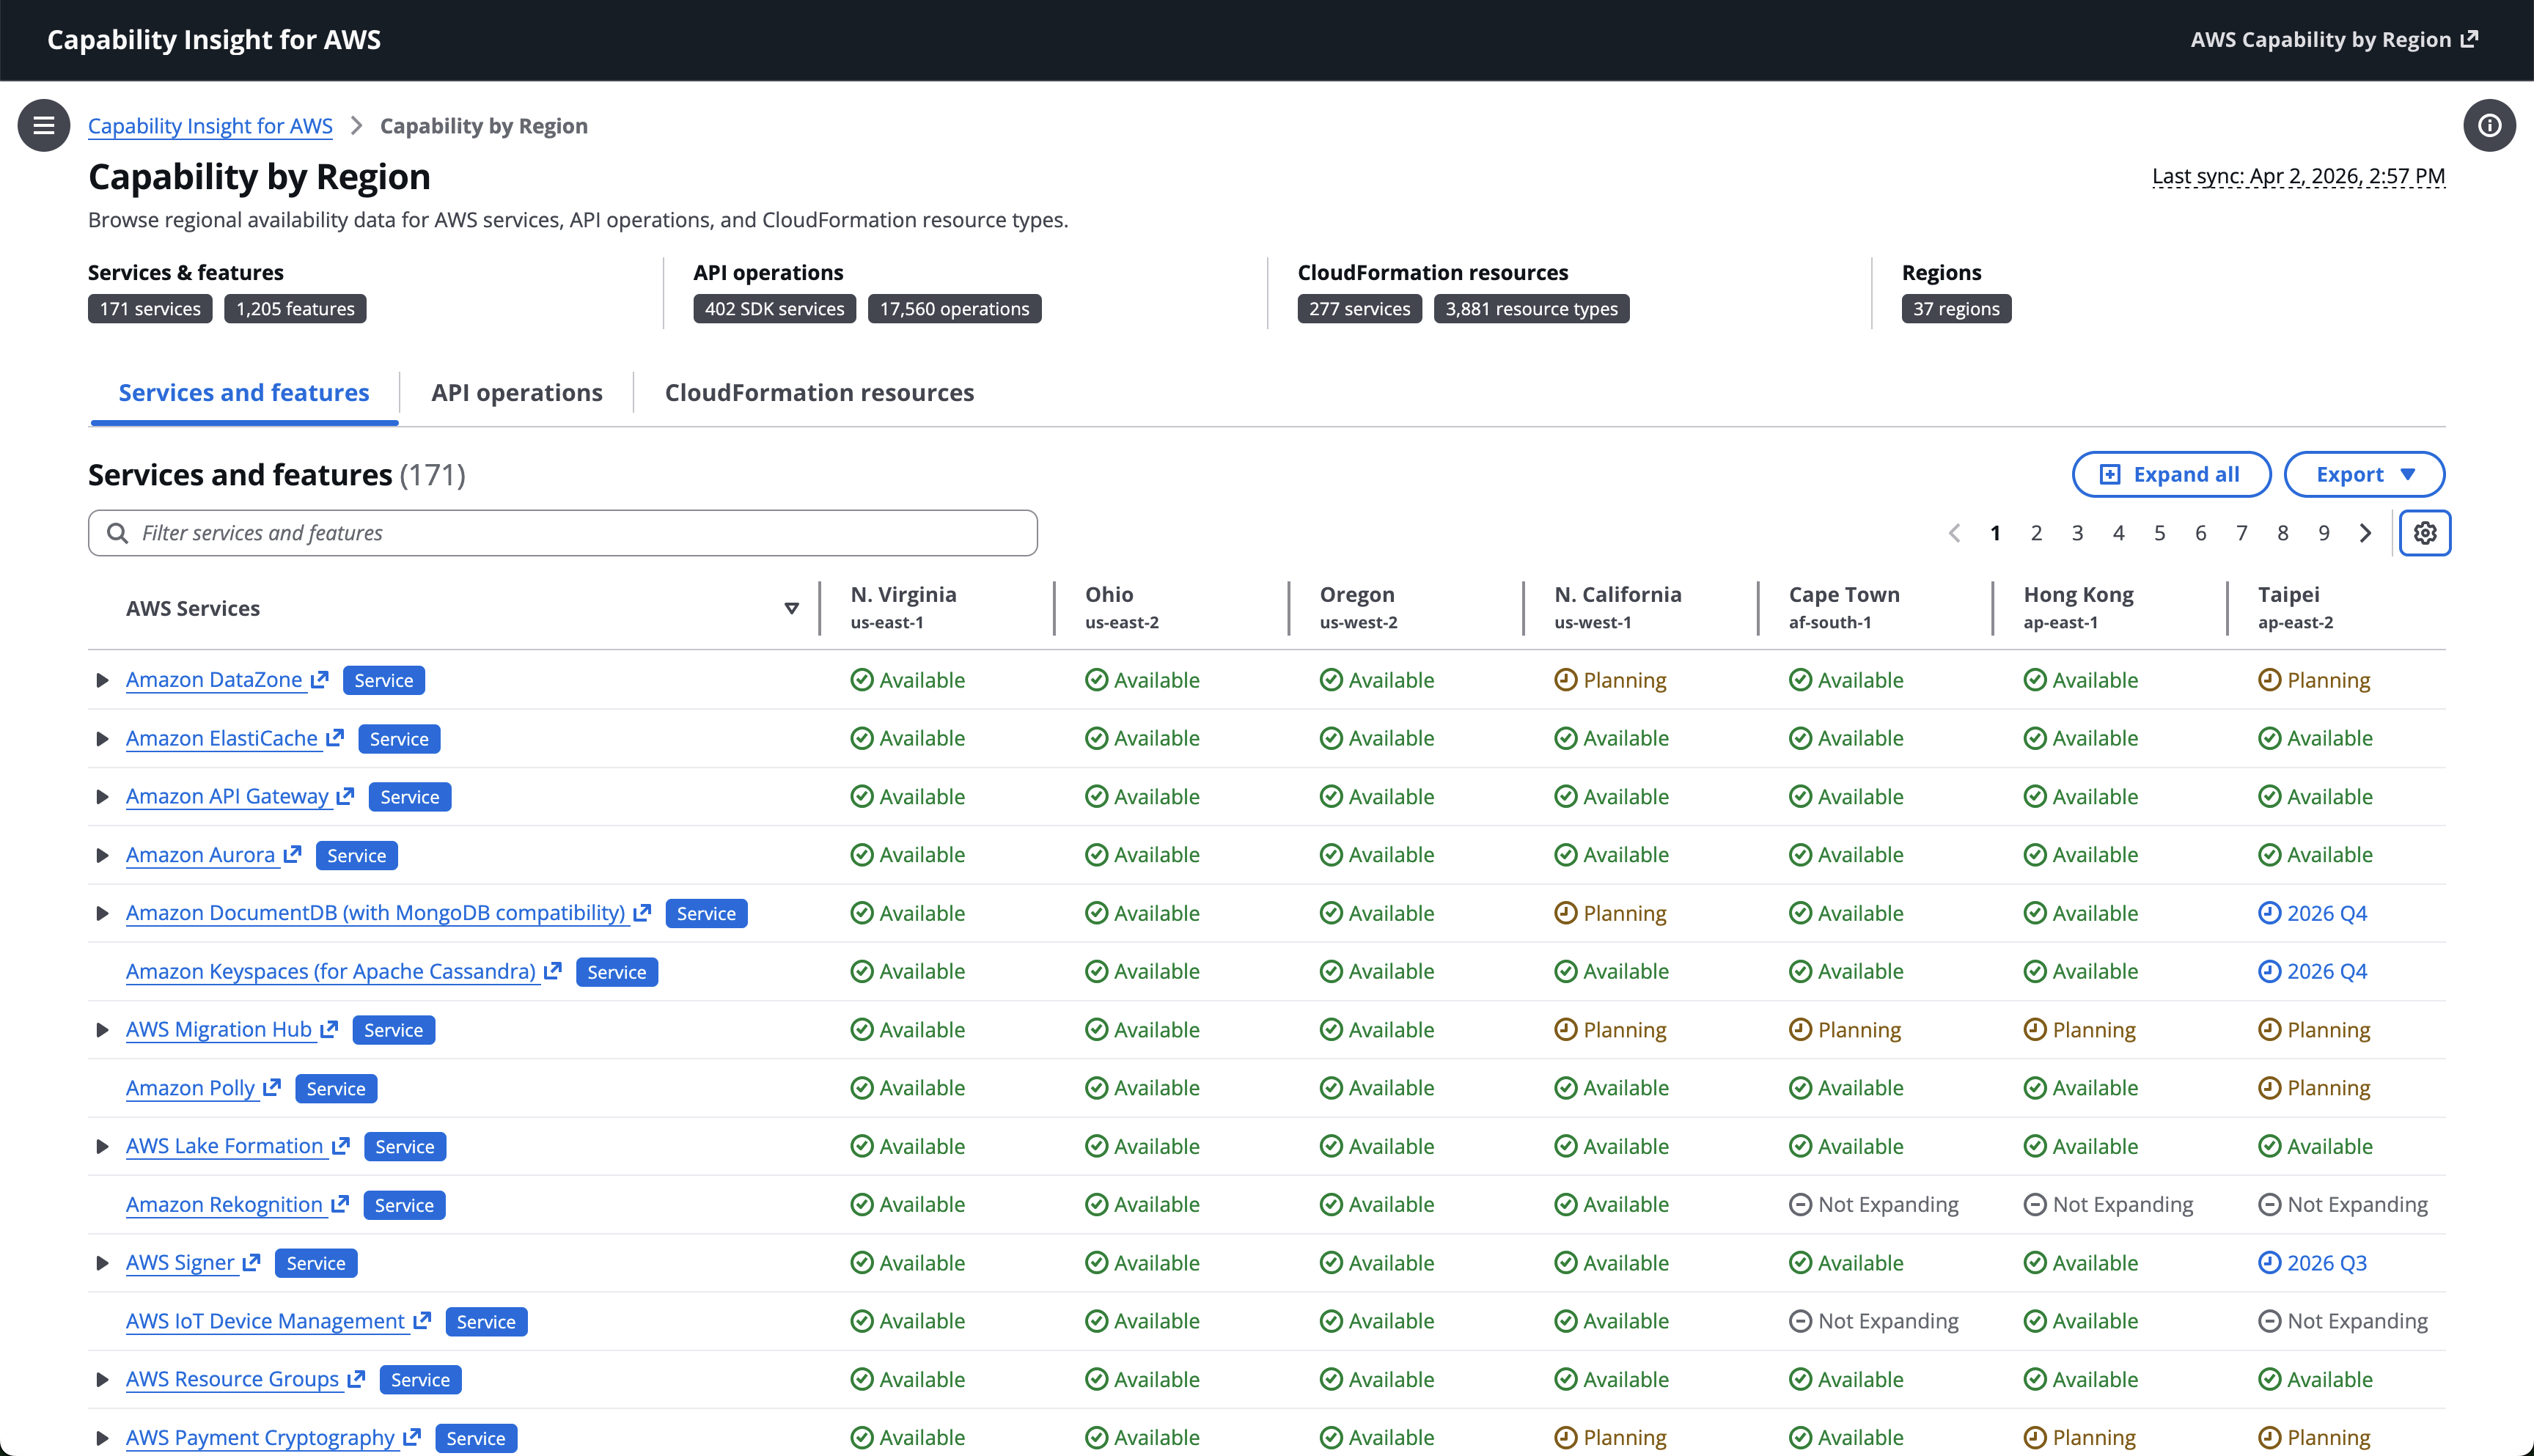
Figure 2: Dashboard overview showing service availability across Regions with status indicators and export options.
Summary counts show coverage for services and features, API operations, CloudFormation resources, and Regions. Tabs switch between catalog views, while filtering, Region columns, status values, and the expand and export controls help you inspect and download availability data.
At this point you have a working dashboard inside your VPC, refreshing daily, with no external dependencies during normal operation.
Part 2 adds personalization by filtering this catalog to the specific services your account runs. You can view the workload analysis results through the dashboard or access them through dedicated API endpoints.
Part 2: Personalize the catalog with Workload Analysis
The catalog covers 200+ services across 35+ Regions. When you plan expansion to a new Region, you don’t need to evaluate all of them. You need to evaluate the 20–30 your account runs. Without that filter, a gap analysis is a multi-week project. With it, it’s a 30-minute review.
Workload Analysis deploys as an additive CloudFormation stack alongside the Capability Insights stack. The pipeline runs as an AWS Step Functions state machine with three stages:
- Parallel analyzers (two branches run in parallel):
- CloudTrail Analyzer: Creates an AWS Glue Data Catalog table pointing at your CloudTrail log bucket, then runs an Amazon Athena query that extracts distinct service/API/Region/account combinations from the last N days (configurable, default 30). This identifies services your account has called.
- CloudFormation Analyzer: Calls
ListStacksandGetTemplatefor every active stack in the account. ExtractsAWS::resource types and scalar property values (strings, numbers, booleans), maps them to service names, and records which stack contributed each resource. This identifies what your account deploys, not only what it calls.
- Usage Decorator runs after both analyzers complete. It reads the primary capability catalogs (
products.json,apis.json,cfn_resources.json) from the website bucket, intersects them with the analyzer outputs, and writes personalized files back to the bucket for the dashboard to consume. - Scheduled execution through an Amazon EventBridge rule triggers the state machine daily (configurable schedule expression), keeping personalized data fresh without manual intervention.
Figure 3 shows how the Workload Analysis components coordinate scheduled and on-demand analysis.
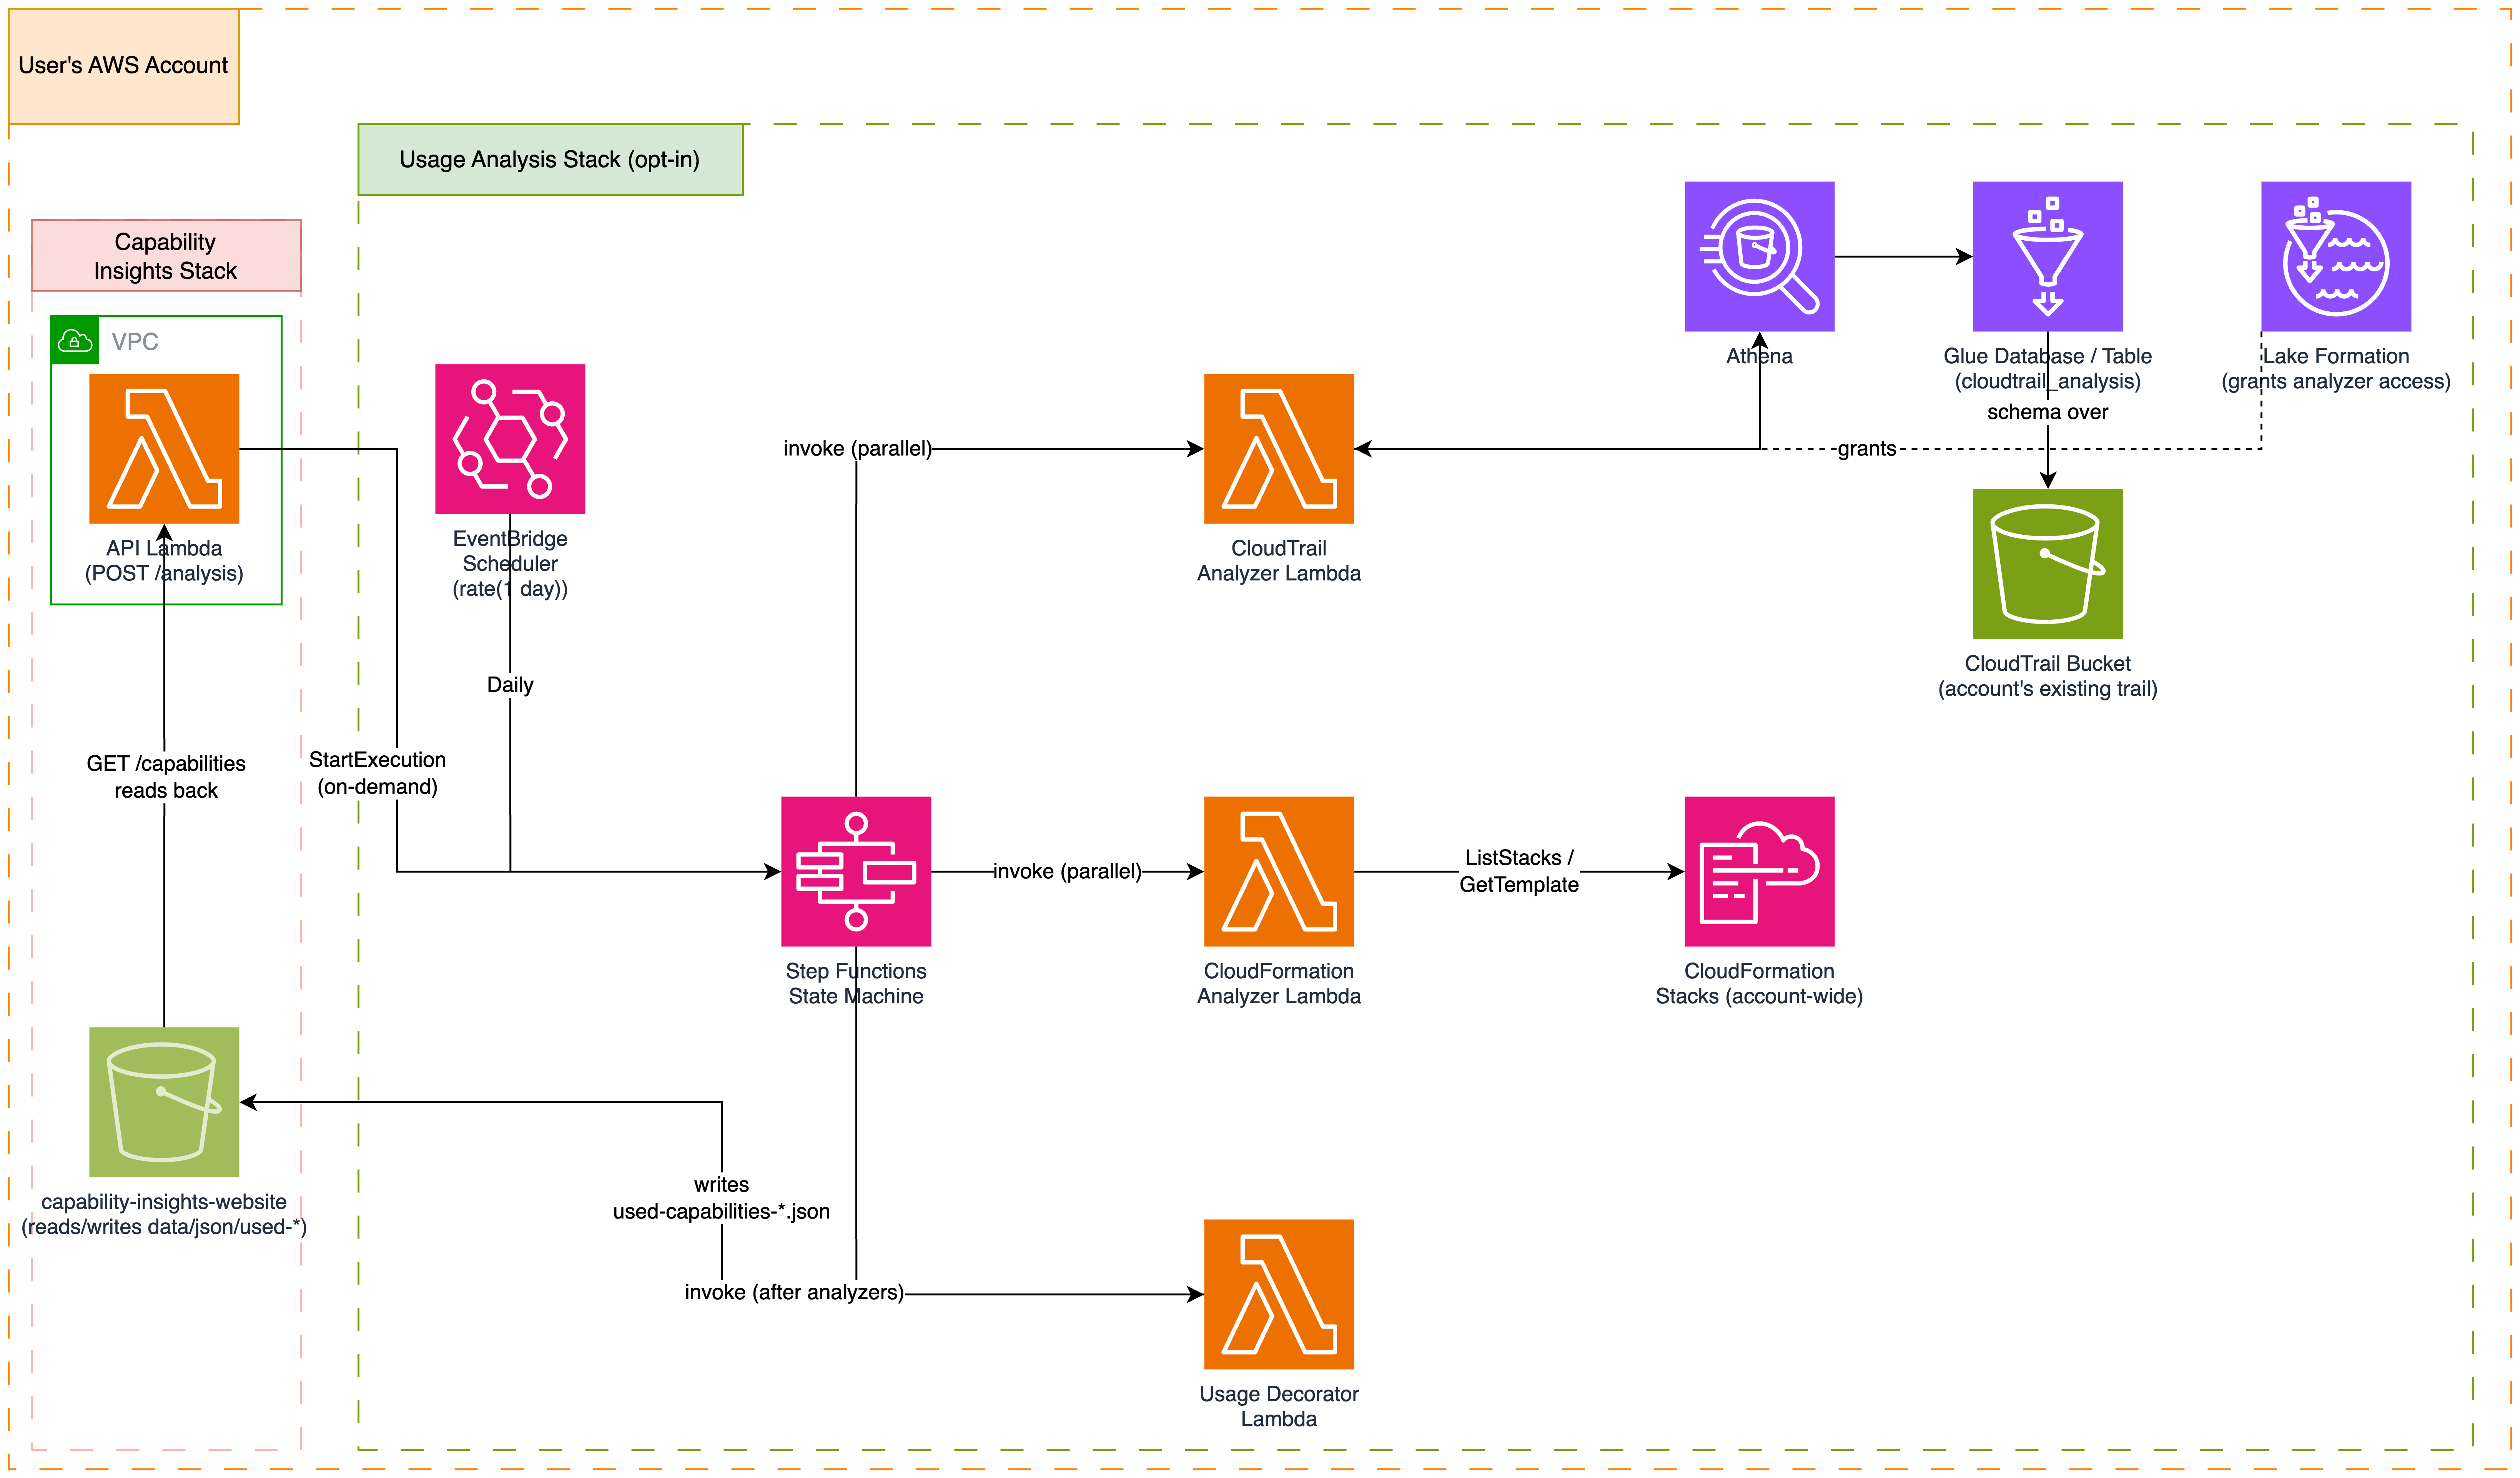
Figure 3: Workload Analysis infrastructure components.
An Amazon EventBridge schedule or an on-demand API request starts the AWS Step Functions state machine. The workflow runs two branches in parallel: the CloudTrail analyzer uses Amazon Athena with AWS Glue Data Catalog and AWS Lake Formation catalog access to query activity, while the CloudFormation analyzer inspects active stacks. After both branches complete, the Usage Decorator combines their results with the primary capability catalogs and writes personalized data to the Capability Insights website bucket for the dashboard and API to consume.
Deploy Workload Analysis
Verify that CloudTrail is active and your logs land in an S3 bucket. Then deploy with the usage analysis flag:
This deploys both the core Insights stack and the Usage Analysis stack, then wires them together so the API Lambda can trigger analysis and serve personalized results.
| Additional flag | Description |
--enable-usage-analysis |
Enables the Workload Analysis pipeline |
--cloudtrail-bucket |
S3 bucket containing your CloudTrail logs |
A typical first run completes in 2–5 minutes depending on account size and the number of active CloudFormation stacks.
Retrieve API endpoint
Use the following command to retrieve the API base URL from the API configuration file on the dashboard bucket:
The command returns output similar to the following:
Use apiBaseUrl as the base URL for the dedicated API endpoints. You must run API requests from within the VPC because the API Gateway endpoint is private.
Run an analysis
Start an analysis by calling POST /analysis through the API Gateway endpoint:
The Amazon EventBridge rule triggers subsequent runs daily. You can also trigger ad-hoc runs through the dashboard’s Settings page.
View personalized results
After an analysis completes, the dashboard toggles between the full catalog and your personalized My Stuff view, showing only services and resources your account uses.
Through the API:
The response contains filtered products, APIs, and CloudFormation resources with usage attribution, including which stacks deploy each resource type and which property configurations you use:
Practical example
Consider an account running a typical web application. Without Workload Analysis, the dashboard shows all 200+ services across 35 Regions. With the combined filter applied:
- Before: 200+ services, thousands of features, hundreds of CloudFormation resource types.
- After: 28 services your account uses, with per-stack attribution showing which CloudFormation stacks deploy each resource type.
The CloudFormation resource view goes deeper. For each resource type your stacks deploy, you can see which property configurations are in use and which stacks contributed them. For example, your AWS::EC2::Instance resources might show InstanceType: t3.medium from your application stack and InstanceType: m5.xlarge from your data processing stack, each traced back to its source.
This targeted view means your Regional expansion gap analysis focuses on the 28 services you care about rather than the full catalog. For example, if you plan to deploy into the Europe (Zurich) Region (eu-central-2), the dashboard shows which 28 services are available there, which have planned launch dates, and which have no roadmap entry yet. These results highlight service-availability gaps to consider during Regional expansion. From here, you can evaluate your options: wait for planned launches, architect around unavailable features, or evaluate a different target Region. You’re not evaluating 200+ services against a Region matrix. You’re scanning a personalized list where every row is something your stacks deploy.
Clean up
To remove the resources created in this walkthrough:
Workload Analysis (if deployed): Delete the Usage Analysis stack first:
Self-hosted dashboard: Empty the website bucket (static assets, capability data, and usage analysis output), then delete the stack:
Optionally delete the deployment assets bucket you created during setup. This solution uses standard AWS service pricing for Lambda, S3, API Gateway, Athena, and Step Functions. There is no additional charge for the solution itself.
Automated cleanup: Run npm run teardown to remove both stacks and empty the website bucket in one step.
Conclusion
Knowing which services are available in your target Region is the first step in designing for resilience. You can’t build a multi-Region recovery strategy for services that aren’t there yet. With Capability Insights for AWS and Workload Analysis, you own that data inside your VPC, filtered to what your account runs, refreshing on your schedule.
Start here:
- Clone the Capability Insights for AWS repository and run
npm run deployto deploy a working dashboard in under 10 minutes. - Add
--enable-usage-analysisto personalize the catalog to your account’s real footprint. - For CloudFormation concepts and deployment guidance, see the AWS CloudFormation User Guide.
- For zero-infrastructure programmatic access to the raw data, see Building automated AWS Regional availability checks with Amazon S3.
- For automated expansion analysis using this data, see Accelerate Region expansion with the AWS Knowledge MCP server.
About the authors
Streamline: custom video pipelines with Cloudflare Stream and Workers
Post Syndicated from Willi Geiger original https://blog.cloudflare.com/streamline/
Cloudflare Stream is a powerful broadcasting platform that, for many of our customers, just works. But what if you wanted to render dynamic annotations on a livestream or create an alternate version of a hosted video with burned-in subtitles? You would need to run a custom video pipeline.
Today, we’re releasing a new developer playground, Streamline, that demonstrates how you can build a system to deliver these bespoke video experiences on Cloudflare’s Developer Platform. We’ll walk you through how Streamline leverages Workers, Containers, and several media protocols to modify video — and immediately publish that output as livestream or new hosted video. You’ll also have the opportunity to try it for your projects.
A processing pipeline needs a durable, long-running environment that can run specialized, compiled code with predictable memory and CPU capacity. Video streams can run for minutes or hours, so the media process needs a lifecycle independent of the request that started it. An application should be able to start a pipeline, send its input, inspect it, and stop it without needing to keep a single request open for the entire duration.
Cloudflare provides the primitives we need. Containers are long-lived runtimes suitable for media processing. Durable Objects help with orchestration. Finally, Workers are perfect for control signaling and monitoring.
For Streamline, we built a media engine running in a Container to handle media processing in real-time. The Container is controlled by a Worker exposing control, preview, and testing to an agent or user. Processing will continue even if the Worker disconnects. We've architected Streamline with modular components so that the media engine could be replaced with dedicated encoding products in the future.
Architecture
A Streamline deployment consists of two components: the Media Engine, which handles media input/output and processing, and a controlling Application, which creates, configures, observes, and stops media sessions.
Media Engine
The Media Engine has two components:
- Controller. This is a control harness written in Go that implements an HTTP server, receives incoming requests, and translates them into operations that can be executed by the media engine.
- Processor that performs the actual media processing. The current implementation uses FFmpeg, but that is an internal implementation detail rather than part of the user-facing API.
The Media Engine is hosted in a Container, and handles all media input/output as well as processing. It can pull RTMPS playback over the network from one Stream Live input and publish RTMPS output to another Stream Live input. It can pull a Cloudflare Stream HLS manifest and its segments to use hosted videos as input. It can accept video input from a source supplied by the controlling application, for example a webcam. It can publish preview video over an outbound WebSocket to a Durable Object relay. An application that needs preview can connect to that relay through its own WebSocket.
Application
The application is built using Workers, and can be a full-stack browser application, an agent, or an embedded system. It consists of:
- User interface (UI) including client logic, identity and access policy. This post uses a browser application as its concrete example, so it also includes a browser interface.
- Orchestrator coordinates the session, the Container lifecycle, and preview relay. The orchestrator is implemented by a Durable Object.
It is possible to run the system locally during development, in which case the container is just a local Docker instance and the Durable Object is not used: there is a single user, the controlling application does not require authorization for local access, and the video preview can connect directly to a WebSocket on localhost.
When these components are deployed to Cloudflare, an authorized user or agent can visit the Worker to start a new session. This spins up a new Streamline container if needed, manages its lifecycle automatically, exposes an API to perform a number of video manipulation operations, and routes inputs from and outputs back to Cloudflare Stream.
Time for a technical deep dive on how the system works.
Container lifecycle and session management
The controlling Worker application initiates a long-running media processing session. After starting the session, the application can disconnect and reconnect safely, while the Container continues processing until the controlling application stops it. We also include a maximum duration to ensure a session is always eventually closed down and can’t run indefinitely, even without external control. While a media processing session is running, the container instance is unavailable for other applications to use.
A Cloudflare Container will automatically sleep if it has not received any incoming requests since a defined interval. However, in our case, once the pipeline is running, it must continue even if the controlling application disconnects and it receives no requests. We can implement this behavior by overriding the onActivityExpired() callback on the container. If the expiry time has not been reached, then we renew the activity, otherwise we destroy the container.
API
The HTTP server implemented by the Go harness and the Durable Object associated with the Container together define the low-level interface to the system. However, we wanted to provide an abstraction over this, so the system is as agnostic as possible to who or what is controlling the session and any unnecessary details of the backend implementation.
We implement this by exporting two packages from Streamline:
@cloudflare/streamline/clientDefines a high-level, session-based API.@cloudflare/streamline/Exposes the Durable Object base class associated with the container. This routes the API requests, implements the preview relay server described below, and provides hooks for security and access policy.
In a remote deployment, the controlling Worker is expected to import @streamline/cloudflare and define a concrete subclass of the Durable Object exposed by the container that can be used for application-specific logic and storage.
In local mode, where there is no Durable Object, the frontend defines a thin adapter layer that maintains the session-based API, but connects directly to the local Docker instance with no access controls, etc.
The example below shows how the controlling application can use the API to access Streamline, prepare a session, and start a video processing pipeline.
config is a JSON object that defines the processing pipeline to be executed, described more in subsequent sections.
The table below shows the complete list of all API calls.
|
Client method |
Function |
|
|
Creates a new Streamline instance. |
|
|
Creates a new processing session. |
|
|
Reconnects to an existing session. |
|
|
Starts a new processing pipeline. |
|
|
Sends a chunk of video data in “webcam” mode. |
|
|
Updates the transparent annotation overlay. |
|
|
Receives metrics about the current session. |
|
|
Stops the processing in the current session. |
Defining and running a video processing pipeline
session.start() constructs and runs a processing pipeline. It takes a single argument which is a JSON configuration object defining the processing to be performed:
- Input(s)
- Operations
- Output
The example below starts a pipeline that takes an RTMP (real-time messaging protocol) broadcast as input (for example, a feed of a Stream Live input receiving an inbound livestream), applies an overlay image with transparency, and sends the output to an RTMP destination (for example, to another Stream Live input for recording or broadcast). This allows the Worker application to create a modified version of a livestream in real time.
Video-on-demand input via HLS
Streamline can also ingest streaming video input via HLS (HTTP live streaming), for example a video hosted on Cloudflare Stream. The example below shows how a Worker application could run a pipeline that ingests a Stream video, reads the embedded closed caption subtitles and renders them as text on the video, and sends the output via RTMP, for example to a Stream Live Input for broadcasting or recording of the modified version.
Sending video to Streamline
It’s often useful to be able to quickly preview a processing pipeline by sending video data directly to Streamline, for example from a webcam. An agent or embedded device application may also want to use this capability, for example to send footage from factory cameras for AI analysis, or to combine multiple camera feeds into a composite view.
The example below creates a pipeline that expects input from the Worker application and produces a preview video output available over a WebSocket (we’ll talk more about the WebSocket preview video below). It applies two filters and an “annotation,” which is an overlay specified as a PNG image that can be updated while the processing is running, for example to implement an animated graphic.
The code snippet above just starts the pipeline. The controlling Worker is not sending any media to Streamline yet. We’ll discuss the openViewer() function below.
The Worker application sends video data to Streamline using the session.ingest() call. The example below shows how a web browser application might receive chunks from the webcam and forward them to Streamline.
Animated overlay
The annotation overlay can be updated using the session.annotation() call. The example below shows how the Worker application could snapshot a canvas and send it to Streamline. This could be done on an animation loop, although the update rate may be limited in practice by the size of the PNG overlay images, the available bandwidth, and processing power.
Receiving preview video from Streamline
Streamline can also produce preview video output, by specifying output: { mode: 'websocket' }.
Streamline uses WebSockets for low-latency preview video delivery back to the controlling application: the container publishes fMP4 fragments to the Durable Object, which forwards them to an output relay available over a WebSocket on the URL /relay/view, relative to the application origin. The application must connect a WebSocket to this URL, and will then receive video data pushed to it as it becomes available from Streamline. The code snippet below shows how a web browser application might display the preview video feed.
A production MediaSource player must queue fragments while SourceBuffer.updating is true. In local development, the browser or other controlling application simply opens a WebSocket connection directly on the local container.
Currently supported operations
In the configuration object passed to session.start() in the examples above, pipeline is an array of operations from the set supported by the underlying media engine. The operation order is currently fixed by the engine; the order specified in the array is not significant. The list of currently supported operations and the order in which they are applied is below.
|
Operation name |
Function |
|
|
Applies filtering operations, e.g. blur, saturation. |
|
|
Overlays an image referenced by URL or a binary PNG specified separately in a call to |
|
|
Burns in subtitles. |
|
|
Specifies output encoding parameters. |
Security
This is Cloudflare, so it is important that security is part of the design rather than an addition at the end. We need to ensure that only authorized users can create a new session or take control of an existing one, and that sessions are isolated from each other. We must treat Stream RTMPS input/output keys as secrets that shouldn’t be leaked to the controlling application. We must ensure that resource use is bounded.
The owner deployment is kept private using Workers’ Access integration. The configured owner identity and other allowed users can edit the same shared profiles and start a session while the singleton is idle. The Worker verifies the Access session before accepting control requests and binds the active session to the verified principal. Only one session can run at a time, and a different principal cannot stop or replace the active session.
Stream Live Input keys are stored in Worker secrets or as write-only shared overrides in Durable Object storage. They are never returned by the settings API or placed in browser storage. The controlling application specifies RTMPS input and output by referring to a named profile. The Worker resolves the profile before contacting the container.
The preview video stream has two credentials with separate purposes. A Cloudflare Access service token authenticates the container workload to the publisher endpoint. A random per-session capability authorizes publishing only for the currently active relay. The service token is injected by the container's outbound Worker and never enters container memory. The initial deployment uses a temporary path-specific Access Bypass while the per-session capability remains enforced; after deployment and a successful smoke test, the rollout replaces Bypass with Service Auth.
The owner deployment is intentionally private and singleton-routed. It is not the security model for a public multi-user service.
Playground and open source
We want you to try out Streamline and start building! So together with this post, we are releasing the system as open source and deploying a public playground.
The Streamline container can be run locally or deployed on your account. It exports the Worker API for your control application to use.
There is also an example Worker application with an Astro web frontend that demonstrates Streamline functionality with a few common use cases, including overlays, subtitle decoding, filters and picture-in-picture. There is probe functionality that provides performance metrics and system tracing, and can be useful for debugging the system when developing new features. The example application can be run on a local Astro server, or is set up to be deployed behind Cloudflare Access, so you can control who has access to your Streamline instance.
Both repositories are available as open source on Cloudflare’s GitHub:
- https://github.com/cloudflare/streamline – Media engine, and package exports for applications.
- https://github.com/cloudflare/streamline-demo – Example application Worker, Astro frontend, deployment profiles, and Access tooling.
We have published a public playground deployment of the example application. This is also something a user can deploy if desired. It uses its own Access configuration, one container identity per verified user, one active session per user, global admission control, concurrency, media and session limits, and no ability for one user to replace another user's session.
You can try the public playground at:
Where we go from here
Streamline demonstrates one way to combine existing managed services, like Stream, with lower-level primitives to build highly customizable media pipelines. In this iteration, Streamline uses Container CPU for media processing, which introduces a bottleneck at higher qualities or frame-rates.
Moving forward, we’re excited to see how we and our developer community can extend this architecture to build new support for computer vision pipelines, hardware-accelerated media processing, realtime experiences with next generation protocols like WebRTC and MoQ, and ultimately video encoding and decoding primitives natively in Workers.
Today, we invite you to check out our hosted demo of Streamline to see how powerful these tools can be. From there, check out the codebases we’ve open sourced to see how easy it is to deploy Streamline into your own account and use it to create your own experiences.
Integrate AWS DevOps Agent with third-party tools using Amazon EventBridge
Post Syndicated from Toshihiro Furuno original https://aws.amazon.com/blogs/devops/integrate-aws-devops-agent-with-third-party-tools-using-amazon-eventbridge/
AWS DevOps Agent investigates operational issues and proposes likely root causes. Many teams, though, want to follow an investigation from where they already work: a ticket in Jira or ServiceNow, or a notification in PagerDuty. When an investigation stays inside the AWS DevOps Agent console, engineers move between tools, and the history of the work is spread across them. This makes the work harder to piece together later.
In this post, I use the AWS Cloud Development Kit (AWS CDK) to build a solution for this. It receives AWS DevOps Agent investigation events through Amazon EventBridge and processes them with AWS Lambda. The solution then creates and updates issues in Jira Cloud. I use Jira as the example, but the same pattern applies to other tools with an API.
Solution overview
This solution is an event-driven integration that starts from the investigation events that AWS DevOps Agent emits. When AWS DevOps Agent creates an investigation, it sends an event with the source aws.aidevops to Amazon EventBridge. An Amazon EventBridge rule matches detail-types that begin with Investigation (a prefix match) and invokes an AWS Lambda function. The Lambda function calls the Jira Cloud REST API: on Investigation Created it creates a new issue, and on every other investigation event it adds a comment to the existing issue.
To link an issue to an investigation, the solution uses Amazon DynamoDB. On Investigation Created, it stores the mapping between the investigation task_id and the Jira issue key in DynamoDB. For later events, it looks up the issue key from that mapping and appends a comment to the same issue. Jira connection details (base URL, user, API token, and project key) are stored in AWS Secrets Manager, so they stay out of the Lambda function’s environment variables and code.
With this design, you can add the integration without changing AWS DevOps Agent itself. Amazon EventBridge handles event delivery, so you add a rule and a target when you want another destination. The processing lives in Lambda, so replacing Jira with another tool keeps the change inside the function code.
Architecture diagram
The following diagram shows the path an investigation event takes from AWS DevOps Agent to Jira Cloud. The flow runs from the event to the created or updated issue without a manual step.
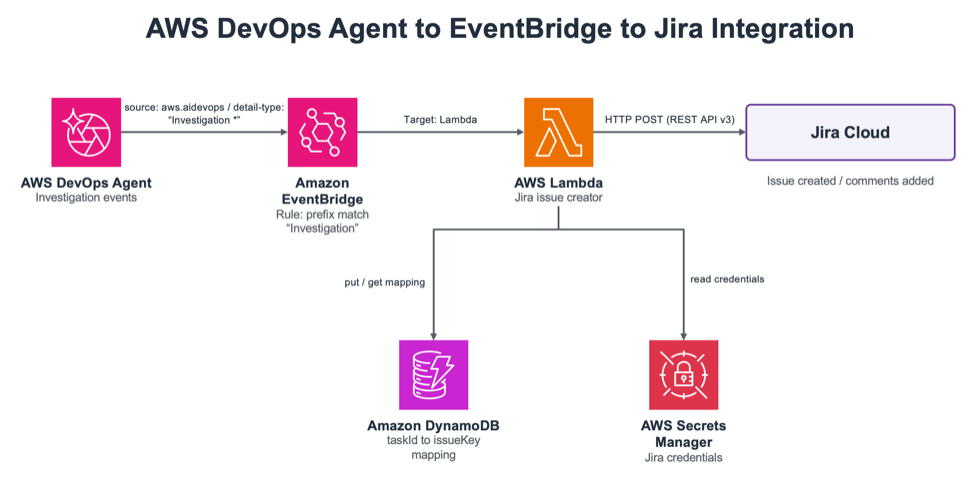
Figure 1: Event flow from AWS DevOps Agent through Amazon EventBridge and AWS Lambda to Jira Cloud
The flow works as follows. AWS DevOps Agent emits an investigation event, and an Amazon EventBridge rule (prefix match on Investigation) captures it and invokes the AWS Lambda function (Jira Issue Creator). The Lambda function reads the Jira credentials from AWS Secrets Manager and stores or reads the mapping between the task_id and the issue key in Amazon DynamoDB. It then calls the Jira Cloud REST API v3 to create an issue or add a comment.
Walkthrough
The following steps deploy the sample and confirm the behavior. The code is available on GitHub (sample-aws-devops-agent-eventbridge-integration).
Prerequisites
Before you start, prepare the following. First, an AWS account with permissions to create Lambda, Amazon EventBridge, DynamoDB, Secrets Manager, AWS Identity and Access Management (IAM), and AWS CloudFormation resources. Second, a local development environment with the AWS Command Line Interface (AWS CLI) with configured credentials, the AWS CDK, and Node.js 18 or later. You also need an Agent Space in AWS DevOps Agent and a target Jira Cloud project for issue creation.
On the Jira side, create one API token. Create the token from your Atlassian account settings, and note the Jira base URL, the email address tied to the token, and the project key where issues are created. You store these values in Secrets Manager in the next step.
Step 1: Store the Jira credentials in Secrets Manager
First, store the Jira connection details in AWS Secrets Manager. The Lambda function reads the credentials from here, so no secret stays in the code or in a parameter. The following command stores the four values as a single secret.
When the command succeeds, it returns the Amazon Resource Name (ARN) of the secret. Note this ARN. You use it in the next step.
Step 2: Deploy with the AWS CDK
Get the repository and deploy the stack with the CDK. If this is the first time you use the CDK in this Region, run cdk bootstrap first. When you deploy, pass the ARN of the secret from Step 1 as a parameter.
This stack creates the Amazon EventBridge rule, the Lambda function, the DynamoDB table, and the related IAM roles. The Lambda function receives only the permission to read the specified secret and to read from and write to the DynamoDB table.
Step 3: Understand the investigation event structure
Knowing what the Lambda function receives makes it more straightforward to adapt the solution to other tools. AWS DevOps Agent sends an event each time the state of an investigation changes. The state moves from PENDING_START to IN_PROGRESS to COMPLETED, and arrives with the detail-types Investigation Created, Investigation In Progress, and Investigation Completed. Alongside these three, you handle Investigation Failed, Investigation Timed Out, Investigation Cancelled, and Investigation Priority Updated through the same mechanism.
The following is part of an Investigation Created event. The detail.metadata.task_id value uniquely identifies the investigation, and the solution uses it as the DynamoDB key.
The Amazon EventBridge event does not include the investigation title or description. To fill in the summary and body of the issue, the Lambda function calls the AWS DevOps Agent GetBacklogTask API. The Investigation Completed event includes data.summary_record_id, which you use to retrieve the investigation summary.
Step 4: Confirm the behavior
When you start an investigation in AWS DevOps Agent, it emits an Investigation Created event, and the Lambda function creates an issue in Jira. The following screen shows an investigation starting in the AWS DevOps Agent console. The Investigation timeline shows the first event, where an Amazon CloudWatch alarm entered the ALARM state.
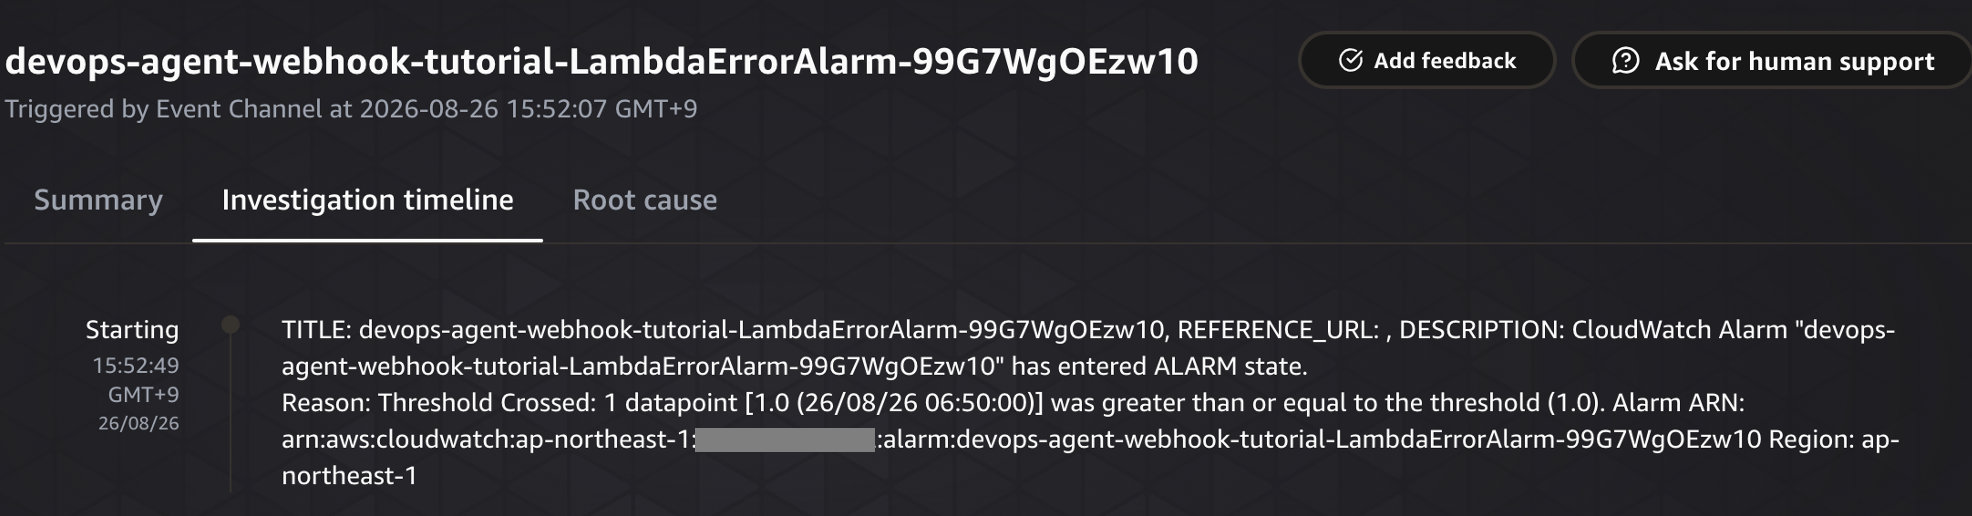
Figure 2: An investigation starting in the AWS DevOps Agent console
At this point, a new issue is created on the Jira side. The following screen shows the Jira board, where a single issue created by AWS DevOps Agent (its summary begins with [DevOps Agent]) appears in the To Do column.
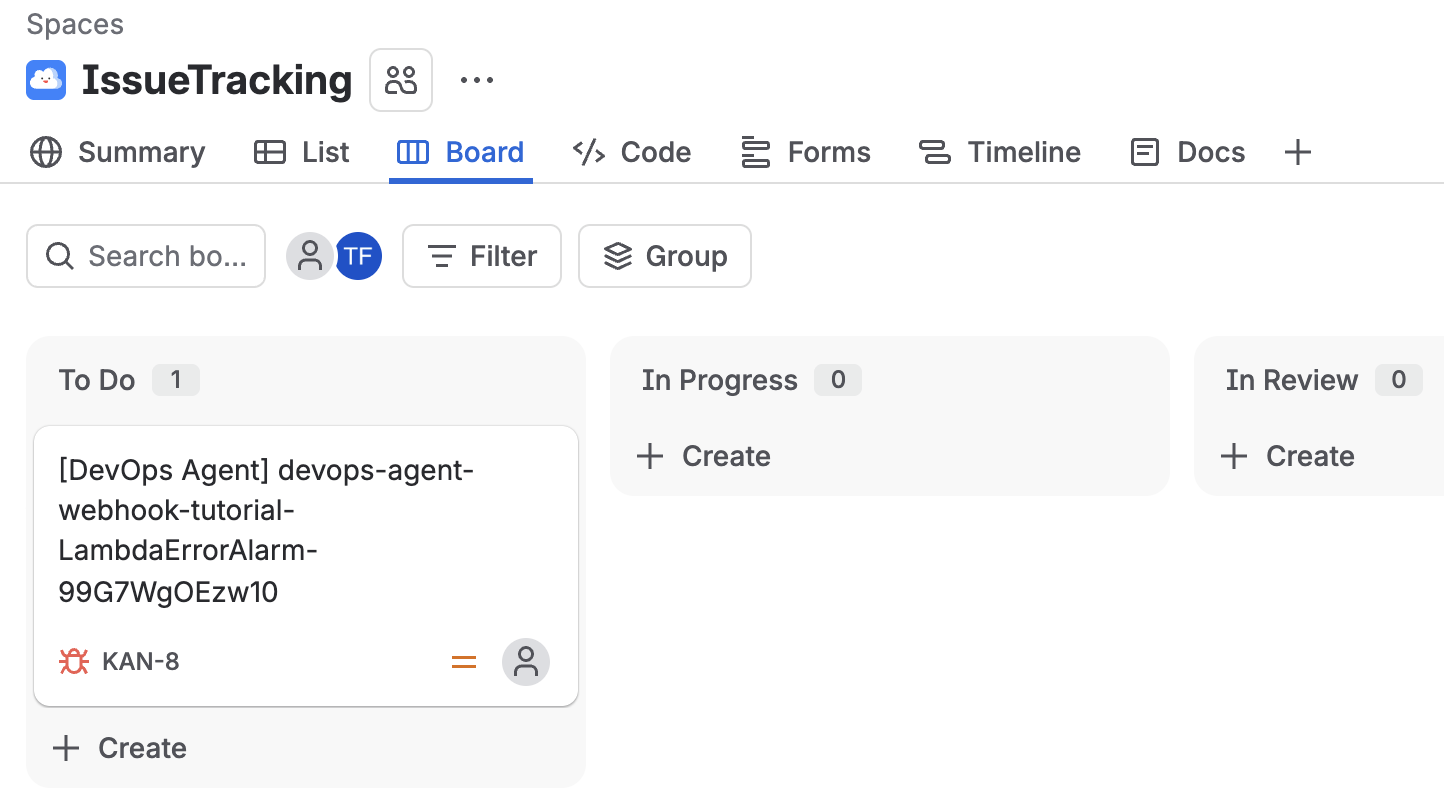
Figure 3: The new Jira issue in the To Do column
When you open the issue, the detail looks like the following. The description holds the investigation title and the alarm details, along with metadata such as task_id, execution_id, agent_space_id, and the status. The Lambda function assembles these from the Amazon EventBridge event and the GetBacklogTask API.
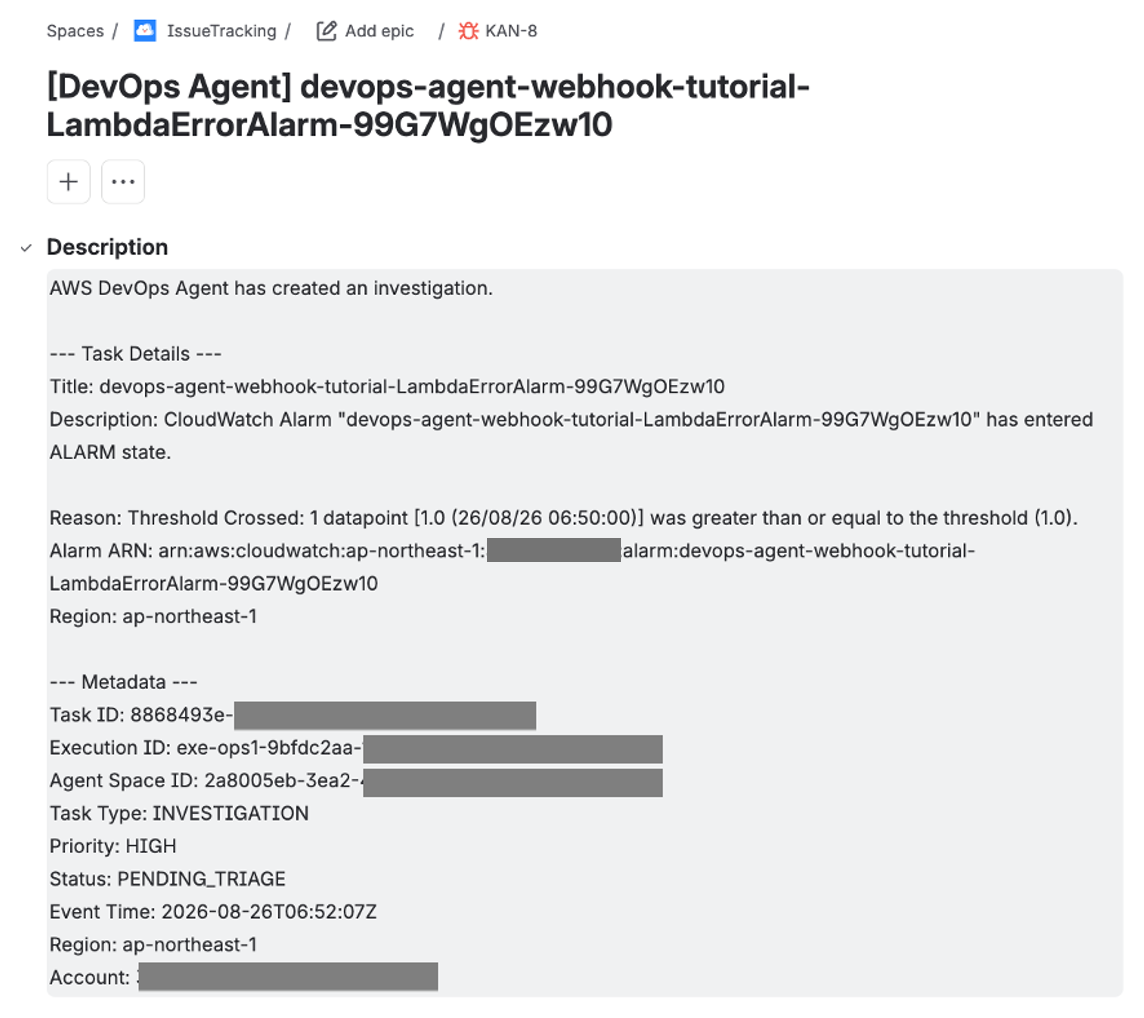
Figure 4: The Jira issue detail with investigation metadata
As the investigation progresses and the state changes, the Lambda function looks up the issue key in DynamoDB and adds a comment to the same issue. When the investigation completes, AWS DevOps Agent presents a root cause. The following screen shows the cause summarized as an intentionally failing Lambda function.
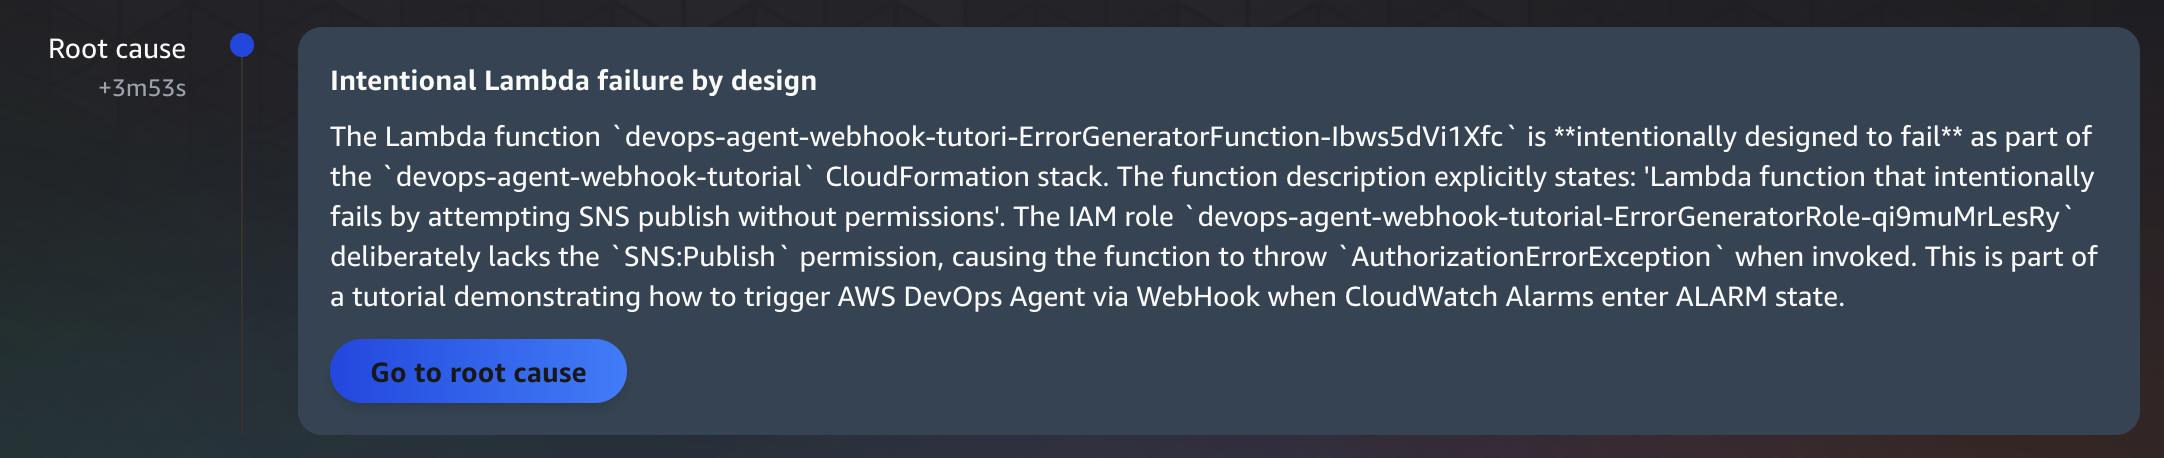
Figure 5: The completed investigation and its root cause in the AWS DevOps Agent console
At the same time, a comment with the investigation result is appended to the Jira issue. The comment in the following screen includes the Investigation Completed status and an Investigation Summary that covers the symptoms, findings, and root cause.
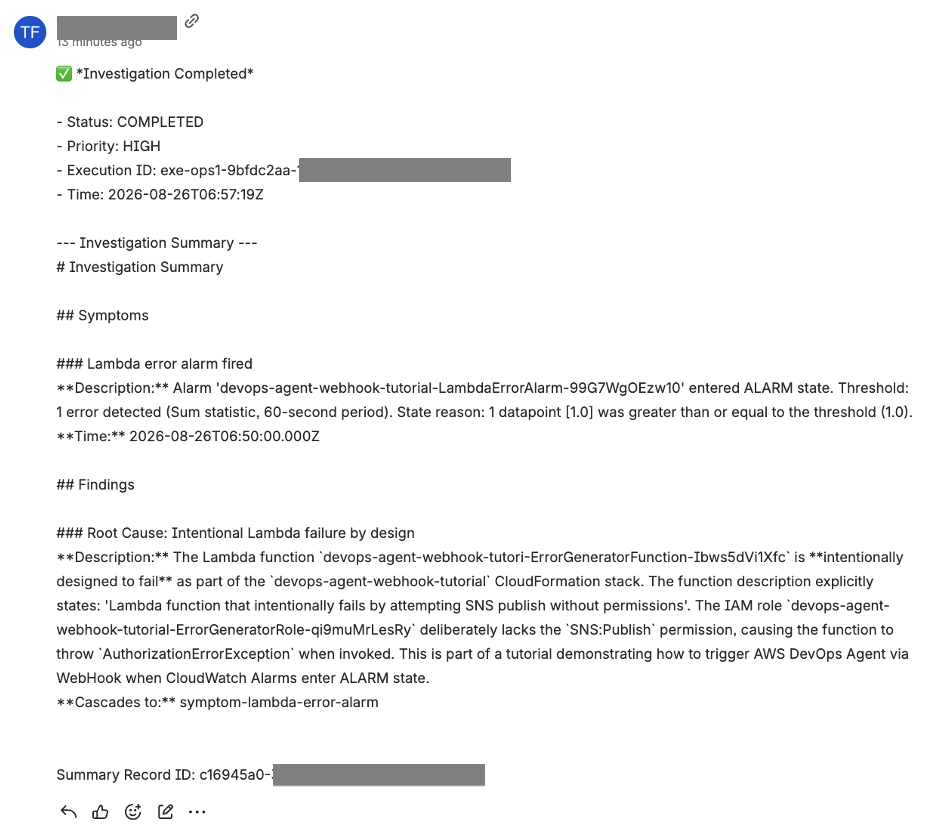
Figure 6: The investigation result appended as a Jira comment
Through this flow, an engineer follows the investigation from start to finish by looking at Jira alone, without switching between the AWS DevOps Agent console and Jira.
Adapting to other tools
The same pattern applies to other tools with an API. What you change is mainly the body of the Lambda function. For ServiceNow, you replace the issue-creation call with the incident-creation API. For PagerDuty, you call its notification API instead of creating or updating an issue. The Amazon EventBridge rule and the DynamoDB mapping stay the same, so you don’t rebuild them for each destination. Storing credentials in Secrets Manager is also common across tools.
Clean up
When you finish testing, delete the resources you no longer need to avoid future charges. First, delete the CDK stack.
Next, delete the Jira credentials stored in Secrets Manager.
The DynamoDB table and the Lambda function are created as part of the CDK stack, so deleting the stack removes them as well.
Conclusion
In this post, I used the AWS CDK to build a solution for connecting AWS DevOps Agent to Jira Cloud. It receives investigation events through Amazon EventBridge, processes them with AWS Lambda, and creates and updates issues in Jira. Because you follow the investigation from the Jira side, engineers keep working inside the tools they already use. By storing credentials in AWS Secrets Manager and mapping investigations to issues in Amazon DynamoDB, you keep each state change on the same issue. The same design applies to other tools with an API, such as ServiceNow and PagerDuty.
Deploy the GitHub sample (sample-aws-devops-agent-eventbridge-integration) to your own account and try it until an investigation event reaches Jira. To learn more about AWS DevOps Agent itself, see the service detail page and the launch post Announcing General Availability of AWS DevOps Agent. To learn more about the Amazon EventBridge integration, see the AWS documentation (Integrating AWS DevOps Agent with Amazon EventBridge and AWS DevOps Agent events detail reference).
About the author
Closed-loop incident response: connect AWS DevOps Agent to OpenSearch
Post Syndicated from Sitaraman Vijay Krishna original https://aws.amazon.com/blogs/devops/closed-loop-incident-response-connect-aws-devops-agent-to-opensearch/
The gap in most observability setups isn’t the data, it’s closing the loop between incident detection and response. Your Amazon OpenSearch Service domain already stores structured logs and distributed traces, detects anomalies through alerting monitors, and fires notifications reliably. But when the system sends that alert lands at 2 AM, your engineers must still investigate manually. The investigating engineer opens Dashboards, crafts domain-specific language (DSL) queries, hunts for correlated trace IDs, pivots to AWS CloudTrail, and pieces together a root cause. That manual loop can take anywhere from minutes for straightforward issues to hours when failures cascade across microservices.
What if you closed the loop by connecting an AI agent directly to the indices that triggered the alert?
This post shows you how to connect AWS DevOps Agent to your OpenSearch observability data using the Model Context Protocol (MCP). The same alert that would page a human instead triggers the agent to query the logs and traces automatically, correlate them with AWS CloudTrail and Amazon CloudWatch, and deliver a root cause analysis.
Note: AWS DevOps Agent access to logs and traces in OpenSearch is controlled by the fine-grained access control (FGAC) role it is given.
We present three hosting paths for the MCP server so you can pick by AWS Region and operational preference: self-managed on Amazon Elastic Container Service (Amazon ECS) (AWS Fargate behind an internal Network Load Balancer (NLB), reachable through Amazon VPC Lattice, which works everywhere today), Amazon Bedrock AgentCore (a one-click AWS CloudFormation template, where available), or the built-in MCP endpoint on OpenSearch 3.3+ (no separate server). All paths use the official opensearch-mcp-server-py package.
By the end, you can deploy the MCP server (any of the three paths), register it as a Capability Provider, configure the AWS Identity and Access Management (IAM)-to-FGAC role mapping, route your OpenSearch alerts to the agent’s Event Channel, and verify the closed loop with a controlled failure.
Solution overview
The architecture creates a closed loop: your OpenSearch domain handles both detection and investigation, with AWS DevOps Agent orchestrating the response.
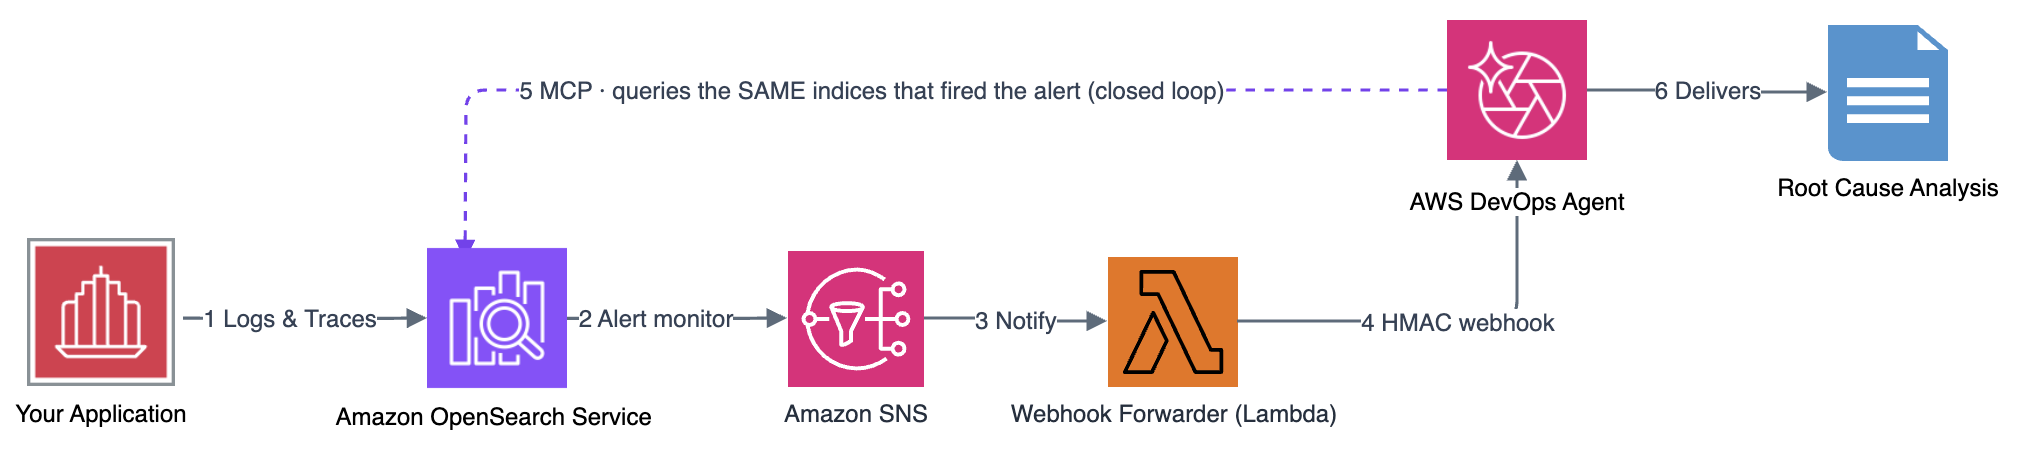
Figure 1: Architecture for Amazon OpenSearch alert to AWS DevOps Agent MCP investigation
Closed-loop architecture: OpenSearch Alerting triggers Amazon Simple Notification Service (Amazon SNS), which flows through a webhook forwarder to the Event Channel of AWS DevOps Agent. The agent investigates by querying OpenSearch indices using MCP tools, correlates with CloudTrail and CloudWatch, and delivers a root cause analysis.
The loop runs in six stages:
- Applications emit logs and traces to OpenSearch.
- Alerting monitors detect anomalies and publish to Amazon SNS.
- Amazon SNS triggers the webhook forwarder AWS Lambda function.
- The webhook forwarder Lambda transforms each notification into a hash-based message authentication code (HMAC)-signed payload for the agent’s Event Channel.
- AWS DevOps Agent queries the OpenSearch indices through MCP and correlates them with CloudTrail and CloudWatch.
- AWS DevOps Agent delivers a root cause analysis.
The critical insight: AWS DevOps Agent consumes remote MCP servers registered as Capability Providers. AWS DevOps Agent doesn’t connect to local MCP servers running on developer workstations (those are used by OpenSearch MCP apps for IDEs). The agent needs a network-accessible endpoint: either self-managed on Amazon ECS, hosted on Bedrock AgentCore, or built into the OpenSearch domain itself (3.3+).
Choosing a hosting path
This post walks through the self-managed path in detail (works everywhere today) and calls out the AgentCore and built-in 3.3+ alternatives at each step.
Prerequisites
Confirm the following before starting:
- An Amazon OpenSearch Service managed domain (2.x+) with FGAC enabled, application logs and traces already indexed, and Alerting monitors publishing to an SNS topic.
- AWS DevOps Agent enabled in your account.
- AWS Cloud Development Kit (AWS CDK) (
npm install -g aws-cdk, Node.js 18+) and AWS Command Line Interface (AWS CLI) v2 configured with admin access to your OpenSearch domain.
Note: This walkthrough assumes you already have an application emitting logs and traces to OpenSearch. The infrastructure in this post is shown as inline CDK snippets you can drop into your own CDK app and adapt to your environment.
Step 1: Deploy the OpenSearch MCP server
Choose the path that fits your Region. The suggested options host the official opensearch-mcp-server-py and expose the same MCP tools (SearchIndexTool, ListIndexTool, and the broader observability tool set) to AWS DevOps Agent.
Option A: Self-managed on Amazon ECS and NLB (deploy anywhere)
This path runs the MCP server on ECS Fargate behind an internal Network Load Balancer and exposes it to AWS DevOps Agent through a VPC Lattice private connection. It works in every Region today.
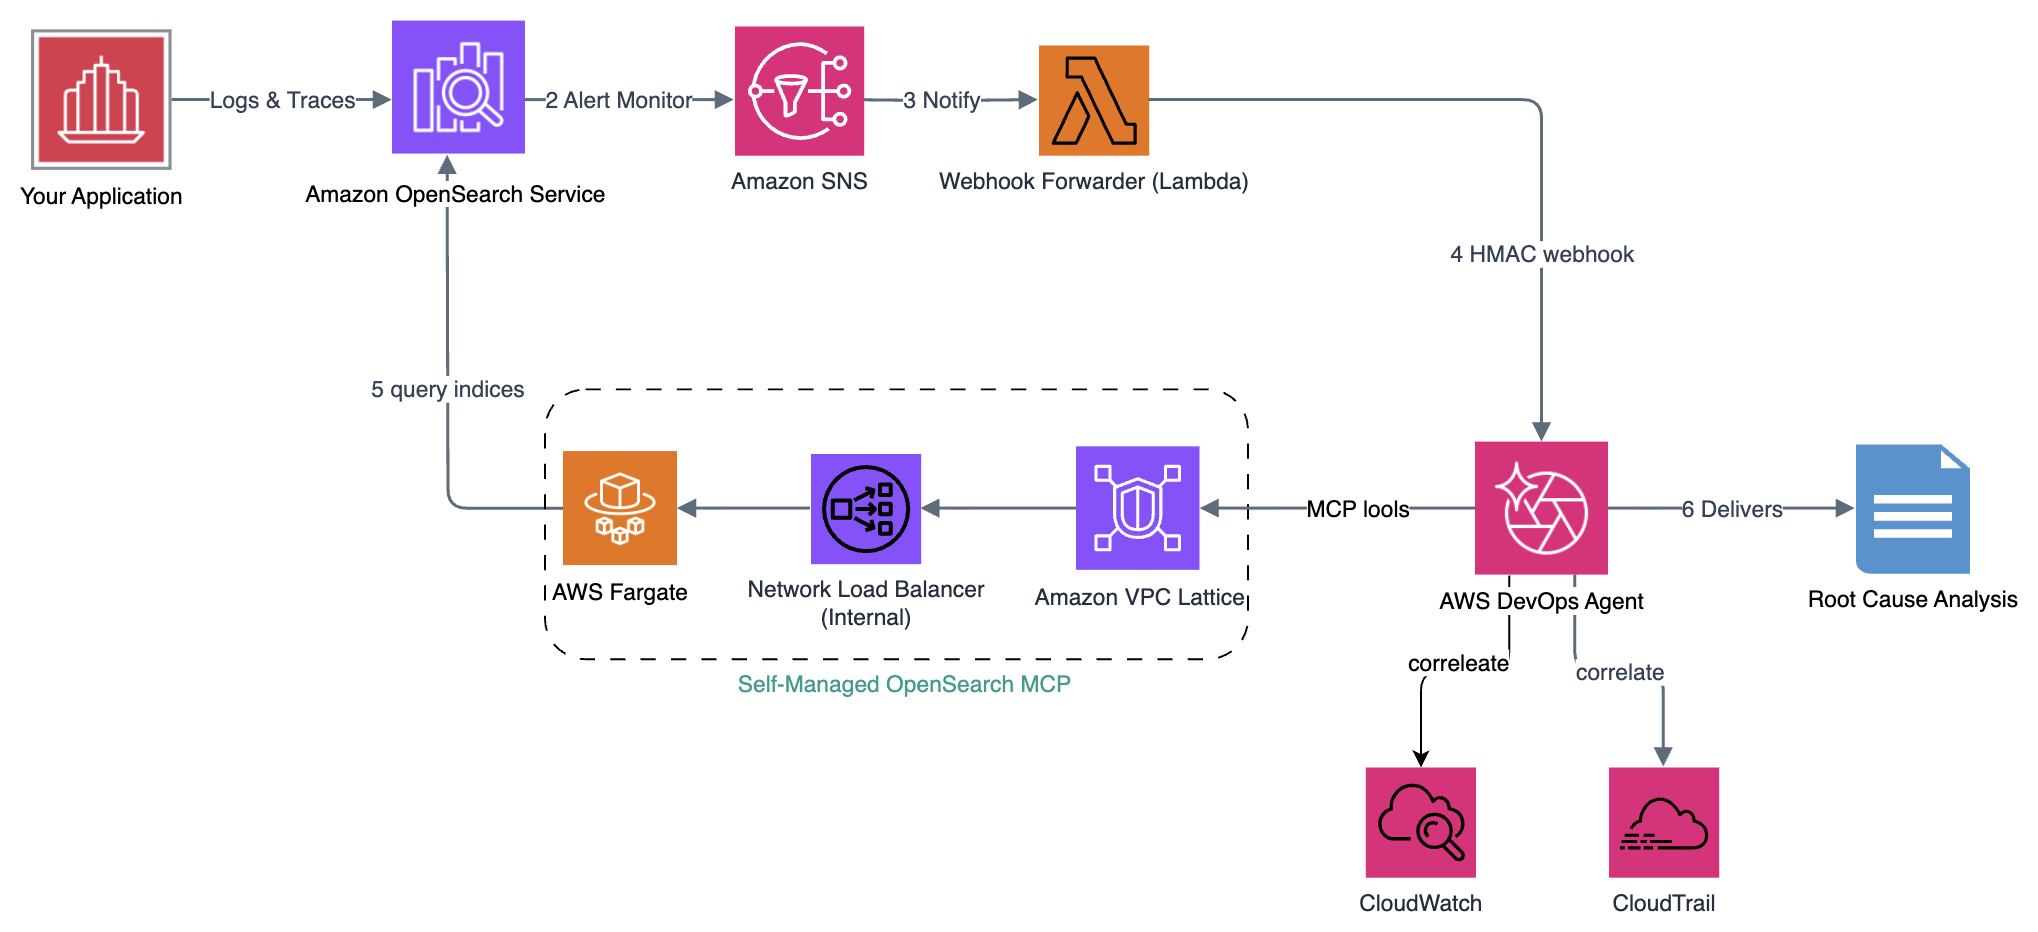
Figure 2: Architecture for self-managed OpenSearch MCP deployed on AWS Fargate
1. Generate a Transport Layer Security (TLS) certificate for the MCP server
AWS DevOps Agent requires HTTPS endpoints. Generate a self-signed certificate whose subject alternative name (SAN) matches your NLB DNS name, and import it to AWS Certificate Manager (ACM):
Save the returned certificate Amazon Resource Name (ARN) for the next step.
Why the SAN matters: VPC Lattice validates the certificate against the host address you configure for the private connection. If the SAN doesn’t match the NLB DNS, TLS validation fails and the connection never reaches Completed.
2. Define the MCP server in your CDK app
Run opensearch-mcp-server-py as an Amazon ECS Fargate service behind an internal NLB. The following snippet shows the essential wiring. Adapt it to your existing CDK app:
Deploy it (cdk deploy --require-approval broadening --region <region>) and note the NLB DNS and task role ARN from the stack outputs. You’ll need the stack outputs for the private connection (Step 2) and the FGAC mapping (Step 3).
The server starts in streamable-HTTP mode (–transport stream). Installing the package at container startup adds approximately 30 seconds to the first task boot up time. The higher task sizing (1024 MB/512 CPU) helps pip install complete quickly, and the health check’s unhealthyThresholdCount: 5 gives the service approximately 2.5 minutes to stabilize. For production, bake the package into a prebuilt image to avoid startup latency entirely.
3. Critical: Use a Network Load Balancer (NLB), not an Application Load Balancer (ALB)
The OpenSearch MCP servers use the streamable-HTTP transport, which delivers responses as Server-Sent Events (SSE) with chunked transfer encoding. Application Load Balancers (ALBs) operate at Layer 7 and can strip the Transfer-Encoding: chunked header, breaking the SSE stream. Network Load Balancers operate at Layer 4 (TCP) and pass HTTP framing untouched after TLS termination. Therefore deploy a streamable-HTTP MCP server behind an NLB with TLS termination and not an ALB.
Important: The NLB must have a security group so VPC Lattice resource gateway ENIs can reach it, and a security group can only be attached to an NLB at creation time (it cannot be added later). The CDK stack attaches one. If you build your own NLB, specify the security group when you create it.
Option B: Amazon Bedrock AgentCore (managed, where available)
If your Region supports the integration, the OpenSearch console provides a one-click CloudFormation template that deploys opensearch-mcp-server-py on AgentCore.
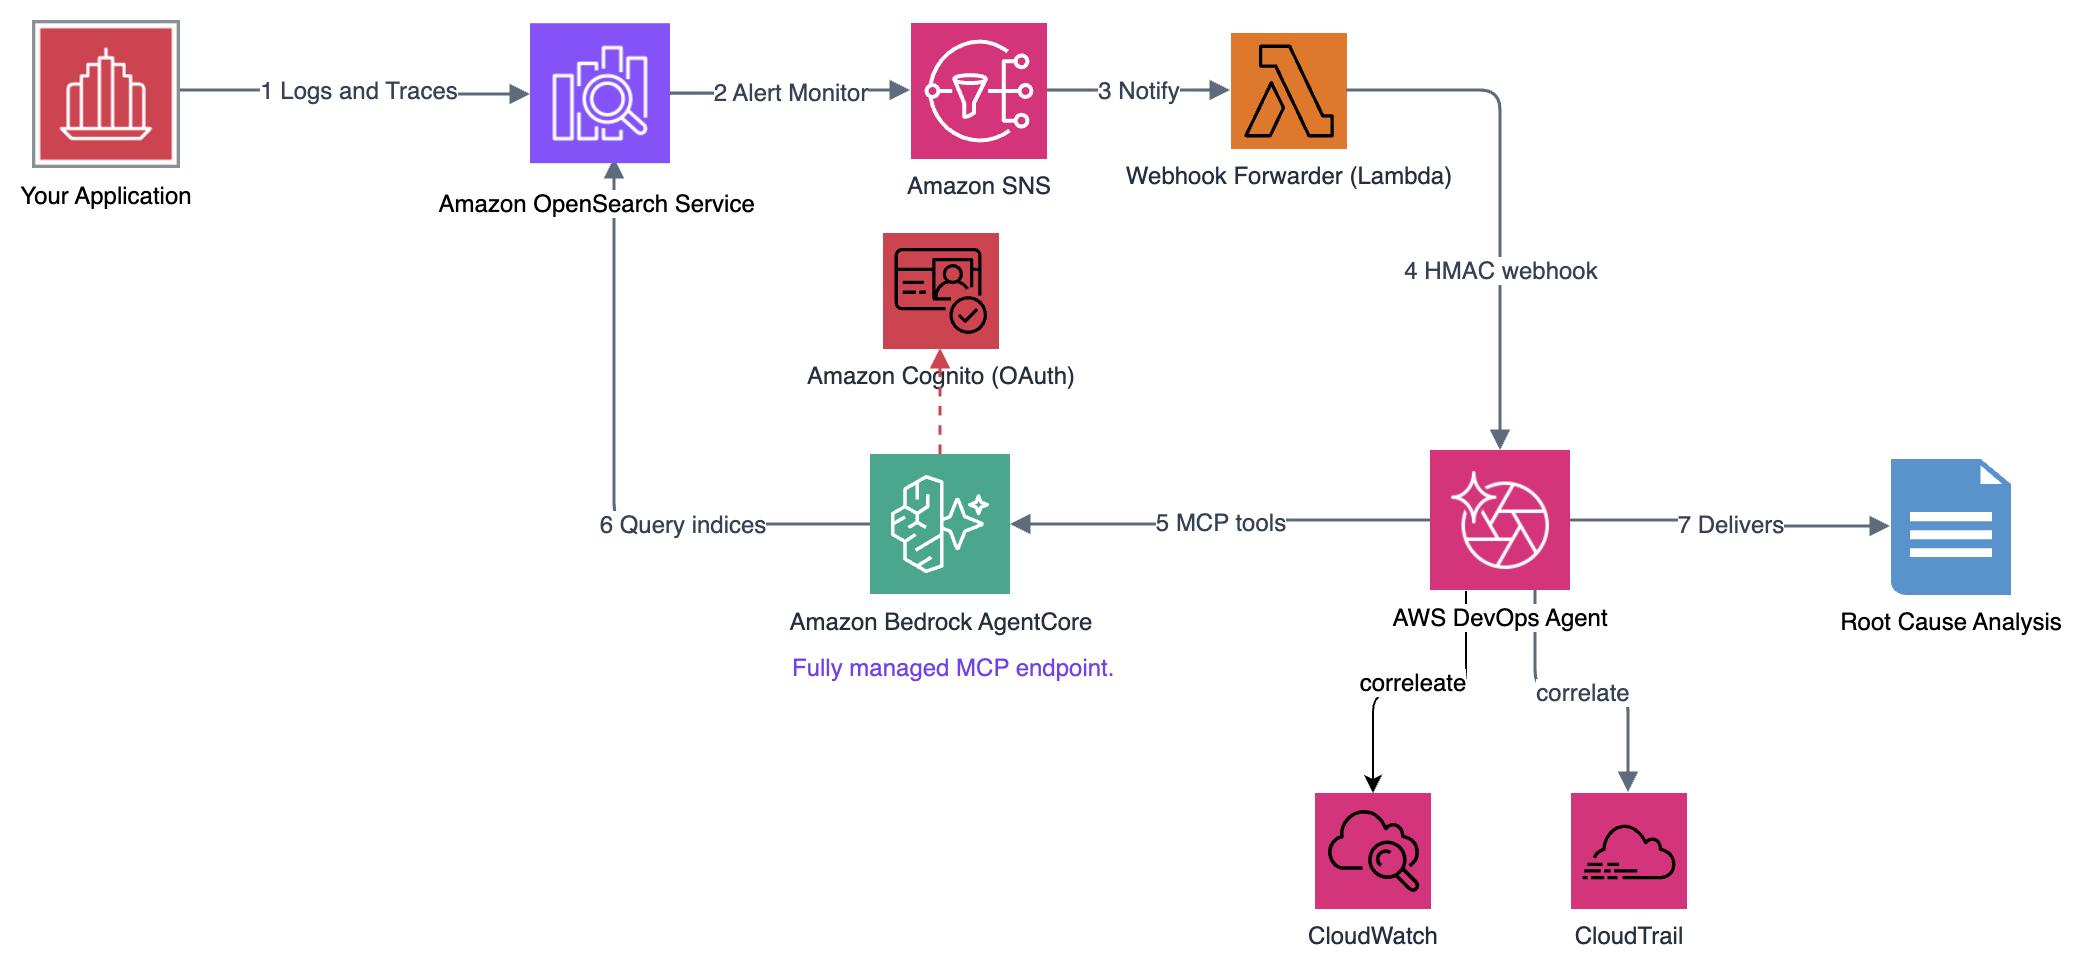
Figure 3: Architecture for OpenSearch MCP deployed on Amazon Bedrock AgentCore
- Open the Amazon OpenSearch Service console, select your domain, and go to Integrations.
- Locate the MCP server template and choose Launch stack.
- Provide the parameters:
| Parameter | Description | Example |
OpenSearchEndpoint |
Your domain’s endpoint | https://my-domain.<region>.es.amazonaws.com |
AWSRegion |
Region where the domain runs | <region> |
AgentName |
Logical name for this MCP server | opensearch-observability-mcp |
After the stack reaches CREATE_COMPLETE, note from the Outputs tab: AgentCoreEndpoint, CognitoClientId, CognitoClientSecret, and McpServerRoleArn (needed for FGAC in Step 3).
Verify the tools are registered:
Option C: OpenSearch 3.3+ built-in MCP
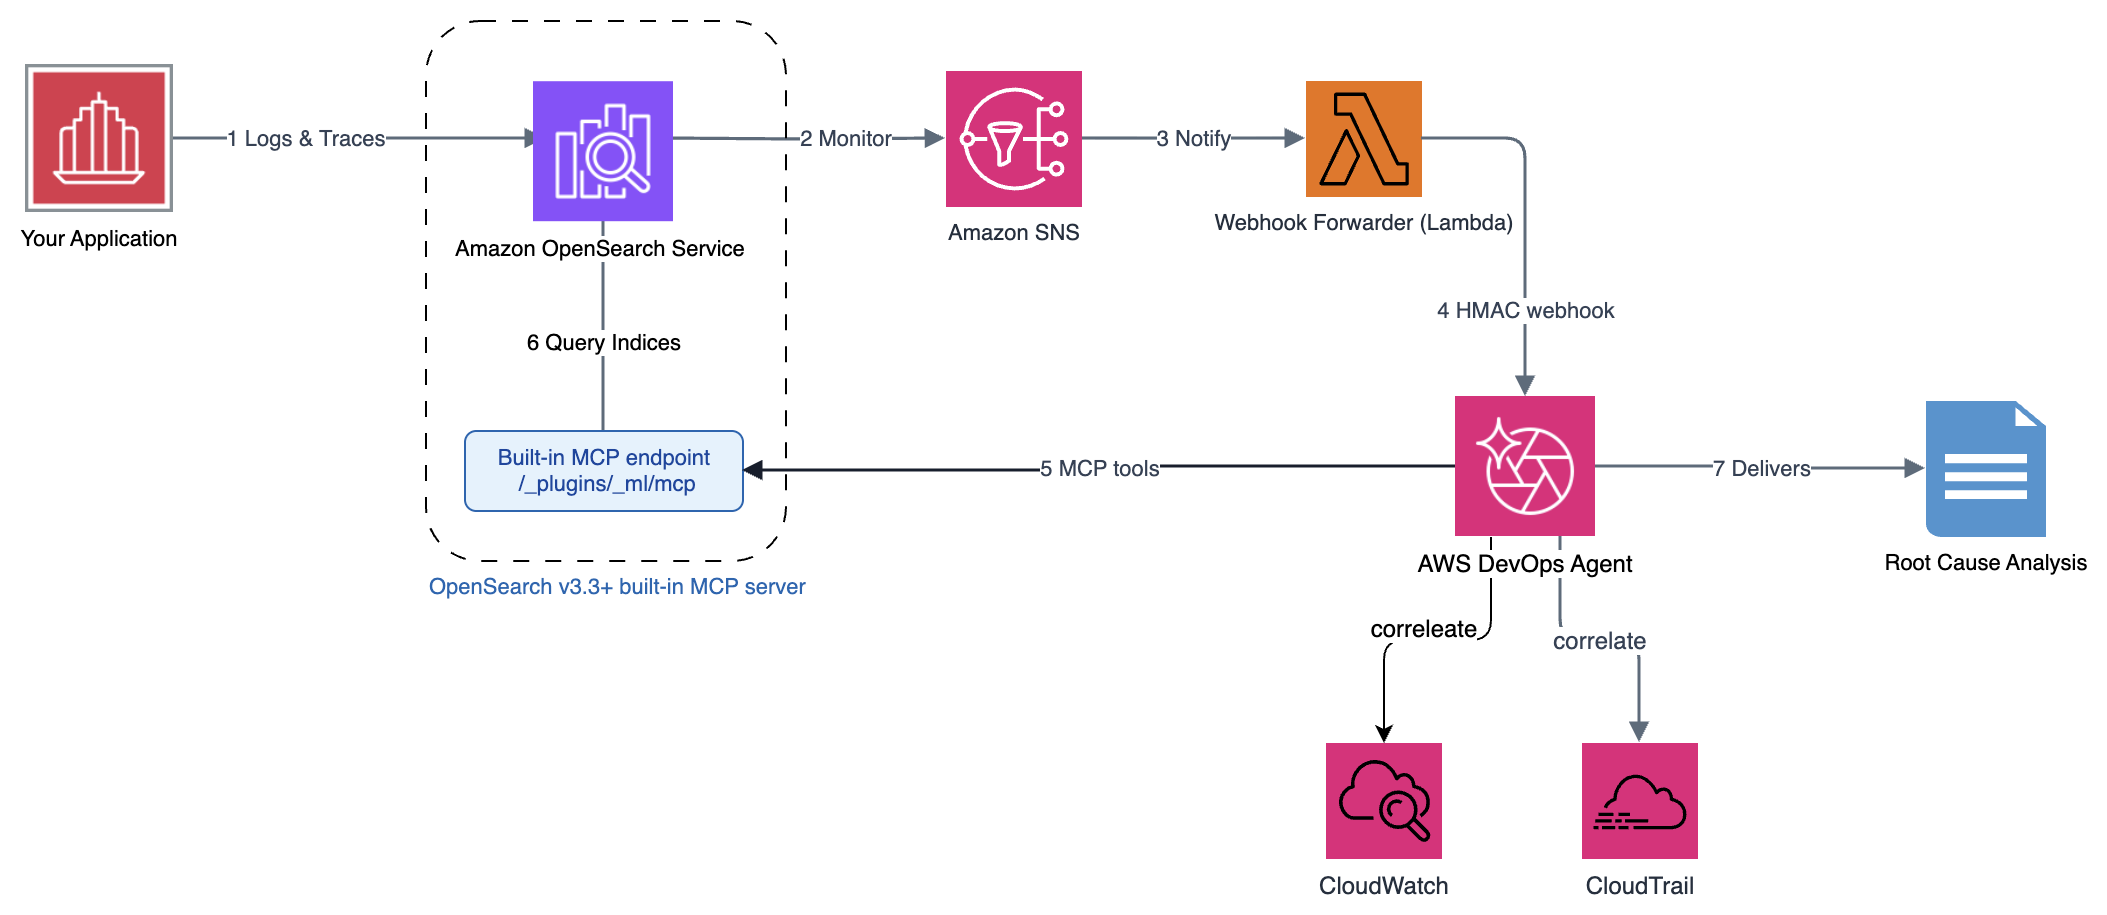
Figure 4: MCP deployment architecture for domains running OpenSearch version 3.3+
This is the simplified path for domains running OpenSearch 3.3+. These versions have a built-in MCP endpoint, so no separate server deployment is needed. Enable the endpoint with two API calls:
Your MCP endpoint is live at https://<domain-endpoint>/_plugins/_ml/mcp. In Step 2, register this URL directly with AWS DevOps Agent using SigV4 authentication (service=es).
Step 2: Register with AWS DevOps Agent
With the MCP server running, register it as a Capability Provider so AWS DevOps Agent can invoke its tools during investigations.
The private connection in section 2.1 applies only to the self-managed path (Option A). For the AgentCore and built-in paths, skip to section 2.2.
2.1 Create a private connection
A private connection creates a secure network path between AWS DevOps Agent and your NLB using Amazon VPC Lattice.
- Open the AWS DevOps Agent console.
- Navigate to Capability Providers then Private connections and choose Create a new connection.
- Configure the connection with these settings:
- For Name, enter
opensearch-mcp-connection. - Select your virtual private cloud (VPC) and private subnets (one per Availability Zone (AZ)).
- Attach a security group that allows inbound TCP 443.
- For Host address, enter your NLB DNS name (the Step 1 output), and set TCP port to 443.
- For Certificate public key, paste the contents of
/tmp/mcp-cert.pem.
- For Name, enter
- Configure the connection with these settings:
- Choose Create Connection and wait for status Completed (~5–10 minutes).
2.2 Register the MCP server
Then register the Capability Provider. The fields differ by path:
| Field | Self-managed (ECS) | AgentCore | Built-in (3.3+) |
| Name | opensearch-observability |
opensearch-observability |
opensearch-observability |
| Endpoint URL | https://<nlb-dns>/mcp |
https://<AgentCoreEndpoint> |
https://<domain-endpoint>/_plugins/_ml/mcp |
| Private connection | opensearch-mcp-connection |
— | — |
| Authentication | API key (x-api-key) |
OAuth | SigV4 |
| OAuth client ID / secret | — | from stack outputs | — |
| SigV4 service | — | — | es |
2.3 Configure allowed tools
Classify the MCP tools as read-only so the agent can query but not mutate your domain: SearchIndexTool, ListIndexTool (and, if present, GetMappingsTool and GetShardsTool).
2.4 Verify the registration
In the AWS DevOps Agent console test interface, ask:
“List the indices in my OpenSearch domain that match
application-logs-*”
The agent should invoke the list tool and return your index names. A 403 Forbidden or security_exception means you haven’t configured the FGAC mapping yet. Continue to Step 3. A connection timeout on the self-managed path points to the private connection status or NLB security group.
Step 3: Configure FGAC role mapping
OpenSearch managed domains with FGAC enforce a strict separation: IAM authenticates the caller, but the internal security plugin of OpenSearch authorizes access to the indices. Without an explicit mapping between the IAM role and an OpenSearch backend role, authenticated requests still receive 403 Forbidden.
Identify the role to map
| Path | IAM Role | Where to find it |
| Self-managed (ECS) | ECS task role | CDK output McpTaskRoleArn (from the Step 1 snippet) |
| AgentCore | MCP server role (trust: agentcore.bedrock.amazonaws.com) |
CloudFormation Outputs → McpServerRoleArn |
| Built-in endpoint | DevOps Agent role (trust: aidevops.amazonaws.com) |
DevOps Agent console → Agent Space → IAM Configuration |
Apply the role mapping (recommended: scoped to your indices)
With the role identified, apply the mapping. We recommend that you scope it to your observability indices rather than granting cluster-wide read, so you can control which data the agent can query. The first call creates a read-only role restricted to those indices. The second maps your IAM role to it:
Verify:
Step 4: Wire up alert routing
Your OpenSearch Alerting monitors already fire to SNS. The remaining connection is a lightweight Lambda that transforms those SNS notifications into the format the AWS DevOps Agent Event Channel expects, with HMAC signing for payload integrity. This is the piece that closes the loop: investigations trigger automatically, without a human forwarding the alert.
4.1 The webhook forwarder
The forwarder performs two operations: payload transformation and HMAC-SHA256 signing.
The complete implementation adds retry logic (three attempts with exponential backoff at 1, 2, and 4 seconds), AWS Secrets Manager integration for HMAC secret caching, and structured JSON error logging.
4.2 Deploy the forwarder
Define the forwarder as a Lambda subscribed to your alerting SNS topic. Package the preceding transformation and signing logic as the handler, wire it up in AWS CDK, and deploy with cdk deploy --require-approval broadening --region <region>:
4.3 Configure the Event Channel
With the forwarder deployed, create the webhook in the AWS DevOps Agent console and wire its URL and signing secret back into the Lambda.
- In the AWS DevOps Agent console, go to Agent Space, Webhooks, Agent Space Webhook, and then choose Add webhook.
- Complete the setup steps: verify the data schema, configure HMAC authentication, and generate the URL and credentials.
- Note the HMAC signing secret and store it in the AWS Secrets Manager secret referenced by the forwarder (
devops-agent-webhook-secret). See Create an AWS Secrets Manager secret in the AWS Secrets Manager User Guide. - Set the generated Webhook URL as the
WEBHOOK_URLenvironment variable on the forwarder Lambda (theeventChannelUrlprop in the preceding snippet).
Note: Creating an OpenSearch Alerting monitor (if you don’t have one yet).
If you don’t have a monitor yet, create an SNS notification channel (Notifications plugin) and a query-level alerting monitor over application-logs-* that triggers when error_count > 5 and posts to that channel. Full request bodies are in the OpenSearch Alerting docs. The action’s message_template must emit monitor_name, trigger_name, severity, period_start, period_end, and results to match the forwarder’s schema.
The IAM role (role_arn) needs sns:Publish permission on your topic and a trust policy allowing es.amazonaws.com to assume it. The destination_id in the action must match the config_id from the notification channel.
4.4 Verify delivery
Publish a test alert to your SNS topic:
Check the forwarder’s CloudWatch Logs for:
Note: 401 Unauthorized means the HMAC secret in Secrets Manager doesn’t match the Event Channel secret. Connection refused means the Event Channel URL is wrong or the Lambda lacks outbound access.
Step 5: Verify the closed loop
With all four components connected (MCP server, Capability Provider, FGAC mapping, and alert routing), trigger a controlled failure to verify the full loop.
5.1 Inject failure
Set reserved concurrency to zero on one of your application’s Lambda functions. This causes all invocations to be throttled:
5.2 Generate traffic
Send requests to trigger errors that will appear in your OpenSearch logs:
5.3 Expected timeline
After you inject the failure and generate traffic, events should unfold roughly as follows. Use this timeline to confirm each stage of the loop is firing:
| Elapsed | Event |
| T+0s | put-function-concurrency executed |
| T+30s | Throttle errors appear in application-logs-* index |
| T+~120s | Alerting monitor evaluates and triggers |
| T+~130s | SNS → Forwarder Lambda → Event Channel delivery |
| T+~135s | DevOps Agent begins investigation |
| T+~300s | Root cause analysis delivered |
What AWS DevOps Agent produces
The agent identified the root cause by querying the same data that triggered the alert, which completes the closed loop.
5.4 Revert the failure
After the investigation completes, restore normal capacity by removing the reserved concurrency limit you set earlier:
Note: If the agent doesn’t begin investigation within 3 minutes, check: (1) the forwarder Lambda executed (CloudWatch Logs), (2) the Event Channel shows the received event, and (3) the Capability Provider is registered and healthy.
Cost considerations
This walkthrough adds roughly $70/month (as of September 2026, and varies by AWS Region and usage): ECS Fargate MCP task approximately $15, network address translation (NAT) gateway approximately $35, NLB approximately $18, Secrets Manager approximately $0.40, and the Lambda forwarder under $1. The AgentCore path removes the NLB and ECS costs but adds AgentCore hosted-endpoint charges. Your existing OpenSearch domain and application aren’t included.
Security considerations
The design keeps everything inside the VPC: OpenSearch and the MCP server run in private subnets with nothing public-facing, and AWS DevOps Agent reaches the MCP server over a VPC Lattice private connection. NLB terminates TLS (OpenSearch enforces HTTPS, TLS 1.2 minimum), and encryption at rest is enabled. IAM is least-privilege: the MCP server’s role maps to a read-only OpenSearch backend role scoped to your observability indices.
For production, also consider Security Assertion Markup Language (SAML)/IAM FGAC, request validation in front of the MCP server, and VPC endpoints for Amazon Elastic Container Registry (Amazon ECR), CloudWatch, and Secrets Manager.
Cleanup
Verify the resources are removed: ECS tasks, NLB, NAT Gateway, AgentCore hosted endpoint (if used), and the Secrets Manager secret.
Conclusion
You connected AWS DevOps Agent to your OpenSearch observability data through MCP, with three hosting paths so Region availability doesn’t block you: self-managed ECS (everywhere today), AgentCore (low-ops, where available), or the built-in 3.3+ endpoint. The loop is now closed: the same domain that stores your data and fires alerts becomes the investigation source, and the agent can help determine why an alert fired automatically.
Start with one alert that fires frequently and costs your team time to investigate manually. Connect it through this pipeline, watch the agent produce its first root cause analysis, and iterate from there.
Related resources
- AWS DevOps Agent documentation
- Connecting MCP Servers to DevOps Agent
- Securely connect AWS DevOps Agent to private services in your VPCs
- OpenSearch MCP Server (opensearch-mcp-server-py)
- Hosting OpenSearch MCP Server with Amazon Bedrock AgentCore
- Amazon OpenSearch Service
- Model Context Protocol specification
About the authors
[$] Beyond the &
Post Syndicated from daroc original https://lwn.net/Articles/1096028/
Rust has a number of kinds of smart pointers, both in the standard
library and defined by users. Still, some operations that are possible with
built-in references are not possible to perform with user-defined smart
pointers. Tyler Mandry, lead of the Rust project’s
language team, spoke at
RustConf 2026 about the lengthy effort to change that, and make smart pointers
just as flexible as built-in references.
Calibrating the AI Anxiety
Post Syndicated from The Atlantic original https://www.youtube.com/watch?v=2OE6TicW2f8
Unidentified Flock Cameras in Florida
Post Syndicated from Bruce Schneier original https://www.schneier.com/blog/archives/2026/10/unidentified-flock-cameras-in-florida.html
St. Lucie County in Florida discovered (alt link) a dozen Flock cameras whose ownership it can’t identify, and that the county government had not permitted.
I am reminded of the decade-old story of StingRay cell phone surveillance devices in Washington, DC, whose operators were also unknown.
My guess is that in the StingRay case, the devices were operated by foreign actors. This Flock case is more likely some local government entity that didn’t bother getting approval. Were I a foreign actor, I would rather hack the existing Flock network—like Israel did with Tehran’s surveillance cameras—than risk installing my own.
Regardless, once we normalize a surveillance infrastructure, both friends and foes will take advantage of it.
Min Jin Lee: Diaspora Is Now Everyone’s “Permanent Condition”
Post Syndicated from The Atlantic original https://www.youtube.com/shorts/Mj6WLHbFuYc
Flavio Bolsonaro #lastweektonight
Post Syndicated from LastWeekTonight original https://www.youtube.com/shorts/BIJWdYpP6k0
Linux Test Project suite stable release for September 2026
Post Syndicated from jzb original https://lwn.net/Articles/1098313/
The Linux Test
Project has announced its
latest stable release for September 2026. There have been 382 patches
from 41 authors since the May 2026
release. See the announcement for a list of new tests, changes, and
more.
Introducing Web Search API via AI Gateway
Post Syndicated from Michelle Chen original https://blog.cloudflare.com/introducing-web-search-api/
Fun fact: when you use an agent and it needs to fetch a live web page, the agent usually just guesses the URL of the page and then makes a tool call to curl it. This is why you’ll sometimes see web fetches come back with a 404 Not Found, which happens if the agent incorrectly guesses the URL of that information. As you can imagine, it’s not super efficient to randomly guess URLs all the time.
There is a better way. What if your agent can actually browse the Internet, just like how humans start with a search engine query when we’re looking for information? This is what web search is designed to do — it enables agents to search for relevant data on the Internet and grounds an agent’s responses based on live information.
Today, we’re announcing Cloudflare’s partnership with web search providers to bring you grounded intelligence via AI Gateway. We’re kicking off this launch with our partners from Ceramic.ai, Exa, and Linkup.
What can I do with the Web Search API?
AI models are only as good as the context you feed them. Models are typically trained and then frozen at a point in time, operating only on information that existed before their knowledge cut off date. This makes it quite hard to engage with models about recent events, changing APIs, or fast-evolving news.
Integrating Web Search API directly into your inference pipeline equips your agents with a dynamic context layer. Your applications get fresh, structured snippets from the web injected straight into context, which gives your models access to live information.
For example, if your agent was building with Cloudflare developer tools, it might miss all the new products and features we’re releasing during this Birthday Week! With web search, you’ll be able to retrieve the latest and greatest documentation and releases, so you can build faster and smarter.
Elevating the industry standard for web search
At Cloudflare, we believe that crawlers should be honest, transparent, and respect all bot rules and preferences, and that site owners should have meaningful transparency and control over how their content is used. With our launch today, we’re excited to announce that our partners have committed to meeting Cloudflare’s bot crawling standards.
The crawler used by the web search provider must comply with Cloudflare’s publicly stated requirements for “Verified bots” as defined in our developer documentation, and web search responses must include a link to the location of crawled content. These rules are net-positive for a fair Internet, and allow creators to decide what they want to do with their data.
We’re extremely excited to be taking another step in setting the bar for what it means to be a good crawler on the Internet, and even more proud of the web search partners who have risen to the challenge to uphold these standards with us. When you use web search on Cloudflare, you choose to consume search knowledge from operators committed to providing the transparency, control, and visibility that helps build a better Internet, by identifying their crawlers, respecting robots.txt, and providing the source of search results.
Using Web Search API via AI Gateway
Cloudflare’s AI Gateway is the flagship integration point for our new Web Search API product. AI Gateway is designed to be the control plane for your applications, with observability, unified billing, security, and access controls all built-in. Naturally, we thought web search would fit right in: you can consume web search with your AI Gateway credits; collect logs and request data on web search calls; and control who gets access to what web search providers.
Requests show up in your normal AI Gateway observability logs, and web search queries draw down from your AI Gateway credit balance. We will identify partners supporting Zero Data Retention (ZDR), so that you know that your data is not retained. We also offer web search directly at list API pricing from our partners, without any additional markup. More details can be found on the web search developer docs.
We also support Bring-Your-Own-Key (BYOK) with web search providers, as we do with model inference providers. This way, you’re able to bring your existing organizational setup and get started with AI Gateway and web search in a few simple steps.
Direct REST API
If you’re making HTTP calls from an existing backend, mobile app, or external service, you can query web search directly through a standard REST endpoint. Simply pass your AI Gateway authentication token, specify your preferred provider in the payload, and it will return web search results.
Workers Bindings
For developers building directly on Cloudflare Workers, integration takes just a line of code. We also have a standalone worker binding that you can use to do web search for your agent:
Coming soon: Server tools
We are actively building native Server Tools directly into AI Gateway. Soon, you won’t need to define tools yourself: they will come built into our control plane so you can spend more time building rather than orchestrating the harness. Web search will be one of the first tools we incorporate into our stack of server tools, and we’re excited for you to try it.
However, if you’d like to orchestrate web search as a server tool yourself today, you can easily do so with the following Worker code snippet:
Try it out today!
We’re excited to bring web search to our platform and to be doing this with wonderful partners who are championing what it means to be a good steward of the Internet. Please give our new web search tools a try via AI Gateway, the standalone REST API, and other formats in the future. Get started with our developer docs today, or try it out on the AI Playground with your AI Gateway account and key.
Security updates for Friday
Post Syndicated from jzb original https://lwn.net/Articles/1098312/
Security updates have been issued by AlmaLinux (dogtag-pki, expat, freerdp, gawk, gdb, ghostscript, gvfs, kernel, kernel-rt, libpcap, openssh, pki-core, rsync, thunderbird, and webkit2gtk3), Debian (chromium, firefox-esr, libio-compress-perl, libpng1.6, nodejs, open-iscsi, redis, thunderbird, and webkit2gtk), Fedora (sos), Mageia (libgcrypt, python-tornado, python-urwid, python-wcwidth, and wireshark), Oracle (corosync, dogtag-pki, expat, firefox, freerdp, gawk, glib2, ipa, kernel, libXfont2, nodejs:24, openssh, osbuild-composer, perl-DBI, pki-core, postgresql:12, python-cryptography, resteasy, ruby, ruby4.0, ruby:3.3, ruby:4.0, thunderbird, and xmlrpc-c), Red Hat (skopeo), SUSE (chromium, emacs, glib2, glibc, gnome-shell, helm3, ImageMagick, imagemagick, kernel-devel, libtcnative-1-0, libtcnative-1-0, libtcnative-2-0, tomcat, tomcat10,, libtcnative-2-0, libX11, libX11-6, libXi-devel, libXpm-devel, libXtst-devel, mistral-vibe, openssl-3, perl-DBI, perl-Protocol-HTTP2, php-composer2, php8, python, rpcbind, sccache, and valkey), and Ubuntu (kf6-kcoreaddons, libxpm, linux, linux-aws, linux-fips, linux-kvm, linux-lts-xenial, linux-fips, linux-gke, linux-raspi-5.4, and openssl).