Post Syndicated from BeardedTinker original https://www.youtube.com/watch?v=fiPGF5SEHjA
Should you buy a lightbulb security camera? I tested 10 cameras from Amazon from $20-$150.
Post Syndicated from The Hook Up original https://www.youtube.com/watch?v=uZCU8OUu0oc
The Next Generation of Managed Detection and Response is Here
Post Syndicated from Jake Godgart original https://blog.rapid7.com/2023/02/22/the-next-generation-of-managed-detection-and-response-is-here/

Humans are great at adapting to change—but objectively the pace of technological change has been way, way too fast.
Security teams manage an average of 76 different tools. Breaches have gone from “s#&@!” to “inevitable.” That’s why we built Managed Threat Complete to address the reality of today’s threat environment. By 2025, Gartner says 50% of organizations will decide to partner with an MDR (Managed Detection and Response) service for 24×7 monitoring.
Now, one move can consolidate and rebalance your work
Managed Threat Complete: It’s always-on MDR plus unlimited vulnerability management with a single subscription.
Combine these two historically siloed pieces of a security program, and you have a complete picture of your risk profile and threat landscape. Since the service combines proactive, responsive, and strategic support of your program, it gets smarter and more resilient over time: a continuously-improving, virtuous cycle.
Most importantly, Managed Threat Complete lets you prove you’re building measurable capacity to be effective at detection and response—and improve the definitions of success that matter most to you. We call it the R-factor, and it measures:
- How ready you are to react to your sprawling attack surface
- How responsive you can be when something inevitably gets through
- How effectively you’re able to remediate after the fact
- How you measure your results and show provable outcomes

Forrester Consulting did the math on Rapid7 MDR, and you win
Forrester’s June 2022 Total Economic Impact™ study commissioned by Rapid7 found that Rapid7 MDR produced extraordinary results:
- 5.5x ROI over 3 years
- <3 month payback
- 90% reduction in the likelihood of a breach
While your team methodically reduces your risks with unlimited VRM scanning, Managed Threat Complete gives you a full team of SOC experts dealing with threats in your environment using advanced XDR technology. And that means really responding, remediating, and making your organization safe and secure—no matter what.
It’s MDR so different, think of it as MDR 2.0.
Typical MDR vendors will simply alert a CISO to a problem. If you’re breached, they’ll tell you to hire an outside Incident Response firm to take it the rest of the way. Managed Threat Complete gives you unlimited Incident Response (the same level you’d get with an IR retainer) included, with DFIR professionals already embedded on your team.
Typical MDR vendors charge by data ingestion and retention. We prioritize visibility into your environment so our analysts can detect and respond without compromise.
Typical MDR vendors take a black box approach to their technology. But with Managed Threat Complete, we give customers unlimited access to our cloud-native XDR technology, sprawling detections library, all of it. See transparently into what your Rapid7 MDR partners are doing. Run your own investigations and threat hunting. Log in once a day or once a year, it’s at your fingertips.
Managed Threat Complete delivers a holistic approach to risk and threat management, so you can consolidate costs and be ready for whatever comes next.
Managed Threat Complete
Focus on proactive, strategic work, while our team delivers 24/7/365, end-to-end detection and response.
No more Flatpak (by default) in Ubuntu Flavors
Post Syndicated from original https://lwn.net/Articles/924078/
The Ubuntu Flavors
offerings (Kubuntu and the like) have decided
that the way to improve the user experience is to put more emphasis on the
Snap package format.
Going forward, the Flatpak package as well as the packages to
integrate Flatpak into the respective software center will no
longer be installed by default in the next release due in April
2023, Lunar Lobster. Users who have used Flatpak will not be
affected on upgrade, as flavors are including a special migration
that takes this into account. Those who haven’t interacted with
Flatpak will be presented with software from the Ubuntu
repositories and the Snap Store.
A full set of stable kernels
Security updates for Wednesday
Post Syndicated from original https://lwn.net/Articles/924070/
Security updates have been issued by Debian (amanda, apr-util, and tiff), Fedora (apptainer, git, gssntlmssp, OpenImageIO, openssl, webkit2gtk3, xorg-x11-server, and xorg-x11-server-Xwayland), Oracle (firefox and thunderbird), Red Hat (python3), SUSE (gnutls, php7, and python-Django), and Ubuntu (chromium-browser, libxpm, and mariadb-10.3, mariadb-10.6).
Maintaining Code Quality with Amazon CodeCatalyst Reports
Post Syndicated from Imtranur Rahman original https://aws.amazon.com/blogs/devops/maintaining-code-quality-with-amazon-codecatalyst-reports/
Amazon CodeCatalyst reports contain details about tests that occur during a workflow run. You can create tests such as unit tests, integration tests, configuration tests, and functional tests. You can use a test report to help troubleshoot a problem during a workflow.
Introduction
In prior posts in this series, I discussed reading The Unicorn Project, by Gene Kim, and how the main character, Maxine, struggles with a complicated Software Development Lifecycle (SDLC) after joining a new team. One of the challenges she encounters is the difficulties in shipping secure, functioning code without an automated testing mechanism. To quote Gene Kim, “Without automated testing, the more code we write, the more money it takes for us to test.”
Software Developers know that shipping vulnerable or non-functioning code to a production environment is to be avoided at all costs; the monetary impact is high and the toll it takes on team morale can be even greater. During the SDLC, developers need a way to easily identify and troubleshoot errors in their code.
In this post, I will focus on how developers can seamlessly run tests as a part of workflow actions as well as configure unit test and code coverage reports with Amazon CodeCatalyst. I will also outline how developers can access these reports to gain insights into their code quality.
Prerequisites
If you would like to follow along with this walkthrough, you will need to:
- Have an AWS Builder ID for signing in to CodeCatalyst.
- Belong to a CodeCatalyst space and have the Space administrator role assigned to you in that space. For more information, see Creating a space in CodeCatalyst, Managing members of your space, and Space administrator role.
- Have an AWS account associated with your space and have the IAM role in that account. For more information about the role and role policy, see Creating a CodeCatalyst service role.
Walkthrough
As with the previous posts in the CodeCatalyst series, I am going to use the Modern Three-tier Web Application blueprint. Blueprints provide sample code and CI/CD workflows to help you get started easily across different combinations of programming languages and architectures. To follow along, you can re-use a project you created previously, or you can refer to a previous post that walks through creating a project using the Three-tier blueprint.
Once the project is deployed, CodeCatalyst opens the project overview. This view shows the content of the README file from the project’s source repository, workflow runs, pull requests, etc. The source repository and workflow are created for me by the project blueprint. To view the source code, I select Code → Source Repositories from the left-hand navigation bar. Then, I select the repository name link from the list of source repositories.

Figure 1. List of source repositories including Mythical Mysfits source code.
From here I can view details such as the number of branches, workflows, commits, pull requests and source code of this repo. In this walkthrough, I’m focused on the testing capabilities of CodeCatalyst. The project already includes unit tests that were created by the blueprint so I will start there.
From the Files list, navigate to web → src → components→ __tests__ → TheGrid.spec.js. This file contains the front-end unit tests which simply check if the strings “Good”, “Neutral”, “Evil” and “Lawful”, “Neutral”, “Chaotic” have rendered on the web page. Take a moment to examine the code. I will use these tests throughout the walkthrough.

Figure 2. Unit test for the front-end that test strings have been rendered properly.
Next, I navigate to the workflow that executes the unit tests. From the left-hand navigation bar, select CI/CD → Workflows. Then, find ApplicationDeploymentPipeline, expand Recent runs and select Run-xxxxx . The Visual tab shows a graphical representation of the underlying YAML file that makes up this workflow. It also provides details on what started the workflow run, when it started, how long it took to complete, the source repository and whether it succeeded.

Figure 3. The Deployment workflow open in the visual designer.
Workflows are comprised of a source and one or more actions. I examined test reports for the back-end in a prior post. Therefore, I will focus on the front-end tests here. Select the build_and_test_frontend action to view logs on what the action ran, its configuration details, and the reports it generated. I’m specifically interested in the Unit Test and Code Coverage reports under the Reports tab:

Figure 4. Reports tab showing line and branch coverage.
Select the report unitTests.xml (you may need to scroll). Here, you can see an overview of this specific report with metrics like pass rate, duration, test suites, and the test cases for those suites:
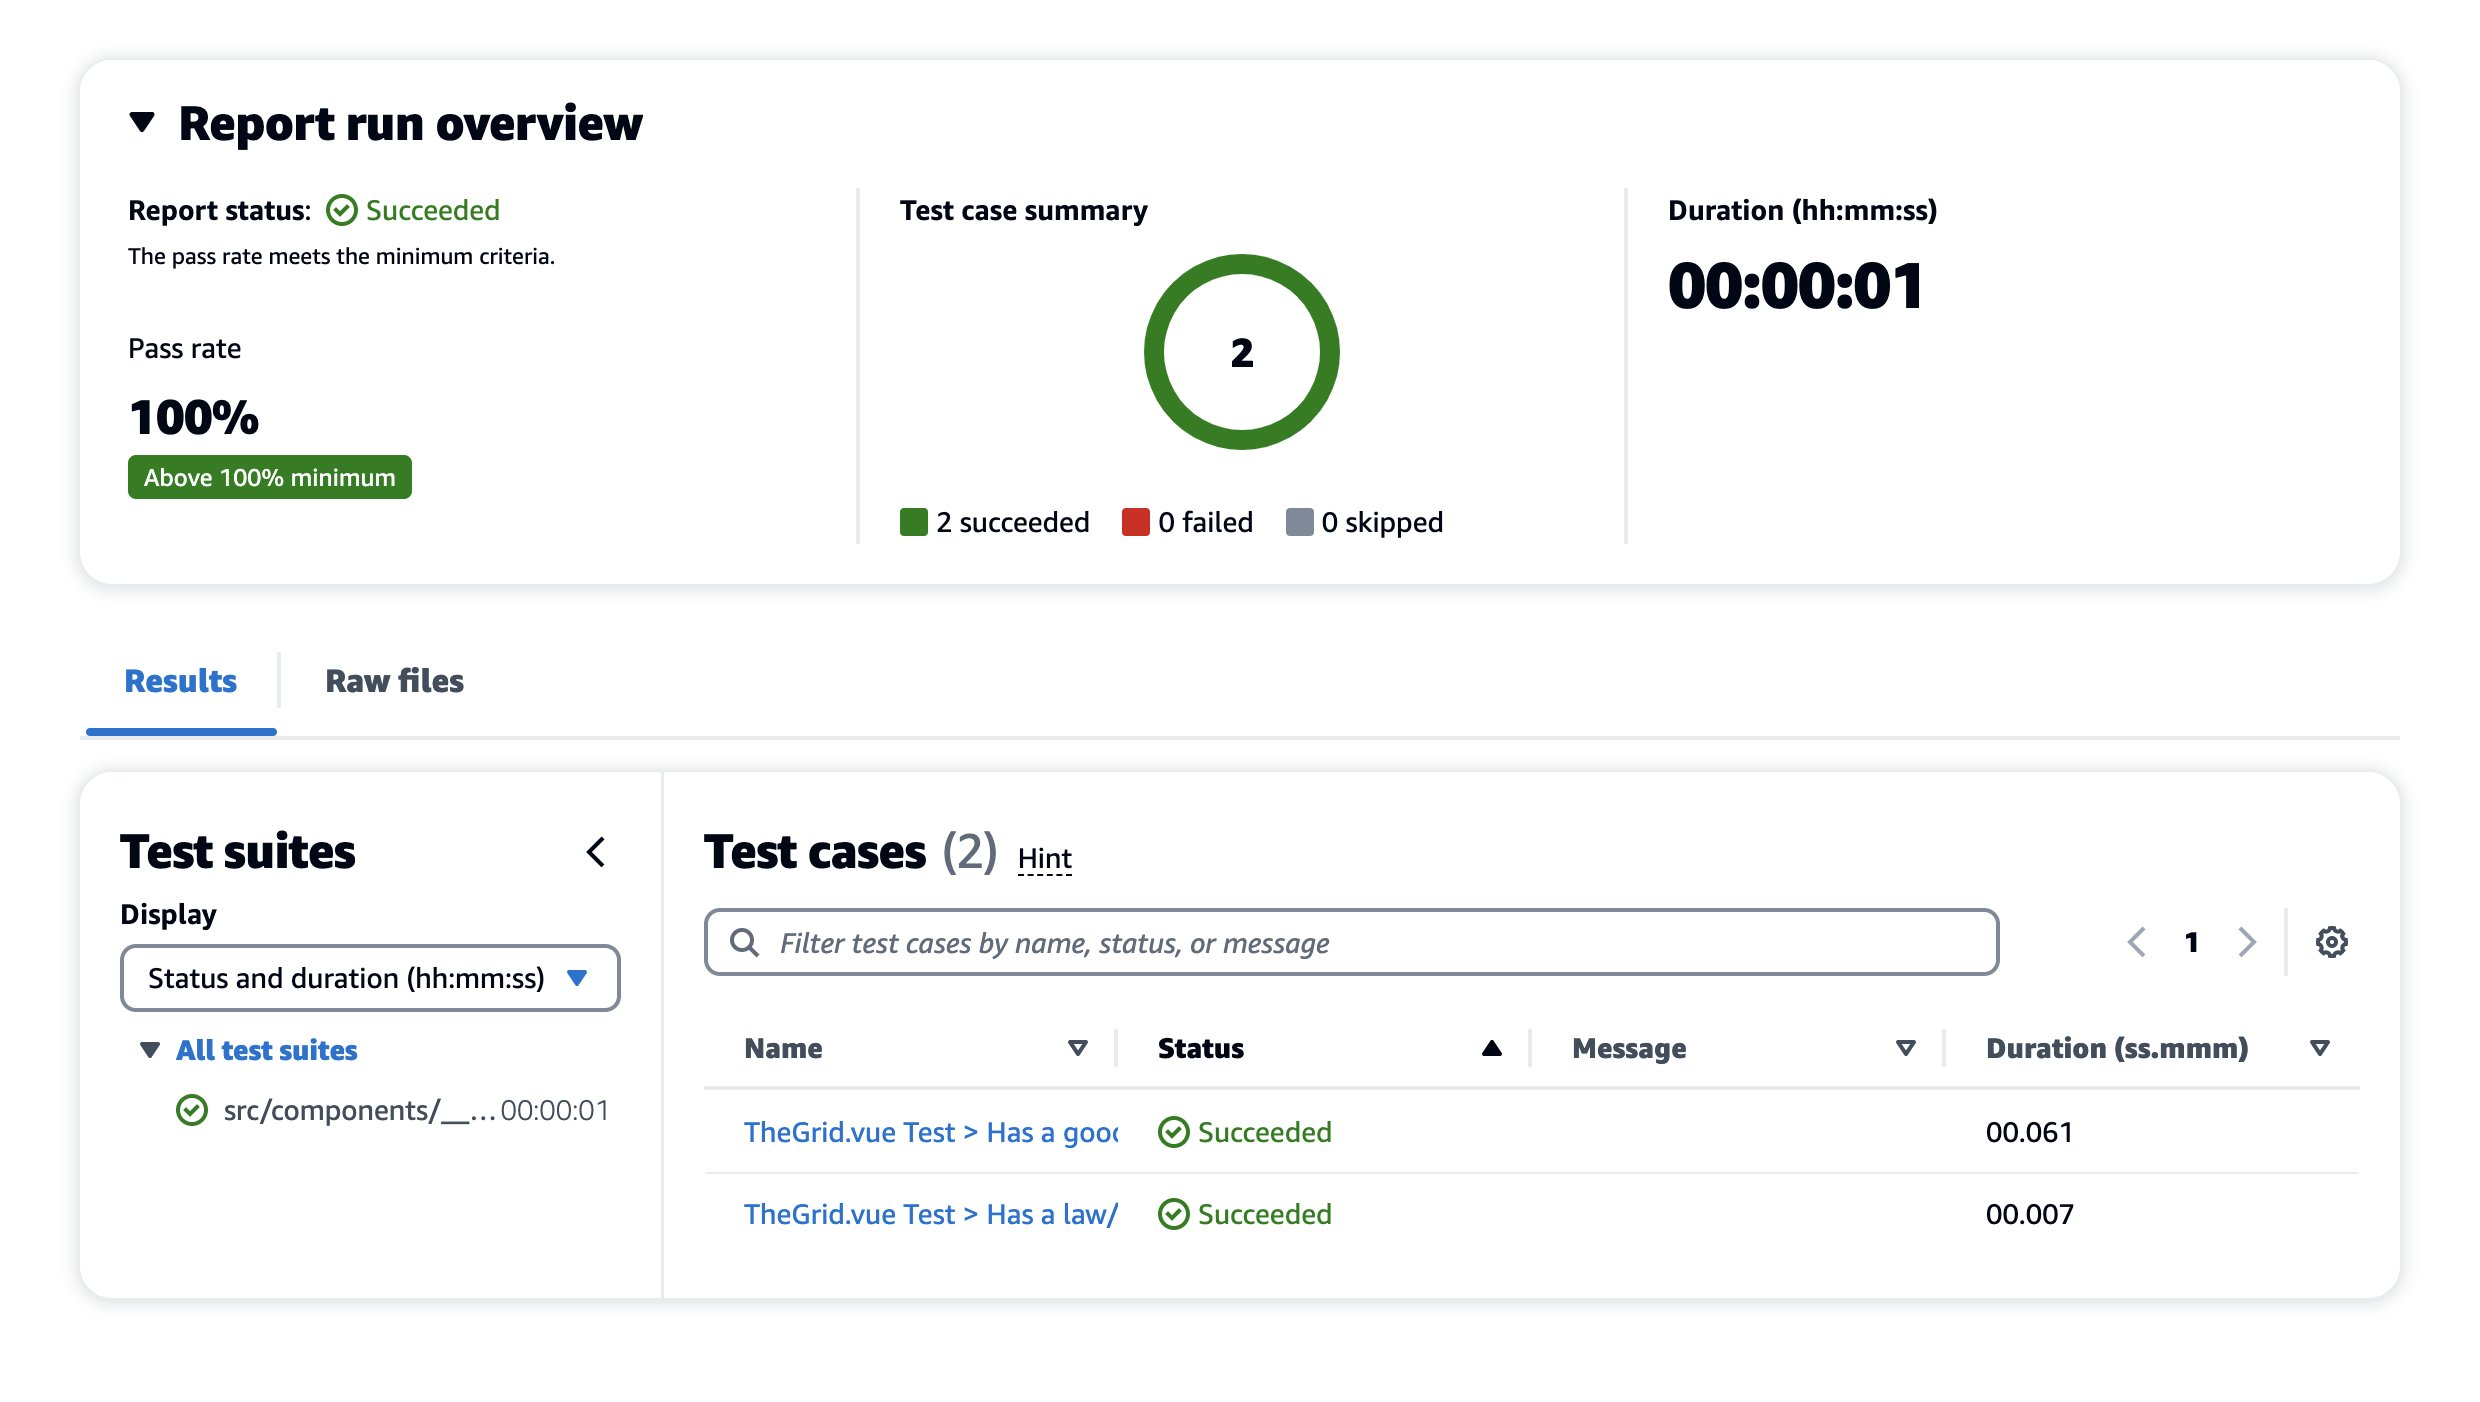
Figure 5. Detailed report for the front-end tests.
This report has passed all checks. To make this report more interesting, I’ll intentionally edit the unit test to make it fail. First, navigate back to the source repository and open web → src → components→ __tests__→TheGrid.spec.js. This test case is looking for the string “Good” so change it to say “Best” instead and commit the changes.

Figure 6. Front-End Unit Test Code Change.
This will automatically start a new workflow run. Navigating back to CI/CD → Workflows, you can see a new workflow run is in progress (takes ~7 minutes to complete).
Once complete, you can see that the build_and_test_frontend action failed. Opening the unitTests.xml report again, you can see that the report status is in a Failed state. Notice that the minimum pass rate for this test is 100%, meaning that if any test case in this unit test ever fails, the build fails completely.
There are ways to configure these minimums which will be explored when looking at Code Coverage reports. To see more details on the error message in this report, select the failed test case.

Figure 7. Failed Test Case Error Message.
As expected, this indicates that the test was looking for the string “Good” but instead, it found the string “Best”. Before continuing, I return to the TheGrid.spec.js file and change the string back to “Good”.
CodeCatalyst also allows me to specify code and branch coverage criteria. Coverage is a metric that can help you understand how much of your source was tested. This ensures source code is properly tested before shipping to a production environment. Coverage is not configured for the front-end, so I will examine the coverage of the back-end.
I select Reports on the left-hand navigation bar, and open the report called backend-coverage.xml. You can see details such as line coverage, number of lines covered, specific files that were scanned, etc.
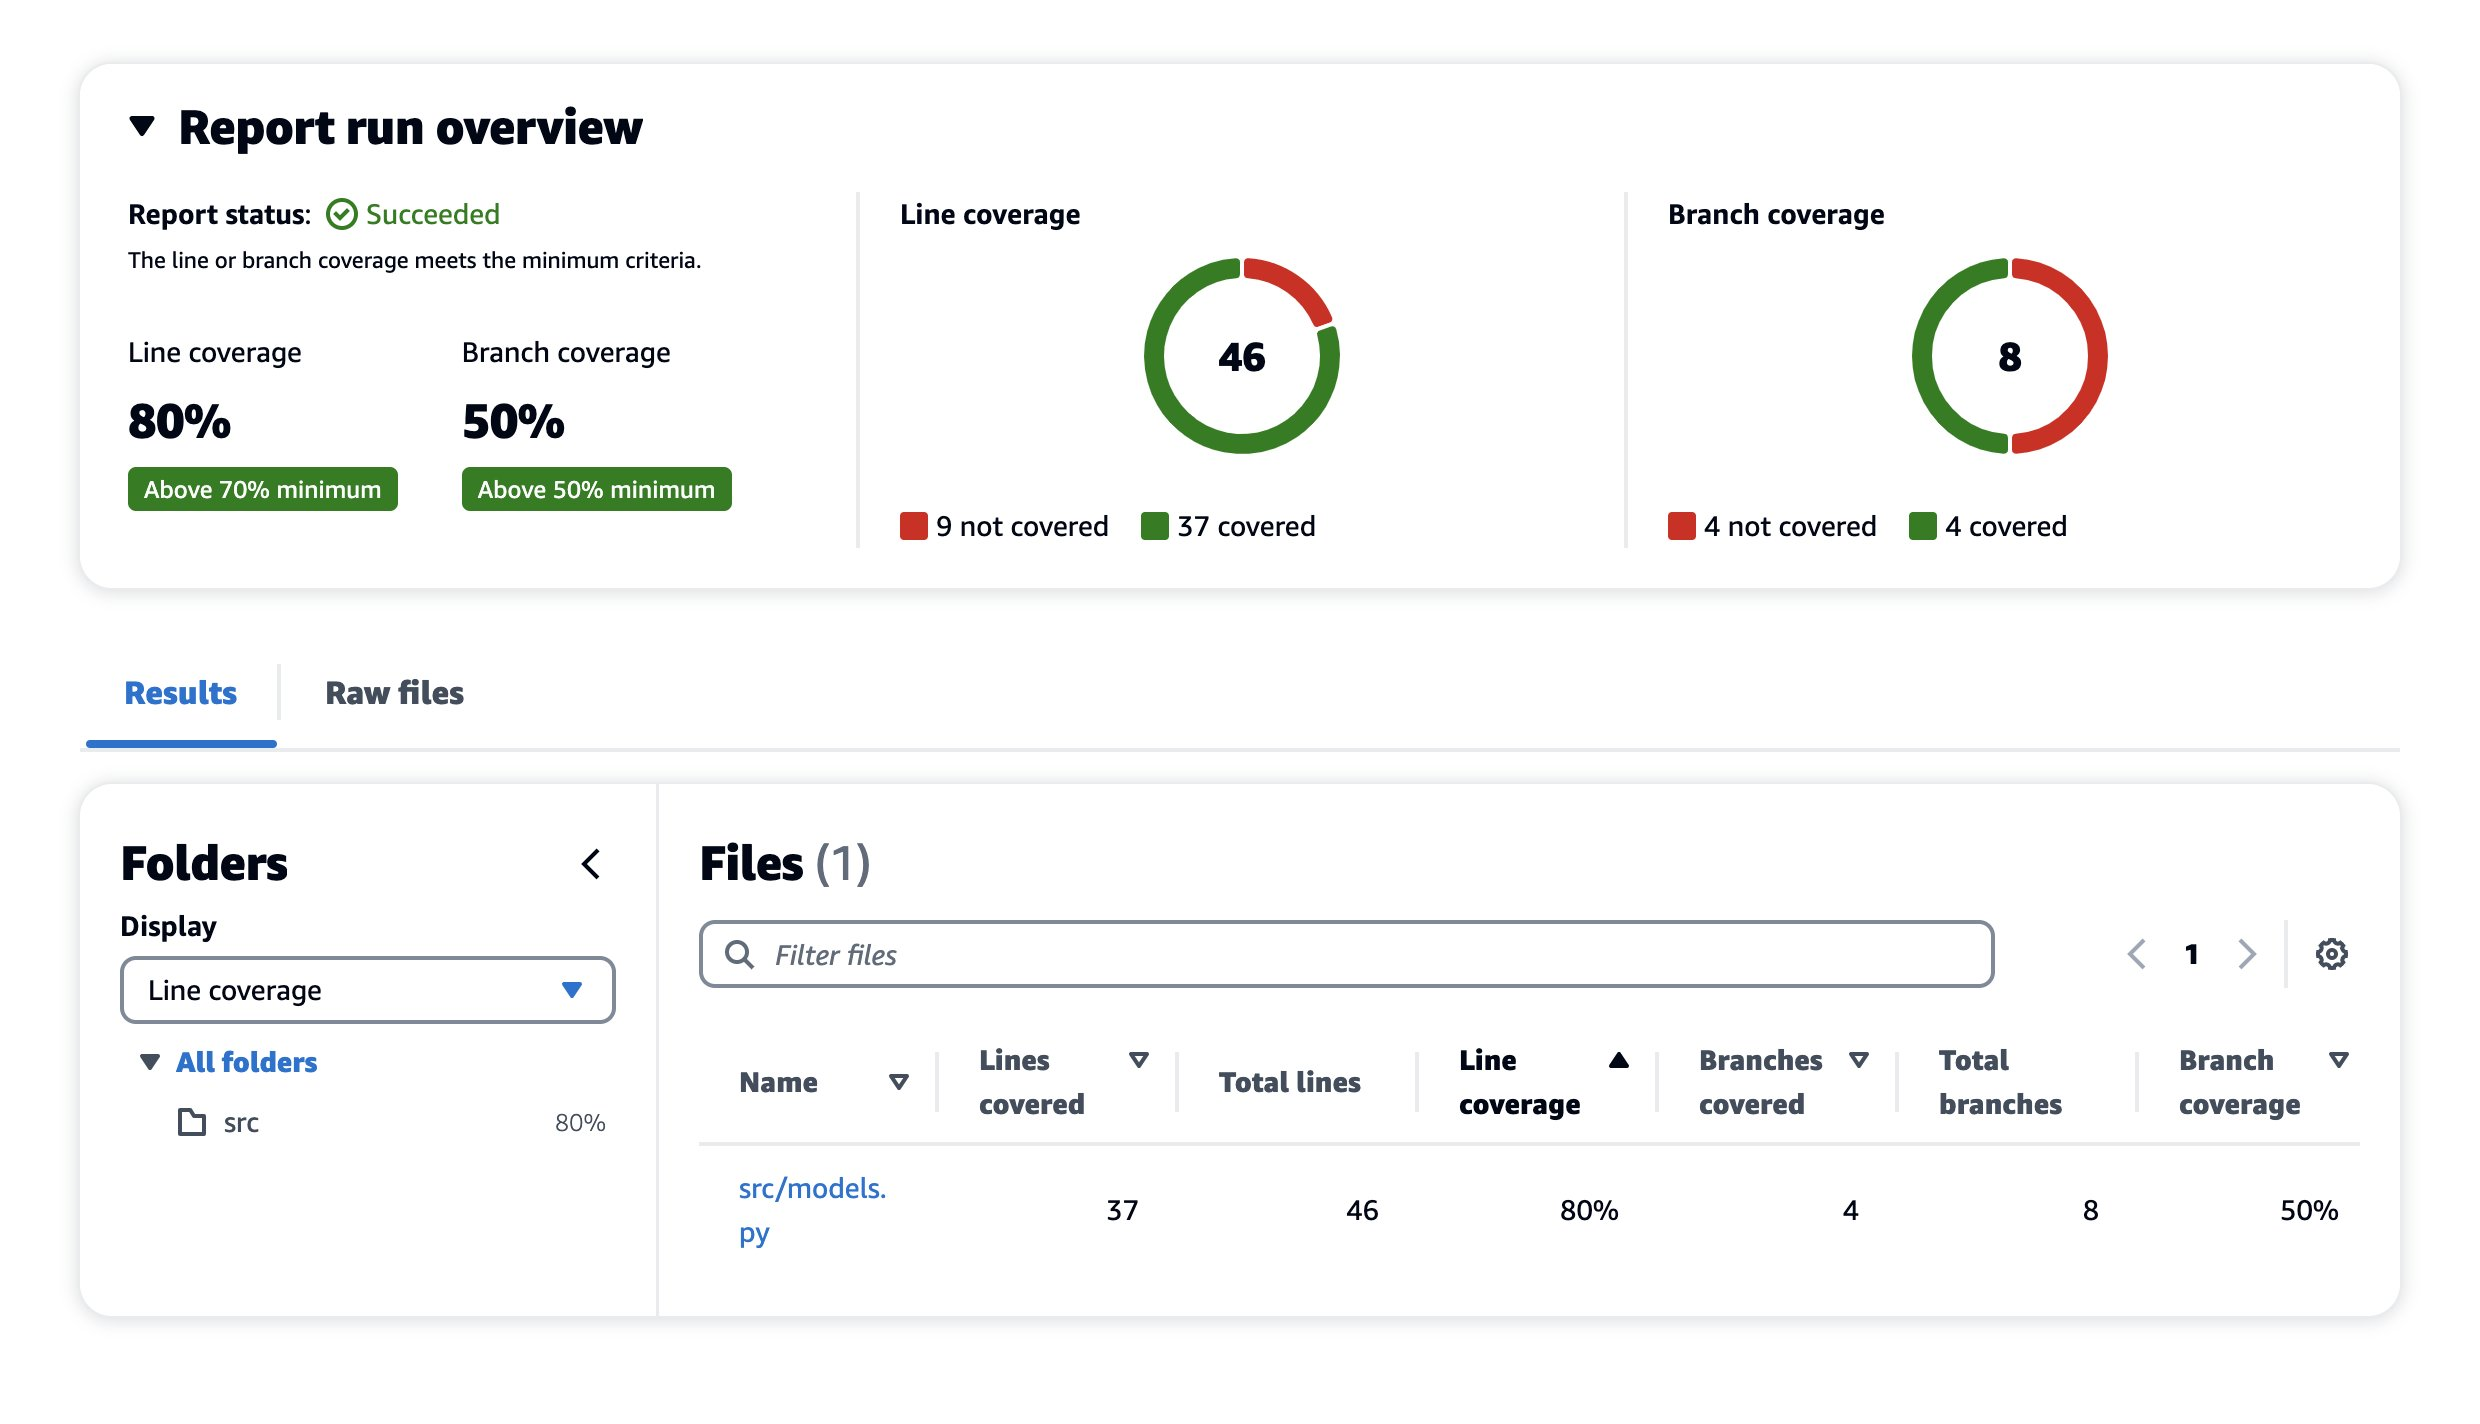
Figure 8. Code Coverage Report Succeeded.
The Line coverage minimum is set to 70% but the current coverage is 80%, so it succeeds. I want to push the team to continue improving, so I will edit the workflow to raise the minimum threshold to 90%. Navigating back to CI/CD → Workflows → ApplicationDeploymentPipeline, select the Edit button. On the Visual tab, select build_backend. On the Outputs tab, scroll down to Success Criteria and change Line Coverage to 90%.
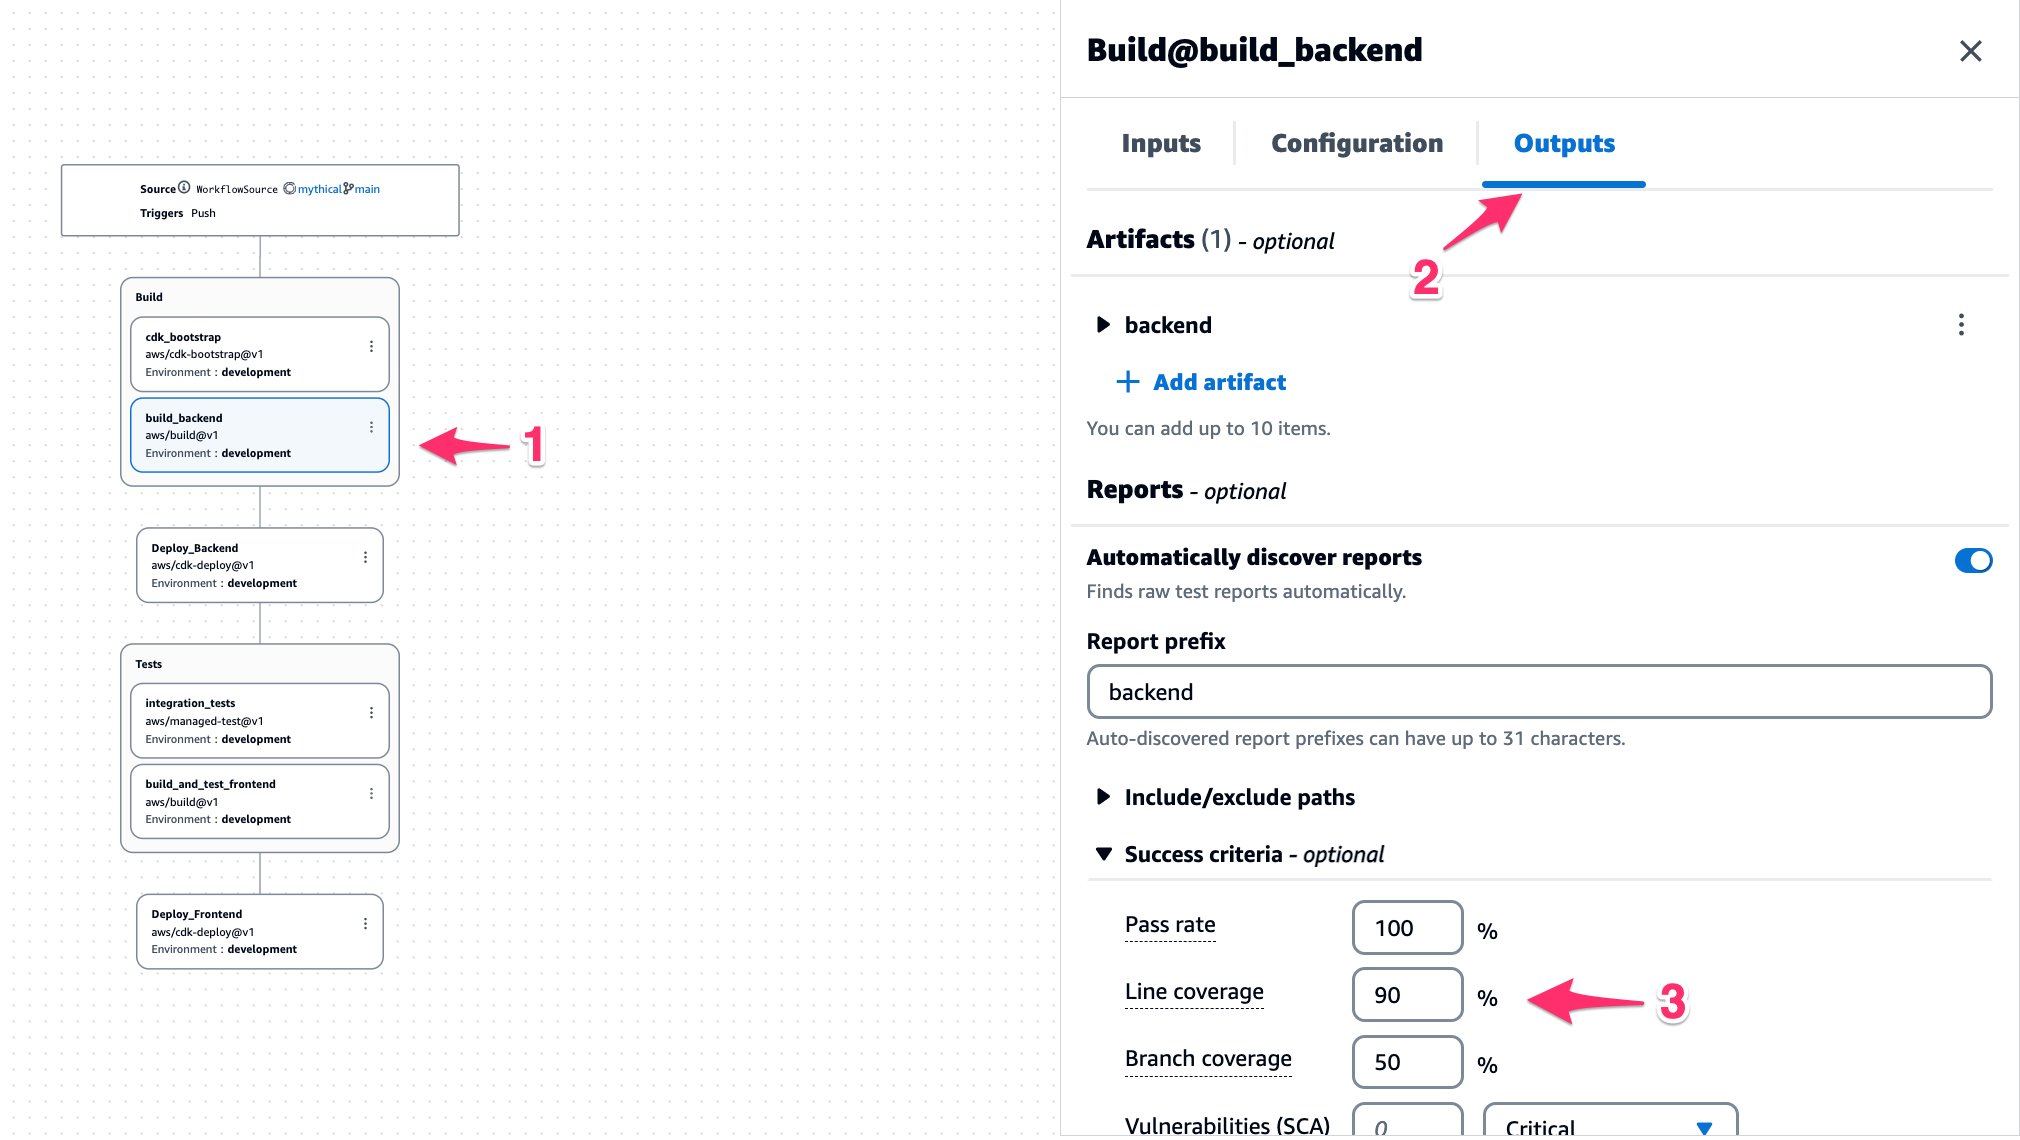
Figure 9. Configuring Code Coverage Success Criteria.
On the top-right, select Commit. This will push the changes to the repository and start a new workflow run. Once the run has finished, navigate back to the Code Coverage report. This time, you can see it reporting a failure to meet the minimum threshold for Line coverage.

Figure 10. Code Coverage Report Failed.
There are other success criteria options available to experiment with. To learn more about success criteria, see Configuring success criteria for tests.
Cleanup
If you have been following along with this workflow, you should delete the resources you deployed so you do not continue to incur charges. First, delete the two stacks that CDK deployed using the AWS CloudFormation console in the AWS account you associated when you launched the blueprint. These stacks will have names like mysfitsXXXXXWebStack and mysfitsXXXXXAppStack. Second, delete the project from CodeCatalyst by navigating to Project settings and choosing Delete project.
Summary
In this post, I demonstrated how Amazon CodeCatalyst can help developers quickly configure test cases, run unit/code coverage tests, and generate reports using CodeCatalyst’s workflow actions. You can use these reports to adhere to your code testing strategy as a software development team. I also outlined how you can use success criteria to influence the outcome of a build in your workflow. In the next post, I will demonstrate how to configure CodeCatalyst workflows and integrate Software Composition Analysis (SCA) reports. Stay tuned!
About the authors:
Albert Göring
Post Syndicated from The History Guy: History Deserves to Be Remembered original https://www.youtube.com/watch?v=j785m8JBMxI
A Device to Turn Traffic Lights Green
Post Syndicated from Bruce Schneier original https://www.schneier.com/blog/archives/2023/02/a-device-to-turn-traffic-lights-green.html
Here’s a story about a hacker who reprogrammed a device called “Flipper Zero” to mimic Opticom transmitters—to turn traffic lights in his path green.
As mentioned earlier, the Flipper Zero has a built-in sub-GHz radio that lets the device receive data (or transmit it, with the right firmware in approved regions) on the same wireless frequencies as keyfobs and other devices. Most traffic preemption devices intended for emergency traffic redirection don’t actually transmit signals over RF. Instead, they use optical technology to beam infrared light from vehicles to static receivers mounted on traffic light poles.
Perhaps the most well-known branding for these types of devices is called Opticom. Essentially, the tech works by detecting a specific pattern of infrared light emitted by the Mobile Infrared Transmitter (MIRT) installed in a police car, fire truck, or ambulance when the MIRT is switched on. When the receiver detects the light, the traffic system then initiates a signal change as the emergency vehicle approaches an intersection, safely redirecting the traffic flow so that the emergency vehicle can pass through the intersection as if it were regular traffic and potentially avoid a collision.
This seems easy to do, but it’s also very illegal. It’s called “impersonating an emergency vehicle,” and it comes with hefty penalties if you’re caught.
Home Assistant 2023.3 Release Party
Post Syndicated from Home Assistant original https://www.youtube.com/watch?v=3UaLAhG9Brc
Supporting beginner programmers in primary school using TIPP&SEE
Post Syndicated from Bobby Whyte original https://www.raspberrypi.org/blog/teaching-programming-in-primary-school-tippsee/
Every young learner needs a successful start to their learning journey in the primary computing classroom. One aspect of this for teachers is to introduce programming to their learners in a structured way. As computing education is introduced in more schools, the need for research-informed strategies and approaches to support beginner programmers is growing. Over recent years, researchers have proposed various strategies to guide teachers and students, such as the block model, PRIMM, and, in the case of this month’s seminar, TIPP&SEE.

We are committed to make computing and creating with digital technologies accessible to all young people, including through our work with educators and researchers. In our current online research seminar series, we focus on computing education for primary-aged children (K–5, ages 5 to 11). In the series’ second seminar, we were delighted to welcome Dr Jean Salac, researcher in the Code & Cognition Lab at the University of Washington.

Jean’s work sits across computing education and human-computer interaction, with an emphasis on justice-focused computing for youth. She talked to the seminar attendees about her work on developing strategies to support primary school students learning to program in Scratch. Specifically, Jean described an approach called TIPP&SEE and how teachers can use it to guide their learners through programming activities.
What is TIPP&SEE?
TIPP&SEE is a metacognitive approach for programming in Scratch. The purpose of metacognitive strategies is to help students become more aware of their own learning processes.

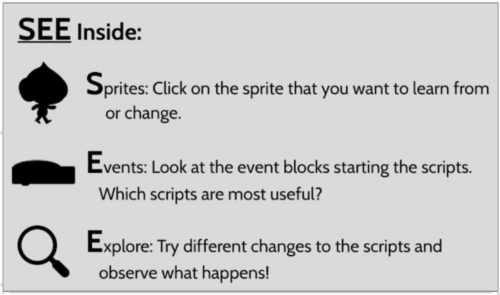
TIPP&SEE scaffolds students as they learn from example Scratch projects: TIPP (Title, Instructions, Purpose, Play) is a scaffold to read and run a Scratch project, while SEE (Sprites, Events, Explore) is a scaffold to examine projects more deeply and begin to adapt them.
Using, modifying and creating
TIPP&SEE is inspired by the work of Irene Lee and colleagues who proposed a progressive three-stage approach called Use-Modify-Create. Following that approach, learners move from reading pre-existing programs (“not mine”) to adapting and creating their own programs (“mine”) and gradually increase ownership of their learning.
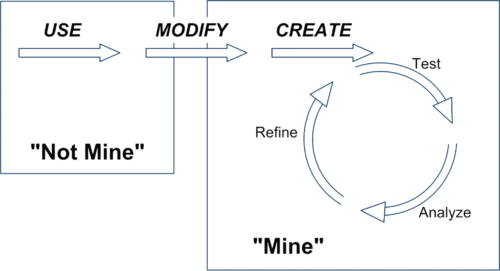
Proponents of scaffolded approaches like Use-Modify-Create argue that engaging learners in cycles of using existing programs (e.g. worked examples) before they move to adapting and creating new programs encourages ownership and agency in learning. TIPP&SEE builds on this model by providing additional scaffolding measures to support learners.
Impact of TIPP&SEE
Jean presented some promising results from her research on the use of TIPP&SEE in classrooms. In one study, fourth-grade learners (age 9 to 10) were randomly assigned to one of two groups: (i) Use-Modify-Create only (the control group) or (ii) Use-Modify-Create with TIPP&SEE. Jean found that, compared to learners in the control group, learners in the TIPP&SEE group:
- Were more thorough, and completed more tasks
- Wrote longer scripts during open-ended tasks
- Used more learned blocks during open-ended tasks
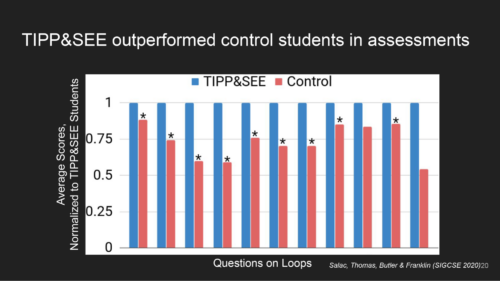
In another study, Jean compared how learners in the TIPP&SEE and control groups performed on several cognitive tests. She found that, in the TIPP&SEE group, students with learning difficulties performed as well as students without learning difficulties. In other words, in the TIPP&SEE group the performance gap was much narrower than in the control group. In our seminar, Jean argued that this indicates the TIPP&SEE scaffolding provides much-needed support to diverse groups of students.
Using TIPP&SEE in the classroom
TIPP&SEE is a multi-step strategy where learners start by looking at the surface elements of a program, and then move on to examining the underlying code. In the TIPP phase, learners first read the title and instructions of a Scratch project, identify its purpose, and then play the project to see what it does.

In the second phase, SEE, learners look inside the Scratch project to click on sprites and predict what each script is doing. They then make changes to the Scratch code and see how the project’s output changes. By changing parameters, learners can observe which part of the output changes as a result and then reason how each block functions. This practice is called deliberate tinkering because it encourages learners to observe changes while executing programs multiple times with different parameters.
You can read more of Jean’s research on TIPP&SEE on her website. There’s also a video on how TIPP&SEE can be used, and free lesson resources based on TIPP&SEE are available in Elementary Computing for ALL and Scratch Encore.
Learning about learning in computing education
Jean’s talk highlighted the need for computing to be inclusive and to give equitable access to all learners. The field of computing education is still in its infancy, though our understanding of how young people learn about computing is growing. We ourselves work to deepen our understanding of how young people learn through computing and digital making experiences.
In our own research, we have been investigating similar teaching approaches for programming, including the use of the PRIMM approach in the UK, so we were very interested to learn about different approaches and country contexts. We are grateful to Dr Jean Salac for sharing her work with researchers and teachers alike. Watch the recording of Jean’s seminar to hear more:
Free support for teaching programming and more to primary school learners
If you are looking for more free resources to help you structure your computing lessons:
- Download our comprehensive classroom resources in The Computing Curriculum, which includes units of programming lessons for age 5 and upwards.
- Take one of our online courses about teaching computing. The course Teaching programming to 5- to 11-year-olds is especially relevant to this seminar.
- Read The Big Book of Computing Pedagogy, a special edition of our Hello World magazine.
Join our next seminar
In the next seminar of our online series on primary computing, I will be presenting my research on integrated computing and literacy activities. Sign up now to join us for this session on Tues 7 March:
As always, the seminars will take place online on the first Tuesday of the month at 17:00–18:30 UK time. Hope to see you there!
The post Supporting beginner programmers in primary school using TIPP&SEE appeared first on Raspberry Pi.
Comic for 2023.02.22 – Small Talk
Post Syndicated from Explosm.net original https://explosm.net/comics/small-talk-2
New Cyanide and Happiness Comic
Съжители по неволя
Post Syndicated from Йовко Ламбрев original https://www.toest.bg/sazhiteli-po-nevolia/

Да го наречем Иван. Някога, преди поне десетилетие и две смени на собствеността, е живял в къщата, която купихме със семейството ми през 2016-та. Оттогава не минава и месец, в който да не го издирват вкъщи от НАП или от Общината за неплатени данъци. Търсят го и частни съдебни изпълнители, банки и мобилни оператори, на които е длъжник. Лепят предупредителни бележки на нашата врата.
Иван не е единствен. Заедно с него на нашия адрес „живее“… нека я наречем Мария. Нея също я издирват периодично за неплатени данъци и задължения. Тя има и син, който също се води, че живее у нас.
Тази история, макар с герои с подменени имена, е съвсем реална. И за съжаление, много често срещана.
Нежелани съжители по документи имат много български семейства
заради несъвършенства на системата за адресна регистрация у нас, наследени с години.
Всяко лице е длъжно в срок от 30 дни да заяви промяната на настоящия си адрес.
Това гласи чл. 99, ал. 1 от Закона за гражданската регистрация. Дотук добре, но от небрежност или съвсем умишлено много хора като Иван и Мария не декларират актуалния си адрес пред държавата. На теория това се санкционира, но в действителност трудно се установява. Отделно, че администрацията не полага никакви усилия да установява и санкционира такива нарушения. Вместо това продължава безполезно да издирва длъжниците си там, където те очевидно отдавна не живеят. И така – години наред.
Ако Иван и Мария не искат да бъдат намирани лесно, те нямат особена причина да променят завареното си положение. То им дава възможност да се крият от кредиторите си и да бавят плащания на сметки и данъци. А в същото време да имат напълно валидна адресна регистрация от времето, когато са били собственици, наематели или ползватели на дадено жилище.
На новите собственици на това жилище обаче те не само причиняват неудобството да получават нежелана кореспонденция и да бъдат посещавани от призовкари, съдебни изпълнители или колекторски фирми. В по-крайната хипотеза – при твърде много лица, регистрирани на един адрес – напълно е възможно на новия собственик на жилището, негов роднина или наемател
да бъде отказано извършване на адресна регистрация
поради нарушаване на чл. 92, ал. 10 от ЗГР, а именно надвишаване на двукратния брой на лицата, които обичайно могат да обитават съответното жилище. Този брой се изчислява спрямо жилищната площ, като „на едно лице се падат не по-малко от 10 кв.м“, указва законът.
Дори когато Иван и Мария си подновяват личната карта, те трябва само да препотвърдят постоянния си адрес – без нужда да доказват, че все още имат правото да се водят на него. Този адрес се подава автоматично от Единната система за гражданска регистрация и административно обслужване на населението (ЕСГРАОН), която отговаря за поддържането на регистъра на населението.
Ако поискате от служителите в съответното териториално звено на ЕСГРАОН да премахнат „мъртвите души“ от вашия имот, ще ви отговорят, че това не е в техните правомощия. И всъщност по закон е така. Право да разпоредят заличаване на адресната регистрация на лица, нарушили изискванията на ЗГР, имат общинските и районните кметове.
И ето го решението.
То е сравнително бързо и не изисква кой знае какви усилия от ваша страна. Всичко, което е необходимо да направите, е да опишете случая си в свободен текст и да го адресирате до кмета на общината, в която се намира вашият имот (или до районния кмет, ако става дума за голям град). Може да се опитате да подадете документа и чрез Системата за сигурно електронно връчване.
В това писмо трябва да поискате назначаване на комисия за проверка по чл. 99б от ЗГР, да приложите списък на членовете на своето домакинство или на наемателите си и да поискате всички извън този списък да бъдат отписани от вашия адрес. Вероятно в Общината ще ви поискат и копие от нотариалния акт за собственост върху имота.
След завеждането на вашата молба с входящ номер кметът има тридневен срок да назначи комисия за исканата от вас проверка. Самата проверка пък следва да бъде извършена в седемдневен срок от назначаването на комисията и накрая да приключи с писмен протокол. Ако кметът не се задейства, ЗГР ви дава правото да сезирате и областния управител.
В общия случай вашата молба ще провокира посещение от кварталния полицай, който ще бъде натоварен със задачата да провери сигнала и да потвърди кой в действителност живее на този адрес. Междувременно служба ГРАО в Общината ще се опита да издири въпросните лица (на адресите на техни преки роднини) и да ги предупреди, че трябва да актуализират адресната си регистрация. Независимо дали ще го сторят, в тридневен срок след приключване на проверката
кметът е длъжен да разпореди заличаване на адресните регистрации, които са в нарушение на закона.
Тази заповед подлежи на обжалване от засегнатите лица, но то не спира изпълнението ѝ.
Това, уви, не означава автоматично, че нежеланата кореспонденция и посещенията от хора, издирващи вашите Иван или Мария, веднага ще секнат. Но постепенно тази набрана инерция ще започне да намалява. И в крайна сметка Иван и Мария в някакъв момент ще бъдат принудени от обстоятелствата да се регистрират на друг адрес.
Wish Interpretation
Post Syndicated from original https://xkcd.com/2741/

Antony Blinken on Russia’s War on Ukraine, One Year Later | The Atlantic Big Story
Post Syndicated from The Atlantic original https://www.youtube.com/watch?v=L2ajt_cOV0c
How to monitor and query IAM resources at scale – Part 2
Post Syndicated from Michael Chan original https://aws.amazon.com/blogs/security/how-to-monitor-and-query-iam-resources-at-scale-part-2/
In this post, we continue with our recommendations for using AWS Identity and Access Management (IAM) APIs. In part 1 of this two-part series, we described how you could create IAM resources and use them soon after for authorization decisions. We also described options for monitoring and responding to IAM resource changes for entire accounts. Now, in part 2 of this post, we’ll cover the API throttling behavior of IAM and AWS Security Token Service (AWS STS) and how you can effectively plan your usage of these APIs. We’ll also cover the features of IAM that enable you to right-size the permissions granted to principals in your organization and assess external access to your resources.
Increase your usage of IAM APIs
If you’re a developer or a security engineer, you might find yourself writing more and more automation that interacts with IAM APIs. Other engineers, teams, or applications might also call the IAM APIs within the same account or cross-account. Over time, anyone calling the APIs in your account incrementally increases the number of requests per second. If so, IAM might send a “Rate exceeded” error that indicates you have exceeded a certain threshold of API calls per second. This is called API throttling.
Understand IAM API throttling
API throttling occurs when you exceed the call rate limits for an API. AWS uses API throttling to limit requests to a service. Like many AWS services, IAM limits API requests to maintain the performance of the service, and to ensure fair usage across customers. IAM and AWS STS independently implement a token bucket algorithm for throttling, in which a bucket of virtual tokens is refilled every second. Each token represents a non-throttled API call that you can make. The number of tokens that a bucket holds and the refill rate depends on the API. For each IAM API, a number of token buckets might apply.
We refer to this simply as rate-limiting criteria. Essentially, there are several rate-limiting criteria that are considered when evaluating whether a customer is generating more traffic than the service allows. The following are some examples of these criteria:
- The account where the API is called
- The account for read or write APIs (depending on whether the API is a read or write operation)
- The account from which AssumeRole was called prior to the API call (for example, third-party cross-account calls)
- The account from which AssumeRole was called prior to the API call for read APIs
- The API and organization where the API is called
Understand STS API throttling
Although IAM has criteria pertaining to the account from which AssumeRole was called, IAM has its own API rate limits that are distinct from AWS STS. Therefore, the preceding criteria are IAM-specific and are separate from the throttling that can occur if you call STS APIs. IAM is also a global service, and the limits are not Region-aware. In contrast, while STS has a single global endpoint, every Region has its own STS endpoint with its own limits.
The STS rate-limiting criteria pertain to each account and endpoint for API calls. For example, if you call the AssumeRole API against the sts.ap-northeast-1.amazonaws.com endpoint, STS will evaluate the rate-limiting criteria associated with that account and the ap-northeast-1 endpoint. Other STS API requests that you perform under the same account and endpoint will also count towards these criteria. However, if you make a request from the same account to a different regional endpoint or the global endpoint, that request will count against different criteria.
Note: AWS recommends that you use the STS regional endpoints instead of the STS global endpoint. Regional endpoints have several benefits, including redundancy and reduced latency. To learn more about other benefits, see Managing AWS STS in an AWS Region.
How multiple criteria affect throttling
The preceding examples show the different ways that IAM and STS can independently limit requests. Limits might be applied at the account level and across read or write APIs. More than one rate-limiting criterion is typically associated with an API call, with each request counted against each rate-limiting criterion independently. This means that if the requests-per-second exceeds the applicable criteria, then API throttling occurs and returns a rate-limiting error.
How to address IAM and STS API throttling
In this section, we’ll walk you through some strategies to reduce IAM and STS API throttling.
Query for top callers
With AWS CloudTrail Lake, your organization can aggregate, store, and query events recorded by CloudTrail for auditing, security investigation, and operational troubleshooting. To monitor API throttling, you can run a simple query that identifies the top callers of IAM and STS.
For example, you can make a SQL-based query in the CloudTrail console to identify the top callers of IAM, as shown in Figure 1. This query includes the API count, API event name, and more that are made to IAM (shown under eventSource). In this example, the top result is a call to GetServiceLastAccessedDetails, which occurred 163 times. The result includes the account ID and principal ID that made those requests.
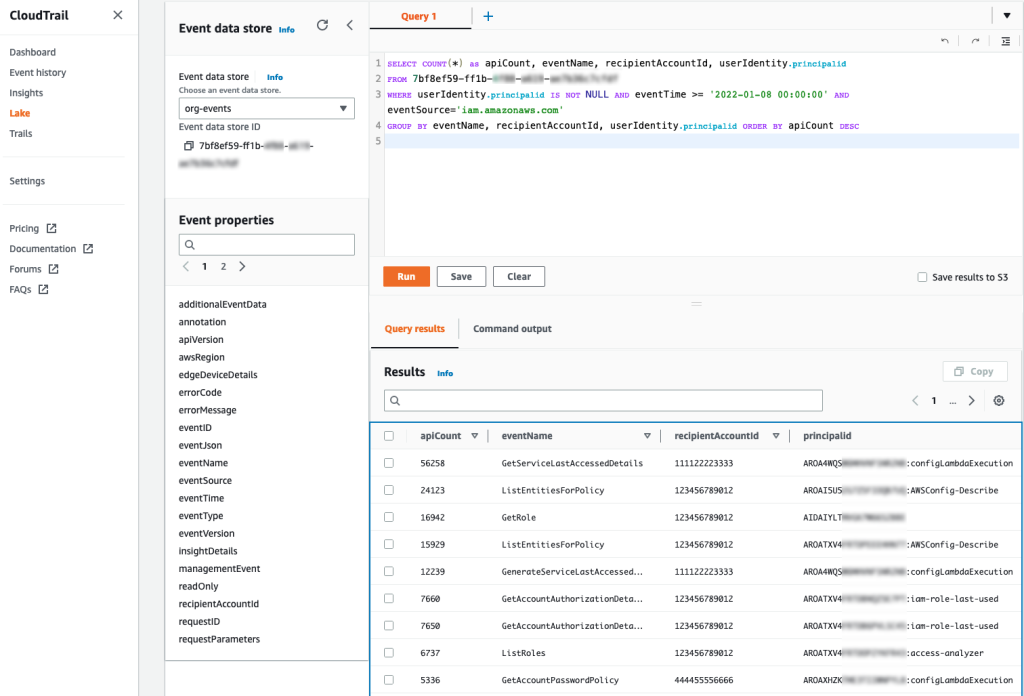
Figure 1: Example AWS CloudTrail Lake query
You can enable AWS CloudTrail Lake for all accounts in your organization. For more information, see Announcing AWS CloudTrail Lake – a managed audit and security Lake. For sample queries, including top IAM actions by principal, see cloud-trail-lake-query-samples in our aws-samples GitHub repository.
Know when you exceed API call rate limits
To reduce call throttling, you need to know when you exceed a rate limit. You can identify when you are being throttled by catching the RateLimitExceeded exception in your API calls. Or, you can send your application logs to Amazon CloudWatch Logs and then configure a metric filter to record each time that throttling occurs, for later analysis or notification. Ideally, you should do this across your applications, and log this information centrally so that you can investigate whether calls from a specific account (such as your central monitoring account) are affecting API availability across your other accounts by exceeding a rate-limiting criterion in those accounts.
Call your APIs with a less aggressive retry strategy
In the AWS SDKs, you can use the existing retry library and provide a custom base for the initial sleep done between API calls. For example, you can set a custom configuration for the backoff or edit the defaults directly. The default SDK_DEFAULT_THROTTLED_BASE_DELAY is 500 milliseconds (ms) in the relevant Java SDK file, but if you’re experiencing throttling consistently, we recommend a minimum 1000 ms for the throttled base delay. You can change this value or implement a custom configuration through the PredefinedBackoffStrategies.SDKDefaultBackoffStrategy() class, which is referenced in the same file. As another example, in the Javascript SDK, you can edit the base retry of the retryDelayOptions configuration in the AWS.Config class, as described in the documentation.
The difference between making these changes and using the SDK defaults is that the custom base provides a less aggressive retry. You shouldn’t retry multiple requests that are throttled during the same one-second window. If the API has other applicable rate-limiting criteria, you can potentially exceed those limits as well, preventing other calls in your account from performing requests. Lastly, be careful that you don’t implement your own retry or backoff logic on top of the SDK retry or backoff logic because this could make throttling worse — instead, you should override the SDK defaults.
Reduce the number of requests by using max items
For some APIs, you can increase the number of items returned by a single API call. Consider the example of the GetServiceLastAccessedDetails API. This API returns a lot of data, but the results are truncated by default to 100 items, ordered alphabetically by the service namespace. If the number of items returned is greater than 100, then the results are paginated, and you need to make multiple requests to retrieve the paginated results individually. But if you increase the value of the MaxItems parameter, you can decrease the number of requests that you need to make to obtain paginated results.
AWS has hundreds of services, so you should set the value of the MaxItems parameter no higher than your application can handle (the response size could be large). At the time of our testing, the results were no longer truncated when this value was 300. For this particular API, IAM might return fewer results, even when more results are available. This means that your code still needs to check whether the results are paginated and make an additional request if paginated results are available.
Consistent use of the MaxItems parameter across AWS APIs can help reduce your total number of API requests. The MaxItems parameter is also available through the GetOrganizationsAccessReport operation, which defaults to 100 items but offers a maximum of 1000 items, with the same caveat that fewer results might be returned, so check for paginated results.
Smooth your high burst traffic
In the table from part 1 of this post, we stated that you should evaluate IAM resources every 24 hours. However, if you use a simple script to perform this check, you could initiate a throttling event. Consider the following fictional example:
As a member of ExampleCorp’s Security team, you are working on a task to evaluate the company’s IAM resources through some custom evaluation scripts. The scripts run in a central security account. ExampleCorp has 1000 accounts. You write automation that assumes a role in every account to run the GetAccountAuthorizationDetails API call. Everything works fine during development on a few accounts, but you later build a dashboard to graph the data. To get the results faster for the dashboard, you update your code to run concurrently every hour. But after this change, you notice that many requests result in the throttling error “Rate exceeded.” Other security teams see “Rate exceeded” errors in their application logs, too.
Can you guess what happened? When you tried to make the requests faster, you used concurrency to make the requests run in parallel. By initiating this large number of requests simultaneously, you exceeded the rate-limiting criteria for the security account from which the sts:AssumeRole action was called prior to the GetAccountAuthorizationDetails API call.
To address scenarios like this, we recommend that you set your own client-side limitations when you need to make a large number of API requests. You can spread these calls out so that they happen sequentially and avoid large spikes. For example, if you run checks every 24 hours, make sure that the calls don’t happen at exactly midnight. Figure 2 shows two different ways to distribute API volume over time:
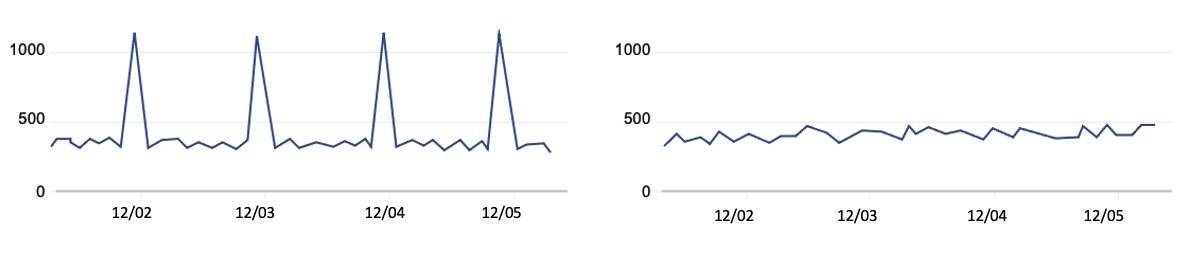
Figure 2: Call volume that periodically spikes compared to evenly-distributed call volume
The graph on the left represents a large, recurring API call volume, with calls occurring at roughly the same time each day—such as 1000 requests at midnight every 24 hours. However, if you intend to make these 1000 requests consistently every 24 hours, you can spread them out over the 24-hour period. This means that you could make about 41 requests every hour, so that 41 accounts are queried at 00:00 UTC, another 41 the next hour, and so on. By using this strategy, you can make these requests blend into your other traffic, as shown in the graph on the right, rather than create large spikes. In summary, your automation scheduler should avoid large spikes and distribute API requests evenly over the 24-hour period. Using queues such as those provided by Amazon Simple Queue Service (Amazon SQS) can also help, and when errors are identified, you can put them in a dead letter queue to try again later.
Some IAM APIs have rate-limiting criteria for API requests made from the account from which the AssumeRole was called prior to the call. We recommend that you serially iterate over the accounts in your organization to avoid throttling. To continue with our example, you should iterate the 41 accounts one-by-one each hour, rather than running 41 calls at once, to reduce spikes in your request rates.
Recommendations specific to STS
You can adjust how you use AWS STS to reduce your number of API calls. When you write code that calls the AssumeRole API, you can reuse the returned credentials for future requests because the credentials might still be valid. Imagine that you have an event-driven application running in a central account that assumes a role in a target account and does an API call for each event that occurs in that account. You should consider reusing the credentials returned by the AssumeRole call for each subsequent call in the target account, especially if calls in the central accounts are being throttled. You can do this for AssumeRole calls because there is no service-side limit to the number of credentials that you can create and use. Whether it’s one credential or many, you need to use and store these carefully. You can also adjust the role session duration, which determines how long the role’s credentials are valid. This value can be up to 12 hours, depending on the maximum session duration configured on the role. If you reuse short-term credentials or adjust the session duration, make sure that you evaluate these changes from a security perspective as you optimize your use of STS to reduce API call volume.
Use case #3: Pare down permissions for least-privileged access
Let’s assume that you want to evaluate your organization’s IAM resources with some custom evaluation scripts. AWS has native functionality that can reduce your need for a custom solution. Let’s take a look at some of these that can help you accomplish these goals.
Identify unintended external sharing
To identify whether resources in your accounts, such as IAM roles and S3 buckets, have been shared with external entities, you can use IAM Access Analyzer instead of writing your own checks. With IAM Access Analyzer, you can identify whether resources are accessible outside your account or even your entire organization. Not only can you identify these resources on-demand, but IAM Access Analyzer proactively re-analyzes resources when their policies change, and reports new findings. This can help you feel confident that you will be notified of new external sharing of supported resources, so that you can act quickly to investigate. For more details, see the IAM Access Analyzer user guide.
Right-size permissions
You can also use IAM Access Analyzer to help right-size the permissions policies for key roles in your accounts. IAM Access Analyzer has a policy generation feature that allows you to generate a policy by analyzing your CloudTrail logs to identify actions used from over 140 services. You can compare this generated policy with the existing policy to see if permissions are unused, and if so, remove them.
You can perform policy generation through the API or the IAM console. For example, you can use the console to navigate to the role that you want to analyze, and then choose Generate policy to start analyzing the actions used over a specified period. Actions that are missing from the generated policy are permissions that can be potentially removed from the existing policy, after you confirm your changes with those who administer the IAM role. To learn more about generating policies based on CloudTrail activity, see IAM Access Analyzer makes it easier to implement least privilege permissions by generating IAM policies based on access activity.
Conclusion
In this two-part series, you learned more about how to use IAM so that you can test and query IAM more efficiently. In this post, you learned about the rate-limiting criteria for IAM and STS, to help you address API throttling when increasing your usage of these services. You also learned how IAM Access Analyzer helps you identify unintended resource sharing while also generating policies that serve as a baseline for principals in your account. In part 1, you learned how to quickly create IAM resources and use them when refining permissions. You also learned how to get information about IAM resources and respond to IAM changes through the various services integrated with IAM. Lastly, when calling IAM directly, you learned about bulk APIs, which help you efficiently retrieve the state of your principals and policies. We hope these posts give you valuable insights about IAM to help you better monitor, review, and secure access to your AWS cloud environment!
If you have feedback about this post, submit comments in the Comments section below. If you have questions about this post, start a new thread on the Security, Identity, & Compliance re:Post or contact AWS Support.
Want more AWS Security news? Follow us on Twitter.
How to monitor and query IAM resources at scale – Part 1
Post Syndicated from Michael Chan original https://aws.amazon.com/blogs/security/how-to-monitor-and-query-iam-resources-at-scale-part-1/
In this two-part blog post, we’ll provide recommendations for using AWS Identity and Access Management (IAM) APIs, and we’ll share useful details on how IAM works so that you can use it more effectively. For example, you might be creating new IAM resources such as roles and policies through automation and notice a delay for resource propagations. Or you might be building a custom cloud security monitoring solution that uses IAM APIs to evaluate the security and compliance of your AWS accounts, and you want to know how to do that without exceeding limits. Although these are just a few example use cases, the insights described in this post are intended to help you avoid anti-patterns when building scalable cloud services that use IAM APIs.
In this post, we describe how to create IAM resources and use them soon after for authorization decisions. We also describe options for monitoring and responding to IAM resource changes for entire accounts. In part 2, we’ll cover the API throttling behavior of IAM and AWS Security Token Service (AWS STS) and how you can effectively plan your usage of these APIs. Let’s dive in!
Use case 1: Create IAM resources and attempt to use them immediately
If you’re a cloud developer, you create and use IAM resources when you develop applications on AWS. For your application to interact with AWS services, you need to grant IAM permissions to your application. Your application—whether it runs on AWS Lambda, Amazon Elastic Compute Cloud (Amazon EC2), or another service—will need an associated IAM role and policy that provide the necessary permissions.
Imagine that you want to create least privilege policies for your application. You begin by deploying new or updated IAM resources, such as roles and policies, along with your application updates, and you automate this process to speed up testing and development.
During development, you begin removing unnecessary policy permissions, with your automation testing the updated permissions. However, you notice that some of your updates do not immediately take effect. The following sections address why this occurs and provide insights to help you architect for other scenarios.
Understand the IAM control plane and data plane
Let’s first learn more about the control plane and data plane in IAM. The control plane involves operations to create, read, update, and delete IAM resources, and it’s how you get the current state of IAM. When you invoke IAM APIs, you interact with the control plane. This includes any API that falls under the iam:* namespace. The data plane, in contrast, consists of the authorization system that is used at scale to grant access to the broader set of AWS services and resources. This includes the AWS STS APIs, which have their own sts:* namespace.
When you call the IAM control plane APIs to create, update, or delete resources, you can expect a read-after-write consistent response. This means that you can retrieve (read) the resource and its latest updates immediately after it’s written. In contrast, the IAM data plane, where authorizations occur, is eventually consistent. This means that there will be a delay for IAM resource changes, such as updates to roles and policies, to propagate and reflect in the authorizations that follow. The delay can be several seconds or longer. Because of this, you need to allow for propagation time when you test changes to IAM resources. To learn more about the control plane and data plane of IAM, see Resilience in AWS Identity and Access Management.
Note: Because calls to AWS APIs rely on IAM to check permissions, the availability and scalability of the data plane are paramount. In 2011, the “can the caller do this?” function handled a couple of thousand requests per second. Today, as new services continue to launch and the number of AWS customers increases, AWS Identity handles over half a billion API calls per second worldwide, and the number is growing. Eventually consistent design enables the IAM data plane to maintain the high availability and low latency needed to evaluate permissions on AWS.
This is why when architecting your application, we recommend that you don’t depend on control plane actions such as resource updates for critical parts of your application’s workflow. Instead, you should architect to take advantage of the data plane, which includes STS and the authorization system of IAM. In the next section, we describe how you can do this.
Test permissions with STS scope-down policies
IAM role sessions have a feature called a session policy, which takes effect immediately when a role is assumed. This is an optional policy that you can provide to scope down the role’s existing identity policies, with the permissions being the intersection of the role’s identity-based policies and the session policy. By using session policies, you get specific, scoped-down credentials from a single pre-existing role without having to create new roles or identity policies for each particular session’s use case. You can use session policies for your application or when you test which least privilege policies are best for your application.
Let’s walk through an example of when to use session policies for permissions testing. Imagine that you need permissions that require very specific, fine-grained conditions to attain your ideal least privilege policy. You might iterate on the policy several times, making updates and testing the changes over and over again. If you update a policy attached to a role, you need to wait for these changes to propagate to the IAM data plane. But if you instead specify a scope-down policy when assuming the pre-existing role prior to testing, you can immediately test and observe the effects of your permissions changes. Immediate testing is possible because your role and its original policy have already propagated to the data plane, enabling you to iterate over various scoped-down session policies that operate against the IAM data plane.
Use STS session policies to assume a role with the AWS CLI
There are two ways to provide a session policy during the AssumeRole process: you can provide an inline policy document or the Amazon Resource Names (ARNs) of managed session policies. The following example shows how to do this through the AWS Command Line Interface (AWS CLI), by passing in a policy document along with the AssumeRole call. If you use this example policy, make sure to replace <123456789012> and <DOC-EXAMPLE-BUCKET> with your own information.
In this example, we provide a previously created role ARN named s3-full-access, which provides full access to Amazon Simple Storage Service (Amazon S3). We can further restrict the role’s permissions by supplying a policy with the optional --policy option. The inline policy document only allows the GetObject request against the S3 bucket named <DOC-EXAMPLE-BUCKET>. The effective permissions for the returned session are the intersection of the role’s identity-based policies and our provided session policy. Therefore, the role session’s permissions are limited to only performing the GetObject request against the <DOC-EXAMPLE-BUCKET>.
Note: The combined size of the passed inline policy document and all passed managed policy ARN characters cannot exceed 2,048 characters. You can reduce the size of the JSON policy document by removing unnecessary whitespace and shortening or removing tags associated with your session.
To learn more about session permissions, see Create fine-grained session permissions using IAM managed policies. In part two of this post, we will describe how you can use role sessions when you need to provide credentials at a high rate.
Use case 2: Monitor and respond to IAM resources for entire accounts
You might need to periodically audit the state of your IAM resources, such as roles and policies, including whether these IAM resources have changed, in a single account or across your entire organization. For example, you might want to check whether roles have overly broad access to actions and resources. Or you might want to monitor IAM resource creation and updates to respond to security-relevant permission changes. In this section, you will learn how to choose the right tool for auditing and monitoring IAM resources across accounts. You will learn about the AWS services that support this use case, the benefits of polling compared to event-based architectures, and powerful APIs that aggregate common information.
Respond to configuration changes with an event-driven approach
Sometimes you might need to perform actions relatively quickly based on IAM changes. For example, you might need to check if a trust policy for a newly created or updated role allows cross-account access. In cases like this, you can use AWS Config rules, AWS CloudTrail, or Amazon EventBridge to detect state changes and perform actions based on these state changes. You can use AWS Config rules to evaluate whether a resource complies with the conditions that you specify. If it doesn’t comply, you can provide a workflow to remediate the non-compliance. With CloudTrail, you can monitor your account’s API calls, and log API calls for your accounts with AWS Organizations integration. EventBridge works closely with CloudTrail and helps you create rules that match incoming events and send them to targets, such as Lambda, where your code can perform analysis or automated remediation. You can even filter out events from your accounts and send them to a central account’s event bus for processing. For an example of how to use EventBridge with IAM Access Analyzer to remediate cross-account access in a role’s trust policy, see Automate resolution for IAM Access Analyzer cross-account access findings on IAM roles. Which feature you choose depends on whether you need to monitor one account or all accounts in your organization, as well as which solution you are more comfortable building with.
One caveat to an event-driven approach is that if many events occur over a short period and your application responds to each event with an IAM API call of its own, you could eventually be throttled by IAM. To address this, you can queue up your responding API calls, distribute them over a longer period, or aggregate them to reduce API call volume. For example, if some of your calls are write APIs (such as UpdateAssumeRolePolicy or CreatePolicyVersion) or read APIs (such as GetRole or GetRolePolicy), you can call them serially with a delay between calls. If you need the latest status on a large number of principals and policies, you can call IAM bulk APIs such as GetAccountAuthorizationDetails, which will return data to you for principals and policies and their relationships in your organization. This approach helps you avoid throttling and querying the IAM control plane with unnecessary and redundant API calls. You will learn more about throttling and how to address it in part two of this post.
Retrieve point-in-time resource information with AWS Config
AWS Config helps you assess, audit, and evaluate the configuration of your AWS resources. It also offers multi-account, multi-Region data aggregation and is integrated with AWS Organizations. With AWS Config, you can create rules that detect and respond to changes. AWS Config also keeps an inventory of AWS resource configurations that you can query through its API, so that you don’t need to make direct API calls to each resource’s service. AWS Config also offers the ability to return the status of resources from multiple accounts and AWS Regions. As shown in Figure 1, you can use the AWS Config console to run a simple SQL-like statement for details on the IAM roles in your entire organization.

Figure 1: Run a query on IAM roles in AWS Config
The preceding results also show associated resources, such as the inline and attached policies for the IAM roles. Alternatively, you can obtain these results from the SDK or CLI. The following query that uses the CLI is equivalent to the preceding query that uses the console. If you use this query, make sure to replace DOC-EXAMPLE-CONFIG-AGGREGATOR> with your AWS Config aggregator.
Here is the response (note that we’ve adjusted the formatting to make it more readable):
The preceding command returns the details of roles in your organization’s accounts, including the full policy document for the associated inline policy. It also returns the customer-managed policy names and their ARNs, for which you can view the policy documents and versions by using the BatchGetResourceConfig API. Note that AWS Config doesn’t provide the AWS-managed policy documents. However, these are common across accounts, and we will show you how to query that data later in this section.
To query the status of roles in your organization, you need to have AWS Config enabled in each account. You also need an aggregator to monitor your accounts with your organization’s management account or a delegated administrator account. For more details on how to set up AWS Config, see the AWS Config developer guide. After you set up AWS Config, you can periodically call the AWS Config APIs to get a snapshot of the current or prior state of your resources. Furthermore, you can periodically pull the snapshot records and evaluate this information in other tools outside of AWS Config. So before you directly use the IAM APIs to get IAM information, consider using AWS Config—this is what it’s for!
Retrieve IAM resource information directly from IAM
As previously noted, AWS Config can give you a bulk view of your AWS and IAM resources. Additionally, CloudTrail and EventBridge can detect AWS and IAM resource changes and help you act on them. If you need data from IAM beyond what these services offer, you can query the IAM APIs directly to get the latest information on your resources.
A few key APIs can help you audit IAM resources more efficiently, especially in bulk. The first is GetAccountAuthorizationDetails, which enables you to retrieve the principals in your account, their associated inline policy documents (if any), attached managed policies, and their relationships to each other. This API reduces the need to individually call ListRolePolicies and ListAttachedRolePolicies for each role in an account. GetAccountAuthorizationDetails also returns the role trust policy document for roles in the results. Finally, GetAccountAuthorizationDetails allows you to filter the result set. For example, if you don’t need information relating to groups or AWS managed policies, you can exclude these from the API response. You can do this by using the filter parameter to only include the details that you need at the time.
Another useful API is GenerateServiceLastAccessedDetails. This API gives you details about when an IAM resource (user, group, role, or policy) was last used in an attempt to access AWS services. You can use this API to identify roles that are unused and remove them if you don’t need them. IAM Access Analyzer, which you will learn about later in this post, also uses the same information.
The following table summarizes the key APIs that you can use, rather than building your own code that loops for this information individually.
| Type of information | API | How to use the API | Frequency of use |
| User list and user detail | GetAccountAuthorizationDetails | Pass User to the filter parameter | When needed, per account |
| User’s inline policy | User’s inline policy GetAccountAuthorizationDetails | Pass User to the filter parameter | When needed, per account |
| User’s attached managed policies | GetAccountAuthorizationDetails | Pass User to the filter parameter | When needed, per account |
| Role list and role detail | GetAccountAuthorizationDetails | Pass Role to the filter parameter | When needed, per account |
| Role trust policy | GetAccountAuthorizationDetails | Pass Role to the filter parameter | When needed, per account |
| Role’s inline policy | GetAccountAuthorizationDetails | Pass Role to the filter parameter | When needed, per account |
| Role’s attached managed policies | GetAccountAuthorizationDetails | Pass Role to the filter parameter | When needed, per account |
| Role last used | GetAccountAuthorizationDetails | Pass Role to the filter parameter | When needed, per account |
| Group list and group detail | GetAccountAuthorizationDetails | Pass Group to the filter parameter | When needed, per account |
| Group’s inline policy | GetAccountAuthorizationDetails | Pass Group to the filter parameter | When needed, per account |
| Group’s attached managed policies | GetAccountAuthorizationDetails | Pass Group to the filter parameter | When needed, per account |
| AWS customer managed policies | GetAccountAuthorizationDetails | Pass LocalManagedPolicy to the filter parameter | When needed, per account |
| AWS managed policies | GetAccountAuthorizationDetails | Pass LocalManagedPolicy to the filter parameter | 24 hours recommended, globally (once for all accounts within an AWS partition) |
| Policy versions | GetAccountAuthorizationDetails | Pass either LocalManagedPolicy or WSManagedPolicy to the filter parameter | 24 hours recommended, per account |
| Services access attempts by an IAM resource | GetServiceLastAccessedDetails | Submit a job through the GenerateServiceLastAccessedDetails API, which returns a JobId; then retrieve the results after the job completes. | Spread total number of requests evenly across 24 hours |
| Actions access attempts by an IAM resource | GetServiceLastAccessedDetails | Submit a job through the GenerateServiceLastAccessedDetails API which returns a JobId; then retrieve the results after the job completes. Pass ACTION_LEVEL as the required Granularity parameter. | Spread total number of requests evenly across 24 hours |
Note: In the table, we suggest that you perform some of these API requests once every 24 hours as a starting point. You might prefer to perform your own analysis at a longer time interval, such as every 48 hours, but we don’t recommend requesting it more often than every 24 hours because these resources (and therefore the details in the responses) don’t change often. These APIs are suitable for periodic, point-in-time collection of information. If you need faster detection of information from
GetAccountAuthorizationDetails, consider whether AWS Config rules or EventBridge will fit your needs. ForGetServiceLastAccessedDetails, recent activity usually appears within four hours, so more frequent requests are unlikely to provide much value.
Use of these APIs can help you avoid writing code that loops through results to make individual read API calls for each principal, policy, and policy version in an account, which could result in tens of thousands of API requests and call throttling. Instead of iterating over each resource, you should use solutions that return bulk data, such as GetAccountAuthorizationDetails, AWS Config, or an AWS Partner Network solution. However, if you’re experiencing throttling, you will learn some practical considerations on how to handle that later in this post.
Inspect IAM resources across multiple accounts and organizations
Your use case might require that you inspect IAM resources across multiple accounts in your organization. Or perhaps you are an independent software vendor and need to build a software-as-a-service tool to evaluate IAM resources across many organizations. The following considerations can help you address use cases like these.
AWS Organizations integration
Previously, you learned of the benefits of the “service last accessed data” that the GenerateServiceLastAccessedDetails and GetServiceLastAccessedDetails APIs provide. But what if you want to pull this data for multiple accounts in your organization? IAM has bulk APIs that support querying this data across your entire organization, so you don’t need to assume a role in each account to generate the request. To generate a report for entities (organization root, organizational unit, or account) or policies in your organization, use the GenerateOrganizationsAccessReport operation, which returns a JobId that is passed as a parameter to the GetOrganizationsAccessReport operation to check if the report has been generated. When the job status is marked complete, you can retrieve the report.
AWS managed policies
Many customers use AWS managed policies because they align to common job functions. AWS creates and administers these policies, which have their own ARNs, such as arn:aws:iam::aws:policy/AWSCodeCommitPowerUser. AWS managed policies are available for every account, and they are the same for every account. AWS updates them when new services and API operations are introduced. Updated policies are recorded and visible as a new version, so you only need to query for the current AWS managed policies once per evaluation cycle, rather than once per account. Therefore, if you’re evaluating hundreds or thousands of accounts, you shouldn’t include the AWS managed policies and their policy versions in your query. Doing so would result in thousands of redundant API requests and could cause throttling. Instead, you can query the AWS managed policies once and then reuse the results across your analysis and evaluation by caching the results for a period of time (for example, every 24 hours) in your application before requesting them again to check for updates. Because AWS managed policies are available through the GetAccountAuthorizationDetails API, you don’t need to query for the AWS managed policies or their versions as a separate action.
Multi-account limits
The preceding table lists the frequency of API requests as “per account” in many places. If you’re calling IAM APIs by assuming a role in other accounts from a central account, some IAM APIs have rate-limiting criteria that apply to API requests performed from the assuming account (the central account). To query data from multiple accounts, we recommend that you serially iterate over the accounts one-by-one to avoid throttling. You’ll learn more about this strategy, as well as throttling, in part 2 of this blog post.
Conclusion
In this post, you learned about different aspects of IAM and best practices to test and query IAM efficiently. With STS session policies, you can test different policies to help achieve least privilege access. With AWS Config, EventBridge, CloudTrail, and CloudTrail Lake, you can audit your IAM resources and respond to changes while reducing the number of IAM API calls that you make. If you need to call IAM directly, you can use IAM bulk APIs for more efficient retrieval of your resource state. You can learn more about IAM and best practices in part 2 of blog post: How to monitor and query IAM resources at scale – Part 2.
If you have feedback about this post, submit comments in the Comments section below. If you have questions about this post, start a new thread on the Security, Identity, & Compliance re:Post or contact AWS Support.
Want more AWS Security news? Follow us on Twitter.
A hybrid approach in healthcare data warehousing with Amazon Redshift
Post Syndicated from Bindhu Chinnadurai original https://aws.amazon.com/blogs/big-data/a-hybrid-approach-in-healthcare-data-warehousing-with-amazon-redshift/
Data warehouses play a vital role in healthcare decision-making and serve as a repository of historical data. A healthcare data warehouse can be a single source of truth for clinical quality control systems. Data warehouses are mostly built using the dimensional model approach, which has consistently met business needs.
Loading complex multi-point datasets into a dimensional model, identifying issues, and validating data integrity of the aggregated and merged data points are the biggest challenges that clinical quality management systems face. Additionally, scalability of the dimensional model is complex and poses a high risk of data integrity issues.
The data vault approach solves most of the problems associated with dimensional models, but it brings other challenges in clinical quality control applications and regulatory reports. Because data is closer to the source and stored in raw format, it has to be transformed before it can be used for reporting and other application purposes. This is one of the biggest hurdles with the data vault approach.
In this post, we discuss some of the main challenges enterprise data warehouses face when working with dimensional models and data vaults. We dive deep into a hybrid approach that aims to circumvent the issues posed by these two and also provide recommendations to take advantage of this approach for healthcare data warehouses using Amazon Redshift.
What is a dimensional data model?
Dimensional modeling is a strategy for storing data in a data warehouse using dimensions and facts. It optimizes the database for faster data retrieval. Dimensional models have a distinct structure and organize data to provide reports that increase performance.
In a dimensional model, a transaction record is divided either into facts (often numerical), additive transactional data, or dimensions (referential information that gives context to the facts). This categorization of data into facts and dimensions, as well as the entity-relationship framework of the dimensional model, presents complex business processes in a way that is easy for analysts to understand.
A dimensional model in data warehousing is designed for reading, summarizing, and analyzing numerical information such as patient vital stats, lab reading values, counts, and so on. Regardless of the division or use case it is related to, dimensional data models can be used to store data obtained from tracking various processes like patient encounters, provider practice metrics, aftercare surveys, and more.
The majority of healthcare clinical quality data warehouses are built on top of dimensional modeling techniques. The benefit of using dimensional data modeling is that, when data is stored in a data warehouse, it’s easier to persist and extract it.
Although it’s a competent data structure technique, there are challenges in scalability, source tracking, and troubleshooting with the dimensional modeling approach. Tracking and validating the source of aggregated and compute data points is important in clinical quality regulatory reporting systems. Any mistake in regulatory reports may result in a large penalty from regulatory and compliance agencies. These challenges exist because the data points are labeled using meaningless numeric surrogate keys, and any minor error can impair prediction accuracy, and consequently affect the quality of judgments. The ways to countervail these challenges are by refactoring and bridging the dimensions. But that adds data noise over time and reduces accuracy.
Let’s look at an example of a typical dimensional data warehouse architecture in healthcare, as shown in the following logical model.

The following diagram illustrates a sample dimensional model entity-relationship diagram.

This data model contains dimensions and fact tables. You can use the following query to retrieve basic provider and patient relationship data from the dimensional model:
Challenges of dimensional modeling
Dimensional modeling requires data preprocessing before generating a star schema, which involves a large amount of data processing. Any change to the dimension definition results in a lengthy and time-consuming reprocessing of the dimension data, which often results in data redundancy.
Another issue is that, when relying merely on dimensional modeling, analysts can’t assure the consistency and accuracy of data sources. Especially in healthcare, where lineage, compliance, history, and traceability are of prime importance because of the regulations in place.
A data vault seeks to provide an enterprise data warehouse while solving the shortcomings of dimensional modeling approaches. It is a data modeling methodology designed for large-scale data warehouse platforms.
What is a data vault?
The data vault approach is a method and architectural framework for providing a business with data analytics services to support business intelligence, data warehousing, analytics, and data science needs. The data vault is built around business keys (hubs) defined by the company; the keys obtained from the sources are not the same.
Amazon Redshift RA3 instances and Amazon Redshift Serverless are perfect choices for a data vault. And when combined with Amazon Redshift Spectrum, a data vault can deliver more value.
There are three layers to the data vault:
- Staging
- Data vault
- Business vault
Staging involves the creation of a replica of the original data, which is primarily used to aid the process of transporting data from various sources to the data warehouse. There are no restrictions on this layer, and it is typically not persistent. It is 1:1 with the source systems, generally in the same format as that of the sources.
The data vault is based on business keys (hubs), which are defined by the business. All in-scope data is loaded, and auditability is maintained. At the heart of all data warehousing is integration, and this layer contains integrated data from multiple sources built around the enterprise-wide business keys. Although data lakes resemble data vaults, a data vault provides more features of a data warehouse. However, it combines the functionalities of both.
The business vault stores the outcome of business rules, including deduplication, conforming results, and even computations. When results are calculated for two or more data marts, this helps eliminate redundant computation and associated inconsistencies.
Because business vaults still don’t satisfy reporting needs, enterprises create a data mart after the business vault to satisfy dashboarding needs.
Data marts are ephemeral views that can be implemented directly on top of the business and raw vaults. This makes it easy to adapt over time and eliminates the danger of inconsistent results. If views don’t give the required level of performance, the results can be stored in a table. This is the presentation layer and is designed to be requirements-driven and scope-specific subsets of the warehouse data. Although dimensional modeling is commonly used to deliver this layer, marts can also be flat files, .xml files, or in other forms.
The following diagram shows the typical data vault model used in clinical quality repositories.

When the dimensional model as shown earlier is converted into a data vault using the same structure, it can be represented as follows.
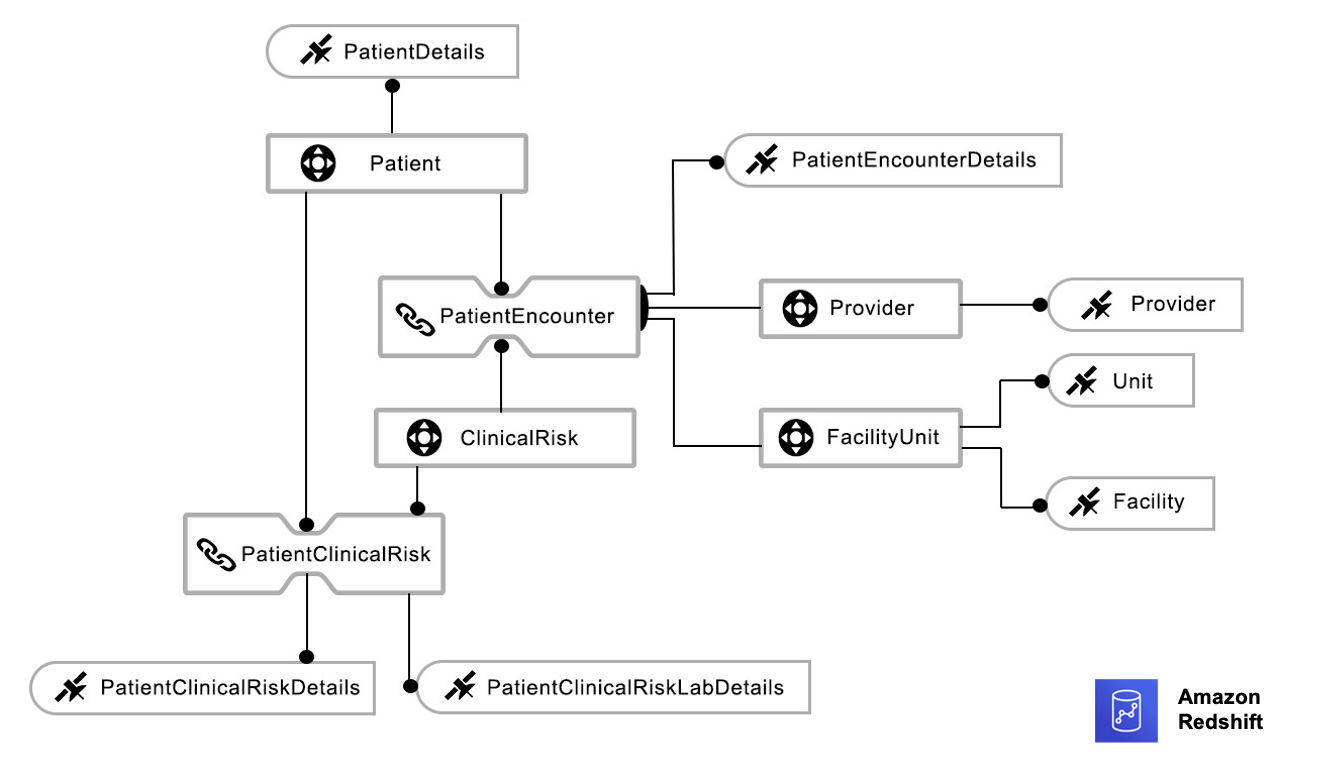
Advantages of a data vault
Although any data warehouse should be built within the context of an overarching company strategy, data vaults permit incremental delivery. You can start small and gradually add more sources over time, just like Kimball’s dimensional design technique.
With a data vault, you don’t have to redesign the structure when adding new sources, unlike dimensional modeling. Business rules can be easily changed because raw and business-generated data is kept independent of each other in a data vault.
A data vault isolates technical data reorganization from business rules, thereby facilitating the separation of these potentially tricky processes. Similarly, data cleaning can be maintained separately from data import.
A data vault accommodates changes over time. Unlike a pure dimensional design, a data vault separates raw and business-generated data and accepts changes from both sources.
Data vaults make it easy to maintain data lineage because it includes metadata identifying the source systems. In contrast to dimensional design, where data is cleansed before loading, data vault updates are always gradual, and results are never lost, providing an automatic audit trail.
When raw data is stored in a data vault, historical attributes that weren’t initially available can be added to the presentation area. Data marts can be implemented as views by adding a new column to an existing view.
In data vault 2.0, hash keys eliminate data load dependencies, which allows near-real-time data loading, as well as concurrent data loads of terabytes to petabytes. The process of mastering both entity-relationship modeling and dimensional design takes time and practice, but the process of automating a data vault is easier.
Challenges of a data vault
A data vault is not a one-size-fits-all solution for data warehouses, and it does have a few limitations.
To begin with, when directly feeding the data vault model into a report on one subject area, you need to combine multiple types of data. Due to the incapability of reporting technologies to perform such data processing, this integration can reduce report performance and increase the risk of errors. However, data vault models could improve report performance by incorporating dimensional models or adding additional reporting layers. And for data models that can be directly reported, a dimensional model can be developed.
Additionally, if the data is static or if it comes from a single source, it reduces the efficacy of data vaults. They often negate many benefits of data vaults, and require more business logic, which can be avoided.
The storage requirement for a data vault is also significantly higher. Three separate tables for the same subject area can effectively increase the number of tables by three, and when they are inserts only. If the data is basic, you can achieve the benefits listed here with a simpler dimensional model rather than deploying a data vault.
The following sample query retrieves provider and patient data from a data vault using the sample model we discussed in this section:
The query involves many joins, which increases the depth and time for the query run, as illustrated in the following chart.

This following table shows that the SQL depth and runtime is proportional, where depth is the number of joins. If the number of joins increase, then the runtime also increases and therefore the cost.
| SQL Depth | Runtime in Seconds | Cost per Query in Seconds |
| 14 | 80 | 40,000 |
| 12 | 60 | 30,000 |
| 5 | 30 | 15,000 |
| 3 | 25 | 12,500 |
The hybrid model addresses major issues raised by the data vault and dimensional model approaches that we’ve discussed in this post, while also allowing improvements in data collection, including IoT data streaming.
What is a hybrid model?
The hybrid model combines the data vault and a portion of the star schema to provide the advantages of both the data vault and dimensional model, and is mainly intended for logical enterprise data warehouses.
The hybrid approach is designed from the bottom up to be gradual and modular, and it can be used for big data, structured, and unstructured datasets. The primary data contains the business rules and enterprise-level data standards norms, as well as additional metadata needed to transform, validate, and enrich data for dimensional approaches. In this model, data processes from left to right provide data vault advantages, and data processes from right to left provide dimensional model advantages. Here, the data vault satellite tables serve as both satellite tables and dimensional tables.
After combining the dimensional and the data vault models, the hybrid model can be viewed as follows.

The following is an example entity-relation diagram of the hybrid model, which consists of a fact table from the dimensional model and all other entities from the data vault. The satellite entity from the data vault plays the dual role. When it’s connected to a data vault, it acts as a sat table, and when connected to a fact table, it acts as a dimension table. To serve this dual purpose, sat tables have two keys: a foreign key to connect with the data vault, and a primary key to connect with the fact table.
The following diagram illustrates the physical hybrid data model.

The following diagram illustrates a typical hybrid data warehouse architecture.

The following query retrieves provider and patient data from the hybrid model:
The number of joins is reduced from five to three by using the hybrid model.
Advantages of using the hybrid model
With this model, structural information is segregated from descriptive information to promote flexibility and avoid re-engineering in the event of a change. It maintains data integrity, allowing organizations to avoid hefty fines when data integrity is compromised.
The hybrid paradigm enables non-data professionals to interact with raw data by allowing users to update or create metadata and data enrichment rules. The hybrid approach simplifies the process of gathering and evaluating datasets for business applications. It enables concurrent data loading and eliminates the need for a corporate vault.
The hybrid model also benefits from the fact that there is no dependency between objects in the data storage. With hybrid data warehousing, scalability is multiplied.
You can build the hybrid model on AWS and take advantage of the benefits of Amazon Redshift, which is a fully managed, scalable cloud data warehouse that accelerates your time to insights with fast, simple, and secure analytics at scale. Amazon Redshift continuously adds features that make it faster, more elastic, and easier to use:
- Amazon Redshift data sharing enhances the hybrid model by eliminating the need for copying data across departments. It also simplifies the work of keeping the single source of truth, saving memory and limiting redundancy. It enables instant, granular, and fast data access across Amazon Redshift clusters without the need to copy or move it. Data sharing provides live access to data so that users always see the most up-to-date and consistent information as it’s updated in the data warehouse.
- Redshift Spectrum enables you to query open format data directly in the Amazon Simple Storage Service (Amazon S3) data lake without having to load the data or duplicate your infrastructure, and it integrates well with the data lake.
- With Amazon Redshift concurrency scaling, you can get consistently fast performance for thousands of concurrent queries and users. It instantly adds capacity to support additional users and removes it when the load subsides, with nothing to manage at your end.
- To realize the benefits of using a hybrid model on AWS, you can get started today without needing to provision and manage data warehouse clusters using Redshift Serverless. All the related services that Amazon Redshift integrates with (such as Amazon Kinesis, AWS Lambda, Amazon QuickSight, Amazon SageMaker, Amazon EMR, AWS Lake Formation, and AWS Glue) are available to work with Redshift Serverless.
Conclusion
With the hybrid model, data can be transformed and loaded into a target data model efficiently and transparently. With this approach, data partners can research data networks more efficiently and promote comparative effectiveness. And with the several newly introduced features of Amazon Redshift, a lot of heavy lifting is done by AWS to handle your workload demands, and you only pay for what you use.
You can get started with the following steps:
- Create an Amazon Redshift RA3 instance for your primary clinical data repository and data marts.
- Build a data vault schema for the raw vault and create materialized views for the business vault.
- Enable Amazon Redshift data shares to share data between the producer cluster and consumer cluster.
- Load the structed and unstructured data into the producer cluster data vault for business use.
About the Authors
 Bindhu Chinnadurai is a Senior Partner Solutions Architect in AWS based out of London, United Kingdom. She has spent 18+ years working in everything for large scale enterprise environments. Currently she engages with AWS partner to help customers migrate their workloads to AWS with focus on scalability, resiliency, performance and sustainability. Her expertise is DevSecOps.
 Sarathi Balakrishnan was the Global Partner Solutions Architect, specializing in Data, Analytics and AI/ML at AWS. He worked closely with AWS partner globally to build solutions and platforms on AWS to accelerate customers’ business outcomes with state-of-the-art cloud technologies and achieve more in their cloud explorations. He helped with solution architecture, technical guidance, and best practices to build cloud-native solutions. He joined AWS with over 20 years of large enterprise experience in agriculture, insurance, health care and life science, marketing and advertisement industries to develop and implement data and AI strategies.
Build a data storytelling application with Amazon Redshift Serverless and Toucan
Post Syndicated from Louis Hourcade original https://aws.amazon.com/blogs/big-data/build-a-data-storytelling-application-with-amazon-redshift-serverless-and-toucan/
This post was co-written with Django Bouchez, Solution Engineer at Toucan.
Business intelligence (BI) with dashboards, reports, and analytics remains one of the most popular use cases for data and analytics. It provides business analysts and managers with a visualization of the business’s past and current state, helping leaders make strategic decisions that dictate the future. However, customers continue to ask for better ways to tell stories with their data, and therefore increase the adoption rate of their BI tools.
Most BI tools on the market provide an exhaustive set of customization options to build data visualizations. It might appear as a good idea, but ultimately burdens business analysts that need to navigate through endless possibilities before building a report. Analysts are not graphic designers, and a poorly designed data visualization can hide the insight it’s intended to convey, or even mislead the viewer. To realize more value from your data, you should focus on building data visualizations that tell stories, and are easily understandable by your audience. This is where guided analytics helps. Instead of presenting unlimited options for customization, it intentionally limits choice by enforcing design best practices. The simplicity of a guided experience enables business analysts to spend more time generating actual insight rather than worrying about how to present them.
This post illustrates the concept of guided analytics and shows you how you can build a data storytelling application with Amazon Redshift Serverless and Toucan, an AWS Partner. Toucan natively integrates with Redshift Serverless, which enables you to deploy a scalable data stack in minutes without the need to manage any infrastructure component.
Amazon Redshift is a fully managed cloud data warehouse service that enables you to analyze large amounts of structured and semi-structured data. Amazon Redshift can scale from a few gigabytes to a petabyte-scale data warehouse, and AWS recently announced the global availability of Redshift Serverless, making it one of the best options for storing data and running ad hoc analytics in a scalable and cost-efficient way.
With Redshift Serverless, you can get insights on your data by running standalone SQL queries or by using data visualizations tools such as Amazon QuickSight, Toucan, or other third-party options without having to manage your data warehouse infrastructure.
Toucan is a cloud-based guided analytics platform built with one goal in mind: reduce the complexity of bringing data insights to business users. For this purpose, Toucan provides a no-code and comprehensive user experience at every stage of the data storytelling application, which includes data connection, building the visualization, and distribution on any device.
If you’re in a hurry and want to see what you can do with this integration, check out Shark attacks visualization with AWS & Toucan, where Redshift Serverless and Toucan help in understanding the evolution of shark attacks in the world.
Overview of solution
There are many BI tools in the market, each providing an ever-increasing set of capabilities and customization options to differentiate from the competition. Paradoxically, this doesn’t seem to increase the adoption rate of BI tools in enterprises. With more complex tools, data owners spend time building fancy visuals, and tend to add as much information as possible in their dashboards instead of providing a clear and simple message to business users.
In this post, we illustrate the concept of guided analytics by putting ourselves in the shoes of a data engineer that needs to communicate stories to business users with data visualizations. This fictional data engineer has to create dashboards to understand how shark attacks evolved in the last 120 years. After loading the shark attacks dataset in Redshift Serverless, we guide you in using Toucan to build stories that provide a better understanding of shark attacks through time. With Toucan, you can natively connect to datasets in Redshift Serverless, transform the data with a no-code interface, build storytelling visuals, and publish them for business users. The shark attacks visualization example illustrates what you can achieve by following instructions in this post.
Additionally, we have recorded a video tutorial that explains how to connect Toucan with Redshift Serverless and start building charts.
Solution architecture
The following diagram depicts the architecture of our solution.
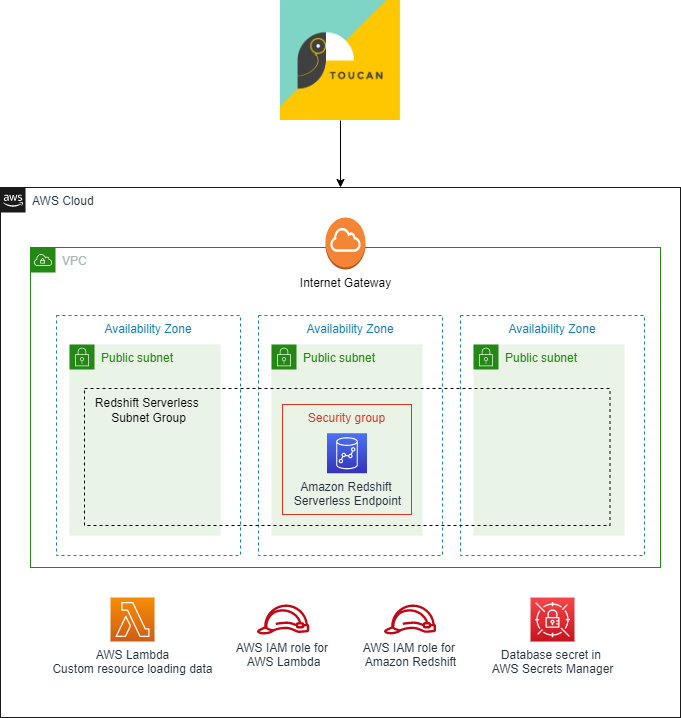
We use an AWS CloudFormation stack to deploy all the resources you need in your AWS account:
- Networking components – This includes a VPC, three public subnets, an internet gateway, and a security group to host the Redshift Serverless endpoint. In this post, we use public subnets to facilitate data access from external sources such as Toucan instances. In this case, the data in Redshift Serverless is still protected by the security group that restricts incoming traffic, and by the database credentials. For a production workload, it is recommended to keep traffic in the Amazon network. For that, you can set the Redshift Serverless endpoints in private subnets, and deploy Toucan in your AWS account through the AWS Marketplace.
- Redshift Serverless components – This includes a Redshift Serverless namespace and workgroup. The Redshift Serverless workspace is publicly accessible to facilitate the connection from Toucan instances. The database name and the administrator user name are defined as parameters when deploying the CloudFormation stack, and the administrator password is created in AWS Secrets Manager. In this post, we use database credentials to connect to Redshift Serverless, but Toucan also supports connection with AWS credentials and AWS Identity and Access Management (IAM) profiles.
- Custom resources – The CloudFormation stack includes a custom resource, which is an AWS Lambda function that loads shark attacks data automatically in your Redshift Serverless database when the CloudFormation stack is created.
- IAM roles and permissions – Finally, the CloudFormation stack includes all IAM roles associated with services previously mentioned to interact with other AWS resources in your account.
In the following sections, we provide all the instructions to connect Toucan with your data in Redshift Serverless, and guide you to build your data storytelling application.
Sample dataset
In this post, we use a custom dataset that lists all known shark attacks in the world, starting from 1900. You don’t have to import the data yourself; we use the Amazon Redshift COPY command to load the data when deploying the CloudFormation stack. The COPY command is one the fastest and most scalable methods to load data into Amazon Redshift. For more information, refer to Using a COPY command to load data.
The dataset contains 4,900 records with the following columns:
- Date
- Year
- Decade
- Century
- Type
- Zone_Type
- Zone
- Country
- Activity
- Sex
- Age
- Fatal
- Time
- Species
- href (a PDF link with the description of the context)
- Case_Number
Prerequisites
For this solution, you should have the following prerequisites:
- An AWS account. If you don’t have one already, see the instructions in Sign Up for AWS.
- An IAM user or role with permissions on AWS resources used in this solution.
- A Toucan free trial to build the data storytelling application.
Set up the AWS resources
You can launch the CloudFormation stack in any Region where Redshift Serverless is available.
- Choose Launch Stack to start creating the required AWS resources for this post:

- Specify the database name in Redshift Serverless (default is
dev). - Specify the administrator user name (default is
admin).
You don’t have to specify the database administrator password because it’s created in Secrets Manager by the CloudFormation stack. The secret’s name is AWS-Toucan-Redshift-Password. We use the secret value in subsequent steps.
Test the deployment
The CloudFormation stack takes a few minutes to deploy. When it’s complete, you can confirm the resources were created. To access your data, you need to get the Redshift Serverless database credentials.
- On the Outputs tab for the CloudFormation stack, note the name of the Secrets Manager secret.

- On the Secrets Manager console, navigate to the Amazon Redshift database secret and choose Retrieve secret value to get the database administrator user name and password.
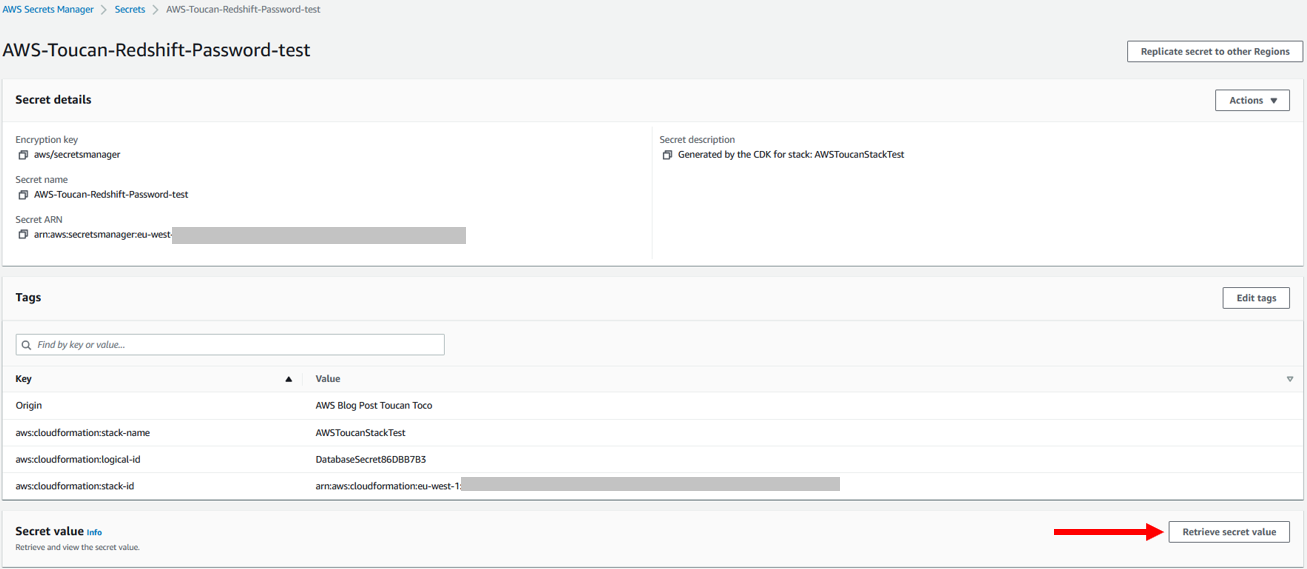
- To make sure your Redshift Serverless database is available and contains the shark attacks dataset, open the Redshift Serverless workgroup on the Amazon Redshift console and choose Query data to access the query editor.
- Also note the Redshift Serverless endpoint, which you need to connect with Toucan.

- In the Amazon Redshift query editor, run the following SQL query to view the shark attacks data:
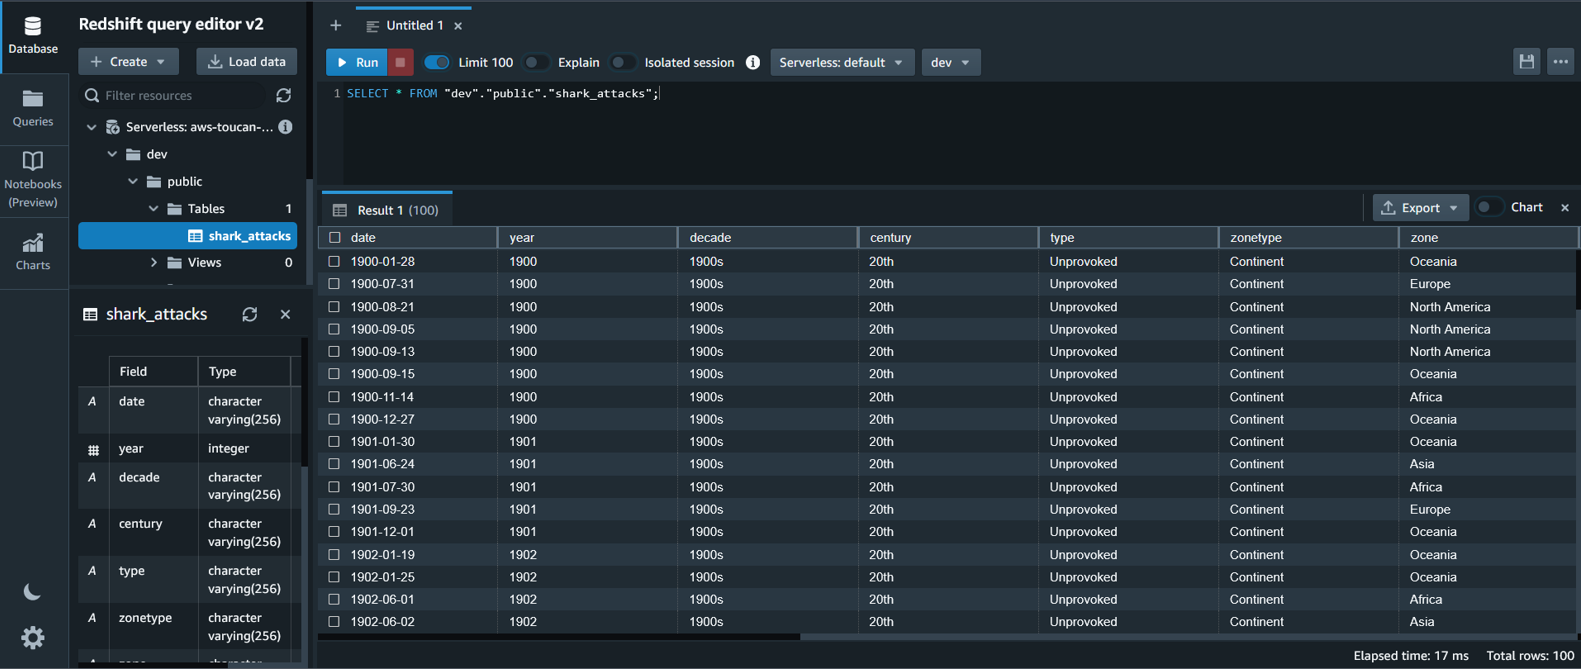
Note that you need to change the name of the database in the SQL query if you change the default value when launching the CloudFormation stack.
You have configured Redshift Serverless in your AWS account and uploaded the shark attacks dataset. Now it’s time to use this data by building a storytelling application.
Launch your Toucan free trial
The first step is to access Toucan platform through the Toucan free trial.
Fill the form and complete the signup steps. You then arrive in the Storytelling Studio, in Staging mode. Feel free to explore what has been already created.
Connect Redshift Serverless with Toucan
To connect Redshift Serverless and Toucan, complete the following steps:
- Choose Datastore at the bottom of the Toucan Storytelling Studio.
- Choose Connectors.
Toucan is natively integrated with Redshift Serverless with AnyConnect.
- Search for the Amazon Redshift connector, and complete the form with the following information:
- Name – The name of the connector in Toucan.
- Host – Your Redshift Serverless endpoint.
- Port – The listening port of your Amazon Redshift database (5439).
- Default Database – The name of the database to connect to (dev by default, unless edited in the CloudFormation stack parameters).
- Authentication Method – The authentication mechanism to connect to Redshift Serverless. In this case, we use database credentials.
- User – The user name to use for authentication with Redshift Serverless (admin by default, unless edited in the CloudFormation stack parameters).
- Password – The password to use for authentication with Redshift Serverless (you should retrieve it from Secrets Manager; the secret’s name is
AWS-Toucan-Redshift-Password).
Create a live query
You are now connected to Redshift Serverless. Complete the following steps to create a query:
- On the home page, choose Add tile to create a new visualization.

- Choose the Live Connections tab, then choose the Amazon Redshift connector you created in the previous step.
The Toucan trial guides you in building your first live query, in which you can transform your data without writing code using the Toucan YouPrep module.
For instance, as shown in the following screenshot, you can use this no-code interface to compute the sum of fatal shark attacks by activities, get the top five, and calculate the percentage of the total.
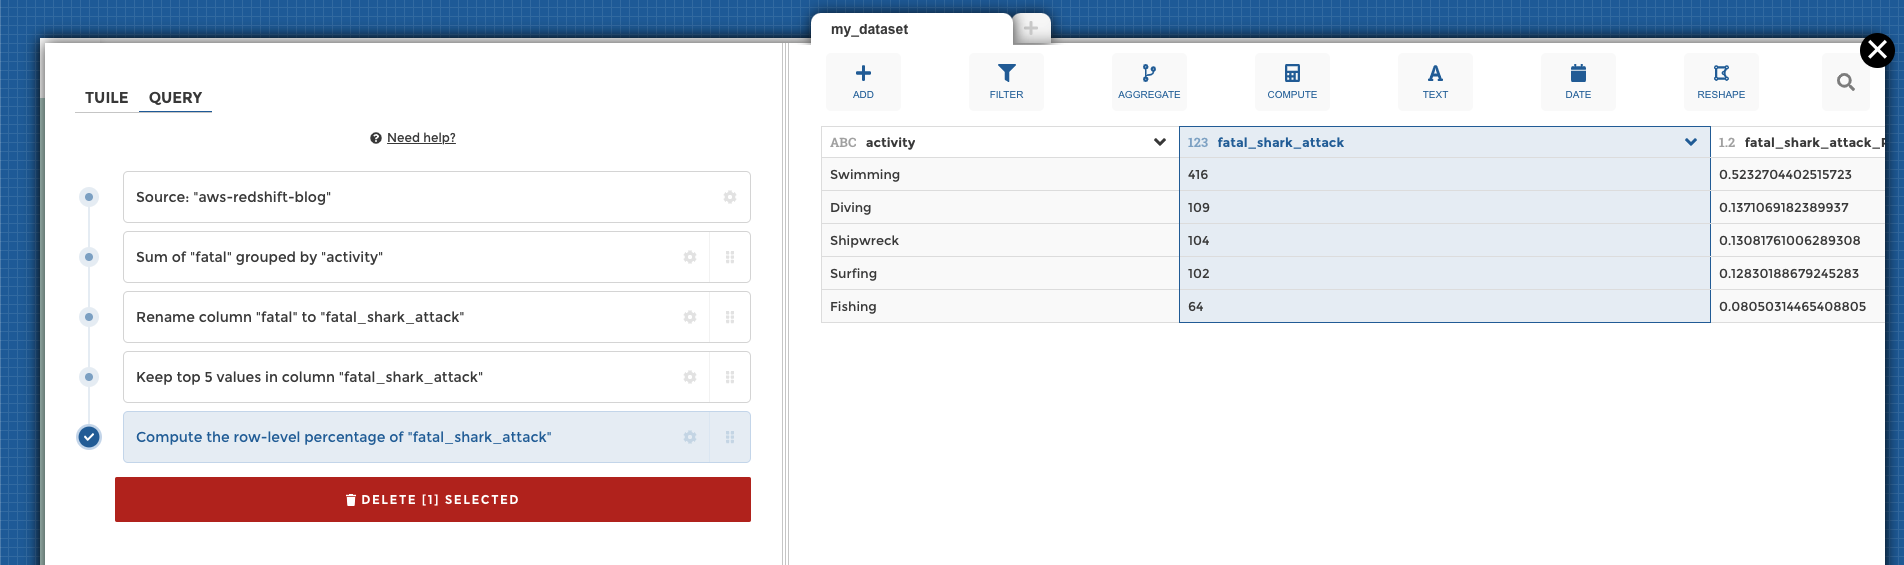
Build your first chart
When your data is ready, choose the Tile tab and complete the form that helps you build charts.
For example, you can configure a leaderboard of the five most dangerous activities, and add a highlight for activities with more than 100 attacks.
Choose Save Changes to save your work and go back to the home page.

Publish and share your work
Until this stage, you have been working in working in Staging mode. To make your work available to everyone, you need to publish it into Production.
On the bottom right of the home page, choose the eye icon to preview your work by putting yourself in the shoes of your future end-users. You can then choose Publish to make your work available to all.
Toucan also offers multiple embedding options to make your charts easier for end-users to access, such as mobile and tablet.
Following these steps, you connected to Redshift Serverless, transformed the data with the Toucan no-code interface, and built data visualizations for business end-users. The Toucan trial guides you in every stage of this process to help you get started.
Redshift Serverless and Toucan guided analytics provide an efficient approach to increase the adoption rate of BI tools by decreasing infrastructure work for data engineers, and by simplifying dashboard understanding for business end-users. This post only covered a small part of what Redshift Serverless and Toucan offer, so feel free to explore other functionalities in the Amazon Redshift Serverless documentation and Toucan documentation.
Clean up
Some of the resources deployed in this post through the CloudFormation template incur costs as long as they’re in use. Be sure to remove the resources and clean up your work when you’re finished in order to avoid unnecessary cost.
On the CloudFormation console, choose Delete stack to remove all resources.
Conclusion
This post showed you how to set up an end-to-end architecture for guided analytics with Redshift Serverless and Toucan.
This solution benefits from the scalability of Redshift Serverless, which enables you to store, transform, and expose data in a cost-efficient way, and without any infrastructure to manage. Redshift Serverless natively integrates with Toucan, a guided analytics tool designed to be used by everyone, on any device.
Guided analytics focuses on communicating stories through data reports. By setting intentional constraints on customization options, Toucan makes it easy for data owners to build meaningful dashboards with a clear and concise message for end-users. It works for both your internal and external customers, on an unlimited number of use cases.
Try it now with our CloudFormation template and a free Toucan trial!
About the Authors
 Louis Hourcade is a Data Scientist in the AWS Professional Services team. He works with AWS customer across various industries to accelerate their business outcomes with innovative technologies. In his spare time he enjoys running, climbing big rocks, and surfing (not so big) waves.
 Benjamin Menuet is a Data Architect with AWS Professional Services. He helps customers develop big data and analytics solutions to accelerate their business outcomes. Outside of work, Benjamin is a trail runner and has finished some mythic races like the UTMB.
 Xavier Naunay is a Data Architect with AWS Professional Services. He is part of the AWS ProServe team, helping enterprise customers solve complex problems using AWS services. In his free time, he is either traveling or learning about technology and other cultures.
 Django Bouchez is a Solution Engineer at Toucan. He works alongside the Sales team to provide support on technical and functional validation and proof, and is also helping R&D demo new features with Cloud Partners like AWS. Outside of work, Django is a homebrewer and practices scuba diving and sport climbing.
[$] Passwordless authentication with FIDO2—beyond just the web
Post Syndicated from original https://lwn.net/Articles/923656/
FIDO2 is a standard for
authenticating users without the need for passwords. While the technology has
been introduced mainly to protect accounts on web sites, it’s also useful
for other purposes, such as logging into Linux systems. The same technology
can even be used beyond authentication, for example to sign files or Git
commits. A couple of talks at FOSDEM
2023 in Brussels presented the possibilities for Linux users.