[$] The first half of the 6.3 merge window

Post Syndicated from original https://lwn.net/Articles/923846/

As of this writing, 5,776 non-merge changesets have been pulled into the
mainline kernel for the 6.3 release; that is a bit less than half of the
work that was waiting in linux-next before the merge window opened. This
merge window is thus well underway, but far from complete. Quite a bit of
significant work has been pulled so far; read on to see what entered the
kernel in the first half of the 6.3 merge window.

Uploading large objects to Amazon S3 using multipart upload and transfer acceleration

Post Syndicated from James Beswick original https://aws.amazon.com/blogs/compute/uploading-large-objects-to-amazon-s3-using-multipart-upload-and-transfer-acceleration/

This post is written by Tam Baghdassarian, Cloud Application Architect, Rama Krishna Ramaseshu, Sr Cloud App Architect, and Anand Komandooru, Sr Cloud App Architect.

Web and mobile applications must often upload objects to the AWS Cloud. For example, services such as Amazon Photos allow users to upload photos and large video files from their browser or mobile application.

Amazon S3 can be ideal to store large objects due to its 5-TB object size maximum along with its support for reducing upload times via multipart uploads and transfer acceleration.

Overview

Developers who must upload large files from their web and mobile applications to the cloud can face a number of challenges. Due to underlying TCP throughput limits, a single HTTP connection cannot use the full bandwidth available, resulting in slower upload times. Furthermore, network latency and quality can result in poor or inconsistent user experience.

Using S3 features such as presigned URLs and multipart upload, developers can securely increase throughput and minimize upload retries due to network errors. Additionally, developers can use transfer acceleration to reduce network latency and provide a consistent user experience to their web and mobile app users across the globe.

This post references a sample application consisting of a web frontend and a serverless backend application. It demonstrates the benefits of using S3’s multipart upload and transfer acceleration features.

Architecture overview

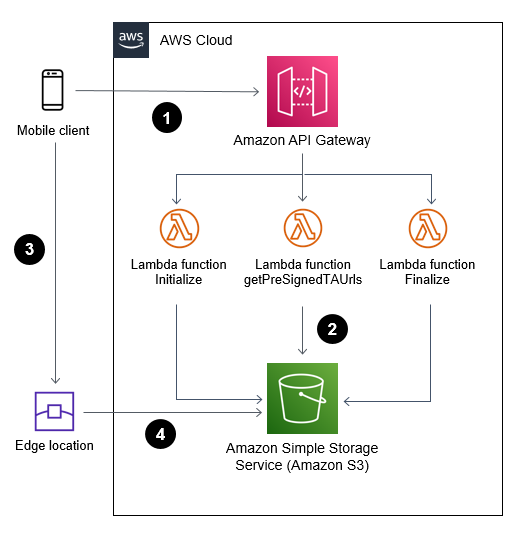
Solution overview:

  1. Web or mobile application (frontend) communicates with AWS Cloud (backend) through Amazon API Gateway to initiate and complete a multipart upload.
  2. AWS Lambda functions invoke S3 API calls on behalf of the web or mobile application.
  3. Web or mobile application uploads large objects to S3 using S3 transfer acceleration and presigned URLs.
  4. File uploads are received and acknowledged by the closest edge location to reduce latency.

Using S3 multipart upload to upload large objects

A multipart upload allows an application to upload a large object as a set of smaller parts uploaded in parallel. Upon completion, S3 combines the smaller pieces into the original larger object.

Breaking a large object upload into smaller pieces has a number of advantages. It can improve throughput by uploading a number of parts in parallel. It can also recover from a network error more quickly by only restarting the upload for the failed parts.

Multipart upload consists of:

  1. Initiate the multipart upload and obtain an upload id via the CreateMultipartUpload API call.
  2. Divide the large object into multiple parts, get a presigned URL for each part, and upload the parts of a large object in parallel via the UploadPart API call.
  3. Complete the upload by calling the CompleteMultipartUpload API call.

When used with presigned URLs, multipart upload allows an application to upload the large object using a secure, time-limited method without sharing private bucket credentials.

This Lambda function can initiate a multipart upload on behalf of a web or mobile application:

const multipartUpload = await s3. createMultipartUpload(multipartParams).promise()
return {
    statusCode: 200,
    body: JSON.stringify({
        fileId: multipartUpload.UploadId,
        fileKey: multipartUpload.Key,
      }),
    headers: {
      'Access-Control-Allow-Origin': '*'
    }
};

The UploadId is required for subsequent calls to upload each part and complete the upload.

Uploading objects securely using S3 presigned URLs

A web or mobile application requires write permission to upload objects to a S3 bucket. This is usually accomplished by granting access to the bucket and storing credentials within the application.

You can use presigned URLs to access S3 buckets securely without the need to share or store credentials in the calling application. In addition, presigned URLs are time-limited (the default is 15 minutes) to apply security best practices.

A web application calls an API resource that uses the S3 API calls to generate a time-limited presigned URL. The web application then uses the URL to upload an object to S3 within the allotted time, without having explicit write access to the S3 bucket. Once the presigned URL expires, it can no longer be used.

When combined with multipart upload, a presigned URL can be generated for each of the upload parts, allowing the web or mobile application to upload large objects.

This example demonstrates generating a set of presigned URLs for index number of parts:

    const multipartParams = {
        Bucket: bucket_name,
        Key: fileKey,
        UploadId: fileId,
    }
    const promises = []

    for (let index = 0; index < parts; index++) {
        promises.push(
            s3.getSignedUrlPromise("uploadPart", {
            ...multipartParams,
            PartNumber: index + 1,
            Expires: parseInt(url_expiration)
            }),
        )
    }
    const signedUrls = await Promise.all(promises)

Prior to calling getSignedUrlPromise, the client must obtain an UploadId via CreateMultipartUpload. Read Generating a presigned URL to share an object for more information.

Reducing latency by using transfer acceleration

By using S3 transfer acceleration, the application can take advantage of the globally distributed edge locations in Amazon CloudFront. When combined with multipart uploads, each part can be uploaded automatically to the edge location closest to the user, reducing the upload time.

Transfer acceleration must be enabled on the S3 bucket. It can be accessed using the endpoint bucketname.s3-acceleration.amazonaws.com or bucketname.s3-accelerate.dualstack.amazonaws.com to connect to the enabled bucket over IPv6.

Use the speed comparison tool to test the benefits of the transfer acceleration from your location.

You can use transfer acceleration with multipart uploads and presigned URLs to allow a web or mobile application to upload large objects securely and efficiently.

Transfer acceleration needs must be enabled on the S3 bucket. This example creates an S3 bucket with transfer acceleration using CDK and TypeScript:

const s3Bucket = new s3.Bucket(this, "document-upload-bucket", {
      bucketName: “BUCKET-NAME”,
      encryption: BucketEncryption.S3_MANAGED,
      enforceSSL: true,
      transferAcceleration: true,      
      removalPolicy: cdk.RemovalPolicy.DESTROY
    });

After activating transfer acceleration on the S3 bucket, the backend application can generate transfer acceleration-enabled presigned URLs. by initializing the S3 SDK:

s3 = new AWS.S3({useAccelerateEndpoint: true});

The web or mobile application then use the presigned URLs to upload file parts.

See S3 transfer acceleration for more information.

Deploying the test solution

To set up and run the tests outlined in this blog, you need:

  • An AWS account.
  • Install and configure AWS CLI.
  • Install and bootstrap AWS CDK.
  • Deploy the backend and frontend solution at the following git repository.
  • A sufficiently large test upload file of at least 100 MB.

To deploy the backend:

  1. Clone the repository to your local machine.
  2. From the backendv2 folder, install all dependencies by running:
    npm install
  3. Use CDK to deploy the backend to AWS:
    cdk deploy --context env="randnumber" --context whitelistip="xx.xx.xxx.xxx"

You can use an additional context variable called “urlExpiry” to set a specific expiration time on the S3 presigned URL. The default value is set at 300 seconds. A new S3 bucket with the name “document-upload-bucket-randnumber” is created for storing the uploaded objects, and the whitelistip value allows API Gateway access from this IP address only.

Note the API Gateway endpoint URL for later.

To deploy the frontend:

  1. From the frontend folder, install the dependencies:
    npm install
  2. To launch the frontend application from the browser, run:
    npm run start

Testing the application

Testing the application

To test the application:

  1. Launch the user interface from the frontend folder:
    npm run
  2. Enter the API Gateway address in the API URL textbox.Select the maximum size of each part of the upload (the minimum is 5 MB) and the number of parallel uploads. Use your available bandwidth, TCP window size, and retry time requirements to determine the optimal part size. Web browsers have a limit on the number of concurrent connections to the same server. Specifying a larger number of concurrent connections results in blocking on the web browser side.
  3. Decide if transfer acceleration should be used to further reduce latency.
  4. Choose a test upload file.
  5. Use the Monitor section to observe the total time to upload the test file.

Experiment with different values for part size, number of parallel uploads, use of transfer acceleration and the size of the test file to see the effects on total upload time. You can also use the developer tools for your browser to gain more insights.

Test results

The following tests have the following characteristics:

  • The S3 bucket is located in the US East Region.
  • The client’s average upload speed is 79 megabits per second.
  • The Firefox browser uploaded a file of 485 MB.

Test 1 – Single part upload without transfer acceleration

To create a baseline, the test file is uploaded without transfer acceleration and using only a single part. This simulates a large file upload without the benefits of multipart upload. The baseline result is 72 seconds.

Single part upload without transfer acceleration

Test 2 – Single upload with transfer acceleration

The next test measured upload time using transfer acceleration while still maintaining a single upload part with no multipart upload benefits. The result is 43 seconds (40% faster).

Single upload with transfer acceleration

Test 3 – Multipart upload without transfer acceleration

This test uses multipart upload by splitting the test file into 5-MB parts with a maximum of six parallel uploads. Transfer acceleration is disabled. The result is 45 seconds (38% faster).

Multipart upload without transfer acceleration

Test 4 – Multipart upload with transfer acceleration

For this test, the test file is uploaded by splitting the file into 5-MB parts with a maximum of six parallel uploads. Transfer acceleration is enabled for each upload. The result is 28 seconds (61% faster).

Multipart upload with transfer acceleration

The following chart summarizes the test results.

Multipart upload Transfer acceleration Upload time
No No 72s
Yes No 43s
No Yes 45s
Yes Yes 28s

Conclusion

This blog shows how web and mobile applications can upload large objects to Amazon S3 in a secured and efficient manner when using presigned URLs and multipart upload.

Developers can also use transfer acceleration to reduce latency and speed up object uploads. When combined with multipart upload, you can see upload time reduced by up to 61%.

Use the reference implementation to start incorporating multipart upload and S3 transfer acceleration in your web and mobile applications.

For more serverless learning resources, visit Serverless Land.

Rust Keyword Generics Progress Report: February 2023

Post Syndicated from original https://lwn.net/Articles/924246/

The group working on adding keyword generics to the Rust language is
foreshadowing
what it plans to propose:

A main driver of the keywords generics initiative has been our
desire to make the different modifier keywords in Rust feel
consistent with one another. Both the const WG and the async WG
were thinking about introducing keyword-traits at the same time,
and we figured we should probably start talking with each other to
make sure that what we were going to introduce felt like it was
part of the same language – and could be extended to support more
keywords in the future.

Developing portable AWS Lambda functions

Post Syndicated from Pascal Vogel original https://aws.amazon.com/blogs/compute/developing-portable-aws-lambda-functions/

This blog post is written by Uri Segev, Principal Serverless Specialist Solutions Architect

When developing new applications or modernizing existing ones, you might face a dilemma: which compute technology to use? A serverless compute service such as AWS Lambda or maybe containers? Often, serverless can be the better approach thanks to automatic scaling, built-in high availability, and a pay-for-use billing model. However, you may hesitate to choose serverless for reasons such as:

  • Perceived higher cost or difficulty in estimating cost
  • It is a paradigm shift, which requires learning to bridge the knowledge gap
  • Misconceptions about Lambda capabilities and use cases
  • Concern that using Lambda will result in lock-in
  • Existing investments in non-serverless platforms and tooling

This blog post suggests best practices for developing portable Lambda functions that allow you to easily port your code to containers if you later choose to. By doing so, you can avoid lock-in and try out the serverless approach in a risk-free way.

Each section of this blog post describes what you need to consider when writing portable code and the steps needed to migrate this code from Lambda to containers, if you later choose to do so.

Best practices for portable Lambda functions

Separate business logic and Lambda handler

Lambda functions are event-driven in nature. When a specific event happens, it invokes the Lambda function by calling its handler method. The handler method receives an event object which contains information regarding the reason for the function invocation. Once the function execution completes, it returns from the handler method. Whatever is returned from the handler is the function’s return value.

To write portable code, we recommend using the handler method only as an interface between the Lambda runtime (event object) and the business logic. Using Hexagonal architecture terminology, the handler should be a driving adapter making calls into the port, which is the interface exposed by the business logic The handler should extract all required information from the event object and then call a separate method that implements the business logic.

When that method returns, the handler constructs the result in the format expected by the function invoker and returns it. We also recommend splitting the handler code and the business logic code into separate files. Should you choose to migrate to containers later, you simply migrate your business logic code files with no additional changes.

The following pseudocode shows a Lambda handler that extracts information from the event object and calls the business logic. Once the business logic is done, the handler places the response in the function’s return value:

import business_logic

# The Lambda handler extracts needed information from the event
# object and invokes the business logic
handler(event, context) {
  # Extract needed information from event object payload = event[‘payload’]

  # Invoke business logic
  result = do_some_logic(payload)
  
  # Construct result for API Gateway
  return {
    statusCode: 200,
	body: result
  }
}

The following pseudocode shows the business logic. It’s located in a separate file and is unaware that it is being invoked from a Lambda function. It is pure logic.

# This is the business logic. It knows nothing about who invokes it.
do_some_logic(data) {
result = "This is my result."
  return result
}

This approach also makes it easier to run unit tests on the business logic without the need to construct event objects and to invoke the Lambda handler.

If you migrate to containers later, you include the business logic files in your container with new interface code as described in the following section.

Event source integration

One benefit of Lambda functions is the event source integration. For instance, if you integrate Lambda with Amazon Simple Queue Service (Amazon SQS), the Lambda service will take care of polling the queue, invoking the Lambda function and deleting the messages from the queue when done. By using this integration, you need to write less boilerplate code. You can focus only on implementing business logic and not the integration with the event source.

The following pseudocode shows how the Lambda handler looks like for an SQS event source:

import business_logic

handler(event, context) {
  entries = []
  # Iterate over all the messages in the event object
  for message in event[‘Records’] {
    # Call the business logic to process a single message
    success = handle_message(message)

    # Start building the response
    if Not success {
      entries.append({
      'itemIdentifier': message['messageId']
      })
    }
  }

  # Notify Lambda about failed items.
  if (let(entries) > 0) {
    return {
      'batchItemFailures': entries
    }
  }
}

As you can see in the previous code, the Lambda function has almost no knowledge that it is being invoked from SQS. There are no SQS API calls. It only knows the structure of the event object, which is specific to SQS.

When moving to a container, the integration responsibility moves from the Lambda service to you, the developer. There are different event sources in AWS, and each of them will require a different approach for consuming events and invoking business logic. For example, if the event source is Amazon API Gateway, your application will need to create an HTTP server that listens on an HTTP port and waits for incoming requests in order to invoke the business logic.

If the event source is Amazon Kinesis Data Streams, your application will need to run a poller that reads records from the shards, keep track of processed records, handle the case of a change in the number of shards in the stream, retry on errors, and more. Regardless of the event source, if you follow the previous recommendations, you will not need to change anything in the business logic code.

The following pseudocode shows how the integration with SQS will look like in a container. Note that you will lose some features such as batching, filtering, and, of course, automatic scaling.

import aws_sdk
import business_logic

QUEUE_URL = os.environ['QUEUE_URL']
BATCH_SIZE = os.environ.get('BATCH_SIZE', 1)
sqs_client = aws_sdk.client('sqs')

main() {
  # Infinite loop to poll for messages from SQS
  while True {

    # Receive a batch of messages from the queue
    response = sqs_client.receive_message(
      QueueUrl = QUEUE_URL,
      MaxNumberOfMessages = BATCH_SIZE,
      WaitTimeSeconds = 20 )

    # Loop over the messages in the batch
    entries = []
    i = 1
    for message in response.get('Messages',[]) {
      # Process a single message
      success = handle_message(message)

      # Append the message handle to an array that is later
      # used to delete processed messages
      if success {
        entries.append(
          {
            'Id': f'index{i}',
            'ReceiptHandle': message['receiptHandle']
          }
        )
        i += 1
      }
    }

    # Delete all the processed messages
    if (len(entries) > 0) {
      sqs_client.delete_message_batch(
        QueueUrl = QUEUE_URL,
        Entries = entries
      )
    }
  }
}

Another point to consider here is Lambda destinations. If your function is invoked asynchronously and you configured a destination for your function, you will need to include that in the interface code. It will need to catch any business logic error and, based on that, invoke the right destination.

Package functions as containers

Lambda supports packaging functions as .zip files and container images. To develop portable code, we recommend using container images as your default packaging method. Even though you package the function as a container image, you can’t run it on other container platforms such as Amazon Elastic Container Service (Amazon ECS) or Amazon Elastic Kubernetes Service (EKS). However, by packaging it this way, the migration to containers later will be easier as you are already using the same tools and you already created a Dockerfile that will require minimal changes.

An example Dockerfile for Lambda looks like this:

FROM public.ecr.aws/lambda/python:3.9
COPY *.py requirements.txt ./
RUN python3.9 -m pip install -r requirements.txt -t .
CMD ["app.lambda_handler"]

If you move to containers later, you will need to change the Dockerfile to use a different base image and adapt the CMD line that defines how to start the application. This is in addition to the code changes described in the previous section.

The corresponding Dockerfile for the container will look like this:

FROM python:3.9
COPY *.py requirements.txt ./
RUN python3.9 -m pip install -r requirements.txt -t .
CMD ["python", "./app.py"]

The deployment pipeline also needs to change as we deploy to a different target. However, building the artifacts remains the same.

Single invocation per instance

Lambda functions run in their own isolated runtime environment. Each environment handles a single request at a time which works great for Lambda. However, if you migrate your application to containers, you will likely invoke the business logic from multiple threads in a single process at the same time.

This section discusses aspects of moving from a single invocation to multiple concurrent invocations within the same process.

Static variables

Static variables are those that are instantiated once and then reused across multiple invocations. Examples of such variables are database connections or configuration information.

For function optimization, and specifically for reducing cold starts and the duration of warm function invocations, we recommend initializing all static variables outside the function handler and storing them in global variables so that further invocations will reuse them.

We recommend using an initialization function that you write as part of the business logic module and that you invoke from outside the handler. This function saves information in global variables that the business logic code reuses across invocations.

The following pseudocode shows the Lambda function:

import business_logic

# Call the initialization code
initialize()

handler(event, context) {
  ...
  # Call the business logic
  ...
}

And the business logic code will look like this:

# Global variables used to store static data
var config

initialize() {
  config = read_Config()
}

do_some_logic(data) {
  # Do something with config object
  ...
}

The same also applies to containers. You will usually initialize static variables when the process starts and not for every single request. When moving to containers, all you need to do is call the initialization function before starting the main application loop.

import business_logic

# Call the initialization code
initialize()

main() {
  while True {
    ...
    # Call the business logic
    ...
  }
}

As you can see, there are no changes in the business logic code.

Database connections

As Lambda functions share nothing between the runtime environments, unlike containers they can’t rely on connection pools when connecting to a relational database. For this reason, we created Amazon RDS Proxy, which acts as a centralized connection pool used by many functions.

To write portable Lambda functions, we recommend using a connection pool object with a single connection. Your business logic code will always ask for a connection from the pool when making a database request. You will still need to use RDS Proxy.

If you later move to containers, you can increase the number of connections in the pool to a larger number with no further changes and the application will scale without overwhelming the database.

File system

Lambda functions come with a writable /tmp folder in the size of 512 MB to 10 GB. As each function instance runs in an isolated runtime environment, developers usually use fixed file names for files stored in that folder. If you run the same business logic code in a container in multiple threads, the different threads will overwrite the files created by others.

We recommended using unique file names in each invocation. Append a UUID or another random number to the file name. Delete the files once you are done with them to avoid running out of space.

If you move your code to containers later, there is nothing to do.

Portable web applications

If you develop a web application, there is another way to achieve portability. You can use the AWS Lambda Web Adapter project to host a web app inside a Lambda function. This way you can develop a web application with familiar frameworks (e.g., Express.js, Next.js, Flask, Spring Boot, Laravel, or anything that uses HTTP 1.1/1.0), and run it on Lambda. If you package your web application as a container, the same Docker image can run on Lambda (using the web adapter) and containers.

Porting from containers to Lambda

This blog post demonstrates how to develop portable Lambda functions you can easily port to containers. Taking these recommendations into consideration can also help develop portable code in general, which allows you to port containers to Lambda functions.

Some things to consider:

  • Separate the business logic from the interface code in the container. The interface code should interact with the event sources and invoke the business logic.
  • As Lambda functions only have a /tmp writable folder, replicate this in your containers (even though you could write to different locations).

Conclusion

This blog post suggests best practices for developing Lambda functions that allow you to gain the benefits of a serverless approach without risking lock-in.

By following these best practices for separating business logic from Lambda handlers, packaging functions as containers, handling Lambda’s single invocation per instance, and more, you can develop portable Lambda functions. As a consequence, you will be able to port your code from Lambda to containers with minimal effort if you choose to move to containers later.

Refer to these best practices and code samples to ease the adoption of a serverless approach when developing your next application.

For more serverless learning resources, visit Serverless Land.

Security updates for Thursday

Post Syndicated from original https://lwn.net/Articles/924236/

Security updates have been issued by CentOS (firefox and thunderbird), Debian (asterisk, git, mariadb-10.3, node-url-parse, python-cryptography, and sofia-sip), Fedora (c-ares, golang-github-need-being-tree, golang-helm-3, golang-oras, golang-oras-1, and golang-oras-2), Oracle (httpd:2.4, kernel, php:8.0, python-setuptools, python3, samba, systemd, tar, and webkit2gtk3), Red Hat (webkit2gtk3), SUSE (phpMyAdmin, poppler, and postgresql12), and Ubuntu (dcmtk and linux-hwe).

Cyberwar Lessons from the War in Ukraine

Post Syndicated from Bruce Schneier original https://www.schneier.com/blog/archives/2023/02/cyberwar-lessons-from-the-war-in-ukraine.html

The Aspen Institute has published a good analysis of the successes, failures, and absences of cyberattacks as part of the current war in Ukraine: “The Cyber Defense Assistance Imperative ­ Lessons from Ukraine.”

Its conclusion:

Cyber defense assistance in Ukraine is working. The Ukrainian government and Ukrainian critical infrastructure organizations have better defended themselves and achieved higher levels of resiliency due to the efforts of CDAC and many others. But this is not the end of the road—the ability to provide cyber defense assistance will be important in the future. As a result, it is timely to assess how to provide organized, effective cyber defense assistance to safeguard the post-war order from potential aggressors.

The conflict in Ukraine is resetting the table across the globe for geopolitics and international security. The US and its allies have an imperative to strengthen the capabilities necessary to deter and respond to aggression that is ever more present in cyberspace. Lessons learned from the ad hoc conduct of cyber defense assistance in Ukraine can be institutionalized and scaled to provide new approaches and tools for preventing and managing cyber conflicts going forward.

I am often asked why where weren’t more successful cyberattacks by Russia against Ukraine. I generally give four reasons: (1) Cyberattacks are more effective in the “grey zone” between peace and war, and there are better alternatives once the shooting and bombing starts. (2) Setting these attacks up takes time, and Putin was secretive about his plans. (3) Putin was concerned about attacks spilling outside the war zone, and affecting other countries. (4) Ukrainian defenses were good, aided by other countries and companies. This paper gives a fifth reasons: they were technically successful, but keeping them out of the news made them operationally unsuccessful.

Data Buffering in Zabbix Proxy

Post Syndicated from Markku Leiniö original https://blog.zabbix.com/data-buffering-in-zabbix-proxy/25410/

One of the features of Zabbix proxy is that it can buffer the collected monitoring data if connectivity to Zabbix server is lost. In this post I will show it happening, using packet capture, or packet analysis.

Zabbix setup and capturing Zabbix proxy traffic

This is the setup in this demo:

  • One Zabbix server in the central site (IPv6 address 2001:db8:1234::bebe and DNS name zabbixtest.lein.io)
  • One Zabbix proxy “Proxy-1” in a remote site (IPv6 address 2001:db8:9876::fafa and IPv4 address 10.0.41.65)
  • One Zabbix agent “Testhost” on a server in the remote site, sending data via the proxy

For simplicity, the agent only monitors one item: the system uptime (item key system.uptime using Zabbix active agent), with 20 seconds interval. So that’s the data that we are expecting to arrive to the server, every 20 seconds.

The proxy is an active proxy using SQLite database, with these non-default configurations in the configuration file:

Server=zabbixtest.lein.io
Hostname=Proxy-1
DBName=/var/lib/zabbix/zabbix_proxy

The proxy “Proxy-1” has also been added in Zabbix server using the frontend.

I’m using Zabbix server and proxy version 6.4.0beta5 here. Agents are normally compatible with newer servers and proxies, so I happened to use an existing agent that was version 4.0.44.

With this setup successfully running, I started packet capture on the Zabbix server, capturing only packets for the proxy communication:

sudo tcpdump host 2001:db8:9876::fafa -v -w proxybuffer.pcap

After having it running for a couple of minutes, I introduced a “network outage” by dropping the packets from the proxy in the server:

sudo ip6tables -A INPUT -s 2001:db8:9876::fafa -j DROP

I kept that drop rule in use for a few minutes and then deleted it with a suitable ip6tables command (sudo ip6tables -D INPUT 1 in this case), and stopped the capture some time after that.

Analyzing the captured Zabbix traffic with Wireshark

I downloaded the capture file (proxybuffer.pcap) to my workstation where I already had Wireshark installed. I also had the Zabbix dissector for Wireshark installed. Without this specific dissector the Zabbix packet contents are just unreadable binary data because the proxy communication is compressed since Zabbix version 4.0.

You can download the same capture file here if you want to follow along:

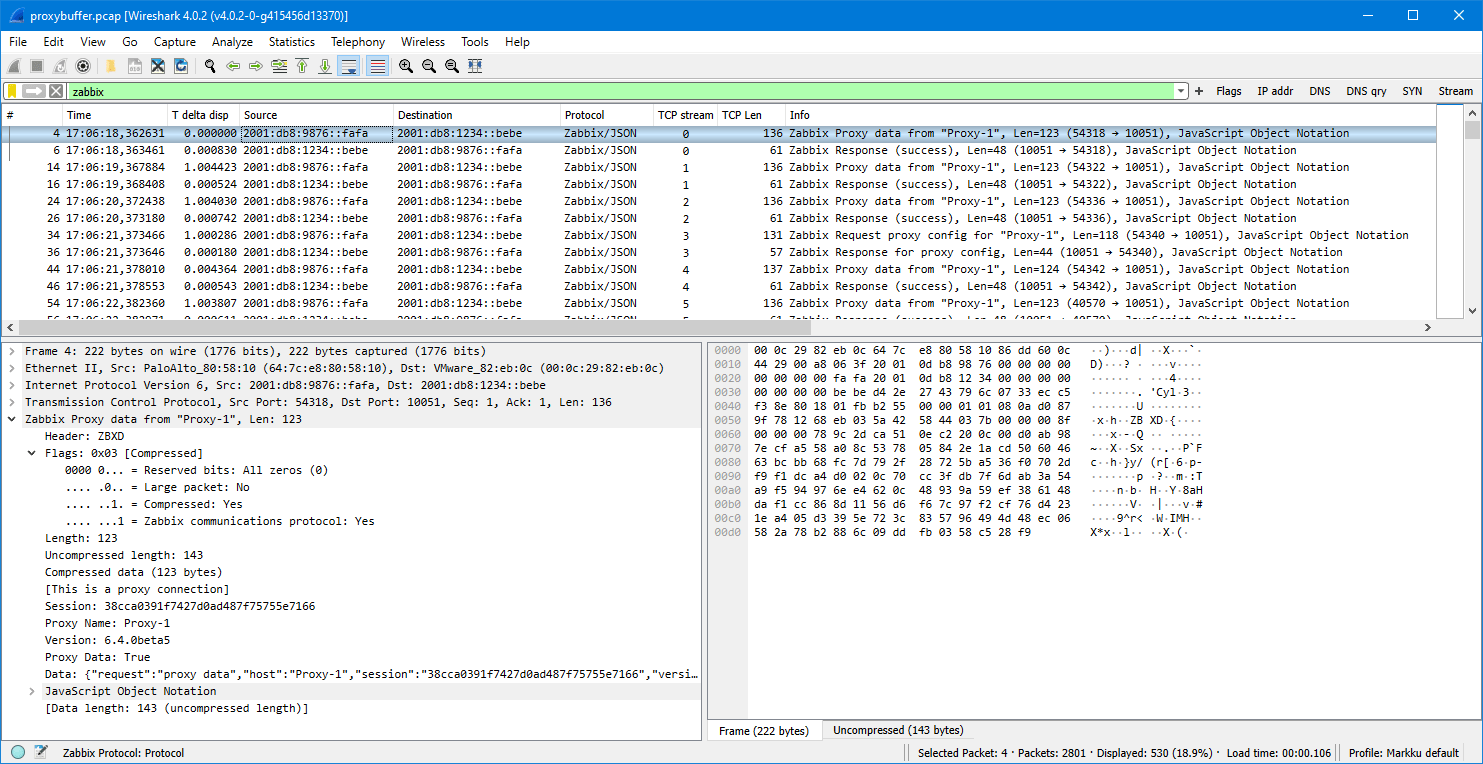
After opening the capture file in Wireshark I first entered zabbix in the display filter, expanded the Zabbix fields in the protocol tree a bit, and this is what I got:

(Your Wireshark view will probably look different. If you are interested in changing it, see my post about customizing Wireshark settings.)

Since this is an active proxy communicating with the server, there is always first a packet from the proxy (config request or data to be sent) and then the response from the server.

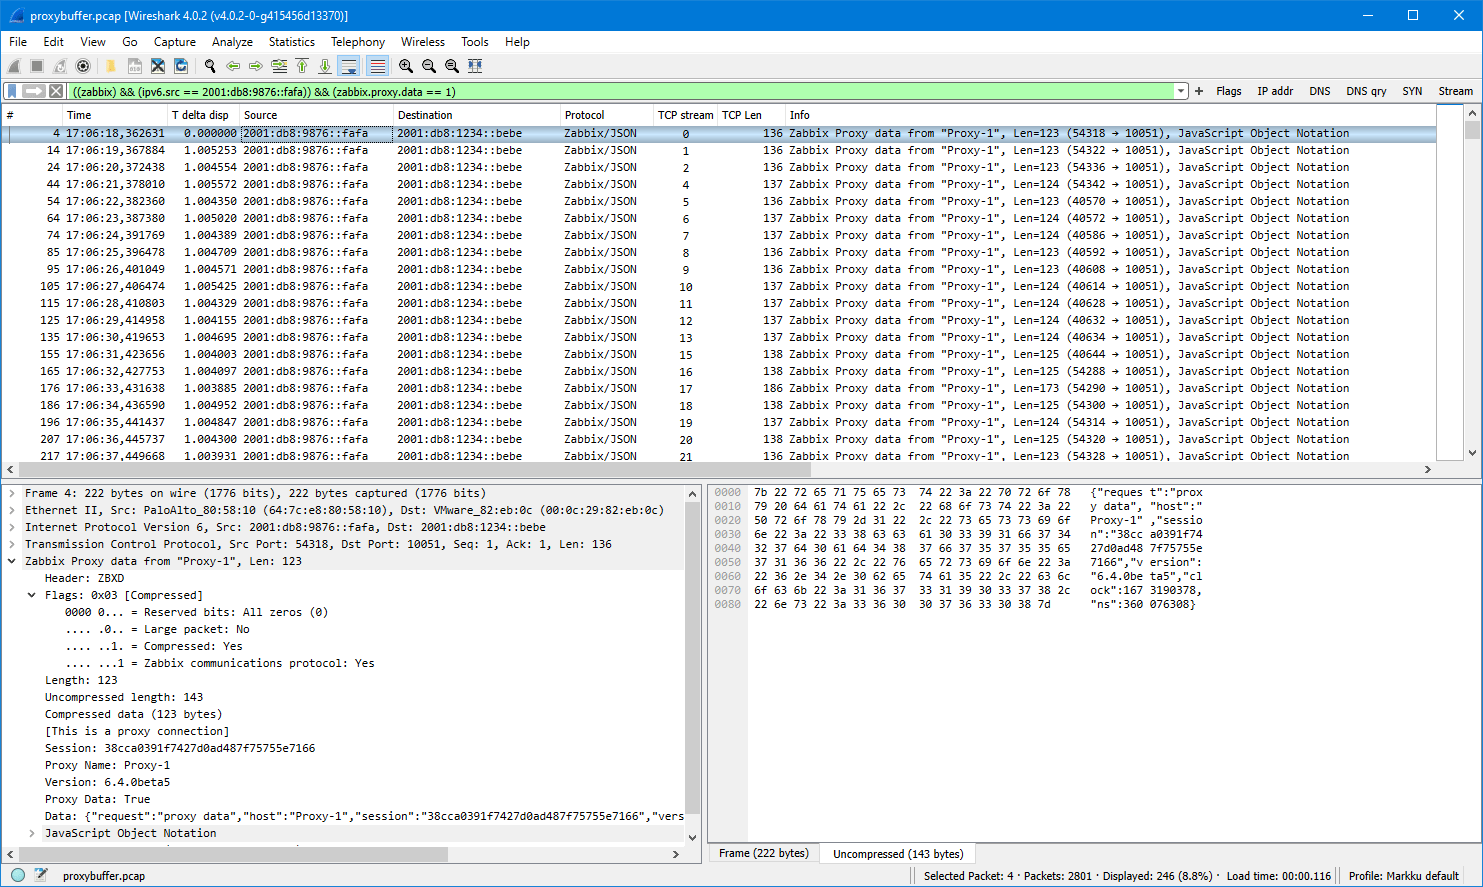
Let’s look at the packets from the proxy only. We get that by adding the proxy source IP address in the filter (by typing it to the field as an ipv6.src filter, or by dragging the IP address from the Source column to the display filter like I did):

Basically there are two types of packets shown:

  • Proxy data
  • Request proxy config

The configuration requests are easier to explain: in Zabbix proxy 6.4 there is a configuration parameter ProxyConfigFrequency (in earlier Zabbix versions the same was called ConfigFrequency):

How often proxy retrieves configuration data from Zabbix server in seconds. Active proxy parameter. Ignored for passive proxies (see ProxyMode parameter). https://www.zabbix.com/documentation/devel/en/manual/appendix/config/zabbix_proxy

It defaults to 10 seconds. What basically happens in each config request is that the proxy says “my current configuration revision is 1234”, and then the server responds to that.

Note: The configuration request concept has been changed in Zabbix 6.4 to use incremental configurations when possible, so the proxy is allowed to get the updated configuration much faster compared to earlier default of 3600 seconds or one hour in Zabbix 6.2 and earlier. See What’s new in Zabbix 6.4.0 for more information.

The other packet type shown above is the proxy data packet. It is actually also used for other than data. In proxy configuration there is a parameter DataSenderFrequency:

Proxy will send collected data to the server every N seconds. Note that active proxy will still poll Zabbix server every second for remote command tasks. Active proxy parameter. Ignored for passive proxies (see ProxyMode parameter). https://www.zabbix.com/documentation/devel/en/manual/appendix/config/zabbix_proxy

The default value for it is one second. But as mentioned in the quote above, even if you increase the configuration value (= actually decrease the frequency… but it is what it is), the proxy will connect to the server every second anyway.

Note: There is a feature request ZBXNEXT-4998 about making the task update interval configurable. Vote and watch that issue if you are interested in that for example for battery-powered Zabbix use cases.

The first packet shown above is (JSON reformatted for better readability):

{
    "request": "proxy data",
    "host": "Proxy-1",
    "session": "38cca0391f7427d0ad487f75755e7166",
    "version": "6.4.0beta5",
    "clock": 1673190378,
    "ns": 360076308
}

There is no “data” in the packet, that’s just the proxy basically saying “hey I’m still here!” to the server so that the server has an opportunity to talk back to the proxy if it has something to say, like a remote command to run on the proxy or on any hosts monitored by the proxy.

As mentioned earlier, the test setup consisted of only one collected item, and that is being collected every 20 seconds, so it is natural that not all data packets contain monitoring data.

I’m further filtering the packets to show only the proxy data packets by adding zabbix.proxy.data in the display filter (by dragging the “Proxy Data: True” field to the filter):

(Yes yes, the topic of this post is data buffering in Zabbix proxy, and we are getting there soon)

Now, there is about 20 seconds worth of packets shown, so we should have one actual data packet there, and there it is, the packet number 176: it is about 50 bytes larger than other packets so there must be something. Here is the Data field contents of that packet:

{
    "request": "proxy data",
    "host": "Proxy-1",
    "session": "38cca0391f7427d0ad487f75755e7166",
    "history data": [
        {
            "id": 31,
            "itemid": 44592,
            "clock": 1673190392,
            "ns": 299338333,
            "value": "1686"
        }
    ],
    "version": "6.4.0beta5",
    "clock": 1673190393,
    "ns": 429562969
}

In addition to the earlier fields there is now a list called history data containing one object. That object has fields like itemid and value. The itemid field has the actual item ID for the monitored item, it can be seen in the URL address in the browser when editing the item in Zabbix frontend. The value 1686 is the actual value of the monitored item (the system uptime in seconds, the host was rebooted about 28 minutes ago).

Let’s develop the display filter even more. Now that we are quite confident that packets that have TCP length of about 136-138 bytes are just the empty data packets without item data, we can get the interesting data packets by adding tcp.len > 140 in the display filter:

When looking at the packet timestamps there is the 20-second interval observed until about 17:08:30. Then there is about 3.5 minutes gap, next send at 17:11:53, and then the data was flowing again with the 20-second interval. The 3.5 minutes gap corresponds to the network outage that was manually caused in the test. The data packet immediately after the outage is larger than others, so let’s see that:

{
    "request": "proxy data",
    "host": "Proxy-1",
    "session": "38cca0391f7427d0ad487f75755e7166",
    "history data": [
        {
            "id": 37,
            "itemid": 44592,
            "clock": 1673190512,
            "ns": 316923947,
            "value": "1806"
        },
        {
            "id": 38,
            "itemid": 44592,
            "clock": 1673190532,
            "ns": 319597379,
            "value": "1826"
        },
--- JSON truncated ---
        {
            "id": 45,
            "itemid": 44592,
            "clock": 1673190672,
            "ns": 345132325,
            "value": "1966"
        },
        {
            "id": 46,
            "itemid": 44592,
            "clock": 1673190692,
            "ns": 348345312,
            "value": "1986"
        }
    ],
    "auto registration": [
        {
            "clock": 1673190592,
            "host": "Testhost",
            "ip": "10.0.41.66",
            "port": "10050",
            "tls_accepted": 1
        }
    ],
    "version": "6.4.0beta5",
    "clock": 1673190708,
    "ns": 108126335
}

What we see here is that there are several history data objects in the same data packet from the proxy. The itemid field is still the same as earlier (44592), and the value field is increasing in 20-second steps. Also the timestamps (clock and nanoseconds) are increasing correspondingly, so we see when the values were actually collected, even though they were sent to the server only a few minutes later, having been buffered by the proxy.

That is also confirmed by looking at the Latest data graph in Zabbix frontend for that item during the time of the test:

There is a nice increasing graph with no gaps or jagged edges.

By the way, this is how the outage looked like in the Zabbix proxy log (/var/log/zabbix/zabbix_proxy.log on the proxy):

   738:20230108:170835.557 Unable to connect to [zabbixtest.lein.io]:10051 [cannot connect to [[zabbixtest.lein.io]:10051]: [4] Interrupted system call]
   738:20230108:170835.558 Will try to reconnect every 120 second(s)
   748:20230108:170835.970 Unable to connect to [zabbixtest.lein.io]:10051 [cannot connect to [[zabbixtest.lein.io]:10051]: [4] Interrupted system call]
   748:20230108:170835.970 Will try to reconnect every 1 second(s)
   748:20230108:170939.993 Still unable to connect...
   748:20230108:171040.015 Still unable to connect...
   738:20230108:171043.561 Still unable to connect...
   748:20230108:171140.068 Still unable to connect...
   748:20230108:171147.105 Connection restored.
   738:20230108:171243.563 Connection restored.

The log looks confusing at first because it shows the messages twice. Also, the second “Connection restored” message arrived almost one minute after the data sending was already restored, as proved in the packet list earlier. The explanation is (as far as I understand it) that the configuration syncer and data sender are separate processes in the proxy, as described in https://www.zabbix.com/documentation/devel/en/manual/concepts/proxy#proxy-process-types. When looking at the packets we see that at 17:12:43 (when the second “Connection restored” message arrived) the proxy sent a proxy config request to the server, so apparently the data sender tries to reconnect every second (to facilitate fast recovery for monitoring data), while the config syncer only tries every two minutes (based on the “Will try to reconnect every 120 second(s)” message, and that corresponds to the outage start time 17:08:35 plus 2 x 2 minutes, plus some extra seconds, presumably because of TCP timeouts).

There were no messages on the Zabbix server log (/var/log/zabbix/zabbix_server.log) for this outage as the outage did not happen in the middle of the TCP session and the proxy was in active mode (= connections are always initiated by the proxy, not by the server), so there was nothing special to log in the Zabbix server process log.

Configurations for the proxy data buffering

In the configuration file for Zabbix proxy 6.4 there are two configuration parameters that control the buffering: ProxyLocalBuffer

Proxy will keep data locally for N hours, even if the data have already been synced with the server. This parameter may be used if local data will be used by third-party applications. (Default = 0) https://www.zabbix.com/documentation/devel/en/manual/appendix/config/zabbix_proxy

ProxyOfflineBuffer

Proxy will keep data for N hours in case of no connectivity with Zabbix server. Older data will be lost. (Default = 1) https://www.zabbix.com/documentation/devel/en/manual/appendix/config/zabbix_proxy

The ProxyOfflineBuffer parameter is the important one. If you need to tolerate longer outages than one hour between the proxy and the Zabbix server (and you have enough disk storage on the proxy), you can increase the value. There is no separate filename or path to configure because proxy uses the dedicated database (configured when installed the proxy) for storing the buffered data.

The ProxyLocalBuffer parameter is uninteresting for most (and disabled by default) because that’s only useful if you plan to fetch the collected data directly from the proxy database into some other external application, and you need to have some flexibility for scheduling the data retrievals from the database.

This post was originally published on the author’s blog.

Inspiring young people to code with the Astro Pi Challenge and astronaut Matthias Maurer

Post Syndicated from Claire Given original https://www.raspberrypi.org/blog/young-people-code-astro-pi-challenge-matthias-maurer-life-on-iss/

The European Astro Pi Challenge offers young people the opportunity to write computer programs that run on Raspberry Pi computers on board the International Space Station (ISS). There are two free, annual missions to participate in: Mission Zero and Mission Space Lab.

Sending your computer program to space is amazing already, and to inspire even more young people about this opportunity, we’re sharing some of the fascinating stories European Space Agency astronaut Matthias Maurer told last round’s Mission Space Lab team winners about his experiences on the ISS.

Matthias on the ISS, catching Astro Pis in microgravity.
ESA astronaut Matthias Maurer with the Astro Pi computer on board the ISS. Photo credit: ESA/NASA

Last round’s winning Mission Space Lab teams were invited to a very special online session with Matthias, and he shared lots of thoughtful and surprising insights from his mission on the International Space Station. Here are three of the questions from the teams and what Matthias had to say:

1. Working together

Lots of the teams wanted to know about the practicalities of life on the ISS. Team Ad Astra from the UK asked “How did you and your crewmates ensure that you got on well together?” Matthias talked about how supporting each member of the team helps everyone work well together:

2. Talking to family

It was surprising to hear that the astronauts on the ISS have lots of opportunities to communicate with people on Earth. Matthias explained how the astronauts can keep in regular contact with their family while answering the question from Team Atlantes from Spain: 

3. Cutting-edge technology

Team NanoKids asked Matthias about the technologies astronauts use on the ISS, and Matthias shared some fascinating glimpses into what tools help the astronauts in their surroundings:

Thank you to all the teams for these great questions. And thank you to Matthias for offering young people a peek into what life is like in space!

You can still get involved in this round of Astro Pi Mission Zero

We hope Matthias’ stories inspire lots of young people to take part in the European Astro Pi Challenge. Registration for this round of Mission Space Lab is closed, so why not sign up for news about the next round?

But it’s not too late for young people to get involved today and become part of space history. Astro Pi Mission Zero is still open for participation a little while longer — until 17 March.

Mission Zero is a beginner’s coding activity, so it’s really easy to get involved: young people just need a grown-up to register for them, and a computer with a web browser to participate. In Mission Zero, young people up to age 19 in eligible countries have the chance to send their own simple computer program into space to display a colourful image for the astronauts to see on the ISS.

The one-hour Mission Zero activity comes with step-by-step instructions for young people to follow. No special equipment or coding skills are needed, and all eligible young people who follow the guidelines will have their program run in space. Every Mission Zero participants receives a certificate to show the exact time and the location of the ISS during their programs run, so they’ll have something to remember their stellar achievement.


The European Astro Pi Challenge is an ESA Education project run in collaboration with us here at the Raspberry Pi Foundation.

The post Inspiring young people to code with the Astro Pi Challenge and astronaut Matthias Maurer appeared first on Raspberry Pi.

Турция – външна политика по скалата на Рихтер

Post Syndicated from Александър Нуцов original https://www.toest.bg/turtsiya-vynshna-politika-po-skalata-na-rihter/

Турция – външна политика по скалата на Рихтер

Географското положение на Турция предопределя извънредната ѝ геополитическата тежест като естествен възел между няколко важни региона – Европа, Кавказ, Средиземноморието, Близкия изток и Северна Африка. Освен че е трудно да я обособим като част от конкретна географска област, политическата и културната ѝ принадлежност е също толкова комплексна.

Макар и предимно мюсюлманска, Турция има светско управление, от векове поддържа търговски и културни взаимоотношения с Европа, членува в западни организации като НАТО и ОССЕ, а през 1999 г. придобива статут на кандидат за присъединяване към Европейския съюз. Още Бащата на републиката Мустафа Кемал Ататюрк недвусмислено възприема западната цивилизация като отправна точка за страната си.

Турция обаче не може да се откъсне от османското си наследство със заплетено историческо минало и разнообразие от култури, обичаи и традиции. Освен това тя наследява неблагоприятна за сигурността си обстановка след разпада на Османската империя заради множеството нови държави по нейните граници.

Макар и сравнително добре защитена географски от труднопроходимите планински масиви на изток, външната политика на империята (и впоследствие на Турция) винаги е страдала от уязвимостта на проливите, свързващи Мраморно с Черно, Егейско и Средиземно море. Контролът върху Босфора и Дарданелите е безценен от икономическа и стратегическа гледна точка, което превръща първо Руската империя, а по-късно и СССР в основна заплаха за сигурността и националните интереси.

Според научните трудове на проф. Мустафа Айдън тези исторически обстоятелства създават възприятието, че страната е обградена от потенциални врагове, което фиксира вниманието на турската външна политика и дипломация върху предпазливостта и сигурността. Поради сложността си отношенията на Турция с ЕС, Русия, Армения, Азербайджан, Израел, Сирия, кюрдите и т.н. заслужават отделен и детайлен анализ. От казаното дотук обаче следва, че югоизточната ни съседка страда от липсата на единна идентичност – геополитическа, културна и идеологическа. Именно това разнообразие от идентичности създава параван за политическите борби в страната, които определят външнополитическата ѝ ориентация.

Основни принципи на турската външна политика

Държавите водят външната си политика по две основни направления. Към първото може да причислим спонтанните събития и промени в средата, на които страната по презумпция трябва да реагира. По отношение на Турция може да се дадат за пример Арабската пролет, войната в Сирия, миграционният натиск и др.

Второто направление се отнася до устойчивите във времето ръководни принципи, норми и обстоятелства, възприемани безусловно и последователно от всяко следващо поколение политици. Такива са вече споменатото географско положение, културно и историческо наследство и установените възприятия за международната система. В случая с Турция трябва да разгледаме и основополагащите принципи, изковани от Ататюрк при утвърждаването на националната държава.

Те са синтезирани в шест понятия, включени в тогавашната Конституция с поправки от 1937 г. – национализъм, секуларизъм, републиканизъм, популизъм, статизъм и революционизъм. Шестте идеологически основи на републиката обаче имат специфично значение, свързано с идеята за модерна национална държава по западен образец.

Опирайки се на Мустафа Айдън, може да направим следното обобщение. Секуларизмът цели да предотврати опитите за прекъсване на дълбоките институционални и културни реформи и установяването на дадена форма на теокрация по османски маниер. Републиканизмът отстоява демократичната република като форма на управление и гарантира равенството на всички граждани пред закона. Революционизмът е синоним на реформизъм и се свързва с идеята за мащабното преустройство на държавата с цел осигуряване на модерното ѝ еволюционно развитие.

Популизмът (за разлика от днешното разбиране) включва идеята за равенство и нуждата от популяризиране на новите идеи сред различните обществени кръгове. Национализмът защитава идеята за суверенитет на турския народ в националните граници, но се опира не на агресия, а на останалия в историята лозунг на Ататюрк „Мир у дома, мир по света“, превърнал се в основа на турската външна политика. Така принципите се подчиняват на идеята за мирни, реалистични и умерени отношения в международен план, които не възпрепятстват, а спомагат за укрепването и развитието на турската нация.

Макар и отчасти видоизменени в приетите след военни преврати Конституции от 1961-ва и 1982 г., идеологическите основи на Ататюрк остават определящи за Турция, а всеки опит за откъсване от техните корени създава вътрешнополитически катаклизми. Така се стигна и до неуспешния пуч през 2016 г. и последвалите година по-късно поправки в Конституцията, които превърнаха Турция от парламентарна в президентска република.

Модерността: Ердоган и Партията на справедливостта и развитието

От спечелването на изборите през 2002 г. външната политика на Партията на справедливостта и развитието и нейният лидер Реджеп Ердоган изживяват много трансформации. С първоначалния устрем към реформи, започнал още през 1999 г., партията цели присъединяване към ЕС. Постепенно обаче външната политика се видоизменя в разрез с кемалистките принципи под въздействието на бившия външен министър и премиер Ахмет Давутоглу.

Уповавайки се на своята книга „Стратегическа дълбочина“, той развива идеята за неоосманизъм в политиката, който изгражда национална идентичност върху сунитския ислям, османската култура и имперското минало. Това предопределя по-активна и агресивна външна политика, стремяща се да възроди историческото влияние в Близкия изток и Северна Африка.

Събития като Арабската пролет допринасят за изоставянето на политиката на „нулеви проблеми“ със съседите, а в резултат на провалилия се военен преврат през 2016 г. драстично се ограничава влиянието на бюрократичния апарат и армията, чиято историческа роля да защитава кемализма е иззета. Това павира пътя за последвалите конституционни промени в модела на управление, които засилват правомощията на президента и създават широка институционална основа за популизъм и евроскептицизъм.

Отстраняването на Давутоглу от властта месец преди преврата дава нов тласък на турската външна политика, която впоследствие става по-малко идеологическа, но по-реалистична заради извънредните правомощия и влияние на Ердоган. Това води до сближаването между Турция и Русия през последните години в сферите на енергетиката, отбраната и туризма, от което те взаимно черпят икономически и стратегически дивиденти.

През 2017 г. например Турция купи от Русия несъвместимите с натовското въоръжение зенитни ракетни комплекси S-400. Двете страни също задълбочиха енергийното си сътрудничество с различни проекти, като заобикалящия Украйна газопровод „Турски поток“, и улесниха движението на гражданите си с въвеждането на по-леки визови режими.

Какво може да се очаква при провал на Ердоган на изборите

Още несъвзела се от опустошителните земетресения, отнели живота десетки хиляди души, Турция ще се изправи пред общи президентски и парламентарни избори. И макар че трагичните събития правят изхода им още по-непредвидим, евентуална промяна в управлението неизменно ще се отрази на турската външна политика – особено при сценария, в който Ердоган губи и президентския си пост, и мнозинството в парламента.

Поради сложната композиция на опозиционния алианс от шест партии, чиито идеологически платформи обхващат разнородни части от политическия спектър, трудно може да се очертае еднозначен бъдещ подход. И все пак от заявките дотук може да се направят следните изводи. Коалицията неведнъж декларира целта си да извърши дълбоки съдебни и структурни реформи по европейски стандарт и да промени Конституцията, връщайки парламентарния режим на управление.

Това предполага по-добро правосъдие, по-свободни медии и реабилитиране на проевропейското съсловие от интелектуалци, журналисти, преподаватели, военни и други противници на режима на Ердоган. Следователно и реалистичната, но безпринципна политика на Ердоган спрямо страни като Русия ще бъде преразгледана.

На институционално ниво е твърде вероятно да станем свидетели на децентрализация и по-ясно разделение на властите, което да позволи на турското Външно министерство, административния апарат и армията да възвърнат функциите и влиянието си като защитници на кемализма. Това би довело до затопляне на отношенията между Турция и ЕС на стратегическо, икономическо и дипломатическо ниво, а в по-дългосрочен план може да се говори и за размразяване на преговорите за членство, спрени през 2018 г. заради зависимата съдебна система и неспособността на Турция да гарантира основни човешки права и свободи.

В този ред на мисли деескалация по оста Турция–Гърция–Кипър в Източното Средиземноморие, преосмисляне на позицията относно приемането на Швеция и Финландия в НАТО и ревизиране на медиаторската роля по отношение на руската инвазия в Украйна са сред възможните сценарии за промяна на външнополитическия курс.

Отношението към България при смяна на властта трябва да се разглежда именно в контекста на отношенията между Турция и ЕС. Освен по-засилена комуникация и цялостно сътрудничество, на преден план ще излязат и ключови въпроси, като противодействието срещу мигрантския натиск и енергийното сътрудничество.

По отношение на нелегалния мигрантски натиск Европейската комисия вече изрази готовност да подпомогне България с обучен персонал, както и с дронове и радари за по-доброто опазване на границата. Въпросът за енергийното сътрудничество съвпада с общоевропейските усилия за диверсификация на доставките на газ и петрол от Русия.

Подписаното наскоро споразумение между държавния доставчик „Булгаргаз“ и турския газов оператор „Боташ“ за достъп на България до турската газопреносна мрежа и терминали за втечнен природен газ създава юридическа основа за по-засилено сътрудничество в тази област. Едно проевропейско управление в Турция обаче би разсеяло съмненията за потенциално руско влияние, превръщайки се в гарант на независимостта на доставките и техния произход. Не е изключена и цялостна или частична ревизия на стратегията на Ердоган за превръщане на Турция в най-важния газов хъб в региона.

Разбира се, не трябва да се забравя, че изходът от изборите в Турция ще се повлияе от редица фактори, включително способността на шесторната коалиция да подкрепи и издигне най-подходящия общ кандидат за президентския пост. Неясно е и доколко разрухата в югоизточната ни съседка, дължаща се в голяма степен на корупция и институционална немарливост, ще повлияе на изборните нагласи. Възможността за отлагане на насрочените за 14 май избори заради трагедията също е сред обсъжданите теми, които могат да окажат влияние.

Бъдещите отношения между България и Турция обаче ще зависят и от изхода от поредните предсрочни избори у нас. Служебните правителства на Румен Радев имат потенциала да продължат чисто техническото и експертно сътрудничество в различни сфери. Но единствено постоянен кабинет с реформистки нагласи и прозападни разбирания ще бъде способен да осъществи по-дълбоко двустранно разбирателство, основано на общоевропейските ценности и принципите за независима съдебна система и борба с корупцията, които едно ново управление в Турция на свой ред би възприело.

An RFC for governance of the Rust project

Post Syndicated from original https://lwn.net/Articles/924132/

The Rust community has been working to reform its governance model; that
work is now being presented as a
draft document
describing how that model will work.

This RFC establishes a Leadership Council as the successor of the
core team and the new governance structure through which Rust
Project members collectively confer the authority to ensure
successful operation of the Project. The Leadership Council
delegates much of this authority to teams (which includes subteams,
working groups, etc.) who autonomously make decisions concerning
their purviews. However, the Council retains some decision-making
authority, outlined and delimited by this RFC.

[$] Python packaging targets

Post Syndicated from original https://lwn.net/Articles/923238/

As we have seen in earlier articles, the packaging landscape for Python is
fragmented and complex, though users of the language have been clamoring
for some kind of
unification for a decade or more at this point. The developers behind
pip and other packaging tools would like to find a way to satisfy
this wish from
Python-language users and developers, thus they have been discussing possible
solutions with increasing urgency, it seems, of late. In order to do that,
though, it is important to understand what specific items—and types of Python
users—to target.

How Ruparupa gained updated insights with an Amazon S3 data lake, AWS Glue, Apache Hudi, and Amazon QuickSight

Post Syndicated from Adrianus Kurnadi original https://aws.amazon.com/blogs/big-data/how-ruparupa-gained-updated-insights-with-an-amazon-s3-data-lake-aws-glue-apache-hudi-and-amazon-quicksight/

This post is co-written with Olivia Michele and Dariswan Janweri P. at Ruparupa.

Ruparupa was built by PT. Omni Digitama Internusa with the vision to cultivate synergy and create a seamless digital ecosystem within Kawan Lama Group that touches and enhances the lives of many.

Ruparupa is the first digital platform built by Kawan Lama Group to give the best shopping experience for household, furniture, and lifestyle needs. Ruparupa’s goal is to help you live a better life, shown by the meaning of the word ruparupa, which means “everything.” We believe that everyone deserves the best, and home is where everything starts.

In this post, we show how Ruparupa implemented an incrementally updated data lake to get insights into their business using Amazon Simple Storage Service (Amazon S3), AWS Glue, Apache Hudi, and Amazon QuickSight. We also discuss the benefits Ruparupa gained after the implementation.

The data lake implemented by Ruparupa uses Amazon S3 as the storage platform, AWS Database Migration Service (AWS DMS) as the ingestion tool, AWS Glue as the ETL (extract, transform, and load) tool, and QuickSight for analytic dashboards.

Amazon S3 is an object storage service with very high scalability, durability, and security, which makes it an ideal storage layer for a data lake. AWS DMS is a database migration tool that supports many relational database management services, and also supports Amazon S3.

An AWS Glue ETL job, using the Apache Hudi connector, updates the S3 data lake hourly with incremental data. The AWS Glue job can transform the raw data in Amazon S3 to Parquet format, which is optimized for analytic queries. The AWS Glue Data Catalog stores the metadata, and Amazon Athena (a serverless query engine) is used to query data in Amazon S3.

AWS Secrets Manager is an AWS service that can be used to store sensitive data, enabling users to keep data such as database credentials out of source code. In this implementation, Secrets Manager is used to store the configuration of the Apache Hudi job for various tables.

Data analytic challenges

As an ecommerce company, Ruparupa produces a lot of data from their ecommerce website, their inventory systems, and distribution and finance applications. The data can be structured data from existing systems, and can also be unstructured or semi-structured data from their customer interactions. This data contains insights that, if unlocked, can help management make decisions to help increase sales and optimize cost.

Before implementing a data lake on AWS, Ruparupa had no infrastructure capable of processing the volume and variety of data formats in a short time. Data had to be manually processed by data analysts, and data mining took a long time. Because of the fast growth of data, it took 1–1.5 hours just to ingest data, which was hundreds of thousands of rows.

The manual process caused inconsistent data cleansing. After the data had been cleansed, some processes were often missing, and all the data had to go through another process of data cleansing.

This long processing time reduced the analytic team’s productivity. The analytic team could only produce weekly and monthly reports. This delay in report frequency impacted delivering important insights to management, and they couldn’t move fast enough to anticipate changes in their business.

The method used to create analytic dashboards was manual and could only produce a few routine reports. The audience of these few reports was limited—a maximum of 20 people from management. Other business units in Kawan Lama Group only consumed weekly reports that were prepared manually. Even the weekly reports couldn’t cover all important metrics, because some metrics were only available in monthly reports.

Initial solution for a real-time dashboard

The following diagram illustrates the initial solution Ruparupa implemented.

Initial solution architecture

Ruparupa started a data initiative within the organization to create a single source of truth within the company. Previously, business users could only get the sales data from the day before, and they didn’t have any visibility to current sales activities in their stores and websites.

To gain trust from business users, we wanted to provide the most updated data in an interactive QuickSight dashboard. We used an AWS DMS replication task to stream real-time change data capture (CDC) updates to an Amazon Aurora MySQL-Compatible Edition database, and built a QuickSight dashboard to replace the static presentation deck.

This pilot dashboard was accepted extremely well by the users, who now had visibility to their current data. However, the data source for the dashboard still resided in an Aurora MySQL database and only covered a single data domain.

The initial design had some additional challenges:

  • Diverse data source – The data source in an ecommerce platform consists of structured, semi-structured, and unstructured data, which requires flexible data storage. The initial data warehouse design in Ruparupa only stored transactional data, and data from other systems including user interaction data wasn’t consolidated yet.
  • Cost and scalability – Ruparupa wanted to build a future-proof data platform solution that could scale up to terabytes of data in the most cost-effective way.

The initial design also had some benefits:

  • Data updates – Data inside the initial data warehouse was delayed by 1 day. This was an improvement over the weekly report, but still not fast enough to make quicker decisions.

This solution only served as a temporary solution; we needed a more complete analytics solution that could serve more complex and larger data sources, faster, and cost-effectively.

Real-time data lake solution

To fulfill their requirements, Ruparupa introduced a mutable data lake, as shown in the following diagram.

Real time data lake solutions architecture

Let’s look at each main component in more detail.

AWS DMS CDC process

To get the real-time data from the source, we streamed the database CDC log using AWS DMS (component 1 in the architecture diagram). The CDC records consist of all inserts, updates, and deletes from the source database. This raw data is stored in the raw layer of the S3 data lake.

An S3 lifecycle policy is used to manage data retention, where the older data is moved to Amazon S3 Glacier.

AWS Glue ETL job

The second S3 data lake layer is the transformed layer, where the data is transformed to an optimized format that is ready for user query. The files are transformed to Parquet columnar format with snappy compression and table partitioning to optimize SQL queries from Athena.

In order to create a mutable data lake that can merge changes from the data source, we introduced an Apache Hudi data lake framework. With Apache Hudi, we can perform upserts and deletes on the transformed layer to keep the data consistent in a reliable manner. With a Hudi data lake, Ruparupa can create a single source of truth for all our data sources quickly and easily. The Hudi framework takes care of the underlying metadata of the updates, making it simple to implement across hundreds of tables in the data lake. We only need to configure the writer output to create a copy-on-write table depending on the access requirements. For the writer, we use an AWS Glue job writer combined with an AWS Glue Hudi connector frrom AWS Marketplace. The additional library from the connector helps AWS Glue understand how to write to Hudi.

An AWS Glue ETL job is used to get the changes from the raw layer and merge the changes in the transformed layer (component 2 in the architecture diagram). With AWS Glue, we are able to create a PySpark job to get the data, and we use the AWS Glue Connector for Apache Hudi to simplify the Hudi library import to the AWS Glue job. With AWS Glue, all the changes from AWS DMS can be merged easily to the Hudi data lake. The jobs are scheduled every hour using a built-in scheduler in AWS Glue.

Secrets Manager is used to store all the related parameters that are required to run the job. Instead of making one transformation job for each table, Ruparupa creates a single generic job that can transform multiple tables by using several parameters. The parameters that give details about the table structure are stored in Secrets Manager and can be retrieved using the name of the table as key. With these custom parameters, Ruparupa doesn’t need to create a job for every table—we can utilize a single job that can ingest the data for all different tables by passing the name of the table to the job.

All the metadata of the tables is stored in the AWS Glue Data Catalog, including the Hudi tables. This catalog is used by the AWS Glue ETL job, Athena query engine, and QuickSight dashboard.

Athena queries

Users can then query the latest data for their report using Athena (component 3 in the architecture diagram). Athena is serverless, so there is no infrastructure to provision or maintain. We can immediately use SQL to query the data lake to create a report or ingest the data to the dashboard.

QuickSight dashboard

Business users can use a QuickSight dashboard to query the data lake (component 4 in the architecture diagram). The existing dashboard is modified to get data from Athena, replacing the previous database. New dashboards were also created to fulfill continuously evolving needs for insights from multiple business units.

QuickSight is also used to notify certain parties when a value is reaching a certain threshold. An email alert is sent to an external notification and messaging platform so it can reach the end-user.

Business results

The data lake implementation in Ruparupa took around 3 months, with an additional month for data validation, before it was considered ready for production. With this solution, management can get the latest information view of their current state up to the last 1 hour. Previously, they could only generate weekly reports—now insights are available 168 times faster.

The QuickSight dashboard, which can be updated automatically, shortens the time required by the analytic team. The QuickSight dashboard now has more content—not only is transactional data reported, but also other metrics like new SKU, operation escalation for free services to customers, and monitoring SLA. Since April 2021 when Ruparupa started their QuickSight pilot, the number of dashboards has increased to around 70 based on requests from business users.

Ruparupa has hired new personnel to join the data analytic team to explore new possibilities and new use cases. The analytic team has grown from just one person to seven to handle new analytic use cases:

  • Merchandising
  • Operations
  • Store manager performance measurement
  • Insights of trending SKUs

Kawan Lama Group also has offline stores besides the ecommerce platform managed by Ruparupa. With the new dashboard, it’s easier to compare transaction data from online and offline stores because they now use the same platform.

The new dashboards also can be consumed by a broader audience, including other business units in Kawan Lama Group. The total users consuming the dashboard increased from just 20 users from management to around 180 users (9 times increase).

Since the implementation, other business units in Kawan Lama Group have increased their trust in the S3 data lake platform implemented by Ruparupa, because the data is more up to date and they can drill down to the SKU level to validate that the data is correct. Other business units can now act faster after an event like a marketing campaign. This data lake implementation has helped increase sales revenue in various business units in Kawan Lama Group.

Conclusion

Implementing a real-time data lake using Amazon S3, Apache Hudi, AWS Glue, Athena, and QuickSight gave Ruparupa the following benefits:

  • Yielded faster insights (hourly compared to weekly)
  • Unlocked new insights
  • Enabled more people in more business units to consume the dashboard
  • Helped business units in Kawan Lama Group act faster and increase sales revenue

If you’re interested in gaining similar benefits, check out Build a Data Lake Foundation with AWS Glue and Amazon S3.

You can also learn how to get started with QuickSight in the Getting Started guide.

Last but not least, you can learn about running Apache Hudi on AWS Glue in Writing to Apache Hudi tables using AWS Glue Custom Connector.


About the Authors

Olivia Michele is a Data Scientist Lead at Ruparupa, where she has worked in a variety of data roles over the past 5 years, including building and integrating Ruparupa data systems with AWS to improve user experience with data and reporting tools. She is passionate about turning raw information into valuable actionable insights and delivering value to the company.

Dariswan Janweri P. is a Data Engineer at Ruparupa. He considers challenges or problems as interesting riddles and finds satisfaction in solving them, and even more satisfaction by being able to help his colleagues and friends, “two birds one stone.” He is excited to be a major player in Indonesia’s technology transformation.

Adrianus Budiardjo Kurnadi is a Senior Solutions Architect at Amazon Web Services Indonesia. He has a strong passion for databases and machine learning, and works closely with the Indonesian machine learning community to introduce them to various AWS Machine Learning services. In his spare time, he enjoys singing in a choir, reading, and playing with his two children.

Nico Anandito is an Analytics Specialist Solutions Architect at Amazon Web Services Indonesia. He has years of experience working in data integration, data warehouses, and big data implementation in multiple industries. He is certified in AWS data analytics and holds a master’s degree in the data management field of computer science.

Improve collaboration between teams by using AWS CDK constructs

Post Syndicated from Joerg Woehrle original https://aws.amazon.com/blogs/devops/improve-collaboration-between-teams-by-using-aws-cdk-constructs/

There are different ways to organize teams to deliver great software products. There are companies that give the end-to-end responsibility for a product to a single team, like Amazon’s Two-Pizza teams, and there are companies where multiple teams split the responsibility between infrastructure (or platform) teams and application development teams. This post provides guidance on how collaboration efficiency can be improved in the case of a split-team approach with the help of the AWS Cloud Development Kit (CDK).

The AWS CDK is an open-source software development framework to define your cloud application resources. You do this by using familiar programming languages like TypeScript, Python, Java, C# or Go. It allows you to mix code to define your application’s infrastructure, traditionally expressed through infrastructure as code tools like AWS CloudFormation or HashiCorp Terraform, with code to bundle, compile, and package your application.

This is great for autonomous teams with end-to-end responsibility, as it helps them to keep all code related to that product in a single place and single programming language. There is no need to separate application code into a different repository than infrastructure code with a single team, but what about the split-team model?

Larger enterprises commonly split the responsibility between infrastructure (or platform) teams and application development teams. We’ll see how to use the AWS CDK to ensure team independence and agility even with multiple teams involved. We’ll have a look at the different responsibilities of the participating teams and their produced artifacts, and we’ll also discuss how to make the teams work together in a frictionless way.

This blog post assumes a basic level of knowledge on the AWS CDK and its concepts. Additionally, a very high level understanding of event driven architectures is required.

Team Topologies

Let’s first have a quick look at the different team topologies and each team’s responsibilities.

One-Team Approach

In this blog post we will focus on the split-team approach described below. However, it’s still helpful to understand what we mean by “One-Team” Approach: A single team owns an application from end-to-end. This cross-functional team decides on its own on the features to implement next, which technologies to use and how to build and deploy the resulting infrastructure and application code. The team’s responsibility is infrastructure, application code, its deployment and operations of the developed service.

If you’re interested in how to structure your AWS CDK application in a such an environment have a look at our colleague Alex Pulver’s blog post Recommended AWS CDK project structure for Python applications.

Split-Team Approach

In reality we see many customers who have separate teams for application development and infrastructure development and deployment.

Infrastructure Team

What I call the infrastructure team is also known as the platform or operations team. It configures, deploys, and operates the shared infrastructure which other teams consume to run their applications on. This can be things like an Amazon SQS queue, an Amazon Elastic Container Service (Amazon ECS) cluster as well as the CI/CD pipelines used to bring new versions of the applications into production.
It is the infrastructure team’s responsibility to get the application package developed by the Application Team deployed and running on AWS, as well as provide operational support for the application.

Application Team

Traditionally the application team just provides the application’s package (for example, a JAR file or an npm package) and it’s the infrastructure team’s responsibility to figure out how to deploy, configure, and run it on AWS. However, this traditional setup often leads to bottlenecks, as the infrastructure team will have to support many different applications developed by multiple teams. Additionally, the infrastructure team often has little knowledge of the internals of those applications. This often leads to solutions which are not optimized for the problem at hand: If the infrastructure team only offers a handful of options to run services on, the application team can’t use options optimized for their workload.

This is why we extend the traditional responsibilities of the application team in this blog post. The team provides the application and additionally the description of the infrastructure required to run the application. With “infrastructure required” we mean the AWS services used to run the application. This infrastructure description needs to be written in a format which can be consumed by the infrastructure team.

While we understand that this shift of responsibility adds additional tasks to the application team, we think that in the long term it is worth the effort. This can be the starting point to introduce DevOps concepts into the organization. However, the concepts described in this blog post are still valid even if you decide that you don’t want to add this responsibility to your application teams. The boundary of who is delivering what would then just move more into the direction of the infrastructure team.

To be successful with the given approach, the two teams need to agree on a common format on how to hand over the application, its infrastructure definition, and how to bring it to production. The AWS CDK with its concept of Constructs provides a perfect means for that.

Primer: AWS CDK Constructs

In this section we take a look at the concepts the AWS CDK provides for structuring our code base and how these concepts can be used to fit a CDK project into your team topology.

Constructs

Constructs are the basic building block of an AWS CDK application. An AWS CDK application is composed of multiple constructs which in the end define how and what is deployed by AWS CloudFormation.

The AWS CDK ships with constructs created to deploy AWS services. However, it is important to understand that you are not limited to the out-of-the-box constructs provided by the AWS CDK. The true power of AWS CDK is the possibility to create your own abstractions on top of the default constructs to create solutions for your specific requirement. To achieve this you write, publish, and consume your own, custom constructs. They codify your specific requirements, create an additional level of abstraction and allow other teams to consume and use your construct.

We will use a custom construct to separate the responsibilities between the the application and the infrastructure team. The application team will release a construct which describes the infrastructure along with its configuration required to run the application code. The infrastructure team will consume this construct to deploy and operate the workload on AWS.

How to use the AWS CDK in a Split-Team Setup

Let’s now have a look at how we can use the AWS CDK to split the responsibilities between the application and infrastructure team. I’ll introduce a sample scenario and then illustrate what each team’s responsibility is within this scenario.

Scenario

Our fictitious application development team writes an AWS Lambda function which gets deployed to AWS. Messages in an Amazon SQS queue will invoke the function. Let’s say the function will process orders (whatever this means in detail is irrelevant for the example) and each order is represented by a message in the queue.

The application development team has full flexibility when it comes to creating the AWS Lambda function. They can decide which runtime to use or how much memory to configure. The SQS queue which the function will act upon is created by the infrastructure team. The application team does not have to know how the messages end up in the queue.

With that we can have a look at a sample implementation split between the teams.

Application Team

The application team is responsible for two distinct artifacts: the application code (for example, a Java jar file or an npm module) and the AWS CDK construct used to deploy the required infrastructure on AWS to run the application (an AWS Lambda Function along with its configuration).

The lifecycles of these artifacts differ: the application code changes more frequently than the infrastructure it runs in. That’s why we want to keep the artifacts separate. With that each of the artifacts can be released at its own pace and only if it was changed.

In order to achieve these separate lifecycles, it is important to notice that a release of the application artifact needs to be completely independent from the release of the CDK construct. This fits our approach of separate teams compared to the standard CDK way of building and packaging application code within the CDK construct.

But how will this be done in our example solution? The team will build and publish an application artifact which does not contain anything related to CDK.
When a CDK Stack with this construct is synthesized it will download the pre-built artifact with a given version number from AWS CodeArtifact and use it to create the input zip file for a Lambda function. There is no build of the application package happening during the CDK synth.

With the separation of construct and application code, we need to find a way to tell the CDK construct which specific version of the application code it should fetch from CodeArtifact. We will pass this information to the construct via a property of its constructor.

For dependencies on infrastructure outside of the responsibility of the application team, I follow the pattern of dependency injection. Those dependencies, for example a shared VPC or an Amazon SQS queue, are passed into the construct from the infrastructure team.

Let’s have a look at an example. We pass in the external dependency on an SQS Queue, along with details on the desired appPackageVersion and its CodeArtifact details:

export interface OrderProcessingAppConstructProps {
    queue: aws_sqs.Queue,
    appPackageVersion: string,
    codeArtifactDetails: {
        account: string,
        repository: string,
        domain: string
    }
}

export class OrderProcessingAppConstruct extends Construct {

    constructor(scope: Construct, id: string, props: OrderProcessingAppConstructProps) {
        super(scope, id);

        const lambdaFunction = new lambda.Function(this, 'OrderProcessingLambda', {
            code: lambda.Code.fromDockerBuild(path.join(__dirname, '..', 'bundling'), {
                buildArgs: {
                    'PACKAGE_VERSION' : props.appPackageVersion,
                    'CODE_ARTIFACT_ACCOUNT' : props.codeArtifactDetails.account,
                    'CODE_ARTIFACT_REPOSITORY' : props.codeArtifactDetails.repository,
                    'CODE_ARTIFACT_DOMAIN' : props.codeArtifactDetails.domain
                }
            }),
            runtime: lambda.Runtime.NODEJS_16_X,
            handler: 'node_modules/order-processing-app/dist/index.lambdaHandler'
        });
        const eventSource = new SqsEventSource(props.queue);
        lambdaFunction.addEventSource(eventSource);
    }
}

Note the code lambda.Code.fromDockerBuild(...): We use AWS CDK’s functionality to bundle the code of our Lambda function via a Docker build. The only things which happen inside of the provided Dockerfile are:

  • the login into the AWS CodeArtifact repository which holds the pre-built application code’s package
  • the download and installation of the application code’s artifact from AWS CodeArtifact (in this case via npm)

If you are interested in more details on how you can build, bundle and deploy your AWS CDK assets I highly recommend a blog post by my colleague Cory Hall: Building, bundling, and deploying applications with the AWS CDK. It goes into much more detail than what we are covering here.

Looking at the example Dockerfile we can see the two steps described above:

FROM public.ecr.aws/sam/build-nodejs16.x:latest

ARG PACKAGE_VERSION
ARG CODE_ARTIFACT_AWS_REGION
ARG CODE_ARTIFACT_ACCOUNT
ARG CODE_ARTIFACT_REPOSITORY

RUN aws codeartifact login --tool npm --repository $CODE_ARTIFACT_REPOSITORY --domain $CODE_ARTIFACT_DOMAIN --domain-owner $CODE_ARTIFACT_ACCOUNT --region $CODE_ARTIFACT_AWS_REGION
RUN npm install order-processing-app@$PACKAGE_VERSION --prefix /asset

Please note the following:

  • we use --prefix /asset with our npm install command. This tells npm to install the dependencies into the folder which CDK will mount into the container. All files which should go into the output of the docker build need to be placed here.
  • the aws codeartifact login command requires credentials with the appropriate permissions to proceed. In case you run this on for example AWS CodeBuild or inside of a CDK Pipeline you need to make sure that the used role has the appropriate policies attached.

Infrastructure Team

The infrastructure team consumes the AWS CDK construct published by the application team. They own the AWS CDK Stack which composes the whole application. Possibly this will only be one of several Stacks owned by the Infrastructure team. Other Stacks might create shared infrastructure (like VPCs, networking) and other applications.

Within the stack for our application the infrastructure team consumes and instantiates the application team’s construct, passes any dependencies into it and then deploys the stack by whatever means they see fit (e.g. through AWS CodePipeline, GitHub Actions or any other form of continuous delivery/deployment).

The dependency on the application team’s construct is manifested in the package.json of the infrastructure team’s CDK app:

{
  "name": "order-processing-infra-app",
  ...
  "dependencies": {
    ...
    "order-app-construct" : "1.1.0",
    ...
  }
  ...
}

Within the created CDK Stack we see the dependency version for the application package as well as how the infrastructure team passes in additional information (like e.g. the queue to use):

export class OrderProcessingInfraStack extends cdk.Stack {
  constructor(scope: Construct, id: string, props?: cdk.StackProps) {
    super(scope, id, props);   

    const orderProcessingQueue = new Queue(this, 'order-processing-queue');

    new OrderProcessingAppConstruct(this, 'order-processing-app', {
       appPackageVersion: "2.0.36",
       queue: orderProcessingQueue,
       codeArtifactDetails: { ... }
     });
  }
}

Propagating New Releases

We now have the responsibilities of each team sorted out along with the artifacts owned by each team. But how do we propagate a change done by the application team all the way to production? Or asked differently: how can we invoke the infrastructure team’s CI/CD pipeline with the updated artifact versions of the application team?

We will need to update the infrastructure team’s dependencies on the application teams artifacts whenever a new version of either the application package or the AWS CDK construct is published. With the dependencies updated we can then start the release pipeline.

One approach is to listen and react to events published by AWS CodeArtifact via Amazon EventBridge. On each release AWS CodeArtifact will publish an event to Amazon EventBridge. We can listen to that event, extract the version number of the new release from its payload and start a workflow to update either our dependency on the CDK construct (e.g. in the package.json of our CDK application) or a update the appPackageVersion which the infrastructure team passes into the consumed construct.

Here’s how a release of a new app version flows through the system:

A release of the application package triggers a change and deployment of the infrastructure team's CDK Stack

Figure 1 – A release of the application package triggers a change and deployment of the infrastructure team’s CDK Stack

  1. The application team publishes a new app version into AWS CodeArtifact
  2. CodeArtifact triggers an event on Amazon EventBridge
  3. The infrastructure team listens to this event
  4. The infrastructure team updates its CDK stack to include the latest appPackageVersion
  5. The infrastructure team’s CDK Stack gets deployed

And very similar the release of a new version of the CDK Construct:

A release of the application team's CDK construct triggers a change and deployment of the infrastructure team's CDK Stack

Figure 2 – A release of the application team’s CDK construct triggers a change and deployment of the infrastructure team’s CDK Stack

  1. The application team publishes a new CDK construct version into AWS CodeArtifact
  2. CodeArtifact triggers an event on Amazon EventBridge
  3. The infrastructure team listens to this event
  4. The infrastructure team updates its dependency to the latest CDK construct
  5. The infrastructure team’s CDK Stack gets deployed

We will not go into the details on how such a workflow could look like, because it’s most likely highly custom for each team (think of different tools used for code repositories, CI/CD). However, here are some ideas on how it can be accomplished:

Updating the CDK Construct dependency

To update the dependency version of the CDK construct the infrastructure team’s package.json (or other files used for dependency tracking like pom.xml) needs to be updated. You can build automation to checkout the source code and issue a command like npm install sample-app-construct@NEW_VERSION (where NEW_VERSION is the value read from the EventBridge event payload). You then automatically create a pull request to incorporate this change into your main branch. For a sample on what this looks like see the blog post Keeping up with your dependencies: building a feedback loop for shared librares.

Updating the appPackageVersion

To update the appPackageVersion used inside of the infrastructure team’s CDK Stack you can either follow the same approach outlined above, or you can use CDK’s capability to read from an AWS Systems Manager (SSM) Parameter Store parameter. With that you wouldn’t put the value for appPackageVersion into source control, but rather read it from SSM Parameter Store. There is a how-to for this in the AWS CDK documentation: Get a value from the Systems Manager Parameter Store. You then start the infrastructure team’s pipeline based on the event of a change in the parameter.

To have a clear understanding of what is deployed at any given time and in order to see the used parameter value in CloudFormation I’d recommend using the option described at Reading Systems Manager values at synthesis time.

Conclusion

You’ve seen how the AWS Cloud Development Kit and its Construct concept can help to ensure team independence and agility even though multiple teams (in our case an application development team and an infrastructure team) work together to bring a new version of an application into production. To do so you have put the application team in charge of not only their application code, but also of the parts of the infrastructure they use to run their application on. This is still in line with the discussed split-team approach as all shared infrastructure as well as the final deployment is in control of the infrastructure team and is only consumed by the application team’s construct.

About the Authors

Picture of the author Joerg Woehrle As a Solutions Architect Jörg works with manufacturing customers in Germany. Before he joined AWS in 2019 he held various roles like Developer, DevOps Engineer and SRE. With that Jörg enjoys building and automating things and fell in love with the AWS Cloud Development Kit.
Picture of the author Mohamed Othman Mo joined AWS in 2020 as a Technical Account Manager, bringing with him 7 years of hands-on AWS DevOps experience and 6 year as System operation admin. He is a member of two Technical Field Communities in AWS (Cloud Operation and Builder Experience), focusing on supporting customers with CI/CD pipelines and AI for DevOps to ensure they have the right solutions that fit their business needs.

How to use granular geographic match rules with AWS WAF

Post Syndicated from Mohit Mysore original https://aws.amazon.com/blogs/security/how-to-use-granular-geographic-match-rules-with-aws-waf/

In November 2022, AWS introduced support for granular geographic (geo) match conditions in AWS WAF. This blog post demonstrates how you can use this new feature to customize your AWS WAF implementation and improve the security posture of your protected application.

AWS WAF provides inline inspection of inbound traffic at the application layer. You can use AWS WAF to detect and filter common web exploits and bots that could affect application availability or security, or consume excessive resources. Inbound traffic is inspected against web access control list (web ACL) rules. A web ACL rule consists of rule statements that instruct AWS WAF on how to inspect a web request.

The AWS WAF geographic match rule statement functionality allows you to restrict application access based on the location of your viewers. This feature is crucial for use cases like licensing and legal regulations that limit the delivery of your applications outside of specific geographic areas.

AWS recently released a new feature that you can use to build precise geographic rules based on International Organization for Standardization (ISO) 3166 country and area codes. With this release, you can now manage access at the ISO 3166 region level. This capability is available across AWS Regions where AWS WAF is offered and for all AWS WAF supported services. In this post, you will learn how to use this new feature with Amazon CloudFront and Elastic Load Balancing (ELB) origin types.

Summary of concepts

Before we discuss use cases and setup instructions, make sure that you are familiar with the following AWS services and concepts:

  • Amazon CloudFront: CloudFront is a web service that gives businesses and web application developers a cost-effective way to distribute content with low latency and high data transfer speeds.
  • Amazon Simple Storage Service (Amazon S3): Amazon S3 is an object storage service built to store and retrieve large amounts of data from anywhere.
  • Application Load Balancer: Application Load Balancer operates at the request level (layer 7), routing traffic to targets—Amazon Elastic Compute Cloud (Amazon EC2) instances, IP addresses, and Lambda functions—based on the content of the request.
  • AWS WAF labels: Labels contain metadata that can be added to web requests when a rule is matched. Labels can alter the behavior or default action of managed rules.
  • ISO (International Organization for Standardization) 3166 codes: ISO codes are internationally recognized codes that designate for every country and most of the dependent areas a two- or three-letter combination. Each code consists of two parts, separated by a hyphen. For example, in the code AU-QLD, AU is the ISO 3166 alpha-2 code for Australia, and QLD is the subdivision code of the state or territory—in this case, Queensland.

How granular geo labels work

Previously, geo match statements in AWS WAF were used to allow or block access to applications based on country of origin of web requests. With updated geographic match rule statements, you can control access at the region level.

In a web ACL rule with a geo match statement, AWS WAF determines the country and region of a request based on its IP address. After inspection, AWS WAF adds labels to each request to indicate the ISO 3166 country and region codes. You can use labels generated in the geo match statement to create a label match rule statement to control access.

AWS WAF generates two types of labels based on origin IP or a forwarded IP configuration that is defined in the AWS WAF geo match rule. These labels are the country and region labels.

By default, AWS WAF uses the IP address of the web request’s origin. You can instruct AWS WAF to use an IP address from an alternate request header, like X-Forwarded-For, by enabling forwarded IP configuration in the rule statement settings. For example, the country label for the United States with origin IP and forwarded IP configuration are awswaf:clientip:geo:country:US and awswaf:forwardedip:geo:country:US, respectively. Similarly, the region labels for a request originating in Oregon (US) with origin and forwarded IP configuration are awswaf:clientip:geo:region:US-OR and awswaf:forwardedip:geo:region:US-OR, respectively.

To demonstrate this AWS WAF feature, we will outline two distinct use cases.

Use case 1: Restrict content for copyright compliance using AWS WAF and CloudFront

Licensing agreements might prevent you from distributing content in some geographical locations, regions, states, or entire countries. You can deploy the following setup to geo-block content in specific regions to help meet these requirements.

In this example, we will use an AWS WAF web ACL that is applied to a CloudFront distribution with an S3 bucket origin. The web ACL contains a geo match rule to tag requests from Australia with labels, followed by a label match rule to block requests from the Queensland region. All other requests with source IP originating from Australia are allowed.

To configure the AWS WAF web ACL rule for granular geo restriction

  1. Follow the steps to create an Amazon S3 bucket and CloudFront distribution with the S3 bucket as origin.
  2. After the CloudFront distribution is created, open the AWS WAF console.
  3. In the navigation pane, choose Web ACLs, select Global (CloudFront) from the dropdown list, and then choose Create web ACL.
  4. For Name, enter a name to identify this web ACL.
  5. For Resource type, choose the CloudFront distribution that you created in step 1, and then choose Add.
  6. Choose Next.
  7. Choose Add rules, and then choose Add my own rules and rule groups.
  8. For Name, enter a name to identify this rule.
  9. For Rule type, choose Regular rule.
  10. Configure a rule statement for a request that matches the statement Originates from a Country and select the Australia (AU) country code from the dropdown list.
  11. Set the IP inspection configuration parameter to Source IP address.
  12. Under Action, choose Count, and then choose Add Rule.
  13. Create a new rule by following the same actions as in step 7 and enter a name to identify the rule.
  14. For Rule type, choose Regular rule.
  15. Configure a rule statement for a request that matches the statement Has a Label and enter awswaf:clientip:geo:region:AU-QLD for the match key.
  16. Set the action to Block and choose Add rule.
  17. For Actions, keep the default action of Allow.
  18. For Amazon CloudWatch metrics, select the AWS WAF rules that you created in steps 8 and 14.
  19. For Request sampling options, choose Enable sampled requests, and then choose Next.
  20. Review and create the web ACL rule.

After the web ACL is created, you should see the web ACL configuration, as shown in the following figures. Figure 1 shows the geo match rule configuration.

Figure 1: Web ACL rule configuration

Figure 1: Web ACL rule configuration

Figure 2 shows the Queensland regional geo restriction.

Figure 2: Queensland regional geo restriction - web ACL configuration<

Figure 2: Queensland regional geo restriction – web ACL configuration<

The setup is now complete—you have a web ACL with two regular rules. The first rule matches requests that originate from Australia and adds geographic labels automatically. The label match rule statement inspects requests with Queensland granular geo labels and blocks them. To understand where requests are originating from, you can configure logging on the AWS WAF web ACL.

You can test this setup by making requests from Queensland, Australia, to the DNS name of the CloudFront distribution to invoke a block. CloudFront will return a 403 error, similar to the following example.

$ curl -IL https://abcdd123456789.cloudfront.net
HTTP/2 403 
server: CloudFront
date: Tue, 21 Feb 2023 22:06:25 GMT
content-type: text/html
content-length: 919
x-cache: Error from cloudfront
via: 1.1 abcdd123456789.cloudfront.net (CloudFront)
x-amz-cf-pop: SYD1-C1

As shown in these test results, requests originating from Queensland, Australia, are blocked.

Use case 2: Allow incoming traffic from specific regions with AWS WAF and Application Load Balancer

We recently had a customer ask us how to allow traffic from only one region, and deny the traffic from other regions within a country. You might have similar requirements, and the following section will explain how to achieve that. In the example, we will show you how to allow only visitors from Washington state, while disabling traffic from the rest of the US.

This example uses an AWS WAF web ACL applied to an application load balancer in the US East (N. Virginia) Region with an Amazon EC2 instance as the target. The web ACL contains a geo match rule to tag requests from the US with labels. After we enable forwarded IP configuration, we will inspect the X-Forwarded-For header to determine the origin IP of web requests. Next, we will add a label match rule to allow requests from the Washington region. All other requests from the United States are blocked.

To configure the AWS WAF web ACL rule for granular geo restriction

  1. Follow the steps to create an internet-facing application load balancer in the US East (N. Virginia) Region.
  2. After the application load balancer is created, open the AWS WAF console.
  3. In the navigation pane, choose Web ACLs, and then choose Create web ACL in the US east (N. Virginia) Region.
  4. For Name, enter a name to identify this web ACL.
  5. For Resource type, choose the application load balancer that you created in step 1 of this section, and then choose Add.
  6. Choose Next.
  7. Choose Add rules, and then choose Add my own rules and rule groups.
  8. For Name, enter a name to identify this rule.
  9. For Rule type, choose Regular rule.
  10. Configure a rule statement for a request that matches the statement Originates from a Country in, and then select the United States (US) country code from the dropdown list.
  11. Set the IP inspection configuration parameter to IP address in Header.
  12. Enter the Header field name as X-Forwarded-For.
  13. For Match, choose Fallback for missing IP address. Web requests without a valid IP address in the header will be treated as a match and will be allowed.
  14. Under Action, choose Count, and then choose Add Rule.
  15. Create a new rule by following the same actions as in step 7 of this section, and enter a name to identify the rule.
  16. For Rule type, choose Regular rule.
  17. Configure a rule statement for a request that matches the statement Has a Label, and for the match key, enter awswaf:forwardedip:geo:region:US-WA.
  18. Set the action to Allow and add choose Add Rule.
  19. For Default web ACL action for requests that don’t match any rules, set the Action to Block.
  20. For Amazon CloudWatch metrics, select the AWS WAF rules that you created in steps 8 and 14 of this section.
  21. For Request sampling options, choose Enable sampled requests, and then choose Next.
  22. Review and create the web ACL rule.

After the web ACL is created, you should see the web ACL configuration, as shown in the following figures. Figure 3 shows the geo match rule

Figure 3: Geo match rule

Figure 3: Geo match rule

Figure 4 shows the Washington regional geo restriction.

Figure 4: Washington regional geo restriction - web ACL configuration

Figure 4: Washington regional geo restriction – web ACL configuration

The following is a JSON representation of the rule:

{
  "Name": "WashingtonRegionAllow",
  "Priority": 1,
  "Statement": {
    "LabelMatchStatement": {
      "Scope": "LABEL",
      "Key": "awswaf:forwardedip:geo:region:US-WA"
    }
  },
  "Action": {
    "Allow": {}
  },
  "VisibilityConfig": {
    "SampledRequestsEnabled": true,
    "CloudWatchMetricsEnabled": true,
    "MetricName": "USRegionalRestriction"
  }
}

The setup is now complete—you have a web ACL with two regular rules. The first rule matches requests that originate from the US after inspecting the origin IP in the X-Forwarded-For header, and adds geographic labels. The label match rule statement inspects requests with the Washington region granular geo labels and allows these requests.

If a user makes a web request from outside of the Washington region, the request will be blocked and a HTTP 403 error response will be returned, similar to the following.

curl -IL https://GeoBlock-1234567890.us-east-1.elb.amazonaws.com
HTTP/1.1 403 Forbidden
Server: awselb/2.0
Date: Tue, 21 Feb 2023 22:07:54 GMT
Content-Type: text/html
Content-Length: 118
Connection: keep-alive

Conclusion

AWS WAF now supports the ability to restrict traffic based on granular geographic labels. This gives you further control based on geographic location within a country.

In this post, we demonstrated two different use cases that show how this feature can be applied with CloudFront distributions and application load balancers. Note that, apart from CloudFront and application load balancers, this feature is supported by other origin types that are supported by AWS WAF, such as Amazon API Gateway and Amazon Cognito.

If you have feedback about this post, submit comments in the Comments section below. If you have questions about this post, start a new thread on the AWS WAF re:Post or contact AWS Support.

Want more AWS Security news? Follow us on Twitter.

Mohit Mysore

Mohit Mysore

Mohit is a Technical Account Manager with over 5 years of experience working with AWS Customers. He is passionate about network and system administration. Outside work, He likes to travel, watch soccer and F1 and spend time with his family.

Enabling Microsoft Defender Credential Guard on Amazon EC2

Post Syndicated from Sheila Busser original https://aws.amazon.com/blogs/compute/enabling-microsoft-defender-credential-guard-on-amazon-ec2/

This blog post is written by Jason Nicholls, Principal Solutions Architect AWS.

In this post we show you how to enable that Windows Defender Credential Guard (Credential Guard) on Amazon Elastic Compute Cloud (Amazon EC2) running Microsoft Windows Server. Credential Guard, when enabled on Amazon EC2 Windows Instances protects sensitive user login information from being extracted from the Operating System (OS) memory.

Microsoft Windows stores credential material such as authentication tokens in the Local Security Authority (LSA), a process in the Microsoft Windows operating system that is responsible for enforcing the security policy of the system. Traditionally these credentials are stored in LSA’s process memory accessible to the rest of the OS, making it possible for a privileged user to extract these credentials. The use of complex passwords, limiting privileged account use, and training users not to use the same password across multiple systems are steps that limit the use of credentials extracted from the LSA, but customers want to isolate these credentials from other rest of the OS.

With Credential Guard enabled, the LSA is isolated by Windows virtualization-based security (VBS). VBS is a suite of Windows security mechanisms that use hardware virtualization features to create an isolated compute environment to store user credentials referred to as the isolated LSA. The isolated LSA is inaccessible to the rest of the OS.

Prerequisites

Credential Guard requires a virtualization technology that supports Virtualization-based Security (VBS) and Unified Extensible Firmware Interface (UEFI) Secure Boot. Optionally, Credential Guard can leverage a Trusted Platform Module (TPM) to further secure credentials. In this walk-through we will use NitroTPM, a virtual TPM 2.0-compliant (ISO/IEC 11889:2015) module for your Amazon EC2 instances to enhance the security of the isolated LSA.

Launch your instance

A list of Windows Amazon Machine Image (AMI)s preconfigured to enable UEFI Secure Boot is available in our “Launch an instance with UEFI Secure Boot support ” guide. You can verify that your AMI supports UEFI Secure Boot and NitroTPM using the AWS Command Line Interface (AWS CLI) describe-images command as follows:

aws ec2 describe-images --image-ids ami-0123456789

When UEFI Secure Boot and NitroTPM are enabled for the AMI, “TpmSupport“: “v2.0“, and “BootMode”: “uefi” appear in the output respectively, such as in the following example.

{
   "Images": [
      {
         ...
         "BootMode": "uefi",
         "TpmSupport": "v2.0"
      }
   ]
}

Before launching the AMI verify that the instance type you want to launch supports UEFI boot mode and uses the Nitro System by using the DescribeInstanceTypes API call. Using the AWS CLI and calling describe-instance-types as follows:

aws ec2 describe-instance-types --instance-types [INSTANCE_TYPE] --region [REGION]

Where INSTANCE_TYPE is a supported instance type as defined in the documentation, an example is c5.large and REGION is a supported AWS Region.

The output of the command should display nitro as the hypervisor and list uefi as a supported boot mode. For example:

{
   "InstanceTypes": [
   {
      ...
      "Hypervisor": "nitro",
      ...
      "SupportedBootModes": [
                "legacy-bios",
                "uefi"
      ]
   }
}

Use the Amazon EC2 console or AWS Command Line Interface (AWS CLI) to launch an Amazon EC2 instance which has “uefi” boot mode enabled. Administrator access to the Amazon EC2 instance is required to enable Credential Guard.

Walkthrough:

Enabling Credential Guard with Amazon EC2 Launch an Amazon EC2 Windows Instance

Launch an Amazon EC2 Windows Instance using a Windows AMI preconfigured to enable UEFI Secure Boot with Microsoft Windows Secure Boot Keys on an instance type that supports UEFI Secure Boot.

You can use the launch wizard in the Amazon EC2 console or run-instances command via the AWS CLI to launch an instance that can support Credential Guard. You need a compatible AMI ID for launching your instance which is unique for each AWS Region. You can use the following link to discover and launch instances with compatible Amazon-provided AMIs in the Amazon EC2 console:

Enable Credential Guard on the launched Instance

Now that you know how to create an AMI with UEFI Secure Boot support enabled, let’s create a Windows instance and configure Credential Guard.

Credential Guard can be enabled either by using Group Policies, the Windows Registry, or the Windows Defender Device Guard and Windows Defender Credential Guard hardware readiness tool (DG-Readiness tool). In this post we will show you how to enable Credential Guard using the Windows Registry and via the DG-Readiness tool.

Option 1: Enabling Credential Guard via the Windows Registry

Start the Amazon EC2 instance using an AMI that has the BootMode set to “uefi“. Windows AMI must be preconfigured to enable UEFI Secure Boot with Microsoft Windows Secure Boot keys as we defined earlier. Once you’re connected to the instance use the Windows System Information tool to check that Credential Guard isn’t running on the instance:

  1. Select Start, type msinfo32.exe, and then select System Information.
  2. Select System Summary on the left.
  3. Confirm that Virtualization-based security is Not Enabled.

Figure 1 Overview of System Information in WindowsFigure 1 Overview of System Information in Windows

Figure 2 System Information confirming that Credential Guard is Not Enabled

Figure 2 System Information confirming that Credential Guard is Not Enabled

4. Open the Windows Command Shell by selecting Start, type cmd.exe, and then press Enter.

5. Run the following commands from the Windows Command Shell to enable Credential Guard using the Windows Registry:

REG ADD "HKLM\System\CurrentControlSet\Control\DeviceGuard" /v EnableVirtualizationBasedSecurity /t REG_DWORD /d 1 /f

REG ADD "HKLM\System\CurrentControlSet\Control\DeviceGuard" /v RequirePlatformSecurityFeatures /t REG_DWORD /d 1 /f

REG ADD "HKLM\System\CurrentControlSet\Control\LSA" /v LsaCfgFlags /t REG_DWORD /d 2 /f

REG ADD "HKLM\SYSTEM\CurrentControlSet\Control\DeviceGuard\Capabilities\" /v "HyperVEnabled" /t REG_DWORD /d 1 /f

Figure 3 Update the Windows Registry to enable Credential GuardFigure 3 Update the Windows Registry to enable Credential Guard

6. Once the changes have been made, reboot the instance.

7. When the instance is back up, reconnect to the instance and select Start, type msinfo32.exe, and then select System Information.

8. Select System Summary on the left.

9. Note that Virtualisation-based security is now changed to Running, and that Secure Boot and Credential Guard are enabled.

Figure 4 Overview of System Information showing Credential Guard is EnabledFigure 4 Overview of System Information showing Credential Guard is Enabled

Figure 5 System Information shows Credential Guard is now EnabledFigure 5 System Information shows Credential Guard is now Enabled

Option 2: Enabling Credential Guard via the DG-Readiness tool

Option 1 requires a remote desktop session to your Windows Instance. Option 2 is run via PowerShell which can either be done in a remote desktop session as described here or via a remote PowerShell session.

Start the Amazon EC2 instance using an AMI that has the BootMode set to “uefi“. Windows AMI must be preconfigured to enable UEFI Secure Boot with Microsoft Windows Secure Boot keys as we defined earlier. Once you’re connected to the instance start a PowerShell session:

  1. Select Start, type PowerShell, and then click Windows PowerShell.

Figure 6 Start PowerShell via the Start BarFigure 6 Start PowerShell via the Start Bar

      2. Download the DG-Readiness tool by running the command:

wget https://download.microsoft.com/download/B/D/8/BD821B1F-05F2-4A7E-AA03-DF6C4F687B07/dgreadiness_v3.6.zip -outfile dgreadiness.zip

Figure 7 Download the DG-Readiness toolFigure 7 Download the DG-Readiness tool

  1. Uncompress the downloaded zip file using the Expand-Archive function within PowerShell
Expand-Archive -Path C:\Users\Administrator\dgreadiness.zip -DestinationPath C:\dgreadiness
  1. Move the DG-Readiness tool to the current folder

copy C:\dgreadiness\dgreadiness_v3.6\DG_Readiness_Tool_v3.6.ps1 .\

Figure 8 Copy the DG-Readiness tool to the current folderFigure 8 Copy the DG-Readiness tool to the current folder

  1. Confirm that Credential Guard is disabled by running the DG-Readiness tool with the -Ready option, as follows:
DG_Readiness_Tool_v3.6.ps1 -Ready

Figure 9 Using the DG-Readiness tool to confirm Credential Guard is not enabledFigure 9 Using the DG-Readiness tool to confirm Credential Guard is not enabled

  1. Enable Credential Guard using the -Enable -CG options as follows:
DG_Readiness_Tool_v3.6.ps1 -Enable -CG
  1. Reboot the instance
  2. Reconnect to the instance after the reboot and confirm that Credential Guard is now running by running the command:
DG_Readiness_Tool_v3.6.ps1 -Ready

Figure 10 DG Readiness Tool shows Credential Guard is enabled and runningFigure 10 DG Readiness Tool shows Credential Guard is enabled and running

Conclusion

With support for Windows Defender Credential Guard on Amazon EC2 Windows Instances customers can create an isolated compute environment that is inaccessible to the rest of the OS. Credential Guard requires UEFI Secure Boot support. Credential Guard can leverage NitroTPM to further secure credentials.

To learn more about the support of Credential Guard visit documentation.

Let’s Architect! Architecture tools

Post Syndicated from Luca Mezzalira original https://aws.amazon.com/blogs/architecture/lets-architect-architecture-tools/

Tools, such as diagramming software, low-code applications, and frameworks, make it possible to experiment quickly. They are essential in today’s fast-paced and technology-driven world. From improving efficiency and accuracy, to enhancing collaboration and creativity, a well-defined set of tools can make a significant impact on the quality and success of a project in the area of software architecture.

As an architect, you can take advantage of a wide range of resources to help you build solutions that meet the needs of your organization. For example, with tools in the likes of the Amazon Web Services (AWS) Solutions Library and Serverless Land, you can boost your knowledge and productivity while working on event-driven architectures, microservices, and stateless computing.

In this Let’s Architect! edition, we explore how to incorporate these patterns into your architecture, and which tools to leverage to build solutions that are scalable, secure, and cost-effective.

How AWS Application Composer helps your team build great apps

In this re:Invent 2022 session, Chase Douglas, Principal Engineer at AWS, speaks about AWS Application Composer, a newly launched service.

This service has the potential to change the way architects design solutions—without writing a single line of code! The service is user-friendly, intuitive, and requires no prior coding experience. It allows users to scaffold a serverless architecture, defining a CloudFormation template visually with drag-and-drop. A detailed AWS Compute Blog post takes readers through the process of using AWS Application Composer.

Take me to this re:Invent 2022 video!

How an architecture can be designed with AWS Application Composer

How an architecture can be designed with AWS Application Composer

AWS design + build tools

When migrating to the cloud, we suggest referencing these four tried-and-true AWS resources that can be used to design and build projects.

  1. AWS Workshops are created by AWS teams to provide opportunities for hands-on learning to develop practical skills. Workshops are available in multiple categories and for skill levels 100-400.
  2. AWS Architecture Center contains a collection of best practices and architectural patterns for designing and deploying cloud-based solutions using AWS services. Furthermore, it includes detailed architecture diagrams, whitepapers, case studies, and other resources that provide a wealth of information on how to design and implement cloud solutions.
  3. Serverless Land (an Amazon property) brings together various patterns, workflows, code snippets, and blog posts pertaining to AWS serverless architectures.
  4. AWS Solutions Library provides customers with templates, tools, and automated workflows to easily deploy, operate, and manage common use cases on the AWS Cloud.
Inside event-driven architectures designed by David Boyne on Serverless Land

Inside event-driven architectures designed by David Boyne on Serverless Land

The Well-Architected way

In this session, the AWS Well-Architected provides guidance on how to implement the architectural models reported in the AWS Well-Architected Framework within your organization at scale.

Discover a customer story and understand how to use the features of the AWS Well-Architected Tool and APIs to receive recommendations based on your workload and measure your architectural metrics. In the Framework whitepaper, you can explore the six pillars of Well-Architected (operational excellence, security, reliability, performance efficiency, cost optimization, and sustainability) and best practices to achieve them.

Understanding the key design pillars can help architects make informed design decisions, leading to more robust and efficient solutions. This knowledge also enables architects to identify potential problems early on in the design process and find appropriate patterns to address those issues.

Take me to the Well-Architected video!

Discover how the AWS Well-Architected Framework can help you design scalable, maintainable, and reusable solutions

Discover how the AWS Well-Architected Framework can help you design scalable, maintainable, and reusable solutions

See you next time!

Thanks for exploring architecture tools and resources with us!

Join us next time when we’ll talk about data mesh architecture!

To find all the posts from this series, check out the Let’s Architect! page of the AWS Architecture Blog.

Go Wild with Wildcards in the Backblaze B2 Command Line Tool 3.7.1

Post Syndicated from Pat Patterson original https://www.backblaze.com/blog/go-wild-with-wildcards-in-backblaze-b2-command-line-tool-3-7-1/

File transfer tools such as Cyberduck, FileZilla Pro, and Transmit implement a graphical user interface (GUI), which allows users to manage and transfer files across local storage and any number of services, including cloud object stores such as Backblaze B2 Cloud Storage. Some tasks, however, require a little more power and flexibility than a GUI can provide. This is where a command line interface (CLI) shines. A CLI typically provides finer control over operations than a GUI tool, and makes it straightforward to automate repetitive tasks. We recently released version 3.7.0 (and then, shortly thereafter, version 3.7.1) of the Backblaze B2 Command Line Tool, alongside version 1.19.0 of the underlying Backblaze B2 Python SDK. Let’s take a look at the highlights in the new releases, and why you might want to use the Backblaze B2 CLI rather than the AWS equivalent.

Battle of the CLI’s: Backblaze B2 vs. AWS

As you almost certainly already know, Backblaze B2 has an S3-compatible API in addition to its original API, now known as the B2 Native API. In most cases, we recommend using the S3-compatible API, since a rich ecosystem of S3 tools and knowledge has evolved over the years.

While the AWS CLI works perfectly well with Backblaze B2, and we explain how to use it in our B2 Developer Quick-Start Guide, it’s slightly clunky. The AWS CLI allows you to set your access key id and secret access key via either environment variables or a configuration file, but you must override the default endpoint on the command line with every command, like this:

% aws --endpoint-url https://s3.us-west-004.backblazeb2.com s3api list-buckets

This is very tiresome if you’re working interactively at the command line! In contrast, the B2 CLI retrieves the correct endpoint from Backblaze B2 when it authenticates, so the command line is much more concise:

% b2 list-buckets

Additionally, the CLI provides fine-grain access to Backblaze B2-specific functionality, such as application key management and replication.

Automating Common Tasks with the B2 Command Line Tool

If you’re already familiar with CLI tools, feel free to skip to the next section.

Imagine you’ve uploaded a large number of WAV files to a Backblaze B2 Bucket for transcoding into .mp3 format. Once the transcoding is complete, and you’ve reviewed a sample of the .mp3 files, you decide that you can delete the .wav files. You can do this in a GUI tool, opening the bucket, navigating to the correct location, sorting the files by extension, selecting all of the .wav files, and deleting them. However, the CLI can do this in a single command:

% b2 rm --withWildcard --recursive my-bucket 'audio/*.wav'

If you want to be sure you’re deleting the correct files, you can add the --dryRun option to show the files that would be deleted, rather than actually deleting them:

% b2 rm --dryRun --withWildcard --recursive my-bucket 'audio/*.wav'
audio/aardvark.wav
audio/barracuda.wav
...
audio/yak.wav
audio/zebra.wav

You can find a complete list of the CLI’s commands and their options in the documentation.

Let’s take a look at what’s new in the latest release of the Backblaze B2 CLI.

Major Changes in B2 Command Line Tool Version 3.7.0

New rm command

The most significant addition in 3.7.0 is a whole new command: rm. As you might expect, rm removes files. The CLI has always included the low-level delete-file-version command (to delete a single file version) but you had to call that multiple times and combine it with other commands to remove all versions of a file, or to remove all files with a given prefix.

The new rm command is significantly more powerful, allowing you to delete all versions of a file in a single command:

% b2 rm --versions --withWildcard --recursive my-bucket images/san-mateo.png

Let’s unpack that command:

  • %: represents the command shell’s prompt. (You don’t type this.)
  • b2: the B2 CLI executable.
  • rm: the command we’re running.
  • --versions: apply the command to all versions. Omitting this option applies the command to just the most recent version.
  • --withWildcard: treat the folderName argument as a pattern to match the file name.
  • --recursive: descend into all folders. (This is required with –withWildcard.)
  • my-bucket: the bucket name.
  • images/san-mateo.png: the file to be deleted. There are no wildcard characters in the pattern, so the file name must match exactly. Note: there is no leading ‘/’ in Backblaze B2 file names.

As mentioned above, the --dryRun argument allows you to see what files would be deleted, without actually deleting them. Here it is with the ‘*’ wildcard to apply the command to all versions of the .png files in /images. Note the use of quotes to avoid the command shell expanding the wildcard:

% b2 rm --dryRun --versions --withWildcard --recursive my-bucket 'images/*.png'
images/amsterdam.png
images/sacramento.png

DANGER ZONE: by omitting --withWildcard and the folderName argument, you can delete all of the files in a bucket. We strongly recommend you use --dryRun first, to check that you will be deleting the correct files.

% b2 rm --dryRun --versions –recursive my-bucket
index.html
images/amsterdam.png
images/phoenix.jpeg
images/sacramento.png
stylesheets/style.css

New --withWildcard option for the ls command

The ls command gains the --withWildcard option. It operates identically as described above. In fact, b2 rm --dryRun --withWildcard --recursive executes the exact same code as b2 ls --withWildcard --recursive. For example:

% b2 ls --withWildcard --recursive my-bucket 'images/*.png'
images/amsterdam.png
images/sacramento.png

You can combine --withWildcard with any of the existing options for ls, for example --long:

% b2 ls --long --withWildcard --recursive my-bucket 'images/*.png'
4_z71d55dummyid381234ed0c1b_f108f1dummyid163b_d2dummyid_m165048_c004
_v0402014_t0016_u01dummyid48198 upload 2023-02-09 16:50:48 714686 images/amsterdam.png
4_z71d55dummyid381234ed0c1b_f1149bdummyid1141_d2dummyid_m165048_c004
_v0402010_t0048_u01dummyid48908 upload 2023-02-09 16:50:48 549261 images/sacramento.png

New --incrementalMode option for upload-file and sync

The new --incrementalMode option saves time and bandwidth when working with files that grow over time, such as log files, by only uploading the changes since the last upload. When you use the --incrementalMode option with upload-file or sync, the B2 CLI looks for an existing file in the bucket with the b2FileName that you supplied, and notes both its length and SHA-1 digest. Let’s call that length l. The CLI then calculates the SHA-1 digest of the first l bytes of the local file. If the digests match, then the CLI can instruct Backblaze B2 to create a new file comprising the existing file and the remaining bytes of the local file.

That was a bit complicated, so let’s look at a concrete example. My web server appends log data to a file, access.log. I’ll see how big it is, get its SHA-1 digest, and upload it to a B2 Bucket:

% ls -l access.log
-rw-r--r-- 1 ppatterson staff 5525849 Feb 9 15:55 access.log

% sha1sum access.log
ff46904e56c7f9083a4074ea3d92f9be2186bc2b access.log

The upload-file command outputs all of the file’s metadata, but we’ll focus on the SHA-1 digest, file info, and size.

% b2 upload-file my-bucket access.log access.log
...
{
...
"contentSha1": "ff46904e56c7f9083a4074ea3d92f9be2186bc2b",
...
"fileInfo": {
"src_last_modified_millis": "1675986940381"
},
...
"size": 5525849,
...
}

As you might expect, the digest and size match those of the local file.

Time passes, and our log file grows. I’ll first upload it as a different file, so that we can see the default behavior when the B2 Cloud Storage file is simply replaced:

% ls -l access.log
-rw-r--r-- 1 ppatterson staff 11047145 Feb 9 15:57 access.log

% sha1sum access.log
7c97866ff59330b67aa96d7a481578d62e030788 access.log

% b2 upload-file my-bucket access.log new-access.log
{
...
"contentSha1": "7c97866ff59330b67aa96d7a481578d62e030788",
...
"fileInfo": {
"src_last_modified_millis": "1675987069538"
},
...
"size": 11047145,
...
}

Everything is as we might expect—the CLI uploaded 11,047,145 bytes to create a new file, which is 5,521,296 bytes bigger than the initial upload.

Now I’ll use the --incrementalMode option to replace the first Backblaze B2 file:

% b2 upload-file --quiet my-bucket access.log access.log
...
{
...
"contentSha1": "none",
...
"fileInfo": {
"large_file_sha1": "7c97866ff59330b67aa96d7a481578d62e030788",
"plan_id": "ea6b099b48e7eb7fce01aba18dbfdd72b56eb0c2",
"src_last_modified_millis": "1675987069538"
},
...
"size": 11047145,
...
}

The digest is exactly the same, but it has moved from contentSha1 to fileInfo.large_file_sha1, indicating that the file was uploaded as separate parts, resulting in a large file. The CLI didn’t need to upload the initial 5,525,849 bytes of the local file; it instead instructed Backblaze B2 to combine the existing file with the final 5,521,296 bytes of the local file to create a new version of the file.

There are several more new features and fixes to existing functionality in version 3.7.0—make sure to check out the B2 CLI changelog for a complete list.

Major Changes in B2 Python SDK 1.19.0

Most of the changes in the B2 Python SDK support the new features in the B2 CLI, such as adding wildcard matching to the Bucket.ls operation and adding support for incremental upload and sync. Again, you can inspect the B2 Python SDK changelog for a comprehensive list.

Get to Grips with B2 Command Line Tool Version 3.7.0 3.7.1

Whether you’re working on Windows, Mac or Linux, it’s straightforward to install or update the B2 CLI; full instructions are provided in the Backblaze B2 documentation.

Note that the latest version is now 3.7.1. The only changes from 3.7.0 are a handful of corrections to help text and that the Mac binary is no longer provided, due to shortcomings in the Mac version of PyInstaller. Instead, we provide the Mac version of the CLI via the Homebrew package manager.

The post Go Wild with Wildcards in the Backblaze B2 Command Line Tool 3.7.1 appeared first on Backblaze Blog | Cloud Storage & Cloud Backup.

Dell PowerEdge Gets Edgy with XR8000 XR7620 and XR5610 Servers

Post Syndicated from Cliff Robinson original https://www.servethehome.com/dell-poweredge-gets-edgy-with-xr8000-xr7620-and-xr5610-servers/

Dell announces new Intel Xeon Edge Enhanced processors with Intel vRAN Boost and new Dell PowerEdge XR8000, XR7000 and XR5000 edge systems

The post Dell PowerEdge Gets Edgy with XR8000 XR7620 and XR5610 Servers appeared first on ServeTheHome.

The collective thoughts of the interwebz