Accelerate self-service analytics with Amazon Redshift Query Editor V2

Post Syndicated from Bhanu Pittampally original https://aws.amazon.com/blogs/big-data/accelerate-self-service-analytics-with-amazon-redshift-query-editor-v2/

Amazon Redshift is a fast, fully managed cloud data warehouse. Tens of thousands of customers use Amazon Redshift as their analytics platform. Users such as data analysts, database developers, and data scientists use SQL to analyze their data in Amazon Redshift data warehouses. Amazon Redshift provides a web-based query editor in addition to supporting connectivity via ODBC/JDBC or the Redshift Data API. Query Editor V2 lets users explore, analyze, and collaborate on data. You can use Query Editor V2 to create databases, schemas, tables, and load data from Amazon Simple Storage Service (S3) either using COPY command or using a wizard . You can browse multiple databases and run queries on your Amazon Redshift data warehouse, data lake, or federated query to operational databases such as Amazon Aurora.

From the smallest start-ups to worldwide conglomerates, customers across the spectrum tell us they want to promote self-service analytics by empowering their end-users, such as data analysts and business analysts, to load data into their analytics platform. Analysts at these organizations create tables and load data in their own workspace, and they join that with the curated data available from the data warehouse to gain insight. This post will discuss how Query Editor V2 accelerates self-service analytics by enabling users to create tables and load data with simple wizards.

The Goal to Accelerate and Empower Data Analysts

A common practice that we see across enterprises today is that more and more enterprises are letting data analysts or business analysts load data into their user or group workspaces that co-exist on data warehouse platforms. Enterprise calls these personal workspaces, departmental schemas, project-based schemas or labs, and so on. The idea of this approach is to empower data analysts to load data sets by themselves and join curated data sets on a data warehouse platform to accelerate the data analysis process.

Amazon Redshift Query Editor V2 makes it easy for administrators to create the workspaces, and it enables data analysts to create and load data into the tables. Query Editor V2 lets you easily create external schemas in Redshift Cluster to extend the data warehouse to a data lake, thereby accelerating analytics.

An example Use case

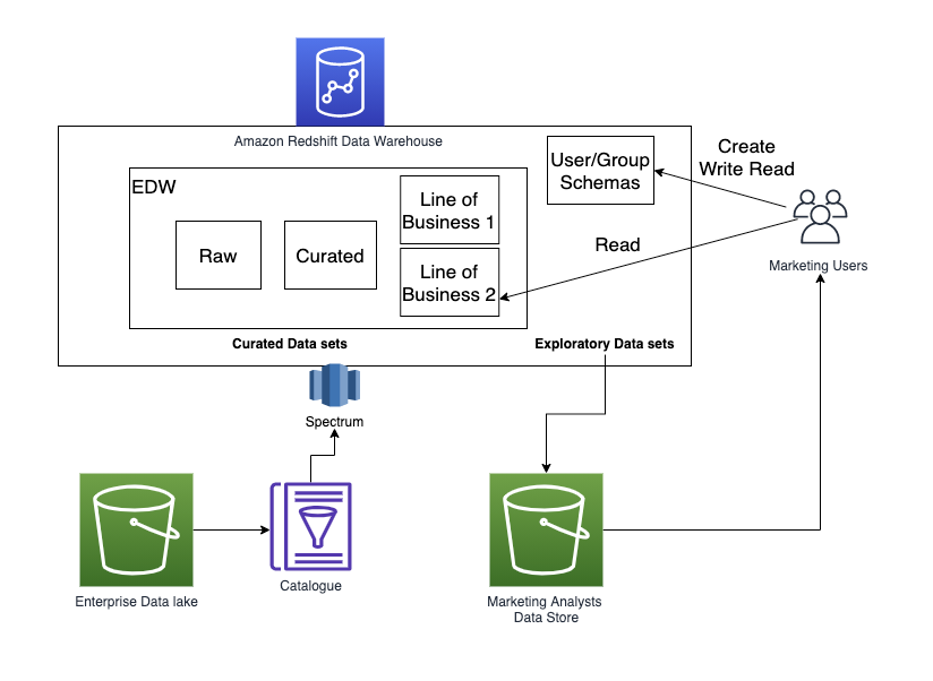
Let’s assume that an organization has a marketing department with some power users and regular users. In this example, let’s also consider that the organization already has an Enterprise Data Warehouse (EDW) powered by Amazon Redshift. The marketing department would like to have a workspace created for their team members.

A visual depiction of a Data Warehouse Environment may look like the following figure. Enterprises let user/group schemas be created along with an EDW, which contains curated data sets. Analysts can create and load exploratory data sets into user schemas, and then join curated data sets available in the EDW.
ScopeofSolution

Amazon Redshift provides several options to isolate your users’ data from the enterprise data warehouse data,. Amazon Redshift data sharing lets you share data from your EDW cluster with a separate consumer cluster. Your users can consume the EDW data and create their own workspace in the consumer cluster. Alternatively, you can create a separate database for your users’ group workspace in the same cluster, and then isolate each user group to have their own schema. Amazon Redshift supports queries of data joining across databases, and then users can join their tables with the curated data in the EDW. We recommend you use the data sharing option that lets you isolate both compute and data. Query Editor v2 supports both scenarios.

Once you have enabled your data analysts to have their own workspace and provided the relevant privileges, then they can easily create Schema, table, and load data.

Prerequisites

  1.  You have an Amazon Redshift cluster, and you have configured the Query Editor V2. You can view the Simplify Data Analysis with Amazon Redshift Query Editor V2 post for instructions on setting up Query Editor V2.
  2. For loading your data from Amazon S3 into Amazon Redshift, you will start by creating an IAM role to provide permissions to access Amazon S3 and grant that role to the Redshift cluster. By default, Redshift users assume that the IAM role is attached to the Redshift cluster. You can find the instructions in the Redshift getting started guide.
  3. For users who want to load data from Amazon S3, Query Editor V2 provides an option to browse S3 buckets. To use this feature, users should have List permission on the S3 bucket.

Create Schemas

The Query Editor V2 supports the schema creation actions. Likewise, admins can create both native and external schemas by creating Schema wizard.

CreateSchemas

As a user, you can easily create a “schema” by accessing Create Schema wizard available from the Create button, and then selecting “Schema” from the drop-down list, as shown in the following screenshot.

If you select the Schema from the drop-down list, then the Create Schema wizard similar to the following screenshot is displayed. You can choose a local schema and provide a schema name.

Optionally, you can authorize a user to authorize users to create objects in the Schema. When the Authorize user check box is selected, then Create and Usage access are granted to the user. Now, Janedoe can create objects in this Schema.

Let’s assume that the analyst user Janedoe logs in to Query Editor V2 and logs in to the database and wants to create table and load data into their personal workspace.

Creating Tables

The Query Editor V2 provides a Create table wizard for users to create a table quickly. It allows power users to auto-create the table as based on a data file. Users can upload the file from their local machine and let Query Editor V2 figure out the data types and column widths. Optionally, you can change the column definition, such as encoding and table properties.

Below is a sample CSV file with a row header and sample rows from the MarketingCampaign.csv file. We will demonstrate how to create a table based on this file in the following steps.

SampleData

The following screenshot shows the uploading of the MarketingCampaing.csv file into Query Editor V2.
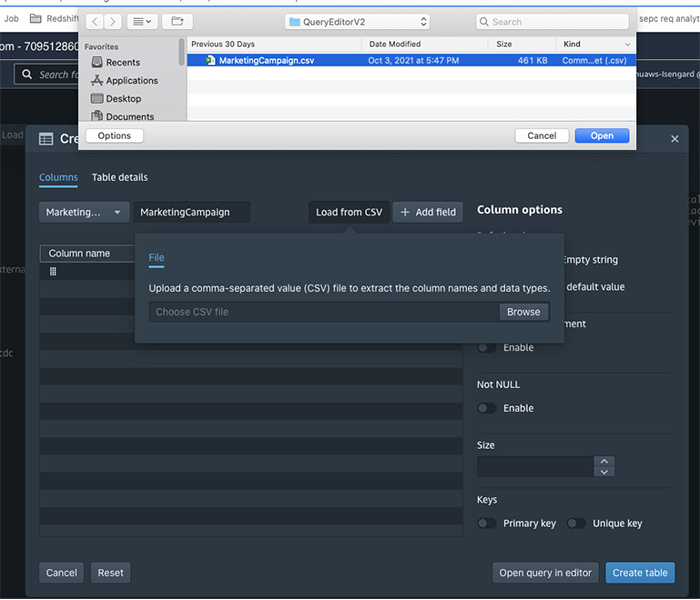
Create Table Wizard has two sections:

  1. Columns

The Columns tab lets users select a file from their local desktop and upload it to Query Editor V2. Users can choose Schema from the drop-down option and provide a table name.

Query Editor V2 automatically infers columns and some data types for each column. It has several options to choose from to set as column properties. For example, you have the option to change column names, data types, and encoding. If you do not choose any encoding option, then the encoding choice will be selected automatically. You can also add new fields, for example, an auto-increment ID column, and define properties for that particular identity column.

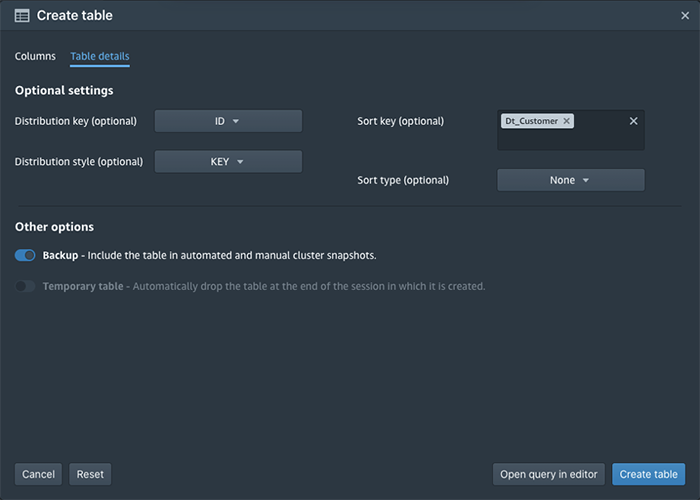
  1. Table Details

You can use the Create Table wizard to create a temporary table or regular table with the option of including it in automatic backups. The temporary table is available until the end of the session and is used in queries. A temporary table is automatically dropped once a user session is terminated.

The “Table Details” is optional, as Amazon Redshift’s Automatic Table Optimization feature takes care of Distribution Key and Sort Key on behalf of users.
  1. Viewing Create Table Statement

Once the column and table level detail is set, Query Editor V2 gives an option to view the Create table statement in Query Editor tab. This lets users save the definition for later use or share it with other users. Once the user reviews the create table definition, then the user can hit the “Run” button to run the query. Users can also directly create a table from the Create table wizard.

The following screenshot shows the Create table definition for the marketing campaign data set.

CreateTable3

Query Editor V2 lets users view table definitions in a table format. The following screenshot displays the table that we created earlier. Note that Redshift automatically inferred encoding type for each column. As the best practice, it skipped for “Dt_Customer“, as it was set as the sort key. When creating the table, we did not set the encodings for columns, as Redshift will automatically set the best compression methods for each column.

Query Editor V2 distinguishes columns by data types in a table by using distinct icons for them.

You can also view the table definition by right-clicking on the table and selecting the show definition option. You can also generate a template select command, and drop or truncate the table by right-clicking on a table.

Loading Data

Now that we have created a schema and a table, let’s learn how to upload the data to the table that we created earlier.

Query Editor V2 provides you with the ability to load data for S3 buckets to Redshift tables. The COPY command is recommended to load data in Amazon Redshift. The COPY command leverages the massively parallel processing capabilities of Redshift.

The Load Data wizard in the Query Editor V2 loads data into Redshift by generating the COPY command. As a data analyst, you don’t have to remember the intricacies of the COPY command.

You can quickly load data from CSV, JSON, ORC, or Parquet files to an existing table using the Load Data Wizard. It supports all of the options in the COPY command. The Load Data Wizard lets Data analysts build a COPY command with an easy-to-use GUI.

The following screenshot shows an S3 bucket that has our MarketingCampaign.csv file. This is a much larger file that we used to create the table using Create table wizard. We will use this file to walk you through the Load Data wizard.

LoadData1

The Load Data wizard lets you browse your available S3 bucket and select a file or folder from the S3 bucket. You can also use a manifest file. A manifest file lets you make sure that all of the files are loaded using the COPY command. You can find more information about manifest files here.

The Load Data Wizard lets you enter several properties, such as the Redshift Cluster IAM role and whether data is encrypted. You can also set file options. For example, in the case of CSV, you can set delimiter and quote parameters. If the file is compressed, then you can provide compression settings.

With the Data Conversion Parameters, you can select options like Escape Characters, time format, and if you want to ignore the header in your data file. The Load Operations option lets you set compression encodings and error handling options.

Query Editor V2 lets you browse S3 objects, thereby making it easier to navigate buckets, folders, and files. Below screens displays the flow

Query Editor V2 supports loading data of many open formats, such as JSON, Delimiter, FixedWidth, AVRO, Parquet, ORC, and Shapefile.

In our example, we are loading CSV files. As you can see, we have selected our MarketingCampaing.csv file and set the Region, and then selected the Resfhift cluster IAM Role.

For the CSV file, under additional File Options, Delimiter Character and Quote Character are set with “;” and an empty quote in the below screen.
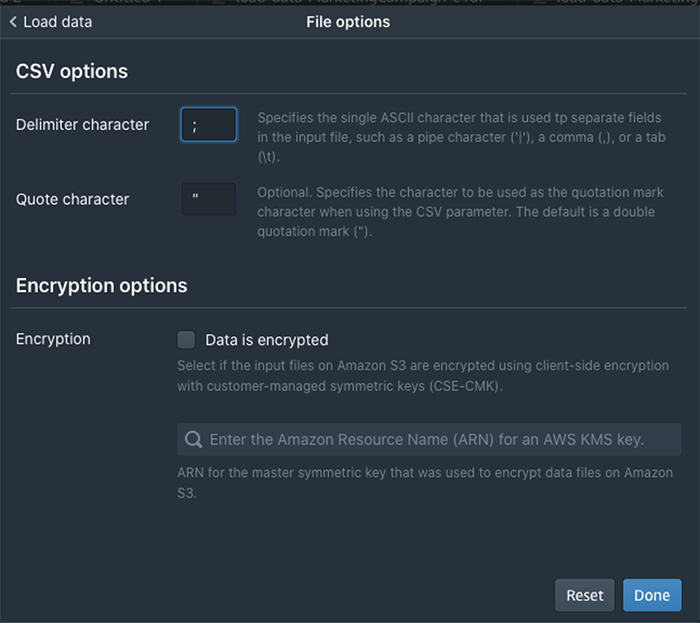
Once the required parameters are set, continue to next step to load data. Load Data operation builds a copy command and automatically loads it into Query Editor Tab, and then invokes the query.

LoadData5

Data is loaded into the target table successfully, and now you can run a query to view that data. The following screen shows the result of the select query executed on our target table:

LoadData6

Viewing load errors

If your COPY command fails, then these are logged into STL_LOAD_ERRORS system table. Query Editor v2 simplifies the viewing of the common errors by showing the errors in-place as shown in the following screenshot:

LoadData7

Saving and reusing the queries

You can save the load queries for future usage by clicking on the saved query and providing a name in the saved query.

SavingQ1You would probably like to reuse the load query in the future to load data in from another S3 location. In that case, you can use the parameterized query by replacing the S3 URL of the as shown in the following screenshot:

SavingQ2

You can save the query, and then share the query with another user.

When you or other users run the query, a prompt for the parameter will appear as in the following screenshot:
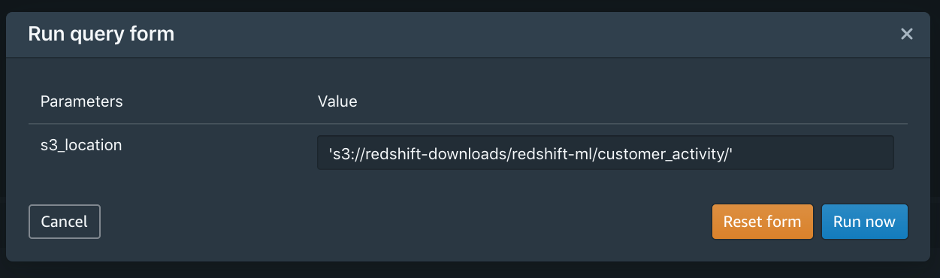
SavingQ3

We discussed how data analysts could load data into their own or the group’s workspace.

We will now discuss using Query Editor V2 to create an external schema to extend your data warehouse to the data lake.

Extending the Data Warehouse to the Data Lake

Extending Data warehouses to Data lakes is part of modern data architecture practices. Amazon Redshift enables this with seamless integration through Data lake running on AWS. Redshift uses Spectrum to allow this extension. You can access data lakes from the Redshift Data warehouse by creating Redshift external schemas.

Query Editor V2 lets you create an external schema referencing an external database in AWS Glue Data Catalogue.

To extend your Data Warehouse to Data Lake, you should have an S3 data lake and AWS Glue Data Catalog database defined for the data lake. Grant permission on AWS Glue to Redshift Cluster Role. You can find more information about external Schema here.

You can navigate to the Create External Schema by using Create Schema wizard, and then selecting the External Schema as shown in the following screenshot:

The Query Editor V2 makes the schema creation experience very easy by hiding the intricacies of the create external schema syntax. You can use the simple interface and provide the required parameters, such as Glue data regions, external database name, and the IAM role. You can browse the Glue Catalog and view the database name.

After you use the create schema option, you can see the schemas in the tree-view. The Query Editor V2 uses distinct icons to distinguish between native Schema and external Schema.

Viewing External Table Definitions

The Query Editor V2 lets data analysts quickly view objects available in external databases and understand their metadata.

You can view tables and columns for a given table by clicking on external Schema and then on a table. When a particular table is selected, its metadata information is displayed in the bottom portion below the tree-view panel. This is a powerful feature, as an analyst can easily understand the data residing externally in the data lake.
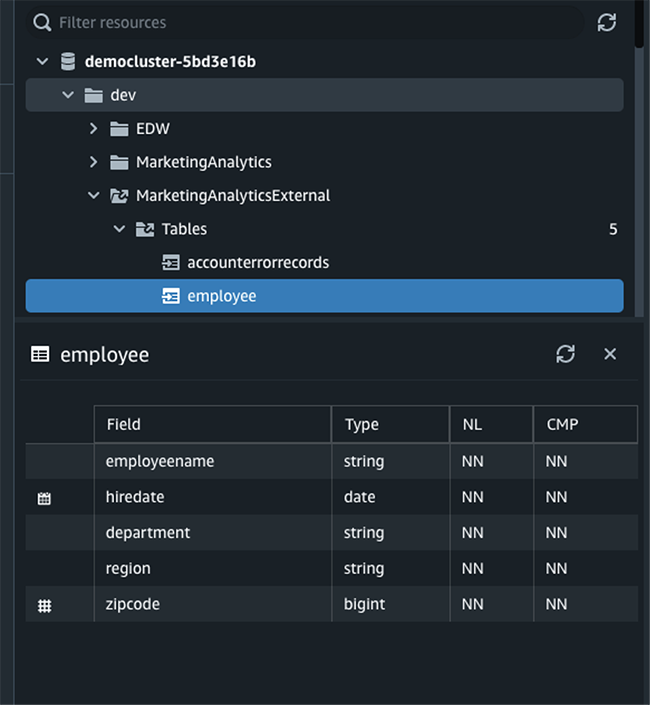
You can now run queries against external tables in the external Schema.

In our fictitious enterprise, Marketing Department team members can load data in their own workspace and join the data from their own user/group workspace with the curated data in the enterprise data warehouse or data lake.

Conclusion

This post demonstrated how the Query Editor V2 enabled data analysts to create tables and load data from Amazon S3 easily with a simple wizard.

We also discussed how Query Editor V2 lets you extend the data warehouse to a data lake. The data analysts can easily browse tables in your local data warehouse, data shared from another cluster, or tables in the data lake. You can run queries that can join tables in your data warehouse and data lake. The Query Editor V2 also provides several features for the collaboration of query authoring. You can view the earlier blog to learn more about how the Query Editor V2 simplifies data analysis.

These features let organizations accelerate self-service analytics and end-users deliver the insights faster.

Happy querying!


About the Authors

Bhanu Pittampally is Analytics Specialist Solutions Architect based out of Dallas. He specializes in building analytical solutions. His background is in data warehouse – architecture, development and administration. He is in data and analytical field for over 13 years. His Linkedin profile is here.

Debu-PandaDebu Panda  is a Principal Product Manager at AWS, is an industry leader in analytics, application platform, and database technologies, and has more than 25 years of experience in the IT world.

cansuaCansu Aksu is a Front End Engineer at AWS, has a several years of experience in developing user interfaces. She is detail oriented, eager to learn and passionate about delivering products and features that solve customer needs and problems

chengyangwangChengyang Wang is a Frontend Engineer in Redshift Console Team. He worked on a number of new features delivered by redshift in the past 2 years. He thrives to deliver high quality products and aim to improve customer experience from UI

Batch Inference at Scale with Amazon SageMaker

Post Syndicated from Ramesh Jetty original https://aws.amazon.com/blogs/architecture/batch-inference-at-scale-with-amazon-sagemaker/

Running machine learning (ML) inference on large datasets is a challenge faced by many companies. There are several approaches and architecture patterns to help you tackle this problem. But no single solution may deliver the desired results for efficiency and cost effectiveness. In this blog post, we will outline a few factors that can help you arrive at the most optimal approach for your business. We will illustrate a use case and architecture pattern with Amazon SageMaker to perform batch inference at scale.

ML inference can be done in real time on individual records, such as with a REST API endpoint. Inference can also be done in batch mode as a processing job on a large dataset. While both approaches push data through a model, each has its own target goal when running inference at scale.

With real-time inference, the goal is usually to optimize the number of transactions per second that the model can process. With batch inference, the goal is usually tied to time constraints and the service-level agreement (SLA) for the job. Table 1 shows the key attributes of real-time, micro-batch, and batch inference scenarios.

Real Time Micro Batch Batch
Execution Mode
Synchronous Synchronous/Asynchronous Asynchronous
Prediction Latency
Subsecond Seconds to minutes Indefinite
Data Bounds Unbounded/stream Bounded Bounded
Execution Frequency
Variable Variable Variable/fixed
Invocation Mode
Continuous stream/API calls Event-based Event-based/scheduled
Examples Real-time REST API endpoint Data analyst running a SQL UDF Scheduled inference job

Table 1. Key characteristics of real-time, micro-batch, and batch inference scenarios

Key considerations for batch inference jobs

Batch inference tasks are usually good candidates for horizontal scaling. Each worker within a cluster can operate on a different subset of data without the need to exchange information with other workers. AWS offers multiple storage and compute options that enable horizontal scaling. Table 2 shows some key considerations when architecting for batch inference jobs.

  • Model type and ML framework. Models built with frameworks such as XGBoost and SKLearn require smaller compute instances. Those built with deep learning frameworks, such as TensorFlow and PyTorch require larger ones.
  • Complexity of the model. Simple models can run on CPU instances while more complex ensemble models and large-scale deep learning models can benefit from GPU instances.
  • Size of the inference data. While all approaches work on small datasets, larger datasets come with a unique set of challenges. The storage system must provide sufficient throughput and I/O to reliably run the inference workload.
  • Inference frequency and job concurrency. The volume of jobs within a fixed interval of time is an important consideration to address Service Quotas. The frequency and SLA requirements also proportionally impact the number of concurrent jobs. This might create additional pressure on the underlying Service Quotas.
ML Framework Model Complexity
Inference Data Size
Inference Frequency
Job Concurrency
  • Traditional
    • XGBoost
    • SKLearn
  • Deep Learning
    • Tensorflow
    • PyTorch
  • Low (linear models)
  • Medium (complex ensemble models)
  • High (large scale DL models)
  • Small (<1 GB)
  • Medium (<100 GB)
  • Large (<1 TB)
  • Hyperscale (>1 TB)
  • Hourly
  • Daily
  • Weekly
  • Monthly
  • 1
  • <10
  • <100
  • >100

Table 2. Key considerations when architecting for batch inference jobs

Real world Batch Inference use case and architecture

Often customers in certain domains such as advertising and marketing or healthcare must make predictions on hyperscale datasets. This requires deploying an inference pipeline that can complete several thousand inference jobs on extremely large datasets. The individual models used are typically of low complexity from a compute perspective. They could include a combination of various algorithms implemented in scikit-learn, XGBoost, and TensorFlow, for example. Most of the complexity in these use cases stems from large volumes of data and the number of concurrent jobs that must run to meet the service level agreement (SLA).

The batch inference architecture for these requirements typically is composed of three layers:

  • Orchestration layer. Manages the submission, scheduling, tracking, and error handling of individual jobs or multi-step pipelines
  • Storage layer. Stores the data that will be inferenced upon
  • Compute layer. Runs the inference job

There are several AWS services available that can be used for each of these architectural layers. The architecture in Figure 1 illustrates a real world implementation. Amazon SageMaker Processing and training services are used for compute layer and Amazon S3 for the storage layer. Amazon Managed Workflows for Apache Airflow (MWAA) and Amazon DynamoDB are used for the orchestration and job control layer.

Figure 1. Architecture for batch inference at scale with Amazon SageMaker

Figure 1. Architecture for batch inference at scale with Amazon SageMaker

Orchestration and job control layer. Apache Airflow is used to orchestrate the training and inference pipelines with job metadata captured into DynamoDB. At each step of the pipeline, Airflow updates the status of each model run. A custom Airflow sensor polls the status of each pipeline. It advances the pipeline with the successful completion of each step, or resubmits a job in case of failure.

Compute layer. SageMaker processing is used as the compute option for running the inference workload. SageMaker has a purpose-built batch transform feature for running batch inference jobs. However, this feature often requires additional pre and post-processing steps to get the data into the appropriate input and output format. SageMaker Processing offers a general purpose managed compute environment to run a custom batch inference container with a custom script. In the architecture, the processing script takes the input location of the model artifact generated by a SageMaker training job and the location of the inference data, and performs pre and post-processing along with model inference.

Storage layer. Amazon S3 is used to store the large input dataset and the output inference data. The ShardedByS3Key data distribution strategy distributes the files across multiple nodes within a processing cluster. With this option enabled, SageMaker Processing will automatically copy a different subset of input files into each node of the processing job. This way you can horizontally scale batch inference jobs by requesting a higher number of instances when configuring the job.

One caveat of this approach is that while many ML algorithms utilize multiple CPU cores during training, only one core is utilized during inference. This can be rectified by using Python’s native concurrency and parallelism frameworks such concurrent.futures. The following pseudo-code illustrates how you can distribute the inference workload across all instance cores. This assumes the SageMaker Processing job has been configured to copy the input files into the /opt/ml/processing/input directory.

from concurrent.futures import ProcessPoolExecutor, as_completed
from multiprocessing import cpu_count
import os
from glob import glob
import pandas as pd

def inference_fn(model_dir, file_path, output_dir):

model = joblib.load(f"{model_dir}/model.joblib")
data = pd.read_parquet(file_path)
data["prediction"] = model.predict(data)

output_path = f"{output_dir}/{os.path.basename(file_path)}"

data.to_parquet(output_path)

return output_path

input_files = glob("/opt/ml/processing/input/*")
model_dir = "/opt/ml/model"
output_dir = "/opt/ml/output"

with ProcessPoolExecutor(max_workers=cpu_count()) as executor:
futures = [executor.submit(inference_fn, model_dir, file_path, output_dir) for file in input_files]

results =[]
for future in as_completed(futures):
results.append(future.result())

Conclusion

In this blog post, we described ML inference options and use cases. We primarily focused on batch inference and reviewed key challenges faced when performing batch inference at scale. We provided a mental model of some key considerations and best practices to consider as you make various architecture decisions. We illustrated these considerations with a real world use case and an architecture pattern to perform batch inference at scale. This pattern can be extended to other choices of compute, storage, and orchestration services on AWS to build large-scale ML inference solutions.

More information:

In The Works – AWS Canada West (Calgary) Region

Post Syndicated from Jeff Barr original https://aws.amazon.com/blogs/aws/in-the-works-aws-canada-west-calgary-region/

We launched the Canada (Central) Region in 2016 and added a third Availability Zone in 2020. Since that launch, tens of thousands of AWS customers have used AWS services in Canada to accelerate innovation, increase agility, and to drive cost savings. This includes enterprises such as Air Canada, BMO Financial Group, NHL, Porter Airlines, and Lululemon, as well as startups with global reach such as Benevity, D2L, and Hootsuite. AWS is also used by Athabasca University, Humber College, the Vancouver General Hospital, and the Canada Border Services Agency, to name a few.

Hello, Calgary
I am happy to announce that we will be opening an AWS region in Calgary, Canada in late 2023 or early 2024. This three-AZ region will reduce latency for end-users in Western Canada and will also support the development of advanced, distributed solutions that span multiple AWS regions. It will also provide additional flexibility for AWS customers that need to store and process data within Canada’s borders.

As part of our commitment to running our business in the most environmentally friendly way possible, we are also investing in renewable energy projects in Canada. We currently have two projects underway, both in Alberta: an 80 MW solar farm (announced in April 2021) and a 375 MW solar farm (announced in June 2021). Together, these projects will contribute more than one million MWh to the power grid when they come online in 2022.

This region is part of a planned investment of CAD $4.3 billion over the next 15 years, including data center construction, ongoing utilities and facilities costs, and purchases of goods & services from regional businesses. Our Economic Impact Study (EIS) estimates that the spending on infrastructure and construction over the next 15 years will increase Canada’s GDP by about CAD $4.9 billion, along with direct and indirect economic benefits including nearly 1,000 new full-time equivalent jobs in Canada.

And Then There Were Nine
With this announcement we now have a total of nine regions (Australia, Canada, India, Indonesia, Israel, New Zealand, Spain, Switzerland, and the United Arab Emirates) in the works. As always, you can find the full list of operational and planned regions on the AWS Global Infrastructure page.

— Jeff;


En construction : la Région AWS Canada Ouest (Calgary)

Nous avons inauguré la Région Canada (Centre) en 2016 et ajouté une troisième Zone de disponibilité en 2020. Depuis ce lancement, des dizaines de milliers de clients d’AWS ont utilisé les services d’AWS au Canada pour accélérer l’innovation, améliorer leur agilité et réaliser des économies. Cela inclut des entreprises telles qu’Air Canada, BMO Groupe financier, la LNH, Porter Airlines et Lululemon, en plus d’entreprises en démarrage à portée mondiale telles que Benevity, D2L et Hootsuite. AWS est également utilisé par l’Université Athabasca, le Collège Humber, l’Hôpital général de Vancouver et l’Agence des services frontaliers du Canada, pour ne citer que quelques exemples.

Bonjour Calgary
Je suis heureux d’annoncer que nous allons ouvrir une Région AWS à Calgary, au Canada, à la fin de 2023 ou au début de 2024. Cette Région à trois ZD réduira la latence pour les utilisateurs finaux de l’Ouest canadien et permettra aussi de soutenir le développement de solutions avancées et distribuées couvrant plusieurs Régions AWS. De plus, elle fournira une flexibilité supplémentaire aux clients d’AWS ayant besoin de stocker et traiter des données à l’intérieur des frontières canadiennes.

Dans le cadre de notre engagement à gérer notre entreprise de la manière la plus respectueuse de l’environnement possible, nous investissons également dans des projets d’énergie renouvelable au Canada. Nous avons actuellement deux projets en cours, tous deux situés en Alberta : une ferme solaire de 80 MW (annoncée en avril 2021) et une ferme solaire de 375 MW (annoncée en juin 2021). Lorsqu’ils seront opérationnels en 2022, ces projets apporteront conjointement plus de 1 million de MWh au réseau électrique.

Cette Région fait partie d’un investissement prévu de 4,3 milliards de dollars CAD au cours des 15 prochaines années, comprenant la construction de centres de données, les dépenses opérationnelles liées aux services publics et aux installations, ainsi que les achats de biens et de services auprès d’entreprises régionales. Notre étude d’impact économique (EIE) estime que les dépenses en matière d’infrastructure et de construction au cours des 15 prochaines années augmenteront le PIB du Canada d’environ 4,9 milliards de dollars CAD, en plus des retombées économiques directes et indirectes, dont près de 1 000 nouveaux emplois équivalents temps plein au Canada.

Et en voilà une neuvième
Avec cette annonce, nous avons maintenant un total de neuf Régions en cours de réalisation (Australie, Canada, Inde, Indonésie, Israël, Nouvelle-Zélande, Espagne, Suisse et les Émirats arabes unis). Comme toujours, vous trouverez la liste complète des Régions opérationnelles et planifiées en consultant la page de l’infrastructure mondiale d’AWS.

— Jeff;

[$] Intel AMX support in 5.16

Post Syndicated from original https://lwn.net/Articles/874846/rss

The x86 instruction set is large, but that doesn’t mean it can’t get bigger
yet. Upcoming Intel processors will feature a new set of instructions
under the name of “Advanced Matrix Extensions” (AMX) that can be used to
operate on matrix data. After a somewhat bumpy development
process, support for AMX has found its way into the upcoming 5.16 kernel.
Using it will, naturally, require some changes by application developers.

Sizing Up Post-Quantum Signatures

Post Syndicated from Bas Westerbaan original https://blog.cloudflare.com/sizing-up-post-quantum-signatures/

Sizing Up Post-Quantum Signatures

Sizing Up Post-Quantum Signatures

Quantum computers are a boon and a bane. Originally conceived by Manin and Feyman to simulate nature efficiently, large-scale quantum computers will speed-up innovation in material sciences by orders of magnitude. Consider the technical advances enabled by the discovery of new materials (with bronze, iron, steel and silicon each ascribed their own age!); quantum computers could help to unlock the next age of innovation. Unfortunately, they will also break the majority of the cryptography that’s currently used in TLS to protect our web browsing. They fall in two categories:

  1. Digital signatures, such as RSA, which ensure you’re talking to the right server.
  2. Key exchanges, such as Diffie–Hellman, which are used to agree on encryption keys.

A moderately-sized stable quantum computer will easily break the signatures and key exchanges currently used in TLS using Shor’s algorithm. Luckily this can be fixed: over the last two decades, there has been great progress in so-called post-quantum cryptography. “Post quantum”, abbreviated PQ, means secure against quantum computers. Five years ago, the standards institute NIST started a public process to standardise post-quantum signature schemes and key exchanges. The outcome is expected to be announced early 2022.

At Cloudflare, we’re not just following this process closely, but are also testing the real-world performance of PQ cryptography. In our 2019 experiment with Google, we saw that we can switch to a PQ key exchange with little performance impact. Among the NIST finalists, there are many with even better performance. This is good news, as we would like to switch to PQ key exchanges as soon as possible — indeed, an attacker could intercept sensitive data today, then keep and decrypt it years into the future using a quantum computer.

Why worry about PQ signatures today

One would think we can take it easy with signatures for TLS: we only need to have them replaced before a large quantum computer is built. The situation, however, is more complicated.

  • The lead time to change signatures is higher. Not only do we need to change the browsers and servers, we also need to change certificate authorities (CAs) and everyone’s certificate management.
  • TLS is addicted to small and fast signatures. For this page that you’re viewing we sent six signatures: two in the certificate chain; one handshake signature; one OCSP staple and finally two SCTs used for certificate transparency.
  • PQ signature schemes have wildly varying performance trade-offs and quirks (as we’ll see below) which stack up quickly with six signatures, which all have slightly different requirements.

One might ask: can’t we be clever and get rid of some of these signatures? We think so! For instance, we can replace the handshake signature with a smaller key exchange or suppress intermediate certificates. Such fundamental changes take years to be adopted. That is why we are also investigating the performance of plain TLS with drop-in PQ signatures.

So, what are our options?

The zoo of PQ signatures

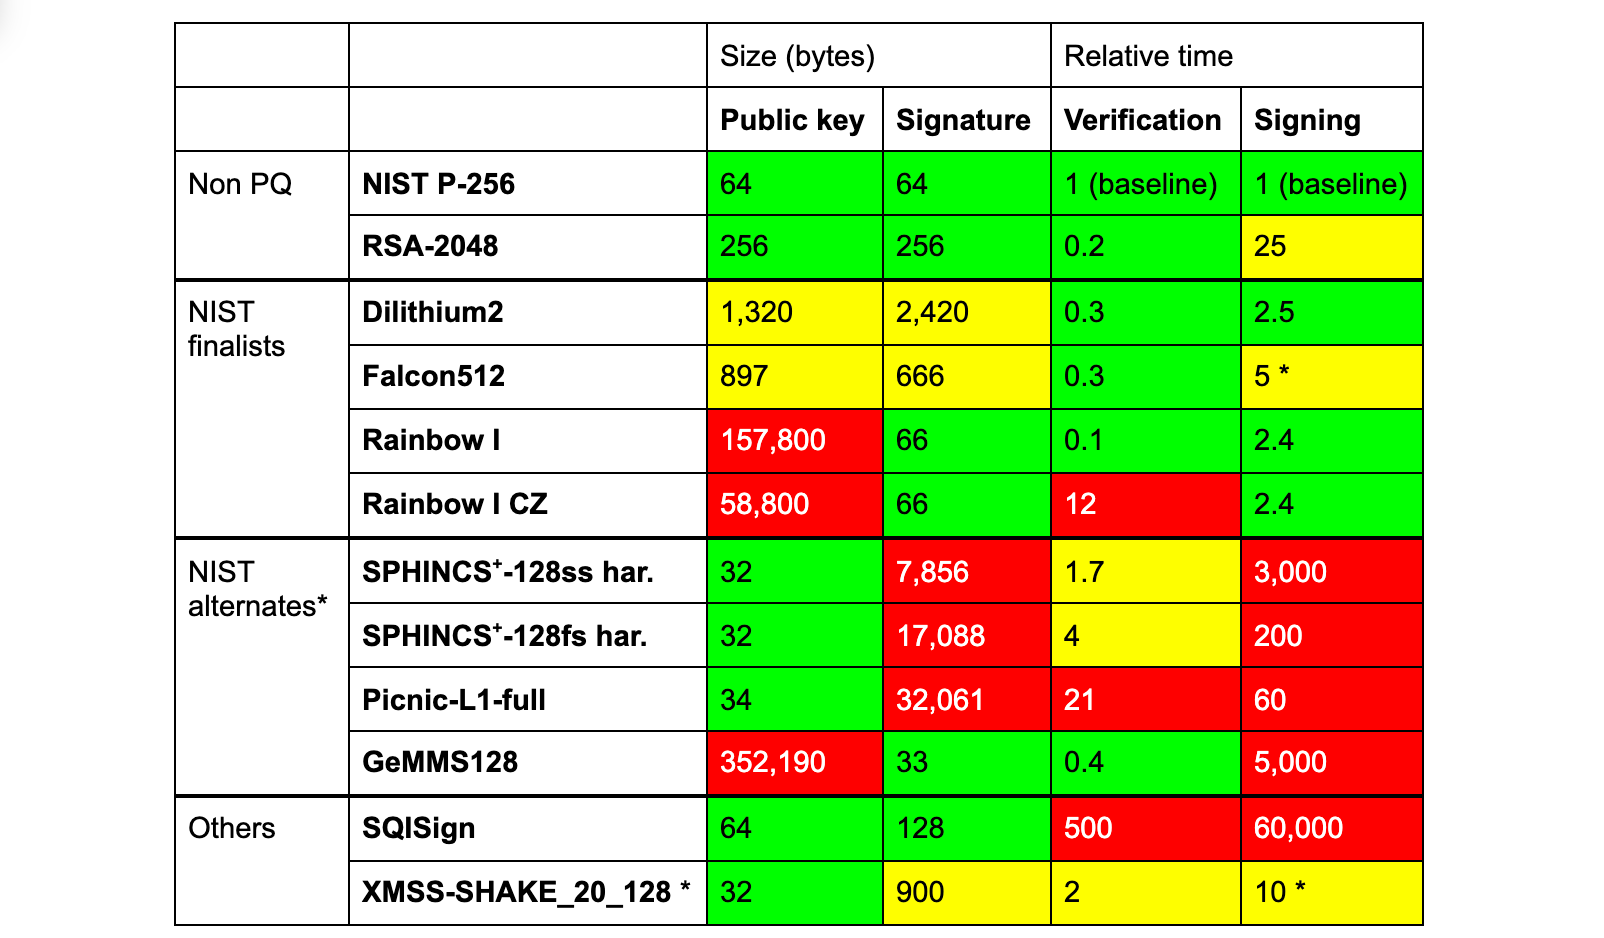
The three finalists of the NIST competition are Dilithium, Falcon and Rainbow. In the table below we compare them against RSA and ECDSA, both of which are in common use today, and a selection of other PQ schemes that might see standardisation in the future.

Sizing Up Post-Quantum Signatures
(* There are many caveats to this table. We compare instances of PQC security level 1. Signing and verification times vary considerably by hardware platform and implementation constraints. They should be taken as a rough indication only. The signing time of Falcon512 is discussed later on. We do not list all relevant variants of the NIST alternates or promising schemes. This instance of XMSS can only sign a million messages, is stateful, requires quite a bit of storage for quick signing, is not standardised and thus far from a drop-in replacement. Rainbow has one other variant, which has smaller private keys.)

None of these PQ signatures are a clear-cut drop-in replacement. To start, all have (much) larger signatures, except for Rainbow, GeMMS and SQISign. Rainbow and GeMMS have huge public keys and SQISign is very slow.

TLS signatures

To confuse matters even more, the signatures within TLS are not all the same:

  • Online. Only the handshake signature is created with every incoming TLS connection, and so signing needs to be fast. Dilithium fits this role well.
  • Offline. All other signatures are made months/years in advance, and so signing time is not that important. This group splits in two:
    • With a public key. The certificate chain includes signatures and their public keys. Here Falcon seems most suited.
    • Without a public key. The remaining three (SCTs and OCSP staple) are just signatures. For these, Rainbow seems optimal, as its large public keys are not transmitted.

Using Dilithium, Falcon, and Rainbow, together, allows optimization for both speed and size simultaneously, which seems like a great idea. However, combining different signatures at the same time has disadvantages:

  • A security issue in the design or implementation of one of the signatures compromises the whole.
  • Clients need to implement multiple cryptographic algorithms, in this case three of them, which is troublesome for smaller devices — especially if separate hardware support is needed for each of them.

So do we really need to eke out every byte and every cycle of performance? Or can we stick to a single signature scheme for simplicity and security?

Can we pick just one?

If we stick to one signature scheme, looking just at the numbers, Falcon512 seems like a reasonable option. It needs 5KB of extra space (compared to a classical handshake), about the same as the Dilithium–Falcon–Rainbow chimera of before. Unfortunately Falcon comes with a caveat: creating signatures efficiently requires constant-time 64-bit floating point arithmetic. Without it, signing is 20x slower. But speed alone is not enough; it has to run in constant time. Without that, one can slowly learn the secret key by measuring the time it takes to create a signature.

Although PCs typically have a sufficiently constant-time floating-point unit, many smaller devices do not. Thus, Falcon seems ill-suited for general purpose online signatures.

What about Dilithium2? It needs 17KB extra — let’s find out if that makes a big difference.

Evidence by Experiment

All the different variables and constraints clearly complicate an already challenging puzzle. The best thing is to just try the options. Over the last few years several interesting papers have appeared studying the various options, such as SKD20, PST20, SKD21 and PKNLN22. These are great starts, but don’t provide a complete picture:

  • SCTs and OCSP staples have yet to be considered. Leaving half (three) of the signatures out changes the results significantly.
  • The networks tested or emulated offer insights, but are far from representative of real-world conditions. All tests were conducted between two datacenters (which does not include real-world last-mile conditions such as Wi-Fi or spotty mobile connections); or a network was simulated with unrealistic packet loss rates.

Here, Cloudflare can contribute. One of the things we like to do is to put new ideas in the community to the test on a global scale.

In this case we’re just taking a first step. Setting up a real-world experiment with a modified browser is quite involved, especially when we consider the many possible variations. Instead, as a first step, we decided first to investigate the most striking variable, the size, and try to answer the question:

How do larger signatures affect the TLS handshake?

There are two parts to this: how fast are they, and, more importantly, do they work at all?

Experimental setup

We need some way to emulate bigger signatures without having to modify the clients. We considered several options. The first idea we had was to pad a valid certificate with a dummy extension. That would require a custom certificate for each size to test, which is cumbersome. Then we considered responding with a dummy ServerHello extension. This is, however, not allowed by TLS 1.2 without a corresponding ClientHello extension. In the end, we went for adding dummy certificates.

Dummy certificates

These dummy certificates are 1kB self-signed invalid certificates that have nothing to do with the certificate chain. To vary the size to test, we simply add more copies. Adding unrelated certificates to the certificate chain is a common misconfiguration and clients have learnt to ignore them. In fact, TLS 1.3 stipulates that these (in rfc-speak) SHOULD be ignored by the client. Testing out hundreds of browsers, we saw no issues.

Standards and reality don’t always agree: when inserting dummy certificates on actual traffic, we saw issues with a small, but not insignificant number of clients. We don’t want to ruin anyone’s connection, and so we decided to use separate connections for this purpose.

Using challenge pages to launch probes

So what did we actually do? On a small percentage of the challenge pages (those with the CAPTCHA), we pick a number n and a random key and send this key in two separate background requests to:

  • 0.tls-size-experiment-c.cloudflareresearch.com
  • [n].tls-size-experiment-1.cloudflareresearch.com

The first, the control, is a normal webpage that stores the TLS handshake time under the key that’s been sent. The real action happens at the second, the live, which adds the n dummy certificates to its chain. The live also stores handshake time under the given key. We could call it “experimental” instead of “live”, but the benign control connection is also an important part of the experiment. Indeed, it allows us to see if live connections are missing. These endpoints were a breeze to write using Cloudflare Workers and KV.

How much dummy data to test?

Before launching the experiment, we tested several libraries and browsers on the live endpoint to see whether they would error due to the dummy certificates. None rejected a single certificate, but how far can we go? TLS 1.3 theoretically allows a certificate chain of 16MB, but in practice many clients reject a much shorter chain. OpenSSL, for instance, rejects one of 102kB. The most stingy we found is Go’s TLS client, which rejects a handshake larger than 64kB. Because of this, we tested with between 1 and 59 dummy certificates.

Intermezzo: TCP’s congestion window

So, what did we find? The graphs are in the next section, have a peek! Before diving right in, we would like to explain a crucial concept, the TCP congestion window, that helps us read the results.

Data sent over the Internet is broken down in packets of around 1.4kB that traverse many routers to reach their destination. Sometimes a router has more incoming packets than it can handle and it has to drop them — this is called congestion. To avoid causing congestion, TCP initially sends just a few packets (typically ten, so ~14kB). Then, with every acknowledgement received in return, the TCP sender will very quickly ramp up the number of packets that it keeps in flight. This number is called the congestion window (cwnd). When it gets too high, congestion occurs, packets are dropped and in response the sender backs off by dialing down the congestion window. Any dropped packet is seen as a sign of congestion by TCP. For this reason, Wi-Fi has its own retransmission mechanism transparent to TCP.

Considering all this, we would expect to see two effects with larger signatures:

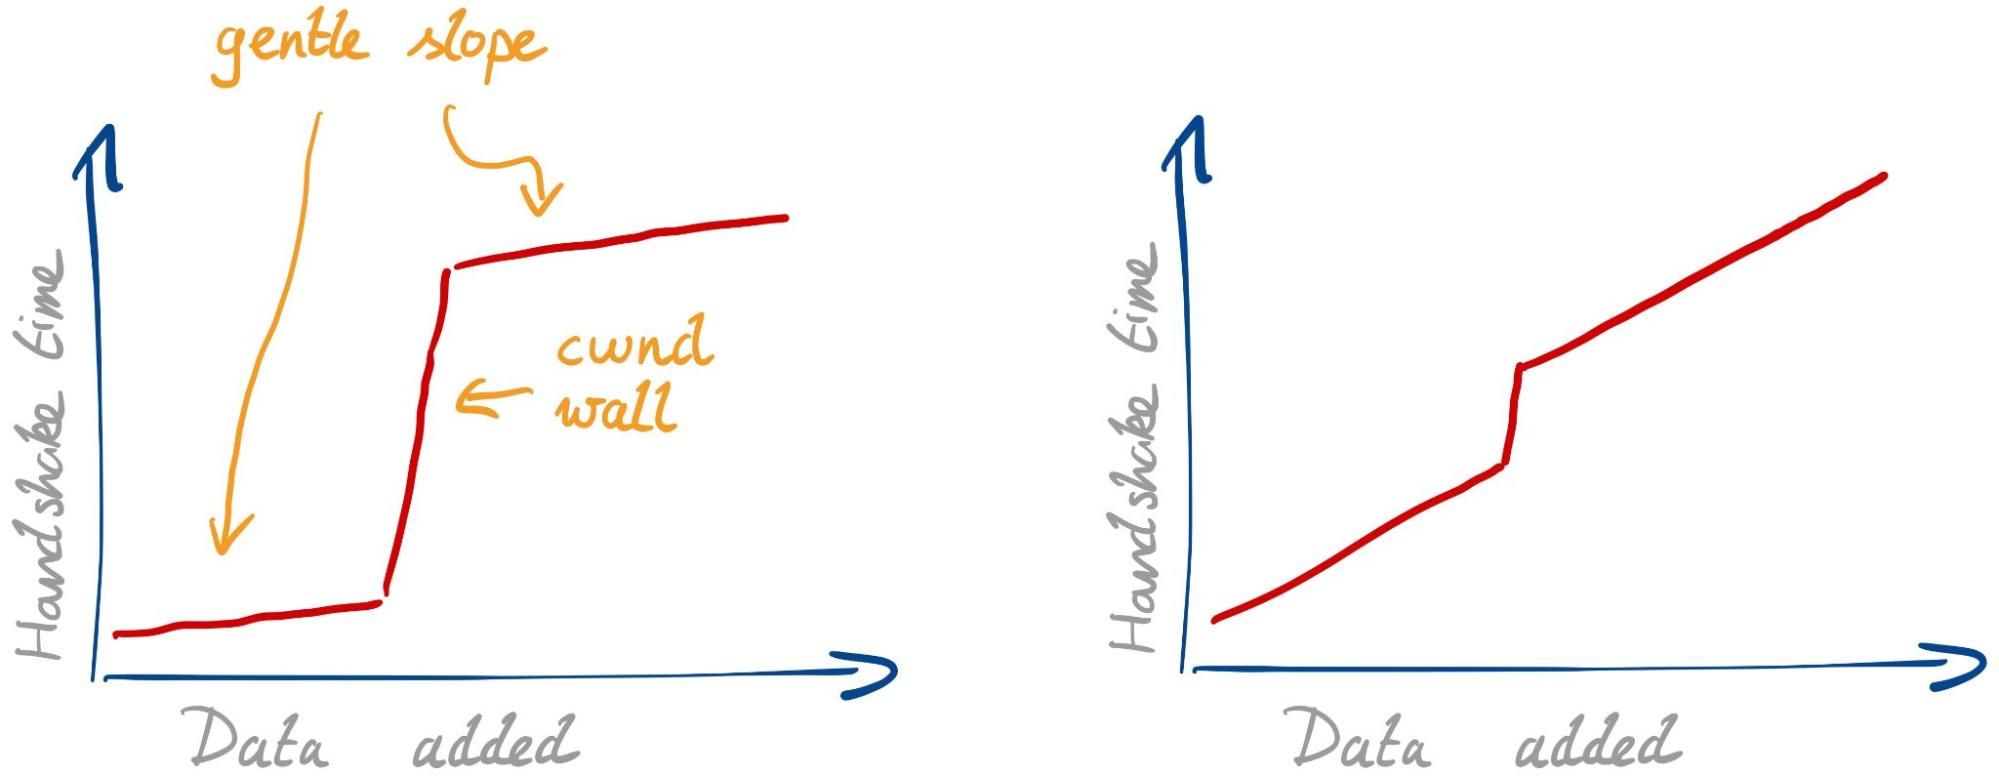
  • Gentle slope. Every single packet needs some extra time to transmit, due to limited bandwidth and possible physical-layer retransmissions. This slope isn’t so gentle if your internet connection is slow or spotty.
  • cwnd wall. Once we fill the congestion window, we have to wait for a whole roundtrip before we can continue. This effect is stronger if the roundtrip time (RTT) is higher.

The strength of the two effects can differ. With a fast connection and high RTT we expect to see the graph below on the left. With a slow connection and low RTT, we expect the one on the right.

Sizing Up Post-Quantum Signatures

There might be other unknown effects. The best thing is to have a look.

In PQ research, the second effect has gained the most attention. The larger signatures simply do not fit in the initial congestion windows used today. A common suggestion in response has been to simply increase the initial congestion window to accommodate the larger signatures. This is far from a simple change to make globally, and we have to understand if this solves the problem to begin with.

Results

Over 24 days we’ve received 964,499 live connections from 454,218 different truncated IPs (to 24 bits, “/24”, for IPv4 and 48 bits for IPv6) and 11,239 different ASNs. First, let’s check how many clients had trouble with the bigger handshakes.

Can clients handle the larger handshakes?

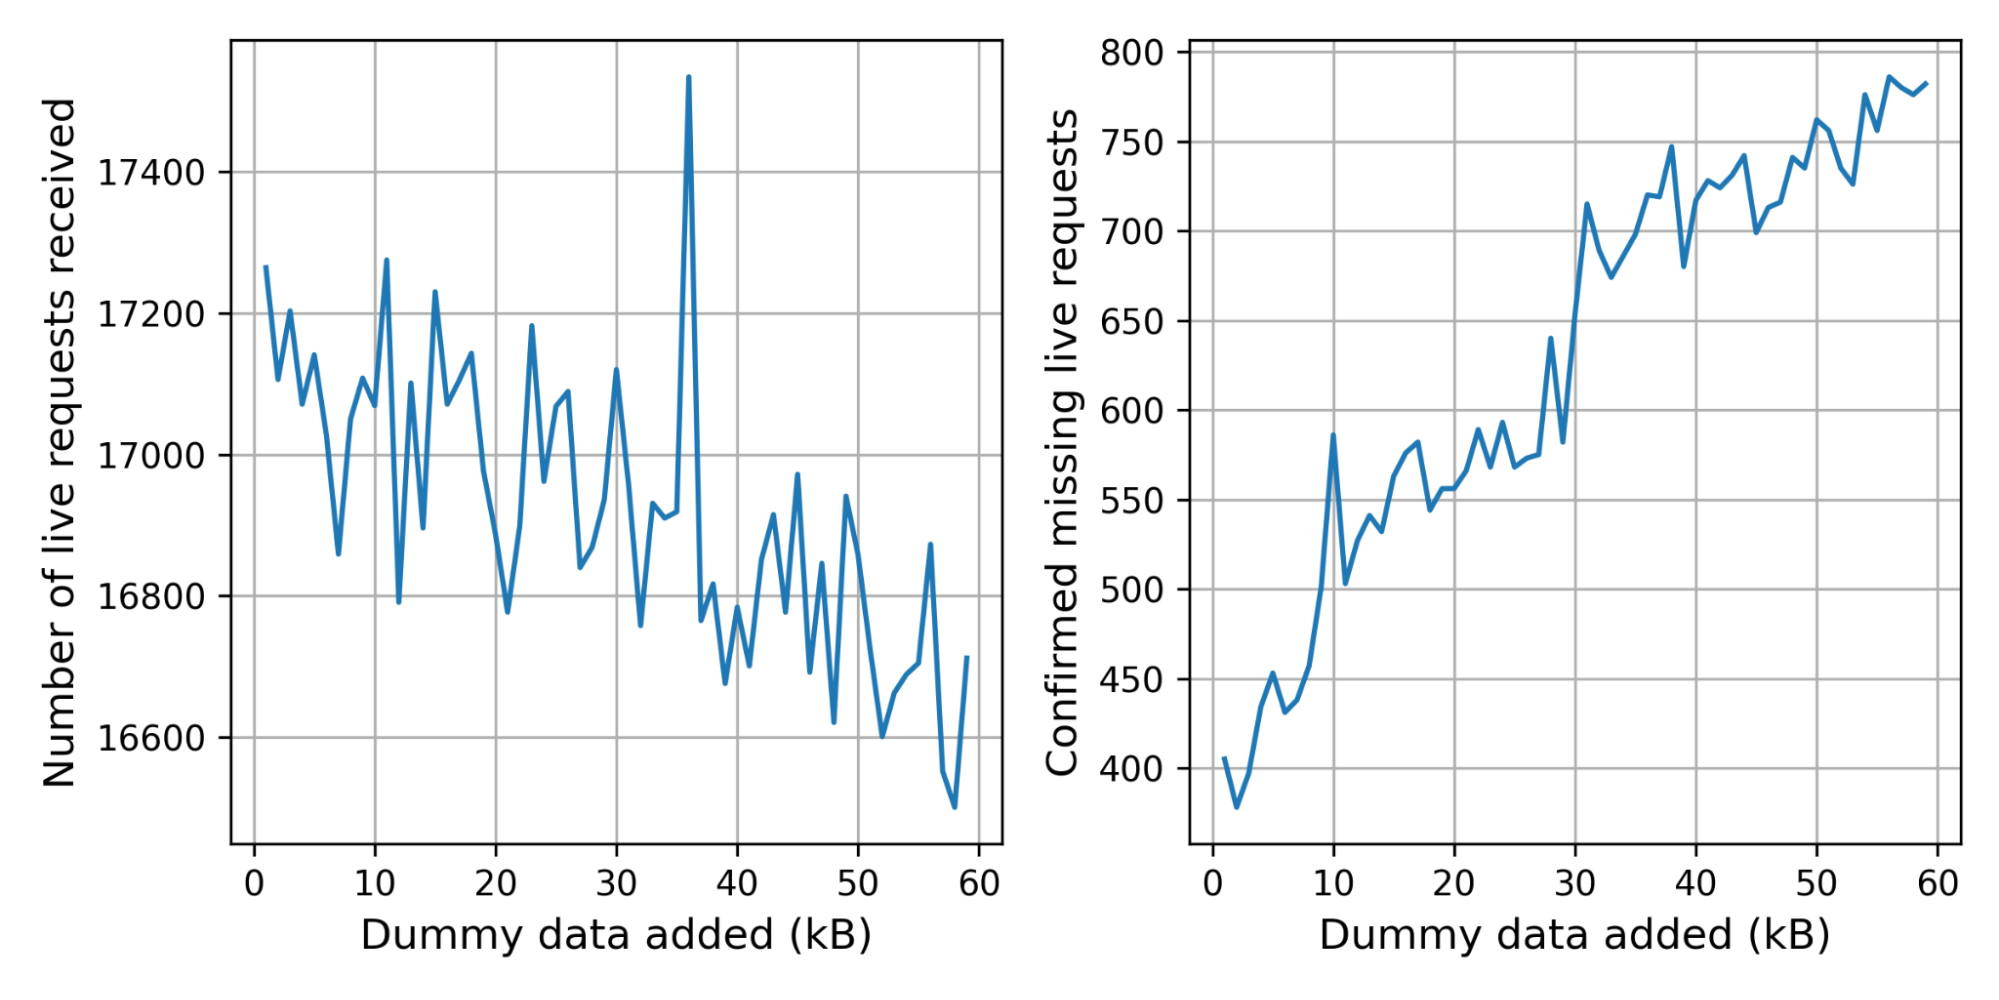
The control connection was missing for 2.4% of the live connections. This is not alarming: we expect some connections to be missing for harmless reasons, such as the user browsing away from the challenge page. There are, however, significantly more live connections without control connection at 3.6%.

In the graph below on the left we break the number of received live connections down by the number of dummy certificates added. Because we pick the number of certificates randomly, the graph is noisy. To get a clearer picture, we started storing the number of certificates added in the corresponding control request, which gives us the graph on the right. The bumps at 10kB and 30kB suggest that there are clients or middleboxes that cannot handle these handshake sizes.

Sizing Up Post-Quantum Signatures

Handshake times with larger signatures

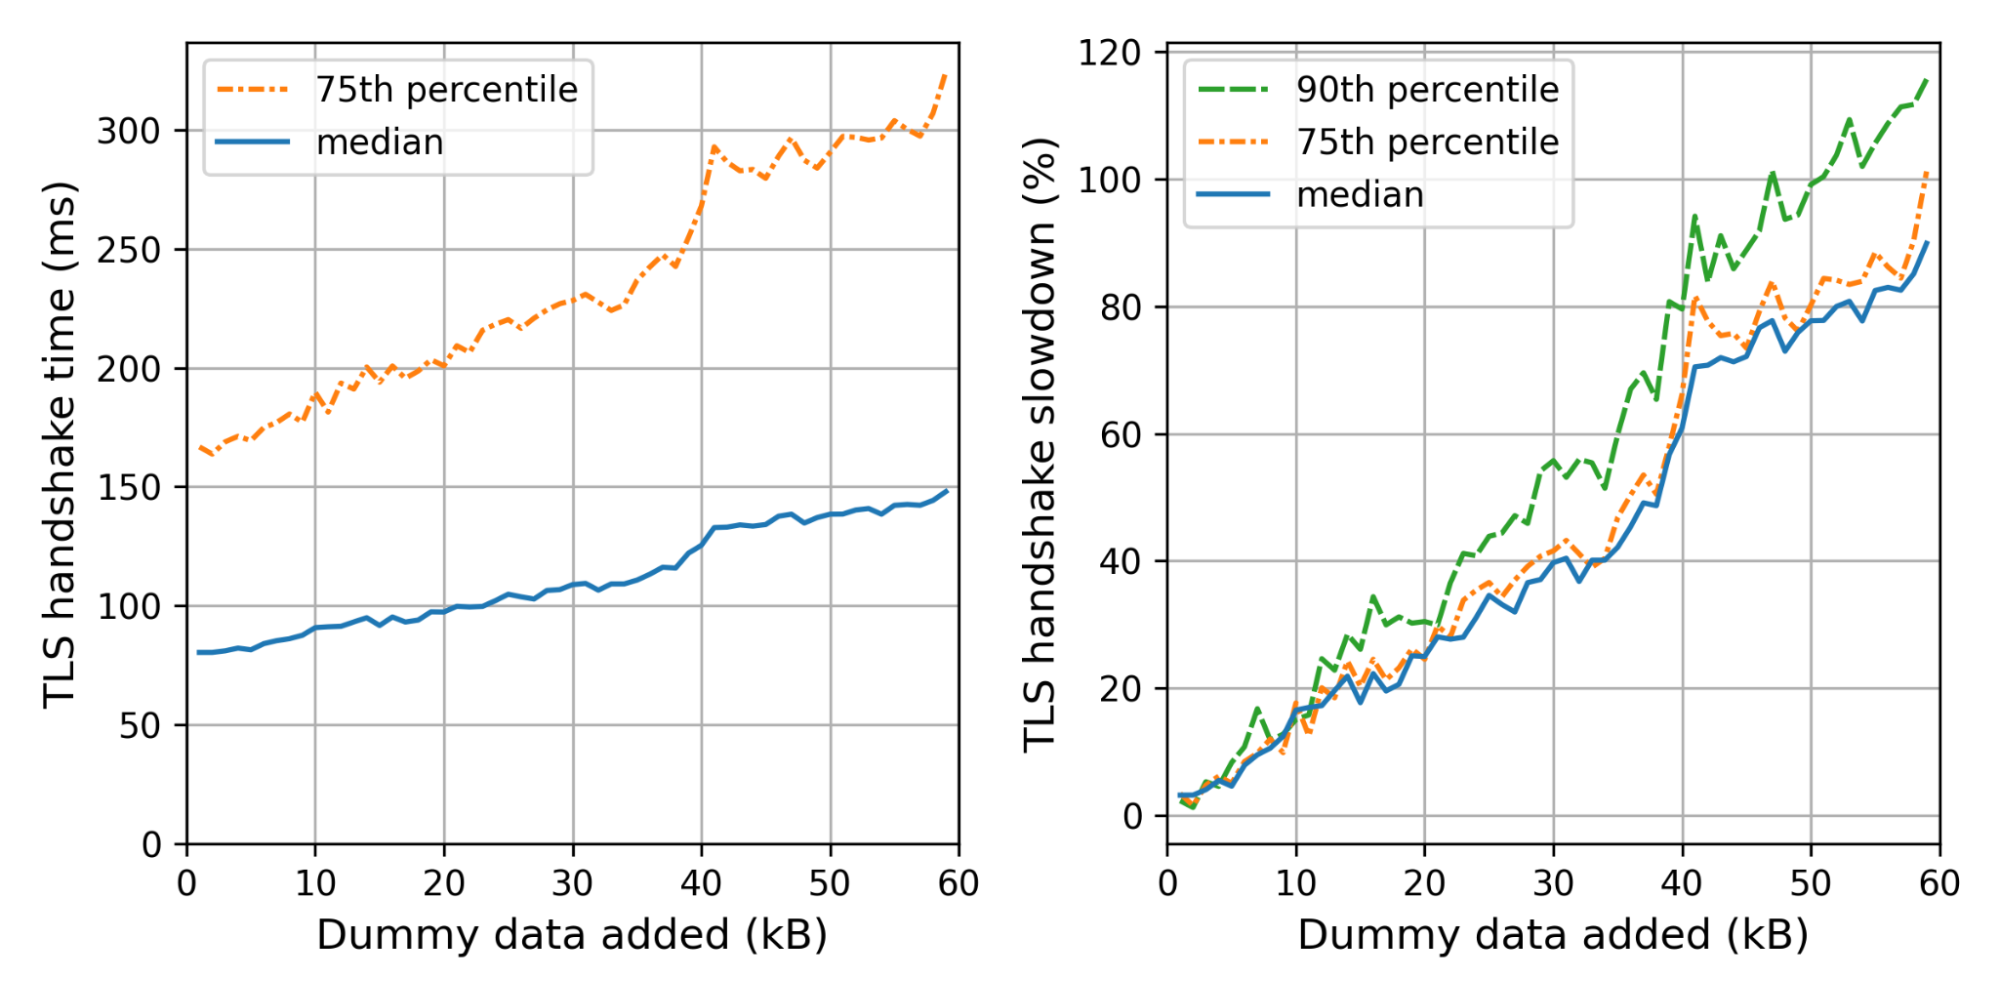
What is the effect on the handshake time? The graph on the left shows the weighted median and 75th percentile TLS handshake times for different amounts of dummy data added. We use the weight so that every truncated IP contributes equally. On the right we show the slowdowns for each size, relative to the handshake time of the control connection.

Sizing Up Post-Quantum Signatures

We can see the not-so-gentle slope until 40kB, where we hit a little wall that corresponds to Cloudflare’s default initial congestion window of 30 packets.

Adding 35kB fits within our initial congestion window. Nonetheless, the median handshake with 35kB extra is 40% slower. The slowest 10% are even worse off, taking 60% as much time. Thus even though we stay within the congestion window, the added data is not for free at all.

We can now translate these insights back to concrete PQ signatures. For example, using Dilithium2 as a drop-in replacement, we need around 17kB extra. That also fits within our initial congestion window with a median slowdown of 20%, which gets worse for the tail-end of users. For the normal initial congestion window of ten, we expect the slowdown to be much worse — around 60–80%.

There are several caveats to point out:

  • These experiments used an initial congestion window of 30 packets instead of ten. With a smaller initial congestion window of ten, which is the default for most systems, we would expect the wall to move from 40kB to around 10kB.
  • Because of our presence all across the world, our RTTs are fairly low. Thus the effect of the cwnd wall is smaller for us.
  • Challenge pages are served, by design, to those clients that we expect to be bots. This adds a significant bias because bots are generally hosted at well-connected providers, and so are closer than users.
  • HTTP/3 was not supported by the server we used for the endpoint. Support for IPv6 was only added ten days into the experiment and accounts for 10.9% of the measurements.
  • Actual TLS handshakes differ in size much more than tested in this setup due to differences in certificate sizes and extensions and other factors.

What have we learned?

The TLS handshake is just one step (~5–20%) in a long chain required to show you a webpage. Casually browsing, it would be hard to notice a TLS handshake that’s 60% slower. But such differences add up. To make a website really fast, you need many seemingly insignificant speedups. Browser developers take this seriously: only in exceptional cases does Chrome allow a change that slows down any microbenchmark by even a percent.

Because of the many parties and complexities involved, we should avoid waiting too long to adopt post-quantum signatures in TLS. That’s a hard sell if it comes at the price of a double-digit slowdown, not least to content servers but also to browser vendors and clients.

A timely adoption of PQ signatures on the web would be great. Our evidence so far suggests that this will be easiest, if six signatures and two public keys would fit in 9kB.

We will continue our efforts to help build a post-quantum secure Internet. To follow along, keep an eye on this blog or have a look at research.cloudflare.com.

Bas Westerbaan is co-submitter of the SPHINCS+ signature scheme.

References

SKD20: Sikeridis, Kampanakis, Devetsikiotis. Assessing the overhead of post-quantum cryptography in TLS 1.3 and SSH. CoNEXT’20.
PST20: Paquin, Stebila, Tamvada. Benchmarking Post-Quantum Cryptography in TLS. PQCrypto 2020.
SKD21: Sikeridis, Kampanakis, Devetsikiotis. Post-Quantum Authentication in TLS 1.3: A Performance Study. NDSS2020.
PKNLN22: Paul, Kuzovkova, Lahr, Niederhagen. Mixed Certificate Chains for the Transition to Post-Quantum Authentication in TLS 1.3. To appear in AsiaCCS 2022.

Security updates for Monday

Post Syndicated from original https://lwn.net/Articles/875420/rss

Security updates have been issued by Debian (containerd, redis, and sqlalchemy), Fedora (kernel, radeontop, rpki-client, and webkit2gtk3), openSUSE (java-1_8_0-openj9, libvirt, mailman, transfig, and webkit2gtk3), Oracle (thunderbird), SUSE (libvirt), and Ubuntu (icu).

Example: forensicating the Mesa County system image

Post Syndicated from original https://blog.erratasec.com/2021/11/example-forensicating-mesa-county.html

Tina Peters, the election clerk in Mesa County (Colorado) went rogue and dumped disk images of an election computer on the Internet. They are available on the Internet via BitTorrent [Mesa1][Mesa2], The Colorado Secretary of State is now suing her over the incident.

The lawsuit describes the facts of the case, how she entered the building with an accomplice on Sunday, May 23, 2021. I thought I’d do some forensics on the image to get more details.

Specifically, I see from the Mesa1 image that she logged on at 4:24pm and was done acquiring the image by 4:30pm, in and (presumably) out in under 7 minutes.

In this blogpost, I go into more detail about how to get that information.

The image

To download the Mesa1 image, you need a program that can access BitTorrent, such as the Brave web browser or a BitTorrent client like qBittorrent. Either click on the “magnet” link or copy/paste into the program you’ll use to download. It takes a minute to gather all the “metadata” associated with the link, but it’ll soon start the download:

What you get is file named EMSSERVER.E01. This is a container file that contains both the raw disk image as well as some forensics metadata, like the date it was collected, the forensics investigator, and so on. This container is in the well-known “EnCase Expert Witness” format. EnCase is a commercial product, but its container format is a quasi-standard in the industry.

Some freeware utilities you can use to open this container and view the disk include “FTK Imager”, “Autopsy”, and on the Linux command line, “ewf-tools”.

However you access the E01 file, what you most want to look at is the Windows operating-system logs. These are located in the directory C:\Windows\system32\winevtx. The standard Windows “Event Viewer” application can load these log files to help you view them.

When inserting a USB drive to create the disk image, these event files will be updated and written to that disk before the image was taken. Thus, we can see in the event files all the events that happen right before the disk image happens.

Disk image acquisition

Here’s what the event logs on the Mesa1 image tells us about the acquisition of the disk image itself.

The person taking the disk image logged in at 4:24:16pm, directly to the console (not remotely), on their second attempt after first typing an incorrect password. The account used was “emsadmin”. Their NTLM password hash is 9e4ec70af42436e5f0abf0a99e908b7a. This is a “role-based” account rather than an individual’s account, but I think Tina Peters is the person responsible for the “emsadmin” roll.

Then, at 4:26:10pm, they connected via USB a Western Digital  “easystore™” portable drive that holds 5-terabytes. This was mounted as the F: drive.

The program “Access Data FTK Imager 4.2.0.13” was run from the USB drive (F:\FTK Imager\FTK Imager.exe) in order to image the system. The image was taken around 4:30pm, local Mountain Time (10:30pm GMT).

It’s impossible to say from this image what happened after it was taken. Presumably, they immediately hit “eject” on the drive, logged off, and disconnected the hard drive. Thus from beginning to end, it took about 7 minutes to take the image once they sat down at the computer.

Dominion Voting Systems

The disk image is that of a an “EMS Server” part of the Dominion Voting Suite. This is a server on an air-gapped network (not connected to any other network) within the count offices.

Most manuals for Colorado are online, though some bits and pieces are missing, and can be found in documents posted to other state’s websites (though each state does things a little different, so such cross referencing can’t be completely trusted).

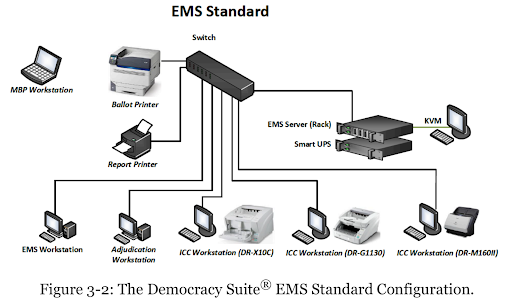
The locked room with an air-gapped network  you see in the Mesa County office appears to look like the following, an “EMS Standard” configuration (EMS stands for Election Management System).

This small network is “air gapped”, meaning there is no connection from this network to any other network in the building, nor out to the Internet. By looking at the logs from the Mesa1 image, we can see what this network looks like:

  • The EMS Server is named “EMSERVER” with IP address 192.168.100.10 and MAC address 44-A8-42-30-01-5D. The hard drive matches Dominion’s specs: a 1-terabyte boot drive (C:) and a 2-terabyte data drive (D:) that is shared with the rest of the network as \\EMSERVER\NAS. This also acts as the network’s DHCP and DNS server.
  • At least one network printer, model Dell E310dw.
  • Two EMS Workstations (EMSCLIENT01 and EMSCLIENT02). This is where users spend most of their time, before an election to create the ballots, and after all the ballots have been counted to construct the final tally.
  • Four ImageCast Central (ICC) (ICC01 – ICC04) scanners, for automatically scanning and tabulating ballots.
  • Two Adjudication Workstations (ADJCLIENT01 and ADJCLIENT03). These are used when the scanners reject ballots, such as when somebody does a write-in candidate, or marks two candidates. Humans need to get involved to make the final judgement on what the ballot actually says.

Note this isn’t the machines you’d expect to see in a precinct when you vote (which would be “ballot marking devices” predominantly). These are the machines in the back office that count the votes and store the official results.

Conclusion

What we see here is that “system logs” can tell us a lot of interesting things about the system. There’s good reason to retain them in the future.

On the other hand, they generally can’t answer the most important question: whether the system was hacked and votes flipped.

Mike Lindell claims to have “Absolute Proof” that Chinese hackers flipped votes throughout the country, including Maricopa County. If so, this would’ve been the system that the Chinese hackers would’ve hacked. Yet, in the system image, there is no evidence of this. By this, I mean the Mesa1 image, the one from before the system logs were deleted (obviously, there would be nothing in the Mesa2 image).

This lack of hacking evidence in the logs isn’t proof that it didn’t happen, though. The fact is, the logs aren’t comprehensive enough to record most hacks, and the hackers could’ve deleted the logs anyway. That’s why system logs aren’t considered “election records” and that laws don’t mandate keeping them: they could have some utility, as I’ve shown above, but they really wouldn’t show the things that we most want to know.

The collective thoughts of the interwebz