Creating static custom domain endpoints with Amazon MQ for RabbitMQ

Post Syndicated from James Beswick original https://aws.amazon.com/blogs/compute/creating-static-custom-domain-endpoints-with-amazon-mq-for-rabbitmq/

This post is written by Nate Bachmeier, Senior Solutions Architect, Wallace Printz, Senior Solutions Architect, Christian Mueller, Principal Solutions Architect.

Many cloud-native application architectures take advantage of the point-to-point and publish-subscribe, or “pub-sub”, model of message-based communication between application components. Not only is this architecture generally more resilient to failure because of the loose coupling and because message processing failures can be retried, it is also more efficient because individual application components can independently scale up or down to maintain message processing SLAs, compared to monolithic application architectures.

Synchronous (REST-based) systems are tightly coupled. A problem in a synchronous downstream dependency has immediate impact on the upstream callers. Retries from upstream callers can fan out and amplify problems.

For applications requiring messaging protocols including JMS, NMS, AMQP, STOMP, MQTT, and WebSocket, Amazon provides Amazon MQ. This is a managed message broker service for Apache ActiveMQ and RabbitMQ that makes it easier to set up and operate message brokers in the cloud.

Amazon MQ provides two managed broker deployment connection options: public brokers and private brokers. Public brokers receive internet-accessible IP addresses while private brokers receive only private IP addresses from the corresponding CIDR range in their VPC subnet. In some cases, for security purposes, customers may prefer to place brokers in a private subnet, but also allow access to the brokers through a persistent public endpoint, such as a subdomain of their corporate domain like ‘mq.example.com’.

This blog explains how to provision private Amazon MQ brokers behind a secure public load balancer endpoint using an example subdomain.

AmazonMQ also supports ActiveMQ – to learn more, read Creating static custom domain endpoints with Amazon MQ to simplify broker modification and scaling.

Overview

There are several reasons one might want to deploy this architecture beyond the security aspects. First, human-readable URLs are easier for people to parse when reviewing operations and troubleshooting, such as deploying updates to ‘mq-dev.example.com’ before ‘mq-prod.example.com’. Additionally, maintaining static URLs for your brokers helps reduce the necessity of modifying client code when performing maintenance on the brokers.

The following diagram shows the solutions architecture. This blog post assumes some familiarity with AWS networking fundamentals, such as VPCs, subnets, load balancers, and Amazon Route 53. For additional information on these topics, see the Elastic Load Balancing documentation.

Reference architecture

  1. The client service tries to connect with a RabbitMQ connection string to the domain endpoint setup in Route 53.
  2. The client looks up the domain name from Route 53, which returns the IP address of the Network Load Balancer (NLB).
  3. The client creates a Transport Layer Security (TLS) connection to the NLB with a secure socket layer (SSL) certificate provided from AWS Certificate Manager (ACM).
  4. The NLB chooses a healthy endpoint from the target group and creates a separate SSL connection. This provides secure, end-to-end SSL encrypted messaging between client and brokers.

To build this architecture, you build the network segmentation first, then add the Amazon MQ brokers, and finally the network routing. You need a VPC, one private subnet per Availability Zone, and one public subnet for your bastion host (if desired).

This demonstration VPC uses the 10.0.0.0/16 CIDR range. Additionally, you must create a custom security group for your brokers. You must set up this security group to allow traffic from your Network Load Balancer to the RabbitMQ brokers.

This example does not use this VPC for other workloads so it allows all incoming traffic that originates within the VPC (which includes the NLB) through to the brokers on the AMQP port of 5671 and the web console port of 443.

Inbound rules

Adding the Amazon MQ brokers

With the network segmentation set up, add the Amazon MQ brokers:

  1. Choose Create brokers on the Active Amazon MQ home page.
  2. Toggle the radio button next to RabbitMQ and choose Next.
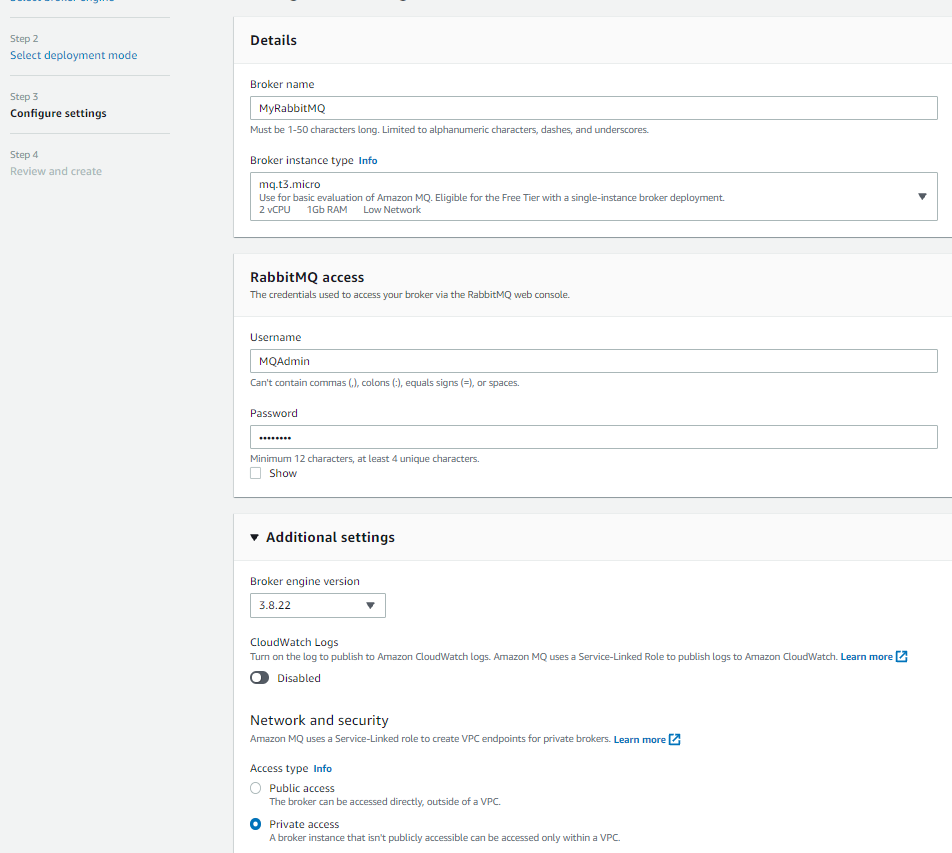
  3. Choose a deployment mode of either single-instance broker (for development environments), or cluster deployment (for production environments).
  4. In Configure settings, specify the broker name and instance type.
  5. Confirm that the broker engine version is 3.8.22 or higher and set Access type to Private access.
    Configure settings page
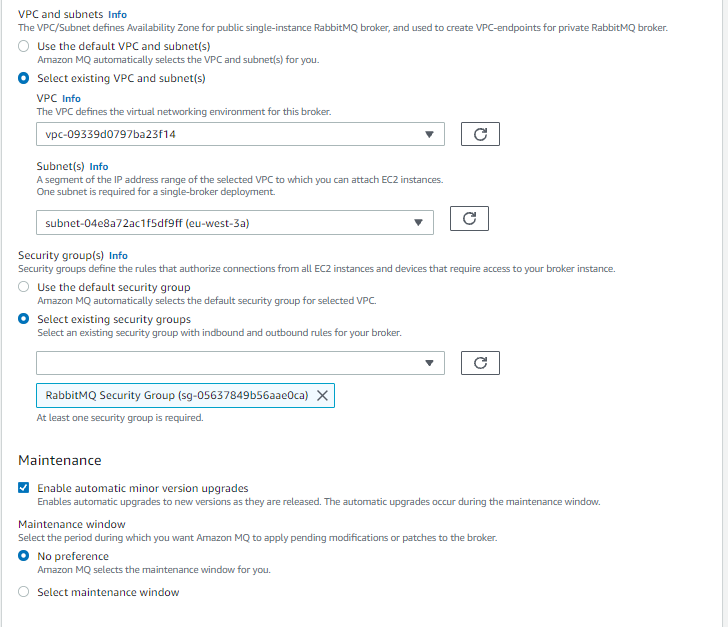
  6. Specify the VPC, private subnets, and security groups before choosing Next.
    Additional settings

Finding the broker’s IP address

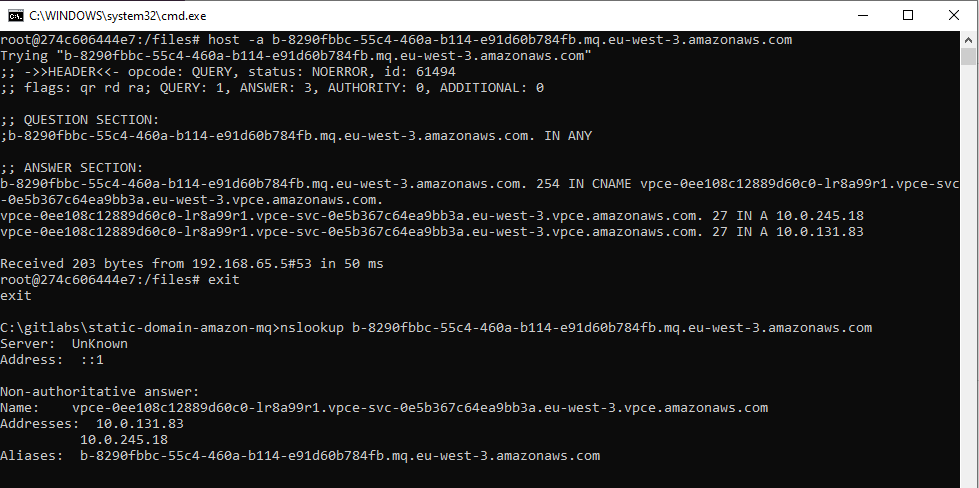
Before configuring the NLB’s target groups, you must look up the broker’s IP address. Unlike Amazon MQ for Apache ActiveMQ, RabbitMQ does not show its private IP addresses, though you can reliably find its VPC endpoints using DNS. Amazon MQ creates one VPC endpoint in each subnet with a static address that won’t change until you delete the broker.

  1. Navigate to the broker’s details page and scroll to the Connections panel.
  2. Find the endpoint’s fully qualified domain name. It is formatted like broker-id.mq.region.amazonaws.com.
  3. Open a command terminal on your local workstation.
  4. Retrieve the ‘A’ record values using the host (Linux) or nslookup (Windows) command.
  5. Record these values for the NLB configuration steps later.
    Terminal results

Configure the load balancer’s target group

The next step in the build process is to configure the load balancer’s target group. You use the private IP addresses of the brokers as targets for the NLB. Create a Target Group, select the target type as IP, and make sure to choose the TLS protocol and for each required port, as well as the VPC your brokers reside in.
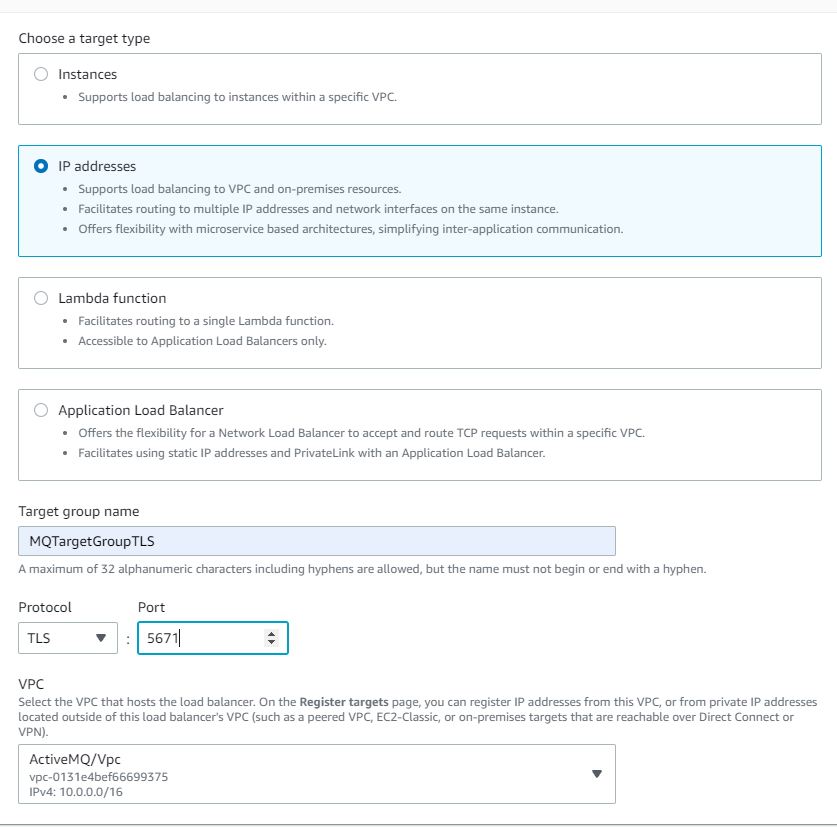
Choose a target type

It is important to configure the health check settings so traffic is only routed to active brokers. Select the TCP protocol and override the health check port to 443 Rabbit MQ’s console port. Also, configure the healthy threshold to 2 with a 10-second check interval so the NLB detects faulty hosts within 20 seconds.

Be sure not to use RabbitMQ’s AMQP port as the target group health check port. The NLB may not be able to recognize the host as healthy on that port. It is better to use the broker’s web console port.
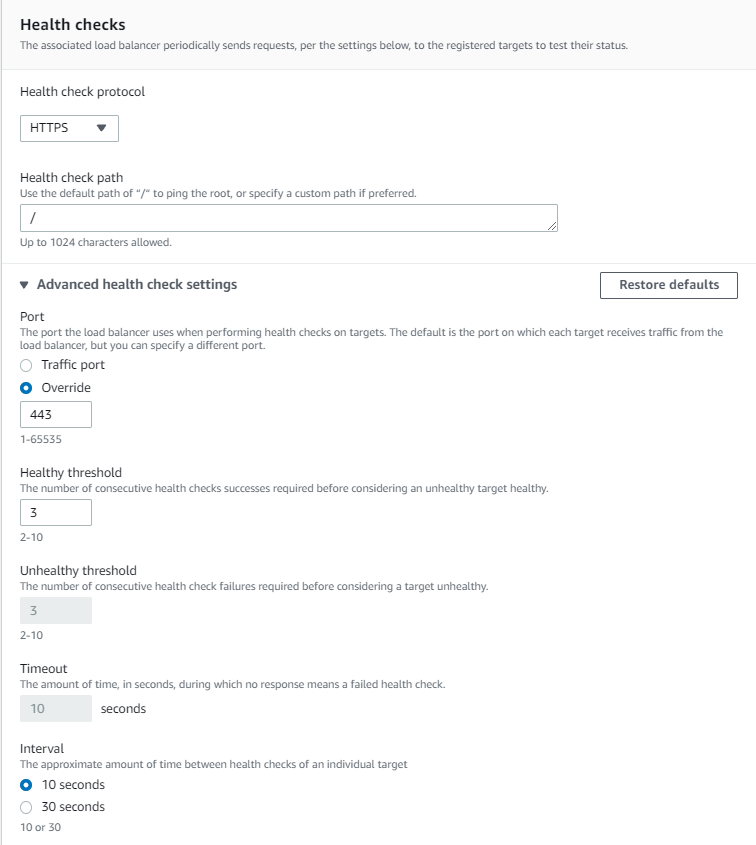
Health checks

Add the VPC endpoint addresses as NLB targets. The NLB routes traffic across the endpoints and provides networking reliability if an AZ is offline. Finally, configure the health checks to use the web console (TCP port 443).

Specify IPs and ports

Creating a Network Load Balancer

Next, you create a Network Load Balancer. This is an internet-facing load balancer with TLS listeners on port 5671 (AMQP), routing traffic to the brokers’ VPC and private subnets. You select the target group you created, selecting TLS for the connection between the NLB and the brokers. To allow clients to connect to the NLB securely, select an ACM certificate for the subdomain registered in Route 53 (for example ‘mq.example.com’).

To learn about ACM certificate provisioning, read more about the process here. Make sure that the ACM certificate is provisioned in the same Region as the NLB or the certificate is not shown in the dropdown menu.
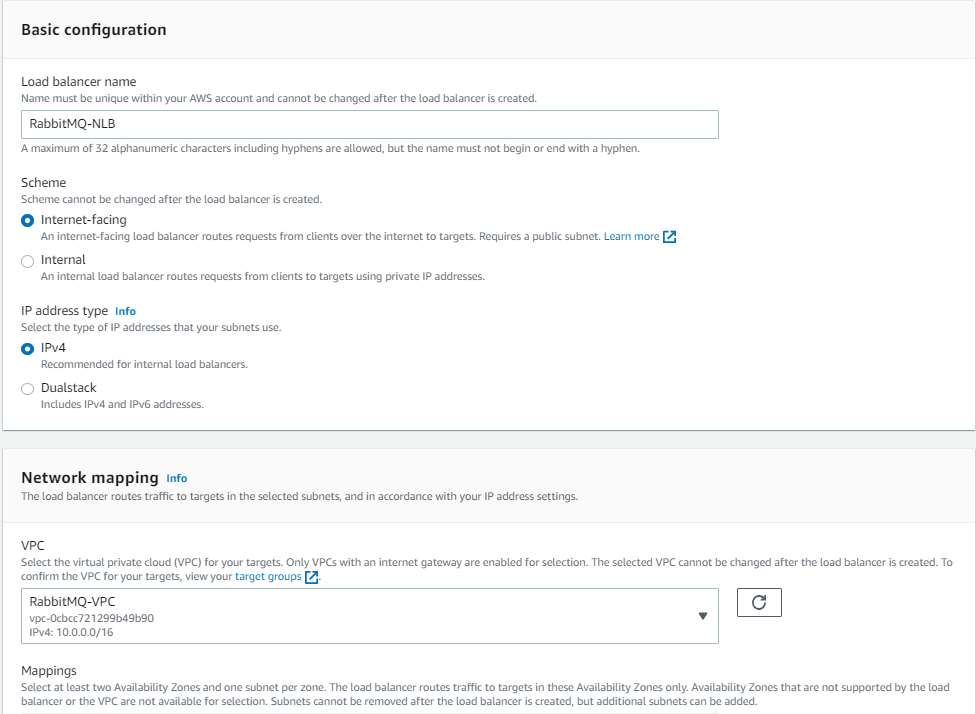
Basic configuration page

Optionally configure IP filtering

The NLB is globally accessible and this may be overly permissive for some workloads. You can restrict incoming traffic to specific IP ranges on the NLB’s public subnet by using network access control list (NACL) configuration:

  1. Navigate to the AWS Management Console to the VPC service and choose Subnets.
  2. Select your public subnet and then switch to the Network ACL tab.
  3. Select the link to the associated network ACL (e.g., acl-0d6fxxxxxxxx) details.
  4. Activate this item and choose Edit inbound rules in the Action menu.
  5. Specify the desired IP range and then choose Save changes.
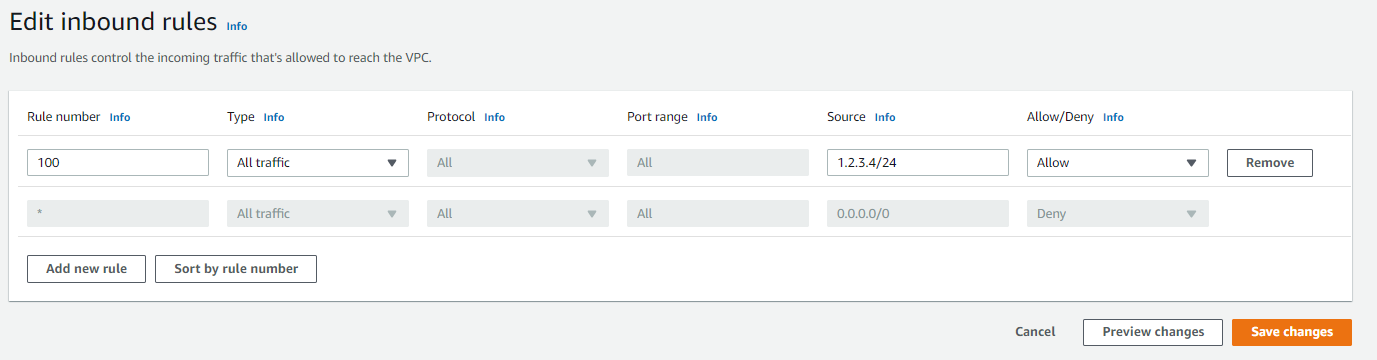
Edit inbound rules

Configuring Route 53

Finally, configure Route 53 to serve traffic at the subdomain of your choice to the NLB:

  1. Go to the Route 53 hosted zone and create a new subdomain record set, such as mq.example.com, that matches the ACM certificate that you previously created.
  2. In the “type” field, select “A – IPv4 address”, then select “Yes” for alias. This allows you to select the NLB as the alias target.
  3. Select from the alias target menu the NLB you just created and save the record set.
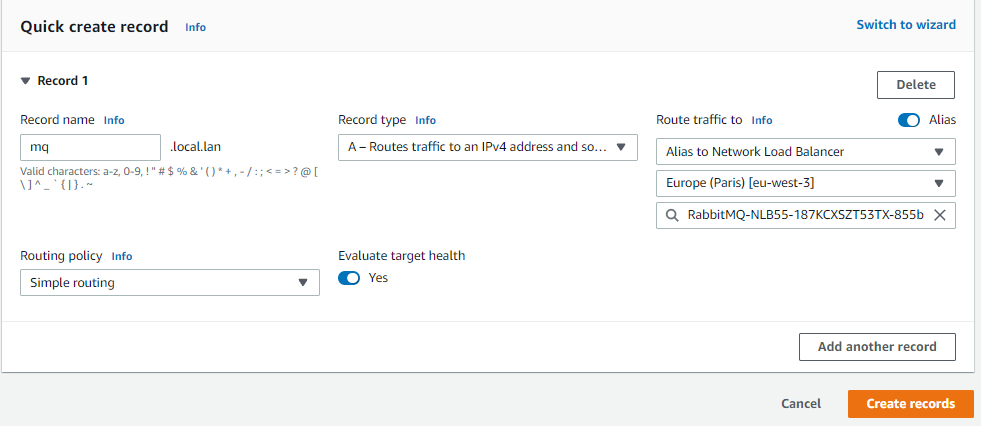
Quick create record

Now callers can use the friendly name in the RabbitMQ connection string. This capability improves the developer experience and reduces operational cost when rebuilding the cluster. Since you added multiple VPC endpoints (one per subnet) into the NLB’s target group, the solution has Multi-AZ redundancy.

Testing with a RabbitMQ client process

The entire process can be tested using any RabbitMQ client process. One approach is to launch the official Docker image and connect with the native client. The service documentation also provides sample code for authenticating, publishing, and subscribing to RabbitMQ channels.

To log in to the broker’s RabbitMQ web console, there are three options. Due to the security group rules, only traffic originating from inside the VPC is allowed to the brokers:

  1. Use a VPN connection from your corporate network to the VPC. Many customers use this option but for rapid testing, there is a simpler and more cost-effective method.
  2. Connect to the brokers’ web console through your Route 53 subdomain, which requires creating a separate web console port listener (443) on the existing NLB and creating a separate TLS target group for the brokers.
  3. Use a bastion host to proxy traffic to the web console.

RabbitMQ

Conclusion

In this post, you build a highly available Amazon MQ broker in a private subnet. You layer security by placing the brokers behind a highly scalable Network Load Balancer. You configure routing from a single custom subdomain URL to multiple brokers with a built-in health check.

For more serverless learning resources, visit Serverless Land.

Security updates for Tuesday

Post Syndicated from original https://lwn.net/Articles/875531/rss

Security updates have been issued by Arch Linux (firefox, grafana, jenkins, opera, and thunderbird), Debian (botan1.10 and ckeditor), openSUSE (chromium, kernel, qemu, and rubygem-activerecord-5_1), SUSE (qemu and rubygem-activerecord-5_1), and Ubuntu (docker.io, kernel, linux, linux-aws, linux-aws-5.11, linux-azure, linux-azure-5.11, linux-gcp, linux-gcp-5.11, linux-hwe-5.11, linux-kvm, linux-oem-5.13, linux-oracle, linux-oracle-5.11, linux, linux-aws, linux-aws-5.4, linux-azure, linux-azure-5.4, linux-gcp, linux-gcp-5.4, linux-gke, linux-gkeop, linux-gkeop-5.4, linux-hwe-5.4, linux-ibm, linux-kvm, and linux, linux-aws, linux-aws-hwe, linux-azure, linux-azure-4.15, linux-dell300x, linux-gcp-4.15, linux-hwe, linux-kvm, linux-oracle, linux-raspi2, linux-snapdragon).

Running a Cost-effective NLP Pipeline on Serverless Infrastructure at Scale

Post Syndicated from Eitan Sela original https://aws.amazon.com/blogs/architecture/running-a-cost-effective-nlp-pipeline-on-serverless-infrastructure-at-scale/

Amenity Analytics develops enterprise natural language processing (NLP) platforms for the finance, insurance, and media industries that extract critical insights from mountains of documents. We provide a scalable way for businesses to get a human-level understanding of information from text.

In this blog post, we will show how Amenity Analytics improved the continuous integration (CI) pipeline speed by 15x. We hope that this example can help other customers achieve high scalability using AWS Step Functions Express.

Amenity Analytics’ models are developed using both a test-driven development (TDD) and a behavior-driven development (BDD) approach. We verify the model accuracy throughout the model lifecycle—from creation to production, and on to maintenance.

One of the actions in the Amenity Analytics model development cycle is backtesting. It is an important part of our CI process. This process consists of two steps running in parallel:

  • Unit tests (TDD): checks that the code performs as expected
  • Backtesting tests (BDD): validates that the precision and recall of our models is similar or better than previous

The backtesting process utilizes hundreds of thousands of annotated examples in each “code build.” To accomplish this, we initially used the AWS Step Functions default workflow. AWS Step Functions is a low-code visual workflow service used to orchestrate AWS services, automate business processes, and build serverless applications. Workflows manage failures, retries, parallelization, service integrations, and observability.

Challenge with the existing Step Functions solution

We found that Step Functions standard workflow has a bucket of 5,000 state transitions with a refill rate of 1,500. Each annotated example has ~10 state transitions. This creates millions of state transitions per code build. Since state transitions are limited and couldn’t be increased to our desired amount, we often faced delays and timeouts. Developers had to coordinate their work with each other, which inevitably slowed down the entire development cycle.

To resolve these challenges, we migrated from Step Functions standard workflows to Step Functions Express workflows, which have no limits on state transitions. In addition, we changed the way each step in the pipeline is initiated, from an async call to a sync API call.

Step Functions Express workflow solution

When a model developer merges their new changes, the CI process starts the backtesting for all existing models.

  • Each model is checked to see if the annotated examples were already uploaded and saved in the Amazon Simple Storage Service (S3) cache. The check is made by a unique key representing the list of items. Once a model is reviewed, the review items will rarely be changed.
  • If the review items haven’t been uploaded yet, it uploads them and initiates an unarchive process. This way the review items can be used in the next phase.
  • When the items are uploaded, an API call is invoked using Amazon API Gateway with the review items keys, see Figure 1.
  • The request is forwarded to an AWS Lambda function. It is responsible for validating the request and sending a job message to an Amazon Simple Queue Service (SQS) queue.
  • The SQS messages are consumed by concurrent Lambda functions, which synchronously invoke a Step Function. The number of Lambda functions are limited to ensure that they don’t exceed their limit in the production environment.
  • When an item is finished in the Step Function, it creates an SQS notification message. This message is inserted into a queue and consumed as a message batch by a Lambda function. The function then sends an AWS IoT message containing all relevant messages for each individual user.
Figure 1. Step Functions Express workflow solution

Figure 1. Step Functions Express workflow solution

Main Step Function Express workflow pipeline

Step Functions Express supports only sync calls. Therefore, we replaced the previous async Amazon Simple Notification Service (SNS) and Amazon SQS, with sync calls to API Gateway.

Figure 2 shows the workflow for a single document in Step Function Express:

  1. Generate a document ID for the current iteration
  2. Perform base NLP analysis by calling another Step Function Express wrapped by an API Gateway
  3. Reformat the response to be the same as all other “logic” steps results
  4. Verify the result by the “Choice” state – if failed go to end, otherwise, continue
  5. Perform the Amenity core NLP analysis in three model invocations: Group, Patterns, and Business Logic (BL)
  6. For each of the model runtime steps:
    • Check if the result is correct
    • If failed, go to end, otherwise continue
  7. Return a formatted result at the end
Figure 2. Workflow for a single document

Figure 2. Workflow for a single document

Base NLP analysis Step Function Express

For our base NLP analysis, we use Spacy. Figure 3 shows how we used it in Step Functions Express:

  1. Confirm if text exists in cache (this means it has been previously analyzed)
  2. If it exists, return the cached result
  3. If it doesn’t exist, split the text to a manageable size (Spacy has text size limitations)
  4. All the texts parts are analyzed in parallel by Spacy
  5. Merge the results into a single, analyzed document and save it to the cache
  6. If there was an exception during the process, it is handled in the “HandleStepFunctionExceptionState”
  7. Send a reference to the analyzed document if successful
  8. Send an error message if there was an exception
Figure 3. Base NLP analysis for a single document

Figure 3. Base NLP analysis for a single document

Results

Our backtesting migration was deployed on August 10, and unit testing migration on September 14. After the first migration, the CI was limited by the unit tests, which took ~25 minutes. When the second migration was deployed, the process time was reduced to ~6 minutes (P95).

Figure 4. Process time reduced from 50 minutes to 6 minutes

Figure 4. Process time reduced from 50 minutes to 6 minutes

Conclusion

By migrating from standard Step Functions to Step Functions Express, Amenity Analytics increased processing speed 15x. A complete pipeline that used to take ~45 minutes with standard Step Functions, now takes ~3 minutes using Step Functions Express. This migration removed the need for users to coordinate workflow processes to create a build. Unit testing (TDD) went from ~25 mins to ~30 seconds. Backtesting (BDD) went from taking more than 1 hour to ~6 minutes.

Switching to Step Functions Express allows us to focus on delivering business value faster. We will continue to explore how AWS services can help us drive more value to our users.

For further reading:

InsightIDR Was XDR Before XDR Was Even a Thing: An Origin Story

Post Syndicated from Sam Adams original https://blog.rapid7.com/2021/11/09/insightidr-was-xdr-before-xdr-was-even-a-thing-an-origin-story/

InsightIDR Was XDR Before XDR Was Even a Thing: An Origin Story

An origin story explains who you are and why. Spiderman has one. So do you.

Rapid7 began building InsightIDR in 2013. It was the year Yahoo’s epic data breach exposed the names, dates of birth, passwords, and security questions and answers of 3 billion users.

Back then, security professionals simply wanted data. If somebody could just ingest it all and send it, they’d take it from there. So the market focused on vast quantities of data — data first, most of it noisy and useless. Rapid7 went a different way: detections first.

We studied how the bad guys attacked networks and figured out what we needed to find them (with the help of our friends on the Metasploit project). Then we wrote and tested those detections, assembled a library, and enabled users to tune the detections to their environments. It sounds so easy now, in this short paragraph, but of course it wasn’t.

At last, in 2015, we sat down with industry analysts right before launch. Questions flew.

“You’re calling it InsightIDR? What does IDR stand for?”

Incident. Detection. Response.

And that’s when the tongue-lashing started. It went something like this: “Incident Detection and Response is a market category, not a product! You need 10 different products to actually do that! It’s too broad! You’re trying to do too much!”  

And then the coup de grace: “Your product name is stupid.”

InsightIDR got off to a gloomy and also awesome start

When you’re trying to be disruptive, the scariest thing is quiet indifference. Any big reaction is great, even if you get called wrong. So we thought maybe we were onto something.

At that time, modern workers were leaving more ways to find them online: LinkedIn, Facebook, Gmail. Attackers found them. We all became targets. There were 4 billion data records taken in 2016, nearly all because of stolen passwords or weak, guessable ones. Of course, intruders masquerading as employees were not caught by traditional monitoring. While it’s a fine idea to set password policy and train employees in security hygiene, we decided to study human nature rather than try to change it.  

At the heart of what we were doing was a new way of tracking activity, and condensing noisy data into meaningful events. With User and Entity Behavior Analytics (UEBA), InsightIDR continuously baselines “normal” user behavior so it spots anomalies, risks, and ultimately malicious behavior fast, helping you break the attack chain.

But UEBA is only part of a detection and response platform. So we added traditional SIEM capabilities like our proprietary data lake technology (that has allowed us to avoid the ingestion-based pricing that plagues the market), file integrity monitoring and compliance dashboards and reports.

We also added some not-so-traditional capabilities like Attacker Behavior Analytics and Endpoint Detection and Response. EDR was ready for its own disruption. EDR vendors continue to be focused on agent data collection. But we decided years ago that detection engineering and curation — zeroing in on evil — is the way to do EDR.

Turns out InsightIDR wasn’t doing “too much” — it was doing XDR

In 2017, we added security orchestration and automation to the Insight platform. XDR is all about analyst efficiency and for that you need more and more automation. Next, our own Network Sensor and full SOAR capabilities took even more burden off analysts. The visibility triad was soon complete when we added network detection and response.

Some time the following year, the founder and CTO of Palo Alto Networks coined the acronym “XDR” to explain the “symphony” that great cybersecurity would require. (Hey, at least we had a name for it now.)

Then, in 2021, three things happened.

First, Rapid7 acquired Velociraptor, an open-source platform focused on endpoint monitoring, digital forensics, and incident response. (We’ve been committed to open source since 2009, when we acquired Metasploit, now the world’s most used penetration testing network with a community of collaborators 300,000 strong.)

Second, with perimeters so stretched they broke, we acquired IntSights. Customers now benefit from unrivaled internal and external threat intelligence, covering the clear, deep, and dark web. We’ll compare InsightIDR’s high-fidelity alerts and signal-to-noise ratio to anyone’s.

Third and finally, XDR became all the buzz. Seriously, not a day, a conference, or a trade pub goes by. The buzz includes debate about the exact definition of XDR, speculation that it’s more buzz than bona fide, and concern that XDR could move very quickly through the Gartner Hype Cycle straight to the “Trough of Disillusionment.”

InsightIDR gives you the freedom to focus on what matters most

In a recent survey of customers in the Rapid7 Voice program (a group that provides input as we develop new ideas) 42% said they’re using InsightIDR to achieve XDR outcomes right now. I listened to one say he’s always surprised at the buzz and debate at conferences: don’t you know you can already do this stuff? I do this stuff!

By the way, he’s working entirely alone, a one-man show for a NASDAQ-listed global company in the health sector (a pretty hot target these days). Can XDR help with the industry’s skills gap problem, now in its fifth year? That’s for another blog.

For now, please download our eBook: “4 Ways XDR Levels Up Security Programs.” It’s a speedy education that comes from long experience. Happy reading.

A Brief History of the Meris Botnet

Post Syndicated from Vivek Ganti original https://blog.cloudflare.com/meris-botnet/

A Brief History of the Meris Botnet

A Brief History of the Meris Botnet

Meris first got our attention due to an exceptionally large 17.2 million requests per second (rps) DDoS attack that it launched against one of our customers. This attack, along with subsequent attacks originated by the Meris botnet, was automatically detected and mitigated by our DDoS protection systems. Cloudflare customers, even ones on the free plan, are protected against Meris attacks.

Over the past months, we’ve been tracking and analyzing the activity of the Meris botnet. Some main highlights include:

  • Meris targets approximately 50 different websites every single day with a daily average of 104 unique DDoS attacks.
  • More than 33% of all Meris DDoS attack traffic targeted China-based websites.
  • More than 12% of all websites that were attacked by Meris are operated by US-based companies.

View more Meris attack insights and trends in the interactive Radar dashboard.

So what is Meris?

Meris (Latvian for plague) is the name of an active botnet behind a series of recent DDoS attacks that have targeted thousands of websites around the world. It was originally detected in late June 2021 by QRator in joint research they conducted with Yandex. Their initial research identified 30,000 to 56,000 bots, but they estimated that the numbers are actually much higher, in the ballpark of 250,000 bots.

The Meris botnet is formed of infected routers and networking hardware manufactured by the Latvian company MikroTik. According to MikroTik’s blog, the attackers exploited a vulnerability in the router’s operating system (RouterOS) which enabled attackers to gain unauthenticated remote access to read and write arbitrary files (CVE-2018-14847).

RouterOS is the router operating system that’s used by MikroTik’s routers and the RouterBOARD hardware product family, which can also be used to turn any PC into a router. Administration of RouterOS can be done either via direct SSH connection or by using a configuration utility called WinBox. The vulnerability itself was possible due to a directory traversal vulnerability in the WinBox interface with RouterOS.

Directory traversal is a type of exploit that allows attackers to travel to the parent directories to gain access to the operating system’s file system, a method and structure of how data is stored and retrieved in the operating system. Once they gain access to the file system, attackers can then read the existing files that administer the router and write files directly into the file system to administer the routers to their botnet needs.

While the vulnerability was patched after its detection back in 2018, it’s still being exploited in compromised devices that do not use the patched RouterOS versions, or that use the default usernames and passwords. MicroTik has advised its customers to upgrade their devices’ OS version, to only allow access to the devices via secure IPsec, and to inspect for any abnormalities such as unknown SOCKS proxy settings and scripts.

To launch volumetric attacks, the botnet uses HTTP pipelining which allows it to send multiple requests over a single connection, thus increasing its total attack throughput. Furthermore, in an attempt to obfuscate the attack source, the botnet uses open SOCKS proxies to proxy their attack traffic to the target.

Cloudflare’s DDoS protection systems automatically detect and mitigate Meris attacks. One of the mitigation actions that the system can choose to use is the ‘Connection Close’ action which eliminates the risk of HTTP pipelining and helps slow down attackers. Additionally, as part of Cloudflare’s threat intelligence suite, we provide a Managed IP List of Open SOCKS Proxies that customers can use as part of their firewall rules — to block, challenge or rate-limit traffic that arrives via SOCKS proxies.

How does Meris compare to Mirai?

About five years ago, Mirai (Japanese for future) — the infamous botnet that infected hundreds of thousands of IoT devices —  launched record-breaking DDoS attacks against websites.

There have been many variants of the Mirai botnet since its source code was leaked. One version of Mirai, called Moobot, was detected last year when it attacked a Cloudflare customer with a 654 Gbps DDoS attack. Another variant recently made a resurgence when it targeted Cloudflare customers with over a dozen UDP and TCP based DDoS attacks that peaked multiple times above 1 Tbps, with a max peak of approximately 1.2 Tbps.

While Mirai infected IoT devices with low computational power, Meris is a swarm of routers that have significantly higher processing power and data transfer capabilities than IoT devices, making them much more potent in causing harm at a larger scale to web properties that are not protected by sophisticated cloud-based DDoS mitigation.

Tracking the Meris botnet attacks

Since the appearance of Meris, Cloudflare’s systems automatically detected and mitigated Meris attacks using the existing mitigation rules. During our analysis of the Meris botnet attacks, our security experts noticed the attack vectors adapt to try and bypass Cloudflare’s defenses. Needless to say, they were not successful. But we wanted to stay many steps ahead of attackers — and so our engineers deployed additional rules that mitigate Meris attacks even more comprehensively. A side effect of these mitigation rules is that it also provides us with more granular threat intelligence on the Meris attacks.

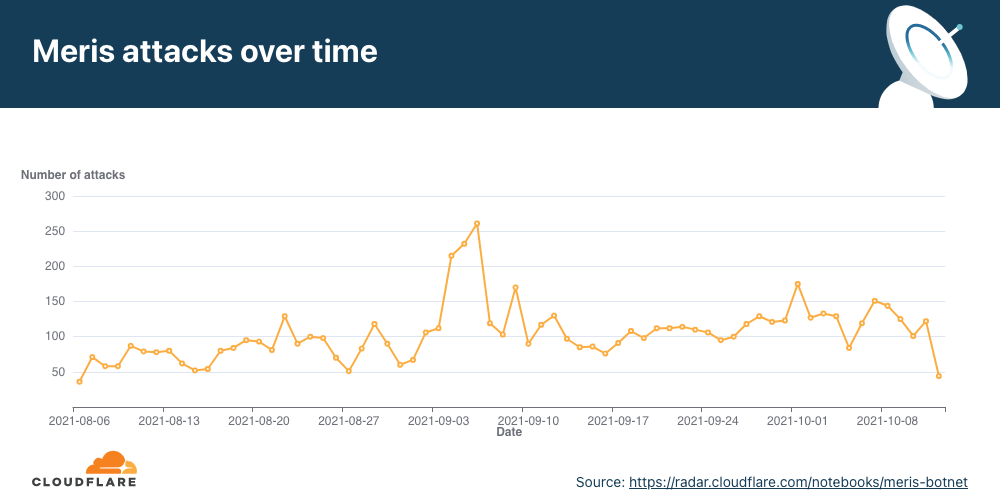
Since we deployed the new rules in early August, we’ve seen Meris launch an average of 104 DDoS attacks on Cloudflare customers every day. The highest figure we’ve seen was on September 6, when Meris was used to launch 261 unique attacks against Cloudflare customers.

A Brief History of the Meris Botnet

View the interactive graph on Cloudflare Radar.

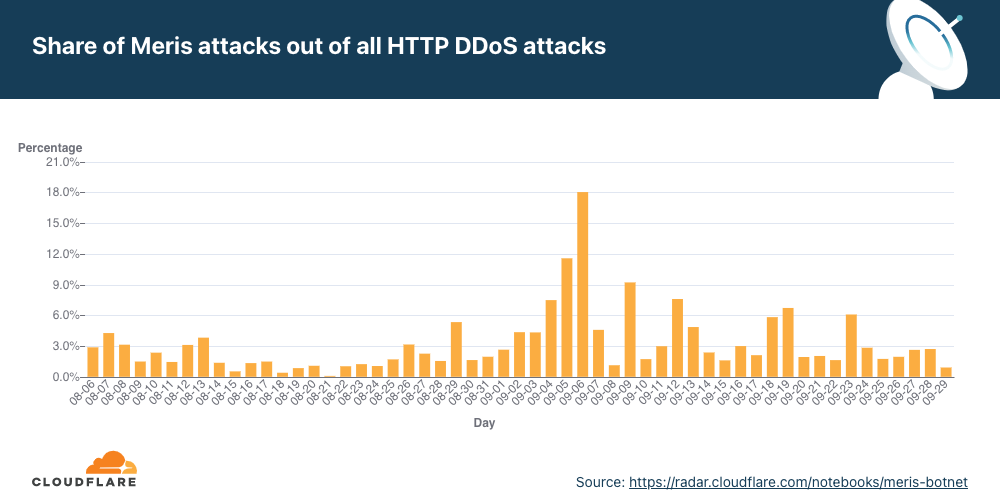
During that same day, on September 6, attacks from Meris accounted for a record-breaking 17.5% of all L7 DDoS attacks that Cloudflare observed.

A Brief History of the Meris Botnet

View the interactive graph on Cloudflare Radar.

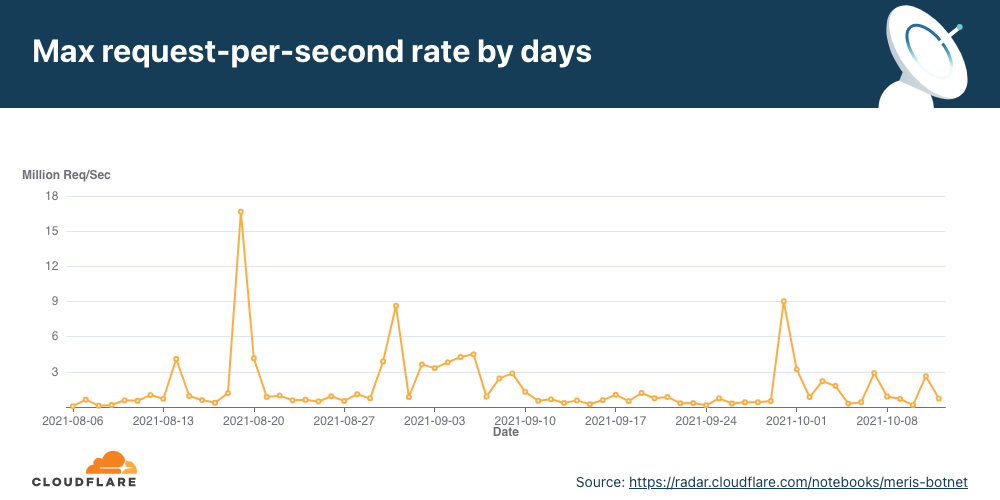
Overall, Meris targets about 50 different websites and applications every single day. Although the average attack peaked at 106K rps, the median attack size was actually smaller at 17.6K rps. The largest attack we’ve seen was 17.2M rps and that occurred in July. In the graph below, you can see the daily highest requests per second rate after we deployed the new rules. Since then, the largest attack we’ve seen was 16.7M rps, which took place on August 19.

A Brief History of the Meris Botnet

Meris used to target Banks, Financial Services, and Insurance companies

Over the past few months, the industry that received the most attack traffic from the Meris botnet was the Banking, Financial Services, and Insurance (BFSI) industry

A Brief History of the Meris Botnet

View the interactive graph on Cloudflare Radar.

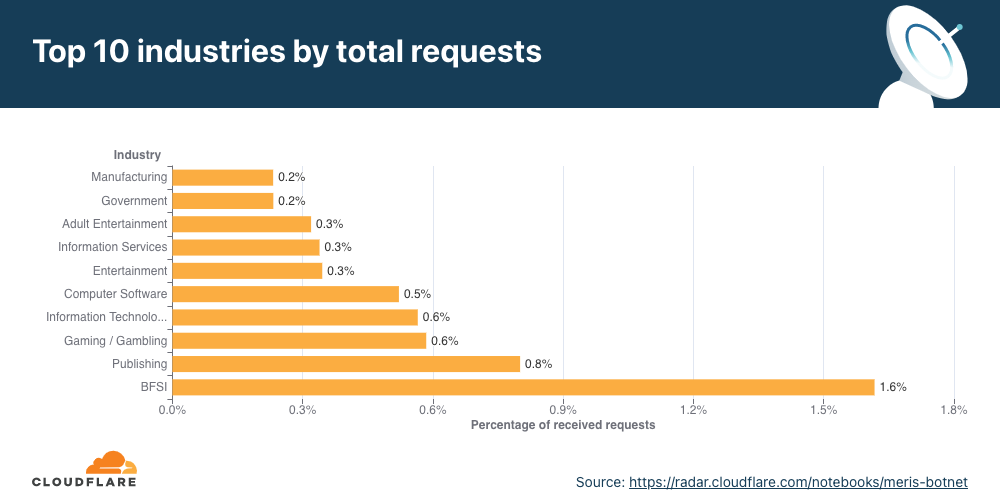
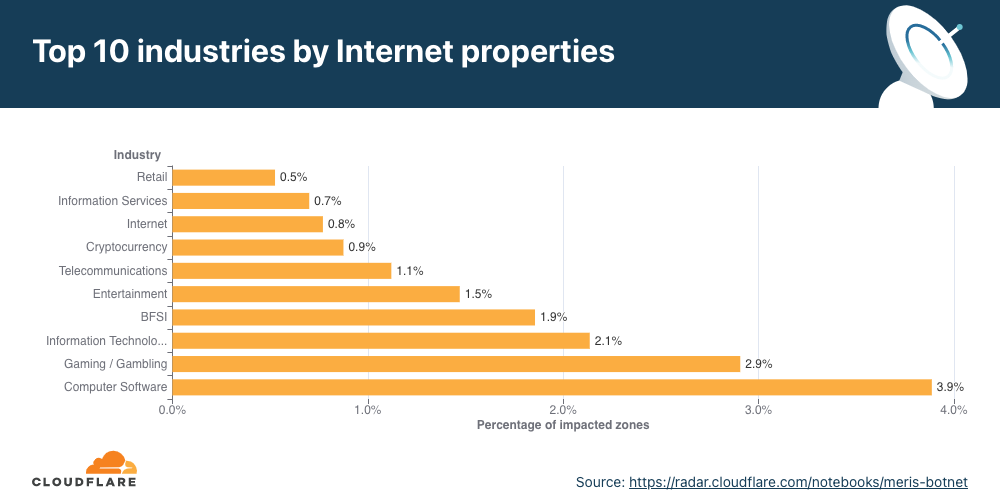
Following the BFSI industry, the most attacked industries were the Publishing, Gaming/Gambling, and IT Services industries. And while BFSI was the number one most attacked industry when considering the Meris DDoS activity rate, it only came in fourth place when considering the percentage of targeted websites.

In terms of the percentage of targeted websites, the Computer Software industry came in first place. Almost 4% of all impacted websites were of Computer Software companies protected by Cloudflare, followed by Gaming/Gambling and IT Services with 3% and 2%, respectively.

A Brief History of the Meris Botnet

View the interactive graph on Cloudflare Radar.

Attacks on industries over time

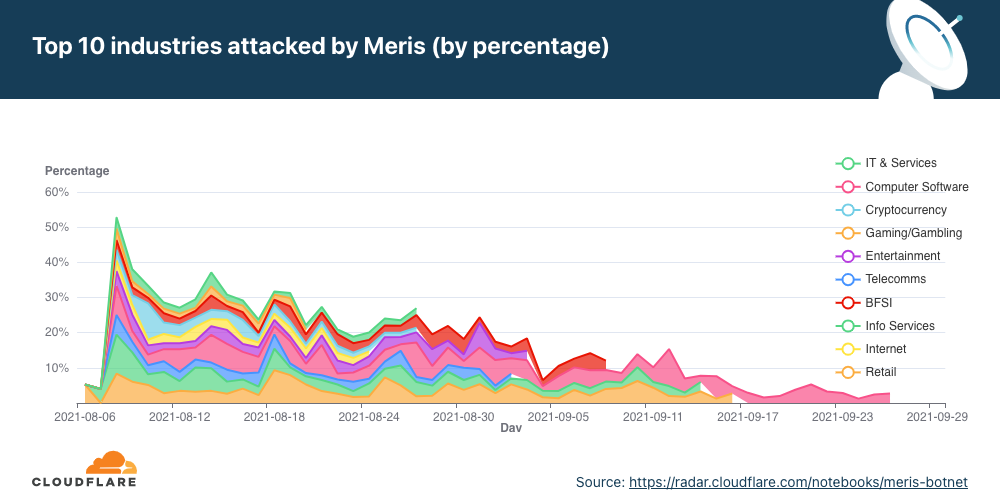
Besides the total breakdowns shown above, we can also view the top industries the botnet attacked over time to understand the changing trends. These trends may be tied to political events, new video game releases, sporting events, or any other global or local public interest events.

Off the top, we can already see the two largest peaks on August 9 and August 29 — mainly on the Computer Software, Gaming/Gambling, and IT industries. Another interesting peak occurred on August 14 against Cryptocurrency providers.

In late August, the botnet was pointed against gambling and casino websites, generating attacks at rates of hundreds of thousands to millions of requests per second. A second significant wave against the same industry was launched in early September.

A Brief History of the Meris Botnet

View the interactive graph on Cloudflare Radar.

Meris targets websites in China, Australia, and US

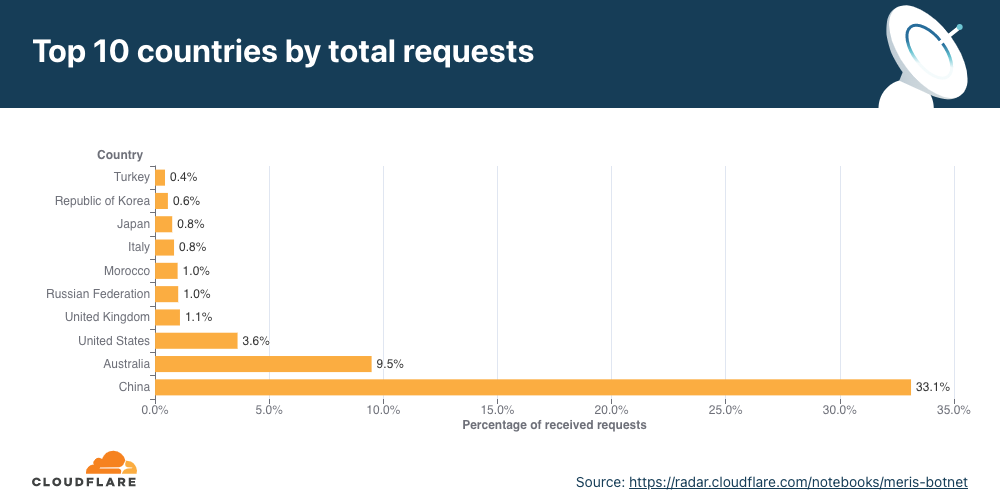
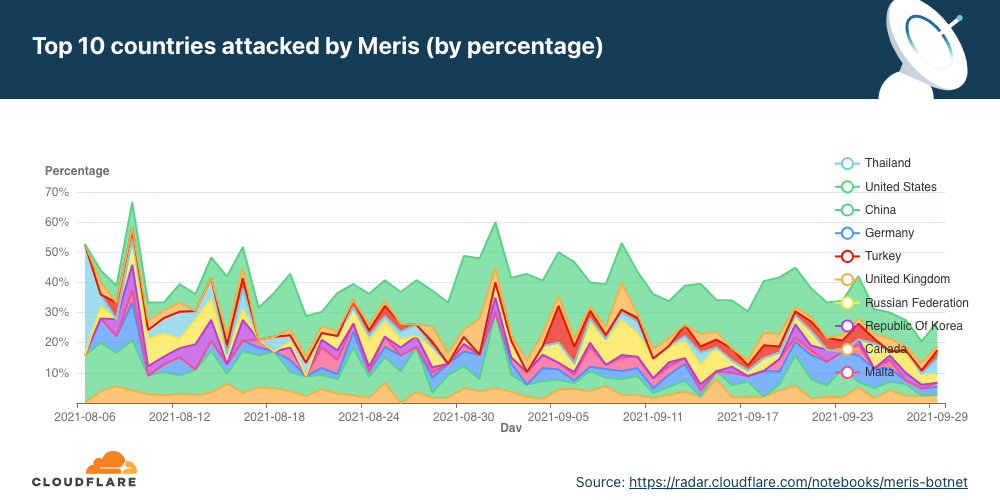
Similarly to the analysis of the top industries, we can calculate the Meris DDoS activity rate per target country to identify which countries came under the most attacks. In total, China-based companies saw the largest amount of DDoS attacks. More than 33% of all requests generated by Meris were destined for China-based companies that are protected by Cloudflare. Australia came in second place, and the US in third.

A Brief History of the Meris Botnet

View the interactive graph on Cloudflare Radar.

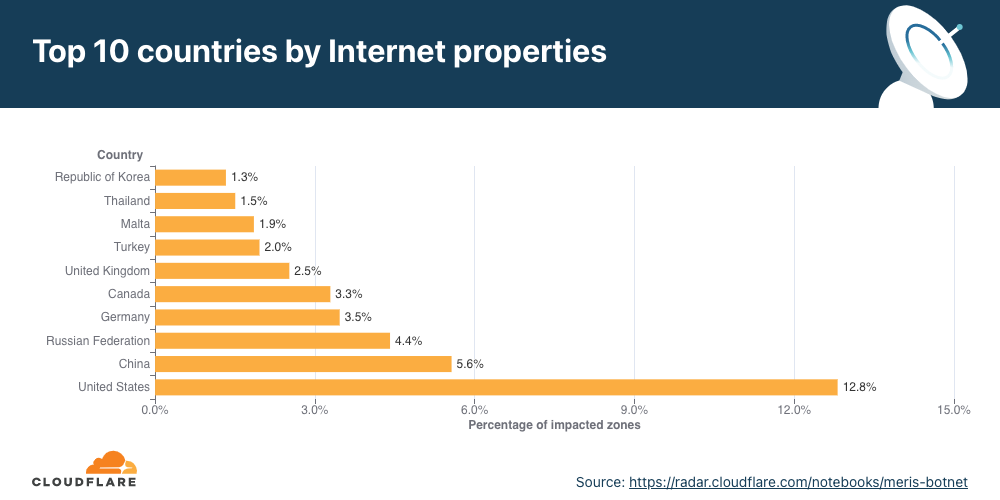
On the other hand, when we look at the number of websites that were targeted by Meris, the US came in first place. More than 12% of all websites that were targeted by Meris are operated by US-based companies. China came in second place with 5.6% and Russia in third with 4.4%.

A Brief History of the Meris Botnet

View the interactive graph on Cloudflare Radar.

Attacks on countries over time

Over time, we can see how the attacks on the top countries change. Similarly to the per-industry breakdown, we can also see two large peaks. The first one occurred on the same spike as the per-industry breakdown on August 9. However, the second one here occurred on September 1.

A Brief History of the Meris Botnet

View the interactive graph on Cloudflare Radar.

Location of the Meris bots

Although only tens of thousands of bots have been detected per attack, it is estimated that there are roughly 250,000 bots worldwide. As indicated above, the botnet is formed of MikroTik routers. Using the source IP address of the routers, we’re able to identify the origin country of the bots to paint a geographical representation of the bots’ presence and growth over time.

The change in the location of the bots doesn’t necessarily indicate that the botnet is growing or shrinking. It could also be that different bot groups are activated from time to time to spread the load of the attacks while attempting not to get caught.

At the beginning of August, the majority of the bots were located in Brazil. But by the end of August, that number plummeted to a single digit percentage close to zero. Meanwhile, the number of infected devices grew in the United States. From the beginning of September, the number of bots was significantly higher in the US, Russia, India, Indonesia, and China.

View the interactive graph on Cloudflare Radar.

Cloudflare protects against Meris attacks

Cloudflare operates autonomous DDoS protection systems that automatically detect and mitigate DDoS attacks of all types, including attacks launched by Meris and Mirai. These systems are also customizable, and Cloudflare customers can tweak and tune their DDoS protection settings as needed with the HTTP DDoS Managed Ruleset and the L3/4 DDoS Managed Ruleset.

Interview with Zabbix Summit Online 2021 speaker: Vittorio Cioe

Post Syndicated from Jekaterina Sizova original https://blog.zabbix.com/interview-with-zabbix-summit-online-2021-speaker-vittorio-cioe/16599/

With two weeks to go until Zabbix Summit 2021, we continue to introduce you to our guest speakers. Vittorio Cioe is already known to our community – he has participated in various Zabbix events, such as Zabbix summits and meetups. This year’s Zabbix Summit is not an exception. We asked Vittorio to tell us a few words about himself and introduce the presentation he will deliver on November 25th.

Hi Vittorio, we are happy to see you among the speakers this year! Would you mind please uncovering what your paper is about?

Hi, happy to be at Zabbix Summit also this year! This year I will cover a topic that is growing interest in the market as far as I can see: infrastructure as code, to create reusable deployment scripts. I will take as an example a Zabbix deployment on Oracle Cloud, using MySQL as a Service. I have decided to go this way because Oracle Cloud is very strong on the infrastructure as code side, and Zabbix it is very straightforward to automate.

You’re already familiar with many of our users and event attendees, but our community is growing, and new members are definitely interested in learning more about the speakers. Tell us please about yourself and your professional activities.

I originally come from Italy but relocated to Poland several years ago. Professionally I am a technology enthusiast, and in the past, I have been working the Security and Digital Transformation space. Finally, 4 years ago I landed at MySQL, which previously I have been a user of. This has been quite an incredible journey which put me in contact with some really amazing technology companies, and among those, Zabbix.

What role does Zabbix play in your professional activities?

Zabbix is one of the Oracle MySQL partners with which we have been able to establish cooperation and I really enjoy working with.

What do you think makes Zabbix stand out from other monitoring solutions?

I believe that the real strength of Zabbix is that the product is Open Source, and it brings the power of an enterprise-level monitoring solution to the broader public which normally could not afford it, giving a lot of companies the possibility of growing.

Have you already seen the summit program and the topics that will be covered? Which presentations would you be interested in hearing yourself?

There are some really great speeches this year! I would really like to listen to the speech of Alexei Vladishev (Zabbix 6.0 LTS – The next great leap in monitoring) and Sergey Sorokin (Take Advantage of Zabbix Services Online).

Introducing Code Club World: a new way for young people to learn to code at home

Post Syndicated from Laura Kirsop original https://www.raspberrypi.org/blog/code-club-world-free-online-platform-young-people-children-learn-to-code-at-home/

Today we are introducing you to Code Club World — a free online platform where young people aged 9 to 13 can learn to make stuff with code.

Images from Code Club World, a free online platform for children who want to learn to code

In Code Club World, young people can:

  • Start out by creating their personal robot avatar
  • Make music, design a t-shirt, and teach their robot avatar to dance!
  • Learn to code on islands with structured activities
  • Discover block-based and text-based coding in Scratch and Python
  • Earn badges for their progress 
  • Share their coding creations with family, friends, and the Code Club World community

Learning to code at home with Code Club World: meaningful, fun, flexible

When we spoke to parents and children about learning at home during the pandemic, it became clear to us that they were looking for educational tools that the children can enjoy and master independently, and that are as fun and social as the computer games and other apps the children love.

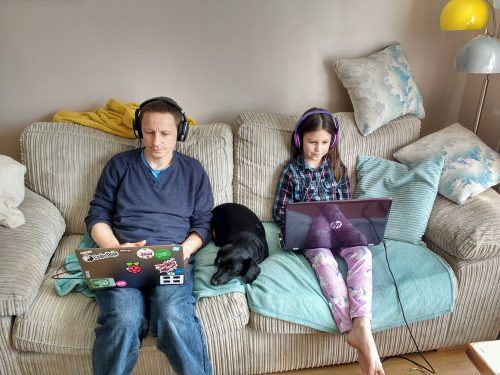
A girl has fun learning to code at home, sitting with a laptop on a sofa, with a dog sleeping next to her and her father writing code too.
Code Club World is educational, and as fun as the games and apps young people love.

What’s more, a free tool for learning to code at home is particularly important for young people who are unable to attend coding clubs in person. We believe every child should have access to a high-quality coding and digital making education. And with this in mind, we set out to create Code Club World, an online environment as rich and engaging as a face-to-face extracurricular learning experience, where all young people can learn to code.

The Code Club World activities are mapped to our research-informed Digital Making Framework — a coding and digital making curriculum for non-formal settings. That means when children are in the Code Club World environment, they are learning to code and use digital making to independently create their ideas and address challenges that matter to them.

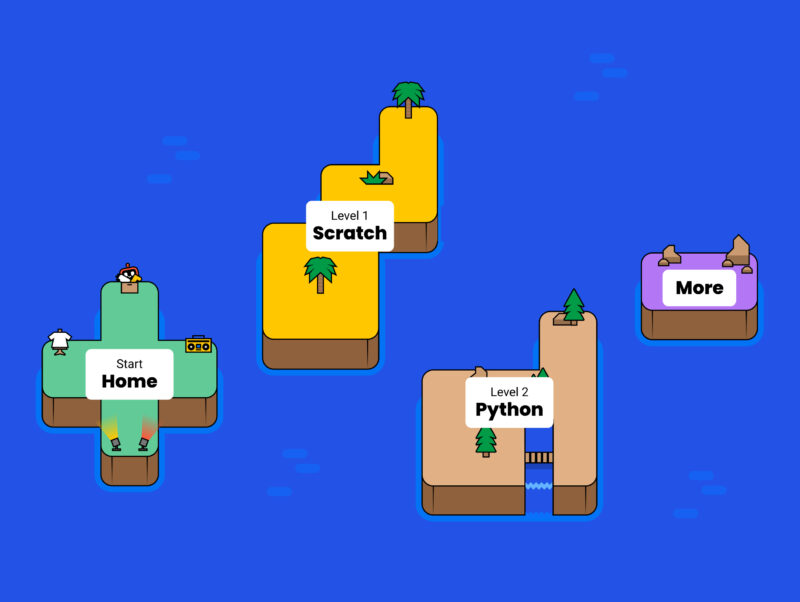
Islands in the Code Club World online platform for children who want to learn to code for free.
Welcome to Code Club World — so many islands to explore!

By providing a structured pathway through the coding activities, a reward system of badges to engage and motivate learners, and a broad range of projects covering different topics, Code Club World supports learners at every stage, while making the activities meaningful, fun, and flexible.

A girl has fun learning to code at home on a tablet sitting on a sofa.
Code Club World’s home island works as well on mobile phones and tablets as on computers.

We’ve also designed Code Club World to be mobile-friendly, so if a young person uses a phone or tablet to visit the platform, they can still code cool things they will be proud of.

Created with the community

Since we started developing Code Club World, we have been working with a community of more than 1000 parents, educators, and children who are giving us valuable input to shape the direction of the platform. We’ve had some fantastic feedback from them:

“I’ve not coded before, but found this really fun! … I LOVED making the dance. It was so much fun and made me laugh!”

Learner, aged 11

“I love the concept of having islands to explore in making the journey through learning coding, it is fabulous and eye-catching.”

Parent

The platform is still in beta status — this means we’d love you to share it with young people in your family, school, or community so they can give their feedback and help make Code Club World even better.

Together, we will ensure every child has an equal opportunity to learn to code and make things that change their world.

The post Introducing Code Club World: a new way for young people to learn to code at home appeared first on Raspberry Pi.

Разследване на Валя Ахчиева: По следите на незаконната сеч в Габрово

Post Syndicated from Екип на Биволъ original https://bivol.bg/%D0%BF%D0%BE-%D1%81%D0%BB%D0%B5%D0%B4%D0%B8%D1%82%D0%B5-%D0%BD%D0%B0-%D0%BD%D0%B5%D0%B7%D0%B0%D0%BA%D0%BE%D0%BD%D0%BD%D0%B0%D1%82%D0%B0-%D1%81%D0%B5%D1%87-%D0%B2-%D0%B3%D0%B0%D0%B1%D1%80%D0%BE%D0%B2.html

вторник 9 ноември 2021


Къде са отсечените 100-годишни букови дървета, след онази незаконна сеч в Габровския Балкан над село Зелено дърво, преди близо 2 години? Над 500 дървета бяха повалени от моторните триони в…

Рискове и мерки за защита на машинното гласуване

Post Syndicated from Bozho original https://blog.bozho.net/blog/3868

Тези дни ескалираха съмненията в машинното гласуване. Тази ескалация е с политически мотив, но няма да правя политически коментар, а експертен, с който да обясня къде всъщност са рисковете за машинното гласуване и какви са мерките, които трябва да вземем, за да бъде то защитено. Ще опитам да обясня и защо допълнителни машини по никакъв начин не помагат за компрометирането на системата, ако Сиела биха искали да я компрометират.

Тук е важно да отбележа, че не твърдя, че някой иска да манипулира резултата – нито Сиела, нито ЦИК, нито Информационно обслужване. Но една добра система трябва да бъде отворена и прозрачна и да може всяка заинтересована страна да се убеди, че тя работи правилно, без да разчита на някой доверен участник. Т.е. дори да вярваме на Сиела, ЦИК и Информационно обслужване, сме длъжни да имаме система, която не разчита на доверието към тях.

Машинното гласуване не е просто една машина, то е процес. Процесът има следните стъпките:

  1. Доставка на празни машини
  2. Получаване на изходния код
  3. Компилиране на изходния код до системен образ
  4. Електронно подписване на системния образ
  5. Записване на подписания системния образ на флашка
  6. Инсталиране на системния образ на всички машини (отключване на машините, в случай, че на тях е бил инсталиран друг системен образ, подписан с други ключ)
  7. Генериране на ключове върху смарт-карти (тези белите, с които секционните комисии подписват)
  8. Комплектоване на смарт-картите и техните ПИН-кодове
  9. Транспортиране на машините и смарт-картите до РИК, съответно до секциите
  10. Стартиране на изборния ден
  11. Гласуване
  12. Приключване на изборния ден и подписване на протокола (както на хартия, така и електронно)
  13. Транспортиране на хартиения протокол, смарт-картите и флаш-паметите с машинния протокол
  14. Проверка на протокола и въвеждането му в системата за машинна обработка
  15. Сумиране и обявяване на резултата

На почти всяка от тези стъпки съществува някакъв риск, който трябва да бъде адресиран. Рискът може да бъде за манипулация на целия изборен процес или на отделни секции. Рискът не значи, че това ще се случи, но трябва да бъдат взети съответните мерки. Сходни рискове съществуват и при хартиеното гласуване – и там има защитни механизми (като напр. голям брой членове на секционни комисии, наблюдатели, бюлетини с уникален номер, и т.н.)

Нека започна с въвеждането на колко термина, които ще ми се наложи да използвам в обяснението.

  • Криптографски ключ – освен като ключ, с който може да се отключва и заключва електронно съдържание, може да си го представите като много дълга (незапомняема) парола, която ни дава достъп до дадена скрита информация, но също така ни дава опция да “подпишем” нещо електронно.
  • Електронен подпис – използване на криптографски ключ с цел гарантиране, че даден файл не е бил подменян и че е създаден от оторизирано за това лице (притежател на ключа)
  • Хеш – “отпечатък” на файл или група от файлове. Хешът е това, което се разпечатва на разписката и служи за идентифициране на софтуера, който работи на машината. Всяка най-малка промяна в дори един файл би променила този хеш.
  • Изходен код – кодът описва как работи софтуера – какво прави в един или друг случай, как смята, къде записва резултата
  • UEFI secure boot – това е технология, която ограничава възможния системен софтуер, който може да работи на една машина само до такъв, който е бил електронно подписан с ключ на оторизиран участник (между другото, всеки домашен компютър или лаптоп също използва тази технология).

В целия процес има три групи рискове, които надграждат един върху друг. Основният риск е първият, защото той определя поведението на системата, но останалите рискове са свързани с него:

  • Изходният код – съществува риск някой (доставчикът) да е заложил определено изкривяване на резултата в изходния код, напр. “всеки трети глас за Х отива за Y или Z”.
  • Системният образ – дори кодът да бъде проверен и да не манипулира резултата, системният образ, който е изграден на база на този код, може да бъде подменен с друг. Затова трябва да сме сигурни, че системният образ е точно този, който е изграден от проверения изходен код
  • Управление на ключове – гарантирането на системния образ, а и на машинните протоколи на флаш-паметите, разчита на електронни подписи с криптографски ключове. Те трябва да бъдат управлявани и съхранявани правилно, за да не може някой да подмени едно или друго съдържание.

Следва таблица с рисковете по тези направления, както и мерки, които са взети за тяхното елиминиране. Ще си позволя да добавя колона “участие на ДБ”, защото всякакви обвинения в манипулация са абсолютно нелепи при всичките усилия, които системно полагаме за честността на изборите. Държа да подчертая, че знанието, описано тук, сме го използвали, за да подобрим процеса.

А откъде имам информация за този анализ? От общи познания по информационна сигурност, от техническата спецификация за поръчката, от докладите за удостоверяване на машините на Държавна агенция “Електронно управление” и от участието ми на техническите срещи с експерти от ДАЕУ и ЦИК, на които задавах въпроси. Не твърдя, че имам пълната картина, но имам достатъчно, така че да оценя рисковете.

Броенето на хартиените разписки е мярка, която позволява откриването на манипулации, ако бъде изпълнена както трябва. Затова и още при предните избори настоявахме чрез нашите представители в ЦИК за извадкова проверка. При проверката на разписките гаранцията идва от това, че избирател се е уверил визуално, че машината е приела гласа, който той е подал. Затова е добра идея да има извадково преброяване в СИК (напр. в 5% от секциите), както и по-обстоен централизиран следизборен одит на разписките, при който рисковете от грешки и от умишлен саботаж са намалени. Важно е при одита да бъде сканиран и QR кода, защото той е гаранцията, че разписката е автентична, а СИК трябва да документира всички извънредни събития, като граждани, тръгнали си с разписка в джоба, свършила хартия и др., които могат да се отразят на броя разписки. Този подход би открил опит за мащабна манипулация, без да създава предпоставки за друг вид манипулации – комуникационни, в които определени технически грешки при броенето и въвеждането на резултата се използват за подкопаване на доверието в изборите.

Риск Мерки за защита Прилагат ли се в момента? Ниво на риск Участие на ДБ
Уязвимости в кода, които позволяват промяна на резултата Автоматизирано тестване за уязвимости на изходния код; Да, от ДАЕУ в процеса на удостоверяване Ниско (това за уязвимости, които не са съзнателно поставени и съответно, дори да ги има, не е ясно дали някой може да се възползва от тях) Не директно, но процеса на удостоверяване беше добавен включително и заради натиска на ДБ за одит на машините.
“Вратичка” (backdoor) в кода, която позволява съзнателна манипулация Преглед на кода от участници в процеса и в процеса на удостоверяване Частично – в момента ДАЕУ проверява кода, но все още ЦИК не е дала достъп до представителите на партиите Високо Предложено от ДБ в Изборния кодекс. Три писма, както и внесено проект на решение на ЦИК.
Подмяна на изходния код след неговото одитиране и преди компилиране на системния образ Генериране на хеш на изходния код и публикуването му Да, в рамките на публичната процедура се сравнява хеша на удостоверения код с този на кода, с който се компилира системния образ. Високо В техническата среща настоявах това да се случи; все пак от Сиела и ДАЕУ вече се бяха подготвили с тази стъпка. Публичното компилиране на системния образ беше поискано от ДБ чрез писмо и становище в комисия в Народното събрание
Вкарване на злонамерена функционалност през библиотеки, които не са част от кода, но системата разчита на тях Проверка на електронните подписи или хешовете на библиотеките спрямо публично обявените Частично – това е част от скриптовете за компилиране на системния образ, до които не са ни предоставили достъп. Ниско – такава атака е с висока сложност, защото в кода трябва да има код, който да се възползва от тази промяна по неочевиден начин. –
Инсталиране на системен образ, различен от официалния, който да изкривява резултата Подписване на официалния с ключ на ЦИК; Извадкова проверка на UEFI db на машините в процеса на инсталиране извадкова проверка на хеша с външен инструмент HashExtractor Частично – от тези избори системният образ се подписва от ЦИК, а не от Сиела. На предните избори е извършена проверка на процеса на инсталиране, но тя трябва да е по-мащабна. Очакваме решение на ЦИК за извадкова проверка с HashExtractor Високо. Хешът на системната разписка е само частична гаранция, тъй като той се генерира от машината (и тя може да разпечата “правилния’). Затова е нужно разделяне на контрола на ключа и инсталирането (за да не са в една и съща организация) ДБ в няколко писма за предните и тези избори предлага на ЦИК извадкова проверка с външния инструмент HashExtractor, както и проверка на UEFI db (дали разпознава правилните ключове или са добавени изключения) и е подкрепила подписването с ключ на ЦИК
Управляване на машината дистанционно в изборния ден Неизползване на карта за безжична комуникация и премахване на драйверите за всякакви мрежови карти. Да, машините са с премахнати мрежови драйвери по спецификация (и това е потвърдено при удостоверяването) и нямат антени за безжична комуникация Ниско Изрично сме се уверили на база на докладите, че няма възможност за отдалечена комуникация с машините.
Изтичане на ключа за UEFI secure boot Генериране на ключа на смарт-карта и съхранение в сигурна физическа среда; евентуално разпределение на ключа между членовете на ЦИК с напр. С алгоритъма за споделяне на ключове на Шамир. За съжаление не може ключът да се генерира на смарт-карта, защото ако тя се развали, губим машините. Алтернативно, може да се генерира на HSM, който поддържа резервни копия. Частично – доколкото разбрах ЦИК е приело протоколни правила за генерирането и съхранението на ключовете и се пазят физически. За следващите избори това трябва да стане в публична процедура. Средно – изтичането на ключа не значи автоматично манипулация на изборите. В този случай проверката с HashExtractor отново би открила проблема, а разделението между собственика на ключа и организацията, инсталираща машините, допълнително намалява риска. Още на предните избори в писмо сме поискали точните процедури за управление на UEFI ключовете
Подписване на секционни машинни протоколи с нелегитимни ключове Публикуване на всички сертификати от смарт-картите на секционните комисии преди изборния ден, което да позволи последваща проверка и защита срещу нелегитимни ключове Не, в момента се разчита, че карти могат да се издават само от Информационно обслужване и че няма допълнително издадени карти. Ниско, тъй като хартиеният протокол, от който имат копие всички членове на СИК и наблюдателите, съдържа валидните данни и хващането на такава манипулация е лесно.. С писмо от миналата седмица до ЦИК сме поискали публикуване на всички сертификати/публични ключове
Подписване на фалшив машинен протокол по пътя от СИК до РИК Разделяне на смарт-картите от флаш-паметите при транспорта Не, в момента се разчита, че такава манипулация в мащаб едва ли е възможна, поради необходимостта от технически познания на член на СИК. Ниско, тъй като хартиеният протокол, от който имат копие всички членове на СИК и наблюдателите, съдържа валидните данни и хващането на такава манипулация е лесно. С писмо преди предходните избори сме предложили разделяне на смарт-картите от флаш-паметите
Изкривяване на резултата при машинна обработка в РИК/ЦИК Публикуване на всички протоколи; получаване на копие от протоколите от всеки член на СИК и застпъник Да Много ниско – протоколите са първичният документ и след неговото генериране всеки опит за мащабна манипулация може да бъде установен много лесно. –

Виждаме, че на практика всички рискове са или адресирани по някакъв начин, или с достатъчно ниско ниво, за да не представляват системен проблем. Моята критика, когато има такава, е в подобряване на вече прилаганите мерки за защита.

Ако приемем, че допълнителните машини са за манипулация на изборите, то Сиела е тази, която би го направила. Само че Сиела в момента разполага с UEFI ключа от предните избори, с който може да отключи съществуващите, “легитимни” машини. Именно затова допълнителните машини с нищо не се различават от съществуващите и не добавят вектор на атака. При следващите избори, в които Сиела няма да има ключа да отключи съществуващите машини, това би било потенциален проблем, тъй като в новите машини може да инсталира всичко, а в старите – само системен образ, подписан от ЦИК. Но на тези разлика няма.

Когато говорим за изходния код, за съжаление в момента той не е собственост на държавата и тя няма право да го публикува. Може, в условия на конфиденциалност, да се предостави на заинтересовани страни (представители на партии, напр.) Това трябва да бъде коригирано за следващи избори – добра идея е да се напиша изцяло нов код, който да е публично достъпен, одитиран, и за чийто прелед да бъдат поканени международни експерти. За това тази година нямаше време, но при малко по-стабилен парламент това трябва да бъде следващата стъпка, според мен.

С оглед на изложеното по-горе, смятам, че изборите в момента са с разумно ниво на защита и че мащабни манипулации няма да бъдат извършвани. Има какво да се желае от процеса, поради което правим постоянни препоръки. ЦИК приема някои от тях, макар и със закъснение.

Бих препоръчал за следващите избори ЦИК да позволи на партиите да изпратят свои представители в складовете, където се извършва инсталирането на машини, и да могат, оп определен ред, да задават въпроси и следят процеса.

Знам, че гореописаното е сложно и твърде експертно. И изисква наблюдатели на етапи различни от изборния ден, на места различни от изборната секция. Но категорично не съм съгласен с политическите внушения, че щом е по-сложно, значи някой го манипулира.

До момента машинното гласуване елиминира невалидните гласове и намали купения и контролиран вот (вероятно защото няма “тъмна стаичка” и не може да се снима екрана, не може да се носят конци за отмерване на дължина, не могат да се изнасят бюлетини в нишка и др.); елиминираха се и грешките при броенето в СИК, а процесът на приемане на протоколи се ускори. Това са ползи, които си струват допълнителното усилие. Ако намерим други начини за справяне с тези проблеми, супер. Но дотогава, нека партиите наистина впрегнат симпатизиращите им ИТ експерти да наблюдават процеса и да се уверяват в неговата честност, вместо да рисуват абсурдни конспиративни графики и да всяват несигурност и недоверие.

Материалът Рискове и мерки за защита на машинното гласуване е публикуван за пръв път на БЛОГодаря.

Satyen Desai: Why I joined Cloudflare and why I am helping Cloudflare grow in Southeast Asia and Korea

Post Syndicated from Satyen Desai original https://blog.cloudflare.com/satyen-desai-why-i-joined-cloudflare-and-why-i-am-helping-cloudflare-grow-in-southeast-asia-and-korea/

Satyen Desai: Why I joined Cloudflare and why I am helping Cloudflare grow in Southeast Asia and Korea

Satyen Desai: Why I joined Cloudflare and why I am helping Cloudflare grow in Southeast Asia and Korea

I am excited to announce that I have joined Cloudflare as the Head of Southeast Asia and Korea (SEAK) region to help build a better Internet and to expand Cloudflare’s growing customer, partner and local teams across all the countries in SEAK. Cloudflare is at an emergence phase in this region, with immense growth potential, and this is just the beginning. Cloudflare has had a lot of success globally and our charter is to build on that success and momentum to grow our presence locally to address the demands in Singapore, Malaysia, Thailand, Indonesia, Philippines, Indochina and Korea. Customer engagements in each of the countries in SEAK presents a unique, rich and fulfilling engagement each with their own intricacies.

A little about me

I was born in India (Surat, Gujarat), and at the age of four our family moved to Bahrain where we lived for eight years. We then moved to New Zealand, which is where I completed my senior years of high school and also my Bachelor’s Degree in Information Engineering at Massey University. After graduation, we moved to Melbourne, Australia which is our family home and where my career started.

I love meeting and working with diverse and interesting people who bring different views, thoughts and perspectives. The experiences growing up and working in so many countries has made me a more dynamic leader, while working with so many cultures and diverse teams. Diversity is what drives innovation and growth, more so true than ever in this exciting region.

I love my sports (cricket, squash, golf), traveling and spending time with family & friends.

My journey to Cloudflare

I joined IBM Australia as a graduate in 1997, gaining valuable experiences across many roles from delivery to sales, in a career spanning 15 years. Having been in the IT industry for more than 27 years, career experiences at large global organisations like IBM, SAP, Cisco, NTT and Oracle, all of these amazing organisations and colleagues (many of whom are friends), have provided me with the best set of tools and experiences which I can bring to Cloudflare to help drive the growth agenda.

Below are the main reasons I joined Cloudflare to embark on this amazing journey:

  1. Cloudflare’s Growth potential: Cloudflare has an immense growth potential in APJC and subsequently in Southeast Asia & Korea.  In our recently announced Q3 earnings, we reported a 51% year-over-year increase in revenue, with a record addition of 170 large customers.
  2. Cloudflare’s ever-growing Portfolio: I was lucky enough to join during Birthday Week, Cloudflare’s 11th birthday. Many new products and solutions were announced during the week to further enhance our growing portfolio of solutions. I am amazed at the pace of innovation, where Cloudflare is continuously releasing new products and features on the Cloud that are then instantly available at all our data centers globally for our clients to consume and adopt.
  3. Cloudflare People: During the interview process, I met with 11 Cloudflare colleagues, and all of these felt more like a discussion with a two-way dialogue and a view for Cloudflare to get to know me better, and for me to better understand Cloudflare. This emphasised in my mind the like-minded people I will be working with, where we all work collaboratively, leveraging the experiences we all bring from our past to achieve greater outcomes.
  4. Cloudflare Culture: having now met with so many of my colleagues at Cloudflare, the one thing that stands out for me is the humility with which everyone operates from Global and Regional leaders to our local teams. The all-inclusive culture at Cloudflare along with the three tenets of Curious, Transparent and Principled are very much aligned with my personal principles: Honesty, Integrity and Transparency.

It is an exciting time to be joining one the fastest growing Cloud companies in the world and I want to be part of the Cloudflare journey and contribute to the growth agenda.

We’re just getting started…

I am convinced that Cloudflare is and will be an even bigger global IT giant. Cloudflare’s mission is to help build a better Internet, by working collaboratively with our customers to make them more secure, providing a high level of performance to support their business critical applications, while reducing cost and the complexity of managing their network infrastructure.

The Southeast Asia and Korea region is such a diverse, dynamic and exciting region to be in, where the potential for growth is limitless. As many as 40 million people in six countries across the region — Singapore, Malaysia, Indonesia, the Philippines, Vietnam and Thailand — came online for the first time in 2020. That pushed the total number of internet users in Southeast Asia to 400 million with some of the biggest ecommerce markets in the world.

Similarly, Korea has the highest internet penetration rate with 96% of its population online. On top of that, the government is investing heavily in its Digital New Deal program, which will focus on development of technologies based on data, networks and AI, as well as a digitization plan that will create job opportunities in a number of industries across the country.

Cloudflare is in a unique position to transform the way business is conducted in this region with its global cloud platform that delivers a broad range of network and security services to businesses of all sizes across all geographies. Coverage across Large Enterprises, Public Sector, Mid-Market, Start-ups to the individual developer: companies of all sizes across all industries are being powered by Cloudflare to provide Security, Performance, and Reliability services.

If you are interested in joining Cloudflare and helping to build a more secure, fast, and reliable Internet, do explore our open roles. We are hiring talented people locally, building and strengthening our local teams across: Strategic / Account Executives, Channel Managers, Business Development Representatives, Strategic / Solution Engineers, Customer Success Managers and more.

It is a great honour and a privilege for me to be part of the Cloudflare family to help build Cloudflare’s future in Southeast Asia and Korea. The potential opportunity is enormous, and we are just getting started.

Feel free to reach out to me at [email protected].

Implementing Auto Scaling for EC2 Mac Instances

Post Syndicated from Rick Armstrong original https://aws.amazon.com/blogs/compute/implementing-autoscaling-for-ec2-mac-instances/

This post is written by: Josh Bonello, Senior DevOps Architect, AWS Professional Services; Wes Fabella, Senior DevOps Architect, AWS Professional Services

Amazon Elastic Compute Cloud (Amazon EC2) is a web service that provides secure, resizable compute capacity in the cloud. The introduction of Amazon EC2 Mac now enables macOS based workloads to run in the AWS Cloud. These EC2 instances require Dedicated Hosts usage. EC2 integrates natively with Amazon CloudWatch to provide monitoring and observability capabilities.

In order to best leverage EC2 for dynamic workloads, it is a best practice to use Auto Scaling whenever possible. This will allow your workload to scale to demand, while keeping a minimal footprint during low activity periods. With Auto Scaling, you don’t have to worry about provisioning more servers to handle peak traffic or paying for more than you need.

This post will discuss how to create an Auto Scaling Group for the mac1.metal instance type. We will produce an Auto Scaling Group, a Launch Template, a Host Resource Group, and a License Configuration. These resources will work together to produce the now expected behavior of standard instance types with Auto Scaling. At AWS Professional Services, we have implemented this architecture to allow the dynamic sizing of a compute fleet utilizing the mac1.metal instance type for a large customer. Depending on what should invoke the scaling mechanisms, this architecture can be easily adapted to integrate with other AWS services, such as Elastic Load Balancers (ELB). We will provide Terraform templates as part of the walkthrough. Please take special note of the costs associated with running three mac1.metal Dedicated Hosts for 24 hours.

How it works

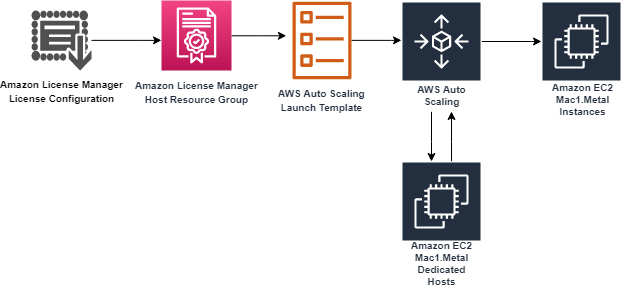
First, we will begin in AWS License Manager and create a License Configuration. This License Configuration will be associated with an Amazon Machine Image (AMI), and can be associated with multiple AMIs. We will utilize this License Configuration as a parameter when we create a Host Resource Group. As part of defining the Launch Template, we will be referencing our Host Resource Group. Then, we will create an Auto Scaling Group based on the Launch Template.

Example flow of License Manager, AWS Auto Scaling, and EC2 Instances and their relationship to each other.

The License Configuration will control the software licensing parameters. Normally, License Configurations are used for software licensing controls. In our case, it is only a required element for a Host Resource Group, and it handles nothing significant in our solution.

The Host Resource Group will be responsible for allocating and deallocating the Dedicated Hosts for the Mac1 instance family. An available Dedicated Host is required to launch a mac1.metal EC2 instance.

The Launch Template will govern many aspects to our EC2 Instances, including AWS Identity and Access Management (IAM) Instance Profile, Security Groups, and Subnets. These will be similar to typical Auto Scaling Group expectations. Note that, in our solution, we will use Tenancy Host Resource Group as our compute source.

Finally, we will create an Auto Scaling Group based on our Launch Template. The Auto Scaling Group will be the controller to signal when to create new EC2 Instances, create new Dedicated Hosts, and similarly terminate EC2 Instances. Unutilized Dedicated Hosts will be tracked and terminated by the Host Resource Group.

Limits

Some limits exist for this solution. To deploy this solution, a Service Quota Increase must be submitted for mac1.metal Dedicated Hosts, as the default quota is 0. Deploying the solution without this increase will result in failures when provisioning the Dedicated Hosts for the mac1.metal instances.

While testing scale-in operations of the auto scaling group, you might find that Dedicated Hosts are in “Pending” state. Mac1 documentation says “When you stop or terminate a Mac instance, Amazon EC2 performs a scrubbing workflow on the underlying Dedicated Host to erase the internal SSD, to clear the persistent NVRAM variables. If the bridgeOS software does not need to be updated, the scrubbing workflow takes up to 50 minutes to complete. If the bridgeOS software needs to be updated, the scrubbing workflow can take up to 3 hours to complete.” The Dedicated Host cannot be reused for a new scale-out operation until this scrubbing is complete. If you attempt a scale-in and a scale-out operation during testing, you might find more Dedicated Hosts than EC2 instances for your ASG as a result.

Auto Scaling Group features like dynamic scaling, health checking, and instance refresh can also cause similar side effects as a result of terminating the EC2 instances. These side effects will subside after 24 hours when a mac1 dedicate host can be released.

Building the solution

This walkthrough will utilize a Terraform template to automate the infrastructure deployment required for this solution. The following prerequisites should be met prior to proceeding with this walkthrough:

Before proceeding, note that the AWS resources created as part of the walkthrough have costs associated with them. Delete any AWS resources created by the walkthrough that you do not intend to use. Take special note that at the time of writing, mac1.metal Dedicated Hosts require a 24 minimum allocation time to align with Apple macOS EULA, and that mac1.metal EC2 instances are not charged separately, only the underlying Dedicated Hosts are.

Step 1: Deploy Dedicated Hosts infrastructure

First, we will do one-time setup for AWS License Manager to have the required IAM Permissions through the AWS Management Console. If you have already used License Manager, this has already been done for you. Click on “create customer managed license”, check the box, and then click on “Grant Permissions.”

AWS License Manager IAM Permissions Grant

To deploy the infrastructure, we will utilize a Terraform template to automate every component setup. The code is available at https://github.com/aws-samples/amazon-autoscaling-mac1metal-ec2-with-terraform. First, initialize your Terraform host. For this solution, utilize a local machine. For this walkthrough, we will assume the use of the us-west-2 (Oregon) AWS Region and the following links to help check resources will account for this.

terraform -chdir=terraform-aws-dedicated-hosts init

Initializing Terraform host and showing an example of expected output.

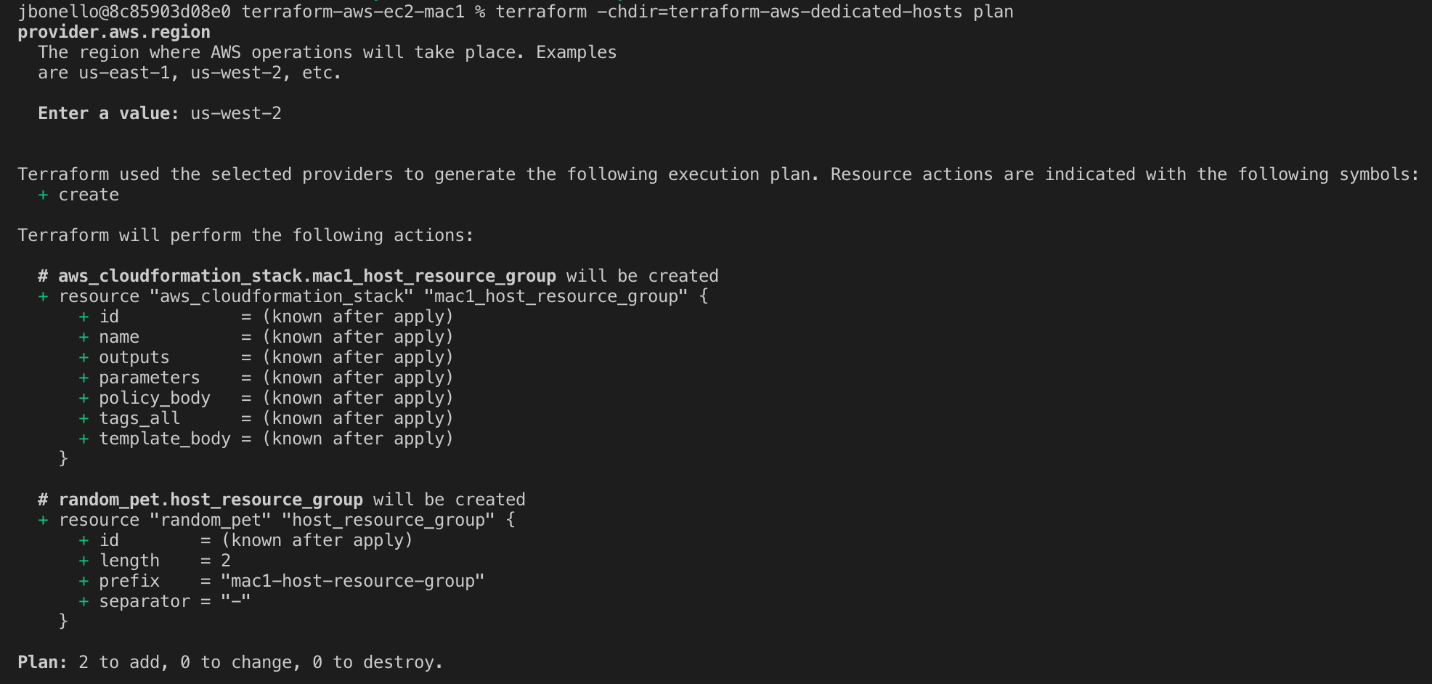
Then, we will plan our Terraform deployment and verify what we will be building before deployment.

terraform -chdir=terraform-aws-dedicated-hosts plan

In our case, we will expect a CloudFormation Stack and a Host Resource Group.

Planning Terraform template and showing an example of expected output.

Then, apply our Terraform deployment and verify via the AWS Management Console.

terraform -chdir=terraform-aws-dedicated-hosts apply -auto-approve

Applying Terraform template and showing an example of expected output.

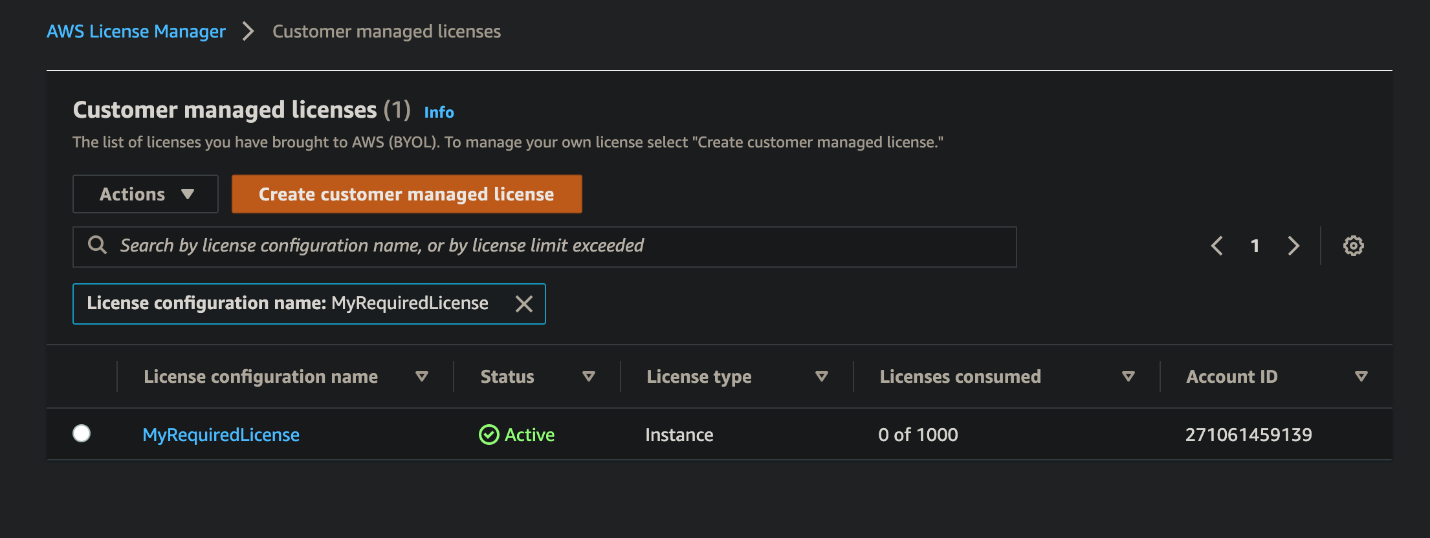
Check that the License Configuration has been made in License Manager with a name similar to MyRequiredLicense.

Example of License Manager License after Terraform Template is applied.

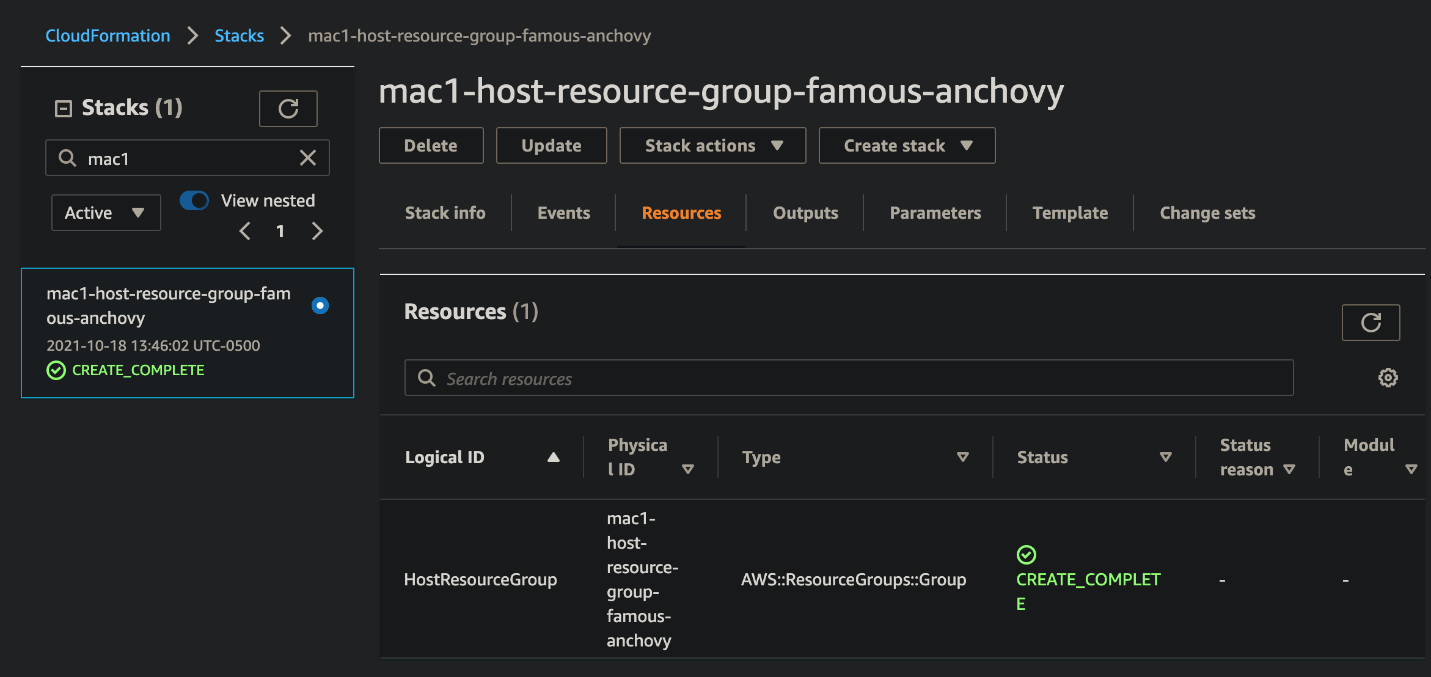
Check that the Host Resource Group has been made in the AWS Management Console. Ensure that the name is similar to mac1-host-resource-group-famous-anchovy.

Example of Cloudformation Stack that is created, with License Manager Host Resource Group name pictured.

Note the host resource group name in the HostResourceGroup “Physical ID” value for the next step.

Step 2: Deploy mac1.metal Auto Scaling Group

We will be taking similar steps as in Step 1 with a new component set.

Initialize your Terraform State:

terraform -chdir=terraform-aws-ec2-mac init

Then, update the following values in terraform-aws-ec2-mac/my.tfvars:

vpc_id : Check the ID of a VPC in the account where you are deploying. You will always have a “default” VPC.

subnet_ids : Check the ID of one or many subnets in your VPC.

hint: use https://us-west-2.console.aws.amazon.com/vpc/home?region=us-west-2#subnets

security_group_ids : Check the ID of a Security Group in the account where you are deploying. You will always have a “default” SG.

host_resource_group_cfn_stack_name : Use the Host Resource Group Name value from the previous step.

Then, plan your deployment using the following:

terraform -chdir=terraform-aws-ec2-mac plan -var-file="my.tfvars"

Once we’re ready to deploy, utilize Terraform to apply the following:

terraform -chdir=terraform-aws-ec2-mac apply -var-file="my.tfvars" -auto-approve

Note, this will take three to five minutes to complete.

Step 3: Verify Deployment

Check our Auto Scaling Group in the AWS Management Console for a group named something like “ec2-native-xxxx”. Verify all attributes that we care about, including the underlying EC2.

Example of Autoscaling Group listing the EC2 Instances with mac1.metal instance type showing InService after Terraform Template is applied.

Check our Elastic Load Balancer in the AWS Management Console with a Tag key “Name” and the value of your Auto Scaling Group.

Check for the existence of our Dedicated Hosts in the AWS Management Console.

Step 4: Test Scaling Features

Now we have the entire infrastructure in place for an Auto Scaling Group to conduct normal activity. We will test with a scale-out behavior, then a scale-in behavior. We will force operations by updating the desired count of the Auto Scaling Group.

For scaling out, update the my.tfvars variable number_of_instances to three from two, and then apply our terraform template. We will expect to see one more EC2 instance for a total of three instances, with three Dedicated Hosts.

terraform -chdir=terraform-aws-ec2-mac apply -var-file="my.tfvars" -auto-approve

Then, take the steps in Step 3: Verify Deployment in order to check for expected behavior.

For scaling in, update the my.tfvars variable number_of_instances to one from three, and then apply our terraform template. We will expect your Auto Scaling Group to reduce to one active EC2 instance and have three Dedicated Hosts remaining until they are capable of being released 24 hours later.

terraform -chdir=terraform-aws-ec2-mac apply -var-file="my.tfvars" -auto-approve

Then, take the steps in Step 3: Verify Deployment in order to check for expected behavior.

Cleaning up

Complete the following steps in order to cleanup resources created by this exercise:

terraform -chdir=terraform-aws-ec2-mac destroy -var-file="my.tfvars" -auto-approve

This will take 10 to 12 minutes. Then, wait 24 hours for the Dedicated Hosts to be capable of being released, and then destroy the next template. We recommend putting a reminder on your calendar to make sure that you don’t forget this step.

terraform -chdir=terraform-aws-dedicated-hosts destroy -auto-approve

Conclusion

In this post, we created an Auto Scaling Group using mac1.metal instance types. Scaling mechanisms will work as expected with standard EC2 instance types, and the management of Dedicated Hosts is automated. This enables the management of macOS based application workloads to be automated based on the Well Architected patterns. Furthermore, this automation allows for rapid reactions to surges of demand and reclamation of unused compute once the demand is cleared. Now you can augment this system to integrate with other AWS services, such as Elastic Load Balancing, Amazon Simple Cloud Storage (Amazon S3), Amazon Relational Database Service (Amazon RDS), and more.

Review the information available regarding CloudWatch custom metrics to discover possibilities for adding new ways for scaling your system. Now we would be eager to know what AWS solution you’re going to build with the content described by this blog post! To get started with EC2 Mac instances, please visit the product page.

Managing permissions with grants in AWS Key Management Service

Post Syndicated from Rick Yin original https://aws.amazon.com/blogs/security/managing-permissions-with-grants-in-aws-key-management-service/

AWS Key Management Service (AWS KMS) helps customers to use encryption to secure their data. When creating a new encrypted Amazon Web Services (AWS) resource, such as an Amazon Relational Database Service (Amazon RDS) database or an Amazon Simple Storage Service (Amazon S3) bucket, all you have to do is provide an AWS KMS key ID that you control and the data will be encrypted and the complexity of protecting and making encryption keys highly available is reduced.

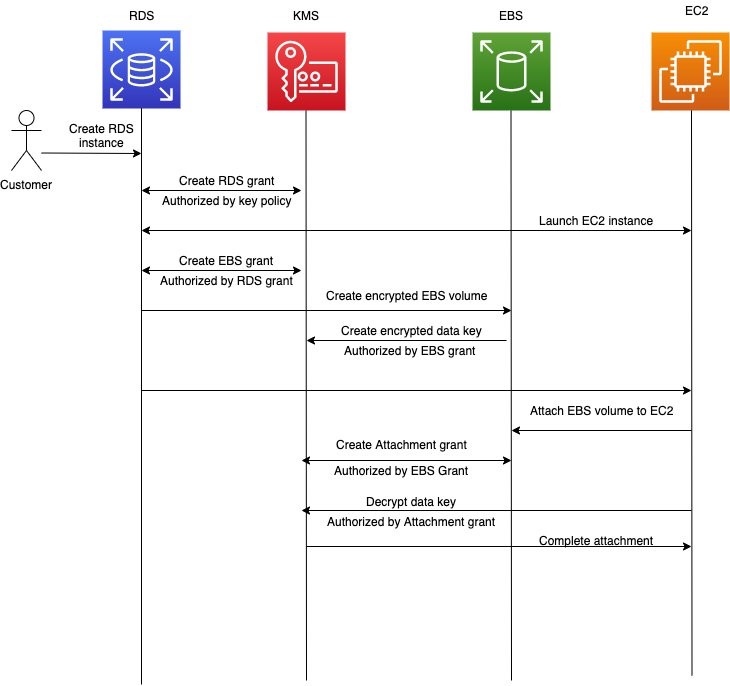
If you’re considering delegating encryption to an AWS service to use a key under your control when it encrypts your data in that service, you might wonder how to ensure the AWS service can only use your key when you want it to and not have full access to decrypt any of your resources at any time. The answer is to use scoped-down dynamic permissions in AWS KMS. Specifically, a combination of permissions that you define in the KMS key policy document along with additional permissions that are created dynamically using KMS grants define the conditions under which one or more AWS services can use your KMS keys to encrypt and decrypt your data.

In this blog post, I discuss:

  • An example of how an AWS service uses your KMS key policy and grants to securely manage access to your encryption keys. The example uses Amazon RDS and demonstrates how the block storage volume behind your database instance is encrypted.
  • Best practices for using grants from AWS KMS in your own workloads.
  • Recent performance improvements when using grants in AWS KMS.

Case study: How RDS uses grants from AWS KMS to encrypt your database volume

Many Amazon RDS instance types are hosted on an Amazon Elastic Compute Cloud (Amazon EC2) instance where the underlying storage layer is an Amazon Elastic Block Store (Amazon EBS) volume. The blocks of the EBS volume that stores the database content are encrypted under a randomly generated 256-bit symmetric data key that is itself encrypted under a KMS key that you configure RDS to use when you create your database instance. Let’s look at how RDS interacts with EBS, EC2, and AWS KMS to securely create an RDS instance using an KMS key.

When you send a request to RDS to create your database, there are several asynchronous requests being made among the RDS, EC2, EBS, and KMS services to:

  1. Create the underlying storage volume with a unique encryption key.
  2. Create the compute instance in EC2.
  3. Load the database engine into the EC2 instance.
  4. Give the EC2 instance permissions to use the encryption key to read and write data to the database storage volume.

The initial authenticated request that you make to RDS to create a new database is made by an AWS Identity and Access Management (IAM) principal in your account (e.g. a user or role). Once the request is received, a series of things has to happen:

  1. RDS needs to request EBS to create an encrypted volume to store your future data.
  2. EBS needs to request AWS KMS generate a unique 256-bit data key for the volume and encrypt it under the KMS key you told RDS to use.
  3. RDS then needs to request that EC2 launch an instance, attach that encrypted volume, and make the data key available to EC2 for use in reads and writes to the volume.

From your perspective, the IAM principal used to create the database also must have permissions in the KMS key policy for the GenerateDataKeyWithoutPlaintext and Decrypt actions. This enables the unique 256-bit data key to be created and encrypted under the desired KMS key as well as allowing the user or role to have the data key decrypted and provisioned to the Nitro card managing your EC2 instance so that reads/writes can happen from/to the database. Given the asynchronous nature of the process of creating the database vs. launching the database volume in the future, how do the RDS, EBS, and EC2 services all get the necessary least privileged permissions to create and provision the data key for use with your database? The answer starts with your IAM principal having permission for the AWS KMS CreateGrant action in the key policy.

RDS uses the identity from your IAM principal to create a grant in AWS KMS that allows it to create other grants for EC2 and EBS with very limited permissions that are further scoped down compared to the original permissions your IAM principal has on the AWS KMS key. A total of three grants are created:

  • The initial RDS grant.
  • A subsequent EBS grant that allows EBS to call AWS KMS and generate a 256-bit data key that is encrypted under the KMS key you defined when creating your database.
  • The attachment grant, which allows the specific EC2 instance hosting your database volume to decrypt the encrypted data key for and provision it for use during I/O between the instance and the EBS volume.

RDS grant

In this example, let’s say you’ve created an RDS instance with an ID of db-1234 and specified a KMS key for encryption. The following grant is created on the KMS key, allowing RDS to create more grants for EC2 and EBS to use in the asynchronous processes required to launch your database instance. The RDS grant is as follows:

{Grantee Principal: '<Regional RDS Service Account>', Encryption Context: '"aws:rds:db-id": "db-1234"', Operations: ['CreateGrant', 'Decrypt', 'GenerateDataKeyWithoutPlaintext']}

In plain English, this grant gives RDS permissions to use the KMS key for three specific operations (API actions) only when the call specifies the RDS instance ID db-1234 in the Encryption Context parameter. The grant provides access for the the grantee principal, which in this case is the value shown for the <Regional RDS service account>. This grant is created in AWS KMS and associated with your KMS key. Because the EC2 instance hasn’t yet been created and launched, the grantee principal cannot include the EC2 instance ID and must instead be the regional RDS service account.

EBS grant

With the RDS instance and initial AWS KMS grant created, RDS requests EC2 to launch an instance for the RDS database. EC2 creates an instance with a unique ID (e.g. i-1234567890abcdefg) using EC2 permissions you gave to the original IAM principal. In addition to the EC2 instance being created, RDS requests that Amazon EBS create an encrypted volume dedicated to the database. As a part of volume creation, EBS needs permission to call AWS KMS to generate a unique 256-bit data key for the volume and encrypt that data key under the KMS key you defined.

The EC2 instance ID is used as the name of the identity for future calls to AWS KMS, so RDS inserts it as the grantee principal in the EBS grant it creates. The EBS grant is as follows:

{Grantee Principal: '<RDS-Host-Role>:i-1234567890abcdefg', Encryption Context: '"aws:rds:db-id": "db-1234"', Operations: ['CreateGrant', 'Decrypt', 'GenerateDataKeyWithoutPlaintext']}}

You’ll notice that this grant uses the same encryption context as the initial RDS grant. However, now that we have the EC2 instance ID associated with the database ID, the permissions that EBS gets to use your key as the grantee principal can be scoped down to require both values. Once this grant is created, EBS can create the EBS volume (e.g. vol-0987654321gfedcba) and call AWS KMS to generate and encrypt a 256-bit data key that can only be used for that volume. This encrypted data key is stored by EBS in preparation for the volume attachment process.

Attachment grant

The final step in creating the RDS instance is to attach the EBS volume to the EC2 instance hosting your database. EC2 now uses the previously created EBS grant to create the attachment grant with the i-1234567890abcdefg instance identity. This grant allows EC2 to decrypt the encrypted data key, provision it to the Nitro card that manages the instance, and begin encrypting I/O to the EBS volume of the RDS database. The attachment grant in this example will be as follows:

{Grantee Principal: 'EC2 Instance Role:i-1234567890abcdefg', Encryption Context: '"aws:rds:db-id": "db-1234", "aws:ebs:id":"vol-0987654321gfedcba"', Operations: ['Decrypt']}

The attachment grant is the most restrictive of the three grants. It requires the caller to know the IDs of all the AWS entities involved: EC2 instance ID, EBS volume ID, and RDS database ID. This design ensures that your KMS key can only be used for decryption by these AWS services in order to launch the specific RDS database you want.

The encrypted EBS volume is now active and attached to the EC2 instance. Should you terminate the RDS instance, the services retire all the relevant KMS grants so they no longer have any permission to use your KMS key to decrypt the 256-bit data key required to decrypt data in your database. If you need to launch your encrypted database again, a similar set of three grants will be dynamically created with the RDS database, EC2 instance, and EBS volume IDs used to scope down permissions on the AWS KMS key.

The process described in the previous paragraphs is graphically shown in Figure 1:
 
Figure 1: How Amazon RDS uses Amazon EC2, Amazon EBS, and AWS KMS to create an encrypted RDS instance

Considering all the AWS KMS key permissions that are added and removed as a part of launching a database, you might ask why not just use the key policy document to make these changes? A KMS key allows only one key policy with a maximum document size of 32 KB. Because one key could be used to encrypt any number of AWS resources, trying to dynamically add and remove scoped-down permissions related to each resource to the key policy document creates two risks. First, the maximum allowable size of the key policy document (32KB) might be exceeded. Second, depending on how many resources are being accessed concurrently, you may exceed the request rate quota for the PutKeyPolicy API action in AWS KMS.

In contrast, there can be any number of grants on a given AWS KMS key, each grant specifying a scoped-down permission for the use of a KMS key with any AWS service that integrated with AWS KMS. Grant creation and deletion is also designed for much higher-volume request rates than modifications to the key policy document. Finally, permission to call PutKeyPolicy is a highly privileged permission, as it lets the caller make unrestricted changes to the permissions on the key, including changes to administrative permissions to disable or schedule the key for deletion. Grants on a key can only allow permissions to use the key, not administer the key. Also, grants that allow the creation of other grants by other IAM principals prohibit the escalation of privilege. In the RDS example above, the permissions RDS receives from the IAM principal in your account during the first CreateGrant request cannot be more permissive than what you defined for the IAM principal in the KMS key policy. The permissions RDS gives to EC2 and EBS during the database creation process cannot be more permissive than the original permission RDS has from the initial grant. This design ensures that AWS services cannot escalate their privileges and use your KMS key for purposes different than what you intend.

Best practices for using AWS KMS grants

AWS KMS grants are a powerful tool to dynamically define permissions to use keys. They are automatically created when you use server-side encryption features in various AWS services. You can also use grants to control permission in your own applications that perform client-side encryption. Here are some best practices to consider:

  • Design the permissions to be as scoped down as possible. Use a specific grantee principal, such as an IAM role, and give the principal access only to the AWS KMS API actions that are needed. You can further limit the scope of grants with the Encryption Context parameter by using any element you want to ensure callers are using the AWS KMS key only for the intended purpose. Below is a specific example that grants AWS account 123456789012 permission to call the GenerateDataKey or Decrypt APIs, but only if the supplied encryption context for customerID is 5678.
    {Actions: 'GenerateDataKey, Decrypt', Grantee Principal: '123456789012', Encryption Context: '"customerID": "5678"'}
    

    This grant could prevent your application from decrypting data belonging to customer “5678” without explicitly passing the expected customerID in the request to AWS KMS. This may be a useful defense-in-depth mechanism to prevent unauthorized access to your customers’ data if your application’s AWS credentials were compromised and used from a different caller who doesn’t know that encryption context is a required parameter for all reads and writes in order to encrypt and decrypt data.

    For more information on how you can use encryption context in AWS KMS permissions, requests, and AWS CloudTrail logs, see How to Protect the Integrity of Your Encrypted Data by Using AWS Key Management Service and EncryptionContext.

  • Remember that grants don’t automatically expire. Your code needs to retire or revoke them once you know the permission is no longer needed on the KMS key. Grants that aren’t retired are leftover permissions that might create a security risk for encrypted resources. See retiring and revoking grants in the AWS KMS developer guide for more detail.
  • Avoid creating duplicate grants. A duplicate grant is a grant that shares the same AWS KMS key ID, API actions, grantee principal, encryption context, and name. If you retire the original grant after use and not the duplicates, then the leftover duplicate grants can lead to unintended access to encrypt or decrypt data.

Recent performance improvements to AWS KMS grants: Removing a resource quota

For customers who use AWS KMS to encrypt resources in AWS services that use grants, there used to be cases where AWS KMS had to enforce a quota on the number of concurrently active resources that could be encrypted under the same KMS key. For example, customers of Amazon RDS, Amazon WorkSpaces, or Amazon EBS would run into this quota at very large scale. This was the Grants for a given principal per key quota and was previously set to 500. You might have seen the error message “Keys only support 500 grants per grantee principal in this region” when trying to create a resource in one of these services.

We recently made a change to AWS KMS to remove this quota entirely and this error message no longer exists. With this quota removed, you can now attach unlimited grants to any KMS key when using any AWS service.

Summary

In this blog post, you’ve seen how services such as Amazon RDS use AWS KMS grants to pass scoped-down permissions through the Amazon EC2 and Amazon EBS instances. You also saw some best practices for using AWS KMS grants in your own applications. Finally, you learned about how AWS KMS has improved grants by removing one of the resource quotas.

Below are some additional resources for AWS KMS and grants.

If you have feedback about this post, submit comments in the Comments section below.

Want more AWS Security how-to content, news, and feature announcements? Follow us on Twitter.

Author

Rick Yin

Rick is a software development engineer on the AWS KMS team. His current focus is helping to scale AWS KMS to meet increasing customer demand by making sure we can serve our requests at ultra-low latency and ultra-high availability. In his free time, Rick enjoys learning about history and trying to stay in shape. He has recently taken up rowing.

Чии мутри обграждат президента и Мая Манолова в Бургас?

Post Syndicated from Екип на Биволъ original https://bivol.bg/%D1%87%D0%B8%D0%B8-%D0%BC%D1%83%D1%82%D1%80%D0%B8-%D0%BE%D0%B1%D0%B3%D1%80%D0%B0%D0%B6%D0%B4%D0%B0%D1%82-%D0%BF%D1%80%D0%B5%D0%B7%D0%B8%D0%B4%D0%B5%D0%BD%D1%82%D0%B0-%D0%B8-%D0%BC%D0%B0%D1%8F-%D0%BC.html

вторник 9 ноември 2021


Противоречива е информацията кой е пратил яките гологлави момчета с качулки на срещата на президента Румен Радев, вицепрезидентката Илияна Йотова и лидерката на „Изправи се! Ние идваме!“ Мая Манолова в…

Creating a costs analytics view to email campaign generated by Amazon Pinpoint

Post Syndicated from rafaaws original https://aws.amazon.com/blogs/messaging-and-targeting/creating-a-costs-analytics-view-to-email-campaign-generated-by-amazon-pinpoint/

Introduction

Many companies have multiple departments using different campaigns in the same AWS account on Amazon Pinpoint and need to split costs at the end of each month between the owners of each campaign. To do this, companies need an easy way to find how much each campaign has generated of cost, since the Amazon Pinpoint console doesn’t have this information. To solution this, it is possible combine some AWS services to find out these costs.

In this post, I will demonstrate how AWS analytics and storage services such as Amazon Kinesis, AWS Glue, Amazon Athena, Amazon Quicksight and Amazon Simple Storage Service (Amazon S3) can help you create an analytical view of the costs generated by emails sent through each campaign on Amazon Pinpoint. Not include transactional and Amazon Journey e-mails on the example.

Amazon Pinpoint is an AWS service that helps companies to engage their customers across multiple channels. You can use the Amazon Pinpoint to send email, SMS, push notifications and voice messages to deliver one-off demands or across campaigns.

In this blog, you will learn how to create a dashboard with total cost of emails sent and MTA (Monthly Targeted Audience) by each campaign. With this information, you will be able to distribute costs internally to each department responsible for each campaign on Amazon Pinpoint.

Solution Overview

To create this dashboard, we will take advantage of the Digital User Engagement Events Database solution. We can use an AWS CloudFormation template that set up Amazon Pinpoint event flow. This solution uses the Amazon Kinesis to stream all events about campaigns to a bucket on Amazon S3. After that, a data processing task is performed by AWS Lambda and cataloged on AWS Glue. Some views will be created on Amazon Athena to organize all data and we will use them to calculating and analyzing the Pinpoint costs. For more information about the solution, architecture and how AWS CloudFormation template works to automate the deployment, please visit the Implementation Guide page.

During the deployment process, you will have the option to create a new Amazon Pinpoint project to manage your campaigns or use an existing one.

Prerequisites

1. Complete the Digital User Engagement Events Database implementation.

2. Have an e-mail campaign on Amazon Pinpoint created with some emails already sent.

Analytics View

All events created by Amazon Pinpoint through the campaigns after the Digital Use Engagement Events Database implementation is complete should be appearing in parquet file format in the Amazon S3. If your campaign did not generate any events after the AWS CloudFormation was completed, I recommend creating and executing a new email campaign just to test this solution. Any test email sent during the implementation of this solution will incur charges. The email costs will be explained during this blog.

After the entire Amazon Pinpoint event flow has worked correctly, some modifications on the views created in Amazon Athena must be made. These changes will help to access the information about the quantity of endpoints registered by each campaign of your project. For this, the following steps are required:

To create a new view

1. Open the Amazon Athena console.

2. Under Database, choose the database name created by AWS CloudFormation template.

You will notice a table called “all events” and some views, eg. campaign_send, email_open, email_send and others. These views are responsible to improve the organization of data sent by Amazon Pinpoint, eg. in the campaign_send view it is possible to see all informations about all events that Amazon Pinpoint sends across the campaign by multiple channels.

3. Choose Create view.

A tab will be added on the center page so you can add your command which will be responsible to created a new view.

4. Replace the existing text to the command below and choose Run query.

CREATE OR REPLACE VIEW endpoint_unit AS
SELECT DISTINCT
client.client_id endpoint_id
, "min"("from_unixtime"((event_timestamp / 1000))) event_timestamp
, "month"("from_unixtime"((event_timestamp / 1000))) month_data
, "year"("from_unixtime"((event_timestamp / 1000))) year_data
FROM
all_events
WHERE (event_type = '_campaign.send')
GROUP BY client.client_id, "month"("from_unixtime"((event_timestamp / 1000))), "year"("from_unixtime"((event_timestamp / 1000)))

In this command we are creating a new view, grouping all the endpoints already used by campaigns, along with the earliest date and time that the endpoint was registered. This command will help you identify the first campaign that used the endpoint in each month and year.

Once the new view is created, you will notice that it is listed in the views pane with the name endpoint_unit. You can run this view to check which values are returned.

5. Choose Preview in the endpoint_unit view to return the results.

Example:

The data displayed refer only to the information of the endpoints used in campaigns after the implementation of the Digital User Engagement Events Database.

Now is the time to create the analytical view in Amazon Quicksight.

To check Amazon Quicksight Region

1. Open the Amazon Quicksight console.

If this is your first time using Amazon Quicksight, a page will appear to subscribe to the services, feel free to choose the best option for your business.

Warning: Some costs might occur by using Amazon Quicksight. Check the Amazon Quicksight Pricing page for more information.

2. On top of the screen, choose <Role>/<Account-Name> and select the region where you have the Amazon Pinpoint project.

To check Amazon Quicksight Permissions

Check the permission of the Amazon Quicksight to enable the access to Amazon S3 bucket.

1. On top of the screen, choose <Role>/<Account-Name>, Manage Quicksight.

2. In navigation pane, choose Security & permissions.

3. Under QuickSight access to AWS services, choose Add or remove.

4. Inside the QuickSight access to AWS services table, under Amazon S3, choose Details.

5. Choose Select S3 buckets.

6. Check if the Amazon S3 bucket name checkbox containing all stream files is selected. If not, select the checkbox and choose Finish and Update.

Create a Dataset for Campaign cost

1. Back to the Amazon Quicksight main page.

2. In the navigation page, choose Datasets, New dataset.

3. Choose Athena.

Now, let’s add the table containing information regarding the number of emails sent per Amazon Pinpoint campaign.

4. In the New Athena data source dialog box, do the following:

a. For Data source name, type a name.

b. Choose Create data source.

5. In the Choose your table dialog box, do the following:

a. Choose Use custom SQL.

b. In first field, enter a name for the custom SQL.

c. In second field, paste the command below.

SELECT * FROM "due_eventdb"."campaign_send" where (message_tags['delivery_type'] = 'EMAIL')

This command is filtering only events of campaign based on emails.

d. Choose Confirm query.

6. In the Finish dataset creation dialog box, you will be asked to select between storing a copy of the data of this table in SPICE or performing a query directly from data source. Feel free to choose the best option for your business.

7. Choose Visualize.

After creating the dataset, you will be redirected to the Amazon Quicksight analytics creation page.

As the information sent by Amazon Pinpoint does not have the unit cost of each email sent, we will use three features called Parameters, Control and Calculated Field to calculate these amounts.

Parameters are named variables that can transfer a value for use by an action or an object. To make the parameters accessible to the dashboard viewer, you add a parameter control.

The calculated fields help you to transform your data by using one or more of the actions: Operators, Functions, Aggregate functions, Fields that contain data or other calculated fields.

Create an Amazon QuickSight parameter

1. In the navigation bar, choose + Add at the top of the screen.

2. Choose Add parameter.

3. In the Create new parameter dialog box, do the following:

a. For Name, type the name for the parameter, eg. Costemail.

b. For Data type, choose number.

c. For Values, select Single value.

d. For Static default value enter the unit cost of email. The cost of each Amazon Pinpoint email can be found on Amazon Pinpoint Pricing page.

e. Choose Create and Close.

Important: All costs in this blog will be calculated in USD.

After creating the first parameters, we need to create a manual control of these costs.

Create an Amazon QuickSight control

1. In the navigation pane, choose Parameters.

2. Under the name of parameters that you previously created, choose Add control.

3.  In the Add control dialog box, do the following:

a. For Display name, enter a name.

b. For Style, choose Text field.

c. Choose Add.

This control will help you in the future if you need to change the unit price without changing the Parameters configuration.

We now need to create the Calculate Field. It multiplying the total sent emails value by the unit costs.

Create an Amazon QuickSight calculated field

1. In the navigation bar, choose + Add at the top of the screen again.

2. Choose add calculated field.

3. In add name field, type a name.

4. Paste the expression below.

count({pinpoint_campaign_id}) * ${name_parameters}

5. Replace the “name_parameters” in the expression with the name of the Parameter you created earlier.

6. Choose Save.

We now have all fields available to create the chart on Quicksight.

Create an Amazon QuickSight dashboard

1. In the navigation page, choose Visualize.

2. Under Visual type, choose Vertical bar chart.

Note: If you prefer, you can change it later to other visual type.

3. Choose the fields pinpoint_campaign_id, calculated field that you just created and event_timestamp. Drag each field to X axis, value and group/color to create the chart.

Example:

In this example, you can see the cost in USD x Amazon Pinpoint Campaign ID between April and May 2021.

If you prefer, you can customize your chart in Format Visual. You can also build another view to show the amount of emails sent per campaign.

4. In the navigation bar, choose Share.

5. Choose Publish dashboard.

6. In the Publish a dashboard dialog box, under Publish new dashboard as, type a name.

7. Choose Publish dashboard.

If you want, you can share your dashboard with other username, group, or email address.

Now that we have the total costs of emails per each campaign, let’s create the chart for the total endpoint cost for each campaign.

Create a Dataset for MTA cost

1. Back to the Amazon Quicksight main page.

2. In the navigation page, choose Datasets, New dataset.

3. Choose Athena.

4. In the New Athena data source dialog box, do the following:

a. For Data source name, type a name.

b. Choose Create data source.

5. In the Choose your table dialog box, do the following:

a. Choose Use custom SQL.

b. In first field, enter a name for the custom SQL.

c. In second field, paste the command below.

SELECT distinct c.endpoint_id, e.pinpoint_campaign_id, c.event_timestamp
FROM "due_eventdb"."campaign_send" e
INNER JOIN "due_eventdb"."endpoint_unit" c ON c.event_timestamp = e.event_timestamp

d. Choose Confirm query.

6. In the Finish dataset creation dialog box, you will be asked to select between storing a copy of the data of this table in SPICE or performing a query directly from data source. Feel free to choose the best option for your business.

7. Choose Visualize.

This command is responsible to join the pinpoint_campaign view with the endpoint_unit view. This command will return the campaign ID responsible for contacting the endpoint for the first time on each month.

8. After the dataset is created, repeat the same steps to create a new Parameter, Control and Calculated Field on section Create an Amazon QuickSight parameter, Create an Amazon QuickSight control and Create an Amazon QuickSight calculated field, but when creating a new Parameter, you will use the unit cost of each endpoint, currently it is described on the Amazon Pinpoint Pricing page as Monthly Targeted Audience (MTA).

If you send messages from an Amazon Pinpoint campaign or journey, the unique endpoints you contact are known as a monthly targeted audience (MTA). You are charged on the number of MTAs targeted in a calendar month.

Important: In this calculation we are not considering the subtraction of the free tier values.

In the process of creating Calculated Field, use the following expression:

count({endpoint_id}) * ${name_parameters}

Also remember to replace the name_parameters field in the expression with the name of the parameter that you previously created in point 8 on Create a Dataset for MTA cost section to calculate the costs of endpoints.
In this expression you are calculating the MTA for the distinct endpoint contacted per month.

After this, you will also have all the required fields to create your total cost chart of endpoint per campaign. In this case, use the fields pinpoint_campaign_id, calculated field that you created earlier and event_timestamp.

Example:

In this example, you can see the MTA cost in USD x Amazon Pinpoint Campaign ID between April and May 2021.

Some customers usually have tens or hundreds of campaigns, on this case you can use the Filter option in the navigation pane to a specify a range of date.

Optional: If you prefer you can combine the email and MTA cost in the same Analyses and Dashboard.

Add more datasets in the same Analyses and Dashboard

1. Back to the Amazon Quicksight main page.

2. In the navigation page, choose Analyses.

3. Choose the email cost Analyses that you created on section Create an Amazon QuickSight dashboard.

4. Choose the pencil icon on Dataset option near to the Navigation page.

5. Choose add dataset.

6. In the Choose dataset to add dialog box, choose the dataset you created on section Create a Dataset for MTA cost.

7. Choose Select.

Now you can create each parameter, control and calculated field per dataset on the same Analyses and publish all charts on same dashboard.

Cleanup

To avoid incurring charges, navigate to AWS Cloudformation console and delete the stack that you used on Digital User Engagement Events Database solutions procedure.

After the stack is deleted, you also need to delete your dashboards, analyses and datasets on Amazon Quicksight. You can also delete the stream events data in your Amazon S3 bucket.

Conclusion

In this blog, we used the total cost of email sent and endpoints to create the charts, but it is possible to obtain several analyses in Quicksight using the views that became available in the Digital User Engagement Events Database solution, such as costs for push notifications and other types of channels.

Also try creating dashboards with other Amazon Pinpoint channels

To do this, use this same procedure, explore the view campaign_send to find all data about other channels and modify the SQL queries on Amazon Quicksight to create your dashboards.


About the Author

Rafael Rodrigues is an Enterprise Solution Architect for AWS based in Sao Paulo, Brazil. He helps customers innovate with modern IT architecture on cloud computing.

OWASP Top 10 Deep Dive: Getting a Clear View on Vulnerable and Outdated Components

Post Syndicated from Amukta Nayak original https://blog.rapid7.com/2021/11/08/owasp-top-10-deep-dive-getting-a-clear-view-on-vulnerable-and-outdated-components/

OWASP Top 10 Deep Dive: Getting a Clear View on Vulnerable and Outdated Components

Most of us think of climbing the ladder as a good thing — but when the ladder in question is OWASP’s Top 10 list of application security risks, a sudden upward trajectory is cause for alarm rather than encouragement.

In the 2021 edition of the OWASP list, vulnerable and outdated components moved up 3 positions from 9th place to 6th. This change in status reflects the increasing importance of this vulnerability in modern application development — and the growing worry with which the security community views this risk. In fact, it was rated at No. 2 in the OWASP Top 10 community survey.

So, what’s behind the meteoric rise of this category in the minds of application security pros?

The challenge of visibility

The prevalence of vulnerable and outdated components — and the ease of attacks using this vector — make this an especially dangerous category. Almost all modern applications use open-source packages, and information about vulnerabilities related to these packages is widely available. Attackers who figure out what vulnerable packages you’re using can use exploits that are already available. That means you have a type of attack that is widespread and straightforward.

But while upgrading and managing vulnerable and outdated components might seem simple in theory, many organizations find that, in practice, the task is anything but easy.

To complicate matters further, modern applications are using an increasing number of third-party and open-source packages. Estimates suggest around 90% of modern applications are utilizing open-source components. With a large number of dependencies — including those often-overlooked nested dependencies — regularly scanning your source code and keeping up to date with security bulletins and remediation information is daunting.

With modern CI/CD pipelines and complex infrastructure, there’s a large gap between development and production, giving teams low visibility into what’s running on production instances. Between source code and application instances, there’s often complex machinery, multiple teams involved, and multiple points of failure. This makes it challenging for SOC analysts, incident responders, and security teams to get information they need, including:

  • The difference between vulnerabilities that are in production vs development
  • Vulnerability exposure duration
  • The difference between multiple application instances

Achieving clarity

Having the right tools in place to get a clearer view of this complex picture is key to understanding where there might be vulnerable components in your application build and remediating them quickly — before a vulnerability becomes a breach.

tCell by Rapid7 provides teams with an end-to-end approach that considers both development and production. After the application is deployed, the tCell server agent inspects packages at server startup and sends per-host package and version information to the tCell backend. Through a multitude of sources including Snyk Intel, NVD, and proprietary research, tCell is providing daily-updated vulnerability and remediation information, the tCell dashboard provides this information and more, including out-of-date packages and mismatched versions.

The packages dashboard shows a summary of packages and versions, filterable by vulnerabilities. This dashboard only has packages and versions that either were live at some point or are currently live on application instances. This helps filter out the noise for security teams, so they can see the real, critical issues and remediate them quickly.

OWASP Top 10 Deep Dive: Getting a Clear View on Vulnerable and Outdated Components

Each package in the package dashboard has an overview providing vulnerability and remediation information.

OWASP Top 10 Deep Dive: Getting a Clear View on Vulnerable and Outdated Components

As you drill further down, each package overview has information about exposure duration broken down per host.

OWASP Top 10 Deep Dive: Getting a Clear View on Vulnerable and Outdated Components

Any application that uses open-source and third-party packages is at risk for attacks that leverage vulnerable and outdated components. In modern application development, that’s nearly all of them.

But managing the many layers of dependencies inherent in applications that use open-source components is a challenging task for security teams, and the issues only grow worse with complex infrastructure between development and production. A tool like tCell can provide security teams the clarity they need to cut through the complexity of today’s application development and production workflows, catching vulnerable components early and patching them quickly.

Check out our previous post on this year’s top threat on the OWASP list: injection.

LXD 4.20 released

Post Syndicated from original https://lwn.net/Articles/875447/rss

The LXD team has announced
the release
of version 4.20 of the LXD system container and virtual
machine manager.

This is one very busy release with a lot of new features.

VM users will be happy to see the initial implementation of live migration and core scheduling support. Container users are getting new configuration keys to set sysctls.

Then the bulk of the new features are all network related with peer network relationships, network zones for auto-generated DNS and SR-IOV accelerated OVN networks.

And lastly, on the clustering front, it’s now possible to better control what servers will be receiving new workloads.

Implementing header-based API Gateway versioning with Amazon CloudFront

Post Syndicated from Eric Johnson original https://aws.amazon.com/blogs/compute/implementing-header-based-api-gateway-versioning-with-amazon-cloudfront/

This post is written by Amir Khairalomoum, Sr. Solutions Architect.

In this blog post, I show you how to use Lambda@Edge feature of Amazon CloudFront to implement a header-based API versioning solution for Amazon API Gateway.

Amazon API Gateway is a fully managed service that makes it easier for developers to create, publish, maintain, monitor, and secure APIs at any scale. Amazon CloudFront is a global content delivery network (CDN) service built for high-speed, low-latency performance, security, and developer ease-of-use. Lambda@Edge is a feature of Amazon CloudFront, a compute service that lets you run functions that customize the content that CloudFront delivers.

The example uses the AWS SAM CLI to build, deploy, and test the solution on AWS. The AWS Serverless Application Model (AWS SAM) is an open-source framework that you can use to build serverless applications on AWS. The AWS SAM CLI lets you locally build, test, and debug your applications defined by AWS SAM templates. You can also use the AWS SAM CLI to deploy your applications to AWS, or create secure continuous integration and deployment (CI/CD) pipelines.

After an API becomes publicly available, it is used by customers. As a service evolves, its contract also evolves to reflect new changes and capabilities. It’s safe to evolve a public API by adding new features but it’s not safe to change or remove existing features.

Any breaking changes may impact consumer’s applications and break them at runtime. API versioning is important to avoid breaking backward compatibility and breaking a contract. You need a clear strategy for API versioning to help consumers adopt them.

Versioning APIs

Two of the most commonly used API versioning strategies are URI versioning and header-based versioning.

URI versioning

This strategy is the most straightforward and the most commonly used approach. In this type of versioning, versions are explicitly defined as part of API URIs. These example URLs show how domain name, path, or query string parameters can be used to specify a version:

https://api.example.com/v1/myservice
https://apiv1.example.com/myservice
https://api.example.com/myservice?v=1

To deploy an API in API Gateway, the deployment is associated with a stage. A stage is a logical reference to a lifecycle state of your API (for example, dev, prod, beta, v2). As your API evolves, you can continue to deploy it to different stages as different versions of the API.

Header-based versioning

This strategy is another commonly used versioning approach. It uses HTTP headers to specify the desired version. It uses the “Accept” header for content negotiation or uses a custom header (for example, “APIVER” to indicate a version):

Accept:application/vnd.example.v1+json
APIVER:v1

This approach allows you to preserve URIs between versions. As a result, you have a cleaner and more understandable set of URLs. It is also easier to add versioning after design. However, you may need to deal with complexity of returning different versions of your resources.

Overview of solution

The target architecture for the solution uses Lambda@Edge. It dynamically routes a request to the relevant API version, based on the provided header:

Architecture overview

Architecture overview

In this architecture:

  1. The user sends a request with a relevant header, which can be either “Accept” or another custom header.
  2. This request reaches the CloudFront distribution and triggers the Lambda@Edge Origin Request.
  3. The Lambda@Edge function uses the provided header value and fetches data from an Amazon DynamoDB table. This table contains mappings for API versions. The function then modifies the Origin and the Host header of the request and returns it back to CloudFront.
  4. CloudFront sends the request to the relevant Amazon API Gateway URL.

In the next sections, I walk you through setting up the development environment and deploying and testing this solution.

Setting up the development environment

To deploy this solution on AWS, you use the AWS Cloud9 development environment.

  1. Go to the AWS Cloud9 web console. In the Region dropdown, make sure you’re using N. Virginia (us-east-1) Region.
  2. Select Create environment.
  3. On Step 1 – Name environment, enter a name for the environment, and choose Next step.
  4. On Step 2 – Configure settings, keep the existing environment settings.

    Console view of configuration settings

    Console view of configuration settings

  5. Choose Next step. Choose Create environment.

Deploying the solution

Now that the development environment is ready, you can proceed with the solution deployment. In this section, you download, build, and deploy a sample serverless application for the solution using AWS SAM.

Download the sample serverless application

The solution sample code is available on GitHub. Clone the repository and download the sample source code to your Cloud9 IDE environment by running the following command in the Cloud9 terminal window:

git clone https://github.com/aws-samples/amazon-api-gateway-header-based-versioning.git ./api-gateway-header-based-versioning

This sample includes:

  • template.yaml: Contains the AWS SAM template that defines your application’s AWS resources.
  • hello-world/: Contains the Lambda handler logic behind the API Gateway endpoints to return the hello world message.
  • edge-origin-request/: Contains the Lambda@Edge handler logic to query the API version mapping and modify the Origin and the Host header of the request.
  • init-db/: Contains the Lambda handler logic for a custom resource to populate sample DynamoDB table

Build your application

Run the following commands in order to first, change into the project directory, where the template.yaml file for the sample application is located then build your application:

cd ~/environment/api-gateway-header-based-versioning/
sam build

Output:

Build output

Build output

Deploy your application

Run the following command to deploy the application in guided mode for the first time then follow the on-screen prompts:

sam deploy --guided

Output:

Deploy output

Deploy output

The output shows the deployment of the AWS CloudFormation stack.

Testing the solution

This application implements all required components for the solution. It consists of two Amazon API Gateway endpoints backed by AWS Lambda functions. The deployment process also initializes the API Version Mapping DynamoDB table with the values provided earlier in the deployment process.

Run the following commands to see the created mappings:

STACK_NAME=$(grep stack_name ~/environment/api-gateway-header-based-versioning/samconfig.toml | awk -F\= '{gsub(/"/, "", $2); gsub(/ /, "", $2); print $2}')

DDB_TBL_NAME=$(aws cloudformation describe-stacks --region us-east-1 --stack-name $STACK_NAME --query 'Stacks[0].Outputs[?OutputKey==`DynamoDBTableName`].OutputValue' --output text) && echo $DDB_TBL_NAME

aws dynamodb scan --table-name $DDB_TBL_NAME

Output:

Table scan results

Table scan results

When a user sends a GET request to CloudFront, it routes the request to the relevant API Gateway endpoint version according to the provided header value. The Lambda function behind that API Gateway endpoint is invoked and returns a “hello world” message.

To send a request to the CloudFront distribution, which is created as part of the deployment process, first get its domain name from the deployed AWS CloudFormation stack:

CF_DISTRIBUTION=$(aws cloudformation describe-stacks --region us-east-1 --stack-name $STACK_NAME --query 'Stacks[0].Outputs[?OutputKey==`CFDistribution`].OutputValue' --output text) && echo $CF_DISTRIBUTION

Output:

Domain name results

Domain name results

You can now send a GET request along with the relevant header you specified during the deployment process to the CloudFront to test the application.

Run the following command to test the application for API version one. Note that if you entered a different value other than the default value provided during the deployment process, change the --header parameter to match your inputs:

curl -i -o - --silent -X GET "https://${CF_DISTRIBUTION}/hello" --header "Accept:application/vnd.example.v1+json" && echo

Output:

Curl results

Curl results

The response shows that CloudFront successfully routed the request to the API Gateway v1 endpoint as defined in the mapping Amazon DynamoDB table. API Gateway v1 endpoint received the request. The Lambda function behind the API Gateway v1 was invoked and returned a “hello world” message.

Now you can change the header value to v2 and run the command again this time to test the API version two:

curl -i -o - --silent -X GET "https://${CF_DISTRIBUTION}/hello" --header "Accept:application/vnd.example.v2+json" && echo

Output:

Curl results after header change

Curl results after header change

The response shows that CloudFront routed the request to the API Gateway v2 endpoint as defined in the mapping DynamoDB table. API Gateway v2 endpoint received the request. The Lambda function behind the API Gateway v2 was invoked and returned a “hello world” message.

This solution requires valid a header value on each individual request, so the application checks and raises an error if the header is missing or the header value is not valid.

You can remove the header parameter and run the command to test this scenario:

curl -i -o - --silent -X GET "https://${CF_DISTRIBUTION}/hello" && echo

Output:

No header causes a 403 error

No header causes a 403 error

The response shows that Lambda@Edge validated the request and raised an error to inform us that the request did not have a valid header.

Mitigating latency

In this solution, Lambda@Edge reads the API version mappings data from the DynamoDB table. Accessing external data at the edge can cause additional latency to the request. In order to mitigate the latency, solution uses following methods:

  1. Cache data in Lambda@Edge memory: As data is unlikely to change across many Lambda@Edge invocations, Lambda@Edge caches API version mappings data in the memory for a certain period of time. It reduces latency by avoiding an external network call for each individual request.
  2. Use Amazon DynamoDB global table: It brings data closer to the CloudFront distribution and reduces external network call latency.

Cleaning up

To clean up the resources provisioned as part of the solution:

  1. Run following command to delete the deployed application:
    sam delete
  2. Go to the AWS Cloud9 web console. Select the environment you created then choose Delete.

Conclusion

Header-based API versioning is a commonly used versioning strategy. This post shows how to use CloudFront to implement a header-based API versioning solution for API Gateway. It uses the AWS SAM CLI to build and deploy a sample serverless application to test the solution in the AWS Cloud.

To learn more about API Gateway, visit the API Gateway developer guide documentation, and for CloudFront, refer to Amazon CloudFront developer guide documentation.

For more serverless learning resources, visit Serverless Land.

The collective thoughts of the interwebz