It’s a vulnerability that allows someone to recover the order of ballots cast, newly exploited with AI tools.
Nearly four years since the original vulnerability was disclosed, I was still able to use it to analyze voter behavior in Georgia (one of the 21 states that uses affected scanners) in the recent May 2026 primary.
Notably, I never touched a voting machine, exploited a network, examined source code, or accessed anything non-public.
After pointing a coding agent to the original vulnerability paper, I supplied it with two data sources highlighted in the paper: the early-voting list for each county, and the “CVR” (cast-vote record) file, containing every ballot and its selections (but not the voters’ names or other identifying information). The CVR file is available upon request, precisely because a public, ballot-level record is what makes election results independently verifiable.
Researchers at a stealth startup in Israel scanned 6,214 live domains belonging to defense contractors, Fortune 500, and Big Tech companies. Of the 8,265 llms.txt and llms-full.txt files they found (many sites hosted both an llms.txt and an llms-full.txt file), 120 of them, each on a different site, pointed to one or more code packages or domain names that weren’t registered. To test what happens when an AI agent processes such files, the researchers registered a handful of the unclaimed names and hosted packages that caused any machine executing them to reach out to their server. Within an hour, the researchers received a phone-home response from a Fortune 500 company. Over time, they got a few dozen more, some from more Fortune 500 companies and others from startups. Their beacon also recorded the chain of parent processes that spawned each install, ultimately revealing that coding agents, including Claude, OpenAI’s Codex, and Nous Research’s Hermes, were involved. Anthropic, OpenAI, and Nous Research did not respond to requests for comment by the time of publication.
This kind of thing will be exploited. Think Solar Winds–style supply chain attacks.
“The trust model is broken,” Alon Hertz, one of the researchers, wrote in an interview. “Agents treat vendor docs as ground truth and don’t question themand neither do the humans supervising them. Agentic AI usage is exploding, and agents are spreading across every layerSaaS, cloud, endpoint. As they multiply, so does the supply-chain surface, and today’s guards don’t cover it.”
In Part 1 of this guide, we examined two common incident scenarios: cross-account Amazon Simple Storage Service (Amazon S3) data deletion with ransomware implications, and cryptocurrency mining deployed through AWS CloudFormation using exposed AWS Management Console credentials. We also introduced key incident response terminology and investigative frameworks for analyzing AWS CloudTrail events.
In this second part, we explore a more complex, multi-stage attack: how a web application vulnerability can cascade into credential harvesting and unauthorized access to Amazon Bedrock services across multiple AWS Regions. We also cover additional investigation techniques and hardening steps to strengthen your security posture.
Scenario 3: SSRF to IMDSv1 credential harvesting with multi-Region Amazon Bedrock service misuse
This scenario examines how a web application vulnerability can cascade into a multi-Region event targeting Amazon Bedrock services. The investigation demonstrates how threat actors chain together multiple techniques, using Amazon Elastic Compute Cloud (Amazon EC2) Instance Metadata Service version 1 (IMDSv1) through server-side request forgery (SSRF) and cross-Region pivoting to access Amazon Bedrock.
Your security team receives multiple alerts: failed AWS Identity and Access Management (IAM) operations in the us-east-1 Region, successful console sign-ins without multi-factor authentication (MFA), and unusual Amazon Bedrock API calls from us-east-2. Initially, these might seem like unrelated events across different services and Regions. However, as our Security Incident Response Team (SIRT) discovered, they represent a carefully orchestrated event chain that began with a web application vulnerability and culminated in unauthorized access to your organization’s AI infrastructure.
Architecture and progression
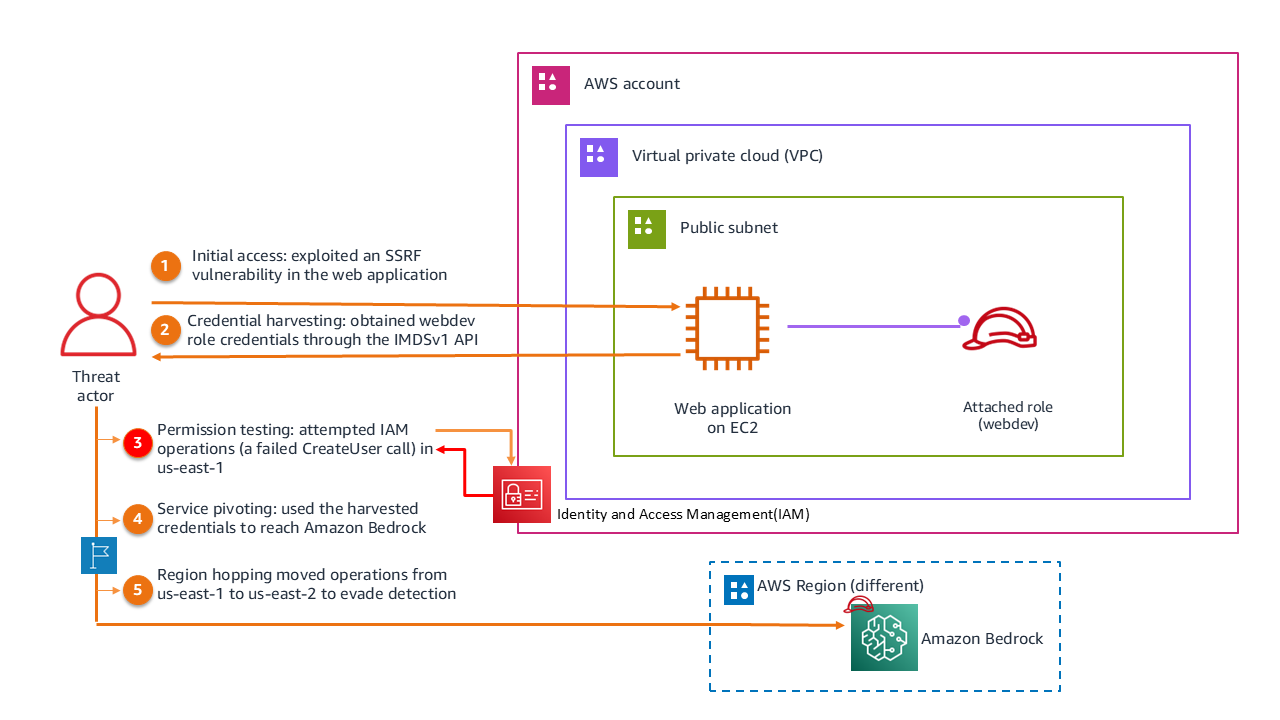
The architecture in figure 1 maps a multi-stage attack that exploits the trust relationship between Amazon Elastic Compute Cloud (Amazon EC2) instances and AWS services. A threat actor identified a server-side request forgery (SSRF) vulnerability in a web application running on an EC2 instance that had an attached webdev IAM role. Rather than attempting to escalate privileges directly, the threat actor used this foothold to reach the Instance Metadata Service version 1 (IMDSv1) endpoint and retrieve the temporary credentials issued to the webdev role. Because IMDSv1 returns credentials in response to a basic request with no session token, an SSRF flaw is enough to harvest them, which is why these credentials became the pivot point for everything that followed. The attack unfolded in five stages. Each stage is numbered in figure 1 so you can follow the progression from the initial web request through to the cross-Region Amazon Bedrock activity:
Initial access: The threat actor exploited the SSRF vulnerability in the web application to make server-side requests on the instance’s behalf.
Credential harvesting: Those requests reached the IMDSv1 endpoint and returned the temporary credentials for the webdev role.
Permission testing: Using the harvested credentials, the threat actor attempted IAM operations to probe the boundaries of what the role could do.
Service pivoting: When IAM actions were denied, the threat actor shifted focus to Amazon Bedrock, a service the role could reach.
Region hopping: The threat actor moved operations from us-east-1 to us-east-2, likely to evade Region-specific monitoring and access controls.
Figure 1: Scenario 3 architecture
CloudTrail evidence and structured extractions
In this section, we walk through the CloudTrail evidence that documents the attack from start to finish. Each of the four events that follow maps to one or more stages in the progression described previously, and together they trace how the threat actor moved from harvested credentials to active misuse of Amazon Bedrock. For each event, we present the relevant portion of the CloudTrail log record, highlight the fields that matter most for the investigation, and include a forensic legend that explains what each highlighted field reveals.
We cover the following events:
Permission boundary testing (15:53:49 UTC): A failed CreateUser call in us-east-1 that reveals the compromised role and the IMDSv1 credential source.
Console access establishment (15:59:29 UTC): A successful console sign-in without MFA, showing the pivot from programmatic to interactive access.
Bedrock service reconnaissance (17:20:00 UTC): A ListFoundationModels call in us-east-2 that marks the Region hop and the shift to AI services.
Active model exploitation (17:25:48 UTC): A Converse call that invokes the Amazon Nova Pro model, confirming unauthorized usage.
As you read each event, focus on how the fields connect one stage to the next. The same webdev role, the same source IP address, and the recurring ec2RoleDelivery value are the threads that tie these otherwise separate events into a single attack chain.
Event 1: Permission boundary testing (15:53:49 UTC): The first suspicious activity appeared as a failed CreateUser API call in us-east-1. The CloudTrail log records an AssumedRole session attempting to create an IAM user named adm1n but receiving an AccessDenied error. The webdev role is visible in the userIdentity field, readOnly is false (indicating a write operation attempt), and the user-agent shows AWS Command Line Interface (AWS CLI) on Windows, suggesting programmatic access from the harvested credentials.
Event 2: Console access establishment (15:59:29 UTC): Six minutes later, the threat actor successfully signed in to the AWS Management Console using the same credentials. The ConsoleLogin event records that MFA wasn’t used (MFAUsed: No), and the source IP (75.3.231.105) provides attribution data. The user agent indicates Chrome browser on Windows 10.
Event 3: Amazon Bedrock service reconnaissance (17:20:00 UTC): Nearly two hours later, the threat actor pivoted to Amazon Bedrock, making a ListFoundationModels API call in us-east-2. This event exhibits several patterns: a Region change from us-east-1 to us-east-2 (potential defense evasion), a shift from IAM to AI services, readOnly: true (reconnaissance rather than modification), and sessionCredentialFromConsole: “true”, which ties the call to the console session established in Event 2 rather than a fresh IMDSv1 credential retrieval.
 {
  "eventVersion": "1.11",
  "userIdentity": {
    "type": "AssumedRole",
    "arn": "arn:aws:sts::XXXXXXXXXXXX:assumed-role/webdev/i-0123456789abcdef0"
  },
  "eventTime": "2025-09-22T17:20:00Z",
  "eventSource": "bedrock.amazonaws.com",  ◄── ❶ Pivoted to cloud AI services
               ‾‾‾‾‾‾‾‾‾‾‾‾‾‾‾‾‾‾‾‾‾‾‾‾
  "eventName": "ListFoundationModels",  ◄── ❷ AI model reconnaissance
               ‾‾‾‾‾‾‾‾‾‾‾‾‾‾‾‾‾‾‾‾‾‾
  "awsRegion": "us-east-2",  ◄── ❸ Region hop (evasion technique)
               ‾‾‾‾‾‾‾‾‾‾‾
  "sourceIPAddress": "75.3.231.105",
  "readOnly": true,
  "tlsDetails": {
    "clientProvidedHostHeader": "bedrock.us-east-2.amazonaws.com"  ◄── ❹ Intentional alternate region targeting
                               ‾‾‾‾‾‾‾‾‾‾‾‾‾‾‾‾‾‾‾‾‾‾‾‾‾‾‾‾‾‾‾‾‾
  },
  "sessionCredentialFromConsole": "true"
}

───────────────────────────────────────────────────────────────────
  FORENSIC LEGEND
───────────────────────────────────────────────────────────────────
❶ eventSource: "bedrock.amazonaws.com"→ Attacker pivoted from IAM to managed AI services
❷ eventName: "ListFoundationModels"→ Reconnaissance: enumerating available AI models
❸ awsRegion: "us-east-2"→ Region hop from us-east-1 (defense evasion)
❹ clientProvidedHostHeader: "bedrock.us-east-2..."  → Confirms intentional targeting of alternate region endpoint
───────────────────────────────────────────────────────────────────
Event 4: Active model exploitation (17:25:48 UTC): Five minutes after the reconnaissance call, the threat actor moved from enumeration to active exploitation, invoking the Amazon Nova Pro model through the Converse API in us-east-2. The additionalEventData field quantifies the unauthorized usage at 944 input tokens and 126 output tokens, confirming that the threat actor successfully prompted the model and received a response.
 {
  "eventVersion": "1.11",
  "userIdentity": {
    "type": "AssumedRole",
    "arn": "arn:aws:sts::XXXXXXXXXXXX:assumed-role/webdev/i-0123456789abcdef0"
  },
  "eventTime": "2025-09-22T17:25:48Z",
  "eventSource": "bedrock.amazonaws.com",
  "eventName": "Converse",  ◄── ❶ Active model invocation (recon → exploitation)
               ‾‾‾‾‾‾‾‾‾‾
  "awsRegion": "us-east-2",
  "requestParameters": {
    "modelId": "amazon.nova-pro-v1:0",  ◄── ❷ Specific model being misused
               ‾‾‾‾‾‾‾‾‾‾‾‾‾‾‾‾‾‾‾‾‾‾
    "inferenceConfig": { "maxTokens": 1024 }
  },
  "responseElements": null,
  "additionalEventData": { "inputTokens": 944, "outputTokens": 126 }  ◄── ❸ Unauthorized usage quantified
                           ‾‾‾‾‾‾‾‾‾‾‾‾‾‾‾‾‾‾‾‾‾‾‾‾‾‾‾‾‾‾‾‾‾‾‾‾‾‾
}

───────────────────────────────────────────────────────────────────
  FORENSIC LEGEND
───────────────────────────────────────────────────────────────────
❶ eventName: "Converse"                → Attacker transitioned from reconnaissance to active exploitation
❷ modelId: "amazon.nova-pro-v1:0"      → Identifies the specific foundation model being misused
❸ inputTokens: 944, outputTokens: 126  → Quantifies unauthorized usage (financial cost + data exfiltration exposure)
───────────────────────────────────────────────────────────────────
Notable event fields to track
As you review the event logs, a handful of fields do most of the investigative work in this scenario. Understanding what each one reveals, and why it matters, is what turns a collection of individual log records into a coherent attack narrative.
The userIdentity field is the starting point for attribution. In this scenario it carries the EC2 instance ID as the session name, which is what let us trace the harvested credentials back to a specific compromised instance rather than a human user. Whenever you see an assumed-role session, this field answers the first question of any investigation: whose credentials are these, and where did they come from?
The readOnly field reveals the intent behind an action. A value of true marks reconnaissance, such as the ListFoundationModels call the threat actor used to enumerate available models, while false marks an attempt to change or use something, such as the CreateUser call or the Converse invocation. Sorting events by this field quickly separates the threat actor’s information gathering from the actions that caused actual impact.
The awsRegion field is easy to overlook, but in this scenario it exposed the threat actor’s evasion strategy. The shift from us-east-1 to us-east-2 wasn’t incidental; threat actors move between Regions because monitoring, alerting, and access controls are often configured inconsistently across them. Watching this field helps you spot activity that has deliberately moved away from where your detection is strongest.
Finally, the userIdentity.invokedBy field identifies when an AWS service, rather than a user or a set of harvested credentials, made the request on your behalf. CloudTrail populates it only when the caller is an AWS service, such as through a service-linked role, a service role, or a forward access session. It doesn’t appear in the events for this scenario because the threat actor called Amazon Bedrock directly with the harvested webdev credentials. That absence is itself informative: it confirms the requests came from a principal acting on its own rather than from a legitimate service-driven workflow. As agent-based and service-integrated Amazon Bedrock workloads become more common, checking this field separates expected service activity from credentials driven directly by a threat actor.
Investigation priorities
With the full attack chain mapped, from SSRF through credential harvesting to Amazon Bedrock service misuse, the investigation turned to a harder question: what did each stage actually cost us, and what would stop it from happening again? A few priorities shaped that work.
The first was figuring out where the credentials came from and how far the exposure reached. It was clear the threat actor had valid credentials for the webdev role, but the more useful question was why a web application role could reach Amazon Bedrock at all. The customer confirmed there was no business reason for it, so we needed to understand whether that permission was a deliberate misconfiguration or an oversight, and then look for other EC2 instances carrying the same role attachment. One compromised instance is an incident; a fleet of instances with the same over-scoped role is a much bigger problem waiting to happen.
Next, we wanted to know what the threat actor did after they got into Amazon Bedrock. Reconnaissance and active use carry very different consequences, so we traced which foundation models were touched and whether any were actually invoked or only enumerated. That distinction matters for scoping the damage, and it signals whether data exfiltration is a concern. Unusual model usage, unexpected prompt volume, or output patterns that don’t match any legitimate workload are the signals that reconnaissance has turned into something worse.
The Region hop was its own line of inquiry. The move from us-east-1 to us-east-2 was almost certainly deliberate, and the investigation focused on understanding what the threat actor gained by it. In practice, that meant comparing the two Regions: were the monitoring and access controls in us-east-2 weaker than in us-east-1, and what else did the threat actor reach in the secondary Region once they were there? Inconsistent controls across Regions are one of the most common ways activity slips past detection.
Tying it all together was the timeline, which shows how quickly the threat actor moved through the chain:
17:25:48: Active model invocation (Converse call) (us-east-2)
Following the credentials across those events fills in the rest of the story. IMDSv1 handed the threat actor temporary credentials for the webdev role, and the same role appears in every event that followed, which confirms the credentials were reused rather than replaced. Nowhere in that sequence was MFA required, and that single gap is what let one harvested credential stay useful across two hours, two Regions, and two very different services.
Incident response checklist
The following checklist captures the actions needed to contain the incident, remediate the vulnerability, and assess the scope of unauthorized AI service usage. Each item names where to look and what a finding looks like, so the checklist stays usable under the time pressure of a live incident.
Contain and remediate the entry point:
Identify the specific web application feature that made the outbound request (URL fetchers, webhook callbacks, PDF or image renderers, and link-preview generators are the usual culprits), then confirm it can reach http://169.254.169.254.
Audit the rest of the application for the same pattern, because one unvalidated URL parameter usually means others exist.
Enforce IMDSv2 on the affected instance and across the fleet with aws ec2 modify-instance-metadata-options --http-tokens required --http-put-response-hop-limit 1. Setting --http-tokens required means credentials are only returned when the caller presents a session token it obtained through a PUT request, which a basic SSRF cannot do. Setting the hop limit to 1 keeps the metadata response on the instance itself, so a request coming from a container or proxy an extra hop away never receives it.
Scope the Bedrock usage:
List the foundation models the webdev role could reach by reviewing its IAM policy and any resource-based policies, so you know the full set of models that were exposed, not only the one that was invoked.
Determine what was sent to and returned by the model. CloudTrail records the Converse call and the token counts, but only Amazon Bedrock model invocation logging captures the input prompts and model responses. If it was enabled, pull the log entries for the session; if it wasn’t, note that the prompt and response content can’t be recovered and enable it now.
Flag any compliance exposure based on what those prompts and responses contained. Unauthorized processing of regulated data (such as personally identifiable information (PII), protected health information (PHI), or cardholder data) through the model might trigger notification obligations.
Check for wider compromise and persistence:
Query CloudTrail across all Regions and services—not only Amazon Bedrock—for every event tied to the webdev role’s session, to confirm what else the same credentials touched.
Correlate the CloudTrail timestamps with VPC Flow Logs and application logs for source IP 75.3.231.105 to build the network-level picture around each API call.
Search for IAM write events from the session (CreateUser, CreateRole, CreateAccessKey, and AttachRolePolicy) that indicate an attempt to establish persistence beyond the temporary credentials. The failed adm1nCreateUser call is the known starting point; confirm nothing similar succeeded.
Watch for ongoing or hidden impact:
Review Amazon Bedrock usage in CloudWatch and your billing data for invocation spikes or unexpected token consumption that fall outside normal workload patterns.
Inspect the invocation logs for signs of sensitive data being processed or extracted through the model.
Check the same logs for prompt injection attempts, where the input tries to override the model’s instructions or extract system prompts.
Key takeaways
This scenario reveals how a single application vulnerability can cascade into broad unauthorized access when multiple security controls are missing. The following takeaways highlight the key defensive gaps and hardening priorities.
Least-privilege IAM for workload roles:The webdev role’s access to Amazon Bedrock across multiple Regions had no business justification for a web application workload, which the customer confirmed during the investigation. Apply least-privilege principles to EC2 instance roles by scoping permissions to only the services and actions the application requires. Use AWS IAM Access Analyzer to identify unused permissions and tighten policies proactively. Overly permissive roles transform a single application vulnerability into broad lateral movement across unrelated services.
IMDSv1 compared to IMDSv2: Organizations must immediately switch to IMDSv2 and disable IMDSv1 across their entire cloud infrastructure. The ec2RoleDelivery: “1.0" field in the logs explicitly confirms the use of IMDSv1, which permits credential retrieval without an authentication token. This architectural weakness makes SSRF-based credential theft trivial, because a web application flaw that can make an outbound request is enough to read the role’s temporary credentials with no further authentication. Transitioning to IMDSv2 mitigates this attack surface by enforcing local, session-based tokens, effectively breaking the threat actor’s exploitation chain. In this scenario, IMDSv2 alone would have stopped the attack at its first step.
Region-based defense evasion signals a deliberate operator: The shift from us-east-1 to us-east-2 for Amazon Bedrock access wasn’t incidental. Threat actors move between Regions because monitoring, alerting, and access controls are often configured inconsistently across them, and activity in a secondary Region is more likely to go unnoticed. This kind of cross-Region movement is a marker of operational security awareness rather than opportunistic access, and it should raise the priority of an investigation. Treat consistent detection coverage across all Regions, including the ones you do not actively use, as a baseline requirement.
Interface switching and permission probing reveal the threat actor’s method: This event chain reveals a threat actor comfortable moving between AWS interfaces and testing boundaries before committing. The failed CreateUser attempt was systematic probing to understand the scope of the harvested credentials, and when IAM actions were denied, the threat actor pivoted to a service the role could actually reach. The combination of programmatic access through the AWS CLI and interactive console access demonstrates the same adaptability. Recognizing this pattern of probe, adapt, and pivot helps responders anticipate the next move instead of reacting to each event in isolation.
AI services need visibility beyond CloudTrail: Amazon Bedrock and other AI services are high-value targets, and CloudTrail alone doesn’t capture the whole story. CloudTrail records who called Amazon Bedrock and whether the call succeeded, but not what was asked or answered. Enable Amazon Bedrock model invocation logging to capture full prompts and responses for compliance auditing. For agent-based workloads, Amazon Bedrock AgentCore Observability, built on AWS Distro for OpenTelemetry (ADOT), provides session-level traces showing tool execution order and latency. Consider also enabling Amazon GuardDuty AI Protection, which analyzes Amazon Bedrock-related CloudTrail activity to detect anomalous invocations, cost harvesting, and prompt injection attempts. Correlating these signals—CloudTrail, Model Invocation Logging, and agent telemetry—gives investigators the complete picture. For implementation guidance, see Monitoring and Auditing AI Workloads on AWS.
Advanced forensic indicators and evasion techniques
Beyond the specific attack patterns in this scenario, investigators should be aware of several evasion techniques that threat actors use to confuse defenders and blend into legitimate activity. The top three that we observe across incident response with customers are:
Root user compared to IAM user named root: When you first create an AWS account, you begin with a single sign-in identity that has complete access to all AWS services and resources in the account. This identity is called the AWS account root user. In some previous investigations, threat actors have also created IAM users in an AWS account named root. The difference is visible in the type field of the userIdentity element of the CloudTrail log record, which indicates the type of user that logged the record.
Role and user name imitation: Threat actors attempt defense evasion by creating names for IAM users and roles that imitate those reserved for use by AWS. For example, the service-linked role AWSServiceRoleForSupport is a unique IAM role linked directly to AWS Support. Threat actors have created roles with the name AWSServiceRoIeforSupport (note the use of an upper-case letter I instead of a lower-case letter l in Role) in an attempt to trick users into thinking actions taken by this role have been performed by AWS Support.
Users named HIDDEN_DUE_TO_SECURITY_REASONS: The userName field contains the string HIDDEN_DUE_TO_SECURITY_REASONS when the recorded event is a console sign-in failure caused by incorrect user name input. CloudTrail doesn’t record the contents in this case because the text could contain sensitive information. However, threat actors have used this string as an actual username to trick investigators into thinking the name has been obfuscated. This technique is usually associated with a corresponding CreateUser or CreateRole CloudTrail event.
Conclusion and next steps
CloudTrail event fields help security teams identify identities with unintended access, track threat actor actions, and remediate affected resources. Understanding fields like userIdentity, eventName, and sourceIPAddress improves incident investigation and threat detection. Implementing best practices such as enabling comprehensive logging, using Amazon Athena for analysis, securing logs, and automating responses helps ensure that CloudTrail serves as a robust forensic and incident response tool.
If you suspect unauthorized activity in your AWS environment, AWS Security Incident Response is available to help. The service continuously monitors and triages findings from Amazon GuardDuty and third-party security tools integrated through AWS Security Hub, automatically filtering alerts to surface the most relevant events. In addition to proactive triage, customers can initiate security cases through the service. You can choose to handle these cases internally or receive support from the Security Incident Response Team (SIRT), a dedicated group of security experts available at all times to assist with investigation, containment, and recovery throughout the incident lifecycle.
Additional resources
The following resources provide further guidance on securing your AWS environment and strengthening your investigative capabilities.
AWS CloudTrail logs contain the evidence you need when investigating suspicious activity in your AWS environment, but knowing which fields matter and how to interpret them can mean the difference between surface-level analysis and uncovering the full scope of an incident. This guide walks you through real-world scenarios, showing you how to analyze CloudTrail events to uncover cross-account unauthorized access, cryptocurrency mining operations, and AI service abuse. You’ll learn the investigative techniques our Security Incident Response Team (SIRT) team uses to handle threats, with practical methodologies you can apply to your own investigations.
Each scenario includes:
Architecture diagrams showing the event progression
Investigation frameworks with specific questions to ask
Lessons learned and preventive measures
Whether you’re in security operations, cloud engineering, compliance, or leadership, this guide provides the investigative mindset needed to move beyond basic CloudTrail queries to comprehensive security analysis.
Incident response definitions
Throughout this guide, we reference terminology commonly used in incident response and threat intelligence. We’ve provided definitions for key terms to help ensure this guide is accessible to readers from diverse backgrounds, whether you’re in security operations, cloud engineering, compliance, or leadership.
Reconnaissance: The initial phase where a threat actor gathers information about the target environment (for example, listing Amazon Simple Storage Service (Amazon S3) buckets or browsing available resources) to understand what’s available before taking action.
Enumeration: Systematically cataloging specific resources, users, or configurations within an environment to identify potential targets or access paths.
Lateral movement: When a threat actor moves from one resource to another within the same environment (for example, pivoting from an Amazon Elastic Compute Cloud (Amazon EC2) instance to an AI service) to expand their access.
Privilege escalation: Attempting to gain higher-level permissions than initially obtained, such as trying to create admin users or modify AWS Identity and Access Management (IAM) policies.
Defense evasion: Techniques used to avoid detection, such as operating in a different AWS Region where monitoring might be less robust, or naming unauthorized resources to look legitimate.
Persistence: Establishing ongoing access to an environment (for example, creating new IAM users or access keys) so the threat actor can return even if the original entry point is closed.
Credential harvesting: Stealing authentication credentials (passwords, access keys, temporary tokens) to impersonate legitimate users or roles.
Server-side request forgery (SSRF): A web application technique where an unauthorized user tricks a server into making requests on their behalf, often used to access internal services such as the Amazon EC2 Instance Metadata Service (IMDS) endpoint. For more information, see Understanding SSRF.
IMDSv1 (Instance Metadata Service v1): Amazon EC2 Instance Metadata Service version 1 (IMDSv1) provides temporary credentials to applications running on an instance. IMDSv1 itself isn’t inherently insecure; however, when an application with issues (for example, one susceptible to SSRF) is running on the instance, an unauthorized user can use that application to reach the metadata endpoint and retrieve credentials. IMDSv2 mitigates this risk by requiring session-based authentication tokens.
Indicators of compromise (IOCs): Observable artifacts (IP addresses, user agents, session names, resource names) that suggest unauthorized activity has occurred.
Exfiltration: The unauthorized transfer of data out of an environment, such as copying files before deleting them.
Event chain: The sequence of steps a threat actor follows from initial access to achieving their objective, where each step enables the next.
Pivot: Shifting from one technique, service, or Region to another during a security event, often after an initial approach is blocked or to avoid detection.
Scenario 1: Cross-account S3 data deletion with ransomware implications
Cross-account access is sometimes necessary in AWS, but misconfiguration creates security risks. In this scenario, your security operations center has received an automated alert that multiple objects have been deleted from the customer-important-data S3 bucket. The initial response seems straightforward: check the CloudTrail logs, identify who deleted the objects, and determine if it was authorized. But as our SIRT team investigated further, what appeared to be a straightforward unauthorized deletion revealed itself as a cross-account incident with ransomware implications. CloudTrail analysis requires recognizing patterns, understanding context, and thinking like a threat actor.
Scenario architecture
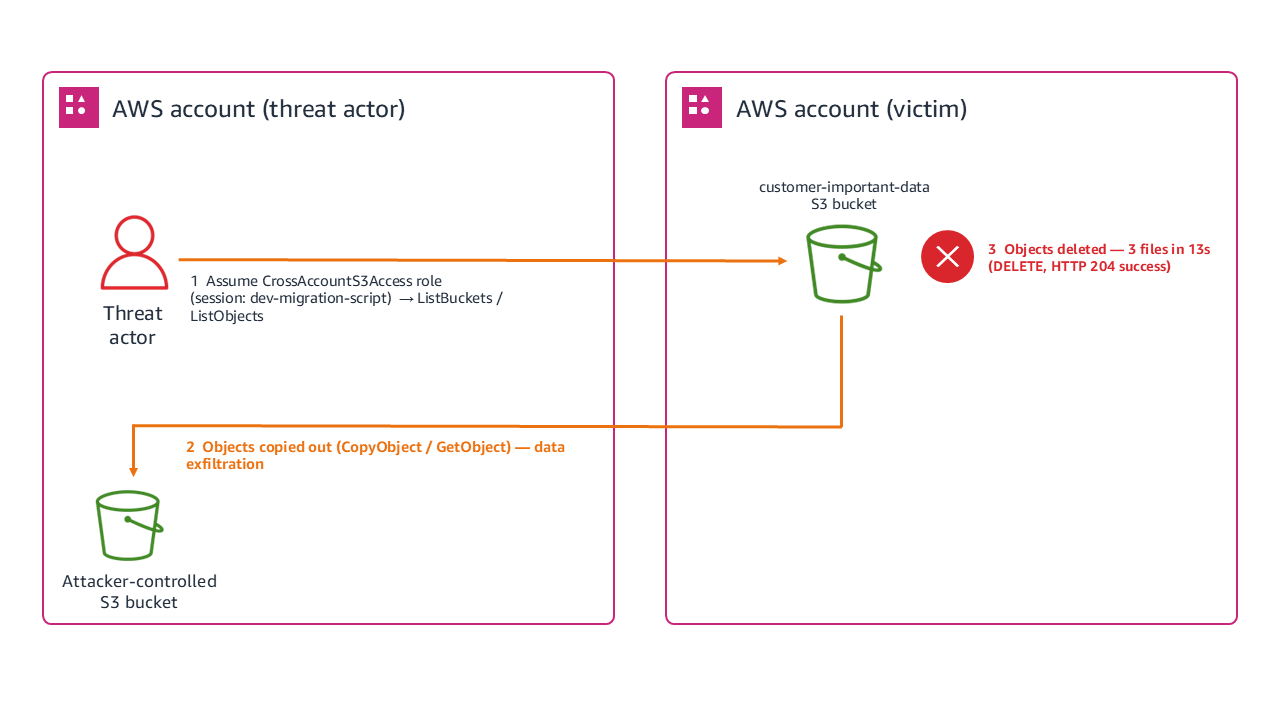
Figure 1 shows the architecture layout for accessing a trusted account and deleting objects from an S3 bucket, which is achieved through the following steps:
Threat actor assumes the CrossAccountS3Access role from a trusted account.
Lists S3 buckets to identify targets (ListBuckets API call).
Lists objects within the target bucket to catalog contents.
Executes scripted deletions of three files within 13 seconds.
Each deletion returns an HTTP 204 (successful) status code.
Figure 1: Scenario 1 architecture
Reconnaissance phase
Our investigation began with examining the CloudTrail logs, where we discovered that the unauthorized activity started with what many analysts might dismiss as routine activity: a ListBuckets API call made through an assumed role at 14:31:22 UTC. The CloudTrail entry contains a session named dev-migration-script using the CrossAccountS3Access role.
While cross-account access is common in enterprise environments, session names typically reflect legitimate business units. Attackers frequently use masquerading techniques, naming their sessions after common developer tasks or automation scripts, to blend seamlessly into daily operational noise. However, cross-referencing this session name against the external source IP and historical deployment logs confirmed that no such migration project was authorized, signaling a clear evasion attempt by a threat actor and the first indication of unauthorized access. Three seconds later, our logs showed a GET request to list objects in the bucket, which is classic reconnaissance behavior. The threat actor was cataloging available targets, using the same assumed role and IP address. This pattern, which you can see in the arn and eventname in the following log, showed us that the threat actor gathered intelligence, assessed targets, and planned their approach.
{
  "eventVersion": "1.08",
  "userIdentity": {
    "type": "AssumedRole",
    "principalId": "AROAEXAMPLE123456789:threat-actor-session",
    "arn": "arn:aws:sts::111122223333:assumed-role/CrossAccountS3Access/threat-actor-session"
  },
  "eventTime": "2025-01-20T14:31:22Z",
  "eventSource": "s3.amazonaws.com",
  "eventName": "ListBuckets",
  "sourceIPAddress": "203.0.113.47",
  "recipientAccountId": "444455556666"
}

──────────────────────────────────────────────────────────────────────────────────
  FORENSIC LEGEND
──────────────────────────────────────────────────────────────────────────────────
❶ arn: ".../CrossAccountS3Access/..."             → Cross-account role assumed; access came from another account
❷ Session name: "threat-actor-session"            → Custom session name attached at role assumption
❸ eventName: "ListBuckets"                        → Enumeration of all S3 buckets in the account (recon)
❹ principalId: "AROAEXAMPLE123456789:threat-actor-session" → Role's unique ID + attacker-chosen session label
❺ sourceIPAddress: "203.0.113.47"                 → Origin of the API call (RFC 5737 documentation IP range)
❻ recipientAccountId: "444455556666"              → AWS account that received/owned the request (fictional placeholder)
──────────────────────────────────────────────────────────────────────────────────
Systematic deletion
After completing their reconnaissance at 14:31:25 UTC, the threat actor went silent for 14 minutes before the first deletion at 14:45:12 UTC. During this window, the threat actor likely reviewed the inventory of objects they’d just enumerated, selected their highest-value targets (financial data, PII, and database backups), and prepared an automated deletion script to execute quickly once ready. We can infer this preparation period based on several factors: no other CloudTrail events from this session appeared during the 14-minute window, the subsequent deletions were precisely timed at 6-7 second intervals suggesting scripted execution, and the targets chosen were the three most business-critical files rather than a bulk delete of everything in the bucket. This selective, scripted approach indicates the threat actor used the reconnaissance data they gathered in the listing phase to build a targeted attack plan before executing it. Within 13 seconds (14:45:12–14:45:25 UTC), the threat actor deleted three files from the customer-important-data bucket: a financial report (q4-2024.xlsx at 14:45:12), a customer personally identifiable information (PII) database (pii-database.csv at 14:45:18), and a production database backup (prod-database-backup.sql at 14:45:25). Each deletion returned an HTTP 204 status code. The Amazon S3 access logs confirm these successful DELETE operations, all originating from the same session.
The 13-second deletion window wasn’t arbitrary. The user-agent string showed AWS Command Line Interface (AWS CLI) usage on Linux, and the precise timing suggested scripted execution rather than manual operations. This indicated preplanned targeting and automated execution to minimize the detection window.
The consistent source IP across events let us search for other suspicious activities from the same source, correlate with threat intelligence feeds, and identify potential lateral movement attempts.
The broad Amazon S3 permissions of the CrossAccountS3Access role raised questions about least privilege implementation, regular access reviews, and the business justification for such extensive cross-account permissions.
Investigation priorities
With confirmation that misconfigured cross-account access had been taken advantage of to delete data, the next step was to prioritize the investigation. In incident response, priority is driven by three factors: whether the threat actor still has active access (containment urgency), whether sensitive data was exposed or exfiltrated (regulatory and business impact), and whether the attack can spread to other resources or accounts (blast radius). We applied these factors to guide the following questions:
How did the threat actor gain access to theCrossAccountS3Accessrole? We examined the role’s trust policy and recent modifications, authentication events in both the trusting and trusted accounts, and other sessions using the same role around the same timeframe.
Were the files copied before deletion? We searched for GetObject operations on the same objects before the deletions, unusual network traffic patterns during the reconnaissance phase, and CopyObject activities that might indicate data theft.
Did the objects have specific significance? Understanding why these specific objects mattered helped us prioritize recovery efforts based on business impact, assess regulatory notification requirements for the PII exposure, and determine the full scope of business disruption from backup loss.
Response checklist
After identifying the scope of the cross-account deletion, the following steps help ensure a thorough response and prevent recurrence.
Determine if the business purpose served by this cross-account access is legitimate
Identify the corresponding authentication events that show how the role was assumed
Identify other AWS resources that this role might access beyond Amazon S3
Check for failed attempts or reconnaissance activities that preceded the successful event
Determine when this cross-account trust relationship was created
Determine when the last access review of this role was conducted
Locate any backup copies of the deleted data
Determine detection rules that can be used to catch similar activity in the future
Key takeaways
This scenario illustrates several principles that apply broadly to cross-account incident investigations. Unusual identifiers in session names often reveal threat actor intent or poor operational security. The progression from ListBuckets to targeted deletions shows how threat actors operate with a plan. Cross-account access needs extra scrutiny because trusted relationships become vectors for unauthorized access when credentials are exposed. Understanding why specific files matter helps prioritize response efforts and assess true impact. Precise timing and consistent technical signatures often indicate scripted events that need different response strategies than manual intrusions.
Scenario 2: Cryptocurrency mining using CloudFormation with console credentials
In this scenario, your finance team notices an unexpected spike in AWS costs, particularly around Amazon EC2 compute charges in the us-east-1 AWS Region. During the investigation, we examine how threat actors use legitimate console access to deploy cryptocurrency mining operations through AWS CloudFormation and how investigators can uncover the scope of resource hijacking events. We discover a CloudFormation stack named CRYPTO which you have no record or knowledge of being created. The stack contains EC2 instances running in your production Amazon Virtual Private Cloud (Amazon VPC) consuming significant compute resources, which signals an immediate security investigation.
Architecture and sequence
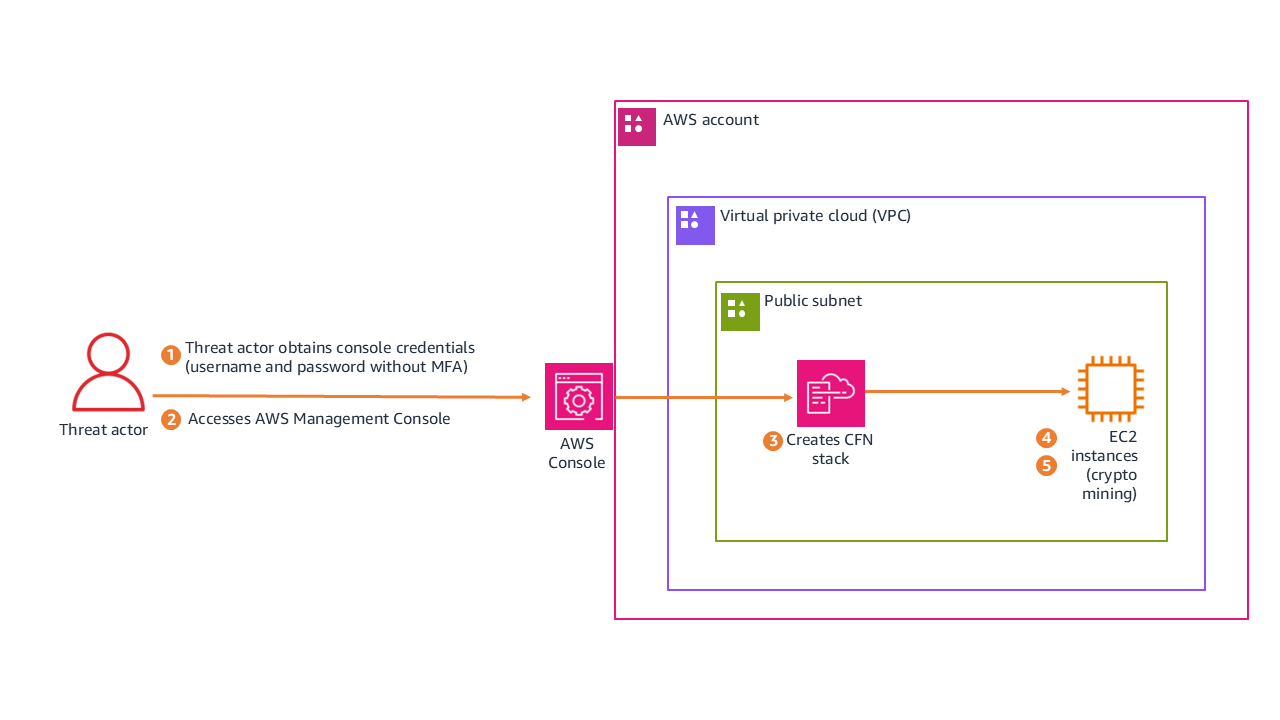
Figure 2 shows how the threat actor moved from credential acquisition to active mining, following these steps:
Threat actor obtains console credentials (username and password without multi-factor authentication (MFA)).
Accesses AWS Management Console.
Creates CloudFormation stack CRYPTO in us-east-1.
Stack deploys EC2 instances configured for cryptocurrency mining in a public subnet.
Mining instances begin consuming compute resources.
Figure 2: Scenario 3 architecture
The following is the redacted CloudTrail event record for the unauthorized CreateStack action. See if you can use it to find the following information:
The name of the CloudFormation stack that was created
The CloudFormation stack Amazon Resource Name (ARN)
If the credentials were secured by MFA
If the threat actor used the AWS Management Console to perform the actions, or if they were performed programmatically using the AWS CLI or a script
Region: us-east-1 (a common choice for threat actors because of immediate service availability)
Authentication and session context analysis:
Examining the session metadata reveals how the threat actor authenticated and accessed the environment:
MFA status: “mfaAuthenticated": “false” indicates that the session was entirely unauthenticated by MFA.
Access method: “sessionCredentialFromConsole": “true” means that access was funneled through the console.
User context: AssumedRole using WSParticipantRole. Session creation occurred at 2025-09-23T18:06:22Z (approximately 50 seconds before stack creation).
Advanced forensic insight (the CloudShell pivot)
The sessionCredentialFromConsole: true field is important to note because this access originated from the AWS console rather than external programmatic API keys. Interestingly, while the session originated from the console, the userAgent field reveals the execution environment was exec-env/CloudShell. This shows that the threat actor didn’t manually click through the CloudFormation user interface, instead launching AWS CloudShell on sign-in to execute a prepackaged deployment script. This allowed the threat actor to achieve automated speed while evading traditional static API key monitoring. The mfaAuthenticated: false field represents a security control gap. Particularly in environments handling sensitive data or production workloads, MFA must be enforced for console access.
Investigation priorities
With the unauthorized stack confirmed, the investigation focused on understanding the full timeline and blast radius. We approached this in three phases, each building on the findings of the previous one.
Reconstruct the console session timeline
The session began at 18:06:22Z and the stack was created at 18:07:12Z, only 50 seconds later. That speed tells us the threat actor came prepared with a script rather than exploring the environment manually. But we needed to know what happened before and after. By filtering CloudTrail for the same session token across the full session duration, we could identify whether the threat actor performed any reconnaissance before deploying the stack, whether they accessed other services or regions during the same session, and whether they attempted to establish persistence (such as creating IAM users or access keys) before or after the mining deployment. Any actions taken outside the CloudFormation deployment could indicate secondary objectives beyond cryptomining.
Examine what the stack actually deployed
The stack name alone doesn’t tell us the full impact. We needed to inspect the CloudFormation template to understand what resources were created and how they were configured. This meant identifying the EC2 instance types (larger instances mean higher costs and potentially more mining output), reviewing the security group rules to determine what network access these instances had to internal resources, checking whether the template included custom AMIs or user data scripts that pulled mining software on boot, and determining if the stack created its own IAM roles with permissions that could be used for further lateral movement. The template itself is evidence. If it was hosted in Amazon S3, the upload event tells us when the threat actor first staged their tools.
Calculate business impact and determine blast radius
Finally, we needed to quantify the damage and determine whether this was isolated or part of a broader compromise. We calculated the total compute cost by multiplying instance hours by instance type pricing, checked whether the mining instances had network paths to production databases or internal services, examined outbound traffic logs for connections to known mining pool IP addresses, and searched for similar stacks or naming patterns across other regions and accounts. The presence of outbound connections to anything other than mining pools would suggest the instances served a dual purpose, potentially exfiltrating data while generating cryptocurrency.
Response checklist
The following checklist captures the key actions needed to contain the incident, assess its impact, and close security gaps.
Determine why MFA wasn’t required for this sensitive operation
Investigate how the threat actor obtained valid console credentials
Check for failed sign-in attempts preceding this successful access
Check for other activities that occurred during this console session
Look for resources that were created by the CloudFormation stack
Determine how long those resources have been running and consuming costs
Look for other similarly named or suspicious stacks in the environment
Check what network access these instances have to internal resources
Determine what outbound connections these instances are making
Look for cryptocurrency mining pool connections
Check if IAM users or roles were created
Check if additional access keys were generated
Determine if the threat actor modified existing permissions or policies
Key takeaways
This scenario highlights how credential hygiene and monitoring controls intersect with resource hijacking threats.
MFA enforcement prevents console-based credential abuse for IAM users. The absence of MFA enabled the full sequence. Console access to production environments should require multi-factor authentication as a security best practice.
Resource naming can be an indicator. The obvious CRYPTO naming suggests either threat actor confidence or poor operational security, both concerning for different reasons.
Cost monitoring is security monitoring. Unusual billing spikes can be early indicators of resource hijacking events.
Console-based activity has different patterns than programmatic activity and requires specialized investigation approaches. The sessionCredentialFromConsole field is your starting point for distinguishing between the two.
Conclusion
In this first part, we walked through two real-world scenarios that demonstrate how CloudTrail analysis can reveal the full scope of a security incident. In Scenario 1, we showed how a seemingly routine cross-account role assumption led to targeted data deletion with ransomware implications, and how session names, timing patterns, and source IP correlation help investigators piece together the event chain. In Scenario 2, we examined how stolen console credentials enabled a cryptocurrency mining deployment through CloudShell, highlighting the critical role of MFA enforcement and cost monitoring as security controls. Both scenarios reinforce a core principle: effective CloudTrail investigation goes beyond identifying what happened. It requires understanding how and why, so you can contain the immediate threat and close the gaps that enabled it.
In Part 2 of this guide, we examine how a web application vulnerability can cascade into a multi-Region event targeting AI services, chaining together SSRF, IMDSv1 credential harvesting, and cross-Region pivoting to access Amazon Bedrock. We also cover critical investigation techniques including root user compared to IAM user named root, role name imitation tactics, and the HIDDEN_DUE_TO_SECURITY_REASONS username trick, along with critical hardening steps and additional resources you can use to strengthen your cloud forensic capabilities.
If you have feedback about this post, submit comments in the Comments section below.
Your scanner just flagged 4,000 new vulnerabilities, 78 of them critical. Which one do you fix first?
To answer that question, Cloudflare is announcing early access to Vulnerability Discovery and Remediation, now part of Cloudflare Managed Defense. Vulnerability Discovery and Remediation is a new, invitation-only Cloudflare service that helps customers detect and mitigate vulnerabilities in their codebases.
Through the OpenAI Daybreak Defense Network, we use OpenAI Daybreak models, including GPT-5.6 Cyber, for reconnaissance, hunting, and validation against codebases that you authorize us to access. If we detect a vulnerability, we will then propose solutions to you, automatically checking each proposed patch and any accompanying proposed mitigation before presenting them for review. Importantly, you are in the driver’s seat: while we may propose code patches and other mitigations, you decide whether they are implemented.
Choosing what to fix first has always been hard. It's getting harder. Large language models can now surface weaknesses across a codebase in minutes, which means the number of findings keeps climbing. But the real problem is speed. Attackers can use AI to accelerate parts of vulnerability discovery and exploitation, giving security teams and developers less time to decide what matters and act on it.
Imagine that your scanner tells you there's a vulnerability in a handler. It doesn't tell you whether that code is deployed. It doesn't tell you whether anyone is actually hitting that route, what security activity surrounds it, or what controls you already have in place. You have to prioritize the finding without evidence of its production exposure or the protections already in place.
This is where we can help. With our global network, we can see which routes are active, how much traffic they carry, and what security events surround them. When customers enable Vulnerability Discovery and Remediation with Web Application Firewall (WAF), we can also see what rules are already applied and are actively blocking attacks. That context turns a generic finding into a specific priority: this vulnerability is in code that's live, on a route that's heavily used, with recent attack activity and no existing protection. And we can help you mitigate that vulnerability by proposing custom WAF mitigations and code patches tailored to your systems.
If this sounds familiar, it should. In “Build your own vulnerability harness”, we described the model-agnostic pipeline we use to scan Cloudflare's fleet, adversarially validate every finding, and turn raw model output into fixes engineers can trust. That internal system is one pillar of Vulnerability Discovery and Remediation. The harness gave us a way to find bugs at fleet scale. Vulnerability Discovery and Remediation brings that discovery process to the code the customer authorizes us to inspect, then connects the findings to production traffic, security events, and the edge controls that can act on them.
This diagram provides an overview of our process, which we explain in more detail below.
Adding context to a vulnerability harness
Our solution works across Cloudflare Workers and proxied applications. The process of detecting vulnerabilities begins with the collection of a traffic and security data snapshot from Web Assets and WAF. The snapshot shows which routes are active, how much traffic they receive, and whether recent security events are associated with them. For instance, a path exhibiting a high volume of detection triggers may also be considered critical for security context purposes. Web Assets and WAF itself serve as the first and second pillar of Vulnerability Discovery and Remediation respectively.
Next, we use source code vulnerability analysis to identify potential weaknesses in code. But that analysis does not show which routes reach it, how much traffic those routes receive, whether they receive suspicious requests, or which protections already apply. We treat routes carrying a high volume of requests as hot paths. Source code deployed to these routes undergoes stricter security profiling. Together, these signals provide evidence about how the API is used and where a vulnerability may be exposed.
For Workers, we retrieve the most recent source version of the Worker and its configured routes to identify the endpoints the Worker serves. Next, we match the Worker's routes to Web Assets and request metadata from Workers Observability, tying the exact source under review to the endpoints it handles in production. This collected network context stays available throughout the investigation, allowing agents to pull it when they need it.
Our vulnerability harness then starts up. It begins by using the Reconnaissance agent to map request paths to the parts of the codebase that handle them. Reconnaissance uses that map to send hunter agents into specific sections of the customer-authorized code, where they look for vulnerabilities and pull in relevant network context as needed. That context can help the hunter agents pay more attention to code behind an active or recently targeted route, but it does not establish that a vulnerability exists. Every vulnerability finding has to be corroborated by evidence in the source code.
Once the hunters return their findings, the validation stage checks the proposed mitigations before assigning each vulnerability an initial risk rating based on source code. The network evidence we collect can raise that rating further when, for example, the affected endpoint carries significant traffic or shows signs of active probing.
The result is a prioritized list of findings, each with a recommended code patch and, when the evidence supports it, a Cloudflare WAF Custom rule that can reduce exposure while the code fix is reviewed. If you have authorized our VDR to defend your zone, we will deploy the rules, scoped conservatively around the method, path, and other request details needed to reach the vulnerable code. If a route pattern contains only variables and wildcards, we do not suggest a rule. We would rather miss a possible connection than claim one the evidence cannot support.
The HTTP method override bypass example above shows how these signals work together. The harness maps the source finding to the production route, uses traffic and security activity to prioritize it, and scopes a proposed WAF rule around the requests that can reach the vulnerable code. That rule can reduce exposure while engineering reviews and ships the code patch.
Where the model runs
When you authorize an investigation, Vulnerability Discovery and Remediation runs the harness on Cloudflare and sends model prompts from Workers through Cloudflare AI Gateway to OpenAI Daybreak models on OpenAI's servers. GPT-5.6 Cyber is used during reconnaissance, hunting, and validation, and its responses return to the harness so the workflow can continue on Cloudflare. No model inference runs at Cloudflare's edge, and the model cannot apply any patch or rule it proposes.
We keep each investigation narrow by limiting it to the source code and evidence the customer authorizes. Before that context reaches the model, Vulnerability Discovery and Remediation removes what the investigation does not need and applies the redaction controls configured for the engagement. The harness treats source code, logs, and request metadata as evidence to inspect, rather than instructions to follow.
Tool access follows the same boundary: each call is logged and checked against the investigation's access policy before it runs, and every patch or rule proposal must pass checks implemented outside the model. If one of those checks fails, the workflow stops before the proposal reaches customer review.
Nothing is presented for review until it has cleared the checks and our team validates the output. For an edge-defense suggestion, that means validating the rule syntax and running it against synthetic fixtures that represent expected requests, rather than against customer traffic. If a check fails or the result remains ambiguous, we hold the output back and route it for diagnosis.
Passing those checks still does not change your environment. After validation by our team, Vulnerability Discovery and Remediation prepares the source code patch and WAF rule.
Join early access
Vulnerability Discovery and Remediation is available to selected customers by invitation during early access through our Managed Defense team. Each engagement starts with one application whose codebase the customer authorizes us to investigate. To connect the findings to production, Vulnerability Discovery and Remediation uses authorized read access to the Web Assets operation inventory, the relevant WAF controls, and Workers Trace Events Logpush where available. The investigation is semi-automated, but you review every result before deciding whether to test or deploy a change.
If you're interested in learning more, talk to your Cloudflare account team.
Network connectivity patterns for private access to Amazon OpenSearch Serverless used to require considerable setup. You had to create virtual private cloud (VPC) endpoints in every consumer VPC and configure Amazon Route 53 Profiles for cross-account DNS. You also had to maintain custom private hosted zones with CNAME records and deploy resolver inbound endpoints for on-premises connectivity. The next generation of OpenSearch Serverless changes this. It uses standard AWS PrivateLink interface endpoints with native private DNS support. Connectivity patterns that previously required multi-step DNS orchestration now work with the same endpoint mechanics you already use for other AWS services.
Collections use resource-based endpoints on the on.aws domain in two formats. The per-collection endpoint (<collectionId>.aoss.<region>.on.aws) reaches a single collection, and the hostname itself identifies which collection you want, so no additional routing information is needed. The per-account Regional endpoint (<accountId>.aoss.<region>.on.aws) reaches any collection in your account through one hostname. Because the hostname alone does not identify a specific collection, you add the x-amz-aoss-collection-name header (or x-amz-aoss-collection-id) to each request to name the target collection. The AWS SDKs include this header automatically when they sign the request with Signature Version 4 (SigV4).
Both formats use standard AWS PrivateLink. You create the VPC endpoint from the Amazon Virtual Private Cloud (Amazon VPC) console or the Amazon Elastic Compute Cloud (Amazon EC2)CreateVpcEndpoint API, using the service name com.amazonaws.<region>.aoss-data. It is the same interface endpoint you create for any other AWS service.
In this post, each pattern shows the architecture, the DNS resolution flow, and the data traffic path. Patterns 1 through 8 operate within a single Region across one or more accounts, labeled Region A in the diagrams, so the repeated Region A boxes in a cross-account pattern are the same Region. Only Pattern 9 spans Regions, shown as Region A and Region B.
These patterns apply to the collection (data) endpoint only. When you create a collection, you also receive an OpenSearch UI endpoint. That endpoint uses a separate PrivateLink mechanism today, with its own VPC endpoint and access policy, and is on a path to move to the standard PrivateLink model. OpenSearch UI connectivity is out of scope for this post.
When you create a standard VPC endpoint for com.amazonaws.<region>.aoss-data with private DNS enabled, AWS creates a private hosted zone for *.aoss.<region>.on.aws and associates it with your VPC. This zone maps collection hostnames to the endpoint’s private elastic network interface (ENI) IP addresses. Your compute’s DNS query reaches the VPC’s Amazon Route 53 Resolver at VPC+2, which resolves the hostname to ENI IPs.
One endpoint serves every collection hostname in the Region. The following AWS CLI command creates that interface endpoint, and the --private-dns-enabled flag turns on the private DNS resolution described here.
OpenSearch Serverless has no per-collection Dashboards endpoint. Use OpenSearch UI applications to explore and visualize collection data.
The diagrams in the following patterns use an Amazon EC2 instance to represent the compute client. Any compute in the VPC reaches a collection the same way, including EC2 instances, AWS Lambda functions attached to the VPC, and containers on Amazon Elastic Container Service (Amazon ECS) or Amazon Elastic Kubernetes Service (Amazon EKS). The connectivity, DNS resolution, and access policies are the same regardless of the compute type.
Pattern 1: Private access from a single VPC
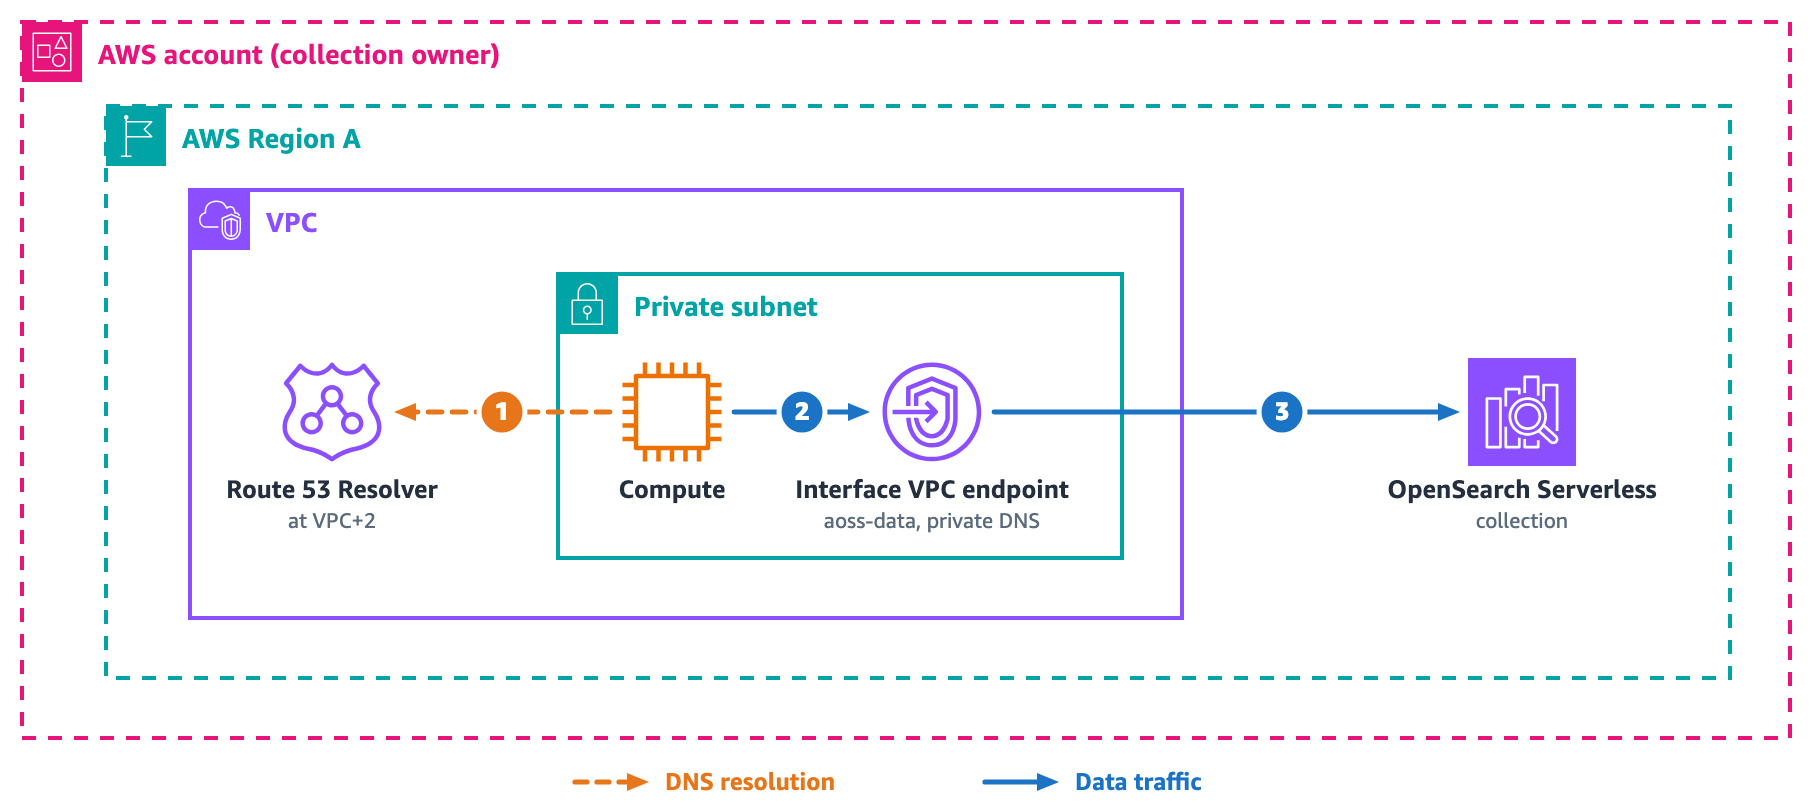
Compute in a VPC needs private access to collections in the same account. The following diagram shows the architecture for private access from a single VPC.
Figure 1: Private access from a single VPC
Create a standard VPC endpoint in the VPC where your compute runs, then reference its ID in the collection’s network policy.
For the DNS resolution flow, (1) compute queries <collectionId>.aoss.<region>.on.aws, and the VPC Route 53 Resolver at VPC+2 returns the endpoint ENI IP addresses because private DNS is enabled on the endpoint.
For the data traffic path, (2) compute connects to the ENI, and (3) PrivateLink forwards the request to the service, which routes to the collection by hostname.
Pattern 2: Multiple VPCs in the same account
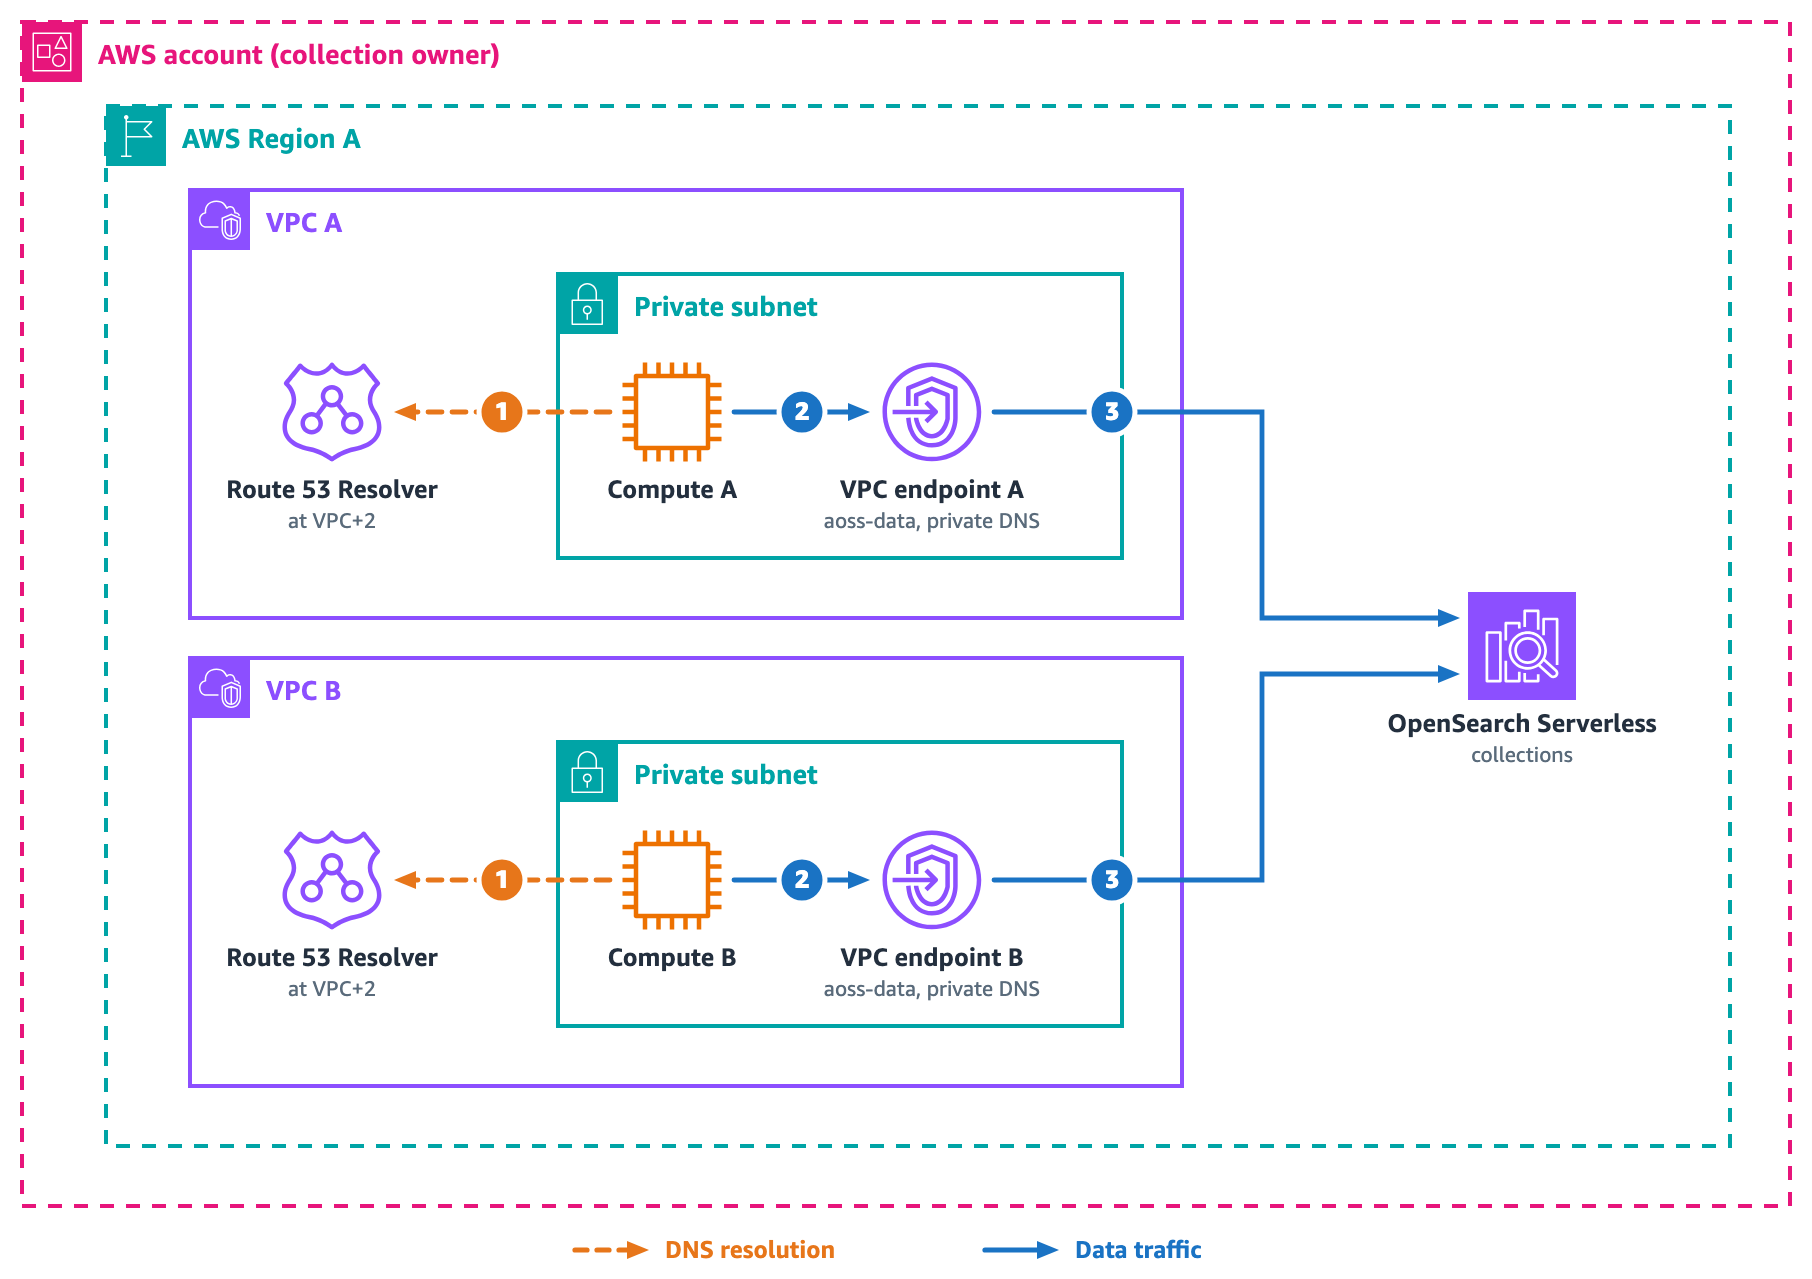
Several VPCs, split by environment, tier, or team, need private access to the same collections. The following diagram shows how each VPC uses its own endpoint to reach the same collections.
Figure 2: Multiple VPCs in the same account
Each VPC needs exactly one aoss-data endpoint with private DNS enabled, and that single endpoint already reaches every collection in the Region. DNS resolves independently within each VPC, so there is no cross-VPC DNS dependency. Adding a new VPC takes two steps. Create the endpoint, then add its endpoint ID to the collection’s network policy. Do not create a second aoss-data endpoint with private DNS enabled in the same VPC. Both endpoints share the same private hosted zone, which causes a conflict and the creation fails.
For the DNS resolution flow, (1) compute in each VPC queries the collection hostname, and that VPC’s Route 53 Resolver at VPC+2 returns the endpoint ENI IP addresses because private DNS is enabled on the endpoint.
For the data traffic path, (2) compute connects to its local ENI, and (3) PrivateLink forwards the request to the service, which routes to the collection by hostname.
Pattern 3: On-premises access from a single account
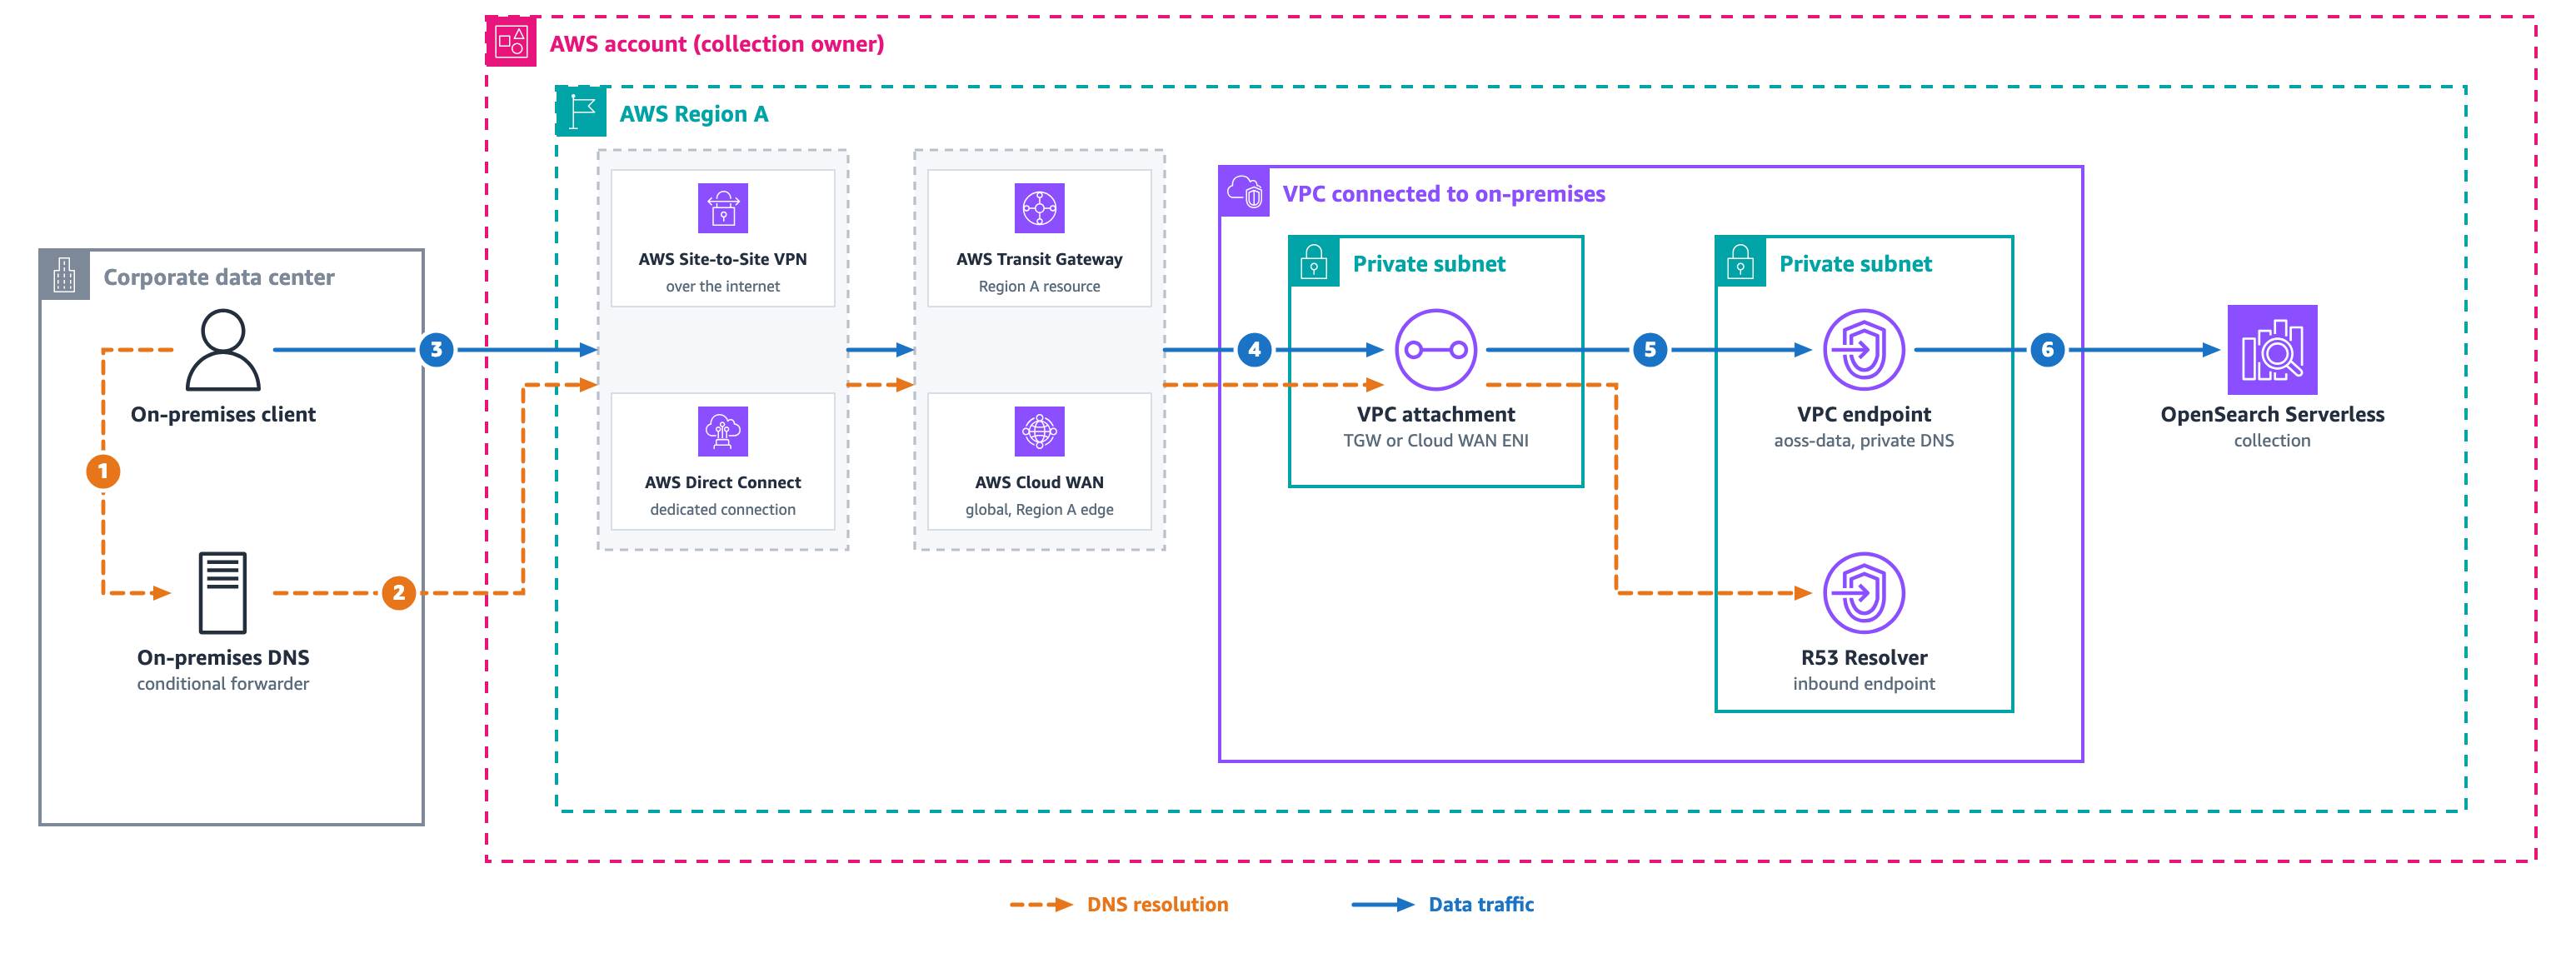
Figure 3: On-premises access from a single account
On-premises DNS servers sit outside the VPC and cannot resolve PrivateLink private DNS names directly. Place an Amazon Route 53 Resolver inbound endpoint in the VPC that holds the aoss-data VPC endpoint. On-premises DNS forwards queries for aoss.<region>.on.aws to that inbound endpoint. The inbound endpoint resolves them against the private hosted zone. The inbound endpoint’s security group must allow TCP/UDP port 53 from your on-premises resolver ranges.
For the DNS resolution flow, (1) the client queries the on-premises resolver. (2) The on-premises conditional forwarder for *.aoss.<region>.on.aws sends the query over Direct Connect or VPN, through Transit Gateway or Cloud WAN, to the inbound endpoint. The inbound endpoint uses the VPC Route 53 Resolver to return the endpoint’s private ENI IPs.
For the data traffic path, (3) the client sends an HTTPS request with the Transport Layer Security (TLS) Server Name Indication (SNI) header set to the collection hostname, over Direct Connect or VPN through Transit Gateway or Cloud WAN. (4) Traffic crosses the VPC’s attachment ENI, (5) reaches the VPC endpoint ENIs, and (6) PrivateLink forwards the request to the service.
Pattern 4: Cross-account access with an endpoint in each consumer VPC
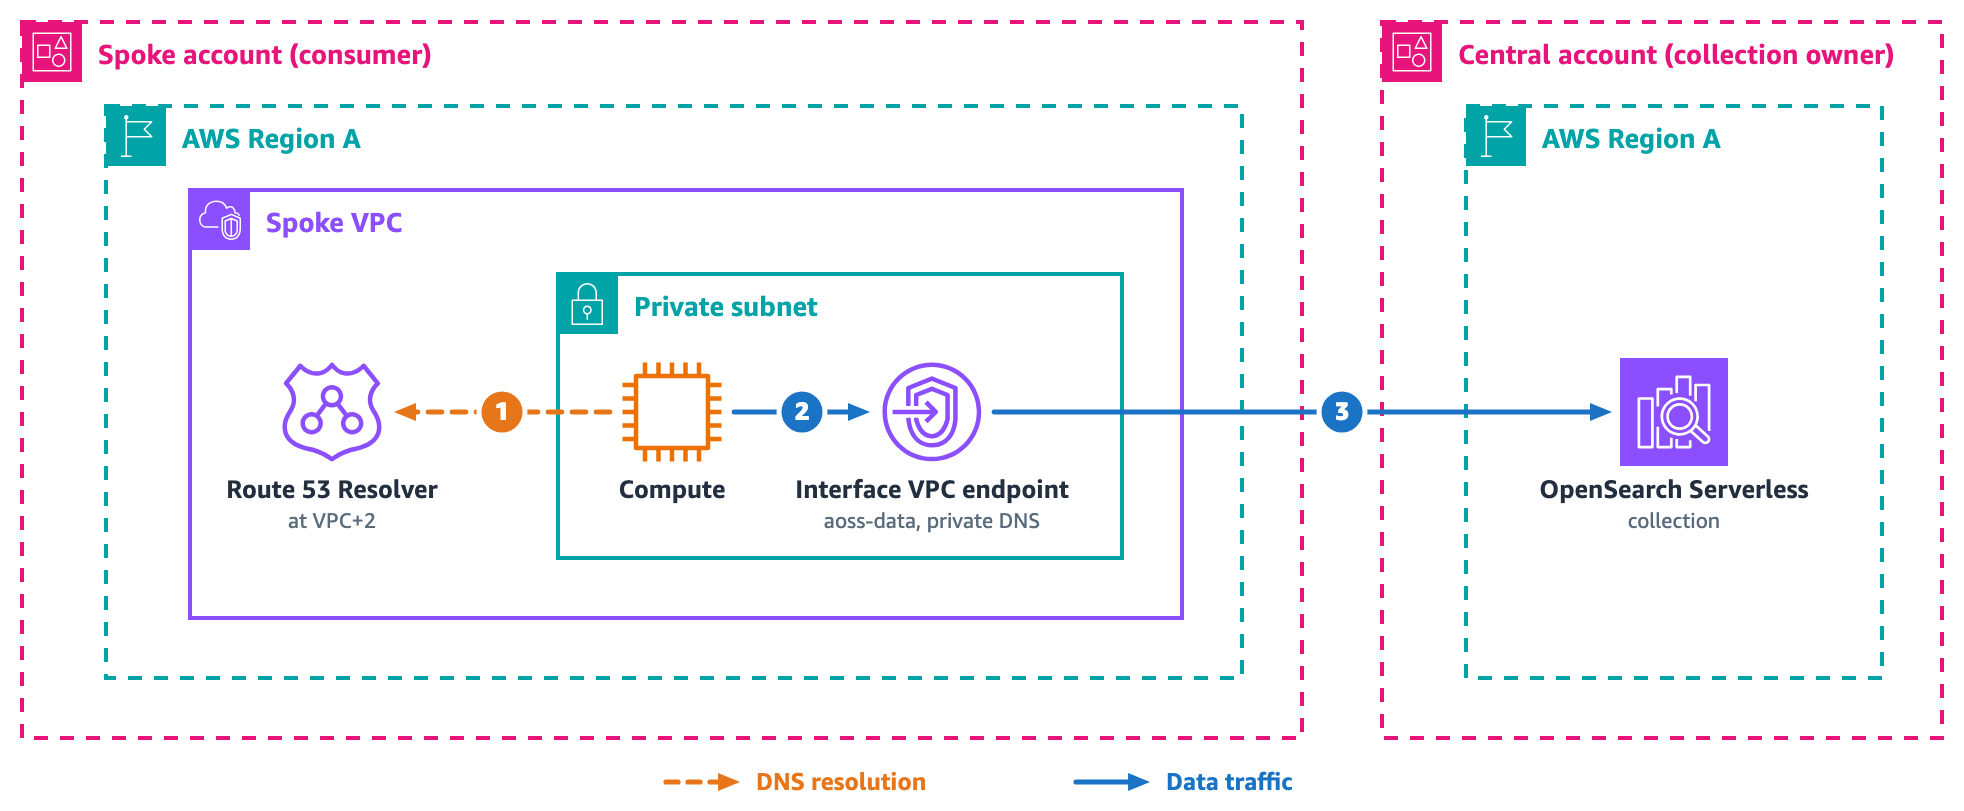
A central account hosts collections, and compute in spoke accounts needs private access. Many enterprises start here. The following diagram shows the cross-account endpoint architecture.
Figure 4: Cross-account access with an endpoint in each consumer VPC
Each spoke creates its own endpoint. The collection owner’s network policy references the spoke’s endpoint ID. The data access policy grants the spoke’s IAM role. PrivateLink carries the traffic end to end, with no Transit Gateway and no peering.
The endpoint lives in the spoke account, not the collection account. The spoke team creates a standard interface VPC endpoint in the spoke VPC for the service name com.amazonaws.<region>.aoss-data with private DNS enabled. The collection owner does not create this endpoint. After the endpoint is ready the spoke shares its endpoint ID with the collection owner, who adds that ID to the collection network policy under SourceVPCEs. A network policy accepts endpoint IDs from accounts across your organization. Each spoke creates its own endpoint and shares the ID rather than peering VPCs or routing through another account’s endpoint.
Network access and data access stay separate. The network policy authorizes the endpoint, and the data access policy authorizes the identity. A serverless data access policy grants principals from the collection’s own account. For a spoke in another account, you create an IAM role in the collection account and grant that role in the data access policy. The spoke role then assumes it to sign requests.
The following network access policy lists the two spoke endpoint IDs under SourceVPCEs and sets AllowFromPublic to false, so only those endpoints reach the collection and the policy denies public access.
For the DNS resolution flow, (1) spoke compute queries the VPC Route 53 Resolver at VPC+2, which returns the local endpoint ENI IPs because private DNS is enabled on the endpoint.
For the data traffic path, (2) compute connects to the local ENI. (3) PrivateLink forwards the request to the service, which checks the network policy for the endpoint ID and the data access policy for the IAM role before routing. Adding a spoke takes one API call and two policy edits.
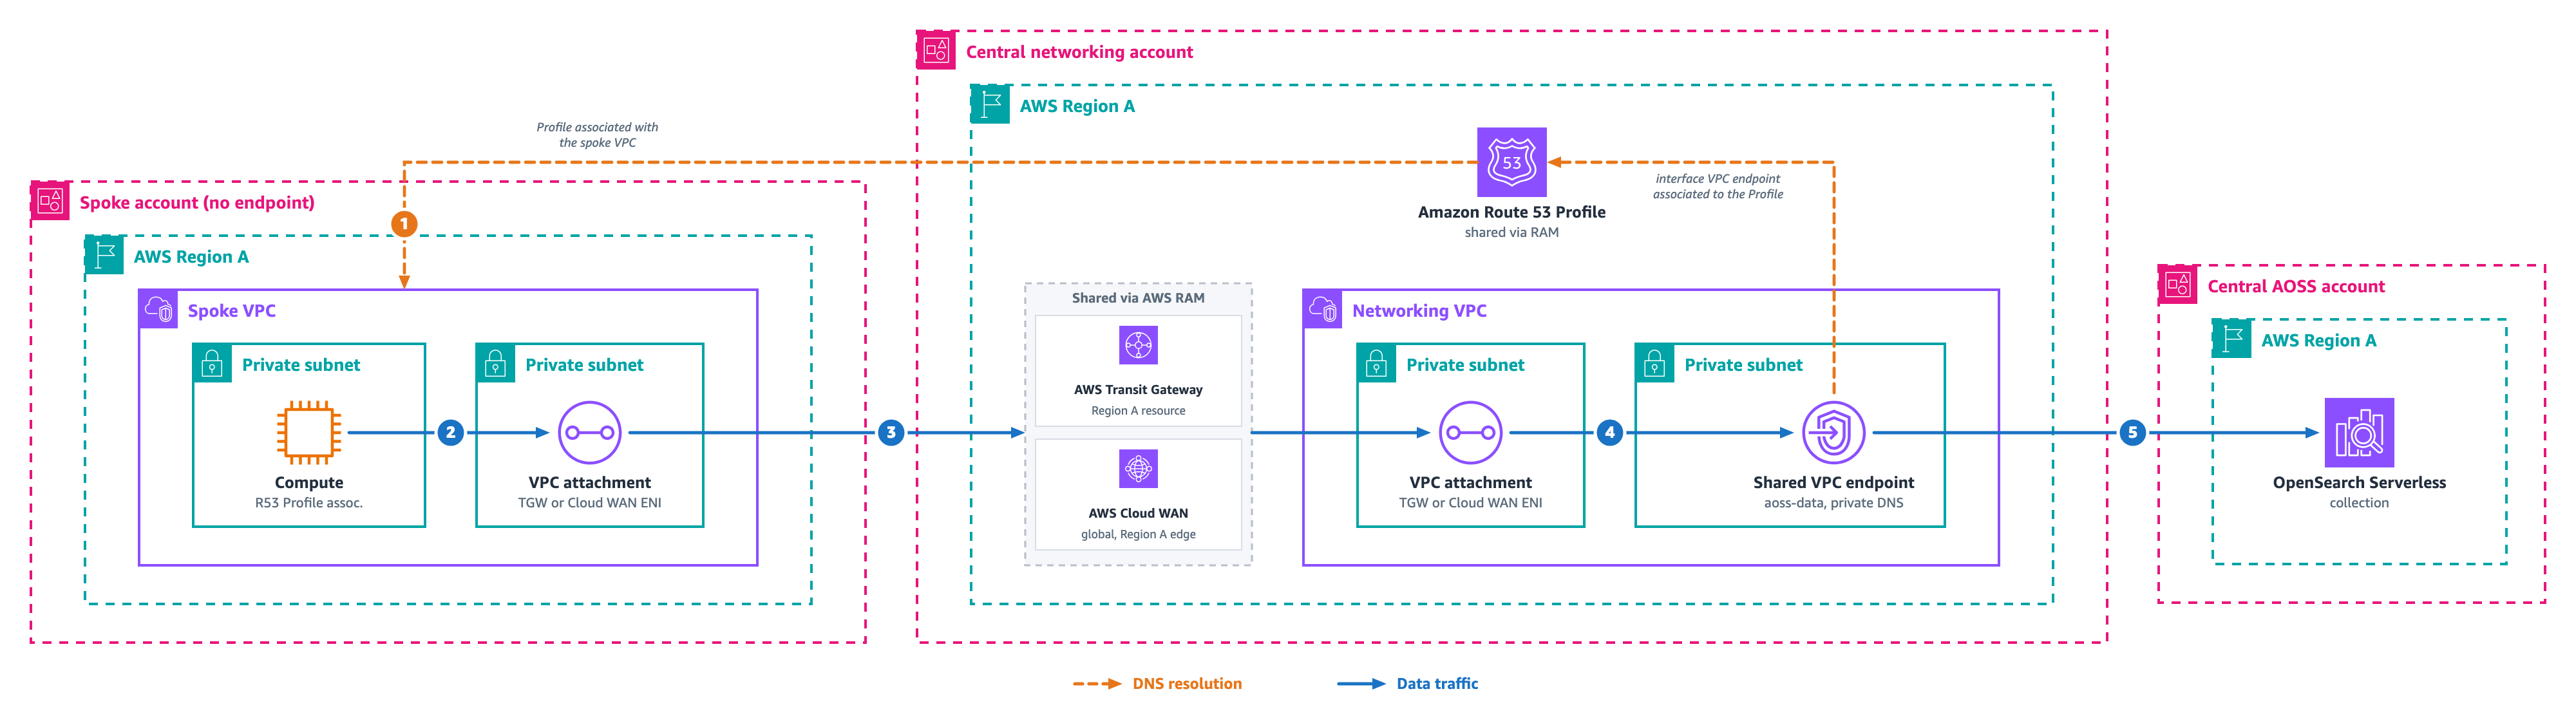
Pattern 5: Centralized shared endpoint with Amazon Route 53 Profiles over Transit Gateway
You want fewer PrivateLink endpoints, so you run one shared endpoint in a networking VPC and reach it from spoke accounts over Transit Gateway or AWS Cloud WAN, with no endpoint in each spoke. The following diagram shows this centralized architecture.
Figure 5: Centralized shared endpoint with Amazon Route 53 Profiles over Transit Gateway
Pattern 5 consolidates access through a single shared endpoint in a central networking VPC rather than creating one per spoke. Because spoke VPCs have no local endpoint, they cannot resolve *.aoss.<region>.on.aws on their own. You share the endpoint’s private DNS with spoke VPCs using Amazon Route 53 Profiles, shared through AWS Resource Access Manager (AWS RAM). This is the one pattern where you still manage DNS propagation.
For the DNS resolution flow, (1) the spoke resolves the hostname through the shared Route 53 Profile, which returns the networking-VPC endpoint ENI IPs.
For the data traffic path, (2) traffic leaves the compute through the spoke VPC’s attachment ENI, (3) crosses Transit Gateway or Cloud WAN into the networking VPC’s attachment ENI, (4) reaches the shared endpoint ENIs, and (5) PrivateLink forwards the request to the service.
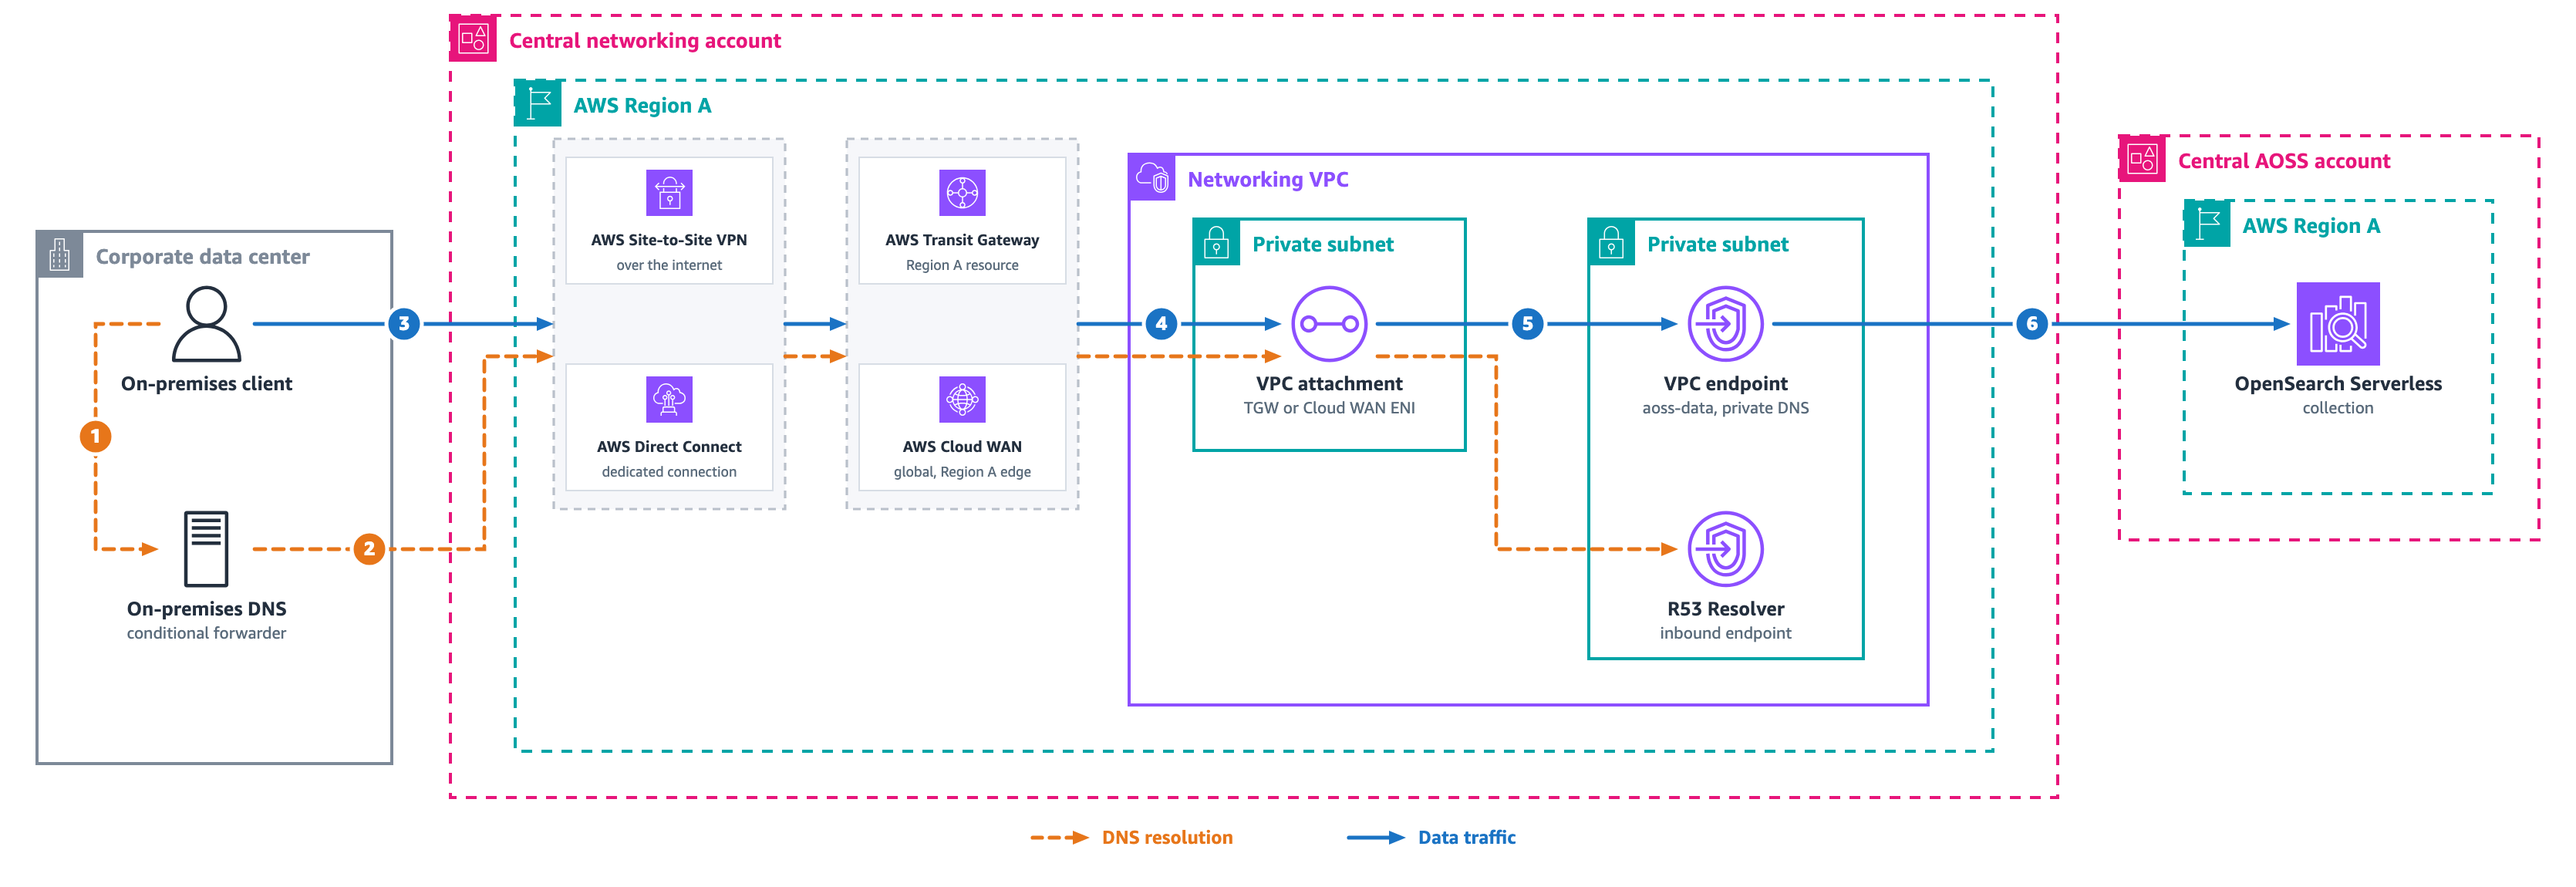
Pattern 6: Cross-account centralized networking with on-premises
A central account hosts collections. A separate networking account owns Direct Connect or VPN and Route 53. On-premises clients reach the collections through the networking account. The following diagram shows this architecture.
Figure 6: Cross-account centralized networking with on-premises
The networking account runs the standard VPC endpoint and a Route 53 Resolver inbound endpoint. The collection owner’s network policy references the networking account’s endpoint ID.
For the DNS resolution flow, (1) the on-premises client queries its resolver. (2) The on-premises conditional forwarder sends the query over Direct Connect or VPN, through Transit Gateway or Cloud WAN, to the inbound endpoint. The inbound endpoint uses the VPC Route 53 Resolver to return the endpoint’s private ENI IPs.
For the data traffic path, (3) the client sends HTTPS over Direct Connect or VPN, through Transit Gateway or Cloud WAN. (4) Traffic crosses the networking VPC’s attachment ENI, (5) reaches the networking-VPC endpoint ENIs, and (6) PrivateLink forwards the request to the service in the central account. The two teams coordinate through one artifact, the endpoint ID.
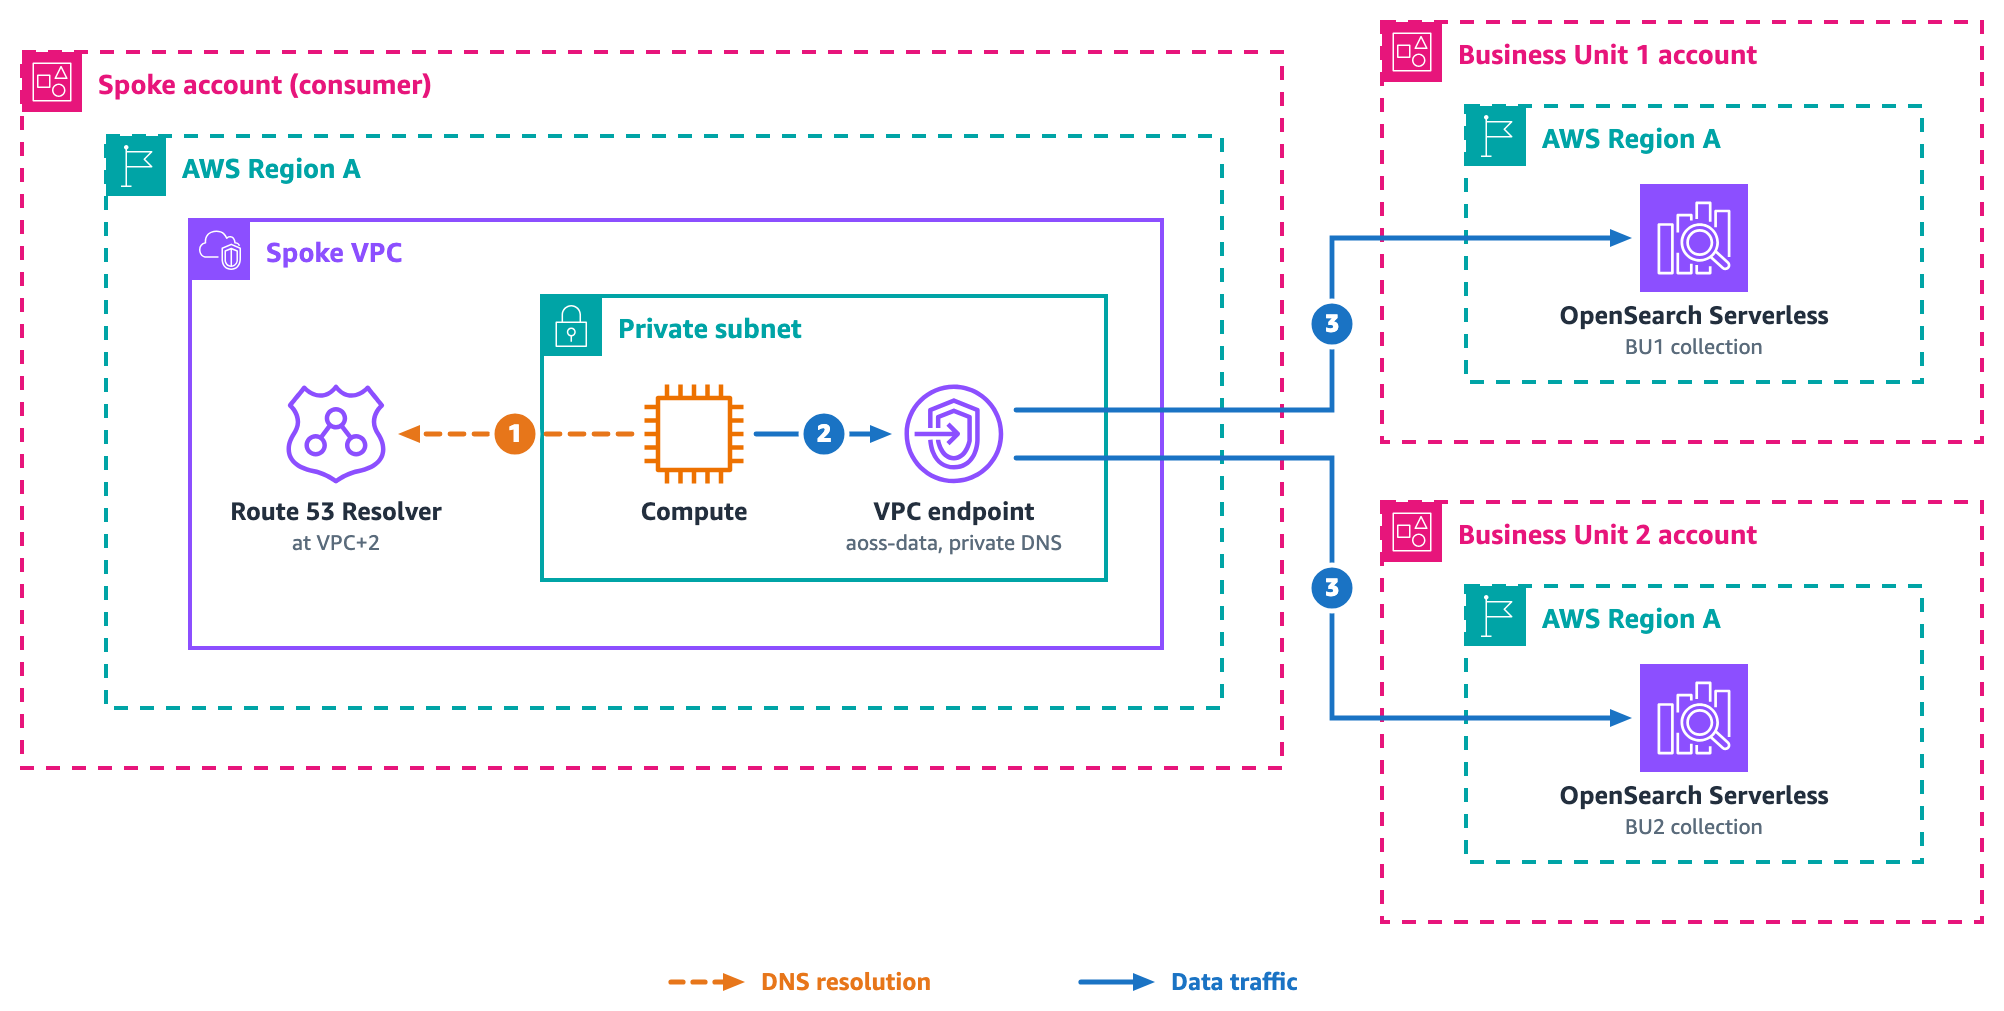
Pattern 7: Distributed multi-business-unit with spoke-account access
Spoke accounts such as analytics or application teams need collections spread across several business unit accounts, and each unit manages its own collections. The following diagram shows the distributed multi-business-unit architecture.
Figure 7: Distributed multi-business-unit with spoke-account access
Each spoke creates one standard endpoint, which resolves every collection hostname in the Region. Each business unit’s network policy lists the spoke endpoint IDs. Access control decides which collections a spoke reaches. DNS does not.
For the DNS resolution flow, (1) spoke compute queries the VPC Route 53 Resolver at VPC+2, which returns the endpoint ENI IPs because private DNS is enabled on the endpoint.
For the data traffic path, (2) compute connects to the local ENI, and (3) PrivateLink forwards the request to the service, which routes to the correct business unit collection by hostname.
Action
Required change
New collection in any BU
No networking change is needed because in the network policy collection/* wildcard, already covers any new collection
New spoke account
Spoke creates an endpoint, and BUs add its ID to their policies
Remove spoke access
BUs remove the endpoint ID and the IAM principal
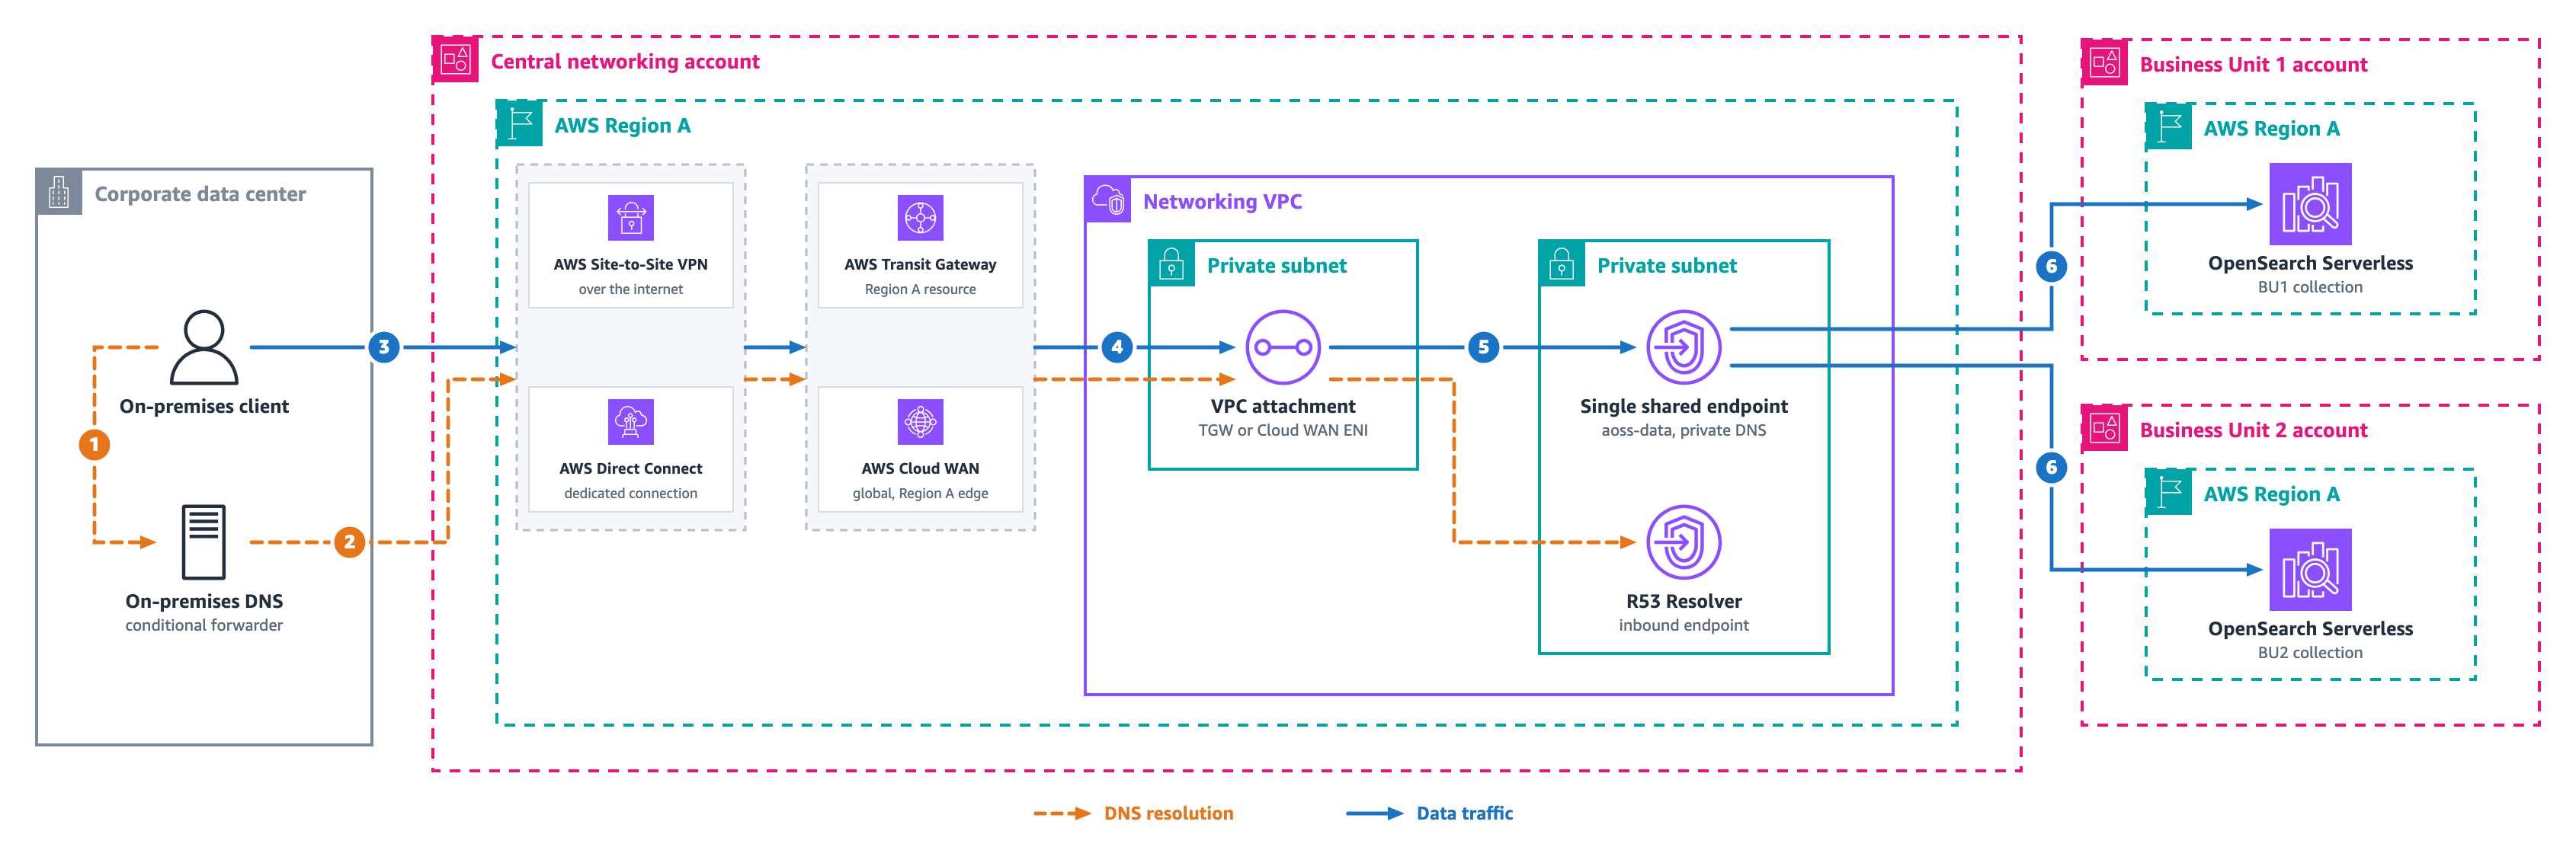
Pattern 8: Distributed multi-business-unit with on-premises access
Several business units own collections in separate accounts. On-premises clients reach collections across all of those accounts through a central networking account. The following diagram shows this architecture.
Figure 8: Distributed multi-business-unit with on-premises access
The networking account runs one standard endpoint that resolves *.aoss.<region>.on.aws hostnames, regardless of which account owns the collection. Each business unit’s network policy includes the networking endpoint ID.
For the DNS resolution flow, (1) the on-premises client queries its resolver. (2) The on-premises conditional forwarder for *.aoss.<region>.on.aws sends the query over Direct Connect or VPN, through Transit Gateway or Cloud WAN, to the networking VPC’s inbound endpoint. The inbound endpoint uses the VPC Route 53 Resolver to return the shared endpoint’s private ENI IPs.
For the data traffic path, (3) the client sends HTTPS over Direct Connect or VPN, through Transit Gateway or Cloud WAN. (4) Traffic crosses the networking VPC’s attachment ENI, (5) the request arrives at the shared endpoint ENIs, and (6) the service routes to business unit 1 or business unit 2 by hostname, as long as that business unit’s policy lists the networking endpoint ID. Adding a collection in any business unit needs no networking change if the network policy uses a collection/* wildcard, since the wildcard already covers it.
Pattern 9: Cross-Region access strategies
Consumers in Region B need data that lives in collections in Region A. The following diagram shows cross-Region access strategies.
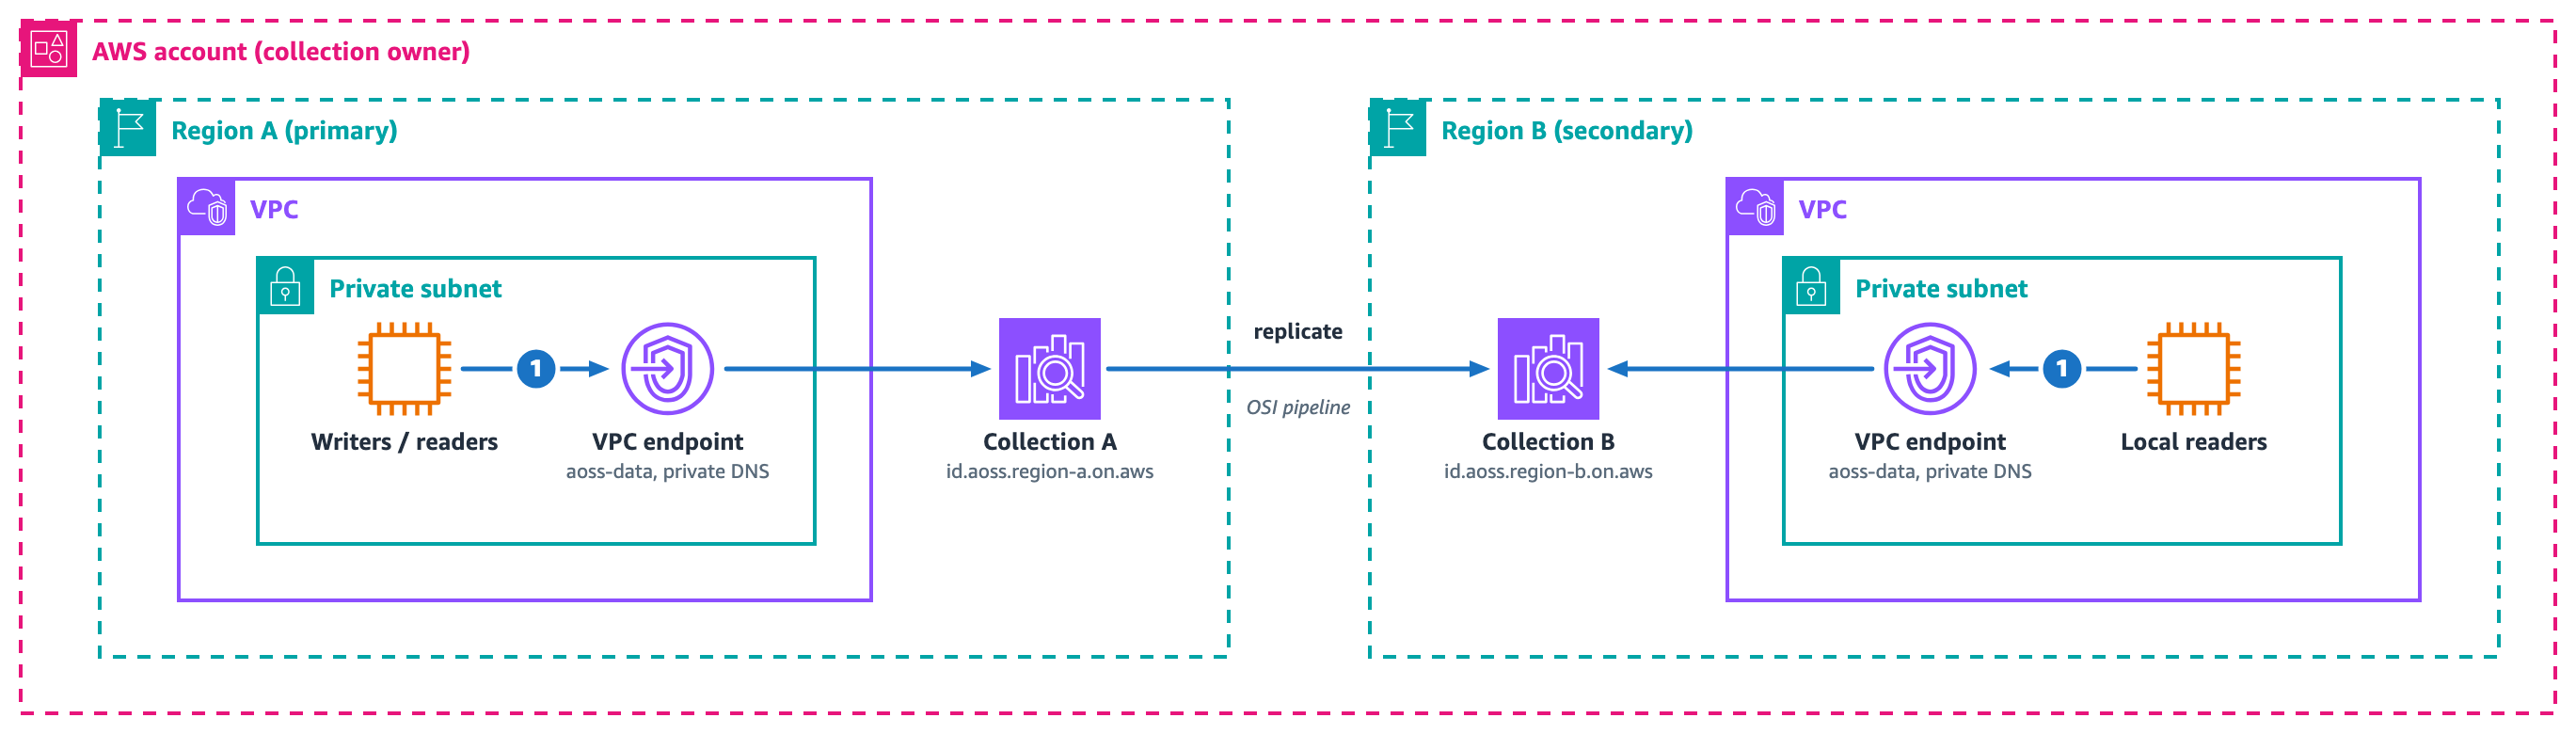
Figure 9: Cross-Region access strategies
Collections are Regional. No built-in cross-Region endpoint or replication exists. Deploy independent collections in each Region, each with its own endpoint and policies, then synchronize data with one of these approaches.
Dual-write. The application writes to both Regions at ingestion time.
Amazon OpenSearch Ingestion pipeline. A pipeline replicates index operations to the secondary Region with near real-time lag. The pipeline creates its own PrivateLink endpoint to the destination collection. It adds the endpoint to that collection’s network policy automatically. You only need to name the network policy and grant the pipeline role.
Amazon Simple Storage Service (Amazon S3) Cross-Region Replication with re-ingestion. Cross-Region Replication copies objects, and an OpenSearch Ingestion pipeline loads them into the local collection. Lag runs in minutes, at the lowest cost of these approaches.
For the DNS resolution flow, DNS resolves locally in each Region, the same as Pattern 1. Each collection hostname carries its Region, so a hostname in Region A resolves through Region A’s own endpoint and a hostname in Region B resolves through Region B’s own endpoint, with no cross-Region DNS.
For the data traffic path, (1) compute in each Region uses that Region’s own endpoint to reach its local collection. Writes land in the primary Region and the sync approach you choose replicates them to the secondary Region, where local readers query the replica. The replicate arrow shows that cross-Region movement, such as an OpenSearch Ingestion pipeline that writes into the secondary-Region collection.
Scale-to-zero changes the economics. An idle secondary-Region collection costs only storage until requests arrive.
Summary
Pattern
Components
1. Same VPC
Standard endpoint and network policy
2. Multiple VPCs
Endpoint per VPC and a policy listing all IDs
3. On-premises
Endpoint, Route 53 inbound endpoint, on-premises forwarder, and Transit Gateway or Cloud WAN
4. Cross-account
Endpoint per consumer, network policy, and data policy
5. Centralized shared endpoint
Shared endpoint, Route 53 Profiles through RAM, and Transit Gateway or Cloud WAN
6. Central networking with on-premises
Networking endpoint, Route 53 inbound, forwarder, Transit Gateway or Cloud WAN, and policies
7. Multi-BU with spoke access
Endpoint per spoke, and each BU policy lists spoke IDs
8. Multi-BU with on-premises
One networking endpoint reached through Transit Gateway or Cloud WAN, and each BU policy lists its ID
9. Cross-Region
Independent collections per Region and a data-sync approach
Across each private pattern, the VPC endpoint resolves all *.aoss.<region>.on.aws hostnames through standard PrivateLink private DNS. Network policies control which endpoints reach a collection, and data access policies control which principals operate on the data. Only Pattern 5 asks you to manage DNS.
Cost considerations
The connectivity pattern you choose drives recurring cost, so match it to your scale instead of adding infrastructure you do not need. The two charges that come up most often, a Route 53 Resolver inbound endpoint and Route 53 Profiles, are both optional for access that stays inside AWS.
A Route 53 Resolver inbound endpoint is needed only for the on-premises patterns (3, 6, and 8), where an on-premises resolver forwards queries into the VPC. Traffic that stays inside AWS never uses it. Route 53 Profiles apply only when a VPC has no endpoint of its own, as in Pattern 5, where the profile carries the shared endpoint’s private DNS to the spoke. When each VPC runs its own interface endpoint, DNS resolves locally through the VPC Route 53 Resolver at no extra charge, so neither the inbound endpoint nor a profile is required.
For most multi-account and multi-Region deployments, an interface endpoint in each consumer VPC (Pattern 4) is the least complex and often the least expensive option. You pay for the interface endpoints you already need for private access, and local DNS resolution adds nothing. Because collections are Regional and each Region resolves on its own, this scales across Regions with no cross-Region DNS.
Centralizing on one shared endpoint (Pattern 5) lowers the number of interface endpoints. However, it adds Transit Gateway or Cloud WAN data processing charges and the cost of sharing DNS. You share that DNS either through Route 53 Profiles or through a private hosted zone that you associate across accounts and maintain yourself. A smaller endpoint count is not automatically cheaper because transit data processing can exceed the savings. Compare both designs against your own traffic before you decide.
OpenSearch Serverless uses standard AWS PrivateLink for private connectivity. You create a VPC endpoint, enable private DNS, and reference the endpoint ID in your network policy. The model scales from single-VPC access to multi-account and multi-business-unit designs, and only Pattern 5 adds DNS infrastructure, where you share the endpoint’s private DNS with Route 53 Profiles. The per-account regional endpoint goes further and serves any collection in an account through one hostname and connection pool. To get started, create your first collection in the OpenSearch Serverless console, or explore the OpenSearch Serverless documentation for detailed API references and tutorials.
Moovit, part of Mobileye (Nasdaq: MBLY), is a leading Mobility-as-a-Service (MaaS) solutions provider and the creator of a leading urban mobility app. Moovit’s iOS, Android, and web apps offer users a smart mobility experience to get to their destination using any mode of public and shared transportation. Transit riders can benefit from mobile ticketing to plan, pay, and ride with transit services. Introduced in 2012, Moovit now serves over 1.7 billion users in more than 3,500 cities across 112 countries, in 45 languages.
Behind these user-facing experiences is a data platform that processes large volumes of mobility, application, and operational data to support product analytics, business intelligence (BI), monitoring, and data science. As the platform grew, Moovit needed to keep analytical workloads reliable and cost-efficient without slowing down teams that depend on fresh data every day.
Over several years, Moovit’s Amazon Redshift cluster grew continuously. It started with an expanding fleet of DC2 nodes, migrated to RA3 nodes, and scaled multiple times to keep pace with growing data demands, ultimately becoming the backbone of their entire data platform.
To address this growth, Moovit transformed their data architecture by building an optimal multi-engine lakehouse architecture and assigning each workload to the most suitable option. This modernization reduced their Amazon Redshift cluster by 50 percent, while establishing a flexible, multi-engine architecture ready for future use cases.
In this post, we share how Moovit gained visibility into workload patterns, cleaned up unnecessary load, selected candidates for offloading, and ran a successful proof of concept (POC) on Amazon EMR Serverless. Moovit ultimately divided the workload between multiple engines, building a modern and cost-optimized data platform that combines provisioned Amazon Redshift, Amazon Redshift Serverless, and Amazon EMR.
The challenge: Outgrowing a single-engine data platform
The Amazon Redshift engine handled a wide variety of workloads, including:
Heavy ETL processing: Raw data ingestion from Amazon Simple Storage Service (Amazon S3) followed by complex aggregation pipelines (daily user-aggregation running once per day with a 3-day lookback, and weekly 10-day-lookback jobs).
Near-real-time operational monitoring: Queries executing every 20 minutes against raw data for system-health dashboards.
Business-intelligence reporting: Tableau extracts and live dashboards.
Data-science workloads: Exploratory analysis and model-feature engineering.
Ad-hoc analysis: Non-recurring queries done by analysts and engineers.
With business growth, storage grew by orders of magnitude over the past decade as the platform expanded. All these varied workloads competed for the same engine and pushed it to its limits. Jobs experienced increasing queue times, service level agreements (SLAs) were at risk, and adding nodes provided minimal performance gains, creating a need to isolate workloads.
Gaining visibility: Measuring workload impact
Moovit’s first modernization milestone was to create a trusted measurement foundation before changing any workloads. Instead of treating warehouse activity as a single opaque stream, the team implemented automated query attribution that continuously classified each query by workload owner and execution context. The classification combined multiple signals: who executed the query (user or service account), recognizable query-signature patterns, and metadata emitted by orchestration frameworks and scheduled processes.
This produced a historical, query-level map of platform usage that answered three critical questions: who is generating load, whatkind of workload is running, and how expensive each workload is in runtime and resource terms. With that baseline in place, the team made offload decisions from evidence rather than assumptions. This approach prioritized the largest and most stable optimization opportunities first and reduced the risk of moving business-critical workloads without visibility.
These classifications and workload metrics were reflected in a Tableau report that aggregated query activity by classification label and execution context. The view exposed operational dimensions such as classification, time granularity, service class, execution-time bucket, unload flags, and sample-query context, supporting both trend monitoring and root-cause drill-down.
The worksheet was parameterized to support multiple measurement modes over the same grouped workload population: total execution time, execution plus queue time, total CPU time, average execution time per query, and ratio-based efficiency views (execution/CPU and CPU/execution). This let the team compare “heavy by volume” workloads against “inefficient by behavior” workloads without creating separate artifacts.
For decision-making, CPU time was used as the primary impact metric because it best represented sustained compute pressure. Execution time, queue time, query-count normalization, and workload-management segmentation were treated as secondary evidence to distinguish:
compute-heavy but healthy workloads
queue-constrained workloads
high-frequency/low-cost workloads
noisy or weakly classified workloads that required attribution cleanup first
Using this framework, prioritization became systematic: first improve classification coverage, then rank workloads by CPU contribution, then validate with queue and workload management (WLM) signals, and finally choose the action path per workload (optimize SQL, reschedule, isolate, retire, or move to another engine).
The following figure shows an example of one of the dashboard widgets (CPU time by query).
Figure 1: CPU time by query, highlighting the most resource-intensive queries and their usage patterns
Cleanup: Reducing unnecessary data warehouse load
With a long-running data platform, in most cases the workloads will start accumulating, some of which become irrelevant at some point. For example, a report which was created and scheduled, yet it became irrelevant after a few years, but still running since no one disabled it. It’s important to indicate these workloads in general to reduce unnecessary load, yet even more critical before doing any significant architectural changes or migrations. Before migrating any workloads, Moovit first reduced unnecessary warehouse load.
The team:
Removed unused processes that were still consuming cluster resources.
Reduced unnecessary frequency where possible: some jobs ran more often than downstream consumers needed.
Reviewed workload-management guardrails to verify resource allocation matched actual priorities.
This cleanup phase was a prerequisite to migration. By removing waste first, the team verified that the workloads eventually selected for offloading were genuinely heavy rather than simply unoptimized or unnecessary.
The no-longer-relevant processes consumed around 7 percent of overall CPU time and were removed before the optimization work began.
Workload selection: Choosing what to offload
With a clear picture of workload patterns, Moovit faced a common decision point: continue scaling the existing Redshift cluster, or re-architect towards a multi-engine approach. The team evaluated two main paths:
Re-architect with Redshift multi-cluster and data sharing: Identify workloads that could benefit from resource isolation, then redistribute processing and queries between multiple Redshift clusters, combining both serverless and provisioned options. This would redistribute load across use-case-optimized clusters and potentially save costs through better resource use.
Re-architect with purpose-built engines: Identify workloads that could benefit from alternative processing frameworks and offload them to more suitable engines. This would reduce pressure on Amazon Redshift while building a more flexible, cost-efficient architecture.
Moovit decided to do both, because while some workloads benefited from being offloaded, others benefited from isolated Amazon Redshift compute.
The measurement data revealed a primary candidate for offloading: raw-data aggregation pipelines. This workload loaded raw data into Amazon Redshift from Amazon S3, then performed heavy sessionization and aggregation transformations. Raw tables were still used for ad-hoc and exploratory analysis, but recurring production consumers primarily depended on aggregated outputs, making these transformations strong candidates for offloading.
Proof of concept: Offloading to EMR Serverless with Spark SQL
With target workload identified, Moovit initiated a POC using Amazon EMR Serverless with Spark SQL. The choice of EMR Serverless was driven by several factors:
Spark SQL compatibility: The existing Redshift SQL logic could be ported with minimal changes to Spark SQL syntax.
Serverless simplicity: No cluster-management overhead during the evaluation phase.
Data-lake native: Processing could occur directly on data in Amazon S3.
The POC defined quantified success criteria measured over five or more consecutive runs:
Runtime reduction: Greater than or equal to 40 percent reduction for the transform portion of selected pipelines.
Amazon Redshift cost reduction: Greater than 30 percent reduction in Redshift RA3 compute with no performance degradation for remaining workloads.
Data-quality parity: Exact match between Spark and Amazon Redshift outputs on row counts, distinct users, and all published metrics over a frozen parity window.
Overcoming initial performance challenges
The first POC attempts exposed significant challenges. Early Spark jobs with 100 executors took approximately 4 hours, far exceeding the 30–40-minute baseline on Amazon Redshift. Beyond raw performance, the team encountered memory pressure, data-parity gaps between Spark and Amazon Redshift outputs, and subtle SQL behavior differences between the two engines.
The team systematically diagnosed and resolved these issues:
Execution-plan analysis: Reviewing the Spark execution plan revealed suboptimal query patterns that generated excessive data shuffles.
Query rewrites: Rewriting specific SQL constructs to align with Spark’s distributed processing model, including splitting large monolithic logic into staged transformations.
Reducing or rewriting expensive DISTINCT patterns: Identifying and eliminating unnecessary DISTINCT operations that created heavy shuffle pressure.
After applying these optimizations, execution time dropped from 4 hours to approximately 10 minutes, and the required executors dropped to fewer than 50, surpassing the original performance.
Validation: Ensuring data parity before cutover
Before transitioning any workload to production, Moovit implemented a rigorous validation process. The new Spark output was compared with the previous Amazon Redshift output using multiple dimensions:
Row counts: ensuring no data was lost or duplicated.
Metric parity: all published business metrics matched.
Daily trends: time-series patterns remained consistent.
Row-level checks: spot-checking individual records for correctness.
Only after all validation checks passed consistently over multiple consecutive runs did the team proceed with cutover for each workload.
Moving to production: Expanding workload offloading
With a successful POC demonstrating both performance gains and cost savings, Moovit progressively moved additional workloads from Amazon Redshift to EMR:
Heavy-aggregation jobs: The primary daily and weekly aggregation pipelines transitioned fully to EMR.
Data-transformation stages: Preprocessing steps that previously consumed Redshift compute moved to Spark, with only final aggregated results loaded back into Amazon Redshift for BI consumption.
Weekly batch workloads: Large batch jobs that previously created resource contention during weekend processing windows.
The transition used a measured approach: each workload was migrated individually, with data-quality validation confirming parity before decommissioning the equivalent jobs which were running on Redshift.
Additional optimizations: Redshift Serverless, workload isolation, and Amazon EMR on Amazon EC2
Beyond EMR offloading, Moovit implemented further architectural improvements to isolate workloads and optimize costs.
With heavy workloads successfully offloaded and isolated, Moovit proceeded to right-size the Redshift cluster. Rather than a single resize, the team reduced the cluster incrementally, two nodes at a time, using elastic resize. At each step, they validated that:
Existing BI workloads maintained acceptable performance.
Queue wait times remained within SLA thresholds.
No workload degradation was observed under peak loads.
This iterative approach minimized risk and allowed the team to find the optimal cluster size with confidence.
Workload isolation with Redshift Serverless
Amazon Redshift persisted as the engine of choice for serving curated BI data. However, not all Amazon Redshift workloads needed provisioned capacity:
Ad-hoc analyst queries: Moved to Redshift Serverless, isolating unpredictable workloads from the provisioned cluster through data sharing.
Data-science workloads: Transitioned to Redshift Serverless for flexible exploration without impacting production.
This workload isolation through Redshift Serverless provided resource separation without requiring additional provisioned capacity. The architecture now used data sharing to provide a unified view across provisioned and serverless clusters.
Operational isolation refinements
Moovit also refined workload isolation by rebalancing WLM priorities on the provisioned cluster. Because the ETL queue mainly handled raw data loading from Amazon S3 (which was not the bottleneck after heavy aggregations moved to Spark), its priority was reduced. At the same time, with most human users moved to Redshift Serverless, Tableau serving workloads on provisioned Redshift were prioritized higher to keep dashboard performance predictable. The final result: a 50% reduction in provisioned Redshift capacity.
Transitioning to EMR on EC2
EMR Serverless proved efficient for the POC phase: it allowed fast iteration without cluster management overhead. However, for longer-term recurring production workloads, Moovit moved to EMR on EC2 to better fit their production cost and infrastructure model, using existing compute reservations.
The transition between EMR deployment options required zero application code changes, demonstrating the flexibility of the EMR deployment options.
AI-assisted SQL translation
Additionally, Moovit used AI-assisted development tools, Claude Code and Cursor, to accelerate parts of the SQL transition process. These tools helped engineers identify Redshift SQL and Spark SQL syntax differences, suggest rewrites, and debug migration issues, while validation and production approval remained under engineer review.
Results: A modern multi-engine architecture
The architectural modernization delivered measurable outcomes:
Cluster size reduction: Redshift cluster size reduced to 50 percent of the initial capacity.
Performance improvement: Key aggregation jobs ran faster and more consistently on EMR (50 percent execution time reduction for p90).
Workload isolation: No single workload type could impact others through resource contention.
33 percent overall data pipeline cost reduction: Combined savings from cluster reduction, transition to EMR, and efficient serverless usage.
Future flexibility: The multi-engine architecture provided pathways for additional use cases without architectural changes.
The following figures compare aggregation-job performance before and after the transition.
Figure 2: Aggregation-job execution times before and after the transition
Figure 3: Wall-clock time for job executions by percentile, before and after the transition
The resulting architecture assigned each workload to the engine that fits it best:
Workload type
Engine
Rationale
Heavy ETL and aggregation
Amazon EMR (Spark SQL)
Distributed processing on Amazon S3. No data warehouse load required
Ongoing processing and BI reporting
Amazon Redshift provisioned
24/7 running processes
Ad-hoc queries
Amazon Redshift Serverless
Burst capacity with workload isolation
Data science
Amazon Redshift Serverless
Flexible exploration without impacting production
Lessons learned
The Moovit modernization journey produced several key insights applicable to similar architectural transitions:
Measure before you move: Establishing baseline metrics and automated classification was essential for identifying true offloading candidates. Without granular workload-level measurements, the team would not have identified which specific processes were exhausting the cluster.
Clean up before you migrate: Reducing unnecessary load first verified that migration efforts targeted genuinely heavy workloads rather than simply unoptimized or unused processes.
Small SQL changes, big impact: Moving from Redshift SQL to Spark SQL required relatively minor syntax adjustments. The core business logic remained intact, and most transformations translated directly with minimal refactoring.
Optimize for the engine: Porting SQL queries to Spark without optimization produced initially poor results for some workloads. Understanding Spark’s distributed execution model and optimizing for it was critical for achieving target performance.
Validate rigorously: Multi-dimensional data-parity checks (row counts, distinct users, metrics, daily trends, and row-level spot checks) gave the team confidence to cut over without data-quality regressions.
Moving between EMR options is straightforward: EMR Serverless proved very efficient for starting fast and evaluating Spark. When Moovit needed to move to EMR on EC2 to use existing reservations, the transition required no application code changes.
Iterative cluster rightsizing: Rather than a single resize, Moovit reduced the Redshift cluster incrementally (two nodes at a time) using elastic resize, validating performance at each step before proceeding further.
Conclusion
Looking ahead, as another potential optimization, Moovit will be evaluating the new Amazon Redshift RG instances for provisioned clusters, providing up to 2.2x better price performance and priced 30% lower than RA3, powered by AWS Graviton.
The broader takeaway is that AWS provides multiple purpose-built engines that can be used in a single data platform. In Moovit’s case, the biggest improvement came from assigning each workload to the engine that fit it best: Amazon Redshift for curated analytical serving, Redshift Serverless for isolated exploratory workloads, and Amazon EMR for large-scale transformations over data in Amazon S3. This architecture gives Moovit a foundation for future optimization and flexibility as data volumes grow and new analytical use cases emerge.
Broadcast production has spent decades organizing media around files, servers, and the physical limits of the facility. That model is familiar, and it works until a live event creates hours of footage across multiple cameras, editors are distributed, the archive is growing by petabytes, and every copy of every clip becomes another operational and financial problem.
Time Addressable Media Store, or TAMS, offers a different model: Organize media by time, store it in object storage, and let interoperable tools access the same content through an open API. Pair that with affordable, high-performance storage, and the result is a practical path toward cloud-native production without forcing media teams into a single vendor’s ecosystem.
That is where a stack built on Backblaze B2, together with TAMS ecosystem partners LiveWyer, CuttingRoom, and Drastic Technologies, gets interesting.
What is TAMS?
When a live event is producing hours of footage across multiple cameras, editors should not have to wait for files to close before they can start working. TAMS, or Time Addressable Media Store, addresses that problem by organizing media around the timeline rather than individual files.
With TAMS, media is stored as timestamped segments that applications can access by time. A news editor can pull a quote from a press conference while it is still underway. A sports producer can create a highlight from a live game feed. A content team can reuse the same moment for social clips, a longer edit, distribution, and archive without creating a separate proprietary copy for every stage.
TAMS gives ingest systems, browser-based editors, desktop NLEs, MAMs, and archive platforms a common way to work with the same media. The store can run on one cloud, ingest can come from another provider, and editors can use the tools they already know.
The specification grew out of BBC Research & Development’s work on cloud-native media production and was published in 2023. Its purpose was practical: Give different companies a shared interface for building interoperable media workflows instead of recreating isolated storage silos in the cloud.
TAMS is not a replacement for an NLE, MAM, ingest system, or archive. It is the layer that helps those systems work together. In this article, we are focusing on three Backblaze ecosystem partners that demonstrate that approach: LiveWyer, CuttingRoom, and Drastic Technologies.
The solution stack
LiveWyer provides TAMOSS, a Kubernetes-native implementation of the TAMS API. TAMOSS is the store management and API layer. It handles the TAMS structure while orchestrating the underlying media segments stored in Backblaze B2.
CuttingRoom brings an editorial-grade video editing experience into the browser. In a TAMS workflow, editors can begin working with media while a live event is still being captured. They can find a moment on the timeline, create a clip, and assemble a story without waiting for an entire file to close or moving the media into a separate editing silo. The CuttingRoom solution allows real-time collaboration, import and exports from and to market leading MAMs and with the optional ShortCut AI assistant editing, editors can do more in less time.
Drastic Technologies’ NetX platform provides the TAMS-compliant readers and writers that handle both ends of the media flow: ingesting and writing media into TAMS, then reading it back for playback and use in professional applications such as Adobe Premiere and Avid. NetX is a key part of making TAMS flows usable across live ingest, playback, and established desktop production workflows including Adobe Premiere.
With Backblaze B2 providing the S3-compatible storage foundation beneath the workflow.
TAMOSS supplies the TAMS interface. CuttingRoom provides the browser-based editorial experience. Drastic NetX handles the critical ingest, writing, reading, and playback paths. B2 stores the media segments at a price that makes large-scale access practical.
These companies are part of a growing ecosystem of roughly 14 technology providers with publicly identifiable TAMS implementations, products, readers, writers, or integrations. That broader ecosystem includes AWS, Konstrukt, LOGIC media solutions, LucidLink, Mimir, Reuters Imagen, Matrox Video, Mavis, Norsk, Techex, and Zixi, alongside LiveWyer, CuttingRoom, and Drastic Technologies.
This is the broader idea behind an interoperable standard. No single company has to provide every part of the workflow, and customers do not have to replace every system they already own.
Where TAMS fits
The use cases are not limited to national broadcasters.
A news organization could ingest a live press conference, let an editor find a quote while the event is still happening, and publish a short clip before the full recording is finished.
A sports production team could create proxy media for immediate clipping while retaining higher-resolution source material for finishing. This is particularly useful because some high-resolution MOV and MXF workflows are difficult to segment and read while they are still growing.
A regional sports league or smaller event producer could avoid building a large on-premises storage environment and give remote editors access to the same media from wherever they are working.
A corporate video team could record a town hall, create short internal clips, publish social content, and retain the full event in the archive using the same underlying media.
The same approach could support houses of worship, education, government, live entertainment, and creator workflows. The common requirement is quick access to a growing body of media without multiplying copies and handoffs.
What if the editor reviewing a live feed did not need to ask where the file was? What if the answer were simply a time range in a shared store?
Why Backblaze B2 matters
Live video is a storage problem before it is almost anything else. A multi-camera sports event, a continuous news operation, or a large livestream can generate terabytes of content quickly.
Backblaze B2 starts at $6.95 per terabyte per month, with free egress up to three times average monthly storage and no egress fees through many compute and CDN partners. That combination makes it easier to keep large live datasets available for editing, review, distribution, and archive.
A TAMS workflow backed by B2 can look like this:
– Use Drastic NetX to ingest and write live feeds into a TAMS store.
– Segment and index the media as it is captured.
– Let editors begin clipping and assembling stories in CuttingRoom.
– Use NetX readers to play and access the same media from Adobe Premiere or Avid.
– Keep the objects available for near-live production, distribution, and archive.
– Add a MAM where richer search, rights, governance, and catalog workflows are required.
Our deployment test offered one final lesson. Getting media into the store was straightforward. Making the service usable by the rest of the team required attention to the operational details. Open standards reduce lock-in, but production still depends on good deployment practices.
That is a healthy place for the industry to be. The pieces are becoming more modular, the interfaces are becoming more open, and media teams have more freedom to assemble the workflow that fits them.
TAMS gives those tools a common language. TAMOSS makes the store deployable. Drastic NetX handles how media is written into and read from the workflow. CuttingRoom makes the content useful to editors and production teams. And Backblaze B2 provides a scalable storage layer that makes the economics work.
The question is no longer whether live media can be stored in the cloud. It is whether we can make that media available to the right person, in the right tool, at the right moment.
Tiered-memory systems are built with multiple types of memory, each of
which has different performance characteristics. In addition to the usual
DRAM, a tiered system might also provide faster high-bandwidth memory or
slower CXL memory. On these systems, the placement of memory allocations
has a significant effect on the performance that a workload will obtain.
While work on tiered-memory improvements has been ongoing for years, it
feels like the pace has slowed a bit recently. Even so, there are a few
efforts underway, but they are facing questions about whether the tiering
design makes sense.
Version
4.0 of the Audacity audio editor has been released. Notable changes in this
release include a rewritten interface using Qt, ability to save user-interface
layouts as “Workspaces”, improvements in working with audio clips, and a new .aup4 project format.
The release is not fully feature-compatible with the Audacity 3.x
series; see the compatibility
notes for a list of missing features.
Continuous improvement depends on experimentation. Teams know that the fastest path to better outcomes is to test changes against real user behavior, measure results, and iterate. In practice, sustaining that cycle is slow and costly because the overhead compounds with each attempt.
Three barriers slow teams down:
1. Planning cost — Turning a proposed change into a testable experiment requires defining a feature flag strategy, coordinating implementation, and wiring everything together before any user sees new behavior.
2. Measurement disconnected from action — Once live, teams must configure metrics, define success criteria, monitor, and interpret results. When metrics regress, remediation traditionally depends on a human merging a fix or rolling back a deployment.
3. Stalled iteration — Without a record of which change caused which outcome, the next hypothesis is a guess, so iteration often does not happen and the goal stalls.
This post introduces a reference solution that closes the gap between defining a goal and reaching it. A team states an improvement goal (for example, increase add-to-cart rate by 10%), and agents plan the experiment, implement the change, deploy it behind a feature flag, measure its impact, and iterate on the result, all within defined safety boundaries. The solution connects Kiro for code generation, AWS DevOps Agent for orchestration and release readiness review, and LaunchDarkly for feature flag governance, experiments, and Guarded Releases for safe, metric-driven rollouts with automatic rollback. The architecture described here is a reference implementation you can build today. A more turnkey experience is planned for the future.
Pre-requisites
Step 1. Enable AWS DevOps Agent and Create an Agent Space. AWS DevOps Agent is available in the AWS regions listed here. Follow these steps to create your AWS DevOps Agent and create an Agent Space.
Step 3. Enable the LaunchDarkly MCP Server in the Agent Space. AWS DevOps Agent connects to LaunchDarkly’s hosted MCP server as a client, giving it the ability to query flag state, read targeting rules, and list flags by project or environment.
Step 4 — Register the LaunchDarkly MCP server (account-level). MCP servers are registered at the AWS account level and shared among all Agent Spaces in that account.
Sign in to the AWS DevOps Agent console.
Navigate to the Capability Providers page (side navigation).
Find MCP Server under the Available providers section and choose Register.
Description: LaunchDarkly feature flag management MCP server
Enable Dynamic Client Registration: Select this checkbox to allow DevOps Agent to automatically register with LaunchDarkly’s authorization server
Step 4a — Configure the authorization flow
LaunchDarkly’s hosted MCP server uses OAuth for authentication:
Select OAuth 3LO (Three-Legged OAuth).
Choose Next.
Complete the OAuth authorization — you will be redirected to LaunchDarkly’s consent page to authorize the connection.
Choose Next.
Tip: Refer to the LaunchDarkly MCP server documentation for specific OAuth scope and credential details.
Step 4b — Review and submit
Review the MCP server configuration details.
Choose Submit.
AWS DevOps Agent validates the connection to LaunchDarkly’s MCP server.
On successful validation, the MCP server is registered at the account level.
Step 5 — Add the MCP server to your Agent Space
After the account-level registration, connect it to your specific Agent Space:
In the AWS DevOps Agent console, select your Agent Space (created in Section 1).
Go to the Capabilities tab.
In the MCP Servers section, choose Add.
Select the LaunchDarkly MCP server you just registered.
Configure tool access:
Allow all tools — makes all LaunchDarkly MCP tools available to the agent
Select specific tools — allowlist only the tools you need (recommended for production)
Choose Add.
Step 5 — Validate the connection. Run a test query to confirm the integration is working. In the DevOps Agent console, start a new investigation or chat session and ask: “List the feature flags in the <your-project-key> project in the production environment.” If the agent returns flag data from LaunchDarkly, the connection is active.
Solution overview
The automated experimentation lifecycle operates as a closed loop. A team states an improvement goal, and the system moves through a continuous cycle: decide what to try next, implement the change behind a feature flag, validate and deploy it, run an experiment to measure impact, roll it out safely, and feed the outcome back into the next iteration. The loop continues until the goal is met or the team decides to stop.
End-to-end Plan-Prove-Iterate workflow showing how AWS DevOps Agent orchestrates hypothesis generation, feature-flagged implementation, experimentation, guarded rollout, and outcome recording in a continuous improvement loop.
Each component has a distinct responsibility. AWS DevOps Agent orchestrates the cycle: it runs on a schedule as a Custom Agent which is a user-defined agent with its own instructions, skills, and connected tools that executes autonomously without pausing for input unless something fails. AWS DevOps Agent supports Custom Agents as a way to encode a specific workflow, including its decision logic, safety constraints, and cadence, into an agent that runs end-to-end on its own. In this solution, the Custom Agent reviews goals, generates hypotheses informed by prior outcomes, coordinates implementation and validation, and drives iteration across multiple experiment cycles.”. Kiro CLI runs in headless mode inside the Experiment MCP Server container on Amazon Bedrock AgentCore, implementing code changes behind LaunchDarkly feature flags and opening pull requests without a human operating an IDE.
LaunchDarkly hosts feature flags, experiments, and Guarded Releases, monitors metrics in real time, and reverts flag state when a threshold is breached. It also exposes a hosted MCP server with tools the agent calls directly. The Experiment MCP Server (custom, built for this solution) exposes the remaining operations over MCP: code implementation through Kiro, PR merge, and deployment triggering.
The agent acts as an MCP client connected to these two servers. LaunchDarkly’s hosted MCP server provides flag management, experiment lifecycle, Guarded Release, and observability tools. The Experiment MCP Server provides code implementation, PR merging, and deployment tools. This design separates decision-making from execution: the agent decides what to do, the MCP servers handle how.
Plan / Prove / Iterate
The lifecycle operates in three phases.
Plan — The agent decides the next action for a goal, generates a hypothesis informed by prior outcomes when iterating, and creates a feature flag in LaunchDarkly. It then invokes Kiro CLI to implement the change behind the flag and open a pull request. AWS DevOps Agent validates the change through release readiness review. After a green review, the PR is merged and a GitHub Actions workflow deploys the application through AWS Amplify.
Prove — Two sequential phases run after deployment. First, a 50/50 experiment splits 10% of traffic on a business KPI (for example, add-to-cart rate) until statistical significance selects a winning variation. Then a Guarded Release ramps the winning variation from 20% to 30% to 40% and eventually to 100% while LaunchDarkly monitors operational guardrails (error rate, page-load-time-p95). If a guardrail threshold is breached, LaunchDarkly reverts the flag state automatically, requiring no redeployment. The experiment measures value (does the change improve the goal metric?); the Guarded Release measures safety (does the change hold up at scale?).
Iterate — After a rollout concludes, the agent queries LaunchDarkly’s Change History API to associate specific flag modifications with outcomes. The recorded outcome informs the next hypothesis, and the cycle repeats until the goal is met or the agent recommends waiting.
Extending the agent with a custom MCP server
AWS DevOps Agent reads code, reviews changes, and decides what to do next. It does not take action on its own. To move from decision to execution, you connect it to MCP servers that expose operations as tools.
LaunchDarkly’s hosted MCP server covers flags, experiments, and Guarded Releases. We needed operations it doesn’t cover — writing code, merging PRs, and deploying — so we built the Experiment MCP Server. It runs on Amazon Bedrock AgentCore and exposes five tools: create_task and get_task_status (invoke Kiro CLI to implement changes and open a PR), merge_pr, trigger_deployment, and get_deployment_status.
These are mutation operations. When the agent calls create_task, Kiro writes real code. When it calls merge_pr, that code lands in main. You are responsible for this server — what it exposes, which repos it can touch, which branches it can merge to. We scoped ours to one repository, one branch, and one Amplify application. Those constraints live in the MCP server’s code, not the agent’s prompt, because API-level scoping cannot be misinterpreted.
The Experiment MCP Server [CG1] is a Python application built on FastMCP, packaged as a container and deployed to Amazon Bedrock AgentCore over stateless HTTP so the platform can restart or replace the container without breaking in-flight requests. At startup, the container pulls credentials from AWS Secrets Manager, clones the target repository, and makes Kiro CLI available as a local binary. This single-container design keeps everything colocated: when the agent calls create_task, the server spawns Kiro CLI as a headless subprocess with direct filesystem access to the cloned repo rather than making a network call to a separate code-generation service. Kiro CLI receives a structured prompt containing the task description, the LaunchDarkly flag key, and the variation details, then writes the change, commits to a new branch, and pushes. The server opens a pull request through the GitHub API and returns the task ID immediately without waiting for Kiro to finish. The caller polls get_task_status, which long-polls against an S3-backed state store so task progress survives container restarts. Deployment tracking follows a similar pattern: trigger_deployment dispatches a GitHub Actions workflow and returns the real GitHub run ID, and get_deployment_status reads live status directly from GitHub, so there is nothing to lose if the container cycles between calls. The overall design principle is that the MCP server coordinates work and delegates persistence to external systems (S3 for task state, GitHub for deployment state, Secrets Manager for credentials) rather than holding anything in memory that a restart would erase.
How the agent works
The agent runs on a schedule. Each run, it evaluates the current state of each goal and picks one of three actions: create a new experiment (no active rollout exists), iterate on a prior result (a rollout completed and the goal is not yet met), or wait (an experiment or rollout is still in progress).
The entry point for the system is an outcome, not a task list. The team picks a business metric from the available set — add-to-cart rate, checkout conversion, bounce rate, or page-load-time-p95 — and sets a target improvement, for example “increase add-to-cart rate by 10%.” Error rate is reserved as a safety guardrail during the Guarded Release phase and cannot be chosen as the primary success metric, because the system needs an independent operational signal to decide whether a winning variation is safe to scale. Beyond the metric and the target, all other inputs are optional. The agent infers the current baseline, the areas of the application in scope for changes, and any constraints from the codebase and production data. If those assumptions are off, the team corrects them before any code is written. The team states where they want to end up, and the agent works backward from there.
Demo Store product listing page used as the test surface for the add-to-cart experimentation cycles. Product cards currently show the control layout (no inline Add to Cart button).
For new goals, the agent explores the target repository and proposes a code change likely to move the metric. For iterations, it reads prior outcomes and adjusts its approach based on what worked and what did not. Before any code change, the agent creates a feature flag in LaunchDarkly (boolean, OFF by default, named with a convention like exp-add-to-cart-*) so every change ships behind a flag from the start.
Implementation runs through Kiro CLI in headless mode. The agent calls create_task, Kiro clones the repository, writes the change behind the feature flag, and opens a pull request.
Merged GitHub PR implementing the feature-flagged inline Add to Cart button on the product listing page, controlled by the atc-on-listing LaunchDarkly flag.
AWS DevOps Agent then runs a release readiness review on the PR. If the review fails, the agent retries up to three times before stopping to ask for help. After a green review, the PR is merged and a GitHub Actions workflow deploys through AWS Amplify.
AWS DevOps Agent Release Readiness Review for the Add to Cart Urgency Boost experiment. The automated review found zero critical issues and recommended standard deployment with a guarded rollout.
Proving the change
Once deployed, the flag is toggled on and the experiment begins. The agent creates a 50/50 experiment across 10% of traffic, splitting on the goal’s business KPI. In production, experiment data comes from real users interacting with your application, with metrics emitted through OpenTelemetry to LaunchDarkly. For this reference implementation, we built a synthetic traffic generator that simulates user sessions across both treatment and control variations, producing the conversion events and operational metrics that drive experiment decisions. It runs alongside the demo application and generates enough volume to reach statistical significance within minutes rather than days. The synthetic traffic generator is a demo convenience, not a production requirement. Any application that emits the right events to LaunchDarkly will work with this architecture.
The agent checks for results on each Custom Agent execution until statistical significance is reached. In an interactive chat session, you prompt the agent to check when you are ready. If the treatment wins, the agent proceeds to the Guarded Release. If it loses, the agent archives the flag and records the outcome for the next iteration.
LaunchDarkly experiment summary for the inline Add to Cart listing CTA test. Treatment won decisively with 98.7% relative lift in add-to-cart conversion and 100% probability to beat control.
The Guarded Release ramps the winning variation from 20% to 30% to 40% while LaunchDarkly [1] applies sequential testing to the operational guardrail metric, halting the rollout as soon as the data shows a statistically significant regression against the original variation.. If a guardrail threshold is breached at any stage, LaunchDarkly reverts flag state at runtime without a redeployment. Guarded Releases and automatic rollback serve as the runtime safety net: if something goes wrong after deployment, the system reverts flag state without waiting for a human to intervene.
To validate the safety net in the reference implementation, we triggered a simulated error-rate spike during the ramp. LaunchDarkly detected the regression within the monitoring window, halted the rollout, and reverted the flag to its pre-rollout state automatically. No human intervened, no redeployment ran, and the application returned to the control behavior within seconds. The screenshot below shows the Guarded Release dashboard after the rollback.
LaunchDarkly Guarded Release auto-rollback event. The system detected an error rate regression during the ramp phase and automatically rolled traffic back to the control variation.
After recording the rollback and feeding the outcome into the next iteration, the agent adjusted its approach and proposed a revised implementation that avoided the latency regression. The second attempt followed the same pipeline: hypothesis, feature flag, implementation, review, deployment, experiment, and Guarded Release. This time, monitoring completed with no regressions detected. LaunchDarkly rolled the winning variation forward to full traffic, with add-to-cart conversion lifting from 20.1% to 37.9% across the treatment population, confirming the experiment result held at scale.
LaunchDarkly Guarded Release monitoring completion. The Add to Cart metric showed a 17.7 percentage point lift with no regressions, so the system graduated the treatment to 100% of traffic.
After each cycle, the agent generates a report documenting the hypothesis, experiment results, rollout outcome, and a recommendation for the next iteration. This report feeds into the next decision, so no context is lost between cycles.
Experimentation cycle summary showing three hypothesis-test iterations. Only Cycle C (inline Add to Cart on listing page) reached statistical significance and was promoted to production. The two cosmetic experiments (button color and placement) were inconclusive.
Safety boundaries
The system operates within defined constraints. The agent validates every change through release readiness review before merge. It creates a feature flag before writing any code, so every change can be toggled off without a redeployment. Guarded Releases enforce operational guardrails at runtime with automatic rollback. The agent retries failed validations up to three times, then stops and asks for help rather than proceeding. All credentials are stored in AWS Secrets Manager and referenced by name only, never exposed in agent logs or tool calls.
Getting started
To implement this workflow, you need AWS DevOps Agent enabled in your AWS account, a LaunchDarkly account (start with a free 30-day AWS trial), and a target application and repository. The reference uses a Next.js app deployed through AWS Amplify. Experiments are available on every LaunchDarkly plan, including the free Developer plan. Guarded Releases, which automate progressive rollouts with automatic rollback, require a LaunchDarkly Enterprise plan with the Guardian add-on. Without Guarded Releases, the workflow still runs experiments and reports results. You manage the rollout manually instead. If your plan does not include Guarded Releases, update the agent skill definition below to remove the Guarded Release actions.
Setup requires three steps. First, add the LaunchDarkly remote MCP server to your AWS DevOps Agent space. Second, deploy the Experiment MCP Server container to an AgentCore runtime, storing API keys and tokens in AWS Secrets Manager. Third, create your custom agent with the orchestration skill. Use the experimentation skill in AWS DevOps Agent to guide you through defining goals, connecting the MCP servers, and writing the orchestration instructions. The full orchestration skill is included below.
---
name: "experiment-orchestration"
description: "Orchestrates automated experimentation lifecycle using LaunchDarkly Guarded Rollouts, an AI coding agent for implementation, and GitHub Actions for deployment."
---

# Automated Experimentation

Use this skill when you have a goal you want to move through experimentation (e.g., "increase checkout conversion by 15%", "decrease page load time by 20%").

**Core principle: experiment first, then guarded rollout.** Always prove a change on a small, fixed slice of traffic via an A/B experiment before ramping it up through a guarded rollout. Never start a guarded rollout blind — it exists only to scale a change the experiment has already shown to work.

**Execution mode:** once the goal is confirmed (Step 1), run Steps 2–8 end-to-end. Async operations (code implementation, release review, deployment, experiment monitoring, rollout monitoring) should be checked periodically, not tight-polled — see the waiting note in each step. Only stop and ask the user something if a step fails unrecoverably (repeated failed release reviews, deployment failure, or an inconclusive/losing experiment result).

**The final report (Step 8) is mandatory, not optional.** The moment an experiment or rollout reaches a terminal outcome — winner, loser, inconclusive, or rollback — produce the full report in the same turn you announce the outcome. Don't let a casual "it worked! ????" substitute for the structured report.

## Step 1: Goal Clarification

Before doing anything, get answers to:

1. **What metric measures success?** *(Required)* e.g. conversion rate, page load time, bounce rate. Reserve your error-rate metric as a safety guardrail — never use it as the primary success metric.
2. **What's the target improvement?** *(Required)* e.g. 15% increase, 200ms decrease.
3. **What's the current baseline?** *(Optional — infer from production metrics if not given)*
4. **What parts of the app are in scope?** *(Optional — infer from the codebase if not given)*
5. **Any constraints?** *(Optional)* e.g. no changes to the payment flow.

Questions 1–2 are required before proceeding; infer 3–5 where possible and confirm your assumptions with the user before implementing.

## Step 2: Hypothesis Generation

Explore the target repository/codebase to find a plausible change:

1. Search and read the relevant code paths.
2. Think through what UI/UX or logic change could plausibly move the chosen metric.
3. Check whether this hypothesis (or something close to it) has already been tried and failed — look at flag history or archived flags with similar naming. Avoid repeating a known failure.
4. Present the hypothesis to the user before proceeding, along with your reasoning and any inferred assumptions from Step 1.

**Before finalizing a flag key, check for collisions:** look up any candidate flag key first.
- Already fully shipped (100% one variation, no split) → already decided, pick a different hypothesis.
- Actively running an experiment → mid-flight, don't compete with it, pick a different hypothesis.
- Doesn't exist → safe to create.

## Step 3: Implementation

1. Create a boolean feature flag, OFF by default in all environments. Name it with a clear pattern like `exp-<metric>-<short-description>` (e.g. `exp-checkout-conversion-cta-color`), lowercase with hyphens, ~50 chars max.
2. Hand off implementation to your coding agent/tool of choice, with clear instructions to gate the change behind the exact flag key from step 1.
3. This step is asynchronous — check status periodically rather than looping tightly on it.
4. Once implementation completes, move to Step 4 with the resulting branch/PR. If it fails, report the error and stop.

## Step 4: Release Readiness

Run your standard release/risk review on the PR before merging.

- If it passes: merge the PR.
- If it fails: feed the review's specific feedback back into implementation and retry. Cap retries at a small fixed number (e.g. 3 attempts total) — if it still hasn't passed, stop and report the last failure to the user rather than retrying indefinitely.

*(If your environment genuinely has no review capability available — e.g., a fully unattended automation context — you can skip straight to merge, but treat that as a deliberate, narrow exception you call out explicitly, not a default. Skipping review removes your only gate against shipping broken code.)*

## Step 5: Deployment

Deployment typically won't fire automatically on merge if your workflow is manually-triggered (`workflow_dispatch`-only) — you'll need to trigger it explicitly.

1. Trigger the deploy workflow on the merge target branch. Treat "already an in-progress deployment for this ref" as expected de-duplication, not an error — don't re-trigger.
2. Poll for status, but let your polling tool's own internal long-poll do the waiting rather than looping tightly yourself.
3. Watch for a "stale" status specifically: if a deployment reports "running" for far longer than normal, cross-check the actual CI run history by commit SHA/timing before assuming it's still in progress — a background poll process may have died without updating the record.
4. **Trigger a deployment at most once per attempt.** If you're unsure whether a previous trigger succeeded, check status first — never re-trigger just because you're unsure.
5. On timeout: stop, check the CI run directly, report the situation, ask how to proceed.
6. On explicit failure: stop and report — do not proceed to the experiment.
7. On success: proceed immediately to Step 6.

## Step 6: Experiment Phase (fixed 10%)

Prove the change on a small, fixed slice of traffic. Do **not** start a guarded rollout here — that's Step 7, and only after this proves out.

1. Turn the flag ON.
2. Configure a fixed 50/50 split across 10% of traffic (a flat allocation, not a staged ramp) on your chosen randomization unit (typically "user"). The remaining 90% of traffic is excluded from the experiment entirely.
3. Create an experiment with:
   - Exactly one primary metric: the success metric from Step 1.
   - Guardrail metric(s): always include your error-rate metric; add a performance metric (e.g. p95 page load time) too if this is a performance-focused change.
   - Treatments: control (off) at 50%, treatment (on) at 50%, allocated to 10% of total traffic.
4. Start the experiment/data collection.
5. Move to Step 7 to monitor toward a decision.

## Step 7: Monitoring & Outcome

Check status periodically — don't tight-loop. In an interactive session, check once and report progress, then pick back up later. In an unattended/scheduled context, check once per invocation and persist your progress somewhere durable between runs.

**Phase 1 — Prove the experiment at 10% (gate before any rollout):**

Watch for statistical significance on the primary metric:

- **Significant + positive lift** → experiment proven. Stop the experiment iteration and move to Phase 2.
- **Significant + negative lift** → declare a loser, archive the flag, skip Phase 2, go straight to the Step 8 report.
- **No significance after a reasonable ceiling (e.g. 30 minutes)** → report "inconclusive, need more traffic" and stop; don't proceed to Phase 2.

Never declare a winner off a single data point or before your stats engine confirms significance.

**Phase 2 — Guarded rollout ramp (only after Phase 1 proves the change):**

Start a guarded rollout with:
- The winning ("on") variation as the test, the original as control.
- Same randomization unit as the experiment.
- **Exactly 3 monitored stages, capped well below 100%** — e.g. 20% → 30% → 40%, ~60 minutes monitoring each. Don't add a stage at or above 100%; Guarded-rollout implementations reject stages above 50% audience allocation, and the rollout auto-promotes to 100% itself once the final monitored stage completes cleanly — no explicit 100% stage needed.
- The same primary + guardrail metrics as the experiment, each configured to notify and auto-rollback on regression.

Track stage progression. If the rollout rolls back or stops at any point, treat it as a regression: declare failed, clean up the flag (deprecate/archive it), and go to the Step 8 report.

Once the final stage completes cleanly and auto-promotes to 100%, declare a winner and go to the Step 8 report.

**Retrying after a rollback:** a rollback isn't always caused by your monitored metrics genuinely regressing — it can also be triggered by an unrelated application error surfacing mid-ramp. Before blindly restarting after the user says they've fixed something:
1. Confirm the flag's current state (should be back to 100% control, nothing stuck mid-rollout).
2. Check the change history timing between "advanced to next stage" and "reverted." A rollback within seconds of advancing is inconsistent with a full metric-window regression and points to an external cause instead.
3. If the flag is cleanly reverted and the external cause is confirmed fixed, it's safe to restart the guarded rollout from scratch with the same parameters.
4. Don't silently retry without this check, and don't refuse to retry just because a prior attempt rolled back — a genuinely fixed external cause is a legitimate reason to retry. A metric-driven loser is not — don't retry that.

**On any terminal outcome, immediately produce the Step 8 report in the same turn** — a one-line "it worked!" note is fine as a lead-in, but the structured report must follow, not wait for a follow-up request.

## Step 8: Report

Runs automatically the instant Step 7 reaches a terminal outcome (winner + auto-promoted to 100%; loser; inconclusive; or rollback/failure). Use this exact structure:

```
## Experiment Report: [Goal Description]

**Date:** [YYYY-MM-DD]
**Goal:** [metric] [direction] by [target]%
**Status:** [achieved / in progress / stalled]

### Hypothesis
[What we tried and why]

### Implementation
- Flag: [flag_key]
- Files modified: [list]
- Branch: [branch name]

### Release Readiness
- [reviewed, passed after N attempt(s) / skipped, per your environment's process]

### Experiment Phase (10% fixed split)
- Status: [proven / loser / inconclusive]
- Duration: [time]
- Metric change: [before] → [after] ([+/-]%)
- Statistical significance: [value, confidence interval]

### Guarded Rollout Phase (if reached)
- Status: [completed / rolled_back / not started]
- Duration: [time]
- Stages reached: [N of 3 monitored stages]
- If rolled back and retried: [root cause, outcome of retry]

### Safety Metrics
- error-rate: [baseline] → [final] ([no regression / regression detected])
- [other guardrails]: [baseline] → [final] ([status])

### Next Steps
[What to do next based on the outcome]
```

## Safety Rules (the non-negotiables)

- Always present the hypothesis before implementing.
- Always run a release/risk review before merging, unless your environment has a deliberate, explicitly-called-out exception.
- **Always prove a change via a fixed small-percentage experiment before starting any guarded rollout** — never ramp blind.
- Always include an error-rate (or equivalent "don't break prod") metric as a guardrail, separate from your success metric.
- Add a performance guardrail (e.g. p95 latency) for performance-focused changes.
- Every rollout metric should be configured to both notify AND auto-rollback on regression — don't rely on notification alone.
- **Cap guarded rollout stages well below 100%** (most platforms reject stages ≥50% audience allocation) and let the platform auto-promote to 100% after the final stage — don't try to add an explicit 100% stage.
- Distinguish a metric-driven rollback (don't retry) from an external-cause rollback (safe to retry once fixed) before restarting a rolled-back rollout.
- The final report is automatic and mandatory on every terminal outcome — never defer it to a follow-up ask.
Conclusion
This post described how AWS DevOps Agent, Kiro CLI, and LaunchDarkly connect into a closed-loop system that turns an improvement goal into a series of measured, safe experiments. The agent runs autonomously on a schedule: it generates hypotheses informed by prior outcomes, creates feature flags before any code change, invokes Kiro CLI in headless mode to implement changes behind those flags, validates through release readiness review, deploys through GitHub Actions and AWS Amplify, and hands off to LaunchDarkly for experiment measurement and guarded rollout. If a guardrail is breached at any point during the rollout, LaunchDarkly reverts flag state at runtime without a redeployment. After each cycle, the agent records what happened and feeds it into the next decision.
This directly addresses the three barriers that slow experimentation:
● Planning cost is reduced because the agent handles hypothesis generation, flag creation, implementation coordination, and validation. The team defines the goal; the system handles the wiring.
● Measurement disconnected from action is addressed because LaunchDarkly monitors metrics in real time and reverts flag state automatically when a guardrail is breached, requiring no redeployment and no waiting for a human to notice.
● Stalled iteration is solved because every outcome is recorded and fed into the next hypothesis automatically. The system does not forget what it learned, and it does not stall between iterations.
The architecture is available to implement today as a reference. The orchestration skill included in this post encodes the full 8-step workflow: goal clarification, hypothesis generation, implementation, release readiness, deployment, experiment, monitoring, guarded rollout, and reporting. Teams define their improvement goal, connect the LaunchDarkly MCP server and the Experiment MCP Server to a DevOps Agent custom agent, and let the system iterate toward the target within the safety boundaries they configure. A more turnkey experience is planned for the future.
To provide the best experiences, we use technologies like cookies to store and/or access device information. Consenting to these technologies will allow us to process data such as browsing behavior or unique IDs on this site. Not consenting or withdrawing consent, may adversely affect certain features and functions.
Functional
Always active
The technical storage or access is strictly necessary for the legitimate purpose of enabling the use of a specific service explicitly requested by the subscriber or user, or for the sole purpose of carrying out the transmission of a communication over an electronic communications network.
Preferences
The technical storage or access is necessary for the legitimate purpose of storing preferences that are not requested by the subscriber or user.
Statistics
The technical storage or access that is used exclusively for statistical purposes.The technical storage or access that is used exclusively for anonymous statistical purposes. Without a subpoena, voluntary compliance on the part of your Internet Service Provider, or additional records from a third party, information stored or retrieved for this purpose alone cannot usually be used to identify you.
Marketing
The technical storage or access is required to create user profiles to send advertising, or to track the user on a website or across several websites for similar marketing purposes.