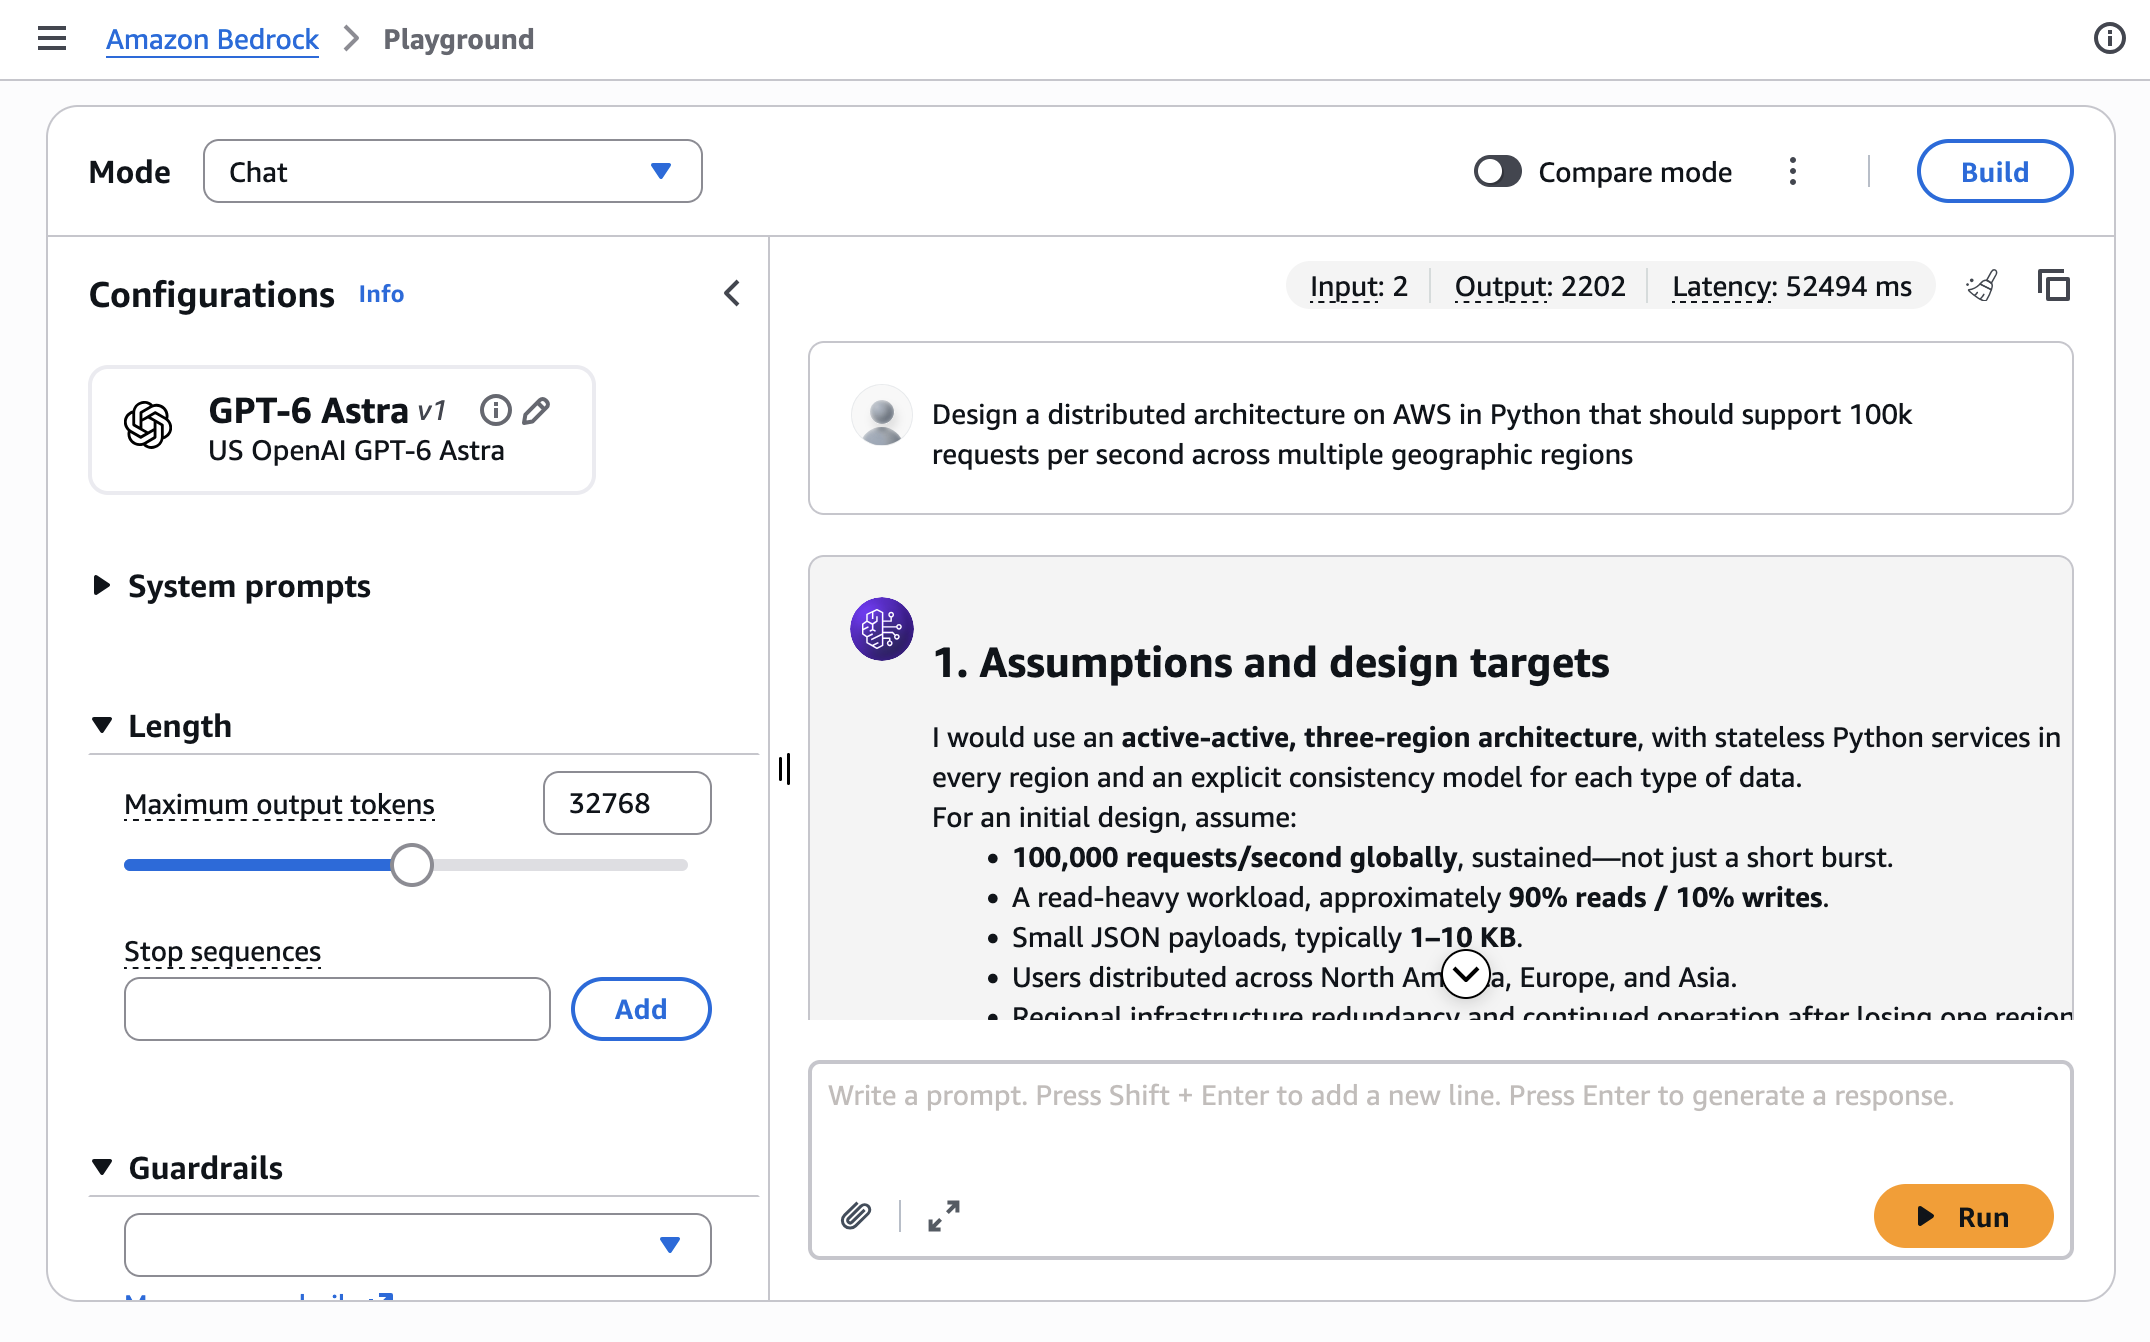
Last week, we announced a public preview of Amazon Bedrock Managed Agents powered by OpenAI, built on a customized version of OpenAI’s Agents API engineered to be AWS-native and integrated with AWS resources. You can now build agents optimized for OpenAI models that run entirely inside AWS with the identities, permissions, and governance controls you already use.
You can choose an execution environment: self-hosted compute to use an existing development machine, container, or compute environment or Amazon Bedrock AgentCore Runtime, for managed runtime sessions and configurable storage in your AWS account. To learn more, visit the Amazon Bedrock documentation.
In addition, we are adding new frontier models on Amazon Bedrock to expand your model choices:
OpenAI GPT-6.1 Sol: An upgrade to GPT-6 Sol, GPT-6.1 Sol delivers exceptionally strong performance on agentic coding, computer use, and professional work. According to OpenAI, it approaches GPT-6 Astra across demanding evaluations at roughly one-fifth of the cost, giving developers more room to build and run capable agents at scale. To learn more, visit the GPT-6.1 Sol model card.
OpenAI GPT-6 Astra UltraFast mode: Ultrafast is a premium speed tier for GPT-6 Astra, built for workloads where speed matters most. According to OpenAI, Ultrafast delivers up to 6x faster inference in the API, with up to 300 tokens per second. The Amazon Bedrock inference engine delivers the performance, security, and reliability required for production workloads. To learn more, visit the GPT-6 Astra model card.
Anthropic Claude Sonnet 5.5: Claude Sonnet 5.5 is a smarter, more efficient Sonnet and a step up from Sonnet 5, making it a natural upgrade for teams already building on Sonnet. It’s stronger for coding, completing well-scoped tasks as part of a larger coding strategy such as building and fixing features with Claude in the same session or verifying output against requirements. To learn more, visit the Claude Sonnet 5.5 model card.
SpaceXAI Grok 4.7: Grok 4.7 builds on Grok 4.6 with better mixed-document handling, more dependable repo-scale coding with planning and error recovery, and enhanced browser-use agents for form fills and portal navigation. To learn more, visit the Grok 4.7 model card.
Last week’s launches
Here are some launches that got my attention:
AWS Well-Architected Agent (preview): You can use an AI-powered agent service that analyzes your AWS environment to deliver targeted, contextual recommendations for improving your applications’ cost, security, performance, and resilience. The agent analyzes your infrastructure, understands your unique business goals, and delivers contextual recommendations.
Amazon S3 Tables support all Apache Iceberg V3 data types: Amazon S3 Tables add support for geometry, geography, unknown, and nanosecond timestamp data types, along with column default values, as defined in the Iceberg V3 specification. You can now store geospatial coordinates and nanosecond-precision event times natively instead of encoding them in strings or integers.
For a full list of AWS announcements, be sure to keep an eye on the What’s New with AWS page.
AWS service availability updates
When the availability of an AWS service or feature changes, we provide customers guidance in AWS Product Lifecycle Changes on available alternatives and support for migration so that disruptions to your operations are minimized. The following lifecycle changes were updated on September 29, 2026.
Services moving to Maintenance (no longer accessible to new customers starting October 29, 2026):
Services reaching End of Support (as of September 29, 2026):
Amazon Mechanical Turk
We understand that changes in availability can impact your operations. For specific guidance, consult the relevant service documentation or contact AWS Support.
Other AWS news
Here are some additional projects and news items you may find interesting:
Introducing Kiro workflows: Kiro workflows enable you to carry out complex tasks from start to finish with multiple agents and less supervision. We’ve been building Kiro itself with workflows, including the new cloud configuration, cloud sessions, and most of the workflow experience.
Introducing Strands Decider: Strands Decider is one of a new class of decision models or system one models, a type of model that has been gaining significant attention since TypeSafe AI’s launch of Jev earlier this month. Strands Decider 2B is a small, open source, decision model optimized for fast experimentation, local development, and innovation.
New FDE pathways for AWS Partners: On June 30, AWS announced the Forward Deployed Engineering (FDE) organization, backed by a $1 billion investment, and extended this hands-on delivery approach to AWS Partners through the Partner-Led FDE motion. Now, AWS Partners have a structured way to build and validate that depth with three new Partner FDE pathways and credentials that recognize the applied proficiency required to deliver production agentic AI.
For a full list of AWS blog posts, be sure to keep an eye on the AWS Blogs page.
Mirelo AI set out to fix how sound design works in the integrated development environment (IDE). For most developers, sound design has always meant leaving the IDE: opening a browser, digging through stock libraries, and trimming and syncing clips by hand. Sound is the last creative layer most developers reach, and the one they most often get wrong without specialist help. For teams building games, apps, and interactive products, digital audio workstations (DAWs) live outside the development workflow, so most ship with placeholder audio or nothing at all.
Mirelo AI, a Europe-based generative AI lab, builds models that turn a text prompt or a video clip into production-ready sound effects, synced to the picture when video is provided. Feed a video clip to the model and it returns audio matched to the action on screen. Mirelo built a hosted server on the Model Context Protocol (MCP), the open standard that lets AI assistants discover and call external tools. With Mirelo’s hosted MCP server, developers can reach those models from the tools they already use.
In this post, we describe how that MCP server became a power in Kiro, the agentic development environment from AWS. We also cover how Mirelo’s AWS Enterprise Support account team helped bring it to the Kiro powers marketplace. The result: Developers using Kiro can generate sound design from a natural-language prompt without leaving their editor.
Solution overview
With a Kiro power, you get Mirelo’s hosted MCP server bundled with Agent Skills that tell the AI assistant when and how to use it. When a developer’s prompt mentions sound, audio, or effects, Kiro activates the power, connects to Mirelo’s server, and loads its tools into the conversation. The developer describes the sound they want. Kiro calls Mirelo’s models and returns a finished audio file into the project.
The design has three parts:
Mirelo’s audio models, exposed through their existing HTTP API.
The hosted MCP server (https://mcp.mirelo.ai/mcp), which wraps that API as callable tools.
The Kiro power, which bundles the MCP configuration with an Agent Skill and publishes it to the marketplace for one-action install.
The problem: Sound is the last mile of creative development
Visual assets have mature tooling inside IDEs and design systems. Audio does not. A game developer prototyping a level generates textures, writes shaders, and tests physics in the editor. But the moment they need a matching footstep sound, the flow breaks. They open a browser, search a stock library, download candidates, trim them to length, and manually sync timing.
Content creators working with generative video hit the same wall from the other side. AI models now produce visual content in seconds, but each clip ships silent, so adding sound means switching tools, breaking flow, and spending more time on audio than the video itself took to create.
Mirelo’s thesis: Sound generation should live where developers already work, not in a separate application.
From API to agent tool: The Mirelo MCP server
Mirelo already had an API powering their Studio product. The question was how to make those capabilities reachable inside AI-powered development environments without asking developers to write integration code.
MCP answers that. By wrapping their API as an MCP server, Mirelo exposed their full audio generation pipeline to any compatible AI assistant. The Mirelo MCP is hosted and remote: developers add a single URL, authenticate through their browser, and start generating audio from conversation. There’s no local install and no API key to manage.
The server covers the full sound design loop:
Generate from text: describe a sound effect in natural language and receive a finished audio file.
Generate from video: pass a video clip and get synced sound effects for every action.
Extend: lengthen an audio clip that is too short for the scene.
Inpaint: replace a selected region of a clip while leaving the rest untouched.
A preflight tool estimates credits and runtime before generation runs, which matters when an agent works through a batch of files rather than a single effect.
Comparing direct API access with a Kiro power
Without the power, a developer who wants a sound effect works against the API directly. For anything longer than a short clip, that means the asynchronous path: submit the job, get a job ID back, poll for status, then download the result once it completes. A minimal version looks like this:
# 1. Submit the job
# The code samples in this post are provided for demonstration and educational purposes only and
# are not intended for production use without additional security review and testing. In
# particular, store API keys in a secrets manager rather than inline, and add error handling and
# retry limits before deploying.
JOB=$(curl -s https://api.mirelo.ai/v2/text-to-sfx/v1.6/jobs \
  --request POST \
  --header 'Authorization: Bearer sk-<your-api-key>' \
  --header 'Content-Type: application/json' \
  --data '{
    "prompt": "Heavy rain on a metal roof with distant thunder",
    "duration_ms": 45000,
    "output_format": "mp3"
  }' | jq -r '.job_id')

# 2. Poll until the job leaves the "processing" state
while true; do
  STATUS=$(curl -s "https://api.mirelo.ai/v2/text-to-sfx/v1.6/jobs/$JOB" \
    --header 'Authorization: Bearer sk-<your-api-key>' | jq -r '.status')
  [ "$STATUS" = "succeeded" ] && break
  [ "$STATUS" = "failed" ] && echo "generation failed" && exit 1
  sleep 3
done

# 3. Fetch the result URL and download the clip
curl -s "https://api.mirelo.ai/v2/text-to-sfx/v1.6/jobs/$JOB" \
  --header 'Authorization: Bearer sk-<your-api-key>' \
  | jq -r '.result_urls[0]' \
  | xargs curl -o rain.mp3
This works, but the developer owns every step. They store the API key, choose the sync endpoint for short clips and the async endpoint for longer ones, and call preflight to estimate credits. They also run the poll loop with sensible backoff, handle the failure state, download the result, and retry on transient errors. Each surface, whether a web app, a game editor, or a batch script, reimplements the same glue.
With the power, the developer describes the sound and the agent assembles that same request. Kiro authenticates through browser sign-in and reads the tool schema Mirelo published. It fills in prompt, duration_ms, and output_format from the conversation, runs the preflight tool when the job is large, and waits on the async job when generation runs long. The developer writes:
Generate 45 seconds of heavy rain on a metal roof with distant thunder, as an mp3.
The file is added to the project. The underlying API call is the same. What changes is who assembles and operates it.
The following table compares the two paths:
Concern
Direct API
Kiro power/MCP tool call
Authentication
Store and send Bearer sk-… on every call
Browser sign-in, managed by Kiro
Cost check
Call /preflight yourself
Agent calls the preflight tool when the job warrants it
Sync compared to async
You choose the endpoint and implement polling
Agent selects based on job size
Response handling
Parse result_urls and download
Agent returns the file into the project
Reuse across tools
Reimplement the glue per surface
One power, available in any Kiro session
Why package it as a Kiro power
Mirelo’s MCP server already worked in several AI assistants. With a Kiro power, you get discoverability, so you find the integration while browsing the marketplace, and automatic activation, so there is no URL to paste or configuration to write.
A power bundles an MCP server with Agent Skills, the structured instructions that guide an AI assistant through a specific workflow. The AI assistant learns what tools exist and when to reach for them. Just as important is how a power loads. A traditional MCP setup registers every tool definition upfront. Connecting a handful of servers can burn tens of thousands of tokens, a large share of the context window, before your first prompt. Kiro powers load dynamically instead. Installed powers sit dormant until your conversation mentions relevant keywords, at which point Kiro activates only that power’s tools and skills and deactivates them when you move on. Skills load the same way, on-demand, so the AI assistant pulls in a specific workflow’s instructions only when it’s working on that task. The result is near-zero baseline context cost and a Mirelo integration that surfaces its sound-design tools exactly when they’re needed, without crowding out the rest of your work.
The structure of a power is small. The following layout shows the three files that define it:
example-power/
|-- plugin.json          # Manifest: name, keywords, and metadata
|-- mcp.json             # Remote MCP server configuration
+-- skills/
    +-- sound-design/
        +-- SKILL.md     # Guides the agent through audio workflows
The plugin.json manifest declares the keywords that trigger activation. The mcp.json file points to the provider’s hosted server. The skill teaches the agent the difference between generating a one-shot effect and sound-designing an entire sequence.
The path from idea to marketplace
The Kiro powers connection came from Mirelo’s AWS Enterprise Support account team. The team spotted the fit between Mirelo’s MCP server and the powers marketplace. They built a proof-of-concept power to show how the integration would work and connected Mirelo with the submission process. Mirelo then packaged their official hosted server as the published power.
From the first conversation to a live power took about two weeks, most of it marketplace review. The engineering itself fit into a single afternoon. The impact is easiest to see in the developer’s workflow. Finding a single sound effect that matches the video is slow, manual work. That includes searching a stock library, auditioning candidates, trimming, and syncing. With the power, a single prompt returns a usable, synced clip, replacing a lengthy manual workflow with one step.
What developers can do with it
After the Mirelo power is active, sound design becomes part of the conversation. A developer polishing a web app might ask:
Generate a soft, satisfying click for this submit button. Short, no metallic ring.
On a game prototype, the request could be:
Here’s my gameplay clip. Generate footstep and impact sounds that match the character’s movement.
For a video project that needs a longer bed:
Extend this forest ambience to forty-five seconds so it covers the full scene transition.
And to fix a single moment:
The glass-break sound at 0:03 is too harsh. Inpaint that region with something more subtle, like thin crystal.
Each request calls Mirelo’s models and returns audio ready to use, without the developer leaving the editor.
A distribution channel for AI model companies
For Mirelo, the Kiro powers marketplace is a new kind of distribution. API businesses have historically reached developers through documentation sites, SDKs, and marketing. A power puts the capability inside the tool developers already use. Developers reach it by intent rather than by integration work.
The model fits AI services that augment creative workflows. Developers don’t plan to use a sound API the way they plan to use a database. They need sound the moment they realize their project is silent. A power meets them at that point of intent.
Conclusion
In this post, we described how Mirelo AI turned a hosted MCP server into a Kiro power, and how AWS Enterprise Support helped move it into the marketplace. For developers, sound design is now a prompt away inside Kiro. For AI model companies, the same path turns an existing MCP server into a distribution channel that reaches developers at the point of intent.
AS/400 business rule extraction no longer requires months of manual effort. With Kiro, an agentic AI-powered development environment (spanning IDE, CLI, web, and mobile surfaces, along with the Kiro Crew workspace), you can compress the process into days. This step-by-step guide walks through the approach. Organizations face a common challenge: critical business logic embedded in extensive RPG and COBOL code bases, often maintained by a declining number of developers and subject matter experts (SMEs) with RPG expertise. The fulfillment rules and shipping logic are scattered across interconnected programs that no single person fully understands.
In this post, we walk you through a step-by-step approach for using Kiro to extract business rules from AS/400 RPG and COBOL programs, generate technical specifications, and produce modernization-ready documentation.
Extraction process challenges
Before this engagement, one of our customers faced several challenges with their existing business rules extraction process. They were planning to modernize their AS/400 order fulfillment workflow, which handled inventory validation, shipping document generation, and warehouse operations.
Significant consulting costs for specialized AS/400 consultants.
Time-intensive manual analysis, typically 4–6 weeks of dedicated effort.
Documentation that becomes outdated before the team finishes writing it.
Risk of overlooking critical business logic during modernization.
The following is the sample system flow considered to walk through the step-by-step guide.
PROG001 (Interactive Validation)
   │  Validates orders, checks inventory, resolves periods
   ▼
PROG002 (Batch Control)
   │  Manages batch processing of validated orders
   ▼
PROG003 (File Management)
   │  Handles file splitting for large shipment batches
   ▼
PROG004 (Content Generation)
   │  Generates shipping manifests, allocates stock by warehouse priority
   ▼
PROG005 (Encoding and Transmission)
Converts EBCDIC to UTF-8, transmits to external Carrier Gateway
Each program has embedded business rules, including order validation and stock allocation with warehouse priority. These programs also handle shipping weight calculations, character encoding conversion, and integration with external carrier systems. Traditional analysis would have taken 4–6 weeks per system. The effort required across consultants, technical writers, and reviewers would have been 40–80 person-hours per system.
Solution
With Kiro, an agentic AI-powered development environment, you can extract comprehensive business rules, generate technical specifications, and create modernization-ready documentation in hours, not months (as detailed in the Outcomes section).
Working autonomously across your code base, Kiro analyzes dependencies, traces execution paths, and produces detailed documentation.
The approach relies on two core Kiro capabilities:
Steering files: Persistent instructions that guide the AI’s behavior, including project context, naming conventions, analysis standards. Configure them once and they apply to all subsequent sessions. Steering files can reference documentation templates that define the exact output format. Each subsequent analysis follows the same repeatable structure.
Specs: A structured way to define requirements, design, and implementation tasks. Kiro executes tasks autonomously with progress tracking. Spec tasks tell Kiro which templates to use and where to save the output.
The workflow has three phases:
Phase 1 – Configure steering files to define project context, directory structure, and technical standards. Examples include “extract 10–20 lines of code context around business rules” and “map abbreviated DDS field names to business terms.” Create documentation templates that the steering files reference. These templates specify the exact output format for business rules with code snippets, pseudocode equivalents, DDS field mappings, and integration specifications.
---
inclusion: always
---
# AS/400 Business Rule Extraction Project
## Goal
Analyze a legacy AS/400 order fulfillment system and extract all business
rules to produce modernization-ready documentation. Discover the program
workflow, data architecture, and business logic by reading the source code.
## Source File Locations
- sourcefiles/rpg/ — RPG IV programs (.RPGLE)
- sourcefiles/cl/ — CL programs (.CLLE)
- sourcefiles/dds/ — DDS definitions: physical files (.PF), logical files (.LF), display files (.DSPF)
- sourcefiles/data/ — DB2 table exports (.csv), one per physical file
## What to Discover
- What each program does and how they relate to each other (trace CALL statements and SBMJOB commands)
- Which files each program accesses and how (read the F-specs at the top of each RPG program)
- Business rules embedded in RPG subroutines (validation, processing, calculation logic)
- How configuration tables drive runtime behavior (trace CHAIN lookups and conditional branching)
- External system integration points (identify calls to programs outside this codebase)
- Data flow between programs (trace parameters passed via CALL/PARM and shared files)
- The meaning of cryptic DDS field names (map them to business terms using TEXT keywords and program context)
## What to Produce
- Business rules with original RPG code snippets (10-20+ lines of context)
- Pseudocode equivalents for every business rule
- DDS field-to-business-term mappings for all physical files
- File dependencies matrix (which programs access which files and how)
- Inter-program parameter passing documentation
- Configuration-to-behavior mapping (trace config table values to subroutine invocations)
- Integration specifications for any external system calls
Use the template at templates/Technical_Implementation_Spec.md for output format.
Save all generated documentation to the output/ directory.
## Constraints
- Analysis only — never create executable programs or modify source files
- Read-only operations on all source files
- Every business rule must trace back to specific program, subroutine, and line numbers
- Discover the system's behavior from the source code — do not assume what the programs do
Figure 1: Steering files provide persistent instructions that guide the analysis behavior of Kiro across sessions, configured once and applied to subsequent analyses
Phase 2 – Build a Kiro Spec with discrete, actionable tasks: analyze source files, parse DDS definitions, extract business rules, generate pseudocode, create consolidated documentation using the templates, and verify business rules against source code.
# Implementation Plan: AS/400 Business Rule Extraction
## Overview
This implementation plan extracts business rules and technical specifications from a legacy AS/400 order fulfillment system. The analysis workflow reads RPG programs, CL programs, and DDS file definitions to discover business logic, data architecture, program workflows, and integration points. All findings will be documented using the provided template and saved to the output directory.
## Tasks
- [ ] 1. Analyze DDS physical and logical file definitions
- Read all .PF files in sourcefiles/dds/ and extract field definitions (name, type, length, decimals, TEXT, COLHDG, VALUES)
- Read all .LF files and document key structures and access paths
- Read any .DSPF files and document screen layouts and field mappings
- Map every cryptic field name to a business term using TEXT keywords, column headers, or literal values
- Document key structures and file relationships (which LF belongs to which PF)
- Save intermediate analysis to output/
- [ ] 2. Analyze each program and extract business rules
- Read all RPG programs (.RPGLE) in sourcefiles/rpg/
- Read all CL programs (.CLLE) in sourcefiles/cl/
- For each program, extract F-spec file declarations with access modes
- Identify all subroutines and document their boundaries (line numbers)
- Extract business rules from subroutines, mainline code, and CL logic
- Include 10-20+ lines of original source code context for each rule
- Generate pseudocode equivalents using common programming constructs
- Categorize each rule (validation, processing, calculation, error handling, integration)
- [ ] 3. Map the program workflow and data flow
- Trace all CALL statements and SBMJOB/QCMDEXC invocations across programs
- Document parameters passed at each inter-program call point
- Build the complete program-to-program workflow chain
- Document how data flows between programs via shared files and parameters
- Map logical file usage back to underlying physical files
- [ ] 4. Analyze configuration-driven behavior
- Identify patterns where programs CHAIN to a table and branch based on values read
- Read the CSV data exports in sourcefiles/data/ to see current configuration values
- Trace each configuration value to the code path it triggers
- Flag any inactive or dead configuration entries
- Produce a configuration-to-behavior mapping
- [ ] 5. Document integration specifications
- Identify all calls to programs outside this codebase
- Document parameters, data formats, and protocols for each external interface
- Document any character encoding conversions (CCSID values and transformations)
- Document file paths, naming conventions, and transmission mechanisms
- [ ] 6. Generate consolidated Technical Implementation Specification
- Load the template from templates/Technical_Implementation_Spec.md
- Populate all template sections with the analysis from tasks 1-5
- Include business rules with original code snippets and pseudocode
- Include DDS field mappings, file dependencies, configuration mappings, and integration specs
- Ensure every claim traces to specific program, subroutine, and line numbers
- Save to output/
- [ ] 7. Validate documentation completeness and accuracy
- Verify all programs have been analyzed
- Verify all DDS physical files have field-to-business-term mappings
- Verify all business rules have both source code snippets and pseudocode
- Verify all inter-program calls are documented with parameters
- Verify the consolidated document follows the template structure
- Cross-check source code references for accuracy (correct line numbers)
## Notes
- This is a read-only analysis workflow — no source files will be modified
- Every business rule must trace to specific program, subroutine, and line numbers
- DDS field mappings use TEXT keywords, COLHDG, and VALUES to determine business terms
- Configuration-driven behavior is identified by CHAIN + conditional branching patterns
- All generated documentation will be saved to the output/ directory
- The template at templates/Technical_Implementation_Spec.md defines the output format
## Task Dependency Graph
```json
{
  "waves": [
    { "id": 0, "tasks": ["1"] },
    { "id": 1, "tasks": ["2", "3"] },
    { "id": 2, "tasks": ["4", "5"] },
    { "id": 3, "tasks": ["6"] },
    { "id": 4, "tasks": ["7"] }
  ]
}

```
Figure 2: The Kiro Spec, showing discrete tasks that Kiro executes autonomously with progress tracking
Phase 3 – Execute the Spec and let Kiro work autonomously. Monitor progress as tasks complete, then review the generated documentation.
Important: AI-extracted rules should be reviewed by an AS/400 SME. Automated extraction might occasionally misinterpret complex or ambiguous business logic, so human validation remains essential before acting on extracted rules.
Here’s an example of what Kiro produces. Given this RPG subroutine that validates orders against the master file, Kiro generates a plain-language business rule and its pseudocode equivalent:
Rule 1.3.16: Stock Allocation
Category: Processing Subroutine: ALLCST (lines 3820-3960) Description: Allocates stock from warehouse inventory. Looks up inventory by item key, verifies sufficient available quantity, then decrements available quantity and increments reserved quantity by the order amount. Updates the inventory record.
Source Code (lines 3820-3960):
   3820      C     ALLCST        BEGSR
   3830      C     ITEMKY        CHAIN     INVSTCK1                           42
   3840      C     *IN42         IFEQ      '0'
   3850      C     QTYAV         IFGE      ORDQTY
   3860      C     QTYAV         SUB       ORDQTY        QTYAV
   3870      C     QTYRS         ADD       ORDQTY        QTYRS
   3880      C                   UPDATE    INVFMT
   3890      C                   Z-ADD     0             ALLERR            1 0
   3900      C                   ELSE
   3910      C                   Z-ADD     1             ALLERR
   3920      C                   END
   3930      C                   ELSE
   3940      C                   Z-ADD     2             ALLERR
   3950      C                   END
   3960      C                   ENDSR
Pseudocode:
function allocateStock():
    inventory = findByKey(InventoryStock, itemKey)
    if inventory found:
        if inventory.quantityAvailable >= orderQuantity:
            inventory.quantityAvailable -= orderQuantity
            inventory.quantityReserved += orderQuantity
            update inventoryStock
            allocationError = 0 // OK
        else:
            allocationError = 1 // Insufficient stock
    else:
        allocationError = 2 // Item not found
Figure 3: Kiro extracts business rules with original RPG code, pseudocode equivalents, and plain-English descriptions
The following is the DDS field mapping that translates abbreviated AS/400 field names into business terms:
1.1 ORDERMST — Order Master
Field
Type
Length
Dec
TEXT (Business Term)
COLHDG
VALUES
Used By
ZIORCD
A
8
—
Order Code
Order / Code
—
PROG001, PROG002, PROG003, PROG004
ZIPERD
P
6
0
Fulfillment Period
Fulfill / Period
—
PROG001
CURPER
P
6
0
Current Period
Current / Period
—
PROG001
STATUS
A
1
—
Order Status
Order / Status
‘A’ ‘H’ ‘C’ ‘X’ ’ ’
PROG001, PROG002
CUSTNAME
A
40
—
Customer Name
Customer / Name
—
PROG001, PROG002, PROG003, PROG004
WHSCD
A
4
—
Warehouse Code
Warehouse / Code
—
PROG001, PROG002, PROG003, PROG004
ORDDTE
P
8
0
Order Date
Order / Date
—
PROG001
ORDQTY
P
7
0
Order Quantity
Order / Quantity
—
PROG001
SHPTYP
A
2
—
Shipment Type
Shipment / Type
—
PROG001
PRIORT
A
1
—
Priority Code
Priority
‘1’ ‘2’ ‘3’
PROG001
Record Format: ORDERMST — TEXT(‘Order Master Record’)
Key: ZIORCD (unique)
STATUS Values: A = Active, H = Hold, C = Complete, X = Canceled, ’ ’ = New/Blank
Figure 4: DDS field mapping translates abbreviated AS/400 field names into business terms
This mapping is essential for modernization. Without it, developers building the replacement system are guessing at what Z1ORDCD means.
Deployment
The following steps walk you through setting up and running the extraction workflow.
Prerequisites
Before you begin, make sure that you have the following in place:
Kiro installed on your workstation (download from https://kiro.dev/).
Access to the AS/400 source code you plan to analyze (RPG/RPGLE, CL/CLLE, and DDS definitions), exported as text files.
Optionally, DB2 configuration tables exported to CSV for configuration-driven behavior analysis.
Familiarity with your organization’s business domain, plus access to an AS/400 SME to validate the extracted rules.
A local project directory where Kiro can read the source files and write generated documentation.
The complete setup is available in the companion GitHub repository listed in the Resources section. This includes steering files, templates, sample AS/400 source code, and Spec definitions.
Figure 5: Project structure in Kiro, showing source files, steering configuration, templates, and output directory
The setup has five steps:
Step 1: Project setup
Create the directories that you will be working from for source files, data, output, and other artifacts:
Create steering files to define your analysis standards. For example, .kiro/steering/product.md:
# Project Context
This project analyzes AS/400 RPG and COBOL programs to extract business rules.
# Analysis Standards
- Extract 10--20+ lines of code context around each business rule
- Map abbreviated DDS field names to business terms
- Document inter-program dependencies and parameter passing
- Identify configuration-driven behavior patterns
Step 3: Add your source files
Copy your AS/400 source code into the sourcefiles/ subdirectories: RPGLE files in rpg/, CLLE files in cl/, and DDS definitions in dds/. Optionally, export DB2 tables to CSV in sourcefiles/data/ for configuration table analysis if you have programs with conditional logic that use those tables to hold runtime configuration options.
Step 4: Create a Kiro Spec
In Kiro, use the command palette: Create New Spec. Define tasks like:
Example Spec definition:
Spec Name: AS/400 Business Rule Extraction
Task 1: Analyze DDS physical and logical file definitions in sourcefiles/dds/
Task 2: For each RPG program in sourcefiles/rpg/, extract business rules with 10--20 lines of surrounding code context
Task 3: Map DDS field names to business terms using templates/field-mapping-template.md
Task 4: Document inter-program data flow and parameter passing
Task 5: Generate consolidated Technical Implementation Specification using templates/tis-template.md
Task 6: Validate that all extracted rules reference valid source line numbers
Step 5: Execute
Open the Spec in Kiro, choose Start, and monitor progress as tasks complete autonomously. Review the generated documentation in the output/ directory.
For detailed instructions, templates, and example outputs, see the GitHub repository.
What the workflow looks like
Figure 6: Kiro executing the Spec, with real-time progress as each task completes
When you execute the Spec, Kiro processes tasks in sequence with real-time progress tracking. Here is what happens during execution:
Opening the Spec with all tasks listed.
Kiro autonomously reading RPG source files and DDS definitions.
Business rules being extracted with code snippets and pseudocode.
DDS field names being mapped to business terms.
The final consolidated documentation in the output directory.
Outcomes
This section summarizes the measured results from the customer engagement described earlier in this post (a five-program AS/400 order fulfillment system with approximately 40,000 lines of RPG/COBOL). Traditional estimates sourced from the customer’s prior modernization planning documents. Results vary by code base complexity.
Time and effort savings
Using Kiro reduced both elapsed time and total person-hours by an order of magnitude compared to the customer’s traditional manual approach. The following table compares the two approaches:
Metric
Traditional Approach
Kiro-Assisted
Savings
Total effort
40-80 person-hours
12 person-hours
70-85% reduction (measured against the customer’s planning estimates)
Timeline
4-6 weeks
3 days
~90% reduction (measured against the customer’s planning estimates)
Breakdown of Kiro-assisted effort
The 12-hour total breaks down as follows, showing that most of the time is spent on human review rather than setup or execution:
Setup (steering + templates + spec): 2 hours.
Kiro autonomous execution: 30 minutes.
Review and validation: 9.5 hours (reflective of iterative refinement of steering, template, spec, and execution).
Total: approximately 12 hours per system of 5 programs with approximately 40,000 lines of code (measured during the customer engagement described earlier in this post).
What Kiro produced
Kiro autonomously generated a complete documentation package for the five-program system, including:
Business rules catalog with original RPG code snippets and pseudocode equivalents.
DDS field-to-business-term mappings across seven physical files.
File dependencies matrix showing which programs access which files.
Integration specifications for the external carrier gateway (CCSID conversion, transmission parameters).
Over 50 pages of structured, template-aligned documentation (measured output from this engagement).
Multiplier effect
The setup cost (templates, steering, Specs) is one-time and is not repeated for additional systems. The following projections extrapolate the per-system effort (approximately 10 hours) from the single-system measured results and add the one-time setup only once:
Scale
Traditional
Kiro-Assisted
Savings
1 system
40-80 hrs / 4-6 weeks
12 hrs / 3 days
28-68 hrs
10 systems
400-800 hrs / 40-60 weeks
102 hrs / 30 days
298-698 hrs
Key quality improvements
Consistent, template-driven output across every system analyzed.
Exact line number references back to source code for every business rule.
Cross-referencing between DDS definitions and RPG program usage alleviates guesswork.
Reusable templates and Specs can often be reused for similar systems with minimal reconfiguration.
Conclusion
Legacy AS/400 business rule extraction doesn’t need to take months. With the steering files and Specs in Kiro, you can extract business logic from RPG code bases and produce developer-ready documentation in days.
You still need AS/400 knowledge, business context, and architectural judgment to validate, prioritize, and plan the modernization. But you don’t need to spend months manually reading code and writing specifications. With Kiro handling extraction, you can focus on strategy and decision-making.
If you have questions or want to share your experience, leave a comment on this post. If you’re an AWS customer working on AS/400 or mainframe modernization, reach out through your AWS account team.
Every code review discussion, incident response thread, and standup happens in Slack. But when an engineer needs to analyze a service or debug a failing test, they leave Slack, open a terminal, navigate to the repository, run commands, and paste the output back. That round trip takes 30 seconds for someone who knows exactly where to look and 5 minutes for someone less familiar with the codebase. Across a team of 10 engineers doing this 15 times a day, that adds up to over 12 hours of lost engineering time per week.
This post walks through building a ChatOps integration that runs Kiro CLI from a Slack slash command. An engineer types /kiro analyze auth-service for memory leaks, and the results appear directly in the channel—no context switch required. The solution uses AWS Lambda, Amazon API Gateway, and AWS Secrets Manager, and it depends on Kiro CLI’s headless authentication to run without an interactive session.
In this post, you will learn how to:
Configure a Slack App with a slash command that triggers an AWS Lambda function
Authenticate Kiro CLI in a headless environment using API key-based authentication
Build and deploy a container image with Kiro CLI to Amazon Elastic Container Registry (Amazon ECR)
Deploy the full solution with AWS Serverless Application Model (AWS SAM)
Why headless authentication matters
A Slack slash command triggers a webhook. The webhook invokes a Lambda function. The Lambda function runs Kiro CLI. At no point in this chain is there a browser, a terminal, or a human session.
Without headless authentication, this architecture does not work. Kiro CLI would require an interactive login, and a Lambda function has no display and no way to complete an OAuth flow.
kiro-cli chat --no-interactive "analyze auth-service for memory leaks"
The API key is stored in AWS Secrets Manager, fetched at runtime, and injected into the Lambda environment. The engineer in Slack never sees or manages the key.
Important: API key-based authentication is available for Kiro Pro, Pro+, and Power subscribers. If your subscription is managed by an administrator, your Kiro admin must enable API key authentication first. For details, see API key governance.
Architecture overview
The solution consists of two Lambda functions, an API Gateway endpoint, and AWS Secrets Manager. The request and response follow two separate paths:
Request path: Slack → API Gateway → Dispatcher Lambda → acknowledge back to Slack (under 3 seconds), then async invoke → Worker Lambda
Response path: Worker Lambda → Slack response_url (direct HTTPS POST, bypasses API Gateway)
Why two Lambda functions?
Slack requires a response within 3 seconds of a slash command. Kiro CLI analysis takes 10–60 seconds depending on the repository size and prompt complexity. The Dispatcher acknowledges the command immediately and invokes the Worker asynchronously. The Worker runs Kiro CLI and posts results back to Slack through the response_url provided in the original payload. This is a standard pattern for Slack integrations that perform long-running work.
A note on response_url limits: the webhook Slack provides in the slash command payload expires 30 minutes after the command is issued and accepts a maximum of 5 responses. The 10-minute Worker timeout and single response in this solution stay well inside both limits. If you raise the Lambda timeout beyond 30 minutes or add incremental progress updates, these POSTs begin to fail silently – switch to chat.postMessage with a bot token at that point.
Prerequisites
Before you begin, you need the following:
An AWS account with permissions to create Lambda functions, API Gateway, Amazon ECR repositories, Secrets Manager secrets, and IAM roles
An infrastructure-as-code tool for deploying serverless resources (this post uses AWS SAM CLI, but you can adapt the templates to AWS CDK, AWS CloudFormation, Terraform, or your preferred tool)
Finch or Docker installed for building container images
A Slack workspace where you have permission to create a Slack App
A Kiro Pro, Pro+, or Power subscription with API key authentication enabled
Step 1: Gather credentials
You need three credentials before deploying. Collect all of them first, then store them in Secrets Manager in Step 2.
Kiro API key
This authenticates Kiro CLI in headless mode.
Sign in to app.kiro.dev
Navigate to API Keys
Create a new key named kiro-chatops
Copy the key (starts with ksk_) – it is shown only once
Slack Signing Secret – This allows the Dispatcher to verify that incoming requests originate from Slack.
On the Basic Information page, scroll to App Credentials
Copy the Signing Secret (32-character hex string)
Slack Bot Token – Optional
The Worker posts results using the response_url from the original slash command payload, which is a pre-authenticated webhook that does not require a bot token. Collect a bot token with the chat:write scope only if you extend the solution to post messages independently of a slash command response.
In your Slack App settings, go to OAuth & Permissions
Add the Bot Token Scope: chat:write
Choose Install to Workspace and authorize
Copy the Bot User OAuth Token (starts with xoxb-)
While you are in the Slack App settings, also configure the slash command:
Go to Slash Commands → Create New Command
Set Command to /kiro
Set Request URL to https://placeholder (update after deployment in Step 6)
Set Short Description to Run Kiro-CLI development tasks
Set Usage Hint to [analyze|review|debug|explain] <description>
Step 2: Store secrets in AWS Secrets Manager
Store each credential as a separate secret. The Lambda functions retrieve these at runtime using IAM-scoped access.
If your target repository is private, also store a GitHub Personal Access Token with repo scope. The Worker uses this token to clone the repository inside the Lambda execution environment.
The Dispatcher has three responsibilities: verify that the request came from Slack, acknowledge the slash command within 3 seconds, and invoke the Worker asynchronously.
Request verification – Slack signs every request with HMAC-SHA256 using your app’s signing secret. The Dispatcher must validate this signature before processing payloads. The verification logic constructs a base string from the request timestamp and body, computes the HMAC, and compares it to the signature in the request header:
Reject any request with a timestamp older than 5 minutes to prevent replay attacks. Normalize request headers to lowercase before reading them—API Gateway may preserve the original casing from the client.
Async handoff
After verifying the request, parse the slash command payload to extract text, user_name, and response_url. Then invoke the Worker Lambda with InvocationType="Event" (fire-and-forget) and immediately return an acknowledgment to Slack:
If the user sends /kiro with no arguments, return an ephemeral usage message with examples. The Dispatcher uses the standard Python 3.12 Lambda runtime and requires no container image.
Step 4: Build the Worker Lambda container image
The Worker runs Kiro CLI against a cloned repository and posts results to Slack. Because Kiro CLI depends on git, system libraries (NSS, X11, ALSA), and a binary that exceeds Lambda’s 250 MB layer limit, package the Worker as a container image.
Dockerfile structure
Start from the AWS Lambda Python 3.12 base image. Install git and the shared libraries that Kiro CLI requires, then install Kiro CLI itself:
Two details matter here. First, copy the Kiro CLI binary to /usr/local/bin/ rather than leaving it in /root/.local/bin/—Lambda runs as a non-root user that cannot access /root/. Second, build with --platform linux/amd64 regardless of your local architecture, because Lambda defaults to x86_64.
Worker logic – The handler performs four steps:
Fetch the Kiro API key (and optionally a Git token) from Secrets Manager
Clone the repository to /tmp/repo using git clone --depth 1
Run kiro-cli chat --no-interactive "<prompt>" with KIRO_API_KEY and HOME=/tmp set in the environment
Post the output to Slack via the response_url
Setting HOME=/tmp is required because Kiro CLI writes a session database, and Lambda’s filesystem is read-only except for /tmp. Strip ANSI escape codes from the output before posting—Kiro CLI emits terminal colors that render as garbage in Slack.
The subprocess timeout should be shorter than the Lambda timeout to allow time for error handling and the Slack POST. Set the subprocess timeout explicitly to 540 seconds in the Worker code, rather than relying on the Lambda timeout alone. A 9-minute subprocess limit with a 10-minute Lambda timeout provides a 1-minute buffer.
Truncate output to 3,800 characters before posting. Slack’s message limit is 4,000 characters per block, and the surrounding formatting consumes part of that space.
Build and push to Amazon ECR
Clean up /tmp/repo at the end of every invocation. Lambda may reuse a warm execution environment, so anything left in /tmp persists into the next invocation. Removing the clone in a finally block helps prevent one user’s repository from leaking into a later request and keeps the 512 MB ephemeral storage from filling up across warm invocations.
AWS_ACCOUNT_ID=$(aws sts get-caller-identity --query Account --output text)
AWS_REGION=us-east-1
 # Create the ECR repository (first time only)
aws ecr create-repository --repository-name kiro-worker --region $AWS_REGION
 # Authenticate to ECR
aws ecr get-login-password --region $AWS_REGION | \
  finch login --username AWS --password-stdin \
  $AWS_ACCOUNT_ID.dkr.ecr.$AWS_REGION.amazonaws.com
 # Build for the correct architecture
cd worker
finch build --platform linux/amd64 -t kiro-worker:latest .
 # Tag and push
finch tag kiro-worker:latest \
  $AWS_ACCOUNT_ID.dkr.ecr.$AWS_REGION.amazonaws.com/kiro-worker:latest
finch push \
  $AWS_ACCOUNT_ID.dkr.ecr.$AWS_REGION.amazonaws.com/kiro-worker:latest
Step 5: Deploy with AWS SAM
The SAM template defines both Lambda functions, the API Gateway endpoint, and the IAM policies. The Dispatcher uses a standard Python runtime. The Worker references the container image you pushed to Amazon ECR.
Key resource configuration:
Resource
Runtime
Timeout
Memory
Package type
Dispatcher
Python 3.12
10 s
256 MB
Zip
Worker
Container
600 s (10 min)
1024 MB
Image
Both functions use AWSSecretsManagerGetSecretValuePolicy scoped to the kiro-chatops/* secret prefix. The Dispatcher also gets LambdaInvokePolicy for the Worker function. Neither function has broader AWS permissions.
The SAM template accepts the ECR image URI as a parameter:
Parameters:
  EcrImageUri:
    Type: String
    Description: ECR image URI for the Worker Lambda

Resources:
  WorkerFunction:
    Type: AWS::Serverless::Function
    Properties:
      PackageType: Image
      ImageUri: !Ref EcrImageUri
      Timeout: 600
      MemorySize: 1024
Deploy:
cd ..  # Back to the project root where template.yaml lives
sam build
sam deploy --guided \
  --stack-name kiro-chatops \
  --parameter-overrides \
    EcrImageUri=$AWS_ACCOUNT_ID.dkr.ecr.$AWS_REGION.amazonaws.com/kiro-worker:latest
SAM prompts you to confirm IAM role creation and acknowledge that the Dispatcher has no authentication (request verification happens in code via the Slack signing secret). After deployment completes, note the ApiEndpoint output value.
Step 6: Connect Slack to the endpoint
Go to api.slack.com/apps and select your Kiro Agent app
Navigate to Slash Commands and edit /kiro
Replace the Request URL with the ApiEndpoint value from the SAM deployment output
Choose Save
Step 7: Test the integration
Test directly from Slack by typing in any channel where the app is installed:
/kiro analyze auth-service for memory leaks
Expected behavior:
Slack immediately displays: “@yourname requested: analyze auth-service for memory leaks – Kiro is working on it…”
After 15–60 seconds, the analysis results appear in the channel
You can also invoke the Worker Lambda directly for testing without Slack:
Once deployed, the value comes from the commands your team uses daily. These patterns map to real engineering workflows:
Category
Example command
Code analysis
/kiro analyze the payment module for error handling gaps
Code review
/kiro review the last 3 commits on main for breaking changes
Debugging
/kiro debug why the integration tests are failing
Knowledge
/kiro explain how the authentication middleware works
Sprint support
/kiro summarize all changes merged to main this week
The value compounds when results are visible to the entire channel. A junior engineer who might hesitate to open a CLI tool can type /kiro explain and get the same analysis and the rest of the team learns from it.
Extending the pattern
Multi-repository support – The basic implementation targets a single preconfigured repository. To support multiple repositories, parse a URL from the slash command text and clone it at runtime. This adds 5-15 seconds of latency and requires a Git token in Secrets Manager for private repositories.
Threaded responses – Post the acknowledgment as a channel message and the full results as a thread reply. This keeps the channel readable while preserving context for long analyses.
Approval workflows – For commands that modify code (for example, “create a PR that fixes this issue”), add a confirmation step. The Worker posts proposed changes with interactive buttons; the action executes only after explicit approval.
Audit logging – Log every invocation to Amazon DynamoDB: who ran it, what they asked, how long it took. This gives engineering leadership visibility into how the team uses AI-assisted development.
Constraints and trade-offs
Constraints:
Execution time – Lambda has a maximum 15-minute timeout. Complex analyses that exceed this will time out. The Worker is set to a 10-minute timeout with a 9-minute subprocess limit.
Ephemeral storage – The /tmp volume defaults to 512 MB. A shallow clone (–depth 1) strips Git history, but the working tree alone can exceed this for large monorepos or repositories with binary assets. You can increase ephemeral storage up to 10 GB by setting EphemeralStorage in the SAM template, or scope the clone to a subdirectory with –sparse-checkout for oversized repositories.
Slack message size – Each Block Kit text block is limited to 3,000 characters. Long outputs are truncated, with full results available in Amazon CloudWatch Logs.
Package size – Kiro CLI with its dependencies exceeds Lambda’s 250 MB layer limit. A container image (up to 10 GB) is required.
Trade-offs:
Lambda vs. Amazon ECS on AWS Fargate – Lambda is simpler and cheaper at the low-volume, bursty usage typical of a single team. Model your own break-even point with the AWS Pricing Calculator, since it shifts with average analysis duration and memory size. For high-volume teams, Fargate with a persistent container avoids cold starts. Start with Lambda and migrate if usage grows.
Public channel vs. ephemeral – Results are posted as in_channel (visible to everyone). For sensitive analyses, change response_type to ephemeral. Consider making this configurable per command.
Cost – Lambda compute is approximately $0.01-$0.05 per 10-minute execution at 1024 MB. The primary cost factor is Kiro CLI usage based on your subscription tier.
Security considerations
Request verification — The Dispatcher validates every request using HMAC-SHA256 with the Slack signing secret. Requests with timestamps older than 5 minutes are rejected.
Secrets management — Credentials are never hardcoded or stored in environment variables. They are fetched at runtime from Secrets Manager with IAM-scoped access.
Least-privilege IAM — The Dispatcher can only invoke the Worker and read secrets. The Worker can only read secrets. Neither has broader AWS permissions.
Audit trail — CloudWatch Logs capture every invocation including the command text, user, and Kiro CLI output. Enable AWS CloudTrail for API Gateway to track all incoming requests.
Cleaning up
To avoid ongoing charges, remove all resources when you are done testing:
To remove the Slack App, go to api.slack.com/apps, select Kiro Agent, and click Delete App.
Conclusion
This post demonstrated integrating Kiro CLI into Slack workflows using headless authentication, serverless functions, and secure credential management. The Dispatcher acknowledges instantly, the Worker runs Kiro CLI headless, and results appear in the channel where the team already communicates.
The architecture is deliberately simple – a slash command, an async handoff, and a container that runs a CLI tool. You can extend it with multi-repo support, threaded responses, or approval workflows as your team’s usage patterns emerge.
Start with a single slash command in one channel. The commands your team uses most will tell you where the friction was hiding.
Code review feedback is most valuable when it arrives early. A security vulnerability caught in a pull request saves hours. The same vulnerability caught in production costs days. But what if you could catch it before the code even leaves the developer’s machine – at the time of git commit?
Git hooks run automatically at specific points in the Git workflow: before a commit, before a push, after a merge. They execute locally, on the developer’s machine, with no CI/CD pipeline involved. The problem is that Git hooks run non-interactively. There is no browser or a terminal session waiting for input. Traditional Kiro CLI requires browser-based login, which makes it unusable in a hook.
Headless authentication changes this. With KIRO_API_KEY set as an environment variable, Kiro CLI runs in any non-interactive context, including Git hooks. This post shows how to wire Kiro CLI into your local Git workflow, so every commit and every push gets AI-powered analysis before it reaches your repository.
Why headless authentication matters here
Git hooks are scripts that Git executes automatically. They have no UI and are unable to open a browser or prompt for credentials. Running silently in the background, they either succeed with exit 0 or blocking the operation with exit non-zero.
# Added to your shell profile (~/.bashrc, ~/.zshrc)
export KIRO_API_KEY=your_api_key_here
The API key is inherited by child processes including Git hooks. If the key isn’t set, the hook skips the execution and fails gracefully rather than blocking commits.
Note on data privacy: These hooks send your staged code diffs to the Kiro API for analysis. Review your organization’s policies on sending source code to APIs before adopting this workflow. For sensitive repositories, consult your security team.
What this enables
Pre-commit hook: Scans your staged files for security issues, code smells and style violations. Problems get caught before the commit exists.
Commit-msg hook: Enforces your team’s commit message format (Conventional commits, Jira refs etc). Malformed messages get rejected instantly instead of cluttering the log.
Pre-push hook: Runs a full review across all commits you’re about to push. This is your last gate before CI picks it up – cheaper to fix it here than to wait for a pipeline failure.
Post-merge hook: After pulling changes, it analyzes incoming changes and flags anything that might conflict with your local work.
Expected output should confirm you are authenticated. If you see an error, verify your API key is valid and your network allows outbound connections to the Kiro API.
Try it yourself: scratch repo setup
To test the hooks without affecting an existing project, create a throwaway repository:
All hook examples below work in this scratch repo. For the pre-push hook, you will also need a remote – either create a throwaway repository on GitHub/GitLab or add a bare local remote:
# Option A: Use a throwaway GitHub/GitLab repo
git remote add origin [email protected]:youruser/kiro-hooks-demo.git

# Option B: Use a local bare repo (no network needed)
git init --bare /tmp/kiro-hooks-demo-remote.git
git remote add origin /tmp/kiro-hooks-demo-remote.git
Hook 1: Pre-commit – Catch issues before they become commits
The pre-commit hook runs after you type git commit but before Git creates the commit object. If the hook exits with a non-zero code, the commit is aborted.
Create .git/hooks/pre-commit:
#!/bin/bash
set -e
# Skip hook if KIRO_API_KEY is not set
if [ -z "$KIRO_API_KEY" ]; then
  echo "  KIRO_API_KEY not set. Skipping Kiro pre-commit analysis."
  exit 0
fi

# Get list of staged files (only added, modified, or renamed)
STAGED_FILES=$(git diff --cached --name-only --diff-filter=AMR)

if [ -z "$STAGED_FILES" ]; then
  echo "No staged files to analyze."
  exit 0
fi

# Get the actual diff content for context
DIFF_CONTENT=$(git diff --cached)

echo "???? Kiro CLI: Analyzing $(echo "$STAGED_FILES" | wc -l | tr -d ' ') staged file(s)..."

# Run Kiro CLI analysis on staged changes (timeout after 30s to avoid hanging offline)
RESULT=$(timeout 30 kiro-cli chat --no-interactive "You are a pre-commit code reviewer. Analyze ONLY the following staged changes for critical issues that should block this commit.
STAGED FILES:$STAGED_FILES

DIFF:$DIFF_CONTENT

Check for:
1. SECURITY: Hardcoded secrets, API keys, passwords, tokens in the diff
2. SECURITY: SQL injection, XSS, or command injection vulnerabilities
3. BUGS: Obvious logic errors, null pointer risks, off-by-one errors
4. PERFORMANCE: Accidentally committed debug code, console.log statements, sleep calls

Rules:
- Only flag issues that are clearly problems. Do not flag style preferences.
- If you find a SECURITY issue, output a line starting with BLOCK: followed by the reason.
- If you find a BUG or PERFORMANCE issue, output a line starting with WARN: followed by the reason.
- If everything looks clean, output a single line: PASS

Be concise. This runs on every commit - speed matters." 2>&1) || {
  EXIT_CODE=$?
  if [ $EXIT_CODE -eq 124 ]; then
    echo "  Kiro CLI timed out (network issue?). Allowing commit."
    exit 0
  fi
  echo "  Kiro CLI returned an error. Allowing commit."
  exit 0
}

echo "$RESULT"

# Block commit if BLOCK issues found
if echo "$RESULT" | grep -q "BLOCK:"; then
  echo ""
  echo " Commit blocked by Kiro CLI. Fix the issues above and try again."
  echo "   To bypass this hook: git commit --no-verify"
  exit 1
fi

# Warn but allow commit for non-blocking issues
if echo "$RESULT" | grep -q "WARN:"; then
  echo ""
  echo "  Warnings found. Commit will proceed. Consider fixing before push."
fi

echo " Kiro CLI pre-commit check passed."
exit 0
Make it executable:
chmod +x .git/hooks/pre-commit
Test it:
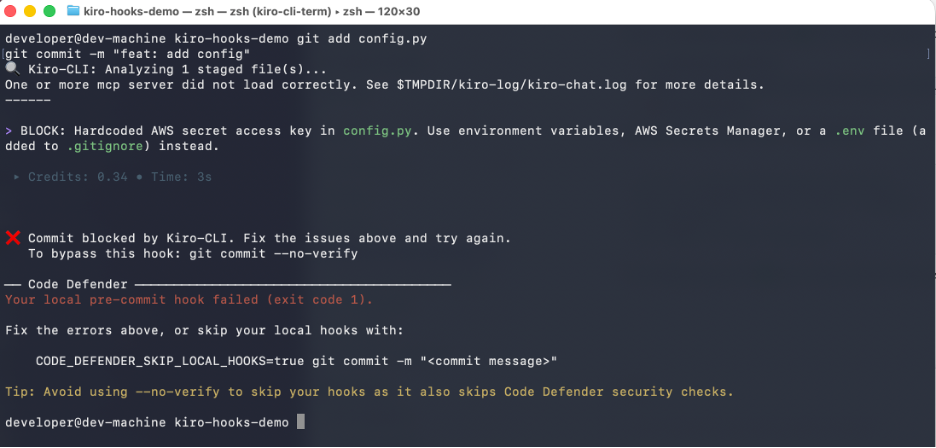
# Test 1: Commit a hardcoded secret (should be blocked)
echo 'AWS_SECRET_KEY = "AKIAIOSFODNN7EXAMPLE"' >> config.py
git add config.py
git commit -m "feat: add config"
# Expected:  Commit blocked by Kiro CLI

# Clean up test file
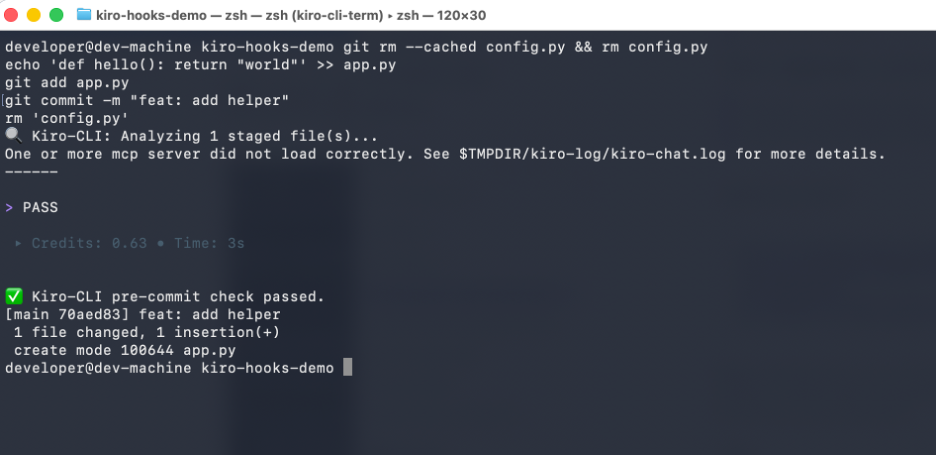
git reset HEAD config.py && rm config.py

# Test 2: Commit clean code (should pass)
echo 'def hello(): return "world"' >> app.py
git add app.py
git commit -m "feat: add hello function"
# Expected:  Kiro CLI pre-commit check passed

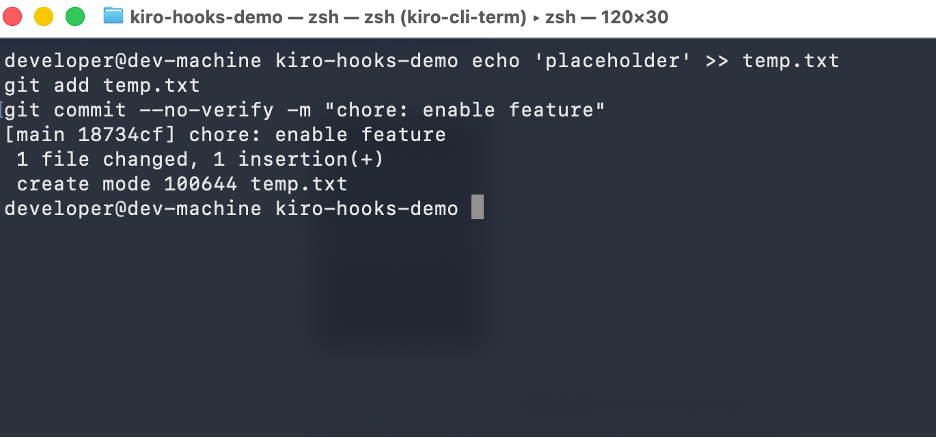
# Test 3: Bypass when needed
echo 'placeholder' >> temp.txt && git add temp.txt
git commit --no-verify -m "chore: emergency fix"
# Expected: Hook skipped entirely

# Clean up
rm -f temp.txt
Test 1 – Stages a file with hard-coded AWS secret key. Kiro CLI detects the credential and blocks the commit with BLOCK:, preventing the secret from entering git history.
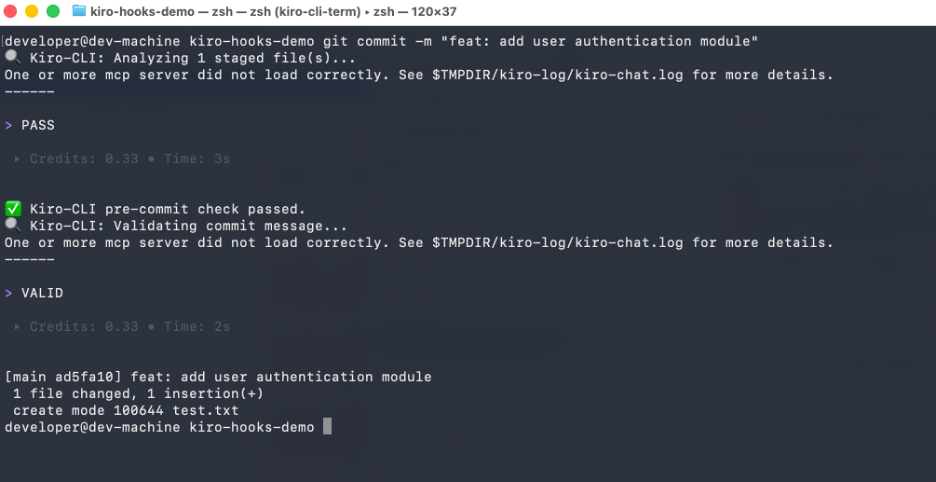
Test 2 – Stages a simple, clean Python function. Kiro CLI finds no issues and outputs PASS, allowing commit to proceed normally.
Test 3 – Uses git’s –no-verify flag to skip all hooks entirely. Demonstrates the escape hatch when developers need to commit without waiting for analysis (e.g, emergency fixes).
Trade-offs:
Speed vs. depth: The prompt is deliberately focused on critical issues only. A comprehensive review would take 15-30 seconds per commit – too slow for developer flow. This hook targets 3-8 seconds
False positives: Blocking commits on false positives destroys developer trust. The prompt is conservative – only BLOCK for clear security issues, WARN for everything else
Bypass escape hatch: git commit –no-verify skips all hooks. This is intentional – developers must never feel trapped. Document when bypassing is acceptable (e.g., emergency hotfixes)
The commit-msg hook runs after the developer writes their commit message. It receives the path to the temporary file containing the message.
Create .git/hooks/commit-msg:
#!/bin/bash

set -e
COMMIT_MSG_FILE="$1"
COMMIT_MSG=$(cat "$COMMIT_MSG_FILE")

# Skip hook if KIRO_API_KEY is not set
if [ -z "$KIRO_API_KEY" ]; then
exit 0
fi

# Skip for merge commits and fixup commits
if echo "$COMMIT_MSG" | grep -qE "^(Merge|fixup!|squash!)"; then
exit 0
fi

echo "???? Kiro CLI: Validating commit message..."

RESULT=$(timeout 15 kiro-cli chat --no-interactive "Validate this commit message against Conventional Commits format.
COMMIT MESSAGE:$COMMIT_MSG

Rules:1. Must start with a type: feat, fix, docs, style, refactor, perf, test, build, ci, chore, revert2. Type may have an optional scope in parentheses: feat(auth), fix(api)3. Must have a colon and space after type/scope: feat: or feat(auth):4. Description must start with lowercase letter5. Description must not end with a period6. Subject line must be under 72 characters7. If a Jira ticket pattern exists (e.g., PROJ-123), that is acceptable in the scope or body
If the message is valid, output exactly: VALIDIf the message is invalid, output: INVALID: followed by what is wrong and a corrected example.
Be concise. One line for valid, two lines max for invalid." 2>&1) || {
echo "  Kiro CLI unavailable. Skipping commit message validation."
exit 0
}

echo "$RESULT"

if echo "$RESULT" | grep -q "INVALID:"; then
echo ""
echo " Commit message does not follow conventions."
echo "   Examples: feat: add login page"
echo "             fix(auth): resolve token expiry bug"
echo "   To bypass: git commit --no-verify"
exit 1
fi

exit 0
Make it executable:
chmod +x .git/hooks/commit-msg
Test it:
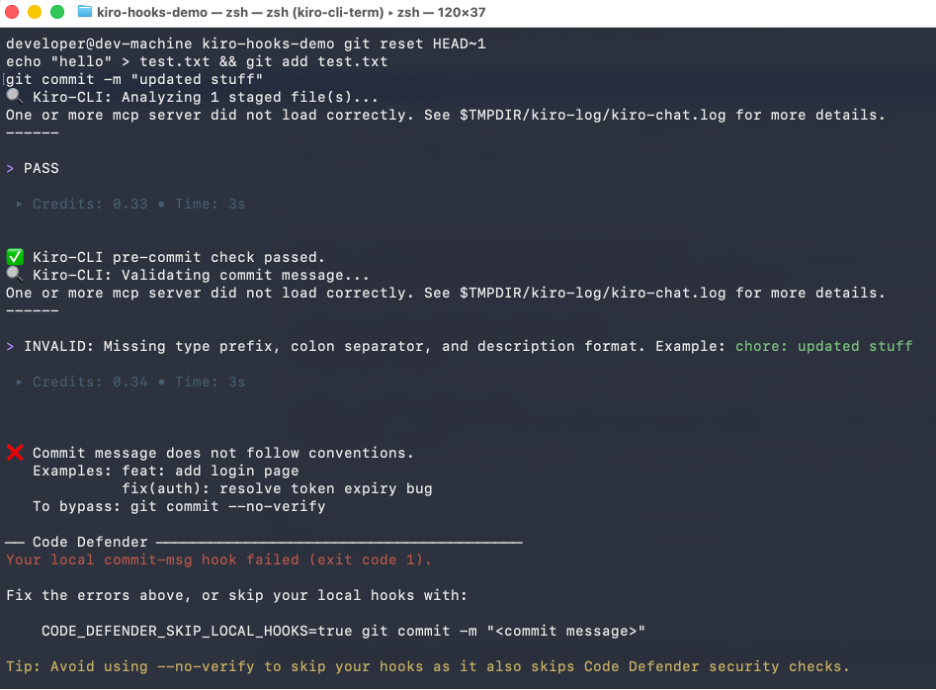
# Test 1: Invalid message (should be blocked)
echo "hello" > test.txt && git add test.txt

git commit -m "updated stuff"
# Expected:  Commit message does not follow conventions

# Test 2: Valid message (should pass)
git commit -m "feat: add user authentication module"
# Expected: passes

# Test 3: Valid with scope
echo "world" >> test.txt && git add test.txt

git commit -m "fix(api): resolve null pointer in user handler"
# Expected: passes
Test 1 – Commits with a non-conventional message (“Updated Stuff”). Kiro CLI detects it lacks required description format and blocks the commit.
Test 2 – Commits with a properly formatted message. Kiro validates it against conventional commit rules and allows the commit.
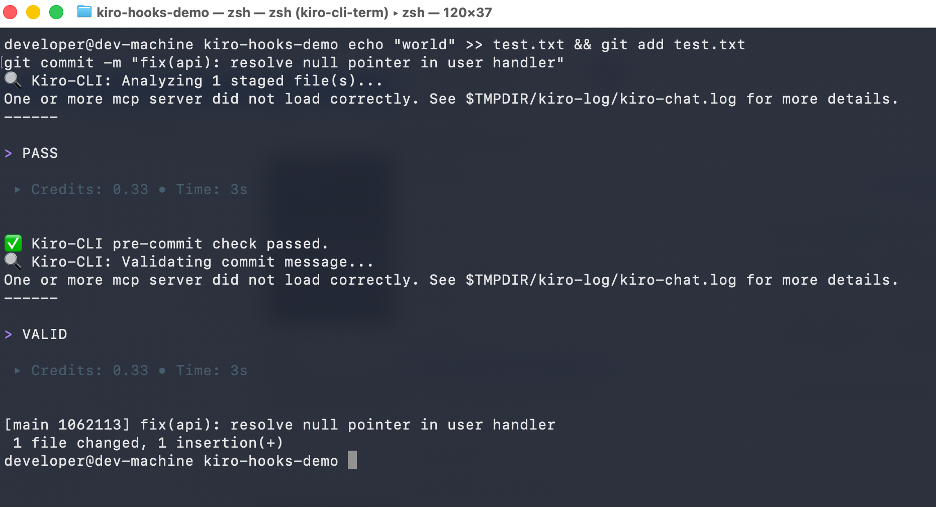
Test 3 – Commits with a scoped conventional message (“fix(api): resolve null pointer in user handler”). Kiro confirms the “type(scope): description” format is valid and allows the commit.
Hook 3: Pre-push – Comprehensive review before code leaves your machine
The pre-push hook runs after git push is called but before data is transferred to the remote. This is the last checkpoint before your code enters the shared repository.
Note: To test this hook, you need a remote configured. See the “Try it yourself” section above for setup options.
Create .git/hooks/pre-push:
#!/bin/bash

set -e
# Skip hook if KIRO_API_KEY is not set
if [ -z "$KIRO_API_KEY" ]; then
echo "  KIRO_API_KEY not set. Skipping Kiro pre-push analysis."
exit 0
fi

# Read push information from stdin
while read LOCAL_REF LOCAL_SHA REMOTE_REF REMOTE_SHA; do
# Skip delete pushes
if [ "$LOCAL_SHA" = "0000000000000000000000000000000000000000" ]; then
continue

fi

# Determine the range of commits being pushed
if [ "$REMOTE_SHA" = "0000000000000000000000000000000000000000" ]; then
# New branch - analyze all commits not yet on any remote
COMMITS=$(git log --oneline "$LOCAL_SHA" --not --remotes 2>/dev/null | head -20)
else
# Existing branch - analyze only new commits
COMMIT_RANGE="$REMOTE_SHA..$LOCAL_SHA"
COMMITS=$(git log --oneline "$COMMIT_RANGE" 2>/dev/null | head -20)
fi

if [ -z "$COMMITS" ]; then
echo "No new commits to analyze."
exit 0
fi

COMMIT_COUNT=$(echo "$COMMITS" | wc -l | tr -d ' ')
echo "???? Kiro CLI: Reviewing $COMMIT_COUNT commit(s) before push..."

# Get the diff and changed files
if [ "$REMOTE_SHA" = "0000000000000000000000000000000000000000" ]; then
DIFF=$(git diff --stat HEAD~"$COMMIT_COUNT" "$LOCAL_SHA" 2>/dev/null || git show --stat "$LOCAL_SHA")
CHANGED_FILES=$(git diff --name-only HEAD~"$COMMIT_COUNT" "$LOCAL_SHA" 2>/dev/null || echo "Unable to determine changed files")
else
DIFF=$(git diff --stat "$REMOTE_SHA" "$LOCAL_SHA" 2>/dev/null)
CHANGED_FILES=$(git diff --name-only "$REMOTE_SHA" "$LOCAL_SHA" 2>/dev/null)
fi

RESULT=$(timeout 60 kiro-cli chat --no-interactive "You are a pre-push code reviewer. These commits are about to be pushed to the remote repository. Perform a comprehensive review.
COMMITS:$COMMITS

CHANGED FILES:$CHANGED_FILES

DIFF STATS:$DIFF

Check for:1. SECURITY: Any secrets, credentials, or API keys in the commits2. SECURITY: Vulnerability patterns (injection, XSS, insecure deserialization)3. QUALITY: Test files included for new functionality4. QUALITY: Large files or binary files that should not be in the repo5. ARCHITECTURE: Breaking changes that should be documented6. DEPENDENCIES: New dependencies added - any known vulnerabilities
If you find a critical SECURITY issue, output: BLOCK: followed by the reason.If you find quality or architecture concerns, output: WARN: followed by the reason.If everything looks good, output: PASS
Provide a brief summary (3-5 lines max). Speed matters." 2>&1) || {
EXIT_CODE=$?
if [ $EXIT_CODE -eq 124 ]; then
echo "  Kiro CLI timed out. Allowing push."
exit 0
fi
echo "  Kiro CLI returned an error. Allowing push."
exit 0
}

echo "$RESULT"

if echo "$RESULT" | grep -q "BLOCK:"; then
echo ""
echo " Push blocked by Kiro CLI. Fix the issues above and try again."
echo "   To bypass: git push --no-verify"
exit 1
fi

if echo "$RESULT" | grep -q "WARN:"; then
echo ""
echo "  Warnings found. Push will proceed. Consider addressing before PR."
fi

done

echo " Kiro CLI pre-push check passed."
exit 0
Make it executable:
chmod +x .git/hooks/pre-push
Test it:
# Test 1: Push commits with a secret (should be blocked)
echo 'DB_PASSWORD="supersecret123"' >> config.env

git add config.envgit commit --no-verify -m "chore: add config"
git push origin main

# Expected:  Push blocked by Kiro CLI

# Test 2: Push clean commits (should pass)
git reset --hard HEAD~1echo 'DB_PASSWORD=${DB_PASSWORD}' >> config.env

git add config.env

git commit -m "chore: add config template with env var reference"
git push origin main

# Expected:  Kiro-CLI pre-push check passed
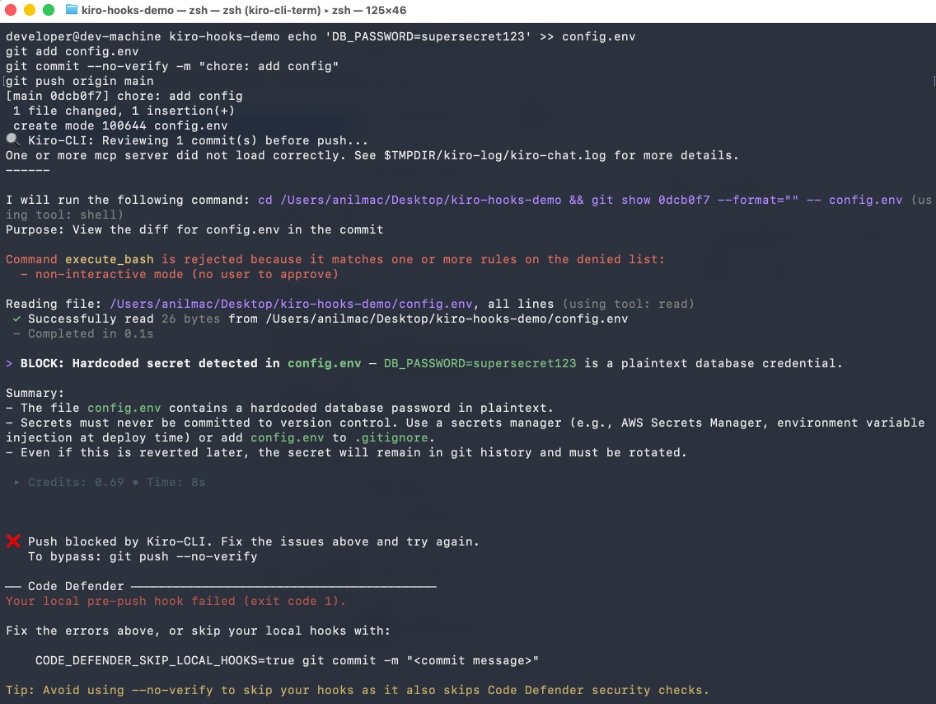
Test 1 – Commits a file containing hard coded database password and attempts to push. Kiro CLI performs a review of the outgoing commit, detects a plaintext credential in config.env file and blocks the push before the secret reaches remote repository.
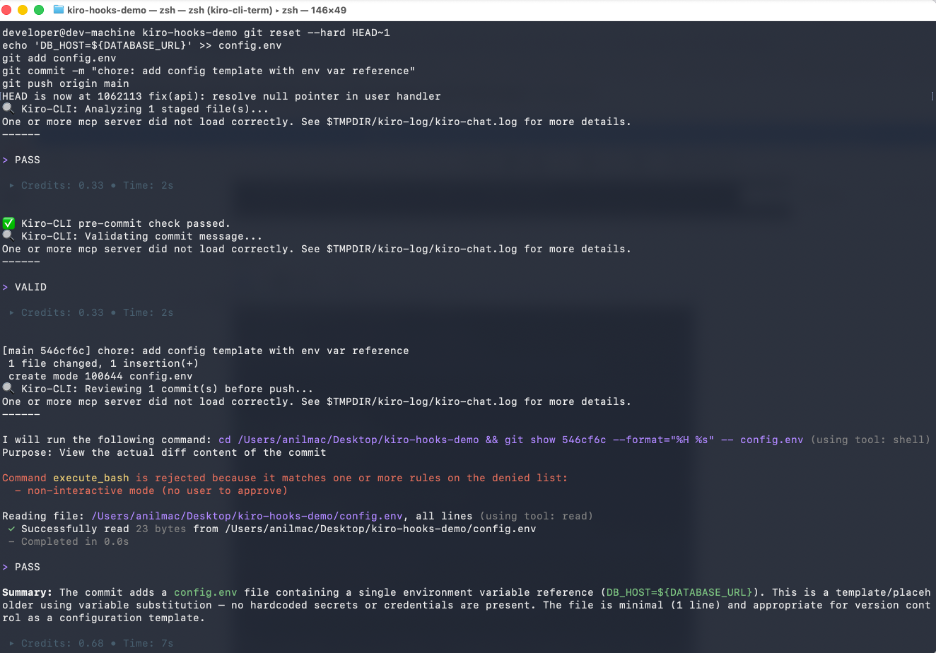
Test 2 – Commits a config template using and environment variable reference “${DATABASE_URL}” instead of real secret. Kiro CLI reviews the commit, confirms no hardcoded credentials are present and allows the commit to proceed.
Trade-off:
The pre-push hook is more thorough than pre-commit because it reviews all commits being pushed at once. This means it takes longer (10-20 seconds) but runs less frequently. Developers push less often than they commit, so this is an acceptable trade-off.
Automating hook installation across your team
Git hooks live in .git/hooks/, which is not tracked by Git. To share hooks across your team, use one of these approaches:
Approach A – Shared hooks directory (recommended)
Store hooks in a tracked directory and configure Git to use it:
# Create a hooks directory in your repo
mkdir -p .githooks
# Copy your hooks there
cp .git/hooks/pre-commit .githooks/pre-commitcp .git/hooks/commit-msg .githooks/commit-msgcp .git/hooks/pre-push .githooks/pre-push
# Commit the hooks
git add .githooks/git commit -m "chore: add Kiro-CLI git hooks for local code analysis"
Each developer runs once after cloning:
git config core.hooksPath .githooks
To automate this, add it to your project’s setup script or Makefile:
# Makefilesetup: @echo "Configuring git hooks..." git config core.hooksPath .githooks @echo "Verifying Kiro CLI..." @kiro-cli whoami || echo "⚠ Set KIRO_API_KEY in your shell profile" @echo "✅ Setup complete"
Approach B – Install script
Create a scripts/install-hooks.sh that developers run once:
#!/bin/bashset -e
echo "Installing Kiro CLI git hooks..."

# Check prerequisites
if ! command -v kiro-cli &> /dev/null; then
echo "Installing Kiro-CLI..."
curl -fsSL https://kiro.dev/install.sh | bash  export PATH="$HOME/.kiro/bin:$PATH"
fi

if [ -z "$KIRO_API_KEY" ]; then
echo ""
echo "  KIRO_API_KEY is not set."
echo "   1. Generate a key at https://app.kiro.dev (Account → Settings → API Keys)"
echo "   2. Add to your shell profile:"
echo "      echo 'export KIRO_API_KEY=your_key_here' >> ~/.zshrc"
echo "   3. Restart your terminal or run: source ~/.zshrc"
echo ""
echo "Hooks installed but will be skipped until KIRO_API_KEY is set."
fi

# Configure hooks path
git config core.hooksPath .githooksecho " Git hooks configured. Kiro CLI will analyze commits and pushes."
Approach C – Pre-commit framework integration
If your team already uses the pre-commit framework, create a .pre-commit-config.yaml:
repos:
- repo: local
hooks:
- id: kiro-security-check
name: Kiro-CLI Security Check
entry: bash -c '
if [ -z "$KIRO_API_KEY" ]; then exit 0; fi
STAGED=$(git diff --cached --name-only --diff-filter=AMR)
if [ -z "$STAGED" ]; then exit 0; fi
DIFF=$(git diff --cached)
RESULT=$(timeout 30 kiro-cli chat --no-interactive "Analyze these staged changes for hardcoded secrets, credentials, and security vulnerabilities ONLY. Files: $STAGED. Diff: $DIFF. Output BLOCK: if critical security issue found, otherwise PASS." 2>&1) || exit 0
echo "$RESULT"
if echo "$RESULT" | grep -q "BLOCK:"; then exit 1; fi
'        language: system        stages: [commit]        pass_filenames: false
- id: kiro-commit-msg        name: Kiro-CLI Commit Message Check        entry: bash -c '
if [ -z "$KIRO_API_KEY" ]; then exit 0; fi
MSG=$(cat "$1")
if echo "$MSG" | grep -qE "^(Merge|fixup!|squash!)"; then exit 0; fi
RESULT=$(timeout 15 kiro-cli chat --no-interactive "Is this commit message valid Conventional Commits format? Message: $MSG. Output VALID or INVALID: reason." 2>&1) || exit 0
echo "$RESULT"
if echo "$RESULT" | grep -q "INVALID:"; then exit 1; fi
'
language: system
stages: [commit-msg]
pass_filenames: true
Constraints, trade-offs, and assumptions
Constraints:
Git hooks run locally – they depend on the developer having Kiro CLI installed and KIRO_API_KEY set
Hooks add latency to git commit and git push operations (3-8 seconds for pre-commit, 10-20 seconds for pre-push)
--no-verify bypasses all hooks – this is a native Git feature
Trade-offs:
Speed vs. thoroughness: Pre-commit checks only critical issues (secrets, obvious bugs) to stay under 8 seconds. Pre-push does a broader review because it runs less frequently.
Blocking vs. warning: Only security issues should block commits – everything else warns – because overly aggressive blocking erodes developer trust and leads to permanent bypasses.
Local vs. CI/CD: Git hooks complement CI/CD, they do not replace it. CI/CD runs in a controlled environment with full test suites. Hooks provide fast, early feedback on the developer’s machine.
Team adoption: Hooks are opt-in per developer (they must set KIRO_API_KEY). This is intentional – forcing hooks on developers who don’t want them creates resentment.
Network dependency: Hooks require internet connectivity. The timeout wrapper ensures they fail gracefully when offline rather than blocking commits indefinitely
KIRO_API_KEY is exported in the developer’s shell profile
The repository uses a branching strategy where developers commit to feature branches and push to remote
Measuring impact
Track these metrics before and after adopting Kiro CLI git hooks:
PR review cycle time: Measure time from PR open to first approval. If hooks are doing their job, reviewers spend less time on nits and more on logic, shortening the feedback loop.
CI/CD failure rate: Track pipeline failures caused by code quality issues that hooks would have caught (lint errors, formatting, missing tests).
Developer satisfaction: Survey developers after 2 weeks. Key question: “Do the hooks save you time or slow you down?”
Bypass rate: Monitor how often –no-verify is used. A high bypass rate signals the hooks are too aggressive or too slow
Cleanup
To remove the hooks and test artifacts:
# Reset hooks path to default
git config --unset core.hooksPath

# Or remove individual hooks
rm .git/hooks/pre-commitrm .git/hooks/commit-msgrm .git/hooks/pre-push

# If using the scratch repo from "Try it yourself"
cd .. && rm -rf kiro-hooks-demorm -rf /tmp/kiro-hooks-demo-remote.git
Conclusion
Headless authentication makes Kiro CLI available in contexts where no browser exists and Git hooks are one of the most valuable of those contexts.
A hardcoded secret caught at git commit takes 10 seconds to fix versus minutes in CI/CD or days in a security audit – start with the pre-commit hook as the highest-value, lowest-friction entry point, and share hooks across your team to standardize developer workflows.
There’s a particular energy to mid-September in New York. Pumpkin spice lattes are flowing, temperatures are dropping, and it’s nearly sweater weather. The city is back at full speed, and so is the AWS launch calendar. This week that energy showed up in a new frontier model on Amazon Bedrock, a desktop app for Amazon Quick, and a reminder that the developers seeing the biggest gains from AI agents aren’t just using better tools — they’re working differently.
Let’s dive in.
Headlines OpenAI GPT-6 Astra is now generally available on Amazon Bedrock – GPT-6 Astra is OpenAI’s latest and most capable model to date, and you can now run it on Amazon Bedrock. It brings deeper reasoning and judgment, professional-quality writing and design, and advanced computer and browser use to demanding business workflows. The model supports a context window of up to 1 million input tokens, so you can send it large codebases, long contracts, or extensive document collections and ask it to reconcile competing inputs.
You can call GPT-6 Astra through supported Amazon Bedrock APIs, or configure ChatGPT Work and Codex to use the model on Amazon Bedrock. Alongside the launch, OpenAI is introducing new enterprise plugins for ChatGPT Work that extend Astra’s browser-use capabilities across common business applications. Established AWS controls help you secure workloads, govern access, and audit model invocation activity, and your inference data isn’t used for model training. Read more
Last week’s launches Here are some launches and updates from this past week that caught my attention:
Amazon Quick desktop app is now generally available on macOS and Windows – The Amazon Quick desktop app brings Amazon Quick to your computer, where it can work with local files and stay connected to your calendar, email, and business apps in the background. Conversations, context, and agents stay synchronized across desktop and mobile, so work you start on one surface carries over to the other. With this release, Quick agents also keep running after you close your computer, which means you can start a long-running task before you leave the office, add input from the mobile app on the way home, and review the result when you get there. Existing Quick users can download the desktop app, and the mobile app is available from the Apple App Store and Google Play. Read more
AWS Lambda now supports a 90-minute function timeout on Lambda Managed Instances – You can now configure a function timeout of up to 90 minutes for asynchronous and event source mapping (ESM) invocations on Lambda Managed Instances, a 6x increase from the previous 15-minute limit. That opens the door to data processing, media transcoding, financial calculations, AI inference, and batch jobs that need longer continuous execution, without splitting the work across multiple functions. Synchronous invocations keep the existing 15-minute maximum. The longer timeout also applies to steps inside Lambda durable functions, which can still run for up to a year when invoked asynchronously. Read more
Amazon EBS Volume Clones now copies volumes across accounts – Amazon Elastic Block Store (Amazon EBS) Volume Clones can now copy a volume into another AWS account and re-encrypt it with an AWS Key Management Service (AWS KMS) key in the target account. If you keep production and development in separate accounts, you can share a volume with AWS Resource Access Manager (AWS RAM) and let the target account create a fresh copy in the same Availability Zone, for example, cloning a production database volume into an isolated development account. Cross-account copy works for all volume types, including unencrypted volumes and volumes encrypted with customer managed keys. Read more
Second-generation single-rack AWS Outposts is now generally available – The new single-rack AWS Outposts is a self-contained 42U rack that puts compute, storage, and networking into one compact unit for locations that need low latency, local data processing, or data residency, and don’t have room for a larger footprint. A single rack delivers up to 2,688 vCPU and 100 TB of Amazon EBS storage, and supports the latest x86-powered Amazon EC2 instances, including general purpose (M7i, M8i), compute-optimized (C7i, C8i), memory-optimized (R7i, R8i), and Outposts accelerated networking instances. You get the same APIs, console, automation, governance, and security controls as multi-rack Outposts and AWS Regions. Read more
Amazon OpenSearch Serverless is now available on v0 by Vercel – You can now describe a search or AI application in natural language inside v0 by Vercel and get a full-stack app backed by Amazon OpenSearch Serverless. v0 provisions a collection, indexes your data, and uses the OpenSearch Serverless endpoint for full-text search and vector search for retrieval-augmented generation (RAG) workloads, without leaving the v0 interface. OpenSearch Serverless scales capacity up and down for you, so you can focus on the application instead of cluster management. You can provision under a new AWS account or link an existing one. Read more
AWS Transform for .NET modernization is now generally available via CLI – You can trigger an AWS-managed .NET modernization in AWS Transform custom with a single CLI command, then run it interactively or script it into an existing pipeline. The CLI sits alongside the existing AWS Transform for .NET experiences in the web application, Visual Studio IDE, Kiro Power, and MCP agents. Use it to upgrade language versions, migrate frameworks, optimize performance, and analyze codebases with transformations you can run as-is or customize. The .NET modernization transformation includes 50,000 free agent minutes per month. Read more
For a full list of AWS announcements, be sure to keep an eye on the What’s New with AWS page.
Other AWS news Here are some additional posts and resources that you might find interesting:
Clare Liguori on frontier engineering – If you already use an AI coding assistant but don’t feel like you’re shipping much faster, start here. Clare Liguori, Senior Principal Engineer at AWS, published a practitioner’s manifesto on frontier engineering: ten principles, drawn from teams across Amazon, for changing how you build software with AI agents. The argument is direct. Software development has split in two, people who changed how they work with agents, and people who only changed their coding tools. Frontier engineering is not vibe coding. You spend the first weeks writing steering files, refactoring the codebase, and learning to decompose work for agents. Those weeks feel slower. The weeks after feel dramatically faster, because you’re no longer building the software directly — you’re building the agent setup that builds the software.
A free year of Kiro for students around the world – The Kiro Students program is expanding from 11 universities to 121 new schools across 16 countries. Eligible students get one year of Kiro with 1,000 credits per month and full access to paid features such as premium models and Kiro Web, no credit card and no trial timer. You can work in the IDE, the CLI, Kiro Web in a browser, or Kiro Crew. If you’re a student, sign up with your university email.
The state of AI for security: measuring what matters for trust – Security teams are using AI for triage, threat modeling, incident response, and code review, but a tool that flags everything doesn’t save time. In The state of AI for security, Anshumali Shrivastava and Neha Rungta introduce Deception Benchmark, a new evaluation that tests whether a model can tell a real vulnerability from code that looks risky but is actually safe. The benchmark includes 14,822 samples across 16 languages and more than 70 Common Weakness Enumeration (CWE) categories. Under standard prompting, precision landed in the mid-50s, about as likely to be inaccurate as accurate, and none of the 12 models tested kept both false positives and false negatives below 10 percent. The post links to the dataset, whitepaper, and submission workflow for verified scoring.
Build full-stack AWS applications in minutes with AI-powered scaffolding – Version 1.0 of the Nx Plugin for AWS is an open source toolkit of deterministic generators for APIs, websites, databases, and AI agents, plus the AWS infrastructure to run them. Each generator writes working, deployable code with security, observability, and type-safety already in place, so an AI assistant can assemble the foundation and spend its effort on your application logic. Bingo Industries used it to take a multi-agent operations chatbot from idea to production in less than 3 weeks. The plugin is open source on GitHub. Create a workspace with pnpm create @aws/nx-workspace and point your coding agent at the included MCP server.
The oldest architecture in computing – On All Things Distributed, Werner Vogels starts from a question customers always ask “Will AI take my job?”, and lands on memory. After spending time with Kiro Crew, he traces a line from Jeff Hawkins’ A Thousand Brains to how Crew stores, consolidates, and forgets across markdown files, a vector database, and a key-value index. His conclusion: the brain is the oldest architecture in computing, and the people who think hardest about how it works will build the next tools. Now, go build.
For a full list of AWS blog posts, be sure to keep an eye on the AWS Blogs page.
Upcoming AWS events Check your calendar and sign up for upcoming AWS events:
AWS Summits – AWS Summits are free in-person events that bring the cloud and AI community together to connect, learn, and explore the latest technologies. Upcoming stops include Dubai (September 30). Browse the full calendar to find a Summit near you, or stream sessions through the Global Livestream and On-Demand Hub.
Join the AWS Builder Center to connect with builders, share solutions, and access content that supports your development. Browse here for upcoming AWS-led in-person and virtual events and developer-focused events.
That’s all for this week. Check back next Monday for another Weekly Roundup!
— Micah
This post is part of our Weekly Roundup series. Check back each week for a quick roundup of interesting news and announcements from AWS!
Continuous improvement depends on experimentation. Teams know that the fastest path to better outcomes is to test changes against real user behavior, measure results, and iterate. In practice, sustaining that cycle is slow and costly because the overhead compounds with each attempt.
Three barriers slow teams down:
1. Planning cost — Turning a proposed change into a testable experiment requires defining a feature flag strategy, coordinating implementation, and wiring everything together before any user sees new behavior.
2. Measurement disconnected from action — Once live, teams must configure metrics, define success criteria, monitor, and interpret results. When metrics regress, remediation traditionally depends on a human merging a fix or rolling back a deployment.
3. Stalled iteration — Without a record of which change caused which outcome, the next hypothesis is a guess, so iteration often does not happen and the goal stalls.
This post introduces a reference solution that closes the gap between defining a goal and reaching it. A team states an improvement goal (for example, increase add-to-cart rate by 10%), and agents plan the experiment, implement the change, deploy it behind a feature flag, measure its impact, and iterate on the result, all within defined safety boundaries. The solution connects Kiro for code generation, AWS DevOps Agent for orchestration and release readiness review, and LaunchDarkly for feature flag governance, experiments, and Guarded Releases for safe, metric-driven rollouts with automatic rollback. The architecture described here is a reference implementation you can build today. A more turnkey experience is planned for the future.
Pre-requisites
Step 1. Enable AWS DevOps Agent and Create an Agent Space. AWS DevOps Agent is available in the AWS regions listed here. Follow these steps to create your AWS DevOps Agent and create an Agent Space.
Step 3. Enable the LaunchDarkly MCP Server in the Agent Space. AWS DevOps Agent connects to LaunchDarkly’s hosted MCP server as a client, giving it the ability to query flag state, read targeting rules, and list flags by project or environment.
Step 4 — Register the LaunchDarkly MCP server (account-level). MCP servers are registered at the AWS account level and shared among all Agent Spaces in that account.
Sign in to the AWS DevOps Agent console.
Navigate to the Capability Providers page (side navigation).
Find MCP Server under the Available providers section and choose Register.
Description: LaunchDarkly feature flag management MCP server
Enable Dynamic Client Registration: Select this checkbox to allow DevOps Agent to automatically register with LaunchDarkly’s authorization server
Step 4a — Configure the authorization flow
LaunchDarkly’s hosted MCP server uses OAuth for authentication:
Select OAuth 3LO (Three-Legged OAuth).
Choose Next.
Complete the OAuth authorization — you will be redirected to LaunchDarkly’s consent page to authorize the connection.
Choose Next.
Tip: Refer to the LaunchDarkly MCP server documentation for specific OAuth scope and credential details.
Step 4b — Review and submit
Review the MCP server configuration details.
Choose Submit.
AWS DevOps Agent validates the connection to LaunchDarkly’s MCP server.
On successful validation, the MCP server is registered at the account level.
Step 5 — Add the MCP server to your Agent Space
After the account-level registration, connect it to your specific Agent Space:
In the AWS DevOps Agent console, select your Agent Space (created in Section 1).
Go to the Capabilities tab.
In the MCP Servers section, choose Add.
Select the LaunchDarkly MCP server you just registered.
Configure tool access:
Allow all tools — makes all LaunchDarkly MCP tools available to the agent
Select specific tools — allowlist only the tools you need (recommended for production)
Choose Add.
Step 5 — Validate the connection. Run a test query to confirm the integration is working. In the DevOps Agent console, start a new investigation or chat session and ask: “List the feature flags in the <your-project-key> project in the production environment.” If the agent returns flag data from LaunchDarkly, the connection is active.
Solution overview
The automated experimentation lifecycle operates as a closed loop. A team states an improvement goal, and the system moves through a continuous cycle: decide what to try next, implement the change behind a feature flag, validate and deploy it, run an experiment to measure impact, roll it out safely, and feed the outcome back into the next iteration. The loop continues until the goal is met or the team decides to stop.
End-to-end Plan-Prove-Iterate workflow showing how AWS DevOps Agent orchestrates hypothesis generation, feature-flagged implementation, experimentation, guarded rollout, and outcome recording in a continuous improvement loop.
Each component has a distinct responsibility. AWS DevOps Agent orchestrates the cycle: it runs on a schedule as a Custom Agent which is a user-defined agent with its own instructions, skills, and connected tools that executes autonomously without pausing for input unless something fails. AWS DevOps Agent supports Custom Agents as a way to encode a specific workflow, including its decision logic, safety constraints, and cadence, into an agent that runs end-to-end on its own. In this solution, the Custom Agent reviews goals, generates hypotheses informed by prior outcomes, coordinates implementation and validation, and drives iteration across multiple experiment cycles.”. Kiro CLI runs in headless mode inside the Experiment MCP Server container on Amazon Bedrock AgentCore, implementing code changes behind LaunchDarkly feature flags and opening pull requests without a human operating an IDE.
LaunchDarkly hosts feature flags, experiments, and Guarded Releases, monitors metrics in real time, and reverts flag state when a threshold is breached. It also exposes a hosted MCP server with tools the agent calls directly. The Experiment MCP Server (custom, built for this solution) exposes the remaining operations over MCP: code implementation through Kiro, PR merge, and deployment triggering.
The agent acts as an MCP client connected to these two servers. LaunchDarkly’s hosted MCP server provides flag management, experiment lifecycle, Guarded Release, and observability tools. The Experiment MCP Server provides code implementation, PR merging, and deployment tools. This design separates decision-making from execution: the agent decides what to do, the MCP servers handle how.
Plan / Prove / Iterate
The lifecycle operates in three phases.
Plan — The agent decides the next action for a goal, generates a hypothesis informed by prior outcomes when iterating, and creates a feature flag in LaunchDarkly. It then invokes Kiro CLI to implement the change behind the flag and open a pull request. AWS DevOps Agent validates the change through release readiness review. After a green review, the PR is merged and a GitHub Actions workflow deploys the application through AWS Amplify.
Prove — Two sequential phases run after deployment. First, a 50/50 experiment splits 10% of traffic on a business KPI (for example, add-to-cart rate) until statistical significance selects a winning variation. Then a Guarded Release ramps the winning variation from 20% to 30% to 40% and eventually to 100% while LaunchDarkly monitors operational guardrails (error rate, page-load-time-p95). If a guardrail threshold is breached, LaunchDarkly reverts the flag state automatically, requiring no redeployment. The experiment measures value (does the change improve the goal metric?); the Guarded Release measures safety (does the change hold up at scale?).
Iterate — After a rollout concludes, the agent queries LaunchDarkly’s Change History API to associate specific flag modifications with outcomes. The recorded outcome informs the next hypothesis, and the cycle repeats until the goal is met or the agent recommends waiting.
Extending the agent with a custom MCP server
AWS DevOps Agent reads code, reviews changes, and decides what to do next. It does not take action on its own. To move from decision to execution, you connect it to MCP servers that expose operations as tools.
LaunchDarkly’s hosted MCP server covers flags, experiments, and Guarded Releases. We needed operations it doesn’t cover — writing code, merging PRs, and deploying — so we built the Experiment MCP Server. It runs on Amazon Bedrock AgentCore and exposes five tools: create_task and get_task_status (invoke Kiro CLI to implement changes and open a PR), merge_pr, trigger_deployment, and get_deployment_status.
These are mutation operations. When the agent calls create_task, Kiro writes real code. When it calls merge_pr, that code lands in main. You are responsible for this server — what it exposes, which repos it can touch, which branches it can merge to. We scoped ours to one repository, one branch, and one Amplify application. Those constraints live in the MCP server’s code, not the agent’s prompt, because API-level scoping cannot be misinterpreted.
The Experiment MCP Server [CG1] is a Python application built on FastMCP, packaged as a container and deployed to Amazon Bedrock AgentCore over stateless HTTP so the platform can restart or replace the container without breaking in-flight requests. At startup, the container pulls credentials from AWS Secrets Manager, clones the target repository, and makes Kiro CLI available as a local binary. This single-container design keeps everything colocated: when the agent calls create_task, the server spawns Kiro CLI as a headless subprocess with direct filesystem access to the cloned repo rather than making a network call to a separate code-generation service. Kiro CLI receives a structured prompt containing the task description, the LaunchDarkly flag key, and the variation details, then writes the change, commits to a new branch, and pushes. The server opens a pull request through the GitHub API and returns the task ID immediately without waiting for Kiro to finish. The caller polls get_task_status, which long-polls against an S3-backed state store so task progress survives container restarts. Deployment tracking follows a similar pattern: trigger_deployment dispatches a GitHub Actions workflow and returns the real GitHub run ID, and get_deployment_status reads live status directly from GitHub, so there is nothing to lose if the container cycles between calls. The overall design principle is that the MCP server coordinates work and delegates persistence to external systems (S3 for task state, GitHub for deployment state, Secrets Manager for credentials) rather than holding anything in memory that a restart would erase.
How the agent works
The agent runs on a schedule. Each run, it evaluates the current state of each goal and picks one of three actions: create a new experiment (no active rollout exists), iterate on a prior result (a rollout completed and the goal is not yet met), or wait (an experiment or rollout is still in progress).
The entry point for the system is an outcome, not a task list. The team picks a business metric from the available set — add-to-cart rate, checkout conversion, bounce rate, or page-load-time-p95 — and sets a target improvement, for example “increase add-to-cart rate by 10%.” Error rate is reserved as a safety guardrail during the Guarded Release phase and cannot be chosen as the primary success metric, because the system needs an independent operational signal to decide whether a winning variation is safe to scale. Beyond the metric and the target, all other inputs are optional. The agent infers the current baseline, the areas of the application in scope for changes, and any constraints from the codebase and production data. If those assumptions are off, the team corrects them before any code is written. The team states where they want to end up, and the agent works backward from there.
Demo Store product listing page used as the test surface for the add-to-cart experimentation cycles. Product cards currently show the control layout (no inline Add to Cart button).
For new goals, the agent explores the target repository and proposes a code change likely to move the metric. For iterations, it reads prior outcomes and adjusts its approach based on what worked and what did not. Before any code change, the agent creates a feature flag in LaunchDarkly (boolean, OFF by default, named with a convention like exp-add-to-cart-*) so every change ships behind a flag from the start.
Implementation runs through Kiro CLI in headless mode. The agent calls create_task, Kiro clones the repository, writes the change behind the feature flag, and opens a pull request.
Merged GitHub PR implementing the feature-flagged inline Add to Cart button on the product listing page, controlled by the atc-on-listing LaunchDarkly flag.
AWS DevOps Agent then runs a release readiness review on the PR. If the review fails, the agent retries up to three times before stopping to ask for help. After a green review, the PR is merged and a GitHub Actions workflow deploys through AWS Amplify.
AWS DevOps Agent Release Readiness Review for the Add to Cart Urgency Boost experiment. The automated review found zero critical issues and recommended standard deployment with a guarded rollout.
Proving the change
Once deployed, the flag is toggled on and the experiment begins. The agent creates a 50/50 experiment across 10% of traffic, splitting on the goal’s business KPI. In production, experiment data comes from real users interacting with your application, with metrics emitted through OpenTelemetry to LaunchDarkly. For this reference implementation, we built a synthetic traffic generator that simulates user sessions across both treatment and control variations, producing the conversion events and operational metrics that drive experiment decisions. It runs alongside the demo application and generates enough volume to reach statistical significance within minutes rather than days. The synthetic traffic generator is a demo convenience, not a production requirement. Any application that emits the right events to LaunchDarkly will work with this architecture.
The agent checks for results on each Custom Agent execution until statistical significance is reached. In an interactive chat session, you prompt the agent to check when you are ready. If the treatment wins, the agent proceeds to the Guarded Release. If it loses, the agent archives the flag and records the outcome for the next iteration.
LaunchDarkly experiment summary for the inline Add to Cart listing CTA test. Treatment won decisively with 98.7% relative lift in add-to-cart conversion and 100% probability to beat control.
The Guarded Release ramps the winning variation from 20% to 30% to 40% while LaunchDarkly [1] applies sequential testing to the operational guardrail metric, halting the rollout as soon as the data shows a statistically significant regression against the original variation.. If a guardrail threshold is breached at any stage, LaunchDarkly reverts flag state at runtime without a redeployment. Guarded Releases and automatic rollback serve as the runtime safety net: if something goes wrong after deployment, the system reverts flag state without waiting for a human to intervene.
To validate the safety net in the reference implementation, we triggered a simulated error-rate spike during the ramp. LaunchDarkly detected the regression within the monitoring window, halted the rollout, and reverted the flag to its pre-rollout state automatically. No human intervened, no redeployment ran, and the application returned to the control behavior within seconds. The screenshot below shows the Guarded Release dashboard after the rollback.
LaunchDarkly Guarded Release auto-rollback event. The system detected an error rate regression during the ramp phase and automatically rolled traffic back to the control variation.
After recording the rollback and feeding the outcome into the next iteration, the agent adjusted its approach and proposed a revised implementation that avoided the latency regression. The second attempt followed the same pipeline: hypothesis, feature flag, implementation, review, deployment, experiment, and Guarded Release. This time, monitoring completed with no regressions detected. LaunchDarkly rolled the winning variation forward to full traffic, with add-to-cart conversion lifting from 20.1% to 37.9% across the treatment population, confirming the experiment result held at scale.
LaunchDarkly Guarded Release monitoring completion. The Add to Cart metric showed a 17.7 percentage point lift with no regressions, so the system graduated the treatment to 100% of traffic.
After each cycle, the agent generates a report documenting the hypothesis, experiment results, rollout outcome, and a recommendation for the next iteration. This report feeds into the next decision, so no context is lost between cycles.
Experimentation cycle summary showing three hypothesis-test iterations. Only Cycle C (inline Add to Cart on listing page) reached statistical significance and was promoted to production. The two cosmetic experiments (button color and placement) were inconclusive.
Safety boundaries
The system operates within defined constraints. The agent validates every change through release readiness review before merge. It creates a feature flag before writing any code, so every change can be toggled off without a redeployment. Guarded Releases enforce operational guardrails at runtime with automatic rollback. The agent retries failed validations up to three times, then stops and asks for help rather than proceeding. All credentials are stored in AWS Secrets Manager and referenced by name only, never exposed in agent logs or tool calls.
Getting started
To implement this workflow, you need AWS DevOps Agent enabled in your AWS account, a LaunchDarkly account (start with a free 30-day AWS trial), and a target application and repository. The reference uses a Next.js app deployed through AWS Amplify. Experiments are available on every LaunchDarkly plan, including the free Developer plan. Guarded Releases, which automate progressive rollouts with automatic rollback, require a LaunchDarkly Enterprise plan with the Guardian add-on. Without Guarded Releases, the workflow still runs experiments and reports results. You manage the rollout manually instead. If your plan does not include Guarded Releases, update the agent skill definition below to remove the Guarded Release actions.
Setup requires three steps. First, add the LaunchDarkly remote MCP server to your AWS DevOps Agent space. Second, deploy the Experiment MCP Server container to an AgentCore runtime, storing API keys and tokens in AWS Secrets Manager. Third, create your custom agent with the orchestration skill. Use the experimentation skill in AWS DevOps Agent to guide you through defining goals, connecting the MCP servers, and writing the orchestration instructions. The full orchestration skill is included below.
---
name: "experiment-orchestration"
description: "Orchestrates automated experimentation lifecycle using LaunchDarkly Guarded Rollouts, an AI coding agent for implementation, and GitHub Actions for deployment."
---

# Automated Experimentation

Use this skill when you have a goal you want to move through experimentation (e.g., "increase checkout conversion by 15%", "decrease page load time by 20%").

**Core principle: experiment first, then guarded rollout.** Always prove a change on a small, fixed slice of traffic via an A/B experiment before ramping it up through a guarded rollout. Never start a guarded rollout blind — it exists only to scale a change the experiment has already shown to work.

**Execution mode:** once the goal is confirmed (Step 1), run Steps 2–8 end-to-end. Async operations (code implementation, release review, deployment, experiment monitoring, rollout monitoring) should be checked periodically, not tight-polled — see the waiting note in each step. Only stop and ask the user something if a step fails unrecoverably (repeated failed release reviews, deployment failure, or an inconclusive/losing experiment result).

**The final report (Step 8) is mandatory, not optional.** The moment an experiment or rollout reaches a terminal outcome — winner, loser, inconclusive, or rollback — produce the full report in the same turn you announce the outcome. Don't let a casual "it worked! ????" substitute for the structured report.

## Step 1: Goal Clarification

Before doing anything, get answers to:

1. **What metric measures success?** *(Required)* e.g. conversion rate, page load time, bounce rate. Reserve your error-rate metric as a safety guardrail — never use it as the primary success metric.
2. **What's the target improvement?** *(Required)* e.g. 15% increase, 200ms decrease.
3. **What's the current baseline?** *(Optional — infer from production metrics if not given)*
4. **What parts of the app are in scope?** *(Optional — infer from the codebase if not given)*
5. **Any constraints?** *(Optional)* e.g. no changes to the payment flow.

Questions 1–2 are required before proceeding; infer 3–5 where possible and confirm your assumptions with the user before implementing.

## Step 2: Hypothesis Generation

Explore the target repository/codebase to find a plausible change:

1. Search and read the relevant code paths.
2. Think through what UI/UX or logic change could plausibly move the chosen metric.
3. Check whether this hypothesis (or something close to it) has already been tried and failed — look at flag history or archived flags with similar naming. Avoid repeating a known failure.
4. Present the hypothesis to the user before proceeding, along with your reasoning and any inferred assumptions from Step 1.

**Before finalizing a flag key, check for collisions:** look up any candidate flag key first.
- Already fully shipped (100% one variation, no split) → already decided, pick a different hypothesis.
- Actively running an experiment → mid-flight, don't compete with it, pick a different hypothesis.
- Doesn't exist → safe to create.

## Step 3: Implementation

1. Create a boolean feature flag, OFF by default in all environments. Name it with a clear pattern like `exp-<metric>-<short-description>` (e.g. `exp-checkout-conversion-cta-color`), lowercase with hyphens, ~50 chars max.
2. Hand off implementation to your coding agent/tool of choice, with clear instructions to gate the change behind the exact flag key from step 1.
3. This step is asynchronous — check status periodically rather than looping tightly on it.
4. Once implementation completes, move to Step 4 with the resulting branch/PR. If it fails, report the error and stop.

## Step 4: Release Readiness

Run your standard release/risk review on the PR before merging.

- If it passes: merge the PR.
- If it fails: feed the review's specific feedback back into implementation and retry. Cap retries at a small fixed number (e.g. 3 attempts total) — if it still hasn't passed, stop and report the last failure to the user rather than retrying indefinitely.

*(If your environment genuinely has no review capability available — e.g., a fully unattended automation context — you can skip straight to merge, but treat that as a deliberate, narrow exception you call out explicitly, not a default. Skipping review removes your only gate against shipping broken code.)*

## Step 5: Deployment

Deployment typically won't fire automatically on merge if your workflow is manually-triggered (`workflow_dispatch`-only) — you'll need to trigger it explicitly.

1. Trigger the deploy workflow on the merge target branch. Treat "already an in-progress deployment for this ref" as expected de-duplication, not an error — don't re-trigger.
2. Poll for status, but let your polling tool's own internal long-poll do the waiting rather than looping tightly yourself.
3. Watch for a "stale" status specifically: if a deployment reports "running" for far longer than normal, cross-check the actual CI run history by commit SHA/timing before assuming it's still in progress — a background poll process may have died without updating the record.
4. **Trigger a deployment at most once per attempt.** If you're unsure whether a previous trigger succeeded, check status first — never re-trigger just because you're unsure.
5. On timeout: stop, check the CI run directly, report the situation, ask how to proceed.
6. On explicit failure: stop and report — do not proceed to the experiment.
7. On success: proceed immediately to Step 6.

## Step 6: Experiment Phase (fixed 10%)

Prove the change on a small, fixed slice of traffic. Do **not** start a guarded rollout here — that's Step 7, and only after this proves out.

1. Turn the flag ON.
2. Configure a fixed 50/50 split across 10% of traffic (a flat allocation, not a staged ramp) on your chosen randomization unit (typically "user"). The remaining 90% of traffic is excluded from the experiment entirely.
3. Create an experiment with:
   - Exactly one primary metric: the success metric from Step 1.
   - Guardrail metric(s): always include your error-rate metric; add a performance metric (e.g. p95 page load time) too if this is a performance-focused change.
   - Treatments: control (off) at 50%, treatment (on) at 50%, allocated to 10% of total traffic.
4. Start the experiment/data collection.
5. Move to Step 7 to monitor toward a decision.

## Step 7: Monitoring & Outcome

Check status periodically — don't tight-loop. In an interactive session, check once and report progress, then pick back up later. In an unattended/scheduled context, check once per invocation and persist your progress somewhere durable between runs.

**Phase 1 — Prove the experiment at 10% (gate before any rollout):**

Watch for statistical significance on the primary metric:

- **Significant + positive lift** → experiment proven. Stop the experiment iteration and move to Phase 2.
- **Significant + negative lift** → declare a loser, archive the flag, skip Phase 2, go straight to the Step 8 report.
- **No significance after a reasonable ceiling (e.g. 30 minutes)** → report "inconclusive, need more traffic" and stop; don't proceed to Phase 2.

Never declare a winner off a single data point or before your stats engine confirms significance.

**Phase 2 — Guarded rollout ramp (only after Phase 1 proves the change):**

Start a guarded rollout with:
- The winning ("on") variation as the test, the original as control.
- Same randomization unit as the experiment.
- **Exactly 3 monitored stages, capped well below 100%** — e.g. 20% → 30% → 40%, ~60 minutes monitoring each. Don't add a stage at or above 100%; Guarded-rollout implementations reject stages above 50% audience allocation, and the rollout auto-promotes to 100% itself once the final monitored stage completes cleanly — no explicit 100% stage needed.
- The same primary + guardrail metrics as the experiment, each configured to notify and auto-rollback on regression.

Track stage progression. If the rollout rolls back or stops at any point, treat it as a regression: declare failed, clean up the flag (deprecate/archive it), and go to the Step 8 report.

Once the final stage completes cleanly and auto-promotes to 100%, declare a winner and go to the Step 8 report.

**Retrying after a rollback:** a rollback isn't always caused by your monitored metrics genuinely regressing — it can also be triggered by an unrelated application error surfacing mid-ramp. Before blindly restarting after the user says they've fixed something:
1. Confirm the flag's current state (should be back to 100% control, nothing stuck mid-rollout).
2. Check the change history timing between "advanced to next stage" and "reverted." A rollback within seconds of advancing is inconsistent with a full metric-window regression and points to an external cause instead.
3. If the flag is cleanly reverted and the external cause is confirmed fixed, it's safe to restart the guarded rollout from scratch with the same parameters.
4. Don't silently retry without this check, and don't refuse to retry just because a prior attempt rolled back — a genuinely fixed external cause is a legitimate reason to retry. A metric-driven loser is not — don't retry that.

**On any terminal outcome, immediately produce the Step 8 report in the same turn** — a one-line "it worked!" note is fine as a lead-in, but the structured report must follow, not wait for a follow-up request.

## Step 8: Report

Runs automatically the instant Step 7 reaches a terminal outcome (winner + auto-promoted to 100%; loser; inconclusive; or rollback/failure). Use this exact structure:

```
## Experiment Report: [Goal Description]

**Date:** [YYYY-MM-DD]
**Goal:** [metric] [direction] by [target]%
**Status:** [achieved / in progress / stalled]

### Hypothesis
[What we tried and why]

### Implementation
- Flag: [flag_key]
- Files modified: [list]
- Branch: [branch name]

### Release Readiness
- [reviewed, passed after N attempt(s) / skipped, per your environment's process]

### Experiment Phase (10% fixed split)
- Status: [proven / loser / inconclusive]
- Duration: [time]
- Metric change: [before] → [after] ([+/-]%)
- Statistical significance: [value, confidence interval]

### Guarded Rollout Phase (if reached)
- Status: [completed / rolled_back / not started]
- Duration: [time]
- Stages reached: [N of 3 monitored stages]
- If rolled back and retried: [root cause, outcome of retry]

### Safety Metrics
- error-rate: [baseline] → [final] ([no regression / regression detected])
- [other guardrails]: [baseline] → [final] ([status])

### Next Steps
[What to do next based on the outcome]
```

## Safety Rules (the non-negotiables)

- Always present the hypothesis before implementing.
- Always run a release/risk review before merging, unless your environment has a deliberate, explicitly-called-out exception.
- **Always prove a change via a fixed small-percentage experiment before starting any guarded rollout** — never ramp blind.
- Always include an error-rate (or equivalent "don't break prod") metric as a guardrail, separate from your success metric.
- Add a performance guardrail (e.g. p95 latency) for performance-focused changes.
- Every rollout metric should be configured to both notify AND auto-rollback on regression — don't rely on notification alone.
- **Cap guarded rollout stages well below 100%** (most platforms reject stages ≥50% audience allocation) and let the platform auto-promote to 100% after the final stage — don't try to add an explicit 100% stage.
- Distinguish a metric-driven rollback (don't retry) from an external-cause rollback (safe to retry once fixed) before restarting a rolled-back rollout.
- The final report is automatic and mandatory on every terminal outcome — never defer it to a follow-up ask.
Conclusion
This post described how AWS DevOps Agent, Kiro CLI, and LaunchDarkly connect into a closed-loop system that turns an improvement goal into a series of measured, safe experiments. The agent runs autonomously on a schedule: it generates hypotheses informed by prior outcomes, creates feature flags before any code change, invokes Kiro CLI in headless mode to implement changes behind those flags, validates through release readiness review, deploys through GitHub Actions and AWS Amplify, and hands off to LaunchDarkly for experiment measurement and guarded rollout. If a guardrail is breached at any point during the rollout, LaunchDarkly reverts flag state at runtime without a redeployment. After each cycle, the agent records what happened and feeds it into the next decision.
This directly addresses the three barriers that slow experimentation:
● Planning cost is reduced because the agent handles hypothesis generation, flag creation, implementation coordination, and validation. The team defines the goal; the system handles the wiring.
● Measurement disconnected from action is addressed because LaunchDarkly monitors metrics in real time and reverts flag state automatically when a guardrail is breached, requiring no redeployment and no waiting for a human to notice.
● Stalled iteration is solved because every outcome is recorded and fed into the next hypothesis automatically. The system does not forget what it learned, and it does not stall between iterations.
The architecture is available to implement today as a reference. The orchestration skill included in this post encodes the full 8-step workflow: goal clarification, hypothesis generation, implementation, release readiness, deployment, experiment, monitoring, guarded rollout, and reporting. Teams define their improvement goal, connect the LaunchDarkly MCP server and the Experiment MCP Server to a DevOps Agent custom agent, and let the system iterate toward the target within the safety boundaries they configure. A more turnkey experience is planned for the future.
AWS uses Planned Lifecycle Events (PLEs) for AWS Health to signal that a managed service version is approaching end of standard support. Several AWS services such as Amazon Elastic Kubernetes Service (Amazon EKS), Amazon Relational Database Service (Amazon RDS), Amazon OpenSearch Service, and Amazon ElastiCache publish these events through AWS Health when a running resource needs to move to a newer version before a published deadline. For the team receiving that alert, the work that follows is remarkably similar regardless of which service triggered it. Engineers must identify every affected resource across accounts and AWS Regions, determine the correct target version, and assess compatibility constraints for dependencies and consumers. They then update infrastructure-as-code (IaC) definitions to reflect the new versions, validate that no breaking changes are introduced, and deploy within the deadline. When multiple services reach end-of-support on overlapping timelines, each with dozens of affected resources, this per-service effort compounds into a sustained operational burden for engineering and operations teams.
AWS DevOps Agent is a frontier agent that resolves and proactively helps prevent incidents, continuously improving reliability and performance of applications on AWS and hybrid environments. AWS DevOps Agent helps review software changes for production risks while investigating incidents and identifying operational improvements as an experienced DevOps engineer.
AWS DevOps Agent and Kiro are transforming how organizations manage version upgrades across AWS managed services and turn these into a governed, event-driven workflow. The AWS DevOps Agent automates the investigation: it discovers impacted resources, analyzes upgrade paths, and produces a structured change specification. Kiro provides the agentic development environment to apply those changes, validate safety constraints, and open a pull request (PR) for human review. The engineer’s role shifts from executing the upgrade to reviewing a PR that has already been investigated, coded, and validated. The engineers can even write the upgrade logic as a custom AWS DevOps Agent skill, and the framework handles orchestration, validation, and delivery.
This post and the sample code demonstrates the approach with an end-to-end Amazon EKS upgrade example. The underlying pattern of event detection, agent-driven investigation, automated code changes, and a failure retry loop applies to other AWS managed services that publish AWS Health PLEs.
In this post, you will learn how to:
Automate planned lifecycle upgrade events detection using AWS Health and Amazon EventBridge
Use AWS DevOps Agent to investigate the upgrade path and produce a structured change spec.
Run Kiro CLI (headless mode) in a continuous integration and continuous delivery (CI/CD) pipeline to apply code changes, validate safety constraints, and open a pull request.
Close the loop with automatic upgrade deployment failure detection where a failed deployment triggers root-cause analysis, mitigation planning, operator notification, and a code fix pull request without human initiation.
Solution overview
The following diagram shows the end-to-end flow, from the initial AWS Health event through to the pull request and the pipeline upgrade loop.
Figure 1: Architecture diagram of the automated upgrade pipeline
There are five main phases in this flow. Let’s walk through each phase.
Phase 1: Detection
a. The pipeline starts when AWS Health publishes an AWS_EKS_PLANNED_LIFECYCLE_EVENT to the default Amazon EventBridge bus with the following event details:
service: EKS
eventTypeCategory: scheduledChange
eventTypeCode: AWS_EKS_PLANNED_LIFECYCLE_EVENT
affectedEntities: <array of cluster ARNs with status: PENDING>
eventRegion: <region of the affected cluster>
b. An Amazon EventBridge rule named eks-health-planned-lifecycle matches this event and invokes the AWS Lambda function devops-agent-health-event.
c. The Lambda function extracts the relevant information (cluster name and region), builds a webhook payload with eventType: incident and priority: HIGH, and POSTs to AWS DevOps Agent webhook endpoint, instructing the agent to follow the eks-upgrade-planning skill for the specific cluster and region. The Lambda function does not validate those values, so a failed extraction can leave the investigation running against placeholder data.
Phase 2: Investigation
a. AWS DevOps Agent uses the eks-upgrade-planning skill to discover cluster topology, validate the version increment, check addon compatibility, scan for deprecated APIs, and determine upgrade sequence.
b. The agent outputs a structured AWS Cloud Development Kit (AWS CDK) Change Spec containing target version strings for every component, a rollback readiness assessment (confirming the 7-day rollback window will be available post-upgrade), a feasibility assessment (READY, BLOCKED, or NEEDS_REMEDIATION), and a risk rating.
c. When AWS DevOps Agent completes its investigation, it emits an Investigation Completed event to Amazon EventBridge with the following event details:
a. A second Amazon EventBridge rule devops-agent-investigation-events matches this event, filtered by agent_space_id so that only events from the specific agent space trigger the pipeline.
b. The rule invokes the Trigger Upgrade Lambda function (devops-agent-trigger-upgrade). This Lambda function fetches the investigation’s journal records through ListJournalRecords and scans the output for content markers to determine the next action. Markers are checked in a fixed priority order so that a failure investigation quoting upstream CLUSTER_VERSION context cannot accidentally re-trigger an upgrade workflow. When either a CDK Change Spec heading or a resolved CLUSTER_VERSION line is present, the Lambda function treats the investigation as having produced an actionable upgrade plan. It retrieves the GitHub Personal Access Token (PAT) from AWS Secrets Manager, builds the investigation metadata into a summary JSON, and dispatches the eks-upgrade.ymlGitHub Actions workflow through the GitHub API. The dispatched payload is a compact summary record (~3.8 KB) containing the CDK Change Spec, not the full investigation transcript, which exceeds GitHub’s workflow dispatch size limit.
c. Before the workflow lets a coding agent near the code, it validates what the investigation produced. An extraction step scans the received payload for fenced code blocks containing CLUSTER_VERSION. Each candidate block is held to a strict format contract:
No leftover placeholder markers.
A Kubernetes version matching X.Y.
A kubectl layer package matching @aws-cdk/lambda-layer-kubectl-vNN.
Every addon version matching vX.Y.Z-eksbuild.N unless explicitly marked NOT_INSTALLED.
The workflow also enforces the agent’s own feasibility verdict. If the investigation concluded BLOCKED or NEEDS_REMEDIATION, the run stops and the coding agent is not invoked. When validation passes, the single deduplicated spec block is written to a temporary file for the coding step. The workflow stops with an error if no spec block is found, no block passes validation, or multiple conflicting specs are present. The pipeline fails closed rather than handing an ambiguous instruction to a coding agent.
d. GitHub Actions then installs Kiro CLI, gated on a minimum tested version, with anything newer allowed through but flagged as untested. The installer is downloaded and executed as two discrete steps rather than piped from curl, and Kiro is then invoked in headless mode:
kiro-cli chat --no-interactive --trust-tools=read,write,glob,grep \
"Read kiro-cdk-instructions.md for context on the CDK patterns. Then read /tmp/cdk-change-spec.txt — it contains the validated CDK Change Spec extracted from the DevOps Agent investigation. Apply those values exactly. Modify lib/iteration3-stack.ts ONLY. Do NOT derive or guess version numbers — use only the values from the spec file. Make only the file edits — do not run any build or shell commands, and do not commit."
e. Two things are worth noting about this invocation. Kiro is trusted with file tools only (read, write, glob, grep) with no shell or command execution, so the scope of the agent step is limited to file edits in the checked-out working tree. And it is told explicitly not to derive version numbers: every value comes from the validated spec file, so a model that misreads the investigation cannot substitute a version of its own. Kiro reads kiro-cdk-instructions.md, a standalone reference that prescribes the CDK modification procedure for EKS upgrades, then modifies lib/iteration3-stack.ts and nothing else. The kubectl layer dependency is handled separately, by npm, in a later step. Neither the AWS DevOps Agent nor Kiro can query a package registry, so neither can know which versions of that layer actually exist. The spec carries only the package name and npm resolves the version. It is the pipeline’s own principle applied to itself: identify what the model cannot know, and move it out of the model’s reach rather than letting it guess.
f. Two independent gates run after Kiro exits. The first diffs the working tree against a single-file allowlist and fails the run if anything other than lib/iteration3-stack.ts was touched. That diff is a containment check on the agent’s write access and only after that audit passes, a separate step updates the kubectl layer dependency in package.json. The second gate runs the full build and CDK synthesis pipeline, so a change that does not compile or synthesize does not create a pull request.
Phase 4: Review and deploy
a. After Kiro exits, the workflow opens a GitHub Pull Request (PR) on a branch named upgrade/eks-automated-<run_id>. Kiro’s role ends at file edits. It does not interact with Git or GitHub. The PR body includes a rollback window advisory documenting the 7-day reversal deadline, a reviewer checklist, and a machine-readable investigation-context block containing the agent space ID and task ID. The post-merge deploy workflow parses that block to tag the AWS CloudFormation stack, so a future upgrade failure carries a record of which investigation produced the deployed plan. The tag is informational only and the failure investigation is not linked to the upgrade investigation, keeping the two workstreams independent.
b. The automated pipeline pauses at the pull request. The Site Reliability Engineering (SRE) team reviews the changes using their existing approval process.
c. After merge, the team deploys using their standard CI/CD pipeline. The investigation-context tags on the stack enable traceability back to the originating event if issues arise.
Phase 5: Failure detection and automated mitigation
The pipeline includes a closed-loop failure path. If a deployed upgrade fails, the system automatically investigates the root cause, generates a mitigation plan, notifies the SRE team, and opens a code fix pull request, all without human initiation. The pipeline attempts this automated recovery once. If the failure investigation itself does not produce actionable results, the pipeline stops and we recommend manually reviewing the cluster upgrade failure through the AWS DevOps Agent console or standard operational runbooks.
With EKS version rollbacks now available, the eks-failure-root-cause skill evaluates whether a rollback is the faster recovery before recommending a code fix. In case a deployment failure occurs within the 7-day rollback window, the root-cause investigation first evaluates whether a version rollback would resolve the issue faster than a code fix. When rollback readiness checks pass and the root cause is version-related (not a code or configuration error), the skill directs the agent to recommend version rollback (aws eks update-cluster-version --kubernetes-version <previous-version>) as the primary recovery action, with the code fix PR as a follow-up hardening measure. If rollback is not viable (outside the window, node skew, forward-only addon changes), the pipeline continues to the existing code fix workflow.
The following diagram shows the failure path from CloudFormation rollback through to the code fix pull request and operator notification.
Figure 2: Architecture diagram of the failure mitigation loop
a. When cdk deploy fails after merge, CloudFormation emits a stack status change event (such as ROLLBACK_FAILED, ROLLBACK_COMPLETE, UPDATE_ROLLBACK_FAILED, or UPDATE_ROLLBACK_COMPLETE) to Amazon EventBridge. An Amazon EventBridge rule (eks-cfn-stack-failure) matches one of these terminal rollback statuses and invokes the Failure Lambda function.
One point deserves emphasis before a responder acts on this event: a CloudFormation stack rollback does not revert an EKS control plane version. Reverting the template to one that specifies a lower Kubernetes version is not a cluster version rollback. That has to be initiated explicitly through the UpdateClusterVersion API, the AWS CLI, or the console. If CloudFormation had already updated the control plane before failing on a later resource, the stack can report a completed rollback while the cluster remains on the new version. Confirm the cluster’s actual Kubernetes version rather than inferring it from the stack status.
b. The Failure Lambda function opens a new investigation on the same agent space (eks-upgrade-poc) used for upgrade planning. The prompt instructs the agent to analyze the failure and produce a root-cause assessment. Using the scoping controls for agent sessions, a single agent space can handle both investigation types safely:
Global Instructions (applied to all agent types) enforce hard rules: “never reference findings from an upgrade-planning investigation when performing failure root-cause analysis” and vice versa. These always-on rules are the primary isolation boundary.
A triage skill (eks-investigation-triage-rules, scoped to Incident Triage) adds explicit “never link” rules that prevent the agent from correlating failure investigations with upgrade investigations, even when they involve the same cluster.
Scoped RCA skills activate based on incident context: eks-upgrade-planning triggers for Health events, eks-failure-root-cause triggers for CloudFormation rollbacks. The agent selects the correct skill automatically.
c. When the root-cause investigation completes, it emits the Investigation Completed event to Amazon EventBridge. The same Trigger Lambda function that handles upgrade completions picks up this event (filtered by agent_space_id).
d. The Trigger Lambda function (devops-agent-trigger-upgrade) fetches the investigation’s journal records through ListJournalRecords and scans for content markers. If a Root Cause heading is present in the content markers but no Mitigation Plan heading exists, the Lambda function knows the root-cause phase is complete but mitigation hasn’t run yet. It programmatically activates the Mitigation Agent by calling UpdateBacklogTask with status PENDING_START, instructing AWS DevOps Agent to generate a recovery plan based on the root-cause findings. It then schedules a one-time check by using Amazon EventBridge Scheduler, set for five minutes later, to poll for mitigation completion. The Mitigation Agent does not reliably emit a second completion event. If mitigation is still running when the check fires, the Lambda function reschedules at three-minute intervals. If the execution has finished but its journal records are not yet fully written, it retries at one-minute intervals until they appear. Polling is capped at thirty attempts so a stuck mitigation cannot loop indefinitely. If the mitigation execution ends in a terminal failure status (FAILED, CANCELED, or TIMED_OUT), the Lambda function publishes an Amazon Simple Notification Service (Amazon SNS) alert and stops polling rather than retrying indefinitely. Because a native Investigation Completed event and a scheduled poll can both reach the Trigger Lambda function for the same task, dispatches are guarded by a lock built on deterministic Amazon EventBridge Scheduler schedule names, so the same recovery is not dispatched twice.
e. The Mitigation Agent produces up to two outputs depending on what the failure requires: an execution plan with immediate recovery steps if manual intervention is needed, and an agent-ready specification with CDK code changes if an infrastructure fix can prevent recurrence. Either output may be omitted if the mitigation does not call for it.
f. When the scheduled poll detects the mitigation output, the Trigger Lambda function delivers both results:
Operator notification: The SRE team receives an SNS notification with the immediate recovery steps so they can recover the cluster without waiting for a code review.
Code fix pull request: If the mitigation includes a CDK change spec, a GitHub Actions workflow runs Kiro CLI to implement the agent-ready specification and opens a pull request for human review. When the root cause lies outside the CDK stack, such as an application-level API deprecation or a custom admission webhook, the pipeline delivers the execution plan with manual remediation steps only and does not generate a PR.
The responder acts on the urgent manual steps immediately while the automated code fix goes through the normal review process.
Why a closed loop matters
Even with thorough investigation and validation, real-world upgrades can fail because of conditions the agent couldn’t observe pre-deployment: workload-specific API deprecations, custom admission webhooks that reject updated resources, or transient control plane issues during the upgrade window. A pipeline that only handles the happy path leaves the team scrambling manually when things go wrong. The closed loop is designed to apply the same agent-driven rigor to failure recovery.
Keeping skills current: Daily skill review
AWS services evolve continuously, new EKS versions ship, addon defaults change, and API deprecation timelines shift. A skill written today may contain outdated version constraints or miss a new upgrade path within weeks. The pipeline includes an automated daily review that keeps the agent’s skills current without manual monitoring.
An Amazon EventBridge rule triggers a Skill Review Lambda function daily. The Lambda function fetches all four skill files (eks-upgrade-planning, eks-failure-root-cause, eks-investigation-triage-rules, and eks-skill-review itself) from the GitHub repository’s main branch and posts them, embedded in the incident description, to the agent space as a new signed-webhook investigation. The agent runs a dedicated review skill (eks-skill-review) that verifies each claim in the embedded content against authoritative AWS sources. It queries AWS APIs for current EKS version availability, addon defaults, and deprecation schedules, then compares what it finds against the embedded skill content.
When the review identifies gaps, outdated constraints, or missing upgrade paths, the Trigger Lambda function dispatches a skill-update.yml GitHub Actions workflow. Kiro CLI applies the recommended edits to the skill files and opens a pull request. The team receives an SNS notification on the eks-skill-update-notifications topic, reviews the PR, and after merging, re-uploads the updated skill zips to the agent space. If no changes are needed, the pipeline logs the result and exits silently. A third path guards against silent failure: if the agent’s output carries the spec heading but no parse-able spec can be isolated from it, the Lambda function dispatches the workflow with the full findings so the run fails visibly rather than reporting a false no-change result.
This self-maintenance loop means the pipeline’s knowledge stays aligned with EKS capabilities, including changes like the recently announced version rollback feature, without requiring the team to manually track service announcements and update skills.
Two caveats apply. First, skill-based triage routing relies on model judgment and can vary between runs on identical input. Treat the daily review as a best-effort maintenance loop, not a guaranteed daily gate. Second, while the review inspects its own skill file, edits to the review procedure still require the same human merge-and-re-upload cycle as any other skill change.
Safety constraints: What the pipeline enforces and why
Amazon EKS upgrades carry risks that make automated safety checks essential. The pipeline enforces constraints at every stage, from the agent’s investigation through to the final CDK diff validation.
Only one minor version at a time. EKS does not support skipping Kubernetes versions. For example, you can move from 1.30 to 1.31, but not from 1.30 to 1.32. The agent validates this in Step 2 of its investigation and stops with an error if a version skip is detected. This constraint means that clusters that are multiple versions behind require sequential upgrades, each with its own investigation and validation cycle.
Control plane upgrades are reversible for 7 days. EKS supports Kubernetes version rollbacks, so you can revert a control plane upgrade to the previous minor version within seven days. EKS evaluates rollback readiness through cluster insights under the ROLLBACK_READINESS category, checking API usage compatibility, cluster health, kubelet and kube-proxy version skew, and EKS-managed add-on compatibility. Insights with ERROR or UNKNOWN status block the rollback until resolved, so rollback can be unavailable even within the 7-day window if readiness checks fail. After the window closes, rollback is no longer offered regardless of cluster state. Rolling back from a version under standard support into one under extended support resumes extended support charges. The upgrade-planning skill checks rollback readiness during its investigation and documents the window in the PR body, so reviewers know their safety net and its constraints.
Rollback is not always viable. Even within the 7-day window, rollback may be unavailable or inappropriate when:
Resources were created during the 7-day window using APIs or fields that exist only in the newer version, which must be removed before rolling back.
Add-on versions are not rolled back automatically, and a downgrade can fail if the current configuration settings are incompatible with the target add-on version. Rollback readiness insights evaluate only EKS managed add-ons.
Nodes were already upgraded and now have version skew. Managed node groups must be rolled back before the control plane, the inverse of the upgrade sequence.
Workloads have adopted features available only in the newer Kubernetes version.
The cluster uses AWS Fargate worker nodes. Fargate pods running the current version must be deleted before rollback, or the kubelet version skew check bypassed with --force.
The cluster was automatically upgraded at the end of extended support (rollback unavailable), or at the end of standard support (rollback requires changing the cluster’s upgrade policy to EXTENDED first)
The cluster was created at its current Kubernetes version rather than upgraded into it, so there is no prior version to return to.
Rollback supports only N to N-1. You cannot roll back across multiple minor versions.
The agent’s risk assessment flags the conditions the pipeline actually encodes (deprecated API usage, add-on version incompatibility, and node version skew) and records them in the PR body alongside its ROLLBACK_AVAILABLE verdict. The remaining conditions above are documented AWS behavior that reviewers should confirm manually. The pipeline does not check them. Note too that the --force flag bypasses insight checks only. It does not bypass the prerequisite validations (the 7-day window, the created-at-version check, or the single-minor-version rule) and it cannot override an incompatible Amazon EKS feature enabled at the current version.
vpc-cni must be updated before node groups. New Amazon Machine Images expect the updated CNI plugin, so the Amazon Virtual Private Cloud (Amazon VPC) CNI add-on upgrade must precede any node group update. If the add-on has not been updated first, pods on the new nodes lose networking. The CDK stack declares this ordering explicitly: the managed node group carries a CloudFormation DependsOn the Amazon VPC CNI add-on, so an update cannot reach the node group before the add-on has been updated. The sequence is also declared non-negotiable in the upgrade-planning skill and the Global Instructions, and the agent reproduces the required order in its investigation output and the PR body. The remaining add-on order (kube-proxy, then Coredns) is documented operational sequence rather than a synthesized dependency.
A Replace means cluster destruction. A Replace action deletes the resource and recreates it. For an Amazon EKS cluster, that means the control plane, all workloads, and all state are destroyed and rebuilt from scratch, which makes the cdk diff the single most important thing a reviewer looks at. The pipeline reduces the chance of a destructive change reaching that review through layered gates rather than a single check:
Version values are taken verbatim from the validated spec file rather than derived by the model.
Kiro CLI is restricted to file tools only (read, write, glob, grep) and cannot run shell commands.
A file-change allowlist fails the run if anything other than lib/iteration3-stack.ts was modified.
A separate step updates the kubectl layer dependency, and a final validation step runs the build and CDK synthesis so that only changes that compile and synthesize successfully can reach a pull request.
The PR body’s reviewer checklist then requires a cdk diff showing Modify and not Replace, alongside version-correctness and add-on compatibility checks. That is a human gate, not an automated one, and it is the final defense before the separately triggered deploy workflow runs after merge.
These constraints are enforced at multiple points: during the agent’s investigation, during Kiro’s code modification and validation, and again at the human review gate on the pull request. Redundant checks at the earlier stages reduce the risk of a single point of failure allowing a destructive change through.
With the safety model clear, here’s what you need before deploying.
Getting started
Follow these steps to deploy the whole solution into your own account, from the Amazon EKS cluster through to the agent space, skills, and event routing.
Important: This solution deploys billable AWS resources including an Amazon EKS cluster, AWS Lambda functions, Amazon EventBridge rules, AWS Identity and Access Management (IAM) roles, and AWS Secrets Manager secrets. You will incur charges while these resources are running. We recommend deploying in a development account and following the Clean up section after completing the walkthrough to avoid ongoing charges.
Prerequisites
To deploy this pipeline in your own environment, you need the following:
AWS account and tooling
An AWS account in a region where AWS DevOps Agent is available, with AWS CDK bootstrapped and AWS Command Line Interface (AWS CLI) v2 configured.
Permissions to create Amazon EKS clusters, AWS Identity and Access Management (IAM) roles, Lambda functions, Amazon EventBridge rules, and Secrets Manager secrets. The walkthrough uses administrative credentials for brevity. Scope them down for anything beyond a sandbox account.
A GitHub fine-grained Personal Access Token (PAT) granting Read and write on Actions, Contents, and Pull requests for your fork, which you will store on AWS Secrets Manager.
For the optional post-merge deploy workflow only: an IAM role that trusts GitHub’s OpenID Connect (OIDC) provider, with its ARN stored as the AWS_DEPLOY_ROLE_ARN repository secret. The sample does not create this role, and the upgrade pipeline through pull request creation works without it.
Kiro
A Kiro CLI API key, which requires a Kiro Pro, Pro+, or Power subscription.
Step 1: Clone the repository
git clone https://github.com/aws-samples/sample-automate-planned-lifecycle-upgrades-with-aws-devops-agent-and-kiro.git
cd sample-automate-planned-lifecycle-upgrades-with-aws-devops-agent-and-kiro
Step 2: Run the bootstrap script to provision the Amazon EKS cluster, AWS DevOps Agent space, Lambda functions, and Amazon EventBridge rules:
./bootstrap.sh
Step 3: Follow the README to configure the webhook credentials, GitHub PAT, and Kiro API key.
Step 4: Upload the AWS DevOps Agent skills and configure agent instructions
Operations teams use AWS DevOps Agent Space web apps for daily incident response activities. This standalone application provides an interface where SREs can launch investigations, interact with the agent through natural language chat, view application topologies, and review incident prevention recommendations.
Access the AWS DevOps Agent space web app
In the AWS DevOps Agent console, select your agent space (eks-upgrade-poc).
Select Launch web app from the top right, choosing IAM or AWS IAM Identity Center option based on your setup. This opens the dedicated web app that the operations teams use to conduct investigations and review recommendations within that space.
The single agent space uses Global Instructions, agent-type-scoped instructions, and four skills to route investigations correctly and enforce isolation between upgrade and failure paths.
Configure Global Instructions
In the AWS DevOps Agent web app navigate to Knowledge > Instructions > All agents
Paste the contents of instructions/global-instructions.md from the repository and select Save.
The Instructions page groups global instructions with the agent-type-scoped instructions, as the following screenshot shows.
Figure 3: The Instructions page showing Global Instructions and agent-type-scoped instructions
Configure Incident Mitigation instructions
In the same agent space, navigate to Knowledge > Instructions > Incident Mitigation
Paste the contents of instructions/mitigation-agent-instructions.md from the repository and select Save.
Upload the agent skills
Zip the skill folder from the repository:
cd skills
zip -r eks-upgrade-planning.zip eks-upgrade-planning
zip -r eks-failure-root-cause.zip eks-failure-root-cause
zip -r eks-investigation-triage-rules.zip eks-investigation-triage-rules
zip -r eks-skill-review.zip eks-skill-review
In the AWS DevOps Agent web app, navigate to Settings > Skills > Custom Skills and select Add Skill.
The Skills page separates the custom skills you upload from AWS managed skills, as the following screenshot shows.
Figure 4: The Skills Management page with the Custom Skills and Managed Skills tabs
Select Upload Skill from the pop-up.
For each skill, upload the zip file.
Under agent type scope, select the agent type listed in the following table and choose Upload.
Note: Each skill must be scoped to the correct agent type so the agent activates it in the right context.
Skill
Scope
Purpose
eks-upgrade-planning
Incident RCA
7-step EKS upgrade investigation producing a CDK Change Spec
eks-failure-root-cause
Incident RCA
Root-cause analysis for CloudFormation rollback failures
eks-investigation-triage-rules
Incident Triage
Prevents linking between upgrade and failure investigations
eks-skill-review
Incident RCA
Daily review of skills for gaps and outdated information
The Upload Skill dialog takes the zip file and the agent type scope together, as the following screenshot shows.
Figure 5: The Upload Skill dialog for choosing a skill zip file and agent type scope
Step 5: Subscribe to SNS topics
Subscribe your on-call email to both SNS topics the stack creates: eks-upgrade-failure-mitigation (mitigation plans and pipeline failure alerts) and eks-skill-update-notifications (daily skill review findings).
Step 6: Test the pipeline end-to-end
The README includes a step-by-step walkthrough, end-to-end test instructions, and optional configuration for the failure mitigation SNS notifications.
Clean up
To avoid ongoing charges, delete the resources deployed during this walkthrough. The repository includes a cleanup script that removes everything in reverse order.
Run the cleanup script:
./cleanup.sh
The script deletes the CloudFormation stack (agent space, Lambda functions, Amazon EventBridge rules, Secrets Manager secrets) and the CDK stack (EKS cluster, node group, VPC). See the repository README for pre-cleanup steps and details on resources that require manual removal.
Security best practices
Security and compliance is a shared responsibility between AWS and the customer, as outlined in the Shared Responsibility Model. We encourage you to review this model for a comprehensive understanding of the respective responsibilities.
In this solution, we implemented the following security measures:
Secrets management. Webhook HMAC credentials and the GitHub PAT are stored on AWS Secrets Manager and are not hard-coded or passed as environment variables. Lambda functions retrieve secrets at invocation time using least-privilege IAM policies scoped to only the specific secret ARNs they require.
Least-privilege IAM. Each Lambda function operates with a dedicated IAM role granting only the minimal permissions required for its specific function. The Health Lambda function can only read webhook credentials and invoke the AWS DevOps Agent webhook. The Trigger Lambda function can only read journal records, update backlog tasks, create and delete the Amazon EventBridge Scheduler schedules it uses for mitigation polling, dispatch GitHub workflows, and publish to the two designated SNS topics (eks-upgrade-failure-mitigation for operator notifications and eks-skill-update-notifications for daily skill review alerts).
Webhook authentication. Communications between Lambda functions and the AWS DevOps Agent webhook use HMAC-SHA256 signed payloads. The agent validates the signature on every request, rejecting payloads with an invalid or missing signature.
GitHub token scoping. The GitHub Personal Access Token uses fine-grained permissions scoped to a single repository with only the Actions, Contents, and Pull Requests permissions required for workflow dispatch and PR creation.
No long-lived credentials in CI/CD. The post-merge deploy workflow (eks-deploy.yml) uses GitHub Actions OIDC federation to assume a short-lived IAM role, removing long-lived access keys from the GitHub environment.
Encryption. All data at rest in Amazon Simple Storage Service (Amazon S3) (CloudFormation template uploads, CDK assets) is encrypted using server-side encryption. Secrets Manager secrets are encrypted with a customer-managed AWS Key Management Service (AWS KMS) key created by the template. All API communications use TLS encryption in transit.
Constrained agent tooling. Kiro CLI runs with file tools only (read, write, glob, grep), with no shell or command execution, so the scope of the agent step is limited to file edits in the checked-out working tree. After Kiro exits, a separate workflow step diffs the working tree against a single-file allowlist (lib/iteration3-stack.ts) and fails the run if any other file was modified. The mitigation path’s workflow uses a wider three-file allowlist (adding package.json and package-lock.json), since a code fix can legitimately require other dependency changes. The agent cannot execute commands, alter workflow definitions, or touch IAM policies or the CloudFormation template.
Pinned, verified CI tooling. Kiro CLI is pinned to a minimum tested version. The workflow fails on anything older and warns on anything newer, so an untested release cannot be silently adopted. The installer is downloaded and executed as two discrete steps rather than piped directly from curl to a shell.
We recommend applying these additional security practices:
Enable AWS CloudTrail logging for the devops-agent API calls to maintain an audit trail of agent interactions.
Restrict the Amazon EventBridge rules to accept events only from expected sources and account IDs.
Rotate the GitHub PAT and webhook HMAC secret on a regular cadence.
Two recently released AWS DevOps Agent capabilities could further strengthen this pipeline, though they are not included in our solution:
Release management: AWS DevOps Agent can automatically review code changes for standards adherence, cross-repository dependency risks, and access-control correctness before deployment. In the context of this pipeline, Release management could evaluate the Kiro-generated CDK pull request against your organization’s policies and flag cross-service breaking changes that CDK diff alone would miss. It can also generate and execute change-specific tests against a running environment, catching integration failures before merge. For more information, see Release management.
Improvements (proactive incident prevention): AWS DevOps Agent analyzes patterns across your incident investigations and delivers prioritized recommendations to help prevent recurring failures. For the EKS upgrade pipeline, this means the agent can identify systemic patterns across multiple failed upgrades, such as a recurring addon incompatibility or a misconfigured node group setting, and generate agent-ready specifications to address the root cause proactively. Recommendations are categorized across observability, infrastructure, governance, and code optimization, and can be handed directly to a coding agent for implementation. Access this capability through the Improvements page in the AWS DevOps Agent web app. For more information, see Proactive incident prevention.
Conclusion
This pipeline shifts end-of-support upgrades from a reactive, manual process to a proactive, event-driven workflow. The investigation, code changes, and validation that an engineer previously performed per cluster now arrive as a reviewed pull request, with no human intervention until the approval step. When AWS Health detects an approaching end-of-support milestone, the system investigates, codes, validates, and delivers a pull request. This reduces mean time to remediation from days to minutes and frees engineers to focus on architecture decisions rather than repetitive upgrade mechanics.
The pipeline’s separation of investigation from delivery means that onboarding a new AWS managed service, such as Amazon RDS engine versions, Amazon ElastiCache engine upgrades, or Lambda runtime deprecations, requires only a new investigation skill. The event routing, code modification, validation, and PR infrastructure remains unchanged.
To get started, clone the repository and run bootstrap.sh, which deploys the CDK stack first (VPC, EKS cluster, managed addons, and the AWS Load Balancer Controller) and then the devops-agent-space.yaml CloudFormation template that creates the agent space, IAM roles, Amazon EventBridge rules, Lambda functions, and Secrets Manager secrets. Configure your webhook credentials and GitHub PAT on AWS Secrets Manager, point the GitHub Actions workflow at your CDK repository, and the pipeline is live. The next Planned Lifecycle Event that fires for your Amazon EKS clusters will produce a validated, reviewable pull request with no human intervention required until the review step.
Next steps
Whether you are exploring, prototyping, or ready to deploy, here is where to go next:
Just evaluating?Read the event workflow walkthrough, which traces every event, Lambda function invocation, and decision point traced end to end, with nothing to deploy. Pair it with the upgrade-planning skill to see the investigation logic that produces the CDK Change Spec.
Ready to run it?Clone the repository and follow the deployment guide in a development account. Roughly 25 minutes for bootstrap.sh, plus 10–15 minutes of configuration, and the synthetic health event in the README produces your first agent-generated pull request. Run cleanup.sh when you are finished to stop the charges.
Ready to adapt it? The investigation logic lives entirely in skills/eks-upgrade-planning/SKILL.md. The routing, validation, and PR machinery is service-agnostic. Onboarding another service that publishes lifecycle events means a new skill and a matching Amazon EventBridge pattern, not a new pipeline. Start with that skill’s output contract, since it is what the validation gate enforces.
This post was co-written with Michael Stephan, Senior Principal Product Manager, and Christian Kreuzberger, Principal Software Engineer, at Dynatrace.
AI-driven software delivery changes how code gets written, but not what production demands of it. A generated change still has to fit the traffic your service receives, the dependencies it calls, and the capacity limits it runs within. Without that context, you validate the change after it ships, which adds rework and deployment risk.
Kiro turns intent into specifications, code, and pull requests. AWS DevOps Agent investigates incidents and proposes mitigations. Bluebox by Dynatrace supplies the runtime topology, dependency, and traffic data that both draw on, so each change and each investigation is grounded in how the system behaves rather than how it’s expected to behave. In this post, we will follow a travel-booking example from feature design through post-deployment remediation. You’ll see how telemetry from Bluebox shapes a change in Kiro, how AWS DevOps Agent investigates an incident, and where human review and existing CI/CD controls remain in the process.
What are Kiro and AWS DevOps Agent?
Kiro is an agentic development environment that applies AI across the software development lifecycle. Its spec-driven workflow organizes a feature request into requirements, design, and implementation tasks before generating any code.
AWS DevOps Agent is a frontier agent for software delivery and operations across AWS, multicloud, and on-premises environments. It investigates incidents, identifies likely root causes, and recommends mitigations. Its release management capability (Preview) reviews code for release readiness and runs release tests before deployment.
Bluebox by Dynatrace: Helps agents ship the code you trust to production
To close the loop between code generation and production context, Kiro and AWS DevOps Agent rely on real-time production intelligence. This is where Bluebox by Dynatrace fits in. Bluebox provides the observability foundation that detects problems, measures their impact, and surfaces the runtime application topology, service dependencies, and actual traffic patterns that make AI-generated code and autonomous investigations truly production-aware.
Without production telemetry, AI-generated code operates in a vacuum – it cannot know that an endpoint handles 40:1 read-to-write ratios, that a service dependency has specific latency characteristics, or how API traffic fluctuates throughout the day. Bluebox grounds actions taken by Kiro and AWS DevOps Agent in how the system actually behaves, not in assumptions about how it should behave.
How the closed loop works
The combination of Kiro, AWS DevOps Agent, and Bluebox creates a continuous cycle from development through production and back:
Production-aware code generation: Before code is written, Kiro retrieves runtime context from Bluebox – service topology, traffic patterns, and resource utilization. Kiro’s spec-driven workflow translates this context into requirements and generates code that aligns with real production conditions from the first commit.
Confident code review: Kiro generates pull requests with production evidence attached. The release management capability in AWS DevOps Agent reviews the change for dependency impacts, drifts from internal standards, and production readiness – running autonomous tests in isolated environments.
Continuous monitoring: After deployment, Dynatrace continuously monitors application behavior. When an anomaly occurs, Bluebox detects it and surfaces full production context.
Autonomous investigation: Bluebox triggers AWS DevOps Agent with the relevant observability and topology data. AWS DevOps Agent performs a deep investigation, correlating telemetry, logs, infrastructure changes, and deployment history to pinpoint the root cause.
Automated remediation: AWS DevOps Agent generates the mitigation plan from the observability and runtime data that Bluebox provides. Bluebox adds that plan to the investigation report and files it as a GitHub issue. Kiro then proposes a production-aware fix as a pull request for your review, completing the loop.
Figure 1: Bluebox supports the closed loop from feature build to operations.
Next, we walk through a concrete example of this workflow in action.
Walkthrough
We follow a travel-booking application through two connected scenarios: shipping a new feature with production context, then responding to a production incident after it deploys.
Building a production-aware feature
Consider a team enhancing a travel booking application to improve customer experience. You begin by describing a new feature in Kiro, such as updating how products are displayed or adjusting backend logic to support new capabilities. In this case, we are using Kiro IDE.
Figure 2. A feature request in Kiro, with the project’s steering documents loaded for context.
Kiro’s spec-driven workflow expands this request into structured requirements before writing code. You connect Kiro to the Bluebox CLI to retrieve the full production context from Dynatrace: service dependencies, runtime topology, and observed traffic. The following figure shows how Kiro queries current load data for the flight-search path, including the ratio of Amazon DynamoDB reads to writes. Kiro composes and runs the CLI command on your behalf, so you don’t have to type it or set environment variables by hand. The command and its output stay visible in the session, so you can approve it before it runs and check what was retrieved before acting on it. In this case, the command queries the Bluebox API for the requested metrics. The output returns read and write counts per second for the DynamoDB table behind flight search, along with the services calling it.
Figure 3. Kiro runs the Bluebox CLI, then reads the codebase with production context before proposing changes.
The telemetry shows the flight-search endpoint is read-heavy. Users repeatedly query the same routes, at roughly 40 reads for every write against the DynamoDB table. Repeated identical reads are what a cache absorbs, so Kiro proposes an Amazon ElastiCache layer in front of the table, sized to the active working set derived from the observed request distribution. Without the read-to-write ratio, the same request could have produced a larger provisioned table or an added read replica, neither of which addresses repeated identical queries.
Kiro generates the code that implements the change and opens a pull request in GitHub for review. Nothing reaches production until a reviewer approves and merges it. The pull request carries the code changes and the Bluebox telemetry that justified them, so reviewers assess the decision against the same telemetry Kiro retrieved.
Figure 4. Kiro pushes a feature branch and opens a pull request in GitHub.
After review and approval through standard processes, a reviewer merges the pull request, and the existing CI/CD pipeline deploys the change.
Figure 5. The pull request is reviewed and merged through the standard GitHub workflow.
Responding to a production incident
With the feature live, Dynatrace continues monitoring the application. A marketing promotion then drives traffic above the observed baseline, and failed requests start to appear. The loop now runs from operations back to development.
Figure 6. Dynatrace detects a spike in failed requests, surfacing the production incident.
Bluebox collects the relevant observability and topology data, runs an initial root-cause analysis, then opens an autonomous investigation in AWS DevOps Agent. The AWS DevOps Agent multi-agent reasoning architecture decomposes the investigation across specialized capabilities that each examine one class of evidence: telemetry, logs, infrastructure configuration, and recent deployment activity.
Figure 7. Bluebox delegates an autonomous investigation to AWS DevOps Agent.
AWS DevOps Agent locates the cause in the DynamoDB table rather than the new cache. The table’s billing mode had been changed to PROVISIONED, with 5 read capacity units (RCU) and 5 write capacity units (WCU) and no auto scaling. The ElastiCache layer absorbs repeated reads, but cache misses and all writes still reach DynamoDB, and at promotion traffic that residual load exceeds 5 RCU and 5 WCU. AWS DevOps Agent produces a mitigation plan with specific remediation steps. This plan and the full investigation context from Bluebox, is documented as a GitHub issue.
Figure 8. GitHub issue is created with results from Bluebox and AWS DevOps Agent.
Kiro proposes a production-aware fix as a new pull request – including the root-cause analysis, supporting telemetry, and recommended configuration changes.
Figure 9. The Kiro coding session works on the GitHub issue and creates a remediation Pull Request.
The fix is reviewed, merged, and deployed like any other change. Dynatrace then confirms that error rates and response times return to baseline, which closes the loop.
Conclusion
In this post, we showed how Kiro, AWS DevOps Agent, and Bluebox by Dynatrace connect production telemetry with feature development and incident remediation. The travel-booking example keeps human review and existing CI/CD controls in the process while passing operational context from production back to development.
To get started pick one application and define a measurable outcome, such as investigation time, change-failure rate, or pull-request review time. Then:
Download Kiro and start building with spec-driven development
Last week, we brought together AWS Heroes from around the world to connect, collaborate, and celebrate the builders who go above and beyond for the AWS community.
The AWS Heroes Summit, an invite-only annual gathering, brings global experts specializing in fields like AI, serverless, and containers together for direct collaboration, technical deep-dives, and feedback sessions with internal AWS product and service teams.
Day 1 started with an inspiring fireside chat from AWS CEO Matt Garman. From an insightful AMA with James Hamilton on Day 2 to breakout sessions from various product teams that sparked new ideas, our AWS Heroes excelled at sharing knowledge, lifting each other up, and turning conversations into collaborations. To learn more, read the attendee feedback on LinkedIn.
Last week’s launches Here are some launches that got my attention:
Web Search on Amazon Bedrock: Amazon Bedrock now enables OpenAI models (GPT-5.4, GPT-5.5, and GPT-5.6 Sol/Terra/Luna) to browse and retrieve information from the internet, allowing AI applications to access up-to-date information beyond their training data. This capability opens new possibilities for building AI agents and applications that can answer questions using real-time web content while maintaining data residency within your secured AWS environment with zero data egress. To get started, visit the AI blog post and the Amazon Bedrock User Guide.
Vector search for Amazon DynamoDB: You can store and query vector embeddings alongside your existing data in DynamoDB without managing a separate vector database. DynamoDB already supports storing memory for AI agents, and with vector search you can now add semantic retrieval over that memory for agentic grounding, with predictable performance. To learn more, visit Esra’s blog post and Amazon DynamoDB Developer Guide.
Up to 3,000 Mbps for AWS Lambda function bandwidth: AWS Lambda functions now support increased network bandwidth, enabling data-intensive workloads and faster communication between Lambda functions and other AWS services. This feature enables functions outside a VPC that are configured with 2 GB of memory or more to access network bandwidth that scales proportionally, from 625 Mbps at 2 GB up to 3,000 Mbps at 10 GB.
For a full list of AWS announcements, be sure to keep an eye on the What’s New with AWS page.
Other AWS news Here are some additional projects and news items that you may find interesting:
Introducing Dogwood: Runtime Verification for AI Agents: AWS open-sourced Dogwood, a purpose-built governance language for AI agents to support Cedar policies and add temporal conditions. Powering Dogwood, Amazon Bedrock AgentCore introduced temporal policies whose decisions depend on the history of an agent’s actions within a session, not on the current request alone.
AWS supports Agent Plugins: An Open Standard for Portable Agent Extensions: AWS announced support for Agent Plugins, an open source, vendor-neutral specification that gives AI agent extensions a common packaging format so you can package an extension once and ship it to any client, including Kiro, VS Code, Cursor, or any tool that implements the spec.
Introducing Kiro Crew: Kiro Crew is a persistent, self-evolving workspace that keeps work moving, online or off, enabling collaborative multi-agent development workflows within the Kiro IDE. It’s built for engineering work that goes beyond a single chat session, and spans repos, tools, and days. You can run several efforts in parallel or hand work to subagents that report back, so nothing waits in line.
For a full list of AWS blog posts, be sure to keep an eye on the AWS Blogs page.
“A pull request comes back with a single comment: “This doesn’t follow our circuit breaker pattern. Check the Architectural Decision Record .”
You know the architecture decision record exists somewhere. You open your team’s wiki, search “circuit breaker,” scroll past six irrelevant results, find the document, read through it, switch back to your editor, and fix the code. Fifteen minutes are gone. Not because the problem was hard, but because the knowledge lived in one place and the code lived in another.
This plays out multiple times a day across engineering teams. Developers face several recurring challenges when working with organizational knowledge:
Context switching – Retrieving coding standards, API specs, or architecture decisions means leaving the editor to search wikis, shared drives, or documentation portals
Knowledge fragmentation – Team knowledge lives across multiple systems, making it difficult to find the right document at the right time
Onboarding friction – New team members spend days navigating unfamiliar documentation structures before becoming productive
Stale compliance – Code reviews catch standards violations after the fact, instead of surfacing the correct pattern during development
The documentation exists and is well structured. But it is not accessible from where development happens.
In this post, we show how to connect Amazon Bedrock Knowledge Bases to Kiro through the Model Context Protocol (MCP), enabling developers to query team documentation directly from their editor and get cited answers quickly. Kiro is an agentic IDE that uses MCP to connect developers to external knowledge sources beyond the local workspace. Whether you already have a Knowledge Base or are building one from scratch, setup typically takes a few minutes.
Why MCP with Knowledge Bases When Kiro Already Has Steering and Agent Skills
Kiro provides several built-in mechanisms to give context to the agent:
Steering files (.kiro/steering/*.md) deliver static instructions and project-level context. They can be included, conditionally matched by file pattern, or manually referenced. Ideal for coding standards, team conventions, and project-specific rules that fit in a few files.
Agent Skills (.kiro/skills/) offer reusable instructions that users activate to guide agent behavior for specific workflows like code reviews, testing strategies, or deployment procedures.
File references (#File, #Folder) provide explicit references to local workspace files for point-in-time context.
The MCP with Knowledge Bases approach is complementary, not a replacement. Use Steering for the ten rules every commit must follow. Use Agent Skills for workflow guidance. Use MCP with Knowledge Bases when your organization maintains hundreds of Architectural Decision Records, API specs, runbooks, security guidelines, and onboarding documents. No developer can internalize all of it. Semantic search surfaces the right answer at the right moment.
Together these serve distinct roles: Steering governs Kiro’s behavior, Knowledge Bases hold your organization’s collective knowledge, and MCP provides the connective layer that makes that knowledge accessible to Kiro on demand.
Solution overview
Amazon Bedrock Knowledge Bases has powered RAG workloads for multiple teams since well before Kiro launched. If your team already has a Knowledge Base, you have completed the foundational setup: documents curated, vectors indexed, knowledge layer built. What follows is a five-minute integration that brings all of it into the editor.
The question is not whether to start from scratch. It is simpler than that: how do you bring what you already have into Kiro?
In this integration, the awslabs.bedrock-kb-retrieval-mcp-server bridges the gap between Kiro and your Knowledge Base, translating natural language queries into vector search operations and returning cited passages directly in the editor.
The answer is a single configuration file and an MCP server that takes less than few minutes to connect.
The use cases that change daily workflows
Before we dive into the how, consider what becomes possible when your Knowledge Base lives inside your editor:
Coding standards enforcement in real time. A developer asks Kiro: “What’s our error handling pattern?” and gets back the exact custom error class structure your team agreed on six months ago, complete with the code snippet from your standards document. API specifications at your fingertips. Instead of opening a browser tab to check authentication requirements, a developer types: “What authentication does the Orders API require?” and immediately sees the JWT scope requirements, header format, and rate limits pulled directly from your OpenAPI spec stored in the Knowledge Base.
Architecture decisions with full context. When someone needs to understand why a decision was made, not just what was decided, they ask Kiro. The Architectural Decision Record comes back with the rationale, the alternatives considered, and the tradeoffs, all cited with source documents.
Kiro CLI in CI/CD. Run headless queries against your Knowledge Base in pipelines. Validate that generated code matches team patterns. Automate compliance checks against your security guidelines during pull request reviews.
Two paths: bring what you have or start fresh
You already have a Knowledge Base
If your team already uses Amazon Bedrock Knowledge Bases, whether it was built for a chatbot, an internal search tool, or a customer-facing assistant, you don’t need to rebuild anything. Your existing Knowledge Base works with Kiro out of the box.
Here’s the approach:
Tag your existing Knowledge Base withmcp-multirag-kb=true. This is how the MCP server discovers it.
Configure the MCP server in Kiro (covered in the next section). Your documents, your embeddings, your vector store, all stay exactly where they are.
The official awslabs.bedrock-kb-retrieval-mcp-server auto-discovers Knowledge Bases with that tag. If you have multiple Knowledge Bases (one for API docs, another for architecture decisions, a third for runbooks), tag them all. Kiro can query across your tagged Knowledge Bases.
You don’t have a Knowledge Base yet
If you’re starting fresh, the accompanying sample repository provides a complete AWS CDK application that deploys everything you need: an Amazon S3 bucket for your documents, an Amazon OpenSearch Serverless collection for vector search, and an Amazon Bedrock Knowledge Base that ties it together. The setup script handles deployment in few minutes.
For the full infrastructure deployment walkthrough, including CDK stack details, document ingestion, and monitoring setup, see the repository README. After the setup script completes, you see the following output confirming the deployment and providing next steps:
Figure 1: Setup script completion output. The script confirms the MCP config is ready, the Knowledge Base tag is set for auto-discovery, and provides sample queries to test immediately.
How it works
The Model Context Protocol (MCP) is what connects Kiro to your Knowledge Base. It acts as a bridge: Kiro connects via MCP on one side, Amazon Bedrock Knowledge Bases uses its Retrieve API on the other, and the MCP server translates between them.
When you ask Kiro a question, the following sequence occurs:
Developer asks a question – You type a natural language query in Kiro (IDE or CLI).
MCP request – Kiro sends your query to the MCP server running as a local child process over stdio.
Retrieve API call – The MCP server calls the Amazon Bedrock Knowledge Bases Retrieve API (not RetrieveAndGenerate).
Vector search – Amazon Bedrock embeds your query using Amazon Titan Text Embeddings v2 and searches the Amazon OpenSearch Serverless vector store.
Ranked chunks returned – The MCP server receives ranked document chunks with relevance scores and passes them back to Kiro.
Kiro generates the response – Kiro’s own LLM synthesizes the retrieved chunks into a cited answer and presents it directly in your editor.
The official MCP server handles retrieval only. Kiro handles the generation, which means the quality of the response benefits from Kiro’s full conversation context and reasoning capabilities.You get cited answers directly in your editor, no context switching required.
Prerequisites
You need the following to connect the MCP server to Kiro:
Replace <YOUR_REGION> with the region where your Knowledge Base lives.
– BEDROCK_KB_RERANKING_ENABLED controls whether the server applies Amazon Bedrock’s reranking model to re-score retrieved chunks by relevance before returning them. Set to “true” to enable reranking for higher-quality results at the cost of additional latency and reranking model charges. The default is “false”, which returns results ranked by vector similarity only.
– Note on permissions: Kiro inherits the same AWS permissions as the profile specified in AWS_PROFILE. The MCP server runs as your local process, so it uses your configured credentials directly. If your profile has broad permissions, Kiro can exercise all of them. For production Knowledge Bases, use a profile with least-privilege access – bedrock:Retrieve is sufficient for read-only queries.
Key settings:
command: “uvx” runs the server without installing anything permanently. It downloads, executes, and cleans up automatically.
KB_INCLUSION_TAG_KEY tells the server to auto-discover any Knowledge Bases tagged with mcp-multirag-kb=true.
autoApprove is empty by default. Add “ListKnowledgeBases” and “QueryKnowledgeBases” to skip confirmation prompts for read-only queries. Both tools are read-only — they retrieve data from your Knowledge Base without modifying it, so auto-approving them is appropriate for read-only workflows.
Restart Kiro. The MCP server connects and discovers your tagged Knowledge Bases automatically.
What this looks like in practice
Same pull request. Same reviewer comment about the circuit breaker pattern. But this time, you do not open a browser. You ask Kiro: "What's our circuit breaker pattern?" Kiro calls the MCP server, queries the Knowledge Base, and returns the result directly in your editor:
Figure 2: Kiro querying the Knowledge Base for the circuit breaker pattern. It calls ListKnowledgeBases to discover tagged Knowledge Bases, reads the local ADR file, and calls QueryKnowledgeBases to return the full parameter table from ADR-001 with source attribution.
The response includes the architecture decision record, the specific parameters (failure threshold, reset timeout, success threshold), and the source file reference. You fix your code quickly — no context switch, no browser tab, no searching.
Example: Querying API specifications
A developer types: "What authentication does the Orders API require?"
Kiro returns:
All requests require a valid JWT in the Authorization: Bearer <token> header. Tokens are issued by the Auth Service and must include the orders:read or orders:write scope.
 Source: api-spec-orders.md
Example: Discovering documentation gaps
A teammate asks Kiro: "What security headers should our APIs return?" The MCP server queries the Knowledge Base and returns the security guidelines document, which covers authentication, input validation, and secrets management — but does not mention HTTP response security headers. Kiro recognizes this gap in the retrieved content and, using its own workspace context (Kiro can read local files like security-guidelines.md independently of the MCP server), recommends the headers that should be added based on the existing security posture documented elsewhere.
Figure 3: Kiro querying security guidelines from the Knowledge Base. The MCP server returns the existing security posture (JWT handling, input validation, secrets management), and Kiro identifies the missing HTTP response security headers section, recommending additions based on the documented security context.
This illustrates how Kiro combines Knowledge Base retrieval with its native workspace awareness. The MCP server handles the retrieval; Kiro handles the reasoning across all available context.
The LangChain alternative: a cloud-agnostic approach with more control
The official MCP server covers most use cases. For advanced scenarios – provider portability (swap between Amazon Bedrock, OpenAI, or local models), server-side RAG with built-in relevance filtering, or custom LCEL chain composition, see the LangChain alternative section in the repository README. You can run both servers simultaneously. Kiro selects the right tool based on your query.
Figure 4: Both MCP servers running simultaneously. Kiro calls `ask_knowledge_base` on the LangChain server and `ListKnowledgeBases` on the official server in parallel, then falls back to `QueryKnowledgeBases` to retrieve the full security guidelines for API authentication from the kiro-dev-knowledge-base.
The quality of answers depends on the quality of your documents:
Write Markdown with clear headings. The 512-token chunking works best with self-contained sections under each heading.
Include code examples. Developers use returned snippets immediately. An error handling standard with a code sample is ten times more useful than one without.
Use consistent naming. If your API is called “Orders API” in one document and “Order Service” in another, retrieval suffers.
Keep documents current. Stale docs erode trust faster than missing docs. Set a quarterly review cadence.
Kiro CLI: Knowledge Base queries in your terminal and CI/CD
The same MCP configuration works for both Kiro IDE and Kiro CLI:
The --no-interactive runs without a session, and – --trust-tools=read auto-approves read-only tool calls (like QueryKnowledgeBases) without prompting. Headless mode requires the KIRO_API_KEY environment variable. To generate an API key, follow the steps in the Kiro Documentation.
Use headless mode in CI/CD pipelines to validate generated code against team standards, or in onboarding scripts that walk new developers through your architecture decisions.
Cleanup
The MCP server is an open-source tool; costs apply to the underlying AWS resources (Amazon OpenSearch Serverless, Amazon S3 storage, and Amazon Bedrock API calls). The primary ongoing cost is Amazon OpenSearch Serverless, which charges for OCU (OpenSearch Compute Unit) capacity even when idle. Amazon S3 storage and Amazon Bedrock API calls are pay-per-use. For detailed pricing, see the Amazon S3 Pricing page and Amazon Bedrock Pricing page. Destroy resources when you’re done experimenting:
cd kiro-bedrock-kb-mcp/infrastructure npx cdk destroy --all
In this blog post, we showed how to connect Amazon Bedrock Knowledge Bases to Kiro through MCP, turning organizational documentation into an in-editor knowledge assistant. This integration addresses the challenges outlined at the beginning of this post:
No more context switching – Developers query coding standards, API specs, and architecture decisions without leaving their editor
Unified knowledge access – A single MCP configuration connects to multiple Knowledge Bases, regardless of where the original documents live
Faster onboarding – New team members get cited answers to questions quickly, without navigating unfamiliar documentation systems
Proactive standards enforcement — Team standards surface during development rather than after a code review catches a violation.
Two paths to get started:
Existing Knowledge Base – Tag it with mcp-multirag-kb=true, add the MCP configuration to Kiro, and start querying after few minutes.
Starting fresh – Deploy the sample infrastructure using the repository, upload your team documents, and connect.
Your documentation already held the answers. Now developers get them quickly, without leaving their workflow.
Customers have access to models that are continuously getting better with each new generation bringing larger context windows, stronger reasoning, and lower token costs. Getting the strongest AI-powered security will come from tools that combine the most relevant models with deep knowledge of a customer’s specific environment.
AWS Continuum for code vulnerabilities (Preview) is built to be that tool to help secure your code at machine speed. Today, we’re announcing a partnership with Anthropic and OpenAI that extends AWS Continuum directly into the developer workflows where code is being written: Anthropic Claude Code, OpenAI Codex, and Kiro. Developers can use these integrations to discover vulnerabilities, contextually prioritize, validate, and remediate, within their existing workflows.
Models are getting smarter
AI models are advancing rapidly. Each generation brings new capabilities, and different models excel at different tasks. The latest frontier models can now identify vulnerabilities and reason through multi-step attack paths that would take a human security team weeks to trace manually.
This is a genuine breakthrough in detection, but it creates a new challenge for your security teams: more findings, more complexity, and the need to determine which ones matter most in your environment and how to address them. The next challenge customers face is building the correct harness and orchestration to turn these models into a single interface that goes from detection through remediation. This is what we set out to do when creating Continuum, which brings together many different models and uses the model that’s most effective for each part of the process.
We also partner with the Frontier Model Forum, an industry consortium developing shared safety standards, evaluation methods, and benchmarking to ensure we can evaluate these models effectively together. We’re also working with model providers on shared security performance benchmarking to make sure we’re using the best model for each task within Continuum and our other AWS security products.
The harness
An AI harness is the orchestration layer that wraps around a model to connect it to tools, guardrails, memory, and workflows, so it delivers outcomes. Think of the model as the engine and the harness as everything around it. You need both to have a high-performance car.
Harnesses are becoming increasingly complex. Teams are stitching together multiple models, agents that call agents, and dynamic workflows, and are dealing with constant change driven by innovations in models, agent frameworks, and tool integrations.
As a result of that complexity, customers are implementing shadow infrastructure to manage integration layers across models and tools. Every time the landscape shifts, security and governance controls potentially break, forcing teams to go back to revisit them and make updates.
These challenges extend beyond the model. They arise in the orchestration required to connect different models and developer environments with tools, context, controls, and workflows across a customer’s environment. At AWS, we see managing that complexity as heavy lifting that AWS should solve. We treat the harness as infrastructure and with the same rigor we apply to identity, discovery, policy enforcement, observability, and compliance of the core infrastructure at AWS.
Enter Continuum
AWS Continuum for code vulnerabilities discovers vulnerabilities, prioritizes them within the context of a customer’s business, validates them in a sandbox, and provides remediation at machine speed. Under the hood, Continuum is an agent-team loop architecture. A sophisticated harness that orchestrates all of it: selecting the right model, connecting to a customer environment, and delivering secure code that’s been validated in context. You never need to think about how the orchestration works, or what changed in the latest release.
Anthropic and OpenAI partnerships
Today we’re announcing partnerships with Anthropic and OpenAI to bring Continuum into the developer workflows where code is being written.
How it works:
Within Claude Code, Codex, and Kiro coding environments, on-demand vulnerability scans identify potential issues and send findings to Continuum. Continuum prioritizes them within the context of the customer’s AWS environment (configurations, AWS Identity and Access Management (IAM) policies, network topology, and exposure surfaces) and validates them in a sandbox. It then returns prioritized, contextual intelligence back to the coding assistant, which adjusts its recommendations accordingly.
This collapses what was traditionally a multi-step, multi-team process (write, scan, triage, prioritize, fix, rescan) into a single outcome: the code suggestion itself. Two modes, one outcome:
For existing code: Use Continuum for code vulnerabilities from AWS to discover, prioritize, validate, and remediate across your environment.
For greenfield code: Use the Continuum plugin within Codex, Claude Code, or Kiro to get security-validated suggestions in your development environment.
Early design partners are already seeing results.
“AWS Continuum connects source code with enterprise knowledge, allowing teams to accurately pinpoint security vulnerabilities and verify that flagged issues are truly meaningful. This shortens what really matters: timeline to fix serious vulnerabilities.” – Mike Johnson, CISO, Rivian
Next
AWS Continuum for code vulnerabilities is available in preview through AWS. Sign up to request access at AWS Continuum.
Continuum integrated into Claude Code, Codex, and Kiro workflows are coming soon.
If you have feedback about this post, submit comments in the Comments section below.
AI coding agents are part of the developer toolchain. Tools like Kiro and Claude Code generate features, tests, and code refactors from natural-language prompts. A single agent can open dozens of pull requests (PRs) across your repositories in an afternoon. That productivity comes with a trade-off: agents optimize for task completion at machine speed with no understanding of your organization’s risk.
Through protocols like the Model Context Protocol (MCP), agents also reach beyond the integrated development environment (IDE) to call APIs, query databases, and modify infrastructure and even entire environments, expanding the scope of resources your application security team defends.
This post lays out an application security (AppSec) control framework for AI coding agents. Two pillars organize the framework: author-time controls shape what the agent produces in the IDE; build-time controls verify and gate what reaches production. Your existing secure software development lifecycle (SDLC) controls still apply and are critical to a defense-in-depth security strategy. The framework shows where to layer additional guardrails so AppSec scales with agent-driven development. The framework is tool-agnostic and cloud-agnostic. Throughout, we use AWS services—Kiro in the IDE and AWS CodePipeline in the build—as a running example that you can adapt to your own toolchain.
Risks
Each of the following risks includes a treatment summary. The control framework section later in this post provides implementation details. The risks are ordered by severity with the highest impact risks first.
R001. Prompt and context injection
Agents read untrusted content, such as issue descriptions, web pages, MCP responses, and README files in third-party packages. Text from outside parties can redirect the agent to disclose secrets, open unauthorized PRs, or invoke tools without user consent. This risk, known as prompt injection, is the top risk in the OWASP Top 10 for LLM Applications. Any agent that reads content from outside parties is exposed, with or without MCP, so connecting tools widens the scope of impact.
Treatment: Treat non-developer input as untrusted. A large language model (LLM) can’t reliably separate instructions from data in a single context window, so architect for it: keep the agent that orchestrates trusted actions separate from the one exposed to untrusted content and grant the exposed agent only read-only, least-privilege access. Require human approval for irreversible actions. Use version-control steering files to prevent silent tampering.
R002. Inadvertent data disclosure and overly permissive configurations
Agents optimize for getting work done. Left unchecked, the code they generate can default to wildcard identity and access management policies, open security groups, and unencrypted storage, or embed sensitive values in code rather than referencing a secrets manager. Most coding agents now include safety mechanisms that make these outcomes less likely, but they remain imperfect, so you still need controls to account for the possibility.
Treatment: Security requirements in a steering document, plus policy-as-code scanning (Checkov, cfn-nag) in the IDE and pipeline. See Context as a security control.
R003. Uncontrolled changes reaching production
Ungated code reaching production isn’t new, but AI agents amplify it. Machine-speed generation can propagate a flawed pattern across repositories before it’s identified.
Treatment: Branch protection rules requiring PR approval (a human-in-the-loop checkpoint), pre-commit hooks for security checks, and sandboxed agent runs that prevent direct pushes to protected branches. The right balance between human review and automated speed depends on the risk profile of the change. For many low-risk paths, automated checks alone might suffice, while higher-risk changes warrant a human checkpoint.
R004. Supply chain risks
Agents don’t always distinguish current best practices from outdated patterns. They might recommend deprecated packages, reference library versions with new Common Vulnerabilities and Exposures (CVEs), and hallucinate package names that don’t exist, which can introduce risks of dependency confusion issues.
Treatment: Software Composition Analysis (SCA) in the pipeline (for example, Amazon Inspector code scanning or Dependabot) to flag vulnerable or unexpected dependencies. For additional control, resolve against a scoped registry like AWS CodeArtifact. Even without a fully curated registry, lockfile validation and allow-listing critical packages reduce exposure.
R005. Uncontrolled external access
Through MCP and tool integrations, agents query databases, call APIs, and modify infrastructure. Without constraints on which tools and data an agent can reach, a single misconfigured integration provides unintended access to sensitive resources.
Treatment: Scope MCP servers to least-privilege tools and resources, enforce authn or authz on external connections, and audit tool invocations. The control point is the configuration file. Review it the same way you review AWS Identity and Access Management (IAM) policies.
R006. Hallucinations and incorrect code
Agents produce plausible-looking output. Code that compiles, passes linting, and looks reasonable can still be functionally wrong: misusing APIs, introducing subtle logic errors, or implementing security-sensitive operations incorrectly. Code that passes continuous integration (CI) but is wrong slips through review; code that fails to build is caught immediately.
Treatment: Layer deterministic verification (static application security testing (SAST), unit tests) with non-deterministic review (LLM-assisted screening against the specification). Neither catches everything alone.
R007. Scope creep
Given a bug-fix prompt, an agent might also refactor surrounding code, disable an unreliable test, or reorganize imports. Unrequested changes introduce regressions and complicate review.
Treatment: A reviewed specification document that defines what must change and what must not, paired with a targeted review of the proposed changes. See Specifications as scope boundaries.
The preceding risks share a common thread: agents produce output faster than humans can review it, and they lack context to self-correct.
The following framework addresses this gap. It organizes controls into two pillars: author-time (pre-generation and post-generation of code) and build-time (in the pipeline, before code reaches production). Author-time controls shape what the agent produces. Build-time controls verify it. Neither is sufficient alone; together they reduce the volume and severity of issues that reach human reviewers.
Deterministic compared to non-deterministic mitigations
Deterministic mitigations[D] produce the same result every time. Linters, SAST scanners, secrets detection, and policy-as-code match patterns against rules and define security invariants: no critical findings, no hardcoded secrets, and no wildcard IAM policies. Use them when the condition can be expressed as a rule. Organizations already have these and must continue enforcing them.
Non-deterministic mitigations [ND] use model judgment. They include steering documents, LLM-as-judge review, specification compliance checks, and scope-creep detection, and they evaluate intent rather than patterns. They catch novel issues that rules miss, but are probabilistic. Use them when evaluation requires context or reasoning across files. This is the new layer that AI-generated code demands, because agents produce code that can pass every deterministic check yet remain functionally wrong.
Human review[H] provides the final layer for the risk-based decisions neither tool type can make. Apply it where judgment is needed, not everywhere: routing every change to a person invites consent fatigue, where reviewers approve by reflex and the control loses its value. The default reflex is to route everything back to a human, but that isn’t always the right response—reserve human judgment for the decisions that genuinely need it.
The control framework
The framework organizes controls into two pillars. Author-time controls (Pillar 1) shape what the agent produces in the IDE, before code is generated and just after. Build-time controls (Pillar 2) verify and gate that output in the pipeline, before it reaches production. The controls within each pillar are tagged deterministic [D], non-deterministic [ND], or human [H].
Pillar 1: Author-time controls (pre- and post-generation of code)
Author-time controls work inside the IDE, where the developer and agent still hold full context. They shape the prompt and the generated output before it ever reaches a pull request. The following controls apply at this stage.
Context as a security control [ND]
Control statement: Encode security invariants as natural-language constraints in a steering document that every developer environment consumes at session start. Addresses R002. Many AI coding agent risks share one root cause: the agent lacks the security context an experienced developer carries implicitly. Your security team sets the policies, such as Amazon Simple Storage Service (Amazon S3) buckets require encryption, API gateways require mutual TLS, and credentials must come from AWS Secrets Manager. Developers don’t always have these requirements available when they’re building. They build what works, not what’s compliant. An AI agent amplifies this gap because it defaults to whatever pattern dominated its training data, with no awareness of your organization’s security posture.
A key mitigation is steering. Security teams write these invariants once as natural-language guidance in a steering document, then distribute them as shareable resources that developers consume in their IDE. The agent loads the file at session start and treats the contents as standing requirements:
IAM policies must follow least-privilege principles; no wildcard Amazon Resource Names (ARNs).
No hardcoded credentials in source code; use a secrets manager.
Security groups must not allow unrestricted inbound access.
This shifts security left, before code generation begins. Steering biases generation toward secure defaults; it doesn’t guarantee them. Treat it as a strong default, paired with the following deterministic gates that block non-compliant code from merging. Security teams define the rules once and every developer environment inherits them automatically. Steering reduces the volume of issues that reach the pipeline, though it doesn’t replace downstream scanning.
How to write effective steering rules: Keep each rule specific and testable, scope it to a concrete risk class, keep the rule set concise so the agent can hold it in context, and iterate from the issues your scanners and reviewers surface.
Specifications as scope boundaries [ND]
Control statement: Require a reviewed specification before code generation begins. Define what must change and what must not. Addresses R007.
Spec-driven workflows turn vague prompts into reviewable specifications before code is generated. This creates a human checkpoint at the design phase, where security decisions are made:
Requirements use testable notation that’s auditable before the agent writes a line of code. For example, the Easy Approach to Requirements Syntax (EARS): WHEN [condition] THE SYSTEM SHALL [behavior].
Tasks are ordered in implementation steps, each mapped back to a requirement.
For bug fixes, specifications add a critical element: unchanged behavior documentation. This is an explicit list of behaviors that must continue working, giving the agent a written boundary against scope creep.
In this model, the specification becomes the primary artifact, code is a derivative of it. Human review effort concentrates on whether the specification solves the right problem with the right constraints, not on reading implementation diffs line by line.
Controlled tool access using MCP [D + ND]
Control statement: Scope each MCP server to the minimum set of tools the agent needs, and give it a dedicated, scoped-down credential rather than the developer’s own. Maintain an allowlist of reviewed MCP servers. Addresses R005.
MCP servers act as controlled gateways between the agent, the external tools, and data:
Dependency management – An MCP server fronting your private package registry resolves dependencies against curated packages, not the public internet. This is a deterministic constraint on supply chain risk.
Infrastructure tooling – Visibility into current resource configurations prevents templates that conflict with existing infrastructure.
Scoped permissions – Each MCP server exposes a defined set of tools and resources. You choose exactly what the agent can access, supporting least-privilege at the integration layer. You supply that credential through the agent’s configuration (in Kiro, the env block of .kiro/settings/mcp.json). Avoid autoApprove: ["*"], which removes the human approval prompt on every tool call.
IDE code scanning [D]
Control statement: Run real-time static analysis in the IDE so security issues surface while the developer (and agent) still have full context. Addresses R002, R006.
Real-time diagnostics catch syntax errors, type mismatches, and configuration issues as the developer types. A malformed IAM policy is flagged before the agent builds further on it. Security-focused extensions (ESLint security plugins, Checkov, SAST) layer on top for immediate feedback while code is fresh in context.
Hooks: Automated guardrails at the point of action [D + ND]
Control statement: Attach deterministic checks to file-save events and non-deterministic verification to task-completion events. Addresses R002, R007.
Shell command hooks [D] – Triggered on file save, these run a linter, formatter, or security scanner and produce the same result every time. They enforce hard rules.
AI-powered hooks [ND] – Triggered on task completion. These prompt the agent to verify that the implementation matches the specification and check for any untested edge cases or files that were modified outside the task’s scope.
Pillar 2: Build-time controls (in the pipeline)
Build-time controls run in the pipeline after code is committed and before it reaches production. They verify and gate what the agent produced, catching what author-time controls did not. The following controls apply at this stage.
Layered security scanning [D]
Control statement: Run secrets detection, static analysis, dependency scanning, and infrastructure-as-code scanning in sequence. Fail the build on any critical finding. Addresses R002, R003, R004.
Secrets detection runs first because it’s cheapest and addresses a high-severity class of issue. It scans for hardcoded API keys, database connection strings, and credentials that AI agents might inadvertently include.
SAST scans source code for injection issues, insecure deserialization, and resource leaks. Custom rules can target AI-specific anti-patterns including overly broad exception handling, deprecated APIs, placeholder credentials, dynamic code execution through eval().
Software Composition Analysis (SCA) identifies known CVEs in dependencies. This is critical for AI-generated code, which might reference deprecated packages or hallucinate package names that open you to dependency confusion issues.
Infrastructure as code (IaC) scanning validates AWS CloudFormation, Terraform, and AWS Cloud Development Kit (AWS CDK) templates against security policies before deployment. Catches overly permissive IAM roles, unencrypted storage, and public-facing resources the agent created.
Each stage halts the pipeline on failure. Results export to a standard format (Static Analysis Results Interchange Format (SARIF)) for compliance auditing and flow downstream to human reviewers. The open source Automated Security Helper (ASH) bundles secrets, SAST, SCA, and IaC scanners behind one command that you can run locally and in AWS CodeBuild, emitting SARIF for the gates that follow.
Quality gates [D]
Control statement: Define pass/fail thresholds for each scan type. Block deployment on any critical or high-severity finding. Addresses R003.
Quality gates convert scan results into go/no-go decisions. Define thresholds for each severity: block on critical findings, require justification for highs, and track mediums. The gate is deterministic: if a threshold is breached, the pipeline stops. Exceptions require documented approval.
Differentiate blocking compared to advisory modes: hard failures on main, advisory on feature branches. Avoid gates becoming a friction that teams route around.
AI-assisted review [ND]
Control statement: Use an LLM reviewer to pre-screen every pull request for specification compliance, scope creep, and security anti-patterns before human review. Addresses R001, R006, R007.
Specification compliance – Does the implementation match the requirements document?
Scope verification – Were files modified outside the task’s stated scope?
Security pattern review – Are there logic errors, misused APIs, or insecure patterns that pass SAST but violate intent?
This pre-screening focuses human reviewer attention on genuine risks rather than formatting or obvious issues. On AWS, AWS Security Agent (code review in preview at publication) checks pull requests against AWS-managed and custom security requirements. The reviewer screens and surfaces findings; the merge decision stays with a human.
A critical principle: the agent that wrote the code should not be the agent that reviews it. A separate session helps avoid self-confirmation bias, but a separate session alone doesn’t always avoid the generator’s blind spots, because two sessions of the same model can share them. Where practical, use a different model for review so the reviewer is less likely to inherit the same systematic weaknesses.
Human-in-the-loop review [ND + H]
Control statement: Require human approval on most pull requests, especially those touching security-sensitive or high-blast-radius code. Lower-risk changes might be eligible for agent-assisted or fully automated approval as tooling matures. Provide reviewers with scan results, LLM pre-screening output, and specification context to enable fast, informed decisions. Addresses R003.
Scale review depth to the risk of the change. Low-risk or boilerplate changes can take a lighter-touch review, while security-sensitive or novel-logic changes warrant mandatory deep review and a second reviewer.
Scanners catch known patterns but can’t judge whether code implements the intended business logic. Human review also serves to calibrate trust: teams build intuition about where agents excel (boilerplate, test writing) and where they’ve tended to struggle (novel business logic, security-sensitive operations), recognizing that this frontier shifts as models improve.
Place two approval gates: after security scans (reviewer focuses on correctness and business logic, with scan results as context) and before production deployment (final sign-off after integration testing). Treat human review as a secondary control, not a guarantee: reviewers are themselves non-deterministic and can miss issues, so human review layers on top of the deterministic gates rather than replacing them.
Putting the framework into practice on AWS
The framework is tool-agnostic, but AWS gives you building blocks for each pillar. The following services map directly to the controls described previously: Kiro for author-time guardrails, and CodeBuild and CodePipeline for build-time gates.
Kiro: Structured AI development
Kiro maps to Pillar 1: It puts the author-time controls in the IDE, where the developer and agent still share full context. Each feature in the following list implements one of those controls, configured in-repo under .kiro/ so the guardrails are version-controlled and shared across the team rather than set per developer.
Steering documents – Markdown files in .kiro/steering/ load into the agent’s context at session start. Conditional inclusion using fileMatch (for example, ["**/*.tf"]) loads IaC-specific rules only when relevant.
Specification-driven workflows – Three-phase specifications (requirements in EARS, design, and tasks) with review checkpoints. Bug-fix specifications capture unchanged behavior explicitly.
Agent hooks – Triggered on file save, tool invocation, or task completion. Shell hooks run deterministic checks (linters, tests); Ask Kiro hooks run AI prompts for non-deterministic review. For example, a security pre-commit scanner hook can flag hardcoded credentials when the agent finishes a task.
Property-based testing – Guided by a specification or hook, Kiro can generate property-based tests (for example, using the hypothesis library) that exercise hundreds of randomized inputs, probing edge cases a hand-written test suite would miss.
MCP integrations – Connect Kiro to private package registries, internal docs, issue trackers, and infrastructure tooling, creating the controlled tool access pattern.
AWS CodeBuild and AWS CodePipeline: Pipeline controls
CodeBuild runs each scanning tool (checking for secrets, SAST, SCA, and IaC) as a build action. A non-zero exit code fails the action, and the stage halts or rolls back according to its OnFailure setting. Findings export as SARIF to Amazon S3 for compliance, and CodePipeline action variables pass results to downstream approval actions.
CodeBuild exit codes halt the pipeline on scan failures
AWS Lambda invoke actions evaluate scan results against configurable thresholds and return pass/fail decisions
Manual approval actions halt the pipeline, send Amazon Simple Notification Service (Amazon SNS) notifications, and link to review artifacts; decisions and reviewer identity are logged for audit
The following table consolidates the framework into a single view that includes each stage of the SDLC and the deterministic [D] and non-deterministic [ND] controls that apply there. Every stage carries both, a reminder that neither control type is sufficient on its own.
Full security scan suite, integration tests, and policy-as-code
AI-assisted review for human approvers
Post-deploy
Runtime monitoring and anomaly detection
AI-powered incident triage
Conclusion
This post laid out a framework for adopting AI coding agents at machine speed without letting unreviewed risk reach production. It layers guardrails at two points:
Author-time controls – Steering, specs, and scoped tools shape what the agent generates in the IDE.
Build-time controls – Scanning, quality gates, and layered review verify it before it reaches production.
No single layer is enough: deterministic gates enforce hard rules, non-deterministic review catches what they miss, and human judgment is reserved for the decisions that need it. Together, they let AppSec scale with agent-driven development.
Where to start this week:
Start with steering and specs – Encode security requirements as steering and use specifications for new features. Highest impact, lowest effort. For a ready-made starting set, the open source Project CodeGuard (a Coalition for Secure AI project under OASIS Open, of which Amazon is a contributing member) publishes reusable steering rules for common risk classes—hardcoded credentials, IaC misconfiguration, supply chain, and MCP security—that you can adapt to your AWS environment.
Add deterministic pipeline gates – Integrate SAST, SCA, and secrets detection. Table-stakes regardless of AI usage.
Calibrate and iterate – Review what controls catch, adjust steering for recurring issues, and expand agent autonomy as trust builds.
Accountability – Developers remain accountable for the security of what they ship. AI agents accelerate development; they don’t transfer ownership.
Last week, my team visited Seoul to meet AWS Korea User Group (AWSKRUG) leaders. AWSKRUG is the largest cloud developer community in Korea, with 20 meetup groups organized by topic and area that collectively host over 100 events each year, primarily in Seoul.
My team regularly visits countries across the Asia-Pacific region, listens to feedback from user group leaders, and works to support their communities. At this meeting, leaders honestly shared what they did well in the first half of the year, what needs improvement, and what they asked of AWS Developer Experience team. We also enjoyed a pleasant conversation during our Chimaek time together.
Now, let’s take a closer look at key launches of last week.
A one-click Lambda setup prompt for coding agents caught my eye most last week. This prompt configures your agent with AWS Serverless skills and the Serverless Model Context Protocol (MCP) server, embedding serverless best practices from the start. This prompt references the Lambda agent setup guide, which includes installation commands for Claude Code, Kiro, Cursor, GitHub Copilot, Codex, Devin Desktop, and OpenCode.
To get started, choose the Copy agent prompt button on the Lambda console screen or copy fetch https://docs.aws.amazon.com/lambda/latest/dg/samples/aws-lambda-agent-setup.md directly, and paste this URL in your preferred AI agent.
You can also use Agent Toolkit for AWS to give your coding agent current AWS knowledge and safe resource access. Use fetch https://raw.githubusercontent.com/aws/agent-toolkit-for-aws/refs/heads/main/setup-instructions/setup.md for installing AWS MCP Server.
Last week’s launches Here are last week’s launches that caught my attention:
OpenAI GPT-5.6 Sol, Terra, and Luna on Amazon Bedrock: You can use the smartest family of models from OpenAI yet on Bedrock’s next-generation inference engine built for high performance, security, and reliability. The three models span capability tiers from flagship reasoning (Sol) to balanced performance (Terra) to fast, cost-efficient inference (Luna), all accessible through the Responses API on Amazon Bedrock.
Same-day transitions to Amazon S3 Standard-IA and S3 One Zone-IA: You can now transition objects to S3 Standard-Infrequent Access (S3 Standard-IA) and S3 One Zone-Infrequent Access (S3 One Zone-IA) as soon as the day they are created, without the previous 30-day minimum retention period in S3 Standard. These storage classes offer up to 40% lower storage costs than S3 Standard while still providing millisecond access when needed, making them ideal for backups, log analytics, and compliance workloads where data becomes cold within hours or days.
Self-managed code storage on AWS Lambda: With self-managed Amazon S3 buckets for code storage, you can reference source code directly from your own S3 buckets without Lambda creating intermediate copies. This eliminates code storage limits and reduces function activation time after function creates and updates by removing the copy step.
Importing users with password hashes on Amazon Cognito: You can now import users with password hashes in CSV user imports. Previously, imported users had to reset their passwords on first sign-in. Now, you can include password hashes in the CSV import, enabling users to sign in immediately with their existing credentials. When creating a CSV import, you specify the password hashing algorithm used by your source system.
For a full list of AWS announcements, be sure to keep an eye on the What’s New with AWS page.
Additional updates Here are some additional news items that you might find interesting:
Open Protocols with the Strands Agents SDK: Learn how open AI protocols such as MCP, A2A, UTCP, AG-UI, and x402 work together using Strands Agents SDK for building AI agents as an example implementation, though the patterns apply to any agent framework.
Open source Bulk Executor for Amazon DynamoDB: Performing bulk operations against all items in a DynamoDB table has historically required custom coding. The Bulk Executor for DynamoDB simplifies bulk tasks like these. You can use this feature to invoke commands like count, find, delete, or update. No coding is required, even when running at large scale.
Transform AWS Support Case Workflows with Kiro CLI: Explore how Kiro CLI’s MCP integration accelerates support case workflows by combining investigation, documentation lookup, and case creation into a single conversational interface across three real-world scenarios: AWS Glue job failures, AWS Lambda cold start investigation, and AWS WAF false positive analysis.
For a full list of AWS blog posts, be sure to keep an eye on the AWS Blogs page.
Finally, some customers experienced an issue with Cost Explorer displaying inaccurate estimated billing data in last weekend. They may have received erroneous budget and cost anomaly detection alerts, and observed inflated estimated cost and usage data. The issue has been resolved, and all AWS services are operating normally. We apologize for the concern this incident caused our customers and are conducting a thorough retrospective to prevent events like this from reoccurring, as well as improving our response when billing incidents occur. For more information, visit the AWS Health Dashboard.
That’s all for this week. Check back next Monday for another Weekly Roundup!
Automated incident remediation – turning investigation findings into deployed fixes without manual toil – is the next frontier for operations teams running distributed workloads on AWS. Today, when an incident fires at 2 AM, the on-call engineer must correlate telemetry across Amazon CloudWatch, deployment pipelines, and application logs, then manually write and deploy a fix – a process that routinely takes hours. AWS DevOps Agent addresses the first half by autonomously investigating incidents, identifying root causes, and generating mitigation plans in minutes. During preview, customers and partners reported up to 75% lower MTTR, 80% faster investigations, and 94% root cause accuracy.
But investigation and mitigation recommendations are only half the story. Someone still has to read the findings, write the fix, test it, and deploy it. What if that second half could be automated too?
In a previous post, Leverage Agentic AI for Autonomous Incident Response with AWS DevOps Agent, we demonstrated how to configure AWS DevOps Agent to monitor your applications, trigger autonomous investigations, and follow best practices for production deployments. We also published this code sample which demonstrates how investigations could be wired to be triggered automatically when a Amazon CloudWatch alarm is raised. These two articles now allow you to trigger AWS DevOps Agent investigation on a Amazon CloudWatch alarm and produce a mitigation plan.
In this post, we demonstrate how to integrate AWS DevOps Agent mitigation plan output with Kiro CLI – running in headless mode on AWS CodeBuild – to close the remediation loop end-to-end. When AWS DevOps Agent completes a mitigation analysis, an event-driven pipeline automatically routes the findings to Kiro CLI, which applies the fix to your codebase, creates a pull request for human review, and triggers deployment upon approval. The result: L1/L2 incidents go from detection to deployed fix with minimal manual intervention – the only human touchpoint is the pull request approval.
We walk through the complete solution using a sample CloudFormation application, including the infrastructure code, anomaly generation scripts, event routing, and the Kiro CLI steering configuration that makes it all work. All source code is available in the accompanying aws-samples repository.
Solution Overview
Consider a typical web application running on AWS — a frontend behind an Application Load Balancer, backend compute on Amazon EC2, and an Amazon RDS database, with source code and CloudFormation templates in AWS CodeCommit. When something goes wrong in this environment, the solution chains two AWS frontier agents —AWS DevOps Agent for autonomous investigation and mitigation, and Kiro CLI for automated code remediation — through a fully serverless event-driven bridge to take the application from incident to deployed fix.
Fig 1 – Solution architecture
How it works
An incident occurs – Your application experiences an issue – high CPU utilization, elevated error rates, slow response times. Amazon CloudWatch alarms fire.
DevOps Agent investigates – AWS DevOps Agent, which has your application onboarded into an Agent Space, autonomously correlates metrics, logs, and deployment history to identify root cause and generate a mitigation plan.
EventBridge routes the signal – An Amazon EventBridge rule captures Mitigation Completed events (source: aws.aidevops) and invokes a AWS Lambda function.
Lambda extracts and queues – The AWS Lambda function calls the AWS DevOps Agent API to retrieve the mitigation summary and execution plan, then publishes the payload to Amazon SQS queue.
CodeBuild runs Kiro CLI – When a message arrives in the Amazon SQS queue, a AWS Lambda function with an SQS event source mapping triggers a AWS CodeBuild execution, passing the message content as an environment variable. AWS CodeBuild runs Kiro CLI in headless mode (–no-interactive –trust-tools=read,write,grep,shell), using the mitigation payload as a remediation prompt.
Kiro CLI applies the fix – Guided by a steering file that describes the repository structure and remediation conventions, Kiro CLI modifies the CloudFormation template or application code, commits to a feature branch, and creates a pull request.
Human approves, pipeline deploys – A developer reviews the pull request. Upon approval and merge, the associated deployment pipeline gets triggered to execute the change.
The sample repository pushed to your account’s AWS CodeCommit repository
Once completed, follow along the Readme file to setup the components which allow you to implement and execute the above architecture. The sections below provide an explanation of the components that have been built to support the architecture.
Capturing mitigation events
AWS DevOps Agent publishes lifecycle events to the Amazon EventBridge default event bus whenever an investigation or mitigation changes state. Each event uses the source aws.aidevops and a detail-type that identifies the specific like Mitigation Completed, Investigation Completed, or Mitigation Failed. The post focuses on a single signal: the moment a mitigation finishes successfully.
EventBridge rule and Lambda extraction
An Amazon EventBridge rule matching the Mitigation Completed detail-type invokes a AWS Lambda function. The event payload contains metadata (agent_space_id, task_id, and execution_id) which allows the AWS Lambda function to call the AWS DevOps Agent and extracts two key objects: the mitigation summary (what action to take and why) and the execution plan (step-by-step instructions). It publishes this structured payload to an Amazon SQS queue for downstream processing.
Headless remediation with Kiro CLI
With mitigation payloads landing in the Amazon SQS queue, we need a compute environment that can check out the application and infrastructure repository, run Kiro CLI agent against the codebase, and push changes back. AWS CodeBuild is a natural fit — it provides on-demand compute, integrates natively with AWS CodeCommit and requires no persistent infrastructure.
Kiro CLI 2.0 introduced headless mode, which allows it to run programmatically in deployment pipelines without an interactive terminal. You authenticate with an API key (stored in AWS Secrets Manager), pass a prompt, and Kiro CLI executes end-to-end — same tools, same agents, same capabilities as the interactive experience.
How CodeBuild orchestrates the fix
When a message arrives in the Amazon SQS queue, a trigger AWS Lambda function starts a AWS CodeBuild execution, passing the Amazon SQS message body as an environment variable. The AWS CodeBuild buildspec follows a straightforward sequence:
Install : Installs Kiro CLI and configures the environment. The KIRO_API_KEY is pulled automatically from AWS Secrets Manager ,never hardcoded.
Generate prompt: A Python script converts the structured mitigation payload into a natural-language remediation prompt. It inspects the content to classify whether the change targets infrastructure (or application code, then generates a focused prompt with the action, reasoning, and specific instructions.
Create feature branch : Checks out a new branch named after the agent space and execution IDs for traceability.
Run Kiro CLI : Invokes Kiro CLI chat –no-interactive –trust-tools=read,write,grep,shell with the generated prompt. The –trust-tools flag auto-approves specific tool categories following least-privilege, since there is no human to confirm.
Validate and commit : Guardrails check the changes: file count limits, protected file detection, Python syntax validation (py_compile), and YAML linting. If all checks pass, the changes are committed and pushed.
Create pull request : Creates an AWS CodeCommit pull request with the mitigation action as the title and the AWS DevOps Agent reasoning in the description.
The steering file
What makes Kiro CLI effective at remediation – rather than just generating generic code – is the steering file. Steering gives Kiro persistent knowledge about your project: repository structure, coding conventions, and decision frameworks.
For this solution, the steering file serves as the guardrails for automated remediation. It defines:
Repository structure – Maps each directory to its purpose.
Decision framework – Rules for classifying changes as infrastructure vs. application.
Scope constraints – Maximum 3 files per remediation, no new files, no new dependencies, no deletions.
Protected files – The buildspec, infrastructure pipeline templates, bridge code, and steering files themselves are explicitly off-limits.
Fail-safe – If the prompt is ambiguous or Kiro cannot determine what to change, it makes no changes rather than guessing.
This steering file is committed to the repository, so every AWS CodeBuild execution picks it up automatically. It ensures Kiro CLI makes targeted, predictable changes rather than broad refactors.
From pull request to deployment
At this point, the automated pipeline has done its work – Kiro CLI has analyzed the mitigation plan, modified the appropriate files, and created a pull request on a feature branch. The pull request description includes what was changed, why (directly from the AWS DevOps Agent’s reasoning), and the agent space and execution IDs for full traceability back to the original incident.
This is where the human-in-the-loop gate comes in. A developer reviews the pull request -verifying that the change is correct, scoped appropriately, and safe to deploy. This approval step is deliberate: while we trust the agents to investigate, analyze, and propose fixes, a human makes the final deployment decision.
Once the pull request is approved and merged into the main branch, the deployment pipelines implement the approved changes in the target environment.
The entire cycle – from CloudWatch alarm to deployed fix – completes in minutes rather than hours, with the only manual step being the pull request review. For organizations handling high volumes of L1/L2 incidents, this translates directly into reduced operational toil and faster recovery.
Cleanup
To avoid ongoing charges, remove the resources created during this walkthrough. Refer to the Readme for the complete teardown sequence.
Conclusion
In this post, we demonstrated how to integrate AWS DevOps Agent mitigation outputs with [1] Kiro CLI to build a closed-loop incident remediation pipeline. By connecting these two frontiers agents’ operations teams can go from incident detection to deployed fix with a single human touchpoint: the pull request approval.
This approach delivers measurable impact for enterprise operations:
Reduced MTTR – L1/L2 incidents that previously required hours of manual investigation and remediation can now resolve in minutes.
Improved operator productivity – Engineers shift from reactive firefighting to reviewing and approving targeted, AI-generated fixes.
Consistent remediation – Steering files codify your team’s conventions and decision frameworks, ensuring every automated fix follows the same standards regardless of when or how often incidents occur.
Ready to get started? Clone the aws-samples repository for the complete implementation, visit the AWS DevOps Agent documentation to configure your first Agent Space, and explore the Kiro CLI documentation to learn more about steering-file-driven code generation. Have questions or want to share how you’ve adapted this pattern? Leave a comment below or open an issue in the repository
When an alarm fires at 2 AM, the first thing most engineers do is grep logs, check recent deployments, and trace code paths. However, the context they need — metrics, traces, topology, configurations — lives in a separate browser tabs and applications. What if your IDE could bring that cloud intelligence directly to your code, understand the full picture, and help you fix the issue end-to-end? Introducing, The Kiro power for AWS DevOps Agent removes that context switching by connecting your IDE directly to the AWS DevOps Agent, so you can investigate incidents, identify root causes, and generate fixes, all from the same place you write code.
This post is for developers and operators who develop applications using Kiro and want to troubleshoot production issues faster without leaving their editor. We’ll walk through how the power works, what it can do, and a step-by-step example of resolving a real incident.
The Kiro power for AWS DevOps Agent connects Kiro, the AI-powered IDE from Amazon, to the AWS DevOps Agent. It brings the production intelligence and release management in AWS DevOps Agent directly into your development environment — where you already plan, architect, debug, and ship code.
With this power installed, you can review your changes for production risks, investigate production incidents, optimize costs, review architecture, map service topology, and generate remediation code — all through natural language conversation, enhanced with the local context of your workspace.
Challenges in cloud operations today
Operating modern cloud applications means navigating a maze of interconnected services. A single user-facing error might require tracing through Amazon Elastic Container Service (Amazon ECS) tasks, Application Load Balancers, AWS Lambda functions, Amazon DynamoDB tables, and dozens of Amazon CloudWatch metric dimensions. Operators face persistent challenges:
Context switching — Investigating an incident requires jumping between the IDE, the AWS Management Console, log viewers, trace explorers, and documentation. Each switch costs time and breaks concentration during high-pressure incidents.
Siloed knowledge — Understanding which metrics matter, which services depend on each other, and what “normal” looks like for a given application often lives in runbooks that are outdated or in the heads of senior engineers. New team members face a steep learning curve.
Remediation gap — Even after identifying a root cause, translating findings into a working fix — an AWS CloudFormation parameter change, a scaling policy update, or an AWS Identity and Access Management (IAM) policy correction — requires switching contexts again and manually applying changes. These challenges compound when teams operate across multiple AWS accounts and environments. Kiro powers address these challenges by bringing operational intelligence directly into the IDE where developers already work.
Challenges in modern software delivery
AI coding agents have changed how fast code gets written, but the code review, testing, and pipeline processes that move code to production were designed for human pace and haven’t kept up. Teams face two persistent challenges:
Review capacity — AI-assisted development produces changes faster than human reviewers can evaluate them. Changes that don’t adhere to internal standards, dependency breaks, and access-control gaps that would have been caught by human reviews can slip through at machine pace.
Invisible dependencies — Applications span multiple repositories, shared infrastructure, and cross-team API contracts. A parameter rename in one repository silently breaks downstream consumers, and no single reviewer holds the full dependency graph in their head.
Faster code generation without corresponding delivery automation simply moves the bottleneck downstream. The Kiro power for AWS DevOps Agent addresses this by bringing release management intelligence into the IDE so you can review changes for production risks and run exploratory release testing of your web and API applications. Any issues can be immediately mitigated before you even push your code changes.
What are Kiro powers?
A Kiro power is a curated package that gives Kiro specialized capabilities in a specific domain, in this case, AWS operations. When installed, the power provides Kiro with tool connections to your AWS environment, domain-specific knowledge (best practices, error recovery patterns), and instructions for routing your requests to the right workflow. Critically, the power combines your local workspace context (code, git history, configuration files) with cloud-side intelligence (metrics, topology, deployment history) — so Kiro understands both what your code does and how your infrastructure behaves. For a deeper look at the powers framework, see Getting started with Kiro powers
Each power typically includes:
MCP server configuration — Connects Kiro to external tools and data through the Model Context Protocol, providing read and write access to cloud resources
Steering files — Domain-specific instructions that teach Kiro how to route intents, choose the right workflow, and handle edge cases
Contextual knowledge — Domain-specific guidance captured in markdown spec files and lifecycle hooks that encode best practices, common patterns, and error recovery strategies (as described in the blog, Introducing powers).
The Kiro power for AWS DevOps Agent
The Kiro power for AWS DevOps Agent packages the full capabilities of AWS DevOps Agent into a single install for Kiro. Once enabled, Kiro gains the ability to converse with a specialized AI agent that has deep knowledge of your AWS infrastructure, your operational history, and AWS best practices.
You can do the following with this power:
Investigate incidents — Describe the symptoms in natural language (“ECS tasks are failing with OOM errors on my-service”) and Kiro orchestrates a deep investigation across CloudWatch metrics, AWS X-Ray traces, Amazon ECS task events, and recent deployments to identify the root cause.
Optimize costs — Ask “What cost savings are available for my ECS services?” and receive specific, data-backed recommendations with estimated monthly savings based on actual utilization metrics from your account.
Review architecture — Request a topology map or security audit of your services. The agent queries your infrastructure and returns findings with actionable improvement suggestions.
Chat across agent spaces — Operate across multiple AWS DevOps Agent agent spaces from a single Kiro session using AWS SigV4. Each agent space can represent a different team, application, or AWS account — and you can switch between them naturally.
Generate remediation code — After identifying a root cause, Kiro can generate the fix directly in your workspace. Because it has access to both the investigation findings and your local code, the remediation is specific to your application, not generic boilerplate.
Run a release readiness review — After finishing a batch of code changes, have the DevOps Agent review the changes for dependency risks, deviations from your standards and best practices, and expansion of access controls in CloudFormation that go beyond best practices. It also builds and runs your code in an AWS-managed sandbox to better assess any production risks.
Perform exploratory release testing for deployed applications — If you deploy your web or API application to a production-like environment, Kiro can have the DevOps Agent run an exploratory tests on it. Any bugs or regressions found can be fixed without leaving the IDE.
How it works
The power provides two complementary workflows that Kiro selects automatically based on your request:
Chat (updates in seconds) — For instant answers about cost, architecture, topology, and knowledge discovery. Kiro creates a conversation with the DevOps Agent and streams responses in real time. Follow-up questions retain full context within the same session.
Investigation (completes in minutes) — For complex incidents requiring deep analysis. The DevOps Agent examines CloudWatch metrics, X-Ray traces, deployment history, and service topology, then delivers a root cause analysis with prioritized recommendations.
The following diagram shows how Kiro combines local workspace context with the DevOps Agent’s cloud intelligence:
Figure 1: Kiro combines local workspace context with the DevOps Agent’s cloud intelligence through the AWS DevOps Agent MCP Server.
Prerequisites
Before using the power, ensure you have:
AWS credentials configured (AWS IAM Identity Center recommended) if using AWS SigV4.
Kiro installed and a workspace set up
An AWS DevOps Agent agent space configured with data sources (CloudWatch, X-Ray, or other integrations)
Create an access token or have AWS SigV4 configured. The access tokens feature must be enabled on your Agent Space for access tokens to work.
For access tokens, you must have IAM permissions to manage access tokens (aidevops:CreateAccessToken, aidevops:RevokeAccessToken, aidevops:RotateAccessToken).
Sign in to the AWS Management Console and open the AWS DevOps Agent console.
Choose your Agent Space.
Choose the Configuration tab.
In the Access tokens section, choose Enable.
Confirm the action.
Create a token
Open the DevOps Agent web app for your Agent Space, then from the navigation menu, choose Settings, then choose Access Tokens.
Choose Create access token.
Enter a name for the token.
Choose a scope:
read – View investigations, recommendations, chats, and Agent Space resources.
operate – Full access. Includes everything in read, plus send messages, create chats, and manage backlog tasks and recommendations.
Set an expiration (1 to 60 days).
Copy the token value and store it in a safe, secure location. You cannot retrieve it again.
After creating a token, the web app displays a configuration example that you can copy directly into your client.
The power works with any agent space that has active data sources. The more data sources connected, the richer the investigations and recommendations.
Getting started with the Kiro power for AWS DevOps Agent
Setting up the power takes only a few steps. You can install it directly or follow these steps:
Open Kiro and choose the Powers icon in the sidebar.
In the AVAILABLE panel, find AWS DevOps Agent.
Choose Install.
The power appears in the INSTALLED panel, and choose Try power.
Figure 2: Kiro powers panel showing the Kiro power for AWS DevOps Agent
Verify Installation
After installation, you should see the Kiro power for AWS DevOps Agent listed in the powers section of the Kiro panel. Navigate to mcp.json file and change these values accordingly, and save the config file.
DEVOPS_AGENT_TOKEN=<your-token>
DEVOPS_AGENT_REGION=<your-agent-space-region>
In the MCP Servers panel, you will see DevOps Agent MCP connected and also displays list of tools. The power activates automatically when you mention relevant keywords like incident, cost optimization, architecture review, or topology in your conversation.
Figure 3: MCP Servers panel showing the AWS DevOps Agent MCP and connected tools
Walkthrough: Investigating a production incident
Let’s walk through a realistic scenario. Your team receives a CloudWatch alarm: an Amazon ECS service is returning HTTP 503 errors and task restarts have spiked.
Step 1: Describe the problem
In Kiro, you type:
“My ECS service checkout-api is throwing 503 errors. The alarm fired 10 minutes ago. Here’s the error from my logs: Connection pool exhausted, max connections 50 reached.”
Because Kiro has access to your workspace, it automatically includes relevant context — your task definition, your connection pool configuration from application.yml, and your recent git commits.
Step 2: Kiro starts the investigation
Kiro routes this to the investigation workflow. You see real-time progress as findings stream in:
Analyzing connection pool metrics against task count…
Root cause identified: Connection pool sized for single task, but service scaled to 5 tasks sharing a database connection limit
Step 3: Review findings and recommendations
The DevOps Agent returns a detailed analysis:
Root cause: The database connection limit (50) is shared across all ECS tasks. When the auto-scaling policy added tasks at 08:47 UTC, each task attempted to open 50 connections, exceeding the Amazon RDS max_connections parameter (100).
Recommendation and Mitigation: Reduce the per-task connection pool to max_connections / max_tasks (100 / 5 = 20 per task), or increase the RDS instance class to support more connections.
Step 4: Generate and apply the fix
You ask Kiro to implement the recommendation. Because it has access to your application.yml and your AWS CloudFormation template, it generates a targeted fix:
Updates spring.datasource.service.maximum-pool-size from 50 to 20 in your application configuration
Adds a comment explaining the calculation
Suggests an RDS parameter group change if you want to increase capacity instead
The fix is applied directly in your workspace, ready for review and commit.
Operating across multiple agent spaces
If your team manages multiple applications, each with its own DevOps Agent agent space, you can switch between them naturally. Kiro lists available agent spaces and routes your question to the right one.
Conclusion
The Kiro power for AWS DevOps Agent brings the full operational intelligence of AWS DevOps Agent into the IDE where you already work. By combining your local workspace context with cloud-side analysis, it closes the loop from detection to remediation without context switching.
Whether you are triaging a production incident, optimizing costs across services, or onboarding a new team member who needs to understand your infrastructure, the power provides contextual answers grounded in your actual AWS environment.
Tipu Qureshi Tipu Qureshi is a Senior Principal Technologist in AWS Agentic AI, focusing on operational excellence and incident response automation. He works with AWS customers to design resilient, observable cloud applications and autonomous operational systems.
Shashiraj Jeripotula (Raj) Shashiraj Jeripotula (Raj) is a San Francisco-based Principal Partner Solutions Architect at AWS. He works with ISV and AWS partners to build deep integrations across observability, AI, and agentic development tooling — helping developers leverage AI agents, Model Context Protocol (MCP), and shift-left observability to build responsible, production-ready AI systems on AWS.
When a security event occurs in your Amazon Web Services (AWS) environment, rapid response is critical. However security teams often struggle with time-consuming, manual processes that slow down investigations. Analysts must recall complex AWS Command Line Interface (AWS CLI) syntax for multiple services, manually correlate findings across Amazon GuardDuty, AWS CloudTrail, and other security tools, and document every investigation step for compliance requirements. They make critical decisions under pressure while active threats continue. For analysts without deep AWS expertise, these challenges are even more pronounced, creating bottlenecks in your security operations.
Kiro is an AI-powered coding assistant that helps users write, understand, and optimize code through integrated development environment (IDE) and command line integrations. Beyond traditional development tasks, it offers AWS-specific expertise including architecture guidance, best practices, cost optimization recommendations, and service documentation navigation. Kiro CLI puts Kiro’s full capabilities in your terminal, making it a natural fit for security operations workflows. For example, with built-in tools, Kiro CLI can be used to help with investigation of a GuardDuty finding—it will propose the appropriate AWS CLI commands, explain what each command does, and wait for your approval before executing. This approach lets you focus on analyzing threats rather than figuring out how to investigate them.
This blog post demonstrates how to use Kiro CLI to conduct a security investigation following the AWS Security Incident Response Guide framework. This framework organizes incident response into five phases:
Preparation: Having the right tools and processes in place before an incident occurs
Detection and analysis: Identifying security events and understanding their scope
Containment: Limiting the impact of an incident and preventing further damage
Eradication and recovery: Removing threats and restoring normal operations
Post-incident activity: Learning from incidents to improve future response
You’ll see how you can use Kiro CLI to triage GuardDuty findings, assess impacted Amazon Elastic Compute Cloud (Amazon EC2) resources, analyze AWS CloudTrail logs, and generate remediation scripts. By the end of this post, you’ll learn how to use Kiro CLI to run security investigations in minutes rather than hours — without skipping steps.
Prerequisites
Before getting started, confirm you have the following:
AWS CLI: Configure using one of the methods in Configuring settings for the AWS CLI. Kiro CLI uses the default AWS CLI profile (or the profile specified by the AWS_PROFILE environment variable) to interact with AWS resources and will request your approval before executing any actions.
Solution overview
To show Kiro CLI in action, we investigate a GuardDuty finding end to end — following the AWS Security Incident Response Guide framework through the following steps.
Discovery: Retrieve and analyze a high-severity GuardDuty finding
Knowledge capture: Create reusable investigation workflows through steering files
Throughout this investigation, Kiro CLI will propose commands, explain their purpose, wait for approval, and automatically document findings—transforming an inefficient manual process into a guided, efficient workflow.
Kiro CLI combines AI reasoning with deep AWS knowledge to analyze security findings, correlate evidence across services, and propose appropriate AWS CLI commands at each step of an investigation. While this AI-powered approach accelerates investigations, it’s important to validate outputs and recommendations before taking action. The specific commands and analysis shown in this walkthrough are examples—your results will vary based on your specific findings and environment configuration.
The investigation: From alert to resolution
In this section, we walk you through the phases of an investigation, from discovery through analysis.
Discovery: A high-severity GuardDuty finding
Our investigation began with a GuardDuty finding requiring immediate attention. Rather than manually constructing AWS CLI commands, we used Kiro CLI’s natural language interface:
I need to investigate GuardDuty finding 58cddb4e8705cde3f595ef5805f50491 in us-east-1. Please help me understand this finding by checking the finding details, resource details, and threat details. For each investigation step, propose the AWS CLI command, explain what information we'll get, and wait for my confirmation before showing the next command. Document everything in a findings.md file in the current directory, including finding summary, investigation steps, evidence collected, and remediation guidance. Structure it for both technical and executive audiences.
This single prompt establishes the entire investigation framework, as shown in Figure 1. By requesting step-by-step approval, we maintain control while benefiting from AI guidance. The documentation requirement helps ensure that we’re building an audit trail in real-time for compliance requirements.
Figure 1: Kiro CLI interface showing the initial investigation prompt and proposed first command to retrieve GuardDuty detector ID and finding details
Kiro CLI proposed retrieving the detector ID and complete finding details. After approval, it executed the commands and revealed critical information, as shown in Figure 2.Key findings:
Type: CryptoCurrency:EC2/BitcoinTool.B!DNS
Severity: HIGH (8.0)
Instance: i-05447e6dacd0a7e7e (m5.xlarge)
Threat: 617 DNS queries to pool.minergate.com
Timeline: Started 9 minutes after instance launch
We can see that it took 9 minutes from instance launch to mining activity, which suggests automated event rather than manual action. This timeline information, automatically extracted and highlighted by Kiro CLI, helps security teams understand event patterns.
Figure 2: GuardDuty finding details showing HIGH severity cryptocurrency mining detection with threat indicators and timeline
Resource and scope analysis
Kiro CLI proposed investigating the EC2 instance configuration, security groups, IAM permissions, and checking for additional findings. This proactive suggestion demonstrates Kiro CLI’s understanding of security investigation workflows, it knows that understanding the potential impact requires examining not just what the unauthorized user did, but what might possibly be a next step in a typical threat scenario.
The following information is also shown in Figure 3.
Instance configuration: Kiro CLI retrieved the instance details, revealing:
Amazon Linux 2023 AMI
Instance Metadata Service version 2 (IMDSv2) required (good security posture)
Public IP address with unrestricted outbound access
IAM instance profile attached
Security group assessment: Kiro CLI analyzed the security group rules and identified:
No inbound rules
Unrestricted outbound access to 0.0.0.0/0, enabling mining traffic
IAM permission analysis: Kiro CLI examined the instance profile and attached role policies, uncovering a critical security risk:
Critical finding: AdministratorAccess policy attached to the EC2 instance profile
Full AWS account access from compromised instance
Potential for complete account takeover
While the observed activity is cryptocurrency mining, the attached AdministratorAccess policy means the unauthorized user could have exfiltrated data, created backdoors, or compromised other resources. This highlights why least-privilege IAM policies are critical. Even if an instance is compromised, limited permissions help reduce the potential impact.
Figure 3: Kiro CLI’s instance configuration summary highlighting the AdministratorAccess policy, unrestricted outbound access, and multiple concurrent security findings
Scope assessment: Kiro CLI checked for additional unexpected activity and discovered seven security findings on this single instance, indicating a multi-vector attack, as shown in Figure 4.
Figure 4: Kiro CLI’s summary highlighting a multi-vector attack.
Figure 5: Kiro CLI’s summary of the investigation and recommendations for immediate actions.
Instance isolation: Kiro CLI produced commands to create an isolation security group with no inbound or outbound rules (as shown in Figure 6), then applied it to the compromised instance. This containment step stops new connections without destroying evidence. However, it’s important to understand that security groups are stateful and use connection tracking. When you change security group rules, existing connections aren’t immediately interrupted and continue to allow packets until they time out.
This means that if an unauthorized user has an active connection to the instance, that connection might persist temporarily even after applying the isolation security group. For immediate interruption of all traffic including active connections, consider also implementing network access control lists (NACLs), which are stateless and don’t track connection state. Unlike security groups, NACLs can immediately break existing connections when rules are applied. While NACLs operate at the subnet level (broader scope than instance-level security groups), they provide an additional layer of defense that helps ensure network isolation.
This scenario illustrates an important principle: while AI-powered tools such as Kiro CLI can help you respond more quickly by generating appropriate commands, it’s critical to keep a human in the loop who understands these nuances. Kiro CLI might not have complete information about edge cases, so security professionals should validate recommendations and consider additional controls based on their expertise and the specific threat scenario.
Figure 6: Instance successfully isolated with confirmation showing no inbound or outbound rules, blocking all network traffic including command-and-control (C&C) communications and mining activity
Privilege revocation: Kiro CLI generated commands to attach a deny-all policy to the compromised IAM role (as shown in Figure 7). The AI assistant explained that even though the AdministratorAccess policy remains attached, the deny-all policy takes precedence because of the evaluation logic used by IAM, where explicit denies always override any allows. This immediately revoked all permissions while preserving the original configuration for forensic analysis.
Figure 7: IAM credentials revocation confirmation with current status checklist showing network isolated, IAM credentials revoked, and forensic snapshot pending
Evidence preservation
Before making mutating changes, Kiro CLI recommended creating a forensic snapshot of the compromised instance’s Amazon EBS volume (as shown in figure 8). This step can be missed when teams are under pressure to contain an active threat, but it’s critical for post-incident analysis and potential legal proceedings.
Memory preservation decision: We chose to leave the instance running in its isolated state rather than stopping it immediately. Stopping an EC2 instance results in loss of volatile memory containing forensic evidence such as running processes, network connections, loaded malware, and encryption keys. By maintaining the instance in an isolated security group with all network access blocked, we neutralized the threat while preserving the ability to conduct deeper forensic investigation if needed.
Volatile memory often contains evidence that explains how an event occurred, malware binaries, decryption keys, or command-and-control (C&C) communications that disappear when an instance stops. This decision point illustrates the balance between immediate threat elimination and thorough investigation.
Capturing volatile memory requires specialized tools and techniques. For Linux instances, LiME (Linux Memory Extractor) can capture physical memory, while Windows instances can use tools like Winpmem. After being captured, memory dumps can be analyzed using Volatility, an open source memory forensics framework. Forensics tools should be pre-installed on your systems to avoid changes being made during the evidence gathering process. AWS provides guidance on automating forensic kernel module builds for Amazon Linux EC2 instances to streamline this process.
Figure 8: Forensic snapshot creation confirmation with proper tagging including purpose, incident ID, and severity for evidence preservation
CloudTrail analysis
To understand the full scope of compromise, we asked Kiro CLI to analyze CloudTrail logs. The AI assistant identified available CloudTrail trails and proposed queries to find any API calls made from the compromised instance using its temporary credentials (as shown in Figure 9).
CloudTrail analysis is often the most time-consuming part of incident investigation, requiring analysts to construct complex queries and correlate events across time. Kiro CLI automates this process, immediately identifying the relevant log sources and proposing appropriate queries.
Figure 9: Kiro CLI identifying available CloudTrail trails and proposing targeted queries
Kiro CLI found no unexpected API calls originating from the instance credentials—no IAM users created, no S3 buckets accessed, and no secrets stolen. The event appeared limited to cryptocurrency mining activity conducted through DNS queries, with no evidence of data exfiltration or lateral movement.
Figure 10: Investigation results from Kiro CLI
This shows the value of thorough CloudTrail analysis: even when initial findings suggest a contained threat, confirming the absence of broader compromise is essential before closing an investigation.
Building proactive defenses
The AWS Security Incident Response Guide emphasizes that preparation is the foundation of effective incident response. With the immediate threat contained, we used Kiro CLI to strengthen our preparation phase by establishing automated alerting for future incidents.
As shown in Figure 11, we used natural language to request
Set up a notification system that sends an email to [email] for any high severity or higher severity findings.
Kiro CLI understood the requirement and proposed a multi-step solution involving Amazon SNS and EventBridge:
Create an SNS topic for GuardDuty alerts
Subscribe an email address to the topic
Create an EventBridge rule to trigger on high-severity findings (severity greater than or equal to 7.0)
Configure the SNS topic as the EventBridge target
Grant EventBridge permissions to publish to the SNS topic
Building automated alerting requires understanding multiple AWS services, their interactions, and correct configuration syntax. Kiro CLI translates a straightforward natural language request into a complete, production-ready solution.
Auto-correction and testing: When setting up complex integrations, commands can fail because of permission issues, incorrect Amazon Resource Name (ARN) references, or malformed JSON policies. Kiro CLI automatically detects these failures and proposes corrected commands.
Figure 11: Notification system setup completion showing SNS topic created, EventBridge rule configured, and confirmation that notifications will trigger on HIGH and CRITICAL severity findings
You can also prompt Kiro CLI to test the setup: Test this notification system to verify it’s working correctly. Kiro CLI will verify that the SNS subscription is confirmed, check that the EventBridge rule is properly configured, validate IAM permissions, identify any misconfigurations, and publish a test event to verify end-to-end functionality. This intelligent error handling means security teams can confidently deploy automation without manual troubleshooting.
Creating reusable investigation workflows
With the immediate threat contained and proactive defenses in place, we then used Kiro CLI to create a reusable steering file that codifies this investigation workflow for future incidents. Steering files are Markdown files stored in .kiro/steering/ that act as persistent memory for Kiro CLI, helping security teams capture institutional knowledge and standardize response procedures. To share them across your team, add them to a Git repository or publish them to your documentation system like Confluence — the same places you’d keep any other runbook.
We recommend running the full investigation and generating the steering file in the same Kiro CLI session. This way, the steering file captures the exact steps, commands, and decisions from your investigation. Navigate the process the way that fits your organization — the steering file will reflect your workflow, not a generic template.
We asked Kiro CLI:
Create a steering file that captures this GuardDuty investigation workflow so future analysts can follow the same systematic approach.
Kiro CLI generated a detailed steering file at .kiro/steering/guardduty-incident-response.md that includes:
Investigation phases aligned with the AWS Security Incident Response Guide
AWS CLI command patterns for GuardDuty, Amazon EC2, IAM, and CloudTrail
Documentation requirements and approval gates
Containment, eradication, and evidence preservation procedures
This is the example steering file that was created by Kiro cli:
---
inclusion: manual
---

# GuardDuty Incident Response Workflow

This steering file guides systematic investigation of GuardDuty findings following AWS Security Incident Response Guide best practices.

## Investigation Phases

### Detection and Analysis
1. Retrieve GuardDuty finding details using finding ID
2. Extract finding type, severity, affected resources, and threat indicators
3. Document timeline of events (instance launch, threat detection)

### Resource Analysis
4. Investigate EC2 instance configuration (AMI, IMDS version, network access)
5. Analyze security group rules (inbound/outbound access)
6. Review IAM permissions attached to instance profile
7. Check for additional findings on the same resource

### Containment
8. Create isolation security group with no inbound/outbound rules
9. Apply isolation security group to compromised instance
10. Create forensic snapshot before making destructive changes
11. Preserve volatile memory by keeping instance running if forensic analysis needed

### Eradication
12. Revoke excessive IAM permissions
13. Document all actions in findings.md with technical and executive summaries

### Analysis
14. Query CloudTrail for API calls from compromised instance credentials
15. Assess scope of compromise and potential lateral movement

## Documentation Requirements
- Finding summary with severity and type
- Investigation steps with timestamps
- Evidence collected (security groups, IAM policies, CloudTrail logs)
- Remediation actions taken
- Recommendations for prevention

## AWS CLI Command Patterns
- GuardDuty: `aws guardduty get-findings`
- EC2: `aws ec2 describe-instances`, `aws ec2 describe-security-groups`
- IAM: `aws iam get-instance-profile`, `aws iam list-attached-role-policies`
- CloudTrail: `aws cloudtrail lookup-events`

## Approval Gates
Always propose commands with explanations before execution and wait for approval.
Traditional incident response playbooks are static documents that quickly become outdated. Kiro CLI steering files are executable playbooks that guide AI-assisted investigations with consistency while remaining flexible enough to adapt to specific scenarios. Steering files stay current because updating them is part of the workflow, not a separate task. When you adjust your investigation process, ask Kiro CLI to update the steering file at the end of the session. It captures your changes, and you share the updated version with the team through Git or Confluence — everyone works from the latest version.
Conclusion
Security incidents require accurate and rapid response, but traditional investigation workflows create bottlenecks that extend mean time to respond (MTTR). By following the framework provided by the AWS Security Incident Response Guide and using Kiro CLI’s AI-powered capabilities, you can transform incident response from reactive to proactive, well-documented operations.
In this post, we demonstrated how Kiro CLI accelerates each phase of the incident response lifecycle—from initial detection and analysis through containment, eradication, and recovery. You learned how to use natural language prompts to investigate GuardDuty findings, analyze compromised resources, implement containment measures, preserve forensic evidence, and establish automated alerting for future incidents. The steering file capability helps your team embed hard-won expertise in reusable workflows that benefit analysts at all skill levels.
Whether you’re investigating alerts, building defenses, or documenting procedures, Kiro CLI provides the expertise and automation to respond faster, learn continuously, build better defenses, and document thoroughly. When commands fail or configurations are wrong, Kiro CLI identifies the issue and corrects it, reducing time spent troubleshooting.
If you have feedback about this post, submit comments in the Comments section below.
Today at the AWS Summit in New York City, Swami Sivasubramanian, AWS VP of Agentic AI, provided the day’s keynote. Here’s our roundup of the biggest announcements from the event:
New in Amazon Bedrock AgentCore We’re introducing new capabilities on Amazon Bedrock AgentCore: connecting AI agents to organizational, web, and paid knowledge, helping teams find and fix what’s going wrong in production, and enforcing controls that scale as agents grow more capable.
Together, these capabilities help you build more capable agents faster, govern those agents with controls that scale, and improve them continuously. To learn more, read our blog post covering all the new features.
Introducing Amazon Bedrock Managed Knowledge Base for faster, more accurate enterprise AI applications — You can build enterprise RAG pipelines with the managed Knowledge Base on Bedrock. It provides native data connectors, Smart Parsing for automatic multi-format data preparation, and an Agentic Retriever for complex multi-step queries—all integrated with AgentCore Gateway so developers can focus on business outcomes rather than infrastructure management.
AWS WAF adds AI traffic monetization capability to help content owners charge AI bots for content access — You can use a new Bot Control capability that enables content providers and publishers price, meter, and collect payment from AI bots and agents accessing their content and APIs. AWS WAF now lets you set a price for that access, accept payment through third-party providers, and grant scoped access directly at the edge.
Amazon Bedrock AgentCore harness in now generally available — You can do building and running production-grade AI agents in minutes—without coding orchestration loops—by defining your agent’s model, tools, skills, and instructions in configuration, with Bedrock AgentCore harness.
New in AI-based security tools
Introducing AWS Continuum: Security at machine speed — AWS Continuum for code vulnerabilities, available in a gated preview, takes findings from across your environment, prioritizes by business impact, proves which are exploitable, and drives a fix through your own process.
AWS Security Agent (now part of AWS Continuum) adds threat modeling, Kiro power and Claude Code plugin, and more — You can generate the new threat modeling (preview) to understand the full context of your application and identify threats with recommended mitigations using the STRIDE framework. You can also use pull request code scanning with remediation across major Git platforms, and IDE integrations via Kiro power, Claude Code plugin, and MCP — letting developers run security reviews and fix issues without context switching.
New in building AI-based applications
Introducing Kiro for iOS — Kiro introduces a native iOS app, available in a gated preview, built for real engineering work that gives developers a new surface to kick off, monitor, steer, and interact with their Kiro sessions directly from their phone. That means you can now start sessions, check back when they’re done, review diffs, and approve changes all while staying connected to your work with no laptop running.
Proactively reduce tech debt autonomously with AWS Transform – continuous modernization — You can use continuous analysis (preview) to automatically scan your code repositories against configurable baselines and generates findings in hours, not weeks. Once you’ve identified and prioritized findings, you can configure autonomous remediations that generate pull requests for affected repositories automatically.
In addition to the keynote announcements, we have other important launches this week:
Amazon S3 annotations: attach rich, queryable context directly to your objects — Amazon S3 now lets you attach up to 1 GB of rich, mutable, and queryable context directly to your objects using annotations, purpose-built for AI agents and autonomous workflows that need to discover, understand, and act on data at scale without maintaining separate metadata systems.
AI coding assistants are transforming software development, but data engineering presents unique challenges: governed data access, shared compute environments, and compliance controls that are designed to remain in place. How do you bring the power of agentic AI development into a governed data environment? With the AWS Toolkit for Visual Studio Code, you can connect Kiro, VS Code, or Cursor directly to Amazon SageMaker Unified Studio.
When you connect your editor to a SageMaker Unified Studio Space (a cloud-based compute environment inside your project), you get AI-assisted development with your preferred tools while your data governance, project permissions, and compute are managed by SageMaker Unified Studio. Additionally, SageMaker Unified Studio automatically generates steering files (like AGENTS.md) that provide your AI assistant with context about your project environment, so it understands your data and project configuration from the first prompt.
This post demonstrates the integration using Kiro. The same Remote Access connection works with VS Code and Cursor. The post starts by showing what you can do with this integration: using natural language to explore and analyze data in a governed environment. We then walk through the setup so you can try it yourself.
What’s new
With the AWS Toolkit, you can connect Kiro, VS Code, and Cursor to your SageMaker Space over a secure SSH tunnel. No additional extensions or SSH key management required. After the connection is established, your IDE has full access to your Space’s file system, compute, and data services.
Two capabilities make this especially powerful for data work:
Automatic AI steering – When connecting Kiro to SageMaker Unified Studio, Kiro generates AGENTS.md and smus-context.md files that provide your AI assistant with context about your environment, including project configuration, environment details, and utilities for discovering your data catalog and project structure. Kiro detects these files automatically; other editors can use them as context for their own AI features.
MCP server support – have Kiro discover and configure itself for the Model Context Protocol servers on your remote SageMaker space ( like smus_local and aws-dataprocessing) to give your agent direct access to your AWS Glue Data Catalog, Amazon Athena queries, and SageMaker Unified Studio project metadata.
The following diagram shows how the components connect:
Architecture diagram: How the components connect
See it in action: AI-assisted development with governed data
Before walking through the setup, we explain what you can do with this integration. This walkthrough uses Kiro as the editor. With Kiro connected to a SageMaker Unified Studio Space, MCP servers configured, and steering documents in place, we can use natural language to explore data and build analytics. The AI assistant has all the context it needs to do this well.
Note: Agentic AI output is nondeterministic. The exact code, tool choices, and responses Kiro produces will vary between sessions, even with the same prompt. The following walkthrough shows one representative session. Your experience will differ in the specifics, but the patterns and capabilities demonstrated here are consistent.
Step 1: Explore the data
Start with a simple prompt:
show my databases and the tables I have access to
Even with native MCP tools available, Kiro often prefers the AWS Command Line Interface (AWS CLI) and bash to retrieve information. This is expected and typically does not affect the outcome. If you prefer MCP tools for every operation, you can add that preference to a steering document.
Kiro used the sagemaker_studio SDK to discover the catalog:
python3 -c "
from sagemaker_studio import Project
project = Project()
conn = project.connection()
catalog = conn.catalog()
print('Databases:')
for db in catalog.databases:
    print(f'  - {db.name}')
"
Databases:
  - default
  - sagemaker_sample_db
Then it drilled into the table schema:
python3 -c "
from sagemaker_studio import Project
project = Project()
conn = project.connection()
catalog = conn.catalog()
db = catalog.database('sagemaker_sample_db')
print('Tables in sagemaker_sample_db:')
for t in db.tables:
    print(f'  - {t.name}')
    print(f'    Columns: {[(c.name, c.type) for c in t.columns]}')
"
Kiro discovered the sagemaker_sample_db.churn dataset, a sample dataset that ships with SageMaker Unified Studio containing 10,000 rows and 21 columns of customer churn data (state, account length, call minutes, service calls, churn flag, and more). Notice that we did not write any of this code. We asked a question in natural language, and Kiro chose the right SDK calls, explored the catalog, and surfaced the results.
Another, more natural way to get the same answer is to ask directly. Prompting “Let us sample the churn table.” yields the same catalog paths and schema output, along with additional metrics like row count and a data sample, all from a single conversational prompt:
Figure 1 — The sagemaker_sample_db.churn dataset in the catalog
Figure 2 — Churn dataset schema with 21 columns
from sagemaker_studio import sqlutils
result = sqlutils.sql(
    'SELECT COUNT(*) AS total_rows FROM sagemaker_sample_db.churn',
    connection_name='default.sql'
)
print('=== Total Row Count ===')
print(result)
=== Total Row Count ===
   total_rows
0       10000
With the schema and row count in hand, Kiro sampled the data to round out its understanding of the dataset:
Figure 3 — Comprehensive data sample after Kiro catalog exploration
Step 2: Run analytics with full context
With the data explored, ask Kiro to run a data quality evaluation:
Can we run basic statistical evaluations for data quality?
Because Kiro had already explored the catalog and sampled the data, it made smart choices about how to run the analysis. Instead of using PySpark for this 10,000-row table, Kiro used Athena using sqlutils to run the evaluation directly. It produced a thorough data quality report:
10,000 rows, 21 columns, zero nulls across all columns. Clean on that front.
5,000 duplicate rows (50 percent). Significant, worth investigating before modeling.
Outliers minimal. Most columns have less than 1 percent outlier rate by IQR.
Clear signal in key features. Churners and non-churners show differences in day_mins (7.52 vs. 3.52), eve_mins (5.95 vs. 4.11), and vmail_message (175 vs. 278).
State distribution roughly uniform (~2% each), intl_plan and vmail_plan near 50/50.
The key insight here is what Kiro did not do. It did not default to PySpark because the environment supports Spark. Having explored the data first, understanding the table size, column types, and that churn is a proper Boolean (not a string), Kiro independently chose the right engine for the workload and produced correct analytics on the first pass.
Best practice: Explore first, code second
Start every AI-assisted development session with data exploration. Ask your AI assistant to discover your catalog, sample your tables, and understand the schema before asking it to build anything. This single step helps reduce a common source of errors in AI-assisted data work: the LLM making assumptions about data it has not seen.
Exploring your data gives the large language model (LLM) the context it needs to properly help with your project. It saves hallucinations and rework, results in faster development time, and reduces token costs.
Ready to try it yourself? The following sections walk through the full setup: prerequisites, connecting your editor to your SageMaker Space, configuring MCP servers, and working with notebooks.
Prerequisites
Before you begin, make sure you have the following:
A SageMaker Unified Studio domain and project with at least one project that has a compute environment provisioned (Tooling or ToolingLight). These should come standard with every SageMaker project except those provisioned with the SQL & Gen AI blueprints. If you need to set up SageMaker Unified Studio, see Getting started with Amazon SageMaker Unified Studio.
A Space with Remote Access enabled. Either a JupyterLab or Code Editor Space works. The instance must have at least 8 GiB of memory (for example, ml.t3.large or larger). The default ml.t3.medium (4 GiB) can’t enable Remote Access. You must upgrade the instance type first, then toggle Remote Access to Enabled in the Configure Space dialog.
A VS Code-compatible editor. Kiro, VS Code, Cursor, or another VS Code-based IDE installed on your local machine. This walkthrough uses Kiro, but the Remote Access connection has been tested with VS Code and Cursor as well.
AWS Toolkit v4.1.0 or later. Kiro ships with the AWS Toolkit pre-installed. For VS Code and Cursor, install the AWS Toolkit extension and verify your version is 4.1.0 or later (Cmd+Shift+X and search for “AWS Toolkit”).
AWS credentials. You must be authenticated in the SageMaker Unified Studio panel of the AWS Toolkit with the same identity (AWS IAM Identity Center or AWS Identity and Access Management (IAM)) that you use to access SageMaker Unified Studio in the browser.
Network connectivity. Your Space must have internet access (PublicInternetOnly mode, or virtual private cloud (VPC) with a NAT gateway or HTTP proxy that allows VS Code and Open VSX endpoints).
The following screenshots show the SageMaker Unified Studio portal and the Configure Space dialog. Navigate to your project, select your Space, and verify the configuration. Remote Access is disabled when the instance has less than 8 GiB of memory. Select an instance with at least 8 GiB, such as ml.t3.large, then enable Remote Access. This is a one-time configuration per Space.
Figure 4 — SMUS project Spaces overview in the portal
Figure 5 — Configure Space dialog showing instance type selection
Figure 6 — Enabling Remote Access on a Space with 8 GiB or more
Connecting your editor to your SageMaker Space
There are two ways to connect: directly from the SageMaker Unified Studio portal, or from your local IDE using the AWS Toolkit.
Method 1: Connect from the SageMaker Unified Studio portal
To launch your IDE directly from the portal, navigate to your project’s Code Spaces page, find your Space, and choose Open in to select your editor (Kiro, VS Code, or Cursor):
Figure 7 — Open in Local IDE from the Code Spaces list
You can also launch from within a Space’s details page:
Figure 8 — Open in Local IDE from the Space details page
Or from within the JupyterLab or Code Editor browser environment:
Figure 9 — Open in Local IDE from JupyterLab
Your browser will prompt you to allow opening the IDE. Confirm, and the editor launches with an SSH connection to your Space already established via the AWS Toolkit. No additional configuration is typically required.
Method 2: Connect from your IDE via the AWS Toolkit
Open your editor on your local machine. Then, in the AWS Toolkit panel, choose Sign in. Authenticate with your IAM Identity Center or IAM credentials, the same identity you use to access SageMaker Unified Studio in the browser. The following screenshots show Kiro, but the steps are the same in VS Code and Cursor. Figure 10 — AWS Toolkit button in Kiro
Figure 11 — AWS Toolkit panel expanded
Figure 12 — AWS Toolkit Sign in dialog
Choose your AWS profile. You must have a profile configured in the AWS CLI with the correct account and AWS Region set.
In the Toolkit panel, browse your SageMaker Unified Studio domains and projects. Select the project that you want to work in.
Figure 13 — Browsing SMUS domains and projects in Kiro
Important: The credentials that you use in the AWS Toolkit must match the identity that you use in the SageMaker Unified Studio portal. The Toolkit validates that your identity has access to the Space.
AI steering: How SageMaker Unified Studio pre-seeds AI context
The real value of the feature comes from what you don’t need to do. When connected to Kiro SageMaker Unified Studio automatically generates steering files that guide your AI assistant with project context, so you can focus on building analytics rather than configuring connections. When you open a SageMaker Unified Studio project, SageMaker Unified Studio presents a prompt to create steering files: an AGENTS.md file that references a newly created smus-context.md. These files provide context about your project environment, such as project configuration, environment details, and utilities for discovering your data catalog and project structure. Kiro detects and applies these files automatically; in other editors, you can reference them as context for your AI features.
Figure 14 — SMUS popup offering to create steering files
Figure 15 — Generated AGENTS.md and smus-context.md steering files
Without these steering files, your AI assistant would need several back-and-forth prompts to discover what data you have and how to access it. With them, the assistant understands your project from the first prompt: how to discover your databases, how your environment is configured, and what tools are available. The steering files also help properly configure MCP servers, which you set up in the next section.
Exploring your project
After you’re connected, the project structure expands into Data and Compute sections in the sidebar, as it would in the SageMaker Unified Studio portal.
Figure 16 — Project Data and Compute sections in the Kiro sidebar
You can explore your data catalog and S3 buckets directly from the sidebar:
Figure 17 — Exploring the data catalog and S3 buckets from the sidebar
You can also remote into a compatible Space for direct development. Hover over a Space and select the remote icon on the right:
Figure 18 — Remote connection icon on a compatible Space
After a moment, the Space opens in a new Kiro window:
Figure 19 — Space opened in a new Kiro window
You must sign in again, and then trust the authors of the files in the Space:
Figure 20 — Trust authors dialog for the Space files
You’re now connected to your Space. The Toolkit works on the Space the way it does locally, except the resources are scoped to the project’s permissions.
Figure 21 — Connected to the SMUS Space with the Toolkit active
Setting up MCP servers
Before you can use AI-assisted development effectively, you must give Kiro access to your data services through Model Context Protocol (MCP) servers. MCP servers extend the Kiro agent with tools: the ability to query catalogs, run SQL, manage credentials, and more.
Out of the box, Kiro has no MCP servers configured:
Figure 22 — Kiro MCP servers panel with no servers configured
Prompt Kiro to find and configure the MCP servers that ship pre-installed on your SageMaker Space. Using the steering file context, Kiro located the servers and generated the configuration. If a server fails to connect, select the failed entry and Kiro will suggest fixes. You might need additional prompts to get the smus_spark_upgrade server (a pre-installed MCP server for managing Spark session upgrades) working correctly.
Figure 23 — Kiro discovering and configuring SMUS MCP servers
Figure 24 — MCP servers after iterating on configuration fixes
For more deterministic results, you can also configure the MCP servers manually. Here is a sample configuration:
Note: Your MCP configuration might vary depending on your SageMaker Unified Studio environment. Use the preceding configuration as a starting point and let your editor adjust if a server fails to connect.
Next, add the AWS Data Processing MCP server to get catalog information and Athena query capabilities. This isn’t strictly required (Kiro can use Python or AWS CLI for the same tasks), but it gives the agent native tools for catalog and query operations.
Figure 25 — AWS Data Processing MCP server tools with Amazon EMR tools disabled
You can list the tools that each MCP server provides. Because the AWS Data Processing MCP server includes tools for many services, we recommend disabling tools that you don’t need for a given project to save model context. For this walkthrough, disable the Amazon EMR tools to focus on AWS Glue and Amazon Athena.
Exploring data with notebooks
Kiro supports Jupyter notebooks in your SageMaker Space with the same language and connection selectors that you would find in SageMaker JupyterLab or Code Editor. Open the command palette (Cmd+Shift+P) and create a new Jupyter notebook:
Figure 26 — Command palette to create a new Jupyter notebook
Figure 27 — New Jupyter notebook opened in Kiro with language and connection selectors in a notebook cell
As in SageMaker JupyterLab, you get language and connection selectors in the bottom right of each cell. Choose the connection selector to see your available connections:
Figure 28 — SageMaker connection selector
Select PySpark to fill in the magic commands for your cell. Write your code (in this case, enter spark and press Shift+Enter) to verify the session starts:
Figure 29 — PySpark magic command and spark verification code
Figure 30 — Running the PySpark cell
If this is your first time using Jupyter with Kiro, you’re prompted to install the Jupyter extension. After it’s installed, select the kernel from Python Environments → Base:
Figure 31 — Jupyter kernel selection prompt
Figure 32 — Selecting the Python kernel from the Base environment
Re-run your cell. After a few moments, AWS Glue provisions a PySpark session:
Figure 33 — AWS Glue provisioning a PySpark session in a Jupyter notebook in Kiro
You see results the way you would in JupyterLab in the SageMaker Unified Studio portal:
Figure 34 — PySpark code running in a Jupyter notebook in Kiro
The notebook generate button
You will notice a Generate button underneath notebook cells. Let’s test it with a simple prompt:
looking at the above cell for reference, show me the accounts where state = california
using pyspark prefixing the cell with `%%pyspark default.spark` and sorting by
account_length
Figure 35 — Using the Generate button with a natural language prompt
Figure 36 — Generated PySpark code from the prompt
This prompt builder, like other notebook generation features, doesn’t have good context on the surrounding cells. You must be explicit about what you want because it won’t read other code or cells as input.
While the Kiro notebook generate button works for straightforward edits, for serious code generation, we recommend that you use Kiro agent mode. This mode has full project and SageMaker context, as demonstrated in the “See it in action” walkthrough earlier in this post.
What’s happening under the hood
When you connect your editor to a SageMaker Unified Studio Space, the AWS Toolkit extension establishes a secure SSH tunnel between your local IDE and your cloud-based Space.
Key details:
SSH tunnel. The connection is managed entirely by the AWS Toolkit (v4.1.0+) or VS Code’s built-in SSH extension. No separate Remote SSH extension is needed; the capability is built in.
File system access. Your editor sees the Space’s persistent storage at /home/sagemaker-user/, including shared project files and notebooks or scripts you create.
SageMaker Unified Studio steering context. The integration generates AGENTS.md and smus-context.md files that provide your AI assistant with context about your project environment and utilities for understanding your data. This is what makes the assistant effective from the first prompt.
MCP server integration. MCP servers like smus_local (for project metadata and environment utilities) and aws-dataprocessing (for AWS Glue Data Catalog and Amazon Athena) extend your editor’s AI with direct access to your data services. Your own MCP servers will be equally valuable here.
Credential flow. The Toolkit uses your existing AWS identity (IAM Identity Center or IAM) to authenticate to the Space. No separate SSH keys to manage. The aws_context_provider tool from the smus_local MCP server handles credential discovery for agent operations.
Best practices
To work effectively with your IDE and SageMaker Unified Studio:
Explore your data before building. Start every session by asking your AI assistant to discover your catalog, sample your data, and understand the schema. This single step helps reduce the most common source of errors in AI-assisted data work: the LLM making assumptions about data it has not seen. See the “See it in action” walkthrough earlier in this post for a concrete example of the difference this makes.
Use the SageMaker Unified Studio steering files. When prompted to create AGENTS.md and smus-context.md, accept. These files are the foundation that makes everything else work: environment context, MCP server configuration, and project understanding. Without them, your AI assistant starts from zero on every prompt. Kiro detects these automatically; in other editors, add them as context.
Disable unused MCP tools. The AWS Data Processing MCP server includes tools for AWS Glue, Amazon EMR, Amazon Athena, and more. Disable the services that you’re not using for a given project to save model context and reduce noise.
Be specific in your prompts. The more detail you give your AI (column names, query patterns you prefer, output formats), the closer the first pass will be. “Run data quality evaluation using Athena SQL” gets you better code than “check my data.”
Always test interactively first. Whether in notebooks or the terminal, validate code before deploying it. AI agents can iterate quickly, but catching issues in an interactive session is faster than debugging a failed AWS Glue job. Athena PySpark and the SageMaker sqlutils and sparkutils packages are great for this.
Stop your Space when idle. Your Space runs on compute (the same instance types as Code Editor and JupyterLab). If idle, the Space will terminate after 60 minutes and close your remote connection. Close the remote window and reconnect to continue.
Things to know
Notebook agent mode. For notebook-heavy analytics workflows where you want agentic AI to generate and run cells directly, SageMaker Notebooks with Data Agent in SageMaker Unified Studio is the recommended option today. Current notebook support in local editors covers editing, running, and generating code in individual cells.
MCP setup takes iteration. Configuring MCP servers may require iteration, especially for servers with complex authentication. Many AI-enabled editors can self-correct when a server fails. For more deterministic results, use the preceding MCP configuration JSON as a starting point rather than relying solely on auto-discovery.
CLI preference. AI agents often prefer the AWS CLI and bash even when MCP tools are available. This doesn’t affect outcomes, but you can steer your assistant toward MCP tools using a steering document if you prefer consistency.
Security and governance boundaries
A core benefit of this integration is that your existing security and governance controls remain enforced. Your editor connects to your SageMaker Space through a secure SSH tunnel managed by the AWS Toolkit. It does not bypass your organization’s access controls. Data access is governed by the same AWS Lake Formation permissions and IAM Identity Center authentication that apply when you work in the SageMaker Unified Studio portal directly. Your project-level permissions, database grants, and column-level security policies apply consistently whether a query originates from an AI agent, a notebook cell, or the SageMaker console. Data access is governed by the boundaries you define in your SageMaker Unified Studio domain and project configuration.
Clean up
To avoid ongoing charges from billable resources (SageMaker Space compute charges per hour, AWS Glue sessions charge per DPU-hour, Amazon Athena queries charge per TB scanned):
Stop your Space – In the SageMaker Unified Studio portal, navigate to your project’s Spaces and stop the Space you used for this walkthrough.
Disconnect: Close the remote connection in your editor (File → Close Remote Connection).
Verify AWS Glue sessions are terminated – If you ran PySpark queries during this walkthrough, verify that the sessions are stopped. In the SageMaker Unified Studio portal, navigate to Data processing and confirm no active AWS Glue sessions remain. Sessions auto-terminate when the Space stops, but verify to avoid unexpected charges.
Delete demo resources (optional) – File deletion is permanent and cannot be undone. Back up any work that you want to retain before proceeding. If you created scripts or files during this walkthrough that you no longer need, delete them from /home/sagemaker-user/. For example, delete any test notebooks, Python scripts, or generated data files. The sample sagemaker_sample_db.churn dataset is read-only and doesn’t need cleanup.
Conclusion
This post showed what happens when agentic AI meets governed data, and walked through how to set it up yourself.
Three key insights emerged from this hands-on experience:
SageMaker Unified Studio steering files transform the developer experience. Your AI assistant is project-aware from the first prompt, understanding your environment and available data without manual setup.
MCP servers bridge “AI that writes code” with “AI that queries your data”. The smus_local and aws-dataprocessing servers are essential for effective agentic data work.
The “explore first” pattern pays immediate dividends. When your AI assistant understands your data before writing code, it makes smarter engine choices and produces correct analytics on the first pass.
This integration brings together two capabilities that are stronger together: your IDE handles the AI-assisted coding and iteration, while SageMaker Unified Studio handles data governance, access control, and compute management. You get the productivity of an agentic AI coding assistant without compromising on the controls your organization requires.
This week, New York City is hosting AWS Summit, bringing together builders, customers, and AWS teams for a full day of announcements, demos, and technical sessions at the Javits Center. I wrote blog posts for some of the Summit launches, so I am excited to see them go live this week. I just won’t be watching from the Javits Center. I’ll be at a four-day music festival, following the launches on my phone while trying to figure out how to put up a tent. If you weren’t able to attend in person like me, the keynote livestream is available on June 17, with Dr. Swami Sivasubramanian, VP of Agentic AI, and Chet Kapoor, VP of Security Services and Observability, covering new capabilities across developer tools, AI infrastructure, and security.
Here’s what happened this week.
Headlines How frontier teams are reinventing AI-native development — Swami published a detailed post this week drawing on data from experiments across hundreds of Amazon engineering teams. The findings are worth reading carefully if you are thinking about how to structure AI adoption on your own team.
A six-engineer team rebuilt the Amazon Bedrock inference engine in 76 days, a project originally scoped for 30 developers over 12 to 18 months. The median productivity gain across structured pilots with Amazon Stores teams was 4.5x in normalized deployment velocity, with some teams exceeding 10x. Perfect Order Experience went from a two-week feature cycle to shipping in an afternoon. WW Grocery cut design document creation from five days to a few hours.
The post distills these results into five practices for becoming a frontier team. First, invest in agent context: build steering files, coding standards, and structured repositories before writing production code. Second, expect an initial slowdown while workflows are restructured, and push through it. Third, maintain a steady backlog of well-scoped tasks so agents can run in parallel without constant supervision. Fourth, make intent explicit through structured specifications before code generation begins. Fifth, shift testing left so agents can self-correct before code reaches the pipeline.
The post closes with a note that commit velocity is only part of the picture, and that a follow-up will cover release management, operations, security operations, and EOL upgrades.
AWS FinOps Agent is now available in preview — AWS FinOps Agent is a new agent for FinOps practitioners and engineering teams that answers cost questions, surfaces optimization opportunities, investigates cost anomalies, and runs recurring FinOps workflows on a defined schedule. You can use it to query your AWS costs, generate cost reports for finance and engineering teams, and surface rightsizing, idle resource, and Savings Plans recommendations from AWS Cost Optimization Hub and AWS Compute Optimizer. The agent can open Jira tickets on your behalf based on those recommendations. When a cost anomaly is detected, FinOps Agent can automatically investigate the root cause and post findings to a Slack channel.
Last week’s launches I’ll start with one I wrote this week, then cover the other launches that caught my attention:
Amazon EC2 M9g and M9gd instances are now generally available — Powered by AWS Graviton5 processors and built on the sixth-generation AWS Nitro System, M9g instances deliver up to 25% better compute performance compared to Graviton4-based instances, with up to 35% faster performance for web applications, up to 35% for machine learning inference, and up to 30% for databases. Graviton5 is the first processor in the AWS fleet to support PCIe Gen6 and DDR5-8800 memory, and includes a 5x larger L3 cache compared to the previous generation. M9g and M9gd instances offer up to 15% higher network bandwidth and 20% higher Amazon EBS bandwidth on average across sizes compared to M8g. This release also introduces the Nitro Isolation Engine, an enhancement to the Nitro System that uses formal verification to provide mathematically proven isolation between virtual machines — establishing Nitro as the first formally verified cloud hypervisor. M9gd instances add up to 11.4 TB of NVMe SSD local storage with 30% higher IOPS compared to M8gd. Both instance types support Instance Bandwidth Configuration (IBC) for adjusting bandwidth allocation between EBS and VPC networking by up to 25%.
Anthropic Claude Fable 5 on Amazon Bedrock — Claude Fable 5 launched on Amazon Bedrock on June 9, bringing extended asynchronous task execution, advanced vision capabilities across diagrams, charts, and PDFs, and proactive self-verification. Access requires opting into data sharing via the Data Retention API before invoking the model; Anthropic requires 30-day retention of inputs and outputs for Mythos-class models. Important note on availability: On June 12, Anthropic asked AWS to revoke access to Claude Fable 5 and Claude Mythos 5 for all users to support compliance with a US Government export control directive. All other models, including Opus 4.8, are unaffected. Read the Anthropic statement for details. AWS will share further updates as they become available.
Gemma 4 models are now available on Amazon Bedrock — The Gemma 4 family from Google DeepMind is now available on Amazon Bedrock across three variants: Gemma 4 31B (dense, 256K-token context window, suited for reasoning and coding workloads), Gemma 4 26B-A4B (mixture-of-experts architecture, targeting cost- and latency-sensitive workloads), and Gemma 4 E2B (smallest variant, designed for low-latency interactive use cases). All three support native function calling, structured output, reasoning, response streaming, multimodal input across text, image, video, and audio, and more than 35 languages.
Amazon OpenSearch Service launches MCP Apps for agentic observability — Amazon OpenSearch Service now supports MCP Apps, enabling observability workflows inside compatible agentic IDEs including Claude Desktop and VS Code. An AI agent in your local environment can investigate incidents using logs, traces, metrics, and alerts stored in OpenSearch domains, collections, and Amazon Managed Service for Prometheus. Each MCP App tool call returns a dual response: a text summary for the agent to reason over and an interactive visualization rendered in the same conversation thread. Available MCP App tools cover log, metrics, and trace investigation; service performance; topology; dynamic visualizations; agent health; cluster health; and instrumentation scoring.
Other AWS news Here are some additional posts and updates you may find useful:
AWS CLI v1 enters maintenance mode — When CLI v1 enters maintenance mode, the botocore and s3transfer dependencies will be vendored directly into the CLI v1 codebase rather than installed as separate packages. This means upgrading CLI v1 will no longer update the standalone botocore or s3transfer packages, and installing those packages independently will have no effect on the versions used by CLI v1. Environments with both CLI v1 and boto3 installed will contain separate copies of these libraries. New CLI v1 releases will be limited to critical bug fixes and security issues. The recommended path is to migrate to AWS CLI v2.
AWS Workload Credentials Provider is now available — AWS has launched a new Workload Credentials Provider that enables workloads to obtain short-term AWS credentials without requiring long-term access keys. This supports credential management for applications running outside of AWS, giving teams a way to follow least-privilege access patterns for workloads in third-party or on-premises environments.
Kiro Pro Max is now available — Kiro has introduced a new Pro Max tier, adding higher usage limits, access to the latest frontier models, and additional agentic capabilities for development teams. Kiro Pro Max is designed for professional developers who need sustained, high-volume use across coding, specification generation, and agent-driven tasks.
Upcoming AWS events Check your calendar and sign up for upcoming AWS events:
This post is part of our Weekly Roundup series. Check back each week for a quick roundup of interesting news and announcements from AWS!
The collective thoughts of the interwebz
Manage Consent
To provide the best experiences, we use technologies like cookies to store and/or access device information. Consenting to these technologies will allow us to process data such as browsing behavior or unique IDs on this site. Not consenting or withdrawing consent, may adversely affect certain features and functions.
Functional
Always active
The technical storage or access is strictly necessary for the legitimate purpose of enabling the use of a specific service explicitly requested by the subscriber or user, or for the sole purpose of carrying out the transmission of a communication over an electronic communications network.
Preferences
The technical storage or access is necessary for the legitimate purpose of storing preferences that are not requested by the subscriber or user.
Statistics
The technical storage or access that is used exclusively for statistical purposes.The technical storage or access that is used exclusively for anonymous statistical purposes. Without a subpoena, voluntary compliance on the part of your Internet Service Provider, or additional records from a third party, information stored or retrieved for this purpose alone cannot usually be used to identify you.
Marketing
The technical storage or access is required to create user profiles to send advertising, or to track the user on a website or across several websites for similar marketing purposes.
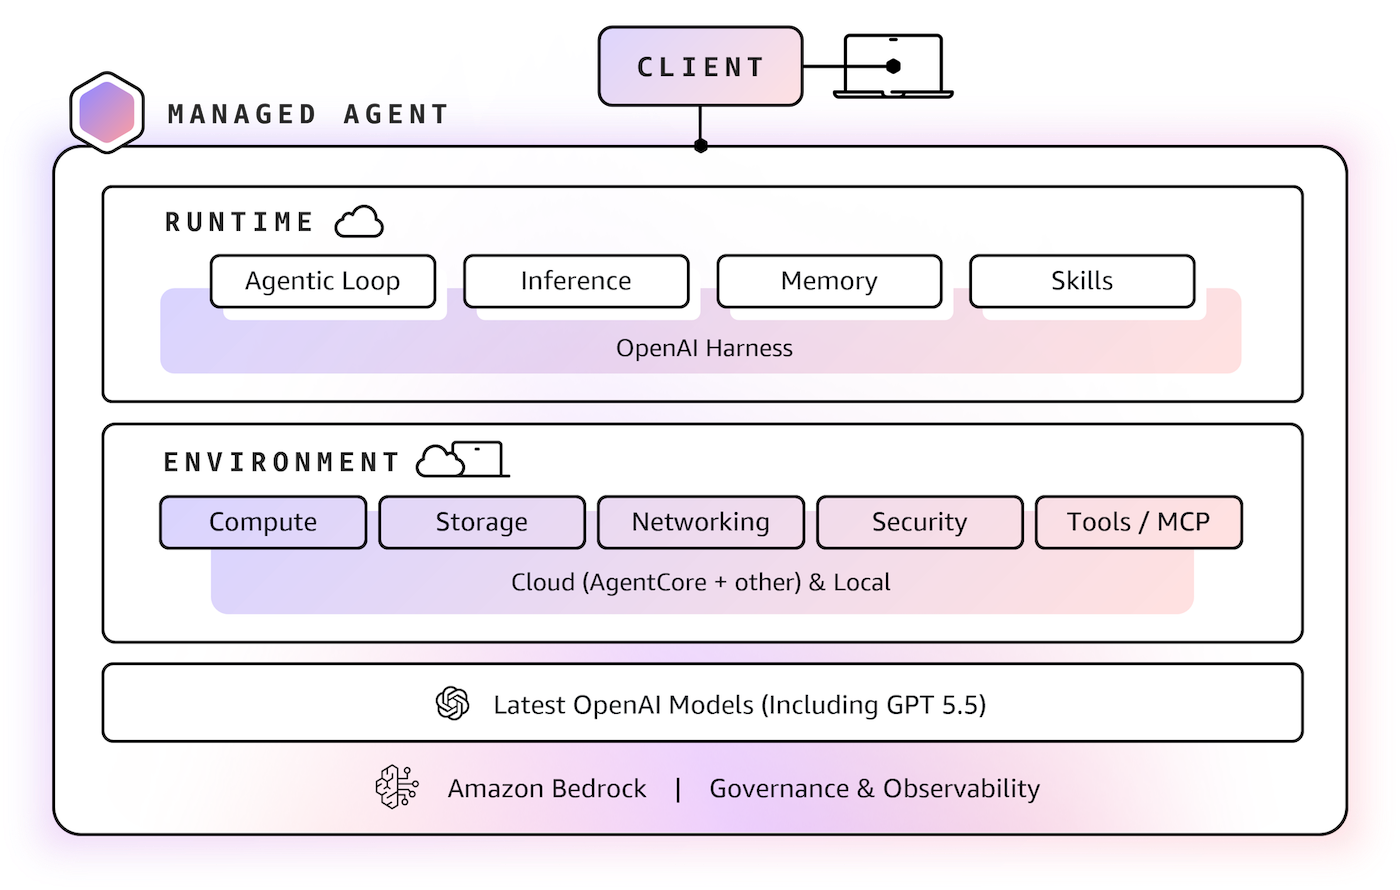 You can choose an execution environment: self-hosted compute to use an existing development machine, container, or compute environment or Amazon Bedrock AgentCore Runtime, for managed runtime sessions and configurable storage in your AWS account. To learn more, visit the Amazon Bedrock documentation.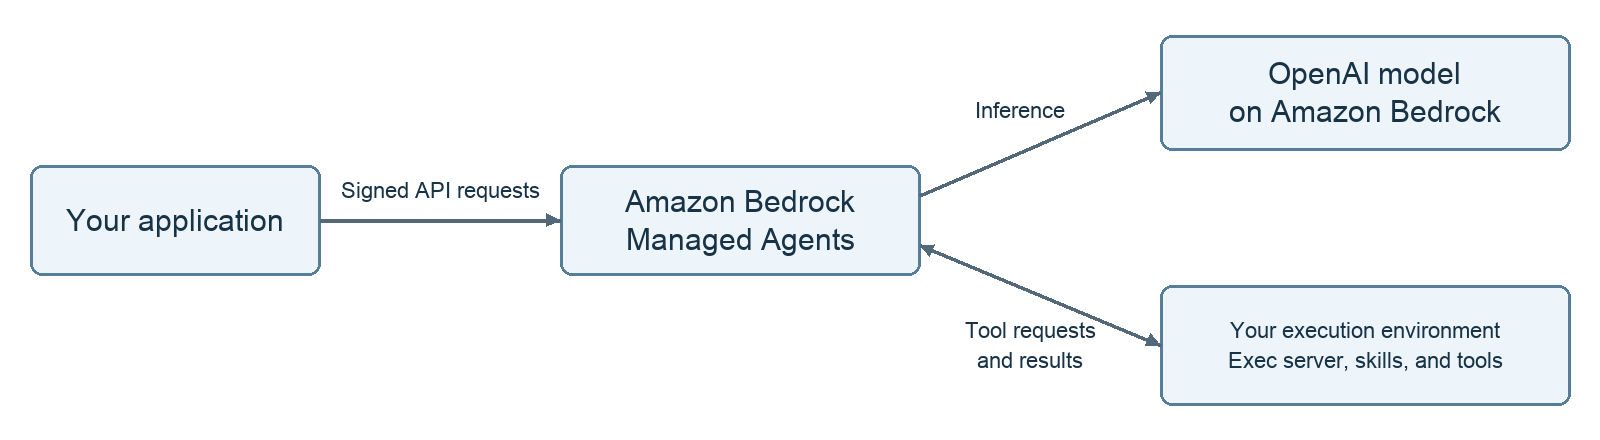
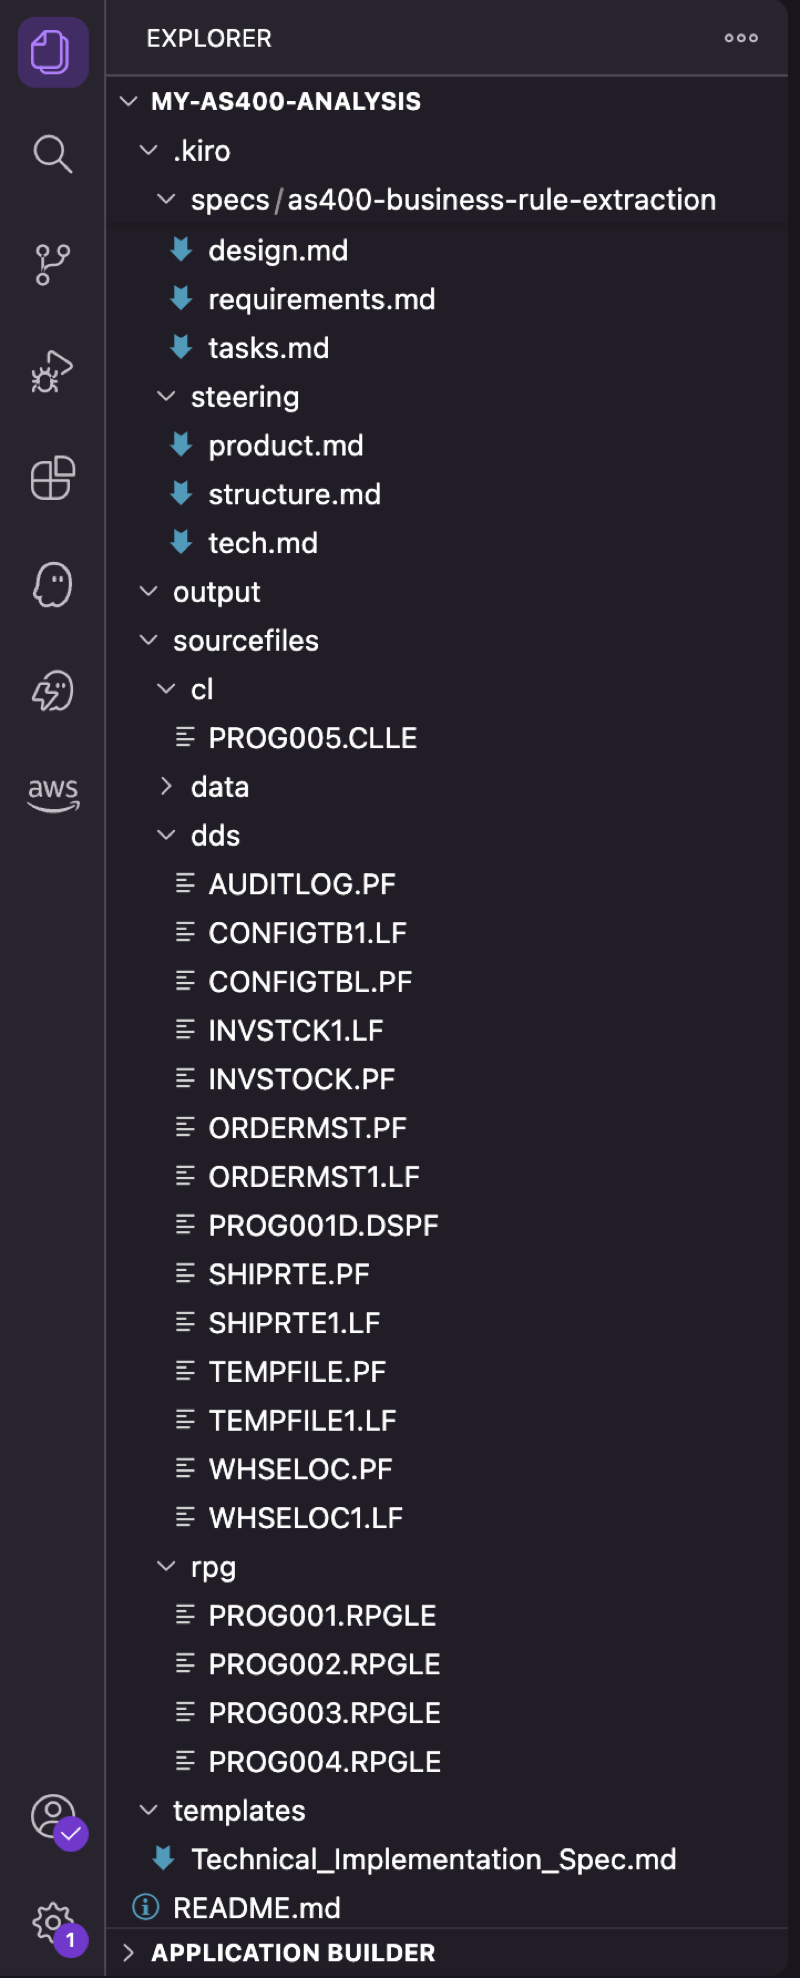
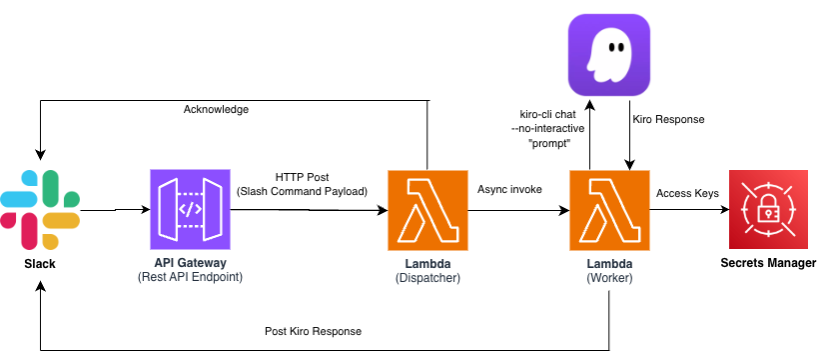

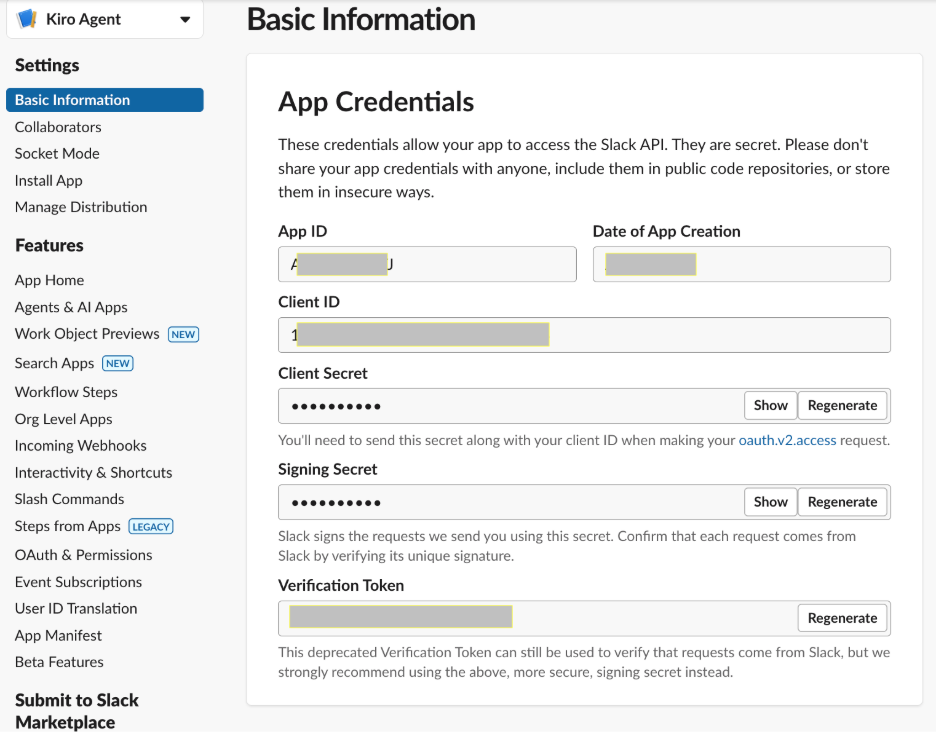
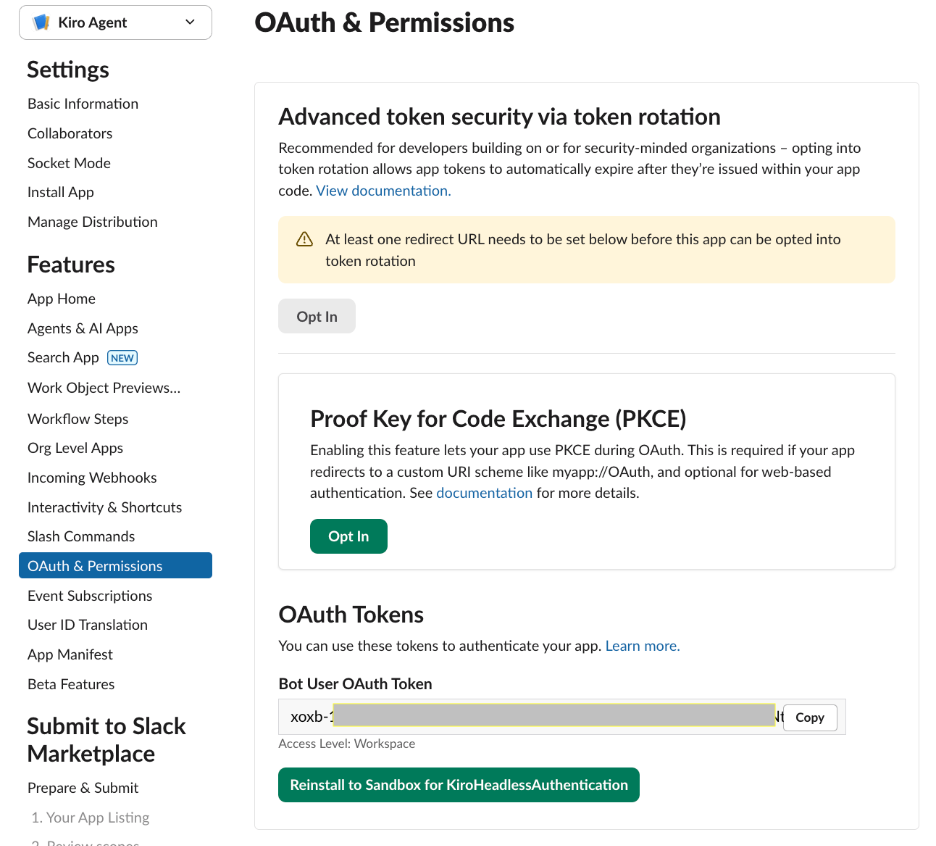
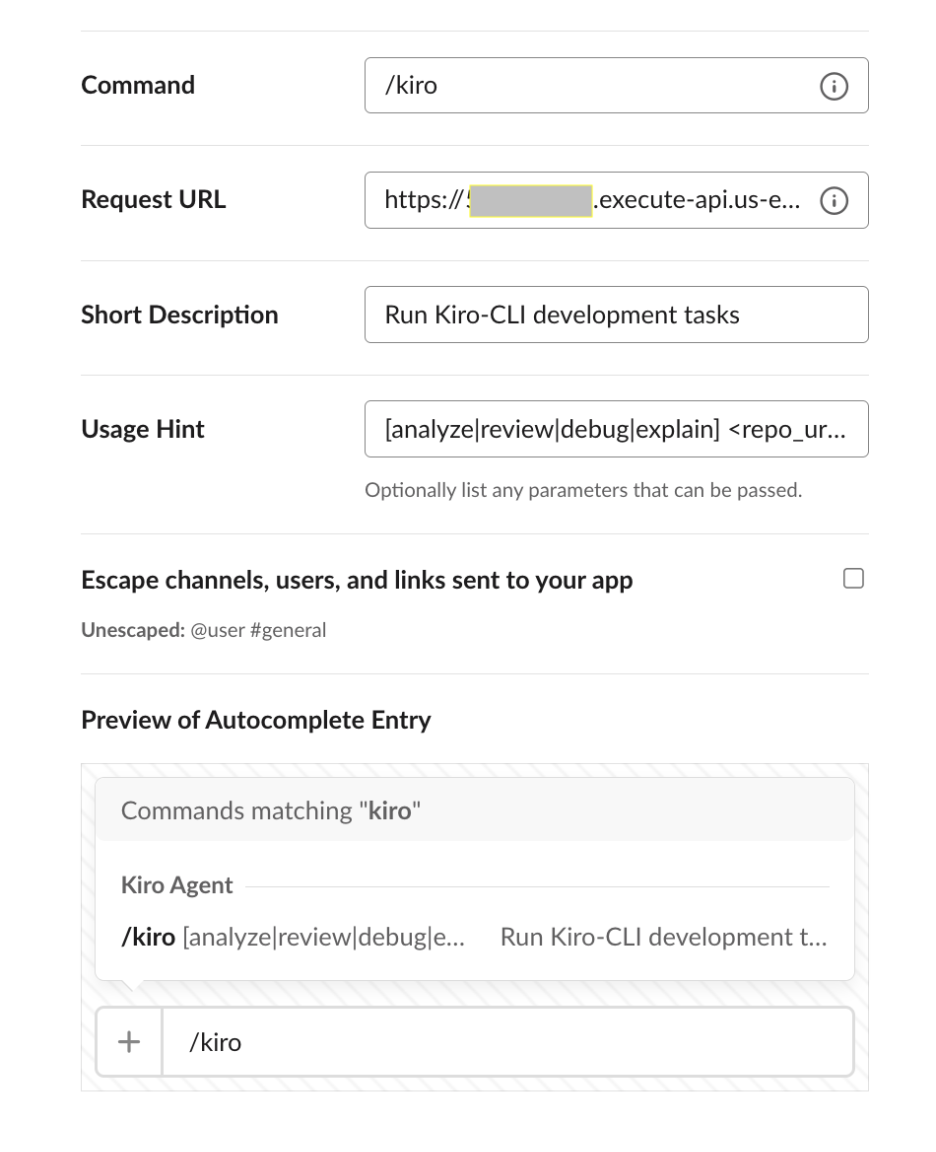

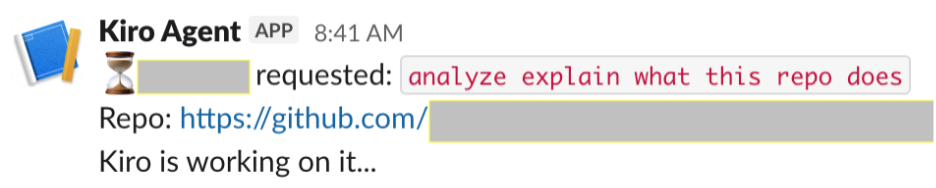
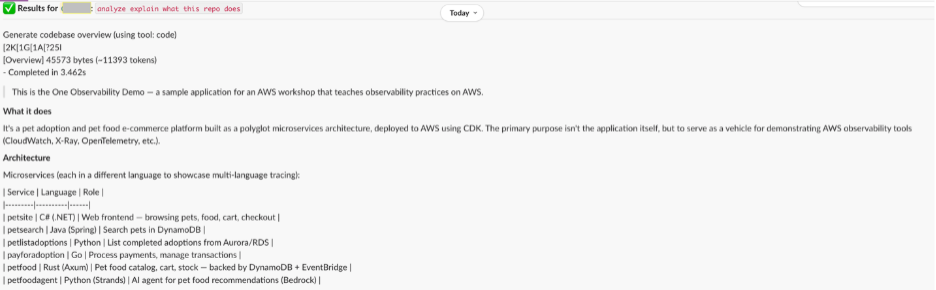
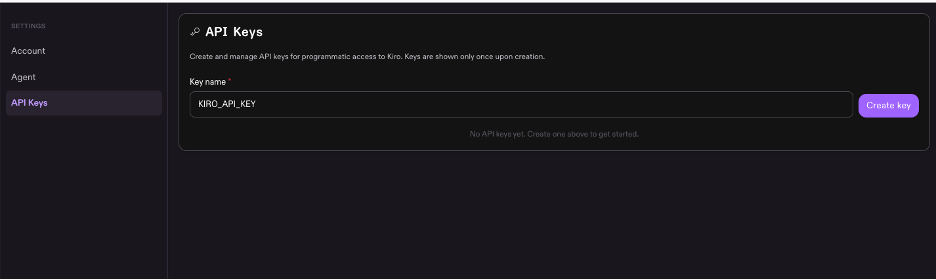
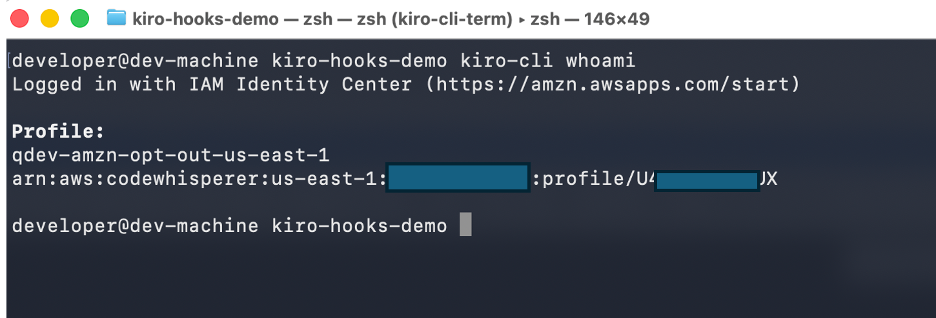
 KIRO_API_KEY not set. Skipping Kiro pre-commit analysis."
exit 0
fi
# Get list of staged files (only added, modified, or renamed)
STAGED_FILES=$(git diff --cached --name-only --diff-filter=AMR)
if [ -z "$STAGED_FILES" ]; then
echo "No staged files to analyze."
exit 0
fi
# Get the actual diff content for context
DIFF_CONTENT=$(git diff --cached)
echo "???? Kiro CLI: Analyzing $(echo "$STAGED_FILES" | wc -l | tr -d ' ') staged file(s)..."
# Run Kiro CLI analysis on staged changes (timeout after 30s to avoid hanging offline)
RESULT=$(timeout 30 kiro-cli chat --no-interactive "You are a pre-commit code reviewer. Analyze ONLY the following staged changes for critical issues that should block this commit.
STAGED FILES:$STAGED_FILES
DIFF:$DIFF_CONTENT
Check for:
1. SECURITY: Hardcoded secrets, API keys, passwords, tokens in the diff
2. SECURITY: SQL injection, XSS, or command injection vulnerabilities
3. BUGS: Obvious logic errors, null pointer risks, off-by-one errors
4. PERFORMANCE: Accidentally committed debug code, console.log statements, sleep calls
Rules:
- Only flag issues that are clearly problems. Do not flag style preferences.
- If you find a SECURITY issue, output a line starting with BLOCK: followed by the reason.
- If you find a BUG or PERFORMANCE issue, output a line starting with WARN: followed by the reason.
- If everything looks clean, output a single line: PASS
Be concise. This runs on every commit - speed matters." 2>&1) || {
EXIT_CODE=$?
if [ $EXIT_CODE -eq 124 ]; then
echo "
KIRO_API_KEY not set. Skipping Kiro pre-commit analysis."
exit 0
fi
# Get list of staged files (only added, modified, or renamed)
STAGED_FILES=$(git diff --cached --name-only --diff-filter=AMR)
if [ -z "$STAGED_FILES" ]; then
echo "No staged files to analyze."
exit 0
fi
# Get the actual diff content for context
DIFF_CONTENT=$(git diff --cached)
echo "???? Kiro CLI: Analyzing $(echo "$STAGED_FILES" | wc -l | tr -d ' ') staged file(s)..."
# Run Kiro CLI analysis on staged changes (timeout after 30s to avoid hanging offline)
RESULT=$(timeout 30 kiro-cli chat --no-interactive "You are a pre-commit code reviewer. Analyze ONLY the following staged changes for critical issues that should block this commit.
STAGED FILES:$STAGED_FILES
DIFF:$DIFF_CONTENT
Check for:
1. SECURITY: Hardcoded secrets, API keys, passwords, tokens in the diff
2. SECURITY: SQL injection, XSS, or command injection vulnerabilities
3. BUGS: Obvious logic errors, null pointer risks, off-by-one errors
4. PERFORMANCE: Accidentally committed debug code, console.log statements, sleep calls
Rules:
- Only flag issues that are clearly problems. Do not flag style preferences.
- If you find a SECURITY issue, output a line starting with BLOCK: followed by the reason.
- If you find a BUG or PERFORMANCE issue, output a line starting with WARN: followed by the reason.
- If everything looks clean, output a single line: PASS
Be concise. This runs on every commit - speed matters." 2>&1) || {
EXIT_CODE=$?
if [ $EXIT_CODE -eq 124 ]; then
echo " Commit blocked by Kiro CLI. Fix the issues above and try again."
echo " To bypass this hook: git commit --no-verify"
exit 1
fi
# Warn but allow commit for non-blocking issues
if echo "$RESULT" | grep -q "WARN:"; then
echo ""
echo "
Commit blocked by Kiro CLI. Fix the issues above and try again."
echo " To bypass this hook: git commit --no-verify"
exit 1
fi
# Warn but allow commit for non-blocking issues
if echo "$RESULT" | grep -q "WARN:"; then
echo ""
echo " Kiro CLI pre-commit check passed."
exit 0
Kiro CLI pre-commit check passed."
exit 0