Tag Archives: alerting

Improved Alerting with Atlas Streaming Eval

Post Syndicated from Netflix Technology Blog original https://netflixtechblog.com/improved-alerting-with-atlas-streaming-eval-e691c60dc61e

Ruchir Jha, Brian Harrington, Yingwu Zhao

TL;DR

  • Streaming alert evaluation scales much better than the traditional approach of polling time-series databases.
  • It allows us to overcome high dimensionality/cardinality limitations of the time-series database.
  • It opens doors to support more exciting use-cases.

Engineers want their alerting system to be realtime, reliable, and actionable. While actionability is subjective and may vary by use-case, reliability is non-negotiable. In other words, false positives are bad but false negatives are the absolute worst!

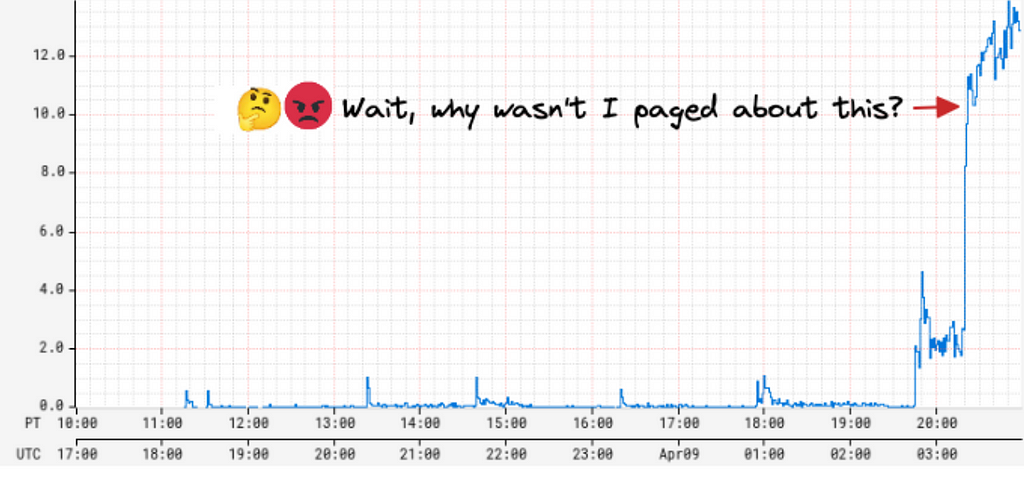
A few years ago, we were paged by our SRE team due to our Metrics Alerting System falling behind — critical application health alerts reached engineers 45 minutes late! As we investigated the alerting delay, we found that the number of configured alerts had recently increased dramatically, by 5 times! The alerting system queried Atlas, our time series database on a cron for each configured alert query, and was seeing an elevated throttle rate and excessive retries with backoffs. This, in turn, increased the time between two consecutive checks for an alert, causing a global slowdown for all alerts. On further investigation, we discovered that one user had programmatically created tens of thousands of new alerts. This user represented a platform team at Netflix, and their goal was to build alerting automation for their users.

While we were able to put out the immediate fire by disabling the newly created alerts, this incident raised some critical concerns around the scalability of our alerting system. We also heard from other platform teams at Netflix who wanted to build similar automation for their users who, given our state at the time, wouldn’t have been able to do so without impacting Mean Time To Detect (MTTD) for all others. Rather, we were looking at an order of magnitude increase in the number of alert queries just over the next 6 months!

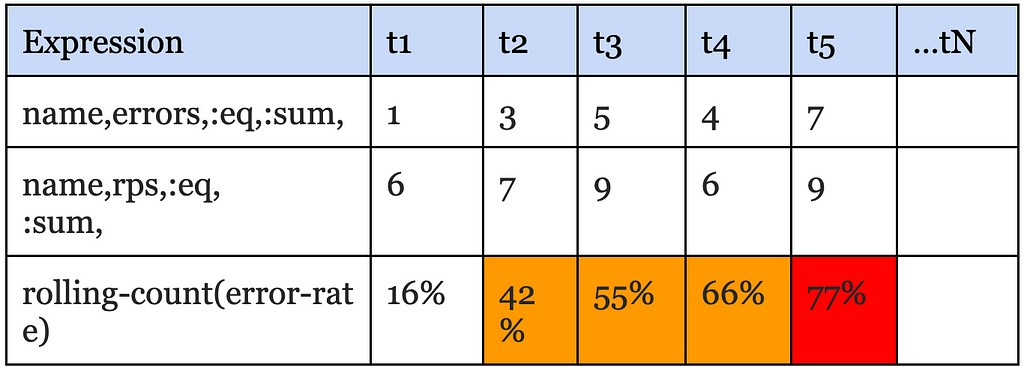
Since querying Atlas was the bottleneck, our first instinct was to scale it up to meet the increased alert query demand; however, we soon realized that would increase Atlas cost prohibitively. Atlas is an in-memory time-series database that ingests multiple billions of time-series per day and retains the last two weeks of data. It is already one of the largest services at Netflix both in size and cost. While Atlas is architected around compute & storage separation, and we could theoretically just scale the query layer to meet the increased query demand, every query, regardless of its type, has a data component that needs to be pushed down to the storage layer. To serve the increasing number of push down queries, the in-memory storage layer would need to scale up as well, and it became clear that this would push the already expensive storage costs far higher. Moreover, common database optimizations like caching recently queried data don’t really work for alerting queries because, generally speaking, the last received datapoint is required for correctness. Take for example, this alert query that checks if errors as a % of total RPS exceeds a threshold of 50% for 4 out of the last 5 minutes:

name,errors,:eq,:sum,
name,rps,:eq,:sum,
:div,
100,:mul,
50,:gt,
5,:rolling-count,4,:gt,

Say if the datapoint received for the last time interval leads to a positive evaluation for this query, relying on stale/cached data would either increase MTTD or result in the perception of a false negative, at least until the missing data is fetched and evaluated. It became clear to us that we needed to solve the scalability problem with a fundamentally different approach. Hence, we started down the path of alert evaluation via real-time streaming metrics.

High Level Architecture

The idea, at a high level, was to avoid the need to query the Atlas database almost entirely and transition most alert queries to streaming evaluation.

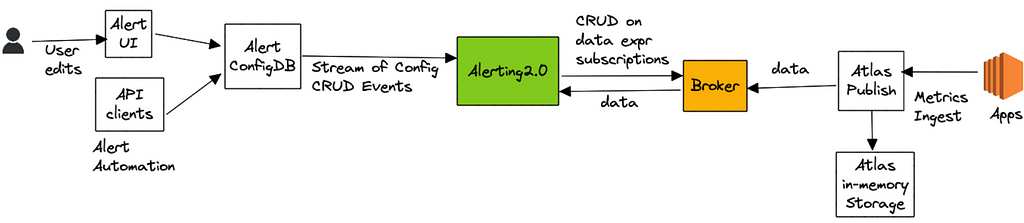
Alert queries are submitted either via our Alerting UI or by API clients, which are then saved to a custom config database that supports streaming config updates (full snapshot + update notifications). The Alerting Service receives these config updates and hashes every new or updated alert query for evaluation to one of its nodes by leveraging Edda Slots. The node responsible for evaluating a query, starts by breaking it down into a set of “data expressions” and with them subscribes to an upstream “broker” service. Data expressions define what data needs to be sourced in order to evaluate a query. For the example query listed above, the data expressions are name,errors,:eq,:sum and name,rps,:eq,:sum. The broker service acts as a subscription manager that maps a data expression to a set of subscriptions. In addition, it also maintains a Query Index of all active data expressions which is consulted to discern if an incoming datapoint is of interest to an active subscriber. The internals here are outside the scope of this blog post.

Next, the Alerting service (via the atlas-eval library) maps the received data points for a data expression to the alert query that needs them. For alert queries that resolve to more than one data expression, we align the incoming data points for each one of those data expressions on the same time boundary before emitting the accumulated values to the final eval step. For the example above, the final eval step would be responsible for computing the ratio and maintaining the rolling-count, which is keeping track of the number of intervals in which the ratio crossed the threshold as shown below:

The atlas-eval library supports streaming evaluation for most if not all Query, Data, Math and Stateful operators supported by Atlas today. Certain operators such as offset, integral, des are not supported on the streaming path.

OK, Results?

First and foremost, we have successfully alleviated our initial scalability problem with the polling based architecture. Today, we run 20X the number of queries we used to run a few years ago, with ease and at a fraction of what it would have cost to scale up the Atlas storage layer to serve the same volume. Multiple platform teams at Netflix programmatically generate and maintain alerts on behalf of their users without having to worry about impacting other users of the system. We are able to maintain strong SLAs around Mean Time To Detect (MTTD) regardless of the number of alerts being evaluated by the system.

Additionally, streaming evaluation allowed us to relax restrictions around high cardinality that our users were previously running into — alert queries that were rejected by Atlas Backend before due to cardinality constraints are now getting checked correctly on the streaming path. In addition, we are able to use Atlas Streaming to monitor and alert on some very high cardinality use-cases, such as metrics derived from free-form log data.

Finally, we switched Telltale, our holistic application health monitoring system, from polling a metrics cache to using realtime Atlas Streaming. The fundamental idea behind Telltale is to detect anomalies on SLI metrics (for example, latency, error rates, etc). When such anomalies are detected, Telltale is able to compute correlations with similar metrics emitted from either upstream or downstream services. In addition, it also computes correlations between SLI metrics and custom metrics like the log derived metrics mentioned above. This has proven to be valuable towards reducing Mean Time to Recover (MTTR). For example, we are able to now correlate increased error rates with increased rate of specific exceptions occurring in logs and even point to an exemplar stacktrace, as shown below:

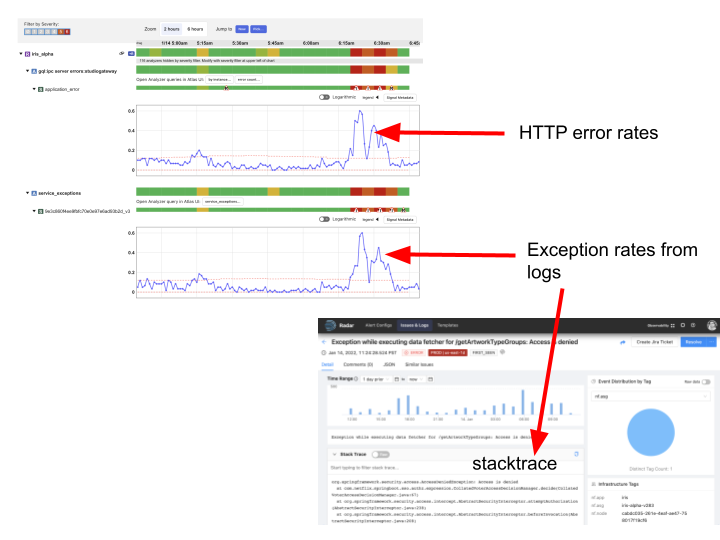
Our logs pipeline fingerprints every log message and attaches a (very high cardinality) fingerprint tag to a log events counter that is then emitted to Atlas Streaming. Telltale consumes this metric in a streaming fashion to identify fingerprints that correlate with anomalies seen in SLI metrics. Once an anomaly is found, we query the logs backend with the fingerprint hash to obtain the exemplar stacktrace. What’s more is we are now able to identify correlated anomalies (and exceptions) occurring in services that may be N hops away from the affected service. A system like Telltale becomes more effective as more services are onboarded (and for that matter the full service graph), because otherwise it becomes difficult to root cause the problem, especially in a microservices-based architecture. A few years ago, as noted in this blog, only about a hundred services were using Telltale; thanks to Atlas Streaming we have now managed to onboard thousands of other services at Netflix.

Finally, we realized that once you remove limits on the number of monitored queries, and start supporting much higher metric dimensionality/cardinality without impacting the cost/performance profile of the system, it opens doors to many exciting new possibilities. For example, to make alerts more actionable, we may now be able to compute correlations between SLI anomalies and custom metrics with high cardinality dimensions, for example an alert on elevated HTTP error rates may be able to point to impacted customer cohorts, by linking to precisely correlated exemplars. This would help developers with reproducibility.

Transitioning to the streaming path has been a long journey for us. One of the challenges was difficulty in debugging scenarios where the streaming path didn’t agree with what is returned by querying the Atlas database. This is especially true when either the data is not available in Atlas or the query is not supported because of (say) cardinality constraints. This is one of the reasons it has taken us years to get here. That said, early signs indicate that the streaming paradigm may help with tackling a cardinal problem in observability — effective correlation between the metrics & events verticals (logs, and potentially traces in the future), and we are excited to explore the opportunities that this presents for Observability in general.


Improved Alerting with Atlas Streaming Eval was originally published in Netflix TechBlog on Medium, where people are continuing the conversation by highlighting and responding to this story.

Handy Tips #19: Preventing alert storms with trigger dependencies

Post Syndicated from Arturs Lontons original https://blog.zabbix.com/handy-tips-19-preventing-alert-storms-with-trigger-dependencies/18696/

Prevent receiving a flood of unwanted alerts and receive only the most critical notifications by defining trigger dependencies.

Every IT infrastructure has multiple elements, failure of which can cause a cascading set of problems across the particular infrastructure segment. It is important to prevent an unwanted alert storm and highlight only the root cause problem within the problem chain.

Define trigger dependencies to prevent alert storms:

  • Only the most critical problems will be displayed in Zabbix
  • Dependent triggers will not generate problems until the parent trigger is in an OK state

  • Each trigger can have multiple trigger dependencies
  • Trigger dependencies can be defined between triggers on different hosts

Check out the video to learn how to define trigger dependencies.

How to define a trigger dependency:
 
  1. Navigate to Configuration → Hosts
  2. Find the host for which you will define the trigger dependency
  3. Click on the triggers button next to the host
  4. Open the trigger for which you will define the dependency
  5. Click on the Dependencies tab
  6. Click add and select the host containing the parent trigger
  7. Select the trigger on which the current trigger will depend on
  8. If required, add more trigger dependencies
  9. Click the Update button
  10. Simulate a problem to test the dependency
  11. Navigate to Monitoring → Problems and observe the trigger dependency behavior

Tips and best practices:
  • The dependent trigger will only be re-evaluated once the related item receives new metrics
  • Trigger dependency may be added between host triggers as long as it wouldn’t result in a circular dependency
  • A trigger dependency chain between multiple hosts can be created
  • Zabbix will not execute actions for the dependent trigger if the parent trigger is in a problem state

The post Handy Tips #19: Preventing alert storms with trigger dependencies appeared first on Zabbix Blog.

Simplifying Zabbix API workflows with named Zabbix API tokens

Post Syndicated from Arturs Lontons original https://blog.zabbix.com/simplifying-zabbix-api-workflows-with-named-zabbix-api-tokens/16653/

Zabbix API enables you to collect any and all information from your Zabbix instance by using a multitude of API methods. You can even utilize Zabbix API calls in your HTTP items. For example, this can be used to monitor the number of particular sets of metrics and visualize their growth over time. With named Zabbix API tokens, such use cases are a lot more simple to implement.

Before Zabbix 5.4 we had to perform the user.login API call to obtain the authentication token. Once the user session was closed, we had to relog, obtain the new authentication token and use it in the subsequent API calls.

With the pre-defined named Zabbix API tokens, you don’t have to constantly check if the authentication token needs to be updated. Starting from Zabbix 5.4 you can simply create a new named Zabbix API token with an expiration date and use it in your API calls.

Creating a new named Zabbix API token

The Zabbix API token creation process is extremely simple. All you have to do is navigate to Administration – General – API tokens and create a new API token. The named API tokens are created for a particular user and can have an optional expiration date and time – otherwise, the tokens are defined without an expiry date.

You can create a named API token in the API tokens section, under Administration – General

Once the Token has been created, make sure to store it somewhere safe, since you won’t be able to recover it afterward. If the token is lost – you will have to recreate it.

Make sure to store the auth token!

Don’t forget, that when defining a role for the particular API user, we can restrict which API methods this user has access to.

Simplifying API tasks with the named API token

There are many different use cases where you could implement Zabbix API calls to collect some additional information. For this blog post, I will create an HTTP item that uses item.get API call to monitor the number of unsupported items.

To achieve that, I will create an HTTP item on a host (This can be the default Zabbix server host or a host dedicated to collecting metrics via Zabbix API calls) and provide the API call in the request body. Since the named API token now provides a static authentication token until it expires, I can simply use it in my API call without the need to constantly keep it updated.

An HTTP agent item that uses a Zabbix API call in its request body

{
    "jsonrpc": "2.0",
    "method": "item.get",
    "params": {
			"countOutput":"1",
			 "filter": {
 "state": "1"
 }
    },
    "id": 2,
    "auth": "b72be8cf163438aacc5afa40a112155e307c3548ae63bd97b87ff4e98b1f7657"
}

HTTP item request body, which returns a count of unsupported items

I will also use regular expression preprocessing to obtain the numeric value from the API call result – otherwise, we won’t be able to graph our value or calculate trends for it.

Regular expression preprocessing step to obtain a numeric value from our Zabbix API call result

Utilizing Zabbix API scripts in Actions

In one of our previous blog posts, we covered resolving problems automatically with the event.acknowledge API method. The logic defined in the blog post was quite complex since we needed to keep an eye out for the authentication tokens and use a custom script to keep them up to date. With named Zabbix API tokens, this use case is a lot more simple.

All I have to do is create an Action operation script containing my API call and pass it to an action operation.

Action operation script that invokes Zabbix event.acknowledge API method

curl -sk -X POST -H "Content-Type: application/json" -d "
{
\"jsonrpc\": \"2.0\",
\"method\": \"event.acknowledge\",
\"params\": {
\"eventids\": \"{EVENT.ID}\",
\"action\": 1,
\"message\": \"Problem resolved.\"
},
\"auth\": \"<Place your authentication token here>",
\"id\": 2
}" <Place your Zabbix API endpoint URL here>

Problem remediation script example

Now my problems will get closed automatically after the time period which I have defined in my action.

Action operation which runs our event.acknowledge Zabbix API script

These are but a few examples that we can now achieve by using API tokens. A lot of information can be obtained and filtered in a unique way via Zabbix API, thus providing you with a granular analysis of your monitored environment. If you have recently upgraded to Zabbix 5.4 or plan to upgrade to Zabbix 6.0 LTS in the future, I would recommend implementing named Zabbix API tokens to simplify your day-to-day workflow and consider the possibilities that this new feature opens up for you.

If you have any questions or if you wish to share your particular use case for data collection or task automation with Zabbix API – feel free to share them in the comments section below!

Supercharge Zabbix with powerful insights

Post Syndicated from alexk original https://blog.zabbix.com/supercharge-zabbix-with-powerful-insights/12841/

A new set of trigger functions for long-term analysis of trend data will allow Zabbix to analyze historical data and generate alerts on detected anomalies.

Contents

I. Types of monitoring (0:39)

II. Zabbix 5.2 new functions (5:34)

III. In a nutshell (13:28)
IV. Questions & Answers (14:17)

Types of monitoring

Let’s start with a philosophical observation. In many cases, configuring monitoring entities is a pretty straightforward exercise. For instance, we know that computers should have some free disk space as applications won’t work otherwise; that CPU should not run at 100oC; that user-facing application should respond in less than a couple of seconds, otherwise, users will notice and complain. To be alerted when any of these expectations fail, we need to use triggers. A trigger can be as simple as {Host:cpu.temp.avg(5m)} > 100.

However, in some situations, it is difficult to decide right from wrong. Some cases can’t be evaluated without a proper context. For instance, is it OK if RAM is 70% full?  The answer is our favorite ‘it depends’. If RAM was just 20% full a week ago, chances are big that some application is leaking and your memory usage will continue growing. But if your RAM usage stays at 70% for three years in a row, there are even better chances that it stays so for another three years.

Another it-depends example is web traffic monitoring. Intuitively, we know that it’s perfectly normal to have uneven traffic distribution across days of week or months. But every website has its usage patterns, so even when we figure out what is normal and what’s not for one specific website, it’s difficult to scale this knowledge to other websites.

Web traffic monitoring

So, in the grand scheme of things, it all boils down to finding a good baseline for parameters we want to monitor. And baselines are usually defined by previous knowledge.

So, in such cases, instead of figuring out a fixed threshold (some fixed value or percentage), we need to figure out data points in the past that we want to compare to our current data points.

  • Compare values to known thresholds.
{Host:cpu.temp.avg(5m)} > 100
  • Baseline — compare to unknown thresholds.

Finding the right points in the past (or rather, finding a good interval to look back to) is still something that the user must supply manually, even though we are also working on automating this in the future. But Zabbix 5.2 gives you some tools to make comparisons to baseline way easier.

Web traffic monitoring example

Let’s consider a history of website visits for an imaginary commerce site — shop.example.com.

Commercial site web traffic monitoring

The numbers are different at any given point in time, yet all these are normal in a certain context. Overall, we see a growing trend in 2020 as compared to 2019. But there are seasonal traffic spikes. The biggest ones are around Christmas.

Site administrators like to be informed of any traffic anomalies (such as fraud traffic, for example), but hate false positives caused by seasonal spikes.

If we want to detect anomalies here, we can get an average for some period and compare it to an average for the same period a year before.

If we know that our organic year-to-year growth is not likely to exceed, for instance, 15 %, then it’s seemingly easy to do this in virtually any version of Zabbix: we take the average traffic over 30 days and check if it exceeds the same period a year ago by more than 15 %.

However, there are a few problems with this trigger expression.

1. First, we look 1 year back in history. But if we look into Zabbix 5.0 documentation about triggers, we see this:

This means that we need to keep a full and detailed history for at least 1 year (13 months, in this specific case). It is a passable solution if we ingest the traffic data daily. But what if we do it every minute? What if we do it every minute for a thousand websites?

2. In Zabbix, we specify time as 30d and 365d. As you may know, in Zabbix, this is just a fancy way to specify 187,200 and 68,328,000 seconds. Zabbix 5.0 doesn’t have the time suffix for a month and a year just because this cannot be simply translated to the number of seconds. Even though 30d is very close to 28d and 31d, it’s still not the same.

3. The result of avg() function with or without the second time shift parameter always depends on the specific time of the calculation. This is because Zabbix calculates time shifts by subtracting the interval from the current time. This makes it impossible to calculate aggregates between, for instance, the first and the last day of a week, a month, or a year.

Zabbix 5.2 new functions

That is why we introduce new trigger functions, which address all the specified issues. We also added few other trigger features, which improve event presentation. These functions are similar to the non-trend counterparts but are optimized for baseline monitoring use cases.

trendavg(period, period_shift)
trendcount(period, period_shift)
trenddelta(period, period_shift)
trendmax(period, period_shift)
trendmin(period, period_shift)
  • The new functions use trends tables instead of history (do not forget to set proper trend storage period):

  • period and period_shift parameters use the Gregorian calendar instead of the number of seconds.

h (hour), d (day), w (week), M (month), and y (year).

  • These functions are easy on system resources because they do calculations only when a period ends.

In addition to the new trigger functions, we also added the ability to set customized event name.

The customized event name lets you fine-tune how the event looks in the Zabbix UI (in screens like problems and problem widget) and include trigger expression calculation results.

This field is optional, you can continue using the trigger Name field instead.

There is also a new macro {? … }. It can be used for expressions inside the event name.

Triggers

Let’s reconfigure our trigger in the Zabbix 5.2 style.

Zabbix 5.2-style triggers

Let’s see what are the arguments for trendavg() function: 1M and now/M.

  • The first argument means that we use calendar month as an aggregation period. So, depending on the month’s trendavg() will be doing calculations for, it will pick up the first and the last date of the month. The same goes for other possible interval suffixes — h for hour, d for day, w for week, and y for year.
  • The second parameter, as in regular aggregate functions, means a time shift. But to distinguish between old and new types of shifts, we call them period shifts. The period shift denotes the last point in the timeline for our aggregation.

For instance, for October 13, 2020, trendavg(1M) will calculate the value for the period from September 1, 2020, to September 30, 2020, and trendavg(1M, 1M-1y) will calculate the value for the period from September 1, 2019, to September 30, 2019.

Event name field

In Zabbix 5.2, you can continue using the Name field with the content copied to the Event name field. But if you specify the Event name, it will be used for all corresponding events instead.

The Event name supports the new macro {?…}, so you can put another trigger expression inside this macro to show some related calculations. We call it the expression macro. For instance, the Event name will be displayed on the Problem screen as follows:

Formatting functions

This trigger generates problems like this:

It’s already very useful, but this percentage will look better if we could round it up. It wouldn’t hurt to show what month we compare our traffic against. To do that, we have added two formatting functions:

  • fmtnum(digits)

— applicable to ITEM.VALUE, ITEM.LASTVALUE, and expression macros.
fmtnum(2) gives 14.85 instead of 14.8512345.

  • fmttime(format, time_shift)

— applicable to {TIME}.
— uses strftime format codes.
— formats time, for instance, {TIME}.fmttime(“%B,%Y”) gives October,2020.

Let’s see how we can improve our Event name with new formatting functions:

It looks somewhat scary on the trigger configuration screen, but Zabbix will reward us by generating events like this:

But the new functions are not limited to a single use case of comparing some data from a recent period to some past period.

Cloud budget monitoring example

Let’s consider another real-world example. Imagine that your IT department runs some very important services in the Cloud. And, of course, your finance department sends a monthly budget you don’t want to overrun. You receive cloud usage records from one or more cloud providers and ingest this data periodically into monitoring.

You could set up a trigger with a trendsum() by one month to check whether you exceeded your fixed budget in the previous months or not. But you want to know about the budget overrun ASAP. If you exceed your monthly budget in the middle of a month, your quick reaction might save the company money.

In the chart, we see the even distribution of cloud usage costs up to the last dates of September. Then the usage starts going up. When should you start worrying?

Again, the new trend functions come to the rescue.

The solution is to use the period_shift parameter, just not in the past, but rather in the future. For instance, if today’s date is October 22, this expression will calculate the sum() from October 1 to October 31.

  • trendsum(1M,now/M+1M)

There is one problem, though. To save precious computing resources, Zabbix evaluates these functions in triggers only when the period is over. However, these functions are also available in calculated items, and we can use arbitrary calculation intervals there.

So, the solution is to set up a calculated item, use trendsum() in the formula, and specify some reasonable update interval (for instance, one hour or one day).

Here, on the right-hand side of the chart, we see the current period, which is not over yet. Let’s take a look at the item definition.

This is the formula to calculate the current calendar period. Then, we can add a simple trigger referencing this calculated item:

Formula to calculate the current calendar period

You can also use the new expression macro in this trigger. You don’t need to have trend functions anywhere in the formula for this.


Once the trigger fires, you will see the following problem on the Problem screen — a nice and clean message containing all the information we need.

Use cases

There are many more possible applications for the new functions besides the examples above. Generally, these trend functions can be applied not only to IT metrics but also to many other real-world KPIs, for example:

— Business performance (to calculate annual revenue, profitability, etc.).
— Sales and marketing (for instance, monthly average, customer acquisition costs, sales target rate).
— Warehousing (such as weekly shipments, return rates, etc.).
— Human resources (for instance, annual training costs, overtime hours, etc.).
— Customer support (such as average response time or the number of issues per month).

We expect these functions to pave the way for Zabbix to new territories, which have been previously occupied by CRMs and other business analytics systems.

In a nutshell

  • Zabbix trend functions — a new way to analyze history without storing historical data.
  • Zabbix trend functions support calendar hours, days, weeks, months, and years.
  • New trigger field Event name – lets us display events with context.
  • New formatting functions let us present numbers and dates in a flexible manner.
  • Long-term data analysis just got easier and better with the new Zabbix 5.2.

Questions & Answers

Question. What’s the maximum time period for these new trigger functions? For how long can we analyze the data?

Answer. The maximum time period is not limited by any hardcoded values. The only limit you should keep in mind is just the size of your trend data history. But there are no limitations in the code whatsoever that would limit this use. You also should keep in mind that the longer is the period the bigger the database load is. That’s also a factor to consider.

Question. Is this trend data that we’re analyzing also going to be stored in the value cache or some other place?

Answer. it’s not stored in the value cache at the moment. These trigger functions recalculate their values only after the period is over. So it’s not of much use for value cache. But if this is required by some demanding applications, we’ll add this in the later versions.