Tag Archives: Amazon Redshift

Automate data archival for Amazon Redshift time series tables

Post Syndicated from Nita Shah original https://aws.amazon.com/blogs/big-data/automate-data-archival-for-amazon-redshift-time-series-tables/

Amazon Redshift is a fast, scalable, secure, and fully managed cloud data warehouse that makes it simple and cost-effective to analyze all of your data using standard SQL. Tens of thousands of customers today rely on Amazon Redshift to analyze exabytes of data and run complex analytical queries, making it the most widely used cloud data warehouse. You can run and scale analytics in seconds on all your data without having to manage your data warehouse infrastructure.

A data retention policy is part of an organization’s overall data management. In a big data world, the size of data is consistently increasing, which directly affects the cost of storing the data in data stores. It’s necessary to keep optimizing your data in data warehouses for consistent performance, reliability, and cost control. It’s crucial to define how long an organization needs to hold on to specific data, and if data that is no longer needed should be archived or deleted. The frequency of data archival depends on the relevance of the data with respect to your business or legal needs.

Data archiving is the process of moving data that is no longer actively used in a data warehouse to a separate storage device for long-term retention. Archive data consists of older data that is still important to the organization and may be needed for future reference, as well as data that must be retained for regulatory compliance.

Data purging is the process of freeing up space in the database or deleting obsolete data that isn’t required by the business. The purging process can be based on the data retention policy, which is defined by the data owner or business need.

This post walks you through the process of how to automate data archival and purging of Amazon Redshift time series tables. Time series tables retain data for a certain period of time (days, months, quarters, or years) and need data to be purged regularly to maintain the rolling data to be analyzed by end-users.

Solution overview

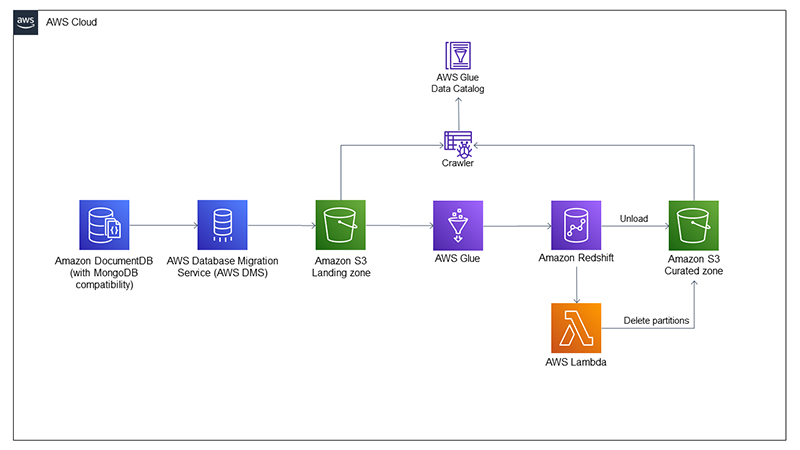
The following diagram illustrates our solution architecture.

We use two database tables as part of this solution.

The arch_table_metadata database table stores the metadata for all the tables that need to be archived and purged. You need to add rows into this table that you want to archive and purge. The arch_table_metadata table contains the following columns.

ColumnName Description
id Database-generated, automatically assigns a unique value to each record.
schema_name Name of the database schema of the table.
table_name Name of the table to be archived and purged.
column_name Name of the date column that is used to identify records to be archived and purged.
s3_uri Amazon S3 location where the data will be archived.
retention_days Number of days the data will be retained for the table. Default is 90 days.

The arch_job_log database table stores the run history of stored procedures. Records are added to this table by the stored procedure. It contains the following columns.

ColumnName Description
job_run_id Assigns unique numeric value per stored procedure run.
arch_table_metadata_id Id column value from table arch_table_metadata.
no_of_rows_bfr_delete Number of rows in the table before purging.
no_of_rows_deleted Number of rows deleted by the purge operation.
job_start_time Time in UTC when the stored procedure started.
job_end_time Time in UTC when the stored procedure ended.
job_status Status of the stored procedure run: IN-PROGRESS, COMPLETED, or FAILED.

Prerequisites

For this solution, complete the following prerequisites:

  1. Create an Amazon Redshift provisioned cluster or Amazon Redshift serverless workgroup.
  2. In Amazon Redshift query editor v2 or a compatible SQL editor of your choice, create the tables arch_table_metadata and arch_job_log. Use the following code for the table DDLs:
    create table arch_table_metadata
    (
    id integer identity(0,1) not null, 
    schema_name varchar(100) not null, 
    table_name varchar(100) not null, 
    column_name varchar(100) not null,
    s3_uri varchar(1000) not null,
    retention_days integer default 90
    );
    
    create table arch_job_log
    (
    job_run_id bigint not null, 
    arch_table_metadata_id  integer not null,
    no_of_rows_bfr_delete bigint,
    no_of_rows_deleted bigint,
    table_arch_start_time timestamp default current_timestamp,
    table_arch_end_time timestamp default current_timestamp,
    job_start_time timestamp default current_timestamp,
    job_end_time timestamp default current_timestamp,
    job_status varchar(20)
    );
    

  3. Create the stored procedure sp_archive_data with the following code snippet. The stored procedure takes the AWS Identity and Access Management (IAM) role ARN as an input argument if you’re not using the default IAM role. If you’re using the default IAM role for your Amazon Redshift cluster, you can pass the input parameter as default. For more information, refer to Creating an IAM role as default in Amazon Redshift.
    CREATE OR REPLACE PROCEDURE archive_data_sp(p_iam_role IN varchar(256))
    AS $$
    DECLARE
    
    v_command           varchar(500);
    v_sql               varchar(500);
    v_count_sql         text;
    
    v_table_id          int;
    v_schema_name       text;
    v_table_name        text;
    v_column_name       text;
    v_s3_bucket_url     text;
    v_s3_folder_name_prefix     text;
    v_retention_days            int = 0;
    v_no_of_rows_before_delete  int = 0;
    v_no_of_deleted_rows        int =0;
    v_job_start_time            timestamp;
    v_job_status                int = 1;
    v_job_id                    int =0;
    
    
    table_meta_data_cur CURSOR FOR
    SELECT id, schema_name, table_name, column_name,s3_uri,retention_days
    FROM arch_table_metadata;
    
    BEGIN
    
        SELECT NVL(MAX(job_run_id),0) + 1 INTO v_job_id FROM arch_job_log;
        RAISE NOTICE '%', v_job_id;
    
        OPEN table_meta_data_cur;
        FETCH table_meta_data_cur INTO v_table_id,v_schema_name, v_table_name, v_column_name, v_s3_bucket_url, v_retention_days;
        WHILE v_table_id IS NOT NULL LOOP
    
            v_count_sql = 'SELECT COUNT(*) AS v_no_of_rows_before_delete FROM ' || v_schema_name || '.' || v_table_name;
            RAISE NOTICE '%', v_count_sql;
            EXECUTE v_count_sql INTO v_no_of_rows_before_delete;
            RAISE NOTICE 'v_no_of_rows_before_delete %', v_no_of_rows_before_delete;
    
            v_job_start_time = GETDATE();
            v_s3_folder_name_prefix = v_schema_name || '.' || v_table_name || '/';
            v_sql = 'SELECT * FROM ' || v_schema_name || '.' || v_table_name || ' WHERE ' || v_column_name || ' <= DATEADD(DAY,-' || v_retention_days || ',CURRENT_DATE)';
    
            IF p_iam_role = 'default' THEN
                v_command = 'UNLOAD (''' || v_sql ||  ''') to ''' || v_s3_bucket_url || v_s3_folder_name_prefix || ''' IAM_ROLE default  PARQUET PARTITION BY (' || v_column_name || ') INCLUDE ALLOWOVERWRITE';
            ELSE
                v_command = 'UNLOAD (''' || v_sql ||  ''') to ''' || v_s3_bucket_url || v_s3_folder_name_prefix || ''' IAM_ROLE ''' || p_iam_role || ''' PARQUET PARTITION BY (' || v_column_name || ') INCLUDE ALLOWOVERWRITE';
            END IF;
            RAISE NOTICE '%', v_command;
            EXECUTE v_command;
    
            v_sql := 'DELETE FROM ' || v_schema_name || '.' || v_table_name || ' WHERE ' || v_column_name || ' <= DATEADD(DAY,-' || v_retention_days || ',CURRENT_DATE)';
            RAISE NOTICE '%', v_sql;
            EXECUTE v_sql;
    
            GET DIAGNOSTICS v_no_of_deleted_rows := ROW_COUNT;
            RAISE INFO '# of rows deleted = %', v_no_of_deleted_rows;
    
            v_sql = 'INSERT INTO arch_job_log (job_run_id, arch_table_metadata_id ,no_of_rows_bfr_delete,no_of_rows_deleted,job_start_time,job_end_time,job_status) VALUES ('
                        || v_job_id || ',' || v_table_id || ',' || v_no_of_rows_before_delete || ',' || v_no_of_deleted_rows || ',''' || v_job_start_time || ''',''' || GETDATE() || ''',' || v_job_status || ')';
            RAISE NOTICE '%', v_sql;
            EXECUTE v_sql;
    
            FETCH table_meta_data_cur INTO v_table_id,v_schema_name, v_table_name, v_column_name, v_s3_bucket_url, v_retention_days;
        END LOOP;
        CLOSE table_meta_data_cur;
    
        EXCEPTION
        WHEN OTHERS THEN
            RAISE NOTICE 'Error - % ', SQLERRM;
    END;
    $$ LANGUAGE plpgsql;
    

Archival and purging

For this use case, we use a table called orders, for which we want to archive and purge any records older than the last 30 days.

Use the following DDL to create the table in the Amazon Redshift cluster:

create table orders (
  O_ORDERKEY bigint NOT NULL,
  O_CUSTKEY bigint,
  O_ORDERSTATUS varchar(1),
  O_TOTALPRICE decimal(18,4),
  O_ORDERDATE Date,
  O_ORDERPRIORITY varchar(15),
  O_CLERK varchar(15),
  O_SHIPPRIORITY Integer,
  O_COMMENT varchar(79))
distkey (O_ORDERKEY)
sortkey (O_ORDERDATE);

The O_ORDERDATE column makes it a time series table, which you can use to retain the rolling data for a certain period.

In order to load the data into the orders table using the below COPY command , you would need to have default IAM role attached to your Redshift cluster or replace the default keyword in the COPY command with the arn of the IAM role attached to the Redshift cluster

copy orders from 's3://redshift-immersionday-labs/data/orders/orders.tbl.'
iam_role default
region 'us-west-2' lzop delimiter '|' COMPUPDATE PRESET;

When you query the table, you can see that this data is for 1998. To test this solution, you need to manually update some of the data to the current date by running the following SQL statement:

update orders set O_ORDERDATE = current_date where O_ORDERDATE < '1998-08-02';

The table looks like the following screenshot after running the update statement.

Now let’s run the following SQL to get the count of number of records to be archived and purged:

select count (*) from orders where O_ORDERDATE <= DATEADD(DAY,-30,CURRENT_DATE)

Before running the stored procedure, we need to insert a row into the arch_file_metadata table for the stored procedure to archive and purge records in the orders table. In the following code, provide the Amazon Simple Storage Service (Amazon S3) bucket name where you want to store the archived data:

INSERT INTO arch_table_metadata (schema_name, table_name, column_name, s3_uri, retention_days) VALUES ('public', 'orders', 'O_ORDERDATE', 's3://<your-bucketname>/redshift_data_archival/', 30);

The stored procedure performs the following high-level steps:

  1. Open a cursor to read and loop through the rows in the arch_table_metadata table.
  2. Retrieve the total number of records in the table before purging.
  3. Export and archive the records to be deleted into the Amazon S3 location as specified in the s3_uri column value. Data is partitioned in Amazon S3 based on the column_name field in arch_table_metadata. The stored procedure uses the IAM role passed as input for the UNLOAD operation.
  4. Run the DELETE command to purge the identified records based on the retention_days column value.
  5. Add a record in arch_job_log with the run details.

Now, let’s run the stored procedure via the call statement passing a role ARN as input parameter to verify the data was archived and purged correctly:

call archive_data_sp('arn:aws:iam:<your-account-id>:role/RedshiftRole-7OR1UWVPFI5J');

As shown in the following screenshot, the stored procedure ran successfully.

Now let’s validate the table was purged successfully by running the following SQL:

select count (*) from orders where O_ORDERDATE <= DATEADD(DAY,-30,CURRENT_DATE)

We can navigate to the Amazon S3 location to validate the archival process. The following screenshot shows the data has been archived into the Amazon S3 location specified in the arch_table_metadata table.

Now let’s run the following SQL statement to look at the stored procedure run log entry:

select a.* from arch_job_log a, arch_table_metadata b
where a.arch_table_metadata_id = b.id
and b.table_name = 'orders'

The following screenshot shows the query results.

In this example, we demonstrated how you can set up and validate your Amazon Redshift table archival and purging process.

Schedule the stored procedure

Now that you have learned how to set up and validate your Amazon Redshift tables for archival and purging, you can schedule this process. For instructions on how to schedule a SQL statement using either the AWS Management Console or the AWS Command Line Interface (AWS CLI), refer to Scheduling SQL queries on your Amazon Redshift data warehouse.

Archive data in Amazon S3

As part of this solution, data is archived in an S3 bucket before it’s deleted from the Amazon Redshift table. This helps reduce the storage on the Amazon Redshift cluster and enables you to analyze the data for any ad hoc requests without needing to load back into the cluster. In the stored procedure, the UNLOAD command exports the data to be purged to Amazon S3, partitioned by the date column, which is used to identify the records to purge. To save costs on Amazon S3 storage, you can manage the storage lifecycle with Amazon S3 lifecycle configuration.

Analyze the archived data in Amazon S3 using Amazon Redshift Spectrum

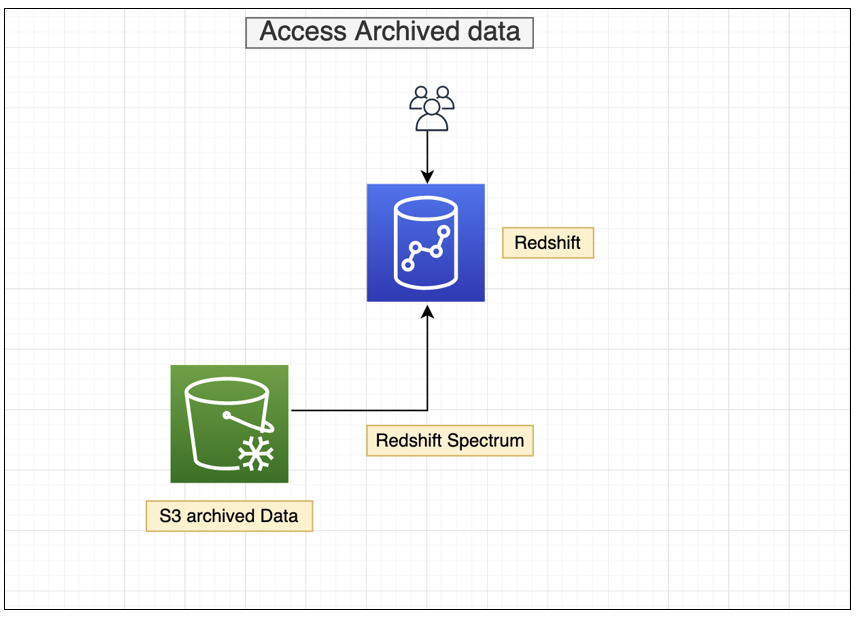
With Amazon Redshift Spectrum, you can efficiently query and retrieve structured and semistructured data from files in Amazon S3, and easily analyze the archived data in Amazon S3 without having to load it back in Amazon Redshift tables. For further analysis of your archived data (cold data) and frequently accessed data (hot data) in the cluster’s local disk, you can run queries joining Amazon S3 archived data with tables that reside on the Amazon Redshift cluster’s local disk. The following diagram illustrates this process.

Let’s take an example where you want to view the number of orders for the last 2 weeks of December 1998, which is archived in Amazon S3. You need to complete the following steps using Redshift Spectrum:

  1. Create an external schema in Amazon Redshift.
  2. Create a late-binding view to refer to the underlying Amazon S3 files with the following query:
    create view vw_orders_hist as select count(*),o_orderdate
    from <external_schema>. orders 
    where o_orderdate between '1998-12-15' and '1998-12-31' group by 2
    with no schema binding;
    

  3. To see a unified view of the orders historical data archived in Amazon S3 and the current data stored in the Amazon Redshift local table, you can use a UNION ALL clause to join the Amazon Redshift orders table and the Redshift Spectrum orders table:
    create view vw_orders_unified as 
    select * from <external_schema>.orders
    union all
    select * from public.orders
    with no schema binding;

To learn more about the best practices for Redshift Spectrum, refer to Best Practices for Amazon Redshift Spectrum.

Best practices

The following are some best practices to reduce your storage footprint and optimize performance of your workloads:

Conclusion

In this post, we demonstrated the automatic archival and purging of data in Amazon Redshift tables to meet your compliance and business requirements, thereby optimizing your application performance and reducing storage costs. As an administrator, you can start working with application data owners to identify retention policies for Amazon Redshift tables to achieve optimal performance, prevent any storage issues specifically for DS2 and DC2 nodes, and reduce overall storage costs.


About the authors

Nita Shah is an Analytics Specialist Solutions Architect at AWS based out of New York. She has been building data warehouse solutions for over 20 years and specializes in Amazon Redshift. She is focused on helping customers design and build enterprise-scale well-architected analytics and decision support platforms.

Ranjan Burman is an Analytics Specialist Solutions Architect at AWS. He specializes in Amazon Redshift and helps customers build scalable analytical solutions. He has more than 15 years of experience in different database and data warehousing technologies. He is passionate about automating and solving customer problems with the use of cloud solutions.

Prathap Thoguru is an Enterprise Solutions Architect at Amazon Web Services. He has over 15 years of experience in the IT industry and is a 9x AWS certified professional. He helps customers migrate their on-premises workloads to the AWS Cloud.

Fine-grained entitlements in Amazon Redshift: A case study from TrustLogix

Post Syndicated from Srikanth Sallaka original https://aws.amazon.com/blogs/big-data/fine-grained-entitlements-in-amazon-redshift-a-case-study-from-trustlogix/

This post is co-written with Srikanth Sallaka from TrustLogix as the lead author.

TrustLogix is a cloud data access governance platform that monitors data usage to discover patterns, provide insights on least privileged access controls, and manage fine-grained data entitlements across data lake storage solutions like Amazon Simple Storage Service (Amazon S3), data warehouses like Amazon Redshift, and transactional databases like Amazon Relational Database Service (Amazon RDS) and Amazon Aurora.

In this post, we discuss how TrustLogix integrates with Amazon Redshift row-level security (RLS) to help data owners express granular data entitlements in business terms and consistently enforce them.

The challenge: Dynamic data authorization

In this post, we discuss two customer use cases:

  • Data access based on enterprise territory assignments – Sales representatives should only be able to access data in the opportunities dataset for their assigned territories. This customer wants to grant access to the dataset based on a criteria, an attribute of dataset, such as geographic area, industry, and revenue. The criteria is an attribute of the dataset. The challenge is that this access control policy should be applied by Amazon Redshift regardless of the platform from where the data is accessed.
  • Entitlement-based data access – One of TrustLogix’s customers is a fortune 500 financial services firm. They use Amazon Redshift to store and perform analysis on a wide range of datasets, like advertising research, pricing to customers, and equity markets. They share this data with traders, quants, and risk managers. This internal data is also consumed by various users across the firm, but not every user is entitled to see all the data. To track this data and access requests, this firm spent a great deal of resources in building a comprehensive list of permissions that define which business user is entitled to what data. A simple scenario is that this entitlement table contains the customer_id and Book_id values assigned to specific user_id values. Any queries on the trade data table, which is tagged as sensitive data, should enforce this policy. The challenge is that these data entitlements should be enforced centrally in Amazon Redshift regardless of the tool from which they are accessed. Data owners should be able to manage this policy with a simple access control policy management interface and shouldn’t be required to know the internals of Amazon Redshift to implement complex procedures.

User-defined function (UDF) and secure view-based implementation

At present, to define fine-grained access controls in Amazon Redshift, TrustLogix is using custom Amazon Redshift user-defined functions (UDFs) and views to author policies from the TrustLogix policy management console and granting users access to the view.

TrustLogix Policy UDF

This process involves three steps:

  1. Create a user-defined function that returns a Boolean whenever the conditions of the policy match.
  2. Create a view by joining the UDF and base table.
  3. Grant access to the new view to the appropriate users or groups.
  4. Block direct table access to all users.

Native row-level security (RLS) policies in Amazon Redshift

The row-level security (RLS) feature in Amazon Redshift simplifies design and implementation of fine-grained access to the rows in tables. With RLS, you can restrict access to a subset of rows within a table based on the user’s job role or permissions and level of data sensitivity with SQL commands. By combining column-level access control and RLS, you can provide comprehensive protection by enforcing granular access to your data. TrustLogix integrates with this feature to let their customers specify custom SQL queries and dictate what sets of data are accessible by which users.

TrustLogix is now using the RLS feature to address both use cases mentioned earlier. This reduces the complexity of managing additional UDF functions or secure views and additional grants.

“We’re excited about this deeper level of integration with Amazon Redshift. Our joint customers in security-forward and highly regulated sectors including financial services, healthcare, and pharmaceutical need to have incredibly fine-grained control over which users are allowed to access what data, and under which specific contexts. The new row-level security capabilities will allow our customers to precisely dictate data access controls based on their business entitlements while abstracting them away from the technical complexities. The new Amazon Redshift RLS capability will enable our joint customers to model policies at the business level, deploy and enforce them via a security-as-code model, ensuring secure and consistent access to their sensitive data.”

– Ganesh Kirti, Founder & CEO, TrustLogix Inc.

TrustLogix integration with RLS

Let’s look at our two use cases and how to implement TrustLogix integration with RLS.

Data access based on territories

The data owner logs in to the TrustLogix control plane and authors a data access policy using the business-friendly UI.

TrustLogix login page

TrustLogix auto-generates the following Amazon Redshift RLS policy, attaches it to the appropriate table, and turns on the RLS on this table.

Create RLS POLICY OPPORTUNITIES_BY_REGION 
WITH (region VARCHAR(256))
USING (region IN (SELECT region FROM Territories_Mgmt WHERE user_id = current_user));

Then you can use the following grant statement on the table:

Grant Select on table Sales.opportunities to role SalesRepresentative;

After this policy is deployed into the Amazon Redshift data warehouse, any user who queries this table automatically gets only authorized data.

Entitlement-based data access

Similar to the first use case, TrustLogix creates two separate RLS policies, one on the book_id and another with customer_id, attaching both the policies on the trade details table.

Create RLS POLICY entitlement_book_id_rls with ( book_id integer) using (book_id in (select book_id from entitlements);
Create RLS Policy entitlemen_Customer_id_rls with (Customer_id integer)Using (customer_id in (select customer_id from customer_details.customer_id =Customer_id and user_id = current_user ));
Attach RLS POLICY entitlement_book_id_rls on trade_details to Role Trader;
Attach RLS POLICY entitlemen_Customer_id_rls on trade_details to Role Trader;

In this case, Amazon Redshift evaluates both attached policies using the AND operator, with the effect that users with the Trader role get view-only access for only those customers and books that the Trader role is granted.

Additional TrustLogix and Amazon Redshift integration benefits

The following diagram illustrates how TrustLogix integrates with Amazon Redshift.

TrustLogix and RLS diagram

This robust new integration offers many powerful security, productivity, and collaboration benefits to joint Amazon Redshift and TrustLogix customers:

  • A single pane of glass to monitor and manage fine-grained data entitlements across multiple Amazon Redshift data warehouses, AWS data stores including Amazon S3 and Aurora, and other cloud data repositories such as Snowflake and Databricks
  • Monitoring of data access down to the user and tool level to prevent shadow IT, identify overly granted access permissions, discover dark data, and ensure compliance with legislative mandates like GDPR, HIPAA, SOX, and PCI
  • A no-code model that enables security as code, ensures consistency, reduces work, and eliminates errors

Summary

The RLS capability in Amazon Redshift delivers granular controls for restricting data. TrustLogix has delivered an integration that reduces the effort, complexity, and dependency of creating and managing complex user-defined functions to fully take advantage of this capability.

Furthermore, TrustLogix doesn’t need to create additional views, which reduces management of user grants on other derived objects. By using the RLS policies, TrustLogix has simplified creating authorization policies for fine-grained data entitlements in Amazon Redshift. You can now provision both coarse-grained and granular access controls within minutes to enable businesses to deliver faster access to analytics while simultaneously tightening your data access controls.


About the authors

Srikanth Sallaka is Head of Product at TrustLogix. Prior to this he has built multiple SaaS and on-premise Data Security and Identity Management solutions. He has honed his Product Management and technical skills working at large enterprise like Oracle, SAP & multiple startups.

Yanzhu Ji is a Product Manager on the Amazon Redshift team. She worked on the Amazon Redshift team as a Software Engineer before becoming a Product Manager. She has rich experience of how the customer-facing Amazon Redshift features are built from planning to launching, and always treats customers’ requirements as first priority. In her personal life, Yanzhu likes painting, photography, and playing tennis.

Cross-account streaming ingestion for Amazon Redshift

Post Syndicated from Poulomi Dasgupta original https://aws.amazon.com/blogs/big-data/cross-account-streaming-ingestion-for-amazon-redshift/

As the most widely used and fastest cloud data warehouse, Amazon Redshift makes it simple and cost-effective to analyze all your data using standard SQL, your existing ETL (extract, transform, and load), business intelligence (BI), and reporting tools quickly and securely. Tens of thousands of customers use Amazon Redshift to analyze exabytes of data per day and power analytics workloads such as BI, predictive analytics, and real-time streaming analytics without having to manage the data warehouse infrastructure. You can also gain up to three times better price performance with Amazon Redshift than other cloud data warehouses.

We are continuously innovating and releasing new features of Amazon Redshift for our customers, enabling the implementation of a wide range of data use cases and meeting requirements with performance and scale. One of the features recently announced is Amazon Redshift Streaming Ingestion for Amazon Kinesis Data Streams and Amazon Managed Streaming for Apache Kafka (Amazon MSK), which lets you experience performance at scale by ingesting real-time streaming data. Amazon Redshift with Kinesis Data Streams is fully managed and runs your streaming applications without requiring infrastructure management. You can use SQL to connect to and directly ingest data from multiple Kinesis data streams simultaneously with low latency and high bandwidth, allowing you to derive insights in seconds instead of minutes.

Previously, loading data from a streaming service like Kinesis Data Streams into Amazon Redshift included several steps. These included connecting the stream to an Amazon Kinesis Data Firehose and waiting for Kinesis Data Firehose to stage the data in Amazon Simple Storage Service (Amazon S3), using various-sized batches at varying-length buffer intervals. After this, Kinesis Data Firehose triggered a COPY command to load the data from Amazon S3 to a table in Amazon Redshift.

Rather than including preliminary staging in Amazon S3, streaming ingestion provides low-latency, high-speed ingestion of stream data from Kinesis Data Streams into an Amazon Redshift materialized view.

In this post, we walk through cross-account Amazon Redshift streaming ingestion by creating a Kinesis data stream in one account, and generating and loading streaming data into Amazon Redshift in a second account within the same Region using role chaining.

Solution overview

The following diagram illustrates our solution architecture.

We demonstrate the following steps to perform cross-account streaming ingestion for Amazon Redshift:

  1. Create a Kinesis data stream in Account-1.
  2. Create an AWS Identity and Access Management (IAM) role in Account-1 to read the data stream using AWS best practices around applying least privileges permissions.
  3. Create an Amazon Redshift – Customizable IAM service role in Account-2 to assume the IAM role.
  4. Create an Amazon Redshift cluster in Account-2 and attach the IAM role.
  5. Modify the trust relationship of the Kinesis Data Streams IAM role in order to access the Amazon Redshift IAM role on its behalf.
  6. Create an external schema using IAM role chaining.
  7. Create a materialized view for high-speed ingestion of stream data.
  8. Refresh the materialized view and start querying.

Account-1 setup

Complete the following steps in Account-1:

  1. Create a Kinesis data stream called my-data-stream. For instructions, refer to Step 1 in Set up streaming ETL pipelines.
  2. Send records to this data stream from an open-source API that continuously generates random user data. For instructions, refer to Steps 2 and 3 in Set up streaming ETL pipelines.
  3. To verify if the data is entering the stream, navigate to the Amazon Kinesis -> Data streams -> my-data-stream -> Monitoring tab.
  4. Find the PutRecord success – average (Percent) and PutRecord – sum (Bytes) metrics to validate record ingestion.

    Next, we create an IAM policy called KinesisStreamPolicy in Account-1.
  5. On the IAM console, choose Policies in the navigation pane.
  6. Choose Create policy.
  7. Create a policy called KinesisStreamPolicy and add the following JSON to your policy (provide the AWS account ID for Account-1):
    {
        "Version": "2012-10-17",
        "Statement": [
            {
                "Sid": "ReadStream",
                "Effect": "Allow",
                "Action": [
                    "kinesis:DescribeStreamSummary",
                    "kinesis:GetShardIterator",
                    "kinesis:GetRecords",
                    "kinesis:DescribeStream"
                ],
                "Resource": "arn:aws:kinesis:*:<Account-1>:stream/*"
            },
            {
                "Sid": "ListStream",
                "Effect": "Allow",
                "Action": [
                    "kinesis:ListStreams",
                    "kinesis:ListShards"
                ],
                "Resource": "*"
            }
        ]
    }

  8. In the navigation pane, choose Roles.
  9. Choose Create role.
  10. Select AWS service and choose Kinesis.
  11. Create a new role called KinesisStreamRole.
  12. Attach the policy KinesisStreamPolicy.

Account-2 setup

Complete the following steps in Account-2:

  1. Sign in to the Amazon Redshift console in Account-2.
  2. Create an Amazon Redshift cluster.
  3. On the IAM console, choose Policies in the navigation pane.
  4. Choose Create policy.
  5. Create a policy RedshiftStreamPolicy and add the following JSON (provide the AWS account ID for Account-1):
    {
        "Version": "2012-10-17",
        "Statement": [
            {
                "Sid": "StmtStreamRole",
                "Effect": "Allow",
                "Action": [
                    "sts:AssumeRole"
                ],
                "Resource": "arn:aws:iam::<Account-1>:role/KinesisStreamRole"
            }
        ]
    }

  6. In the navigation pane, choose Roles.
  7. Choose Create role.
  8. Select AWS service and choose Redshift and Redshift customizable.
  9. Create a role called RedshiftStreamRole.
  10. Attach the policy RedshiftStreamPolicy to the role.

Set up trust relationship

To set up the trust relationship, complete the following steps:

  1. Sign in to the IAM console as Account-1.
  2. In the navigation pane, choose Roles.
  3. Edit the IAM role KinesisStreamRole and modify the trust relationship (provide the AWS account ID for Account-2):
    {
        "Version": "2012-10-17",
        "Statement": [
            {
                "Effect": "Allow",
                "Principal": {
                    "AWS": "arn:aws:iam::<Account-2>:role/RedshiftStreamRole"
                },
                "Action": "sts:AssumeRole"
            }        
        ]
    }

Set up streaming ingestion

To set up streaming ingestion, complete the following steps:

  1. Sign in to the Amazon Redshift console as Account-2.
  2. Launch the Query Editor v2 or your preferred SQL client and run the following statements to access the data stream my-data-stream in Account-1.
  3. Create an external schema using role chaining (replace the IAM role ARNs, separated by a comma without any spaces around it):
    CREATE EXTERNAL SCHEMA schema_stream
    FROM KINESIS
    IAM_ROLE 'arn:aws:iam::<Account-2>:role/RedshiftStreamRole,
    arn:aws:iam::<Account-1>:role/KinesisStreamRole';

  4. Create a materialized view to consume the stream data and store stream records in semi-structured SUPER format:
    CREATE MATERIALIZED VIEW my_stream_vw AS
        SELECT approximatearrivaltimestamp,
        partitionkey,
        shardid,
        sequencenumber,
        json_parse(from_varbyte(data, 'utf-8')) as payload    
        FROM schema_stream."my-data-stream";

  5. Refresh the view, which triggers Amazon Redshift to read from the stream and load data into the materialized view:
    REFRESH MATERIALIZED VIEW my_stream_vw;

  6. Query data in the materialized view using the dot notation:
    SELECT payload.name.first, payload.name.last, payload.name.title,
    payload.dob.date as dob, payload.cell, payload.location.city, payload.email
    FROM my_stream_vw;

You can now view the results, as shown in the following screenshot.

Conclusion

In this post, we discussed how to set up two different AWS accounts to enable cross-account Amazon Redshift streaming ingestion. It’s simple to get started and you can perform rich analytics on streaming data, right within Amazon Redshift using existing familiar SQL.

For information about how to set up Amazon Redshift streaming ingestion using Kinesis Data Streams in a single account, refer to Real-time analytics with Amazon Redshift streaming ingestion.


About the authors

Poulomi Dasgupta is a Senior Analytics Solutions Architect with AWS. She is passionate about helping customers build cloud-based analytics solutions to solve their business problems. Outside of work, she likes travelling and spending time with her family.

Raks KhareRaks Khare is an Analytics Specialist Solutions Architect at AWS based out of Pennsylvania. He helps customers architect data analytics solutions at scale on the AWS platform.

AWS Week in Review – September 5, 2022

Post Syndicated from Danilo Poccia original https://aws.amazon.com/blogs/aws/aws-week-in-review-september-5-2022/

This post is part of our Week in Review series. Check back each week for a quick roundup of interesting news and announcements from AWS!

As a new week begins, let’s quickly look back at the most significant AWS news from the previous seven days.

Last Week’s Launches
Here are the launches that got my attention last week:

AWS announces open-sourced credentials-fetcher to simplify Microsoft AD access from Linux containers. You can find more in the What’s New post.

AWS Step Functions now has 14 new intrinsic functions that help you process data more efficiently and make it easier to perform data processing tasks such as array manipulation, JSON object manipulation, and math functions within your workflows without having to invoke downstream services or add Task states.

AWS SAM CLI esbuild support is now generally available. You can now use esbuild in the SAM CLI build workflow for your JavaScript applications.

Amazon QuickSight launches a new user interface for dataset management that replaces the existing popup dialog modal with a full-page experience, providing a clearer breakdown of dataset management categories.

AWS GameKit adds Unity support. With this release for Unity, you can integrate cloud-based game features into Win64, MacOS, Android, or iOS games from both the Unreal and Unity engines with just a few clicks.

AWS and VMware announce VMware Cloud on AWS integration with Amazon FSx for NetApp ONTAP. Read more in Veliswa‘s blog post.

The AWS Region in the United Arab Emirates (UAE) is now open. More info in Marcia‘s blog post.

View of Abu Dhabi in the United Arab Emirates

For a full list of AWS announcements, be sure to keep an eye on the What’s New at AWS page.

Other AWS News
A few more blog posts you might have missed:

Easy analytics and cost-optimization with Amazon Redshift Serverless – Four different use cases of Redshift Serverless are discussed in this post.

Building cost-effective AWS Step Functions workflows – In this blog post, Ben explains the difference between Standard and Express Workflows, including costs, migrating from Standard to Express, and some interesting ways of using both together.

How to subscribe to the new Security Hub Announcements topic for Amazon SNS – You can now receive updates about new Security Hub services and features, newly supported standards and controls, and other Security Hub changes.

Deploying AWS Lambda functions using AWS Controllers for Kubernetes (ACK) – With the ACK service controller for AWS Lambda, you can provision and manage Lambda functions with kubectl and custom resources.

For AWS open-source news and updates, here’s the latest newsletter curated by Ricardo to bring you the most recent updates on open-source projects, posts, events, and more.

Upcoming AWS Events
Depending on where you are on this planet, there are many opportunities to meet and learn:

AWS Summits – Come together to connect, collaborate, and learn about AWS. Registration is open for the following in-person AWS Summits: Ottawa (September 8), New Delhi (September 9), Mexico City (September 21–22), Bogotá (October 4), and Singapore (October 6).

AWS Community DaysAWS Community Day events are community-led conferences to share and learn with one another. In September, the AWS community in the US will run events in the Bay Area, California (September 9) and Arlington, Virginia (September 30). In Europe, Community Day events will be held in October. Join us in Amersfoort, Netherlands (October 3), Warsaw, Poland (October 14), and Dresden, Germany (October 19).

That’s all from me for this week. Come back next Monday for another Week in Review!

Danilo

Use Amazon Redshift Spectrum with row-level and cell-level security policies defined in AWS Lake Formation

Post Syndicated from Anusha Challa original https://aws.amazon.com/blogs/big-data/use-amazon-redshift-spectrum-with-row-level-and-cell-level-security-policies-defined-in-aws-lake-formation/

Data warehouses and data lakes are key to an enterprise data management strategy. A data lake is a centralized repository that consolidates your data in any format at any scale and makes it available for different kinds of analytics. A data warehouse, on the other hand, has cleansed, enriched, and transformed data that is optimized for faster queries. Amazon Redshift is a cloud-based data warehouse that powers a lake house architecture, which enables you to query the data in a data warehouse and an Amazon Simple Storage Service (Amazon S3) data lake using familiar SQL statements and gain deeper insights.

Data lakes often contain data for multiple business units, users, locations, vendors, and tenants. Enterprises want to share their data while balancing compliance and security needs. To satisfy compliance requirements and to achieve data isolation, enterprises often need to control access at the row level and cell level. For example:

  • If you have a multi-tenant data lake, you may want each tenant to be able to view only those rows that are associated to their tenant ID
  • You may have data for multiple portfolios in the data lake and you need to control access for various portfolio managers
  • You may have sensitive information or personally identifiable information (PII) that can be viewed by users with elevated privileges only

AWS Lake Formation makes it easy to set up a secure data lake and access controls for these kinds of use cases. You can use Lake Formation to centrally define security, governance, and auditing policies, thereby achieving unified governance for your data lake. Lake Formation supports row-level security and cell-level security:

  • Row-level security allows you to specify filter expressions that limit access to specific rows of a table to a user
  • Cell-level security builds on row-level security by allowing you to apply filter expressions on each row to hide or show specific columns

Amazon Redshift is the fastest and most widely used cloud data warehouse. Amazon Redshift Spectrum is a feature of Amazon Redshift that enables you to query data from and write data back to Amazon S3 in open formats. You can query open file formats such as Parquet, ORC, JSON, Avro, CSV, and more directly in Amazon S3 using familiar ANSI SQL. This gives you the flexibility to store highly structured, frequently accessed data in an Amazon Redshift data warehouse, while also keeping up to exabytes of structured, semi-structured, and unstructured data in Amazon S3. Redshift Spectrum integrates with Lake Formation natively. This integration enables you to define data filters in Lake Formation that specify row-level and cell-level access control for users on your data and then query it using Redshift Spectrum.

In this post, we present a sample multi-tenant scenario and describe how to define row-level and cell-level security policies in Lake Formation. We also show how these policies are applied when querying the data using Redshift Spectrum.

Solution overview

In our use case, Example Corp has built an enterprise data lake on Amazon S3. They store data for multiple tenants in the data lake and query it using Redshift Spectrum. Example Corp maintains separate AWS Identity and Access Management (IAM) roles for each of their tenants and wants to control access to the multi-tenant dataset based on their IAM role.

Example Corp needs to ensure that the tenants can view only those rows that are associated to them. For example, Tenant1 should see only those rows where tenantid = 'Tenant1' and Tenant2 should see only those rows where tenantid = 'Tenant2'. Also, tenants can only view sensitive columns such as phone, email, and date of birth associated to specific countries.

The following is a screenshot of the multi-tenant dataset we use to demonstrate our solution. It has data for two tenants: Tenant1 and Tenant2. tenantid is the column that distinguishes data associated to each tenant.

To solve this use case, we implement row-level and cell-level security in Lake Formation by defining data filters. When Example Corp’s tenants query the data using Redshift Spectrum, the service checks filters defined in Lake Formation and returns only the data that the tenant has access to.

Lake Formation metadata tables contain information about data in the data lake, including schema information, partition information, and data location. You can use them to access underlying data in the data lake and manage that data with Lake Formation permissions. You can apply row-level and cell-level security to Lake Formation tables. In this post, we provide a walkthrough using a standard Lake Formation table.

The following diagram illustrates our solution architecture.

The solution workflow consists of the following steps:

  1. Create IAM roles for the tenants.
  2. Register an Amazon S3 location in Lake Formation.
  3. Create a database and use AWS Glue crawlers to create a table in Lake Formation.
  4. Create data filters in Lake Formation.
  5. Grant access to the IAM roles in Lake Formation.
  6. Attach the IAM roles to the Amazon Redshift cluster.
  7. Create an external schema in Amazon Redshift.
  8. Create Amazon Redshift users for each tenant and grant access to the external schema.
  9. Users Tenant1 and Tenant2 assume their respective IAM roles and query data using the SQL query editor or any SQL client to their external schemas inside Amazon Redshift.

Prerequisites

This walkthrough assumes that you have the following prerequisites:

Create IAM roles for the tenants

Create IAM roles Tenant1ReadRole and Tenant2ReadRole for users with elevated privileges for the two tenants, with Amazon Redshift as the trusted entity, and attach the following policy to both roles:

{
	"Version": "2012-10-17",
	"Statement": [{
		"Effect": "Allow",
		"Action": [
			"lakeformation:GetDataAccess",
			"glue:GetTable",
			"glue:GetTables",
			"glue:SearchTables",
			"glue:GetDatabase",
			"glue:GetDatabases",
			"glue:GetPartition",
			"glue:GetPartitions"
		],
		"Resource": "*"
	}]
}

Register an Amazon S3 location in Lake Formation

We use the sample multi-tenant dataset SpectrumRowLevelFiltering.csv. Complete the following steps to register the location of this dataset in Lake Formation:

  1. Download the dataset and upload it to the Amazon S3 path s3://<your_bucket>/order_details/SpectrumRowLevelFiltering.csv.
  2. On the Lake Formation console, choose Data lake locations in the navigation pane.
  3. Choose Register location.
  4. For Amazon S3 path, enter the S3 path of your dataset.
  5. For IAM role, choose either the AWSServiceRoleForLakeFormationDataAccess service-linked role (the default) or the Lake Formation administrator role mentioned in the prerequisites.
  6. Choose Register location.

Create a database and a table in Lake Formation

To create your database and table, complete the following steps:

  1. Sign in to the AWS Management Console as the data lake administrator.
  2. On the Lake Formation console, choose Databases in the navigation pane.
  3. Choose Create database.
  4. For Name, enter rs_spectrum_rls_blog.
  5. If Use only IAM access control for new tables in this database is selected, uncheck it.
  6. Choose Create database.Next, you create a new data lake table.
  7. On the AWS Glue console, choose Crawlers in navigation pane.
  8. Choose Add crawler.
  9. For Crawler name, enter order_details.
  10. For Specify crawler source type, keep the default selections.
  11. For Add data store, choose Include path, and choose the S3 path to the dataset (s3://<your_bucket>/order_details/).
  12. For Choose IAM Role, choose Create an IAM role, with the suffix rs_spectrum_rls_blog.
  13. For Frequency, choose Run on demand.
  14. For Database, choose database you just created (rs_spectrum_rls_blog).
  15. Choose Finish to create the crawler.
  16. Grant CREATE TABLE permissions and DESCRIBE/ALTER/DELETE database permissions to the IAM role you created in Step 12.
  17. To run the crawler, in the navigation pane, choose Crawlers.
  18. Select the crawler order_details and choose Run crawler.When the crawler is complete, you can find the table order_details created under the database rs_spectrum_rls_blog in the AWS Glue Data Catalog.
  19. On the AWS Glue console, in the navigation pane, choose Databases.
  20. Select the database rs_spectrum_rls_blog and choose View tables.
  21. Choose the table order_details.

The following screenshot is the schema of the order_details table.

Create data filters in Lake Formation

To implement row-level and cell-level security, first you create data filters. Then you choose that data filter while granting SELECT permission on the tables. For this use case, you create two data filters: one for Tenant1 and one for Tenant2.

  1. On the Lake Formation console, choose Data catalog in the navigation pane, then choose Data filters.
  2. Choose Create new filter.
    Let’s create the first data filter filter-tenant1-order-details restricting the rows Tenant1 is able to see in table order_details.
  3. For Data filter name, enter filter-tenant1-order-details.
  4. For Target database, choose rs_spectrum_rls_blog.
  5. For Target table, choose order_details.
  6. For Column-level access, select Include columns and then choose the following columns: c_emailaddress, c_phone, c_dob, c_firstname, c_address, c_country, c_lastname, and tenanted.
  7. For Row filter expression, enter tenantid = 'Tenant1' and c_country in  (‘USA’,‘Spain’).
  8. Choose Create filter.
  9. Repeat these steps to create another data filter filter-tenant2-order-details, with row filter expression tenantid = 'Tenant2' and c_country in (‘USA’,‘Canada’).

Grant access to IAM roles in Lake Formation

After you create the data filters, you need to attach them to the table to grant access to a principal. First let’s grant access to order_details to the IAM role Tenant1ReadRole using the data filter we created for Tenant1.

  1. On the Lake Formation console, in the navigation pane, under Permissions, choose Data Permissions.
  2. Choose Grant.
  3. In the Principals section, select IAM users and roles.
  4. For IAM users and roles, choose the role Tenant1ReadRole.
  5. In the LF-Tags or catalog resources section, choose Named data catalog resources.
  6. For Databases, choose rs_spectrum_rls_blog.
  7. For Tables, choose order_details.
  8. For Data filters, choose filter-tenant1-order-details.
  9. For Data filter permissions, choose Select.
  10. Choose Grant.
  11. Repeat these steps with the IAM role Tenant2ReadRole and data filter filter-tenant2-order-details.

Attach the IAM roles to the Amazon Redshift cluster

To attach your roles to the cluster, complete the following steps:

  1. On the Amazon Redshift console, in the navigation menu, choose CLUSTERS, then select the name of the cluster that you want to update.
  2. On the Actions menu, choose Manage IAM roles.The IAM roles page appears.
  3. Either choose Enter ARN and enter an ARN of the Tenant1ReadRole IAM role, or choose the Tenant1ReadRole IAM role from the list.
  4. Choose Add IAM role.
  5. Choose Done to associate the IAM role with the cluster.The cluster is modified to complete the change.
  6. Repeat these steps to add the Tenant2ReadRole IAM role to the Amazon Redshift cluster.

Amazon Redshift allows up to 50 IAM roles to attach to the cluster to access other AWS services.

Create an external schema in Amazon Redshift

Create an external schema on the Amazon Redshift cluster, one for each IAM role, using the following code:

CREATE EXTERNAL SCHEMA IF NOT EXISTS spectrum_tenant1
FROM DATA CATALOG DATABASE 'rs_spectrum_rls_blog'
IAM_ROLE '<<Tenant1ReadRole ARN>>'
REGION 'us-east-1';

CREATE EXTERNAL SCHEMA IF NOT EXISTS  spectrum_tenant2
FROM DATA CATALOG DATABASE  'rs_spectrum_rls_blog'
IAM_ROLE '<<Tenant2ReadRole ARN>>'
REGION 'us-east-1';

Create Amazon Redshift users for each tenant and grant access to the external schema

Complete the following steps:

  1. Create Amazon Redshift users to restrict access to the external schemas (connect to the cluster with a user that has permission to create users or superusers) using the following code:
    CREATE USER tenant1_user WITH PASSWORD '<password>';
    CREATE USER tenant2_user WITH PASSWORD '<password>';

  2. Let’s create the read-only role (tenant1_ro) to provide read-only access to the spectrum_tenant1 schema:
    create role tenant1_ro;

  3. Grant usage on spectrum_tenant1 schema to the read-only tenant1_ro role:
    grant usage on schema spectrum_tenant1 to role tenant1_ro;

  4. Now assign the user to the read-only tenant1_ro role:
    grant role tenant1_ro to tenant1_user;

  5. Repeat the same steps to grant permission to the user tenant2_user:
    create role tenant2_ro;
    grant usage on schema spectrum_tenant2 to role tenant2_ro;
    grant role tenant2_ro to tenant2_user;

Tenant1 and Tenant2 users run queries using the SQL editor or a SQL client

To test the permission levels for different users, connect to the database using the query editor with that user.

In the Query Editor in the Amazon Redshift console, connect to the cluster with tenant1_user and run the following query:

-- Query table 'order_details' in schema spectrum_tenant1 with role Tenant1ReadRole

SELECT * FROM spectrum_tenant1.order_details;

In the following screenshot, tenant1_user is only able to see records where the tenantid value is Tenant1 and only the customer PII fields specific to the US and Spain.

To validate the Lake Formation data filters, the following screenshot shows that Tenant1 can’t see any records for Tenant2.

Reconnect to the cluster using tenant2_user and run the following query:

-- Query table 'order_details' in schema spectrum_tenant2 with role Tenant2ReadRole

SELECT * FROM spectrum_tenant2.order_details;

In the following screenshot, tenant2_user is only able to see records where the tenantid value is Tenant2 and only the customer PII fields specific to the US and Canada.

To validate the Lake Formation data filters, the following screenshot shows that Tenant2 can’t see any records for Tenant1.

Conclusion

In this post, you learned how to implement row-level and cell-level security on an Amazon S3-based data lake using data filters and access control features in Lake Formation. You also learned how to use Redshift Spectrum to access the data from Amazon S3 while adhering to the row-level and cell-level security policies defined in Lake Formation.

You can further enhance your understanding of Lake Formation row-level and cell-level security by referring to Effective data lakes using AWS Lake Formation, Part 4: Implementing cell-level and row-level security.

To learn more about Redshift Spectrum, refer Amazon Redshift Spectrum Extends Data Warehousing Out to Exabytes—No Loading Required.

For more information about configuring row-level access control natively in Amazon Redshift, refer to Achieve fine-grained data security with row-level access control in Amazon Redshift.


About the authors

Anusha Challa is a Senior Analytics Specialist Solutions Architect at AWS. Her expertise is in building large-scale data warehouses, both on premises and in the cloud. She provides architectural guidance to our customers on end-to-end data warehousing implementations and migrations.

Ranjan Burman is an Analytics Specialist Solutions Architect at AWS.

Easy analytics and cost-optimization with Amazon Redshift Serverless

Post Syndicated from Ahmed Shehata original https://aws.amazon.com/blogs/big-data/easy-analytics-and-cost-optimization-with-amazon-redshift-serverless/

Amazon Redshift Serverless makes it easy to run and scale analytics in seconds without the need to setup and manage data warehouse clusters. With Redshift Serverless, users such as data analysts, developers, business professionals, and data scientists can get insights from data by simply loading and querying data in the data warehouse.

With Redshift Serverless, you can benefit from the following features:

  • Access and analyze data without the need to set up, tune, and manage Amazon Redshift clusters
  • Use Amazon Redshift’s SQL capabilities, industry-leading performance, and data lake integration to seamlessly query data across a data warehouse, data lake, and databases
  • Deliver consistently high performance and simplified operations for even the most demanding and volatile workloads with intelligent and automatic scaling, without under-provisioning or over-provisioning the compute resources
  • Pay for the compute only when the data warehouse is in use

In this post, we discuss four different use cases of Redshift Serverless:

  • Easy analytics – A startup company needs to create a new data warehouse and reports for marketing analytics. They have very limited IT resources, and need to get started quickly and easily with minimal infrastructure or administrative overhead.
  • Self-service analytics – An existing Amazon Redshift customer has a provisioned Amazon Redshift cluster that is right-sized for their current workload. A new team needs quick self-service access to the Amazon Redshift data to create forecasting and predictive models for the business.
  • Optimize workload performance – An existing Amazon Redshift customer is looking to optimize the performance of their variable reporting workloads during peak time.
  • Cost-optimization of sporadic workloads – An existing customer is looking to optimize the cost of their Amazon Redshift producer cluster with sporadic batch ingestion workloads.

Easy analytics

In our first use case, a startup company with limited resources needs to create a new data warehouse and reports for marketing analytics. The customer doesn’t have any IT administrators, and their staff is comprised of data analysts, a data scientist, and business analysts. They want to create new marketing analytics quickly and easily, to determine the ROI and effectiveness of their marketing efforts. Given their limited resources, they want minimal infrastructure and administrative overhead.

In this case, they can use Redshift Serverless to satisfy their needs. They can create a new Redshift Serverless endpoint in a few minutes and load their initial few TBs of marketing dataset into Redshift Serverless quickly. Their data analysts, data scientists, and business analysts can start querying and analyzing the data with ease and derive business insights quickly without worrying about infrastructure, tuning, and administrative tasks.

Getting started with Redshift Serverless is easy and quick. On the Get started with Amazon Redshift Serverless page, you can select the Use default settings option, which will create a default namespace and workgroup with the default settings, as shown in the following screenshots.

With just a single click, you can create a new Redshift Serverless endpoint in minutes with data encryption enabled, and a default AWS Identity and Access Management (IAM) role, VPC, and security group attached. You can also use the Customize settings option to override these settings, if desired.

When the Redshift Serverless endpoint is available, choose Query data to launch the Amazon Redshift Query Editor v2.

Query Editor v2 makes it easy to create database objects, load data, analyze and visualize data, and share and collaborate with your teams.

The following screenshot illustrates creating new database tables using the UI.

The following screenshot demonstrates loading data from Amazon Simple Storage Service (Amazon S3) using the UI.

The following screenshot shows an example of analyzing and visualizing data.

Refer to the video Get Started with Amazon Redshift Serverless to learn how to set up a new Redshift Serverless endpoint and start analyzing your data in minutes.

Self-service analytics

In another use case, a customer is currently using an Amazon Redshift provisioned cluster that is right-sized for their current workloads. A new data science team wants quick access to the Amazon Redshift cluster data for a new workload that will build predictive models for forecasting. The new team members don’t know yet how long they will need access and how complex their queries will be.

Adding the new data science group to the current cluster presented the following challenges:

  • The additional compute capacity needs of the new team are unknown and hard to estimate
  • Because the current cluster resources are optimally utilized, they need to ensure workload isolation to support the needs of the new team without impacting existing workloads
  • A chargeback or cost allocation model is desired for the various teams consuming data

To address these issues, they decide to let the data science team create their own new Redshift Serverless instance and grant them data share access to the data they need from the existing Amazon Redshift provisioned cluster. The following diagram illustrates the new architecture.

The following steps need to be performed to implement this architecture:

  1. The data science team can create a new Redshift Serverless endpoint, as described in the previous use case.
  2. Enable data sharing between the Amazon Redshift provisioned cluster (producer) and the data science Redshift Serverless endpoint (consumer) using these high-level steps:
    1. Create a new data share.
    2. Add a schema to the data share.
    3. Add objects you want to share to the data share.
    4. Grant usage on this data share to the Redshift Serverless consumer namespace, using the Redshift Serverless endpoint’s namespace ID.
    5. Note that the Redshift Serverless endpoint is encrypted by default; the provisioned Redshift producer cluster also needs to be encrypted for data sharing to work between them.

The following screenshot shows sample SQL commands to enable data sharing on the Amazon Redshift provisioned producer cluster.

On the Amazon Redshift Serverless consumer, create a database from the data share and then query the shared objects.

For more details about configuring Amazon Redshift data sharing, refer to Sharing Amazon Redshift data securely across Amazon Redshift clusters for workload isolation.

With this architecture, we can resolve the three challenges mentioned earlier:

  • Redshift Serverless allows the data science team to create a new Amazon Redshift database without worrying about capacity needs, and set up data sharing with the Amazon Redshift provisioned producer cluster within 30 minutes. This tackles the first challenge.
  • Amazon Redshift data sharing allows you to share live, transactionally consistent data across provisioned and Serverless Redshift databases, and data sharing can even happen when the producer is paused. The new workload is isolated and runs on its own compute resources, without impacting the performance of the Amazon Redshift provisioned producer cluster. This addresses the second challenge.
  • Redshift Serverless isolates the cost of the new workload to the new team and enables an easy chargeback model. This tackles the third challenge.

Optimized workload performance

For our third use case, an Amazon Redshift customer using an Amazon Redshift provisioned cluster is looking for performance optimization during peak times for their workload. They need a solution to manage dynamic workloads without over-provisioning or under-provisioning resources and build a scalable architecture.

An analysis of the workload on the cluster shows that the cluster has two different workloads:

  • The first workload is streaming ingestion, which runs steadily during the day.
  • The second workload is reporting, which runs on an ad hoc basis during the day with some scheduled jobs during the night. It was noted that the reporting jobs run anywhere between 8–12 hours daily.

The provisioned cluster was sized as 12 nodes of ra3.4xlarge to handle both workloads running in parallel.

To optimize these workloads, the following architecture was proposed and implemented:

  • Configure an Amazon Redshift provisioned cluster with just 4 nodes of ra3.4xlarge, to handle the streaming ingestion workload only. The following screenshots illustrate how to do this on the Amazon Redshift console, via an elastic resize operation of the existing Amazon Redshift provisioned cluster by reducing number of nodes from 12 to 4:
  • Create a new Redshift Serverless endpoint to be utilized by the reporting workload with 128 RPU (Redshift Processing Units) in lieu of 8 nodes ra3.4xlarge. For more details about setting up Redshift Serverless, refer to the first use case regarding easy analytics.
  • Enable data sharing between the Amazon Redshift provisioned cluster as the producer and Redshift Serverless as the consumer using the serverless namespace ID, similar to how it was configured earlier in the self-service analytics use case. For more information about how to configure Amazon Redshift data sharing, refer to Sharing Amazon Redshift data securely across Amazon Redshift clusters for workload isolation.

The following diagram compares the current architecture and the new architecture using Redshift Serverless.

After completing this setup, the customer ran the streaming ingestion workload on the Amazon Redshift provisioned instance (producer) and reporting workloads on Redshift Serverless (consumer) based on the recommended architecture. The following improvements were observed:

  • The streaming ingestion workload performed the same as it did on the former 12-node Amazon Redshift provisioned cluster.
  • Reporting users saw a performance improvement of 30% by using Redshift Serverless. It was able to scale compute resources dynamically within seconds, as additional ad hoc users ran reports and queries without impacting the streaming ingestion workload.
  • This architecture pattern is expandable to add more consumers like data scientists, by setting up another Redshift Serverless instance as a new consumer.

Cost-optimization

In our final use case, a customer is using an Amazon Redshift provisioned cluster as a producer to ingest data from different sources. The data is then shared with other Amazon Redshift provisioned consumer clusters for data science modeling and reporting purposes.

Their current Amazon Redshift provisioned producer cluster has 8 nodes of ra3.4xlarge and is located in the us-east-1 Region. The data delivery from the different data sources is scattered between midnight to 8:00 AM, and the data ingestion jobs take around 3 hours to run in total every day. The customer is currently on the on-demand cost model and has scheduled daily jobs to pause and resume the cluster to minimize costs. The cluster resumes every day at midnight and pauses at 8:00 AM, with a total runtime of 8 hours a day.

The current annual cost of this cluster is 365 days * 8 hours * 8 nodes * $3.26 (node cost per hour) = $76,153.6 per year.

To optimize the cost of this workload, the following architecture was proposed and implemented:

  • Set up a new Redshift Serverless endpoint with 64 RPU as the base configuration to be utilized by the data ingestion producer team. For more information about setting up Redshift Serverless, refer to the first use case regarding easy analytics.
  • Restore the latest snapshot from the existing Amazon Redshift provisioned producer cluster into Redshift Serverless by choosing the Restore to serverless namespace option, as shown in the following screenshot.
  • Enable data sharing between Redshift Serverless as the producer and the Amazon Redshift provisioned cluster as the consumer, similar to how it was configured earlier in the self-service analytics use case.

The following diagram compares the current architecture to the new architecture.

By moving to Redshift Serverless, the customer realized the following benefits:

  • Cost savings – With Redshift Serverless, the customer pays for compute only when the data warehouse is in use. In this scenario, the customer observed a savings of up to 65% on their annual costs by using Redshift Serverless as the producer, while still getting better performance on their workloads. The Redshift Serverless annual cost in this case equals 365 days * 3 hours * 64 RPUs * $0.375 (RPU cost per hour) = $26,280, compared to $76,153.6 for their former provisioned producer cluster. Also, the Redshift Serverless 64 RPU baseline configuration offers the customer more compute resources than their former 8 nodes of ra3.4xlarge cluster, resulting in better performance overall.
  • Less administration overhead – Because the customer doesn’t need to worry about pausing and resuming their Amazon Redshift cluster any more, the administration of their data warehouse is simplified by moving their producer Amazon Redshift cluster to Redshift Serverless.

Conclusion

In this post, we discussed four different use cases, demonstrating the benefits of Amazon Redshift Serverless—from its easy analytics, ease of use, superior performance, and cost savings that can be realized from the pay-per-use pricing model.

Amazon Redshift provides flexibility and choice in data warehousing. Amazon Redshift Provisioned is a great choice for customers who need a custom provisioning environment with more granular controls; and with Redshift Serverless, you can start new data warehousing workloads in minutes with dynamic auto scaling, no infrastructure management, and a pay-per-use pricing model.

We encourage you to start using Amazon Redshift Serverless today and enjoy the many benefits it offers.


About the Authors

Ahmed Shehata is a Data Warehouse Specialist Solutions Architect with Amazon Web Services, based out of Toronto.

Manish Vazirani is an Analytics Platform Specialist at AWS. He is part of the Data-Driven Everything (D2E) program, where he helps customers become more data-driven.

Rohit Bansal is an Analytics Specialist Solutions Architect at AWS. He has nearly two decades of experience helping customers modernize their data platforms. He is passionate about helping customers build scalable, cost-effective data and analytics solutions in the cloud. In his spare time, he enjoys spending time with his family, travel, and road cycling.

Convert Oracle XML BLOB data to JSON using Amazon EMR and load to Amazon Redshift

Post Syndicated from Abhilash Nagilla original https://aws.amazon.com/blogs/big-data/convert-oracle-xml-blob-data-to-json-using-amazon-emr-and-load-to-amazon-redshift/

In legacy relational database management systems, data is stored in several complex data types, such XML, JSON, BLOB, or CLOB. This data might contain valuable information that is often difficult to transform into insights, so you might be looking for ways to load and use this data in a modern cloud data warehouse such as Amazon Redshift. One such example is migrating data from a legacy Oracle database with XML BLOB fields to Amazon Redshift, by performing preprocessing and conversion of XML to JSON using Amazon EMR. In this post, we describe a solution architecture for this use case, and show you how to implement the code to handle the XML conversion.

Solution overview

The first step in any data migration project is to capture and ingest the data from the source database. For this task, we use AWS Database Migration Service (AWS DMS), a service that helps you migrate databases to AWS quickly and securely. In this example, we use AWS DMS to extract data from an Oracle database with XML BLOB fields and stage the same data in Amazon Simple Storage Service (Amazon S3) in Apache Parquet format. Amazon S3 is an object storage service offering industry-leading scalability, data availability, security, and performance, and is the storage of choice for setting up data lakes on AWS.

After the data is ingested into an S3 staging bucket, we used Amazon EMR to run a Spark job to perform the conversion of XML fields to JSON fields, and the results are loaded in a curated S3 bucket. Amazon EMR runtime for Apache Spark can be over three times faster than clusters without EMR runtime, and has 100% API compatibility with standard Apache Spark. This improved performance means your workloads run faster and it saves you compute costs, without making any changes to your application.

Finally, transformed and curated data is loaded into Amazon Redshift tables using the COPY command. The Amazon Redshift table structure should match the number of columns and the column data types in the source file. Because we stored the data as a Parquet file, we specify the SERIALIZETOJSON option in the COPY command. This allows us to load complex types, such as structure and array, in a column defined as SUPER data type in the table.

The following architecture diagram shows the end-to-end workflow.

In detail, AWS DMS migrates data from the source database tables into Amazon S3, in Parquet format. Apache Spark on Amazon EMR reads the raw data, transforms the XML data type into JSON, and saves the data to the curated S3 bucket. In our code, we used an open-source library, called spark-xml, to parse and query the XML data.

In the rest of this post, we assume that the AWS DMS tasks have already run and created the source Parquet files in the S3 staging bucket. If you want to set up AWS DMS to read from an Oracle database with LOB fields, refer to Effectively migrating LOB data to Amazon S3 from Amazon RDS for Oracle with AWS DMS or watch the video Migrate Oracle to S3 Data lake via AWS DMS.

Prerequisites

If you want to follow along with the examples in this post using your AWS account, we provide an AWS CloudFormation template you can launch by choosing Launch Stack:

BDB-2063-launch-cloudformation-stack

Provide a stack name and leave the default settings for everything else. Wait for the stack to display Create Complete (this should only take a few minutes) before moving on to the other sections.

The template creates the following resources:

  • A virtual private cloud (VPC) with two private subnets that have routes to an Amazon S3 VPC endpoint
  • The S3 bucket {stackname}-s3bucket-{xxx}, which contains the following folders:
    • libs – Contains the JAR file to add to the notebook
    • notebooks – Contains the notebook to interactively test the code
    • data – Contains the sample data
  • An Amazon Redshift cluster, in one of the two private subnets, with a database named rs_xml_db and a schema named rs_xml
  • A secret (rs_xml_db) in AWS Secrets Manager
  • An EMR cluster

The CloudFormation template shared in this post is purely for demonstration purposes only. Please conduct your own security review and incorporate best practices prior to any production deployment using artifacts from the post.

Finally, some basic knowledge of Python and Spark DataFrames can help you review the transformation code, but isn’t mandatory to complete the example.

Understanding the sample data

In this post, we use college students’ course and subjects sample data that we created. In the source system, data consists of flat structure fields, like course_id and course_name, and an XML field that includes all the course material and subjects involved in the respective course. The following screenshot is an example of the source data, which is staged in an S3 bucket as a prerequisite step.

We can observe that the column study_material_info is an XML type field and contains nested XML tags in it. Let’s see how to convert this nested XML field to JSON in the subsequent steps.

Run a Spark job in Amazon EMR to transform the XML fields in the raw data to JSON

In this step, we use an Amazon EMR notebook, which is a managed environment to create and open Jupyter Notebook and JupyterLab interfaces. It enables you to interactively analyze and visualize data, collaborate with peers, and build applications using Apache Spark on EMR clusters. To open the notebook, follow these steps:

  1. On the Amazon S3 console, navigate to the bucket you created as a prerequisite step.
  2. Download the file in the notebooks folder.
  3. On the Amazon EMR console, choose Notebooks in the navigation pane.
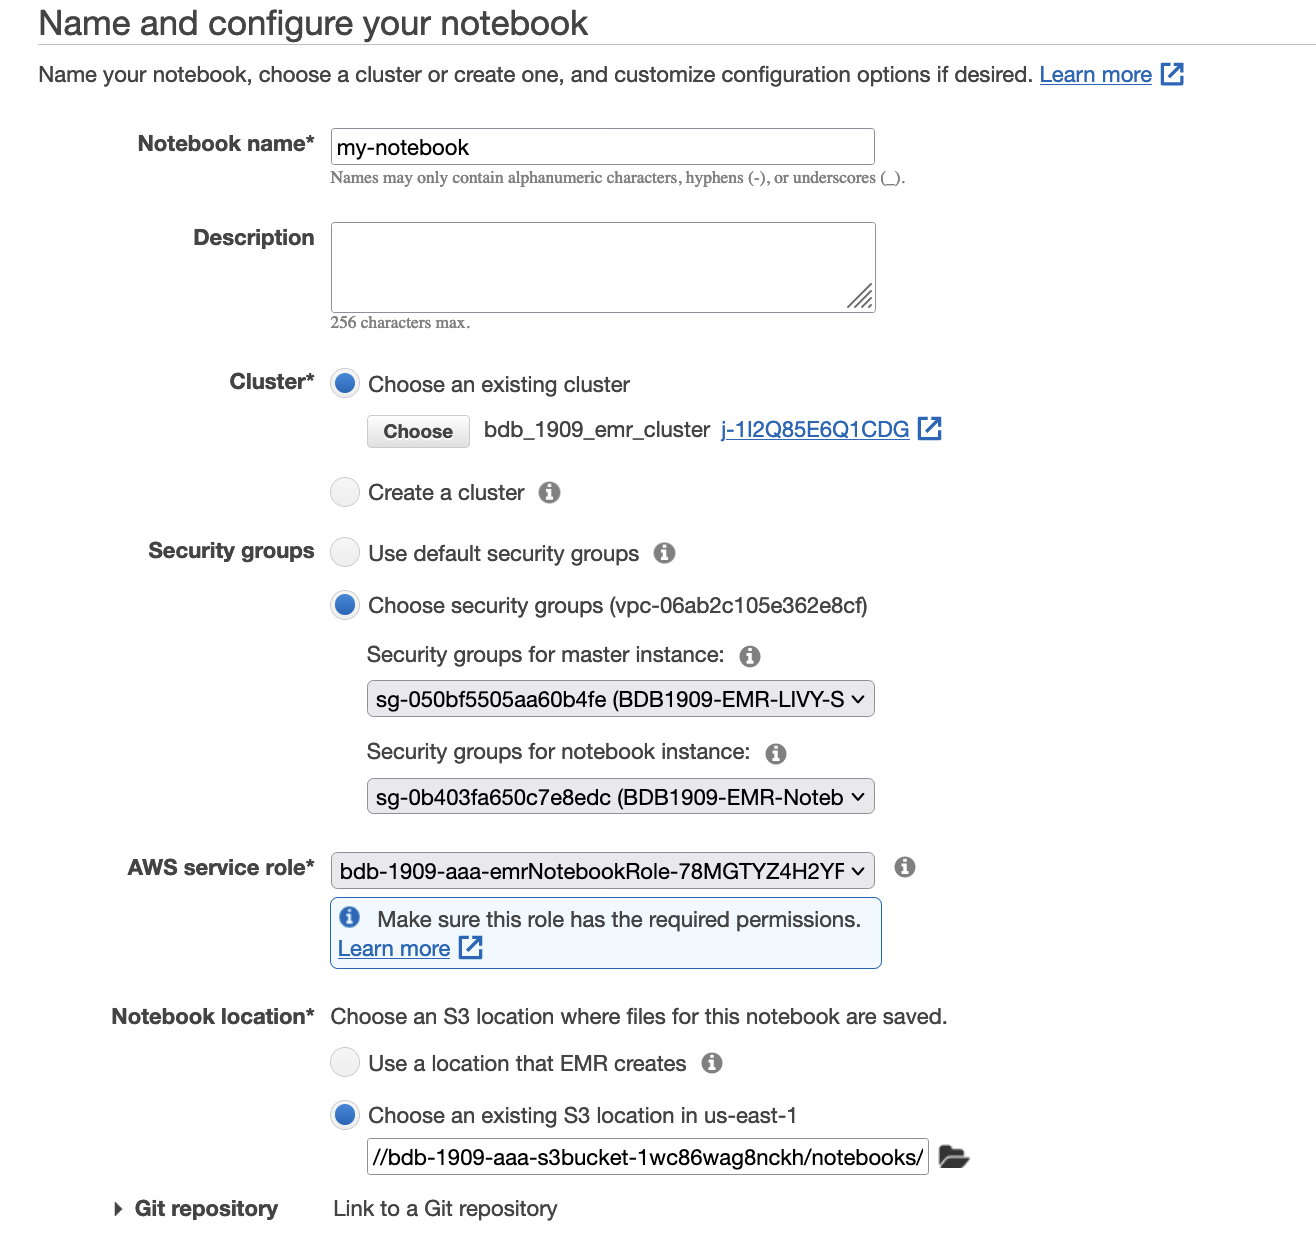
  4. Choose Create notebook.
  5. For Notebook name, enter a name.
  6. For Cluster, select Choose an existing cluster.
  7. Select the cluster you created as a prerequisite.
  8. For Security Groups, choose BDB1909-EMR-LIVY-SG and BDB1909-EMR-Notebook-SG
  9. For AWS Service Role, choose the role bdb1909-emrNotebookRole-{xxx}.
  10. For Notebook location, specify the S3 path in the notebooks folder (s3://{stackname}-s3bucket-xxx}/notebooks/).
  11. Choose Create notebook.
  12. When the notebook is created, choose Open in JupyterLab.
  13. Upload the file you downloaded earlier.
  14. Open the new notebook.

    The notebook should look as shown in the following screenshot, and it contains a script written in Scala.
  15. Run the first two cells to configure Apache Spark with the open-source spark-xml library and import the needed modules.The spark-xml package allows reading XML files in local or distributed file systems as Spark DataFrames. Although primarily used to convert (portions of) large XML documents into a DataFrame, spark-xml can also parse XML in a string-valued column in an existing DataFrame with the from_xml function, in order to add it as a new column with parsed results as a struct.
  16. To do so, in the third cell, we load the data from the Parquet file generated by AWS DMS into a DataFrame, then we extract the attribute that contains the XML code (STUDY_MATERIAL_INFO) and map it to a string variable name payloadSchema.
  17. We can now use the payloadSchema in the from_xml function to convert the field STUDY_MATERIAL_INFO into a struct data type and added it as a column named course_material in a new DataFrame parsed.
  18. Finally, we can drop the original field and write the parsed DataFrame to our curated zone in Amazon S3.

Due to the structure differences between DataFrame and XML, there are some conversion rules from XML data to DataFrame and from DataFrame to XML data. More details and documentation are available XML Data Source for Apache Spark.

When we convert from XML to DataFrame, attributes are converted as fields with the heading prefix attributePrefix (underscore (_) is the default). For example, see the following code:

  <book category="undergraduate">
    <title lang="en">Introduction to Biology</title>
    <author>Demo Author 1</author>
    <year>2005</year>
    <price>30.00</price>
  </book>

It produces the following schema:

root
 |-- category: string (nullable = true)
 |-- title: struct (nullable = true)
 |    |-- _VALUE: string (nullable = true)
 |    |-- _lang: string (nullable = true)
 |-- author: string (nullable = true)
 |-- year: string (nullable = true)
 |-- price: string (nullable = true)

Next, we have a value in an element that has no child elements but attributes. The value is put in a separate field, valueTag. See the following code:

<title lang="en">Introduction to Biology</title>

It produces the following schema, and the tag lang is converted into the _lang field inside the DataFrame:

|-- title: struct (nullable = true)
 |    |-- _VALUE: string (nullable = true)
 |    |-- _lang: string (nullable = true)

Copy curated data into Amazon Redshift and query tables seamlessly

Because our semi-structured nested dataset is already written in the S3 bucket as Apache Parquet formatted files, we can use the COPY command with the SERIALIZETOJSON option to ingest data into Amazon Redshift. The Amazon Redshift table structure should match the metadata of the Parquet files. Amazon Redshift can replace any Parquet columns, including structure and array types, with SUPER data columns.

The following code demonstrates CREATE TABLE example to create a staging table.

create table rs_xml_db.public.stg_edw_course_catalog 
(
course_id bigint,
course_name character varying(5000),
course_material super
);

The following code uses the COPY example to load from Parquet format:

COPY rs_xml_db.public.stg_edw_course_catalog FROM 's3://<<your Amazon S3 Bucket for curated data>>/data/target/<<your output parquet file>>' 
IAM_ROLE '<<your IAM role>>' 
FORMAT PARQUET SERIALIZETOJSON; 

By using semistructured data support in Amazon Redshift, you can ingest and store semistructured data in your Amazon Redshift data warehouses. With the SUPER data type and PartiQL language, Amazon Redshift expands the data warehouse capability to integrate with both SQL and NoSQL data sources. The SUPER data type only supports up to 1 MB of data for an individual SUPER field or object. Note, the JSON object may be stored in a SUPER data type, but reading this data using JSON functions currently has a VARCHAR (65535 byte) limit. See Limitations for more details.

The following example shows how nested JSON can be easily accessed using SELECT statements:

SELECT DISTINCT bk._category
	,bk.author
	,bk.price
	,bk.year
	,bk.title._lang
FROM rs_xml_db.public.stg_edw_course_catalog main
INNER JOIN main.course_material.book bk ON true;

The following screenshot shows our results.

Clean up

To avoid incurring future charges, first delete the notebook and the related files on Amazon S3 bucket as explained in this EMR documentation page then the CloudFormation stack.

Conclusion

This post demonstrated how to use AWS services like AWS DMS, Amazon S3, Amazon EMR, and Amazon Redshift to seamlessly work with complex data types like XML and perform historical migrations when building a cloud data lake house on AWS. We encourage you to try this solution and take advantage of all the benefits of these purpose-built services.

If you have questions or suggestions, please leave a comment.


About the authors

Abhilash Nagilla is a Sr. Specialist Solutions Architect at AWS, helping public sector customers on their cloud journey with a focus on AWS analytics services. Outside of work, Abhilash enjoys learning new technologies, watching movies, and visiting new places.

Avinash Makey is a Specialist Solutions Architect at AWS. He helps customers with data and analytics solutions in AWS. Outside of work he plays cricket, tennis and volleyball in free time.

Fabrizio Napolitano is a Senior Specialist SA for DB and Analytics. He has worked in the analytics space for the last 20 years, and has recently and quite by surprise become a Hockey Dad after moving to Canada.

How Fannie Mae built a data mesh architecture to enable self-service using Amazon Redshift data sharing

Post Syndicated from Kiran Ramineni original https://aws.amazon.com/blogs/big-data/how-fannie-mae-built-a-data-mesh-architecture-to-enable-self-service-using-amazon-redshift-data-sharing/

This post is co-written by Kiran Ramineni and Basava Hubli, from Fannie Mae.

Amazon Redshift data sharing enables instant, granular, and fast data access across Amazon Redshift clusters without the need to copy or move data around. Data sharing provides live access to data so that users always see the most up-to-date and transactionally consistent views of data across all consumers as data is updated in the producer. You can share live data securely with Amazon Redshift clusters in the same or different AWS accounts, and across Regions. Data sharing enables secure and governed collaboration within and across organizations as well as external parties.

In this post, we see how Fannie Mae implemented a data mesh architecture using Amazon Redshift cross-account data sharing to break down the silos in data warehouses across business units.

About Fannie Mae

Chartered by U.S. Congress in 1938, Fannie Mae advances equitable and sustainable access to homeownership and quality, affordable rental housing for millions of people across America. Fannie Mae enables the 30-year fixed-rate mortgage and drives responsible innovation to make homebuying and renting easier, fairer, and more accessible. We are focused on increasing operational agility and efficiency, accelerating the digital transformation of the company to deliver more value and reliable, modern platforms in support of the broader housing finance system.

Background

To fulfill the mission of facilitating equitable and sustainable access to homeownership and quality, affordable rental housing across America, Fannie Mae embraced a modern cloud-based architecture which leverages data to drive actionable insights and business decisions. As part of the modernization strategy, we embarked on a journey to migrate our legacy on-premises workloads to AWS cloud including managed services such as Amazon Redshift and Amazon S3. The modern data platform on AWS cloud serves as the central data store for analytics, research, and data science. In addition, this platform also serves for governance, regulatory and financial reports.

To address capacity, scalability and elasticity needs of a large data footprint of over 4PB, we decentralized and delegated ownership of the data stores and associated management functions to their respective business units. To enable decentralization, and efficient data access and management, we adopted a data mesh architecture.

Data mesh solution architecture

To enable a seamless access to data across accounts and business units, we looked at various options to build an architecture that is sustainable and scalable. The data mesh architecture allowed us to keep data of the respective business units in their own accounts, but yet enable a seamless access across the business unit accounts in a secure manner.  We reorganized the AWS account structure to have separate accounts for each of the business units wherein, business data and dependent applications were collocated in their respective AWS Accounts.

With this decentralized model, the business units independently manage the responsibility of hydration, curation and security of their data.  However, there is a critical need to enable seamless and efficient access to data across business units and an ability to govern the data usage. Amazon Redshift cross-account data sharing meets this need and enables us with business continuity.

To facilitate the self-serve capability on the data mesh, we built a web portal that allows for data discovery and ability to subscribe to data in the Amazon Redshift data warehouse and Amazon Simple Storage Service (Amazon S3) data lake (lake house). Once a consumer initiates a request on the web portal, an approval workflow is triggered with notification to the governance and business data owner. Upon successful completion of the request workflow, an automation process is triggered to grant access to the consumer, and a notification is sent to the consumer. Subsequently, the consumer is able to access the requested datasets. The workflow process of request, approval, and subsequent provisioning of access was automated using APIs and AWS Command Line Interface (AWS CLI) commands, and entire process is designed to complete within a few minutes.

With this new architecture using Amazon Redshift cross-account data sharing, we were able implement and benefit from the following key principles of a data mesh architecture that fit very well for our use case:

  • A data as a product approach
  • A federated model of data ownership
  • The ability for consumers to subscribe using self-service data access
  • Federated data governance with the ability to grant and revoke access

The following architecture diagram shows the high-level data mesh architecture we implemented at Fannie Mae. Data from each of the operational systems is collected and stored in individual lake houses and subscriptions are managed through a data mesh catalog in a centralized control plane account.

Fig 1. High level Data Mesh catalog architecture

Fig 1. High level Data Mesh catalog architecture

Control plane for data mesh

With a redesigned account structure, data are spread out across separate accounts for each business application area in S3 data lake or in Amazon Redshift cluster. We designed a hub and spoke point-to-point data distribution scheme with a centralized semantic search to enhance the data relevance. We use a centralized control plane account to store the catalog information, contract detail, approval workflow policies, and access management details for the data mesh. With a policy driven access paradigm, we enable fine-grained access management to the data, where we automated Data as a Service enablement with an optimized approach. It has three modules to store and manage catalog, contracts, and access management.

Data catalog

The data catalog provides the data glossary and catalog information, and helps fully satisfy governance and security standards. With AWS Glue crawlers, we create the catalog for the lake house in a centralized control plane account, and then we automate the sharing process in a secure manner. This enables a query-based framework to pinpoint the exact location of the data. The data catalog collects the runtime information about the datasets for indexing purposes, and provides runtime metrics for analytics on dataset usage and access patterns. The catalog also provides a mechanism to update the catalog through automation as new datasets become available.

Contract registry

The contract registry hosts the policy engine, and uses Amazon DynamoDB to store the registry policies. This has the details on entitlements to physical mapping of data, and workflows for the access management process. We also use this to store and maintain the registry of existing data contracts and enable audit capability to determine and monitor the access patterns. In addition, the contract registry serves as the store for state management functionality.

Access management automation

Controlling and managing access to the dataset is done through access management. This provides a just-in-time data access through IAM session policies using a persona-driven approach. The access management module also hosts event notification for data, such as frequency of access or number of reads, and we then harness this information for data access lifecycle management. This module plays a critical role in the state management and provides extensive logging and monitoring capabilities on the state of the data.

Process flow of data mesh using Amazon Redshift cross-account data sharing

The process flow starts with creating a catalog of all datasets available in the control plane account. Consumers can request access to the data through a web front-end catalog, and the approval process is triggered through the central control plane account. The following architecture diagram represents the high-level implementation of Amazon Redshift data sharing via the data mesh architecture. The steps of the process flow are as follows:

  1. All the data products, Amazon Redshift tables, and S3 buckets are registered in a centralized AWS Glue Data Catalog.
  2. Data scientists and LOB users can browse the Data Catalog to find the data products available across all lake houses in Fannie Mae.
  3. Business applications can consume the data in other lake houses by registering a consumer contract. For example, LOB1-Lakehouse can register the contract to utilize data from LOB3-Lakehouse.
  4. The contract is reviewed and approved by the data producer, which subsequently triggers a technical event via Amazon Simple Service Notification (Amazon SNS).
  5. The subscribing AWS Lambda function runs AWS CLI commands, ACLs, and IAM policies to set up Amazon Redshift data sharing and make data available for consumers.
  6. Consumers can access the subscribed Amazon Redshift cluster data using their own cluster.
Fig 2. Data Mesh architecture using Amazon Redshift data sharing

Fig 2. Data Mesh architecture using Amazon Redshift data sharing

The intention of this post is not to provide detailed steps for every aspect of creating the data mesh, but to provide a high-level overview of the architecture implemented, and how you can use various analytics services and third-party tools to create a scalable data mesh with Amazon Redshift and Amazon S3. If you want to try out creating this architecture, you can use these steps and automate the process using your tool of choice for the front-end user interface to enable users to subscribe to the dataset.

The steps we describe here are a simplified version of the actual implementation, so it doesn’t involve all the tools and accounts. To set up this scaled-down data mesh architecture, we demonstrate using cross-account data sharing using one control plane account and two consumer accounts. For this, you should have the following prerequisites:

  • Three AWS accounts, one for the producer <ProducerAWSAccount1>, and two consumer accounts: <ConsumerAWSAccount1> and <ConsumerAWSAccount2>
  • AWS permissions to provision Amazon Redshift and create an IAM role and policy
  • The required Amazon Redshift clusters: one for the producer in the producer AWS account, a cluster in ConsumerCluster1, and optionally a cluster in ConsumerCluster2
  • Two users in the producer account, and two users in consumer account 1:
    • ProducerClusterAdmin – The Amazon Redshift user with admin access on the producer cluster
    • ProducerCloudAdmin – The IAM user or role with rights to run authorize-data-share and deauthorize-data-share AWS CLI commands in the producer account
    • Consumer1ClusterAdmin – The Amazon Redshift user with admin access on the consumer cluster
    • Consumer1CloudAdmin – The IAM user or role with rights to run associate-data-share-consumer and disassociate-data-share-consumer AWS CLI commands in the consumer account

Implement the solution

On the Amazon Redshift console, log in to the producer cluster and run the following statements using the query editor:

CREATE DATASHARE ds;

ALTER DATASHARE ds ADD SCHEMA PUBLIC;
ALTER DATASHARE ds ADD TABLE table1;
ALTER DATASHARE ds ADD ALL TABLES IN SCHEMA sf_schema;

For sharing data across AWS accounts, you can use the following GRANT USAGE command. For authorizing the data share, typically it will be done by a manager or approver. In this case, we show how you can automate this process using the AWS CLI command authorize-data-share.

GRANT USAGE ON DATASHARE ds TO ACCOUNT <CONSUMER ACCOUNT>;

aws redshift authorize-data-share --data-share-arn <DATASHARE ARN> --consumer-identifier <CONSUMER ACCOUNT>

For the consumer to access the shared data from producer, an administrator on the consumer account needs to associate the data share with one or more clusters. This can be done using the Amazon Redshift console or AWS CLI commands. We provide the following AWS CLI command because this is how you can automate the process from the central control plane account:

aws redshift associate-data-share-consumer --no-associate-entire-account --data-share-arn <DATASHARE ARN> --consumer-arn <CONSUMER CLUSTER ARN>

/* Create Database in Consumer Account */
CREATE DATABASE ds_db FROM DATASHARE ds OF ACCOUNT <PRODUCER ACCOUNT> NAMESPACE <PRODUCER CLUSTER NAMESPACE>;

Optional:
CREATE EXTERNAL SCHEMA Schema_from_datashare FROM REDSHIFT DATABASE 'ds_db' SCHEMA 'public';

GRANT USAGE ON DATABASE ds_db TO user/group;

/* Optional:Grant usage on database to users or groups */
GRANT USAGE ON SCHEMA Schema_from_datashare TO GROUP Analyst_group;

To enable Amazon Redshift Spectrum cross-account access to AWS Glue and Amazon S3, and the IAM roles required, refer to How can I create Amazon Redshift Spectrum cross-account access to AWS Glue and Amazon S3.

Conclusion

Amazon Redshift data sharing provides a simple, seamless, and secure platform for sharing data in a domain-oriented distributed data mesh architecture. Fannie Mae deployed the Amazon Redshift data sharing capability across the data lake and data mesh platforms, which currently hosts over 4 petabytes worth of business data. The capability has been seamlessly integrated with their Just-In-Time (JIT) data provisioning framework enabling a single-click, persona-driven access to data. Further, Amazon Redshift data sharing coupled with Fannie Mae’s centralized, policy-driven data governance framework greatly simplified access to data in the lake ecosystem while fully conforming to the stringent data governance policies and standards. This demonstrates that Amazon Redshift users can create data share as product to distribute across many data domains.

In summary, Fannie Mae was able to successfully integrate the data sharing capability in their data ecosystem to bring efficiencies in data democratization and introduce a higher velocity, near real-time access to data across various business units. We encourage you to explore the data sharing feature of Amazon Redshift to build your own data mesh architecture and improve access to data for your business users.


About the authors

Kiran Ramineni is Fannie Mae’s Vice President Head of Single Family, Cloud, Data, ML/AI & Infrastructure Architecture, reporting to the CTO and Chief Architect. Kiran and team spear headed cloud scalable Enterprise Data Mesh (Data Lake) with support for Just-In-Time (JIT), and Zero Trust as it applies to Citizen Data Scientist and Citizen Data Engineers. In the past Kiran built/lead several internet scalable always-on platforms.

Basava Hubli is a Director & Lead Data/ML Architect at Enterprise Architecture. He oversees the Strategy and Architecture of Enterprise Data, Analytics and Data Science platforms at Fannie Mae. His primary focus is on Architecture Oversight and Delivery of Innovative technical capabilities that solve for critical Enterprise business needs. He leads a passionate and motivated team of architects who are driving the modernization and adoption of the Data, Analytics and ML platforms on Cloud. Under his leadership, Enterprise Architecture has successfully deployed several scalable, innovative platforms & capabilities that includes, a fully-governed Data Mesh which hosts peta-byte scale business data and a persona-driven, zero-trust based data access management framework which solves for the organization’s data democratization needs.

Rajesh Francis is a Senior Analytics Customer Experience Specialist at AWS. He specializes in Amazon Redshift and focuses on helping to drive AWS market and technical strategy for data warehousing and analytics. Rajesh works closely with large strategic customers to help them adopt our new services and features, develop long-term partnerships, and feed customer requirements back to our product development teams to guide the direction of our product offerings.

Kiran Sharma is a Senior Data Architect in AWS Professional Services. Kiran helps customers architecting, implementing and optimizing peta-byte scale Big Data Solutions on AWS.

Set up federated access to Amazon Athena for Microsoft AD FS users using AWS Lake Formation and a JDBC client

Post Syndicated from Mostafa Safipour original https://aws.amazon.com/blogs/big-data/set-up-federated-access-to-amazon-athena-for-microsoft-ad-fs-users-using-aws-lake-formation-and-a-jdbc-client/

Tens of thousands of AWS customers choose Amazon Simple Storage Service (Amazon S3) as their data lake to run big data analytics, interactive queries, high-performance computing, and artificial intelligence (AI) and machine learning (ML) applications to gain business insights from their data. On top of these data lakes, you can use AWS Lake Formation to ingest, clean, catalog, transform, and help secure your data and make it available for analysis and ML. Once you have setup your data lake, you can use Amazon Athena which is an interactive query service that makes it easy to analyze data in Amazon Simple Storage Service (Amazon S3) using standard SQL.

With Lake Formation, you can configure and manage fine-grained access control to new or existing databases, tables, and columns defined in the AWS Glue Data Catalog for data stored in Amazon S3. After you set access permissions using Lake Formation, you can use analytics services such as Amazon Athena, Amazon Redshift, and Amazon EMR without needing to configure policies for each service.

Many of our customers use Microsoft Active Directory Federation Services (AD FS) as their identity provider (IdP) while using cloud-based services. In this post, we provide a step-by-step walkthrough of configuring AD FS as the IdP for SAML-based authentication with Athena to query data stored in Amazon S3, with access permissions defined using Lake Formation. This enables end-users to log in to their SQL client using Active Directory credentials and access data with fine-grained access permissions.

Solution overview

To build the solution, we start by establishing trust between AD FS and your AWS account. With this trust in place, AD users can federate into AWS using their AD credentials and assume permissions of an AWS Identity and Access Management (IAM) role to access AWS resources such as the Athena API.

To create this trust, you add AD FS as a SAML provider into your AWS account and create an IAM role that federated users can assume. On the AD FS side, you add AWS as a relying party and write SAML claim rules to send the right user attributes to AWS (specifically Lake Formation) for authorization purposes.

The steps in this post are structured into the following sections:

  1. Set up an IAM SAML provider and role.
  2. Configure AD FS.
  3. Create Active Directory users and groups.
  4. Create a database and tables in the data lake.
  5. Set up the Lake Formation permission model.
  6. Set up a SQL client with JDBC connection.
  7. Verify access permissions.

The following diagram provides an overview of the solution architecture.

The flow for the federated authentication process is as follows:

  1. The SQL client which has been configured with Active Directory credentials sends an authentication request to AD FS.
  2. AD FS authenticates the user using Active Directory credentials, and returns a SAML assertion.
  3. The client makes a call to Lake Formation, which initiates an internal call with AWS Security Token Service (AWS STS) to assume a role with SAML for the client.
  4. Lake Formation returns temporary AWS credentials with permissions of the defined IAM role to the client.
  5. The client uses the temporary AWS credentials to call the Athena API StartQueryExecution.
  6. Athena retrieves the table and associated metadata from the AWS Glue Data Catalog.
  7. On behalf of the user, Athena requests access to the data from Lake Formation (GetDataAccess). Lake Formation assumes the IAM role associated with the data lake location and returns temporary credentials.
  8. Athena uses the temporary credentials to retrieve data objects from Amazon S3.
  9. Athena returns the results to the client based on the defined access permissions.

For our use case, we use two sample tables:

  • LINEORDER – A fact table containing orders
  • CUSTOMER – A dimension table containing customer information including Personally Identifiable Information (PII) columns (c_name, c_phone, c_address)

We also have data consumer users who are members of the following teams:

  • CustomerOps – Can see both orders and customer information, including PII attributes of the customer
  • Finance – Can see orders for analytics and aggregation purposes but only non-PII attributes of the customer

To demonstrate this use case, we create two users called CustomerOpsUser and FinanceUser and three AD groups for different access patterns: data-customer (customer information access excluding PII attributes), data-customer-pii (full customer information access including PII attributes), and data-order (order information access). By adding the users to these three groups, we can grant the right level of access to different tables and columns.

Prerequisites

To follow along with this walkthrough, you must meet the following prerequisites:

Set up an IAM SAML provider and role

To set up your SAML provider, complete the following steps:

  1. In the IAM console, choose Identity providers in the navigation pane.
  2. Choose Add provider.
  3. For Provider Type, choose SAML.
  4. For Provider Name, enter adfs-saml-provider.
  5. For Metadata Document, download your AD FS server’s federation XML file by entering the following address in a browser with access to the AD FS server:
    https://<adfs-server-name>/FederationMetadata/2007-06/FederationMetadata.xml

  6. Upload the file to AWS by choosing Choose file.
  7. Choose Add provider to finish.

Now you’re ready to create a new IAM role.

  1. In the navigation pane, choose Roles.
  2. Choose Create role.
  3. For the type of trusted entity, choose SAML 2.0 federation.
  4. For SAML provider, choose the provider you created (adfs-saml-provider).
  5. Choose Allow programmatic and AWS Management Console access.
  6. The Attribute and Value fields should automatically populate with SAML:aud and https://signin.aws.amazon.com/saml.
  7. Choose Next:Permissions.
  8. Add the necessary IAM permissions to this role. For this post, attach AthenaFullAccess.

If the Amazon S3 location for your Athena query results doesn’t start with aws-athena-query-results, add another policy to allow users write query results into your Amazon S3 location. For more information, see Specifying a Query Result Location Using the Athena Console and Writing IAM Policies: How to Grant Access to an Amazon S3 Bucket.

  1. Leave the defaults in the next steps and for Role name, enter adfs-data-access.
  2. Choose Create role.
  3. Take note of the SAML provider and IAM role names to use in later steps when creating the trust between the AWS account and AD FS.

Configure AD FS

SAML-based federation has two participant parties: the IdP (Active Directory) and the relying party (AWS), which is the service or application that wants to use authentication from the IdP.

To configure AD FS, you first add a relying party trust, then you configure SAML claim rules for the relying party. Claim rules are the way that AD FS forms a SAML assertion sent to a relying party. The SAML assertion states that the information about the AD user is true, and that it has authenticated the user.

Add a relying party trust

To create your relying party in AD FS, complete the following steps:

  1. Log in to the AD FS server.
  2. On the Start menu, open ServerManger.
  3. On the Tools menu, choose the AD FS Management console.
  4. Under Trust Relationships in the navigation pane, choose Relying Party Trusts.
  5. Choose Add Relying Party Trust.
  6. Choose Start.
  7. Select Import data about the relying party published online or on a local network and enter the URL https://signin.aws.amazon.com/static/saml-metadata.xml.

The metadata XML file is a standard SAML metadata document that describes AWS as a relying party.

  1. Choose Next.
  2. For Display name, enter a name for your relying party.
  3. Choose Next.
  4. Select I do not want to configure multi-factor authentication.

For increased security, we recommend that you configure multi-factor authentication to help protect your AWS resources. We don’t enable multi-factor authentication for this post because we’re using a sample dataset.

  1. Choose Next.
  2. Select Permit all users to access this relying party and choose Next.

This allows all users in Active Directory to use AD FS with AWS as a relying party. You should consider your security requirements and adjust this configuration accordingly.

  1. Finish creating your relying party.

Configure SAML claim rules for the relying party

You create two sets of claim rules in this post. The first set (rules 1–4) contains AD FS claim rules that are required to assume an IAM role based on AD group membership. These are the rules that you also create if you want to establish federated access to the AWS Management Console. The second set (rules 5–6) are claim rules that are required for Lake Formation fine-grained access control.

To create AD FS claim rules, complete the following steps:

  1. On the AD FS Management console, find the relying party you created in the previous step.
  2. Right-click the relying party and choose Edit Claim Rules.
  3. Choose Add Rule and create your six new rules.
  4. Create claim rule 1, called NameID:
    1. For Rule template, use Transform an Incoming Claim.
    2. For Incoming claim type, choose Windows account name.
    3. For Outgoing claim type, choose Name ID.
    4. For Outgoing name ID format, choose Persistent Identifier.
    5. Select Pass through all claim values.
  5. Create claim rule 2, called RoleSessionName:
    1. For Rule template, use Send LDAP Attribute as Claims.
    2. For Attribute store, choose Active Directory.
    3. For Mapping of LDAP attributes to outgoing claim types, add the attribute E-Mail-Addresses and outgoing claim type https://aws.amazon.com/SAML/Attributes/RoleSessionName.
  6. Create claim rule 3, called Get AD Groups:
    1. For Rule template, use Send Claims Using a Custom Rule.
    2. For Custom rule, enter the following code:
      c:[Type == "http://schemas.microsoft.com/ws/2008/06/identity/claims/windowsaccountname", Issuer == "AD AUTHORITY"]
      => add(store = "Active Directory", types = ("http://temp/variable"), query = ";tokenGroups;{0}", param = c.Value);

  7. Create claim rule 4, called Roles:
    1. For Rule template, use Send Claims Using a Custom Rule.
    2. For Custom rule, enter the following code (enter your account number and name of the SAML provider you created earlier):
      c:[Type == "http://temp/variable", Value =~ "(?i)^aws-"]
      => issue(Type = "https://aws.amazon.com/SAML/Attributes/Role", Value = RegExReplace(c.Value, "aws-", "arn:aws:iam::<AWS ACCOUNT NUMBER>:saml-provider/<adfs-saml-provider>,arn:aws:iam::<AWS ACCOUNT NUMBER>:role/"));

Claim rules 5 and 6 allow Lake Formation to make authorization decisions based on user name or the AD group membership of the user.

  1. Create claim rule 5, called LF-UserName, which passes the user name and SAML assertion to Lake Formation:
    1. For Rule template, use Send LDAP Attributes as Claims.
    2. For Attribute store, choose Active Directory.
    3. For Mapping of LDAP attributes to outgoing claim types, add the attribute User-Principal-Name and outgoing claim type https://lakeformation.amazon.com/SAML/Attributes/Username.
  2. Create claim rule 6, called LF-Groups, which passes data and analytics-related AD groups that the user is a member of, along with the SAML assertion to Lake Formation:
    1. For Rule template, use Send Claims Using a Custom Rule.
    2. For Custom rule, enter the following code:
      c:[Type == "http://temp/variable", Value =~ "(?i)^data-"]
      => issue(Type = "https://lakeformation.amazon.com/SAML/Attributes/Groups", Value = c.Value);

The preceding rule snippet filters AD group names starting with data-. This is an arbitrary naming convention; you can adopt your preferred naming convention for AD groups that are related to data lake access.

Create Active Directory users and groups

In this section, we create two AD users and required AD groups to demonstrate varying levels of access to the data.

Create users

You create two AD users: FinanceUser and CustomerOpsUser. Each user corresponds to an individual who is a member of the Finance or Customer business units. The following table summarizes the details of each user.


FinanceUser CustomerOpsUser
First Name FinanceUser CustomerOpsUser
User logon name [email protected] [email protected]
Email [email protected] [email protected]

To create your users, complete the following steps:

  1. On the Server Manager Dashboard, on the Tools menu, choose Active Directory Users and Computers.
  2. In the navigation pane, choose Users.
  3. On the tool bar, choose the Create user icon.
  4. For First name, enter FinanceUser.
  5. For Full name, enter FinanceUser.
  6. For User logon name, enter [email protected].
  7. Choose Next.
  8. Enter a password and deselect User must change password at next logon.

We choose this option for simplicity, but in real-world scenarios, newly created users must change their password for security reasons.

  1. Choose Next.
  2. In Active Directory Users and Computers, choose the user name.
  3. For Email, enter [email protected].

Adding an email is mandatory because it’s used as the RoleSessionName value in the SAML assertion.

  1. Choose OK.
  2. Repeat these steps to create CustomerOpsUser.

Create AD groups to represent data access patterns

Create the following AD groups to represent three different access patterns and also the ability to assume an IAM role:

  • data-customer – Members have access to non-PII columns of the customer table
  • data-customer-pii – Members have access to all columns of the customer table, including PII columns
  • data-order – Members have access to the lineorder table
  • aws-adfs-data-access – Members assume the adfs-data-access IAM role when logging in to AWS

To create the groups, complete the following steps:

  1. On the Server Manager Dashboard, on the Tools menu, choose Active Directory Users and Computers.
  2. On the tool bar, choose the Create new group icon.
  3. For Group name¸ enter data-customer.
  4. For Group scope, select Global.
  5. For Group type¸ select Security.
  6. Choose OK.
  7. Repeat these steps to create the remaining groups.

Add users to appropriate groups

Now you add your newly created users to their appropriate groups, as detailed in the following table.

User Group Membership Description
CustomerOpsUser data-customer-pii
data-order
aws-adfs-data-access
Sees all customer information including PII and their orders
FinanceUser data-customer
data-order
aws-adfs-data-access
Sees only non-PII customer data and orders

Complete the following steps:

  1. On the Server Manager Dashboard, on the Tools menu, choose Active Directory Users and Computers.
  2. Choose the user FinanceUser.
  3. On the Member Of tab, choose Add.
  4. Add the appropriate groups.
  5. Repeat these steps for CustomerOpsUser.

Create a database and tables in the data lake

In this step, you copy data files to an S3 bucket in your AWS account by running the following AWS Command Line Interface (AWS CLI) commands. For more information on how to set up the AWS CLI, refer to Configuration Basics.

These commands copy the files that contain data for customer and lineorder tables. Replace <BUCKET NAME> with the name of an S3 bucket in your AWS account.

aws s3 sync s3://awssampledb/load/ s3://<BUCKET NAME>/customer/ \
--exclude "*" --include "customer-fw.tbl-00*" --exclude "*.bak"

aws s3api copy-object --copy-source awssampledb/load/lo/lineorder-single.tbl000.gz \
--key lineorder/lineorder-single.tbl000.gz --bucket <BUCKET NAME> \
--tagging-directive REPLACE

For this post, we use the default settings for storing data and logging access requests within Amazon S3. You can enhance the security of your sensitive data with the following methods:

  • Implement encryption at rest using AWS Key Management Service (AWS KMS) and customer managed encryption keys
  • Use AWS CloudTrail and audit logging
  • Restrict access to AWS resources based on the least privilege principle

Additionally, Lake Formation is integrated with CloudTrail, a service that provides a record of actions taken by a user, role, or AWS service in Lake Formation. CloudTrail captures all Lake Formation API calls as events and is enabled by default when you create a new AWS account. When activity occurs in Lake Formation, that activity is recorded as a CloudTrail event along with other AWS service events in event history. For audit and access monitoring purposes, all federated user logins are logged via CloudTrail under the AssumeRoleWithSAML event name. You can also view specific user activity based on their user name in CloudTrail.

To create a database and tables in the Data Catalog, open the query editor on the Athena console and enter the following DDL statements. Replace <BUCKET NAME> with the name of the S3 bucket in your account.

CREATE DATABASE salesdata;
CREATE EXTERNAL TABLE salesdata.customer
(
    c_custkey VARCHAR(10),
    c_name VARCHAR(25),
    c_address VARCHAR(25),
    c_city VARCHAR(10),
    c_nation VARCHAR(15),
    c_region VARCHAR(12),
    c_phone VARCHAR(15),
    c_mktsegment VARCHAR(10)
)
-- The data files contain fixed width columns hence using RegExSerDe
ROW FORMAT SERDE 'org.apache.hadoop.hive.serde2.RegexSerDe'
WITH SERDEPROPERTIES (
    "input.regex" = "(.{10})(.{25})(.{25})(.{10})(.{15})(.{12})(.{15})(.{10})"
)
LOCATION 's3://<BUCKET NAME>/customer/';

CREATE EXTERNAL TABLE salesdata.lineorder(
  `lo_orderkey` int, 
  `lo_linenumber` int, 
  `lo_custkey` int, 
  `lo_partkey` int, 
  `lo_suppkey` int, 
  `lo_orderdate` int, 
  `lo_orderpriority` varchar(15), 
  `lo_shippriority` varchar(1), 
  `lo_quantity` int, 
  `lo_extendedprice` int, 
  `lo_ordertotalprice` int, 
  `lo_discount` int, 
  `lo_revenue` int, 
  `lo_supplycost` int, 
  `lo_tax` int, 
  `lo_commitdate` int, 
  `lo_shipmode` varchar(10))
ROW FORMAT DELIMITED 
  FIELDS TERMINATED BY '|' 
LOCATION 's3://<BUCKET NAME>/lineorder/';

Verify that tables are created and you can see the data:

SELECT * FROM "salesdata"."customer" limit 10;
SELECT * FROM "salesdata"."lineorder" limit 10;

Set up the Lake Formation permission model

Lake Formation uses a combination of Lake Formation permissions and IAM permissions to achieve fine-grained access control. The recommended approach includes the following:

  • Coarse-grained IAM permissions – These apply to the IAM role that users assume when running queries in Athena. IAM permissions control access to Lake Formation, AWS Glue, and Athena APIs.
  • Fine-grained Lake Formation grants – These control access to Data Catalog resources, Amazon S3 locations, and the underlying data at those locations. With these grants, you can give access to specific tables or only columns that contain specific data values.

Configure IAM role permissions

Earlier in the walkthrough, you created the IAM role adfs-data-access and attached the AWS managed IAM policy AthenaFullAccess to it. This policy has all the permissions required for the purposes of this post.

For more information, see the Data Analyst Permissions section in Lake Formation Personas and IAM Permissions Reference.

Register an S3 bucket as a data lake location

The mechanism to govern access to an Amazon S3 location using Lake Formation is to register a data lake location. Complete the following steps:

  1. On the Lake Formation console, choose Data lake locations.
  2. Choose Register location.
  3. For Amazon S3 path, choose Browse and locate your bucket.
  4. For IAM role, choose AWSServiceRoleForLakeFormationDataAccess.

In this step, you specify an IAM service-linked role, which Lake Formation assumes when it grants temporary credentials to integrated AWS services that access the data in this location. This role and its permissions are managed by Lake Formation and can’t be changed by IAM principals.

  1. Choose Register location.

Configure data permissions

Now that you have registered the Amazon S3 path, you can give AD groups appropriate permissions to access tables and columns in the salesdata database. The following table summarizes the new permissions.

Database and Table AD Group Name Table Permissions Data Permissions
salesdata.customer data-customer Select c_city, c_custkey, c_mktsegment, c_nation, and c_region
salesdata.customer data-customer-pii Select All data access
salesdata.lineorder data-order Select All data access
  1. On the Lake Formation console, choose Tables in the navigation pane.
  2. Filter tables by the salesdata database.
  3. Select the customer table and on the Actions menu, choose View permissions.

You should see following existing permissions. These entries allow the current data lake administrator to access the table and all its columns.

  1. To add new permissions, select the table and on the Actions menu, choose Grant.
  2. Select SAML user and groups.
  3. For SAML and Amazon QuickSight users and groups, enter arn:aws:iam::<AWS ACCOUNT NUMBER>:saml-provider/adfs-saml-provider:group/data-customer.

To get this value, get the ARN of the SAML provider from the IAM console and append :group/data-customer to the end of it.

  1. Select Named data catalog resources.
  2. For Databases, choose the salesdata database.
  3. For Tables, choose the customer table.
  4. For Table permissions, select Select.
  5. For Data permissions, select Column-based access.
  6. For Select columns, add the columns c_city, c_custkey, c_mktsegment, c_nation, and c_region.
  7. Choose Grant.

You have now allowed members of the AD group data-customer to have access to columns of the customer table that don’t include PII.

  1. Repeat these steps for the customer table and data-customer-pii group with all data access.
  2. Repeat these steps for the lineorder table and data-order group with all data access.

Set up a SQL client with JDBC connection and verify permissions

In this post, we use SQL Workbench to access Athena through AD authentication and verify the Lake Formation permissions you created in the previous section.

Prepare the SQL client

To set up the SQL client, complete the following steps:

  1. Download and extract the Lake Formation-compatible Athena JDBC driver with AWS SDK (2.0.14 or later version) from Using Athena with the JDBC Driver.
  2. Go to the SQL Workbench/J website and download the latest stable package.
  3. Install SQL Workbench/J on your client computer.
  4. In SQL Workbench, on the File menu, choose Manage Drivers.
  5. Choose the New driver icon.
  6. For Name, enter Athena JDBC Driver.
  7. For Library, browse to and choose the Simba Athena JDBC .jar file that you just downloaded.
  8. Choose OK.

You’re now ready to create connections in SQL Workbench for your users.

Create connections in SQL Workbench

To create your connections, complete the following steps:

  1. On the File menu, choose Connect.
  2. Enter the name Athena-FinanceUser.
  3. For Driver, choose the Simba Athena JDBC driver.
  4. For URL, enter the following code (replace the placeholders with actual values from your setup and remove the line breaks to make a single line connection string):
jdbc:awsathena://AwsRegion=<AWS Region Name e.g. ap-southeast-2>;
S3OutputLocation=s3://<Athena Query Result Bucket Name>/jdbc;
plugin_name=com.simba.athena.iamsupport.plugin.AdfsCredentialsProvider;
idp_host=<adfs-server-name e.g. adfs.company.com>;
idp_port=443;
preferred_role=<ARN of the role created in step1 e.g. arn>;
user=financeuser@<Domain Name e.g. company.com>;
password=<password>;
SSL_Insecure=true;
LakeFormationEnabled=true;

For this post, we used a self-signed certificate with AD FS. This certificate is not trusted by the client, therefore authentication doesn’t succeed. This is why the SSL_Insecure attribute is set to true to allow authentication despite the self-signed certificate. In real-world setups, you would use valid trusted certificates and can remove the SSL_Insecure attribute.

  1. Create a new SQL workbench profile named Athena-CustomerOpsUser and repeat the earlier steps with CustomerOpsUser in the connection URL string.
  2. To test the connections, choose Test for each user, and confirm that the connection succeeds.

Verify access permissions

Now we can verify permissions for FinanceUser. In the SQL Workbench Statement window, run the following SQL SELECT statement:

SELECT * FROM "salesdata"."lineorder" limit 10;
SELECT * FROM "salesdata"."customer" limit 10;

Verify that only non-PII columns are returned from the customer table.

As you see in the preceding screenshots, FinanceUser only has access to non-PII columns of the customer table and full access to (all columns) of the lineorder table. This allows FinanceUser, for example, to run aggregate and summary queries based on market segment or location of customers without having access to their personal information.

Run a similar query for CustomerOpsUser. You should be able to see all columns, including columns containing PII, in the customer table.

Conclusion

This post demonstrated how to configure your data lake permissions using Lake Formation for AD users and groups. We configured AD FS 3.0 on your Active Directory and used it as an IdP to federate into AWS using SAML. This post also showed how you can integrate your Athena JDBC driver to AD FS and use your AD credentials directly to connect to Athena.

Integrating your Active Directory with the Athena JDBC driver gives you the flexibility to access Athena from business intelligence tools you’re already familiar with to analyze the data in your Amazon S3 data lake. This enables you to have a consistent central permission model that is managed through AD users and their group memberships.


About the Authors

Mostafa Safipour is a Solutions Architect at AWS based out of Sydney. Over the past decade he has helped many large organizations in the ANZ region build their data, digital, and enterprise workloads on AWS.

Praveen Kumar is a Specialist Solution Architect at AWS with expertise in designing, building, and implementing modern data and analytics platforms using cloud-native services. His areas of interests are serverless technology, streaming applications, and modern cloud data warehouses.

Amazon Redshift data sharing best practices and considerations

Post Syndicated from BP Yau original https://aws.amazon.com/blogs/big-data/amazon-redshift-data-sharing-best-practices-and-considerations/

Amazon Redshift is a fast, fully managed cloud data warehouse that makes it simple and cost-effective to analyze all your data using standard SQL and your existing business intelligence (BI) tools. Amazon Redshift data sharing allows for a secure and easy way to share live data for reading across Amazon Redshift clusters. It allows an Amazon Redshift producer cluster to share objects with one or more Amazon Redshift consumer clusters for read purposes without having to copy the data. With this approach, workloads isolated to different clusters can share and collaborate frequently on data to drive innovation and offer value-added analytic services to your internal and external stakeholders. You can share data at many levels, including databases, schemas, tables, views, columns, and user-defined SQL functions, to provide fine-grained access controls that can be tailored for different users and businesses that all need access to Amazon Redshift data. The feature itself is simple to use and integrate into existing BI tools.

In this post, we discuss Amazon Redshift data sharing, including some best practices and considerations.

How does Amazon Redshift data sharing work ?

  • To achieve best in class performance Amazon Redshift consumer clusters cache and incrementally update block level data (let us refer to this as block metadata) of objects that are queried, from the producer cluster (this works even when cluster is paused).
  • The time taken for caching block metadata depends on the rate of the data change on the producer since the respective object(s) were last queried on the consumer. (As of today the consumer clusters only update their metadata cache for an object only on demand i.e. when queried)
  • If there are frequent DDL operations, the consumer is forced to re-cache the full block metadata for an object during the next access to maintain consistency as to enable live sharing as structure changes on the producer invalidate all the existing metadata cache on the consumers.
  • Once the consumer has the block metadata in sync with the latest state of an object on the producer that is when the query would execute as any other regular query (query referring to local objects).

Now that we have the necessary background on data sharing and how it works, let’s look at a few best practices across streams that can help improve workloads while using data sharing.

Security

In this section, we share some best practices for security when using Amazon Redshift data sharing.

Use INCLUDE NEW cautiously

INCLUDE NEW is a very useful setting while adding a schema to a data share (ALTER DATASHARE). If set to TRUE, this automatically adds all the objects created in the future in the specified schema to the data share automatically. This might not be ideal in cases where you want to have fine-grained control on objects being shared. In these cases, leave the setting at its default of FALSE.

Use views to achieve fine-grained access control

To achieve fine-grained access control for data sharing, you can create late-binding views or materialized views on shared objects on the consumer, and then share the access to these views to users on consumer cluster, instead of giving full access on the original shared objects. This comes with its own set of considerations, which we explain later in this post.

Audit data share usage and changes

Amazon Redshift provides an efficient way to audit all the activity and changes with respect to a data share using system views. We can use the following views to check these details:

Performance

In this section, we discuss best practices related to performance.

Materialized views in data sharing environments

Materialized views (MVs) provide a powerful route to precompute complex aggregations for use cases where high throughput is needed, and you can directly share a materialized view object via data sharing as well.

For materialized views built on tables where there are frequent write operations, it’s ideal to create the materialized view object on the producer itself and share the view. This method gives us the opportunity to centralize the management of the view on the producer cluster itself.

For slowly changing data tables, you can share the table objects directly and build the materialized view on the shared objects directly on the consumer. This method gives us the flexibility of creating a customized view of data on each consumer according to your use case.

This can help optimize the block metadata download and caching times in the data sharing query lifecycle. This also helps in materialized view refreshes because, as of this writing, Redshift doesn’t support incremental refresh for MVs built on shared objects.

Factors to consider when using cross-Region data sharing

Data sharing is supported even if the producer and consumer are in different Regions. There are a few differences we need to consider while implementing a share across Regions:

  • Consumer data reads are charged at $5/TB for cross region data shares, Data sharing within the same Region is free. For more information, refer to Managing cost control for cross-Region data sharing.
  • Performance will also vary when compared to a uni-Regional data share because the block metadata exchange and data transfer process between the cross-Regional shared clusters will take more time due to network throughput.

Metadata access

There are many system views that help with fetching the list of shared objects a user has access to. Some of these include all the objects from the database that you’re currently connected to, including objects from all the other databases that you have access to on the cluster, including external objects. The views are as follows:

We suggest using very restrictive filtering while querying these views because a simple select * will result in an entire catalog read, which isn’t ideal. For example, take the following query:

select * from svv_all_tables;

This query will try to collect metadata for all the shared and local objects, making it very heavy in terms of metadata scans, especially for shared objects.

The following is a better query for achieving a similar result:

SELECT table_name,
column_name,
data_type FROM svv_all_tables WHERE table_name = < tablename > AND schema_name = < schemaname > AND database_name = < databasename > ORDER BY ordinal_position

This is a good practice to follow for all metadata views and tables; doing so allows seamless integration into several tools. You can also use the SVV_DATASHARE* system views to exclusively see shared object-related information.

Producer/consumer dependencies

In this section, we discuss the dependencies between the producer and consumer.

Impact of the consumer on the producer

Queries on the consumer cluster will have no impact in terms of performance or activity on the producer cluster. This is why we can achieve true workload isolation using data sharing.

Encrypted producers and consumers

Data sharing seamlessly integrates even if both the producer and the consumer are encrypted using different AWS Key Management Service (AWS KMS) keys. There are sophisticated, highly secure key exchange protocols to facilitate this so you don’t have to worry about encryption at rest and other compliance dependencies. The only thing to make sure is that both the producer and consumer are in a homogeneous encryption configuration.

Data visibility and consistency

A data sharing query on the consumer can’t impact the transaction semantics on the producer. All the queries involving shared objects on the consumer cluster follow read-committed transaction consistency while checking for visible data for that transaction.

Maintenance

If there is a scheduled manual VACUUM operation in use for maintenance activities on the producer cluster on shared objects, you should use VACUUM recluster whenever possible. This is especially important for large objects because it has optimizations in terms of the number of data blocks the utility interacts with, which results in less block metadata churn compared to a full vacuum. This benefits the data sharing workloads by reducing the block metadata sync times.

Add-ons

In this section, we discuss additional add-on features for data sharing in Amazon Redshift.

Real-time data analytics using Amazon Redshift streaming data

Amazon Redshift recently announced the preview for streaming ingestion using Amazon Kinesis Data Streams. This eliminates the need for staging the data and helps achieve low-latency data access. The data generated via streaming on the Amazon Redshift cluster is exposed using a materialized view. You can share this as any other materialized view via a data share and use it to set up low-latency shared data access across clusters in minutes.

Amazon Redshift concurrency scaling to improve throughput

Amazon Redshift data sharing queries can utilize concurrency scaling to improve the overall throughput of the cluster. You can enable concurrency scaling on the consumer cluster for queues where you expect a heavy workload to improve the overall throughput when the cluster is experiencing heavy load.

For more information about concurrency scaling, refer to Data sharing considerations in Amazon Redshift.

Amazon Redshift Serverless

Amazon Redshift Serverless clusters are ready for data sharing out of the box. A serverless cluster can also act as a producer or a consumer for a provisioned cluster. The following are the supported permutations with Redshift Serverless:

  • Serverless (producer) and provisioned (consumer)
  • Serverless (producer) and serverless (consumer)
  • Serverless (consumer) and provisioned (producer)

Conclusion

Amazon Redshift data sharing gives you the ability to fan out and scale complex workloads without worrying about workload isolation. However, like any system, not having the right optimization techniques in place could pose complex challenges in the long term as the systems grow in scale. Incorporating the best practices listed in this post presents a way to mitigate potential performance bottlenecks proactively in various areas.

Try data sharing today to unlock the full potential of Amazon Redshift, and please don’t hesitate to reach out to us in case of further questions or clarifications.


About the authors

BP Yau is a Sr Product Manager at AWS. He is passionate about helping customers architect big data solutions to process data at scale. Before AWS, he helped Amazon.com Supply Chain Optimization Technologies migrate its Oracle data warehouse to Amazon Redshift and build its next generation big data analytics platform using AWS technologies.

Sai Teja Boddapati is a Database Engineer based out of Seattle. He works on solving complex database problems to contribute to building the most user friendly data warehouse available. In his spare time, he loves travelling, playing games and watching movies & documentaries.

From centralized architecture to decentralized architecture: How data sharing fine-tunes Amazon Redshift workloads

Post Syndicated from Jingbin Ma original https://aws.amazon.com/blogs/big-data/from-centralized-architecture-to-decentralized-architecture-how-data-sharing-fine-tunes-amazon-redshift-workloads/

Amazon Redshift is a fully managed, petabyte-scale, massively parallel data warehouse that offers simple operations and high performance. It makes it fast, simple, and cost-effective to analyze all your data using standard SQL and your existing business intelligence (BI) tools. Today, Amazon Redshift has become the most widely used cloud data warehouse.

With the significant growth of data for big data analytics over the years, some customers have asked how they should optimize Amazon Redshift workloads. In this post, we explore how to optimize workloads on Amazon Redshift clusters using Amazon Redshift RA3 nodes, data sharing, and pausing and resuming clusters. For more cost-optimization methods, refer to Getting the most out of your analytics stack with Amazon Redshift.

Key features of Amazon Redshift

First, let’s review some key features:

  • RA3 nodes – Amazon Redshift RA3 nodes are backed by a new managed storage model that gives you the power to separately optimize your compute power and your storage. They bring a few very important features, one of which is data sharing. RA3 nodes also support the ability to pause and resume, which allows you to easily suspend on-demand billing while the cluster is not being used.
  • Data sharing – Amazon Redshift data sharing offers you to extend the ease of use, performance, and cost benefits of Amazon Redshift in a single cluster to multi-cluster deployments while being able to share data. Data sharing enables instant, granular, and fast data access across Redshift clusters without the need to copy or move it. You can securely share live data with Amazon Redshift clusters in the same or different AWS accounts, and across regions. You can share data at many levels, including schemas, tables, views, and user-defined functions. You can also share the most up-to-date and consistent information as it’s updated in Amazon Redshift Serverless. It also provides fine-grained access controls that you can tailor for different users and businesses that all need access to the data. However, data sharing in Amazon Redshift has a few limitations.

Solution overview

In this use case, our customer is heavily using Amazon Redshift as their data warehouse for their analytics workloads, and they have been enjoying the possibility and convenience that Amazon Redshift brought to their business. They mainly use Amazon Redshift to store and process user behavioral data for BI purposes. The data has increased by hundreds of gigabytes daily in recent months, and employees from departments continuously run queries against the Amazon Redshift cluster on their BI platform during business hours.

The company runs four major analytics workloads on a single Amazon Redshift cluster, because some data is used by all workloads:

  • Queries from the BI platform – Various queries run mainly during business hours.
  • Hourly ETL – This extract, transform, and load (ETL) job runs in the first few minutes of each hour. It generally takes about 40 minutes.
  • Daily ETL – This job runs twice a day during business hours, because the operation team needs to get daily reports before the end of the day. Each job normally takes between 1.5–3 hours. It’s the second-most resource-heavy workload.
  • Weekly ETL – This job runs in the early morning every Sunday. It’s the most resource-heavy workload. The job normally takes 3–4 hours.

The analytics team has migrated to the RA3 family and increased the number of nodes of the Amazon Redshift cluster to 12 over the years to keep the average runtime of queries from their BI tool within an acceptable time due to the data size, especially when other workloads are running.

However, they have noticed that performance is reduced while running ETL tasks, and the duration of ETL tasks is long. Therefore, the analytics team wants to explore solutions to optimize their Amazon Redshift cluster.

Because CPU utilization spikes appear while the ETL tasks are running, the AWS team’s first thought was to separate workloads and relevant data into multiple Amazon Redshift clusters with different cluster sizes. By reducing the total number of nodes, we hoped to reduce the cost of Amazon Redshift.

After a series of conversations, the AWS team found that one of the reasons that the customer keeps all workloads on the 12-node Amazon Redshift cluster is to manage the performance of queries from their BI platform, especially while running ETL workloads, which have a big impact on the performance of all workloads on the Amazon Redshift cluster. The obstacle is that many tables in the data warehouse are required to be read and written by multiple workloads, and only the producer of a data share can update the shared data.

The challenge of dividing the Amazon Redshift cluster into multiple clusters is data consistency. Some tables need to be read by ETL workloads and written by BI workloads, and some tables are the opposite. Therefore, if we duplicate data into two Amazon Redshift clusters or only create a data share from the BI cluster to the reporting cluster, the customer will have to develop a data synchronization process to keep the data consistent between all Amazon Redshift clusters, and this process could be very complicated and unmaintainable.

After more analysis to gain an in-depth understanding of the customer’s workloads, the AWS team found that we could put tables into four groups, and proposed a multi-cluster, two-way data sharing solution. The purpose of the solution is to divide the workloads into separate Amazon Redshift clusters so that we can use Amazon Redshift to pause and resume clusters for periodic workloads to reduce the Amazon Redshift running costs, because clusters can still access a single copy of data that is required for workloads. The solution should meet the data consistency requirements without building a complicated data synchronization process.

The following diagram illustrates the old architecture (left) compared to the new multi-cluster solution (right).

Improve the old architecture (left) to the new multi-cluster solution (right)

Dividing workloads and data

Due to the characteristics of the four major workloads, we categorized workloads into two categories: long-running workloads and periodic-running workloads.

The long-running workloads are for the BI platform and hourly ETL jobs. Because the hourly ETL workload requires about 40 minutes to run, the gain is small even if we migrate it to an isolated Amazon Redshift cluster and pause and resume it every hour. Therefore, we leave it with the BI platform.

The periodic-running workloads are the daily and weekly ETL jobs. The daily job generally takes about 1 hour and 40 minutes to 3 hours, and the weekly job generally takes 3–4 hours.

Data sharing plan

The next step is identifying all data (tables) access patterns of each category. We identified four types of tables:

  • Type 1 – Tables are only read and written by long-running workloads
  • Type 2 – Tables are read and written by long-running workloads, and are also read by periodic-running workloads
  • Type 3 – Tables are read and written by periodic-running workloads, and are also read by long-running workloads
  • Type 4 – Tables are only read and written by periodic-running workloads

Fortunately, there is no table that is required to be written by all workloads. Therefore, we can separate the Amazon Redshift cluster into two Amazon Redshift clusters: one for the long-running workloads, and the other for periodic-running workloads with 20 RA3 nodes.

We created a two-way data share between the long-running cluster and the periodic-running cluster. For type 2 tables, we created a data share on the long-running cluster as the producer and the periodic-running cluster as the consumer. For type 3 tables, we created a data share on the periodic-running cluster as the producer and the long-running cluster as the consumer.

The following diagram illustrates this data sharing configuration.

The long-running cluster (producer) shares type 2 tables to the periodic-running cluster (consumer). The periodic-running cluster (producer’) shares type 3 tables to the long-running cluster (consumer’)

Build two-way data share across Amazon Redshift clusters

In this section, we walk through the steps to build a two-way data share across Amazon Redshift clusters. First, let’s take a snapshot of the original Amazon Redshift cluster, which became the long-running cluster later.

Take a snapshot of the long-running-cluster from the Amazon Redshift console

Now, let’s create a new Amazon Redshift cluster with 20 RA3 nodes for periodic-running workloads. Then we migrate the type 3 and type 4 tables to the periodic-running cluster. Make sure you choose the ra3 node type. (Amazon Redshift Serverless supports data sharing too, and it becomes generally available in July 2022, so it is also an option now.)

Create the periodic-running-cluster. Make sure you select the ra3 node type.

Create the long-to-periodic data share

The next step is to create the long-to-periodic data share. Complete the following steps:

  1. On the periodic-running cluster, get the namespace by running the following query:
SELECT current_namespace;

Make sure record the namespace.

  1. On the long-running cluster, we run queries similar to the following:
CREATE DATASHARE ltop_share SET PUBLICACCESSIBLE TRUE;
ALTER DATASHARE ltop_share ADD SCHEMA public_long;
ALTER DATASHARE ltop_share ADD ALL TABLES IN SCHEMA public_long;
GRANT USAGE ON DATASHARE ltop_share TO NAMESPACE '[periodic-running-cluster-namespace]';
  1. We can validate the long-to-periodic data share using the following command:
SHOW datashares;
  1. After we validate the data share, we get the long-running cluster namespace with the following query:
SELECT current-namespace;

Make sure record the namespace.

  1. On the periodic-running cluster, run the following command to load the data from the long-to-periodic data share with the long-running cluster namespace:
CREATE DATABASE ltop FROM DATASHARE ltop_share OF NAMESPACE '[long-running-cluster-namespace]';
  1. Confirm that we have read access to tables in the long-to-periodic data share.

Create the periodic-to-long data share

The next step is to create the periodic-to-long data share. We use the namespaces of the long-running cluster and the periodic-running cluster that we collected in the previous step.

  1. On the periodic-running cluster, run queries similar to the following to create the periodic-to-long data share:
CREATE DATASHARE ptol_share SET PUBLICACCESSIBLE TRUE;
ALTER DATASHARE ptol_share ADD SCHEMA public_periodic;
ALTER DATASHARE ptol_share ADD ALL TABLES IN SCHEMA public_periodic;
GRANT USAGE ON DATASHARE ptol_share TO NAMESPACE '[long-running-cluster-namespace]';
  1. Validate the data share using the following command:
SHOW datashares;
  1. On the long-running cluster, run the following command to load the data from the periodic-to-long data using the periodic-running cluster namespace:
CREATE DATABASE ptol FROM DATASHARE ptol_share OF NAMESPACE '[periodic-running-cluster-namespace]';
  1. Check that we have read access to the tables in the periodic-to-long data share.

At this stage, we have separated workloads into two Amazon Redshift clusters and built a two-way data share across two Amazon Redshift clusters.

The next step is updating the code of different workloads to use the correct endpoints of two Amazon Redshift clusters and perform consolidated tests.

Pause and resume the periodic-running Amazon Redshift cluster

Let’s update the crontab scripts, which run periodic-running workloads. We make two updates.

  1. When the scripts start, call the Amazon Redshift check and resume cluster APIs to resume the periodic-running Amazon Redshift cluster when the cluster is paused:
    aws redshift resume-cluster --cluster-identifier [periodic-running-cluster-id]

  2. After the workloads are finished, call the Amazon Redshift pause cluster API with the cluster ID to pause the cluster:
    aws redshift pause-cluster --cluster-identifier [periodic-running-cluster-id]

Results

After we migrated the workloads to the new architecture, the company’s analytics team ran some tests to verify the results.

According to tests, the performance of all workloads improved:

  • The BI workload is about 100% faster during the ETL workload running periods
  • The hourly ETL workload is about 50% faster
  • The daily workload duration reduced to approximately 40 minutes, from a maximum of 3 hours
  • The weekly workload duration reduced to approximately 1.5 hours, from a maximum of 4 hours

All functionalities work properly, and cost of the new architecture only increased approximately 13%, while over 10% of new data had been added during the testing period.

Learnings and limitations

After we separated the workloads into different Amazon Redshift clusters, we discovered a few things:

  • The performance of the BI workloads was 100% faster because there was no resource competition with daily and weekly ETL workloads anymore
  • The duration of ETL workloads on the periodic-running cluster was reduced significantly because there were more nodes and no resource competition from the BI and hourly ETL workloads
  • Even when over 10% new data was added, the overall cost of the Amazon Redshift clusters only increased by 13%, due to using the cluster pause and resume function of the Amazon Redshift RA3 family

As a result, we saw a 70% price-performance improvement of the Amazon Redshift cluster.

However, there are some limitations of the solution:

  • To use the Amazon Redshift pause and resume function, the code for calling the Amazon Redshift pause and resume APIs must be added to all scheduled scripts that run ETL workloads on the periodic-running cluster
  • Amazon Redshift clusters require several minutes to finish pausing and resuming, although you’re not charged during these processes
  • The size of Amazon Redshift clusters can’t automatically scale in and out depending on workloads

Next steps

After improving performance significantly, we can explore the possibility of reducing the number of nodes of the long-running cluster to reduce Amazon Redshift costs.

Another possible optimization is using Amazon Redshift Spectrum to reduce the cost of Amazon Redshift on cluster storage. With Redshift Spectrum, multiple Amazon Redshift clusters can concurrently query and retrieve the same structured and semistructured dataset in Amazon Simple Storage Service (Amazon S3) without the need to make copies of the data for each cluster or having to load the data into Amazon Redshift tables.

Amazon Redshift Serverless was announced for preview in AWS re:Invent 2021 and became generally available in July 2022. Redshift Serverless automatically provisions and intelligently scales your data warehouse capacity to deliver best-in-class performance for all your analytics. You only pay for the compute used for the duration of the workloads on a per-second basis. You can benefit from this simplicity without making any changes to your existing analytics and BI applications. You can also share data for read purposes across different Amazon Redshift Serverless instances within or across AWS accounts.

Therefore, we can explore the possibility of removing the need to script for pausing and resuming the periodic-running cluster by using Redshift Serverless to make the management easier. We can also explore the possibility of improving the granularity of workloads.

Conclusion

In this post, we discussed how to optimize workloads on Amazon Redshift clusters using RA3 nodes, data sharing, and pausing and resuming clusters. We also explored a use case implementing a multi-cluster two-way data share solution to improve workload performance with a minimum code change. If you have any questions or feedback, please leave them in the comments section.


About the authors

Jingbin Ma

Jingbin Ma is a Sr. Solutions Architect at Amazon Web Services. He helps customers build well-architected applications using AWS services. He has many years of experience working in the internet industry, and his last role was CTO of a New Zealand IT company before joining AWS. He is passionate about serverless and infrastructure as code.

Chao PanChao Pan is a Data Analytics Solutions Architect at Amazon Web Services. He’s responsible for the consultation and design of customers’ big data solution architectures. He has extensive experience in open-source big data. Outside of work, he enjoys hiking.

Build a resilient Amazon Redshift architecture with automatic recovery enabled

Post Syndicated from Kevin Burandt original https://aws.amazon.com/blogs/big-data/build-a-resilient-amazon-redshift-architecture-with-automatic-recovery-enabled/

Amazon Redshift provides resiliency in the event of a single point of failure in a cluster, including automatically detecting and recovering from drive and node failures. The Amazon Redshift relocation feature adds an additional level of availability, and this post is focused on explaining this automatic recovery feature.

When the cluster relocation feature is enabled on an RA3 cluster, Amazon Redshift automatically relocates the cluster in situations where issues at the Availability Zone level prevent optimal cluster operation, or in case of large-scale failures impacting cluster resources in a data center within an Availability Zone. Relocation is done by creating the cluster’s compute resources in another Availability Zone. After a cluster is relocated to another Availability Zone, there is no loss of data and no application changes are required because the cluster endpoint doesn’t change. This provides a resilient architecture to maintain application availability. When a failover is initiated, the actual time to recover is dependent on the size of a cluster, with the average time under 15 minutes. Note that the ability to relocate is subject to capacity availability. Cluster relocation is offered at no charge.

The cluster relocation feature also helps you build a demonstratable Availability Zone recovery plan as well as address capacity shortages while expanding resources in a given Availability Zone. You can manually move the cluster to another Availability Zone to test your disaster recovery plan. In cases where a cluster can’t be resized or resumed due to capacity shortages in an Availability Zone, you can relocate the cluster to an Availability Zone with more capacity. If the relocation isn’t successful, the existing cluster is left unchanged. The existing cluster isn’t removed until the new cluster is successfully created as part of this process.

Solution overview

Amazon Redshift customers with operationally sensitive applications require application resiliency in the event of an outage in an Availability Zone. The Amazon Redshift relocation feature provides application resiliency through an easy-to-use architecture with zero loss of data and no application modifications.

The following diagram illustrates the architecture before failover

After failover, we have the following architecture

In this post, we demonstrate how to enable cluster relocation using either the AWS Management Console or AWS Command Line Interface (AWS CLI). We walk through examples of automatic and manual relocation, also show how to create a custom relocation solution using additional AWS services.

Prerequisites

Make sure you have the following prerequisites:

  • An AWS account.
  • Amazon Redshift clusters created in a VPC with a minimum of two subnets each in different Availability Zone.
  • An Amazon Redshift cluster with multiple Availability Zones configured in the cluster subnet group. You can set one up using the following AWS CloudFormation template.
  • The relocation feature is possible only with the RA3 Amazon Redshift node type.
  • In the Network and security settings section, choose Disable for the Publicly accessible option.

Enable cluster relocation

The first step is to enable cluster relocation, either via the console or AWS CLI. For more information, see Managing cluster relocation in Amazon Redshift. When using cluster relocation, be aware of the limitations.

Enable cluster relocation using the console

To enable cluster relocation on the console, complete the following steps:

  1. On the Amazon Redshift console, choose Clusters.
  2. Edit your cluster.
  3. Under Backup, for Cluster relocation, select Enable.

Enable cluster relocation using the AWS CLI

The relocation feature requires port 5439. If your current cluster is using a different port, you must modify it to use 5439 before modifying it to enable relocation. The following command modifies the port in case your cluster doesn’t use 5439:

aws redshift modify-cluster --cluster-identifier mycluster --port 5439

The following command enables the availability-zone-relocation parameter on the Amazon Redshift cluster:

aws redshift modify-cluster --cluster-identifier mycluster --availability-zone-relocation

The following command disables the availability-zone-relocation parameter on the Amazon Redshift cluster:

aws redshift modify-cluster --cluster-identifier mycluster --no-availability-zone-relocation

Automatic Availability Zone relocation

When using relocation in Amazon Redshift, you enable Amazon Redshift to move a cluster to another Availability Zone without any loss of data or changes to your applications. With relocation, you can resume operations when there is an interruption of service on your cluster with minimal impact. The new cluster will have the same endpoint so that applications can continue operations without modification.

This feature doesn’t require any action from the user besides the one-time configuration to enable the relocation feature. When the recovery feature is activated, the destination Availability Zone used is defined in the cluster subnet group.

Manual Availability Zone relocation

You can trigger the relocation manually, relocating a cluster to another Availability Zone. Complete the following steps:

  1. On the Amazon Redshift console, choose Clusters in the navigation pane.The clusters for your account in the current Region are listed. A subset of properties of each cluster is displayed in columns in the list.
  2. Choose the cluster you want to relocate.
  3. On the Actions menu, choose Relocate.If the Relocate option is greyed out, that indicates the cluster isn’t configured to use the Availability Zone relocation feature, or the cluster doesn’t meet the requirements for the relocation feature. For more details, refer to Limitations.
  4. In the Relocate cluster section, for Subnet group, choose an Availability Zone.The Availability Zone list is derived from the cluster subnet group. If you don’t choose an Availability Zone, Amazon Redshift chooses one for you.
  5. Choose Relocate.

After relocation is initiated, Amazon Redshift starts the relocation and displays the cluster status as Relocating. When the relocation complete, the cluster status changes to Available.

The following screenshot confirms the cluster has relocated to the correct Availability Zone.

Custom Availability Zone relocation solution

In this section, we simulate an automatic cluster failover to another Availability Zone with a reboot. Our event-based relocation solution involves setting up an alarm with an Amazon Simple Notification Service (Amazon SNS) topic, and creating an AWS Lambda function to trigger the relocation.

Create an alarm

To set up the alarm, complete the following steps:

  1. On the Amazon Redshift console, choose Clusters in the navigation pane.
  2. Choose your cluster.
  3. On the Cluster performance tab, expand the Alarms section and choose Create alarm.
  4. Configure the alarm for the HealthStatus metric and provide an alarm name and description.
  5. In the Alarm actions section, for Notifications¸ select Enabled.
  6. For Notify SNS topic, choose an existing SNS topic or create a new one.This topic receives a notification if the leader node isn’t healthy or is unavailable.
  7. Choose Create alarm.

Create a Lambda function

To set up a Lambda function to trigger Availability Zone relocation in case of cluster failure, complete the following steps:

  1. On the Lambda console, in the navigation pane, choose Functions.
  2. Open the Lambda function created by the CloudFormation stack.
  3. Edit the function code and modify the following snippet, updating the cluster ID and the destination Availability Zone:
    run_command('/opt/aws redshift modify-cluster --cluster-identifier redshift-cluster-az-relocation --availability-zone us-east-1d')

  4. Choose Add trigger.
  5. Under Trigger configuration, choose SNS.
  6. For SNS topic, choose the topic you specified for your alarm.
  7. Choose Add.

Test the Availability Zone relocation feature

Now we can test our custom Availability Zone relocation solution.

  1. On the Amazon Redshift console, choose Clusters in the navigation pane.
  2. Choose the cluster that you want to relocate.
  3. On the cluster detail page, note the cluster identifier.
  4. Use AWS CloudShell to run the following AWS CLI command to find the current Availability Zone of the Amazon Redshift cluster:
    aws redshift describe-clusters --cluster-identifier redshift-cluster-az-relocation

  5. From the JSON output, look for the attribute AvailabilityZone.
  6. On the cluster detail page, on the Actions menu, choose Reboot.
  7. Choose Reboot cluster.
    This triggers the alarm, and changes the alarm state to ALARM.
    Amazon SNS receives a message and triggers the Lambda function to perform the cluster relocation to the Availability Zone configured in the code. The cluster relocation takes several minutes.
  8. In CloudShell, run the following AWS CLI command to find the modified Availability Zone of the cluster:
    aws redshift describe-clusters --cluster-identifier redshift-cluster-az-relocation

Benefits

The cluster relocation feature provides the following benefits:

  • You can recover your cluster to another Availability Zone where failover can be done in minutes to ensure business continuity and high availability (HA). In addition, Availability Zones are physically separated resources that allow you to create a configuration for HA.
  • Amazon Redshift cluster recovery is a one-step process that may also be automated, as opposed to the manual process required to restore a cluster from a snapshot.
  • Because Amazon Redshift managed storage already includes the ability to replicate to two other Availability Zones using Amazon Simple Storage Service (Amazon S3), the cost of the additional copies is covered. There are no additional charges to use this feature.
  • The cluster relocation capability allows you to support business-critical use cases on your data warehouse requiring HA capabilities. This reduces the chance of an outage impacting your business operations.
  • You can benefit from automatic recovery to a failover Availability Zone when there are issues in optimal performance.
  • Relocation is provided free of charge and is subject to capacity availability.

Conclusion

In this post, we walked you through how the automated Availability Zone recovery feature in Amazon Redshift helps you build a resilient modern data architecture. The post also described how to perform a manual relocation through the AWS management console. Lastly, we discussed how to implement an event-based relocation using Amazon SNS and Lambda. These various techniques can help you plan your failover strategies based on your business needs.


About the authors

Kevin Burandt is a Senior Manager, Solutions Architecture at AWS. He is passionate about building and leading technical teams that  help customers and partners use technology to achieve business outcomes and deliver value to their customers. Outside of work, he enjoys home renovation projects and working on classic cars.

Indira Balakrishnan is a Principal Solutions Architect in the AWS Analytics Specialist SA Team. She is passionate about helping customers build cloud-based analytics solutions to solve their business problems using data-driven decisions. Outside of work, she volunteers at her kids’ activities and spends time with her family.

Ramkumar Nottath is a Sr. Solutions Architect at AWS focusing on Analytics services. He enjoys working with various customers to help them build scalable, reliable big data and analytics solutions. His interests extend to various technologies such as analytics, data warehousing, streaming, and machine learning. He loves spending time with his family and friends.

Tahir Aziz is an Analytics Solution Architect at AWS. He has worked with building data warehouses and big data solutions for over 13 years. He loves to help customers design end-to-end analytics solutions on AWS. Outside of work, he enjoys traveling and cooking.

Manage data transformations with dbt in Amazon Redshift

Post Syndicated from Randy Chng original https://aws.amazon.com/blogs/big-data/manage-data-transformations-with-dbt-in-amazon-redshift/

Amazon Redshift is a fully managed, petabyte-scale data warehouse service in the cloud. You can start with just a few hundred gigabytes of data and scale to a petabyte or more. Amazon Redshift enables you to use your data to acquire new insights for your business and customers while keeping costs low.

Together with price-performance, customers want to manage data transformations (SQL Select statements written by data engineers, data analysts, and data scientists) in Amazon Redshift with features including modular programming and data lineage documentation.

dbt (data build tool) is a framework that supports these features and more to manage data transformations in Amazon Redshift. There are two interfaces for dbt:

  • dbt CLI – Available as an open-source project
  • dbt Cloud – A hosted service with added features including an IDE, job scheduling, and more

In this post, we demonstrate some features in dbt that help you manage data transformations in Amazon Redshift. We also provide the dbt CLI and Amazon Redshift workshop to get started using these features.

Manage common logic

dbt enables you to write SQL in a modular fashion. This improves maintainability and productivity because common logic can be consolidated (maintain a single instance of logic) and referenced (build on existing logic instead of starting from scratch).

The following figure is an example showing how dbt consolidates common logic. In this example, two models rely on the same subquery. Instead of replicating the subquery, dbt allows you to create a model for the subquery and reference it later.

Manage common subquery in dbt

Figure 1: Manage common subquery in dbt

The concept of referencing isn’t limited to logic related to subqueries. You can also use referencing for logic related to fields.

The following is an example showing how dbt consolidates common logic related to fields. In this example, a model applies the same case statement on two fields. Instead of replicating the case statement for each field, dbt allows you to create a macro containing the case statement and reference it later.

Manage common case statement in dbt

Figure 2: Manage common case statement in dbt

How is a model in dbt subsequently created in Amazon Redshift? dbt provides you with the command dbt run, which materializes models as views or tables in your targeted Amazon Redshift cluster. You can try this out in the dbt CLI and Amazon Redshift workshop.

Manage common data mappings

Although you can use macros to manage data mappings (for example, mapping “1” to “One” and “2” to “Two”), an alternative is to maintain data mappings in files and manage the files in dbt.

The following is an example of how dbt manages common data mappings. In this example, a model applies one-to-one data mappings on a field. Instead of creating a macro for the one-to-one data mappings, dbt allows you to create a seed for the one-to-one data mappings in the form of a CSV file and then reference it later.

Manage common data mapping in dbt

Figure 3: Manage common data mapping in dbt

You can create or update a seed with a two-step process. After you create or update a CSV seed file, run the command dbt seed to create the CSV seed as a table in your targeted Amazon Redshift cluster before referencing it.

Manage data lineage documentation

After you have created models and seeds in dbt, and used dbt’s referencing capability, dbt provides you with a method to generate documentation on your data transformations.

You can run the command dbt docs generate followed by dbt docs serve to launch a locally hosted website containing documentation on your dbt project. When you choose a model on the locally hosted website, information about the model is displayed, including columns in the final view or table, dependencies to create the model, and the SQL that is compiled to create the view or table. The following screenshot shows an example of this documentation.

Documentation generated by dbt

Figure 4: Documentation generated by dbt

You can also visualize dependencies for improved navigation of documentations during impact analysis. In the following example graph, we can see that model rpt_tech_all_users is built referencing the model base_public_users, which in turn references the table users in the public schema.

Data lineage visualization generated by dbt

Figure 5: Data lineage visualization generated by dbt

Conclusion

This post covered how you can use dbt to manage data transformations in Amazon Redshift. As you explore dbt, you will come across other features like hooks, which you can use to manage administrative tasks, for example, continuous granting of privileges.

For a hands-on experience with dbt CLI and Amazon Redshift, we have a workshop with step-by-step instructions to help you create your first dbt project and explore the features mentioned in this post—models, macros, seeds, and hooks. Visit dbt CLI and Amazon Redshift to get started.

If you have any questions or suggestions, leave your feedback in the comments section. If you need any further assistance to optimize your Amazon Redshift implementation, contact your AWS account team or a trusted AWS partner.


About the authors

Randy Chng is an Analytics Acceleration Lab Solutions Architect at Amazon Web Services. He works with customers to accelerate their Amazon Redshift journey by delivering proof of concepts on key business problems.

Sean Beath is an Analytics Acceleration Lab Solutions Architect at Amazon Web Services. He delivers proof of concepts with customers on Amazon Redshift, helping customers drive analytics value on AWS.

Develop an Amazon Redshift ETL serverless framework using RSQL, AWS Batch, and AWS Step Functions

Post Syndicated from Lukasz Budnik original https://aws.amazon.com/blogs/big-data/develop-an-amazon-redshift-etl-serverless-framework-using-rsql-aws-batch-and-aws-step-functions/

Amazon Redshift RSQL is a command-line client for interacting with Amazon Redshift clusters and databases. You can connect to an Amazon Redshift cluster, describe database objects, query data, and view query results in various output formats. You can use enhanced control flow commands to replace existing extract, transform, load (ETL) and automation scripts.

This post explains how you can create a fully serverless and cost-effective Amazon Redshift ETL orchestration framework. To achieve this, you can use Amazon Redshift RSQL and AWS services such as AWS Batch and AWS Step Functions.

Overview of solution

When you’re migrating from existing data warehouses to Amazon Redshift, your existing ETL processes are implemented as proprietary scripts. These scripts contain SQL statements and complex business logic such as if-then-else control flow logic, error reporting, and error handling. You can convert all these features to Amazon Redshift RSQL, which you can use to replace existing ETL and other automation scripts. To learn more about Amazon Redshift RSQL features, examples, and use cases, see Accelerate your data warehouse migration to Amazon Redshift – Part 4.

AWS Schema Conversion Tool (AWS SCT) can convert proprietary scripts to Amazon Redshift RSQL. AWS SCT can automatically convert Teradata BTEQ scripts to Amazon Redshift RSQL. To learn more how to use AWS SCT, see Converting Teradata BTEQ scripts to Amazon Redshift RSQL with AWS SCT.

The goal of the solution presented in this post is to run complex ETL jobs implemented in Amazon Redshift RSQL scripts in the AWS Cloud without having to manage any infrastructure. In addition to meeting functional requirements, this solution also provides full auditing and traceability of all ETL processes that you run.

The following diagram shows the final architecture.

The deployment is fully automated using AWS Cloud Development Kit (AWS CDK) and comprises of the following stacks:

  • EcrRepositoryStack – Creates a private Amazon Elastic Container Registry (Amazon ECR) repository that hosts our Docker image with Amazon Redshift RSQL
  • RsqlDockerImageStack – Builds our Docker image asset and uploads it to the ECR repository
  • VpcStack – Creates a VPC with isolated subnets, creates an Amazon Simple Storage Service (Amazon S3) VPC endpoint gateway, as well as Amazon ECR, Amazon Redshift, and Amazon CloudWatch VPC endpoint interfaces
  • RedshiftStack – Creates an Amazon Redshift cluster, enables encryption, enforces encryption in-transit, enables auditing, and deploys the Amazon Redshift cluster in isolated subnets
  • BatchStack – Creates a compute environment (using AWS Fargate), job queue, and job definition (using our Docker image with RSQL)
  • S3Stack – Creates data, scripts, and logging buckets; enables encryption at-rest; enforces secure transfer; enables object versioning; and disables public access
  • SnsStack – Creates an Amazon Simple Notification Service (Amazon SNS) topic and email subscription (email is passed as a parameter)
  • StepFunctionsStack – Creates a state machine to orchestrate serverless RSQL ETL jobs
  • SampleDataDeploymentStack – Deploys sample RSQL ETL scripts and sample TPC benchmark datasets

Prerequisites

You should have the following prerequisites:

Deploy AWS CDK stacks

To deploy the serverless RSQL ETL framework solution, use the following code. Replace 123456789012 with your AWS account number, eu-west-1 with the AWS Region to which you want deploy the solution, and [email protected] with your email address to which ETL success and failure notifications are sent.

git clone https://github.com/aws-samples/amazon-redshift-serverless-rsql-etl-framework
cd amazon-redshift-serverless-rsql-etl-framework
npm install
./cdk.sh 123456789012 eu-west-1 bootstrap
./cdk.sh 123456789012 eu-west-1 deploy --all --parameters SnsStack:EmailAddressSubscription=[email protected]

The whole process takes a few minutes. While AWS CDK creates all the stacks, you can continue reading this post.

Create the RSQL container image

AWS CDK creates an RSQL Docker image. This Docker image is the basic building block of our solution. All ETL processes run inside it. AWS CDK creates the Docker image locally using Docker Engine and then uploads it to the Amazon ECR repository.

The Docker image is based on an Amazon Linux 2 Docker image. It has the following tools installed: the AWS Command Line Interface (AWS CLI), unixODBC, Amazon Redshift ODBC driver, and Amazon Redshift RSQL. It also contains .odbc.ini file, which defines the etl profile, which is used to connect to the Amazon Redshift cluster. See the following code:

FROM amazonlinux:2

ENV AMAZON_REDSHIFT_ODBC_VERSION=1.4.52.1000
ENV AMAZON_REDSHIFT_RSQL_VERSION=1.0.4

RUN yum install -y openssl gettext unixODBC awscli && \
yum clean all

RUN rpm -i \
https://s3.amazonaws.com/redshift-downloads/drivers/odbc/${AMAZON_REDSHIFT_ODBC_VERSION}/AmazonRedshiftODBC-64-bit-${AMAZON_REDSHIFT_ODBC_VERSION}-1.x86_64.rpm \
https://s3.amazonaws.com/redshift-downloads/amazon-redshift-rsql/${AMAZON_REDSHIFT_RSQL_VERSION}/AmazonRedshiftRsql-${AMAZON_REDSHIFT_RSQL_VERSION}-1.x86_64.rpm

COPY .odbc.ini .odbc.ini
COPY fetch_and_run.sh /usr/local/bin/fetch_and_run.sh

ENV ODBCINI=.odbc.ini
ENV ODBCSYSINI=/opt/amazon/redshiftodbc/Setup
ENV AMAZONREDSHIFTODBCINI=/opt/amazon/redshiftodbc/lib/64/amazon.redshiftodbc.ini

ENTRYPOINT ["/usr/local/bin/fetch_and_run.sh"]

The following code example shows the .odbc.ini file. It defines an etl profile, which uses an AWS Identity and Access Management (IAM) role to get temporary cluster credentials to connect to Amazon Redshift. AWS CDK creates this role for us. Because of this, we don’t need to hard-code credentials in a Docker image. The Database, DbUser, and ClusterID parameters are set in AWS CDK. Also, AWS CDK replaces the Region parameter at runtime with the Region to which you deploy the stacks.

[ODBC]
Trace=no

[etl]
Driver=/opt/amazon/redshiftodbc/lib/64/libamazonredshiftodbc64.so
Database=demo
DbUser=etl
ClusterID=redshiftblogdemo
Region=eu-west-1
IAM=1

For more information about connecting to Amazon Redshift clusters with RSQL, see Connect to a cluster with Amazon Redshift RSQL.

Our Docker image implements a well-known fetch and run integration pattern. To learn more about this pattern, see Creating a Simple “Fetch & Run” AWS Batch Job. The Docker image fetches the ETL script from an external repository, and then runs it. AWS CDK passes the information about the ETL script to run to the Docker container at runtime as an AWS Batch job parameter. The job parameter is exposed to the container as an environment variable called BATCH_SCRIPT_LOCATION. Our job also expects two other environment variables: DATA_BUCKET_NAME, which is the name of the S3 data bucket, and COPY_IAM_ROLE_ARN, which is the Amazon Redshift IAM role used for the COPY command to load the data into Amazon Redshift. All environment variables are set automatically by AWS CDK. The fetch_and_run.sh script is the entry point of the Docker container. See the following code:

#!/bin/bash

# This script expects the following env variables to be set:
# BATCH_SCRIPT_LOCATION - full S3 path to RSQL script to run
# DATA_BUCKET_NAME - S3 bucket name with the data
# COPY_IAM_ROLE_ARN - IAM role ARN that will be used to copy the data from S3 to Redshift

PATH="/bin:/usr/bin:/sbin:/usr/sbin:/usr/local/bin:/usr/local/sbin"

if [ -z "${BATCH_SCRIPT_LOCATION}" ] || [ -z "${DATA_BUCKET_NAME}" ] || [ -z "${COPY_IAM_ROLE_ARN}" ]; then
    echo "BATCH_SCRIPT_LOCATION/DATA_BUCKET_NAME/COPY_IAM_ROLE_ARN not set. No script to run."
    exit 1
fi

# download script to a temp file
TEMP_SCRIPT_FILE=$(mktemp)
aws s3 cp ${BATCH_SCRIPT_LOCATION} ${TEMP_SCRIPT_FILE}

# execute script
# envsubst will replace ${COPY_IAM_ROLE_ARN} and ${COPY_IAM_ROLE_ARN} placeholders with actual values
envsubst < ${TEMP_SCRIPT_FILE} | rsql -D etl

exit $?

Create AWS Batch resources

Next, AWS CDK creates the AWS Batch compute environment, job queue, and job definition. As a fully managed service, AWS Batch helps you run batch computing workloads of any scale. AWS CDK creates a Fargate serverless compute environment for us. The compute environment deploys inside the same VPC as the Amazon Redshift cluster, inside the isolated subnets. The job definition uses our Docker image with Amazon Redshift RSQL.

This step turns Amazon Redshift RSQL into a serverless service. You can build complex ETL workflows based on this generic job.

Create a Step Functions state machine

AWS CDK then moves to the deployment of the Step Functions state machine. Step Functions enables you to build complex workflows in a visual way directly in your browser. This service supports over 9,000 API actions from over 200 AWS services.

You can use Amazon States Language to create a state machine on the Step Functions console. The Amazon States Language is a JSON-based, structured language used to define your state machine. You can also build them programmatically using AWS CDK, as I have done for this post.

After AWS CDK finishes, a new state machine is created in your account called ServerlessRSQLETLFramework. To run it, complete the following steps:

  1. Navigate to the Step Functions console.
  2. Choose the function to open the details page.
  3. Choose Edit, and then choose Workflow Studio New.
    The following screenshot shows our state machine.
  4. Choose Cancel to leave Workflow Studio, then choose Cancel again to leave the edit mode.
    You will be brought back to the details page.
  5. Choose Start execution.
    A dialog box appears. By default, the Name parameter is set to a random identifier, and the Input parameter is set to a sample JSON document.
  6. Delete the Input parameter and choose Start execution to start the state machine.

The Graph view on the details page updates in real time. The state machine starts with a parallel state with two branches. In the left branch, the first job loads customer data into staging table, then the second job merges new and existing customer records. In the right branch, two smaller tables for regions and nations are loaded and then merged one after another. The parallel state waits until all branches are complete before moving to the vacuum-analyze state, which runs VACUUM and ANALYZE commands on Amazon Redshift. The sample state machine also implements the Amazon SNS Publish API actions to send notifications about success or failure.

From the Graph view, you can check the status of each state by choosing it. Every state that uses an external resource has a link to it on the Details tab. In our example, next to every AWS Batch Job state, you can see a link to the AWS Batch Job details page. Here, you can view the status, runtime, parameters, IAM roles, link to Amazon CloudWatch Logs with the logs produced by ETL scripts, and more.

Clean up

To avoid ongoing charges for the resources that you created, delete them. AWS CDK deletes all resources except data resources such as S3 buckets and Amazon ECR repositories.

  1. First, delete all AWS CDK stacks. In the following code, provide your own AWS account and AWS Region:
    ./cdk.sh 123456789012 eu-west-1 destroy --all

  2. On the Amazon S3 console, empty and delete buckets with names starting with:
    1. s3stack-rsqletldemodata
    2. s3stack-rsqletldemoscripts
    3. s3stack-rsqletldemologging
  3. Finally, on the Amazon ECR console, delete repositories with names starting with:
    1. ecrrepositorystack-amazonlinuxrsql
    2. cdk-container-assets

Next steps

Here are some ideas of additional enhancements that you can add to the described solution.

You can break large complex state machines into smaller building blocks by creating self-contained state machines. In our example, you could create state machines for every pair of copy and merge jobs. You could create three such state machines: Copy and Merge Customer, Copy and Merge Region, and Copy and Merge Nation, and then call them from the main state machine. For complex workflows, a different team can work on each sub-state machine in parallel. Also, this pattern promotes reuse of existing components, best practices, and security mechanisms.

You can use Amazon S3 Object Functions or Amazon S3 EventBridge notifications to start a state machine automatically after you upload a file to an S3 bucket. To learn more about Amazon S3 integration with Amazon EventBridge, see Use Amazon S3 Event Notifications with Amazon EventBridge. This way you can achieve a fully event-driven serverless ETL orchestration framework.

Summary

You can use Amazon Redshift RSQL, AWS Batch, and Step Functions to create modern, serverless, and cost-effective ETL workflows. There is no infrastructure to manage, and Amazon Redshift RSQL works as a serverless RSQL service. In this post, we demonstrated how to use this serverless RSQL service to build more complex ETL workflows with Step Functions.

Step Functions integrates natively with over 200 AWS services. This opens a new world of possibilities to AWS customers and partners, who can integrate their processes with other data, analytics, machine learning, and compute services such as Amazon S3, Amazon DynamoDB, AWS Glue, Amazon OpenSearch Service (successor to Amazon Elasticsearch Service), Amazon SageMaker, AWS Lambda, and more. The additional advantage of Step Functions and AWS Batch is that you have full traceability and auditing out of the box. Step Functions shows Graph or Event views together with a complete history for all state machine runs.

In this post, I used RSQL automation scripts as the building blocks of ETL workflows. Using RSQL is a common integration pattern that we see for customers migrating from Teradata BTEQ scripts. However, if you have simple ETL or ELT processes that can be written as plain SQL, you can invoke the Amazon Redshift Data API directly from Step Functions. To learn more about this integration pattern, see ETL orchestration using the Amazon Redshift Data API and AWS Step Functions with AWS SDK integration.


About the author

Lukasz is a Principal Software Dev Engineer working in the AWS DMA team. Lukasz helps customers move their workloads to AWS and specializes in migrating data warehouses and data lakes to AWS. In his free time, Lukasz enjoys learning new human languages.

How Epos Now modernized their data platform by building an end-to-end data lake with the AWS Data Lab

Post Syndicated from Debadatta Mohapatra original https://aws.amazon.com/blogs/big-data/how-epos-now-modernized-their-data-platform-by-building-an-end-to-end-data-lake-with-the-aws-data-lab/

Epos Now provides point of sale and payment solutions to over 40,000 hospitality and retailers across 71 countries. Their mission is to help businesses of all sizes reach their full potential through the power of cloud technology, with solutions that are affordable, efficient, and accessible. Their solutions allow businesses to leverage actionable insights, manage their business from anywhere, and reach customers both in-store and online.

Epos Now currently provides real-time and near-real-time reports and dashboards to their merchants on top of their operational database (Microsoft SQL Server). With a growing customer base and new data needs, the team started to see some issues in the current platform.

First, they observed performance degradation for serving the reporting requirements from the same OLTP database with the current data model. A few metrics that needed to be delivered in real time (seconds after a transaction was complete) and a few metrics that needed to be reflected in the dashboard in near-real-time (minutes) took several attempts to load in the dashboard.

This started to cause operational issues for their merchants. The end consumers of reports couldn’t access the dashboard in a timely manner.

Cost and scalability also became a major problem because one single database instance was trying to serve many different use cases.

Epos Now needed a strategic solution to address these issues. Additionally, they didn’t have a dedicated data platform for doing machine learning and advanced analytics use cases, so they decided on two parallel strategies to resolve their data problems and better serve merchants:

  • The first was to rearchitect the near-real-time reporting feature by moving it to a dedicated Amazon Aurora PostgreSQL-Compatible Edition database, with a specific reporting data model to serve to end consumers. This will improve performance, uptime, and cost.
  • The second was to build out a new data platform for reporting, dashboards, and advanced analytics. This will enable use cases for internal data analysts and data scientists to experiment and create multiple data products, ultimately exposing these insights to end customers.

In this post, we discuss how Epos Now designed the overall solution with support from the AWS Data Lab. Having developed a strong strategic relationship with AWS over the last 3 years, Epos Now opted to take advantage of the AWS Data lab program to speed up the process of building a reliable, performant, and cost-effective data platform. The AWS Data Lab program offers accelerated, joint-engineering engagements between customers and AWS technical resources to create tangible deliverables that accelerate data and analytics modernization initiatives.

Working with an AWS Data Lab Architect, Epos Now commenced weekly cadence calls to come up with a high-level architecture. After the objective, success criteria, and stretch goals were clearly defined, the final step was to draft a detailed task list for the upcoming 3-day build phase.

Overview of solution

As part of the 3-day build exercise, Epos Now built the following solution with the ongoing support of their AWS Data Lab Architect.

Epos Now Arch Image

The platform consists of an end-to-end data pipeline with three main components:

  • Data lake – As a central source of truth
  • Data warehouse – For analytics and reporting needs
  • Fast access layer – To serve near-real-time reports to merchants

We chose three different storage solutions:

  • Amazon Simple Storage Service (Amazon S3) for raw data landing and a curated data layer to build the foundation of the data lake
  • Amazon Redshift to create a federated data warehouse with conformed dimensions and star schemas for consumption by Microsoft Power BI, running on AWS
  • Aurora PostgreSQL to store all the data for near-real-time reporting as a fast access layer

In the following sections, we go into each component and supporting services in more detail.

Data lake

The first component of the data pipeline involved ingesting the data from an Amazon Managed Streaming for Apache Kafka (Amazon MSK) topic using Amazon MSK Connect to land the data into an S3 bucket (landing zone). The Epos Now team used the Confluent Amazon S3 sink connector to sink the data to Amazon S3. To make the sink process more resilient, Epos Now added the required configuration for dead-letter queues to redirect the bad messages to another topic. The following code is a sample configuration for a dead-letter queue in Amazon MSK Connect:

Because Epos Now was ingesting from multiple data sources, they used Airbyte to transfer the data to a landing zone in batches. A subsequent AWS Glue job reads the data from the landing bucket , performs data transformation, and moves the data to a curated zone of Amazon S3 in optimal format and layout. This curated layer then became the source of truth for all other use cases. Then Epos Now used an AWS Glue crawler to update the AWS Glue Data Catalog. This was augmented by the use of Amazon Athena for doing data analysis. To optimize for cost, Epos Now defined an optimal data retention policy on different layers of the data lake to save money as well as keep the dataset relevant.

Data warehouse

After the data lake foundation was established, Epos Now used a subsequent AWS Glue job to load the data from the S3 curated layer to Amazon Redshift. We used Amazon Redshift to make the data queryable in both Amazon Redshift (internal tables) and Amazon Redshift Spectrum. The team then used dbt as an extract, load, and transform (ELT) engine to create the target data model and store it in target tables and views for internal business intelligence reporting. The Epos Now team wanted to use their SQL knowledge to do all ELT operations in Amazon Redshift, so they chose dbt to perform all the joins, aggregations, and other transformations after the data was loaded into the staging tables in Amazon Redshift. Epos Now is currently using Power BI for reporting, which was migrated to the AWS Cloud and connected to Amazon Redshift clusters running inside Epos Now’s VPC.

Fast access layer

To build the fast access layer to deliver the metrics to Epos Now’s retail and hospitality merchants in near-real time, we decided to create a separate pipeline. This required developing a microservice running a Kafka consumer job to subscribe to the same Kafka topic in an Amazon Elastic Kubernetes Service (Amazon EKS) cluster. The microservice received the messages, conducted the transformations, and wrote the data to a target data model hosted on Aurora PostgreSQL. This data was delivered to the UI layer through an API also hosted on Amazon EKS, exposed through Amazon API Gateway.

Outcome

The Epos Now team is currently building both the fast access layer and a centralized lakehouse architecture-based data platform on Amazon S3 and Amazon Redshift for advanced analytics use cases. The new data platform is best positioned to address scalability issues and support new use cases. The Epos Now team has also started offloading some of the real-time reporting requirements to the new target data model hosted in Aurora. The team has a clear strategy around the choice of different storage solutions for the right access patterns: Amazon S3 stores all the raw data, and Aurora hosts all the metrics to serve real-time and near-real-time reporting requirements. The Epos Now team will also enhance the overall solution by applying data retention policies in different layers of the data platform. This will address the platform cost without losing any historical datasets. The data model and structure (data partitioning, columnar file format) we designed greatly improved query performance and overall platform stability.

Conclusion

Epos Now revolutionized their data analytics capabilities, taking advantage of the breadth and depth of the AWS Cloud. They’re now able to serve insights to internal business users, and scale their data platform in a reliable, performant, and cost-effective manner.

The AWS Data Lab engagement enabled Epos Now to move from idea to proof of concept in 3 days using several previously unfamiliar AWS analytics services, including AWS Glue, Amazon MSK, Amazon Redshift, and Amazon API Gateway.

Epos Now is currently in the process of implementing the full data lake architecture, with a rollout to customers planned for late 2022. Once live, they will deliver on their strategic goal to provide real-time transactional data and put insights directly in the hands of their merchants.


About the Authors

Jason Downing is VP of Data and Insights at Epos Now. He is responsible for the Epos Now data platform and product direction. He specializes in product management across a range of industries, including POS systems, mobile money, payments, and eWallets.

Debadatta Mohapatra is an AWS Data Lab Architect. He has extensive experience across big data, data science, and IoT, across consulting and industrials. He is an advocate of cloud-native data platforms and the value they can drive for customers across industries.

Use SQL queries to define Amazon Redshift datasets in AWS Glue DataBrew

Post Syndicated from Suraj Shivananda original https://aws.amazon.com/blogs/big-data/use-sql-queries-to-define-amazon-redshift-datasets-in-aws-glue-databrew/

In the post Data preparation using Amazon Redshift with AWS Glue DataBrew, we saw how to create an AWS Glue DataBrew job using a JDBC connection for Amazon Redshift. In this post, we show you how to create a DataBrew profile job and a recipe job using an Amazon Redshift connection with custom SQL.

DataBrew is a visual data preparation tool that can help you simplify your extract, transform, and load (ETL) process. You can now define a dataset from Amazon Redshift by applying custom SQL statements. Applying a custom SQL statement to a large source table allows you to select, join, and filter the data before cleaning, normalizing, and transforming it in a DataBrew project. Filtering and joining the data from your data source and only bringing in the data you want to transform simplifies the ETL process.

In this post, we demonstrate how to use custom SQL queries to define your Amazon Redshift datasets in DataBrew.

Solution overview

To implement this solution, you complete the following high-level steps:

  1. Create an Amazon Redshift connection.
  2. Create your dataset and use SQL queries to define your Amazon Redshift source datasets.
  3. Create a DataBrew profile job to profile the source data.
  4. Create a DataBrew project and recipe job to transform the data and load it to Amazon Simple Storage Service (Amazon S3).

The following diagram illustrates the architecture for our solution.

Prerequisites

To use this solution, complete the following prerequisite steps:

  1. Have an AWS account.
  2. Create an Amazon Redshift cluster in a private subnet within a VPC as a security best practice.
  3. Because DataBrew commands require that the cluster has access to Amazon S3, make sure you create a gateway VPC endpoint to Amazon S3. The gateway endpoint provides reliable connectivity to Amazon S3 without requiring an internet gateway or NAT device from your VPC.
  4. Enable the enhanced VPC routing in the Amazon Redshift cluster. Enhanced VPC routing forces all Amazon Redshift commands to use the connectivity to the gateway VPC endpoint to Amazon S3 in the same AWS Region as your cluster.
  5. Create a database and tables, and load the sample data in the Amazon Redshift cluster.
  6. Prepare a SQL query to extract the source dataset. You use this SQL query later in this post to create an Amazon Redshift source dataset in DataBrew.
  7. Create an S3 bucket to store data from the profile and recipe jobs. The DataBrew connection temporarily stores intermediate data in Amazon S3.
  8. For our use case, we use a mock dataset. You can download the DDL and data files from GitHub.

Security best practices

Consider the following best practices in order to mitigate security threats:

  • Review the shared responsibility model when using DataBrew.
  • Restrict network access for inbound and outbound traffic to least privilege. Take advantage of the routing traffic within the VPC by using an Amazon S3 gateway endpoint and enhanced VPC routing in Amazon Redshift.
  • Enable the lifecycle policy in Amazon S3 to retain only necessary data, and delete unnecessary data.
  • Enable Amazon S3 versioning and cross-Region replication for critical datasets to protect against accidental deletes.
  • Enable server-side encryption using AWS KMS (SSE-KMS) or Amazon S3 (SSE-S3).
  • DataBrew uses Amazon CloudWatch for logging, so you should update your log retention period to retain logs for the appropriate length of time.

Create an Amazon Redshift connection

In this section, you create a connection in DataBrew to connect to your Amazon Redshift cluster.

  1. On the DataBrew console, choose Datasets in the navigation pane.
  2. On the Connections tab, choose Create connection.
  3. For Connection name, enter a name, such as order-db-connection.
  4. For Connection type, select Amazon Redshift.
  5. Under Connection access, provide the Amazon Redshift cluster name, database name, database user, and database password.
  6. Choose Create connection.

Create your dataset by applying a custom SQL statement to filter the source data

In this section, you create a Amazon Redshift connection, add your custom SQL statement, and validate it. You can also validate your SQL statement directly in your Amazon Redshift cluster by using the Amazon Redshift query editor v2. The purpose of validating the SQL statement is to help you avoid failure in loading your dataset into a project or job. Also, checking the query runtime ensures that it runs in under 3 minutes, avoiding timeouts during project loading. To analyze and improve query performance in Amazon Redshift, see Tuning query performance.

  1. On the DataBrew console, choose Datasets in the navigation pane.
  2. On the Datasets tab, choose Connect new dataset.
  3. For Dataset name, enter a name, such as order-data.
  4. In the left pane, choose Amazon Redshift under Database connections.
  5. Add your Amazon Redshift connection and select Enter custom SQL.
  6. Enter the SQL query and choose Validate SQL.
  7. Under Additional configurations, for Enter S3 destination, provide an S3 destination to temporarily store the intermediate results.
  8. Choose Create dataset.

Create a DataBrew profile job

In this section, you use the newly created Amazon Redshift dataset to create a profile job. Data profiling helps you understand your dataset and plan the data preparation steps needed in running your recipe jobs.

  1. On the DataBrew console, choose Jobs in the navigation pane.
  2. On the Profile jobs tab, choose Create job.
  3. For Job name, enter a name, such as order-data-profile-job.
  4. For Job type¸ select Create a profile job.
  5. Under Job input, choose Browse datasets and choose the dataset you created earlier (order-data).
  6. For Data sample, select Full dataset.
  7. Under Job output settings¸ for S3 location, enter the S3 bucket for the job output files.
  8. For Role name, choose an AWS Identity and Access Management (IAM) role with permission for DataBrew to connect to the data on your behalf. For more information, refer to Adding an IAM role with data resource permissions.
  9. Choose Create and run job.

Check the status of your profile job. A profile output file is created and stored in Amazon S3 upon completion. You can choose View data profile to see more information.

In addition to an output file, DataBrew also provides visualizations. On the Dataset profile overview tab, you can see data visualizations that can help you understand your data better. Next, you can see detailed statistics about your data on the Column statistics tab, illustrated with graphics and charts. You can define data quality rules on the Data quality rules tab, and then see the results from the data quality ruleset that applies to this dataset.

For example, in the following screenshot, the amount column has 2% missing values, as shown on the Column statistics tab. You can provide rules that avoid triggering a recipe job in case of an anomaly. You can also notify the source teams to handle or acknowledge the missing values. DataBrew users can also add steps in the recipe job to handle the anomalies and missing values.

Create a DataBrew project and recipe job

In this section, you start analyzing and transforming your Amazon Redshift dataset in a DataBrew project. The custom SQL statement runs in Amazon Redshift when the project is loaded. Databrew performs read-only access to your source data.

Create a project

To create your project, complete the following steps:

  1. On the DataBrew console, choose Projects in the navigation pane.
  2. Choose Create project.
  3. For Project name, enter a name, such as order-data-proj.
  4. Under Recipe details¸ choose Create new recipe and enter a recipe name, such as order-data-proj-recipe.
  5. For Select a dataset, select My datasets.
  6. Select the dataset you created earlier (order-data).
  7. Under Permissions, for Role name, choose your DataBrew role.
  8. Choose Create project.

DataBrew starts a session, constructs a DataFrame, extracts sample data, infers basic statistics, and displays the sample data in a grid view. You can add steps to build a transformation recipe. As of this writing, DataBrew offers over 350 transformations, with more on the way.

For our example use case, Company ABC has set a target to ship all orders within 7 days after the order date (internal SLA). They want a list of orders that didn’t meet the 7-day SLA for additional investigation. The following sample recipe contains steps to handle the missing values, filter the values by amount, change the date format, calculate the date difference, and filter the values by shipping days. The detailed steps are as follows:

  1. Fill missing values with 0 for the amount column.
  2. Filter values by amount greater than 0.
  3. Change the format of order_timestamp to align with ship_date.
  4. Create a new column called days_for_shipping using the dateTime function DATEDIFF to show the difference between order_timestamp and ship_date in days.
  5. Filter the values by days_for_shipping greater than 7.

Create a recipe job

To create your DataBrew recipe job, complete the following steps:

  1. On the DataBrew console, choose Jobs in the navigation pane.
  2. Choose Create job.
  3. For Job name¸ enter a name, such as SHIPPING-SLA-MISS.
  4. Under Job output settings, configure your Amazon S3 output settings.
  5. For S3 location, enter the location of your output bucket.
  6. For Role name, choose the IAM role that contains permissions for DataBrew to connect on your behalf.
  7. Choose Create and run job.

You can check the status of your job on the Jobs page.

The output file is in Amazon S3 as specified, and your data transformation is now complete.

Clean up

To avoid incurring future charges, we recommend deleting the resources you created during this walkthrough.

Conclusion

In this post, we walked through applying custom SQL statements to an Amazon Redshift data source in your dataset, which you can use in profiling and transformation jobs. You can now focus on building your data transformation steps knowing that you’re working on only the needed data.

To learn more about the various supported data sources for DataBrew, see Connecting to data with AWS Glue DataBrew.


About the authors

Suraj Shivananda is a Solutions Architect at AWS. He has over a decade of experience in Software Engineering, Data and Analytics, DevOps specifically for data solutions, automating and optimizing cloud based solutions. He’s a trusted technical advisor and helps customers build Well Architected solutions on the AWS platform.

Marie Yap is a Principal Solutions Architect for Amazon Web Services based in Hawaii. In this role, she helps various organizations begin their journey to the cloud. She also specializes in analytics and modern data architectures.

Dhiraj Thakur is a Solutions Architect with Amazon Web Services. He works with AWS customers and partners to provide guidance on enterprise cloud adoption, migration, and strategy. He is passionate about technology and enjoys building and experimenting in the analytics and AI/ML space.

Accelerate your data warehouse migration to Amazon Redshift – Part 6

Post Syndicated from Michael Soo original https://aws.amazon.com/blogs/big-data/part-6-accelerate-your-data-warehouse-migration-to-amazon-redshift/

This is the sixth in a series of posts. We’re excited to share dozens of new features to automate your schema conversion; preserve your investment in existing scripts, reports, and applications; accelerate query performance; and potentially simplify your migrations from legacy data warehouses to Amazon Redshift.

Check out all the previous posts in this series:

Amazon Redshift is the cloud data warehouse of choice for tens of thousands of customers who use it to analyze exabytes of data to gain business insights. With Amazon Redshift, you can query data across your data warehouse, operational data stores, and data lake using standard SQL. You can also integrate other AWS services such as Amazon EMR, Amazon Athena, Amazon SageMaker, AWS Glue, AWS Lake Formation, and Amazon Kinesis to use all the analytic capabilities in the AWS Cloud.

Migrating a data warehouse can be a complex undertaking. Your legacy workload might rely on proprietary features that aren’t directly supported by a modern data warehouse like Amazon Redshift. For example, some data warehouses enforce primary key constraints, making a tradeoff with DML performance. Amazon Redshift lets you define a primary key but uses the constraint for query optimization purposes only. If you use Amazon Redshift, or are migrating to Amazon Redshift, you may need a mechanism to check that primary key constraints are not being violated by extract, transform, and load (ETL) processes.

In this post, we describe two design patterns that you can use to accomplish this efficiently. We also show you how to use the AWS Schema Conversion Tool (AWS SCT) to automatically apply the design patterns to your SQL code.

We start by defining the semantics to address. Then we describe the design patterns and analyze their performance. We conclude by showing you how AWS SCT can automatically convert your code to enforce primary keys.

Primary keys

A primary key (PK) is a set of attributes such that no two rows can have the same value in the PK. For example, the following Teradata table has a two-attribute primary key (emp_id, div_id). Presumably, employee IDs are unique only within divisions.

CREATE TABLE testschema.emp ( 
  emp_id INTEGER NOT NULL
, name VARCHAR(12) NOT NULL
, div_id INTEGER NOT NULL
, job_title VARCHAR(12)
, salary DECIMAL(8,2)
, birthdate DATE NOT NULL ) 
CONSTRAINT pk_emp_id PRIMARY KEY (emp_id, div_id);

Most databases require that a primary key satisfy two criteria:

  • Uniqueness – The PK values are unique over all rows in the table
  • Not NULL – The PK attributes don’t accept NULL values

In this post, we focus on how to support the preceding primary key semantics. We describe two design patterns that you can use to develop SQL applications that respect primary keys in Amazon Redshift. Our focus is on INSERT-SELECT statements. Customers have told us that INSERT-SELECT operations comprise over 50% of the DML workload against tables with unique constraints. We briefly provide some guidance for other DML statements later in the post.

INSERT-SELECT

In the rest of this post, we dive deep into design patterns for INSERT-SELECT statements. We’re concerned with statements of the following form:

INSERT INTO <target table> SELECT * FROM <staging table>

The schema of the staging table is identical to the target table on a column-by-column basis.

A duplicate PK value can be introduced by two scenarios:

  • The staging table contains duplicates, meaning there are two or more rows in the staging data with the same PK value
  • There is a row x in the staging table and a row y in the target table that share the same PK value

Note that these situations are independent. It can be the case that the staging table contains duplicates, the staging table and target table share a duplicate, or both.

It’s imperative that the staging table doesn’t contain duplicate PK values. To ensure this, you can apply deduplication logic, as described in this post, to the staging table when it’s loaded. Alternatively, if your upstream source can guarantee that duplicates have been eliminated before delivery, you can eliminate this step.

Join

The first design pattern simply joins the staging and target tables. If any rows are returned, then the staging and target tables share a primary key value.

Suppose we have staging and target tables defined as the following:

CREATE TABLE stg ( 
  pk_col INTEGER 
, payload VARCHAR(100) 
, PRIMARY KEY (pk_col)
); 

CREATE TABLE tgt ( 
  pk_col INTEGER 
, payload VARCHAR(100) 
, PRIMARY KEY (pk_col)
);
We can use the following query to detect any duplicate primary key values:
SELECT count(1) 
FROM stg, tgt 
WHERE tgt.pk_col = stg.pk_col;

If the primary key has multiple columns, then the WHERE condition can be extended:

SELECT count(1)
FROM stg, tgt
WHERE
    tgt.pk_col1 = stg.pk_col1
AND tgt.pk_col2 = tgt.pk_col2
AND …
;

There is one complication with this design pattern. If you allow NULL values in the primary key column, then you need to add special code to handle the NULL to NULL matching:

SELECT count(1)
FROM stg, tgt
WHERE
   (tgt.pk_col = stg.pk_col) 
OR (tgt.pk_col IS NULL AND stg.pk_col IS NULL)
;

This is the primary disadvantage of this design pattern—the code can be ugly and unintuitive. Furthermore, if you have a multicolumn primary key, then the code becomes even more complicated.

INTERSECT

The second design pattern that we describe uses the Amazon Redshift INTERSECT operation. INTERSECT is a set-based operation that determines if two queries have any rows in common. You can check out UNION, INTERSECT, and EXCEPT in the Amazon Redshift documentation for more information.

We can determine if the staging and target table have duplicate PK values using the following query:

SELECT COUNT(1)
FROM (
  SELECT pk_col FROM stg
  INTERSECT
  SELECT pk_col FROM tgt
) a
;

If the primary key is composed of more than one column, you can simply modify the subqueries to include the additional columns:

SELECT COUNT(1)
FROM (
  SELECT pk_col1, pk_col2, …, pk_coln FROM stg
  INTERSECT
  SELECT pk_col, pk_col2, …, pk_coln FROM tgt
) a
;

This pattern’s main advantage is its simplicity. The code is easier to understand and validate than the join design pattern. INTERSECT handles the NULL to NULL matching implicitly so you don’t have to write any special code for NULL values.

Performance

We tested both design patterns using an Amazon Redshift cluster consisting of 12 ra3.4xlarge nodes. Each node contained 12 CPU and 96 GB of memory.

We created the staging and target tables with the same distribution and sort keys to minimize data redistribution at query time.

We generated the test data artificially using a custom program. The target dataset contained 1 billion rows of data. We ran 10 trials of both algorithms using staging datasets that ranged from 20–200 million rows, in 20-million-row increments.

In the following graph, the join design pattern is shown as a blue line. The intersect design pattern is shown as an orange line.

You can observe that the performance of both algorithms is excellent. Each is able to detect duplicates in less than 1 second for all trials. The join algorithm outperforms the intersect algorithm, but both have excellent performance.

So, which algorithm should use you choose? If you’re developing a new application on Amazon Redshift, the intersect algorithm is probably the best choice. The inherent NULL matching logic and simple intuitive code make this the best choice for new applications.

Conversely, if you need to squeeze every bit of performance from your application, then the join algorithm is your best option. In this case, you’ll have to trade complexity and perhaps extra effort in code review to gain the extra performance.

Automation

If you’re migrating an existing application to Amazon Redshift, you can use AWS SCT to automatically convert your SQL code.

Let’s see how this works. Suppose you have the following Teradata table. We use it as the target table in an INSERT-SELECT operation.

CREATE MULTISET TABLE testschema.test_pk_tgt (
  pk_col INTEGER NOT NULL
, payload VARCHAR(100) NOT NULL
, PRIMARY KEY (pk_col)
);

The staging table is identical to the target table, with the same columns and data types.

Next, we create a procedure to load the target table from the staging table. The procedure contains a single INSERT-SELECT statement:

REPLACE PROCEDURE testschema.insert_select()
BEGIN
INSERT INTO testschema.test_pk_tgt (pk_col, payload)
SELECT pk_col, payload FROM testschema.test_pk_stg;
END;

Now we use AWS SCT to convert the Teradata stored procedure to Amazon Redshift. First, open Settings, Conversion settings, and ensure that you’ve selected the option Automate Primary key / Unique constraint. If you don’t select this option, AWS SCT won’t add the PK check to the converted code.

Next, choose the stored procedure in the source database tree, right-click, and choose Convert schema.

AWS SCT converts the stored procedure (and embedded INSERT-SELECT) using the join rewrite pattern. Because AWS SCT performs the conversion for you, it uses the join rewrite pattern to leverage its performance advantage.

And that’s it, it’s that simple. If you’re migrating from Oracle or Teradata, you can use AWS SCT to convert your INSERT-SELECT statements now. We’ll be adding support for additional data warehouse engines soon.

In this post, we focused on INSERT-SELECT statements, but we’re also happy to report that AWS SCT can enforce primary key constraints for INSERT-VALUE and UPDATE statements. AWS SCT injects the appropriate SELECT statement into your code to determine if the INSERT-VALUE or UPDATE will create duplicate primary key values. Download the latest version of AWS SCT and give it a try!

Conclusion

In this post, we showed you how to enforce primary keys in Amazon Redshift. If you’re implementing a new application in Amazon Redshift, you can use the design patterns in this post to enforce the constraints as part of your ETL stream.

Also, if you’re migrating from an Oracle or Teradata database, you can use AWS SCT to automatically convert your SQL to Amazon Redshift. AWS SCT will inject additional code into your SQL stream to enforce your unique key constraints, and thereby insulate your application code from any related changes.

We’re happy to share these updates to help you in your data warehouse migration projects. In the meantime, you can learn more about Amazon Redshift and AWS SCT. Happy migrating!


About the authors

Michael Soo is a Principal Database Engineer with the AWS Database Migration Service team. He builds products and services that help customers migrate their database workloads to the AWS cloud.

Illia Kravtsov is a Database Developer with the AWS Project Delta Migration team. He has 10+ years experience in data warehouse development with Teradata and other MPP databases.

Create a most-recent view of your data lake using Amazon Redshift Serverless

Post Syndicated from George Komninos original https://aws.amazon.com/blogs/big-data/create-a-most-recent-view-of-your-data-lake-using-amazon-redshift-serverless/

Building a robust data lake is very beneficial because it enables organizations have a holistic view of their business and empowers data-driven decisions. The curated layer of a data lake is able to hydrate multiple homogeneous data products, unlocking limitless capabilities to address current and future requirements. However, some concepts of how data lakes work feel counter-intuitive for professionals with a traditional database background.

Data lakes are by design append-only, meaning that the new records with an existing primary key don’t update the existing values out-of-the box; instead the new values are appended, resulting in having multiple occurrences of the same primary key in the data lake. Furthermore, special care needs to be taken to handle row deletions, and even if there is a way to identify deleted primary keys, it’s not straightforward to incorporate them to the data lake.

Traditionally, processing between the different layers of data lakes is performed using distributed processing engines such as Apache Spark that can be deployed in a managed or serverless way using services such as Amazon EMR or AWS Glue. Spark has recently introduced frameworks that give data lakes a flavor of ACID properties, such as Apache Hudi, Apache Iceberg, and Delta Lake. However, if you’re coming from a database background, there is a significant learning curve to adopt these technologies that involves understanding the concepts, moving away from SQL to a more general-purpose language, and adopting a specific ACID framework and its complexities.

In this post, we discuss how to implement a data lake that supports updates and deletions of individual rows using the Amazon Redshift ANSI SQL compliant syntax as our main processing language. We also take advantage of its serverless offering to address scenarios where consumption patterns don’t justify creating a managed Amazon Redshift cluster, which makes our solution cost-efficient. We use Python to interact with the AWS API, but you can also use any other AWS SDK. Finally, we use AWS Glue auto-generated code to ingest data to Amazon Redshift Serverless and AWS Glue crawlers to create metadata for our datasets.

Solution overview

Most of the services we use for this post can be treated as placeholders. For instance, we use Amazon DocumentDB (with MongoDB compatibility) as our data source system, because one of the key features of a data lake is that it can support structured and unstructured data. We use AWS Database Migration Service (AWS DMS) to ingest data from Amazon DocumentDB to the data lake on Amazon Simple Storage Service (Amazon S3). The change data capture (CDC) capabilities of AWS Database Migration Service (AWS DMS) enable us to identify both updated and deleted rows that we want to propagate to the data lake. We use an AWS Glue job to load raw data to Redshift Serverless to use job bookmarks, which allows each run of the load job to ingest new data. You could replace the AWS Glue job with Amazon Redshift Spectrum or the Amazon Redshift COPY command if there is a different way to identify newly arrived data.

After new data is ingested to Amazon Redshift, we use it as our extract, transform, and load (ETL) engine. We trigger a stored procedure to curate the new data, upsert it to our existing table, and unload it to the data lake. To handle data deletions, we have created a scalar UDF in AWS Lambda that we can call from Amazon Redshift to delete the S3 partitions that have been affected by the newly ingested dataset before rewriting them with the updated values. The following diagram showcases the architecture of our solution.

Data ingestion

The dataset we use for this post is available on GitHub. After we create our Amazon DocumentDB instance (for this post, we used engine version 4.0.0 and the db.t3.medium instance class), we ingest the sample dataset. Ingested records look like the this:

{
	"_id": ObjectId("61f998d9b7599a1e904ae84d"),
	"Case_Type": "Confirmed",
	"Cases": 1661,
	"Difference": 135,
	"Date": "5/12/2020",
	"Country_Region": "Sudan",
	"Province_State": "N/A",
	"Admin2": "",
	"Combined_Key": "Sudan",
	"Lat": 12.8628,
	"Long": 30.2176,
	"Prep_Flow_Runtime": "6/5/2022 11:15:39 PM"
}

We then create an AWS DMS dms.t3.medium instance using engine version 3.4.6, a source endpoint for Amazon DocumentDB, and a target endpoint for Amazon S3, adding dataFormat=parquet; as an extra configuration, so that records are stored in Parquet format in the landing zone of the data lake. After we confirm the connectivity of the endpoints using the Test connection feature, we create a database migration task for full load and ongoing replication. We can confirm data is migrated successfully to Amazon S3 by browsing in the S3 location and choosing Query with S3 Select on the Parquet file that has been generated. The result looks like the following screenshot.

We then catalog the ingested data using an AWS Glue crawler on the landing zone S3 bucket, so that we can query the data with Amazon Athena and process it with AWS Glue.

Set up Redshift Serverless

Amazon Redshift is a fully managed, petabyte-scale data warehouse service in the cloud. You can start with just a few hundred gigabytes of data and scale to a petabyte or more. This enables you to use your data to acquire new insights for your business and customers. It’s not uncommon to want to take advantage of the rich features Amazon Redshift provides without having a workload demanding enough to justify purchasing an Amazon Redshift provisioned cluster. To address such scenarios, we have launched Redshift Serverless, which includes all the features provisioned clusters have but enables you to only pay for the workloads you run rather than paying for the entire time your Amazon Redshift cluster is up.

Our next step is to set up our Redshift Serverless instance. On the Amazon Redshift console, we choose Redshift Serverless, select the required settings (similar to creating a provisioned Amazon Redshift cluster), and choose Save configuration. If you intend to access your Redshift Serverless instance via a JDBC client, you might need to enable public access. After the setup is complete, we can start using the Redshift Serverless endpoint.

Load data to Redshift Serverless

To confirm our serverless point is accessible, we can create an AWS Glue connection and test its connectivity. The type of the connection is JDBC, and we can find our serverless JDBC URL from the Workgroup configuration section on our Redshift Serverless console. For the connection to be successful, we need to configure the connectivity between the Amazon Redshift and AWS Glue security groups. For more details, refer to Connecting to a JDBC Data Store in a VPC. After connectivity is configured correctly, we can test the connection and if the test is successful, we should see the following message.

We use an AWS Glue job to load the historical dataset to Amazon Redshift; however, we don’t apply any business logic at this step because we want to implement our transformations using ANSI SQL in Amazon Redshift. Our AWS Glue job is mostly auto-generated boilerplate code:

import sys
from awsglue.transforms import *
from awsglue.utils import getResolvedOptions
from pyspark.context import SparkContext
from awsglue.context import GlueContext
from awsglue.job import Job

args = getResolvedOptions(sys.argv, ["JOB_NAME"])
sc = SparkContext()
glueContext = GlueContext(sc)
spark = glueContext.spark_session
job = Job(glueContext)
job.init(args["JOB_NAME"], args)

datasource0 = glueContext.create_dynamic_frame.from_catalog(database = "document-landing", table_name = "cases", transformation_ctx = "datasource0")

glueContext.write_dynamic_frame.from_jdbc_conf(frame = datasource0, catalog_connection = "redshift-serverless", connection_options = {"dbtable": "cases_stage", "database": "dev"}, redshift_tmp_dir = args["TempDir"], transformation_ctx = "datasink4")

job.commit()

The job reads the table cases from the database document_landing from our AWS Glue Data Catalog, created by the crawler after data ingestion. It copies the underlying data to the table cases_stage in the database dev of the cluster defined in the AWS Glue connection redshift-serverless. We can run this job and use the Amazon Redshift query editor v2 on the Amazon Redshift console to confirm its success by seeing the newly created table, as shown in the following screenshot.

We can now query and transform the historical data using Redshift Serverless.

Transform stored procedure

We have created a stored procedure that performs some common transformations, such as converting a text to date and extracting the year, month, and day from it, and creating some boolean flag fields. After the transformations are performed and stored to the cases table, we want to unload the data to our data lake S3 bucket and finally empty the cases_stage table, preparing it to receive the next CDC load of our pipeline. See the following code:

CREATE OR REPLACE PROCEDURE public.historicalload() LANGUAGE plpgsql AS $$
DECLARE
  sql text;
  s3folder varchar(65535);
  iamrole varchar(1000);
  unload varchar(65535);
begin
  create table cases as (
  SELECT oid__id
  , case_type
  , cases
  , difference
  , TO_DATE(date, 'mm/dd/yyyy') date
  , country_region
  , province_state
  , admin2
  , combined_key
  , lat
  , long
  , TO_DATE(prep_flow_runtime, 'mm/dd/yyyy') prep_flow_runtime
  , fips
  , DATE_PART(year, TO_DATE(date, 'mm/dd/yyyy'))::smallint as year
  , DATE_PART(month, TO_DATE(date, 'mm/dd/yyyy'))::smallint as month
  , DATE_PART(day, TO_DATE(date, 'mm/dd/yyyy'))::smallint as day
  , CASE WHEN case_type = 'Deaths' then 1 else 0 end is_death
  , CASE WHEN case_type = 'Confirmed' then 1 else 0 end is_confirmed
  FROM "dev"."public"."cases_stage");
  sql:='select * from "dev"."public"."cases"';
  s3folder:= s3://object-path/name-prefix ';
  iamrole:='arn:aws:iam::<AWS account-id>:role/<role-name>';
  unload := 'unload ('''||sql||''') to '''||s3folder||''' iam_role '''||iamrole||''' ALLOWOVERWRITE MAXFILESIZE 100 MB PARALLEL PARQUET PARTITION BY (year,month,day)';
  execute unload;
  truncate "dev"."public"."cases_stage";
END;
$$

Note that for unloading data to Amazon S3, we need to create the AWS Identity and Access Management (IAM) role arn:aws:iam::<AWS account-id>:role/<role-name>, give it the required Amazon S3 permissions, and associate it with our Redshift Serverless instance. Calling the stored procedure after ingesting the historical dataset to the cases_stage table results in loading the transformed and partitioned dataset in the S3 folder specified in Parquet format. After we crawl the folder with an AWS Glue crawler, we can verify the results using Athena.

We can revisit the loading AWS Glue job we described before to automatically invoke the steps we triggered manually. We can use an Amazon Redshift postactions configuration to trigger the stored procedure as soon as the loading of the staging table is complete. We can also use Boto3 to trigger the AWS Glue crawler when data is unloaded to Amazon S3. Therefore, the revisited AWS Glue job looks like the following code:

import sys
import boto3
from awsglue.transforms import *
from awsglue.utils import getResolvedOptions
from pyspark.context import SparkContext
from awsglue.context import GlueContext
from awsglue.job import Job

args = getResolvedOptions(sys.argv, ["JOB_NAME"])
sc = SparkContext()
glueContext = GlueContext(sc)
spark = glueContext.spark_session
job = Job(glueContext)
job.init(args["JOB_NAME"], args)

glueClient = boto3.client('glue')

datasource0 = glueContext.create_dynamic_frame.from_catalog(database = "document-landing", table_name = "cases", transformation_ctx = "datasource0")

glueContext.write_dynamic_frame.from_jdbc_conf(frame = datasource0, catalog_connection = "redshift-serverless", connection_options = {"dbtable": "cases_stage", "database": "dev", "postactions":post_query}, redshift_tmp_dir = args["TempDir"], transformation_ctx = "datasink4")
glueClient = boto3.client('glue')
response = glueClient.start_crawler(Name='document-lake')
job.commit()

CDC load

Because the AWS DMS migration task we configured is for full load and ongoing replication, it can capture updates and deletions on a record level. Updates come with an OP column with value U, such as in the following example:

U,61f998d9b7599a1e843038cc,Confirmed,25,1,3/24/2020,Sudan,N/A,,Sudan,12.8628,30.2176,6/4/2020 11:15:39 PM,

Deletions have an OP column with value D, the primary key to be deleted, and all other fields empty:

D,61f998d9b7599a1e904ae941,,,,,,,,,,,,

Enabling job bookmarks for our AWS Glue job guarantees that subsequent runs of the job only process new data since the last checkpoint that was set in the previous run of the job without any changes in our code. After the CDC data is loaded in the staging table, our next step is to delete rows with OP column D, perform a merge operation to replace existing rows, and upload the result to our S3 bucket. However, because S3 objects are immutable, we need to delete the partitions that would be affected by the latest ingested dataset and rewrite them from Amazon Redshift. Amazon Redshift doesn’t have an out-of-the-box way to delete S3 objects; however, we can use a scalar Lambda UDF that takes as an argument the partition to be deleted and removes all the objects under the partition. The Python code of our Lambda function uses Boto3 and looks like the following example:

import json
import boto3

datalakeBucket = '<DATA-LAKE-BUCKET>'
folder = 'prod/cases/'
    
def lambda_handler(event, context):
    ret = {}
    res = []
    s3Resource = boto3.resource('s3')
    bucket = s3Resource.Bucket(datalakeBucket)
    for argument in event['arguments']:
        partition = argument[0]
        bucket.objects.filter(Prefix=folder + partition).delete()
        res.append(True)
    ret['success'] = True
    ret['results'] = res
    return json.dumps(ret)

We then need to register the Lambda UDF from in our Amazon Redshift cluster by running the following code:

create or replace external function deletePartition(path VARCHAR)
returns boolean stable 
LAMBDA 'deletePartition'
IAM_ROLE 'arn:aws:iam::<AWS account-id>:role/<role-name>';

The last edge case we might need to take care of is the scenario of a CDC dataset containing multiple records for the same dataset. The approach we take here is to use another date field that is available in the dataset, prep_flow_time, to keep the latest record. To implement this logic in SQL, we use a nested query with the row_number window function.

On a high level, the upsert stored procedure includes the following steps:

  1. Delete partitions that are being updated from the S3 data lake, using the scalar Lambda UDF.
  2. Delete rows that are being updated from Amazon Redshift.
  3. Implement the transformations and compute the latest values of the updated rows.
  4. Insert them into the target table in Amazon Redshift.
  5. Unload the affected partitions to the S3 data lake.
  6. Truncate the staging table.

See the following code:

CREATE OR REPLACE PROCEDURE upsert()
AS $$
DECLARE
  sql text;
  deletePartition text;
  s3folder varchar(65535);
  iamrole varchar(1000);
  unload varchar(65535);
begin
  
  drop table if exists affected_dates;
  create temp table affected_dates as select date from cases where oid__id in (select distinct oid__id from cases_stage cs);
  deletePartition:='select deletePartition(partitionPath) from 
  (select distinct ''year='' || year::VARCHAR || ''/month='' || month::VARCHAR || ''/day='' || day::VARCHAR partitionPath
  from cases
  where date in (select date from affected_dates));';
  execute deletePartition;
	
  delete from cases using cases_stage 
  where cases.oid__id = cases_stage.oid__id;
  insert into cases 
  select oid__id
  , case_type
  , cases
  , difference
  , date
  , country_region
  , province_state
  , admin2
  , combined_key
  , lat
  , long
  , prep_flow_runtime
  , fips
  , year
  , month
  , day
  , is_death
  , is_confirmed
from
(SELECT row_number() over (partition by oid__id order by TO_DATE(prep_flow_runtime, 'mm/dd/yyyy') desc) seq
  , oid__id
  , case_type
  , cases
  , difference
  , TO_DATE(date, 'mm/dd/yyyy') date
  , country_region
  , province_state
  , admin2
  , combined_key
  , lat
  , long
  , TO_DATE(prep_flow_runtime, 'mm/dd/yyyy') prep_flow_runtime
  , fips
  , DATE_PART(year, TO_DATE(date, 'mm/dd/yyyy'))::smallint as year
  , DATE_PART(month, TO_DATE(date, 'mm/dd/yyyy'))::smallint as month
  , DATE_PART(day, TO_DATE(date, 'mm/dd/yyyy'))::smallint as day
  , CASE WHEN case_type = 'Deaths' then 1 else 0 end is_death
  , CASE WHEN case_type = 'Confirmed' then 1 else 0 end is_confirmed
  from cases_stage where op = 'U') where seq = 1;
  
  sql:='select *
  from cases
  where date in (select date from affected_dates);';
  s3folder:='s3://<DATA-LAKE-BUCKET>/prod/cases/';
  iamrole:=' arn:aws:iam::<AWS account-id>:role/<role-name>';
  unload := 'unload ('''||sql||''') to ''' ||s3folder||''' iam_role '''||iamrole||''' ALLOWOVERWRITE MAXFILESIZE 100 MB PARALLEL PARQUET PARTITION BY (year,month,day)';    
  execute unload;
  truncate cases_stage;
END;
$$ LANGUAGE plpgsql;

Finally, we can modify the aforementioned AWS Glue job to use Boto3 to decide whether this is a historical load or a CDC by using Boto3 to check if the table exists in the AWS Glue Data Catalog. The final version of the AWS Glue job is as follows:

import sys
from awsglue.transforms import *
from awsglue.utils import getResolvedOptions
from pyspark.context import SparkContext
from awsglue.context import GlueContext
from awsglue.job import Job

args = getResolvedOptions(sys.argv, ['TempDir','JOB_NAME'])

sc = SparkContext()
glueContext = GlueContext(sc)
spark = glueContext.spark_session
spark.sql("set spark.sql.legacy.timeParserPolicy=LEGACY")
job = Job(glueContext)
job.init(args['JOB_NAME'], args)
glueClient = boto3.client('glue')
tableExists = True
post_query="call upsert();"
try:
    response = glueClient.get_table(DatabaseName='document-data-lake', Name='cases')
except glueClient.exceptions.EntityNotFoundException:
    tableExists = False
    post_query="call historicalLoad();"

datasource0 = glueContext.create_dynamic_frame.from_catalog(database = "document-landing", table_name = "cases", transformation_ctx = "datasource0")

glueContext.write_dynamic_frame.from_jdbc_conf(frame = datasource0, catalog_connection = "redshift-serverless", connection_options = {"dbtable": "cases_stage", "database": "dev", "postactions":post_query}, redshift_tmp_dir = args["TempDir"], transformation_ctx = "datasink4")
if not tableExists:
    response = glueClient.start_crawler(Name='document-lake')

job.commit()

Running this job for the first time with job bookmarks enabled loads the historical data to the Redshift Serverless staging table and triggers the historical load stored procedure, which in turn performs the transformations we implemented using SQL and unloads the result to the S3 data lake. Subsequent runs ingest newly arrived data from the landing zone, ingests them to the staging table, and performs the upsert process, deleting and repopulating the affected partitions in the data lake.

Conclusion

Building a modern data lake that maintains a most recent view involves some edge cases that aren’t intuitive if you come from a RDBMS background. In this post, we described an AWS native approach that takes advantage of the rich features and SQL syntax of Amazon Redshift, paying only for the resources used thanks to Redshift Serverless and without using any external framework.

The introduction of Amazon Redshift Serverless unlocks the hundreds of Redshift features released every year to users that do not require a cluster that’s always up and running. You can start experimenting with this approach of managing your data lake with Redshift, as well as addressing other use cases that are now easier to solve with Redshift Serverless.


About the author

George Komninos is a solutions architect for the AWS Data Lab. He helps customers convert their ideas to a production-ready data product. Before AWS, he spent three years at Alexa Information domain as a data engineer. Outside of work, George is a football fan and supports the greatest team in the world, Olympiacos Piraeus.

Simplify analytics on Amazon Redshift using PIVOT and UNPIVOT

Post Syndicated from Ashish Agrawal original https://aws.amazon.com/blogs/big-data/simplify-analytics-on-amazon-redshift-using-pivot-and-unpivot/

Amazon Redshift is a fast, fully managed cloud data warehouse that makes it simple and cost-effective to analyze all your data using standard SQL and your existing business intelligence (BI) tools.

Many customers look to build their data warehouse on Amazon Redshift, and they have many requirements where they want to convert data from row level to column level and vice versa. Amazon Redshift now natively supports PIVOT and UNPIVOT SQL operators with built-in optimizations that you can use for data modeling, data analysis, and data presentation. You can apply PIVOT and UNPIVOT to tables, sub-queries, and common table expressions (CTEs). PIVOT supports the COUNT, SUM, MIN, MAX, and AVG aggregate functions.

You can use PIVOT tables as a statistics tool that summarizes and reorganizes selected columns and rows of data from a dataset. The following are a few scenarios where this can be useful:

  • Group the values by at least one column
  • Convert the unique values of a selected column into new column names
  • Use in combination with aggregate functions to derive complex reports
  • Filter specific values in rows and convert them into columns or vice versa
  • Use these operators to generate a multidimensional reporting

In this post, we discuss the benefits of PIVOT and UNPIVOT, and how you can use them to simplify your analytics in Amazon Redshift.

PIVOT overview

The following code illustrates the PIVOT syntax:

SELECT … 
FROM  
    (<get_source_data>)   
    AS <alias_source_query>  
PIVOT  
(  
    <agg_func>(<agg_col>)  
FOR   
[<pivot_col>]   
    IN ( [pivot_value_first], [pivot_value_second],  
    ... [pivot_value_last])  
) AS <alias_pivot>
<optional ORDER BY clause>;

The syntax contains the following parameters:

  • <get_source_data> – The SELECT query that gets the data from the source table
  • <alias_source_query> – The alias for the source query that gets the data
  • <agg_func> – The aggregate function to apply
  • <agg_col> – The column to aggregate
  • <pivot_col> – The column whose value is pivoted
  • <pivot_value_n> – A list of pivot column values separated by commas
  • <alias_pivot> – The alias for the pivot table
  • <optional ORDER BY clause> – An optional parameter to apply an ORDER BY clause on the result set

The following diagram illustrates how PIVOT works.

PIVOT instead of CASE statements

Let’s look at an example of analyzing data from a different perspective than how it’s stored in the table. In the following example, book sales data is stored by year for each book. We want to look at the book_sales dataset by year and analyze if there were any books sold or not, and if sold, how many books were sold for each title. The following screenshot shows our query.

The following screenshot shows our output.

Previously, you had to derive your desired results set using a CASE statement. This requires you to add an individual CASE statement with the column name for each title, as shown in the following code:

SELECT year,
MAX (CASE WHEN bookname = 'LOTR' THEN sales ELSE NULL END) LOTR,
MAX (CASE WHEN bookname = 'GOT' THEN sales ELSE NULL END) GOT,
MAX (CASE WHEN bookname = 'Harry Potter' THEN sales else NULL
END) "Harry Potter",
MAX (CASE WHEN bookname = 'Sherlock' THEN sales ELSE NULL END)
sherlock
FROM book_sales GROUP BY year order by year;

With the out-of-the-box PIVOT operator, you can use a simpler SQL statement to achieve the same results:

SELECT *
FROM
(
  SELECT bookname, year, sales
  FROM book_sales
) AS d
PIVOT
(
  MAX(sales)
  FOR bookname IN ('LOTR', 'GOT', 'Harry Potter', 'Sherlock')
) AS piv
order by year;

UNPIVOT overview

The following code illustrates the UNPIVOT syntax:

SELECT ...
FROM  
    (<get_source_data>)   
    AS <alias_source_query> 
UNPIVOT <optional INCLUDE NULLS>
(  
    <value_col>
FOR   
<name_col>  
    IN (column_name_1, column_name_2 ..... column_name_n)  
) AS <alias_unpivot>
<optional ORDER BY clause>; 

The code uses the following parameters:

  • <get_source_data> – The SELECT query that gets the data from the source table.
  • <alias_source_query> – The alias for the source query that gets the data.
  • <optional INCLUDE NULLS> – An optional parameter to include NULL values in the result set. By default, NULLs in input columns aren’t inserted as result rows.
  • <value_col> – The name assigned to the generated column that contains the row values from the column list.
  • <name_col> – The name assigned to the generated column that contains the column names from the column list.
  • <column_name_n> – The column names from the source table or subquery to populate value_col and name_col.
  • <alias_unpivot> – The alias for the unpivot table.
  • <optional ORDER BY clause> – An optional parameter to apply an ORDER BY clause on the result set.

The following diagram illustrates how UNPIVOT works.

UNPIVOT instead of UNION ALL queries

Let’s look at the following example query with book_sales_pivot.

We get the following output.

Previously, you had to derive this result set using UNION ALL, which resulted in a long and complex query form, as shown in the following code:

select * from
(SELECT year, 'lotr' AS book, LOTR AS sales FROM (SELECT * FROM book_sales_pivot)
UNION ALL
SELECT year, 'got' AS book, GOT AS sales FROM (SELECT * FROM book_sales_pivot)
UNION ALL
SELECT year, 'harry potter' AS book, "Harry Potter" AS sales FROM (SELECT * FROM book_sales_pivot)
UNION ALL
SELECT year, 'sherlock' AS book, "Sherlock" AS sales FROM (SELECT * FROM book_sales_pivot)
)
order by year;


With UNPIVOT, you can use the following simplified query:

select * from book_sales_pivot UNPIVOT INCLUDE NULLS
(sales for book in ("LOTR", "GOT", "Harry Potter", "Sherlock"))
order by year;

UNPIVOT is straightforward compared to UNION ALL. You can further clean this output by excluding NULL values from the result set. For example, you can exclude book titles from the result set if there were no sales in a year:

select * from book_PIVOT UNPIVOT
(sales for book in ("LOTR", "GOT", "Harry Potter", "Sherlock"))
order by year;

By default, NULL values in the input column are skipped and don’t yield a result row.

Now that we understand the basic interface and usability, let’s dive into a few complex use cases.

Dynamic PIVOT tables using stored procedures

The query of PIVOT is static, meaning that you have to enter a list of PIVOT column names manually. In some scenarios, you may not want to manually use your PIVOT values because your data keeps changing, and it gets difficult to maintain the list of values and update the PIVOT query manually.

To handle these scenarios, you can take advantage of the dynamic PIVOT stored procedure:

/*
        non_pivot_cols : Text list of columns to be added to the SELECT clause
        table_name     : Schema qualified name of table to be queried
        agg_func       : Name of the aggregate function to apply
        agg_col        : Name of the column to be aggregated
        pivot_col      : Name of the column whose value will be pivoted
        result_set     : Name of cursor used for output      
 */      

CREATE OR REPLACE PROCEDURE public.sp_dynamicPIVOT
(
non_pivot_cols IN VARCHAR(MAX),
table_name IN VARCHAR(MAX),
agg_func IN VARCHAR(32),
agg_col IN VARCHAR(MAX),
pivot_col IN VARCHAR(100),
result_set INOUT REFCURSOR )
AS $$
DECLARE
sql        VARCHAR(MAX) := '';
result_t   VARCHAR(MAX) := '';
PIVOT_sql  VARCHAR(MAX);
cnt INTEGER := 1;
no_of_parts INTEGER := 0;
item_for_col character varying := '';
item_pivot_cols character varying := '';
BEGIN

sql := 'SELECT  listagg (distinct ' || pivot_col || ', '','') within group (order by ' || pivot_col || ')  from ' || table_name || ';';

EXECUTE sql ||' ;' INTO result_t;


no_of_parts := (select REGEXP_COUNT ( result_t , ','  ));


<<simple_loop_exit_continue>>
  LOOP
    item_for_col := item_for_col + '''' + (select split_part("result_t",',',cnt)) +''''; 
    item_pivot_cols := item_pivot_cols + '"' + (select split_part("result_t",',',cnt)) +'"'; 
    cnt = cnt + 1;
    IF (cnt < no_of_parts + 2) THEN
        item_for_col := item_for_col + ',';
        item_pivot_cols := item_pivot_cols + ',';
    END IF;
    EXIT simple_loop_exit_continue WHEN (cnt >= no_of_parts + 2);
  END LOOP;


PIVOT_sql := 'SELECT ' || non_PIVOT_cols || ',' || item_pivot_cols || ' from ( select * from ' || table_name || ' ) as src_data PIVOT ( ' || agg_func || '(' || agg_col || ') FOR ' || pivot_col || ' IN (' || item_for_col || ' )) as PIV order by ' || non_PIVOT_cols || ';';


-- Open the cursor and execute the SQL
OPEN result_set FOR EXECUTE PIVOT_sql;

END;
$$ LANGUAGE plpgsql;


Example:
BEGIN;
CALL public.sp_dynamicPIVOT ('year','public.book_sales','MAX','sales','bookname', 'PIVOT_result');
FETCH ALL FROM PIVOT_result; CLOSE PIVOT_result;
END;

PIVOT example using CTEs

You can use PIVOT as part of a CTE (Common Table Expression). See the following example code:

with dataset1 as
(Select bookname,sales from public.book_sales)
select * from dataset1 PIVOT (
 sum(sales)
 FOR bookname IN ('LOTR', 'GOT', 'Harry Potter', 'Sherlock')
);

Multiple aggregations for PIVOT

The following code illustrates multiple aggregations for PIVOT:

WITH dataset1 AS
(
 SELECT 1 AS "rownum",
 bookname,
 sales
 FROM PUBLIC.book_sales)
SELECT *
FROM (
 SELECT rownum,"LOTR" as avg_sales_lotr,"GOT" as avg_sales_got,"Harry Potter" as avg_sales_harrypotter,"Sherlock" as avg_sales_sherlock
 FROM dataset1 PIVOT (avg(sales) FOR bookname IN ('LOTR','GOT','Harry Potter','Sherlock')) AS avg_sales) a
JOIN
 (
 SELECT rownum, "LOTR" as sum_sales_lotr,"GOT" as sum_sales_got,"Harry Potter" as sum_sales_harrypotter,"Sherlock" as sum_sales_sherlock
 FROM dataset1 PIVOT (sum(sales) FOR bookname IN ('LOTR',
 'GOT', 'Harry Potter', 'Sherlock')) AS sum_sales) b
using (rownum);

Summary

Although PIVOT and UNPIVOT aren’t entirely new paradigms of SQL language, the new native support for these operators in Amazon Redshift can help you achieve many robust use cases without the hassle of using alternate operators. In this post, we explored a few ways in which the new operators may come in handy.

Adapt PIVOT and UNPIVOT into your workstreams now and work with us as we evolve the feature, incorporating more complex option sets. Please feel free to reach out to us if you need further help to achieve your custom use cases.


About the authors

Ashish Agrawal is currently Sr. Technical Product Manager with Amazon Redshift building cloud-based data warehouse and analytics cloud service. Ashish has over 24 years of experience in IT. Ashish has expertise in data warehouse, data lake, Platform as a Service. Ashish is speaker at worldwide technical conferences.

Sai Teja Boddapati is a Database Engineer based out of Seattle. He works on solving complex database problems to contribute to building the most user friendly data warehouse available. In his spare time, he loves travelling, playing games and watching movies & documentaries.

Maneesh Sharma is a Senior Database Engineer at AWS with more than a decade of experience designing and implementing large-scale data warehouse and analytics solutions. He collaborates with various Amazon Redshift Partners and customers to drive better integration.

Eesha Kumar is an Analytics Solutions Architect with AWS. He works with customers to realize business value of data by helping them building solutions leveraging AWS platform and tools.

Integrate Amazon Redshift row-level security with Amazon Redshift native IdP authentication

Post Syndicated from Maneesh Sharma original https://aws.amazon.com/blogs/big-data/integrate-amazon-redshift-row-level-security-with-amazon-redshift-native-idp-authentication/

Amazon Redshift is a fully managed, petabyte-scale data warehouse service in the cloud. You can start with just a few hundred gigabytes of data and scale to a petabyte or more. This enables you to use your data to acquire new insights for your business and customers.

As enterprise customers look to build their data warehouse on Amazon Redshift, they have business requirements to enforce adequate fine-grained access controls to govern who can access which rows of their sensitive data based on the user profiler. Furthermore, many organizations want to access Amazon Redshift using their existing identity provider (IdP) while maintaining these compliance and security requirements around their data. Without proper integrated features to enforce row-level and secure authentication, you may have to develop additional solutions such as views, or try to integrate third-party solutions around your data to enforce security.

With the introduction of row-level security in Amazon Redshift, you can restrict user access at the row level. Additionally, we have introduced a native IdP functionality to help you implement authentication and authorization with your choice of business intelligence (BI) tools in a seamless way.

Amazon Redshift row-level security (RLS) provides granular access control over your sensitive data. It does this by using RLS policies to determine which rows to return in the query result sets.

In this post, we walk you through an example on how you can implement row-level security in Amazon Redshift while using existing IdP credentials to simplify authentication and managing permissions. You can use this flexible solution to provide complete control over data access while maintaining authorization using your existing IdP.

Solution overview

For our use case, an organization requires row-level security to restrict access to sales performance data to specific states and their allocated salesperson. We have the following business rules and conditions:

  • Alice, the salesperson for NY, should have access to NY sales data only
  • Bob, the salesperson for CA, should get access to CA sales data only
  • Charlie, the sales manager for the North America region, should have access to sales data for all states
  • Jen, who belongs to HR department, shouldn’t have access to any sales data

The following diagram illustrates the solution architecture we implement to solve this problem statement using Amazon Redshift row-level security and Amazon Redshift native IdP authentication.

Solution Overview

The solution contains the following steps:

  1. Create RLS policies to provide fine-grained access control for row-level data on the Sales table.
  2. Create Amazon Redshift roles for each of the different Azure AD groups and assign relevant permissions to the table.

With native IdP, roles get created automatically based on Azure groups. However, as a best practice, we’re pre-creating the Amazon Redshift roles and assigning relevant permissions.

  1. Attach row-level security policies to the roles.
  2. Configure a JDBC or ODBC driver in your SQL client to use Azure AD federation and use Azure AD login credentials to sign in.
  3. Upon successful authentication, Azure AD issues an authentication token (OAuth token) back to the Amazon Redshift driver.
  4. The driver forwards the authentication token to the Amazon Redshift cluster to initiate a new database session. Amazon Redshift verifies and validates the authentication token.
  5. Amazon Redshift calls the Azure Graph API to obtain the user’s group membership.
  6. Amazon Redshift maps the logged-in Azure AD user to the Amazon Redshift user and maps the Azure AD groups to Amazon Redshift roles.
  7. The Amazon Redshift roles are pre-mapped with the RLS policies mentioned in step 3. This allows the respective users to query the fine-grained row-level access data from the client.

Prerequisites

To implement this solution, you must have the following prerequisites:

Implement your Amazon Redshift native IdP

To set up your Amazon Redshift native IdP setup, refer to Integrate Amazon Redshift native IdP federation with Microsoft Azure AD using a SQL client. Follow the steps to set up your Azure application and collect Azure AD information for the Amazon Redshift IdP.

For this post, we have created the following four groups in Azure AD:

  • sales_ny
  • sales_ca
  • sales_manager
  • hr_group

Then we created the following four users in Azure AD:

  • Alice – The salesperson in NY state
  • Bob – The salesperson in CA state
  • Charlie – The manager for the North America region
  • Jen – A member of the HR group

Add the respective users to their appropriate group:

  • Alicesales_ny
  • Bobsales_ca
  • Charliesales_manager
  • JenHR

Next, we need to register the IdP in Amazon Redshift using the following command:

CREATE IDENTITY PROVIDER rls_idp TYPE
azure NAMESPACE 'aad'
PARAMETERS '{
"issuer":"https://sts.windows.net/87f4aa26-78b7-410e-bf29-57b39929ef9a/",
"audience":["https://analysis.windows.net/powerbi/connector/AmazonRedshift",
"api://991abc78-78ab-4ad8-a123-zf123ab03612p"],
"client_id":"123ab555-a321-666d-7890-11a123a44890",
"client_secret":"KiG7Q~FEDnE.VsWS1IIl7LV1R2BtA4qVv2ixB" }'
;

In the preceding statement, the type azure indicates that the provider specifically facilitates communication with Microsoft Azure AD. We use the following parameters to collect Azure AD information (for more information, refer to Collect Azure AD Information in Integrate Amazon Redshift native IdP federation with Microsoft Azure AD using a SQL client).

  • issuer – The issuer ID to trust when a token is received. The unique identifier for the tenant_id is appended to the issuer.
  • client_id – The unique public identifier of the application registered with the IdP. This can be referred to as the application ID.
  • client_secret – A secret identifier, or password, known only to the IdP and the registered application.
  • audience – The application ID that is assigned to the application in Azure. For this post, we connect with Amazon Redshift using Power BI Desktop and SQL Workbench/J. The audience value is hardcoded for Power BI desktop, for example https://analysis.windows.net/powerbi/connector/AmazonRedshift . The second audience value is for the SQL client, which you get from the application ID URI in the OAuth application. For example, api://991abc78-78ab-4ad8-a123-zf123ab03612p.

Use the following command to view the registered IdP on Amazon Redshift:

DESC IDENTITY PROVIDER rls_idp;

Native IdP - data

Use the following command to view all the IdPs registered:

select * from svv_identity_providers;

The following Sales table contains information about each salesperson, the respective state they cover, and their total sales amount:

CREATE TABLE SALES (sales_person VARCHAR(30), state CHAR(2), "total_sales" INT);
INSERT INTO SALES VALUES ('Alice', 'NY', 5000);
INSERT INTO SALES VALUES ('Bob', 'CA', 6000);
INSERT INTO SALES VALUES ('Sally', 'IL', 7000);

Sales data

Now we create four roles in the Amazon Redshift cluster based on the groups that we created on the Azure AD portal and assign relevant permissions to them. This simplifies administration by assigning different permissions to different roles and assigning them to different users.

The role name in the Amazon Redshift cluster looks like <namespace>:<azure_ad_group_name>, where the namespace is the one we provided in the IdP creation command (aad) and the group name is the Azure AD group. See the following code:

CREATE ROLE "aad:sales_ny";
CREATE ROLE "aad:sales_ca";
CREATE ROLE "aad:sales_manager";
CREATE ROLE "aad:hr";

Now we grant permission to the Amazon Redshift role on the appropriate tables. For this post, we assign SELECT permission on the Sales table for all four roles:

GRANT SELECT ON TABLE SALES TO ROLE "aad:sales_ny";
GRANT SELECT ON TABLE SALES TO ROLE "aad:sales_ca";
GRANT SELECT ON TABLE SALES TO ROLE "aad:sales_manager";
GRANT SELECT ON TABLE SALES TO ROLE "aad:hr";

Use the following command to view all the roles in the cluster:

select * from svv_roles;

roles information

Create a row-level security policy

Let’s enforce an RLS policy on the Sales table to restrict access to sales performance information for a salesperson specific to a particular state. We create the following policy:

CREATE RLS POLICY policy_sales_ny
WITH (state char(2))
USING (state = 'NY');
CREATE RLS POLICY policy_sales_ca
WITH (state char(2))
USING (state = 'CA');

The sales manager is also required to view sales across the North American region. For this, we create the following policy:

CREATE RLS POLICY policy_sales_all
USING (true);

The policy_sales_all policy allows the sales manager to view all the information in the sales table.

Attach the row-level security policy to roles

Now we have to attach the row-level security policies to their respective Amazon Redshift roles so that when the user logs in using their Amazon Redshift native IdP, they can get fine-grained access to the records.

ATTACH RLS POLICY policy_sales_ny ON public.sales TO ROLE "aad:sales_ny";
ATTACH RLS POLICY policy_sales_ca ON public.sales TO ROLE "aad:sales_ca";
ATTACH RLS POLICY policy_sales_all ON public.sales TO ROLE "aad:sales_manager";

For the HR role, we haven’t created or attached any RLS policy because we don’t want any user from the HR group to get access to sales records.

Enable row-level security on the table

Now let’s enable row-level security on the respective tables. In this demo, we enable the RLS policy on the Sales table using the following command:

ALTER TABLE public.sales ROW LEVEL SECURITY ON;

Use the following command to view the RLS policies:

SELECT * FROM svv_rls_attached_policy;

RLS policy - Data

Test row-level security using Power BI Desktop

In this example, we use Microsoft Power BI Desktop to connect with Amazon Redshift using a native IdP. For this solution, use Microsoft Power BI Desktop- Version: 2.102.683.0 64-bit and above.

  1. In your Microsoft Power BI Desktop, choose Get data.

Native IdP- PowerBI Desktop-Login

  1. Search for the Amazon Redshift connector, choose it, and choose Connect.

Native IdP- PowerBI Desktop-Login

  1. For Server, enter your Amazon Redshift cluster’s endpoint. For example: test-cluster.ct4abcufthff.us-east-1.redshift.amazonaws.com.
  2. For Database, enter your database name (for this post, we enter dev).
  3. Choose OK.

Native IdP- PowerBI Desktop-connection

  1. Choose Microsoft Account.

Native IdP- PowerBI Desktop-Login

  1. Choose Sign in.

RLS-Native IdP- PowerBI Desktop-Login

  1. Enter your Microsoft Account credentials in the authorization dialog. For this example, we sign in with user Alice.
  1. Choose Next.

RLS-Native IdP- PowerBI Desktop-Login

Once connected, you will see the message “You are currently signed in.”

  1. Choose Connect.

As shown in the following screenshot, Azure AD user Alice is able to authenticate using an Amazon Redshift native IdP, and the RLS policies were applied automatically, allowing Alice to access sales performance information for only NY state.

RLS-Native IdP- PowerBI Desktop-Authorized to view respective data

Similarly, we can try signing in as user Bob and see only CA state information.

RLS-Native IdP- PowerBI Desktop-UnAuthorized to view respective data

Charlie belongs to the manager role where the view all policy has been applied, so when he signs in, he is able to view all the rows in the sales table.

RLS-Native IdP- PowerBI Desktop-Authorized to view data

Finally, when Jen signs in, she can access the table, but isn’t able to view any sales records because no RLS policy has been attached to the HR role.

RLS-Native IdP- PowerBI Desktop-UnAuthorized to view data

If we haven’t granted SELECT on the sales table to the role aad:hr, which Jen belongs to, then she can’t access the sales table.

RLS-Native IdP- PowerBI Desktop-UnAuthorized to access table

Test row-level security using SQL Workbench/J

Now we test row-level security with an Amazon Redshift native IdP using SQL Workbench/J.

  1. Create a new connection in SQL Workbench/J and choose Amazon Redshift as the driver.
  2. Choose Manage drivers and add all the files from the downloaded AWS JDBC driver pack .zip file. (Remember to unzip the file.)

Make sure to use the Amazon Redshift driver 2.1.0.4 onwards, because all previous Amazon Redshift driver versions don’t support the Amazon Redshift native IDP feature.

Native IdP- Workbench/J drivers

  1. For URL, enter jdbc:redshift://<cluster endpoint>:<port>:<databasename>. For example: jdbc:redshift://test-cluster.ab6yejheyhgf.us-east-1.redshift.amazonaws.com:5439/dev.

Native IdP- Workbench/J Connection

  1. On the Driver properties tab, add the following properties:
    1. plugin_namecom.amazon.redshift.plugin.BrowserAzureOAuth2CredentialsProvider
    2. listen_port – 7890
    3. idp_response_timeout – 50
    4. scope – Enter the scope value from the OAuth application. For example, api://991abc78-78ab-4ad8-a123-zf123ab03612p/jdbc_login.
    5. client_id – Enter the client_id value from the OAuth application. For example, 991abc78-78ab-4ad8-a123-zf123ab03612p.
    6. idp_tenant – Enter the tenant ID value from the OAuth application. For example, 87f4aa26-78b7-410e-bf29-57b39929ef9a.

Native IdP- Workbench/J Parameters

  1. Choose OK from SQL Workbench/J.

You’re redirected to the browser to sign in with your Azure AD credentials.

As shown in the following screenshot, Azure AD user Alice is able to authenticate using an Amazon Redshift native IdP and view only sales performance information for NY state.

Similarly, we can re-authenticate and sign in as user Bob, who is able to view sales information specific to CA state.

When Charlie signs in, he is able to view all the rows from every state.

Finally, when Jen signs in, she is able to access the table, but can’t view any sales records because no RLS policy has been attached to the HR role.

If we haven’t granted SELECT on the sales table to the role aad:hr, which Jen belongs to, then Jen can’t access the sales table.

Summary

In this post, we covered how you can achieve a secure end-to-end experience using Amazon Redshift native IdP authentication, which simplifies administration and row-level security to enable fine-grained row-level access in Amazon Redshift.

For more information about Amazon Redshift row-level security and native IdP federation, refer to:


About the authors

Maneesh Sharma is a Senior Database Engineer at AWS with more than a decade of experience designing and implementing large-scale data warehouse and analytics solutions. He collaborates with various Amazon Redshift Partners and customers to drive better integration.

Harshida Patel is a Specialist Sr. Solutions Architect, Analytics, with AWS.

Kiran Chinta is a Software Development Manager at Amazon Redshift. He leads a strong team in query processing, SQL language, data security, and performance. Kiran is passionate about delivering products that seamlessly integrate with customers’ business applications with the right ease of use and performance. In his spare time, he enjoys reading and playing tennis.

Debu-PandaDebu Panda is a Senior Manager, Product Management, with AWS. He is an industry leader in analytics, application platforms, and database technologies, and has more than 25 years of experience in the IT world. Debu has published numerous articles on analytics, enterprise Java, and databases, and has presented at multiple conferences such as AWS re:Invent, Oracle Open World, and Java One. He is lead author of the EJB 3 in Action (Manning Publications 2007, 2014) and Middleware Management (Packt).