In a recent survey, a staggering 82% of IT leaders reported experiencing performance issues with their AI workloads within the past year, primarily due to bandwidth and data processing limitations. At the same time, 93% agreed that there’s a greater expectation within their organizations for IT leaders to minimize time-to-revenue for their AI-driven IT infrastructure.
These statistics highlight the predicament that most AI infrastructure and operations teams face today: the challenge of balancing scalability with performance while staying on budget with two of their most expensive operational expense (OpEx) line item costs. Organizations are looking for their AI initiatives to pay off, while IT teams struggle to overcome the unique data challenges they face across the AI model/workload lifecycle—including scalability, performance, and cost management.
Ebook: “Why Object Storage Is Ideal for AI Workflows”
Want to take a deeper dive into the world of object storage? Check out our latest ebook, “Why Object Storage is Ideal for AI Workloads,” and discover the advantages this architecture has to offer across the model lifecycle.
Choosing the Right Cloud-Based Object Storage Provider for AI Data: There’s A Lot to Consider
Choosing the right object storage provider is one of the most consequential decisions infrastructure teams make when building AI‑powered applications. A mis-step can introduce hidden costs, brittle performance, and operational friction that put the brakes on time‑to‑insight and undermine ROI. Selecting or transitioning between cloud-based object storage providers demands careful consideration, as capabilities can vary significantly.
To ensure your AI infrastructure is robust and cost-effective, thoroughly evaluate providers based on several critical factors:
Low latency & high throughput
Performance is critical when selecting a cloud-based object storage provider for AI data. Low latency and high throughput in particular are key as they ensure rapid data access and processing. Low latency minimizes delays in distributing data to GPU clusters, dramatically enhancing training and inference efficiency. Meanwhile, high throughput prevents bottlenecks and improves overall system performance when working with the massive datasets typical of AI applications.
Reliability & uptime
Reliability is foundational. Even minor downtime can severely impact productivity, halt critical AI processes, and delay strategic objectives. Providers must offer clear service level agreements (SLAs) ensuring high availability, typically at 99.9% uptime or higher. Redundant architectures, data replication across regions, and reliable backup strategies are essential to maintain continuous and uninterrupted data access. Finally, when selecting a cloud-based object storage solution, data durability is table stakes.
Transparent & predictable pricing
Budget predictability is crucial for infrastructure planning and growth forecasting. Complex pricing structures, minimum retention periods, hidden fees for data transfers (egress), API requests, and retrieval charges can quickly erode cost-effectiveness. Providers should offer clear, simple pricing structures with explicit, predictable costs for all services involved. Ideally, charges for common activities such as data retrieval, ingress, and transactions should be minimized or eliminated to facilitate efficient AI workflows without unexpected budget impacts.
Data accessibility
Rapid, consistent data accessibility is non-negotiable for AI applications, especially during model training and inference, where delays can significantly degrade performance and outcomes. Providers offering “cold” storage tiers may appear economical upfront but introduce retrieval latency that could hamper time-sensitive applications. Opting for “hot” or always-on storage tiers ensures data remains immediately accessible without incurring delays, essential for high-performance AI workloads. Data portability is another important consideration for AI workloads, as the ability to freely transfer data to the GPU cloud (or clouds) of your choosing greatly increases flexibility and reduces the risk of lock-in.
Scalability and elasticity
AI initiatives typically experience fluctuating data storage demands, requiring infrastructure that can seamlessly scale with growth. Effective providers offer a scalable storage model capable of handling rapid expansions in data volume without performance degradation or significant architectural changes. Elastic scalability ensures that infrastructure teams can effortlessly manage peaks in data collection, processing, and model training demands.
Security and compliance
Security considerations cannot be overstated, particularly when dealing with sensitive or regulated data. Providers must demonstrate rigorous security standards, including data encryption (at rest and in transit), comprehensive access controls, detailed audit logs, and certifications such as SOC 2 compliance. These measures collectively ensure data integrity, protect against breaches, and ensure compliance with regulatory standards.
Leveraging the open cloud: Making data storage a critical part of your AI workflows
The open cloud is a cloud architecture and philosophy rooted in interoperability, data portability, and freedom from vendor lock-in. Unlike proprietary cloud ecosystems that tether customers to a single provider’s toolsets, APIs, and infrastructure, the open cloud is designed to enable seamless integration across platforms, tools, and environments. It supports open standards and APIs, gives users full control over their data, and allows organizations to choose best-in-class services without being locked into a single ecosystem.
In practical terms, the open cloud supports flexible data movement across public clouds, private clouds, and on-prem environments. It gives organizations the autonomy to mix and match services (e.g., compute from one provider, storage from another) and shift workloads as business or technical needs evolve—without punitive costs or excessive reconfiguration.
As organizations accelerate AI adoption, the open cloud offers clear, strategic advantages across every phase of the AI lifecycle—from data ingestion and preprocessing to training, tuning, and inference.
How Backblaze can help
The Backblaze B2 Cloud Storage platform facilitates smooth integration across various AI tools and platforms, and with Backblaze B2 Overdrive, you get a product designed to move exabyte-scale datasets at up to terabit speeds without the eye-watering price tag.
S3 compatibility: Backblaze’s S3-compatible API ensures easy integration with existing applications and frameworks like TensorFlow and PyTorch.
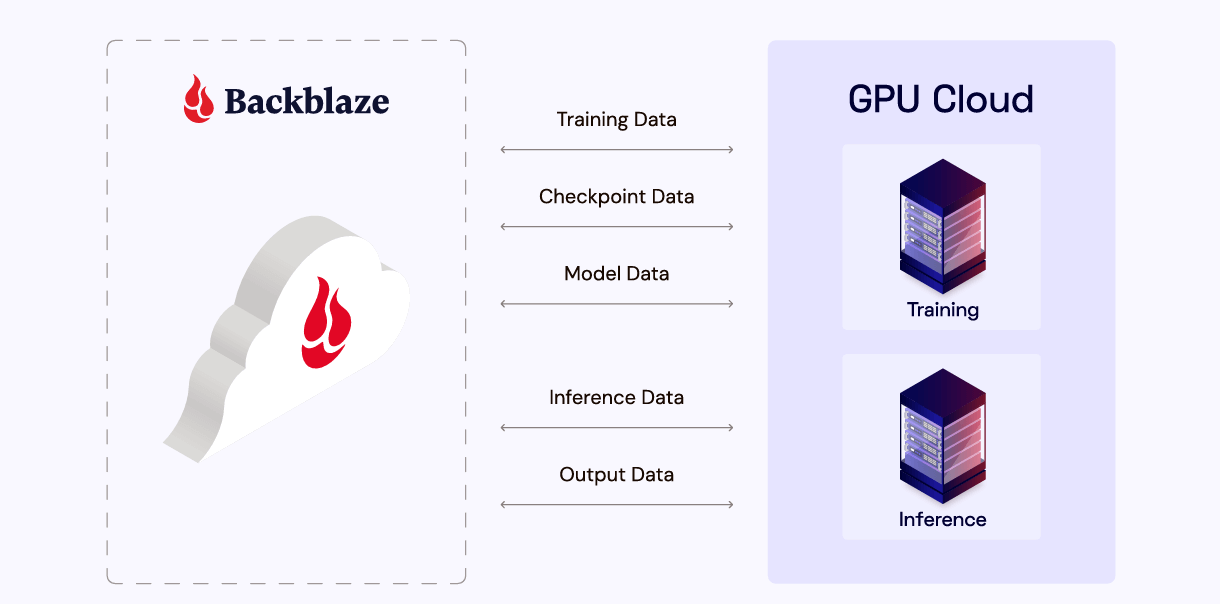
GPU compute environments: Backblaze partners with GPU providers like Vultr and PureNodal, enabling efficient data processing for training models on high-performance hardware without egress fees.
MLOps platforms: Its compatibility with MLOps workflows allows users to streamline model lifecycle management while leveraging Backblaze’s reliable storage backbone. Together, these integrations simplify the AI deployment process and ensure maximum flexibility across cloud environments.
What makes B2 Overdrive different?
B2 Overdrive gets you all the above, plus it offers a specialized solution at a fraction of competitors’ costs. Here’s what you get:
Up to 1Tbps throughput: In other words, the kind of speed that lets you move petabytes of data fast without complex architecture.
Unlimited free egress: Move as much data as you want, whenever you want, to wherever you want. Egress is totally free.
Private networking support: Transfer data at maximum speed through secure private networking connections to your infrastructure.
It’s built on the foundation of our always-hot cloud storage infrastructure, with no minimum file size requirements, no deletion fees, and powerful features like Event Notifications so you can build responsive and automated workflows. We’ll be sharing some of the innovations under the hood in the coming months—so, stay tuned to our series on the engineering behind performance.
No single technology has changed the way we use data quite like AI. From massive training sets to constant streams of checkpoint and inference data, AI applications are data intensive, to say the least. Thankfully, there’s an answer. Object storage—with its scalability, flexibility, and cost-effectiveness—is uniquely suited to AI at every stage of the model lifecycle.
In this blog post, we’ll take a quick look at what object storage is, why it’s a perfect fit for AI workloads, and how Backblaze B2 Cloud Storage offers unique advantages for AI teams looking to innovate quickly, easily, and cost-effectively.
What is object storage?
Think of object storage as a giant, organized bucket for all your files. Instead of stuffing things into folders or breaking them into blocks, you just drop each file (an “object”), with a unique tag and some helpful notes (metadata), into your storage solution.
Unlike traditional file or block storage, object storage uses a flat address space. Each object is assigned a unique identifier and can be tagged with rich metadata, making it easy to search, retrieve, and manage at scale.
Because of this unique architecture, object storage is ideal for handling unstructured data—such as images, video, audio, text, and sensor data—which is the meat and potatoes of most modern AI workflows. Also, being cloud-based, object storage is inherently designed for massive scalability and accessibility over the internet (often via S3 API).
Ebook: “Why Object Storage Is Ideal for AI Workflows”
Want to take a deeper dive into the world of object storage? Check out our latest ebook, “Why Object Storage is Ideal for AI Workloads,” and discover the advantages this architecture has to offer across the model lifecycle.
Understanding AI’s data storage needs at each stage of the model lifecycle
Before diving into the benefits of object storage, let’s first define and outline the AI model lifecycle. While some may slice and dice it a little differently, generally speaking, we can break the AI model lifecycle down into the following stages:
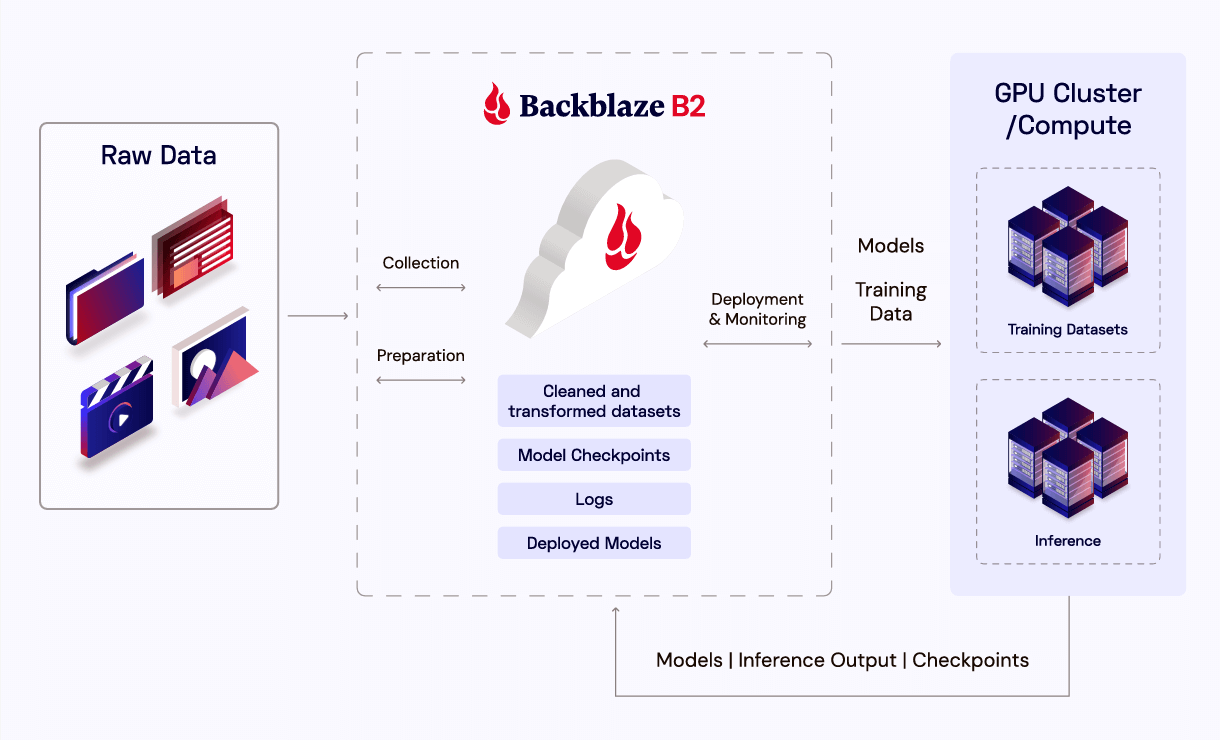
Data ingestion and collection: Massive, often petabyte-scale datasets are gathered from a diversity of sources.
Data preparation and storage: Raw data is cleaned, labeled, transformed, and stored for future retrieval and processing.
Model training: Data is fed into AI training algorithms, typically deployed across many nodes in a GPU cluster—usually requiring high throughput, parallel access, and lengthy processing times.
Deployment and inference: Trained models are deployed into live applications where they take in new data and make inferences based on that data.
Monitoring and archiving: Continuous monitoring generates substantial amounts of log data and performance metrics that must be versioned, stored, and archived for compliance or retraining purposes.
As you can see, each stage of the model lifecycle presents its own unique set of data demands—with each one requiring plenty of planning, work, and preparation. And at every one of these stages, matters of scale, speed, accessibility, and cost are mission-critical to a project’s success.
Where object storage excels: Scalability for data ingestion and collection
Object storage offers virtually unlimited scalability for large, and ever-expanding datasets, making it an ideal solution for the earliest stages of AI development. With no need to create volumes or file systems, organizations can quickly start uploading data to object storage. In addition to this seamless scalability, object storage also shines in its ability to support a diverse range of structured and unstructured data types without the need for rigid hierarchies. In this way, AI teams can ingest all sorts of data to support whatever their unique application needs; and do it quickly and efficiently.
Flexible data preparation and storage
Cloud-based object storage systems are excellent for maintaining easily-accessible, version-controlled datasets that allow for lightning fast iteration and collaboration. Capabilities like version recovery (which allows teams to easily revert datasets to previous states with simple API calls) and concurrent access (which gives multiple team members the ability to work on the same datasets simultaneously without conflicts) are also key to the data preparation and storage phase of AI development.
Reliable, high-performance data storage for model training
For the model training stage of the AI lifecycle, object storage supports parallel access and high throughput, both of which are absolutely essential for GPU-intensive training workloads. Reliable shuttling of large datasets to GPU clusters, wherever they may be, is key for keeping things efficient. Meanwhile, streamlined storage of model checkpoints from those clusters gives teams peace of mind in knowing that a mid-training failure state will not place them all the way back at square one.
Plus, lifecycle management features allow completed or outdated training datasets to be automatically archived—reducing clutter and optimizing storage costs, all while keeping active training data easily accessible.
Efficient versioning for deployment and inference
AI models are always a work in progress. Once deployed and operational, they have to be routinely evaluated and tuned. To that end, object storage makes it easy to store and retrieve a range of valuable information, including model checkpoints, test results, and inference data.
Built-in versioning and object immutability features support reproducibility and audit trails, so you can always trace which data and models produced which results. Together, these capabilities make for robust and effective lifecycle management, significantly boosting reliability and compliance.
Cost-effectiveness and durability for monitoring and archiving
When in the field, continuous monitoring of AI models generates a whole lot of log data and performance metrics. Object storage automates the management of these resources through customizable lifecycle rules, automatically deleting or archiving out-of-date inference logs based on predefined timelines (e.g., after 30–180 days).
This significantly reduces the need for manual oversight, conserves engineering resources, and ensures that relevant performance data remains accessible for compliance and regulatory auditing.
Meanwhile, with the right vendor, object storage solutions can offer competitive pricing models—sometimes including the separation of compute from storage—to ensure cost-effectiveness throughout the late stages of the AI lifecycle. Finally, high durability (of 11 nines or more) and redundancies protect models and datasets which become increasingly valuable over time.
Backblaze B2: Cost-effective, high-performance object storage for your AI workloads
Backblaze B2 Cloud Storage takes all the inherent advantages of cloud-based object storage for AI workloads and amplifies them—through competitive, transparent pricing; reliable, high performance; and seamless integration and support to ensure your project is not only efficient and affordable, but most importantly, successful.
Competitive, transparent pricing: One-fifth of the cost of most hyperscalers’ solutions, with no hidden costs and three times your total storage volume in free egress included. Plus, fully-transparent, predictable pricing models ensure your organization is fully aware and prepared for the costs associated with your applications.
High performance and reliability: Upload speeds up to 30% faster than AWS S3 for many workloads, plus a 99.9% uptime SLA with 11 nines of durability, ensure always-hot, instantly accessible data for demanding AI workloads.
Seamless adoption and integration, accompanied by expert support: With features like Universal Data Migration and no hidden delete fees, B2 Cloud Storage uniquely streamlines cost-effective data management for AI. Backblaze B2 also boasts S3 API compatibility for true plug-and-play functionality with leading AI and machine learning ops (MLOps) tools and technologies.
Plus, our truly agnostic solution allows organizations to freely and easily connect to any compute or GPU environment (or environments), free of vendor lock-in and fees. And in case you want some support along the way, our team of dedicated solution engineers are available to tailor and fine-tune your architecture and operations to best suit whatever the unique needs of your AI project may be.
Optimize your AI lifecycle with cloud object storage from Backblaze B2
Data is one of the most important, and most challenging, aspects of AI development. And with their unprecedented data demands, traditional block and file storage systems frequently come up short in supporting modern AI applications. At the same time, legacy cloud storage solutions come with enormous burdens of cost, inflexibility, and the ever-looming threat of lock-in.
Cloud-based object storage offers the perfect solution to all these challenges—with the right mixture of performance, efficiency, and cost-effectiveness that AI projects need.It’s so-well-suited, in fact, that we’ve written an entire white paper on the subject! So, if you’re interested in taking a deeper dive into the topic, check out our ebook, Why Object Storage is Ideal for AI Workloads, today.
Your disaster recovery (DR) plan is only as strong as your last test. Yet, many enterprises treat DR like a fire extinguisher—useful in theory, but rarely checked. Regular backup testing and disaster recovery drills are essential to ensure your plan works when it counts.
Let’s break down how to test your DR plan effectively and build a framework for continuous improvement.
Step 1: Building a disaster recovery testing framework
Your DR plan isn’t complete until it includes a clear, repeatable testing schedule. Here’s how to structure it:
Testing frequency: Establish a regular testing schedule. The optimal frequency depends on your company’s size and risk profile. A minimum of annual testing is recommended, with more frequent testing (every three-six months) beneficial for larger enterprises.
Testing types: Incorporate various testing methodologies into your plan. This might include:
Tabletop exercises: Simulate disaster scenarios through facilitated discussions, allowing your team to identify communication gaps and areas for improvement in the DR plan.
Walk-throughs: Step through specific recovery procedures outlined in the plan with your incident response team, ensuring team members understand their roles and responsibilities.
Limited scope DR drills: Simulate a disaster scenario with a specific system or application outage, testing recovery procedures for that particular environment.
Full-scale DR drills: Conduct comprehensive tests that simulate a full-blown disaster, involving all critical systems, applications, and personnel.
By rotating through these disaster recovery testing approaches, you’ll catch vulnerabilities before a real crisis does.
Step 2: Involve the right people (not just IT)
A solid DR plan isn’t just an IT function, it’s a team sport. Bring in key personnel from various departments (IT, legal, finance, etc.) to review your DR plan. You might discover potential oversights or areas for improvement that you may have missed with their diverse perspectives.
Step 3: Practice makes prepared
Regularly conduct DR drills and exercises to put your plan into action. DR drills should feel real. That means:
Involving your team. These exercises should involve all members of your IRT, including IT specialists, communication experts, and management representatives, simulating real-world response scenarios and fostering teamwork within the team.
Learning from every test. The primary objective of testing is to identify weaknesses and improve your DR plan. Track everything: timing, response quality, communication breakdowns.
Conducting a retrospective. Use your DR exercises and drills to analyze successes and failures, identify areas for improvement in the DR plan and update your plan based on the lessons learned.
Encourage open discussion and feedback from all participants, including the IRT and potentially impacted stakeholders.
Identify areas where the plan fell short or where communication could be improved.
Apply these insights to fortify your DR plan and improve your company’s overall disaster preparedness.
Step 4: Make the plan accessible
Ensure your DR plan is readily accessible to your IRT members, even during a disaster. Consider storing it in a secure, cloud-based location accessible from various devices and internet connections. Ensure you can access your plan even if your primary environment is down.
Step 5: Leverage the cloud for DR testing
Consider cloud-based solutions for DR testing and recovery. This eliminates the need for ongoing infrastructure investment dedicated solely to testing purposes. Leveraging tools like cloud storage and virtualized infrastructure services provide flexible, affordable options.
Here are some key benefits of cloud-based DR testing:
Cost-effectiveness: Cloud platforms offer on-demand resources, eliminating the need for dedicated infrastructure and associated costs.
Scalability: Cloud resources can be easily scaled up or down to meet your specific testing needs.
Repeatability: Cloud environments allow for replicating test scenarios consistently, facilitating effective training and process improvement.
Final thoughts: Test, Learn, Refine, Repeat
Disaster recovery isn’t a one-and-done process. Every test is a chance to learn, refine, and prepare better for the next incident. Businesses that test regularly not only reduce downtime—they build trust with their teams, customers, and stakeholders.
As organizations race to innovate in AI, efficient, scalable, and cost-effective cloud storage has become key to their success. Whether you’re training massive models or deploying real-time inference pipelines, following best practices for AI storage will help you maximize performance, minimize costs, and ensure the integrity and availability of your most valuable AI asset—data.
In this blog, we’re going to take a look at five of those best practices, to help you get the most out of your cloud storage solution when working with AI.
Ebook: “Why Object Storage Is Ideal for AI Workflows”
Wondering what type of data architecture makes the most sense for your AI initiatives? Check out our latest ebook, “Why Object Storage is Ideal for AI Workloads,” and learn all the advantages this approach to cloud storage offers across the entire model lifecycle.
1. Understand Your Data Lifecycle
You’ve assembled your training data set, loaded it into fast storage next to your GPU compute, and hit the button to start your training. What happens when the training run is complete? If you’re just going to delete that data set, then great—enter rm -r and simply move on.
If not, though, you’ll need to carefully consider the ongoing costs of storage. Leaving that dataset where it is will likely cost you many times over what you’d spend archiving it to a more cost-effective location. By fully understanding and mapping your data lifecycle—and distinguishing between active (e.g., during model training), and inactive data (e.g., archived/dated model versions)—you can manage your storage costs much more efficiently.
2. Check In Your Checkpoints
Training AI models is a delicate, resource-intensive process. Hardware failures, software bugs, and even power outages can derail week-long training runs, wasting precious time and compute resources.
The two most important steps you can take to avoid these kinds of snags are:
Frequent checkpointing: This means regularly saving a model’s state so you can pick the training process back up from the last checkpoint, rather than starting all over again at square one.
Backup checkpoint data to the cloud: Storing checkpoint data on only local drives alone can be very risky. If the local storage fails, your checkpoints—and all the progress they represent—could be lost. That’s why you should always back up checkpoint data to secure cloud storage solutions as well. This dual approach ensures both speed (for quick recovery) and durability (for disaster recovery), letting you and your team rest easy knowing your hard work is being protected.
3. Keep Your Model Safe
With that same spirit in mind, don’t forget that your models require safekeeping, too. It takes a lot of time and money to train AI models, so protecting them—whether from hardware failure, human error, ransomware attack, or other threats—is absolutely paramount. To safeguard your models:
Use your cloud provider’s object lock to prevent accidental or malicious deletion.
Implement regular, automated backups of both model binaries and associated metadata.
Store critical models in geographically redundant locations for disaster recovery.
These few simple steps can go a very long way to ensuring that your valuable, hard-earned models remain safe and functional, even when things take a turn for the worse.
4. Don’t Lock Your Data Behind a Paywall
Let’s imagine you’re planning your next training run. When looking at cloud providers, you discover that you can realize significant savings by switching GPU compute providers. The only problem is, your current provider will charge you an arm and a leg to move the data to where it needs to be. There’s still a net gain from moving, but you lose significant margin by paying this exorbitant “exit toll,” known as an egress fee. This is why, before committing to a storage provider, you should carefully review its pricing structures and fees, including the following:
Calculate the total cost of moving your data, not just storing it.
Consider multi-cloud strategies or providers that offer free or low-cost egress for AI workloads.
By understanding these costs upfront, you retain the flexibility to optimize your infrastructure as business needs evolve, and avoid the all-too-common trap of hidden fees.
5. Do the Mirroring Math: The Replication Equation
Let’s imagine you’ve found yourself a cost-effective storage option with a specialized cloud object storage provider. Even after finding the right solution with the right pricing structure and performance, there are considerations to be made. No matter how quickly you can download the data, if compute and data are in different locations there’s no escaping the fact that your GPUs might be spinning idle waiting for that data to arrive.
To avoid this predicament, break out your calculator and do the “mirroring math”:
Calculate the time and cost required to replicate (mirror) data to a location near your GPUs before training starts.
Weigh the benefits of lower storage costs against the potential delays and additional storage expenses during training.
For large or frequently accessed datasets, it may be worth pre-staging data in high-throughput storage close to your compute.
Ask yourself: Is it faster and/or cheaper to replicate the data upfront to be in close proximity to your GPUs, or does the time required to mirror the data and the additional storage cost during the training run outweigh the benefits? Intelligent data placement—balancing cost, performance, and proximity—ensures your AI workloads run efficiently and cost-effectively.
Building a Future-Proof AI Storage Strategy
The relentless pace of AI innovation demands a storage strategy that is agile, scalable, and cost-effective. Thankfully, the above five best practices can go quite a long way to ensuring the long-term success of your AI project
By understanding the entirety of your data lifecycle—checkpointing wisely, securing your models, avoiding data lock-in, and optimizing data placement—your team is laying the groundwork for sustained AI success. No matter what industry you’re in, these best practices will help to control costs, accelerate innovation, maintain compliance, and protect your team’s most valuable digital assets, in both the near and long term.
Last week, a misconfiguration in Google Cloud’s API infrastructure led to a major global outage. Not long before that, IBM Cloud suffered its second significant disruption in a matter of weeks. The incidents impacted everything from enterprise infrastructure to consumer-facing apps—Gmail, Spotify, Cloudflare, and countless internal systems built on top of these platforms.
Understandably, much of the coverage has focused on what went wrong. But the more important question might be: Why does something like this ripple so far and wide in a system supposedly built for resilience?
Single points of failure in a multi-service world
One might assume that as cloud providers scale, their reliability scales with them. However, these outages reveal a critical distinction: the difference between data-layer resilience and control-plane fragility.
The problem is, that robust data layer can be rendered useless if the “front door” is locked. Hyperscale cloud platforms have grown so interdependent and complex that a fault in one layer can bring vast swaths of unrelated services to a halt. This is the risk of vertical integration: When one vendor provides compute, storage, networking, and identity, a simple bug or misconfiguration can cascade through thousands of applications, not because the applications are fragile, but because they’ve all tied themselves to the same operational backbone.
Redundancy, or the illusion of it?
In theory, cloud architecture encourages redundancy. But in practice, many companies—even those using multi-cloud strategies—tend to consolidate key services like authentication and orchestration with a single vendor. When that vendor’s services go down, it doesn’t matter that your data is replicated across three availability zones in the same data center. If you can’t log in to access it, your redundancy becomes purely theoretical.
After last week’s outages, some companies may re-evaluate their cloud strategy—but it’s not as easy as flipping a switch. True diversification is complex, requiring time, engineering resources, and a cultural shift toward designing for failure.
The reality: Fewer assumptions, more contingencies
The knee-jerk reaction to events like these is often to demand better SLAs, more transparency, or faster recovery times. Those are valid asks. But they might miss the deeper lesson: Assumptions about uptime and “X-nines” reliability are only helpful until the moment they aren’t. What users need are not just better guarantees, but clearer paths to self-determination when things break.
That might look like:
Designing for graceful degradation. What can your service do when its cloud provider is partially offline?
Reconsidering dependencies. Are you tying core logic to a provider’s proprietary APIs, or abstracting where possible?
Asking harder questions during vendor selection. Not just, “Can it scale?” but “What happens when it fails?”
Case study: Sardius Media bakes in redundancy
Sardius Media, a global video platform, built cloud redundancy into its DNA. Every piece of media is replicated across multiple S3 compatible storage providers—including Backblaze B2—using a proprietary “race” mechanism that always delivers the fastest, most reliable storage experience for end users. This architecture keeps files available, resilient, and protected, even if one provider has an outage.
No single point of failure: Content lives across multiple clouds
Best performance: Requests race to the fastest provider in real time
Durability, affordability, and global reach—Backblaze B2 wins the race up to 80% of the time globally
Sardius Media’s strategy proves that open, multi-provider storage isn’t just theory—it’s operational resilience in action.
What does that mean for you?
The answer isn’t to abandon the cloud, but to get smarter about how you use it. This means architecting systems that don’t just have data redundancy, but true operational independence.
Maybe that means replicating data to providers who specialize rather than consolidate. Or maybe it just means revisiting architectures that have become too reliant on invisible scaffolding.
What’s clear is this: reliability isn’t a feature you buy from the cloud. It’s a design philosophy that must be shared.
Under pressure to do more with less? (Who isn’t, right?)
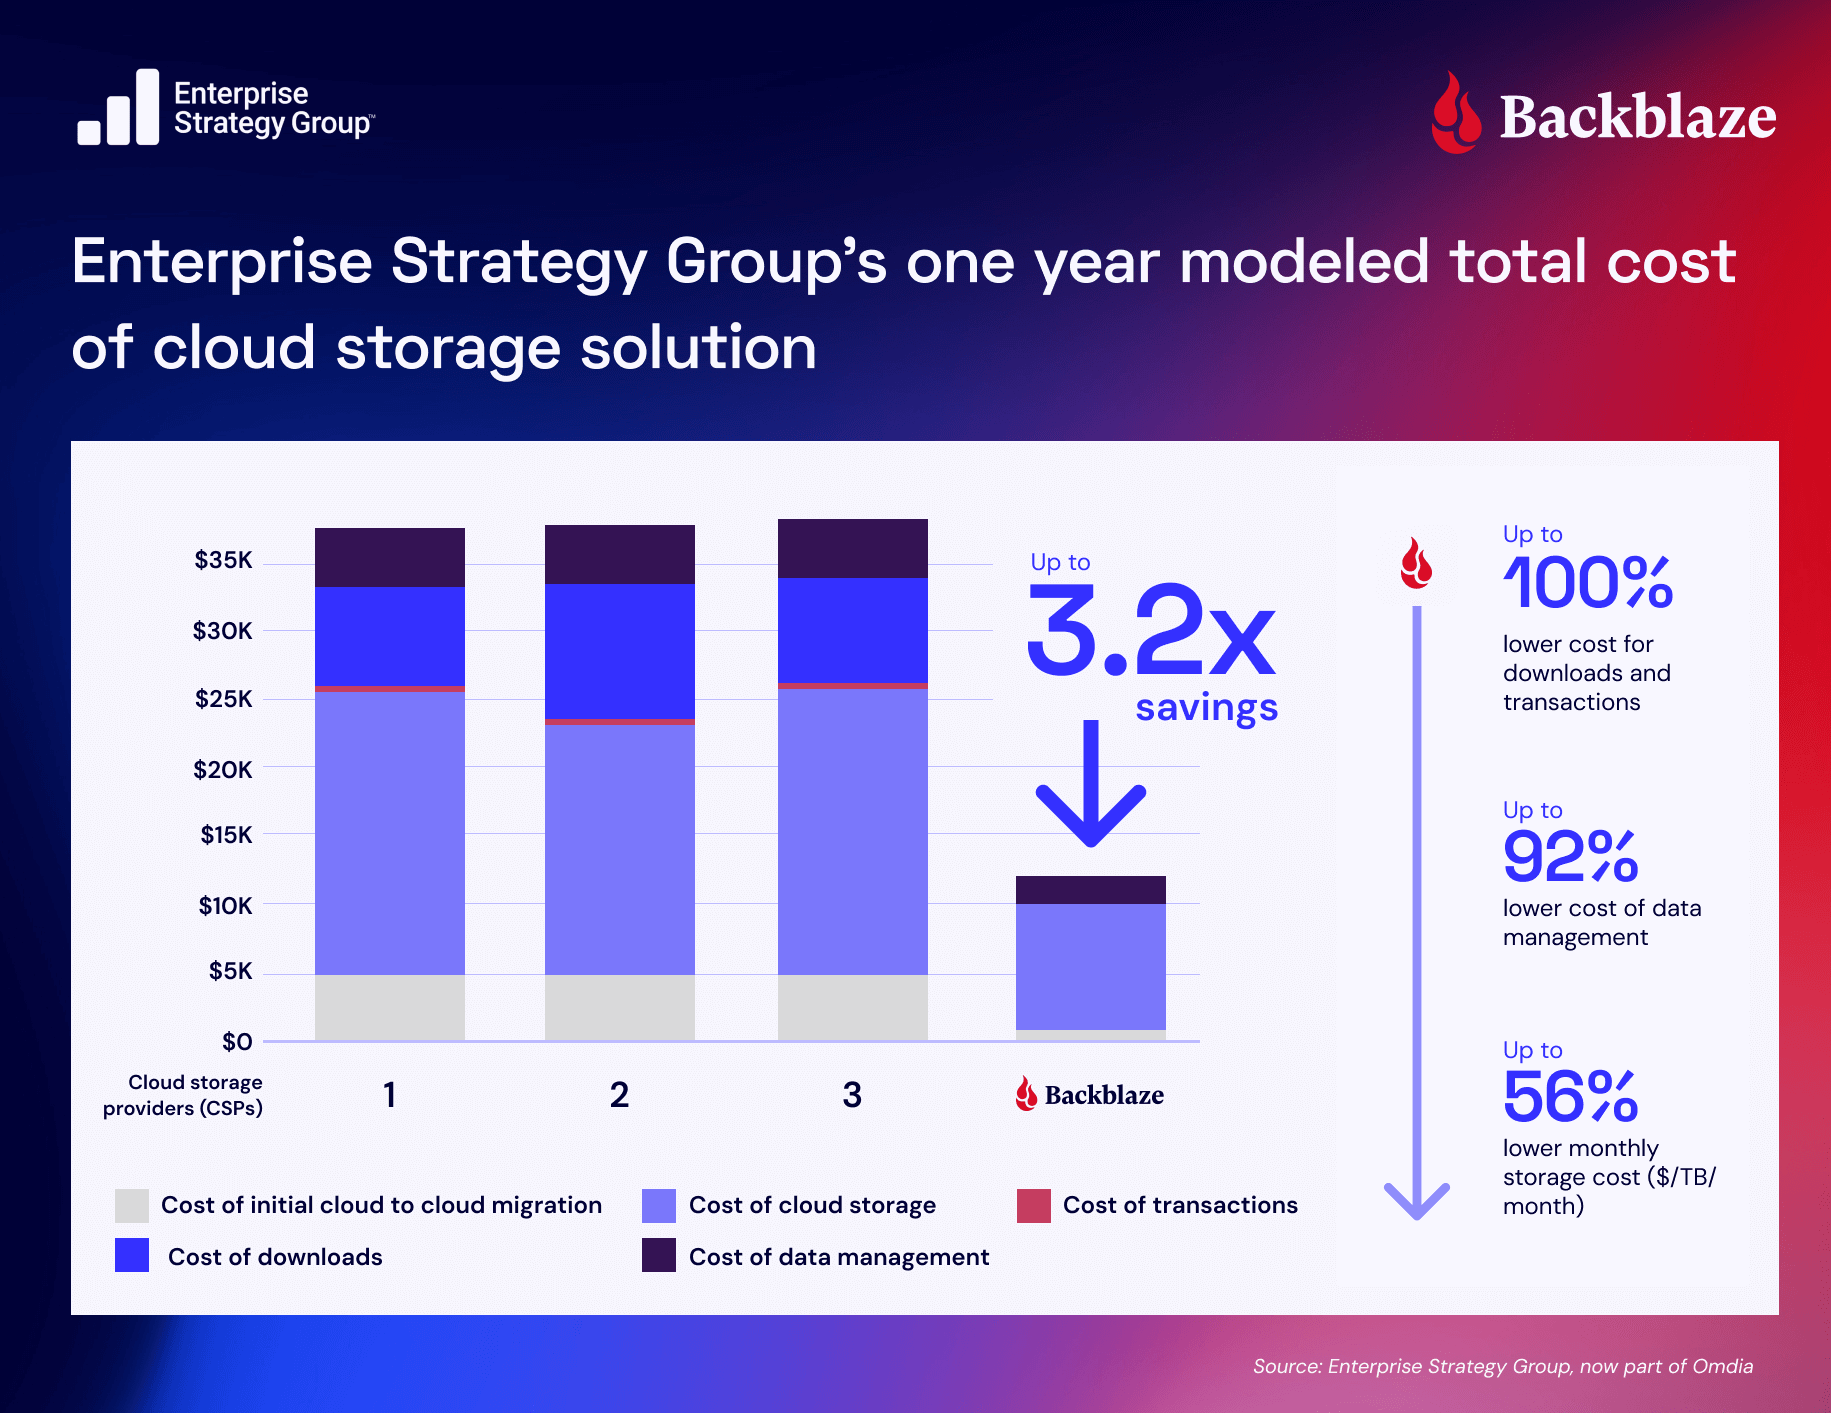
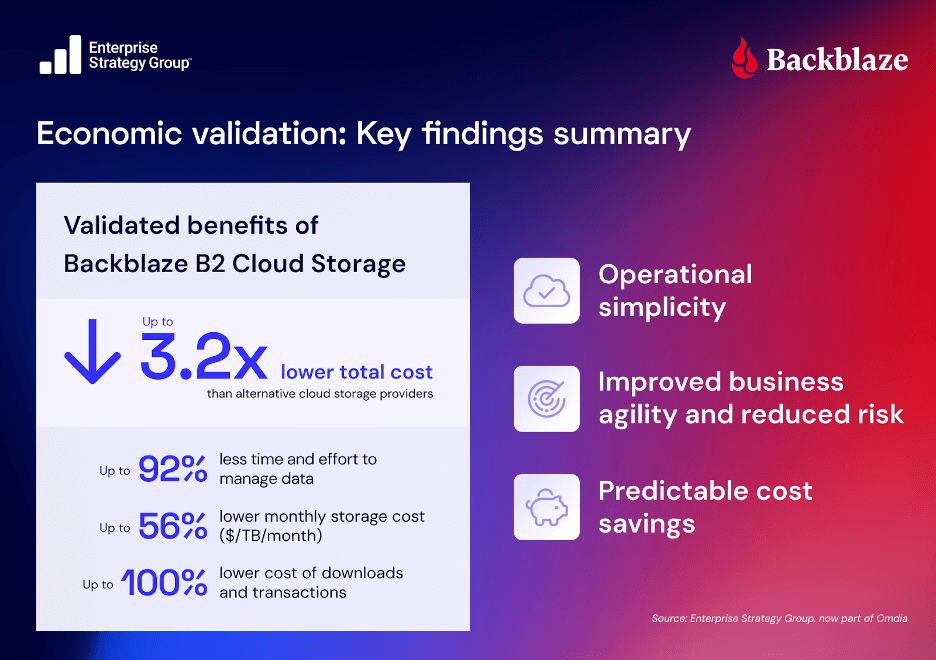
Whether you’re an IT leader or a startup founder, the last thing you want to do is waste time and money wrestling with expensive, overcomplicated cloud storage. According to a new report from Informa TechTarget’s Enterprise Strategy Group (ESG), you don’t have to. Backblaze B2 Cloud Storage delivers:
Up to 3.2x lower total cost of ownership (TCO)
Up to 56% lower monthly storage costs
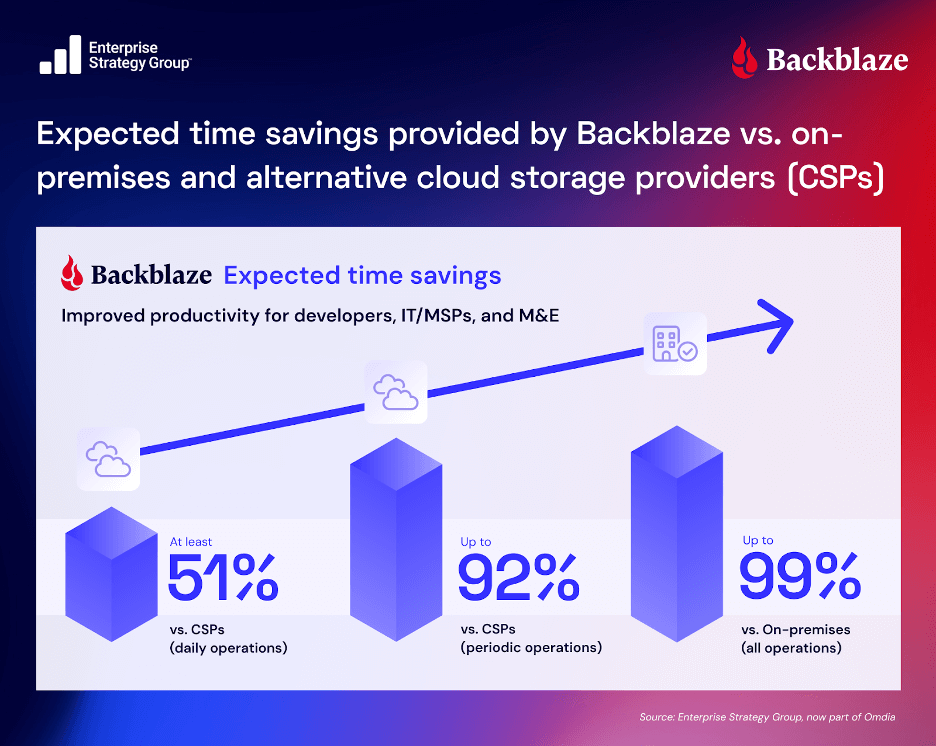
Up to 92% less time and effort to manage data
Up to 100% lower download and transaction costs
Up to 91% savings on cloud to cloud (C2C) migration costs
Economic validation: Motivation, results, and methodology
The independent analysis confirms what many Backblaze B2 users already know: Our cloud storage platform is more affordable and easier to manage compared to legacy cloud providers like AWS, Google Cloud Platform, and Azure.
To develop these findings, the ESG analysts talked to customers. They validated use cases. They used our product and verified the accuracy of our listed pricing and cost calculator. And then, they took those results along with the knowledge they’ve gathered over decades of experience to quantify the benefits that organizations can expect by using the Backblaze B2 Cloud Storage platform.
Powerful storage, real savings
The ESG report highlights how Backblaze’s predictable pricing—including at least 3x free egress, if not totally free egress in many cases—can help businesses skip the painful math of legacy storage and start getting more value out of their data. Whether you’re hosting content, training AI models, backing up critical data, or building applications, B2 Cloud Storage gives you freedom without vendor lock-in.
It’s not just about saving money—it’s about reclaiming time and resources to focus on innovation.
AI workloads don’t play by the same rules as your average enterprise app, and if you’ve looked at your cloud bill lately, you probably know that already. They have unique demands that make them especially vulnerable to hidden AI storage costs. Think: massive parallel GPU training, nonstop data shuffling, and frequent checkpointing.
The problem? Most cloud pricing models weren’t built for this kind of action. They were designed when workloads were a lot more predictable. So, when you run AI workloads on storage models built by hyperscalers, the costs add up quickly, and often invisibly.
Download the ebook
Struggling to keep AI storage costs under control? Download our free ebook to discover how to optimize cloud storage for AI workloads—without compromising performance.
Here are five reasons your cloud bill for AI workloads could spiral out of control:
1. Death by API call: Soaring costs in AI training pipelines.
AI workloads are packed with transactions. Every ingest of raw data, training round, inference batch, or logging step triggers API calls—PUTs, GETs, LISTs, and COPYs. If you’re training a foundational model like Deepseek v3 or Llama 2, you could be making millions of small transactions a day just by uploading all the raw data you require for training.
Each transaction might cost a fraction of a cent—but they add up.
Example: Let’s assume a model needs 1 trillion pretraining tokens. Different data sources contribute varying numbers of tokens per file. For this exercise, let’s assume the following token counts:
Web pages: ~1,000 tokens/page (e.g., blog posts, articles)
A typical large language model (LLM) training mix might look like this:
Source
% of tokens
Tokens contribution
Files required (approx.)
Web pages
40%
400B tokens
400M files
Books
20%
200B tokens
2M files
Code
15%
150B tokens
300M files
News articles
15%
150B tokens
187.5M files
Academic papers
10%
100B tokens
20M files
Total
100%
1T tokens
~909.5M files
If you’re ingesting 909.5 million files to AWS S3 at $0.005 per 1,000 PUTs (pricing as of April 2025), then you’d be charged:
909,500,000 ÷ 1,000 = 909,500 units
909,500 × $0.005 = $4,547.50
That’s $4,547.50 in just PUT transaction fees—for just collecting all the data you need for training. And that’s not counting GETs, LISTs, or any other operations that are necessary to support the full AI data pipeline.
2. The small file tax: How small files drive up AI cloud storage costs
Models trained on image slices, text tokens, or time-series data can create millions of small files. These not only trigger excessive API calls, but also suffer from the following:
Some providers bill you by minimum object size (e.g., rounding all small files up to 128KB).
Every small object can trigger a full-priced transaction.
Frequent access means you’re paying for reads, not just storage.
This mismatch means your dataset of 100 million 10KB files could behave (and cost) like a much larger, high-churn workload.
3. Why cold storage fails for AI data workloads
Deep archive tiers may be cheap upfront, but they’re a poor fit for iterative AI workflows. Need to rehydrate training data to rerun a model? Get ready to wait hours and pay per retrieval. Need to delete? You could get hit with minimum retention penalties, and pay for that data as if you held onto it for 60, 90, or even 180 days.
AI workflows are iterative. You’re not archiving log files; you’re experimenting, fine-tuning, and reprocessing constantly. Cold storage is rarely compatible with that.
4. Egress fees: The hidden cost of moving AI training data
Egress is a silent killer. It’s the fee you pay every time you move data out of cloud storage. In AI workflows, that’s often necessary for:
Sending training data to a GPU cluster.
Validating models on a local system.
Migrating to another provider.
Collaborating with partners across clouds or regions.
These fees scale linearly with data volume, which is a problem when your AI pipeline is pulling terabytes or petabytes per day.
5. AI data lifecycle rules can backfire
You might set up lifecycle rules to move infrequently accessed data to cheaper tiers—sounds smart, right?
Except:
Lifecycle transitions often come with per-object fees.
Accessing those objects later triggers retrieval fees, or breaks performance expectations.
Deleting or overwriting too early triggers penalties.
And all of this assumes you even know your data’s “temperature” in advance—which, in AI workflows, changes day to day.
Smarter AI Storage
Your AI pipeline isn’t just a compute problem: It’s a data movement and storage orchestration engine. And that’s exactly where traditional cloud pricing models fall short.
If your cloud bill is blowing up, it’s probably not just because you kicked off another training run. It’s the millions of GET requests, the silent egress charges, and those archive tier retrievals you didn’t plan for.
The good news? Once you know where the hidden costs are, you can start building smarter.
In an earlier blog post, I explained how to build your own LLM with Backblaze B2 + Jupyter Notebook, implementing a simple conversational AI chatbot using the LangChain AI framework to implement retrieval-augmented generation (RAG). The notebook walks you through the process of loading PDF files from a Backblaze B2 Bucket into a vector store, running a local instance of a large language model (LLM) and combining those to form a chatbot that can answer questions on its specialist subject.
That article generated a lot of interest, and a few questions:
“Could you make this into a web app, like ChatGPT?”
“Could you use this with OpenAI? DeepSeek?”
“Could I load multiple collections of documents into this?”
“Could I run multiple LLMs and compare them?”
“Can I add new documents to the vector store as they are uploaded to the bucket?”
The answer to all of these questions is “Yes!”
Today, I’ll present a simple conversational AI chatbot web app with a ChatGPT-style UI that you can easily configure to work with OpenAI, DeepSeek, or any of a range of other LLMs. In future blog posts, I’ll extend this to allow you to configure multiple LLMs and document collections, and integrate with Backblaze B2’s Event Notifications feature to load documents into the vector store within seconds of them being uploaded.
And, here’s a very short video of the chatbot in action:
Retrieval-augmented generation, or RAG for short, is a technique that applies the generative features of an LLM to a collection of documents, resulting in a chatbot that can effectively answer questions based on the content of those documents.
A typical RAG implementation splits each document in the collection into a number of roughly equal-sized, overlapping chunks, and generates an embedding for each chunk. Embeddings are vectors (lists) of floating point numbers with hundreds or thousands of dimensions. The distance between two vectors indicates their similarity. Small distances indicate high similarity and large distances indicate low similarity.
The RAG app then loads each chunk, along with its embedding, into a vector store. The vector store is a special-purpose database that can perform a similarity search–given a piece of text, the vector store can retrieve chunks ranked by their similarity to the query text by comparing the embeddings.
Let’s put the pieces together:
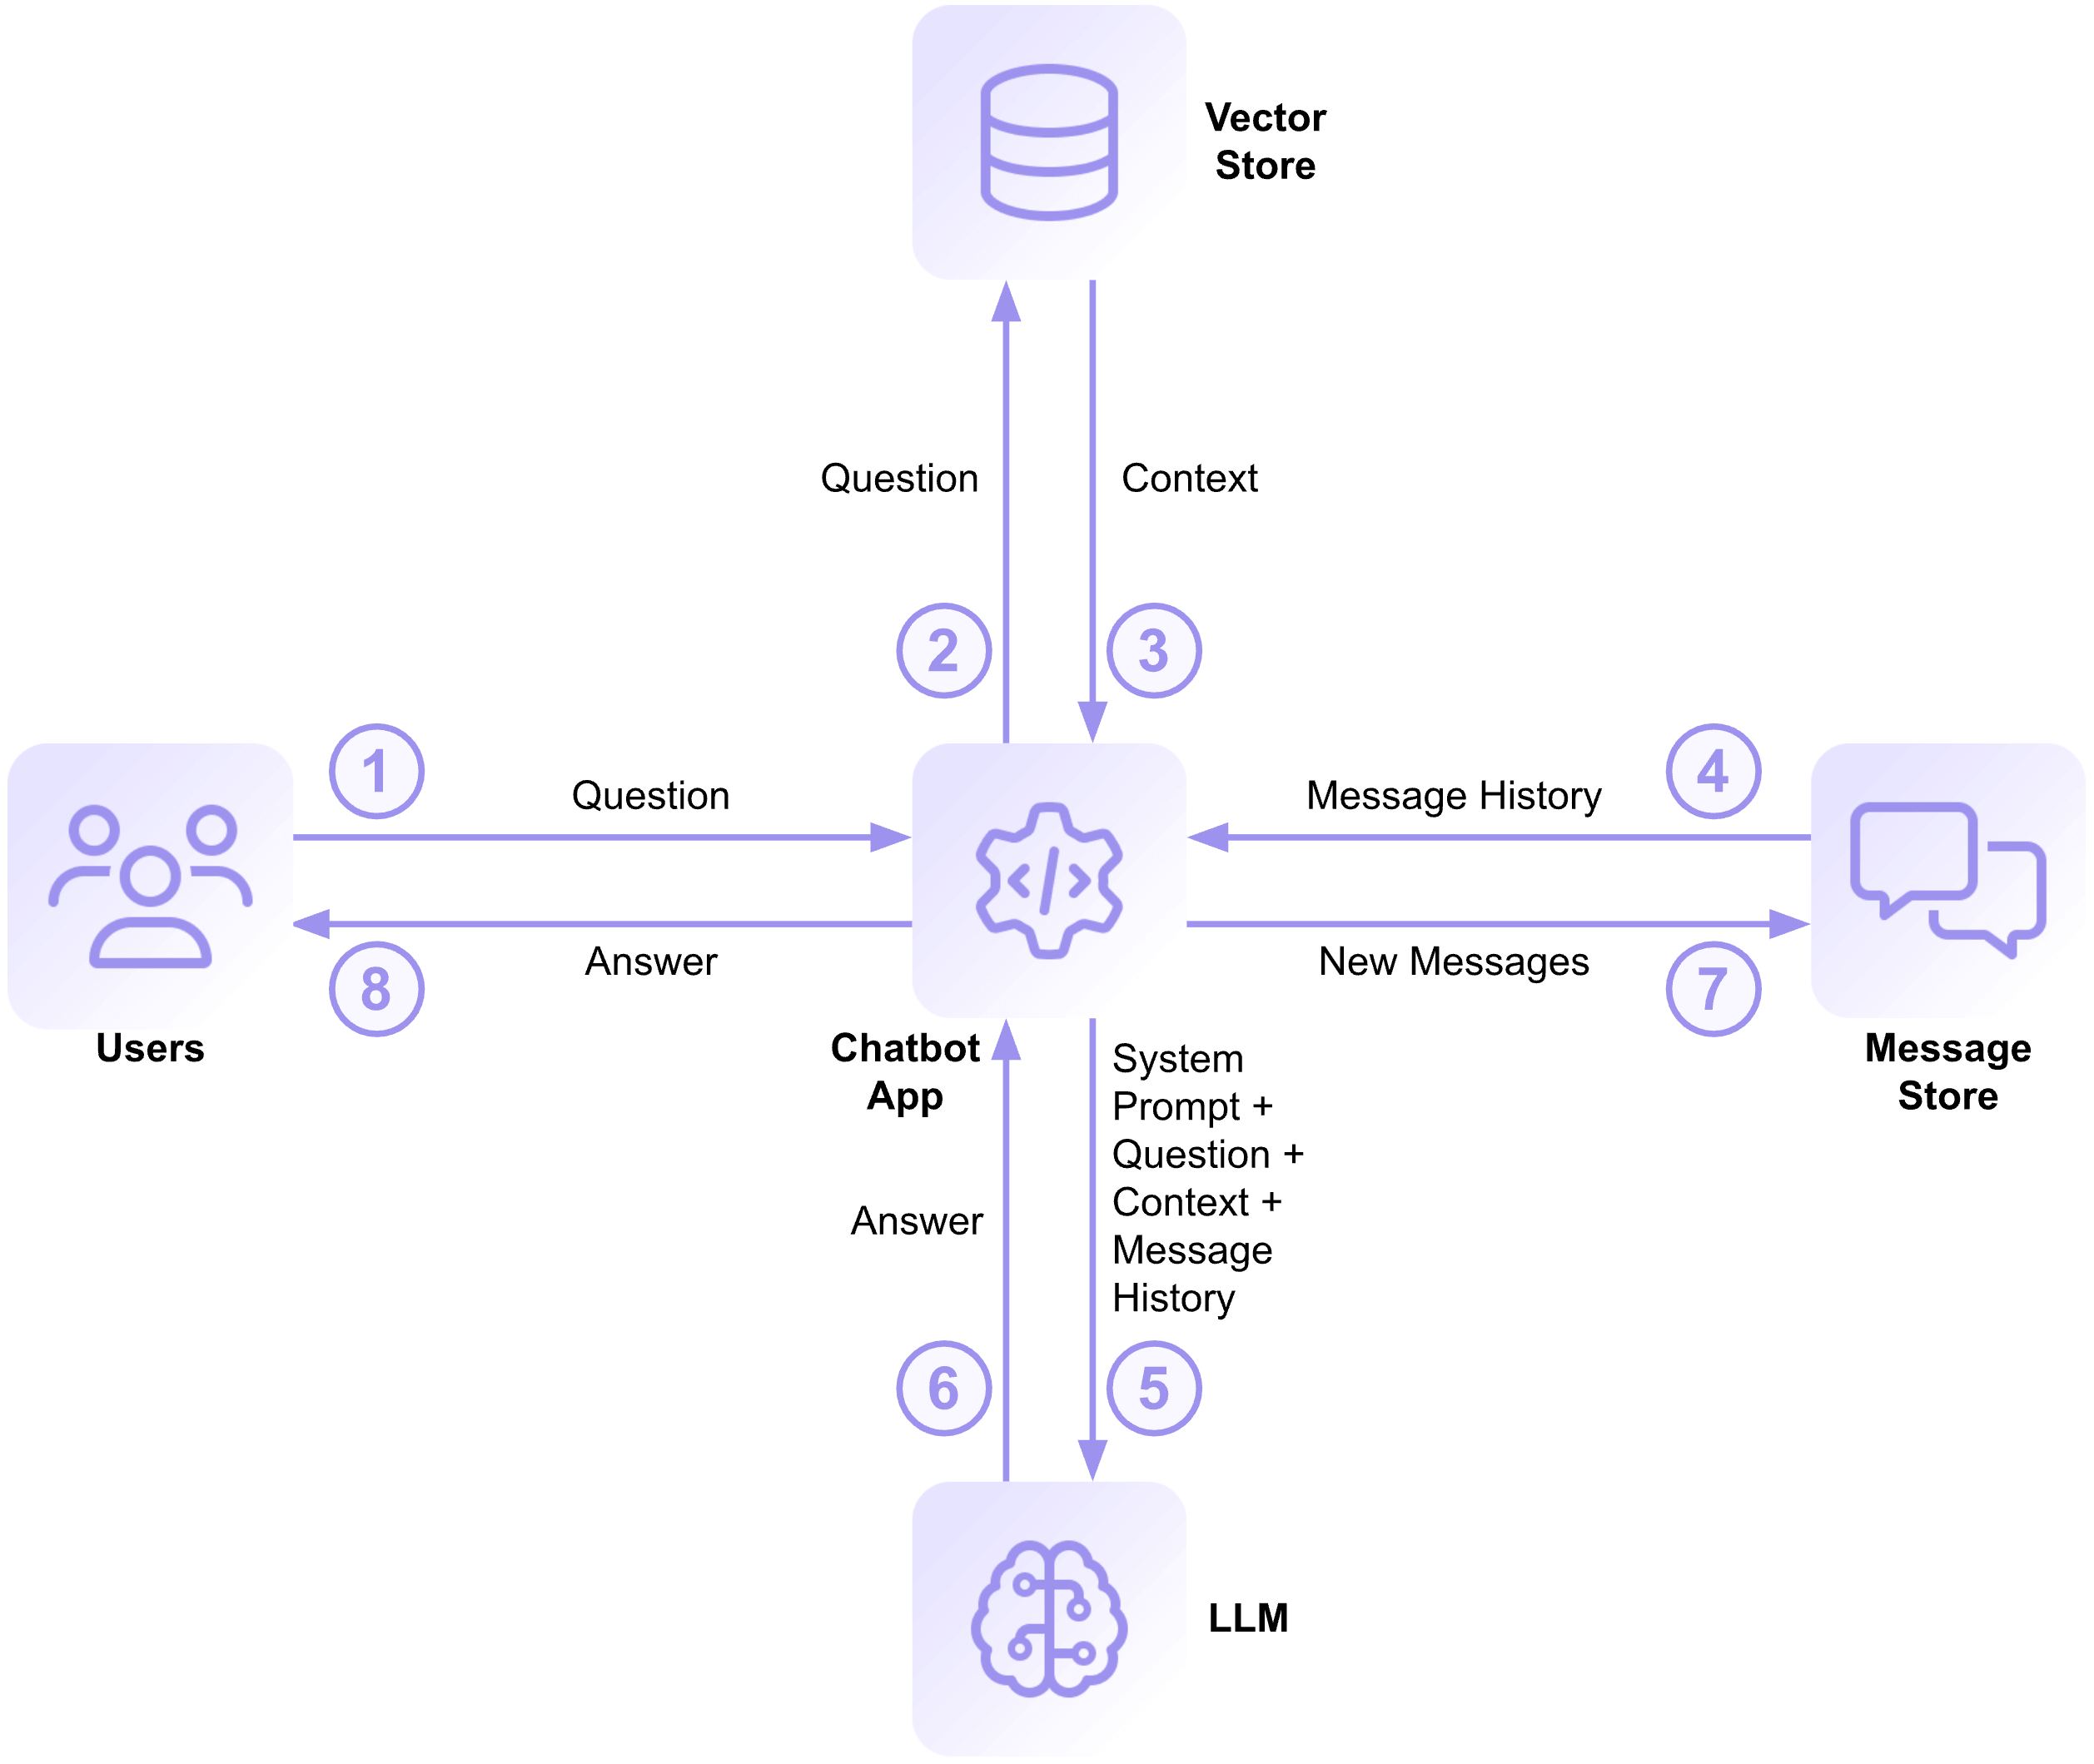
Given a question from the user (1), the RAG app can query the vector store for chunks of text that are similar to the question (2). This will be the context that helps the LLM answer the user’s question. Here’s a concrete example using the Backblaze documentation collection: Given the question, “Tell me about object lock,” the vector store returns four document chunks, each of about 170 words, to the app (3). Here is a link to the text of, and a short extract from, each chunk:
Object Lock: With Object Lock Legal Hold, files are prevented from being changed or deleted, but the immutability does not have a defined retention period.
Object Lock: You can enable Object Lock on a bucket when you create a new bucket or on an existing bucket.
Object Lock: Object Lock in Backblaze B2 was designed with the Immutability feature in Veeam Backup & Replication in mind.
Enable Object Lock with the S3 Compatible API: To enable Object Lock on an existing S3 compatible bucket, add the x-amz-bucket-object-lock-token header with a value of 1 to the S3 Put Object Lock Configuration API call.
Unsurprisingly, three of the four results are extracts from the main documentation article on Object Lock.
In order to provide a conversational experience, the RAG app maintains a chat history in a message store. The RAG app retrieves the message history (4) to form part of the query it will send to the LLM.
A system prompt sets the guidelines for the LLM to generate responses. In a RAG, the system prompt typically specifies that the response should be based on retrieved document data rather than model memorization, and attempts to prevent hallucinations by ensuring that the model does not fabricate information if no relevant documents are found. Here is the system prompt from the RAG app:
Use the following pieces of context and the message history to answer the question at the end. If you don't know the answer, just say that you don't know, don't try to make up an answer.
The RAG submits the system prompt, the context, the last few messages in the conversation, and the user’s question to the LLM (5), which generates a, hopefully useful, response (6). Here’s the answer it provided to the above question:
Object Lock is a feature that allows users to enforce immutability on files stored in cloud storage, specifically in services like Backblaze B2 and AWS S3. Here are the key points about Object Lock:
Immutability: Once a file is locked, it cannot be modified or deleted until a specified retention period expires or a legal hold is lifted.
Retention Periods: Users can set a retention period when locking a file. During this time, the file remains immutable, meaning it cannot be changed or deleted.
Legal Hold: Users can place files under a legal hold, which prevents modifications or deletions indefinitely until the hold is removed.
Enabling Object Lock: Object Lock can be enabled for new buckets or existing ones, but it must be turned on at the bucket level before files are uploaded.
Integrations: Some applications, like Veeam Backup & Replication, offer built-in support for Object Lock, making the process easier for users when they want to ensure file immutability during backups.
No Extra Cost: There is no additional fee for using Object Lock; however, standard storage charges for the locked files still apply.
Mistakes in Locking: If a user locks a file for longer than intended, they may need to contact support to resolve the situation, which could involve closing their storage account in some cases.
Overall, Object Lock is a crucial feature for organizations that need to ensure data integrity and compliance with regulations concerning data retention.
The RAG app adds the user’s question and the LLM’s response to the message store (7), returns the answer to the user (8), and awaits the next question.
A quick tour of the sample app
The sample app is on GitHub at https://github.com/backblaze-b2-samples/ai-rag-app. The app is open source, under the MIT license, so you can use it as a basis for your own experimentation without any restrictions. The app was originally written to demonstrate RAG with Backblaze B2 Cloud Storage, but it works with any S3 compatible object store.
The README file covers configuration and deployment in some detail; in this blog post, I’ll just give you a high-level overview. The sample app is written in Python using the Django web framework. API credentials and related settings are configured via environment variables, while the LLM and vector store are configured via Django’s settings.py file:
# Change source_data_location and vector_store_location to match your environment # search_k is the number of results to return when searching the vector store DOCUMENT_COLLECTION: CollectionSpec = { 'name': 'Docs', 'source_data_location': 's3://blze-ev-ai-rag-app/pdfs', 'vector_store_location': 's3://blze-ev-ai-rag-app/vectordb/docs/openai', 'search_k': 4, 'embeddings': { 'cls': OpenAIEmbeddings, 'init_args': { 'model': "text-embedding-3-large", }, }, }
The sample app is configured to use OpenAI GPT-4o mini, but the README explains how to use different online LLMs such as DeepSeek V3 or Google Gemini 2.0 Flash, or even a local LLM such as Meta Llama 3.1 via the Ollama framework. If you do run a local LLM, be sure to pick a model that fits your hardware. I tried running Meta’s Llama 3.3, which has 70 billion parameters (70B), on my MacBook Pro with the M1 Pro CPU. It took nearly three hours to answer a single question! Llama 3.1 8B was a much better fit, answering questions in less than 30 seconds.
Notice that the document collection is configured with the location of a vector store containing the Backblaze documentation as a sample dataset. The README file contains an application key with read-only access to the PDFs and vector store so you can try the application without having to load your own set of documents.
If you want to use your own document collection, a pair of custom commands allow you to load them from a Backblaze B2 Bucket into the vector store and then query the vector store to test that it all worked.
First, you need to load your data:
% python manage.py load_vector_store
Deleting existing LanceDB vector store at s3://blze-ev-ai-rag-app/vectordb/docs
Creating LanceDB vector store at s3://blze-ev-ai-rag-app/vectordb/docs
Loading data from s3://blze-ev-ai-rag-app/pdfs in pages of 1000 results
Successfully retrieved page 1 containing 618 result(s) from s3://blze-ev-ai-rag-app/pdfs
Skipping pdfs/.bzEmpty
Skipping pdfs/cloud_storage/.bzEmpty
Loading pdfs/cloud_storage/cloud-storage-about-backblaze-b2-cloud-storage.pdf
Loading pdfs/cloud_storage/cloud-storage-add-file-information-with-the-native-api.pdf
Loading pdfs/cloud_storage/cloud-storage-additional-resources.pdf
...
Loading pdfs/v1_api/s3-put-object.pdf
Loading pdfs/v1_api/s3-upload-part-copy.pdf
Loading pdfs/v1_api/s3-upload-part.pdf
Loaded batch of 614 document(s) from page
Split batch into 2758 chunks
[2025-02-28T01:26:11Z WARN  lance_table::io::commit] Using unsafe commit handler. Concurrent writes may result in data loss. Consider providing a commit handler that prevents conflicting writes.
Added chunks to vector store
Added 614 document(s) containing 2758 chunks to vector store; skipped 4 result(s).
Created LanceDB vector store at s3://blze-ev-ai-rag-app/vectordb/docs. "vectorstore" table contains 2758 rows
Now you can verify that the data is stored by querying the vector store. Notice how the raw results from the vector store include an S3 URI identifying the source document:
% python manage.py search_vector_store 'Which B2 native APIs would I use to upload large files?'
2025-03-01 02:38:07,740 ai_rag_app.management.commands.search INFO     Opening vector store at s3://blze-ev-ai-rag-app/vectordb/docs/openai
2025-03-01 02:38:07,740 ai_rag_app.utils.vectorstore DEBUG    Populating AWS environment variables from the b2 profile
Found 4 docs in 2.30 seconds
2025-03-01 02:38:11,074 ai_rag_app.management.commands.search INFO
page_content='Parts of a large file can be uploaded and copied in parallel, which can significantly reduce the time it takes to upload terabytes of data. Each part can be  anywhere from 5 MB to 5 GB, and you can pick the size that is most convenient for your application. For best upload performance, Backblaze recommends that you use the recommendedPartSize parameter that is returned by the b2_authorize_account operation.  To upload larger files and data sets, you can use the command-line interface (CLI), the Native API, or an integration, such as Cyberduck.  Usage for Large Files  Generally, large files are treated the same as small files. The costs for the API calls are the same.  You are charged for storage for the parts that you uploaded or copied. Usage is counted from the time the part is stored. When you call the b2_finish_large_file' metadata={'source': 's3://blze-ev-ai-rag-app/pdfs/cloud_storage/cloud-storage-large-files.pdf'}
...
The core of the sample application is the RAG class. There are several methods that create the basic components of the RAG, but here we’ll look at how the _create_chain() method brings together the system prompt, vector store, message history, and LLM.
First, we define the system prompt, which includes a placeholder for the context—those chunks of text that the RAG will retrieve from the vector store:
# These are the basic instructions for the LLM
system_prompt = (
    "Use the following pieces of context and the message history to "
    "answer the question at the end. If you don't know the answer, "
    "just say that you don't know, don't try to make up an answer. "
    "\n\n"
    "Context: {context}"
)
Then we create a prompt template that brings together the system prompt, message history, and the user’s question:
# The prompt template brings together the system prompt, context, message history and the user's question
prompt_template = ChatPromptTemplate(
    [
        ("system", system_prompt),
        MessagesPlaceholder(variable_name="history", optional=True, n_messages=10),
        ("human", "{question}"),
    ]
)
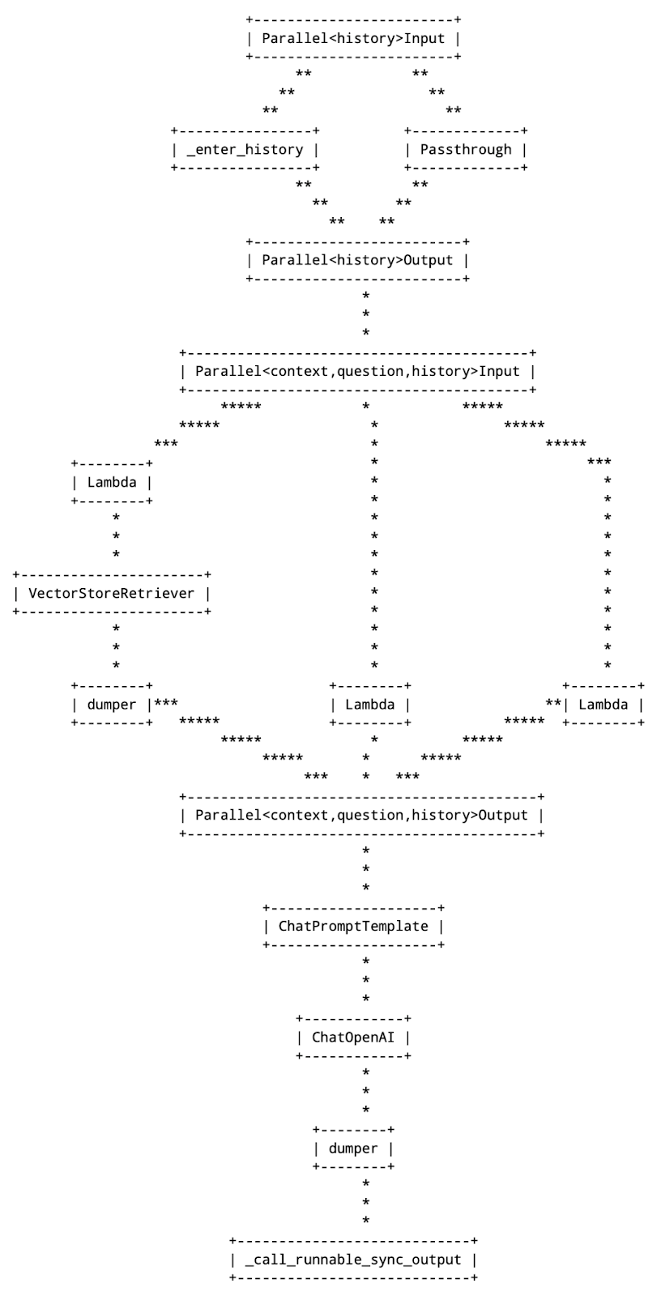
Now we use LangChain Expression Language (LCEL) to bring the various components together to form a chain. LCEL allows us to define a chain of components declaratively; that is, we provide a high-level representation of the chain we want, rather than specifying how the components should fit together.
Notice the log_data() helper method—it simply logs its input and passes it on to the next component in the chain.
# Create the basic chain
# When loglevel is set to DEBUG, log_input will log the results from the vector store
chain = (
    {
        "context": (
            itemgetter("question")
            | retriever
            | log_data('Documents from vector store', pretty=True)
        ),
        "question": itemgetter("question"),
        "history": itemgetter("history"),
    }
    | prompt_template
    | model
    | log_data('Output from model', pretty=True)
)
Assigning a name to the chain allows us to add instrumentation when we invoke it:
# Give the chain a name so the handler can see it
named_chain: Runnable[Input, Output] = chain.with_config(run_name="my_chain")
Now, we use LangChain’s RunnableWithMessageHistory class to manage adding and retrieving messages from the message store:
The input to the chain is a Python dictionary containing the question, while the config argument configures the chain with the Django session key and a callback that annotates the chain output with its execution time. Since the chain output contains Markdown formatting, the API endpoint that handles requests from the front end uses the open source markdown-it library to render the output to HTML for display.
The remainder of the code is mostly concerned with rendering the web UI. One interesting facet is that the Django view, responsible for rendering the UI as the page loads, uses the RAG’s message store to render the conversation, so if you reload the page, you don’t lose your context.
Take this code and run it!
The sample AI RAG application is open source under the MIT license, and I encourage you to use it as the basis for your own RAG exploration. The README file suggests a few ways you could extend it, and I also draw your attention to conclusion of the README if you are thinking of running the app in production:
[…] in order to get you started quickly, we streamlined the application in several ways. There are a few areas to attend to if you wish to run this app in a production setting:
The app does not use a database for user accounts, or any other data, so there is no authentication. All access is anonymous. If you wished to have users log in, you would need to restore Django’s AuthenticationMiddleware class to the MIDDLEWARE configuration and configure a database.
Similarly, conversation history is stored in memory, so you would need to use a persistent message history implementation, such as RedisChatMessageHistory to run the app in multiple processes or on multiple hosts.
Above all, have fun! AI is a rapidly evolving technology, with vendors and open source projects releasing new capabilities every day. I hope you find this app a useful way of jumping in.
If you’re responsible for managing cloud storage across a fast-growing company, you know the drill: more teams, more data, more buckets—and way more complexity. That’s why we’re launching a new enterprise web console, now entering private preview.
Built for scale, security, and simplicity, the new console gives you:
Centralized control over your organization’s cloud storage.
The ability to add multiple admins who each have their own credentials.
More flexibility in bucket creation, including the ability to create buckets in any region.
Built-in zero-trust security features like mandatory MFA and SSO support.
Whether you’re wrangling storage across departments or delivering managed services to clients, this is the command center that helps you move faster, stay secure, and keep everything organized. Because managing cloud storage shouldn’t be harder than using it.
What’s new in the enterprise web console?
The new web console gives IT admins and managed service providers (MSPs) a clean, central hub for managing B2 Cloud Storage deployments—whether you’ve got a few buckets or a few thousand. Here’s what’s under the hood:
Role-based access controls (RBAC): Assign authorized admin users and utilize a resource group architecture so people only access what they need. Great for zero trust—even better for peace of mind.
Mandatory MFA: Because “security optional” isn’t really an option anymore.
SSO and SCIM support: Manage your user base automatically and at scale.
We also revamped the user interface so it’s faster to navigate, easier on the eyes, and just generally gets out of your way.
Storage where you need it
With this update, you’ll be able to create and manage B2 Buckets in any available region. That unlocks a few big wins:
Ensuring data redundancy and disaster recovery through geographically distributed backup copies.
Optimizing application performance for global users by reducing data access latency.
Compliance with data residency rules.
Ready to get started?
We’re rolling out the enterprise console in private preview starting soon. If you’re a Backblaze customer with a committed contract, reach out to your Customer Success Manager to see if you’re eligible. Not sure who your CSM is? Email [email protected] for help.
General availability is coming later this year. Stay tuned—we’ll keep shipping.
Everyone’s chasing the next breakthrough in AI, pouring money into bigger models and faster chips. But there’s one innovation killer no one’s talking about, and it isn’t compute limits—it’s vendor lock-in.
While you’re optimizing your algorithms, your infrastructure is quietly draining your budget and tying your roadmap to someone else’s agenda. Open cloud providers help you create an ecosystem where data flows freely, innovation isn’t throttled, and every component works harmoniously to drive progress. Yet, for many organizations, vendor lock-in with hyperscalers costs more than just dollars: it comes at the expense of the freedom to innovate on your own terms.
Today, I’m talking through how AI organizations end up locked in with hyperscalers and how to avoid that trap.
Download the ebook
Struggling to keep AI storage costs under control? Download our free ebook to discover how to optimize cloud storage for AI workloads—without compromising performance.
The three pillars of AI infrastructure
At its heart, AI infrastructure rests on three essential pillars:
Compute: The engines powering your models and training processes.
Data management: The systems that capture, store, and organize the massive volumes of data your projects depend on.
Integration and flexibility: The ability to move data seamlessly between various platforms and cloud environments without being tied to a single provider.
When any of these pillars are compromised by vendor lock-in, the consequences are immediate and costly:
Can you freely move workloads between environments?
Are you paying premium prices for basic data transfers?
Is your team spending more time managing infrastructure than building innovative solutions?
These challenges directly hinder your team’s ability to deliver the AI breakthroughs your organization expects.
Understanding vendor lock-in
Vendor lock-in occurs when an organization becomes overly dependent on a single vendor’s products or services, making it difficult—or costly—to switch to alternative solutions. This dependency can manifest in several ways:
Proprietary technologies: When a vendor’s system uses exclusive formats or interfaces, integrating new tools becomes challenging.
Complex pricing: Long-term agreements with rigid terms and hidden fees may restrict flexibility and force you to absorb unexpected costs.
Ecosystem dependence: Relying on one provider’s suite of services can limit your ability to adopt innovative, best-of-breed solutions from other vendors.
In practice, vendor lock-in can hurt innovation by restricting your options, slowing down the pace at which you can adopt new technologies, and diverting resources to manage and maintain a closed system rather than driving creative breakthroughs.
The hidden costs of vendor lock-in
Imagine scaling your AI project only to discover, as Decart did, that egress fees essentially hold your data hostage. Their team needed to train models across multiple GPU clusters simultaneously—a scenario that would have incurred crippling costs with their previous provider. Or consider Grass Network, who found their ability to serve Fortune 1000 clients fundamentally undermined by their cloud vendor’s pricing structure, with egress and deletion fees that made their business model unsustainable at scale.
The pattern is clear: Organizations trapped in vendor-locked systems end up diverting precious resources—both financial and human—away from innovation and toward infrastructure management. This results in delayed training cycles, slower model iterations, and missed market opportunities as engineering talent gets consumed by working around limitations rather than building competitive advantages.
A holistic look at open AI infrastructure
While compute power and advanced analytics often grab headlines, the true strength of an AI system lies in the seamless integration of all its components. An open AI infrastructure can deliver:
Enhanced agility: With a flexible, multi-cloud approach, you can rapidly adopt new tools and technologies without being bound by a single provider’s limitations.
Optimized performance: When data flows effortlessly between compute clusters, storage systems, and analytics platforms, every part of your infrastructure can perform at its peak.
Cost efficiency: Transparent pricing and predictable billing ensure that hidden fees—like those associated with storage tiers and egress—don’t eat into your budget.
Future-proofing: By avoiding proprietary ecosystems, you build an infrastructure that is resilient and adaptable, giving you the freedom to experiment and innovate.
Rethinking storage as the strategic backbone
Among all the components, storage plays a uniquely critical role—it’s the circulatory system that keeps your data moving throughout the AI workflow. The right storage foundation doesn’t just warehouse data; it becomes a strategic asset that enables multi-cloud workflows, maintains cost predictability, and prevents vendor lock-in by allowing seamless integration with different compute engines, GPU clusters, and software platforms. Forward-thinking organizations are increasingly viewing storage not as a commodity, but as the linchpin of AI infrastructure strategy.
Backblaze B2: A foundation for multi cloud storage
Within this framework, Backblaze B2 serves as a robust storage foundation that transforms how AI teams approach multi-cloud workflows. Rather than trying to be everything to everyone, B2 Cloud Storage focuses exclusively on being the best at what matters most for your data: performance, scalability, and predictability.
It effortlessly scales from terabytes to petabytes, accommodating everything from raw training data to archived model outputs without performance degradation. S3 compatibility means it integrates easily with virtually any AI pipeline or tool. Perhaps most importantly, it keeps costs transparent and predictable with straightforward pricing that eliminates the “sticker shock” that plagues many AI projects.
A reliable, independent storage layer doesn’t just help you sidestep the pitfalls of vendor lock-in—it fundamentally changes how your team approaches innovation by removing the technical and financial barriers that traditionally constrain experimentation.
See the open cloud in action
Your company’s data is a powerful resource—learn how to harness it with an AI agent designed to generate meaningful insights. In this deep dive, Backblaze’s Pat Patterson and Jeronimo De Leon will demonstrate how to build an AI agent that can query, analyze, and generate insights from company-specific data—all powered by cost-efficient, scalable cloud storage.
Charting a new course for innovation
Breaking free from vendor lock-in isn’t merely about cutting costs—it’s about reclaiming control over your entire AI infrastructure and accelerating your path to results. When every component, from compute to storage and integration, is designed to be open and flexible, your organization gains the freedom to experiment, iterate, and push the boundaries of what’s possible.
The most successful AI teams we’ve observed are those building on strong, multi-cloud-friendly foundations where data flows without friction or penalty. They’re the ones asking tough questions about their infrastructure choices today to ensure maximum flexibility tomorrow.
Welcome to the first Drive Stats of 2025. In case you missed it, the 2024 Drive Stats report was the last for long-time Drive Stats guru, Andy Klein, who is happily retired—off putting the “green” in greener pastures by working on his golf game. We–being Backblaze staff writer Stephanie Doyle and Chief Technical Evangelist Pat Patterson–are picking up where Andy left off, bringing you the metrics and analysis you know and love. Now, on to the numbers!
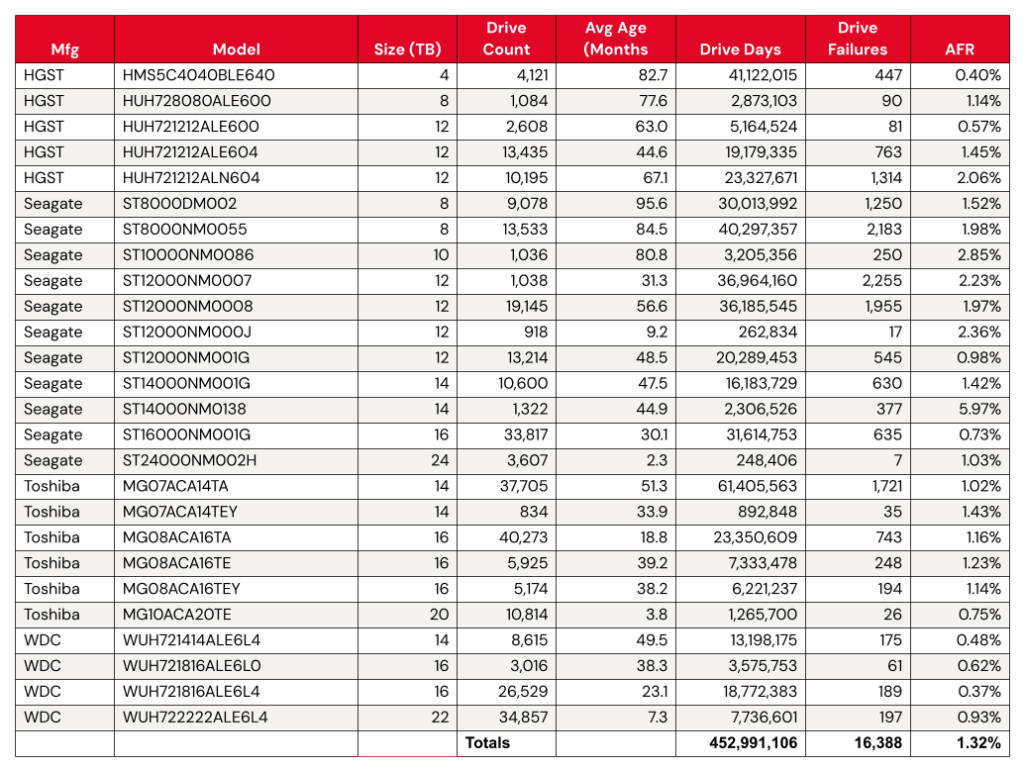
As of March 31, 2025, we had 312,831 drives under management. Of that total, there were 3,970 boot drives and 308,861 data drives. We’ll review their annualized failure rates (AFRs) as of Q1 2025, and we’ll dig into the average age of drive failure by model, drive size, and more. Along the way, we’ll share our observations and insights on the data presented and, this time around, we’ve got some exciting updates to share about how we produce Drive Stats. (Stay tuned, fellow Snowflake fans.)
As always, we look forward to your thoughts—we’ll see you in the comments section.
Sign up for the Drive Stats LinkedIn Live
Ready to dive deeper into the data? Tune in Thursday, May 15, 2025 at 10:00 a.m. PT, to query the new Drive Stats team, Stephanie Doyle and Pat Patterson. Feel free to drop us a line with any questions you want us to answer.
Q1 2025 hard drive failure rates
As mentioned above, at the end of Q1 2025, we were running 312,831 drives. During the quarter as a whole, however, we were monitoring a total of 318,426 drives; this count includes those that were taken out of service during the quarter, either because they failed or were only used temporarily.
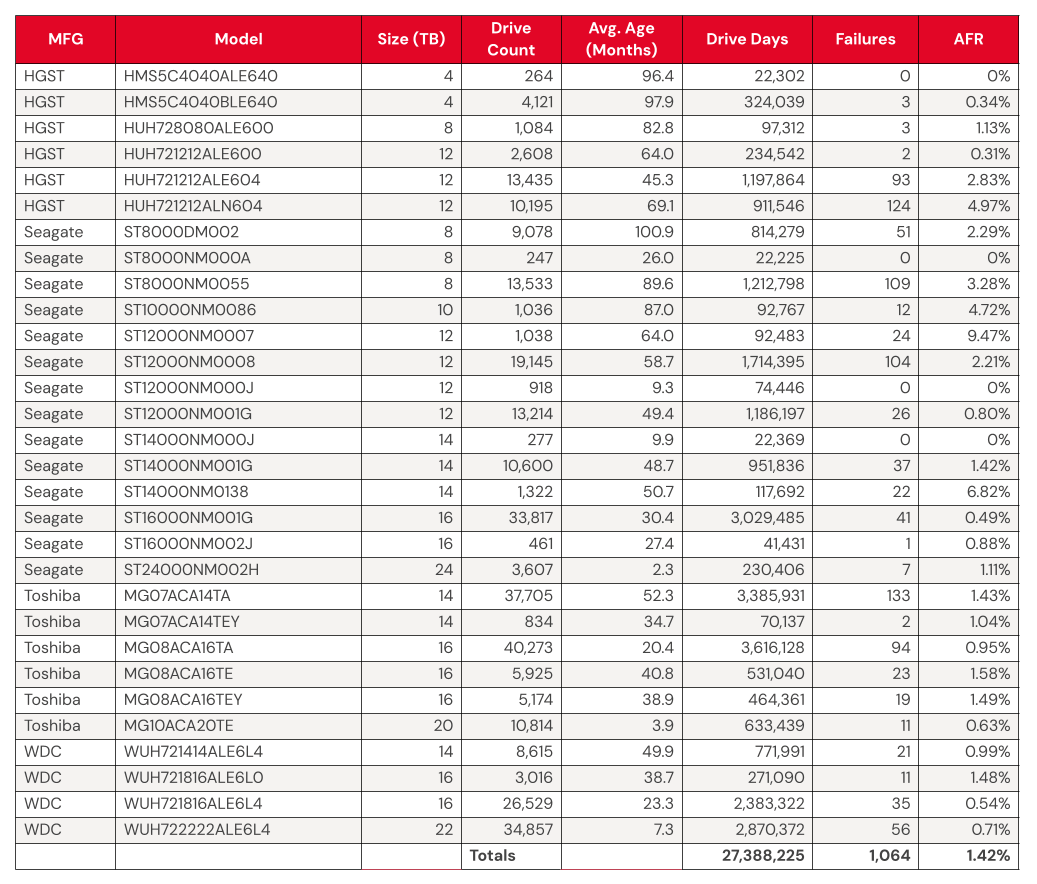
We’ll discuss the criteria we used in the next section of this report. Removing these drives leaves us with 317,833 hard drives to analyze. The table below shows the annualized failure rates (AFR) for Q1 2025 for this collection of drives.
Backblaze Hard Drive Failure Rates for Q1 2025
Reporting period January 1, 2025–March 31, 2025 inclusive Drive models with drive count > 100 as of March 31, 2025 and drive days > 10,000 in Q1 2025.
Notes and observations
The 4TB drives are hanging on and finishing strong. Good news: We have another quarter’s worth of data on our beloved 4TB drives (though the planned migration is well underway). True to their history, the 4TB drives showed wonderfully low failure rates, with yet another quarter of zero failures from model HMS5C4040ALE640 and 0.34% AFR from model HMS5C4040BLE640.
Keeping an eye on the 20TB+ pool. The 24TB Seagate (model ST24000NM002H) no longer has a perfect record, with eight failures for the quarter. Still, the drives put up a respectable 1.00% AFR. Meanwhile, the 20TB+ drives as a pool are averaging a 0.72% AFR, coming in lower than the overall failure rates—always a promising sign.
Zero failures for the quarter. Four drives get a gold star for zero failures this quarter:
The 4TB HGST (model HMS5C4040ALE640)
The Seagate 8TB (model ST8000NM000A)
Seagate 12TB (model ST12000NM000J)
Seagate 14TB (model ST14000NM000J)
Three out of the four also had zero failures last quarter, all but the Seagate 12TB.
The quarterly failure rate is slightly higher. The quarterly failure rate went up from 1.35% to 1.42%. As with the zero-failure club, our higher-end outlier AFRs show some of the usual suspects:
We noted earlier we removed 593 drives from consideration when we produced the table above covering Q4 2024. There are two primary reasons we did not consider these drive models.
Testing. These are drives of a given model that we monitor and collect Drive Stats data on, but are not considered production drives at this time. For example, drives undergoing certification testing to determine if they are performant enough for our environment are not included in our Drive Stats calculations.
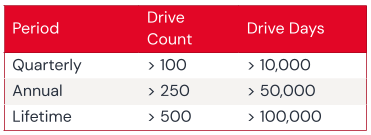
Insufficient data points. When we calculate the annualized failure rate for a drive model for a given period of time (quarterly, annual, or lifetime), we want to ensure we have enough data to reliably do so. Therefore we have defined criteria for a drive model to be included in the tables and charts for the specified period of time. Models that do not meet these criteria are not included in the tables and charts for the period in question.
Regardless of whether or not a given drive model is included in the charts and tables, all of the data for all of the drives we use is included in our Drive Stats dataset which you can download by visiting our Drive Stats page.
As with the Q4 quarterly results, we will apply these criteria to the annual and lifetime charts that follow in this report.
Lifetime hard drive failure rates
As of the end of Q1 2025, we were tracking 312,831 data hard drives. To be considered for the lifetime review, a drive model was required to have 500 or more drives as of the end of Q1 2025 and have over 100,000 accumulated drive days during their lifetime. When we removed those drive models which did not meet the lifetime criteria, we had 312,493 drives grouped into 26 models remaining for analysis as shown in the table below.
Backblaze Lifetime Hard Drive Failure Rates
Reporting period ending March 31, 2025 inclusive Drive models with > 500 drives and > 100,000 lifetime drive days
Notes and observations
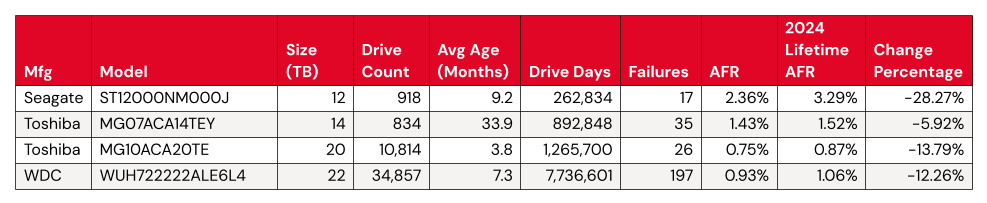
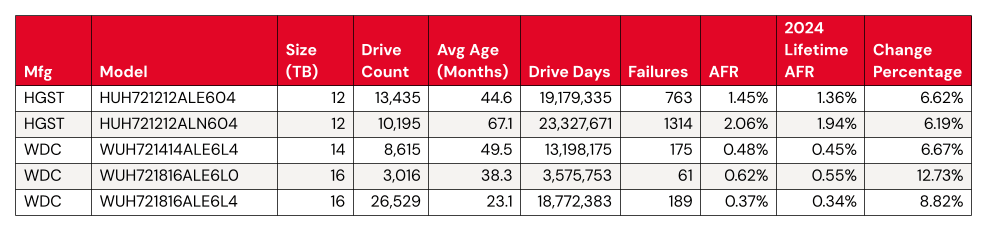
The lifetime AFR remains steady, despite some drives having significant change. We see virtually no change in our overall lifetime AFR, which we last tracked at 1.31% in the 2024 Year-End Drive Stats Report. But, with some drive models showing significant change in year-over-year AFR, it’s worth digging in a little deeper.
Statistically significant improved AFRs:
Both the 12TB and the 14TB had the same number of failures (or nearly so). Meanwhile, the Toshiba 20TB and WDC 22TB had more failures, but added a significant number of drives to the fleet. Both of these activities increase the number of drive days we tracked for the model’s drive pool, so these results are unsurprising.
Statistically significant worsened AFRs:
Meanwhile, we have a few things happening for the significantly worsened AFRs. The WDC drive models are all top performers from a failure perspective, even a change from .45 to .48 shows up in the numbers.
That leaves us with two HGST 12TB drives. Both come in above the average failure rate, at 1.45% (model: HUH721212ALE604) and 2.06% (model: HUH721212ALN604). We can give HUH721212ALE604 a pass—with the drive pool showing an average age of 67.1 months, or about five and a half years, it’s firmly on track with the expected pattern defined by the bathtub curve.
Where does that leave us with model HUH721212ALE604? We’ll keep an eye on it. Given that its AFR rate isn’t too far off from the total AFR of the Backblaze drive fleet, it’s not hugely concerning unless we see the rate of change continue.
What’s new with Drive Stats?
In taking on this report, our main focus was to ensure continuity with our decades-old dataset. That said, we also saw some opportunities to streamline the process of data collection, a continuation of the work that David Winings talked about in Overload to Overhaul: How We Upgraded the Drive Stats Data and Drive Stats Data Deep Dive: The Architecture. All of these things set us up for not just an easier time generating this report, but some bigger plans in the future. (We won’t tip our hand yet—but stay tuned.)
Drive Stats gets a Snowflake upgrade
When we first started tracking Drive Stats way back in 2013, data collection was very ad hoc. For the first few years, when Brian Beach was at the helm, we published stats once a year. When Andy took over in 2015, he moved to publishing quarterly data (starting in 2016). As the dataset grew, and Andy’s collection of lightweight desktop apps started to run out of steam, it became apparent that we needed to upgrade to more capable analytical tooling. For a variety of operational reasons, Andy was gamely running SQL queries against CSV data imported into a MySQL instance running on his laptop—and having to do a ton of manual data cleanup to boot. (Pun obviously intended.)
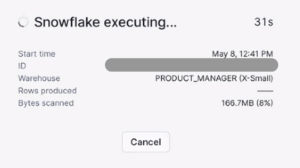
This year, with the help of our colleagues on the database engineering team (shoutout to Tom Roden—thanks so much!), we were able to get the Drive Stats data included in the Backblaze Snowflake instance. Gone are the days of us bugging folks for exports that take hours to process! We can run lightweight queries against a cached, structured table.
We started from Andy’s SQL queries and tweaked them a bit to match the logic and nomenclature of Snowflake fields. Once we had that worked out, the first thing we did was validate our methodology by running the Q4 Drive Stats numbers and comparing them to Andy’s—success.
It helps that Pat has experimented with our Drive Stats dataset in Trino and other analytical tools like Apache Iceberg, so it’s certainly not the first time he’s considered methodology and tooling for this problem. Going forward, we may further refine the process, but for now, the migration to Snowflake saved us a ton of time and manual data cleanup.
The Hard Drive Stats data
The complete dataset used to create the tables and charts in this report is available on our Hard Drive Test Data page. You can download and use this data for free for your own purpose. All we ask are three things: 1) you cite Backblaze as the source if you use the data, 2) you accept that you are solely responsible for how you use the data, and 3) you do not sell this data itself to anyone; it is free.
Good luck, and let us know if you find anything interesting.
When you’re moving exabytes of data, every network request, every CPU cycle, every byte matters. Recently, I had the chance to revisit a part of our system that’s been quietly humming along for years. With one small rethink, we helped give our download performance a serious boost.
The idea was almost laughably simple: combine two separate requests into one. But when you’re operating at massive scale, even a “simple” change can make a huge difference.
The challenge: Why we had 40 requests per download
Before the change, downloading a file meant:
A “download coordinator” pod would reach out across the 20 pods that make up a Vault to grab metadata.
Once it had those, it would figure out where the needed bytes lived.
Then it would go back and request the actual data.
That meant 40 separate requests just to get the ball rolling on every download.
The fix: Smarter reads with half the overhead
At some point, it clicked for me: why were we doing this in two steps? The original setup only pulled the bare minimum of data. But what if we just grabbed everything we needed at once? There wasn’t a good reason not to. So I refactored the process so that a pod could grab both the shard header and the data in a single request.
Now:
The coordinator still orchestrates the work.
The receiving pod reads the header, figures out what it needs, and pulls the data—all internally. By shifting this responsibility to the receiving pod, we eliminate a network round trip per pod—20 round trips in total.
The combined result is sent back to the coordinator in a single step.
After the fix, we’re still reading the same amount of data from disk, so disk I/O remains unchanged, but network performance improved significantly. Instead of kicking off 40 network operations, we’re down to about half that. Less traffic, less overhead, faster performance.
It was a simple fix, but the project required a significant amount of software engineering work as well. By shifting responsibilities to the “receiving pod” the coordinator needed to learn to perform lots of just-in-time reasoning about the nature of the download, which required rethinking how we architected portions of the download code.
Why it didn’t just instantly double download performance
If you’re thinking, “shouldn’t that make downloads twice as fast?”—not quite.
Here’s why: Big files get broken into “stripes” during download, and my change only optimizes the first stripe request. Smaller files (a big chunk of our traffic) see the full benefit because they often fit into a single stripe. For larger files, though, the improvement only affects a small part of the overall download, so the impact is more limited.
How we measured the impact
Measuring the real-world effect turned out to be trickier than I expected. Our download traffic isn’t steady; it’s spiky. Under normal conditions, our system wasn’t hitting capacity limits which made it hard to clearly see changes in download performance.
But in our dedicated performance testing environment, where we could send a controlled load of downloads, the improvement was crystal clear. With this change, our system could handle a much higher peak load—great news for handling things like backup surges, AI training runs, and large enterprise downloads.
Beyond download performance: System-wide benefits
One of the coolest side effects? This doesn’t just help customer downloads. It also speeds up internal operations like vault recomputing data drives and server-side copies.
By freeing up CPU cycles that used to be wasted on multiple requests, we open the door for better performance everywhere. And hey, maybe even some minor energy savings—less CPU load means less heat, less power.
What this taught me about optimization
When you’re trying to optimize a massive system, it’s tempting to chase performance with complicated solutions: more threads, smarter caches, fancier hardware.
But sometimes, the real win is just about thinking differently. Questioning assumptions. Asking, “Wait, why are we doing it this way?”
For me, this project was a great reminder that even at exabyte scale, the simplest solution can be the most impactful.
If you work with cloud storage and data lakes, you’re likely hearing the word “Iceberg” with increasing frequency, occasionally prefixed by “Apache”. What is Apache Iceberg, and how can you leverage it to efficiently store data in object stores such as Backblaze B2 Cloud Storage? I’ll answer both of those questions in this blog post.
But, first, join me on a brief trip back in time to the beginning of the twenty-first century, a long-ago time before the emergence of big data and cloud computing.
A timely shoutout to the Data Council conference
We recently attended the 2025 Data Council conference and caught Ryan Blue, co-creator of Apache Iceberg’s excellent presentation (featuring some very entertaining slides).
If you want to hear more about topics like this one, feel free to join us at Backblaze Weekly, an ongoing webinar series where we discuss all things Backblaze.
Ryan Blue speaking at the 2025 Data Council conference. Note: His shirt says “the future is open”. We agree!
CSV: The lingua franca of tabular data
In the early 2000s, if you were working with tabular data, you were likely using either a relational database management system (RDBMS), such as Oracle Database, or a spreadsheet, likely Microsoft Excel.
Data stored in an RDBMS is highly structured, meaning that it MUST conform to a predefined schema. For example, you might create an employee table with columns such as first name, last name, date of birth, hire date, and so on. The database schema holds metadata such as the name and data type of each column, whether that column must have a value, relationships between tables, and so on.
A spreadsheet, on the other hand, has some structure—data is arranged in rows and columns, similarly to an RDBMS–but each cell can contain anything: text, a number, a formula referencing other cells, even an image in today’s spreadsheets. We say that a spreadsheet is semi-structured data.
At the turn of the century, each database and spreadsheet had its own proprietary file format, optimized for its own requirements, and often not at all publicly documented, but the need to be able to exchange data between applications led to broad adoption of a file format to allow just that: comma-separated values, or CSV.
Here’s a simple example of some tabular data represented as CSV:
employee_id,first_name,last_name,reports_to,job_title,is_manager
1,Gleb,Budman,,CEO,1
123,Patrick,Thomas,1,"VP of Marketing",1
45,Yev,Pusin,123,"Head of Communications and Community",1
678,Pat,Patterson,45,"Chief Technical Evangelist",0
CSV is simple and flexible enough that it was easy for me to type that example up manually and import it into Microsoft Excel with no problems at all. Note that, as well as the commas, the double quotes in the CSV data are part of the file format, and do not appear in the imported data:
CSV has a lot of advantages: It’s simple; flexible; widely understood; the optional header line means that data can be somewhat self-describing; and it’s not controlled by any single vendor.
CSV does, however, also have a few disadvantages, including:
There’s no schema; nothing in that file expresses that the values in the first column, apart from the header, must be integers.
It’s difficult to represent complex or hierarchical datasets.
Data is stored as text, which is inefficient for numerical and repetitive data. Text representations of numbers occupy more storage than binary, and applications must convert them to binary when loading the file and convert them back to text when saving it.
Avro, Parquet and ORC: File formats for big data
The emergence of open-source distributed computing frameworks such as Apache Hadoop and, later, Apache Spark, in the first two decades of this century drove the creation and adoption of more efficient ways of storing tabular data. Avro, Parquet and ORC, all Apache projects, are binary file formats that address shortcomings of CSV, such as encapsulating schema alongside the data.
Avro, like CSV, is designed for row-oriented data, which makes it well-suited to use cases that involve appending new data to files. Parquet and ORC, in contrast, are column-oriented file formats, perfect for online analytical processing (OLAP) use cases where, for example, an application might read an entire column from a table to calculate the sum of its values. As well as storing numbers in a binary representation, Parquet and ORC can also reduce file size through compression strategies such as run-length encoding.
Here’s a concrete example: The Drive Stats data set for December 2024 occupies 3.7GB of storage in CSV format. As Parquet, the same data consumes just 242MB, a data compression ratio of more than 15:1.
Why does it matter if your dataset is smaller? Well, beyond just cost savings, which are amplified when dealing with huge datasets, smaller files mean that running queries against full datasets takes less time, which reduces server load, compute costs, and so on.
From file formats to table formats and data lakes
Apache Hadoop’s original use case was as an implementation of MapReduce, a programming model for manipulating large datasets. Engineers at Facebook, tasked with allowing SQL queries over datasets generated by Hadoop, created Apache Hive, and, with it, the Hive table format, which specified how to view a collection of files as a single logical table. The Hive table format in turn allowed organizations to create data lakes, repositories that store structured and semi-structured data in their original format for analysis by a wide range of tools, and, later, data lakehouses, which aim to combine the benefits of data lakes and traditional data warehouses by storing structured data using data lake tools and technologies.
A key concept of the Hive table format is partitioning, a way of organizing files to reduce the amount of data that must be read to process a query. Taking the Drive Stats dataset as an example, we can partition the files by year and month, so that each file has a prefix of the form:
/drivestats/year={year}/month={month}/
For example:
/drivestats/year=2024/month=12/
With this partitioning scheme, a system processing a query for hard drive statistics for, say, December 12, 2024, need only retrieve files with the above prefix. You might be wondering, “Why not partition the data on day, also, to further reduce the number of files that must be retrieved?” The answer depends on the data volume and access patterns. It’s much more efficient to partition data into fewer large files than many small files, so overly granular partitioning can actually impair performance.
It’s worth mentioning that file formats and table formats are largely independent of each other. You can use Avro, Parquet, ORC, or even CSV files with the Hive table format.
While the Hive table format served the big data community well for several years, it had a number of shortcomings:
Every query incurs a file list (“list objects”, in S3 API terms) operation, which is particularly expensive with cloud object storage, both in terms of time and API transaction charges.
Deleting or modifying data typically implies rewriting an entire data file, even if only a single row was affected.
Hive can only partition datasets on columns that are in the table schema. For example, the Drive Stats data set includes a date column, so to use it with Hive, we had to create additional, redundant, year and month columns.
Any changes to the data schema or partitioning strategy require affected files to be rewritten, making schema evolution problematic, if not infeasible, for large datasets.
As a result, vendors and the broader big data community formed a number of projects to define new table formats to succeed Hive, including Apache Iceberg, Apache Hudi, and Delta Lake, a Linux Foundation project.
Iceberg‘s features allow it to be used to organize huge data sets, efficiently and flexibly:
Table metadata including the list of files that comprise a table is stored as JSON data alongside the data files, eliminating the need to run an expensive list object operation for every query.
Schema evolution allows you to add, drop, update, or rename columns.
Hidden partitioning decouples partitioning from the table schema. For example, you can partition data like the Drive Stats dataset by year and month based on the existing date values, without creating additional columns.
Partition layout evolution allows you to modify your partitioning strategy as data volume or access patterns change.
Time travel allows you to query table snapshots.
Serializable isolation provides atomic table changes, ensuring readers never see inconsistent data.
Multiple concurrent writers use optimistic concurrency, retrying to ensure that compatible updates succeed while detecting conflicting writes.
Iceberg is widely supported across the big data ecosystem, with many applications and tools allowing you to store Iceberg tables in S3 compatible cloud object storage such as Backblaze B2. In this article, I’ll look at the simplest use case, running queries against the Drive Stats dataset, with three representative examples: Snowflake, Trino, and DuckDB.
Writing Iceberg data to Backblaze B2
I wrote a simple Python application, drivestats2iceberg, using the PyIceberg library, that converts the Drive Stats dataset from the zipped CSV files we publish to Parquet files in an Iceberg table stored in a Backblaze B2 Bucket. There are some useful techniques in drivestats2iceberg, and it is published on GitHub as open source, under the MIT license, so feel free to use it as a starting point for your own data conversion apps.
Querying Iceberg tables in Backblaze B2 from Snowflake
Snowflake is a data-as-a-service platform addressing a wide variety of use cases, including artificial intelligence (AI), machine learning (ML), collaboration across organizations, and data lakes.
As I mentioned above, Snowflake announced general availability of its Iceberg tables offering in June 2024, allowing you to manipulate Iceberg tables located on external volumes, outside your Snowflake warehouse, and query them alongside data in Snowflake-managed tables.
Snowflake’s Iceberg implementation is quite complicated, with different capabilities according to your choice of cloud object storage provider and whether you want Snowflake to manage your Iceberg catalog or use a catalog integration.
For our simple use case, where the Iceberg metadata and data files already exist in a Backblaze B2 Bucket, the first step is to create a Snowflake external volume, configuring it with suitable credentials and the location of the Drive Stats data.
Note: the application key shown in this Snowflake statement has read-only access to the drivestats-iceberg bucket. You can use it to query the Drive Stats data set from your own Snowflake instance or from other environments.
Next, you must create a catalog integration. The object store catalog integration simply reads Iceberg metadata from an external (to Snowflake) cloud storage location:
Now you can create an Iceberg table object that references the existing dataset. Note that Snowflake requires you to explicitly specify the metadata file to use for column definitions; this is typically the most recently created JSON file under the metadata prefix.
My x-small Snowflake warehouse executed the first three queries in a fraction of a second. As you might expect from its additional complexity, the last query took longer: 16 seconds.
Querying Iceberg tables in Backblaze B2 from Trino
To access the Drive Stats data set from Trino, you must configure its Iceberg connector with a catalog properties file. For example, to configure a catalog named drivestats_b2, create a file etc/catalog/drivestats_b2.properties:
Note that the above configuration file uses the same read-only credentials as the Snowflake example. You can use this configuration file as-is to explore the Drive Stats dataset using Trino.
Start the Trino server and CLI, then create a Trino schema with the location of the data, and set it as the default schema for subsequent queries:
CREATE SCHEMA drivestats_b2.ds_schema
    WITH (location = 's3://drivestats-iceberg/');
USE drivestats_b2.ds_schema;
The Trino Iceberg connector provides the register_table procedure for registering existing Iceberg tables into the metastore. Optionally, you can provide an additional metadata_file_name parameter if you wish to register the table with some specific table state, or if the connector cannot automatically figure out the metadata version to use.
Since you can query the table using the exact same SQL queries as in the Snowflake example, producing the exact same results, I won’t reproduce them here. Running Trino in a Docker container on my MacBook Pro, the first three queries executed in less than three seconds, the fourth took just over a minute.
Querying Iceberg tables in Backblaze B2 from DuckDB
DuckDB is an open-source column-oriented RDBMS, intended for in-process use: embedded in applications. There are DuckDB client APIs (also known as drivers) for many programming languages, including Python, Java, JavaScript (Node.js) and Go.
DuckDB is focused on the same kinds of use cases as Snowflake and Trino; it is effectively the OLAP equivalent to SQLite, which targets online transaction processing (OLTP) workloads.
To work with Iceberg tables in cloud object storage, you must install and load the httpfs and iceberg DuckDB extensions:
Now, you need to create a secret with your Backblaze B2 credentials.
Again, the application key shown here has read-only access to the Drive Stats dataset; you can use it to explore the data yourself if you like.
CREATE SECRET secret (
    TYPE s3,
    KEY_ID '0045f0571db506a0000000017',
    SECRET 'K004Fs/bgmTk5dgo6GAVm2Waj3Ka+TE',
    REGION 'us-west-004',
    ENDPOINT 's3.us-west-004.backblazeb2.com'
);
By default, queries against Iceberg tables in DuckDB use a SELECT ... FROM iceberg_scan(...) syntax, but you can define a schema and a view so that you can use the same SQL queries as with Snowflake and Trino:
First, a schema:
CREATE SCHEMA ds_schema;
USE ds_schema;
Then, a view:
CREATE VIEW drivestats AS
    SELECT *
    FROM iceberg_scan(
        's3://drivestats-iceberg/drivestats',
        version = '?',
        allow_moved_paths = true
    );
Note: the version = '?' parameter tells DuckDB to examine the table’s metadata files and “guess” which one corresponds to the latest version. This behavior is not enabled by default, so you must set unsafe_enable_version_guessing to true before you query the data, like this:
SET unsafe_enable_version_guessing = true;
That done, you can query the table using the exact same SQL queries as with Snowflake and Trino, with the exact same results. With DuckDB on my MacBook Pro, the first three queries took about 15–25 seconds; the fourth about 90 seconds.
Note that Snowflake, Trino and DuckDB are very different systems, with different trade-offs between cost, performance, and flexibility. I’ve included the execution times I saw to set your expectations when working with these tools, rather than as a point of comparison between them.
What’s next for Apache Iceberg?
Apache Iceberg is much more than a table format specification; it’s a broad, thriving ecosystem that is constantly innovating new features, tracking progress via its own GitHub repository. Here are a few technologies that are currently in active development:
Variant Data Type Support will offer a more efficient, versatile approach to managing hierarchical, JSON-like data, aligning with Apache Spark’s variant format.
Materialized Views will allow you to define a view as you usually would, in terms of a query against one or more existing views or tables, that is able to store data, like a table. On creation, the materialized view is populated with data and functions as a cache, serving its data in response to queries. The materialized view can be periodically refreshed to keep it in sync with its sources.
Geospatial Support will add Iceberg-native data types and operations storage and analysis of geospatial data, allowing you to define columns as points, lines and polygons, and use conditions such as “intersects” in queries.
I’ve only scratched the surface of Apache Iceberg in this blog post. Stay tuned for deeper dives into using Snowflake, Trino, DuckDB and more platforms and tools with the Iceberg table format and Backblaze B2 Cloud Storage.
If you’re wrangling massive datasets for AI, machine learning (ML), high-performance compute (HPC), content delivery networks (CDNs), or analytics, you’re familiar with the trade-off: Pay a premium for the highest speeds, or compromise on performance to keep costs manageable.
Backblaze B2 Overdrive changes that. You can now move exabyte-scale datasets at up to terabit speeds without the eye-watering price tag. Starting at $15 per terabyte per month, Backblaze B2 Overdrive gives you the power to run data-intensive workloads at peak performance, with unlimited free egress and private networking options that keep things fast, secure, and predictable.
See it in action
Join our upcoming webinar with Pat Patterson, Chief Technical Evangelist and Dave Ngo, Chief Product Officer, to learn more about how B2 Overdrive supercharges your data.
What makes B2 Overdrive different?
B2 Overdrive offers a specialized cloud object storage solution at a fraction of competitors’ costs. Here’s what you get:
Up to 1Tbps throughput: In other words, the kind of speed that lets you move petabytes of data fast without complex architecture.
Unlimited free egress: Move as much data as you want, whenever you want, to wherever you want. Egress is totally free.
Private networking support: Transfer data at maximum speed through secure private networking connections to your infrastructure.
It’s built on the foundation of our always-hot cloud storage infrastructure, with no minimum file size requirements, no deletion fees, and powerful features like Event Notifications so you can build responsive and automated workflows. We’ll be sharing some of the innovations under the hood in the coming months—so, stay tuned to our series on the engineering behind performance.
Who’s it for?
The simple answer: The status quo isn’t cutting it. Today’s workloads demand both the ability to move massive datasets and predictable economics that don’t penalize success. B2 Overdrive challenges the assumption that mind-bending performance has to come with mind-boggling prices.
We need to store an insane amount of data and, at the same time, download it to different GPU clusters around the world, and for all that to not cost an insane amount of money. That’s why we chose Backblaze.
—Dean Leitersdorf, CEO and Co-Founder, Decart
Ready to go?
Backblaze B2 Overdrive is generally available today for organizations with multi-petabyte storage instances and workloads.
Want to learn more or see if it’s the right fit for your team? Get in touch with our Sales team—we’d love to talk about how we can help you ditch the trade-offs and go full speed ahead.
You’ve always had insight into the buckets in your B2 Cloud Storage account, and now you can go deeper. With Bucket Access Logs, it’s possible to see a detailed record of operations performed against objects inside of a bucket. Whether you’re managing a growing archive, running audits, or troubleshooting automated workflows, these logs can provide the transparency needed to stay in control.
Starting today, Bucket Access Logs are available in limited preview. If you are interested, reach out to Support for more information.
What you can track with Bucket Access Logs
Once enabled, Bucket Access Logs record a range of operations performed on the objects in a bucket. That includes:
Every log entry includes details like the timestamp, operation type, and the object involved. If you’ve ever wished you had a record of what happened—and when—it’s now within reach.
Easy to configure: User interface (UI) and APIs
Bucket Access Logs are fully S3 compatible. You can configure logging through the Backblaze B2 web UI or programmatically via the S3 API using standard tools or SDKs. This makes it easy to integrate logging into your existing workflows and infrastructure without needing to learn anything new.
Because B2’s Bucket Access Logs are S3 compatible, your existing S3 log management tools will work seamlessly with B2 Logs. This allows you to use the same tools and processes you already have in place for monitoring, analyzing, and storing logs.
Important: Don’t enable access logging on the same bucket that you use as the log destination. This can result in an endless loop of logs generating more logs.
Once configured, you’ll begin to see new log objects arrive in the destination bucket as activity occurs in the source bucket. From there, you can analyze, archive, or pipe the data into other systems for further processing.
Preview: Configuring Bucket Access Logs in the UI
Here’s a preview of how you will be able to configure Bucket Access Logs via the user interface:
This simple, intuitive interface lets you easily configure your logging settings, choose a destination bucket, and start tracking operations on your objects. Once enabled, you’ll have access to the logs directly in the destination bucket, with the details you need to monitor and analyze your data access patterns.
Use cases for Bucket Access Logs
Bucket Access Logs unlock a broad set of security, privacy, and operational workflows. Here are just a few examples of how you can use them:
1. Security and privacy monitoring
Organizations storing sensitive data—like security footage, personal files, or customer assets—often need detailed audit trails for compliance and accountability.
Log object access activity through pre-signed URLs and correlate access with specific users.
Track access times, IP addresses, and user actions to meet reporting requirements or identify suspicious behavior.
Detect potentially compromised application keys by analyzing activity patterns without disrupting all keys in use.
Enforce privacy policies by monitoring the source IP addresses of requests and verifying they match allowed sources.
Analyze latency and bandwidth metrics across object access requests to optimize data delivery.
2. Infrastructure and traffic control
When storage access is tightly integrated with content delivery networks (CDNs) or other network layers, it’s important to confirm that traffic flows through the correct paths.
Validate that object uploads originate only from approved CDNs or endpoints, not directly from unauthorized sources.
Detect misconfigurations early by comparing traffic origins to expected network patterns.
3. Usage tracking and audit trails
Understanding how data moves through your system can help with cost management, client reporting, and internal transparency.
Monitor object uploads and deletions that impact billing to better forecast and control storage costs.
Maintain a historical record of object activity for clients or partners who require verifiable data access trails.
Troubleshoot issues in automated workflows by reviewing the sequence of operations on specific objects.
Across these use cases, a common thread emerges: the need to know when, what, and where for activity happening inside your buckets.
Get started with Bucket Access Logs
Bucket Access Logs are available today in preview. To try it out, contact Support for more information.
For more detailed instructions and guidance on configuring and using Bucket Access Logs, check out the official Bucket Access Logs documentation.
Whether you’re building for compliance, monitoring security, or just want better observability into your workflows, Bucket Access Logs give you the visibility you need—right where your data lives.
When you’re operating a data storage platform at exabyte scale, even small inefficiencies become big problems. With billions of files flowing through our systems, performance isn’t something we think about after the fact—it’s something we constantly chase, measure, and optimize.
But before you can improve cloud performance, you have to know where to look. When we were working on improving small file uploads, I was tasked with taking a closer look at our file upload pipeline to see if we could make it faster.
The path from that general idea to hitting a clear performance goal taught me a lot—not just about our systems, but about how to approach performance work in a principled, strategic way. Here’s how it unfolded, and what you can apply to your own environment.
Step one: Define the problem
The initial ask from our Product team was pretty familiar: “Can we make uploads faster?” It’s a fair question, but not a very actionable one. So we worked with our Product team to define our success criteria. Here are some of the questions we asked to get to specific, actionable goals:
“What do we mean by faster? Do we want to improve latency or throughput?”
“Do we want to improve all uploads? Just big files? Just small files? “What qualifies as a small upload?”
After some back and forth, we landed on a clear, measurable target: Process file uploads of 1MB or less via our B2 API in under 40 milliseconds. That specificity made a huge difference:
With a goal of 40 milliseconds, we had a stopping point. We would know when we’d done enough.
We had a bar to measure against and a way to identify what was worth optimizing. If something took two milliseconds, we could leave it alone. If it took 30, it became the focus.
We could scope effort. There’s a big difference between getting something under 40 milliseconds versus 200.
Step two: Use the right tools for the job if you possibly can
Analyzing performance without proper tooling means doing a lot of heavy lifting by hand. We had to drop custom instrumentation throughout the stack, create metric-collecting objects, and pass them all the way down the call stack so we could get timing data from different parts of the upload path.
The upload flow touches more than 20 storage pods and services, so we also built a lightweight sampling system to keep from flooding our metrics pipeline. The data went into an open-source search and analytics suite, and from there we built dashboards to try to make sense of it all.
It was time-consuming. Painfully so. But it worked.
I could now compare fast and slow uploads, identify patterns, and—most importantly—see where time was actually being spent. That’s how we discovered that fsync was dominating our performance profile, captured in the screenshot below. We measured each sub-operation that comprises our drive write operations, and grouped them by the total time they took to complete. You can see the process fsync sub-operation dominates in every group. Removing or optimizing around it offered a 10x speedup. But it took weeks of manual effort to get to that insight.
Drive write operations grouped by the time they took to complete.
Enter: Tracing at scale
Eventually, we brought in more powerful tooling, including an open source distributed tracing system. It was a game changer.
What used to take dozens of lines of code and a lot of custom wiring now took a single annotation. More importantly, it gave us something we couldn’t get otherwise: a way to see activity across services, systems, and pods—all in one view.
It allowed us to correlate events happening across different physical machines, trace performance end-to-end, and understand the impact of specific changes in real time.
At one point, we were debating whether a particular optimization would get us across the finish line. This optimization allows the slowest shard to store asynchronously if and only if all others had been successfully and durably stored. This prevents a single slow shard from slowing down the entire upload. Thanks to the new tooling, we didn’t have to guess—we could see that once we flipped the switch, we’d hit our 40ms goal (and it would help all other uploads as well, not just small uploads). That let us focus on getting that one feature ready for production, confident that it would move the needle.
Visualization demonstrating one of our upload optimizations, this time for a slower upload. The first 19 shards to complete were stored successfully and durably, so we stop waiting for the last shard, return a 200 status code to the customer (indicated by the dotted line), and allow the 20th shard to finish asynchronously.
Step three: Optimize with intent
One of the biggest lessons I learned through this process is that you can spend weeks optimizing the wrong thing if you’re not careful. That’s why measurement has to come first.
Don’t guess. Instrument. Don’t tweak randomly. Set a baseline and track deltas. Performance work is iterative. You’ll fix one bottleneck, only to reveal the next one lurking beneath it. That’s the job.
In hindsight, one of the smartest things we did was setting a clear performance goal at the start of the project. It didn’t just help us focus—it told us when we were done. You can optimize forever. Knowing when to stop is just as important as knowing where to begin.
Step four: Tool up for the future
The tracing tool has made life a lot easier, but it’s not the only tool we use. Our analytics suite still plays a big role when we want to analyze aggregate data, or need the flexibility to slice and dice data. The two complement each other nicely.
There’s no one-size-fits-all solution—it’s more like a toolbox. And like any good toolbox, it keeps growing with our needs.
Advice from the trenches
If you’re running distributed systems or chasing performance in your own stack, here’s what I’d suggest:
Start with a clear goal. Know exactly what “faster” means, and write it down.
Measure before you optimize. Otherwise, you’re flying blind.
Pick the right tool for the job. Tracing, metrics, logs—they all have their place.
Don’t wait to build your tools. Invest in observability early.
Know when to stop. The ROI of performance work diminishes fast if you’re not careful.
And maybe give your helper methods better names than DoSomeWork. Or don’t. It makes the code reviews a little more entertaining.
AI is rewriting the rules of technology, for better or worse. Arguably one of the most “for better and worse” areas? Ransomware. It’s a full blown billion dollar business, and AI is supercharging both the offense and defense.
Not only are we seeing AI give bad actors more sophisticated tools and campaigns to target business and consumers alike, we’re also seeing mitigation techniques and technologies deployed by good actors gain equally compelling AI-powered improvements.
In other words, welcome to the future—where your data is the hostage and the bots are negotiating. Let’s dig in.
Some stage-setting: How much is ransomware costing us?
Despite ransomware payments exceeding an eye-watering $1 billion in 2023—and despite some high profile attacks in 2024, one of which extracted $75 million from a single victim—ransomware attacks actually fell overall in 2024. High profile law enforcement activity, like those against LockBit and BlackCat contributed to a huge drop in the second half of 2024.
Don’t get too excited though: According to cryptocurrency tracing firm Chainanalysis, that still meant $814 million in 2024. And, the true cost of ransomware includes more than just payments extracted under threat.
The economic ripple effects of a ransomware attack can include losing C-level talent, having to lay off employees, and ongoing downtime or business closure. Industry-wide, cyber insurance is a growing industry, and 2024 saw a staggering 31% of claims come from third-party risk.
Perhaps most concerningly, ransomware attackers are increasingly using exfiltration as a tactic to double and triple extortion, even using exfiltration data to launch targeted distributed denial-of-service (DDoS) attacks. According to a Check Point’s 2025 Cyber Security Report, some new actors have emerged as exclusively “data-selling platforms,” hosting dedicated data leak sites (DLS) and negotiation platforms.
The good news
Machine learning (ML) tools have underpinned modern cyber security techniques for years now—with excellent results.
Sophisticated monitoring tools give us far more granular insights and alerts.
AI-driven behavioral analysis is making it easier to detect anomalies and preempt attacks before they escalate.
What does this mean for defending against ransomware attacks?
Enterprises now have access to security platforms that analyze network behavior in real time, flagging unusual access patterns or lateral movement before a full ransomware payload can deploy. These platforms rely on machine learning models trained on massive datasets of known attack vectors, which allows them to flag and quarantine suspicious activity with impressive accuracy.
The interesting thing is that common knowledge says that “the AI revolution” has been happening recently, and quickly. But, when it comes to cybersecurity defense, many tools have been using ML algorithms for at least two decades. Palo Alto Networks (WildFire), for example, has been using ML since 2003.
The line between “processing massive datasets and acting up on that info based on programmed parameters” and machine learning is subtle, but important. While the former follows set parameters, machine learning identifies patterns in data—sometimes with human guidance—to decide from multiple possible actions.
It’s like teaching an assistant a series of tasks they can eventually do on their own. When you think about the progression from basic automation to ML, AI, and deep learning, the shift from rule-based actions to autonomous, chained decisions starts to make a lot of sense.
Zero trust architecture, enhanced by AI, is also gaining momentum. Instead of relying on perimeter-based defenses, AI-enhanced systems enforce granular access controls and continuously verify user and device trust levels. In practice, what this means is that systems no longer assume that you are you on the other end—not without evidence. Combine this with real-time threat intelligence sharing and automated incident response, and enterprises can shorten the window between detection and mitigation drastically.
The bad news
Deep fakes are more convincing.
The ability to generate code means there are more attacks, and those attacks are more sophisticated and responsive.
Cyber criminals of all skill levels have access to more technical tools, including some that are specialized in malware.
Enterprises are adjusting to a new way of working, which can create vulnerabilities.
Generative AI, phishing, and deep fakes
The low-hanging fruit in this discussion is that it’s easy to use generative AI to create more convincing phishing attacks. In the past, bad grammar or non-localized language choices have been an easy way to quickly identify a phishing attack.
Assisted by generative AI, deep fakes of both the voice and video flavor are getting increasingly difficult to spot—so, while you know your CEO isn’t likely to text you to get a bunch of gift cards or send them company funds via Bitcoin or PayPal, you might believe a video of your CFO or a call from your CEO asking you to transfer funds to accounts that turn out to not be legitimate.
How is generated code being used by ransomware bad actors?
Just as generative AI models have made everyone a poet, they’re also widely used to generate code. Tools like GitHub Copilot have seen wide adoption amongst enterprises looking to generate and test code. Gartner reports that by 2027, 70% of professional developers will use AI-powered coding tools, up from less than 10% in 2023.
Given how AI code generation has made code generation easier on enterprises, it’s no surprise that the ransomware industry is following the same adoption trends. By January 2023, this had gone from a hypothetical to a reality, with ransomware bad actors of low levels of technical skill able to leverage LLMs to create malware scripts.
By July 2023, cybercriminals were already discussing WormGPT, a malicious chatbot trained on ChatGPT which removed standard guardrails against creating illegal or inappropriate content. And, cybersecurity protection firms had executed a proof of concept to demonstrate that AI could generate truly polymorphic code on the fly—a technique used to make it much easier to evade detection by antivirus programs. By July 2024, one study showed that ChatGPT 4 was able to exploit 87% of one-day vulnerabilities.
Couple that with the fact that ransomware bad actors have opposite success metrics vs. enterprises. Cyber criminals rely on enacting as many attacks as possible, and it only takes one of those attacks succeeding to see a significant upside. Enterprises, on the other hand, only need one failure to see a huge negative impact on their businesses.
What things can you implement to be ransomware ready?
Some of these recommendations are things that users can do on every platform they interact with, such as:
Creating good, strong, unique passwords, and preferably using a password manager: A good password manager reduces password reuse and helps ensure best practices are followed enterprise-wide.
Enabling multifactor authentication (MFA): Multi-factor authentication remains one of the strongest lines of defense, especially when paired with device verification and biometric options.
On the enterprise side of the house, frameworks like cyber resilience help teams protect data they’ve been entrusted with. And, AI-powered cyber security tools can be a powerful tool in any business’s toolbox. That can look like a number of different things, including:
Investing in AI-powered endpoint detection and response (EDR). These tools continuously monitor and analyze endpoint activities, flagging unusual behavior and isolating threats automatically.
Training teams on recognizing deep fakes and AI-enhanced phishing attempts. Security awareness training is evolving fast. Focused, frequent, and AI-aware sessions are critical for employees across departments.
Leveraging deception technology. Deploying decoy systems, fake credentials, and honeypots can help trap attackers early and gather valuable intel on their tactics.
Running tabletop simulations. Practicing breach scenarios—especially those involving AI-enabled threats—prepares teams to act decisively when seconds matter.
Cyber resilience isn’t static, and neither are the tools and tactics. One of the most important areas an enterprise can invest in is ongoing security and research. Enterprise leaders need to prioritize proactive measures. That means ongoing AI model audits, being nimble in response to new and changing best practices, and investing in cross-functional teams that bring together infosec, legal, and operational leadership.
The future of AI and ransomware
Let’s level with each other—separately, the AI and ransomware spaces are both changing quickly. When you combine AI and ransomware and try to define how they’re affecting each other, you’re on pretty slippery ground.
What we’re trying to do here is identify patterns that affect our everyday lives—but we’re also taking a peek at what folks are studying in the research realm, because quantum is just around the corner, and, frankly, too impactful to ignore.
So, tell us if we need an update, or if you have another opinion! The comments section is open and we’re happy to chat.
At Backblaze, we’re in the business of building a storage platform that can handle billions of operations a day—reliably, predictably, and fast. That means digging deep into low-level architecture, optimizing what most people overlook, and constantly balancing trade-offs between performance, cost, and scale.
Today, we’re kicking off a new blog series that showcases the platform-level work our Engineering team has been doing to build and run a modern cloud storage platform. The kind of work that usually stays buried in Jira tickets and internal docs, but that makes all the difference when you’re serving exabytes at scale.
What it really means to build a modern cloud storage platform
When people talk about cloud storage, they usually focus on capacity, availability, and price. This includes the systems, tools, and architectural decisions that enable our infrastructure to scale reliably while handling billions of operations per day.
We’re crafting a dynamic, evolving platform that handles exabytes of data with reliability and efficiency. We’re a platform that developers and businesses build on. That means durability, performance, uptime, and predictability aren’t just nice-to-haves—they’re fundamental requirements. As Senior Vice President of Engineering, I’m excited to pull back the curtain and offer a glimpse into the ongoing engineering efforts that power our platform.
Building for simple is more complex than it seems
One of our core engineering philosophies is this: Complexity should serve simplicity. For example, changing how we handle request headers might sound like a small thing, but when you operate a distributed system at scale, even tiny inefficiencies can multiply quickly. A 5% improvement in API response time might not sound dramatic, but at exabyte scale, that translates to millions of faster interactions per day, less CPU usage, and better customer experiences across the board.
Our Engineering team is always thinking about those compound effects. Sometimes that means rewriting parts of a system that have been stable for years. Other times it means saying no to flashy solutions and choosing battle-tested designs that will hold up under load.
Our goal, in addition to talking about the individual stories, is to start talking about some of the throughlines—when one project spawns another, or how we decide which project to pursue when there are competing priorities.
These projects don’t usually make headlines on their own, but taken together, they form the backbone of what makes Backblaze perform the way it does. They’ll become part of our regularly scheduled programming, and we’ll drop them in our Tech Lab category so you can find them easily.
Sign up for the Developer newsletter
Sign up for the Backblaze Developer Newsletter to receive a monthly roundup of articles and news for everyone developing on Backblaze B2 Cloud Storage.
See you on the next one—and let us know if you have questions
We’re proud of the work our engineers are doing, but more than that, we think it’s worth sharing. Whether you’re a fellow cloud architect, a developer using our platform, or just someone curious about what it takes to run cloud infrastructure at scale, we hope this series offers something insightful.
Technology doesn’t stand still, and neither do we. The more efficient our platform becomes, the better we can serve our customers—and the more we can invest in new ideas. So stay tuned. We’re kicking things off in this content series in the next few weeks, and we look forward to hearing your thoughts!
As the saying goes, no one ever got fired for using AWS—but we should revisit that truism. In the era of the open cloud, smart enterprise-level companies are leveraging best-of-breed cloud providers to reduce costs and enhance their cloud stack with specialists. What does that mean, practically speaking? The ability to reduce one of your biggest line item expenses by up to 80%.
As a CFO, I’m focused on strategically balancing operational expenses (OpEx) with a constant zero-based budgeting approach so my capital either fuels profitable growth or flows to free cash flows so I can drive shareholder value. Cloud storage, while essential, can be a significant cost center, and its billing structures often lack the transparency you need for effective financial management. My goal here is to demystify cloud storage costs, with a particular emphasis on the often-overlooked egress fees, and outline strategies for controlling these expenses.
Understanding the true cost of the cloud
The cost of cloud storage involves paying for data storage. However, the nuances of billing can vary significantly depending on usage patterns. We call an AWS bill a “cloud storage” bill, but it also includes a wide variety of configurable services, including compute, security, networking, analytics, database, and AI and machine learning (AI/ML) tools.
Consider a company that relies heavily on streaming media. Their primary cost driver is supporting a vast library of content for on-demand streaming. According to EY, cloud hosting for a typical software as a service (SaaS) company costs usually account for 6%-12% of revenue. For businesses with substantial video media assets, just storage expenses can consume a considerable portion of revenue. According to Coughlin and Associates, archiving and preservation accounts for the highest slice of cloud storage spending in the media and entertainment space.
Understanding your cloud bill is easier said than done
Crucial—but difficult to actualize. Cloud storage bills from providers like Amazon are so complex they’re regularly 40+ pages. According to a report from CloudZero, when asked how well they can attribute cloud spend to different aspects of their business (e.g., customers, products, features), 42% of respondents said they’re only able to give an estimate. Even worse, over 20% said they have little to no idea how much different aspects of their business cost.
This complexity has spawned an entire industry specialized in reducing cloud bills, and many enterprise companies have a job role dedicated to it. In my experience, even the best of those that occupy that job role have difficulty parsing the complexity.
Egress fees and other hidden charges: Unveiling the financial drain
While storage costs are relatively straightforward, it’s the hidden fees that can significantly impact the bottom line. Egress fees, incurred when data is transferred out of the cloud, are a prime example. These fees often lack transparency, making accurate budgeting and forecasting difficult. And, if you’re running applications in the cloud, you can’t avoid them: Users need to be able to move their data around. A recent survey indicated that 56% of IT professionals consider egress fees excessive, highlighting a widespread concern within the industry. At Backblaze, over 94% of our cloud storage customers were not charged any egress fees in 2024.
Beyond egress fees, other charges can further complicate cloud billing. These include minimum storage duration fees and tiered pricing models. I’ve seen firsthand how a lack of clarity can hinder financial planning. As I often say to my team, “We can’t optimize what we can’t understand.”
Overcoming cloud migration obstacles: A financial perspective
Given these cost considerations, exploring alternative cloud providers is a financially prudent strategy. I recognize that change can be perceived as disruptive. There’s often a concern about migration complexity and potential risks. Some organizations become so entrenched with a particular provider that they’re hesitant to consider alternatives, even when faced with substantial cost disadvantages in their steady-state cloud bills.
But, why the specific fear of cloud migration? There are always ways to manage the risk. In the grander scheme of IT and tech complexity, re-pointing an S3 standard API is considered an extremely low risk and low complexity effort. This is not like implementing a new ERP or data warehouse. It’s pretty straight forward, and your tech teams will have to make some time for a proof of concept and some testing.
The second big blocker is understanding who you are working with from a reputational and security standpoint. Data is the most precious asset for most companies nowadays. How long has the company been around? How many customers do they have? What is the net retention revenue (NRR)? Any history of cyber breaches? And which information security programs and certifications are in place?
Moving to the economics, the back-of-napkin math on the potential financial benefits of switching providers can be substantial. Reducing cloud storage costs directly impacts profitability. For example, if a video media company with storage costs representing 6% of revenue could cut those costs by 80%, that would translate to a 4.8% reduction in overall revenue costs. For a company with a 10% operating margin, this could increase it to 14.8%. That is a very substantial profitability improvement!
I have personally operated and advised companies with hyperscaler invoices from the likes of AWS ranging from $4 million to $7 million annually. Reducing those expenses isn’t just incremental improvement; it’s a game-changer. In some cases, the return on investment (ROI) from migrating to a more cost-effective solution, including reduced egress fees, can be realized in as little as one quarter.
Driving financial performance through cloud optimization
As CFOs, we have a responsibility to scrutinize cloud spending and ensure it aligns with our financial objectives. This requires a deep understanding of cloud billing models, particularly the impact of egress fees. By demanding transparency, rigorously evaluating alternatives, and embracing change, we can effectively manage cloud costs and enhance shareholder value. It’s imperative to foster a culture of agility within our organizations to facilitate necessary changes. The potential financial rewards are significant, and proactive cloud cost management is a key driver of improved financial performance.
Creating clear goals is inevitably part of any business strategy. You’ve likely heard of the acronym SMART—specific, measurable, actionable, realistic, and time-bound—when it comes to goal setting. As a business leader in information technology or a related business unit, you’re responsible for developing sound goals for business technology, data protection, and disaster recovery.
Two key metrics that feed into those strategies are your recovery time objective (RTO) and recovery point objective (RPO). Like all the other goals your business sets, the RTO and RPO should also be SMART goals.
So, how can you set meaningful RTO and RPO objectives for your business? And how can the cloud help you achieve or improve on those objectives? Today I’ll talk about how to smarten up these objectives to lead to better business continuity (BC) and a more effective disaster recovery (DR) plan.
The Essential Guide to Disaster Recovery Planning
Read more about how to build a disaster recovery plan for your organization.
Why do RTO and RPO matter?
RTO and RPO are two fundamental inputs to a comprehensive disaster recovery plan. They also very much guide how you’ll structure your backup strategy and engineer your backup architecture.
RTO is a business metric that states the maximum length of time a business can tolerate for recovery. It’s important to note the difference between recovery and restoration of data here. Restoring data is just one part of a recovery.
Recovery means systems are back up and running—fully functional—with users (employees, customers, etc.) able to utilize them in the same manner as before the data incident occurred.
RPO measures the maximum amount of data a company can afford to lose (or is willing to lose), measured in units of time. For instance, an RPO of 12 hours means that the company can accept the risk (financial risk, risk to the brand, etc.) of having lost 12 hours worth of data. So, if you run backups every 11 hours, you will be able to meet your RPO.
How to set RTO and RPO
Creating these objectives is a business decision—not an IT decision. If you’re an IT leader, your job is to work with your internal stakeholders to fully understand the business and the criticality of various applications and services in order to help define the RTO and RPO.
Put another way: The decision about what standard to meet is a shared responsibility. And those standards (recovery time, file durability, etc.) are the targets that IT and infrastructure providers teams must meet.
RTO and RPO may be different from one system to another. Some applications are more important than others.
Keep in mind that it’s likely that department heads will all say their services are the most important to immediately recover. But if everything is deemed critical, then nothing is.
Discuss how data loss and time to recovery impact the business in quantifiable details—revenue lost, number of customers affected, etc.—in order to truly prioritize systems and set appropriate RTOs and RPOs.
Making your RTOs and RPOs SMART
Remember that your objectives should be SMART:
Specific: Think through how granular your RTOs and RPOs should be. In addition to different RTOs and RPOs per application, you may also need different RTOs and RPOs per scenario. For example, the RTO for a ransomware attack is much different than that for hardware failure.
Measurable: One good way of measuring the efficacy of your RTOs and RPOs is by conducting DR testing. Run fire drills and conduct tabletop exercises. Practice restoring data. These inputs will help you understand if your objectives are meaningful and obtainable.
Actionable: Document your RTO and RPO in your DR plans and ensure they align with any business continuity risk management plans or goals around maximum allowable risk tolerance. You may also want to document the assumptions and inputs that formed the RTO and RPO. For instance, how much revenue is lost when a given system is down? Explain how that factor drives your RTO.
Realistic: Don’t let your stakeholders set unachievable objectives. If there is an ask for a very low RTO and/or RPO, help your stakeholder understand exactly what it will take—and how much it will cost—to implement that objective.
Time-bound: The RTO can be defined in seconds up to weeks. The shorter the RTO, the more expensive the investment will be to meet it.
Remember that you’re always balancing RTO and RPO against an unachievable “perfect” state. For instance, you would likely need multiple failover hot sites with replicated data to meet an RTO of seconds of downtime.
RTO is a forward-looking measurement; RPO is a backward-looking measurement that essentially represents the frequency of your backups.
A short RPO means more recent backup data is needed, and, yes, that also means greater investment. RPOs measured in seconds may require high-speed backup technology like continuous replication.
How to discuss RTO and RPO with business leaders
Discussing technical concepts with internal stakeholders can be challenging. To guide the objective-setting discussion with stakeholders, use the following questions as a guide:
Where and how do you store data?
How often does your data change?
What would a minute of downtime cost your department, in terms of revenue, risk, loss of productivity, impact to customers, etc.?
What are the compliance or industry requirements for maintaining sensitive data?
Do you have a way of manually transacting business if service is down?
Your IT department may already be well aware of many of these goals, but it’s good to do a fresh and full inventory of data and data management procedures. For example, even with the rise of shared drives, many employees still save important data locally. Or, there may be business-critical data being saved in services like Microsoft 365 or Kubernetes—and those services are often not adequately backed up.
How do RTO and RPO affect backup strategy?
Your RPO is often more directly related to backup strategy, although RTO certainly informs backup strategy. If you need a very low RPO (i.e., the business can tolerate very little data loss), you must plan to run backups more frequently. This ensures you always have very recent data to recover.
RTO, however, relates more to systems and infrastructure—again, because the objective is about recovery and not just restoring data. RTO will drive investment decisions around backup and DR architecture.
Your backup strategy or tech stack should not dictate either your RTO or your RPO.
First, you should define your RTO and RPO, and then you must determine if changes in backup policy are needed or if you need to update any backup systems in order to reach desired RTOs and RPOs.
Your RTO will drive decisions around backup and DR infrastructure; your RPO will drive decisions around frequency of backup and type of backup.
How does the cloud help companies meet RTO and RPO goals?
Using a public cloud for backup and archive can help you achieve your desired RTO and/or RPO. An obvious example is using cloud to replace LTO tape backup. Tape backup has some of the worst (maybe the worst) RTOs and RPOs. It takes an extraordinarily long time to recover from tape, and backups are likely not as frequent as they should be because tape is often not properly maintained. Migrating your tape backups to a public cloud like Backblaze B2 Cloud Storage is still cost-effective and it will drastically improve RTO and RPO.
If you’re using a hyperscaler like AWS, you may have had to cut back on frequency of backup or needed retention periods due to exorbitant fees. Shifting your backups to Backblaze B2 can help you achieve your goals: Backblaze B2 is one-fifth the cost of AWS S3, you can afford to run and save more frequent backups, thus lowering your overall RPO.
Replication is another technology that can help reduce RTOs. Many enterprise businesses will already have a failover site, but keeping an extra copy of your data in the cloud ensures you can still meet your desired RTO in the case of a DR site or production facility takeout. This is exactly what brought SaaS platform Centerbase to Backblaze.
More commonly, if it’s inordinately expensive to own your own DR site, you can store your backups in Backblaze B2 and utilize Cloud Replication for added redundancy.
RTO and RPO and your business
Ultimately, you should frame your RTO and RPO in terms of business impact. Then, reverse engineer your backup and DR infrastructure to support those objectives. Next, identify the storage systems for your data based on its business criticality and desired RTO and RPO.
Depending on your business goals, you’ll likely use cloud storage services, on-premises storage, or some combination of the two. Regardless of the type of business you run, demonstrating that you have an airtight DR plan with SMART RTO and RPO goals will instill confidence in your business partners, help with cyber insurance eligibility, and shore up your organization’s ability to withstand data disasters.
To provide the best experiences, we use technologies like cookies to store and/or access device information. Consenting to these technologies will allow us to process data such as browsing behavior or unique IDs on this site. Not consenting or withdrawing consent, may adversely affect certain features and functions.
Functional
Always active
The technical storage or access is strictly necessary for the legitimate purpose of enabling the use of a specific service explicitly requested by the subscriber or user, or for the sole purpose of carrying out the transmission of a communication over an electronic communications network.
Preferences
The technical storage or access is necessary for the legitimate purpose of storing preferences that are not requested by the subscriber or user.
Statistics
The technical storage or access that is used exclusively for statistical purposes.The technical storage or access that is used exclusively for anonymous statistical purposes. Without a subpoena, voluntary compliance on the part of your Internet Service Provider, or additional records from a third party, information stored or retrieved for this purpose alone cannot usually be used to identify you.
Marketing
The technical storage or access is required to create user profiles to send advertising, or to track the user on a website or across several websites for similar marketing purposes.