Tag Archives: reliability

Disaster recovery compliance in the cloud, part 1: Common misconceptions

Post Syndicated from Dan MacKay original https://aws.amazon.com/blogs/security/disaster-recovery-compliance-in-the-cloud-part-1-common-misconceptions/

Compliance in the cloud can seem challenging, especially for organizations in heavily regulated sectors such as financial services. Regulated financial institutions (FIs) must comply with laws and regulations (often in multiple jurisdictions), global security standards, their own corporate policies, and even contractual obligations with their customers and counterparties. These various compliance requirements may impose constraints on how their workloads can be architected for the cloud, and may require interpretation on what FIs must do in order to be compliant. It’s common for FIs to make assumptions regarding their compliance requirements, which can result in unnecessary costs and increased complexity, and might not align with their strategic objectives. A modern, rationalized approach to compliance can help FIs avoid imposing unnecessary constraints while meeting their mandatory requirements.

In my role as an Amazon Web Services (AWS) Compliance Specialist, I work with our financial services customers to identify, assess, and determine solutions to address their compliance requirements as they move to the cloud. One of the most common challenges customers ask me about is how to comply with disaster recovery (DR) requirements for workloads they plan to run in the cloud. In this blog post, I share some of the typical misconceptions FIs have about DR compliance in the cloud. In Part 2, I outline a structured approach to designing compliant architectures for your DR workloads. As my primary market is Canada, the examples in this blog post largely pertain to FIs operating in Canada, but the principles and best practices are relevant to regulated organizations in any country.

“Why isn’t there a checklist for compliance in the cloud?”

Compliance requirements are sometimes prescriptive: “if X, then you must do Y.” When requirements are prescriptive, it’s usually clear what you must do in order to be compliant. For example, the Payment Card Industry Data Security Standard (PCI DSS) requirement 8.2.4 obliges companies that process, store, or transmit credit card information to “change user passwords/passphrases at least once every 90 days.” But in the financial services sector, compliance requirements for managing operational risks can be subjective. When regulators take what is known as a principles-based approach to setting regulatory expectations, each FI is required to assess their specific risks and determine the mitigating controls necessary to conform with the organization’s tolerance for operational risk. Because the rules aren’t prescriptive, there is no “checklist for achieving compliance.” Instead, principles-based requirements are guidelines that FIs are expected to consider as they design and implement technology solutions. They are, by definition, subject to interpretation and can be prone to myths and misconceptions among FIs and their service providers. To illustrate this, let’s look at two aspects of DR that are frequently misunderstood within the Canadian financial services industry: data residency and geodiversity.

“My data has to stay in country X”

Data residency or data localization is a requirement for specific data-sets processed and stored in an IT system to remain within a specific jurisdiction (for example, a country). As discussed in our Policy Perspectives whitepaper, contrary to historical perspectives, data residency doesn’t provide better security. Most cyber-attacks are perpetrated remotely and attackers aren’t deterred by the physical location of their victims. In fact, data residency can run counter to an organization’s objectives for security and resilience. For example, data residency requirements can limit the options our customers have when choosing the AWS Region or Regions in which to run their production workloads. This is especially challenging for customers who want to use multiple Regions for backup and recovery purposes.

It’s common for FIs operating in Canada to assume that they’re required to keep their data—particularly customer data—in Canada. In reality, there’s very little from a statutory perspective that imposes such a constraint. None of the private sector privacy laws include data residency requirements, nor do any of the financial services regulatory guidelines. There are some place of records requirements in Canadian federal financial services legislation such as The Bank Act and The Insurance Companies Act, but these are relatively narrow in scope and apply primarily to corporate records. For most Canadian FIs, their requirements are more often a result of their own corporate policies or contractual obligations, not externally imposed by public policies or regulations.

“My data centers have to be X kilometers apart”

Geodiversity—short for geographic diversity—is the concept of maintaining a minimum distance between primary and backup data processing sites. Geodiversity is based on the principle that requiring a certain distance between data centers mitigates the risk of location-based disruptions such as natural disasters. The principle is still relevant in a cloud computing context, but is not the only consideration when it comes to planning for DR. The cloud allows FIs to define operational resilience requirements instead of limiting themselves to antiquated business continuity planning and DR concepts like physical data center implementation requirements. Legacy disaster recovery solutions and architectures, and lifting and shifting such DR strategies into the cloud, can diminish the potential benefits of using the cloud to improve operational resilience. Modernizing your information technology also means modernizing your organization’s approach to DR.

In the cloud, vast physical distance separation is an anti-pattern—it’s an arbitrary metric that does little to help organizations achieve availability and recovery objectives. At AWS, we design our global infrastructure so that there’s a meaningful distance between the Availability Zones (AZs) within an AWS Region to support high availability, but close enough to facilitate synchronous replication across those AZs (an AZ being a cluster of data centers). Figure 1 shows the relationship between Regions, AZs, and data centers.
 

Synchronous replication across multiple AZs enables you to minimize data loss (defined as the recovery point objective or RPO) and reduce the amount of time that workloads are unavailable (defined as the recovery time objective or RTO). However, the low latency required for synchronous replication becomes less achievable as the distance between data centers increases. Therefore, a geodiversity requirement that mandates a minimum distance between data centers that’s too far for synchronous replication might prohibit you from taking advantage of AWS’s multiple-AZ architecture. A multiple-AZ architecture can achieve RTOs and RPOs that aren’t possible with a simple geodiversity mitigation strategy. For more information, refer to the AWS whitepaper Disaster Recovery of Workloads on AWS: Recovery in the Cloud.

Again, it’s a common perception among Canadian FIs that the disaster recovery architecture for their production workloads must comply with specific geodiversity requirements. However, there are no statutory requirements applicable to FIs operating in Canada that mandate a minimum distance between data centers. Some FIs might have corporate policies or contractual obligations that impose geodiversity requirements, but for most FIs I’ve worked with, geodiversity is usually a recommended practice rather than a formal policy. Informal corporate guidelines can have some value, but they aren’t absolute rules and shouldn’t be treated the same as mandatory compliance requirements. Otherwise, you might be unintentionally restricting yourself from taking advantage of more effective risk management techniques.

“But if it is a compliance requirement, doesn’t that mean I have no choice?”

Both of the previous examples illustrate the importance of not only confirming your compliance requirements, but also recognizing the source of those requirements. It might be infeasible to obtain an exception to an externally-imposed obligation such as a regulatory requirement, but exceptions or even revisions to corporate policies aren’t out of the question if you can demonstrate that modern approaches provide equal or greater protection against a particular risk—for example, the high availability and rapid recoverability supported by a multiple-AZ architecture. Consider whether your compliance requirements provide for some level of flexibility in their application.

Also, because many of these requirements are principles-based, they might be subject to interpretation. You have to consider the specific language of the requirement in the context of the workload. For example, a data residency requirement might not explicitly prohibit you from storing a copy of the content in another country for backup and recovery purposes. For this reason, I recommend that you consult applicable specialists from your legal, privacy, and compliance teams to aid in the interpretation of compliance requirements. Once you understand the legal boundaries of your compliance requirements, AWS Solutions Architects and other financial services industry specialists such as myself can help you assess viable options to meet your needs.

Conclusion

In this first part of a two-part series, I provided some examples of common misconceptions FIs have about compliance requirements for disaster recovery in the cloud. The key is to avoid making assumptions that might impose greater constraints on your architecture than are necessary. In Part 2, I show you a structured approach for architecting compliant DR workloads that can help you to avoid these preventable missteps.

If you have feedback about this post, submit comments in the Comments section below.

Want more AWS Security how-to content, news, and feature announcements? Follow us on Twitter.
Author

Dan MacKay

Dan is the Financial Services Compliance Specialist for AWS Canada. As a member of the Worldwide Financial Services Security & Compliance team, Dan advises financial services customers on best practices and practical solutions for cloud-related governance, risk, and compliance. He specializes in helping AWS customers navigate financial services and privacy regulations applicable to the use of cloud technology in Canada.

Cloudflare and COVID-19: Project Fair Shot Update

Post Syndicated from Brian Batraski original https://blog.cloudflare.com/cloudflare-and-covid-19-project-fair-shot-update/

Cloudflare and COVID-19: Project Fair Shot Update

Cloudflare and COVID-19: Project Fair Shot Update

In February 2021, Cloudflare launched Project Fair Shot — a program that gave our Waiting Room product free of charge to any government, municipality, private/public business, or anyone responsible for the scheduling and/or dissemination of the COVID-19 vaccine.

By having our Waiting Room technology in front of the vaccine scheduling application, it ensured that:

  • Applications would remain available, reliable, and resilient against massive spikes of traffic for users attempting to get their vaccine appointment scheduled.
  • Visitors could wait for their long-awaited vaccine with confidence, arriving at a branded queuing page that provided accurate, estimated wait times.
  • Vaccines would get distributed equitably, and not just to folks with faster reflexes or Internet connections.

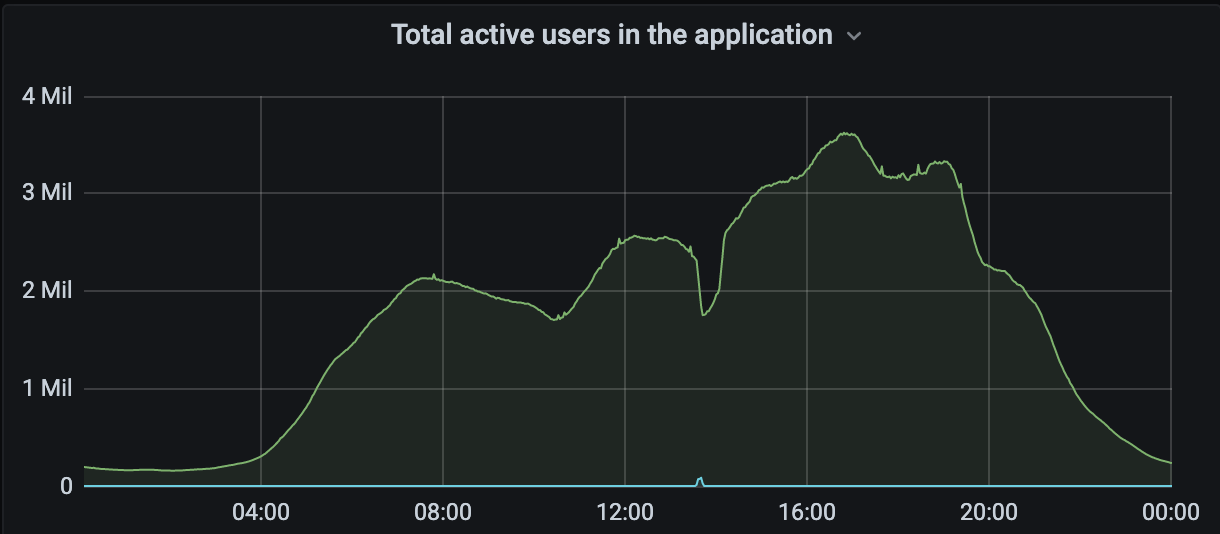
Since February, we’ve seen a good number of participants in Project Fair Shot. To date, we have helped more than 100 customers across more than 10 countries to schedule approximately 100 million vaccinations. Even better, these vaccinations went smoothly, with customers like the County of San Luis Obispo regularly dealing with more than 20,000 appointments in a day.  “The bottom line is Cloudflare saved lives today. Our County will forever be grateful for your participation in getting the vaccine to those that need it most in an elegant, efficient and ethical manner” — Web Services Administrator for the County of San Luis Obispo.

We are happy to have helped not just in the US, but worldwide as well. In Canada, we partnered with a number of organizations and the Canadian government to increase access to the vaccine. One partner stated: “Our relationship with Cloudflare went from ‘Let’s try Waiting Room’ to ‘Unless you have this, we’re not going live with that public-facing site.’” — CEO of Verto Health. In another country in Europe, we saw over three million people go through the Waiting Room in less than 24 hours, leading to a significantly smoother and less stressful experience. Cities in Japan, — working closely with our partner, Classmethod — have been able to vaccinate over 40 million people and are on track to complete their vaccination process across 317 cities. If you want more stories from Project Fair Shot, check out our case studies.

Cloudflare and COVID-19: Project Fair Shot Update
A European customer seeing very high amounts of traffic during a vaccination event

We are continuing to add more customers to Project Fair Shot every day to ensure we are doing all that we can to help distribute more vaccines. With the emergence of the Delta variant and others, vaccine distribution (and soon, booster shots) is still very much a real problem to keep everyone healthy and resilient. Because of these new developments, Cloudflare will be extending Project Fair Shot until at least July 1, 2022. Though we are not excited to see the pandemic continue, we are humbled to be able to provide our services and be a critical part in helping us collectively move towards a better tomorrow.

Automatic Remediation of Kubernetes Nodes

Post Syndicated from Andrew DeMaria original https://blog.cloudflare.com/automatic-remediation-of-kubernetes-nodes/

Automatic Remediation of Kubernetes Nodes

Automatic Remediation of Kubernetes Nodes

We use Kubernetes to run many of the diverse services that help us control Cloudflare’s edge. We have five geographically diverse clusters, with hundreds of nodes in our largest cluster. These clusters are self-managed on bare-metal machines which gives us a good amount of power and flexibility in the software and integrations with Kubernetes. However, it also means we don’t have a cloud provider to rely on for virtualizing or managing the nodes. This distinction becomes even more prominent when considering all the different reasons that nodes degrade. With self-managed bare-metal machines, the list of reasons that cause a node to become unhealthy include:

  • Hardware failures
  • Kernel-level software failures
  • Kubernetes cluster-level software failures
  • Degraded network communication
  • Software updates are required
  • Resource exhaustion1

Automatic Remediation of Kubernetes Nodes

Unhappy Nodes

We have plenty of examples of failures in the aforementioned categories, but one example has been particularly tedious to deal with. It starts with the following log line from the kernel:

unregister_netdevice: waiting for lo to become free. Usage count = 1

The issue is further observed with the number of network interfaces on the node owned by the Container Network Interface (CNI) plugin getting out of proportion with the number of running pods:

$ ip link | grep cali | wc -l
1088

This is unexpected as it shouldn’t exceed the maximum number of pods allowed on a node (we use the default limit of 110). While this issue is interesting and perhaps worthy of a whole separate blog, the short of it is that the Linux network interfaces owned by the CNI are not getting cleaned up after a pod terminates.

Some history on this can be read in a Docker GitHub issue. We found this seems to plague nodes with a longer uptime, and after rebooting the node it would be fine for about a month. However, with a significant number of nodes, this was happening multiple times per day. Each instance would need rebooting, which means going through our worker reboot procedure which looked like this:

  1. Cordon off the affected node to prevent new workloads from scheduling on it.
  2. Collect any diagnostic information for later investigation.
  3. Drain the node of current workloads.
  4. Reboot and wait for the node to come back.
  5. Verify the node is healthy.
  6. Re-enable scheduling of new workloads to the node.

While solving the underlying issue would be ideal, we needed a mitigation to avoid toil in the meantime — an automated node remediation process.

Existing Detection and Remediation Solutions

While not complicated, the manual remediation process outlined previously became tedious and distracting, as we had to reboot nodes multiple times a day. Some manual intervention is unavoidable, but for cases matching the following, we wanted automation:

  • Generic worker nodes
  • Software issues confined to a given node
  • Already researched and diagnosed issues

Limiting automatic remediation to generic worker nodes is important as there are other node types in our clusters where more care is required. For example, for control-plane nodes the process has to be augmented to check etcd cluster health and ensure proper redundancy for components servicing the Kubernetes API. We are also going to limit the problem space to known software issues confined to a node where we expect automatic remediation to be the right answer (as in our ballooning network interface problem). With that in mind, we took a look at existing solutions that we could use.

Node Problem Detector

Node problem detector is a daemon that runs on each node that detects problems and reports them to the Kubernetes API. It has a pluggable problem daemon system such that one can add their own logic for detecting issues with a node. Node problems are distinguished between temporary and permanent problems, with the latter being persisted as status conditions on the Kubernetes node resources.2

Draino and Cluster-Autoscaler

Draino as its name implies, drains nodes but does so based on Kubernetes node conditions. It is meant to be used with cluster-autoscaler which then can add or remove nodes via the cluster plugins to scale node groups.

Kured

Kured is a daemon that looks at the presence of a file on the node to initiate a drain, reboot and uncordon of the given node. It uses a locking mechanism via the Kubernetes API to ensure only a single node is acted upon at a time.

Cluster-API

The Kubernetes cluster-lifecycle SIG has been working on the cluster-api project to enable declaratively defining clusters to simplify provisioning, upgrading, and operating multiple Kubernetes clusters. It has a concept of machine resources which back Kubernetes node resources and furthermore has a concept of machine health checks. Machine health checks use node conditions to determine unhealthy nodes and then the cluster-api provider is then delegated to replace that machine via create and delete operations.

Proof of Concept

Interestingly, with all the above except for Kured, there is a theme of pluggable components centered around Kubernetes node conditions. We wanted to see if we could build a proof of concept using the existing theme and solutions. For the existing solutions, draino with cluster-autoscaler didn’t make sense in a non-cloud environment like our bare-metal set up. The cluster-api health checks are interesting, however they require a more complete investment into the cluster-api project to really make sense. That left us with node-problem-detector and kured. Deploying node-problem-detector was simple, and we ended up testing a custom-plugin-monitor like the following:

apiVersion: v1
kind: ConfigMap
metadata:
  name: node-problem-detector-config
data:
  check_calico_interfaces.sh: |
    #!/bin/bash
    set -euo pipefail
    
    count=$(nsenter -n/proc/1/ns/net ip link | grep cali | wc -l)
    
    if (( $count > 150 )); then
      echo "Too many calico interfaces ($count)"
      exit 1
    else
      exit 0
    fi
  cali-monitor.json: |
    {
      "plugin": "custom",
      "pluginConfig": {
        "invoke_interval": "30s",
        "timeout": "5s",
        "max_output_length": 80,
        "concurrency": 3,
        "enable_message_change_based_condition_update": false
      },
      "source": "calico-custom-plugin-monitor",
      "metricsReporting": false,
      "conditions": [
        {
          "type": "NPDCalicoUnhealthy",
          "reason": "CalicoInterfaceCountOkay",
          "message": "Normal amount of interfaces"
        }
      ],
      "rules": [
        {
          "type": "permanent",
          "condition": "NPDCalicoUnhealthy",
          "reason": "TooManyCalicoInterfaces",
          "path": "/bin/bash",
          "args": [
            "/config/check_calico_interfaces.sh"
          ],
          "timeout": "3s"
        }
      ]
    }

Testing showed that when the condition became true, a condition would be updated on the associated Kubernetes node like so:

kubectl get node -o json worker1a | jq '.status.conditions[] | select(.type | test("^NPD"))'
{
  "lastHeartbeatTime": "2020-03-20T17:05:17Z",
  "lastTransitionTime": "2020-03-20T17:05:16Z",
  "message": "Too many calico interfaces (154)",
  "reason": "TooManyCalicoInterfaces",
  "status": "True",
  "type": "NPDCalicoUnhealthy"
}

With that in place, the actual remediation needed to happen. Kured seemed to do most everything we needed, except that it was looking at a file instead of Kubernetes node conditions. We hacked together a patch to change that and tested it successfully end to end — we had a working proof of concept!

Revisiting Problem Detection

While the above worked, we found that node-problem-detector was unwieldy because we were replicating our existing monitoring into shell scripts and node-problem-detector configuration. A 2017 blog post describes Cloudflare’s monitoring stack, although some things have changed since then. What hasn’t changed is our extensive usage of Prometheus and Alertmanager.

For the network interface issue and other issues we wanted to address, we already had the necessary exported metrics and alerting to go with them. Here is what our already existing alert looked like3:

- alert: CalicoTooManyInterfaces
  expr: sum(node_network_info{device=~"cali.*"}) by (node) >= 200
  for: 1h
  labels:
    priority: "5"
    notify: chat-sre-core chat-k8s

Note that we use a “notify” label to drive the routing logic in Alertmanager. However, that got us asking, could we just route this to a Kubernetes node condition instead?

Introducing Sciuro

Automatic Remediation of Kubernetes Nodes

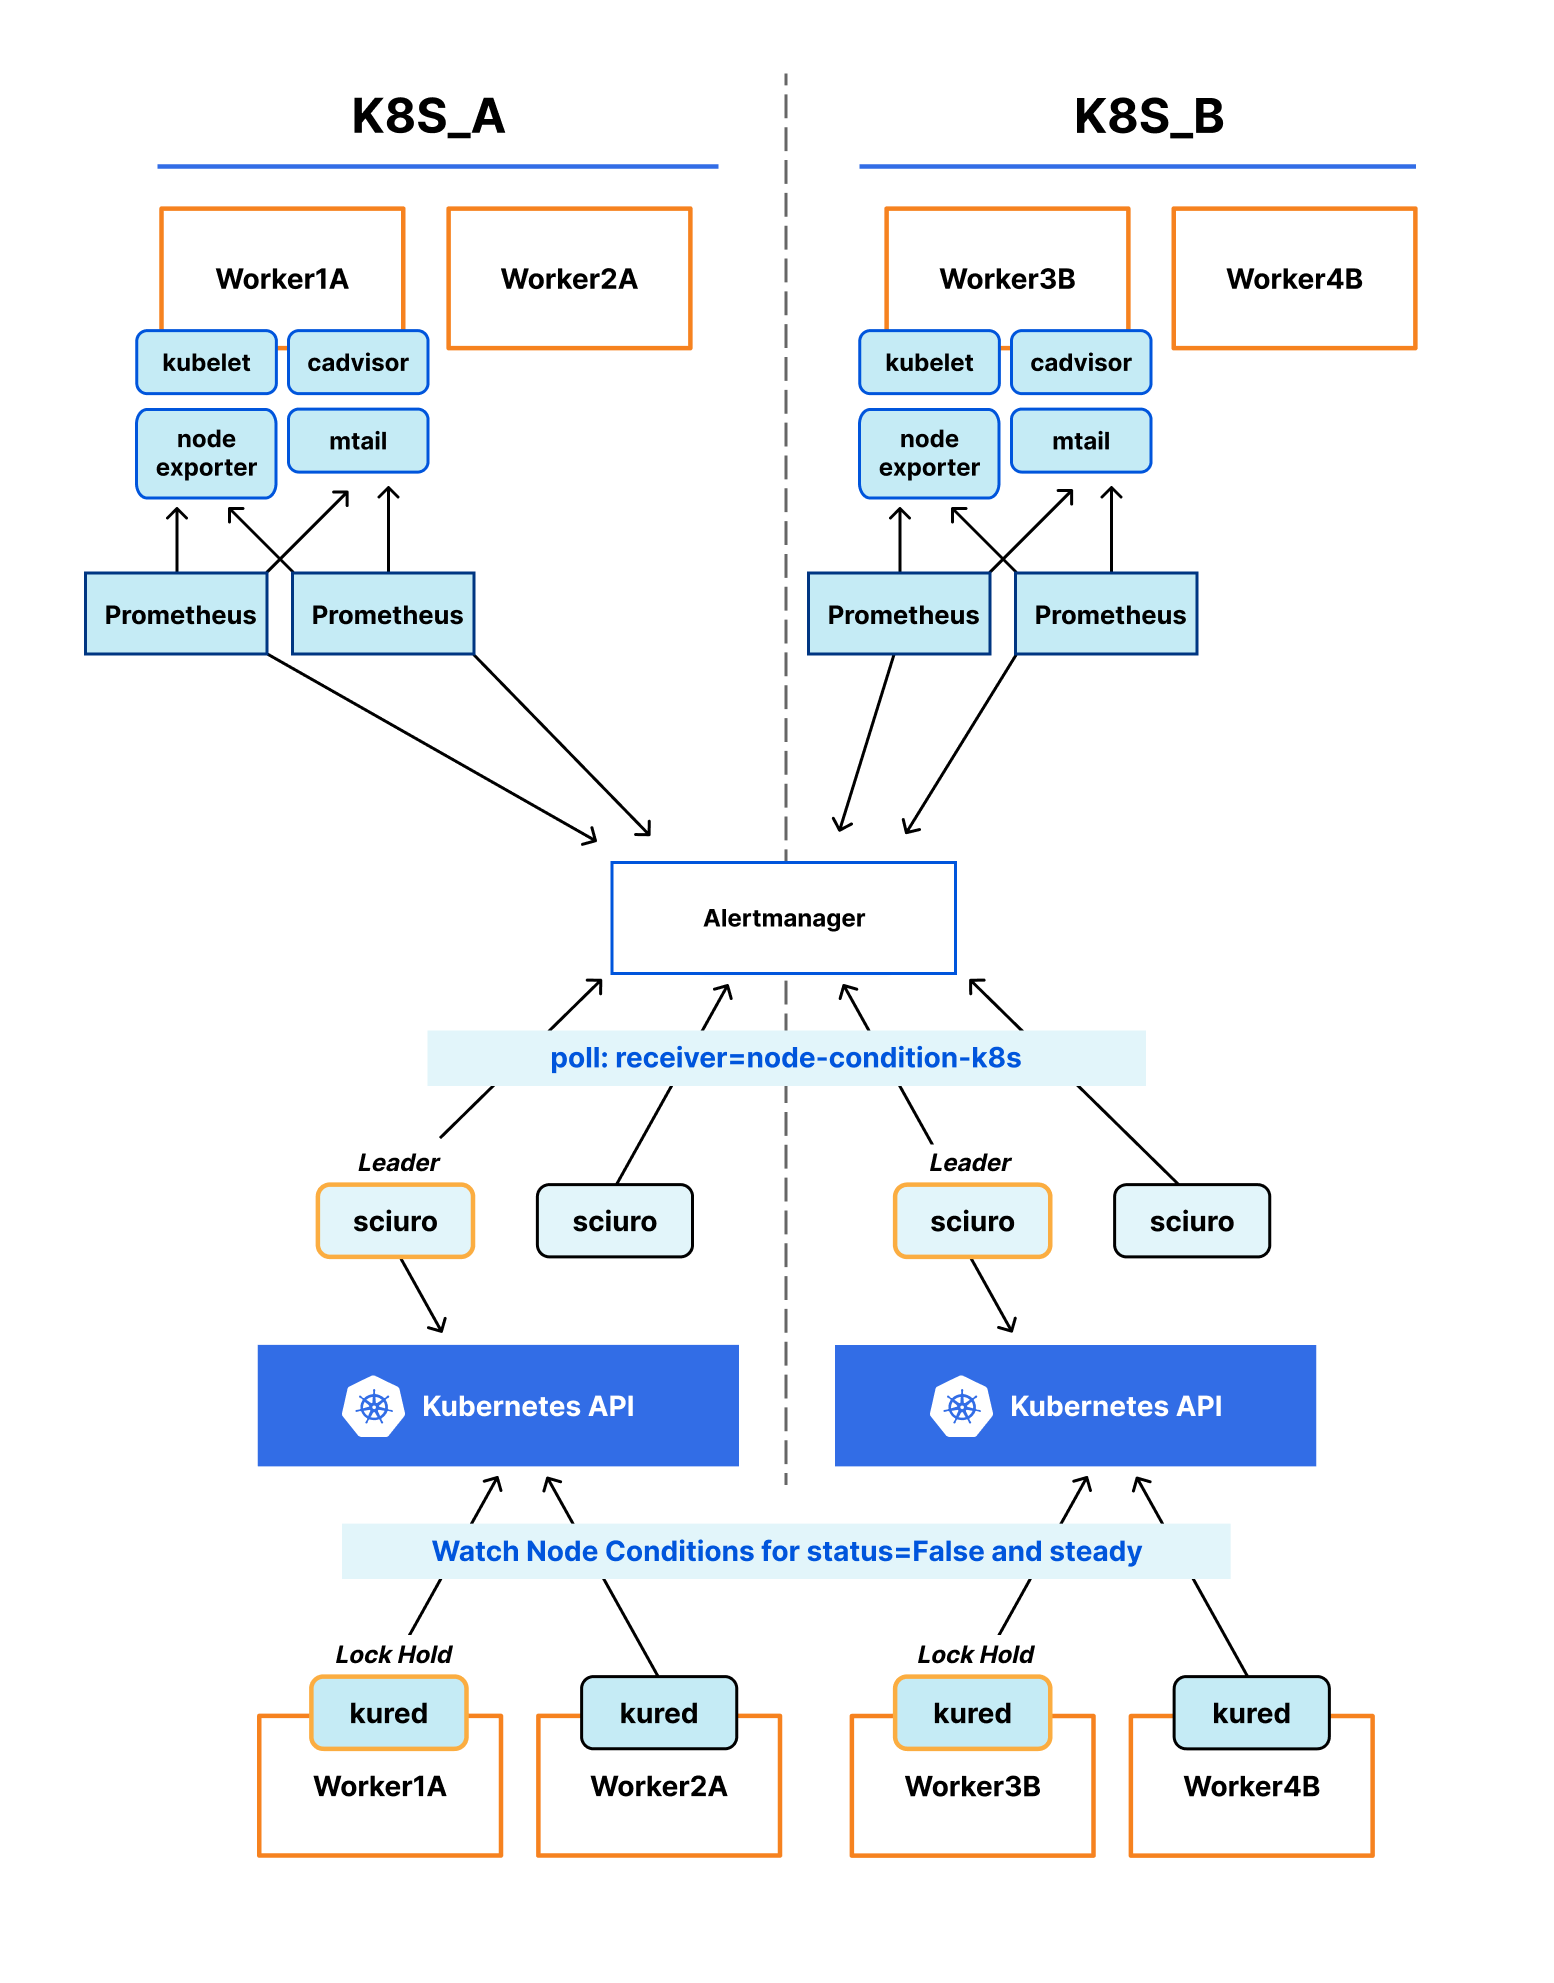
Sciuro is our open-source replacement of node-problem-detector that has one simple job: synchronize Kubernetes node conditions with currently firing alerts in Alertmanager. Node problems can be defined with a more holistic view and using already existing exporters such as node exporter, cadvisor or mtail. It also doesn’t run on affected nodes which allows us to rely on out-of-band remediation techniques. Here is a high level diagram of how Sciuro works:

Automatic Remediation of Kubernetes Nodes

Starting from the top, nodes are scraped by Prometheus, which collects those metrics and fires relevant alerts to Alertmanager. Sciuro polls Alertmanager for alerts with a matching receiver, matches them with a corresponding node resource in the Kubernetes API and updates that node’s conditions accordingly.

In more detail, we can start by defining an alert in Prometheus like the following:

- alert: CalicoTooManyInterfacesEarly
  expr: sum(node_network_info{device=~"cali.*"}) by (node) >= 150
  labels:
    priority: "6"
    notify: node-condition-k8s

Note the two differences from the previous alert. First, we use a new name with a more sensitive trigger. The idea is that we want automatic node remediation to try fixing the node first as soon as possible, but if the problem worsens or automatic remediation is failing, humans will still get notified to act. The second difference is that instead of notifying chat rooms, we route to a target called “node-condition-k8s”.

Sciuro then comes into play, polling the Altertmanager API for alerts matching the “node-condition-k8s” receiver. The following shows the equivalent using amtool:

$ amtool alert query -r node-condition-k8s
Alertname                 	Starts At            	Summary                                                               	 
CalicoTooManyInterfacesEarly  2021-05-11 03:25:21 UTC  Kubernetes node worker1a has too many Calico interfaces  

We can also check the labels for this alert:

$ amtool alert query -r node-condition-k8s -o json | jq '.[] | .labels'
{
  "alertname": "CalicoTooManyInterfacesEarly",
  "cluster": "a.k8s",
  "instance": "worker1a",
  "node": "worker1a",
  "notify": "node-condition-k8s",
  "priority": "6",
  "prometheus": "k8s-a"
}

Note the node and instance labels which Sciuro will use for matching with the corresponding Kubernetes node. Sciuro uses the excellent controller-runtime to keep track of and update node sources in the Kubernetes API. We can observe the updated node condition on the status field via kubectl:

$ kubectl get node worker1a -o json | jq '.status.conditions[] | select(.type | test("^AlertManager"))'
{
  "lastHeartbeatTime": "2021-05-11T03:31:20Z",
  "lastTransitionTime": "2021-05-11T03:26:53Z",
  "message": "[P6] Kubernetes node worker1a has too many Calico interfaces",
  "reason": "AlertIsFiring",
  "status": "True",
  "type": "AlertManager_CalicoTooManyInterfacesEarly"
}

One important note is Sciuro added the AlertManager_ prefix to the node condition type to prevent conflicts with other node condition types. For example, DiskPressure, a kubelet managed condition, could also be an alert name. Sciuro will also properly update heartbeat and transition times to reflect when it first saw the alert and its last update. With node conditions synchronized by Sciuro, remediation can take place via one of the existing tools. As mentioned previously we are using a modified version of Kured for now.

We’re happy to announce that we’ve open sourced Sciuro, and it can be found on GitHub where you can read the code, find the deployment instructions, or open a Pull Request for changes.

Managing Node Uptime

While we began using automatic node remediation for obvious problems, we’ve expanded its purpose to additionally keep node uptime low. Low node uptime is desirable to further reduce drift on nodes, keep the node initialization process well-oiled, and encourage the best deployment practices on the Kubernetes clusters. To expand on the last point, services that are deployed with best practices and in a high availability fashion should see negligible impact when a single node leaves the cluster. However, services that are not deployed with best practices will most likely have problems especially if they rely on singleton pods. By draining nodes more frequently, it introduces regular chaos that encourages best practices. To enable this with automatic node remediation the following alert was defined:

- alert: WorkerUptimeTooHigh
  expr: |
    (
      (
        (
              max by(node) (kube_node_role{role="worker"})
            - on(node) group_left()
              (max by(node) (kube_node_role{role!="worker"}))
          or on(node)
            max by(node) (kube_node_role{role="worker"})
        ) == 1
      )
    * on(node) group_left()
      (
        (time() - node_boot_time_seconds) > (60 * 60 * 24 * 7)
      )
    )
  labels:
    priority: "9"
    notify: node-condition-k8s

There is a bit of juggling with the kube_node_roles metric in the above to isolate the alert to generic worker nodes, but at a high level it looks at node_boot_time_seconds, a metric from prometheus node_exporter. Again the notify label is configured to send to node conditions which kicks off the automatic node remediation. One further detail is the priority here is set to “9” which is of lower precedence than our other alerts. Note that the message field of the node condition is prefixed with the alert priority in brackets. This allows the remediation process to take priority into account when choosing which node to remediate first, which is important because Kured uses a lock to act on a single node at a time.

Wrapping Up

In the past 30 days, we’ve used the above automatic node remediation process to action 571 nodes. That has saved our humans a considerable amount of time. We’ve also been able to reduce the time to repair for some issues as automatic remediation can act at all times of the day and with a faster response time.

As mentioned before, we’re open sourcing Sciuro and its code can be found on GitHub. We’re open to issues, suggestions, and pull requests. We do have some ideas for future improvements. For Sciuro, we may look to reduce latency which is mainly due to polling and potentially add a push model from Altermanager although this isn’t a need we’ve had yet.  For the larger node remediation story, we hope to do an overhaul of the remediating component. As mentioned previously, we are currently using a fork of kured, but a future replacement component should include the following:

  • Use out-of-band management interfaces to be able to shut down and power on nodes without a functional operating system.
  • Move from decentralized architecture to a centralized one that can integrate more complicated logic. This might include being able to act on entire failure domains in parallel.
  • Handle specialized nodes such as masters or storage nodes.

Finally, we’re looking for more people passionate about Kubernetes to join our team. Come help us push Kubernetes to the next level to serve Cloudflare’s many needs!


1Exhaustion can be applied to hardware resources, kernel resources, or logical resources like the amount of logging being produced.
2Nearly all Kubernetes objects have spec and status fields. The status field is used to describe the current state of an object. For node resources, typically the kubelet manages a conditions field under the status field for reporting things like if the node is ready for servicing pods.
3The format of the following alert is documented on Prometheus Alerting Rules.

Soar: Simulation for Observability, reliAbility, and secuRity

Post Syndicated from Yan Zhai original https://blog.cloudflare.com/soar-simulation-for-observability-reliability-and-security/

Soar: Simulation for Observability, reliAbility, and secuRity

Soar: Simulation for Observability, reliAbility, and secuRity

Serving more than approximately 25 million Internet properties is not an easy thing, and neither is serving 20 million requests per second on average. At Cloudflare, we achieve this by running a homogeneous edge environment: almost every Cloudflare server runs all Cloudflare products.

Soar: Simulation for Observability, reliAbility, and secuRity
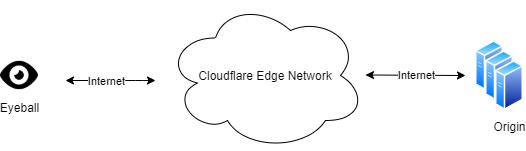
Figure 1. Typical Cloudflare service model: when an end-user (a browser/mobile/etc) visits an origin (a Cloudflare customer), traffic is routed via the Internet to the Cloudflare edge network, and Cloudflare communicates with the origin servers from that point.

As we offer more and more products and enjoy the benefit of horizontal scalability, our edge stack continues to grow in complexity. Originally, we only operated at the application layer with our CDN service and DoS protection. Then we launched transport layer products, such as Spectrum and Argo. Now we have further expanded our footprint into the IP layer and physical link with Magic Transit. They all run on every machine we have. The work of our engineers enables our products to evolve at a fast pace, and to serve our customers better.
However, such software complexity presents a sheer challenge to operation: the more changes you make, the more likely it is that something is going to break. And we don’t tolerate any of our mistakes slipping into the production environment and affecting our customers.

In this article, we will discuss one of the techniques we use to fight such software complexity: simulations. Simulations are basically system tests that run with synthesized customer traffic and applications. We would like to introduce our simulation system, SOAR, i.e. Simulation for Observability, reliAbility, and secuRity.

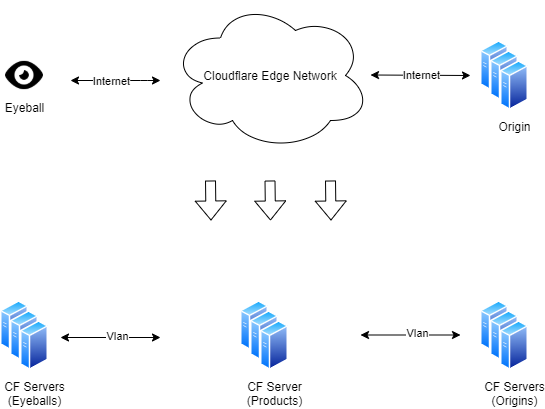
What is SOAR? Simply put, it’s a data center built specifically for simulations. It runs the same software stack as our production data centers, but without any production traffic. Within SOAR, there are end-user servers, product servers, and origin servers (Figure 2). The product servers behave exactly the same as servers in our production edge network, and they are the targets that we want to test. End-user servers and origin servers run applications that try to simulate customer behaviors. The simplest case is to run network benchmarks through product servers, in order to evaluate how effective the corresponding products are. Instead of sending test traffic over the Internet, everything happens in the LAN environment that Cloudflare tightly controls. This gives us great flexibility in testing network features such as bring-your-own-IP (BYOIP) products.

Soar: Simulation for Observability, reliAbility, and secuRity
Figure 2. SOAR architectural view: by simulating the end users and origin on Cloudflare servers in the same VLAN, we can focus on examining the problems occurring in our edge network.

To demonstrate how this works, let’s go through a running example using Magic Transit.

Magic Transit is a product that provides IP layer protection and acceleration. One of the main functions of Magic Transit is to shield customers from DDoS attacks.

Soar: Simulation for Observability, reliAbility, and secuRity
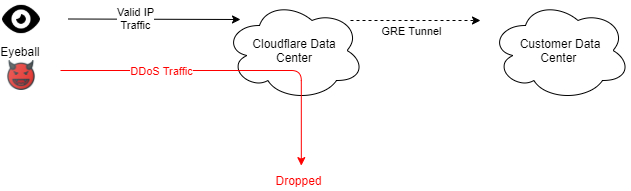
Figure 3. Magic Transit workflow in a nutshell

Customers bring their IP ranges to advertise from Cloudflare edge. When attackers initiate a DoS attack, Cloudflare absorbs all the customer’s traffic, drops the attack traffic, and encapsulates clean traffic to customers. For this product, operational concerns are multifold, and here are some examples:

  • Have we properly configured our data plane so that traffic can reach customers? Is BGP ready? Are ECMP routes programmed correctly? Are health probes working correctly?
  • Do we have any untested corner cases that only manifest with a large amount of traffic?
  • Is our DoS system dropping malicious traffic as intended? How effective
  • Will any other team’s changes break Magic Transit as our edge keeps growing?

To ease these concerns, we run simulated customers with SOAR. Yes, simulated, not real. For example, assume a customer Alice onboarded an IP range 192.0.2.0/24 to Magic Transit. To simulate this customer, in SOAR we can configure a test application (e.g. iperf server) on one origin server to represent Alice’s service. We also bring up a product server to run Magic Transit. This product server will filter traffic toward a.b.c.0/24, and GRE encapsulated cleansed traffic to Alice’s specified GRE endpoint. To make it work, we also add routing rules to forward packets destined to 192.0.2.0/24 to go through the product server above. Similarly, we add routing rules to deliver GRE packets from the product server to the origin servers. Lastly, we start running test clients as eyeballs to evaluate the functional correctness, performance metrics, and resource usage.

For the rest of this article, we will talk about the design and implementation of this simulation system, as well as several real cases in which it helped us catch problems early or avoid problems altogether.

System Design

From performance simulation to config simulation

Before we created SOAR, we had already built a “performance simulation” for our layer 7 services. It is based on SaltStack, our configuration management software. All the simulation cases are system test cases against Cloudflare-owned HTTP sites. These cases are statically configured and run non-stop. Each simulation case produces multiple Prometheus metrics such as requests per second and latency. We monitor these metrics daily on our Grafana dashboard.

While this simulation system is very useful, it becomes less efficient as we have more and more simulation cases and products to run and analyze.

Isolation and Coordination

As more types of simulations are onboarded, it is critical to ensure each simulation runs in a clean environment, and all tasks of a simulation run together. This challenge is specific to providers like Cloudflare, whose products are not virtualized because we want to maximize our edge performance. As a result, we have to isolate simulations and clean up by ourselves; otherwise, different simulations may cross-affect each other.

For example, for Magic Transit simulations, we need to create a GRE tunnel on an origin server and set up several routes on all three servers, to make sure simulated traffic can flow as real Magic Transit customers would. We cannot leave these routes after the simulation finishes, or there might be a conflict. We once ran into a situation where different simulations required different source IP addresses to the same destination. In our original performance simulation environment, we will have to modify simulation applications to avoid these conflicts. This approach is less desirable as different engineering teams have to pay attention to other teams’ code.

Moreover, the performance simulation addresses only the most basic system test cases: a client sends traffic to a server and measures the performance characteristics like request per second and latency quantile. But the situation we want to simulate and validate in our production environment can be far more complex.

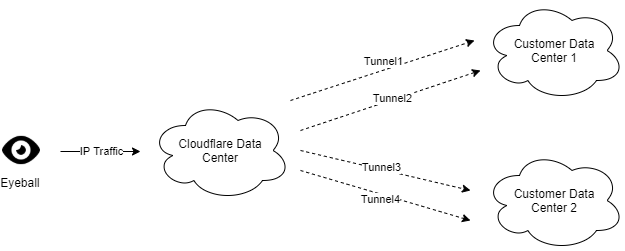
In our previous example of Magic Transit, customers can configure complicated network topology. Figure 4 is one simplified case. Let’s say Alice establishes four GRE tunnels with Cloudflare; two connect to her data center 1, and traffic will be ECMP hashed between these two tunnels. Similarly, she also establishes another two tunnels to her data center 2 with similar ECMP settings. She would like to see traffic hit data center 1 normally and fail over to data center 2 when tunnels 1 and 2 are both down.

Soar: Simulation for Observability, reliAbility, and secuRity
Figure 4. The customer configured Magic Transit to establish four tunnels to her two data centers. Traffic to data center 1 is hashed between tunnel 1 and 2 using ECMP, and traffic to data center 2 is hashed between tunnel 3 and 4. Data center 1 is the primary one, and traffic should failover to data center 2 if tunnels 1 and 2 are both down. Note the number “2” is purely symbolic, as real customers can have more than just 2 data centers, or 2 paths per ECMP route.

In order to examine the effectiveness of route failover, we would need to inject errors on the product servers only after the traffic on the eyeball server has started. But this type of coordination is not achievable with statically defined simulations.

Engineer friendliness and Interactiveness

Our performance simulation is not engineer-friendly. Not just because it is all statically configured in SaltStack (most engineering teams do not possess Salt expertise), but it is also not integrated with an engineer’s daily routine. Can engineers trigger a simulation on every branch build? Can simulation results get back in time to inform that a performance problem occurs? The answer is no, it is not possible with our static configuration. An engineer can submit a Salt PR to config a new simulation, but this simulation may have to wait for several hours because all other unfinished simulations need to complete first (recall it is just a static loop). Nor can an engineer add a test to the team’s repository to run on every build, as it needs to reside in the SRE-managed Salt repository, making it unmanageable as the number of simulations grows.

The Architecture

To address the above limitations, we designed SOAR.

Soar: Simulation for Observability, reliAbility, and secuRity
Figure 5. The Architecture of SOAR

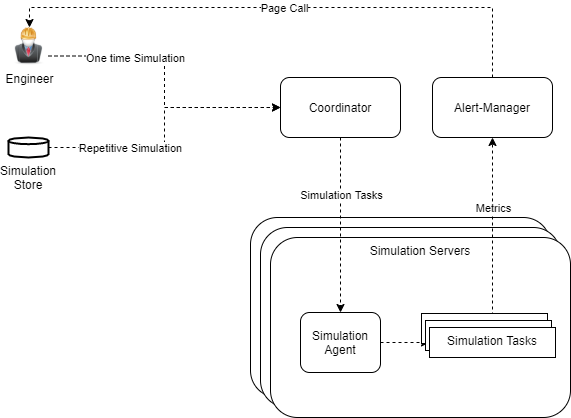
The architecture is a performance simulation structure, extended. We created an internal coordinator service to:

  1. Interface with engineers, so they could now submit one-time simulations from their laptop or within the building pipeline, or view previous execution results.
  2. Dispatch and coordinate simulation tasks to each simulation server, where a simulation agent executes these tasks. The coordinator will isolate simulations properly so none of them contends on system resources. For example, the simplest policy we implemented is to never run two simulations on the same server at the same time.

The coordinator is secured by Cloudflare Access, so that only employees can visit this service. The coordinator will serve two types of simulations: one-time simulation to be run in an ad-hoc way and mainly on a per pull request manner, to ease development testing. It’s also callable from our CI system. Another type is repetitive simulations that are stored in the coordinator’s persistent storage. These simulations serve daily monitoring purposes and will be executed periodically.

Each simulation server runs a simulation agent. This agent will execute two types of tasks received from the coordinator: system tasks and user tasks. System tasks change the system-wide configurations and will be reverted after each simulation terminates. These will include but are not limited to route change, link change, address change, ipset change and iptables change.

User tasks, on the other hand, run benchmarks that we are interested in evaluating, and will be terminated if it exceeds an allocated execution budget. Each user task is isolated in a cgroup, and the agent will ensure all user tasks are executed with dedicated resources. The generic runtime metrics of user tasks is monitored by Cadvisor and sent to Prometheus and Alert Manager. A user task can export its own metrics to Prometheus as well.

For SOAR to run reliably, we provisioned a dedicated environment that enforces the same settings for the production environment and operates it as a production system: hardened security, standard alerts on watch, no engineer access except approved tools. This to a large extent allows us to run simulations as a stable source of anomaly detection.

Simulating with customer-specific configuration

An important ability of SOAR is to simulate for a specific customer. This will provide the customer with more guarantees that both their configurations and our services are battle-tested with traffic before they go live. It can also be used to bisect problems during a customer escalation, helping customer support to rule out unrelated factors more easily.

All of our edge servers know how to dispatch an incoming customer packet. This factor greatly reduces difficulties in simulating a specific customer. What we need to do in simulation is to mock routing and domain translation on simulated eyeballs and origins, so that they will correctly send traffic to designated product servers. And the problem is solved—magic!

The actual implementation is also straightforward: as simulations run in a LAN environment, we have tight control over how to route packets (servers are on the same broadcast domain). Any eyeball, origin, or product server can just use a direct routing rule and a static DNS entry in /etc/hosts to redirect packets to go to the correct destination.

Running a simulation this way allows us to separate customer configuration management from the simulation service: our products will manage it, so any time a customer configuration is changed, they will already reflect in simulations without special care.

Implementation and Integration

All SOAR components are built with Golang from scratch on Linux servers. It took three engineer-months to build the prototype and onboard the first engineering use case. While there are other mature platforms for job scheduling, task isolation, and monitoring, building our own allows us to better absorb new requirements from engineering teams, which is much easier and quicker than an external dependency.

In addition, we are currently integrating the simulation service into our release pipeline. Cloudflare built a release manager internally to schedule product version changes in controlled steps: a new product is first deployed into dogfooding data centers. After the product has been trialed by Cloudflare employees, it moves to several canary data centers with limited customer traffic. If nothing bad happens, in an hour or so, it starts to land in larger data centers spread across three tiers. Tier-3 will receive the changes an hour earlier than tier-2, and the same applies to tier-2 and tier-1. This ensures a product would be battle-tested enough before it can serve the majority of Cloudflare customers.

Now we move this further by adding a simulation step even before dogfooding. In this step, all changes are deployed into the simulation environment, and engineering teams will configure which simulations to run. Dogfooding starts only when there is no performance regression or functional breakage. Here performance regression is based on Prometheus metrics, where each engineering team can define their own Prometheus query to interpret the performance results. All configured simulations will run periodically to detect problems in releases that do not tie to a specific product, e.g. a Linux kernel upgrade. SREs receive notifications asynchronously if any issue is discovered.

Simulations at Cloudflare: Case Studies

Simulations are very useful inside Cloudflare. Let’s see some real experiences we had in the past.

Detecting an anomaly on data center specific releases

In our Magic Transit example, the engineering team was about to release physical network interconnect (PNI) support. With PNI, customer data centers physically peer with Cloudflare routers.

Soar: Simulation for Observability, reliAbility, and secuRity
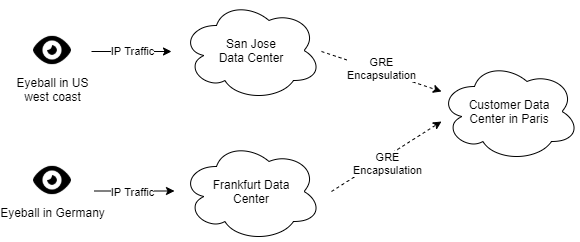
Figure 6. The Magic Transit service flow for a customer without PNI support. Any Cloudflare data center can receive eyeball traffic. After mitigating a DoS attack traffic, valid traffic is encapsulated to the customer data center from any of the handling Cloudflare data centers.
Soar: Simulation for Observability, reliAbility, and secuRity
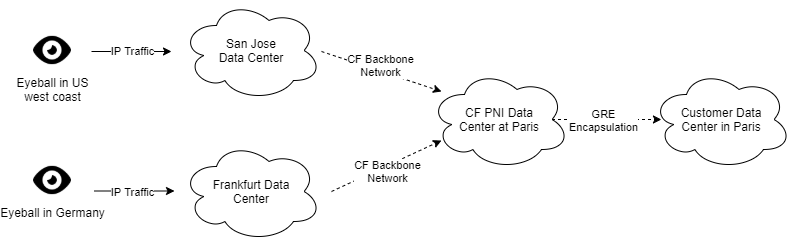
Figure 7. Magic Transit with PNI support. Traffic received from any data center will be moved to the PNI data center that the customer connects to. The PNI data center becomes a choke point.‌‌

However, this PNI functionality introduces a problem in our normal release process. However, PNI data centers are typically different from our dogfooding and canary data centers. If we still release with the normal process, then two critical phases are skipped. And what’s worse, the PNI data center could be a choke point in front of that customer’s traffic. If the PNI data center is taken down, no other data center can replace its role.

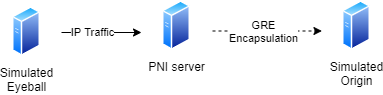
SOAR in this case is an important utility to help. The basic idea is to configure a server with PNI information. This server will act as if it runs in a PNI data center. Then we run simulated eyeball and origin to examine if there is any functional breakage:
Soar: Simulation for Observability, reliAbility, and secuRity
Figure 8. SOAR configures a server with PNI information and runs simulated eyeball and origin on this server. If a PNI related code release has a problem, then with proper simulation traffic it will be caught before rolling into production.
With such simulation capability, we were able to detect several problems early on and before releasing. For example, we caught a problem that impacts checksum offloading, which could encapsulate TCP packets with the wrong inner checksum and cause the packets to be dropped at the origin side. This problem does not exist in our virtualized testing environment and integration tests; it only happens when production hardware comes into play. We then use this simulation as a success indicator to test various fixes until we get the packet flow running normally again.

Continuously monitor performance on the edge stack

When a team configures a simulation, it runs on the same stack where all other teams run their products as well. This means when a simulation starts to show unhealthy results, it may or may not directly relate to the product associated with that simulation.

But with continuous simulations, we will have more chances to detect issues before things go south, or at least it will serve as a hint to quickly react to emerging problems. In an example early this year, we noticed one of our performance simulation dashboards showed that some HTTP request throughput was dropping by 20%. After digging into the case, we found our bot detection system had made a change that affected related requests. Luckily enough we moved fast thanks to the hint from the simulation (and some other useful tools like Opentracing).

Our recent enhancement from just HTTP performance simulation to SOAR makes it even more useful for customers. This is because we are now able to simulate with customer-specific configurations, so we might expose customer-specific problems. We are still dogfooding this, and hopefully, we can deploy it to our customers soon.

DoS Attacks as Simulations

When we started to develop Magic Transit, a question worth monitoring was how effective our mitigation pipeline is, and how to apply thresholds for different customers. For our new ACK flood mitigation system, flowtrackd, we onboarded its performance simulation cases together with tunable ACK flood. Combined with customer-specific configuration, this allows us to compare the throughput result under different volumes of attacks, and systematically tune our mitigation threshold.

Another important factor that we will be able to achieve with our “attack simulation” system is to mount attacks we have seen in the past, making sure the development of our mitigation pipelines won’t ever pass on these known attacks to our customers.

Conclusion

In this article, we introduced Cloudflare’s simulation system, SOAR. While simulation is not a new tool, we can use it to improve reliability, observability, and security. Our adoption of SOAR is still in its early stages, but we are pretty confident that, by fully leveraging simulations, we will push our quality of service to a new level.

Architecting for Reliable Scalability

Post Syndicated from Marwan Al Shawi original https://aws.amazon.com/blogs/architecture/architecting-for-reliable-scalability/

Cloud solutions architects should ideally “build today with tomorrow in mind,” meaning their solutions need to cater to current scale requirements as well as the anticipated growth of the solution. This growth can be either the organic growth of a solution or it could be related to a merger and acquisition type of scenario, where its size is increased dramatically within a short period of time.

Still, when a solution scales, many architects experience added complexity to the overall architecture in terms of its manageability, performance, security, etc. By architecting your solution or application to scale reliably, you can avoid the introduction of additional complexity, degraded performance, or reduced security as a result of scaling.

Generally, a solution or service’s reliability is influenced by its up time, performance, security, manageability, etc. In order to achieve reliability in the context of scale, take into consideration the following primary design principals.

Modularity

Modularity aims to break a complex component or solution into smaller parts that are less complicated and easier to scale, secure, and manage.

Monolithic architecture vs. modular architecture

Figure 1: Monolithic architecture vs. modular architecture

Modular design is commonly used in modern application developments. where an application’s software is constructed of multiple and loosely coupled building blocks (functions). These functions collectively integrate through pre-defined common interfaces or APIs to form the desired application functionality (commonly referred to as microservices architecture).


Scalable modular applications

Figure 2: Scalable modular applications

For more details about building highly scalable and reliable workloads using a microservices architecture, refer to Design Your Workload Service Architecture.

This design principle can also be applied to different components of the solution’s architecture. For example, when building a cloud solution on a single Amazon VPC, it may reach certain scaling limits and make it harder to introduce changes at scale due to the higher level of dependencies. This single complex VPC can be divided into multiple smaller and simpler VPCs. The architecture based on multiple VPCs can vary. For example, the VPCs can be divided based on a service or application building block, a specific function of the application, or on organizational functions like a VPC for various departments. This principle can also be leveraged at a regional level for very high scale global architectures. You can make the architecture modular at a global level by distributing the multiple VPCs across different AWS Regions to achieve global scale (facilitated by AWS Global Infrastructure).

In addition, modularity promotes separation of concerns by having well-defined boundaries among the different components of the architecture. As a result, each component can be managed, secured, and scaled independently. Also, it helps you avoid what is commonly known as “fate sharing,” where a vertically scaled server hosts a monolithic application, and any failure to this server will impact the entire application.

Horizontal scaling

Horizontal scaling, commonly referred to as scale-out, is the capability to automatically add systems/instances in a distributed manner in order to handle an increase in load. Examples of this increase in load could be the increase of number of sessions to a web application. With horizontal scaling, the load is distributed across multiple instances. By distributing these instances across Availability Zones, horizontal scaling not only increases performance, but also improves the overall reliability.

In order for the application to work seamlessly in a scale-out distributed manner, the application needs to be designed to support a stateless scaling model, where the application’s state information is stored and requested independently from the application’s instances. This makes the on-demand horizontal scaling easier to achieve and manage.

This principle can be complemented with a modularity design principle, in which the scaling model can be applied to certain component(s) or microservice(s) of the application stack. For example, only scale-out Amazon Elastic Cloud Compute (EC2) front-end web instances that reside behind an Elastic Load Balancing (ELB) layer with auto-scaling groups. In contrast, this elastic horizontal scalability might be very difficult to achieve for a monolithic type of application.

Leverage the content delivery network

Leveraging Amazon CloudFront and its edge locations as part of the solution architecture can enable your application or service to scale rapidly and reliably at a global level, without adding any complexity to the solution. The integration of a CDN can take different forms depending on the solution use case.

For example, CloudFront played an important role to enable the scale required throughout Amazon Prime Day 2020 by serving up web and streamed content to a worldwide audience, which handled over 280 million HTTP requests per minute.

Go serverless where possible

As discussed earlier in this post, modular architectures based on microservices reduce the complexity of the individual component or microservice. At scale it may introduce a different type of complexity related to the number of these independent components (microservices). This is where serverless services can help to reduce such complexity reliably and at scale. With this design model you no longer have to provision, manually scale, maintain servers, operating systems, or runtimes to run your applications.

For example, you may consider using a microservices architecture to modernize an application at the same time to simplify the architecture at scale using Amazon Elastic Kubernetes Service (EKS) with AWS Fargate.

Example of a serverless microservices architecture

Figure 3: Example of a serverless microservices architecture

In addition, an event-driven serverless capability like AWS Lambda is key in today’s modern scalable cloud solutions, as it handles running and scaling your code reliably and efficiently. See How to Design Your Serverless Apps for Massive Scale and 10 Things Serverless Architects Should Know for more information.

Secure by design

To avoid any major changes at a later stage to accommodate security requirements, it’s essential that security is taken into consideration as part of the initial solution design. For example, if the cloud project is new or small, and you don’t consider security properly at the initial stages, once the solution starts to scale, redesigning the entire cloud project from scratch to accommodate security best practices is usually not a simple option, which may lead to consider suboptimal security solutions that may impact the desired scale to be achieved. By leveraging CDN as part of the solution architecture (as discussed above), using Amazon CloudFront, you can minimize the impact of distributed denial of service (DDoS) attacks as well as perform application layer filtering at the edge. Also, when considering serverless services and the Shared Responsibility Model, from a security lens you can delegate a considerable part of the application stack to AWS so that you can focus on building applications. See The Shared Responsibility Model for AWS Lambda.

Design with security in mind by incorporating the necessary security services as part of the initial cloud solution. This will allow you to add more security capabilities and features as the solution grows, without the need to make major changes to the design.

Design for failure

The reliability of a service or solution in the cloud depends on multiple factors, the primary of which is resiliency. This design principle becomes even more critical at scale because the failure impact magnitude typically will be higher. Therefore, to achieve a reliable scalability, it is essential to design a resilient solution, capable of recovering from infrastructure or service disruptions. This principle involves designing the overall solution in such a way that even if one or more of its components fail, the solution is still be capable of providing an acceptable level of its expected function(s). See AWS Well-Architected Framework – Reliability Pillar for more information.

Conclusion

Designing for scale alone is not enough. Reliable scalability should be always the targeted architectural attribute. The design principles discussed in this blog act as the foundational pillars to support it, and ideally should be combined with adopting a DevOps model.

Keeping Netflix Reliable Using Prioritized Load Shedding

Post Syndicated from Netflix Technology Blog original https://netflixtechblog.com/keeping-netflix-reliable-using-prioritized-load-shedding-6cc827b02f94

How viewers are able to watch their favorite show on Netflix while the infrastructure self-recovers from a system failure

By Manuel Correa, Arthur Gonigberg, and Daniel West

Getting stuck in traffic is one of the most frustrating experiences for drivers around the world. Everyone slows to a crawl, sometimes for a minor issue or sometimes for no reason at all. As engineers at Netflix, we are constantly reevaluating how to redesign traffic management. What if we knew the urgency of each traveler and could selectively route cars through, rather than making everyone wait?

In Netflix engineering, we’re driven by ensuring Netflix is there when you need it to be. Yet, as recent as last year, our systems were susceptible to metaphorical traffic jams; we had on/off circuit breakers, but no progressive way to shed load. Motivated by improving the lives of our members, we’ve introduced priority-based progressive load shedding.

The animation below shows the behavior of the Netflix viewer experience when the backend is throttling traffic based on priority. While the lower priority requests are throttled, the playback experience remains uninterrupted and the viewer is able to enjoy their title. Let’s dig into how we accomplished this.

Failure can occur due to a myriad of reasons: misbehaving clients that trigger a retry storm, an under-scaled service in the backend, a bad deployment, a network blip, or issues with the cloud provider. All such failures can put a system under unexpected load, and at some point in the past, every single one of these examples has prevented our members’ ability to play. With these incidents in mind, we set out to make Netflix more resilient with these goals:

  1. Consistently prioritize requests across device types (Mobile, Browser, and TV)
  2. Progressively throttle requests based on priority
  3. Validate assumptions by using Chaos Testing (deliberate fault injection) for requests of specific priorities

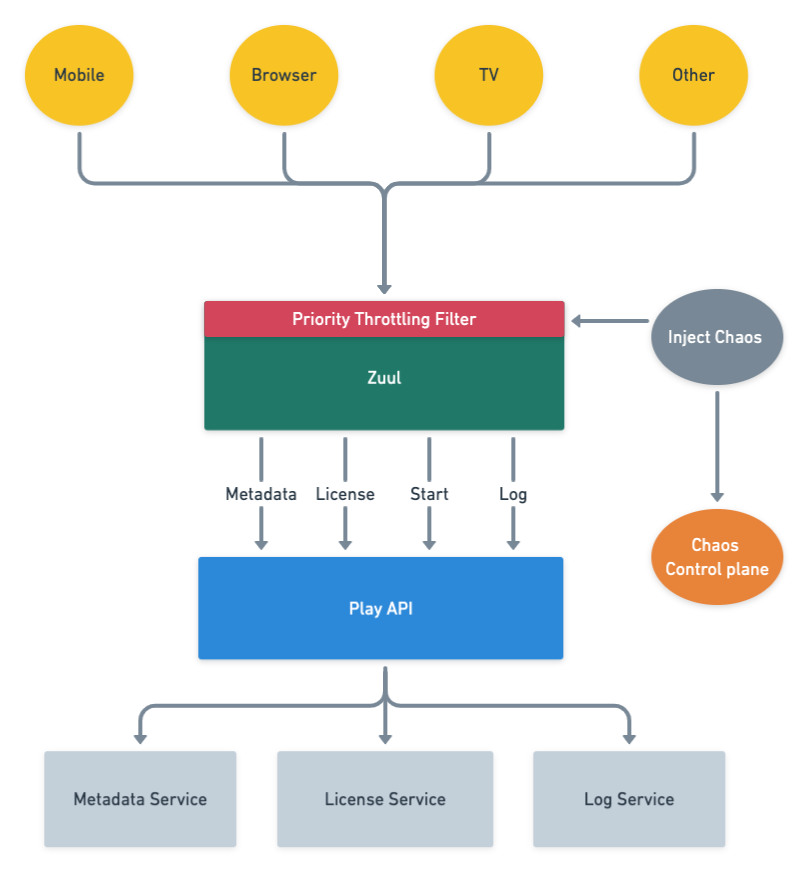
The resulting architecture that we envisioned with priority throttling and chaos testing included is captured below.

High level playback architecture with priority throttling and chaos testing

Building a request taxonomy

We decided to focus on three dimensions in order to categorize request traffic: throughput, functionality, and criticality. Based on these characteristics, traffic was classified into the following:

  • NON_CRITICAL: This traffic does not affect playback or members’ experience. Logs and background requests are examples of this type of traffic. These requests are usually high throughput which contributes to a large percentage of load in the system.
  • DEGRADED_EXPERIENCE: This traffic affects members’ experience, but not the ability to play. The traffic in this bucket is used for features like: stop and pause markers, language selection in the player, viewing history, and others.
  • CRITICAL: This traffic affects the ability to play. Members will see an error message when they hit play if the request fails.

Using attributes of the request, the API gateway service (Zuul) categorizes the requests into NON_CRITICAL, DEGRADED_EXPERIENCE and CRITICAL buckets, and computes a priority score between 1 to 100 for each request given its individual characteristics. The computation is done as a first step so that it is available for the rest of the request lifecycle.

Most of the time, the request workflow proceeds normally without taking the request priority into account. However, as with any service, sometimes we reach a point when either one of our backends is in trouble or Zuul itself is in trouble. When that happens requests with higher priority get preferential treatment. The higher priority requests will get served, while the lower priority ones will not. The implementation is analogous to a priority queue with a dynamic priority threshold. This allows Zuul to drop requests with a priority lower than the current threshold.

Finding the best place to throttle traffic

Zuul can apply load shedding in two moments during the request lifecycle: when it routes requests to a specific back-end service (service throttling) or at the time of initial request processing, which affects all back-end services (global throttling).

Service throttling

Zuul can sense when a back-end service is in trouble by monitoring the error rates and concurrent requests to that service. Those two metrics are approximate indicators of failures and latency. When the threshold percentage for one of these two metrics is crossed, we reduce load on the service by throttling traffic.

Global throttling

Another case is when Zuul itself is in trouble. As opposed to the scenario above, global throttling will affect all back-end services behind Zuul, rather than a single back-end service. The impact of this global throttling can cause much bigger problems for members. The key metrics used to trigger global throttling are CPU utilization, concurrent requests, and connection count. When any of the thresholds for those metrics are crossed, Zuul will aggressively throttle traffic to keep itself up and healthy while the system recovers. This functionality is critical: if Zuul goes down, no traffic can get through to our backend services, resulting in a total outage.

Introducing priority-based progressive load shedding

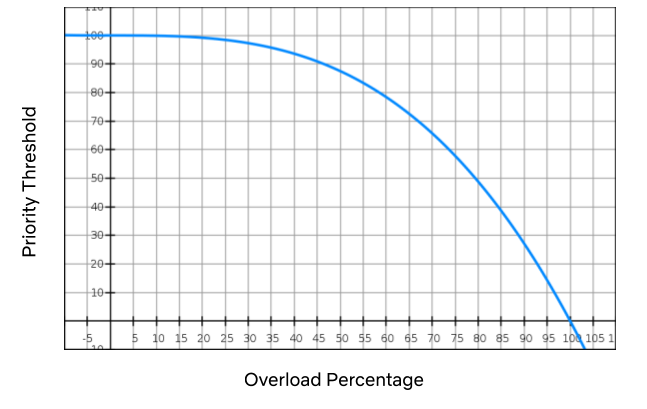
Once we had the prioritization piece in place, we were able to combine it with our load shedding mechanism to dramatically improve streaming reliability. When we’re in a bad situation (i.e. any of the thresholds above are exceeded), we progressively drop traffic, starting with the lowest priority. A cubic function is used to manage the level of throttling. If things get really, really bad the level will hit the sharp side of the curve, throttling everything.

The graph above is an example of how the cubic function is applied. As the overload percentage increases (i.e. the range between the throttling threshold and the max capacity), the priority threshold trails it very slowly: at 35%, it’s still in the mid-90s. If the system continues to degrade, we hit priority 50 at 80% exceeded and then eventually 10 at 95%, and so on.

Given that a relatively small amount of requests impact streaming availability, throttling low priority traffic may affect certain product features but will not prevent members pressing “play” and watching their favorite show. By adding progressive priority-based load shedding, Zuul can shed enough traffic to stabilize services without members noticing.

Handling retry storms

When Zuul decides to drop traffic, it sends a signal to devices to let them know that we need them to back off. It does this by indicating how many retries they can perform and what kind of time window they can perform them in. For example:

{ “maxRetries” : <max-retries>, “retryAfterSeconds”: <seconds> }

Using this backpressure mechanism, we can stop retry storms much faster than we could in the past. We automatically adjust these two dials based on the priority of the request. Requests with higher priority will retry more aggressively than lower ones, also increasing streaming availability.

Validating which requests are right for the job

To validate our request taxonomy assumptions on whether a specific request fell into the NON_CRITICAL, DEGRADED, or CRITICAL bucket, we needed a way to test the user’s experience when that request was shed. To accomplish this, we leveraged our internal failure injection tool (FIT) and created a failure injection point in Zuul that allowed us to shed any request based on a supplied priority. This enabled us to manually simulate a load shedded experience by blocking ranges of priorities for a specific device or member, giving us an idea of which requests could be safely shed without impacting the user.

Continually ensuring those requests are still right for the job

One of the goals here is to reduce members’ pain by shedding requests that are not expected to affect the user’s streaming experience. However, Netflix changes quickly and requests that were thought to be noncritical can unexpectedly become critical. In addition, Netflix has a wide variety of client devices, client versions, and ways to interact with the system. To make sure we weren’t causing members pain when throttling NON_CRITICAL requests in any of these scenarios, we leveraged our infrastructure experimentation platform ChAP.

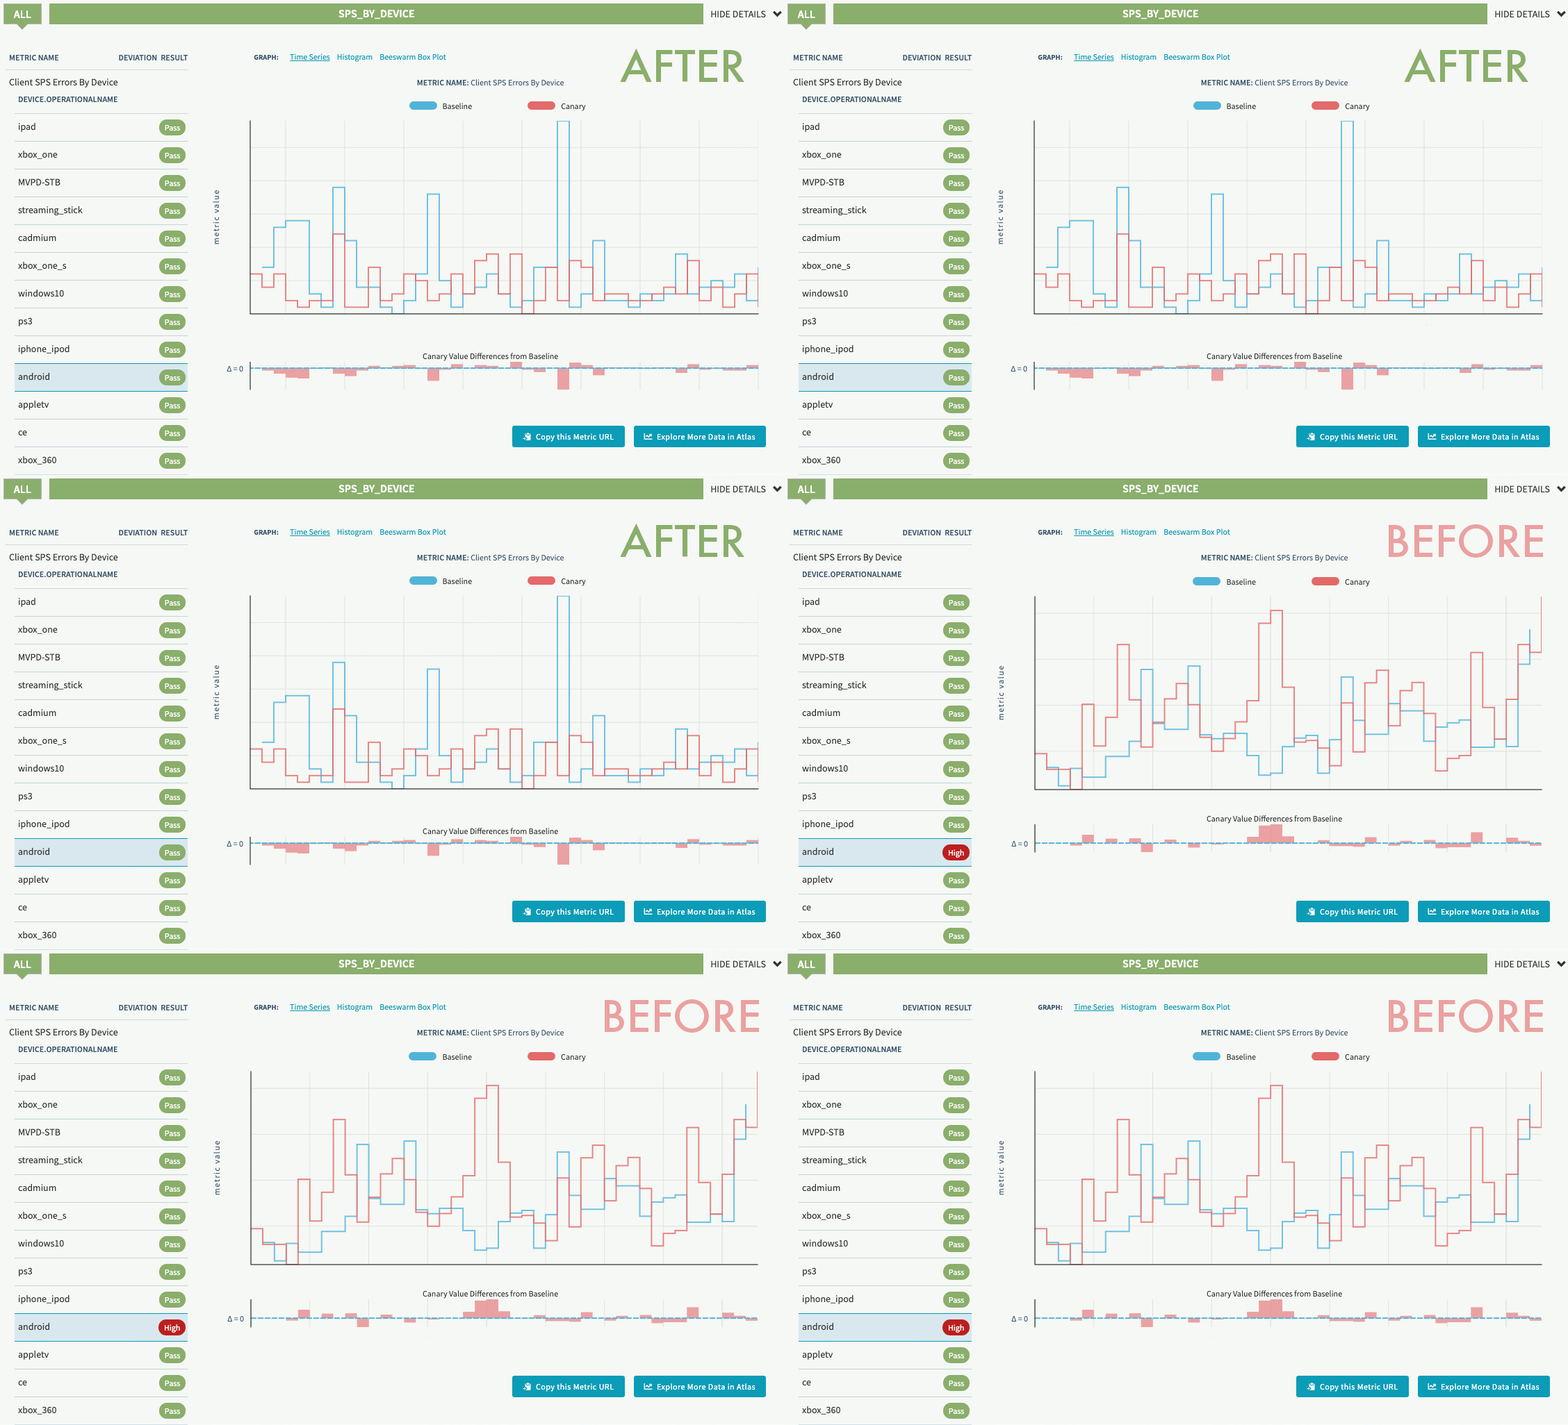
This platform allows us to stage an A/B experiment that will allocate a small number of production users to either a control or treatment group for 45 minutes while throttling a range of priorities for the treatment group. This lets us capture a variety of live use cases and measure the impact to their playback experience. ChAP analyzes the members’ KPIs per device to determine if there is a deviation between the control and the treatment groups.

In our first experiment, we detected a race condition in both Android and iOS devices for a low priority request that caused sporadic playback errors. Since we practice continuous experimentation, once the initial experiments were run and the bugs were fixed, we scheduled them to run on a periodic basis. This allows us to detect regressions early and keep users streaming.

Experiment regression detection before and after fix (SPS indicates streaming availability)

Reaping the benefits

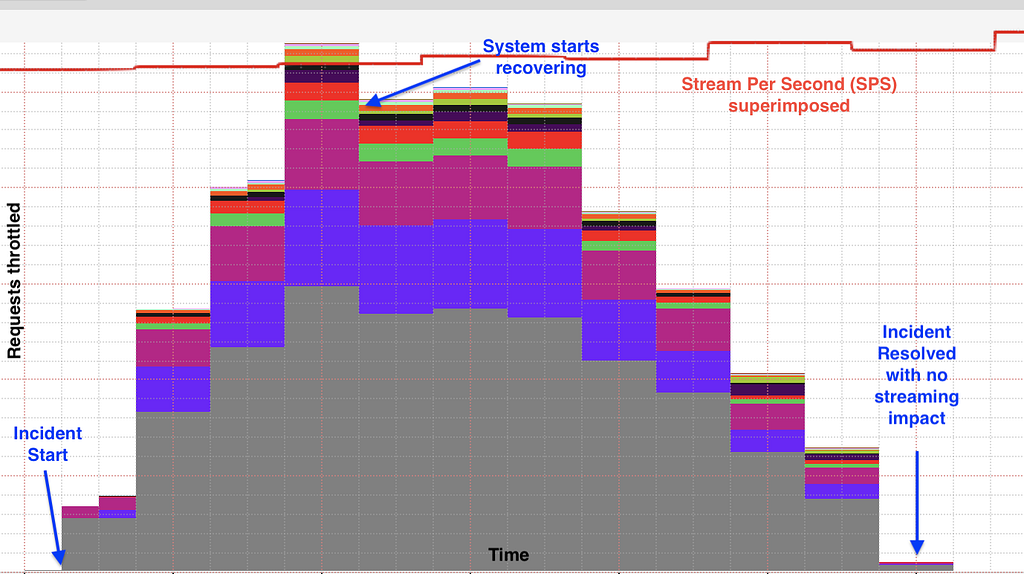
In 2019, before progressive load shedding was in place, the Netflix streaming services experienced an outage that resulted in a sizable percentage of members who were not able to play for a period of time. In 2020, days after the implementation was deployed, the team started seeing the benefit of the solution. Netflix experienced a similar issue with the same potential impact as the outage seen in 2019. Unlike then, Zuul’s progressive load shedding kicked in and started shedding traffic until the service was in a healthy state without impacting members’ ability to play at all.

The graph below shows a stable streaming availability metric stream per second (SPS) while Zuul is performing progressive load shedding based on request priority during the incident. The different colors in the graph represent requests with different priority being throttled.

Members were happily watching their favorite show on Netflix while the infrastructure was self-recovering from a system failure.

We are not done yet

For future work, the team is looking into expanding the use of request priority for other use cases like better retry policies between devices and back-ends, dynamically changing load shedding thresholds, tuning the request priorities using Chaos Testing as a guiding principle, and other areas that will make Netflix even more resilient.

If you’re interested in helping Netflix stay up in the face of shifting systems and unexpected failures, reach out to us. We’re hiring!


Keeping Netflix Reliable Using Prioritized Load Shedding was originally published in Netflix TechBlog on Medium, where people are continuing the conversation by highlighting and responding to this story.

DNS Flag Day 2020

Post Syndicated from Christian Elmerot original https://blog.cloudflare.com/dns-flag-day-2020/

DNS Flag Day 2020

DNS Flag Day 2020

October 1 was this year’s DNS Flag Day. Read on to find out all about DNS Flag Day and how it affects Cloudflare’s DNS services (hint: it doesn’t, we already did the work to be compliant).

What is DNS Flag Day?

DNS Flag Day is an initiative by several DNS vendors and operators to increase the compliance of implementations with DNS standards. The goal is to make DNS more secure, reliable and robust. Rather than a push for new features, DNS flag day is meant to ensure that workarounds for non-compliance can be reduced and a common set of functionalities can be established and relied upon.

Last year’s flag day was February 1, and it set forth that servers and clients must be able to properly handle the Extensions to DNS (EDNS0) protocol (first RFC about EDNS0 are from 1999 – RFC 2671). This way, by assuming clients have a working implementation of EDNS0, servers can resort to always sending messages as EDNS0. This is needed to support DNSSEC, the DNS security extensions. We were, of course, more than thrilled to support the effort, as we’re keen to push DNSSEC adoption forward .

DNS Flag Day 2020

The goal for this year’s flag day is to increase DNS messaging reliability by focusing on problems around IP fragmentation of DNS packets. The intention is to reduce DNS message fragmentation which continues to be a problem. We can do that by ensuring cleartext DNS messages sent over UDP are not too large, as large messages risk being fragmented during the transport. Additionally, when sending or receiving large DNS messages, we have the ability to do so over TCP.

Problem with DNS transport over UDP

A potential issue with sending DNS messages over UDP is that the sender has no indication of the recipient actually receiving the message. When using TCP, each packet being sent is acknowledged (ACKed) by the recipient, and the sender will attempt to resend any packets not being ACKed. UDP, although it may be faster than TCP, does not have the same mechanism of messaging reliability. Anyone still wishing to use UDP as their transport protocol of choice will have to implement this reliability mechanism in higher layers of the network stack. For instance, this is what is being done in QUIC, the new Internet transport protocol used by HTTP/3 that is built on top of UDP.

Even the earliest DNS standards (RFC 1035) specified the use of sending DNS messages over TCP as well as over UDP. Unfortunately, the choice of supporting TCP or not was up to the implementer/operator, and then firewalls were sometimes set to block DNS over TCP. More recent updates to RFC 1035, on the other hand, require that the DNS server is available to query using DNS over TCP.

DNS message fragmentation

Sending data over networks and the Internet is restricted to the limitation of how large each packet can be. Data is chopped up into a stream of packets, and sized to adhere to the Maximum Transmission Unit (MTU) of the network. MTU is typically 1500 bytes for IPv4 and, in the case of IPv6, the minimum is 1280 bytes. Subtracting both the IP header size (IPv4 20 bytes/IPv6 40 bytes) and the UDP protocol header size (8 bytes) from the MTU, we end up with a maximum DNS message size of 1472 bytes for IPv4 and 1232 bytes in order for a message to fit within a single packet. If the message is any larger than that, it will have to be fragmented into more packets.

Sending large messages causes them to get fragmented into more than one pack. This is not a problem with TCP transports since each packet is ACK:ed to ensure proper delivery. However, the same does not hold true when sending large DNS messages over UDP. For many intents and purposes, UDP has been treated as a second-class citizen to TCP as far as network routing is concerned. It is quite common to see UDP packet fragments being dropped by routers and firewalls, potentially causing parts of a message to be lost. To avoid fragmentation over UDP it is better to truncate the DNS message and set the Truncation Flag in the DNS response. This tells the recipient that more data is available if the query is retried over TCP.

DNS Flag Day 2020 wants to ensure that DNS message fragmentation does not happen. When larger DNS messages need to be sent, we need to ensure it can be done reliably over TCP.

DNS servers need to support DNS message transport over TCP in order to be compliant with this year’s flag day. Also, DNS messages sent over UDP must never exceed the limit over which they risk being fragmented.

Cloudflare authoritative DNS and 1.1.1.1

We fully support the DNS Flag Day initiative, as it aims to make DNS more reliable and robust, and it ensures a common set of features for the DNS community to evolve on. In the DNS ecosystem, we are as much a client as we are a provider. When we perform DNS lookups on behalf of our customers and users, we rely on other providers to follow standards and be compliant. When they are not, and we can’t work around the issues, it leads to problems resolving names and reaching resources.

Both our public resolver 1.1.1.1 as well as our authoritative DNS service, set and enforce reasonable limits on DNS message sizes when sent over UDP. Of course, both services are available over TCP. If you’re already using Cloudflare, there is nothing you need to do but to keep using our DNS services! We will continually work on improving DNS.

Oh, and you can test your domain on the DNS Flag Day site: https://dnsflagday.net/2020/

Secondary DNS – Deep Dive

Post Syndicated from Alex Fattouche original https://blog.cloudflare.com/secondary-dns-deep-dive/

How Does Secondary DNS Work?

Secondary DNS - Deep Dive

If you already understand how Secondary DNS works, please feel free to skip this section. It does not provide any Cloudflare-specific information.

Secondary DNS has many use cases across the Internet; however, traditionally, it was used as a synchronized backup for when the primary DNS server was unable to respond to queries. A more modern approach involves focusing on redundancy across many different nameservers, which in many cases broadcast the same anycasted IP address.

Secondary DNS involves the unidirectional transfer of DNS zones from the primary to the Secondary DNS server(s). One primary can have any number of Secondary DNS servers that it must communicate with in order to keep track of any zone updates. A zone update is considered a change in the contents of a  zone, which ultimately leads to a Start of Authority (SOA) serial number increase. The zone’s SOA serial is one of the key elements of Secondary DNS; it is how primary and secondary servers synchronize zones. Below is an example of what an SOA record might look like during a dig query.

example.com	3600	IN	SOA	ashley.ns.cloudflare.com. dns.cloudflare.com. 
2034097105  // Serial
10000 // Refresh
2400 // Retry
604800 // Expire
3600 // Minimum TTL

Each of the numbers is used in the following way:

  1. Serial – Used to keep track of the status of the zone, must be incremented at every change.
  2. Refresh – The maximum number of seconds that can elapse before a Secondary DNS server must check for a SOA serial change.
  3. Retry – The maximum number of seconds that can elapse before a Secondary DNS server must check for a SOA serial change, after previously failing to contact the primary.
  4. Expire – The maximum number of seconds that a Secondary DNS server can serve stale information, in the event the primary cannot be contacted.
  5. Minimum TTL – Per RFC 2308, the number of seconds that a DNS negative response should be cached for.

Using the above information, the Secondary DNS server stores an SOA record for each of the zones it is tracking. When the serial increases, it knows that the zone must have changed, and that a zone transfer must be initiated.  

Serial Tracking

Serial increases can be detected in the following ways:

  1. The fastest way for the Secondary DNS server to keep track of a serial change is to have the primary server NOTIFY them any time a zone has changed using the DNS protocol as specified in RFC 1996, Secondary DNS servers will instantly be able to initiate a zone transfer.
  2. Another way is for the Secondary DNS server to simply poll the primary every “Refresh” seconds. This isn’t as fast as the NOTIFY approach, but it is a good fallback in case the notifies have failed.

One of the issues with the basic NOTIFY protocol is that anyone on the Internet could potentially notify the Secondary DNS server of a zone update. If an initial SOA query is not performed by the Secondary DNS server before initiating a zone transfer, this is an easy way to perform an amplification attack. There is two common ways to prevent anyone on the Internet from being able to NOTIFY Secondary DNS servers:

  1. Using transaction signatures (TSIG) as per RFC 2845. These are to be placed as the last record in the extra records section of the DNS message. Usually the number of extra records (or ARCOUNT) should be no more than two in this case.
  2. Using IP based access control lists (ACL). This increases security but also prevents flexibility in server location and IP address allocation.

Generally NOTIFY messages are sent over UDP, however TCP can be used in the event the primary server has reason to believe that TCP is necessary (i.e. firewall issues).

Zone Transfers

In addition to serial tracking, it is important to ensure that a standard protocol is used between primary and Secondary DNS server(s), to efficiently transfer the zone. DNS zone transfer protocols do not attempt to solve the confidentiality, authentication and integrity triad (CIA); however, the use of TSIG on top of the basic zone transfer protocols can provide integrity and authentication. As a result of DNS being a public protocol, confidentiality during the zone transfer process is generally not a concern.

Authoritative Zone Transfer (AXFR)

AXFR is the original zone transfer protocol that was specified in RFC 1034 and RFC 1035 and later further explained in RFC 5936. AXFR is done over a TCP connection because a reliable protocol is needed to ensure packets are not lost during the transfer. Using this protocol, the primary DNS server will transfer all of the zone contents to the Secondary DNS server, in one connection, regardless of the serial number. AXFR is recommended to be used for the first zone transfer, when none of the records are propagated, and IXFR is recommended after that.

Incremental Zone Transfer (IXFR)

IXFR is the more sophisticated zone transfer protocol that was specified in RFC 1995. Unlike the AXFR protocol, during an IXFR, the primary server will only send the secondary server the records that have changed since its current version of the zone (based on the serial number). This means that when a Secondary DNS server wants to initiate an IXFR, it sends its current serial number to the primary DNS server. The primary DNS server will then format its response based on previous versions of changes made to the zone. IXFR messages must obey the following pattern:

  1. Current latest SOA
  2. Secondary server current SOA
  3. DNS record deletions
  4. Secondary server current SOA + changes
  5. DNS record additions
  6. Current latest SOA

Steps 2,3,4,5,6 can be repeated any number of times, as each of those represents one change set of deletions and additions, ultimately leading to a new serial.

IXFR can be done over UDP or TCP, but again TCP is generally recommended to avoid packet loss.

How Does Secondary DNS Work at Cloudflare?

The DNS team loves microservice architecture! When we initially implemented Secondary DNS at Cloudflare, it was done using Mesos Marathon. This allowed us to separate each of our services into several different marathon apps, individually scaling apps as needed. All of these services live in our core data centers. The following services were created:

  1. Zone Transferer – responsible for attempting IXFR, followed by AXFR if IXFR fails.
  2. Zone Transfer Scheduler – responsible for periodically checking zone SOA serials for changes.
  3. Rest API – responsible for registering new zones and primary nameservers.

In addition to the marathon apps, we also had an app external to the cluster:

  1. Notify Listener – responsible for listening for notifies from primary servers and telling the Zone Transferer to initiate an AXFR/IXFR.

Each of these microservices communicates with the others through Kafka.

Secondary DNS - Deep Dive
Figure 1: Secondary DNS Microservice Architecture‌‌

Once the zone transferer completes the AXFR/IXFR, it then passes the zone through to our zone builder, and finally gets pushed out to our edge at each of our 200 locations.

Although this current architecture worked great in the beginning, it left us open to many vulnerabilities and scalability issues down the road. As our Secondary DNS product became more popular, it was important that we proactively scaled and reduced the technical debt as much as possible. As with many companies in the industry, Cloudflare has recently migrated all of our core data center services to Kubernetes, moving away from individually managed apps and Marathon clusters.

What this meant for Secondary DNS is that all of our Marathon-based services, as well as our NOTIFY Listener, had to be migrated to Kubernetes. Although this long migration ended up paying off, many difficult challenges arose along the way that required us to come up with unique solutions in order to have a seamless, zero downtime migration.

Challenges When Migrating to Kubernetes

Although the entire DNS team agreed that kubernetes was the way forward for Secondary DNS, it also introduced several challenges. These challenges arose from a need to properly scale up across many distributed locations while also protecting each of our individual data centers. Since our core does not rely on anycast to automatically distribute requests, as we introduce more customers, it opens us up to denial-of-service attacks.

The two main issues we ran into during the migration were:

  1. How do we create a distributed and reliable system that makes use of kubernetes principles while also making sure our customers know which IPs we will be communicating from?
  2. When opening up a public-facing UDP socket to the Internet, how do we protect ourselves while also preventing unnecessary spam towards primary nameservers?.

Issue 1:

As was previously mentioned, one form of protection in the Secondary DNS protocol is to only allow certain IPs to initiate zone transfers. There is a fine line between primary servers allow listing too many IPs and them having to frequently update their IP ACLs. We considered several solutions:

  1. Open source k8s controllers
  2. Altering Network Address Translation(NAT) entries
  3. Do not use k8s for zone transfers
  4. Allowlist all Cloudflare IPs and dynamically update
  5. Proxy egress traffic

Ultimately we decided to proxy our egress traffic from k8s, to the DNS primary servers, using static proxy addresses. Shadowsocks-libev was chosen as the SOCKS5 implementation because it is fast, secure and known to scale. In addition, it can handle both UDP/TCP and IPv4/IPv6.

Secondary DNS - Deep Dive
Figure 2: Shadowsocks proxy Setup

The partnership of k8s and Shadowsocks combined with a large enough IP range brings many benefits:

  1. Horizontal scaling
  2. Efficient load balancing
  3. Primary server ACLs only need to be updated once
  4. It allows us to make use of kubernetes for both the Zone Transferer and the Local ShadowSocks Proxy.
  5. Shadowsocks proxy can be reused by many different Cloudflare services.

Issue 2:

The Notify Listener requires listening on static IPs for NOTIFY Messages coming from primary DNS servers. This is mostly a solved problem through the use of k8s services of type loadbalancer, however exposing this service directly to the Internet makes us uneasy because of its susceptibility to attacks. Fortunately DDoS protection is one of Cloudflare’s strengths, which lead us to the likely solution of dogfooding one of our own products, Spectrum.

Spectrum provides the following features to our service:

  1. Reverse proxy TCP/UDP traffic
  2. Filter out Malicious traffic
  3. Optimal routing from edge to core data centers
  4. Dual Stack technology
Secondary DNS - Deep Dive
Figure 3: Spectrum interaction with Notify Listener

Figure 3 shows two interesting attributes of the system:

  1. Spectrum <-> k8s IPv4 only:
  2. This is because our custom k8s load balancer currently only supports IPv4; however, Spectrum has no issue terminating the IPv6 connection and establishing a new IPv4 connection.
  3. Spectrum <-> k8s routing decisions based of L4 protocol:
  4. This is because k8s only supports one of TCP/UDP/SCTP per service of type load balancer. Once again, spectrum has no issues proxying this correctly.

One of the problems with using a L4 proxy in between services is that source IP addresses get changed to the source IP address of the proxy (Spectrum in this case). Not knowing the source IP address means we have no idea who sent the NOTIFY message, opening us up to attack vectors. Fortunately, Spectrum’s proxy protocol feature is capable of adding custom headers to TCP/UDP packets which contain source IP/Port information.

As we are using miekg/dns for our Notify Listener, adding proxy headers to the DNS NOTIFY messages would cause failures in validation at the DNS server level. Alternatively, we were able to implement custom read and write decorators that do the following:

  1. Reader: Extract source address information on inbound NOTIFY messages. Place extracted information into new DNS records located in the additional section of the message.
  2. Writer: Remove additional records from the DNS message on outbound NOTIFY replies. Generate a new reply using proxy protocol headers.

There is no way to spoof these records, because the server only permits two extra records, one of which is the optional TSIG. Any other records will be overwritten.

Secondary DNS - Deep Dive
Figure 4: Proxying Records Between Notifier and Spectrum‌‌

This custom decorator approach abstracts the proxying away from the Notify Listener through the use of the DNS protocol.  

Although knowing the source IP will block a significant amount of bad traffic, since NOTIFY messages can use both UDP and TCP, it is prone to IP spoofing. To ensure that the primary servers do not get spammed, we have made the following additions to the Zone Transferer:

  1. Always ensure that the SOA has actually been updated before initiating a zone transfer.
  2. Only allow at most one working transfer and one scheduled transfer per zone.

Additional Technical Challenges

Zone Transferer Scheduling

As shown in figure 1, there are several ways of sending Kafka messages to the Zone Transferer in order to initiate a zone transfer. There is no benefit in having a large backlog of zone transfers for the same zone. Once a zone has been transferred, assuming no more changes, it does not need to be transferred again. This means that we should only have at most one transfer ongoing, and one scheduled transfer at the same time, for any zone.

If we want to limit our number of scheduled messages to one per zone, this involves ignoring Kafka messages that get sent to the Zone Transferer. This is not as simple as ignoring specific messages in any random order. One of the benefits of Kafka is that it holds on to messages until the user actually decides to acknowledge them, by committing that messages offset. Since Kafka is just a queue of messages, it has no concept of order other than first in first out (FIFO). If a user is capable of reading from the Kafka topic concurrently, it is entirely possible that a message in the middle of the queue be committed before a message at the end of the queue.

Most of the time this isn’t an issue, because we know that one of the concurrent readers has read the message from the end of the queue and is processing it. There is one Kubernetes-related catch to this issue, though: pods are ephemeral. The kube master doesn’t care what your concurrent reader is doing, it will kill the pod and it’s up to your application to handle it.

Consider the following problem:

Secondary DNS - Deep Dive
Figure 5: Kafka Partition‌‌
  1. Read offset 1. Start transferring zone 1.
  2. Read offset 2. Start transferring zone 2.
  3. Zone 2 transfer finishes. Commit offset 2, essentially also marking offset 1.
  4. Restart pod.
  5. Read offset 3 Start transferring zone 3.

If these events happen, zone 1 will never be transferred. It is important that zones stay up to date with the primary servers, otherwise stale data will be served from the Secondary DNS server. The solution to this problem involves the use of a list to track which messages have been read and completely processed. In this case, when a zone transfer has finished, it does not necessarily mean that the kafka message should be immediately committed. The solution is as follows:

  1. Keep a list of Kafka messages, sorted based on offset.
  2. If finished transfer, remove from list:
  3. If the message is the oldest in the list, commit the messages offset.
Secondary DNS - Deep Dive
Figure 6: Kafka Algorithm to Solve Message Loss

This solution is essentially soft committing Kafka messages, until we can confidently say that all other messages have been acknowledged. It’s important to note that this only truly works in a distributed manner if the Kafka messages are keyed by zone id, this will ensure the same zone will always be processed by the same Kafka consumer.

Life of a Secondary DNS Request

Although Cloudflare has a large global network, as shown above, the zone transferring process does not take place at each of the edge datacenter locations (which would surely overwhelm many primary servers), but rather in our core data centers. In this case, how do we propagate to our edge in seconds? After transferring the zone, there are a couple more steps that need to be taken before the change can be seen at the edge.

  1. Zone Builder – This interacts with the Zone Transferer to build the zone according to what Cloudflare edge understands. This then writes to Quicksilver, our super fast, distributed KV store.
  2. Authoritative Server – This reads from Quicksilver and serves the built zone.
Secondary DNS - Deep Dive
Figure 7: End to End Secondary DNS‌‌

What About Performance?

At the time of writing this post, according to dnsperf.com, Cloudflare leads in global performance for both Authoritative and Resolver DNS. Here, Secondary DNS falls under the authoritative DNS category here. Let’s break down the performance of each of the different parts of the Secondary DNS pipeline, from the primary server updating its records, to them being present at the Cloudflare edge.

  1. Primary Server to Notify Listener – Our most accurate measurement is only precise to the second, but we know UDP/TCP communication is likely much faster than that.
  2. NOTIFY to Zone Transferer – This is negligible
  3. Zone Transferer to Primary Server – 99% of the time we see ~800ms as the average latency for a zone transfer.
Secondary DNS - Deep Dive
Figure 8: Zone XFR latency

4. Zone Transferer to Zone Builder – 99% of the time we see ~10ms to build a zone.

Secondary DNS - Deep Dive
Figure 9: Zone Build time

5. Zone Builder to Quicksilver edge: 95% of the time we see less than 1s propagation.

Secondary DNS - Deep Dive
Figure 10: Quicksilver propagation time

End to End latency: less than 5 seconds on average. Although we have several external probes running around the world to test propagation latencies, they lack precision due to their sleep intervals, location, provider and number of zones that need to run. The actual propagation latency is likely much lower than what is shown in figure 10. Each of the different colored dots is a separate data center location around the world.

Secondary DNS - Deep Dive
Figure 11: End to End Latency

An additional test was performed manually to get a real world estimate, the test had the following attributes:

Primary server: NS1
Number of records changed: 1
Start test timer event: Change record on NS1
Stop test timer event: Observe record change at Cloudflare edge using dig
Recorded timer value: 6 seconds

Conclusion

Cloudflare serves 15.8 trillion DNS queries per month, operating within 100ms of 99% of the Internet-connected population. The goal of Cloudflare operated Secondary DNS is to allow our customers with custom DNS solutions, be it on-premise or some other DNS provider, to be able to take advantage of Cloudflare’s DNS performance and more recently, through Secondary Override, our proxying and security capabilities too. Secondary DNS is currently available on the Enterprise plan, if you’d like to take advantage of it, please let your account team know. For additional documentation on Secondary DNS, please refer to our support article.