Version
6.0.0 of the Hurl command-line tool has been released. Hurl is
curl-powered utility that runs HTTP requests and tests defined in a
plain-text Hurl
file. Notable features in this release include the ability to
generate dynamic values with functions, shorter syntax, and an option
to export Hurl files to a list of curl commands. See the release
notes for a full list of changes and downloads.
Artificial intelligence (AI) is transforming industries, and education is no exception. AI-driven development environments (AIDEs), like GitHub Copilot, are opening up new possibilities, and educators and researchers are keen to understand how these tools impact students learning to code.
In our 50th research seminar, Nicholas Gardella, a PhD candidate at the University of Virginia, shared insights from his research on the effects of AIDEs on beginner programmers’ skills.
Nicholas Gardella focuses his research on understanding human interactions with artificial intelligence-based code generators to inform responsible adoption in computer science education.
Measuring AI’s impact on students
AI tools are becoming a big part of software development, but what does that mean for students learning to code? As tools like GitHub Copilot become more common, it’s crucial to ask: Do these tools help students to learn better and work more effectively, especially when time is tight?
This is precisely what Nicholas’s research aims to identify by examining the impact of AIDEs on four key areas:
Performance (how well students completed the tasks)
Workload (the effort required)
Emotion (their emotional state during the task)
Self-efficacy (their belief in their own abilities to succeed)
Nicholas conducted his study with 17 undergraduate students from an introductory computer science course, who were mostly first-time programmers, with different genders and backgrounds.
By luckybusiness
The students completed programming tasks both with and without the assistance of GitHub Copilot. Nicholas selected the tasks from OpenAI’s human evaluation data set, ensuring they represented a range of difficulty levels. He also used a repeated measures design for the study, meaning that each student had the opportunity to program both independently and with AI assistance multiple times. This design helped him to compare individual progress and attitudes towards using AI in programming.
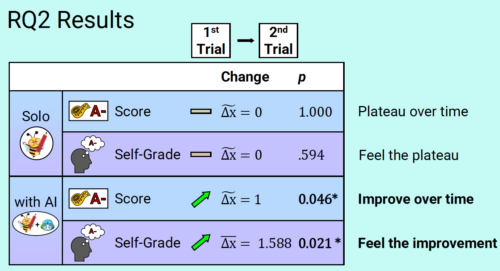
Less workload, more performance and self-efficacy in learning
The results were promising for those advocating AI’s role in education. Nicholas’s research found that participants who used GitHub Copilot performed better overall, completing tasks with less mental workload and effort compared to solo programming.
Nicholas used several measures to find out whether AIDEs affected students’ emotional states.
However, the immediate impact on students’ emotional state and self-confidence was less pronounced. Initially, participants did not report feeling more confident while coding with AI. Over time, though, as they became more familiar with the tool, their confidence in their abilities improved slightly. This indicates that students need time and practice to fully integrate AI into their learning process. Students increasingly attributed their progress not to the AI doing the work for them, but to their own growing proficiency in using the tool effectively. This suggests that with sustained practice, students can gain confidence in their abilities to work with AI, rather than becoming overly reliant on it.
Students who used AI tools seemed to improve more quickly than students who worked on the exercises themselves.
A particularly important takeaway from the talk was the reduction in workload when using AI tools. Novice programmers, who often find programming challenging, reported that AI assistance lightened the workload. This reduced effort could create a more relaxed learning environment, where students feel less overwhelmed and more capable of tackling challenging tasks.
However, while workload decreased, use of the AI tool did not significantly boost emotional satisfaction or happiness during the coding process. Nicholas explained that although students worked more efficiently, using the AI tool did not necessarily make coding a more enjoyable experience. This highlights a key challenge for educators: finding ways to make learning both effective and engaging, even when using advanced tools like AI.
AI as a tool for collaboration, not replacement
Nicholas’s findings raise interesting questions about how AI should be introduced in computer science education. While tools like GitHub Copilot can enhance performance, they should not be seen as shortcuts for learning. Students still need guidance in how to use these tools responsibly. Importantly, the study showed that students did not take credit for the AI tool’s work — instead, they felt responsible for their own progress, especially as they improved their interactions with the tool over time.
Rick Payne and team / Better Images of AI / Ai is… Banner / CC-BY 4.0
Students might become better programmers when they learn how to work alongside AI systems, using them to enhance their problem-solving skills rather than relying on them for answers. This suggests that educators should focus on teaching students how to collaborate with AI, rather than fearing that these tools will undermine the learning process.
Bridging research and classroom realities
Moreover, the study touched on an important point about the limits of its findings. Since the experiment was conducted in a controlled environment with only 17 participants, researchers need to conduct further studies to explore how AI tools perform in real-world classroom settings. For example, the role of internet usage plays a fundamental role. It will be relevant to understand how factors such as class size, prior varying experience, and the age of students affect their ability to integrate AI into their learning.
In the follow-up discussion, Nicholas also demonstrated how AI tools are becoming more accessible within browsers and how teachers can integrate AI-driven development environments more easily into their courses. By making AI technology more readily available, these tools are democratising access to advanced programming aids, enabling students to build applications directly in their web browsers with minimal setup.
The path ahead
Nicholas’s talk provided an insightful look into the evolving relationship between AI tools and novice programmers. While AI can improve performance and reduce workload, it is not a magic solution to all the challenges of learning to code.
Based on the discussion after the talk, educators should support students in developing the skills to use these tools effectively, shaping an environment where they can feel confident working with AI systems. The researchers and educators agreed that more research is needed to expand on these findings, particularly in more diverse and larger-scale educational settings.
As AI continues to shape the future of programming education, the role of educators will remain crucial in guiding students towards responsible and effective use of these technologies, as we are only at the beginning.
Join our next seminar
In our current seminar series, we are exploring how to teach programming with and without AI technology. Join us at our next seminar on Tuesday, 10 December at 17:00–18:30 GMT to hear Leo Porter (UC San Diego) and Daniel Zingaro (University of Toronto) discuss how they are working to create an introductory programming course for majors and non-majors that fully incorporates generative AI into the learning goals of the course.
To sign up and take part in the seminar, click the button below — we’ll then send you information about joining. We hope to see you there.
Security updates have been issued by Red Hat (go-toolset:rhel8, grafana, kernel, kernel-rt, kernel:4.18.0, pam, pam:1.5.1, pcs, postgresql:12, postgresql:15, postgresql:16, python3:3.6.8, qemu-kvm, rhc, rhc-worker-playbook, and virt:rhel and virt-devel:rhel) and SUSE (ansible-10, ansible-core, avahi, bpftool, python, python3, python36, webkit2gtk3, and xen).
It’s been the biggest year for elections in human history: 2024 is a “super-cycle” year in which 3.7 billion eligible voters in 72 countries had the chance to go the polls. These are also the first AI elections, where many feared that deepfakes and artificial intelligence-generated misinformation would overwhelm the democratic processes. As 2024 draws to a close, it’s instructive to take stock of how democracy did.
In a Pew survey of Americans from earlier this fall, nearly eight times as many respondents expected AI to be used for mostly bad purposes in the 2024 election as those who thought it would be used mostly for good. There are real concerns and risks in using AI in electoral politics, but it definitely has not been all bad.
The dreaded “death of truth” has not materialized—at least, not due to AI. And candidates are eagerly adopting AI in many places where it can be constructive, if used responsibly. But because this all happens inside a campaign, and largely in secret, the public often doesn’t see all the details.
Connecting with voters
One of the most impressive and beneficial uses of AI is language translation, and campaigns have started using it widely. Local governments in Japan and California and prominent politicians, including India Prime Minister Narenda Modi and New York City Mayor Eric Adams, used AI to translate meetings and speeches to their diverse constituents.
Even when politicians themselves aren’t speaking through AI, their constituents might be using it to listen to them. Google rolled out free translation services for an additional 110 languages this summer, available to billions of people in real time through their smartphones.
Other candidates used AI’s conversational capabilities to connect with voters. U.S. politicians Asa Hutchinson, Dean Phillips and Francis Suarez deployed chatbots of themselves in their presidential primary campaigns. The fringe candidate Jason Palmer beat Joe Biden in the American Samoan primary, at least partly thanks to using AI-generated emails, texts, audio and video. Pakistan’s former prime minister, Imran Khan, used an AI clone of his voice to deliver speeches from prison.
Perhaps the most effective use of this technology was in Japan, where an obscure and independent Tokyo gubernatorial candidate, Takahiro Anno, used an AI avatar to respond to 8,600 questions from voters and managed to come in fifth among a highly competitive field of 56 candidates.
Nuts and bolts
AIs have been used in political fundraising as well. Companies like Quiller and Tech for Campaigns market AIs to help draft fundraising emails. Other AI systems help candidates target particular donors with personalized messages. It’s notoriously difficult to measure the impact of these kinds of tools, and political consultants are cagey about what really works, but there’s clearly interest in continuing to use these technologies in campaign fundraising.
Polling has been highly mathematical for decades, and pollsters are constantly incorporating new technologies into their processes. Techniques range from using AI to distill voter sentiment from social networking platforms—something known as “social listening“—to creating synthetic voters that can answer tens of thousands of questions. Whether these AI applications will result in more accurate polls and strategic insights for campaigns remains to be seen, but there ispromisingresearch motivated by the ever-increasing challenge of reaching real humans with surveys.
In 2024, similar capabilities were almost certainly used in a variety of elections around the world. In the U.S., for example, a Georgia politician used AI to produce blog posts, campaign images and podcasts. Even standard productivity software suites like those from Adobe, Microsoft and Google now integrate AI features that are unavoidable—and perhaps very useful to campaigns. Other AI systems help advise candidates looking to run for higher office.
Fakes and counterfakes
And there was AI-created misinformation and propaganda, even though it was not as catastrophic as feared. Days before a Slovakian election in 2023, fake audio discussing election manipulation went viral. This kind of thing happened many times in 2024, but it’s unclear if any of it had any real effect.
In the U.S. presidential election, there was a lot of press after a robocall of a fake Joe Biden voice told New Hampshire voters not to vote in the Democratic primary, but that didn’t appear to make much of a difference in that vote. Similarly, AI-generated images from hurricane disaster areas didn’t seem to have much effect, and neither did a stream of AI-faked celebrity endorsements or viral deepfake images and videos misrepresenting candidates’ actions and seemingly designed to prey on their political weaknesses.
AI also played a role in protecting the information ecosystem. OpenAI used its own AI models to disrupt an Iranian foreign influence operation aimed at sowing division before the U.S. presidential election. While anyone can use AI tools today to generate convincing fake audio, images and text, and that capability is here to stay, tech platforms also use AI to automatically moderate content like hate speech and extremism. This is a positive use case, making content moderation more efficient and sparing humans from having to review the worst offenses, but there’s room for it to become more effective, more transparent and more equitable.
There is potential for AI models to be much more scalable and adaptable to more languages and countries than organizations of human moderators. But the implementations to date on platforms like Meta demonstrate that a lot more work needs to be done to make these systems fair and effective.
One thing that didn’t matter much in 2024 was corporate AI developers’ prohibitions on using their tools for politics. Despite market leader OpenAI’s emphasis on banning political uses and its use of AI to automatically reject a quarter-million requests to generate images of political candidates, the company’s enforcement has been ineffective and actual use is widespread.
The genie is loose
All of these trends—both good and bad—are likely to continue. As AI gets more powerful and capable, it is likely to infiltrate every aspect of politics. This will happen whether the AI’s performance is superhuman or suboptimal, whether it makes mistakes or not, and whether the balance of its use is positive or negative. All it takes is for one party, one campaign, one outside group, or even an individual to see an advantage in automation.
This essay was written with Nathan E. Sanders, and originally appeared in The Conversation.
Интернет форумите са пълни с въпроси от типа „На кого да се оплача, че в моята сграда има такъв или онакъв проблем?“. Освен да чакаме някой външен (община, законодател, инспекция и т.н.) да реши наш проблем, можем да действаме законосъобразно и сами.
В сградата, в която живеем, можем най-лесно да постигнем промяна, защото там гласът ни има голяма тежест. Необходимо е да убедим не твърде много хора, че дадена инициатива е добра или даден ремонт е необходим. А и да не забравяме, че притежаваме част от сградата – т.нар. идеални части.
Домоуправителите нямат магически способности, те помагат на собствениците да поддържат общата сграда. Всеки би могъл обаче:
Да участва в общи събрания. „Каквото решите“, „все ми е тая“, „няма смисъл“ – подобни оправдания по-скоро са причина нещата да не стават.
Да взема участие в управлението на сградата и така да се запознае как се работи на публична длъжност, която често е без доход.
Да помага на управителните органи, например със събиране на оферти, организиране на ремонти, звънене по телефони и звънци и разговори с неизрядни длъжници, идеи, труд. Или поне да не им пречи.
Няколко души притежаваме обща и скъпа вещ. Работим, за да си я позволим по десет и повече години. Логично е да я пазим, да я поддържаме и тя да запазва стойността си с времето.
Да, етажната собственост (ЕС) е такава вещ, но отношението към нея не следва тази логика. Въпреки че за мнозина да си купиш апартамент е ангажимент да изплащаш ипотека 15 и повече години, състоянието на съсобствените сгради в България не е цветущо. Достатъчно е да се огледаме около себе си. По сградата си личи колко се разбираме в малкия колектив, в който сме попаднали, и дали намираме общ език, за да защитаваме общата ни инвестиция.
Многофамилните сгради в България се регулират от Закона за управление на етажната собственост (ЗУЕС). Само в София те са около 23 000. Всяка сграда трябва да има управител (или домоуправител, както много хора са свикнали до го наричат), който се избира от Общо събрание (ОС). То е своеобразен малък парламент, в който трябва да участват всички собственици. С мнозинство се вземат решения какво да се прави на територията на общата съсобственост, а (домо)управителят трябва да изпълнява решенията.
Дотук с теорията. В реалността обаче понякога управлението на сгради се практикува дори от хора, които не са прочели ЗУЕС. Но те пък се избират от собственици, които също не са наясно с този закон. Може би ако се говори повече за ЗУЕС, повече хора ще разберат как работи, и ще се опитват да го спазват.
Дотогава споделям някои от собствените си наблюдения за сградите около нас през призмата на познанията и опита ми, свързани с темата за етажната собственост.
Проблемите
За да буксува управлението на етажните собствености, има няколко основни проблема:
Апатия
Ако живеем в многофамилна сграда, вероятно от собствен опит знаем, че трудно се събират достатъчно участници в събранията. Знае го и законодателят, който с последните промени в ЗУЕС леко намали кворума за легитимно ОС. Това, което неучастващите собственици често не осъзнават, е, че липсата на необходимото присъствие блокира работата на домоуправителя. Например как един управител да започне да събира значителна сума за ремонт на покрив, ако тя е одобрена от 13,01% (в ЗУЕС голяма част от решенията се вземат с половината присъстващи и минималният кворум е 26%)? На теория е законно, но дали управителят ще успее? Как да стартира принудително събиране от нередовни платци, ако има само 13% одобрение? Най-вероятно нередовните първо ще обвинят и наговорят „приятни“ думи на управителя, а той ще има рехава подкрепа от останалите съседи.
Законодателни несъвършенства
Макар да е ясно, че е малко вероятно в събранието да участват достатъчно присъстващи, при промените от септември 2023 г. законодателят вдигна дела гласуващи, който е необходим за избор на домоуправител. Преди той беше над 50% от присъстващите на събранието, но след измененията вече е над 50% от всички собственици.
През септември 2023 г., от една страна, се направиха няколко дигитални стъпки: въведе се имейл за комуникация с управител и съседи и дистанционно и онлайн гласуване. От друга страна обаче, се въведе ежемесечен отчет, при това задължително на хартия.
Законът е сложен
Ако някой собственик има желание да участва в управлението на сградата си, той невинаги разбира формалните изисквания и успява да води правилно документацията. Всяко юридическо лице трябва да се подчинява на счетоводните и данъчните стандарти. Но при управлението на ЕС се наблюдават значителни импровизации във воденето на документацията. Управителите и касиерите сами избират как да го правят, а това затруднява институционалната помощ, когато е необходима – например при събиране на задължения по съдебен ред.
Фирми и частни лица, управляващи ЕС
На пазара може да се намерят т.нар. професионални домоуправители – търговски фирми, които предлагат (срещу определена такса) да отменят собствениците в грижата по поддръжката на сградите, събирането на таксите и т.н. За съжаление обаче, липсва достатъчна публичност на добрите и лошите практики при тези търговци. И когато се съберат неинформираността на собствениците как работи ЗУЕС, и липсата на кворум на събрание, може сградата да се окаже „вързана“ за конкретна фирма.
На много хора им е позната ситуацията да се събират вноски за възнаграждение на фирмата и нищо да не се подобрява в сградата. Проблемът с тези фирми е в топ 4 на получените становища от Министерството на регионалното развитие и благоустройството при обсъждането на промените в ЗУЕС от 2019–2020 г. За съжаление, след промените на закона през 2023 г. няма голямо подобрение за този казус. По-скоро новата редакция на закона доста ще затрудни най-малките играчи – частни лица, управляващи 3–4 близки входа или сгради. Тези домоуправители се препоръчват от „уста на уста“ и са от най-съвестните.
Ще бъде по-трудно и за най-малките фирми с един-двама служители. По-сложно става и за управителите собственици, чийто избор вече трябва да става с над 50% от всички собственици. Административната трудност за най-дребните играчи не означава обаче подобряване на услугата в сектора.
Пасивност в Столичната община
Столичната община (СО) няма пълни данни как се управляват сградите. Не разполага с данни и за качеството на сградите. Липсата на информация ѝ пречи да работи заедно с ЕС за подобряване на околоблоковото пространство например. Ала същевременно Общината не поема инициативата това да се промени.
Въпреки че ЗУЕС е обект на много критики, той подчертава ролята на местната власт като основен помощник на етажните собствености. Кметът е задължен да назначи управител, ако няма такъв, издава актове за административни нарушения в сградата, може да разпореди неотложен ремонт и т.н. Общината обаче невинаги изпълнява тези свои функции ефективно.
Ако заеме по-активна позиция в процесите, засягащи ЕС, Общината може значително да подобри тяхното функциониране и да допринесе за създаването на по-привлекателна жизнена среда за жителите на многофамилните жилищни сгради.
Ето няколко предложения как СО би могла активно да подобри ставащото на територията на ЕС и в междублоковите пространства:
Комуникация, комуникация, комуникация. Една от основните причини за ниската активност в общите събрания е липсата на информираност сред собствениците какви са техните права и отговорности. Общината би могла да играе по-активна роля в повишаването на обществената осведоменост чрез информационни кампании, семинари и онлайн ресурси, обясняващи ползите от активното участие в управлението на ЕС и на стъпките, включени в процеса. Тя може да организира редовни срещи или форуми, на които собствениците и мениджърите на ЕС да имат възможност да обсъждат своите притеснения и да търсят решения заедно.
Опростяване на процедурите. Законодателството за ЕС е сложно и объркващо и обезсърчава собствениците да участват активно в управлението. Би било полезно да се преразгледат и опростят съществуващите разпоредби, за да станат по-разбираеми и по-достъпни за всички собственици. Това може да включва разработването на ясни насоки или ръководства стъпка по стъпка за различните процеси – например свикване на ОС, вземане на решения и разрешаване на спорове. СО би могла да организира проучване и да предложи подходящи законодателни промени.
Подкрепа и насърчаване на добре управлявани сгради. Смисълът на подобна програма би бил да стимулира ЕС да подобрят своята ефективност, да поддържат сградите си и да създават по-приятна жизнена среда. За да участва в програмата, една ЕС трябва да изпълни определени критерии, свързани с управлението на сградата, поддръжката и спазването на законовите изисквания. Ето няколко примера за такива стимули:
Намаление на цената на картите за градски транспорт.
Преференциален достъп до спортни съоръжения – например плувни басейни, фитнес зали и спортни зали.
Поддръжка на зелените площи – Общината може да предложи съдействие за озеленяване на околоблоковото пространство – да предостави растения, пейки, детски съоръжения и др.
Други общински услуги – Общината може извърши анализ кои общински услуги биха могли да се предложат с отстъпка или безплатно на добре управлявани ЕС. Примерите може да включват услуги за управление на отпадъци, ремонти на обществени пространства, организиране на събития и т.н.
Събиране на данни и наблюдение. За да помогне на етажните собствености да стигнат до решение кое трябва да се подобри, и да вземат информирани решения, СО може да събира и споделя данни за състоянието на сградите, включително тяхната енергийна ефективност, инфраструктура, техническо състояние, ниво на поддръжка, събираемост на такси, текущи такси. Това ще позволи на Общината да разбере по-добре нуждите на етажните собствености да планират и предприемат инициативи за подобряване на състоянието си.
Ангажиране на общността. Включването на местните общности в усилията за подобряване на ЕС може да помогне за изграждането на чувство за общност и споделена отговорност. СО може да си партнира с квартални групи, училища и местни организации, за да популяризира значението на добре управляваните етажни собствености и да предостави възможности хората да допринесат за каузата.
Приоритизация. По данни на Националния статистически институт в столицата има близо 800 000 жилища и значителна част от тях са в режим на ЕС. Ако предположим, че един апартамент струва средно 100 000 евро, това означава, че жилищният актив само в София е поне 80 млрд. евро, което се доближава до размера на годишния брутен вътрешен продукт на държавата. А най-разпространената общинска услуга на експертите на СО за този доста скъп актив е… да регистрират домоуправители и да издават удостоверения. Ако СО играе по-активна роля в поддържането на жилищния фонд, ще повлияе върху подобряването на качеството на живот на гражданите и тяхната удовлетвореност от средата, в която живеят. Защото това, което виждаме най-често, когато излезем от къщи, са общият коридор, фоайе, асансьор и пространството около блока.
Освен идеите по-горе има и редица други неща, за които СО може съдейства.
Например за по-ефективно събиране на вземания от длъжници – да речем, чрез вписване на задълженията към ЕС при издаване на данъчна оценка. Или за извършване на неотложни ремонти по чл. 49 от ЗУЕС – защо за тази цел не се създаде фонд в СО, който се захранва от принудително събраните от собствениците средства за извършените ремонти? Или за спазване на санитарно-хигиенни норми – съдействие при случаи на събирачи на пречещи на обитателите на сградата животни и вехтории; миризми от съседи или търговски обекти и др. Или насочване към психолози и медиатори при конфликтни ситуации. И т.н.
Чрез прилагането на подобни мерки СО може да изиграе ключова роля в подпомагането на етажните собствености да преодолеят настоящите предизвикателства и да създадат по-приветлива, удобна и добре поддържана жилищна среда за над милион жители на София.
В настоящата ни съвместна поредица с „Екипът на София“ обсъждаме планирането, озеленяването, архитектурата, инфраструктурата, мобилността и още много други градски теми, описваме добрите примери и търсим възможните решения за подобряването на качеството на живот в нашите градове.
I hit a point where I just didn’t like this website any more. It was too… stuffy. Posts kept getting longer, more elaborate, more time-consuming to write. I didn’t recognize the tone any more, and when I look back at older posts, those are way snarkier than they need to be. I think I was trying to be taken seriously-but-not-too-seriously, and the voice that developed as a result was just really weird.
I kept looking at this blog and thinking… who is this? Who wrote this? And who is supposed to write more of this?
The previous design was based around “keep looking like sort of like the default Octopress theme I used to have”. I don’t think that was a great design philosophy, not least of all because I stopped using Octopress in 2012, and Octopress itself has been abandoned since 2015. But it was also just… beige. I think I was hoping that brown-ish would be reminiscent of Eevee colors?
So I redid it from scratch, based on the new design philosophy of “I like it”. And you know what? I like it! I hope you like it too. But also, I don’t care too much if you don’t, because it’s for me!
Also, hey, did you know CSS can do all kinds of crazy stuff now? Like nesting blocks? This blog used to use SCSS! Now it doesn’t need to! And I barely had to change anything! Maybe there’s a post in there.
You might need a recent browser, but you should be using a recent browser anyway.
My time on Cohost, which allowed near-arbitrary inline HTML and CSS, has rekindled a joy in doing stupid tricks with CSS, and so I’ve glued together a mountain of stupid tricks to make something more playful and distinct. Also I can draw better now than I could a decade ago, so I flexed those muscles a bit, too.
One thing I do slightly lament is that my games used to be above the fold (at least on my screen), and now they’re not. But I think this design actually rewards… scrolling down? So hopefully that helps. Not like I’m collecting metrics or anything.
I’ve intended to do this for ages. The old landing page contained an exhaustive list of… most things I’ve made or worked on, which made it kind of a cluttered mess. Now that exhaustive list has a real home as the landing page for c.eev.ee. I’ve been using this to host stuff (like Lexy’s Labyrinth) for ages, but the root page has been a 403 that whole time. Now it’s not! Wow!
Also: a list of my puzzles! There aren’t too many yet, but maybe there will be??
Pelican has both “articles”, which are dated, and “pages”, which are not. I looked over a lot of my old posts in the course of this redesign, and a lot of them are either out of date w.r.t. technical information, about an event that was only interesting for a brief time, or just… unmaintained?
Which all makes sense for something that has a date, right? Like, Wikipedia articles don’t have a date. Those are assumed to be reasonably current. And there’s something a little sad about writing a very lengthy post with a lot of details about something, and then watching it sink into the ocean of time. But keeping a post with “2015” in the URL up-to-date indefinitely doesn’t seem quite right.
So I’m taking a crack at “pages”. I expect the presentation will change a bit as I accumulate more, but I’ve seeded the idea with a couple starter pages:
Two pure-CSS toys/puzzles that were originally Cohost CSS crimes, now tidied up and with full
explanations: Lights Out and Rush Hour.
A lengthy list of variant sudoku types with full rules and examples, something that I hadn’t seen anywhere else.
At some point I put the category in the URL, so “normal” blog posts were at /blog/foo, whereas my dev log posts were at /dev/foo. I don’t know why I thought that was a good idea, and it makes it annoying to reshuffle the categories, so I’ve collapsed everything back into /blog.
There are redirects up the wazoo so this shouldn’t matter to anyone. But if you find a link to my site that 404s, I must’ve missed a redirect, so, please let me know.
The cool news is that instead of reverse-chrono categories, there’s now a much better way to find a post you’re looking for: I made a full list of all my writing! Enjoy. But don’t read anything from before 2015.
I probably forgot a lot of little things, and the layout is still a bit work-in-progress on very small screens. I’m also not entirely sure how to convey the distinction between articles/pages at a glance, and I don’t have a real name for the c.eev.ee page, so it’s called something different everywhere it appears.
Feel free to send me your nitpicks; I’d like this design to be more actively maintained than the old one was.
Coming up next: Posts?? More posts?????? Remember when I wrote posts????????
The AWS Glue Data Catalog now automates generating statistics for new tables. These statistics are integrated with the cost-based optimizer (CBO) from Amazon Redshift Spectrum and Amazon Athena, resulting in improved query performance and potential cost savings.
Queries on large datasets often read extensive amounts of data and perform complex join operations across multiple datasets. When a query engine like Redshift Spectrum or Athena processes the query, the CBO uses table statistics to optimize it. For example, if the CBO knows the number of distinct values in a table column, it can choose the optimal join order and strategy. These statistics must be collected beforehand and should be kept up to date to reflect the latest data state.
Previously, creating statistics for Iceberg tables in the Data Catalog required you to continuously monitor and update configurations for your tables. You had to do undifferentiated heavy lifting to do the following:
Discover new tables with specific data table formats (such as Parquet, JSON, CSV, XML, ORC, ION) and specific transactional data table formats such as Iceberg and their individual bucket paths
Determine and set up compute tasks based on scan strategy (sampling percentage and schedules)
Set up event notification systems to understand changes in data lakes
Set up specific optimizer configuration-based query performance and storage improvement strategies
Set up a scheduler or build your own event-based compute tasks with setup and teardown
Now, the Data Catalog lets you generate statistics automatically for updated and created tables with a one-time catalog configuration. You can get started by selecting the default catalog on the Lake Formation console and enabling table statistics on the table optimization configuration tab. As new tables are created, the number of distinct values (NDVs) are collected for Iceberg tables, and additional statistics such as the number of nulls, maximum, minimum, and average length are collected for other file formats such as Parquet. Redshift Spectrum and Athena can use the updated statistics to optimize queries, using optimizations such as optimal join order or cost-based aggregation pushdown. The AWS Glue console provides you visibility into the updated statistics and statistics generation runs.
Now, data lake administrators can configure weekly statistics collection across all databases and tables in their catalog. When the automation is enabled, the Data Catalog generates and updates column statistics for all columns in the tables on a weekly basis. This job analyzes 20% of records in the tables to calculate statistics. These statistics can be used by Redshift Spectrum and Athena CBO to optimize queries.
Furthermore, this new feature provides the flexibility to configure automation settings and scheduled collection configurations at the table level. Individual data owners can override catalog-level automation settings based on specific requirements. Data owners can customize settings for individual tables, including whether to enable automation, collection frequency, target columns, and sampling percentage. This flexibility allows administrators to maintain an optimized platform overall, while enabling data owners to fine-tune individual table statistics.
In this post, we discuss how the Data Catalog automates table statistics collection and how you can use it to enhance your data platform’s efficiency.
Enable catalog-level statistics collection
The data lake administrator can enable catalog-level statistics collection on the Lake Formation console. Complete the following steps:
On the Lake Formation console, choose Catalogs in the navigation pane.
Select the catalog that you want to configure, and choose Edit on the Actions menu.
The command calls the AWS Glue UpdateCatalog API, which takes in a CatalogProperties structure that expects the following key-value pairs for catalog-level statistics:
ColumnStatistics.RoleArn – The IAM role Amazon Resource Name (ARN) to be used for all jobs triggered for catalog-level statistics
ColumnStatistics.Enabled – A Boolean value indicating whether the catalog-level settings are enabled or disabled
Callers of UpdateCatalog must have UpdateCatalog IAM permissions and be granted ALTER on CATALOG permissions on the root catalog if using Lake Formation permissions. You can call the GetCatalog API to verify the properties that are set to your catalog properties. For the required permissions used by the role passed, see Prerequisites for generating column statistics.
By following these steps, catalog-level statistics collection is enabled. AWS Glue then automatically updates statistics for all columns in each table, sampling 20% of records on a weekly basis. This allows data lake administrators to effectively manage the data platform’s performance and cost-efficiency.
View automated table-level settings
When catalog-level statistics collection is enabled, when an Apache Hive table or Iceberg table is created or updated using the AWS Glue CreateTable or UpdateTable APIs through the AWS Glue console, AWS SDK, or AWS Glue crawlers, an equivalent table level setting is created for that table.
Tables with automatic statistics generation enabled must follow one of following properties:
HIVE table formats such as Parquet, Avro, ORC, JSON, ION, CSV, and XML
Apache Iceberg table format
After a table has been created or updated, you can confirm that a statistics collection setting has been set by checking the table description on the AWS Glue console. The setting should have the Schedule property set as Auto and Statistics configuration set as Inherited from catalog. Any table setting with the following settings is automatically triggered by AWS Glue internally.
The following is an image of a Hive Table where catalog-level statistics collection has been applied and statistics have been collected:
The following is an image of a Iceberg Table where catalog-level statistics collection has been applied and statistics have been collected:
Configure table-level statistics collection
Data owners can customize statistics collection at the table level to meet specific needs. For frequently updated tables, statistics can be refreshed more often than weekly. You can also specify target columns to focus on those most commonly queried.
Moreover, you can set what percentage of table records to use when calculating statistics. Therefore, you can increase this percentage for tables that need more precise statistics, or decrease it for tables where a smaller sample is sufficient to optimize costs and statistics generation performance.
These table-level settings can override the catalog-level settings previously described.
To configure table-level statistics collection on AWS Glue console, complete the following steps:
On the AWS Glue console, choose Databases under Data Catalog in the navigation pane.
Choose a database to view all available tables (for example, optimization_test).
Choose the table to be configured (for example, catalog_returns).
Go to Column statistics and choose Generate on schedule.
In the Schedule section, choose the frequency from Hourly, Daily, Weekly, Monthly and Custom (cron expression). In this example, for Frequency, choose Daily.
Under Advanced configuration, for Security configuration, optionally choose your security configuration to enable at-rest encryption on the logs pushed to CloudWatch.
For Sample rows, enter 100 as the percentage of rows to sample.
Choose Generate statistics.
In the table description on the AWS Glue console, you can confirm that a statistics collection job has been scheduled for the specified date and time.
By following these steps, you have configured table-level statistics collection. This allows data owners to manage table statistics based on their specific requirements. Combining this with catalog-level settings by data lake administrators enables securing a baseline for optimizing the entire data platform while flexibly addressing individual table requirements.
You can also create a column statistics generation schedule through the AWS CLI:
The required parameters are database-name, table-name, and role. You can also include optional parameters such as schedule, column-name-list, catalog-id, sample-size, and security-configuration. For more information, see Generating column statistics on a schedule.
Conclusion
This post introduced a new feature in the Data Catalog that enables automated statistics collection at the catalog level with flexible per-table controls. Organizations can effectively manage and maintain up-to-date column-level statistics. By incorporating these statistics, CBO in both Redshift Spectrum and Athena can optimize query processing and cost-efficiency.
Try out this feature for your own use case, and let us know your feedback in the comments.
About the Authors
Sotaro Hikita is an Analytics Solutions Architect. He supports customers across a wide range of industries in building and operating analytics platforms more effectively. He is particularly passionate about big data technologies and open source software.
Noritaka Sekiyama is a Principal Big Data Architect on the AWS Glue team. He works based in Tokyo, Japan. He is responsible for building software artifacts to help customers. In his spare time, he enjoys cycling with his road bike.
Kyle Duong is a Senior Software Development Engineer on the AWS Glue and AWS Lake Formation team. He is passionate about building big data technologies and distributed systems.
Sandeep Adwankar is a Senior Product Manager at AWS. Based in the California Bay Area, he works with customers around the globe to translate business and technical requirements into products that enable customers to improve how they manage, secure, and access data.
In 2024, Thanksgiving (November 28), Black Friday (November 29), and Cyber Monday (December 2) significantly impacted Internet traffic, similar to trends seen in 2023 and previous years. This year, Thanksgiving in the US drove a 20% drop in daily traffic compared to the previous week, with a notable 33% dip at 15:45 ET. In contrast, Black Friday and Cyber Monday drove traffic spikes. But how global is this trend, and do attacks increase during Cyber Week?
At Cloudflare, we manage and protect a substantial amount of traffic for our customers, providing a unique vantage point to analyze traffic and attack patterns across the Internet. This perspective reveals insights like Cyber Monday being the busiest Internet traffic day of 2024 globally, followed by Black Friday, with patterns varying across countries. Notably, global HTTP request volume on Cyber Monday 2024 was 36% higher than 2023, with 5% of that traffic blocked as potential attacks.
For this analysis, we examined anonymized and aggregated HTTP requests and DNS queries across our network to uncover key patterns. Cyber Monday, December 2, was the day with peak traffic, and key findings for that day include:
Cloudflare processed a peak of 99.8 million HTTP requests per second at 15:33 UTC on Cyber Monday, December 2.
Cloudflare handled approximately 5.4 trillion daily requests on Cyber Monday, with blocked potential attacks comprising around 5% of all traffic. This was higher than the 5.1 trillion daily requests on Black Friday, where 6% of request traffic consisted of blocked potential attacks.
Daily global HTTP request volume on Cyber Monday 2024 (December 2) increased by 36% compared to Cyber Monday 2023. In comparison, Cyber Monday 2023 had shown a 27% increase over Cyber Monday 2022.
Ranking Cyber Week daily Internet traffic
This year’s trends, like those observed in previous years, show how Internet traffic typically peaks in late November but tends to drop in December. In 2024, Cyber Monday was again the busiest day for global Internet traffic. However, Black Friday didn’t make the Top 3, as Sunday, December 1, and Tuesday, November 26, saw higher traffic. Black Friday ranked #5, coming behind November 21.
Note: On December 1, 2024, a customer-specific software update event contributed to the increased Internet traffic observed that day, including at the country level.
Highest Internet traffic days, worldwide
#1 Cyber Monday, December 2, 2024
#2 Sunday, December 1, the day before Cyber Monday
#3 Tuesday, November 26, 2024
In the US, the ranking was similar, with Cyber Monday, Sunday, and Black Friday being the busiest days for Internet traffic. On Cyber Monday, traffic was 12% higher than the previous week and 57% higher than Cyber Monday 2023.
Highest Internet traffic days, United States
#1 Cyber Monday, December 2
#2 Sunday, December 1
#3 Black Friday, November 29
Additionally, most US states show a similar trend, with Cyber Monday generating the most traffic, followed by Sunday, December 1, and Black Friday, November 29. Arizona, West Virginia, and Arkansas saw increases in traffic of over 20% compared to the previous week. Almost all other states experienced traffic increases exceeding 10%, including some of the most populous ones like California (11%), Florida (11%), and New York (11%).
In looking at just traffic to Shopping and Retail sites based in the US that use Cloudflare, Cyber Monday recorded the highest traffic, followed by Black Friday and the Black Friday weekend. Traffic to these sites increased significantly during Cyber Week, starting on Monday, November 25, with a 7% increase compared to the previous week and a 57% jump compared to the first week of November.
Black Friday goes mobile, Cyber Monday goes desktop
During Thanksgiving Day, mobile usage in the US increased significantly, with mobile device traffic accounting for 51.7% of all traffic, compared to 42.4% the previous week. The trend intensified on Black Friday, with mobile’s share peaking at 51.9% (up from 43.9% the prior Friday) and reaching a similar level on Saturday, November 30, at 52%. However, Cyber Monday saw a shift to desktop use, with mobile device share dropping to 43.4%, lower than the previous Monday. This mirrors a similar trend observed in 2023.
These patterns suggest that Black Friday shopping in the US often involves more out of home/office activities, with people relying on mobile devices for Internet access while on the go, whereas the opposite tends to occur on Cyber Monday, a day when many return to work and school in the US.
How are other countries impacted by Cyber Week?
Internationally, a trend of peak Internet traffic in November is observed in most countries, as highlighted in our 2023 Year in Review. This trend is likely linked to colder weather in the Northern Hemisphere, where approximately 87% of the world’s population resides, as well as holidays and shopping periods, among other factors.
Here’s a table summarizing the November and early December days with the most traffic, where Cyber Week plays a significant role.
Highest Internet traffic days
UK
#1 Black Friday, November 29
#2 Cyber Monday, December 2
#3 Sunday, December 1 (Black Friday weekend)
Canada
#1 Cyber Monday, December 2
#2 Black Friday, November 29
#3 Sunday, December 1 (Black Friday weekend)
Germany
#1 Sunday, December 1 (Black Friday weekend)
#2 Black Friday, November 29
#3 Cyber Monday, December 2
Mexico
#1 Cyber Monday, December 2
#2 Wednesday, November 27
#3 Tuesday, November 26
France
#1 Sunday, December 1 (Black Friday weekend)
#2 Cyber Monday, December 2
#3 Wednesday, November 27
Brazil
#1 Tuesday, November 26
#2 Cyber Monday, December 2
#3 Thursday, November 21
Spain
#1 Sunday, December 1 (Black Friday weekend)
#2 Cyber Monday, December 2
#3 Tuesday, November 26
Australia
#1 Black Friday, November 29
#2 Cyber Monday, December 2
#3 Sunday, December 1 (Black Friday weekend)
Egypt
#1 Wednesday, November 27
#2 Sunday, December 1 (Black Friday weekend)
#3 Sunday, November 24
Singapore
#1 Friday, November 22
#2 Cyber Monday, December 2
#3 Tuesday, November 26
India
#1 Cyber Monday, December 2
#2 Black Friday, November 29
#3 Sunday, December 1 (Black Friday weekend)
Turkey
#1 Sunday, December 1 (Black Friday weekend)
#2 Cyber Monday, December 2
#3 Singles’ Day, November 10-11
Saudi Arabia
#1 Sunday, December 1 (Black Friday weekend)
#2 Saturday, November 30 (Black Friday weekend)
#3 Cyber Monday, December 2
South Africa
#1 Wednesday, November 27
#2 Tuesday, November 26
#3 Black Friday, November 29
Countries like the Philippines (where Singles’ Day was the top shopping day again this year), Japan, South Korea, Thailand, and Indonesia (where Cyber Monday ranked second this year) show increased traffic in October and November compared to other months. However, they do not exhibit an obvious increase in traffic during Cyber Week.
As noted earlier, Singles’ Day (November 11), a major Asian shopping event, ranked among the Top 3 traffic days in Turkey, the Philippines, and other countries.
E-commerce DNS trends
Aggregated data from our 1.1.1.1 resolver reveals category-specific DNS traffic growth to E-commerce sites, showing a steady increase throughout November, similar to the overall Internet traffic trends.
In the US, E-commerce DNS traffic in November 2024 followed a similar pattern compared to 2023. Black Friday (November 29) ranked as the top day for DNS traffic in the E-commerce category, followed closely by Cyber Monday and Tuesday, November 26. This aligns more closely with overall US Internet traffic trends, where Cyber Monday ranked #1.
Also in the E-commerce category, DNS traffic on Black Friday peaked between 15:00 and 18:00 ET (13:00 and 15:00 PT), with an 18% increase at 18:00 ET compared to the previous week. On Cyber Monday, peak traffic occurred later, from 20:00 to 22:00 ET (17:00 to 19:00 PT).
A glimpse into Europe’s DNS E-commerce trends
The UK showed a similar trend in DNS traffic to E-commerce sites, mirroring its Internet traffic patterns, and following the same pattern as 2023. In 2024, Black Friday (November 29) ranked #1, followed by Cyber Monday (December 2), and Thursday, November 21.
In Australia, Saturday, November 30 (the day after Black Friday), was the top day for E-commerce DNS traffic, followed by Cyber Monday and Black Friday. Canada followed a similar trend, with Black Friday ranking highest, followed by Cyber Monday.
In Germany, the busiest E-commerce day was Thursday, November 21, a week before Black Friday, followed by Black Friday (November 29) and Monday, November 25. Cyber Monday did not make the top three, consistent with 2023.
In France, Black Friday remained the top E-commerce day, as in 2023, followed by Cyber Monday (December 2) and Thursday, November 21.
Low-cost and second-hand DNS trends
Focusing on the US again, so-called “low-cost” E-commerce sites (which include recent entrants like Temu and fast-fashion brands) have become increasingly popular, and experienced more DNS traffic in the days leading up to Black Friday and Thanksgiving, specifically November 26 and 27. Cyber Monday ranked third.
As observed last year, second-hand shopping sites (ones that offer previously used items) in the US gained more momentum and DNS traffic during the two weeks before Black Friday week. Traffic to these sites peaked on November 12, with Cyber Monday coming in as a close second.
Growth of cyber threats in November
DDoS (distributed denial-of-service) attacks remain a common tactic for disrupting Internet properties. Our data shows that Shopping and Retail sites in the United States protected by Cloudflare experienced a significant rise in DDoS activity on Cyber Monday. On that day, 7% of all traffic in this category was mitigated as DDoS attacks, with an additional 8% flagged as potential threats.
More broadly, DDoS activity targeting the US in general (not limited to E-commerce) also spiked during Black Friday week. Starting November 24, the share blocked as DDoS attacks rose sharply, peaking at over 2% of all traffic on November 25. Across the entire Cyber Week, there was a 41% increase in blocked DDoS attack requests compared to the previous week.
Email threat trends around “Black Friday” and “Cyber Monday”
From a cybersecurity perspective, trending events, topics, and individuals often trigger spikes in email traffic, including malicious, phishing, and spam messages. This was evident during the Paris 2024 Olympics, the US elections, and shopping periods like Black Friday and Cyber Monday. Between November 1 and December 2, 2024, Cloudflare’s Cloud Email Security service processed nearly 24 million emails mentioning “Black Friday” or “Cyber Monday” in the subject. Of those, 19.4 million referenced “Black Friday” while 4.2 million mentioned “Cyber Monday”, with 76% (3.2 million) of the Cyber Monday emails sent on December 2, 2024.
During this period, “Black Friday” emails were not only higher volume but also showed higher percentages of spam (10.8%) and malicious content (0.9%) compared to emails mentioning “Cyber Monday” in the subject, which had 1.8% spam and 0.2% malicious content.
In the next chart, we focus on emails with “Black Friday” in the subject, given that it generated the highest percentage of spam and malicious emails. Spam emails peaked in mid-November, making up 29% of all emails, and reached 26% on Cyber Monday. Malicious email percentages were also higher in mid-November, with 3% recorded on November 14, before Black Friday week.
The busiest day for “Black Friday” emails was November 29, Black Friday itself, with 4.1 million emails, followed by Saturday, November 30 (1.5 million), and Wednesday, November 27 (1.4 million).
Wrap up
Internet traffic trends during Black Friday and Cyber Monday show varying patterns globally and regionally. Cyber Monday leads in traffic overall, followed closely by Black Friday. While the US and Canada share similar trends, countries like the UK, Germany, and Australia saw traffic higher on Black Friday than Cyber Monday. In most countries, activity also increased in the days leading up to Black Friday.
On the cybersecurity front, DDoS attacks were more noticeable during Cyber Week in 2024, especially targeting shopping-related sites.
The Lorex 2K Indoor Wi-Fi Security Camera is a consumer security device that provides cloud-based video camera surveillance capabilities. This device was a target at the 2024 Pwn2Own IoT competition. Rapid7 developed an unauthenticated remote code execution (RCE) exploit chain as an entry for the competition. On November 25, 2024, Lorex released a firmware update to resolve the five vulnerabilities that comprise the exploit chain reported by Rapid7. As of December 3, 2024, we are disclosing these issues publicly in coordination with the vendor.
Technical analysis
A detailed technical analysis for the exploit chain described in this blog can be found in Rapid7’s whitepaper here.
The accompanying source code for the exploit chain can be found here.
The exploit chain consists of five distinct vulnerabilities, which operate together in two phases to achieve unauthenticated RCE. The five vulnerabilities are listed below.
CVE
Description
Affected Component
CVSS
CVE-2024-52544
An unauthenticated attacker can trigger a stack-based buffer overflow.
Phase 1 performs an authentication bypass, allowing a remote unauthenticated attacker to reset the device’s admin password to a password of the attacker’s choosing. This phase leverages an unauthenticated stack-based buffer overflow, and an unauthenticated out-of-bounds (OOB) heap read vulnerability. The OOB heap read allows an attacker to leak secrets stored in the device’s memory that are required to compute a special code value; this code value is required for an administrator password reset to be performed. A null pointer dereference vulnerability is leveraged to force the device to reboot in order to allow the next phase to complete.
Phase 2 achieves remote code execution by leveraging the auth bypass in phase 1 to perform an authenticated stack-based buffer overflow and execute an operating system (OS) command with root privileges. This capability is then leveraged to write a file to disk and, in turn, bypass the device’s code signing enforcement in order to execute arbitrary native code. Finally, the exploit will execute a reverse shell payload to give the remote attacker a root shell on the target device.
An overview of the two phases chained together can be seen below.
Impact
A remote unauthenticated attacker can leverage CVE-2024-52544, CVE-2024-52545, and CVE-2024-52546 (Phase 1) to reset a target device’s admin password, to a password of the attacker’s choosing. With valid admin credentials, an attacker can then either view the live video and audio feed from the device, or proceed to leverage CVE-2024-52547 and CVE-2024-52548 (Phase 2) to achieve remote code execution with root privileges on the target device.
The below table lists the affected devices and firmware versions.
Device
Firmware
W461AS-EG
2.800.00LR000.0.R.210907
W462AQ-EG
2.800.00LR000.0.R.210907
W461AS
2.800.00LR000.0.R.210730
W462AQ
2.800.00LR000.0.R.210730
W461AS-EG S2
2.800.0000000.3.R.20220331
W462AC-EG S2
2.800.0000000.3.R.20220331
W461AS
2.800.0000000.3.R.202203
W462AQ
2.800.0000000.3.R.202203
W461ASC
2.800.030000000.3.R
Credit
These vulnerabilities were discovered by Stephen Fewer, Principal Security Researcher at Rapid7 and are being disclosed in accordance with Rapid7’s vulnerability disclosure policy.
Vendor Statement
The following statement has been provided by the vendor.
Lorex Technology is dedicated to delivering the highest standards of protection and privacy for our customers and will collaborate with esteemed security experts to proactively identify and address potential vulnerabilities. In collaboration with Rapid7, we’ve been advised about one of our security cameras and successfully implemented a firmware update, which has fully resolved the identified security vulnerability.
Remediation
The following remediation steps have been provided by the vendor.
Our product team has decided to push the mandatory firmware updates to the devices. Upon opening Lorex app, users will be presented with the firmware update notice. User must accept the firmware update, and they cannot decline or postpone the firmware update. Camera will then flash new firmware and reboot. We advise that the users would not power down the camera during the firmware update. Once the camera reboots, the user can confirm that they have the latest version of firmware: V2.800.0000000.8.R.20241111
Disclosure timeline
October 29, 2024: Rapid7 contacts the vendor about the issues in this blog; vendor acknowledges. October 31, 2024: Rapid7 shares disclosure write-up with the vendor. November 4, 2024: Vendor indicates a patch is in development. November 12, 2024: Rapid7 provides CVEs IDs for the issues identified. November 13, 2024: Vendor verifies patch schedule. November 19, 2024: Rapid7 and the vendor agree to a December 3, 2024 coordinated disclosure date. December 3, 2024: This disclosure.
The traditional structure of a compiler forms a pipeline — parsing,
type-checking, optimization, and code-generation, usually in that order. But
modern programming languages have requirements that are ill-suited to such a
design. Increasingly, compilers are moving toward other designs in
order to support incremental compilation and low-latency responses for uses
like integration into IDEs. Rust has, for the last eight years, been pursuing a
particularly unusual design; in that time
compile times have
substantially improved, but there’s still more work to be done.
Today, we announced the next generation of Amazon SageMaker, which is a unified platform for data, analytics, and AI, bringing together widely-adopted AWS machine learning and analytics capabilities. At its core is SageMaker Unified Studio (preview), a single data and AI development environment for data exploration, preparation and integration, big data processing, fast SQL analytics, model development and training, and generative AI application development. This announcement includes Amazon SageMaker Lakehouse, a capability that unifies data across data lakes and data warehouses, helping you build powerful analytics and artificial intelligence and machine learning (AI/ML) applications on a single copy of data.
In addition to these launches, I’m happy to announce data catalog and permissions capabilities in Amazon SageMaker Lakehouse, helping you connect, discover, and manage permissions to data sources centrally.
Organizations today store data across various systems to optimize for specific use cases and scale requirements. This often results in data siloed across data lakes, data warehouses, databases, and streaming services. Analysts and data scientists face challenges when trying to connect to and analyze data from these diverse sources. They must set up specialized connectors for each data source, manage multiple access policies, and often resort to copying data, leading to increased costs and potential data inconsistencies.
The new capability addresses these challenges by simplifying the process of connecting to popular data sources, cataloging them, applying permissions, and making the data available for analysis through SageMaker Lakehouse and Amazon Athena. You can use the AWS Glue Data Catalog as a single metadata store for all data sources, regardless of location. This provides a centralized view of all available data.
Data source connections are created once and can be reused, so you don’t need to set up connections repeatedly. As you connect to the data sources, databases and tables are automatically cataloged and registered with AWS Lake Formation. Once cataloged, you grant access to those databases and tables to data analysts, so they don’t have to go through separate steps of connecting to each data source and don’t have to know built-in data source secrets. Lake Formation permissions can be used to define fine-grained access control (FGAC) policies across data lakes, data warehouses, and online transaction processing (OLTP) data sources, providing consistent enforcement when querying with Athena. Data remains in its original location, eliminating the need for costly and time-consuming data transfers or duplications. You can create or reuse existing data source connections in Data Catalog and configure built-in connectors to multiple data sources, including Amazon Simple Storage Service (Amazon S3), Amazon Redshift, Amazon Aurora, Amazon DynamoDB (preview), Google BigQuery, and more.
Getting started with the integration between Athena and Lake Formation To showcase this capability, I use a preconfigured environment that incorporates Amazon DynamoDB as a data source. The environment is set up with appropriate tables and data to effectively demonstrate the capability. I use the SageMaker Unified Studio (preview)interface for this demonstration.
To begin, I go to SageMaker Unified Studio (preview) through the Amazon SageMaker domain. This is where you can create and manage projects, which serve as shared workspaces. These projects allow team members to collaborate, work with data, and develop ML models together. Creating a project automatically sets up AWS Glue Data Catalog databases, establishes a catalog for Redshift Managed Storage (RMS) data, and provisions necessary permissions.
To manage projects, you can either view a comprehensive list of existing projects by selecting Browse all projects, or you can create a new project by choosing Create project. I use two existing projects: sales-group, where administrators have full access privileges to all data, and marketing-project, where analysts operate under restricted data access permissions. This setup effectively illustrates the contrast between administrative and limited user access levels.
In this step, I set up a federated catalog for the target data source, which is Amazon DynamoDB. I go to Data in the left navigation pane and choose the + (plus) sign to Add data. I choose Add connection and then I choose Next.
I choose Amazon DynamoDB and choose Next.
I enter the details and choose Add data. Now, I have the Amazon DynamoDB federated catalog created in SageMaker Lakehouse. This is where your administrator gives you access using resource policies. I’ve already configured the resource policies in this environment. Now, I’ll show you how fine-grained access controls work in SageMaker Unified Studio (preview).
I begin by selecting the sales-group project, which is where administrators maintain and have full access to customer data. This dataset contains fields such as zip codes, customer IDs, and phone numbers. To analyze this data, I can execute queries using Query with Athena.
Upon selecting Query with Athena, the Query Editor launches automatically, providing a workspace where I can compose and execute SQL queries against the lakehouse. This integrated query environment offers a seamless experience for data exploration and analysis.
In the second part, I switch to marketing-project to show what an analyst experiences when they run their queries and observe that the fine-grained access control permissions are in place and working.
In the second part, I demonstrate the perspective of an analyst by switching to the marketing-project environment. This helps us verify that the fine-grained access control permissions are properly implemented and effectively restricting data access as intended. Through example queries, we can observe how analysts interact with the data while being subject to the established security controls.
Using the Query with Athena option, I execute a SELECT statement on the table to verify the access controls. The results confirm that, as expected, I can only view the zipcode and cust_id columns, while the phone column remains restricted based on the configured permissions.
With these new data catalog and permissions capabilities in Amazon SageMaker Lakehouse, you can now streamline your data operations, enhance security governance, and accelerate AI/ML development while maintaining data integrity and compliance across your entire data ecosystem.
Now available Data catalog and permissions in Amazon SageMaker Lakehouse simplifies interactive analytics through federated query when connecting to a unified catalog and permissions with Data Catalog across multiple data sources, providing a single place to define and enforce fine-grained security policies across data lakes, data warehouses, and OLTP data sources for a high-performing query experience.
You can use this capability in US East (N. Virginia), US West (Oregon), US East (Ohio), Europe (Ireland), and Asia Pacific (Tokyo) AWS Regions.
Today, we announced the general availability of Amazon SageMaker Lakehouse and Amazon Redshift support for zero-ETL integrations from applications. Amazon SageMaker Lakehouse unifies all your data across Amazon Simple Storage Service (Amazon S3) data lakes and Amazon Redshift data warehouses, helping you build powerful analytics and AI/ML applications on a single copy of data. SageMaker Lakehouse gives you the flexibility to access and query your data in-place with all Apache Iceberg compatible tools and engines. Zero-ETL is a set of fully managed integrations by AWS that minimizes the need to build ETL data pipelines for common ingestion and replication use cases. With zero-ETL integrations from applications such as Salesforce, SAP, and Zendesk, you can reduce time spent building data pipelines and focus on running unified analytics on all your data in Amazon SageMaker Lakehouse and Amazon Redshift.
As organizations rely on an increasingly diverse array of digital systems, data fragmentation has become a significant challenge. Valuable information is often scattered across multiple repositories, including databases, applications, and other platforms. To harness the full potential of their data, businesses must enable access and consolidation from these varied sources. In response to this challenge, users build data pipelines to extract and load (EL) from multiple applications into centralized data lakes and data warehouses. Using zero-ETL, you can efficiently replicate valuable data from your customer support, relationship management, and enterprise resource planning (ERP) applications for analytics and AI/ML to datalakes and data warehouses, saving you weeks of engineering effort needed to design, build, and test data pipelines.
An AWS Glue database that is configured for Amazon S3 where the data will be stored.
A secret in AWS Secret Manager to use for the connection to the data source. The credentials must contain the username and password that you use to sign in to your application.
An AWS Identity and Access Management (IAM) role for the Amazon SageMaker Lakehouse or Amazon Redshift job to use. The role must grant access to all resources used by the job, including Amazon S3 and AWS Secrets Manager.
A valid AWS Glue connection to the desired application.
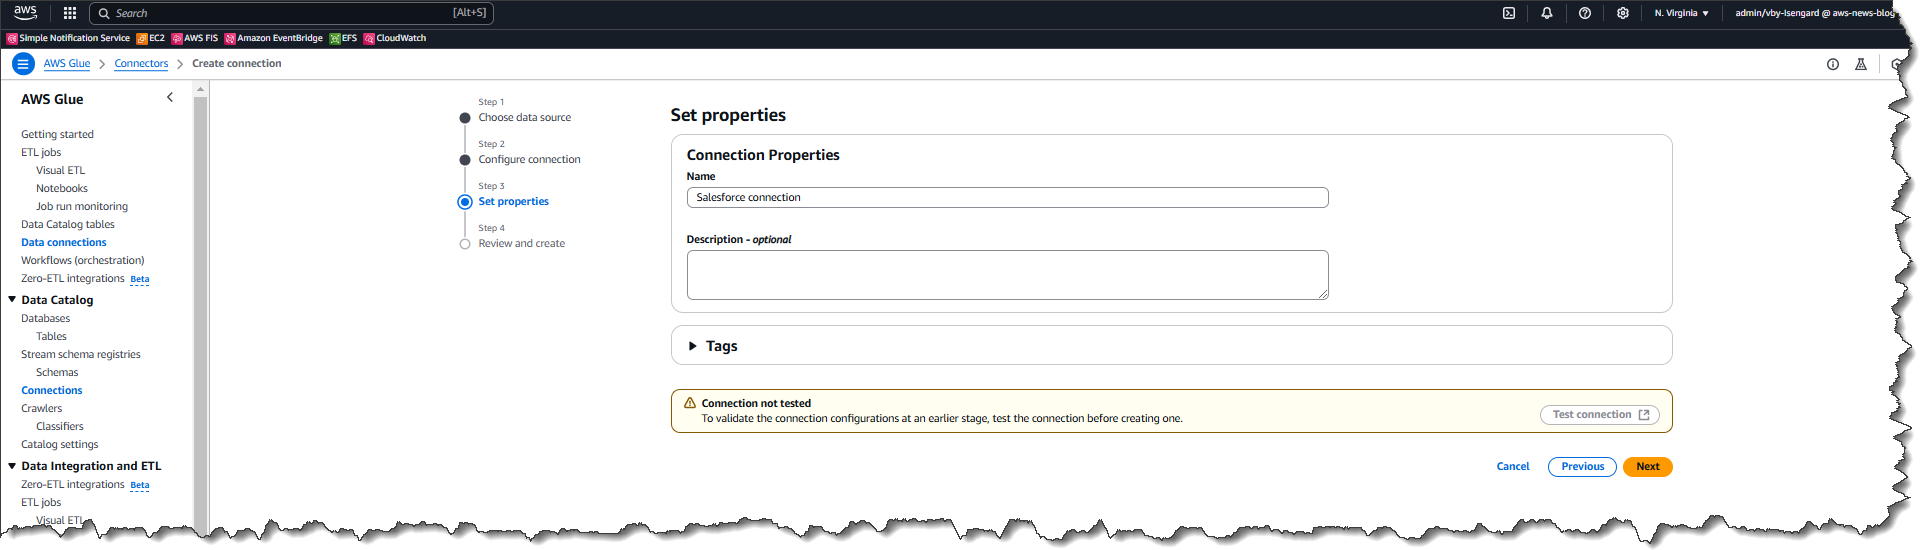
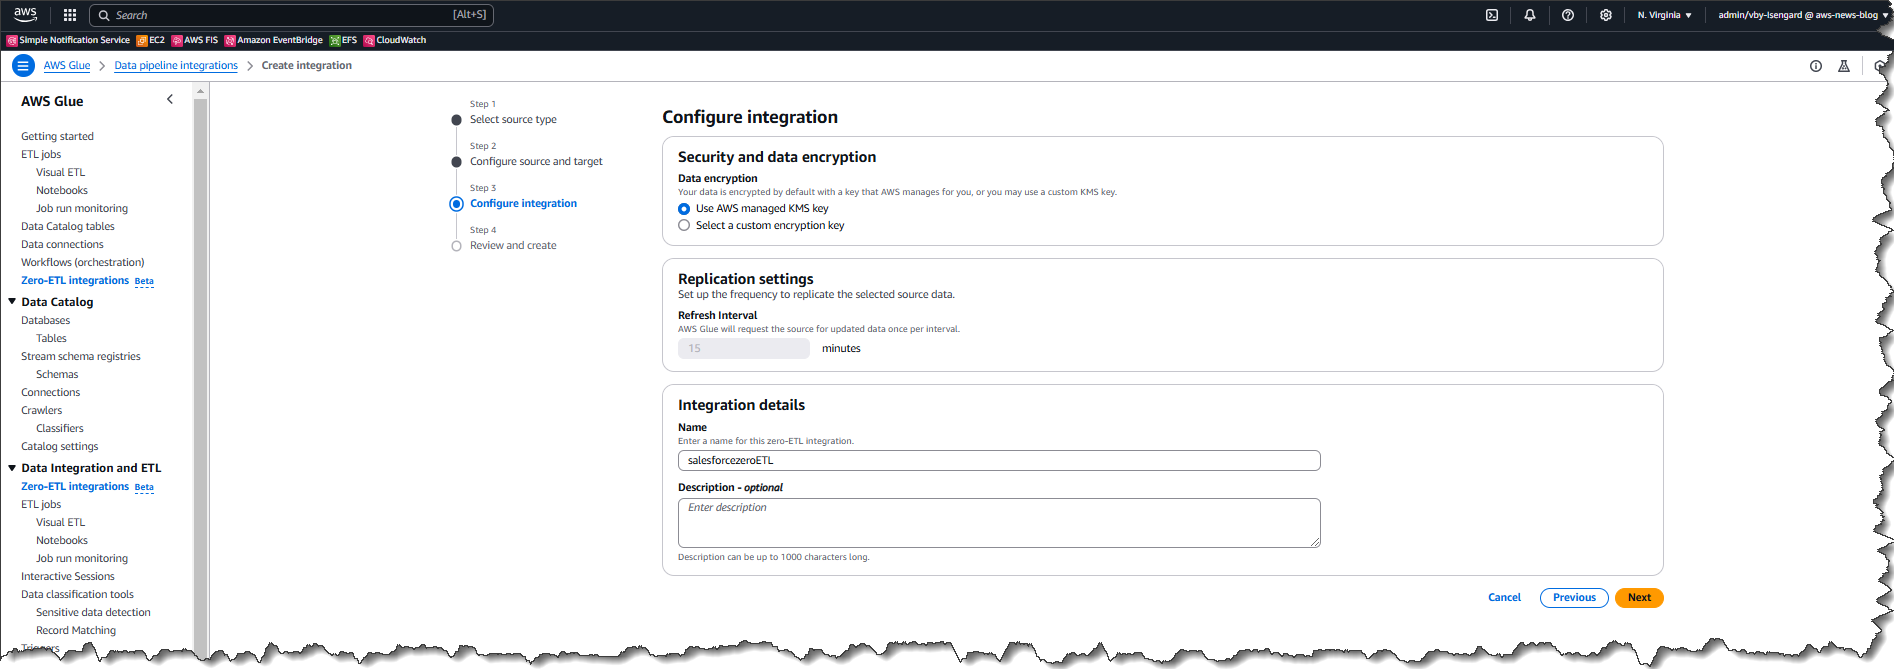
How it works – creating a Glue connection prerequisite I start by creating a connection using the AWS Glue console. I opt for a Salesforce integration as the data source.
Next, I provide the location of the Salesforce instance to be used for the connection, together with the rest of the required information. Be sure to use the .salesforce.com domain instead of .force.com. Users can choose between two authentication methods, JSON Web Token (JWT), which is obtained through Salesforce access tokens, or OAuth login through the browser.
I review all the information and then choose Create connection.
After I sign into the Salesforce instance through a popup (not shown here), the connection is successfully created.
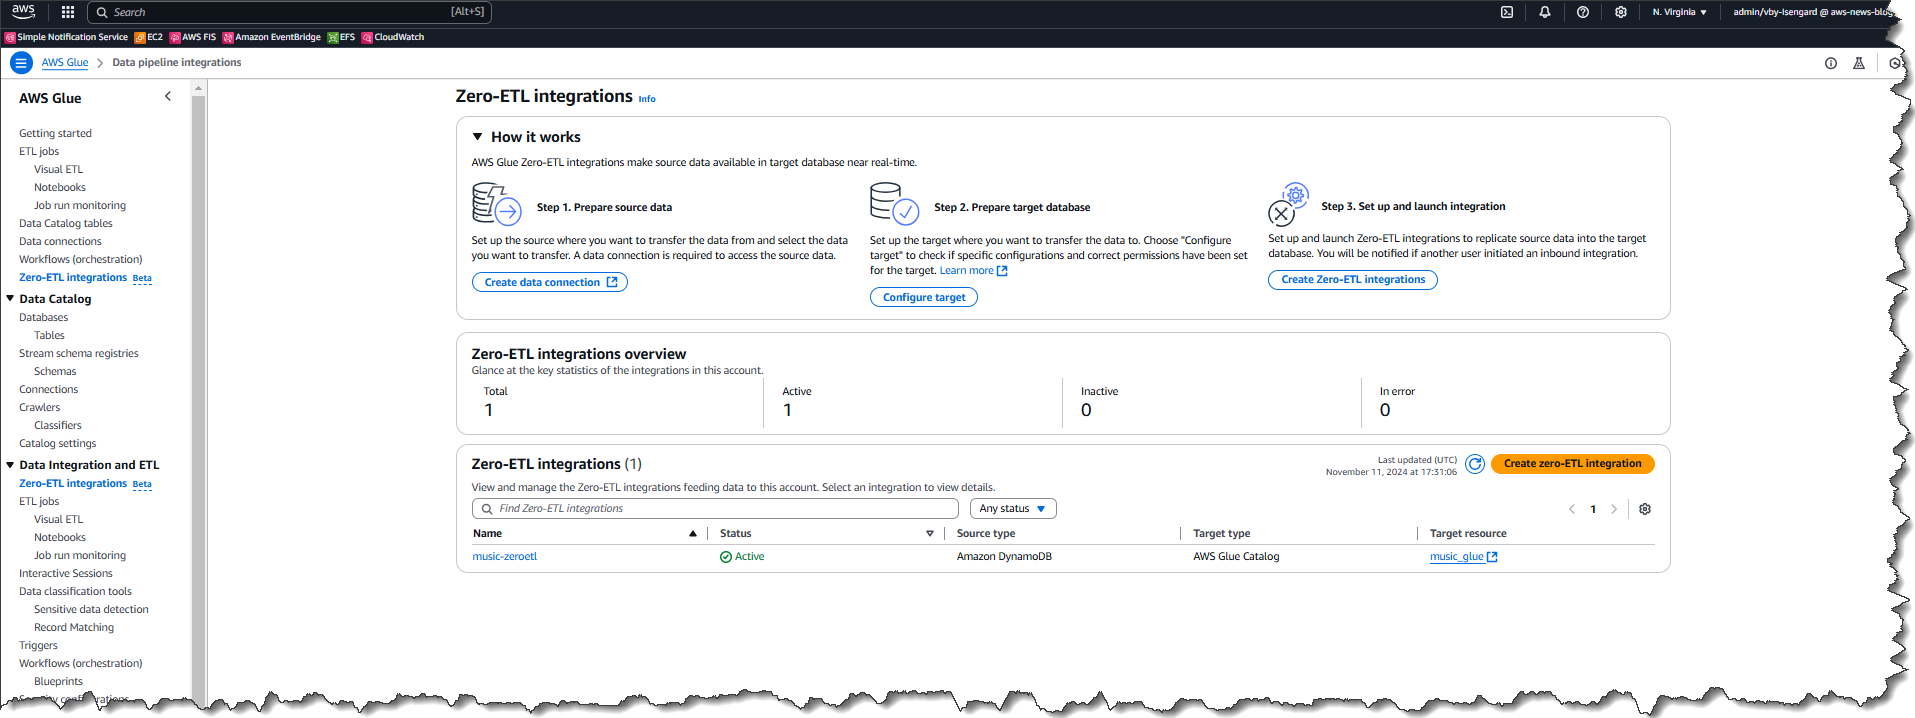
How it works – creating a zero-ETL integration Now that I have a connection, I choose zero-ETL integrations from the left navigation panel, then choose Create zero-ETL integration.
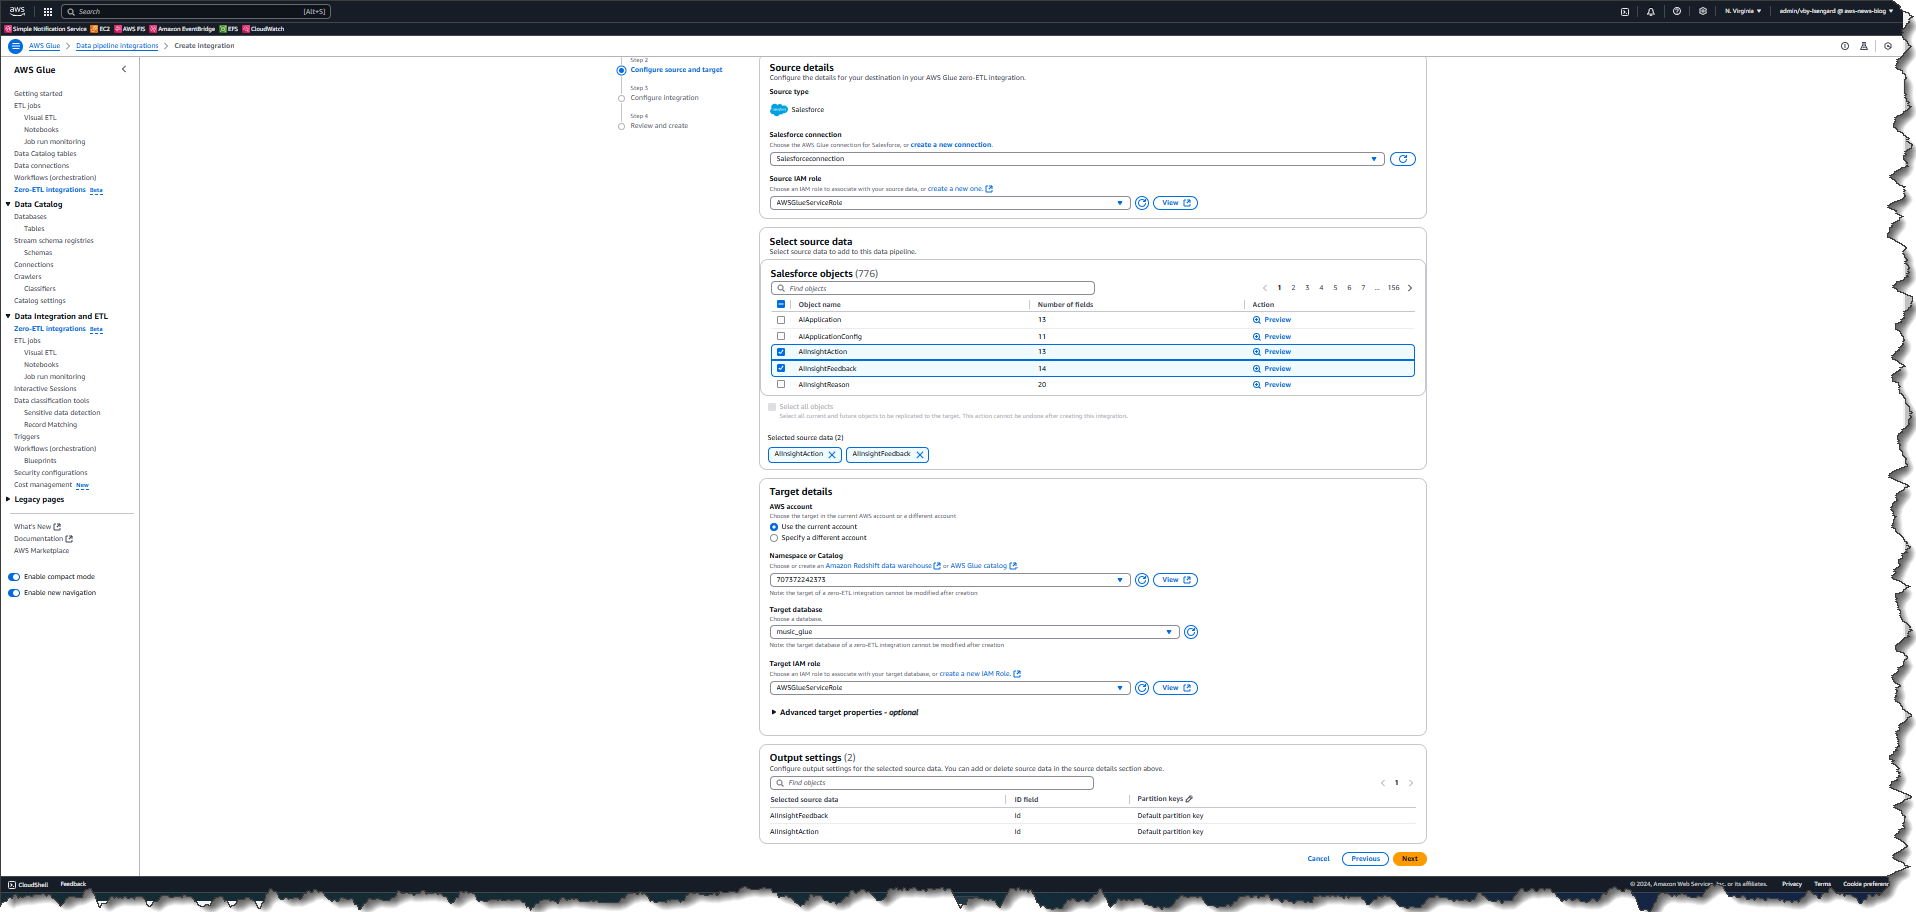
First I choose the source type for my integration – in this case Salesforce so I can use my recently created connection.
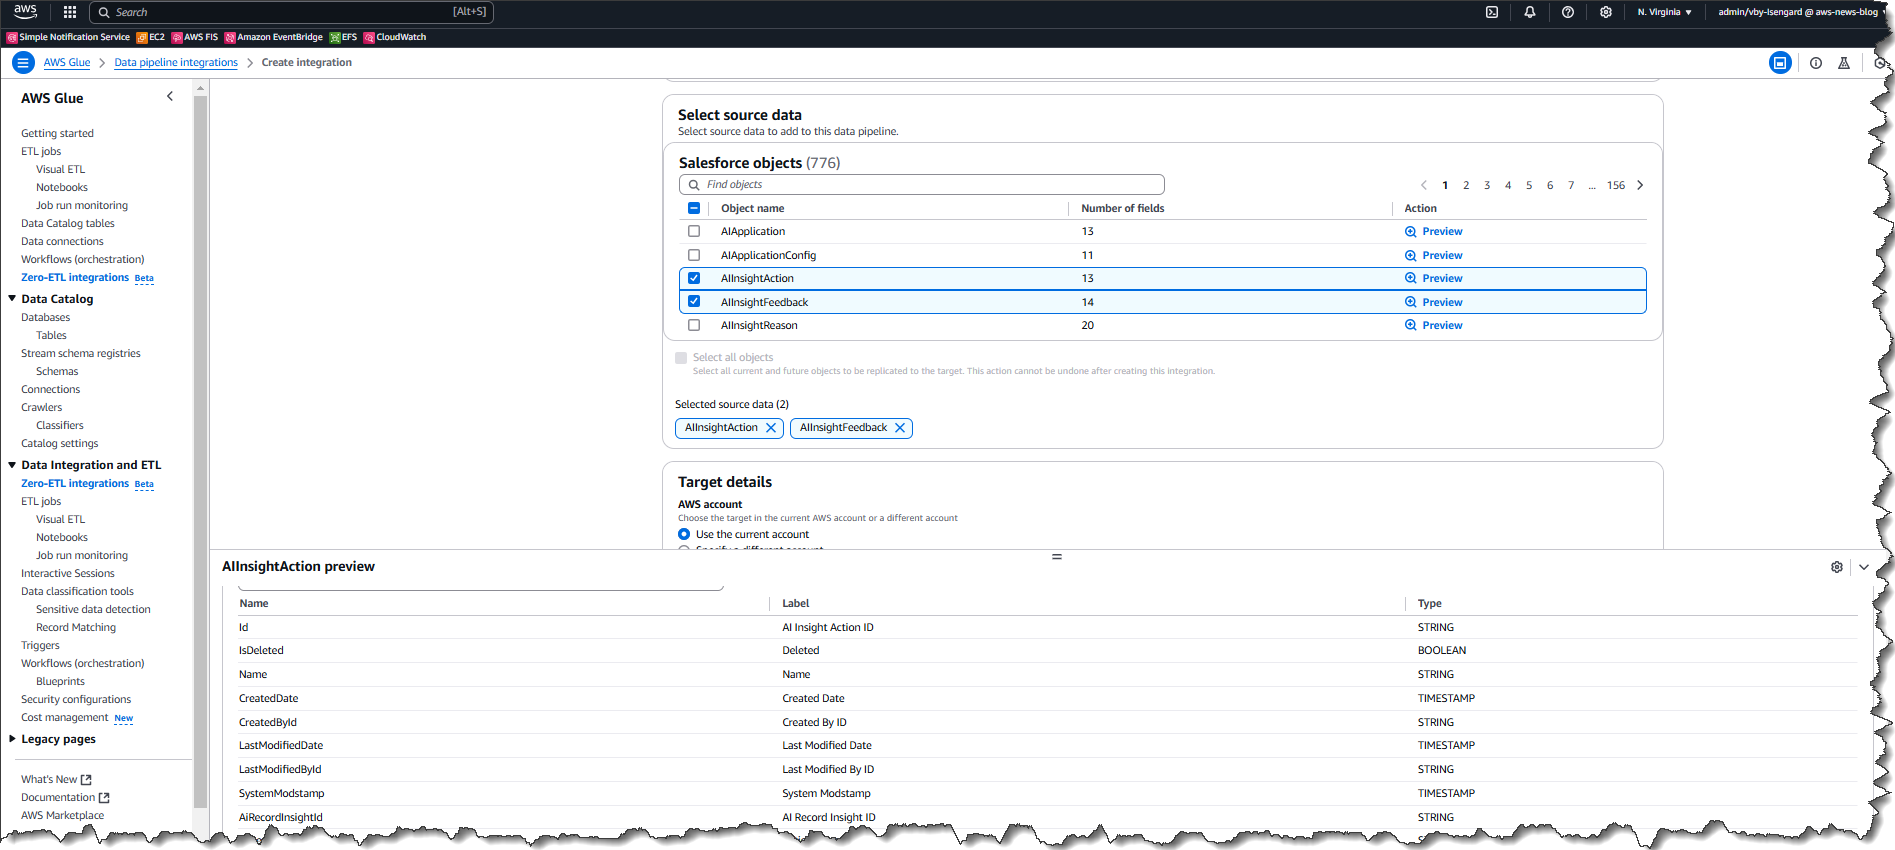
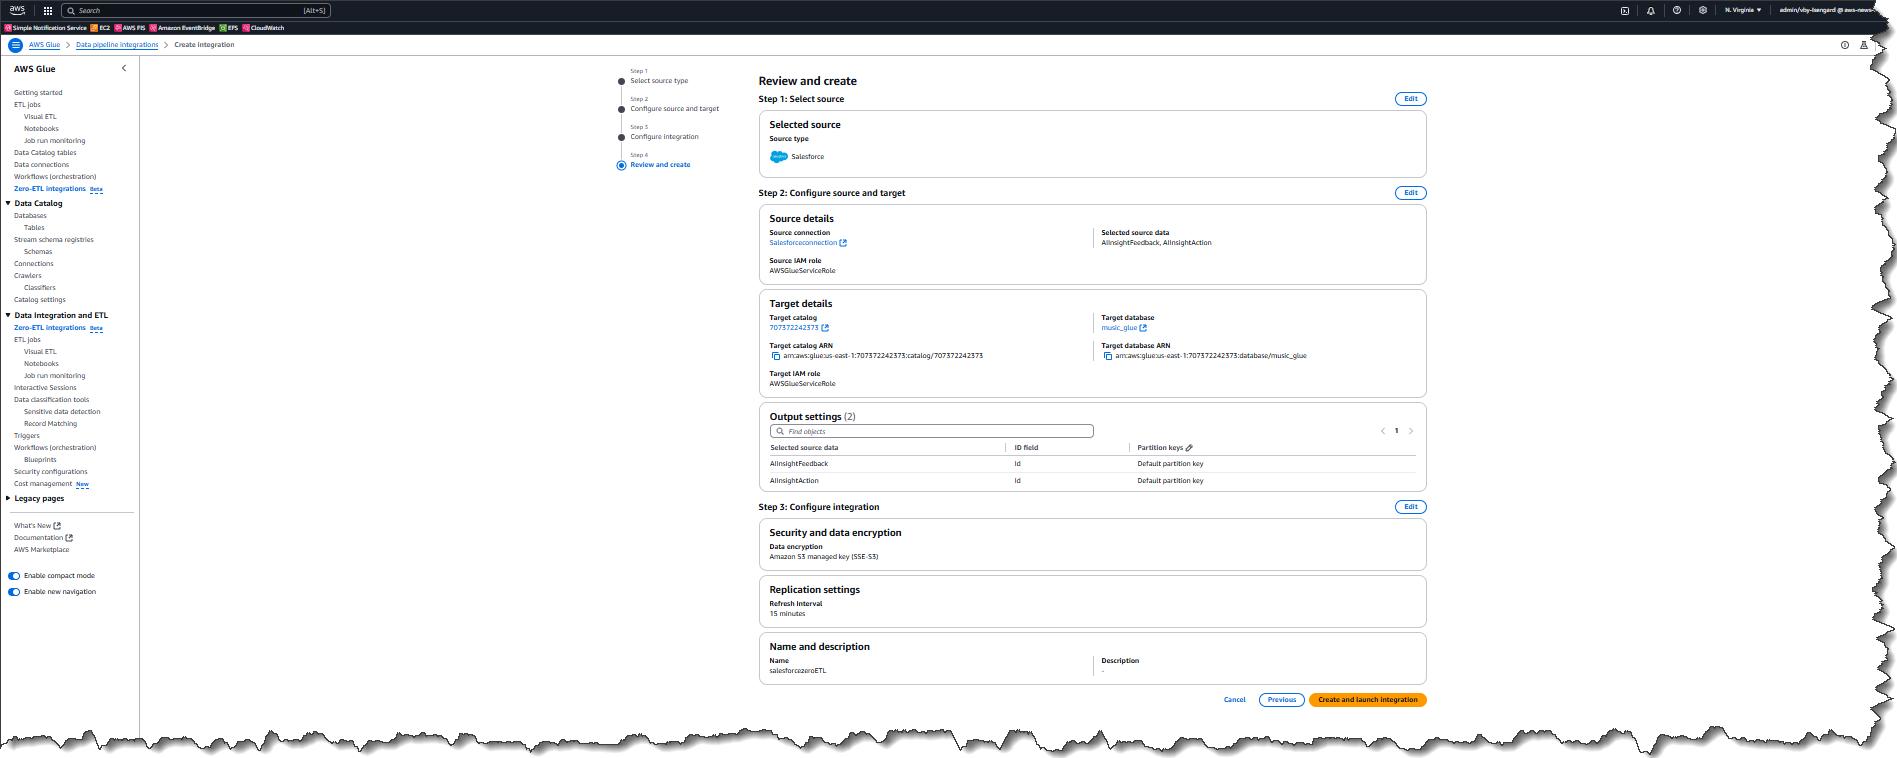
Next, I select objects from the data source that I want to replicate to the target database in AWS Glue.
While in the process of adding objects, I can quickly preview both data and metadata to confirm that I am selecting the correct object.
By default, zero-ETL integration will synchronize data from the source to the target every 60 minutes. However, you can change this interval to reduce the cost of replication for cases that do not require frequent updates.
I review and then choose Create and launch integration.
The data in the source (Salesforce instance) has now been replicated to the target database salesforcezeroETL in my AWS account. This integration has two phases. Phase 1: initial load will ingest all the data for the selected objects and may take between 15 min to a few hours depending on the size of the data in these objects. Phase 2: incremental load will detect any changes (such as new records, updated records, or deleted records) and apply these to the target.
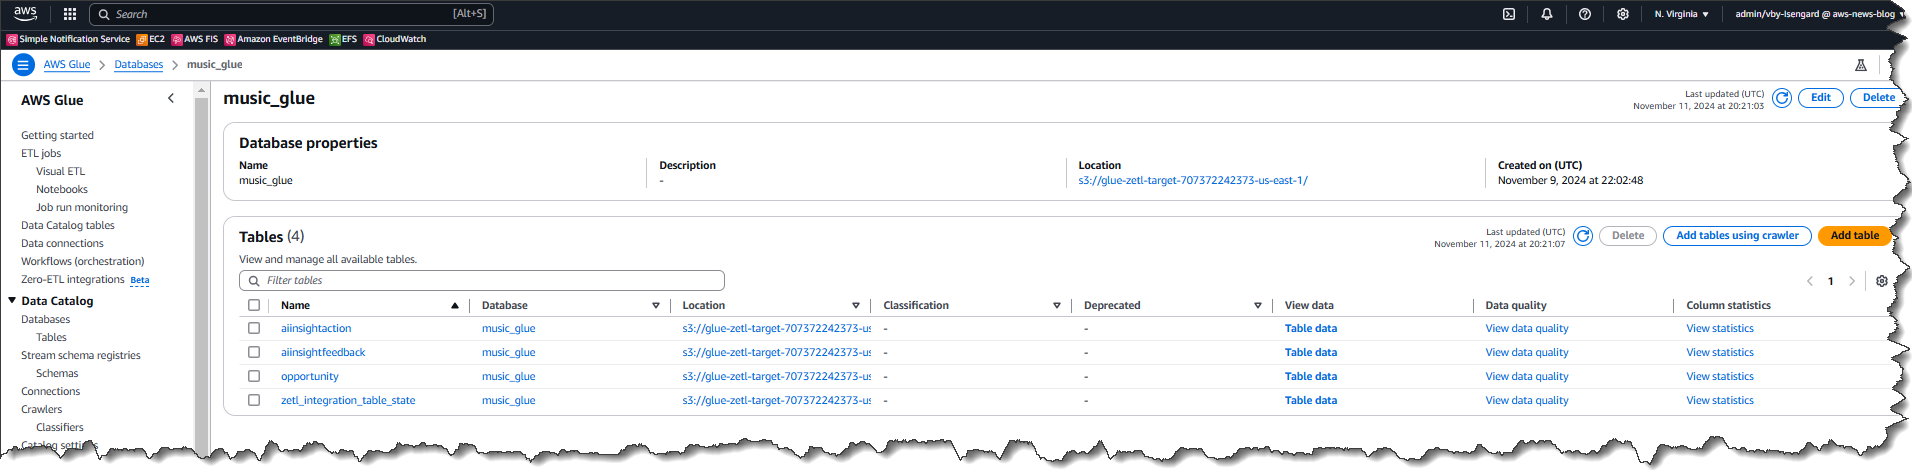
Each of the objects that I selected earlier has been stored in its respective table within the database. From here I can view the Table data for each of the objects that have been replicated from the data source.
Lastly, here’s a view of the data in Salesforce. As new entities are created, or existing entities are updated or changed in Salesforce, the data changes will synchronize to the target in AWS Glue automatically.
Now available Amazon SageMaker Lakehouse and Amazon Redshift support for zero-ETL integrations from applications is now available in US East (N. Virginia), US East (Ohio), US West (Oregon), Asia Pacific (Hong Kong), Asia Pacific (Singapore), Asia Pacific (Sydney), Asia Pacific (Tokyo), Europe (Frankfurt), Europe (Ireland), and Europe (Stockholm) AWS Regions. For pricing information, visit the AWS Glue pricing page.
To provide the best experiences, we use technologies like cookies to store and/or access device information. Consenting to these technologies will allow us to process data such as browsing behavior or unique IDs on this site. Not consenting or withdrawing consent, may adversely affect certain features and functions.
Functional
Always active
The technical storage or access is strictly necessary for the legitimate purpose of enabling the use of a specific service explicitly requested by the subscriber or user, or for the sole purpose of carrying out the transmission of a communication over an electronic communications network.
Preferences
The technical storage or access is necessary for the legitimate purpose of storing preferences that are not requested by the subscriber or user.
Statistics
The technical storage or access that is used exclusively for statistical purposes.The technical storage or access that is used exclusively for anonymous statistical purposes. Without a subpoena, voluntary compliance on the part of your Internet Service Provider, or additional records from a third party, information stored or retrieved for this purpose alone cannot usually be used to identify you.
Marketing
The technical storage or access is required to create user profiles to send advertising, or to track the user on a website or across several websites for similar marketing purposes.


 Sotaro Hikita is an Analytics Solutions Architect. He supports customers across a wide range of industries in building and operating analytics platforms more effectively. He is particularly passionate about big data technologies and open source software.
 Noritaka Sekiyama is a Principal Big Data Architect on the AWS Glue team. He works based in Tokyo, Japan. He is responsible for building software artifacts to help customers. In his spare time, he enjoys cycling with his road bike.
 Kyle Duong is a Senior Software Development Engineer on the AWS Glue and AWS Lake Formation team. He is passionate about building big data technologies and distributed systems.
 Sandeep Adwankar is a Senior Product Manager at AWS. Based in the California Bay Area, he works with customers around the globe to translate business and technical requirements into products that enable customers to improve how they manage, secure, and access data.