На второ четене: „Цялото наше безумство“

Post Syndicated from original https://www.toest.bg/na-vtoro-chetene-cyaloto-nashe-bezumstvo/

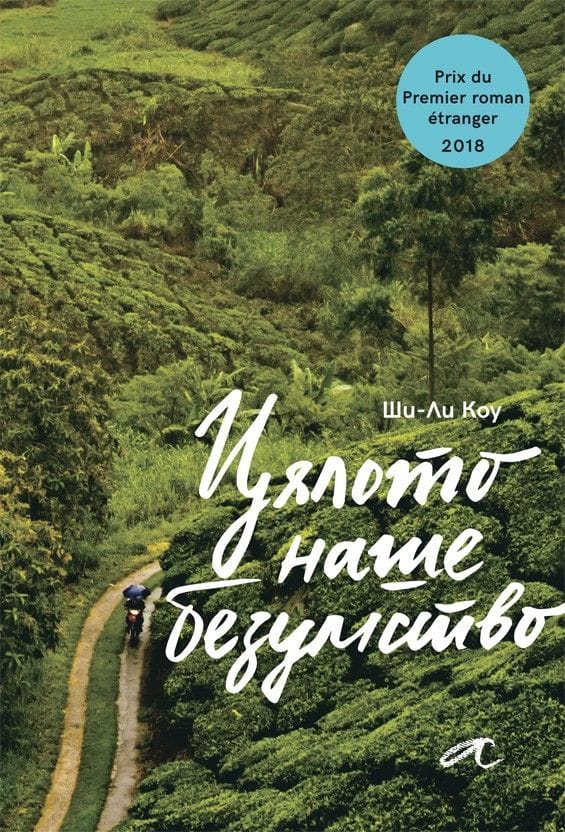
„Цялото наше безумство“ от Ши-Ли Коу

На второ четене: „Цялото наше безумство“

превод от английски Светослава Павлова, изд. „Алтера“, 2022

Обикновено има или целенасочен интерес и изрично любопитство, или някаква странна съпротива и съмнение, когато човек посяга към литература от автори, принадлежащи на крайно далечна от нас култура. Признавам си, че зачетох „Цялото наше безумство“ на малайската авторка Ши-Ли Коу по втория начин само за да установя

колко изумително сходен на нашия е светът, който тя описва –

в устройството на обществото и специфичните му недъзи; в хитрите и често смехотворни преки към справянето с бита, спецификата на отношенията и живописните характери в провинцията; в противопоставянето на глобалния мегаполис и справянето с неумолимо настъпващия „прогрес“; в шегите и езика.

Романът представлява двугласен хор от разкази в първо лице, като едното повествование се води от възрастен етнически китаец, а другото – от подрастващо християнско момиче.

Съдбата на двамата се преплита, когато момичето бива осиновено след катастрофа от близката на мъжа – малайката Мами Биви. Жена, която като че ли сме срещали в редица други любими книги: самодостатъчна особнячка, самотна и самобитна, чудата и доизмисляща истории, всяка от които започва с „Беше/Имаше неестествен…“. Тази дума – неестествен, ще бележи всичко случващо се в измисления градец Лубок Сайонг в щата Перак, така че дори нормалните и обичайни неща ще придобият някакъв друг, извънвремеви и леко магичен привкус. Така както някои от героите ще виждат неспокойни мъртви или ангели, рибите ще имат съзнание, а част от събитията ще се случват като че ли по неведомо съвпадение.

Не, романът далеч не е в традицията на латиноамериканския магически реализъм, макар тук-там да има подобни краски.

Разказът е изключително земен, изпълнен със сладостна ирония и ярък социален сарказъм.

Книгата не представлява също така нито мемоари на възрастния мъж (макар и донякъде да наподобява градски летописи, водени в ние-форма), нито роман на израстването в аз-форма, както се споменава в анотацията. Може би защото героите разказвачи не са наистина важните, фокусът не е тяхната промяна или израстване, те не са в центъра на събитията.

Големият герой на този роман е всъщност самият градец, както и неговите типажи, чешити, местни и случайно приходящи. Това неголямо и не особено уредено място няма как да не ви се стори безкрайно познато – то все още е далеч от инфраструктурата, привилегиите и шаблонния лукс на глобалното, макар „прогресът“ по един или друг начин да пълзи към него. Иска ли питане, че политиците минават през него инцидентно преди избори и с известна погнуса, а ежегодните наводнения са нещо, което жителите са приели като природна даденост, както – уви – често се случва и у нас:

В Лубок Сайонг не виним пътното строителство, обезлесяването, затинените реки, запушените отводнителни тръби или универсалния виновник, корумпираните бюрократи, които работят в отделите, отговарящи за гореспоменатите пътища, гори, реки и тръби.

В този град, където всичко е едно – една болница, едно полицейско управление, една бензиностанция и така нататък – легендата е най-близката възможност за преодоляване на нелицеприятната и скучна истина за реалността такава, каквато е. Дори и тя обаче е оскъдна и не особено атрактивна, за да привлича достатъчно интерес към града, или както разказвачът описва местното предлагане на легендите –

хладни и слабо гарнирани, на порции, недостатъчни да задоволят апетита или въображението.

Ши-Ли Коу е изключително забавна в начина, по който кара разказвача си да (само)иронизира местните поверия, да „героизира“ на шега обикновеното, докато подкача „автентичното“ и „традиционното“, да извежда на преден план смешното, като същевременно буди у нас симпатия към него. 

Съпоставяйки от време на време живота с този в столицата Куала Лумпур, авторката очертава ясни дихотомии, без нито за миг да бъде мелодраматична или да идеализира едното за сметка на другото: уж автентичното ръчно труд-и-творчество (често „подпомагано“ от поръчаните в Китай масовки) срещу индустриализацията и големите фабрики, в които в крайна сметка работят същите „мързеливи, глупави и злочести хора, които просто се опитват да си изкарат прехраната“; неугледния локален туризъм, на който се отдават само случайно изпаднали авантюристи, срещу маститите спа комплекси за добре плащащите чуждестранни гости; местната храна, която може да предизвика позиви за често ходене до тоалетната, срещу безличните световни вериги, като „Старбъкс“ и „Макдоналдс“; самодоволните доброволци от големия град и свикналите с бедствията провинциалисти, които се дразнят от тяхната жизнерадостна и клиширана помощ; забавната неприветливост на самобитното срещу абсурда на привнесеното; традиционните ислямски закони и илюзорното приличие срещу реалното съществуване на травестити и други сексуални и личностни свободи зад кулисите.

Възможно е тогава да се каже, че „Цялото наше безумство“ може да се чете като своеобразна социална сатира,

тъй като във всяка възможна ситуация и чрез куп метафори Ши Ли-Коу не пропуска да ни напомни за обществените реалности. Макар и история на един отделно взет малък град, тя е история на съвременна Малайзия встрани от лъскавите туристически брошури. Ши Ли-Коу очертава ежедневието на земния, обикновен човек (чиято практичност измества дори въпросите на живот и смърт) чрез поредица от забавни, полукомични и леко тъжни случки. Ще научим как се клинчи от час, как се спасяват пиявици, как се превъзпитават травестити, как се прави мост в нищото и т.н. И във всичко това ще личи носталгията по непревзетото от глобализма, по малкия град, по твърде човешкото. 

Тази книга наистина е изпълнена с неподправено човеколюбие,

с великодушно снизхождение към кривиците и недостатъците на всеки и с обич към доброто и достойното у всеки – независимо от неговата етническа, верска, сексуална и друга принадлежност. В мешавицата от етноси, която Ши-Ли Коу забърква – малайци, индийци, китайци, индонезийци, – човекът в която и да е координатна точка на споменатото в горния абзац остава просто човек: погрешим, в никога незавършен процес на себесъздаване, очарователно комичен. Важното е, че той не е сам за себе си – героите на романа неизбежно намират път един към друг, колкото и криволичещ да е той, образуват сложни, но автентични връзки и в крайна сметка една истинска човечна общност в епруветката на измисления Лубок Сайонг.

На второ четене: „Цялото наше безумство“

В „Цялото наше безумство“ няма поука, както признава чрез героите си авторката:

Искам да кажа на тези, които идват, на всеки, който би ме чул, че урокът не е в разказа, а в живота.

И за да затворим кръга към далечното, което особено на нас, българите, ще ни се стори безкрайно познато, ще ви оставя

кратък списък с някои неща от ежедневния дискурс, които веднага ще разпознаете като родни

и които присъстват в книгата:

  • всичко е политика;
  • таксиметровите шофьори се оплакват, че държавата е съсипана и никой не се грижи за тях, а всички искат да ги прецакат;
  • всичко гнило идва от Китай – отровено мляко за кърмачета, консервирана храна с живак, масово произведените сувенири;
  • всички гледат ужасно дублирани сапунени опери;
  • хората в крайна сметка си предпочитат съмнителната и мързелива помощ на корумпираните институции;
  • те споделят тихото чакане и кротката търпимост по отношение на некадърността, защото общата мизерия свързва;
  • политиците раздават пари на калпак преди избори на всички социално ощетени групи освен данъкоплатците на платена работа;
  • природните бедствия са по вина на корупцията и нехайството, но са представяни като добри за нацията, защото карат обществото да се обединява около обща кауза;
  • младите, които все пак остават в малкия град, просто твърде много обичат мързеливия си живот, за да се бъхтят на някаква работа;
  • прогресът не е исторически, а преди всичко търговски и се измерва с потреблението на куп жалонни боклуци.

Завършвам с една присъда на Мама Биви:

Вие сте тези, които погубихте Куала Лумпур. Продължихте да строите магазини, офиси, жилищни сгради и огромни молове. Живеехте си в множеството ви мезонети и вили и те пак не ви бяха достатъчни. Строите още по-големи сгради, за да продавате все повече неща. Настоявате за все повече чуждестранни майстори готвачи и лъскави ресторанти, които трябва да се обновяват на всеки три години. Построихте още пътища за шестте ви коли, с които задушавате града, защото много ще се изпотите, ако се качите в метрото или автобуса. И се оплаквате, че градът бил загубил чара си?


Никой от нас не чете единствено най-новите книги. Тогава защо само за тях се пише? „На второ четене“ е рубрика, в която отваряме списъците с книги, публикувани преди поне година, четем ги и препоръчваме любимите си от тях. Рубриката е част от партньорската програма Читателски клуб „Тоест“. Изборът на заглавия обаче е единствено на авторите – Стефан Иванов и Антония Апостолова, които биха ви препоръчали тези книги и ако имаше как веднъж на две седмици да се разходите с тях в книжарницата.

ASRock Rack MECAI-GH200 Short-Depth NVIDIA Grace Hopper Server

Post Syndicated from Cliff Robinson original https://www.servethehome.com/asrock-rack-mecai-gh200-short-depth-nvidia-grace-hopper-server-arm/

The ASRock Rack MECAI-GH200 is a short-depth NVIDIA Grace Hopper (GH200) server with lots of I/O and designed for single aisle servicing

The post ASRock Rack MECAI-GH200 Short-Depth NVIDIA Grace Hopper Server appeared first on ServeTheHome.

Reverse Searching Netflix’s Federated Graph

Post Syndicated from Netflix Technology Blog original https://netflixtechblog.com/reverse-searching-netflixs-federated-graph-222ac5d23576

By Ricky Gardiner, Alex Hutter, and Katie Lefevre

Since our previous posts regarding Content Engineering’s role in enabling search functionality within Netflix’s federated graph (the first post, where we identify the issue and elaborate on the indexing architecture, and the second post, where we detail how we facilitate querying) there have been significant developments. We’ve opened up Studio Search beyond Content Engineering to the entirety of the Engineering organization at Netflix and renamed it Graph Search. There are over 100 applications integrated with Graph Search and nearly 50 indices we support. We continue to add functionality to the service. As promised in the previous post, we’ll share how we partnered with one of our Studio Engineering teams to build reverse search. Reverse search inverts the standard querying pattern: rather than finding documents that match a query, it finds queries that match a document.

Intro

Tiffany is a Netflix Post Production Coordinator who oversees a slate of nearly a dozen movies in various states of pre-production, production, and post-production. Tiffany and her team work with various cross-functional partners, including Legal, Creative, and Title Launch Management, tracking the progression and health of her movies.

So Tiffany subscribes to notifications and calendar updates specific to certain areas of concern, like “movies shooting in Mexico City which don’t have a key role assigned”, or “movies that are at risk of not being ready by their launch date”.

Tiffany is not subscribing to updates of particular movies, but subscribing to queries that return a dynamic subset of movies. This poses an issue for those of us responsible for sending her those notifications. When a movie changes, we don’t know who to notify, since there’s no association between employees and the movies they’re interested in.

We could save these searches, and then repeatedly query for the results of every search, but because we’re part of a large federated graph, this would have heavy traffic implications for every service we’re connected to. We’d have to decide if we wanted timely notifications or less load on our graph.

If we could answer the question “would this movie be returned by this query”, we could re-query based on change events with laser precision and not impact the broader ecosystem.

The Solution

Graph Search is built on top of Elasticsearch, which has the exact capabilities we require:

Instead of taking a search (like “spanish-language movies shot in Mexico City”) and returning the documents that match (One for Roma, one for Familia), a percolate query takes a document (one for Roma) and returns the searches that match that document, like “spanish-language movies” and “scripted dramas”.

We’ve communicated this functionality as the ability to save a search, called SavedSearches, which is a persisted filter on an existing index.

type SavedSearch {
id: ID!
filter: String
index: SearchIndex!
}

That filter, written in Graph Search DSL, is converted to an Elasticsearch query and indexed in a percolator field. To learn more about Graph Search DSL and why we created it rather than using Elasticsearch query language directly, see the Query Language section of “How Netflix Content Engineering makes a federated graph searchable (Part 2)”.

We’ve called the process of finding matching saved searches ReverseSearch. This is the most straightforward part of this offering. We added a new resolver to the Domain Graph Service (DGS) for Graph Search. It takes the index of interest and a document, and returns all the saved searches that match the document by issuing a percolate query.

"""
Query for retrieving all the registered saved searches, in a given index,
based on a provided document. The document in this case is an ElasticSearch
document that is generated based on the configuration of the index.
"""
reverseSearch(
after: String,
document: JSON!,
first: Int!,
index: SearchIndex!): SavedSearchConnection

Persisting a SavedSearch is implemented as a new mutation on the Graph Search DGS. This ultimately triggers the indexing of an Elasticsearch query in a percolator field.

"""
Mutation for registering and updating a saved search. They need to be updated
any time a user adjusts their search criteria.
"""
upsertSavedSearch(input: UpsertSavedSearchInput!): UpsertSavedSearchPayload

Supporting percolator fields fundamentally changed how we provision the indexing pipelines for Graph Search (see Architecture section of How Netflix Content Engineering makes a federated graph searchable). Rather than having a single indexing pipeline per Graph Search index we now have two: one to index documents and one to index saved searches to a percolate index. We chose to add percolator fields to a separate index in order to tune performance for the two types of queries separately.

Elasticsearch requires the percolate index to have a mapping that matches the structure of the queries it stores and therefore must match the mapping of the document index. Index templates define mappings that are applied when creating new indices. By using the index_patterns functionality of index templates, we’re able to share the mapping for the document index between the two. index_patterns also gives us an easy way to add a percolator field to every percolate index we create.

Example of document index mapping

Index pattern — application_*

{
"order": 1,
"index_patterns": ["application_*"],
"mappings": {
"properties": {
"movieTitle": {
"type": "keyword"
},
"isArchived": {
"type": "boolean"
}
}
}

Example of percolate index mappings

Index pattern — *_percolate

{
"order": 2,
"index_patterns": ["*_percolate*"],
"mappings": {
"properties": {
"percolate_query": {
"type": "percolator"
}
}
}
}

Example of generated mapping

Percolate index name is application_v1_percolate

{
"application_v1_percolate": {
"mappings": {
"_doc": {
"properties": {
"movieTitle": {
"type": "keyword"
},
"isArchived": {
"type": "boolean"
},
"percolate_query": {
"type": "percolator"
}
}
}
}
}
}

Percolate Indexing Pipeline

The percolate index isn’t as simple as taking the input from the GraphQL mutation, translating it to an Elasticsearch query, and indexing it. Versioning, which we’ll talk more about shortly, reared its ugly head and made things a bit more complicated. Here is the way the percolate indexing pipeline is set up.

See Data Mesh — A Data Movement and Processing Platform @ Netflix to learn more about Data Mesh.
  1. When SavedSearches are modified, we store them in our CockroachDB, and the source connector for the Cockroach database emits CDC events.
  2. A single table is shared for the storage of all SavedSearches, so the next step is filtering down to just those that are for *this* index using a filter processor.
  3. As previously mentioned, what is stored in the database is our custom Graph Search filter DSL, which is not the same as the Elasticsearch DSL, so we cannot directly index the event to the percolate index. Instead, we issue a mutation to the Graph Search DGS. The Graph Search DGS translates the DSL to an Elasticsearch query.
  4. Then we index the Elasticsearch query as a percolate field in the appropriate percolate index.
  5. The success or failure of the indexing of the SavedSearch is returned. On failure, the SavedSearch events are sent to a Dead Letter Queue (DLQ) that can be used to address any failures, such as fields referenced in the search query being removed from the index.

Now a bit on versioning to explain why the above is necessary. Imagine we’ve started tagging movies that have animals. If we want users to be able to create views of “movies with animals”, we need to add this new field to the existing search index to flag movies as such. However, the mapping in the current index doesn’t include it, so we can’t filter on it. To solve for this we have index versions.

Dalia & Forrest from the series Baby Animal Cam

When a change is made to an index definition that necessitates a new mapping, like when we add the animal tag, Graph Search creates a new version of the Elasticsearch index and a new pipeline to populate it. This new pipeline reads from a log-compacted Kafka topic in Data Mesh — this is how we can reindex the entire corpus without asking the data sources to resend all the old events. The new pipeline and the old pipeline run side by side, until the new pipeline has processed the backlog, at which point Graph Search cuts over to the version using Elasticsearch index aliases.

Creating a new index for our documents means we also need to create a new percolate index for our queries so they can have consistent index mappings. This new percolate index also needs to be backfilled when we change versions. This is why the pipeline works the way it does — we can again utilize the log compacted topics in Data Mesh to reindex the corpus of SavedSearches when we spin up a new percolate indexing pipeline.

We persist the user provided filter DSL to the database rather than immediately translating it to Elasticsearch query language. This enables us to make changes or fixes when we translate the saved search DSL to an Elasticsearch query . We can deploy those changes by creating a new version of the index as the bootstrapping process will re-translate every saved search.

Another Use Case

We hoped reverse search functionality would eventually be useful for other engineering teams. We were approached almost immediately with a problem that reverse searching could solve.

The way you make a movie can be very different based on the type of movie it is. One movie might go through a set of phases that are not applicable to another, or might need to schedule certain events that another movie doesn’t require. Instead of manually configuring the workflow for a movie based on its classifications, we should be able to define the means of classifying movies and use that to automatically assign them to workflows. But determining the classification of a movie is challenging: you could define these movie classifications based on genre alone, like “Action” or “Comedy”, but you likely require more complex definitions. Maybe it’s defined by the genre, region, format, language, or some nuanced combination thereof. The Movie Matching service provides a way to classify a movie based on any combination of matching criteria. Under the hood, the matching criteria are stored as reverse searches, and to determine which criteria a movie matches against, the movie’s document is submitted to the reverse search endpoint.

In short, reverse search is powering an externalized criteria matcher. It’s being used for movie criteria now, but since every Graph Search index is now reverse-search capable, any index could use this pattern.

A Possible Future: Subscriptions

Reverse searches also look like a promising foundation for creating more responsive UIs. Rather than fetching results once as a query, the search results could be provided via a GraphQL subscription. These subscriptions could be associated with a SavedSearch and, as index changes come in, reverse search can be used to determine when to update the set of keys returned by the subscription.


Reverse Searching Netflix’s Federated Graph was originally published in Netflix TechBlog on Medium, where people are continuing the conversation by highlighting and responding to this story.

V8 incorporates new sandbox

Post Syndicated from daroc original https://lwn.net/Articles/968429/

V8, the JavaScript engine used in Chrome,
announced
that its memory sandbox is no longer experimental.

Chrome 123 could therefore be considered to be a sort of “beta”
release for the sandbox. This blog post uses this opportunity to
discuss the motivation behind the sandbox, show how it prevents
memory corruption in V8 from spreading within the host process, and
ultimately explain why it is a necessary step towards memory safety.

[$] A focus on FOSS funding

Post Syndicated from jzb original https://lwn.net/Articles/967001/

Among the numerous approaches to funding the development and advancement of
open-source software, corporate sponsorship in the form of donations to umbrella
organizations is perhaps the most visible. At SCALE21x in Pasadena, California, Duane O’Brien
presented
a slice of his recent research into the landscape of such sponsorship arrangements,
with an overview of the identifiable trends of the past ten years and some initial
insights he hopes are valuable for sponsors and community members alike.

How Aura from Unity revolutionized their big data pipeline with Amazon Redshift Serverless

Post Syndicated from Yonatan Dolan original https://aws.amazon.com/blogs/big-data/how-aura-from-unity-revolutionized-their-big-data-pipeline-with-amazon-redshift-serverless/

This post is co-written with  Amir Souchami and  Fabian Szenkier from Unity.

Aura from Unity (formerly known as ironSource) is the market standard for creating rich device experiences that engage and retain customers. With a powerful set of solutions, Aura enables complete digital transformation, letting operators promote key services outside the store, directly on-device.

Amazon Redshift is a recommended service for online analytical processing (OLAP) workloads such as cloud data warehouses, data marts, and other analytical data stores. You can use simple SQL to analyze structured and semi-structured data, operational databases, and data lakes to deliver the best price/performance at any scale. The Amazon Redshift data sharing feature provides instant, granular, and high-performance access without data copies and data movement across multiple Redshift data warehouses in the same or different AWS accounts and across AWS Regions. Data sharing provides live access to data so that you always see the most up-to-date and consistent information as it’s updated in the data warehouse.

Amazon Redshift Serverless makes it straightforward to run and scale analytics in seconds without the need to set up and manage data warehouse clusters. Redshift Serverless automatically provisions and intelligently scales data warehouse capacity to deliver fast performance for even the most demanding and unpredictable workloads, and you pay only for what you use. You can load your data and start querying right away in the Amazon Redshift Query Editor or in your favorite business intelligence (BI) tool and continue to enjoy the best price/performance and familiar SQL features in an easy-to-use, zero administration environment.

In this post, we describe Aura’s successful and swift adoption of Redshift Serverless, which allowed them to optimize their overall bidding advertisement campaigns’ time to market from 24 hours to 2 hours. We explore why Aura chose this solution and what technological challenges it helped solve.

Aura’s initial data pipeline

Aura is a pioneer in using Redshift RA3 clusters with data sharing for extract, transform, and load (ETL) and BI workloads. One of Aura’s operations is bidding advertisement campaigns. These campaigns are optimized by using an AI-based bid process that requires running hundreds of analytical queries per campaign. These queries are run on data that resides in an RA3 provisioned Redshift cluster.

The integrated pipeline is comprised of various AWS services:

The following diagram illustrates this architecture.

Aura architecture

Challenges of the initial architecture

The queries for each campaign run in the following manner:

First, a preparation query filters and aggregates raw data, preparing it for the subsequent operation. This is followed by the main query, which carries out the logic according to the preparation query result set.

As the number of campaigns grew, Aura’s Data team was required to run hundreds of concurrent queries for each of these steps. Aura’s existing provisioned cluster was already heavily utilized with data ingestion, ETL, and BI workloads, so they were looking for cost-effective ways to isolate this workload with dedicated compute resources.

The team evaluated a variety of options, including unloading data to Amazon S3 and a multi-cluster architecture using data sharing and Redshift serverless. The team gravitated towards the multi-cluster architecture with data sharing, as it requires no query rewrite, allows for dedicated compute for this specific workload, avoids the need to duplicate or move data from the main cluster, and provides high concurrency and automatic scaling. Lastly, it’s billed in a pay-for-what-you-use model, and provisioning is straightforward and quick.

Proof of concept

After evaluating the options, Aura’s Data team decided to conduct a proof of concept using Redshift Serverless as a consumer of their main Redshift provisioned cluster, sharing just the relevant tables for running the required queries. Redshift Serverless measures data warehouse capacity in Redshift Processing Units (RPUs). A single RPU provides 16 GB of memory and a serverless endpoint can range from 8 RPU to 512 RPU.

Aura’s Data team started the proof of concept using a 256 RPU Redshift Serverless endpoint and gradually lowered the RPU to reduce costs while making sure the query runtime was below the required target.

Eventually, the team decided to use a 128 RPU (2 TB RAM) Redshift Serverless endpoint as the base RPU, while using the Redshift Serverless auto scaling feature, which allows hundreds of concurrent queries to run by automatically upscaling the RPU as needed.

Aura’s new solution with Redshift Serverless

After a successful proof of concept, the production setup included adding code to switch between the provisioned Redshift cluster and the Redshift Serverless endpoint. This was done using a configurable threshold based on the number of queries waiting to be processed in a specific MSK topic consumed at the beginning of the pipeline. Small-scale campaign queries would still run on the provisioned cluster, and large-scale queries would use the Redshift Serverless endpoint. The new solution uses an Amazon MWAA pipeline that fetches configuration information from a DynamoDB table, consumes jobs that represent ad campaigns, and then runs hundreds of EKS jobs triggered using EKSPodOperator. Each job runs the two serial queries (the preparation query followed by a main query, which outputs the results to Amazon S3). This happens several hundred times concurrently using Redshift Serverless compute resources.

Then the process initiates another set of EKSPodOperator operators to run the AI training code based on the data result that was saved on Amazon S3.

The following diagram illustrates the solution architecture.

Aura new architecture

Outcome

The overall runtime of the pipeline was reduced from 24 hours to just 2 hours, a 12-times improvement. This integration of Redshift Serverless, coupled with data sharing, led to a 90% reduction in pipeline duration, negating the necessity for data duplication or query rewriting. Moreover, the introduction of a dedicated consumer as an exclusive compute resource significantly eased the load of the producer cluster, enabling running small-scale queries even faster.

“Redshift Serverless and data sharing enabled us to provision and scale our data warehouse capacity to deliver fast performance, high concurrency and handle challenging ML workloads with very minimal effort.”

– Amir Souchami, Aura’s Principal Technical Systems Architect.

Learnings

Aura’s Data team is highly focused on working in a cost-effective manner and has therefore implemented several cost controls in their Redshift Serverless endpoint:

  • Limit the overall spend by setting a maximum RPU-hour usage limit (per day, week, month) for the workgroup. Aura configured that limit so when it is reached, Amazon Redshift will send an alert to the relevant Amazon Redshift administrator team. This feature also allows writing an entry to a system table and even turning off user queries.
  • Use a maximum RPU configuration, which defines the upper limit of compute resources that Redshift Serverless can use at any given time. When the maximum RPU limit is set for the workgroup, Redshift Serverless scales within that limit to continue to run the workload.
  • Implement query monitoring rules that prevent wasteful resource utilization and runaway costs caused by poorly written queries.

Conclusion

A data warehouse is a crucial part of any modern data-driven company, enabling you to answer complex business questions and provide insights. The evolution of Amazon Redshift allowed Aura to quickly adapt to business requirements by combining data sharing between provisioned and Redshift Serverless data warehouses. Aura’s journey with Redshift Serverless underscores the vast potential of strategic tech integration in driving efficiency and operational excellence.

If Aura’s journey has sparked your interest and you are considering implementing a similar solution in your organization, here are some strategic steps to consider:

  • Start by thoroughly understanding your organization’s data needs and how such a solution can address them.
  • Reach out to AWS experts, who can provide you with guidance based on their own experiences. Consider engaging in seminars, workshops, or online forums that discuss these technologies. The following resources are recommended for getting started:
  • An important part of this journey would be to implement a proof of concept. Such hands-on experience will provide valuable insights before moving to production.

Elevate your Redshift expertise. Already enjoying the power of Amazon Redshift? Enhance your data journey with the latest features and expert guidance. Reach out to your dedicated AWS account team for personalized support, discover cutting-edge capabilities, and unlock even greater value from your data with Amazon Redshift.


About the Authors

Amir Souchami, Chief Architect of Aura from Unity, focusing on creating resilient and performant cloud systems and mobile apps at major scale.

Fabian Szenkier is the ML and Big Data Architect at Aura by Unity, works on building modern AI/ML solutions and state of the art data engineering pipelines at scale.

Liat Tzur is a Senior Technical Account Manager at Amazon Web Services. She serves as the customer’s advocate and assists her customers in achieving cloud operational excellence in alignment with their business goals.

Adi Jabkowski is a Sr. Redshift Specialist in EMEA, part of the Worldwide Specialist Organization (WWSO) at AWS.

Yonatan Dolan is a Principal Analytics Specialist at Amazon Web Services. He is located in Israel and helps customers harness AWS analytical services to leverage data, gain insights, and derive value.

Automate large-scale data validation using Amazon EMR and Apache Griffin

Post Syndicated from Dipal Mahajan original https://aws.amazon.com/blogs/big-data/automate-large-scale-data-validation-using-amazon-emr-and-apache-griffin/

Many enterprises are migrating their on-premises data stores to the AWS Cloud. During data migration, a key requirement is to validate all the data that has been moved from source to target. This data validation is a critical step, and if not done correctly, may result in the failure of the entire project. However, developing custom solutions to determine migration accuracy by comparing the data between the source and target can often be time-consuming.

In this post, we walk through a step-by-step process to validate large datasets after migration using a configuration-based tool using Amazon EMR and the Apache Griffin open source library. Griffin is an open source data quality solution for big data, which supports both batch and streaming mode.

In today’s data-driven landscape, where organizations deal with petabytes of data, the need for automated data validation frameworks has become increasingly critical. Manual validation processes are not only time-consuming but also prone to errors, especially when dealing with vast volumes of data. Automated data validation frameworks offer a streamlined solution by efficiently comparing large datasets, identifying discrepancies, and ensuring data accuracy at scale. With such frameworks, organizations can save valuable time and resources while maintaining confidence in the integrity of their data, thereby enabling informed decision-making and enhancing overall operational efficiency.

The following are standout features for this framework:

  • Utilizes a configuration-driven framework
  • Offers plug-and-play functionality for seamless integration
  • Conducts count comparison to identify any disparities
  • Implements robust data validation procedures
  • Ensures data quality through systematic checks
  • Provides access to a file containing mismatched records for in-depth analysis
  • Generates comprehensive reports for insights and tracking purposes

Solution overview

This solution uses the following services:

  • Amazon Simple Storage Service (Amazon S3) or Hadoop Distributed File System (HDFS) as the source and target.
  • Amazon EMR to run the PySpark script. We use a Python wrapper on top of Griffin to validate data between Hadoop tables created over HDFS or Amazon S3.
  • AWS Glue to catalog the technical table, which stores the results of the Griffin job.
  • Amazon Athena to query the output table to verify the results.

We use tables that store the count for each source and target table and also create files that show the difference of records between source and target.

The following diagram illustrates the solution architecture.

Architecture_Diagram

In the depicted architecture and our typical data lake use case, our data either resides n Amazon S3 or is migrated from on premises to Amazon S3 using replication tools such as AWS DataSync or AWS Database Migration Service (AWS DMS). Although this solution is designed to seamlessly interact with both Hive Metastore and the AWS Glue Data Catalog, we use the Data Catalog as our example in this post.

This framework operates within Amazon EMR, automatically running scheduled tasks on a daily basis, as per the defined frequency. It generates and publishes reports in Amazon S3, which are then accessible via Athena. A notable feature of this framework is its capability to detect count mismatches and data discrepancies, in addition to generating a file in Amazon S3 containing full records that didn’t match, facilitating further analysis.

In this example, we use three tables in an on-premises database to validate between source and target : balance_sheet, covid, and survery_financial_report.

Prerequisites

Before getting started, make sure you have the following prerequisites:

Deploy the solution

To make it straightforward for you to get started, we have created a CloudFormation template that automatically configures and deploys the solution for you. Complete the following steps:

  1. Create an S3 bucket in your AWS account called bdb-3070-griffin-datavalidation-blog-${AWS::AccountId}-${AWS::Region} (provide your AWS account ID and AWS Region).
  2. Unzip the following file to your local system.
  3. After unzipping the file to your local system, change <bucket name> to the one you created in your account (bdb-3070-griffin-datavalidation-blog-${AWS::AccountId}-${AWS::Region}) in the following files:
    1. bootstrap-bdb-3070-datavalidation.sh
    2. Validation_Metrics_Athena_tables.hql
    3. datavalidation/totalcount/totalcount_input.txt
    4. datavalidation/accuracy/accuracy_input.txt
  4. Upload all the folders and files in your local folder to your S3 bucket:
    aws s3 cp . s3://<bucket_name>/ --recursive

  5. Run the following CloudFormation template in your account.

The CloudFormation template creates a database called griffin_datavalidation_blog and an AWS Glue crawler called griffin_data_validation_blog on top of the data folder in the .zip file.

  1. Choose Next.
    Cloudformation_template_1
  2. Choose Next again.
  3. On the Review page, select I acknowledge that AWS CloudFormation might create IAM resources with custom names.
  4. Choose Create stack.

You can view the stack outputs on the AWS Management Console or by using the following AWS CLI command:

aws cloudformation describe-stacks --stack-name <stack-name> --region us-east-1 --query Stacks[0].Outputs
  1. Run the AWS Glue crawler and verify that six tables have been created in the Data Catalog.
  2. Run the following CloudFormation template in your account.

This template creates an EMR cluster with a bootstrap script to copy Griffin-related JARs and artifacts. It also runs three EMR steps:

  • Create two Athena tables and two Athena views to see the validation matrix produced by the Griffin framework
  • Run count validation for all three tables to compare the source and target table
  • Run record-level and column-level validations for all three tables to compare between the source and target table
  1. For SubnetID, enter your subnet ID.
  2. Choose Next.
    Cloudformation_template_2
  3. Choose Next again.
  4. On the Review page, select I acknowledge that AWS CloudFormation might create IAM resources with custom names.
  5. Choose Create stack.

You can view the stack outputs on the console or by using the following AWS CLI command:

aws cloudformation describe-stacks --stack-name <stack-name> --region us-east-1 --query Stacks[0].Outputs

It takes approximately 5 minutes for the deployment to complete. When the stack is complete, you should see the EMRCluster resource launched and available in your account.

When the EMR cluster is launched, it runs the following steps as part of the post-cluster launch:

  • Bootstrap action – It installs the Griffin JAR file and directories for this framework. It also downloads sample data files to use in the next step.
  • Athena_Table_Creation – It creates tables in Athena to read the result reports.
  • Count_Validation – It runs the job to compare the data count between source and target data from the Data Catalog table and stores the results in an S3 bucket, which will be read via an Athena table.
  • Accuracy – It runs the job to compare the data rows between the source and target data from the Data Catalog table and store the results in an S3 bucket, which will be read via the Athena table.

Athena_table

When the EMR steps are complete, your table comparison is done and ready to view in Athena automatically. No manual intervention is needed for validation.

Validate data with Python Griffin

When your EMR cluster is ready and all the jobs are complete, it means the count validation and data validation are complete. The results have been stored in Amazon S3 and the Athena table is already created on top of that. You can query the Athena tables to view the results, as shown in the following screenshot.

The following screenshot shows the count results for all tables.

Summary_table

The following screenshot shows the data accuracy results for all tables.

Detailed_view

The following screenshot shows the files created for each table with mismatched records. Individual folders are generated for each table directly from the job.

mismatched_records

Every table folder contains a directory for each day the job is run.

S3_path_mismatched

Within that specific date, a file named __missRecords contains records that do not match.

S3_path_mismatched_2

The following screenshot shows the contents of the __missRecords file.

__missRecords

Clean up

To avoid incurring additional charges, complete the following steps to clean up your resources when you’re done with the solution:

  1. Delete the AWS Glue database griffin_datavalidation_blog and drop the database griffin_datavalidation_blog cascade.
  2. Delete the prefixes and objects you created from the bucket bdb-3070-griffin-datavalidation-blog-${AWS::AccountId}-${AWS::Region}.
  3. Delete the CloudFormation stack, which removes your additional resources.

Conclusion

This post showed how you can use Python Griffin to accelerate the post-migration data validation process. Python Griffin helps you calculate count and row- and column-level validation, identifying mismatched records without writing any code.

For more information about data quality use cases, refer to Getting started with AWS Glue Data Quality from the AWS Glue Data Catalog and AWS Glue Data Quality.


About the Authors

Dipal Mahajan serves as a Lead Consultant at Amazon Web Services, providing expert guidance to global clients in developing highly secure, scalable, reliable, and cost-efficient cloud applications. With a wealth of experience in software development, architecture, and analytics across diverse sectors such as finance, telecom, retail, and healthcare, he brings invaluable insights to his role. Beyond the professional sphere, Dipal enjoys exploring new destinations, having already visited 14 out of 30 countries on his wish list.

Akhil is a Lead Consultant at AWS Professional Services. He helps customers design & build scalable data analytics solutions and migrate data pipelines and data warehouses to AWS. In his spare time, he loves travelling, playing games and watching movies.

Ramesh Raghupathy is a Senior Data Architect with WWCO ProServe at AWS. He works with AWS customers to architect, deploy, and migrate to data warehouses and data lakes on the AWS Cloud. While not at work, Ramesh enjoys traveling, spending time with family, and yoga.

What is retrieval-augmented generation, and what does it do for generative AI?

Post Syndicated from Nicole Choi original https://github.blog/2024-04-04-what-is-retrieval-augmented-generation-and-what-does-it-do-for-generative-ai/

One of the hottest topics in AI right now is RAG, or retrieval-augmented generation, which is a retrieval method used by some AI tools to improve the quality and relevance of their outputs.

Organizations want AI tools that use RAG because it makes those tools aware of proprietary data without the effort and expense of custom model training. RAG also keeps models up to date.  When generating an answer without RAG, models can only draw upon data that existed when they were trained. With RAG, on the other hand, models can leverage a private database of newer information for more informed responses.

We talked to GitHub Next’s Senior Director of Research, Idan Gazit, and Software Engineer, Colin Merkel, to learn more about RAG and how it’s used in generative AI tools.

Why everyone’s talking about RAG

One of the reasons you should always verify outputs from a generative AI tool is because its training data has a knowledge cut-off date. While models are able to produce outputs that are tailored to a request, they can only reference information that existed at the time of their training. But with RAG, an AI tool can use data sources beyond its model’s training data to generate an output.

The difference between RAG and fine-tuning

Most organizations currently don’t train their own AI models. Instead, they customize pre-trained models to their specific needs, often using RAG or fine-tuning. Here’s a quick breakdown of how these two strategies differ.

Fine-tuning requires adjusting a model’s weights, which results in a highly customized model that excels at a specific task. It’s a good option for organizations that rely on codebases written in a specialized language, especially if the language isn’t well-represented in the model’s original training data.

RAG, on the other hand, doesn’t require weight adjustment. Instead, it retrieves and gathers information from a variety of data sources to augment a prompt, which results in an AI model generating a more contextually relevant response for the end user.

Some organizations start with RAG and then fine-tune their models to accomplish a more specific task. Other organizations find that RAG is a sufficient method for AI customization alone.

How AI models use context

In order for an AI tool to generate helpful responses, it needs the right context. This is the same dilemma we face as humans when making a decision or solving a problem. It’s hard to do when you don’t have the right information to act on.

So, let’s talk more about context in the context (😉) of generative AI:

  • Today’s generative AI applications are powered by large language models (LLMs) that are structured as transformers, and all transformer LLMs have a context window— the amount of data that they can accept in a single prompt. Though context windows are limited in size, they can and will continue to grow larger as more powerful models are released.

  • Input data will vary depending on the AI tool’s capabilities. For instance, when it comes to GitHub Copilot in the IDE, input data comprises all of the code in the file that you’re currently working on. This is made possible because of our Fill-in-the-Middle (FIM) paradigm, which makes GitHub Copilot aware of both the code before your cursor (the prefix) and after your cursor (the suffix).

    GitHub Copilot also processes code from your other open tabs (a process we call neighboring tabs) to potentially find and add relevant information to the prompt. When there are a lot of open tabs, GitHub Copilot will scan the most recently reviewed ones.

  • Because of the context window’s limited size, the challenge of ML engineers is to figure out what input data to add to the prompt and in what order to generate the most relevant suggestion from the AI model. This task is known as prompt engineering.

How RAG enhances an AI model’s contextual understanding

With RAG, an LLM can go beyond training data and retrieve information from a variety of data sources, including customized ones.

When it comes to GitHub Copilot Chat within GitHub.com and in the IDE, input data can include your conversation with the chat assistant, whether it’s code or natural language, through a process called in-context learning. It can also include data from indexed repositories (public or private), a collection of Markdown documentation across repositories (that we refer to as knowledge bases), and results from integrated search engines. From these other sources, RAG will retrieve additional data to augment the initial prompt. As a result, it can generate a more relevant response.

The type of input data used by GitHub Copilot will depend on which GitHub Copilot plan you’re using.

Chart comparing what is included in three different GitHub Copilot plans: Individual, Business, and Enterprise.

Unlike keyword search or Boolean search operators, an ML-powered semantic search system uses its training data to understand the relationship between your keywords. So, rather than view, for example, “cats” and “kittens” as independent terms as you would in a keyword search, a semantic search system can understand, from its training, that those words are often associated with cute videos of the animal. Because of this, a search for just “cats and kittens” might rank a cute animal video as a top search result.

How does semantic search improve the quality of RAG retrievals? When using a customized database or search engine as a RAG data source, semantic search can improve the context added to the prompt and overall relevance of the AI-generated output.

The semantic search process is at the heart of retrieval. “It surfaces great examples that often elicit great results,” Gazit says.

Developers can use Copilot Chat on GitHub.com to ask questions and receive answers about a codebase in natural language, or surface relevant documentation and existing solutions.

You’ve probably read dozens of articles (including some of our own) that talk about RAG, vector databases, and embeddings. And even if you haven’t, here’s something you should know: RAG doesn’t require embeddings or vector databases.

A RAG system can use semantic search to retrieve relevant documents, whether from an embedding-based retrieval system, traditional database, or search engine. The snippets from those documents are then formatted into the model’s prompt. We’ll provide a quick recap of vector databases and then, using GitHub Copilot Enterprise as an example, cover how RAG retrieves data from a variety of sources.

Vector databases

Vector databases are optimized for storing embeddings of your repository code and documentation. They allow us to use novel search parameters to find matches between similar vectors.

To retrieve data from a vector database, code and documentation are converted into embeddings, a type of high-dimensional vector, to make them searchable by a RAG system.

Here’s how RAG retrieves data from vector databases: while you code in your IDE, algorithms create embeddings for your code snippets, which are stored in a vector database. Then, an AI coding tool can search that database by embedding similarity to find snippets from across your codebase that are related to the code you’re currently writing and generate a coding suggestion. Those snippets are often highly relevant context, enabling an AI coding assistant to generate a more contextually relevant coding suggestion. GitHub Copilot Chat uses embedding similarity in the IDE and on GitHub.com, so it finds code and documentation snippets related to your query.

Embedding similarity  is incredibly powerful because it identifies code that has subtle relationships to the code you’re editing.

“Embedding similarity might surface code that uses the same APIs, or code that performs a similar task to yours but that lives in another part of the codebase,” Gazit explains. “When those examples are added to a prompt, the model’s primed to produce responses that mimic the idioms and techniques that are native to your codebase—even though the model was not trained on your code.”

General text search and search engines

With a general text search, any documents that you want to be accessible to the AI model are indexed ahead of time and stored for later retrieval. For instance, RAG in GitHub Copilot Enterprise can retrieve data from files in an indexed repository and Markdown files across repositories.

RAG can also retrieve information from external and internal search engines. When integrated with an external search engine, RAG can search and retrieve information from the entire internet. When integrated with an internal search engine, it can also access information from within your organization, like an internal website or platform. Integrating both kinds of search engines supercharges RAG’s ability to provide relevant responses.

For instance, GitHub Copilot Enterprise integrates both Bing, an external search engine, and an internal search engine built by GitHub into Copilot Chat on GitHub.com. Bing integration allows GitHub Copilot Chat to conduct a web search and retrieve up-to-date information, like about the latest Java release. But without a search engine searching internally, ”Copilot Chat on GitHub.com cannot answer questions about your private codebase unless you provide a specific code reference yourself,” explains Merkel, who helped to build GitHub’s internal search engine from scratch.

Here’s how this works in practice. When a developer asks a question about a repository to GitHub Copilot Chat in GitHub.com, RAG in Copilot Enterprise uses the internal search engine to find relevant code or text from indexed files to answer that question. To do this, the internal search engine conducts a semantic search by analyzing the content of documents from the indexed repository, and then ranking those documents based on relevance. GitHub Copilot Chat then uses RAG, which also conducts a semantic search, to find and retrieve the most relevant snippets from the top-ranked documents. Those snippets are added to the prompt so GitHub Copilot Chat can generate a relevant response for the developer.

Key takeaways about RAG

RAG offers an effective way to customize AI models, helping to ensure outputs are up to date with organizational knowledge and best practices, and the latest information on the internet.

GitHub Copilot uses a variety of methods to improve the quality of input data and contextualize an initial prompt, and that ability is enhanced with RAG. What’s more, the RAG retrieval method in GitHub Copilot Enterprise goes beyond vector databases and includes data sources like general text search and search engine integrations, which provides even more cost-efficient retrievals.

Context is everything when it comes to getting the most out of an AI tool. To improve the relevance and quality of a generative AI output, you need to improve the relevance and quality of the input.

As Gazit says, “Quality in, quality out.”

Looking to bring the power of GitHub Copilot Enterprise to your organization? Learn more about GitHub Copilot Enterprise or get started now.

The post What is retrieval-augmented generation, and what does it do for generative AI? appeared first on The GitHub Blog.

Incus 6.0 LTS released

Post Syndicated from corbet original https://lwn.net/Articles/968421/

Version
6.0 LTS
of the Incus container management system has been released.
This is a major milestone for Incus as it marks our first release with
extended support, suitable for use in production environments where monthly
feature releases aren’t suitable.
” Changes include swap limits for
containers, a new shell completion mechanism, support for the creation of
VLAN interfaces, improved live migration, and more.

New tools for production safety — Gradual deployments, Source maps, Rate Limiting, and new SDKs

Post Syndicated from Tanushree Sharma original https://blog.cloudflare.com/workers-production-safety


2024’s Developer Week is all about production readiness. On Monday. April 1, we announced that D1, Queues, Hyperdrive, and Workers Analytics Engine are ready for production scale and generally available. On Tuesday, April 2, we announced the same about our inference platform, Workers AI. And we’re not nearly done yet.

However, production readiness isn’t just about the scale and reliability of the services you build with. You also need tools to make changes safely and reliably. You depend not just on what Cloudflare provides, but on being able to precisely control and tailor how Cloudflare behaves to the needs of your application.

Today we are announcing five updates that put more power in your hands – Gradual Deployments, source mapped stack traces in Tail Workers, a new Rate Limiting API, brand-new API SDKs, and updates to Durable Objects – each built with mission-critical production services in mind. We build our own products using Workers, including Access, R2, KV, Waiting Room, Vectorize, Queues, Stream, and more. We rely on each of these new features ourselves to ensure that we are production ready – and now we’re excited to bring them to everyone.

Gradually deploy changes to Workers and Durable Objects

Deploying a Worker is nearly instantaneous – a few seconds and your change is live everywhere.

When you reach production scale, each change you make carries greater risk, both in terms of volume and expectations. You need to meet your 99.99% availability SLA, or have an ambitious P90 latency SLO. A bad deployment that’s live for 100% of traffic for 45 seconds could mean millions of failed requests. A subtle code change could cause a thundering herd of retries to an overwhelmed backend, if rolled out all at once. These are the kinds of risks we consider and mitigate ourselves for our own services built on Workers.

The way to mitigate these risks is to deploy changes gradually – commonly called rolling deployments:

  1. The current version of your application runs in production.
  2. You deploy the new version of your application to production, but only route a small percentage of traffic to this new version, and wait for it to “soak” in production, monitoring for regressions and bugs. If something bad happens, you’ve caught it early at a small percentage (e.g. 1%) of traffic and can revert quickly.
  3. You gradually increment the percentage of traffic until the new version receives 100%, at which point it is fully rolled out.

Today we’re opening up a first-class way to deploy code changes gradually to Workers and Durable Objects via the Cloudflare API, the Wrangler CLI, or the Workers dashboard. Gradual Deployments is entering open beta – you can use Gradual Deployments with any Cloudflare account that is on the Workers Free plan, and very soon you’ll be able to start using Gradual Deployments with Cloudflare accounts on the Workers Paid and Enterprise plans. You’ll see a banner on the Workers dashboard once your account has access.

When you have two versions of your Worker or Durable Object running concurrently in production, you almost certainly want to be able to filter your metrics, exceptions, and logs by version. This can help you spot production issues early, when the new version is only rolled out to a small percentage of traffic, or compare performance metrics when splitting traffic 50/50. We’ve also added observability at a version level across our platform:

  • You can filter analytics in the Workers dashboard and via the GraphQL Analytics API by version.
  • Workers Trace Events and Tail Worker events include the version ID of your Worker, along with optional version message and version tag fields.
  • When using wrangler tail to view live logs, you can view logs for a specific version.
  • You can access version ID, message, and tag from within your Worker’s code, by configuring the Version Metadata binding.

You may also want to make sure that each client or user only sees a consistent version of your Worker. We’ve added Version Affinity so that requests associated with a particular identifier (such as user, session, or any unique ID) are always handled by a consistent version of your Worker. Session Affinity, when used with Ruleset Engine, gives you full control over both the mechanism and identifier used to ensure “stickiness”.

Gradual Deployments is entering open beta. As we move towards GA, we’re working to support:

  • Version Overrides. Invoke a specific version of your Worker in order to test before it serves any production traffic. This will allow you to create Blue-Green Deployments.
  • Cloudflare Pages. Let the CI/CD system in Pages automatically progress the deployments on your behalf.
  • Automatic rollbacks. Roll back deployments automatically when the error rate spikes for a new version of your Worker.

We’re looking forward to hearing your feedback! Let us know what you think through this feedback form or reach out in our Developer Discord in the #workers-gradual-deployments-beta channel.

Source mapped stack traces in Tail Workers

Production readiness means tracking errors and exceptions, and trying to drive them down to zero. When an error occurs, the first thing you typically want to look at is the error’s stack trace – the specific functions that were called, in what order, from which line and file, and with what arguments.

Most JavaScript code – not just on Workers, but across platforms – is first bundled, often transpiled, and then minified before being deployed to production. This is done behind the scenes to create smaller bundles to optimize performance and convert from Typescript to JavaScript if needed.

If you’ve ever seen an exception return a stack trace like: /src/index.js:1:342,it means the error occurred on the 342nd character of your function’s minified code. This is clearly not very helpful for debugging.

Source maps solve this – they map compiled and minified code back to the original code that you wrote. Source maps are combined with the stack trace returned by the JavaScript runtime in order to present you with a human-readable stack trace. For example, the following stack trace shows that the Worker received an unexpected null value on line 30 of the down.ts file. This is a useful starting point for debugging, and you can move down the stack trace to understand the functions that were called that were set that resulted in the null value.

Unexpected input value: null
  at parseBytes (src/down.ts:30:8)
  at down_default (src/down.ts:10:19)
  at Object.fetch (src/index.ts:11:12)

Here’s how it works:

  1. When you set upload_source_maps = true in your wrangler.toml, Wrangler will automatically generate and upload any source map files when you run wrangler deploy or wrangler versions upload.
  2. When your Worker throws an uncaught exception, we fetch the source map and use it to map the stack trace of the exception back to lines of your Worker’s original source code.
  3. You can then view this deobfuscated stack trace in real-time logs or in Tail Workers.

Starting today, in open beta, you can upload source maps to Cloudflare when you deploy your Worker – get started by reading the docs. And starting on April 15th , the Workers runtime will start using source maps to deobfuscate stack traces. We’ll post a notification in the Cloudflare dashboard and post on our Cloudflare Developers X account when source mapped stack traces are available.

New Rate Limiting API in Workers

An API is only production ready if it has a sensible rate limit. And as you grow, so does the complexity and diversity of limits that you need to enforce in order to balance the needs of specific customers, protect the health of your service, or enforce and adjust limits in specific scenarios. Cloudflare’s own API has this challenge – each of our dozens of products, each with many API endpoints, may need to enforce different rate limits.

You’ve been able to configure Rate Limiting rules on Cloudflare since 2017. But until today, the only way to control this was in the Cloudflare dashboard or via the Cloudflare API. It hasn’t been possible to define behavior at runtime, or write code in a Worker that interacts directly with rate limits – you could only control whether a request is rate limited or not before it hits your Worker.

Today we’re introducing a new API, in open beta, that gives you direct access to rate limits from your Worker. It’s lightning fast, backed by memcached, and dead simple to add to your Worker. For example, the following configuration defines a rate limit of 100 requests within a 60-second period:

[[unsafe.bindings]]
name = "RATE_LIMITER"
type = "ratelimit"
namespace_id = "1001" # An identifier unique to your Cloudflare account

# Limit: the number of tokens allowed within a given period, in a single Cloudflare location
# Period: the duration of the period, in seconds. Must be either 60 or 10
simple = { limit = 100, period = 60 } 

Then, in your Worker, you can call the limit method on the RATE_LIMITER binding, providing a key of your choosing. Given the configuration above, this code will return a HTTP 429 response status code once more than 100 requests to a specific path are made within a 60-second period:

export default {
  async fetch(request, env) {
    const { pathname } = new URL(request.url)

    const { success } = await env.RATE_LIMITER.limit({ key: pathname })
    if (!success) {
      return new Response(`429 Failure – rate limit exceeded for ${pathname}`, { status: 429 })
    }

    return new Response(`Success!`)
  }
}

Now that Workers can connect directly to a data store like memcached, what else could we provide? Counters? Locks? An in-memory cache? Rate limiting is the first of many primitives that we’re exploring providing in Workers that address questions we’ve gotten for years about where a temporary shared state that spans many Worker isolates should live. If you rely on putting state in the global scope of your Worker today, we’re working on better primitives that are purpose-built for specific use cases.

The Rate Limiting API in Workers is in open beta, and you can get started by reading the docs.

New auto-generated SDKs for Cloudflare’s API

Production readiness means going from making changes by clicking buttons in a dashboard to making changes programmatically, using an infrastructure-as-code approach like Terraform or Pulumi, or by making API requests directly, either on your own or via an SDK.

The Cloudflare API is massive, and constantly adding new capabilities – on average we update our API schemas between 20 and 30 times per day. But to date, our API SDKs have been built and maintained manually, so we had a burning need to automate this.

We’ve done that, and today we’re announcing new client SDKs for the Cloudflare API in three languages – Typescript, Python and Go – with more languages on the way.

Each SDK is generated automatically using Stainless API, based on the OpenAPI schemas that define the structure and capabilities of each of our API endpoints. This means that when we add any new functionality to the Cloudflare API, across any Cloudflare product, these API SDKs are automatically regenerated, and new versions are published, ensuring that they are correct and up-to-date.

You can install the SDKs by running one of the following commands:

// Typescript
npm install cloudflare

// Python
pip install --pre cloudflare

// Go
go get -u github.com/cloudflare/cloudflare-go/v2

If you use Terraform or Pulumi, under the hood, Cloudflare’s Terraform Provider currently uses the existing, non-automated Go SDK. When you run terraform apply, the Cloudflare Terraform Provider determines which API requests to make in what order, and executes these using the Go SDK.

The new, auto-generated Go SDK clears a path towards more comprehensive Terraform support for all Cloudflare products, providing a base set of tools that can be relied upon to be both correct and up-to-date with the latest API changes. We’re building towards a future where any time a product team at Cloudflare builds a new feature that is exposed via the Cloudflare API, it is automatically supported by the SDKs. Expect more updates on this throughout 2024.

Durable Object namespace analytics and WebSocket Hibernation GA

Many of our own products, including Waiting Room, R2, and Queues, as well as platforms like PartyKit, are built using Durable Objects. Deployed globally, including newly added support for Oceania, you can think of Durable Objects like singleton Workers that can provide a single point of coordination and persist state. They’re perfect for applications that need real-time user coordination, like interactive chat or collaborative editing. Take Atlassian’s word for it:

One of our new capabilities is Confluence whiteboards, which provides a freeform way to capture unstructured work like brainstorming and early planning before teams document it more formally. The team considered many options for real-time collaboration and ultimately decided to use Cloudflare’s Durable Objects. Durable Objects have proven to be a fantastic fit for this problem space, with a unique combination of functionalities that has allowed us to greatly simplify our infrastructure and easily scale to a large number of users. – Atlassian

We haven’t previously exposed associated analytical trends in the dashboard, making it hard to understand the usage patterns and error rates within a Durable Objects namespace unless you used the GraphQL Analytics API directly. The Durable Objects dashboard has now been revamped, letting you drill down into metrics, and go as deep as you need.

From day one, Durable Objects have supported WebSockets, allowing many clients to directly connect to a Durable Object to send and receive messages.

However, sometimes client applications open a WebSocket connection and then eventually stop doing…anything. Think about that tab you’ve had sitting open in your browser for the last 5 hours, but haven’t touched. If it uses WebSockets to send and receive messages, it effectively has a long-lived TCP connection that isn’t being used for anything. If this connection is to a Durable Object, the Durable Object must stay running, waiting for something to happen, consuming memory, and costing you money.

We first introduced WebSocket Hibernation to solve this problem, and today we’re announcing that this feature is out of beta and is Generally Available. With WebSocket Hibernation, you set an automatic response to be used while hibernating and serialize state such that it survives hibernation. This gives Cloudflare the inputs we need in order to maintain open WebSocket connections from clients while “hibernating” the Durable Object such that it is not actively running, and you are not billed for idle time. The result is that your state is always available in-memory when you actually need it, but isn’t unnecessarily kept around when it’s not. As long as your Durable Object is hibernating, even if there are active clients still connected over a WebSocket, you won’t be billed for duration.

In addition, we’ve heard developer feedback on the costs of incoming WebSocket messages to Durable Objects, which favor smaller, more frequent messages for real-time communication. Starting today incoming WebSocket messages will be billed at the equivalent of 1/20th of a request (as opposed to 1 message being the equivalent of 1 request as it has been up until now). Following a pricing example:

WebSocket Connection Requests Incoming WebSocket Messages Billed Requests Request Billing
Before 10K 432M 432,010,000 $64.65
After 10K 432M 21,610,000 $3.09

Production ready, without production complexity

Becoming production ready on the last generation of cloud platforms meant slowing down how fast you shipped. It meant stitching together many disconnected tools or standing up whole teams to work on internal platforms. You had to retrofit your own productivity layers onto platforms that put up roadblocks.

The Cloudflare Developer Platform is grown up and production ready, and committed to being an integrated platform where products intuitively work together and where there aren’t 10 ways to do the same thing, with no need for a compatibility matrix to help understand what works together. Each of these updates shows this in action, integrating new functionality across products and parts of Cloudflare’s platform.

To that end, we want to hear from you about not only what you want to see next, but where you think we could be even simpler, or where you think our products could work better together. Tell us where you think we could do more – the Cloudflare Developers Discord is always open.