All posts by Channy Yun

Amazon Textract Updates: Up to 32% Price Reduction in 8 AWS Regions and Up to 50% Reduction in Asynchronous Job Processing Times

Post Syndicated from Channy Yun original https://aws.amazon.com/blogs/aws/amazon-textract-updates-up-to-32-price-reduction-in-8-aws-regions-and-up-to-50-reduction-in-asynchronous-job-processing-times/

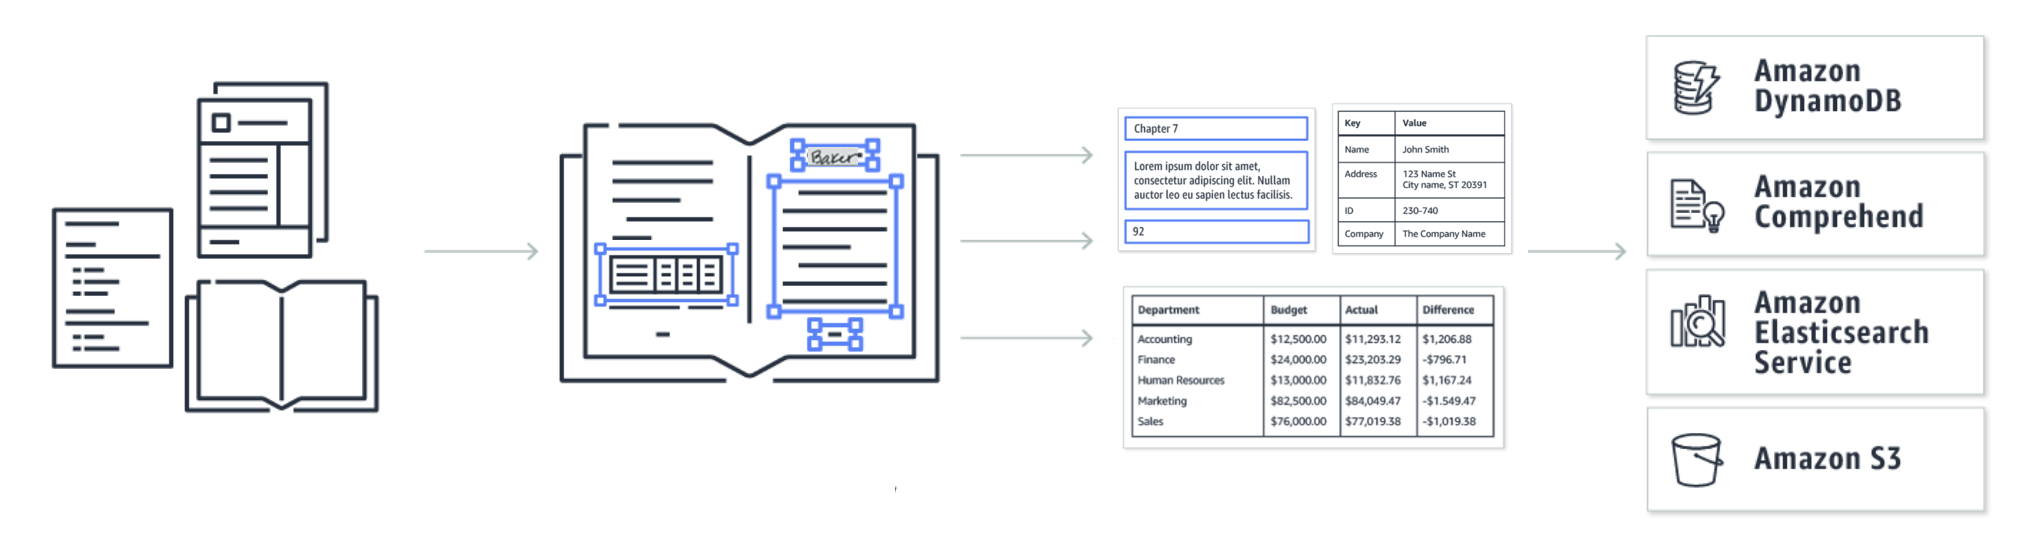
Introduced at AWS re:Invent 2018, Amazon Textract is a machine learning service that automatically extracts text, handwriting and data from scanned documents that goes beyond simple optical character recognition (OCR) to identify, understand, and extract data from forms and tables.

In the past few months, we introduced specialized support for processing invoices and receipts and enhanced the quality of the underlying computer vision models that power extraction of handwritten text, forms, and tables with printed text support for English, Spanish, German, Italian, Portuguese, and French.

Third-party auditors assess the security and compliance of Amazon Textract as part of multiple AWS compliance programs. We also added IRAP compliance support and achieved US FedRAMP authorization to add to the existing list such as HIPAA, PCI DSS, ISO SCO, and MTCS.

Customers use Amazon Textract to automate critical business process workflows (for example, in claims and tax form processing, loan applications, and accounts payable). It can reduce human review time, improve accuracy, lower costs, and accelerate the pace of innovation on a global scale. At the same time, Textract customers told us that we could be doing even more to reduce costs and improve latency.

Today we are excited to announce two major updates to Amazon Textract:

  • Up to 32 percent price reduction in 8 AWS Regions to help global customers save even more with Textract.
  • Up to 50 percent reduction in end-to-end job processing times for Textract’s asynchronous operations worldwide.

Up to 32% price reduction in 8 AWS Regions
We are pleased to announce an up to 32 percent price reduction in eight AWS Regions: Asia Pacific (Mumbai), Asia Pacific (Seoul), Asia Pacific (Singapore), Asia Pacific (Sydney), Canada (Central), Europe (Frankfurt), Europe (London), and Europe (Paris).

The API pricing for DetectDocumentText (OCR) and AnalyzeDocument (both forms and tables) in these AWS Regions is now the same as the US East (N. Virginia) Region pricing. Customers in those identified Regions will see a 9-32 percent reduction in API pricing.

Before the price reduction, a customer’s usage of the DetectDocumentText and AnalyzeDocument APIs would have been billed at different rates, by Region, for their usage tier. That customer will now be billed at the same rate, no matter from which AWS commercial Region Textract is being called.

AWS Regions DetectDocumentText API AnalyzeDocument API (forms + tables)
Old New Reduction Old New Reduction
Asia Pacific (Mumbai) $1.830 $1.50 18% $79.30 $65.0 18%
Asia Pacific (Seoul) $1.845 19% $79.95 19%
Asia Pacific (Singapore) $2.200 32% $95.00 32%
Asia Pacific (Sydney) $1.950 23% $84.50 23%
Canada (Central) $1.655 9% $72.15 10%
Europe (Frankfurt) $1.875 20% $81.25 20%
Europe (London) $1.750 14% $75.00 13%
Europe (Paris) $1.755 15% $76.05 15%

This table shows two examples of effective price per 1,000 pages for processing the first 1 million monthly pages before and after this price reduction. Customers with usage above the 1 million monthly pages tier will also see a similar reduction in prices, the details of which can be found on the Amazon Textract pricing page.

The new pricing goes into effect on September 1, 2021. It will be applied to your bill automatically. This pricing change does not apply to the Europe (Ireland), US-based commercial Regions, and US GovCloud Regions. There is no change to the pricing for the recently launched AnalyzeExpense API for invoices and receipts.

As part of the AWS Free Tier, you can get started with Amazon Textract for free. The Free Tier lasts 3 months and new AWS customers can analyze up to 1,000 pages per month using the Detect Document Text API and up to 100 pages per month using the Analyze Document API or Analyze Expense API.

Up to 50% reduction in end-to-end job processing times
Customers can invoke Textract synchronously (on single-page documents) and asynchronously (on multi-page documents) for detecting printed and handwritten lines and words (via the DetectDocumentText API) as well as for forms and tables extraction (via the AnalyzeDocument API). We see that the vast majority of customers invoke Textract asynchronously today for at-scale processing of their document pipeline.

Based on customer feedback, we have made a number of enhancements to Textract’s asynchronous API operations that reduce the end-to-end latency by as much as 50 percent. Specifically, these updates reduce the end-to-end job processing times experienced by Textract customers on worldwide asynchronous operations by as much as 50 percent. The lower the processing time, the faster customers are able to process their documents, achieve scale and improve their overall productivity.

To learn more about Amazon Textract, see this tutorial for extracting text and structured data from a document, this code sample on GitHub, Amazon Textract documentation, and blog posts about Amazon Textract on the AWS Machine Learning Blog.

Channy

AWS IoT SiteWise Edge Is Now Generally Available for Processing Industrial Equipment Data on Premises

Post Syndicated from Channy Yun original https://aws.amazon.com/blogs/aws/aws-iot-sitewise-edge-is-now-generally-available-for-processing-industrial-equipment-data-on-premises/

At AWS re:Invent 2020, we announced the preview of AWS IoT SiteWise Edge, a new feature of AWS IoT SiteWise that provides software that runs on premises at industrial sites and makes it easy to collect, process, and monitor equipment data locally before sending the data to AWS Cloud destinations. AWS IoT SiteWise Edge software can be installed on local hardware such as third-party industrial gateways and computers, or on AWS Outposts and AWS Snow Family compute devices. It uses AWS IoT Greengrass, an edge runtime that helps build, deploy, and manage applications.

With AWS IoT SiteWise Edge, you can organize and process your equipment data in the on-premises SiteWise gateway using AWS IoT SiteWise asset models. You can then read the equipment data locally from the gateway using the same application programming interfaces (APIs) that you use with AWS IoT SiteWise in the cloud. For example, you can compute metrics such as Overall Equipment Effectiveness (OEE) locally for use in a production-line monitoring dashboard on the factory floor.

You can use AWS IoT SiteWise Edge for these use cases to quickly assess and demonstrate the value of industrial IoT to your organization:

  • Localized testing of products: The testing of automotive, electronics, or aerospace products might generate thousands of data points per second from multiple sensors embedded in the product and the testing equipment. You can process data locally in the gateway for near-real-time dashboards and store just the results in the cloud to optimize your bandwidth and storage costs.
  • Lean manufacturing in the smart factory: You can compute key performance metrics such as OEE, Mean Time Between Failures (MTBF), and Mean Time to Resolution (MTTR) in the gateway and monitor local dashboards that must continue to work even if the connection of the factory to the cloud is temporarily interrupted. This ensures that factory staff can identify and identify the root cause of every bottleneck as soon as it arises.
  • Improving product quality: Your local applications can read equipment and sensor data from AWS IoT SiteWise Edge on the gateway as it is collected, and combine it with data from other sources like enterprise resource planning (ERP) systems and manufacturing execution systems to help catch defect-causing conditions. The data can be further processed through machine learning models to identify anomalies that are used to trigger alerts for staff on the factory floor.

To securely connect and read sensor data from historian databases or directly from equipment, AWS IoT SiteWise Edge supports three common industrial protocols: OPC-UA (Open Platform Communications Unified Architecture), Modbus TCP, and EtherNet/IP.

After data is collected by the gateway, you can filter, transform, and aggregate the data locally using asset models defined in the cloud. You can also run AWS Lambda functions locally on the gateway to customize how the data is processed. You can keep sensitive data on premises to help comply with data residency requirements, and you can send data to AWS IoT SiteWise or other AWS services in the cloud, such as Amazon S3 and Amazon Timestream, for long term storage and further analysis.

At GA, we added new features and made improvements based on customer feedback during the preview:

  • Easy setup with Edge Gateway Installer: You can obtain an edge device installer from the AWS IoT SiteWise console and run it on your industrial gateway to install AWS IoT SiteWise Edge software and all prerequisites, including the AWS IoT Greengrass v2 runtime, Docker, Python, and Java.
  • Support for AWS IoT Greengrass v2: The OPC-UA data collection and data processing pack will be supported on AWS IoT Greengrass version 2.
  • Integration with LDAP/Active Directory: Edge gateway now integrates with LDAP servers or a local user pool to authenticate users at the edge. These users will use their corporate or Linux credentials to authenticate themselves on OpsHub or monitor portals at the edge.

AWS IoT SiteWise Edge – Getting Started
To get started with AWS IoT SiteWise Edge, complete the following steps to create a gateway that connects to data servers to deliver your industrial data streams to the AWS Cloud:

  1. Create a gateway and an get edge installer.
  2. Install edge software onto your industrial gateway.
  3. Configure your edge gateway from the cloud.
  4. Configure your monitoring applications at the edge and in the cloud.

To create your gateway, from the left navigation pane of the AWS IoT SiteWise console, expand Edge, and choose Gateways. On the Gateways page, choose Create gateway. You can select Greengrass v2 to configure your gateway. If you are existing customer, you can select to make a gateway for Greengrass v1.

To configure your first gateway, enter your gateway name and core device name, and then choose Default setup to create a Greengrass core device for this gateway with default settings. Choose Next.

By default, AWS IoT SiteWise enables the data collection pack to collect and send your equipment data to the AWS Cloud. To compute metrics and transforms using asset models at the edge, choose Data processing pack. You can also give users access to manage this gateway through the command line or the local monitor dashboards of an OpsHub application from the LDAP/Active Directory in your organization. Choose Next.

Optionally, you can add existing OPC-UA data servers to ingest data to the gateway. You can add data sources later. For more information, see Configuring data sources in the AWS IoT SiteWise User Guide. Choose Next.

Review your gateway configuration and choose the operating system of your edge gateway. We currently support the Linux OS distributions of Amazon Linux, Red Hat, or Ubuntu. Choose Generate.

AWS IoT SiteWise will generate an installer with these configuration values for your gateway. We provide an install script that you can download, <Gateway-name>.deploy.sh, where <Gateway-name> is the name of the gateway you just created.

To set up AWS IoT SiteWise Edge on your device, run the install script and verify the AWS IoT Greengrass runtime for your gateway.

Once the gateway is created, you configure its data sources from the gateway detail page. You can configure OPC-UA, Modbus, and EtherNet/IP data sources. To learn more, please see Configuring data sources in AWS IoT SiteWise User Guide.

Now you can see the created gateway, its configuration, edge capabilities, and data sources. Once you have configured your data sources, deploy the AWS IoT Greengrass connectors with “SiteWise” in the title to your device. To learn more, see Configuring a gateway in AWS IoT SiteWise User Guide.

Processing Model Data and Monitoring the Gateway
You can use asset models defined in AWS IoT SiteWise to specify which data, transforms, and metrics to process in the gateway locally, and visualize equipment data using local AWS IoT SiteWise Monitor dashboards served from the gateway.

To add your models to the gateway, in the left navigation pane of the AWS IoT SiteWise console, expand Build, and then choose Models. On the Models page, choose Configure for edge.

There are three options for an edge configuration for an asset model: no edge configuration (that is, all properties are computed in the cloud), compute all properties at the edge, and custom edge configuration.

AWS IoT SiteWise gateway fetches all instances of the asset model from the service and processes all data it is able to collect for measurement. All you need to do is configure the asset models themselves and keep the load guidance in mind.

With AWS IoT SiteWise Edge, you can also deploy AWS IoT SiteWise Monitor web applications locally so users like process engineers can visualize equipment data in near-real time on the factory floor and use this information to improve the uptime of equipment, reduce waste, and increase production output.

At the GA release of AWS IoT SiteWise Edge, we improved the SiteWise Monitor configuration by allowing users to configure which dashboards they want to run at the edge, and to reduce clutter and bandwidth requirements, to make only those dashboards available locally. To learn more, see Getting started with AWS IoT SiteWise Monitor in the AWS IoT SiteWise Monitor Application Guide.

The OpsHub for AWS IoT SiteWise application can be installed on any Windows PC for monitoring and troubleshooting gateways entirely locally. The application connects directly to your gateway over the local network to monitor health metrics (for example, memory, CPU, cloud connectivity), status of edge software (for example, uptime of dashboard applications), and recent data collected from equipment.

We also improved the visualization of gateway health metrics and the ability to download gateway activity logs. To learn more, see Monitor data at the edge in the AWS IoT SiteWise User Guide.

Available Now
AWS IoT SiteWise Edge is available in all AWS Regions where AWS IoT SiteWise is available. AWS IoT SiteWise Edge provides the data collection and processing pack in the gateway for local applications. The data collection pack is free. The data processing pack is charged at $200 per active gateway, per month. See the AWS IoT SiteWise pricing page for details.

To learn more, visit the AWS IoT SiteWise Edge page or see Ingesting data using a gateway in the AWS IoT SiteWise User Guide.

You can send feedback through the AWS IoT SiteWise forum or through your usual AWS Support contacts.

Channy

Amazon EBS io2 Block Express Volumes with Amazon EC2 R5b Instances Are Now Generally Available

Post Syndicated from Channy Yun original https://aws.amazon.com/blogs/aws/amazon-ebs-io2-block-express-volumes-with-amazon-ec2-r5b-instances-are-now-generally-available/

At AWS re:Invent 2020, we previewed Amazon EBS io2 Block Express volumes, the next-generation server storage architecture that delivers the first SAN built for the cloud. Block Express is designed to meet the requirements of the largest, most I/O-intensive, mission-critical deployments of Microsoft SQL Server, Oracle, SAP HANA, and SAS Analytics on AWS.

Today, I am happy to announce the general availability of Amazon EBS io2 Block Express volumes, with Amazon EC2 R5b instances powered by the AWS Nitro System to provide the best network-attached storage performance available on EC2. The io2 Block Express volumes now also support io2 features such as Multi-Attach and Elastic Volumes.

In the past, customers had to stripe multiple volumes together in order go beyond single-volume performance. Today, io2 volumes can meet the needs of mission-critical performance-intensive applications without striping and the management overhead that comes along with it. With io2 Block Express, customers can get the highest performance block storage in the cloud with four times higher throughput, IOPS, and capacity than io2 volumes with sub-millisecond latency, at no additional cost.

Here is a summary of the use cases and characteristics of the key Solid State Drive (SSD)-backed EBS volumes:

General Purpose SSD Provisioned IOPS SSD
Volume type gp2 gp3 io2 io2 Block Express
Durability 99.8%-99.9% durability 99.999% durability
Use cases General applications, good to start with when you do not fully understand the performance profile yet I/O-intensive applications and databases Business-critical applications and databases that demand highest performance
Volume size 1 GiB – 16 TiB 4 GiB – 16 TiB 4 GiB – 64 TiB
Max IOPS 16,000 64,000 ** 256,000
Max throughput 250 MiB/s * 1,000 MiB/s 1,000 MiB/s ** 4,000 MiB/s

* The throughput limit is between 128 MiB/s and 250 MiB/s, depending on the volume size.
** Maximum IOPS and throughput are guaranteed only on instances built on the Nitro System provisioned with more than 32,000 IOPS.

The new Block Express architecture delivers the highest levels of performance with sub-millisecond latency by communicating with an AWS Nitro System-based instance using the Scalable Reliable Datagrams (SRD) protocol, which is implemented in the Nitro Card dedicated for EBS I/O function on the host hardware of the instance. Block Express also offers modular software and hardware building blocks that can be assembled in many ways, giving you the flexibility to design and deliver improved performance and new features at a faster rate.

Getting Started with io2 Block Express Volumes
You can now create io2 Block Express volumes in the Amazon EC2 console, AWS Command Line Interface (AWS CLI), or using an SDK with the Amazon EC2 API when you create R5b instances.

After you choose the EC2 R5b instance type, on the Add Storage page, under Volume Type, choose Provisioned IOPS SSD (io2). Your new volumes will be created in the Block Express format.

Things to Know
Here are a couple of things to keep in mind:

  • You can’t modify the size or provisioned IOPS of an io2 Block Express volume.
  • You can’t launch an R5b instance with an encrypted io2 Block Express volume that has a size greater than 16 TiB or IOPS greater than 64,000 from an unencrypted AMI or a shared encrypted AMI. In this case, you must first create an encrypted AMI in your account and then use that AMI to launch the instance.
  • io2 Block Express volumes do not currently support fast snapshot restore. We recommend that you initialize these volumes to ensure that they deliver full performance. For more information, see Initialize Amazon EBS volumes in Amazon EC2 User Guide.

Available Now
The io2 Block Express volumes are available in all AWS Regions where R5b instances are available: US East (Ohio), US East (N. Virginia), US West (Oregon), Asia Pacific (Singapore), Asia Pacific (Tokyo), Europe (Frankfurt), with support for more AWS Regions coming soon. We plan to allow EC2 instances of all types to connect to io2 Block Volumes, and will have updates on this later in the year.

In terms of pricing and billing, io2 volumes and io2 Block Express volumes are billed at the same rate. Usage reports do not distinguish between io2 Block Express volumes and io2 volumes. We recommend that you use tags to help you identify costs associated with io2 Block Express volumes. For more information, see the Amazon EBS pricing page.

To learn more, visit the EBS Provisioned IOPS Volume page and io2 Block Express Volumes in the Amazon EC2 User Guide.

Channy

Customize and Package Dependencies With Your Apache Spark Applications on Amazon EMR on Amazon EKS

Post Syndicated from Channy Yun original https://aws.amazon.com/blogs/aws/customize-and-package-dependencies-with-your-apache-spark-applications-on-amazon-emr-on-amazon-eks/

Last AWS re:Invent, we announced the general availability of Amazon EMR on Amazon Elastic Kubernetes Service (Amazon EKS), a new deployment option for Amazon EMR that allows customers to automate the provisioning and management of Apache Spark on Amazon EKS.

With Amazon EMR on EKS, customers can deploy EMR applications on the same Amazon EKS cluster as other types of applications, which allows them to share resources and standardize on a single solution for operating and managing all their applications. Customers running Apache Spark on Kubernetes can migrate to EMR on EKS and take advantage of the performance-optimized runtime, integration with Amazon EMR Studio for interactive jobs, integration with Apache Airflow and AWS Step Functions for running pipelines, and Spark UI for debugging.

When customers submit jobs, EMR automatically packages the application into a container with the big data framework and provides prebuilt connectors for integrating with other AWS services. EMR then deploys the application on the EKS cluster and manages running the jobs, logging, and monitoring. If you currently run Apache Spark workloads and use Amazon EKS for other Kubernetes-based applications, you can use EMR on EKS to consolidate these on the same Amazon EKS cluster to improve resource utilization and simplify infrastructure management.

Developers who run containerized, big data analytical workloads told us they just want to point to an image and run it. Currently, EMR on EKS dynamically adds externally stored application dependencies during job submission.

Today, I am happy to announce customizable image support for Amazon EMR on EKS that allows customers to modify the Docker runtime image that runs their analytics application using Apache Spark on your EKS cluster.

With customizable images, you can create a container that contains both your application and its dependencies, based on the performance-optimized EMR Spark runtime, using your own continuous integration (CI) pipeline. This reduces the time to build the image and helps predicting container launches for a local development or test.

Now, data engineers and platform teams can create a base image, add their corporate standard libraries, and then store it in Amazon Elastic Container Registry (Amazon ECR). Data scientists can customize the image to include their application specific dependencies. The resulting immutable image can be vulnerability scanned, deployed to test and production environments. Developers can now simply point to the customized image and run it on EMR on EKS.

Customizable Runtime Images – Getting Started
To get started with customizable images, use the AWS Command Line Interface (AWS CLI) to perform these steps:

  1. Register your EKS cluster with Amazon EMR.
  2. Download the EMR-provided base images from Amazon ECR and modify the image with your application and libraries.
  3. Publish your customized image to a Docker registry such as Amazon ECR and then submit your job while referencing your image.

You can download one of the following base images. These images contain the Spark runtime that can be used to run batch workloads using the EMR Jobs API. Here is the latest full image list available.

Release Label Spark Hadoop Versions Base Image Tag
emr-5.32.0-latest Spark 2.4.7 + Hadoop 2.10.1 emr-5.32.0-20210129
emr-5.33-latest Spark 2.4.7-amzn-1 + Hadoop 2.10.1-amzn-1 emr-5.33.0-20210323
emr-6.2.0-latest Spark 3.0.1 + Hadoop 3.2.1 emr-6.2.0-20210129
emr-6.3-latest Spark 3.1.1-amzn-0 + Hadoop 3.2.1-amzn-3 emr-6.3.0:latest

These base images are located in an Amazon ECR repository in each AWS Region with an image URI that combines the ECR registry account, AWS Region code, and base image tag in the case of US East (N. Virginia) Region.

755674844232.dkr.ecr.us-east-1.amazonaws.com/spark/emr-5.32.0-20210129

Now, sign in to the Amazon ECR repository and pull the image into your local workspace. If you want to pull an image from a different AWS Region to reduce network latency, choose the different ECR repository that corresponds most closely to where you are pulling the image from US West (Oregon) Region.

$ aws ecr get-login-password --region us-west-2 | docker login --username AWS --password-stdin 895885662937.dkr.ecr.us-west-2.amazonaws.com
$ docker pull 895885662937.dkr.ecr.us-west-2.amazonaws.com/spark/emr-5.32.0-20210129

Create a Dockerfile on your local workspace with the EMR-provided base image and add commands to customize the image. If the application requires custom Java SDK, Python, or R libraries, you can add them to the image directly, just as with other containerized applications.

The following example Docker commands are for a use case in which you want to install useful Python libraries such as Natural Language Processing (NLP) using Spark and Pandas.

FROM 895885662937.dkr.ecr.us-west-2.amazonaws.com/spark/emr-5.32.0-20210129
USER root
### Add customizations here ####
RUN pip3 install pyspark pandas spark-nlp // Install Python NLP Libraries
USER hadoop:hadoop

In another use case, as I mentioned, you can install a different version of Java (for example, Java 11):

FROM 895885662937.dkr.ecr.us-west-2.amazonaws.com/spark/emr-5.32.0-20210129
USER root
### Add customizations here ####
RUN yum install -y java-11-amazon-corretto // Install Java 11 and set home
ENV JAVA_HOME /usr/lib/jvm/java-11-amazon-corretto.x86_64
USER hadoop:hadoop

If you’re changing Java version to 11, then you also need to change Java Virtual Machine (JVM) options for Spark. Provide the following options in applicationConfiguration when you submit jobs. You need these options because Java 11 does not support some Java 8 JVM parameters.

"applicationConfiguration": [ 
  {
    "classification": "spark-defaults",
    "properties": {
        "spark.driver.defaultJavaOptions" : "
		    -XX:OnOutOfMemoryError='kill -9 %p' -XX:MaxHeapFreeRatio=70",
        "spark.executor.defaultJavaOptions" : "
		    -verbose:gc -Xlog:gc*::time -XX:+PrintGCDetails -XX:+PrintGCDateStamps 
			-XX:OnOutOfMemoryError='kill -9 %p' -XX:MaxHeapFreeRatio=70 
			-XX:+IgnoreUnrecognizedVMOptions"
    }
  }
]

To use custom images with EMR on EKS, publish your customized image and submit a Spark workload in Amazon EMR on EKS using the available Spark parameters.

You can submit batch workloads using your customized Spark image. To submit batch workloads using the StartJobRun API or CLI, use the spark.kubernetes.container.image parameter.

$ aws emr-containers start-job-run \
    --virtual-cluster-id <enter-virtual-cluster-id> \
    --name sample-job-name \
    --execution-role-arn <enter-execution-role-arn> \
    --release-label <base-release-label> \ # Base EMR Release Label for the custom image
    --job-driver '{
        "sparkSubmitJobDriver": {
        "entryPoint": "local:///usr/lib/spark/examples/jars/spark-examples.jar",
        "entryPointArguments": ["1000"],
        "sparkSubmitParameters": [ "--class org.apache.spark.examples.SparkPi --conf spark.kubernetes.container.image=123456789012.dkr.ecr.us-west-2.amazonaws.com/emr5.32_custom"
		  ]
      }
  }'

Use the kubectl command to confirm the job is running your custom image.

$ kubectl get pod -n <namespace> | grep "driver" | awk '{print $1}'
Example output: k8dfb78cb-a2cc-4101-8837-f28befbadc92-1618856977200-driver

Get the image for the main container in the Driver pod (Uses jq).

$ kubectl get pod/<driver-pod-name> -n <namespace> -o json | jq '.spec.containers
| .[] | select(.name=="spark-kubernetes-driver") | .image '
Example output: 123456789012.dkr.ecr.us-west-2.amazonaws.com/emr5.32_custom

To view jobs in the Amazon EMR console, under EMR on EKS, choose Virtual clusters. From the list of virtual clusters, select the virtual cluster for which you want to view logs. On the Job runs table, select View logs to view the details of a job run.

Automating Your CI Process and Workflows
You can now customize an EMR-provided base image to include an application to simplify application development and management. With custom images, you can add the dependencies using your existing CI process, which allows you to create a single immutable image that contains the Spark application and all of its dependencies.

You can apply your existing development processes, such as vulnerability scans against your Amazon EMR image. You can also validate for correct file structure and runtime versions using the EMR validation tool, which can be run locally or integrated into your CI workflow.

The APIs for Amazon EMR on EKS are integrated with orchestration services like AWS Step Functions and AWS Managed Workflows for Apache Airflow (MWAA), allowing you to include EMR custom images in your automated workflows.

Now Available
You can now set up customizable images in all AWS Regions where Amazon EMR on EKS is available. There is no additional charge for custom images. To learn more, see the Amazon EMR on EKS Development Guide and a demo video how to build your own images for running Spark jobs on Amazon EMR on EKS.

You can send feedback to the AWS forum for Amazon EMR or through your usual AWS support contacts.

Channy

Getting Started with Amazon ECS Anywhere – Now Generally Available

Post Syndicated from Channy Yun original https://aws.amazon.com/blogs/aws/getting-started-with-amazon-ecs-anywhere-now-generally-available/

Since Amazon Elastic Container Service (Amazon ECS) was launched in 2014, AWS has released other options for running Amazon ECS tasks outside of an AWS Region such as AWS Wavelength, an offering for mobile edge devices or AWS Outposts, a service that extends to customers’ environments using hardware owned and fully managed by AWS.

But some customers have applications that need to run on premises due to regulatory, latency, and data residency requirements or the desire to leverage existing infrastructure investments. In these cases, customers have to install, operate, and manage separate container orchestration software and need to use disparate tooling across their AWS and on-premises environments. Customers asked us for a way to manage their on-premises containers without this added complexity and cost.

Following Jeff’s preannouncement last year, I am happy to announce the general availability of Amazon ECS Anywhere, a new capability in Amazon ECS that enables customers to easily run and manage container-based applications on premises, including virtual machines (VMs), bare metal servers, and other customer-managed infrastructure.

With ECS Anywhere, you can run and manage containers on any customer-managed infrastructure using the same cloud-based, fully managed, and highly scalable container orchestration service you use in AWS today. You no longer need to prepare, run, update, or maintain your own container orchestrators on premises, making it easier to manage your hybrid environment and leverage the cloud for your infrastructure by installing simple agents.

ECS Anywhere provides consistent tooling and APIs for all container-based applications and the same Amazon ECS experience for cluster management, workload scheduling, and monitoring both in the cloud and on customer-managed infrastructure. You can now enjoy the benefits of reduced cost and complexity by running container workloads such as data processing at edge locations on your own hardware maintaining reduced latency, and in the cloud using a single, consistent container orchestrator.

Amazon ECS Anywhere – Getting Started
To get started with ECS Anywhere, register your on-premises servers or VMs (also referred to as External instances) in the ECS cluster. The AWS Systems Manager Agent, Amazon ECS container agent, and Docker must be installed on these external instances. Your external instances require an IAM role that permits them to communicate with AWS APIs. For more information, see Required IAM permissions in the ECS Developer Guide.

To create a cluster for ECS Anywhere, on the Create Cluster page in the ECS console, choose the Networking Only template. This option is for use with either AWS Fargate or external instance capacity. We recommend that you use the AWS Region that is geographically closest to the on-premises servers you want to register.

This creates an empty cluster to register external instances. On the ECS Instances tab, choose Register External Instances to get activation codes and an installation script.

On the Step 1: External instances activation details page, in Activation key duration (in days), enter the number of days the activation key should remain active. The activation key can be used for up to 1,000 activations. In Number of instances, enter the number of external instances you want to register to your cluster. In Instance role, enter the IAM role to associate with your external instances.

Choose Next step to get a registration command.

On the Step 2: Register external instances page, copy the registration command. Run this command on the external instances you want to register to your cluster.

Paste the registration command in your on-premise servers or VMs. Each external instance is then registered as an AWS Systems Manager managed instance, which is then registered to your Amazon ECS clusters.

Both x86_64 and ARM64 CPU architectures are supported. The following is a list of supported operating systems:

  • CentOS 7, CentOS 8
  • RHEL 7
  • Fedora 32, Fedora 33
  • openSUSE Tumbleweed
  • Ubuntu 18, Ubuntu 20
  • Debian 9, Debian 10
  • SUSE Enterprise Server 15

When the ECS agent has started and completed the registration, your external instance will appear on the ECS Instances tab.

You can also add your external instances to the existing cluster. In this case, you can see both Amazon EC2 instances and external instances are prefixed with mi-* together.

Now that the external instances are registered to your cluster, you are ready to create a task definition. Amazon ECS provides the requiresCompatibilities parameter to validate that the task definition is compatible with the the EXTERNAL launch type when creating your service or running your standalone task. The following is an example task definition:

{
	"requiresCompatibilities": [
		"EXTERNAL"
	],
	"containerDefinitions": [{
		"name": "nginx",
		"image": "public.ecr.aws/nginx/nginx:latest",
		"memory": 256,
		"cpu": 256,
		"essential": true,
		"portMappings": [{
			"containerPort": 80,
			"hostPort": 8080,
			"protocol": "tcp"
		}]
	}],
	"networkMode": "bridge",
	"family": "nginx"
}

You can create a task definition in the ECS console. In Task Definition, choose Create new task definition. For Launch type, choose EXTERNAL and then configure the task and container definitions to use external instances.

On the Tasks tab, choose Run new task. On the Run Task page, for Cluster, choose the cluster to run your task definition on. In Number of tasks, enter the number of copies of that task to run with the EXTERNAL launch type.

Or, on the Services tab, choose Create. Configure service lets you specify copies of your task definition to run and maintain in a cluster. To run your task in the registered external instance, for Launch type, choose EXTERNAL. When you choose this launch type, load balancers, tag propagation, and service discovery integration are not supported.

The tasks you run on your external instances must use the bridge, host, or none network modes. The awsvpc network mode isn’t supported. For more information about each network mode, see Choosing a network mode in the Amazon ECS Best Practices Guide.

Now you can run your tasks and associate a mix of EXTERNAL, FARGATE, and EC2 capacity provider types with the same ECS service and specify how you would like your tasks to be split across them.

Things to Know
Here are a couple of things to keep in mind:

Connectivity: In the event of loss of network connectivity between the ECS agent running on the on-premises servers and the ECS control plane in the AWS Region, existing ECS tasks will continue to run as usual. If tasks still have connectivity with other AWS services, they will continue to communicate with them for as long as the task role credentials are active. If a task launched as part of a service crashes or exits on its own, ECS will be unable to replace it until connectivity is restored.

Monitoring: With ECS Anywhere, you can get Amazon CloudWatch metrics for your clusters and services, use the CloudWatch Logs driver (awslogs) to get your containers’ logs, and access the ECS CloudWatch event stream to monitor your clusters’ events.

Networking: ECS external instances are optimized for running applications that generate outbound traffic or process data. If your application requires inbound traffic, such as a web service, you will need to employ a workaround to place these workloads behind a load balancer until the feature is supported natively. For more information, see Networking with ECS Anywhere.

Data Security: To help customers maintain data security, ECS Anywhere only sends back to the AWS Region metadata related to the state of the tasks or the state of the containers (whether they are running or not running, performance counters, and so on). This communication is authenticated and encrypted in transit through Transport Layer Security (TLS).

ECS Anywhere Partners
ECS Anywhere integrates with a variety of ECS Anywhere partners to help customers take advantage of ECS Anywhere and provide additional functionality for the feature. Here are some of the blog posts that our partners wrote to share their experiences and offerings. (I am updating this article with links as they are published.)

Now Available
Amazon ECS Anywhere is now available in all commercial regions except AWS China Regions where ECS is supported. With ECS Anywhere, there are no minimum fees or upfront commitments. You pay per instance hour for each managed ECS Anywhere task. ECS Anywhere free tier includes 2200 instance hours per month for six months per account for all regions. For more information, see the pricing page.

To learn more, see ECS Anywhere in the Amazon ECS Developer Guide. Please send feedback to the AWS forum for Amazon ECS or through your usual AWS Support contacts.

Get started with the Amazon ECS Anywhere today.

Channy

Update. Watch a cool demo of ECS Anywhere to operate a Raspberry Pi cluster at home office and read its deep-dive blog post.

AWS Lambda Extensions Are Now Generally Available – Get Started with Your Favorite Operations Tools Today

Post Syndicated from Channy Yun original https://aws.amazon.com/blogs/aws/getting-started-with-using-your-favorite-operational-tools-on-aws-lambda-extensions-are-now-generally-available/

In October 2020, we announced the preview of AWS Lambda extensions, which you can use to easily integrate Lambda functions with your favorite tools for monitoring, observability, security, and governance.

Today, I’m happy to announce the general availability of AWS Lambda Extensions which comes with new performance improvements and an expanded set of partners. As part of the GA release, we have enabled functions to send responses as soon as the function code is complete without waiting for the included extensions to finish. This enables extensions to perform activities like sending telemetry to a preferred destination after the function’s response has been returned. We also welcome extensions from new partners: Imperva, Instana, Sentry, Site24x7, and the AWS Distro for OpenTelemetry.

You can use Lambda extensions for use cases such as capturing diagnostic information before, during, and after function invocation; automatically instrumenting your code without needing code changes; fetching configuration settings or secrets before the function invocation; detecting and alerting on function activity through security agents; and sending telemetry to custom destinations such as Amazon Simple Storage Service (Amazon S3), Amazon Kinesis, Amazon Elasticsearch Service directly and asynchronously from your Lambda functions.

Customers are drawn to the vision of Serverless. The reduced operational responsibility frees them up to focus on their business problems. To help customers monitor, observe, secure, and govern their functions, AWS Lambda provides native integrations for logs and metrics through Amazon CloudWatch, tracing through AWS X-Ray, tracking configuration changes through AWS Config, and recording API calls through AWS CloudTrail In addition, AWS Lambda partners provide tools for application management, API integration, deployment, monitoring, and security.

AWS Lambda extensions provide a simple way to extend the Lambda execution environment, which is where your function code is executed. AWS customers, partners, and the open source community can use the new Lambda Extensions API to build their own extensions, which are companion processes that augment the capabilities of Lambda functions. To learn how to build your own extensions, see the Building Extensions for AWS Lambda – In preview blog post. The post also includes information about changes to the Lambda lifecycle.

How AWS Lambda Extensions Works
AWS Lambda extensions are designed to be the easiest way to plug in the tools you use today without complex installation or configuration management. You can add tools to your functions using Lambda layers or include them in the image for functions deployed as container images.

Lambda extensions use the Extensions API to register for function and execution environment lifecycle events. In response to these events, extensions can start new processes or run logic. Lambda extensions can also use the Runtime Logs API to subscribe to a stream of the same logs that the Lambda service sends to Amazon CloudWatch directly from the Lambda execution environment. Lambda streams the logs to the extension, and the extension can then process, filter, and send the logs to any preferred destination.

Most customers will use Lambda extensions without needing to know about the capabilities of the Extensions API. You can just consume capabilities of an extension by configuring the options in your Lambda functions.

How to Use Lambda Extensions
You can install and manage extensions using the Lambda console, the AWS Command Line Interface (CLI), or infrastructure as code (IaC) services and tools such as AWS CloudFormation, AWS Serverless Application Model (AWS SAM), and Terraform.

To use Lambda extensions to integrate existing tools with your Lambda functions, choose your a Lambda function and on the Configuration tab, choose Monitoring and Operations tools.

On the Extensions page, you can find available extensions from AWS Lambda partners. Choose an extension to view its installation instructions.

AWS Lambda Extensions Partners
At this launch, Lambda extensions integrate with these AWS Lambda partners who have provided the following information to introduce their extensions. (I am updating this article with links as they are published.)

  • AppDynamics provides end-to-end transaction tracing for AWS Lambda. With the AppDynamics extension, it is no longer mandatory for developers to include the AppDynamics tracer as a dependency in their function code, making tracing transactions across hybrid architectures even simpler.
  • Coralogix is a log analytics and cloud security platform that empowers thousands of companies to improve security and accelerate software delivery, allowing you to get deep insights without paying for the noise. Coralogix can now read Lambda function logs and metrics directly, without using CloudWatch or Amazon S3, reducing the latency, and cost of observability.
  • The Datadog extension brings comprehensive, real-time visibility to your serverless applications. Combined with Datadog’s integration with AWS, you get metrics, traces, and logs to help you monitor, detect, and resolve issues at any scale. The Datadog extension makes it easier than ever to get telemetry from your serverless workloads.
  • The Dynatrace extension makes it even easier to bring AWS Lambda metrics and traces into the Dynatrace platform for intelligent observability and automatic root cause detection. Get comprehensive, end-to-end observability with the flip of a switch and no code changes.
  • Epsagon helps you monitor, troubleshoot, and lower the cost of your Lambda functions. Epsagon’s extension reduces the overhead of sending traces to the Epsagon service, with minimal performance impact to your function.
  • HashiCorp Vault allows you to secure, store, and tightly control access to your application’s secrets and sensitive data. With the Vault extension, you can now authenticate and securely retrieve dynamic secrets before your Lambda function is invoked.
  • Honeycomb is a powerful observability tool that helps you debug your entire production app stack. Honeycomb’s extension decreases the overhead, latency, and cost of sending events to the Honeycomb service, while increasing reliability.
  • Instana Enterprise Observability Platform ingests performance metrics, traces requests, and profiles processes to make observability work for the enterprise. The Instana Lambda extension offers modification-free, low latency tracing of Lambda functions backed by their real-time Enterprise Observability Platform.
  • Imperva Serverless Protection protects organizations from vulnerabilities created by misconfigured apps and code-level security risks in serverless computing environments. The Imperva extension enables customers to easily embed additional security in their DevOps processes for serverless applications without requiring any code changes, leading to faster time to market.
  • Lumigo provides a monitoring and observability platform for serverless and microservices applications. The Lumigo extension enables the new Lumigo Lambda Profiler to see a breakdown of function resources, including CPU, memory, and network metrics. Use the extension to receive actionable insights to reduce Lambda runtime duration and cost, fix bottlenecks, and increase efficiency.
  • Check Point CloudGuard provides full lifecycle security for serverless applications. The CloudGuard extension enables Function Self Protection data aggregation as an out-of-process extension, providing detection and alerting on application layer attacks.
  • New Relic enables you to efficiently monitor, troubleshoot, and optimize your Lambda functions. New Relic’s extension allows you send your Lambda service platform logs directly to New Relic’s unified observability platform, allowing you to quickly visualize data with minimal latency and cost.
  • Thundra provides an application debugging, observability and security platform for serverless, container and virtual machine (VM) workloads. The Thundra extension adds asynchronous telemetry reporting functionality to the Thundra agents, getting rid of network latency.
  • Splunk offers an enterprise-grade cloud monitoring solution for real-time full-stack visibility at scale. The Splunk extension provides a simplified runtime-independent interface to collect high-resolution observability data with minimal overhead. Monitor, manage, and optimize the performance and cost of your serverless applications with Splunk Observability solutions.
  • Sentry’s extension enables developers to monitor code health. From error tracking to performance monitoring, developers can see issues more clearly, solve them quicker, and continuously stay informed about the health of their applications, all without making code changes.
  • Site24x7 provides a performance monitoring solution for DevOps and IT operations. The Site24x7 extension enables real-time observability into your Lambda functions. It enables you to monitor critical Lambda metrics and function executions logs and optimize execution time and performance.
  • The Sumo Logic extension enables you to get instant visibility into the health and performance of your mission-critical applications using AWS Lambda. With this extension and Sumo Logic’s continuous intelligence platform, you can now ensure that all your Lambda functions are running as expected by analyzing function, platform, and extension logs to quickly identify and remediate errors and exceptions.

Here are Lambda extensions from AWS services:

  • AWS AppConfig helps you manage, store, and safely deploy application configurations to your hosts at runtime. The AWS AppConfig extension integrates Lambda and AWS AppConfig seamlessly. Lambda functions have simple access to external configuration settings quickly and easily. Developers can now dynamically change their Lambda function’s configuration safely using robust validation features.
  • Amazon CodeGuru Profiler helps developers improve application performance and reduce costs by pinpointing an application’s most expensive line of code. It provides recommendations for improving code to save money. The Lambda integration removes the need to change any code or redeploy packages.
  • Amazon CloudWatch Lambda Insights enables you to efficiently monitor, troubleshoot, and optimize Lambda functions. The Lambda Insights extension simplifies the collection, visualization, and investigation of detailed compute performance metrics, errors, and logs. You can more easily isolate and correlate performance problems to optimize your Lambda environments.
  • AWS Distro for OpenTelemetry is a secure, production-ready, AWS-supported distribution of the OpenTelemetry project. The Lambda extension runs the OpenTelemetry collector and enables functions to send trace data to AWS monitoring services such as AWS X-Ray and to any destination such as Honeycomb and Lightstep that supports OpenTelemetry Protocol (OTLP) using the OTLP exporter.

To get started with Lambda extensions, use the links provided to install these extensions.

Things to Know
Here are a couple of things to keep in mind:

Pricing: Extensions share the same billing model as Lambda functions and you are charged for compute time used in all phases of the Lambda lifecycle. For function invocations, you pay for requests served and the compute time used to run your code and all extensions, together, in 1ms increments. To learn more about billing for extensions, visit the Lambda FAQs page.

Performance: Lambda extensions might impact the performance of your function because they share resources such as CPU, memory, and storage with the function, and because extensions are initialized before function code. For example, if an extension performs compute-intensive operations, you might see your function’s execution duration increase because the extension and your function code share the same CPU resources.

Because Lambda uses allocates proportional CPU power based on the memory setting, you might see increased execution and initialization duration at lower memory settings as more processes compete for the same CPU resources. You can use CloudWatch metrics such as PostRuntimeExecutionDuration to measure the extra time the extension takes after the function execution and MaxMemoryUsed to measure the increase in memory used.

Available Now
The performance improvements announced as part of GA are currently in US East (N. Virginia), Europe (Ireland), and Europe (Milan) Regions. (Update. AWS Lambda Extensions are now generally available in all commercial regions.)

You can also build your own extensions. To learn how to build extensions, see the Lambda Extensions API in the AWS Lambda Developer Guide. You can send feedback through the AWS forum for AWS Lambda or through your usual AWS Support contacts.

Channy

Update. Watch a quick introductory video and a deep dive playlist about AWS Lambda Extensions for more information.

New – Amazon Elastic Block Store Local Snapshots on AWS Outposts

Post Syndicated from Channy Yun original https://aws.amazon.com/blogs/aws/new-amazon-elastic-block-store-local-snapshots-on-aws-outposts/

Today I am happy to announce that AWS Outposts customers can now make local snapshots of their Amazon Elastic Block Store (EBS) volumes, making it easy to meet data residency and local backup requirements. AWS Outposts is a fully managed service that extends AWS infrastructure, services, APIs, and tools to virtually any datacenter, co-location space, or on-premises facility for a truly consistent hybrid experience. Until now, Amazon EBS snapshots on Outposts were stored by default on Amazon Simple Storage Service (S3) in the AWS Region. If your Outpost is provisioned with Amazon S3 on Outposts, now you have the option to store your snapshots locally on your Outpost.

Customers use AWS Outposts to support applications that need to run on-premises due to low latency, local data processing, or data residency requirements. Customers looking to use AWS services in countries where no AWS Region exists today can opt to run their applications on Outposts. Sometimes data needs to remain in a particular country, state, or municipality for regulatory, contractual, or information security reasons. These customers need the data for snapshots and Amazon Machine Image (AMI) to be stored locally on Outposts to operate their applications. In addition, some of our customers could also see value for workloads that need low latency access to local backups.

EBS Local Snapshots on Outposts is a new capability that enables snapshots and AMI data to be stored locally on Amazon S3 on Outposts. Now you can create and manage EBS Local Snapshots on Outposts through the AWS Management Console, AWS Command Line Interface (CLI), and AWS SDKs. You can also continue to take snapshots of EBS volumes on Outposts, which are stored in S3 in the associated parent Region.

How to Get Started With EBS Local Snapshots on Outposts
To get started, visit the AWS Outposts Management Console to order an Outposts configuration that includes your selected EBS and Amazon S3 storage capacity (EBS snapshots use Amazon S3 on Outposts to store snapshots), or you can add S3 storage to your existing Outposts. EBS Local Snapshots are enabled on Outposts provisioned with Amazon S3 on Outposts.

To create a local EBS snapshot on Outposts, go to the EBS volume console and select the volume you want to create a snapshot from. Click the Actions button, then select Create Snapshot in the dropdown menu.

You can create a snapshot either in the AWS Region or your Outposts when you choose the Snapshot destination. The AWS Region snapshot uses Amazon S3 in the region and the AWS Outposts snapshot uses S3 storage on Outposts for storing the snapshots. Amazon S3 on Outposts is a new storage class, which is designed to durably and redundantly store data on Outposts. Note that due to its scale, Amazon S3 in a region offers higher durability than S3 on Outposts.

You can call CreateSnapshot with the outpost-arn parameter set to the Outposts ARN that uniquely identifies your installation. If data residency is not a concern, you can also get the CreateSnapshot API to create the snapshot in the parent AWS Region by specifying AWS Region as the destination.

$ aws ec2 create-snapshot \
     --volume-id vol-1234567890abcdef0 \
     --outpost-arn arn:aws:outposts:us-east-1:123456789012:outpost/op-1a2b3c \ 
	 --description "local snapshots in outpost"

You can also use commands for the AWS Command Line Interface (CLI) and AWS SDKs e.g. CreateSnapshots, DescribeSnapshot, CopySnapshot, and DeleteSnapshot to manage snapshots on Outposts, and use Amazon Data Lifecycle Manager to automate snapshots management on Outposts. All local snapshots on Outposts are Encrypted by Default (EBD).

You can set IAM policies for data residency of your snapshots. The policy example below will enforce data residency on the Outposts by denying CreateSnapshot(s) calls to create snapshots in the region from outpost volumes.

{
   "Version":"2012-10-17",
   "Statement":[
      {
         "Effect":"Deny",
         "Action":[
            "ec2:CreateSnapshot",
            "ec2:CreateSnapshots"
         ],
         "Resource":"arn:aws:ec2:us-west-2::snapshot/*",
         "Condition":{
            "StringEquals":{
               "ec2:SourceOutpostArn":"arn:aws:outposts:us-west-2:1234567890:outpost/op-1a2b3c"
            },
            "Null":{
               "ec2:OutpostArn":"true"
            }
         }
      },
      {
         "Effect":"Allow",
         "Action":[
            "ec2:CreateSnapshot",
            "ec2:CreateSnapshots"
         ],
         "Resource":"*"
      }
   ]
}

You can audit your own data residency compliance by calling the DescribeSnapshots API that will return the snapshot’s storage location. All creation, update, and copy operations are logged in AWS CloudTrail audit logs.

You can copy AMI snapshots from the AWS Region to your Outposts and register them as AMI to launch your EC2 instances on Outposts.

Also, you can do this via simple AWS Command Line Interface (CLI) commands as follows:

$ aws ec2 copy-snapshot \
     --region us-west-2 \
     --source-region us-west-2 \
     --source-snapshot-id snap-1 \
     --destination-outpost-arn arn:aws:outposts:us-west-2:123456789012:outpost/op-1a2b3c \ 
	 --description "This is my copied snapshot."

Now you can register the snapshot as a local AMI for launching your EC2 instances on your Outposts.

$ aws ec2 register-image \
    --root-device-name /dev/sda1 \
    --block-device-mappings '[ \
       {"DeviceName": "/dev/sda1", "Ebs" :{"VolumeSize":100, "SnapshotId":"snap-1-copy"}}]'

You can also copy your regional AMIs to Outposts using the copy-image command. Specify the ID of the AMI to copy, the source Region, and the ARN of the destination Outpost.

$ aws ec2 copy-image \
       --source-region us-west-2 \
	   --source-image-id ami-1234567890abcdef0  \
	   --name "Local AMI copy"  \
	   --destination-outpost-arn arn:aws:outposts:us-west-2:123456789012:outpost/op-1a2b3c

Copying of local snapshots on Outposts to the parent AWS Region is not supported. In scenarios where data residency is required, you can only create local snapshots or copy snapshots from the parent Region. To ensure your data residency requirements are met on AWS Outposts, I recommend you refer to whitepapers such as AWS Policy Perspectives: Data Residency and Addressing Data Residency Requirements with AWS Outposts, and confirm and work closely with your compliance and security teams.

CloudEndure Migration and Disaster Recovery services, offered by AWS, allow customers to migrate or replicate workloads for recovery purposes into AWS from physical, virtual, or cloud-based sources. Up until now, if customers selected an Outposts device as a migration or recovery target, the snapshot data had to be copied to a public region before being copied back into the Outposts device. This led to increased cutover and recovery times, as well as other data transfer impacts.

With the newly launched availability of EBS Local Snapshots on Outposts, you can migrate, replicate and recover workloads from any sources directly into Outposts, or between Outposts devices, without requiring the EBS snapshot data to go through a public region, leading to lower latencies, greater performance, and reduced costs. Supported use cases related to Outposts for migration and disaster recovery include: from on-premises to Outposts, from public AWS Regions into Outposts, from Outposts into public AWS Regions, and between two Outposts devices. Learn more about CloudEndure Migration and CloudEndure Disaster Recovery.

Available Now
Amazon EBS Local Snapshots on AWS Outposts is available for all Outposts provisioned with S3 on Outposts. To learn more, take a look at the documentation. Please send feedback to the AWS Outposts team, your usual AWS support contacts, or Outposts partners.

Learn all the details about AWS Outposts and get started today.

Channy

New – AWS Transfer Family support for Amazon Elastic File System

Post Syndicated from Channy Yun original https://aws.amazon.com/blogs/aws/new-aws-transfer-family-support-for-amazon-elastic-file-system/

AWS Transfer Family provides fully managed Secure File Transfer Protocol (SFTP), File Transfer Protocol (FTP) over TLS, and FTP support for Amazon Simple Storage Service (S3), enabling you to seamlessly migrate your file transfer workflows to AWS.

Today I am happy to announce AWS Transfer Family now also supports file transfers to Amazon Elastic File System (EFS) file systems as well as Amazon S3. This feature enables you to easily and securely provide your business partners access to files stored in Amazon EFS file systems. With this launch, you now have the option to store the transferred files in a fully managed file system and reduce your operational burden, while preserving your existing workflows that use SFTP, FTPS, or FTP protocols.

Amazon EFS file systems are accessible within your Amazon Virtual Private Cloud (VPC) and VPC connected environments. With this launch, you can securely enable third parties such as your vendors, partners, or customers to access your files over the supported protocols at scale globally, without needing to manage any infrastructure. When you select Amazon EFS as the data store for your AWS Transfer Family server, the transferred files are readily available to your business-critical applications running on Amazon Elastic Compute Cloud (EC2), as well as to containerized and serverless applications run using AWS services such as Amazon Elastic Container Service (ECS), Amazon Elastic Kubernetes Service (EKS), AWS Fargate, and AWS Lambda.

Using Amazon EFS – Getting Started
To get started in your existing Amazon EFS file system, make sure the POSIX identities you assign for your SFTP/FTPS/FTP users are owners of the files and directories you want to provide access to. You will provide access to that Amazon EFS file system through a resource-based policy. Your role also needs to establish a trust relationship. This trust relationship allows AWS Transfer Family to assume the AWS Identity and Access Management (IAM) role to access your bucket so that it can service your users’ file transfer requests.

You will also need to make sure you have created a mount target for your file system. In the example below, the home directory is owned by userid 1234 and groupid 5678.

$ mkdir home/myname
$ chown 1234:5678 home/myname

When you create a server in the AWS Transfer Family console, select Amazon EFS as your storage service in the Step 4 section Choose a domain.

When the server is enabled and in an online state, you can add users to your server. On the Servers page, select the check box of the server that you want to add a user to and choose Add user.

In the User configuration section, you can specify the username, uid (e.g. 1234), gid (e.g 5678), IAM role, and Amazon EFS file system as user’s home directory. You can optionally specify a directory within the file system which will be the user’s landing directory. You use a service-managed identity type – SSH keys. If you want to use password type, you can use a custom option with AWS Secrets Manager.

Amazon EFS uses POSIX IDs which consist of an operating system user id, group id, and secondary group id to control access to a file system. When setting up your user, you can specify the username, user’s POSIX configuration, and an IAM role to access the EFS file system. To learn more about configuring ownership of sub-directories in EFS, visit the documentation.

Once the users have been configured, you can transfer files using the AWS Transfer Family service by specifying the transfer operation in a client. When your user authenticates successfully using their file transfer client, it will be placed directly within the specified home directory, or root of the specified EFS file system.

$ sftp [email protected]

sftp> cd /fs-23456789/home/myname
sftp> ls -l
-rw-r--r-- 1 3486 1234 5678 Jan 04 14:59 my-file.txt
sftp> put my-newfile.txt
sftp> ls -l
-rw-r--r-- 1 3486 1234 5678 Jan 04 14:59 my-file.txt
-rw-r--r-- 1 1002 1234 5678 Jan 04 15:22 my-newfile.txt

Most of SFTP/FTPS/FTP commands are supported in the new EFS file system. You can refer to a list of available commands for FTP and FTPS clients in the documentation.

Command Amazon S3 Amazon EFS
cd Supported Supported
ls/dir Supported Supported
pwd Supported Supported
put Supported Supported
get Supported Supported including resolving symlinks
rename Supported (only file) Supported (file or folder)
chown Not supported Supported (root only)
chmod Not supported Supported (root only)
chgrp Not supported Supported (root or owner only)
ln -s Not supported Not supported
mkdir Supported Supported
rm Supported Supported
rmdir Supported (non-empty folders only) Supported
chmtime Not Supported Supported

You can use Amazon CloudWatch to track your users’ activity for file creation, update, delete, read operations, and metrics for data uploaded and downloaded using your server. To learn more on how to enable CloudWatch logging, visit the documentation.

Available Now
AWS Transfer Family support for Amazon EFS file systems is available in all AWS Regions where AWS Transfer Family is available. There are no additional AWS Transfer Family charges for using Amazon EFS as the storage backend. With Amazon EFS storage, you pay only for what you use. There is no need to provision storage in advance and there are no minimum commitments or up-front fees.

To learn more, take a look at the FAQs and the documentation. Please send feedback to the AWS forum for AWS Transfer Family or through your usual AWS support contacts.

Learn all the details about AWS Transfer Family to access Amazon EFS file systems and get started today.

Channy;

New –  FreeRTOS Long Term Support to Provide Years of Feature Stability

Post Syndicated from Channy Yun original https://aws.amazon.com/blogs/aws/new-freertos-long-term-support-to-provide-years-of-feature-stability/

Today, I’m particularly happy to announce FreeRTOS Long Term Support (LTS). FreeRTOS is an open source, real-time operating system for microcontrollers that makes small, low-power edge devices easy to program, deploy, secure, connect, and manage. LTS releases offer a more stable foundation than standard releases as manufacturers deploy and later update devices in the field. As we have planned, LTS is now included in the FreeRTOS kernel and a set of FreeRTOS libraries needed for embedded and IoT applications, and for securely connecting microcontroller-based (MCU) devices to the cloud.

Embedded developers at original equipment manufacturers (OEMs) and MCU vendors using FreeRTOS to build long-lived applications on IoT devices now get the predictability and feature stability of an LTS release without compromising access to critical security updates. The FreeRTOS 202012.00 LTS release applies to the FreeRTOS kernel, connectivity libraries (FreeRTOS+TCP, coreMQTT, coreHTTP), security library (PKCS #11 implementation), and AWS library (AWS IoT Device Shadow).

We will provide security updates and critical bug fixes for all these libraries until December 31, 2022.

Benefits of FreeRTOS LTS
Embedded developers at OEMs who want to use FreeRTOS libraries for their long-lived applications want to benefit from security updates and bug fixes in the latest FreeRTOS mainline releases. Mainline releases can introduce both new features and critical fixes, which may increase time and effort for users to include only fixes.

An LTS release provides years of feature stability of included libraries. With an LTS release, any update will not change public APIs, file structure, or build processes that could require changes to your application. Security updates and critical bug fixes will be backported at least until Dec 31, 2022. LTS releases contain updates that only address critical issues including security vulnerabilities. Therefore, the integration of LTS releases is less disruptive to customers’ development and integration efforts as they approach and move into production. For MCU vendors, this means reduced effort in integrating a stable code base and faster time to market with vendors’ latest libraries.

Available Now
The FreeRTOS 202012.00 LTS release is available now to download. To learn more, visit FreeRTOS LTS and the documentation. Please send us feedback on the Github repository and the forum of FreeRTOS.

Channy

Announcing AWS IoT Greengrass 2.0 – With an Open Source Edge Runtime and New Developer Capabilities

Post Syndicated from Channy Yun original https://aws.amazon.com/blogs/aws/announcing-aws-iot-greengrass-2-0-with-an-open-source-edge-runtime-and-new-developer-capabilities/

I am happy to announce AWS IoT Greengrass 2.0, a new version of AWS IoT Greengrass that makes it easy for device builders to build, deploy, and manage intelligent device software. AWS IoT Greengrass 2.0 provides an open source edge runtime, a rich set of pre-built software components, tools for local software development, and new features for managing software on large fleets of devices.


AWS IoT Greengrass 2.0 edge runtime is now open source under an Apache 2.0 license, and available on Github. Access to the source code allows you to more easily integrate your applications, troubleshoot problems, and build more reliable and performant applications that use AWS IoT Greengrass.

You can add or remove pre-built software components based on your IoT use case and your device’s CPU and memory resources. For example, you can choose to include pre-built AWS IoT Greengrass components such as stream manager only when you need to process data streams with your application, or machine learning components only when you want to perform machine learning inference locally on your devices.

The AWS IoT Greengrass IoT Greengrass 2.0 includes a new command-line interface (CLI) that allows you to locally develop and debug applications on your device. In addition, there is a new local debug console that helps you visually debug applications on your device. With these new capabilities, you can rapidly develop and debug code on a test device before using the cloud to deploy to your production devices.

AWS IoT Greengrass 2.0 is also integrated with AWS IoT thing groups, enabling you to easily organize your devices in groups and manage application deployments across your devices with features to control rollout rates, timeouts, and rollbacks.

AWS IoT Greengrass 2.0 – Getting Started
Device builders can use AWS IoT Greengrass 2.0 by going to the AWS IoT Greengrass console where you can find a download and install command that you run on your device. Once the installer is downloaded to the device, you can use it to install Greengrass software with all essential features, register the device as an AWS IoT Thing, and create a simple “hello world” software component in less than 10 minutes.

To get started in the AWS IoT Greengrass console, you first register a test device by clicking Set up core device. You assign the name and group of your core device. To deploy to only the core device, select No group. In the next step, install the AWS IoT Greengrass Core software in your device.

When the installer completes, you can find your device in the list of AWS IoT Greengrass Core devices on the Core devices page.

AWS IoT Greengrass components enable you to develop and deploy software to your AWS IoT Greengrass Core devices. You can write your application functionality and bundle it as a private component for deployment. AWS IoT Greengrass also provides public components, which provide pre-built software for common use cases that you can deploy to your devices as you develop your device software. When you finish developing the software for your component, you can register it with AWS IoT Greengrass. Then, you can deploy and run the component on your AWS IoT Greengrass Core devices.


To create a component, click the Create component button on the Components page. You can use a recipe or import an AWS Lambda function. The component recipe is a YAML or JSON file that defines the component’s details, dependencies, compatibility, and lifecycle. To learn about the specifications, visit the recipe reference guide.

Here is an example of a YAML recipe.

When you finish developing your component, you can add it to a deployment configuration to deploy to one or more core devices. To create a new deployment or configure the components to deploy to core devices, click the Create button on the Deployments page. You can deploy to a core device or a thing group as a target, and select the components to deploy. The deployment includes the dependencies for each component that you select.


You can edit the version and parameters of selected components and advanced settings such as the rollout configuration, which defines the rate at which the configuration deploys to the target devices; timeout configuration, which defines the duration that each device has to apply the deployment; or cancel configuration, which defines when to automatically stop the deployment.

Moving to AWS IoT Greengrass 2.0
Existing devices running AWS IoT Greengrass 1.x will continue to run without any changes. If you want to take advantage of new AWS IoT Greengrass 2.0 features, you will need to move your existing AWS IoT Greengrass 1.x devices and workloads to AWS IoT Greengrass 2.0. To learn how to do this, visit the migration guide.

After you move your 1.x applications over, you can start adding components to your applications using new version 2 features, while leaving your version 1 code as-is until you decide to update them.

AWS IoT Greengrass 2.0 Partners
At launch, industry-leading partners NVIDIA and NXP have qualified a number of their devices for AWS IoT Greengrass 2.0:

See all partner device listings in the AWS Partner Device Catalog. To learn about getting your device qualified, visit the AWS Device Qualification Program.

Available Now
AWS IoT Greengrass 2.0 is available today. Please see the AWS Region table for all the regions where AWS IoT Greengrass is available. For more information, see the developer guide.

Starting today, to help you evaluate, test, and develop with this new release of AWS IoT Greengrass, the first 1,000 devices in your account will not incur any AWS IoT Greengrass charges until December 31, 2021. For pricing information, check out the AWS IoT Greengrass pricing page.

Give it a try, and please send us feedback through your usual AWS Support contacts or the AWS forum for AWS IoT Greengrass.

Learn all the details about AWS IoT Greengrass 2.0 and get started with the new version today.

Channy

New – AWS IoT Core for LoRaWAN to Connect, Manage, and Secure LoRaWAN Devices at Scale

Post Syndicated from Channy Yun original https://aws.amazon.com/blogs/aws/new-aws-iot-core-for-lorawan-to-connect-manage-and-secure-lorawan-devices-at-scale/

Today, I am happy to announce AWS IoT Core for LoRaWAN, a new fully-managed feature that allows AWS IoT Core customers to connect and manage wireless devices that use low-power long-range wide area network (LoRaWAN) connectivity with the AWS Cloud.

Using AWS IoT Core for LoRaWAN, customers can now set up a private LoRaWAN network by connecting their own LoRaWAN devices and gateways to the AWS Cloud – without developing or operating a LoRaWAN Network Server (LNS) by themselves. The LNS is required to manage LoRaWAN devices and gateways’ connection to the cloud; gateways serve as a bridge and carry device data to and from the LNS, usually over Wi-Fi or Ethernet.

This allows customers to eliminate the undifferentiated work and operational burden of managing an LNS, and enables them to easily and quickly connect and secure LoRaWAN device fleets at scale.

Combined with the long range and deep in-building coverage provided by LoRa technology, AWS IoT Core now enables customers to accelerate IoT application development using AWS services and acting on the data generated easily from connected LoRaWAN devices.

Customers – mostly enterprises – need to develop IoT applications using devices that transmit data over long range (1-3 miles of urban coverage or up to 10 miles for line-of-sight) or through the walls and floors of buildings, for example for real-time asset tracking at airports, remote temperature monitoring in buildings, or predictive maintenance of industrial equipment. Such applications also require devices to be optimized for low-power consumption, so that batteries can last several years without replacement, thus making the implementation cost-effective. Given the extended coverage of LoRaWAN connectivity, it is attractive to enterprises for these use cases, but setting up LoRaWAN connectivity in a privately managed site requires customers to operate an LNS.

With AWS IoT Core for LoRaWAN, you can connect LoRaWAN devices and gateways to the cloud with a few simple steps in the AWS IoT Management Console, thus speeding up the network setup time, and connect off-the-shelf LoRaWAN devices, without any requirement to modify embedded software, for a plug and play experience.

AWS IoT Core for LoRaWAN – Getting Started
Getting started with a LoRaWAN network setup is easy. You can find AWS IoT Core for LoRaWAN qualified gateways and developer kits from the AWS Partner Device Catalog. AWS qualified gateways and developer kits are pre-tested and come with a step by step guide from the manufacturer on how to connect it with AWS IoT Core for LoRaWAN.

With AWS IoT Core console, you can register the gateways by providing a gateway’s unique identifier (provided by the gateway vendor) and selecting LoRa frequency band. For registering devices, you can input device credentials (identifiers and security keys provided by the device vendor) on the console.

Each device has a Device Profile that specifies the device capabilities and boot parameters the LNS requires to set up LoRaWAN radio access service. Using the console, you can select a pre-populated Device Profile or create a new one.

A destination automatically routes messages from LoRaWAN devices to AWS IoT Rules Engine. Once a destination is created, you can use it to map multiple LoRaWAN devices to the same IoT rule. You can write rules using simple SQL queries, to transform and act on the device data, like converting data from proprietary binary to JSON format, raising alerts, or routing it to other AWS services like Amazon Simple Storage Service (S3). From the console, you can also query metrics for connected devices and gateways to troubleshoot connectivity issues.

Available Now
AWS IoT Core for LoRaWAN is available today in US East (N. Virginia) and Europe (Ireland) Regions. With pay-as-you-go pricing and no monthly commitments, you can connect and scale LoRaWAN device fleets reliably, and build applications with AWS services quickly and efficiently. For more information, see the pricing page.

To get started, buy an AWS qualified LoRaWAN developer kit and and launch Getting Started experience in the AWS Management Console. To learn more, visit the developer guide. Give this a try, and please send us feedback either through your usual AWS Support contacts or the AWS forum for AWS IoT.

Learn all the details about AWS IoT Core for LoRaWAN and get started with the new feature today.

Channy

New – Amazon EMR on Amazon Elastic Kubernetes Service (EKS)

Post Syndicated from Channy Yun original https://aws.amazon.com/blogs/aws/new-amazon-emr-on-amazon-elastic-kubernetes-service-eks/

Tens of thousands of customers use Amazon EMR to run big data analytics applications on frameworks such as Apache Spark, Hive, HBase, Flink, Hudi, and Presto at scale. EMR automates the provisioning and scaling of these frameworks and optimizes performance with a wide range of EC2 instance types to meet price and performance requirements. Customer are now consolidating compute pools across organizations using Kubernetes. Some customers who manage Apache Spark on Amazon Elastic Kubernetes Service (EKS) themselves want to use EMR to eliminate the heavy lifting of installing and managing their frameworks and integrations with AWS services. In addition, they want to take advantage of the faster runtimes and development and debugging tools that EMR provides.

Today, we are announcing the general availability of Amazon EMR on Amazon EKS, a new deployment option in EMR that allows customers to automate the provisioning and management of open-source big data frameworks on EKS. With EMR on EKS, customers can now run Spark applications alongside other types of applications on the same EKS cluster to improve resource utilization and simplify infrastructure management.

Customers can deploy EMR applications on the same EKS cluster as other types of applications, which allows them to share resources and standardize on a single solution for operating and managing all their applications. Customers get all the same EMR capabilities on EKS that they use on EC2 today, such as access to the latest frameworks, performance optimized runtimes, EMR Notebooks for application development, and Spark user interface for debugging.

Amazon EMR automatically packages the application into a container with the big data framework and provides pre-built connectors for integrating with other AWS services. EMR then deploys the application on the EKS cluster and manages logging and monitoring. With EMR on EKS, you can get 3x faster performance using the performance-optimized Spark runtime included with EMR compared to standard Apache Spark on EKS.

Amazon EMR on EKS – Getting Started
If you already have a EKS cluster where you run Spark jobs, you simply register your existing EKS cluster with EMR using the AWS Management Console, AWS Command Line Interface (CLI) or APIs to deploy your Spark appication.

For exampe, here is a simple CLI command to register your EKS cluster.

$ aws emr create-virtual-cluster \
          --name <virtual_cluster_name> \
          --container-provider '{
             "id": "<eks_cluster_name>",
             "type": "EKS",
             "info": {
                 "eksInfo": {
                     "namespace": "<namespace_name>"
                 }
             } 
         }'

In the EMR Management console, you can see it in the list of virtual clusters.

When Amazon EKS clusters are registered, EMR workloads are deployed to Kubernates nodes and pods to manage application execution and auto-scaling, and sets up managed endpoints so that you can connect notebooks and SQL clients. EMR builds and deploys a performance-optimized runtime for the open source frameworks used in analytics applications.

You can simply start your Spark jobs.

$ aws emr start-job-run \
          --name <job_name> \
          --virtual-cluster-id <cluster_id> \
          --execution-role-arn <IAM_role_arn> \
          --virtual-cluster-id <cluster_id> \
          --release-label <<emr_release_label> \
          --job-driver '{
            "sparkSubmitJobDriver": {
              "entryPoint": <entry_point_location>,
              "entryPointArguments": ["<arguments_list>"],
              "sparkSubmitParameters": <spark_parameters>
            }
       }'

To monitor and debug jobs, you can use inspect logs uploaded to your Amazon CloudWatch and Amazon Simple Storage Service (S3) location configured as part of monitoringConfiguration. You can also use the one-click experience from the console to launch the Spark History Server.

Integration with Amazon EMR Studio

Now you can submit analytics applications using AWS SDKs and AWS CLI, Amazon EMR Studio notebooks, and workflow orchestration services like Apache Airflow. We have developed a new Airflow Operator for Amazon EMR on EKS. You can use this connector with self-managed Airflow or by adding it to the Plugin Location with Amazon Managed Workflows for Apache Airflow.

You can also use newly previewed Amazon EMR Studio to perform data analysis and data engineering tasks in a web-based integrated development environment (IDE). Amazon EMR Studio lets you submit notebook code to EMR clusters deployed on EKS using the Studio interface. After seting up one or more managed endpoints to which Studio users can attach a Workspace, EMR Studio can communicate with your virtual cluster.

For EMR Studio preview, there is no additional cost when you create managed endpoints for virtual clusters. To learn more, visit the guide document.

Now Available
Amazon EMR on Amazon EKS is available in US East (N. Virginia), US West (Oregon), and Europe (Ireland) Regions. You can run EMR workloads in AWS Fargate for EKS removing the need to provision and manage infrastructure for pods as a serverless option.

To learn more, visit the documentation. Please send feedback to the AWS forum for Amazon EMR or through your usual AWS support contacts.

Learn all the details about Amazon EMR on Amazon EKS and get started today.

Channy;

New – Code Signing, a Trust and Integrity Control for AWS Lambda

Post Syndicated from Channy Yun original https://aws.amazon.com/blogs/aws/new-code-signing-a-trust-and-integrity-control-for-aws-lambda/

Code signing is an industry standard technique used to confirm that the code is unaltered and from a trusted publisher. Code running inside AWS Lambda functions is executed on highly hardened systems and runs in a secure manner. However, function code is susceptible to alteration as it moves through deployment pipelines that run outside AWS.

Today, we are launching Code Signing for AWS Lambda. It is a trust and integrity control that helps administrators enforce that only signed code packages from trusted publishers run in their Lambda functions and that the code has not been altered since signing.

Code Signing for Lambda provides a first-class mechanism to enforce that only trusted code is deployed in Lambda. This frees up organizations from the burden of building gatekeeper components in their deployment pipelines. Code Signing for AWS Lambda leverages AWS Signer, a fully managed code signing service from AWS. Administrators create Signing Profile, a resource in AWS Signer that is used for creating signatures and grant developers access to the signing profile using AWS Identity and Access Management (IAM). Within Lambda, administrators specify the allowed signing profiles using a new resource called Code Signing Configuration (CSC). CSC enables organizations to implement a separation of duties between administrators and developers. Administrators can use CSC to set code signing policies on the functions, and developers can deploy code to the functions.

How to Create a Signing Profile
You can use AWS Signer console to create a new Signing profile. A signing profile can represent a group of trusted publishers and is analogous to the use of a digital signing certificate.

By clicking Create Signing Profile, you can create a Signing Profile that can be used to create signed code packages.

You can assign Signature validity period for the signatures generated by a Signing Profile between 1 day and 135 months.

How to create a Code Signing Configuration (CSC)
You can configure your functions to use Code Signing through the AWS Lambda console, Command-line Interface (CLI), or APIs by creating and attaching a new resource called Code Signing Configuration to the function. You can find Code signing configurations under Additional resources menu.

You can click Create configuration to define signing profiles that are allowed to sign code artifacts for this configuration, and set signature validation policy. To add an allowed signing profile, you can either select from the dropdown, which shows all signing profiles in your AWS account, or add a signing profile from a different account by specifying the version ARN.

Also, you can set the signature validation policy to either ‘Warn’ or ‘Enforce’. With ‘Warn’, Lambda logs a Cloudwatch metric if there is a signature check failure but accepts the deployment. With ‘Enforce’, Lambda rejects the deployment if there is a signature check failure. Signature check fails if the signature signing profile does not match one of the allowed signing profiles in the CSC, the signature is expired, or the signature is revoked. If the code package is tampered or altered since signing, the deployment is always rejected, irrespective of the signature validation policy.

You can use new Lambda API CreateCodeSigningConfig to create a CSC too. You can see the JSON request syntax below.

{
     "CodeSigningConfigId": string,
     "CodeSigningConfigArn": string,
     "Description": string,
     "AllowedPublishers": {
           "SigningProfileVersionArns": [string]
      },
     "CodeSigningPolicies": {
     "UntrustedArtifactOnDeployment": string,   // WARN OR ENFORCE
    },
     "LastModified”: string
}

Let’s Enable Code Signing for Your Lambda Functions
To enable Code Signing feature for your Lambda functions, you can select a function and click Edit in Code signing configuration section.

Select one of the available CSCs and click the Save button.

Once your function is configured to use code signing, you need to upload signed .zip file or Amazon S3 URL of a signed .zip made by a signing job in AWS Signer.

How to Create a Signed Code Package
Choose one of the allowed signing profiles and specify the S3 location of the code package ZIP file to be signed. Also, specify a destination path where the signed code package should be uploaded.

A signing job is an asynchronous process that generates a signature for your code package and puts the signed code package in the specified destination path.

Once signing job is succeeded, you can find signed ZIP packages in your assigned S3 bucket.

Back to Lambda console, you can now publish the signed code package to the Lambda function. Lambda will perform signature checks to verify that the code has not been altered since signing and that the code is signed by one of the allowed signing profile.

You can also enable code signing for a function using CreateFunction or PutFunctionCodeSigningConfig APIs by attaching a CSC to the function.

Developers can also use SAM CLI to sign code packages. They do this by specifying the signing profiles at package or deploy stage. SAM CLI automatically starts the signing workflow before deploying the code to Lambda.

Code Signing is also supported by Infrastructure as code tools like AWS CloudFormation and Terraform. Terraform also allows developers to sign code, in addition to declaring and creating code signing resources.

Now Available
Code Signing for AWS Lambda is available in all commercial regions except AWS China Regions, AWS GovCloud (US) Regions, and Asia Pacific (Osaka) Region. There is no additional charge for using code signing, and customers pay the standard price for Lambda functions.

To learn more about Code Signing for AWS Lambda and AWS Signer, please visit the Lambda developer guide and send us feedback either in the forum for AWS Lambda or through your usual AWS support contacts.

Channy;

AWS Network Firewall – New Managed Firewall Service in VPC

Post Syndicated from Channy Yun original https://aws.amazon.com/blogs/aws/aws-network-firewall-new-managed-firewall-service-in-vpc/

Our customers want to have a high availability, scalable firewall service to protect their virtual networks in the cloud. Security is the number one priority of AWS, which has provided various firewall capabilities on AWS that address specific security needs, like Security Groups to protect Amazon Elastic Compute Cloud (EC2) instances, Network ACLs to protect Amazon Virtual Private Cloud (VPC) subnets, AWS Web Application Firewall (WAF) to protect web applications running on Amazon CloudFront, Application Load Balancer (ALB) or Amazon API Gateway, and AWS Shield to protect against Distributed Denial of Service (DDoS) attacks.

We heard customers want an easier way to scale network security across all the resources in their workload, regardless of which AWS services they used. They also want customized protections to secure their unique workloads, or to comply with government mandates or commercial regulations. These customers need the ability to do things like URL filtering on outbound flows, pattern matching on packet data beyond IP/Port/Protocol and the ability to alert on specific vulnerabilities for protocols beyond HTTP/S.

Today, I am happy to announce AWS Network Firewall, a high availability, managed network firewall service for your virtual private cloud (VPC). It enables you to easily deploy and manage stateful inspection, intrusion prevention and detection, and web filtering to protect your virtual networks on AWS. Network Firewall automatically scales with your traffic, ensuring high availability with no additional customer investment in security infrastructure.

With AWS Network Firewall, you can implement customized rules to prevent your VPCs from accessing unauthorized domains, to block thousands of known-bad IP addresses, or identify malicious activity using signature-based detection. AWS Network Firewall makes firewall activity visible in real-time via CloudWatch metrics and offers increased visibility of network traffic by sending logs to S3, CloudWatch and Kinesis Firehose. Network Firewall is integrated with AWS Firewall Manager, giving customers who use AWS Organizations a single place to enable and monitor firewall activity across all your VPCs and AWS accounts. Network Firewall is interoperable with your existing security ecosystem, including AWS partners such as CrowdStrike, Palo Alto Networks, and Splunk. You can also import existing rules from community maintained Suricata rulesets.

Concepts of Network Firewall
AWS Network Firewall runs stateless and stateful traffic inspection rules engines. The engines use rules and other settings that you configure inside a firewall policy.

You use a firewall on a per-Availability Zone basis in your VPC. For each Availability Zone, you choose a subnet to host the firewall endpoint that filters your traffic. The firewall endpoint in an Availability Zone can protect all of the subnets inside the zone except for the one where it’s located.

You can manage AWS Network Firewall with the following central components.

  • Firewall – A firewall connects the VPC that you want to protect to the protection behavior that’s defined in a firewall policy. For each Availability Zone where you want protection, you provide Network Firewall with a public subnet that’s dedicated to the firewall endpoint. To use the firewall, you update the VPC route tables to send incoming and outgoing traffic through the firewall endpoints.
  • Firewall policy – A firewall policy defines the behavior of the firewall in a collection of stateless and stateful rule groups and other settings. You can associate each firewall with only one firewall policy, but you can use a firewall policy for more than one firewall.
  • Rule group – A rule group is a collection of stateless or stateful rules that define how to inspect and handle network traffic. Rules configuration includes 5-tuple and domain name filtering. You can also provide stateful rules using Suricata open source rule specification.

AWS Network Firewall – Getting Started
You can start AWS Network Firewall in AWS Management Console, AWS Command Line Interface (CLI), and AWS SDKs for creating and managing firewalls. In the navigation pane in VPC console, expand AWS Network Firewall and then choose Create firewall in Firewalls menu.

To create a new firewall, enter the name that you want to use to identify this firewall and select your VPC from the dropdown. For each availability zone (AZ) where you want to use AWS Network Firewall, create a public subnet to for the firewall endpoint. This subnet must have at least one IP address available and a non-zero capacity. Keep these firewall subnets reserved for use by Network Firewall.

For Associated firewall policy, select Create and associate an empty firewall policy and choose Create firewall.

Your new firewall is listed in the Firewalls page. The firewall has an empty firewall policy. In the next step, you’ll specify the firewall behavior in the policy. Select your newly created the firewall policy in Firewall policies menu.

You can create or add new stateless or stateful rule groups – zero or more collections of firewall rules, with priority settings that define their processing order within the policy, and stateless default action defines how Network Firewall handles a packet that doesn’t match any of the stateless rule groups.

For stateless default action, the firewall policy allows you to specify different default settings for full packets and for packet fragments. The action options are the same as for the stateless rules that you use in the firewall policy’s stateless rule groups.

You are required to specify one of the following options:

  • Allow – Discontinue all inspection of the packet and permit it to go to its intended destination.
  • Drop – Discontinue all inspection of the packet and block it from going to its intended destination.
  • Forward to stateful rule groups – Discontinue stateless inspection of the packet and forward it to the stateful rule engine for inspection.

Additionally, you can optionally specify a named custom action to apply. For this action, Network Firewall sends an CloudWatch metric dimension named CustomAction with a value specified by you. After you define a named custom action, you can use it by name in the same context where you have define it. You can reuse a custom action setting among the rules in a rule group and you can reuse a custom action setting between the two default stateless custom action settings for a firewall policy.

After you’ve defined your firewall policy, you can insert the firewall into your VPC traffic flow by updating the VPC route tables to include the firewall.

How to set up Rule Groups
You can create new stateless or stateful rule groups in Network Firewall rule groups menu, and choose Create rule group. If you select Stateful rule group, you can select one of three options: 1) 5-tuple format, specifying source IP, source port, destination IP, destination port, and protocol, and specify the action to take for matching traffic, 2) Domain list, specifying a list of domain names and the action to take for traffic that tries to access one of the domains, and 3) Suricata compatible IPS rules, providing advanced firewall rules using Suricata rule syntax.

Network Firewall supports the standard stateless “5 tuple” rule specification for network traffic inspection with priority number that indicates the processing order of the stateless rule within the rule group.

Similarly, a stateful 5 tuple rule has the following match settings. These specify what the Network Firewall stateful rules engine looks for in a packet. A packet must satisfy all match settings to be a match.

A rule group with domain names has the following match settings – Domain name, a list of strings specifying the domain names that you want to match, and Traffic direction, a direction of traffic flow to inspect. The following JSON shows an example rule definition for a domain name rule group.

{
  "RulesSource": {
    "RulesSourceList": {
      "TargetType": "FQDN_SNI","HTTP_HOST",
      "Targets": [
        "test.example.com",
        "test2.example.com"
      ],
      "GeneratedRulesType": "DENYLIST"
    }
  } 
}

A stateful rule group with Suricata compatible IPS rules has all settings defined within the Suricata compatible specification. For example, as following is to detect SSH protocol anomalies. For information about Suricata, see the Suricata website.

alert tcp any any -> any 22 (msg:"ALERT TCP port 22 but not SSH"; app-layer-protocol:!ssh; sid:2271009; rev:1;)

You can monitor Network Firewall using CloudWatch, which collects raw data and processes it into readable, near real-time metrics, and AWS CloudTrail, a service that provides a record of API calls to AWS Network Firewall by a user, role, or an AWS service. CloudTrail captures all API calls for Network Firewall as events. To learn more about logging and monitoring, see the documentation.

Network Firewall Partners
At this launch, Network Firewall integrates with a collection of AWS partners. They provided us with lots of helpful feedback. Here are some of the blog posts that they wrote in order to share their experiences (I am updating this article with links as they are published).

Available Now
AWS Network Firewall is now available in US East (N. Virginia), US West (Oregon), and Europe (Ireland) Regions. Take a look at the product page, price, and the documentation to learn more. Give this a try, and please send us feedback either through your usual AWS Support contacts or the AWS forum for Amazon VPC.

Learn all the details about AWS Network Firewall and get started with the new feature today.

Channy;

Introducing AWS Gateway Load Balancer – Easy Deployment, Scalability, and High Availability for Partner Appliances

Post Syndicated from Channy Yun original https://aws.amazon.com/blogs/aws/introducing-aws-gateway-load-balancer-easy-deployment-scalability-and-high-availability-for-partner-appliances/

Last year, we launched Virtual Private Cloud (VPC) Ingress Routing to allow routing of all incoming and outgoing traffic to/from an Internet Gateway (IGW) or Virtual Private Gateway (VGW) to the Elastic Network Interface of a specific Amazon Elastic Compute Cloud (EC2) instance. With VPC Ingress Routing, you can now configure your VPC to send all […]

Amazon MQ Update – New RabbitMQ Message Broker Service

Post Syndicated from Channy Yun original https://aws.amazon.com/blogs/aws/amazon-mq-update-new-rabbitmq-message-broker-service/

In 2017, we launched Amazon MQ – a managed message broker service for Apache ActiveMQ, a popular open-source message broker that is fast and feature-rich. It offers queues and topics, durable and non-durable subscriptions, push-based and poll-based messaging, and filtering. With Amazon MQ, we have enhanced lots of new features by customer feedback to improve […]

New – Redis 6 Compatibility for Amazon ElastiCache

Post Syndicated from Channy Yun original https://aws.amazon.com/blogs/aws/new-redis-6-compatibility-for-amazon-elasticache/

After the last Redis 5.0 compatibility for Amazon ElastiCache, there has been lots of improvements to Amazon ElastiCache for Redis including upstream supports such as 5.0.6.

Earlier this year, we announced Global Datastore for Redis that lets you replicate a cluster in one region to clusters in up to two other regions. Recently we improved your ability to monitor your Redis fleet by enabling 18 additional engine and node-level CloudWatch metrics. Also, we added support for resource-level permission policies, allowing you to assign AWS Identity and Access Management (IAM) principal permissions to specific ElastiCache resource or resources.

Today, I am happy to announce Redis 6 compatibility to Amazon ElastiCache for Redis. This release brings several new and important features to Amazon ElastiCache for Redis:

  • Managed Role-Based Access Control – Amazon ElastiCache for Redis 6 now provides you with the ability to create and manage users and user groups that can be used to set up Role-Based Access Control (RBAC) for Redis commands. You can now simplify your architecture while maintaining security boundaries by having several applications use the same Redis cluster without being able to access each other’s data. You can also take advantage of granular access control and authorization to create administration and read-only user groups. Amazon ElastiCache enhances the new Access Control Lists (ACL) introduced in open source Redis 6 to provide a managed RBAC experience, making it easy to set up access control across several Amazon ElastiCache for Redis clusters.
  • Client-Side Caching – Amazon ElastiCache for Redis 6 comes with server-side enhancements to deliver efficient client-side caching to further improve your application performance. Redis clusters now support client-side caching by tracking client requests and sending invalidation messages for data stored on the client. In addition, you can also take advantage of a broadcast mode that allows clients to subscribe to a set of notifications from Redis clusters.
  • Significant Operational Improvements – This release also includes several enhancements that improve application availability and reliability. Specifically, Amazon ElastiCache has improved replication under low memory conditions, especially for workloads with medium/large sized keys, by reducing latency and the time it takes to perform snapshots. Open source Redis enhancements include improvements to expiry algorithm for faster eviction of expired keys and various bug fixes.

Note that open source Redis 6 also announced support for encryption-in-transit, a capability that is already available in Amazon ElastiCache for Redis 4.0.10 onwards. This release of Amazon ElastiCache for Redis 6 does not impact Amazon ElastiCache for Redis’ existing support for encryption-in-transit.

In order to apply RBAC to a new or existing Redis 6 cluster, we first need to ensure you have a user and user group created. We’ll review the process to do this below.

Using Role-Based Access Control – How it works
An alternative to Authenticating Users with the Redis AUTH Command, Amazon ElastiCache for Redis 6 offers Role-Based Access Control (RBAC). With RBAC, you create users and assign them specific permissions via an Access String.

If you want to create, modify, and delete users and user groups, you will need to select to the User Management and User Group Management sections in the ElastiCache console.

ElastiCache will automatically configure a default user with user ID and user name “default”, and then you can add it or new created users to new groups in User Group Management.

If you want to change the default user with your own password and access setting, you need to create a new user with the username set to “default” and can then swap it with the original default user. We recommend using your own strong password for a default user.

The following example shows how to swap the original default user with another default that has a modified access string via AWS CLI.

$ aws elasticache create-user \
 --user-id "new-default-user" \
 --user-name "default" \
 --engine "REDIS" \
 --passwords "a-str0ng-pa))word" \ 
 --access-string "off +get ~keys*"

Create a user group and add the user you created previously.

$ aws elasticache create-user-group \
  --user-group-id "new-default-group" \
  --engine "REDIS" \
  --user-ids "default"

Swap the new default user with the original default user.

$ aws elasticache modify-user-group \
    --user-group-id "new-default-group" \
    --user-ids-to-add "new-default-user" \
    --user-ids-to-remove "default"

Also, you can modify a user’s password or change its access permissions using modify-user command, or remove a specific user using delete-user command. It will be removed from any user groups to which it belongs.

Similarly you can modify a user group by adding new users and/or removing current users using modify-user-group command, or delete a user group using delete-user-group command. Note that the user group itself, not the users belonging to the group, will be deleted.

Once you have created a user group and added users, you can assign the user group to a replication group, or migrate between Redis AUTH and RBAC. For more information, see the documentation in detail.

Redis 6 cluster for ElastiCache – Getting Started
As usual, you can use the ElastiCache Console, CLI, APIs, or a CloudFormation template to create to new Redis 6 cluster. I’ll use the Console, choose Redis from the navigation pane and click Create with the following settings:

Select “Encryption in-transit” checkbox to ensure you can see the “Access Control” options. You can select an option of Access Control either User Group Access Control List by RBAC features or Redis AUTH default user. If you select RBAC, you can choose one of the available user groups.

My cluster is up and running within minutes. You can also use the in-place upgrade feature on existing cluster. By selecting the cluster, click Action and Modify. You can change the Engine Version from 5.0.6-compatible engine to 6.x.

Now Available
Amazon ElastiCache for Redis 6 is now available in all AWS regions. For a list of ElastiCache for Redis supported versions, refer to the documentation. Please send us feedback either in the AWS forum for Amazon ElastiCache or through AWS support, or your account team.

Channy;