Today, we’re announcing a new capability for Amazon Aurora PostgreSQL that you can use to directly query operational data together with data stored in your data lake in Apache Iceberg and Apache Parquet formats, using your existing PostgreSQL applications and tools. By eliminating the need to extract, transform, and load (ETL) structured data from data lakes into your operational database, you can reduce operational complexity and simplify application development. You can also use Aurora PostgreSQL to query data from data lakes managed in Iceberg REST Catalog (IRC)-compatible catalogs, giving you access to data across a breadth of analytics systems without moving or duplicating it. Whether you’re powering real-time dashboards, enriching transactions with historical context, or building AI agents that reason over both live and archived data, you can now do it all through a single, familiar interface.
Previously, if your application needed to combine recent transactional data in Aurora with historical records stored in Amazon S3, a common approach was to build reverse ETL pipelines that duplicated data, increased infrastructure costs, and required ongoing engineering effort to keep everything synchronized. This challenge only grows as you increasingly embed AI agents into your applications, where it is impractical to predict and pre-replicate every dataset an agent might need.
DuckLabs, the team that maintains the DuckDB project, recently joined Amazon, and this capability is an example of how the efficiency of DuckDB is being integrated into our services. DuckDB is now embedded directly within Aurora PostgreSQL, so you can query live operational data (including uncommitted writes) alongside your data lake in a single query. Query processing stays within Aurora, with no additional network hops and no ETL pipelines that duplicate data. You can query Apache Iceberg tables managed through the AWS Glue Data Catalog, as well as Parquet and Iceberg data stored in Amazon S3 and S3 Tables. You do all of this using familiar PostgreSQL syntax and your existing applications and tools.
We’re excited to bring the speed and simplicity of DuckDB directly into Aurora PostgreSQL, so you and your agents can query and combine operational and Iceberg data using the familiar PostgreSQL applications, tools, and endpoints already in use. By building this capability around DuckDB, future improvements to the open source engine can continue to bring performance and functionality gains to Aurora and other AWS services.
What is new
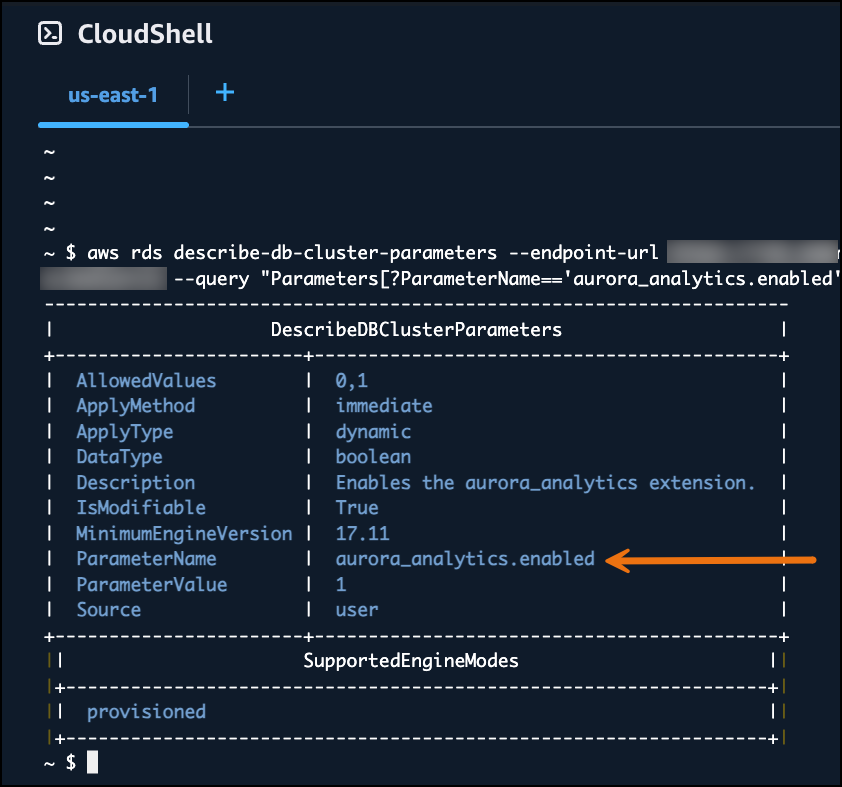
This capability is supported on two Aurora PostgreSQL major versions: 17 (starting with 17.11) and 18 (starting with 18.6). To use it, you create an Aurora PostgreSQL cluster, attach an IAM role with the AuroraAnalytics feature, and enable the aurora_analytics extension. The IAM role is what gives Aurora access to your data in Amazon S3 and the AWS Glue Data Catalog. You then create foreign tables that point to your Iceberg or Parquet data in the data lake, and query them using familiar PostgreSQL syntax. You can complete this setup through the Amazon RDS console, or with any PostgreSQL client such as psql. The process is well documented in the Aurora PostgreSQL documentation.
You can query data across external IRC-compatible catalogs through AWS Glue Data Catalog federation. You register the external catalog once with Glue, and then create foreign tables for the tables you want to query, the same way you would for any Glue-native table. A single query can then join data stored in Aurora with Iceberg tables registered across multiple catalogs, so applications get a unified view without moving data or replacing your existing catalog investments.
Aurora also applies optimizations such as predicate pushdown and column pruning so that only the relevant data is read. This keeps queries efficient even as the underlying data grows. Frequently accessed data is also cached in your Aurora instance, so subsequent queries against the same data return faster. You can inspect this behavior per query using aurora_analytics_stat_statements(), which reports metrics such as rows scanned, bytes read from Amazon S3, and cache hits.
To see how direct querying works, I connected to my Aurora PostgreSQL database using psql and created the extension:
CREATE EXTENSION aurora_analytics;
For my walkthrough, I set up a simple financial scenario. I have a recent_transactions table in Aurora with the last 7 days of customer transactions, and a Parquet file in Amazon S3 containing 5 years of historical transaction data. To make Aurora aware of the historical data, I created a foreign table pointing at the Parquet file in S3:
CREATE FOREIGN TABLE transaction_history ()
SERVER aurora_analytics_server
OPTIONS (
    location 's3://<my-bucket>/finance/transaction_history.parquet',
    format 'parquet'
);
Notice the empty parentheses in the CREATE FOREIGN TABLE statement. Aurora automatically reads the schema from the Parquet file metadata, so you do not need to define columns manually. For workloads with many tables, you can skip creating them one at a time: a single IMPORT FOREIGN SCHEMA statement bulk-creates foreign tables for every Iceberg or Parquet table in an AWS Glue Data Catalog database, inferring schemas automatically.
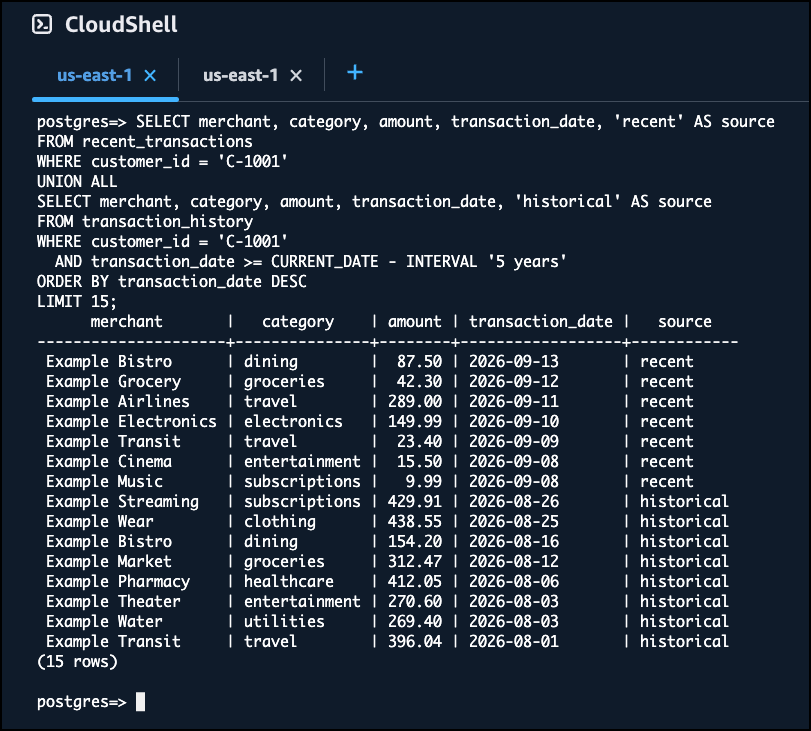
With both tables in place, I ran a single query that combines the recent operational data in Aurora with the historical data in S3:
SELECT merchant, category, amount, transaction_date, 'recent' AS source
FROM recent_transactions
WHERE customer_id = 'C-1001'
UNION ALL
SELECT merchant, category, amount, transaction_date, 'historical' AS source
FROM transaction_history
WHERE customer_id = 'C-1001'
  AND transaction_date >= CURRENT_DATE - INTERVAL '5 years'
ORDER BY transaction_date DESC
LIMIT 15;
The result shows both recent and historical transactions in a single result set. The 7 most recent rows come from Aurora, and the rest come directly from the Parquet file in S3. DuckDB handles the analytical scan of the Parquet data under the hood, while Aurora handles the operational data. That single query would have previously required a pipeline to move the historical data into the database first.
If a query pattern needs single-digit-millisecond latency, you can materialize data from the data lake into a native Aurora PostgreSQL table using familiar commands such as CREATE TABLE AS SELECT, INSERT INTO ... SELECT, or MERGE INTO. The materialized table lives in Aurora and is queried like any other PostgreSQL table, giving you a low-latency path for hot data without operating a separate ingestion pipeline. The read queries can run on any Aurora PostgreSQL instance in your cluster, whether the writer or a read replica, so you can offload analytical scans from your operational workload. The materialization commands write data into Aurora, so they run on the writer instance.
Get started today
Direct querying of Apache Iceberg and Parquet data from Amazon Aurora PostgreSQL is available today in all commercial AWS Regions and AWS GovCloud (US) Regions, at no additional charge. You pay only for the incremental Aurora compute the queries consume and Amazon S3 request costs for reading data lake files.
Today, we’re excited to introduce the newest members of the AWS Heroes program. AWS Heroes are a vibrant, worldwide group of AWS experts who go above and beyond to share knowledge, mentor others, and build thriving communities. These individuals make a real difference in helping developers and organizations succeed with AWS.
This month, we welcome three exceptional community leaders from across the globe, each bringing unique expertise and a deep commitment to empowering builders everywhere.
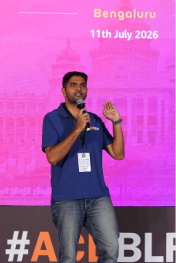
Avinash Shashikant Dalvi – Bengaluru, India
Serverless Hero Avinash Shashikant Dalvi is a tech architect and co-organizer of AWS User Group Bengaluru who is focused on serverless, containers, and production-ready applications on AWS. He has delivered over 40 community talks, publishes the AWS for Product Builders newsletter, and creates technical content covering Amazon ECS, AWS Fargate, AWS Lambda, and AWS Amplify.
Joanne Skiles – Orlando, USA
Serverless Hero Joanne Skiles is an engineering leader and educator with over 16 years of experience building full-stack systems, including serverless architecture and AI systems on AWS. She organizes the Orlando AWS User Group and teaches cloud and AI concepts through her YouTube channel, conference talks, and her podcasts Chaotic Commits and Her Career Unplugged. Joanne is also a professor in the Computer Science department at Rollins College, where she runs the Transparent Systems lab.
Xiaofei Li – Shanghai, China
Community Hero Xiaofei Li is an AWS Golden Jacket holder and is an active community leader in the Greater China Region, leading the Kiro, Amazon Quick, and Tokyo Chinese AWS communities. He founded the Kiro Chinese User Community (5,000+ members) and initiated the Chinese localization of AWS Builder Cards across 15 cities and 3,000+ participants. Xiaofei also mentors underserved students and supports Women in Tech initiatives.
Learn More
Visit the AWS Heroes webpage if you’d like to learn more about the AWS Heroes program, or to connect with a Hero near you. To learn more about how to get involved with the AWS community, visit our AWS Builder Center.
AS/400 business rule extraction no longer requires months of manual effort. With Kiro, an agentic AI-powered development environment (spanning IDE, CLI, web, and mobile surfaces, along with the Kiro Crew workspace), you can compress the process into days. This step-by-step guide walks through the approach. Organizations face a common challenge: critical business logic embedded in extensive RPG and COBOL code bases, often maintained by a declining number of developers and subject matter experts (SMEs) with RPG expertise. The fulfillment rules and shipping logic are scattered across interconnected programs that no single person fully understands.
In this post, we walk you through a step-by-step approach for using Kiro to extract business rules from AS/400 RPG and COBOL programs, generate technical specifications, and produce modernization-ready documentation.
Extraction process challenges
Before this engagement, one of our customers faced several challenges with their existing business rules extraction process. They were planning to modernize their AS/400 order fulfillment workflow, which handled inventory validation, shipping document generation, and warehouse operations.
Significant consulting costs for specialized AS/400 consultants.
Time-intensive manual analysis, typically 4–6 weeks of dedicated effort.
Documentation that becomes outdated before the team finishes writing it.
Risk of overlooking critical business logic during modernization.
The following is the sample system flow considered to walk through the step-by-step guide.
PROG001 (Interactive Validation)
   │  Validates orders, checks inventory, resolves periods
   ▼
PROG002 (Batch Control)
   │  Manages batch processing of validated orders
   ▼
PROG003 (File Management)
   │  Handles file splitting for large shipment batches
   ▼
PROG004 (Content Generation)
   │  Generates shipping manifests, allocates stock by warehouse priority
   ▼
PROG005 (Encoding and Transmission)
Converts EBCDIC to UTF-8, transmits to external Carrier Gateway
Each program has embedded business rules, including order validation and stock allocation with warehouse priority. These programs also handle shipping weight calculations, character encoding conversion, and integration with external carrier systems. Traditional analysis would have taken 4–6 weeks per system. The effort required across consultants, technical writers, and reviewers would have been 40–80 person-hours per system.
Solution
With Kiro, an agentic AI-powered development environment, you can extract comprehensive business rules, generate technical specifications, and create modernization-ready documentation in hours, not months (as detailed in the Outcomes section).
Working autonomously across your code base, Kiro analyzes dependencies, traces execution paths, and produces detailed documentation.
The approach relies on two core Kiro capabilities:
Steering files: Persistent instructions that guide the AI’s behavior, including project context, naming conventions, analysis standards. Configure them once and they apply to all subsequent sessions. Steering files can reference documentation templates that define the exact output format. Each subsequent analysis follows the same repeatable structure.
Specs: A structured way to define requirements, design, and implementation tasks. Kiro executes tasks autonomously with progress tracking. Spec tasks tell Kiro which templates to use and where to save the output.
The workflow has three phases:
Phase 1 – Configure steering files to define project context, directory structure, and technical standards. Examples include “extract 10–20 lines of code context around business rules” and “map abbreviated DDS field names to business terms.” Create documentation templates that the steering files reference. These templates specify the exact output format for business rules with code snippets, pseudocode equivalents, DDS field mappings, and integration specifications.
---
inclusion: always
---
# AS/400 Business Rule Extraction Project
## Goal
Analyze a legacy AS/400 order fulfillment system and extract all business
rules to produce modernization-ready documentation. Discover the program
workflow, data architecture, and business logic by reading the source code.
## Source File Locations
- sourcefiles/rpg/ — RPG IV programs (.RPGLE)
- sourcefiles/cl/ — CL programs (.CLLE)
- sourcefiles/dds/ — DDS definitions: physical files (.PF), logical files (.LF), display files (.DSPF)
- sourcefiles/data/ — DB2 table exports (.csv), one per physical file
## What to Discover
- What each program does and how they relate to each other (trace CALL statements and SBMJOB commands)
- Which files each program accesses and how (read the F-specs at the top of each RPG program)
- Business rules embedded in RPG subroutines (validation, processing, calculation logic)
- How configuration tables drive runtime behavior (trace CHAIN lookups and conditional branching)
- External system integration points (identify calls to programs outside this codebase)
- Data flow between programs (trace parameters passed via CALL/PARM and shared files)
- The meaning of cryptic DDS field names (map them to business terms using TEXT keywords and program context)
## What to Produce
- Business rules with original RPG code snippets (10-20+ lines of context)
- Pseudocode equivalents for every business rule
- DDS field-to-business-term mappings for all physical files
- File dependencies matrix (which programs access which files and how)
- Inter-program parameter passing documentation
- Configuration-to-behavior mapping (trace config table values to subroutine invocations)
- Integration specifications for any external system calls
Use the template at templates/Technical_Implementation_Spec.md for output format.
Save all generated documentation to the output/ directory.
## Constraints
- Analysis only — never create executable programs or modify source files
- Read-only operations on all source files
- Every business rule must trace back to specific program, subroutine, and line numbers
- Discover the system's behavior from the source code — do not assume what the programs do
Figure 1: Steering files provide persistent instructions that guide the analysis behavior of Kiro across sessions, configured once and applied to subsequent analyses
Phase 2 – Build a Kiro Spec with discrete, actionable tasks: analyze source files, parse DDS definitions, extract business rules, generate pseudocode, create consolidated documentation using the templates, and verify business rules against source code.
# Implementation Plan: AS/400 Business Rule Extraction
## Overview
This implementation plan extracts business rules and technical specifications from a legacy AS/400 order fulfillment system. The analysis workflow reads RPG programs, CL programs, and DDS file definitions to discover business logic, data architecture, program workflows, and integration points. All findings will be documented using the provided template and saved to the output directory.
## Tasks
- [ ] 1. Analyze DDS physical and logical file definitions
- Read all .PF files in sourcefiles/dds/ and extract field definitions (name, type, length, decimals, TEXT, COLHDG, VALUES)
- Read all .LF files and document key structures and access paths
- Read any .DSPF files and document screen layouts and field mappings
- Map every cryptic field name to a business term using TEXT keywords, column headers, or literal values
- Document key structures and file relationships (which LF belongs to which PF)
- Save intermediate analysis to output/
- [ ] 2. Analyze each program and extract business rules
- Read all RPG programs (.RPGLE) in sourcefiles/rpg/
- Read all CL programs (.CLLE) in sourcefiles/cl/
- For each program, extract F-spec file declarations with access modes
- Identify all subroutines and document their boundaries (line numbers)
- Extract business rules from subroutines, mainline code, and CL logic
- Include 10-20+ lines of original source code context for each rule
- Generate pseudocode equivalents using common programming constructs
- Categorize each rule (validation, processing, calculation, error handling, integration)
- [ ] 3. Map the program workflow and data flow
- Trace all CALL statements and SBMJOB/QCMDEXC invocations across programs
- Document parameters passed at each inter-program call point
- Build the complete program-to-program workflow chain
- Document how data flows between programs via shared files and parameters
- Map logical file usage back to underlying physical files
- [ ] 4. Analyze configuration-driven behavior
- Identify patterns where programs CHAIN to a table and branch based on values read
- Read the CSV data exports in sourcefiles/data/ to see current configuration values
- Trace each configuration value to the code path it triggers
- Flag any inactive or dead configuration entries
- Produce a configuration-to-behavior mapping
- [ ] 5. Document integration specifications
- Identify all calls to programs outside this codebase
- Document parameters, data formats, and protocols for each external interface
- Document any character encoding conversions (CCSID values and transformations)
- Document file paths, naming conventions, and transmission mechanisms
- [ ] 6. Generate consolidated Technical Implementation Specification
- Load the template from templates/Technical_Implementation_Spec.md
- Populate all template sections with the analysis from tasks 1-5
- Include business rules with original code snippets and pseudocode
- Include DDS field mappings, file dependencies, configuration mappings, and integration specs
- Ensure every claim traces to specific program, subroutine, and line numbers
- Save to output/
- [ ] 7. Validate documentation completeness and accuracy
- Verify all programs have been analyzed
- Verify all DDS physical files have field-to-business-term mappings
- Verify all business rules have both source code snippets and pseudocode
- Verify all inter-program calls are documented with parameters
- Verify the consolidated document follows the template structure
- Cross-check source code references for accuracy (correct line numbers)
## Notes
- This is a read-only analysis workflow — no source files will be modified
- Every business rule must trace to specific program, subroutine, and line numbers
- DDS field mappings use TEXT keywords, COLHDG, and VALUES to determine business terms
- Configuration-driven behavior is identified by CHAIN + conditional branching patterns
- All generated documentation will be saved to the output/ directory
- The template at templates/Technical_Implementation_Spec.md defines the output format
## Task Dependency Graph
```json
{
  "waves": [
    { "id": 0, "tasks": ["1"] },
    { "id": 1, "tasks": ["2", "3"] },
    { "id": 2, "tasks": ["4", "5"] },
    { "id": 3, "tasks": ["6"] },
    { "id": 4, "tasks": ["7"] }
  ]
}

```
Figure 2: The Kiro Spec, showing discrete tasks that Kiro executes autonomously with progress tracking
Phase 3 – Execute the Spec and let Kiro work autonomously. Monitor progress as tasks complete, then review the generated documentation.
Important: AI-extracted rules should be reviewed by an AS/400 SME. Automated extraction might occasionally misinterpret complex or ambiguous business logic, so human validation remains essential before acting on extracted rules.
Here’s an example of what Kiro produces. Given this RPG subroutine that validates orders against the master file, Kiro generates a plain-language business rule and its pseudocode equivalent:
Rule 1.3.16: Stock Allocation
Category: Processing Subroutine: ALLCST (lines 3820-3960) Description: Allocates stock from warehouse inventory. Looks up inventory by item key, verifies sufficient available quantity, then decrements available quantity and increments reserved quantity by the order amount. Updates the inventory record.
Source Code (lines 3820-3960):
   3820      C     ALLCST        BEGSR
   3830      C     ITEMKY        CHAIN     INVSTCK1                           42
   3840      C     *IN42         IFEQ      '0'
   3850      C     QTYAV         IFGE      ORDQTY
   3860      C     QTYAV         SUB       ORDQTY        QTYAV
   3870      C     QTYRS         ADD       ORDQTY        QTYRS
   3880      C                   UPDATE    INVFMT
   3890      C                   Z-ADD     0             ALLERR            1 0
   3900      C                   ELSE
   3910      C                   Z-ADD     1             ALLERR
   3920      C                   END
   3930      C                   ELSE
   3940      C                   Z-ADD     2             ALLERR
   3950      C                   END
   3960      C                   ENDSR
Pseudocode:
function allocateStock():
    inventory = findByKey(InventoryStock, itemKey)
    if inventory found:
        if inventory.quantityAvailable >= orderQuantity:
            inventory.quantityAvailable -= orderQuantity
            inventory.quantityReserved += orderQuantity
            update inventoryStock
            allocationError = 0 // OK
        else:
            allocationError = 1 // Insufficient stock
    else:
        allocationError = 2 // Item not found
Figure 3: Kiro extracts business rules with original RPG code, pseudocode equivalents, and plain-English descriptions
The following is the DDS field mapping that translates abbreviated AS/400 field names into business terms:
1.1 ORDERMST — Order Master
Field
Type
Length
Dec
TEXT (Business Term)
COLHDG
VALUES
Used By
ZIORCD
A
8
—
Order Code
Order / Code
—
PROG001, PROG002, PROG003, PROG004
ZIPERD
P
6
0
Fulfillment Period
Fulfill / Period
—
PROG001
CURPER
P
6
0
Current Period
Current / Period
—
PROG001
STATUS
A
1
—
Order Status
Order / Status
‘A’ ‘H’ ‘C’ ‘X’ ’ ’
PROG001, PROG002
CUSTNAME
A
40
—
Customer Name
Customer / Name
—
PROG001, PROG002, PROG003, PROG004
WHSCD
A
4
—
Warehouse Code
Warehouse / Code
—
PROG001, PROG002, PROG003, PROG004
ORDDTE
P
8
0
Order Date
Order / Date
—
PROG001
ORDQTY
P
7
0
Order Quantity
Order / Quantity
—
PROG001
SHPTYP
A
2
—
Shipment Type
Shipment / Type
—
PROG001
PRIORT
A
1
—
Priority Code
Priority
‘1’ ‘2’ ‘3’
PROG001
Record Format: ORDERMST — TEXT(‘Order Master Record’)
Key: ZIORCD (unique)
STATUS Values: A = Active, H = Hold, C = Complete, X = Canceled, ’ ’ = New/Blank
Figure 4: DDS field mapping translates abbreviated AS/400 field names into business terms
This mapping is essential for modernization. Without it, developers building the replacement system are guessing at what Z1ORDCD means.
Deployment
The following steps walk you through setting up and running the extraction workflow.
Prerequisites
Before you begin, make sure that you have the following in place:
Kiro installed on your workstation (download from https://kiro.dev/).
Access to the AS/400 source code you plan to analyze (RPG/RPGLE, CL/CLLE, and DDS definitions), exported as text files.
Optionally, DB2 configuration tables exported to CSV for configuration-driven behavior analysis.
Familiarity with your organization’s business domain, plus access to an AS/400 SME to validate the extracted rules.
A local project directory where Kiro can read the source files and write generated documentation.
The complete setup is available in the companion GitHub repository listed in the Resources section. This includes steering files, templates, sample AS/400 source code, and Spec definitions.
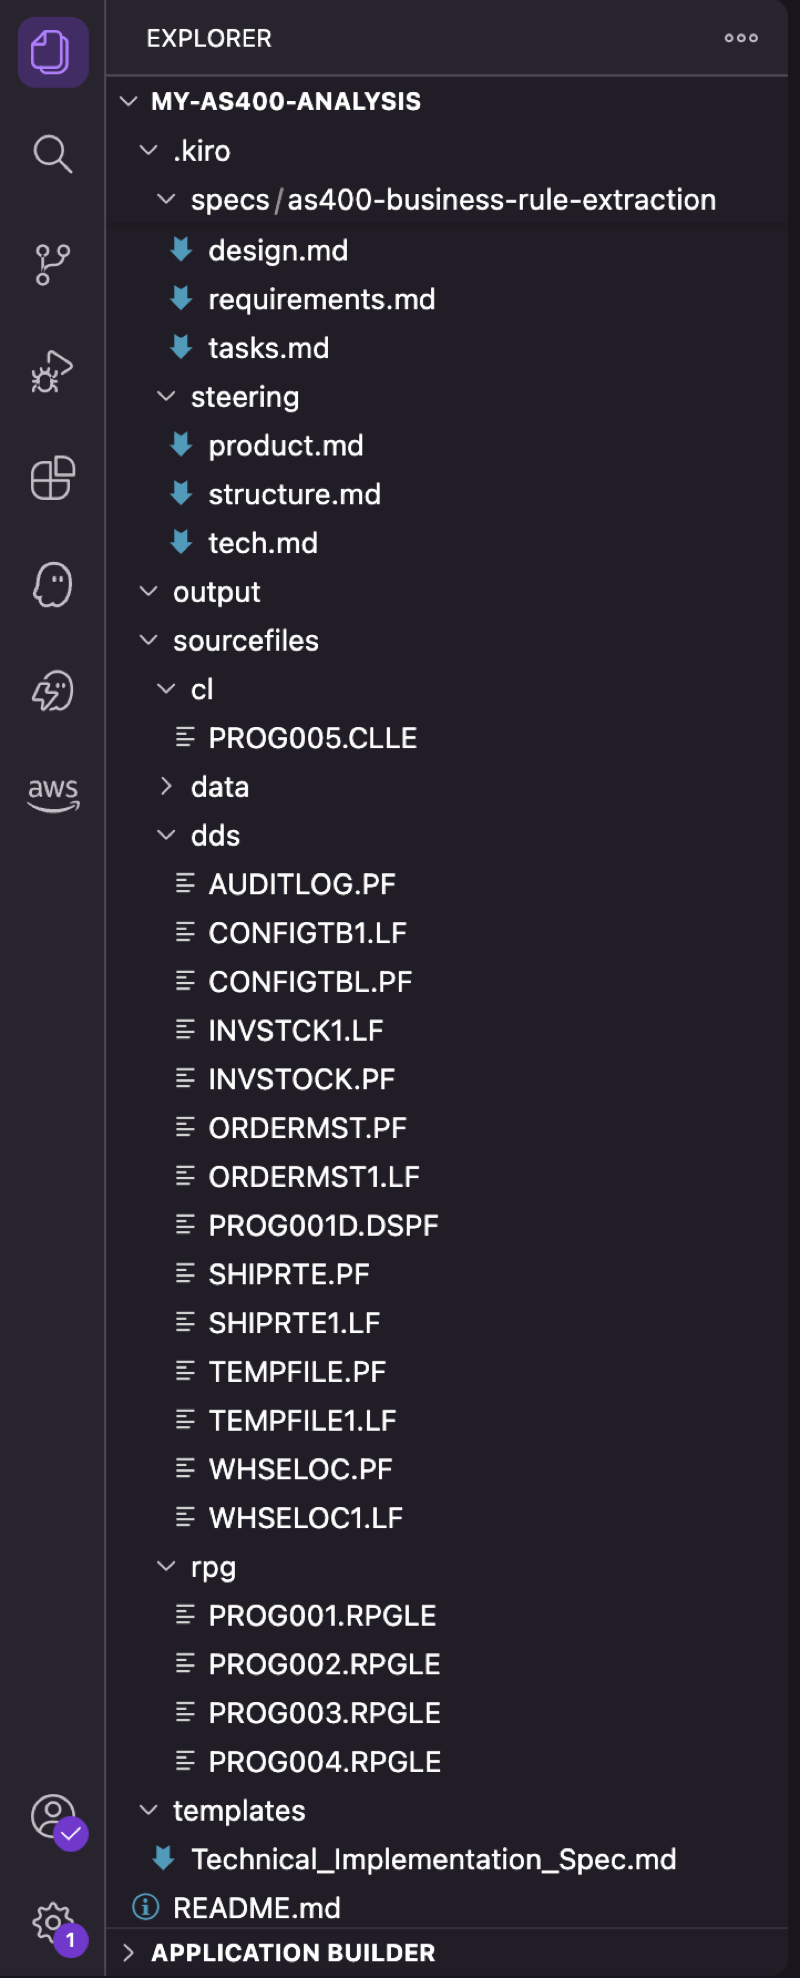
Figure 5: Project structure in Kiro, showing source files, steering configuration, templates, and output directory
The setup has five steps:
Step 1: Project setup
Create the directories that you will be working from for source files, data, output, and other artifacts:
Create steering files to define your analysis standards. For example, .kiro/steering/product.md:
# Project Context
This project analyzes AS/400 RPG and COBOL programs to extract business rules.
# Analysis Standards
- Extract 10--20+ lines of code context around each business rule
- Map abbreviated DDS field names to business terms
- Document inter-program dependencies and parameter passing
- Identify configuration-driven behavior patterns
Step 3: Add your source files
Copy your AS/400 source code into the sourcefiles/ subdirectories: RPGLE files in rpg/, CLLE files in cl/, and DDS definitions in dds/. Optionally, export DB2 tables to CSV in sourcefiles/data/ for configuration table analysis if you have programs with conditional logic that use those tables to hold runtime configuration options.
Step 4: Create a Kiro Spec
In Kiro, use the command palette: Create New Spec. Define tasks like:
Example Spec definition:
Spec Name: AS/400 Business Rule Extraction
Task 1: Analyze DDS physical and logical file definitions in sourcefiles/dds/
Task 2: For each RPG program in sourcefiles/rpg/, extract business rules with 10--20 lines of surrounding code context
Task 3: Map DDS field names to business terms using templates/field-mapping-template.md
Task 4: Document inter-program data flow and parameter passing
Task 5: Generate consolidated Technical Implementation Specification using templates/tis-template.md
Task 6: Validate that all extracted rules reference valid source line numbers
Step 5: Execute
Open the Spec in Kiro, choose Start, and monitor progress as tasks complete autonomously. Review the generated documentation in the output/ directory.
For detailed instructions, templates, and example outputs, see the GitHub repository.
What the workflow looks like
Figure 6: Kiro executing the Spec, with real-time progress as each task completes
When you execute the Spec, Kiro processes tasks in sequence with real-time progress tracking. Here is what happens during execution:
Opening the Spec with all tasks listed.
Kiro autonomously reading RPG source files and DDS definitions.
Business rules being extracted with code snippets and pseudocode.
DDS field names being mapped to business terms.
The final consolidated documentation in the output directory.
Outcomes
This section summarizes the measured results from the customer engagement described earlier in this post (a five-program AS/400 order fulfillment system with approximately 40,000 lines of RPG/COBOL). Traditional estimates sourced from the customer’s prior modernization planning documents. Results vary by code base complexity.
Time and effort savings
Using Kiro reduced both elapsed time and total person-hours by an order of magnitude compared to the customer’s traditional manual approach. The following table compares the two approaches:
Metric
Traditional Approach
Kiro-Assisted
Savings
Total effort
40-80 person-hours
12 person-hours
70-85% reduction (measured against the customer’s planning estimates)
Timeline
4-6 weeks
3 days
~90% reduction (measured against the customer’s planning estimates)
Breakdown of Kiro-assisted effort
The 12-hour total breaks down as follows, showing that most of the time is spent on human review rather than setup or execution:
Setup (steering + templates + spec): 2 hours.
Kiro autonomous execution: 30 minutes.
Review and validation: 9.5 hours (reflective of iterative refinement of steering, template, spec, and execution).
Total: approximately 12 hours per system of 5 programs with approximately 40,000 lines of code (measured during the customer engagement described earlier in this post).
What Kiro produced
Kiro autonomously generated a complete documentation package for the five-program system, including:
Business rules catalog with original RPG code snippets and pseudocode equivalents.
DDS field-to-business-term mappings across seven physical files.
File dependencies matrix showing which programs access which files.
Integration specifications for the external carrier gateway (CCSID conversion, transmission parameters).
Over 50 pages of structured, template-aligned documentation (measured output from this engagement).
Multiplier effect
The setup cost (templates, steering, Specs) is one-time and is not repeated for additional systems. The following projections extrapolate the per-system effort (approximately 10 hours) from the single-system measured results and add the one-time setup only once:
Scale
Traditional
Kiro-Assisted
Savings
1 system
40-80 hrs / 4-6 weeks
12 hrs / 3 days
28-68 hrs
10 systems
400-800 hrs / 40-60 weeks
102 hrs / 30 days
298-698 hrs
Key quality improvements
Consistent, template-driven output across every system analyzed.
Exact line number references back to source code for every business rule.
Cross-referencing between DDS definitions and RPG program usage alleviates guesswork.
Reusable templates and Specs can often be reused for similar systems with minimal reconfiguration.
Conclusion
Legacy AS/400 business rule extraction doesn’t need to take months. With the steering files and Specs in Kiro, you can extract business logic from RPG code bases and produce developer-ready documentation in days.
You still need AS/400 knowledge, business context, and architectural judgment to validate, prioritize, and plan the modernization. But you don’t need to spend months manually reading code and writing specifications. With Kiro handling extraction, you can focus on strategy and decision-making.
If you have questions or want to share your experience, leave a comment on this post. If you’re an AWS customer working on AS/400 or mainframe modernization, reach out through your AWS account team.
A lot has happened in the KDE
Plasma desktop environment in the last year. Marco Martin, a KDE contributor
who spends most of his time working on Plasma, took the stage at Akademy 2026 in Graz, Austria to give
an update on Plasma’s major new features, some of the minor-but-interesting
ones, and a preview of what’s coming soon. The biggest upcoming change, dropping
X11 support from Plasma, has been well-advertised; but there are also plans
afoot to further improve remote-desktop support and more.
On September 30, 2026, Cisco published a security advisory for CVE-2026-76504, a critical API authentication bypass vulnerability affecting Cisco Catalyst SD-WAN Manager. The vulnerability has a CVSSv3.1 score of 9.8 and results from improper handling of URL encoding (CWE-177). An unauthenticated, remote attacker can send a crafted HTTP request that bypasses an authentication rule for a specific API endpoint, gaining access to the API with the privileges of the admin user.
According to Cisco, CVE-2026-76504 is being actively exploited in the wild; Cisco PSIRT became aware of the activity in September 2026. Cisco Catalyst SD-WAN Manager systems with ports exposed to the internet are at risk of compromise. The vulnerability affects the product regardless of system configuration, and Cisco has not provided a workaround, however vendor supplied updates are available. Rapid7 strongly recommends that organizations upgrade affected systems to a fixed release on an emergency basis, outside of normal patch cycles, and investigate internet-facing systems for signs of exploitation.
Cisco Catalyst SD-WAN Manager was also affected by two critical, unauthenticated peering authentication flaws earlier in 2026: CVE-2026-20127 and Rapid7-discovered CVE-2026-20182. Both were distinct issues in the vdaemon service and similar parts of its networking stack. CVE-2026-76504 targets a separate API authentication path, but the recurrence of authentication bypasses in internet-facing Catalyst SD-WAN control components reinforces the need for emergency remediation.
Mitigation guidance
Cisco has released software updates that remediate CVE-2026-76504. Organizations running affected instances of Cisco Catalyst SD-WAN Manager should upgrade to an appropriate fixed release listed below without waiting for a regular patch cycle:
Cisco Catalyst SD-WAN Software release
First fixed release
Earlier than 20.9
Migrate to a fixed release
20.9
20.9.10.1
20.12
20.12.8.2
20.15
20.15.6.1
20.18
20.18.4.1
26.1
26.1.2.1
26.2
26.2.1
Cisco has addressed the vulnerability in the cloud-based Cisco SD-WAN Cloud (Cisco Managed) release 20.15.605, and indicates that no customer action is required for that service.
There are no workarounds. As a temporary mitigation, Cisco recommends that on-premises customers prevent access to the system from unsecured networks. If internet access is required, restrict access to known, trusted hosts and protect Cisco Catalyst SD-WAN control components behind a filtering device. Cisco indicates that this mitigation is already deployed in Cisco Catalyst SD-WAN Cloud Hosted environments. Organizations should apply updates even when the mitigation is in place.
Because active exploitation has occurred, Rapid7 strongly recommends that organizations audit affected systems for compromise. For help assessing a potentially compromised system, Cisco customers may open a Severity 3 TAC case with CVE-2026-76504 in the title and provide an admin-tech file generated with the request admin-tech command.
For the latest mitigation guidance and release compatibility information, please refer to the vendor’s security advisory.
Rapid7 customers
Exposure Command, Vulnerability Management, and Nexpose
Exposure Command, Vulnerability Management, and Nexpose customers can assess exposure to CVE-2026-76504 with vulnerability checks expected to be available in the October 1 content release.
Indicators of compromise
Cisco recommends reviewing the following logs for requests related to j_security_check from unknown or unauthorized IP addresses:
/var/log/nms/containers/service-proxy/serviceproxy-access.log: Requests with an encoded character in the j_security_check path, such as POST /%6a_security_check HTTP/1.1.
/var/log/nms/vmanage-server.log: Requests to j_security_check associated with usernames beginning with viptela-reserved-.
The %6a value, which URI-encodes the character j, is only an example. According to Cisco, an attacker can exploit the vulnerability by encoding any single character in the request. The vendor cautions that these log entries can also occur during standard operations and should be evaluated against normal network posture to avoid false positives.
The 2026 Python Language Summit was held on July 14 in Kraków, Poland;
there is now a
series of reports available on the topics that were discussed there.
They include the memory buffer protocol, garbage collection, free-threaded
Python, and “Spicycrab”.
Higher education faces a difficult security equation. Universities hold large volumes of sensitive student, financial, health, and research data while supporting open networks, distributed users, legacy infrastructure, and increasingly complex cloud environments. Attackers have taken notice, and the pressure on security teams continues to grow.
In Q2 2025, universities faced an average of 4,388 cyberattacks per organization per week, up 24% from the same period in 2024. Nine in ten universities reported experiencing a breach or security incident during the previous 12 months, while the average cost of a data breach in education reached $10.22 million. Confirmed attacks against higher education institutions exposed more than 3.9 million records in 2025, with ransomware continuing to disrupt teaching, research, financial aid, and administrative operations.
Those figures are concerning on their own, but they only explain part of the problem. For university systems with multiple campuses, the way security is organized can create an additional layer of risk.
Why is higher education so difficult to secure?
Universities operate differently from most commercial organizations. Open access, collaboration, and academic freedom are central to their mission, which means security teams must protect environments where students, faculty, researchers, guests, and third parties connect from almost anywhere.
That openness sits alongside an unusually broad mix of sensitive data. A single university may hold student PII, financial aid and tax records, health information, proprietary research, government-funded projects, and intellectual property. Many institutions also rely on legacy systems that have been connected over time to modern cloud applications, APIs, learning platforms, and research networks, creating visibility gaps that can be difficult to manage.
Resource pressure adds to the challenge. The draft cites 94% of higher education IT leaders as saying they lack enough personnel to defend their environments adequately, leaving relatively small teams responsible for sprawling networks with large numbers of users, devices, applications, and third-party services.
For multi-campus university systems, many of these pressures are compounded by decentralized security operations. Individual campuses often maintain their own infrastructure, security tools, teams, incident response processes, vendor relationships, and renewal cycles.
The result can be limited visibility across the wider institution. If ransomware is detected at one campus, teams elsewhere may have no immediate view of the same attacker activity. If a zero-day is exploited in one research environment, another campus may remain exposed because the intelligence and response process stay local.
Fragmentation also affects efficiency. When each campus independently buys, deploys, and manages its own security stack, the wider university system can carry duplicated costs, additional management overhead, and inconsistent coverage. Fragmentation can also slow the spread of threat intelligence across a university system. If one campus detects a new attack pattern, an unusual intrusion technique, or previously unseen malware, that insight may remain local rather than reaching security teams elsewhere in time to act. A suspicious login sequence identified at Campus B, for example, could be the early signal of activity already moving toward Campus A or Campus C, but without shared visibility each team may investigate the same threat independently and at different speeds.
The same problem can appear during vulnerability response. If one campus confirms active exploitation of a newly disclosed vulnerability in a research environment, another campus may still be exposed because patching decisions, asset inventories, and remediation workflows are managed separately. What should become a system-wide priority can remain a local incident until someone connects the dots.
Attackers do not necessarily respect those organizational boundaries. A smaller or less-resourced campus can provide an entry point into relationships, systems, and data connected to the wider institution, while defenders may still be working with a campus-by-campus view.
What should university systems change?
Higher education security needs to preserve the autonomy individual campuses require while improving visibility and coordination across the broader institution.
That means giving security teams a shared view of exposure, threats, and active incidents across campuses, along with the ability to coordinate detection and response when activity in one part of the university may affect another. It also creates an opportunity to reduce duplicated tooling and processes, share threat intelligence more effectively, and make better use of limited security resources.
The objective is a model where a local security team can continue managing the needs of its own campus without losing access to the wider context of what is happening across the university system.
As the threat landscape becomes more connected, higher education security architecture needs to become more connected with it.
In Part 2 of this series, we’ll look at another pressure making that shift more urgent: the growing compliance burden across FERPA, GLBA, HIPAA, and CMMC, and why fragmented security can make regulatory readiness harder to manage across a university system.
Rapid7 helps more than 11,000 organizations worldwide take command of their security. Learn more at rapid7.com/sled.
Sharon Yang is a Chromium developer who worked at Google on the browser
and now works on it at Igalia. On the final day of FOSSY 2026, she gave a
presentation on her experiences with both of those companies, comparing and
contrasting the ways the each operates and how that affects work on the
code base. She enjoyed working at Google and feels the same about Igalia,
so the talk was not aimed at complaints—instead it was meant to give a feel
for two companies that are rather different.
The election for members of the Linux Foundation Technical Advisory Board
will be held electronically after the close of the upcoming Linux Plumbers Conference. The call for
candidates is is open, with a nomination deadline of October 7.
There are five seats to fill this time, including the one vacated by the
unfortunate passing of Dan Williams.
Serving on the TAB is a good way to help the kernel-development community.
Please see this article from last year for
an overview of what the TAB does and why membership is rewarding, then
consider putting in your nomination.
This week, Cloudflare's Impact programs will reach $100 million in donated services. It's a significant milestone, and one that we are proud of because it means that thousands of organizations, like journalism outlets, civil society, state and local governments, election management bodies, and public schools are being protected from cyberattacks.
But Cloudflare's Impact programs have never been about philanthropy. They are a fundamental part of our business and our mission, and they continue to help guide almost everything we do.
As we celebrate this milestone and our 16th Birthday Week, we wanted to revisit not only how we got here, but also how our Impact programs continue to grow and evolve to help those working for the public interest.
Free → Impact
Cloudflare started as a free service. The original idea was to provide a basic version of our services to developers and small businesses for free, and then use the data about cyberattacks on their websites to build more sophisticated products that we could sell.
However, we quickly discovered that some of our free customers were not only doing essential work, like reporting on corruption in Africa or on the Russian invasion of Crimea, but also experiencing some of the largest attacks on our network. That realization changed how we thought about our free services. We committed not only to making them available for free for everyone, but also to doing more for organizations being targeted by powerful adversaries simply for serving the public.
Cloudflare launched Project Galileo in 2014 to provide more advanced security services for important but vulnerable people and organizations online, including journalists, human rights defenders, and civil society groups. Today, the program includes more than 3,500 domains in over 120 countries. In 2025, Cloudflare blocked more than 38.5 billion DDoS, website vulnerability, email phishing, and other cyberattacks against Project Galileo participants, almost 105.4 million per day.
Over the last 12 years, Cloudflare has continued to expand what we now call our Impact programs. Although each program is unique, our goal is the same: to support organizations and institutions serving the public, particularly those that would not otherwise have access to the necessary cybersecurity services. For example:
The Athenian Project (2017): Supporting state and local governments operating democratic elections, which includes more than 440 websites in 33 U.S. states. We later expanded that program outside the United States and now protect election management bodies in eight countries, including Canada, North Macedonia, Georgia, and Moldova.
Cloudflare for Campaigns (2020): Partnering with Defending Digital Campaigns to provide free cybersecurity services for candidates for public office, which now includes more than 530 websites across the United States.
Helping keep these organizations online by protecting their websites and internal data remains essential. In 2026, Cloudflare released its first annual report on cyberattacks against civil society, which found that civil society organizations are targeted more frequently and more intensely than other Cloudflare customers. For example, Project Galileo participants faced attempts to exploit security vulnerabilities in websites at a rate more than seven times higher than an average user. Cloudflare is also on pace to more than double the number of applications to Project Galileo from last year.
But Cloudflare's Impact programs have never been static; they evolve alongside our company and technology, and the organizations they serve. Increasingly that means not just defending public interest organizations, but empowering them to adapt and thrive in the era of AI.
Looking to the future
In early September 2026, on a rainy day in Barcelona, Cloudflare co-hosted a hackathon. Because our developer platform is such an important part of our business, we hold these events all the time. But this one was different: instead of a room full of software engineers or startup founders, it was the first time we held an event specifically for journalists.
Media Party hackathon co-hosted by Cloudflare at the BIT Habitat in Barcelona (September 9, 2026).
The event was part of a three-day conference organized by Media Party, a nonprofit dedicated to media innovation through digital tools. The event was designed to bring together journalists, developers, and strategists to solve a single problem: how to help newsrooms adapt to an AI-driven, post-search information landscape. The sprint focused on four themes: workflow automation, agentic journalism, synthetic-content verifications, and information integrity.
Each team received free access to Cloudflare's developer platform and the assistance of volunteer Cloudflare engineers to see what they could build in a day.
Four teams made it to the final round. The winning team, AIdas, built a tool that helps researchers and journalists study AI bias across politically contested topics by comparing how different LLMs answer the same question, and recording their responses as open data.
The hackathon was just one part of a broader effort across Cloudflare Impact to expand beyond cybersecurity services to help public interest groups adapt to a changing world:
Protecting Local News from AI Crawlers: Last year, Cloudflare provided free access to our Bot Management and AI Crawl control for Project Galileo participants, including more than 750 journalists, independent news organizations and non-profits supporting news-gathering around the world. These tools will help these organizations understand and control how their content is accessed by AI crawlers, and safeguard their reporting from unauthorized scraping.
Non-profit startups: Last year during Birthday Week, Cloudflare announced its startup program, which provides more than $250,000 in Cloudflare credits, would be available for the first time for non-profit organizations. This week we will announce the first 30 organizations accepted into the program and how they are serving their communities with tools built on our developer platform.
Automation tools for human rights: This week we will also announce three new projects that Cloudflare engineers have built using our developer platform for three leading human rights organizations, covering topics including tracking transnational repression, digital rights legislation and policy development, and corporate human rights due diligence.
Across all of these new efforts, the goal remains the same: to help organizations doing essential work access the tools and support they need to continue to advance their missions.
Join Us
I had the opportunity to meet with two of the Cloudflare engineers who volunteered at the hackathon in Barcelona. They both mentioned to me that one of the reasons they came to work at Cloudflare was Project Galileo, and the chance to use their skills to help organizations working in their communities.
It was an important reminder that Cloudflare's Impact programs and our mission are not just things we have done. They continue to shape our identity, including through the people who choose to come work with us.
If that sounds like the kind of work you want to do, come join us.
From our conversations with companies at every stage of their AI adoption journey, we've seen some common patterns. First, there is an exploration period as you bring on every new tool, dole out API keys freely, and let the tokens flow. Then, you converge on the canonical tools for your organization for agentic coding, for non-technical workflows, for running and deploying agents. As companies formalize their AI adoption, they want to manage and oversee token spend for users, but budgets and rules only go so far. The best savings are the ones users never notice.
Today, we are releasing Cloudflare's Auto Router in public beta, available through AI Gateway. Set your model to cloudflare/auto and the Auto Router will automatically route each request to a model that is capable enough for the task, without requiring an end user to think about model selection. Our early results using the Auto Router internally through our OpenCode harness show a cost savings of up to 30% when compared to using only frontier models like OpenAI Sol and Anthropic Claude Opus.
Why we built this
From our own experience tracking AI spend at Cloudflare, we’ve learned managing costs requires a multipronged approach. Previously, we talked about how to set budgets and limits around AI spend, and how to see who is spending across your organization by linking employees to their AI usage.
In many harnesses, including OpenCode, Claude Code, and Codex, individual users still select models manually. Of course, not all tasks are created equal, and often individuals end up using models that are overkill for their work. For example, you don't need Opus-level intelligence if you're looking to summarize an email or chat threads. However, you wouldn't want to block that model completely from your security engineering team.
Our goal is for AI Gateway to be the control plane for organizations deploying AI internally. Because every request from every user, agent, and tool already flows through it, AI Gateway is in a unique position to do more than observe and enforce. Budgets, spend limits, and identity-aware analytics give organizations visibility and guardrails, but they still rely on individuals to make cost-conscious choices request by request. The next step is for the gateway itself to make intelligent decisions on a user's behalf: sending each request to a model that is capable enough for the task. That way, organizations reduce spend automatically, while users keep access to the most capable models when their work actually needs them.
The results
We use Auto Router internally at Cloudflare within our OpenCode deployment and within Cloudflare OS, our custom agent harness. In our internal usage, we’ve seen results comparable with frontier models for coding tasks.
Auto Router does best when used across a wide range of knowledge-work tasks, like those typically found in a large organization with work spanning both technical and non-technical teams. We evaluated cloudflare/auto against OpenAI’s GPT-6 Sol and Anthropic’s Claude Opus 5.5 on our internal general knowledge work benchmark. The benchmark uses simulated workspace tools and covers common day-to-day workflows across email, calendars, Slack, files, travel and finance. Each task requires the model to use these tools to produce a verifiable answer or complete an action.
Model
Successful Trials
Success Rate
Total Cost
Cost per success
cloudflare/auto
252/291
86.6% (+6.2/−6.9 pp)
$2.10
$0.0084
Anthropic Claude Opus 5.5
281/291
96.6% (+2.7/−3.8 pp)
$5.91
$0.0210
OpenAI GPT-6 Sol
245/291
84.2% (+6.5/−6.9 pp)
$2.64
$0.0108
97 tasks with three samples per model per task. Parenthetical values show 95% confidence intervals estimated from 10,000 task-level bootstrap resamples, preserving all three repetitions within each task. “pp” indicates percentage points.
Our Auto Router delivered similar performance to other state-of-the-art daily-driver models, coming in at 80% the cost of Sol and 35% the cost of Opus. While that may initially seem surprising, one way to frame the problem a model router solves is through the “jagged frontier” across models. The ability to solve a problem often exists somewhere in this portfolio of models; the router’s job is to choose the right model for each task while balancing quality and price. Savings come from not paying frontier rates for non-frontier work, and they grow with how much of that work you have.
Another insight is that lower token prices do not always produce lower-cost outcomes. A model that looks cheaper on paper may end up using disproportionately more tokens to solve a problem. A router should minimize predicted trajectory cost, not just load-balance by dollars per million tokens.
This is already useful today, but it’s only the beginning of what the Auto Router can learn from Cloudflare’s position in the inference path.
How it works
When you send a request to cloudflare/auto, AI Gateway first builds the pool of models that can actually serve it. It filters out models that do not support the request format or execution mode, and accounts for the credentials, billing configuration, access control policies, and spend limits attached to the gateway. It will also filter out unhealthy upstream providers or models during downtime and automatically bring them back into the pool after an outage.
For the remaining candidates, the router looks at a compact view of the conversation. It considers the most recent messages, prioritizing the newest turns. The conversation is then sent to a multi-head classification model running on Workers AI and deployed on GPUs across our edge network. The classifier produces two sets of signals. First, it assigns probabilities across 14 task categories (like coding, planning, research, data analysis). It then rates the request across four dimensions on a scale from one to five: complexity, ambiguity, stakes, and dependence on earlier context.
A separate scoring matrix combines those signals with model benchmark results to estimate how well each model fits the request. To calibrate the scoring matrix, we defined the preferred model for a set of example task and difficulty profiles, then adjusted the weights to produce those choices.
Finally, the router combines expected quality with each model's input and output token prices. On straightforward requests, price carries more weight, so a smaller model can win when it is capable enough. As difficulty rises, the cost penalty falls and stronger models have more room to win. In simplified terms, cloudflare/auto selects the model with the highest utility as defined by:
For long agentic sessions like debugging or coding, cost is less driven by the model’s list price than by the cost of cache reads, which grows with session length. Switching models throws the cache away and forces a new model to write the whole context again. This can be worth it, as a model with a cheaper cache-read and cache-write prices can pay back the rewrite quickly.
Rather than completely avoiding model switching, the Auto Router accounts for the cost of cache reads and writes. Within a turn (one user input loop), the cache is hot and switching rarely pays off, so it’s better to keep using the same model. Across turns, the Auto Router applies a switching penalty that grows with the number of tokens already in context. A model that still holds a live cache for the session is priced at its cheaper cache-read rate. Every other candidate is priced at the full cost of rewriting the context, so the deeper the conversation, the more a switch has to earn back, through higher quality results that use fewer tokens overall or cheaper cache rereads. Switching models has another cost: most models can't read another model's reasoning tokens, so a model switch that drops reasoning tokens means that the new model may have to redo it at output prices. In the future, we want to account for this by having the router prefer to stay within the same model family when it switches.
From there, the router returns a ranked list. AI Gateway attempts the winner first and can move to another eligible model if that provider cannot serve the request.
This overall design has several benefits. The two-stage architecture (task and dimensions classifier to scoring matrix) means that routing decisions are legible because you can inspect each task’s predicted category and complexity to see how it translated into the model choice. Adjusting the router when a new model is released also does not require retraining — we only add its benchmark-derived weights to the scoring matrix. The same classifier can also support different routing profiles. For example, in addition to cloudflare/auto, we plan to release other routers in the future, including cloudflare/auto-best, which uses the same classification and model pool, but selects the highest expected quality without applying the cost tradeoff.
What's next
Our release today is only the starting point, and we’re continuing to invest in research and new routing strategies. In the near term, we want to:
Expand the models offered through cloudflare/auto
Include zero-data-retention requirements when filtering models
Account for provider capacity when selecting models
Select the appropriate reasoning or thinking level for each request
Add full support for the Responses API and WebSockets
Explore structured decision models as a first-pass classifier
As agents help us build more complex applications, both humans and agents need a better way to stay on top of what goes wrong in production. Coding agents can already query observability data, navigate a repository, change code, write tests, and open a pull request. What remains manual is connecting those steps: recognizing that repeated failures come from the same bug, gathering the relevant logs and traces, sending that context to an agent, and checking whether the fix worked. Without that structured handoff, the agent must search raw telemetry to reconstruct the scope and context of the failure before it can investigate.
Group repeated exceptions, 5xx responses, and error logs into one issue.
Send the error, stack trace, logs, traces, and Worker version to a configured coding agent.
Trigger the agent’s configured workflow — from triaging an issue to querying more data to opening a pull request.
Fix your first issue with the following prompt for your agent with CF CLI or checkout the documentation to get started:
Catch failures automatically
With one line of configuration, you can start receiving Issues detected on your Worker with no additional instrumentation required. Issues are built into the Workers runtime, so there is no SDK to install or application wrapper to add.
Once enabled, Issues records uncaught exceptions, failed invocations, HTTP 5xx responses, output from console.log() and console.error(), and logs that contain a stack trace. It also flags runaway alarm conditions and code that writes large volumes of logs inside loops.
Consider a Worker whose handler starts throwing errors after a deployment. Every failed request has a different request ID, but they all come from the same bug. Issues groups them together and shows when the error first appeared, how many times it has happened, and whether it is becoming more frequent.
When you open an issue you can see the error, a stack trace when available, the logs and traces leading up to it, the Worker version, request details and trend of the issue over time, as shown below:
Contextualizing errors for your agent
Cloudflare can capture what happened inside the Worker, but it does not know which users, accounts, or sessions matter to your application. Use the Worker runtime's built-in OpenTelemetry API to add those identifiers, without installing another package:
Those identifiers appear with each occurrence. In this issue, you can now see whether failures are concentrated in one account or session before sending the issue to an agent.
Send detected issues to your agent
An issue no longer has to sit in a dashboard while someone copies a stack trace and pastes it into a prompt. Configure an automation once, and when an issue crosses an occurrence threshold or returns after a quiet period, Issues sends it straight to your agent through Automations. You can choose when the automation should run and where the issue should go.
This can be via:
Built-in coding agents: Connect Claude Code with a routine ID and token, Cursor with an automation webhook URL, or Devin with an API token and organization ID.
Generic webhooks: Send issue context to your own agent or HTTPS endpoint.
Chat and incident management: Notify your team through chat or an on-call workflow.
When the automation runs, Issues sends the failure summary and diagnostic context captured with the issue — the exception, error, source-mapped stack trace, leading and trailing logs and traces, Worker version, and the application context you added. For deeper investigation, you can connect the agent separately to Cloudflare MCP that lets the agent query the related logs and traces so that it can propose code and test changes and open a pull request.
You stay in control of what reaches production: review the pull request, deploy the fix, and mark the issue resolved.
How Issues uncovered and resolved two Workflows bugs in one day
Cloudflare Workflows, a primitive that powers long-running, multi-step applications, is built entirely on the Workers platform.
Behind the scenes, its services keep track of steps, retries, and saved state. This makes Workflows a useful place to test Issues on our own production systems. Within a day of turning it on, the team found two unusual problems hidden inside a large volume of traffic.
A migration stuck in a retry loop: A Workflows control plane migration repeatedly hit a SQLite foreign key error when attempting to apply migrations in an edge case. Issues allowed the Workflows team to identify the problem and fix it.
A deletion process that never completed: Workflows discovered that during deletion of Workflow instances, there was an edge case where they could exceed a Workers subrequest limit and not finish the deletion. Issues helped the Workflows team identify the issue and do a fix.
Instead of leaving the team to connect thousands of separate pieces of telemetry and user reports, their automation setup sent these issues directly to Cloudflare OS, which followed the errors into the Workflows code and proposed a fix for both issues.
Get started
Ready to see what Issues finds in your app? To get started:
Set observability.issues.enabled to true in your wrangler.jsonc file
Set up your first automation in the Cloudflare dashboard to send issues to your destination of choice whether that’s an agent, a webhook, incident management tool or chat platform.
If your agent is handling setup, it can also use the new cf CLI to inspect issues and create automations. Check out our documentation to learn more!
You just thought of your next great idea, and buying the right domain feels like the easiest way to make that first bit of progress. Naturally, you open a new tab in your browser, only to find yourself face-to-face with an experience that feels like a budget airline peppering you with add-ons at checkout: Want security? How about a website? Do you want email? You’re just a few minutes into building your next idea, and it doesn’t feel fun anymore.
Launched a decade ago, Cloudflare Registrar has always taken a simpler approach. Domains at cost, transparent pricing, and no unnecessary upsells. But simplicity shouldn’t begin at checkout. It should begin the moment you start looking for the right domain.
Today, we’re bringing that same simplicity to the entire experience of finding and buying a domain. Our new domain search shows every extension we support, responds as quickly as you type, and makes hundreds of possibilities easier to explore through sorting, filtering, and transparent pricing.
And you know what is particularly good at ignoring distractions and staying focused on the destination? An AI agent. We designed Cloudflare Registrar to work naturally with agents through the Registrar API, MCP, and our newly launched cf CLI. You can ask your favorite agent to find the right domain, buy it, or transfer one you already own.
The agentic registrar, expanded
In April, we launched the Registrar API beta, allowing developers and agents to search for, check, and register domains programmatically. We have expanded the API since then. The new sandbox lets you test registrar workflows without purchasing a domain or triggering a real transaction. Our extensions endpoint returns relevant information for each of the 420+ extensions we support, helping you account for the different requirements across registries. We also added transfers, so you can bring domains from another registrar into Cloudflare programmatically.
The Registrar API is available through Cloudflare MCP, giving agents access without requiring a separate integration. Earlier this week, we also announced the launch of cf CLI, bringing the same capabilities directly into your terminal. You can prompt your favorite agent to search for, register, or transfer a domain. These tasks already lend themselves naturally to a conversation:
“Is example.com available?”
“Buy example.com.”
“Transfer example.com from my current registrar.”
The way people interact with the Internet is changing. Cloudflare Registrar should feel natural whether you use it through an agent or in your browser. For many people, the browser is still where the search begins, and that experience was long overdue for an overhaul.
Search simplified
Previously, our search page showed around 20 available results from a subset of extensions, sometimes modifying your search term to suggest related options. You couldn’t see that exact name across every extension we support.
We decided to take a simpler approach: show you the exact term you searched across every supported extension. Results appear as you type and continue to load as you scroll, letting you explore hundreds of options without starting another search. We also include domains that have already been registered, giving you a more complete picture. If you only want domains available to buy, you can filter everything else out.
More results might not sound simpler, but these are the results you asked for. Sorting and filtering help you narrow them down. Whether you are logged in or logged out, on your phone or at your desk, the experience feels the same.
Making a complex question feel simple
Cloudflare Registrar supports 420+ extensions. A single search can thus create more than 420 separate availability questions. Each extension is operated by a registry that maintains its official registration records and provides the authoritative answer about a domain’s availability and price.
Asking every registry every question at once would be slow and wasteful. Registries respond at different speeds and impose request limits, and much of the work would be for results the person might never view. To solve this, our search gathers evidence from multiple sources: (1) prepared availability datasets (e.g. zone files) and cached answers; (2) DNS answers; (3) live registry lookups.
A hit against an availability dataset or DNS can tell us that a domain is already in use, but a miss cannot necessarily prove availability as a domain may be registered without being configured in DNS, or it may be on a blocked list. A recent registry-derived answer is stronger but becomes stale over time, while a live registry check provides the freshest authoritative answer but takes longer and draws on limited upstream capacity. Our new search progressively probes these sources while balancing speed, freshness, and certainty for each result. As better or more accurate information arrives, we update only the affected result dynamically.
How we built search for speed and scale
We built the new search on the same Cloudflare developer platform available to our customers. Workers run the public search entry point and the services that gather availability evidence. Durable Objects give each active search one coordinator, while Workers KV stores prepared data that can be reused across searches. Together, these primitives let the service scale across users and 420+ extensions while keeping operating costs low.
We prepare useful evidence before a search begins: a purpose-built pipeline converts registry zone files and other bulk sources into compact availability datasets in Workers KV. Large datasets are split into smaller pieces, so a lookup retrieves only the data required for that domain. These fast checks can answer many questions without making a new live registry request.
A search session is composed of a Durable Object that coordinates that specific search interaction. It establishes the result order from the query, sort, and filters without waiting for network lookups, remembers the best evidence received for each domain, and tracks which results are visible so lookup work follows the person's attention.
WebSockets provide the bidirectional connection, and we designed an application protocol on top of them to connect the browser to the resolution process. An initial snapshot establishes the ordered list. Subsequent delta messages contain only the fields that changed, letting the browser update one domain instead of downloading the full result set again. Before sending a delta, the Durable Object compares the new evidence with the current answer: stronger evidence can replace it but weaker evidence cannot.
A separate Worker gathers additional evidence. It can query DNS through Cloudflare's 1.1.1.1 resolver, make a live Registrar check, or reuse a recently cached answer. Reusing fresh answers avoids repeating upstream requests. Because an available domain can be registered at any moment, an available answer has a shorter useful cache life than evidence that a domain is already taken.
Together, these pieces turn hundreds of independent availability checks and all that coordination into one coherent search experience. Cloudflare’s Developer Platform gives us all the building blocks to hide that complexity and craft a domain search experience that feels simple and is among the fastest in the world.
Transparent pricing and price drops
Making search feel simple is not only about speed. It is also about knowing exactly what a domain will cost. Cloudflare Registrar has offered domains at cost since day one. Great prices are part of making domains simple, but so is knowing what you will pay. Our new search and our new pricing page show both the initial registration price and the renewal price for every domain. When a domain is discounted, we show the original at-cost registration price crossed out alongside the promotional price.
Beginning with Birthday Week (this week!), we’re offering first-year registration discounts on select extensions including .io, .dev, .app, and .tech. You can explore every discounted extension directly from the search page as well as our newly launched pricing page.
Whether you search in your browser or ask an agent, our goal is the same. Remove the friction between having an idea and making it real. Buying a domain for your next idea should be fun and feel like progress.
Find your next domain
Choose how you want to get started:
Search in your browser: Explore every available extension and find your next domain.
Ask your favorite agent: Install cf CLI, then prompt your agent to search for, register, or transfer a domain.
Build with the API: Use the Registrar API to bring domain search and registration into your own application or workflow.
However you choose to do it, finding your next domain should be the fun part.
Acknowledgements: This simplicity was a result of cross-team collaboration. Special thanks to Pedro Menezes, Shobhit Kuruvilla, Lucy Dryaeva, Fred Pinto, and the Registrar Team, the Design Engineering Team, and the Forge team.
The collective thoughts of the interwebz
Manage Consent
To provide the best experiences, we use technologies like cookies to store and/or access device information. Consenting to these technologies will allow us to process data such as browsing behavior or unique IDs on this site. Not consenting or withdrawing consent, may adversely affect certain features and functions.
Functional
Always active
The technical storage or access is strictly necessary for the legitimate purpose of enabling the use of a specific service explicitly requested by the subscriber or user, or for the sole purpose of carrying out the transmission of a communication over an electronic communications network.
Preferences
The technical storage or access is necessary for the legitimate purpose of storing preferences that are not requested by the subscriber or user.
Statistics
The technical storage or access that is used exclusively for statistical purposes.The technical storage or access that is used exclusively for anonymous statistical purposes. Without a subpoena, voluntary compliance on the part of your Internet Service Provider, or additional records from a third party, information stored or retrieved for this purpose alone cannot usually be used to identify you.
Marketing
The technical storage or access is required to create user profiles to send advertising, or to track the user on a website or across several websites for similar marketing purposes.