Post Syndicated from Talks at Google original https://www.youtube.com/watch?v=wJwcc90-UtY
Shooting Landscapes with Filters
Post Syndicated from Matt Granger original https://www.youtube.com/watch?v=SKWw-icH-ks
Microservices discovery using Amazon EC2 and HashiCorp Consul
Post Syndicated from Marine Haddad original https://aws.amazon.com/blogs/architecture/microservices-discovery-using-amazon-ec2-and-hashicorp-consul/
These days, large organizations typically have microservices environments that span across cloud platforms, on-premises data centers, and colocation facilities. The reasons for this vary but frequently include latency, local support structures, and historic architectural decisions. However, due to the complex nature of these environments, efficient mechanisms for service discovery and configuration management must be implemented to support operations at scale. This is an issue also faced by Nomura.
Nomura is a global financial services group with an integrated network spanning over 30 countries and regions. By connecting markets East & West, Nomura services the needs of individuals, institutions, corporates, and governments through its three business divisions: Retail, Investment Management, and Wholesale (Global Markets and Investment Banking). E-Trading Strategy Foreign Exchange sits within Global Markets, and focuses on all quantitative analysis and technical aspects of electronic FX flows. The team builds out a number of innovative solutions for clients, all of which are needed to operate in an ultra-low latency environment to be competitive. The focus is to build high-quality engineered platforms that can handle all aspects of Nomura’s growing 24 hours a day, 5-and-a-half days a week FX business.
In this blog post, we share the solution we developed for Nomura and how you can build a service discovery mechanism that uses a hierarchical rule-based algorithm. We use the flexibility of Amazon Elastic Compute Cloud (Amazon EC2) and third-party software, such as SpringBoot and Consul. The algorithm supports features such as service discovery by service name, Domain Name System (DNS) latency, and custom provided tags. This can activate customers with automated deployments, since services are able to auto-discover and connect with other services. Based on provided tags, customers can implement environment boundaries so that a service doesn’t connect to an unintended service. Finally, we built a failover mechanism, so that if a service becomes unavailable, an alternative service would be provided (based on given criteria).
After reading this post, you can use the provided assets in the open source repository to deploy the solution in their sandbox environment. The Terraform and Java code that accompanies this post can be amended as needed to suit individual requirements.
Overview of solution
The solution is composed of a microservices platform that is spread over two different data centers, and a Consul cluster per data center. We use two Amazon Virtual Private Clouds (VPCs) to model geographically distributed Consul “data centers”. These VPCs are then connected via an AWS Transit Gateway. By permitting communication across the different data centers, the Consul clusters can form a wide-area network (WAN) and have visibility of service instances deployed to either. The SpringBoot microservices use the Spring Cloud Consul plugin to connect to the Consul cluster. We have built a custom configuration provider that uses Amazon EC2 instance metadata service to retrieve the configuration. The configuration provider mechanism is highly extensible, so anyone can build their own configuration provider.
The major components of this solution are:
-
- Sample microservices built using Java and SpringBoot, and deployed in Amazon EC2 with one microservice instance per EC2 instance
- A Consul cluster per Region with one Consul agent per EC2 instance
- A custom service discovery algorithm

Figure 1. Multi-VPC infrastructure architecture
A typical flow for a microservice would be to 1/ boot up, 2/ retrieve relevant information from the EC2 Metadata Service (such as tags), and, 3/ use it to register itself with Consul. Once a service is registered with Consul it can discover services to integrate with, and it can be discovered by other services.
An important component of this service discovery mechanism is a custom algorithm that performs service discovery based on the tags created when registering the service with Consul.
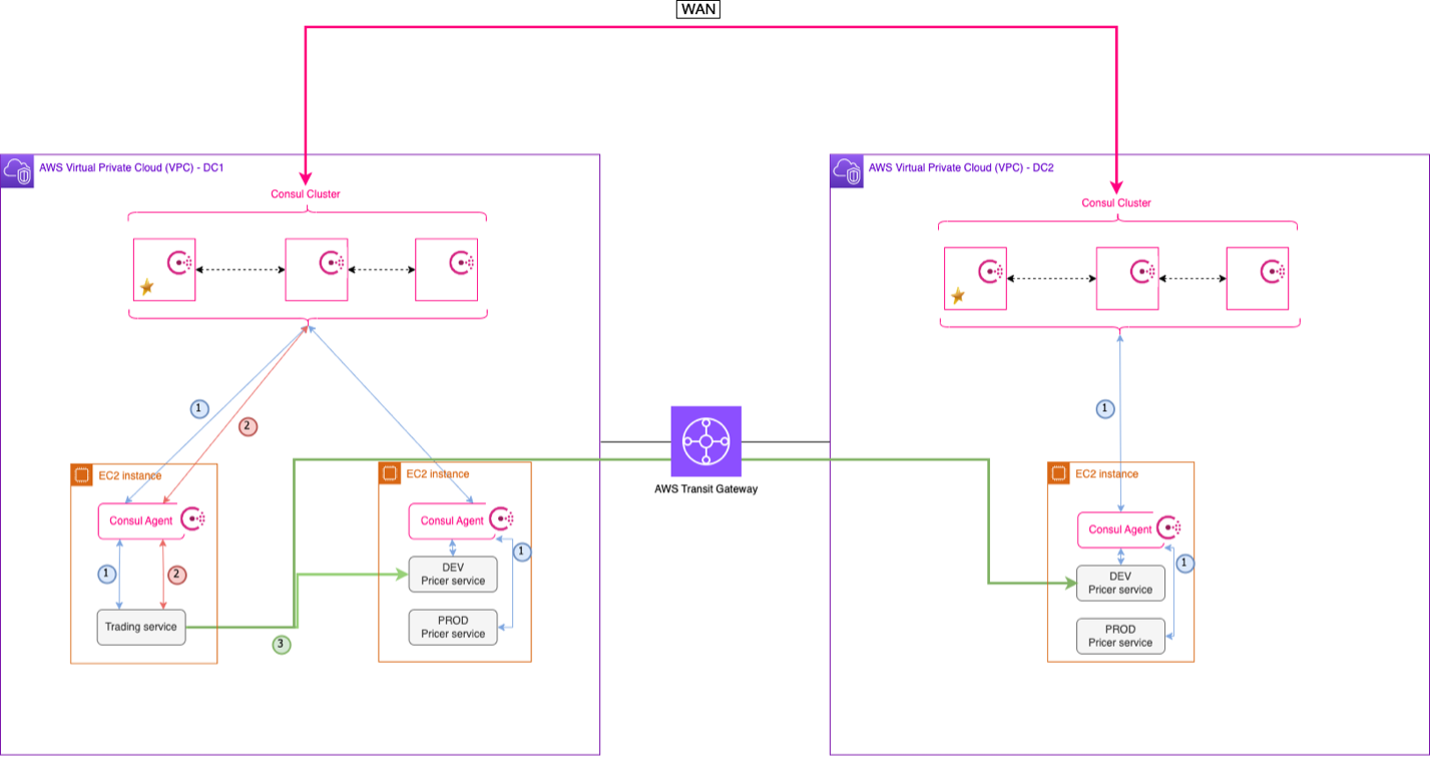
Figure 2. Service discovery flow
The service flow shown in Figure 2 is as follows:
- The Consul agent deployed on the instance registers to the local Consul cluster, and the service registers to its Consul agent.
- The Trading service looks up for available Pricer services via API calls.
- The Consul agent returns the list of available Pricer services, so that the Trading service can query a Pricer service.
Walkthrough
Following are the steps required to deploy this solution:
- Provision the infrastructure using Terraform. The application .jar file and the Consul configuration are deployed as part of it.
- Test the solution.
- Clean up AWS resources.
The steps are detailed in the next section, and the code can be found in this GitHub repository.
Prerequisites
- Install Git
- Install Terraform
- Install Packer
- Install AWS CLI
- An AWS account
- A Consul Enterprise License – if you don’t have an Enterprise license, you can contact the Hashicorp Support Team to request a trial license.
Deployment steps
Note: The default AWS Region used in this deployment is ap-southeast-1. If you’re working in a different AWS Region, make sure to update it.
Clone the repository
First, clone the repository that contains all the deployment assets:
git clone https://github.com/aws-samples/geographical-hierarchical-service-lookup-with-consul-on-aws
Build Amazon Machine Images (AMIs)
1. Build the Consul Server AMI in AWS
Go to the ~/deployment/scripts/amis/consul-server/ directory and build the AMI by running:
packer build .
The output should look like this:
==> Builds finished. The artifacts of successful builds are:
--> amazon-ebs.ubuntu20-ami: AMIs were created:
ap-southeast-1: ami-12345678910
Make a note of the AMI ID. This will be used as part of the Terraform deployment.
2. Build the Consul Client AMI in AWS
Go to ~/deployment/scripts/amis/consul-client/ directory and build the AMI by running:
packer build .
The output should look like this:
==> Builds finished. The artifacts of successful builds are:
--> amazon-ebs.ubuntu20-ami: AMIs were created:
ap-southeast-1: ami-12345678910
Make a note of the AMI ID. This will be used as part of the Terraform deployment.
Prepare the deployment
There are a few steps that must be accomplished before applying the Terraform configuration.
1. Update deployment variables
-
- In a text editor, go to directory
~/deployment/ - Edit the variable file template.var.tfvars.json by adding the variables values, including the AMI IDs previously built for the Consul Server and Client
- In a text editor, go to directory
Note: The key pair name should be entered without the “.pem” extension.
2. Place the application file .jar in the root folder ~/deployment/
Deploy the solution
To deploy the solution, run the following commands from the terminal:
export VAR_FILE=template.var.tfvars.json
terraform init && terraform plan --var-file=$VAR_FILE -out plan.out
terraform apply plan.out
Validate the deployment
All the EC2 instances have been deployed with AWS Systems Manager access, so you can connect privately to the terminal using the AWS Systems Manager Session Manager feature.
To connect to an instance:
1. Select an instance
2. Click Connect
3. Go to Session Manager tab
Using Session Manager, connect to one of the Consul servers and run the following commands:
consul members
This command shows you the list of all Consul servers and clients connected to this cluster.
consul members -wan
This command shows you the list of all Consul servers connected to this WAN environment.
To see the Consul User Interface:
1. Open your terminal and run:
aws ssm start-session --target <instanceID> --document-name AWS-StartPortForwardingSession --parameters '{"portNumber":["8500"],"localPortNumber":["8500"]}' --region <region>
Where instanceID is the AWS Instance ID of one of the Consul servers, and Region is the AWS Region.
Using System Manager Port Forwarding allows you to connect privately to the instance via a browser.
2. Open a browser and go to http://localhost:8500/ui
3. Find the Management Token ID in AWS Secrets Manager in the AWS Management Console
4. Login to the Consul UI using the Management Token ID
Test the solution
Connect to the trading instance and query the different services:
curl http://localhost:9090/v1/discover/service/pricer
curl http://localhost:9090/v1/discover/service/static-data
This deployment assumes that the Trading service queries the Pricer and Static-Data services, and that services are returned based on an order of precedence (see Table 1 following):
| Service | Precedence | Customer | Cluster | Location | Environment |
|---|---|---|---|---|---|
| TRADING | 1 | ACME | ALPHA | DC1 | DEV |
| PRICER | 1 | ACME | ALPHA | DC1 | DEV |
| PRICER | 2 | ACME | ALPHA | DC2 | DEV |
| PRICER | 3 | ACME | BETA | DC1 | DEV |
| PRICER | 4 | ACME | BETA | DC2 | DEV |
| PRICER | 5 | SHARED | ALPHA | DC1 | DEV |
| PRICER | 6 | SHARED | ALPHA | DC2 | DEV |
| STATIC-DATA | 1 | SHARED | SHARED | DC1 | DEV |
| STATIC-DATA | 2 | SHARED | SHARED | DC2 | DEV |
| STATIC-DATA | 2 | SHARED | BETA | DC2 | DEV |
| STATIC-DATA | 2 | SHARED | GAMMA | DC2 | DEV |
| STATIC-DATA | -1 | STARK | ALPHA | DC1 | DEV |
| STATIC-DATA | -1 | ACME | BETA | DC2 | PROD |
Table 1. Service order of precedence
To test the solution, switch on and off services in the AWS Management Console and repeat Trading queries to look at where the traffic is being redirected.
Cleaning up
To avoid incurring future charges, delete the solution from ~/deployment/ in the terminal:
terraform destroy --var-file=$VAR_FILE
Conclusion
In this post, we outlined the prevalent challenge of complex globally distributed microservice architectures. We demonstrated how customers can build a hierarchical service discovery mechanism to support such an environment using a combination of Amazon EC2 service and third-party software such as SpringBoot and Consul. Use this to test this solution into your sandbox environment and to see if it could bring the answer to your current challenge.
Additional resources:
[$] The first half of the 6.5 merge window
Post Syndicated from original https://lwn.net/Articles/936418/
The first days of the 6.5 merge window have been a bit calmer than usual,
with “only” 4,000 non-merge changesets having been pulled into the mainline
repository. Those changesets include a fair amount of significant work,
though. Read on for LWN’s summary of the first set of changes merged for
the next major kernel release.
pfSense CE 2.7 Released with Intel i226 Support and Other Enhancements
Post Syndicated from Rohit Kumar original https://www.servethehome.com/pfsense-ce-2-7-released-with-intel-i226-support-and-other-enhancements/
pfSense CE 2.7 is out with new features like a packet capture GUI and even an upgrade to FreeBSD 14 for better hardware support
The post pfSense CE 2.7 Released with Intel i226 Support and Other Enhancements appeared first on ServeTheHome.
What it takes to keep an enterprise ‘Frankenkernel’ alive (Register)
Post Syndicated from original https://lwn.net/Articles/936976/
The Register reports
from Jiří Benc’s DevConf.cz talk on the making of the CentOS Stream
kernel.
So, what the team are working on is a Frankenstein’s monster, sewn
together from different codebases. Although the base kernel is
still version 5.14, it is full of backports from upstream. It has
the XFS filesystem code from kernel 6.0, the USB subsystem –
complete with drivers – and BPF subsystem from kernel 6.2, the
wireless stack and all drivers from kernel 6.3, and the multipath
TCP/IP code from kernel 6.4 – which at the time of the talk hadn’t
even been released upstream yet.
Deploying low-latency hybrid cloud storage on AWS Local Zones using AWS Storage Gateway
Post Syndicated from maceneff original https://aws.amazon.com/blogs/compute/deploying-low-latency-hybrid-cloud-storage-on-aws-local-zones-using-aws-storage-gateway/
This blog post is written by Ruchi Nigam, Senior Cloud Support Engineer and Sumit Menaria, Senior Hybrid SA.
AWS Local Zones are a type of infrastructure deployment that places compute, storage, database, and other select AWS services close to large population and industry centers. With Local Zones close to large population centers in metro areas, customers can achieve the low latency required for use cases like video analytics, online gaming, virtual workstations, live streaming, remote healthcare, and augmented and virtual reality. They can also help customers operating in regulated sectors like healthcare, financial services, mining and resources, and public sector that might have preferences or requirements to keep data within a geographic boundary. In addition to low-latency and residency benefits, Local Zones can help organizations migrate additional workloads to AWS, supporting a hybrid cloud migration strategy and simplifying IT operations.
Your hybrid cloud migration strategy may involve storage requirements for data coming in from various on-premises sources, file sharing within the organization or backup on-premises files. These storage requirements can be met by using Amazon FSx for a feature-rich, high performance file system. You can deploy your workload in the nearest Local Zones and use Amazon FSx in the parent AWS Region for a cost-effective solution with four widely-used file systems: NetApp ONTAP, OpenZFS, Windows File Server, and Lustre.
If your workloads need low-latency access to your storage solution and operate in locations which are not close to an AWS Region, then you can consider AWS Storage Gateway as a set of hybrid cloud storage services to get access to virtually unlimited cloud storage in the region. There are options to deploy Storage Gateway directly in your on-premises environment as a virtual machine (VM) (VMware ESXi, Microsoft Hyper-V, Linux KVM) or as a pre-configured standalone hardware appliance. But you can also deploy it on an Amazon Elastic Compute Cloud (Amazon EC2) instance in Local Zones or the Region, depending where your data sources and users are. Deploying Storage Gateway on Amazon EC2 in Local Zones provides low latency access via local cache for your applications while taking away the undifferentiated heavy lifting of management of the power, space, and hardware for deploying it in the on-premises environment. Before choosing an appropriate location, you must note any data residency requirements with which you must comply. There may be situations where the Local Zone’s parent Region is in the same country. However, it is recommended to work with your compliance and security teams for confirmation, as the objects are stored in the Amazon S3 service in the Region.
Depending on your use cases you can choose among four different deployment options: Amazon S3 File Gateway, Amazon FSx File Gateway , Tape Gateway, and Volume Gateway.
|
Name |
Interface |
Use Case |
|
S3 File Gateway |
NFS, SMB |
Allow on-premises or EC2 instances to store files as objects in Amazon S3 and access them via NFS or SMB mount points |
|
Volume Gateway Stored Mode |
iSCSI |
Asynchronous replication of on-premises data to Amazon S3 |
|
Volume Gateway Cached Mode |
iSCSI |
Primary data stored in Amazon S3 with frequently accessed data cached locally on-premises |
|
Tape Gateway |
ISCSI |
Replace on-premises physical tapes with AWS-backed virtual tapes. Provides virtual media changer and tape drives to use with existing backup applications |
|
FSx File Gateway |
SMB |
Low-latency, efficient connection for remote users when moving on-premises Windows file systems into the cloud. |
We expand on how you can deploy Amazon S3 File Gateway in a Local Zones specific setup. However, a similar approach can be used for other deployment options.
Amazon S3 File Gateway on Local Zones
Amazon S3 File Gateway provides a seamless way to connect to the cloud to store application data files and backup images as durable objects in Amazon S3 cloud storage. Amazon S3 File Gateway supports a file interface into Amazon S3 and combines a service and a virtual software appliance. The gateway offers Server Message Block (SMB) or Network File System (NFS)-based access to data in Amazon S3 with local caching. This can be used for both on-premises and data-intensive Amazon EC2-based applications in Local Zones that require file protocol access to Amazon S3 object storage.
Architecture

In the previous architecture, Client connects to the Storage Gateway EC2 instance over a private/public connection. Storage Gateway EC2 instance can access the S3 bucket in the Region via the Storage Gateway service endpoint. The File Share associated with the Storage Gateway presents the S3 bucket as a locally mounted drive for the client to use.
There are few things we must note while deploying file gateway on Amazon EC2 in a Local Zone.
- Since there are selected EC2 instance types available in the Local Zones, identify the instance types available in your desired Local Zone and select the appropriate one which meets the file gateway requirements from a memory perspective.
For example, to list the EC2 instance types offered in the ‘us-east-1-bos-la’ Availability Zone (AZ), use the following command:
aws ec2 describe-instance-type-offerings —location-type
"availability-zone" —filters Name=location,Values=us-east-1-bos-
1a —region us-east-1
- Choose a supported instance type and EBS volumes in the Local Zone.
- Add another 150GiB storage apart from the root volume for cache storage.
- Review and make sure that the Security Group has correct firewall ports open – SMB/NFS ports, HTTP port (for activation) are open in ingress.
- For activation, if you must access the Storage Gateway over the Public network, then you must assign a Public IP address to the EC2 instance. If you plan to use an Elastic IP address, then make sure that you select the network-border group specific to the Local Zone.
- For private connectivity, you can use an AWS Direct Connect connection at the supported Local Zones and also enable VPC endpoint for connectivity between Storage Gateway and service endpoints.
Setting up Amazon S3 File Gateway
1. Navigate to the Storage Gateway console and select the Create Gateway button. In the Gateway options, select the Gateway type as Amazon S3 File Gateway.

2. Under Platform options, select Amazon EC2 and select the option to Customize your settings.

Then, select the Launch instance button and complete launching the EC2 instance to be used as the Storage Gateway. Navigating to the launch instance wizard picks up the verified file gateway Amazon Machine Image (AMI) available in the Region. However, you can also find the AMI using the following AWS Command Line Interface (AWS CLI) command:
aws --region us-east-1 ssm get-parameter --name
/aws/service/storagegateway/ami/FILE_S3/latest
3. After launching the EC2 instance, check Confirm set up gateway and select Next.

4. Under Gateway connection options, choose the IP address radio button and enter the Public IP of the EC2 instance launched in Step 2.

5. For the Storage Gateway Service endpoint connection, you can create a VPC endpoint for Storage Gateway and specify the VPC endpoint ID from the dropdown selections for a private connection between the gateway and AWS Storage Services. Alternatively, you can choose the Publicly accessible option.

6. Review and activate the storage gateway.

7. Once the gateway is activated, you can allocate cache storage from the local disks. It is recommended to only use Amazon Elastic Block Store (Amazon EBS) volumes for the gateway storage.

Once the gateway is configured, the next steps show how to create a file share that can be accessed using the NFS or the SMB protocol.
8. A File Gateway can host multiple NFS and SMB file shares. For this example, we configure the NFS file share type. You can also select the corresponding S3 bucket in the Region which is going to be used for storing the data.

Once the file share is created, you can see the list of mount commands to be used on different clients.

On a Linux Client, use the following steps to mount the previously created NFS file share. Make sure you replace the IP address, S3 bucket name, and mount path with names specific to your configuration.
sudo mount -t nfs -o nolock,hard 10.0.32.151:/my-s3-bucket /my-
mount-path
You can verify that the file share has been mounted by running the following command:
$ df -TH
Filesystem Type Size Used Avail Use% Mounted on
devtmpfs devtmpfs 497M 0 497M 0% /dev
tmpfs tmpfs 506M 476k 506M 1% /run
tmpfs tmpfs 506M 0 506M 0% /sys/fs/cgroup
/dev/xvda1 xfs 8.6G 7.3G 1.4G 85% /
10.0.32.151:/my-s3-bucket nfs4 9.3E 0 9.3E 0% /your-mount-path
tmpfs tmpfs 102M 0 102M 0% /run/user/0
tmpfs tmpfs 102M 0 102M 0% /run/user/1000
Now you can also list the S3 objects as files on the locally mounted drive.

For reference, here are the objects stored in the S3 bucket in the Region.

To see a recently added object in the S3 bucket, select Refresh cache under the Actions options of the file share.
Depending on the client location, performance for access to the cached files is better as compared to direct access to the files in the parent Region. The clients can be either in your on-premises and accessed via Direct Connect to the Local Zone, or workload within the Local Zone, which can mount the file gateway for local access from the VPC.
Furthermore, you can look at Amazon S3 File Gateway performance for clients to select the appropriate EC2 instance type and EBS volume size and monitor Cache hit, Read/Write Time, and other performance metrics of the storage gateway by using CloudWatch Metrics.
Cleaning Up
- Unmount the File Gateway from the local machine:
unmount /your-mount-path - Delete the Storage Gateway from the Storage Gateway console
- Delete the VPC Endpoint created for Storage Gateway service
- Delete the EC2 instance from the Amazon EC2 console
- Delete the files added to the S3 bucket from the Amazon S3 console
Conclusion
By deploying Amazon Storage Gateway on Local Zones, you can utilize the scalability, security, and cost-effectiveness of the AWS cloud, and simultaneously provide low-latency and high-performance access for on-premises applications and users. This can accelerate the migration your storage workloads to cloud while providing your users with low latency access via Local Zones in a truly hybrid manner. Read more about AWS Storage Gateway and AWS Local Zones in their respective documentation.
Някои бележки по бунта на „Вагнер“
Post Syndicated from original https://www.toest.bg/nyakoi-belezhki-po-bunta-na-vagner/

Военният бунт на Евгений Пригожин и частната му армия, насочен срещу официалното ръководство на руската армия, все още поражда повече въпроси, отколкото отговори. Едва ли някога ще научим всички детайли за причината „Вагнер“ в последния момент да се откаже от финалната си цел – влизане в Москва. Но случилото се на 23 и 24 юни вече дава възможност да се направят някои дългосрочни прогнози за по-нататъшното развитие на кризата в Русия, както и на войната в Украйна.
Започналата преди около месец контраофанзива на украинската армия има непосредствен ефект върху случващото се вътре в Русия – украинските успехи на бойното поле, макар и бавни, изглежда, ще стават все повече и това автоматично води до разширяващи се пукнатини сред руските военни и политически лидери.
Митовете, които вече не съществуват
Окончателно беше сринат митът за популярността на Путин. В Русия проучванията на общественото мнение се провеждат в среда, в която едноличната власт се приема за неизбежна и където „грешен“ отговор на въпроса „Подкрепяте ли Путин?“ носи очевидни рискове. Но когато властта на Путин бъде на практика отнета, както стана в окупирания от „Вагнер“ град Ростов, не изглеждаше някой от местните да има нещо против.
Видяхме кадри, на които цивилни еуфорично посрещат бойците на Пригожин, дават им храна и си правят снимки с тях. Друга част от местното население реагира на събитията с апатия, а някои просто търсеха начин да напуснат града възможно най-бързо. В нито един руски град обаче не видяхме хора, спонтанно изразяващи подкрепа за Путин и протестиращи срещу действията на Пригожин.
Тази динамика вътре в Русия означава, че част от руснаците са готови да бъдат управлявани от нов експлоататорски режим, стига той да замени сегашното управление. От друга страна, апатията на по-голяма част от населението показва, че повечето руснаци в този момент приемат за даденост, че ще бъдат управлявани от военачалникa с най-много оръжия и най-силна армия и просто ще продължат с ежедневието си.
Важно е да се отбележи, че симпатиите на отделни руснаци към частната армия „Вагнер“ дойдоха, след като Пригожин обвини Путин, че е излъгал руското общество за причината да се започне военната агресия срещу Украйна през 2022 г. Пригожин каза също, че Киев не е планирал широкомащабни атаки срещу окупирания от Русия Донбас. Следователно в Русия се срина не само митът за вожда Путин, а и митът за войната като средство да бъде защитена страната срещу потенциална агресия, идваща отвън.
Москва не е непревземаема крепост?
Русия се намира в най-тежката си вътрешна криза след разпада на СССР през 1991 г. Походът на Пригожин към Москва показва, че сравнително малка военна сила няма да има особени проблеми да достигне руската столица. Това не беше така, преди по-голямата част от руските въоръжени сили да бъдат ангажирани във войната срещу Украйна, където много от най-добрите единици бяха унищожени в битки с украинската армия.
Паралелно с това границите на най-голямата държава в света не биват защитавани, а вътрешната сигурност на практика не съществува, щом група от няколко хиляди войници без авиация може почти безпрепятствено да стигне до портите на Москва, а само преди седмици руски партизани, сражаващи се на страната на Украйна, успяха да извършат разузнавателна операция в Белгородска област. Oчевидно е, че Путин не пази руските „национални интереси“, в противен случай нямаше да започне конфликт, който да засили руската зависимост от Китай, да унищожи връзките със Запада и да вкара Русия в спирала на самоунищожителни вътрешни конфликти, за които противопоставянето между Пригожин и Шойгу беше само началото.
Истинската причина за руската агресия срещу Украйна още от 2014 г. беше, че свободна, демократична и европейска Украйна е заплаха за режима на Путин. Реформирана по европейски модел, Украйна се превърна в положителен пример за своите съседи от бившия СССР. Тя е „моделът“, който по естествен начин населението в Беларус, Русия, Молдова, Грузия и Армения иска да следва, за да подобри състоянието на собствената си държава. Огромните протести за демокрация в Беларус от лятото на 2020 г. доказаха, че това е необратим процес, който рано или късно щеше да стигне до самата Русия и да застраши диктаторския режим в Москва.
(Не)възможната ескалация
Събитията от 23 и 24 юни показаха още нещо важно – т.нар. червени линии на Путин не съществуват и когато диктаторът е притиснат в ъгъла, той просто ще опита да спаси собствения си живот, бягайки от Москва. Това още веднъж доказва, че западните страхове от някаква ужасяваща руска ескалация, която би последвала украинска военна победа, са неоснователни. Всъщност нищо ново – тактиката на Путин винаги е била да заплашва с военна ескалация и да се надява страховете на противниците му да надделеят над желанието за противопоставяне, а ако тази тактика се провали, в Кремъл просто променят наратива и казват пред руската публика, че „всичко върви по план“.
Всъщност маршът на „Вагнер“ към Москва може да се разглежда и като пример за вероятния край на войната в Украйна. Защото следващия път, когато две въоръжени групи застанат една срещу друга на територията на Русия, битката няма да бъде решена за два дни и най-вероятно ще се наложи руската армия да се изтегли от Украйна, за да може тя да бъде използвана в задаващата се гражданска война. Това развитие става все по-вероятно с увеличаващите се украински успехи на фронта.
Рисковете за България от задълбочаващия се хаос в Русия са големи. Повече от година след началото на пълномащабната руска атака срещу Украйна българската държава не успява да се справи с все по-агресивните руски агенти в политиката, като в същото време продължават саботажът на наша територия и уличната агресия, идваща от проруски групи. За да има адекватна реакция на задаващия се крах на режима на Путин, България първо трябва успее да защити собствената си вътрешна сигурност от зловредното руско влияние.
Heeeere’s Johnny! The King of Late Night.
Post Syndicated from The History Guy: History Deserves to Be Remembered original https://www.youtube.com/watch?v=On5BrdM7BNM
The US Is Spying on the UN Secretary General
Post Syndicated from Bruce Schneier original https://www.schneier.com/blog/archives/2023/06/the-us-is-spying-on-the-un-secretary-general.html
The Washington Post is reporting that the US is spying on the UN Secretary General.
The reports on Guterres appear to contain the secretary general’s personal conversations with aides regarding diplomatic encounters. They indicate that the United States relied on spying powers granted under the Foreign Intelligence Surveillance Act (FISA) to gather the intercepts.
Lots of details about different conversations in the article, which are based on classified documents leaked on Discord by Jack Teixeira.
There will probably a lot of faux outrage at this, but spying on foreign leaders is a perfectly legitimate use of the NSA’s capabilities and authorities. (If the NSA didn’t spy on the UN Secretary General, we should fire it and replace it with a more competent NSA.) It’s the bulk surveillance of whole populations that should outrage us.
Security updates for Friday
Post Syndicated from original https://lwn.net/Articles/936949/
Security updates have been issued by Debian (docker-registry, flask, systemd, and trafficserver), Fedora (moodle, python-reportlab, suricata, and vim), Red Hat (go-toolset and golang, go-toolset-1.19 and go-toolset-1.19-golang, go-toolset:rhel8, open-vm-tools, python27:2.7, and python3), SUSE (buildah, chromium, gifsicle, libjxl, sqlite3, and xonotic), and Ubuntu (linux, linux-allwinner, linux-allwinner-5.19, linux-aws, linux-aws-5.19,
linux-azure, linux-gcp, linux-gcp-5.19, linux-hwe-5.19, linux-ibm,
linux-kvm, linux-lowlatency, linux-oracle, linux-raspi, linux-starfive,
linux-starfive-5.19, linux, linux-aws, linux-aws-5.15, linux-aws-5.4, linux-azure,
linux-azure-5.15, linux-azure-5.4, linux-azure-fde-5.15, linux-bluefield,
linux-gcp, linux-gcp-5.15, linux-gcp-5.4, linux-gke, linux-gke-5.15,
linux-gkeop, linux-gkeop-5.15, linux-hwe-5.15, linux-hwe-5.4, linux-ibm,
linux-ibm-5.4, linux-kvm, linux-lowlatency, linux-lowlatency-hwe-5.15,
linux-nvidia, linux-oracle, linux-oracle-5.15, linux-oracle-5.4,
linux-raspi, linux-raspi-5.4, and linux-oem-6.1).
Местни избори 2023. За кого бият?
Post Syndicated from Емилия Милчева original https://www.toest.bg/mestni-izbori-2023-za-kogo-biyat/

На местните избори наесен няколко нови политически сили ще се борят за свои кметове и групи общински съветници – „Продължаваме промяната“–„Демократична България“ и „Възраждане“, и трета, макар и необявена официално – президентският кръг. Всъщност дори четири, тъй като ПП и ДБ към момента не могат да постигнат разбирателство за общи кандидатури за кметове и общински съветници – освен за София.
Всички тези формации ще се стремят да разбият хегемонията на ГЕРБ в местната власт, за да разширят политическото си влияние. А това надмощие се пропука още през 2019 г., когато ГЕРБ спечели допълнително 9 кметски места, но изгуби общински съветници. Изключването на Втория в партията на 7 юли същата година заради луксозния апартамент с асансьор, купен особено евтино от „Артекс“, все пак нанесе известни поражения, тъй като Цветан Цветанов се грижеше работата с местните структури да се движи като по часовник. През 2019 г. кандидатите на ГЕРБ се явиха на балотажи в 15 общини, които на предишния местен вот четири години по-рано бяха спечелили още на първия тур. На ДПС все още няма кой да им отнеме „крепостите“.
Новите политически конкуренти на местния вот, освен че ще са в схватка помежду си, ще са и съперници с ГЕРБ. Целите на предизборната кампания обаче се усложняват от факта, че партията на Бойко Борисов и ПП–ДБ са скрепени от общо управление – кабинет, в който след 9 месеца представителката на ГЕРБ Мария Габриел ще стане министър-председател.
Освен това си взаимодействат по обща законодателна програма в парламента и обменят идеи за конституционна реформа, каквато възнамеряват да осъществят с ГЕРБ–СДС, ДПС и която от останалите политически сили се съгласи. (Съгласни засега няма.) Заради бъдещето на правителството и бъдещата конституционна реформа съюзът с ГЕРБ – а това значи и с лидера Бойко Борисов – трябва да бъде съхранен. Това обяснява и защо имунитетът на Борисов е неприкосновен и пазен, а заедно с него – и изваждането от деловодството на парламента на документите по „Барселонагейт“, внесени от бившия вече главен прокурор Иван Гешев.
Пътят към София
Как тогава ще се реализира битката за София на общия кандидат-кмет на ПП–ДБ, „Спаси София“ и гражданската платформа „Eкипът на София“ Васил Терзиев? Последните две формации са активни на градския терен от години със свои анализи и предложения какво да се промени, за да имат столичани „право на град“. В публичните си изяви досега Терзиев залага на позитивната кампания и не хвърля камък по ГЕРБ и дългогодишната кметица на София Йорданка Фандъкова.
Евентуална победа би следвало да е венецът на един цикъл, започнал на местните избори през 2019 г., когато „Демократична България“ спечели 8 районни кметове в столицата – ⅓ от всички, и група общински съветници. А на парламентарния вот на 2 април коалицията ПП–ДБ победи ГЕРБ в трите избирателни района в София, спечелвайки средно с 32% повече гласове.
Но контекстът тогава беше различен. На балотажите, на които се избираше и кмет на столицата, и почти всички районни кметове – 22 от 24, имаше значително обединение на формации и избиратели срещу ГЕРБ. Такъв тип подкрепа беше отчетена и при Мая Манолова, напуснала поста на омбудсман и издигната по формулата „независим кандидат, подкрепен от…“ срещу Йорданка Фандъкова (ГЕРБ). Въпреки че леви и представители на градската десница гласуваха заедно, все пак една част от десните не успяха да надмогнат политическата поляризация от началото на Прехода – но също се наблюдаваше и масово гласуване, отчетено в секции в ромски квартали. Двайсетина хиляди гласа не достигнаха на Манолова да седне в кметския кабинет на „Московска“ 33 и ГЕРБ продължи да управлява.
След обявената номинация на ИТ предприемача, известен като съосновател на компанията Telerik и образователна академия със същото име, се появиха коментари, че произходът на Терзиев, чиито баща, дядовци и чичо са заемали високи позиции в бившите тайни служби, е флирт с левия електорат. Резултатът наесен ще покаже дали тази спекулация ще се окаже вярна – и дали отблъснатите вдясно няма да са повече от привлечените отляво. Но ухажване на левите избиратели е и привличането на кмета на район „Изгрев“ д-р Делян Георгиев в екипа на Терзиев. Георгиев беше изключен от БСП по предложение на лидерката Корнелия Нинова.
От първоначалните изявления на Васил Терзиев се разбра, че възнамерява да води позитивна кампания, без да влиза в тежки схватки с ГЕРБ. Изборите обаче са битка и успехите на бизнес попрището невинаги вършат работа на политическия терен. Васил Терзиев не е политик, а кметският пост в София в действителност е четвъртият в държавата – след председателя на парламента, премиера и президента. Столицата е градът, в който живее близо една трета от България, и е с бюджет от над 2 млрд. лв. за 2022 г.
ГЕРБ все още не са обявили кого ще номинират срещу Терзиев – нескрито слаба кандидатура, каквато беше Цецка Цачева срещу Румен Радев на президентския вот през 2016 г., или кандидат, с когото биха стигнали до балотаж, а там вече може и приятели от „плаващи мнозинства“ да помогнат. Първото би означавало, че се отказват от София, където ще имат голяма група съветници. Но столицата е знакова за ГЕРБ и би било лош сигнал за партията – и в контекста на предстоящите догодина европейски избори.
Второто си е репутационна щета, макар че ГЕРБ не са се притеснявали от партньорствата си с националисти. В Европа крайнодесни вече влизат в управлението заедно с десни партии, а това може да промени баланса на силите в Европейския парламент след евроизборите догодина, прогнозира Euronews.
С антиевропейски послания се кани да играе на местните избори и „Възраждане“, особено ако референдумът за запазване на лева до 2043 г. се проведе заедно с тях.
Ами „Възраждане“?
През 2019 г. лидерът на партия „Възраждане“ Костадин Костадинов загуби балотажа във Варна срещу настоящия кмет Иван Портних (ГЕРБ), спечелил трети мандат. Сега националпатриотичната партия с кремълски уклон, учредена във Варна, издига депутата си Коста Стоянов за кмет. Ако ПП и ДБ не стигнат до обща кандидатура, социалистите са в полуразпад и е голяма вероятността на балотажа да се окажат Портних и Стоянов. На изборите на 2 април ГЕРБ–СДС бяха първи, на второ място – ПП–ДБ, които получиха с близо 13 000 гласа по-малко като коалиция, а партия „Възраждане“ увеличи подкрепата си, макар и с малко.
След създаването на правителство „Възраждане“ се опитват по всякакъв начин да провокират напрежение. Поредният опит е на Костадинов с призиви за насилие – „тази уродлива измет да бъде унищожена“. „Измет“ са противниците на режима на Путин и на войната, която води в Украйна. Уталожената с избора на кабинет политическа криза не работи за рейтинга им и затова поддръжници на партията атакуват киносалони заради филма Close на режисьора Лукас Донт, обявен от тях за „гейски“ и за „педофилия“, и драскат антисемитски лозунги. Техните фашизоидни прояви, които Костадинов обявява за „антифашистки“, макар и публично осъдени от премиера, политически сили, общественици, ще стигнат до кресчендо за местните избори.
ГЕРБ не се гнусят да влизат в сглобки с „Възраждане“ в парламента, въпреки че Борисов „категорично“ осъди поведението им, свързано с „агресията, инакомислещите, провокацията и езика на омразата“. Но избирателите им са свикнали на такива колаборации от години и също така не им е повлиял и съюзът с ПП–ДБ. Скорошно проучване на социологическата агенция „Тренд“ установи, че от не-коалицията с ГЕРБ ПП–ДБ са изгубили 5% от подкрепата и „Възраждане“ са съвсем близо до тях, на по-малко от 4% „разстояние“ – макар и отбелязали минимален ръст в сравнение с изборния си резултат. Сходни данни показа и „Алфа Рисърч“ – спад с близо пет пункта спрямо април на резултатите при ПП–ДБ, докато при ГЕРБ е 2%.
Така че местните избори наесен ще са по-трудни от парламентарните от пролетта. Основният политически враг на ПП–ДБ, също и политическа цел, вече е партньор във властта. „Възраждане“ не са управлявали, за да бъдат подложени на критика. БСП е умряло куче. ДПС е вкарано в конституционното мнозинство. „Има такъв народ“ не влизат в сметката, освен като подплънки.
Кой ще превземе доскорошните крепости на ГЕРБ – ето това е въпросът и за отговорите ще помогне и справянето на правителството.
В името на „баштата“
Post Syndicated from original https://www.toest.bg/v-imeto-na-bashtata/

Преди две години имах възможност да прекарам един месец в творческа резиденция в Белград. Първият ден от престоя ми се падаше на 1 юни и след като се настаних и си разопаковах багажа, се запътих към офиса на домакините ми от литературната и културна Асоциация KROKODIL, за да се запознаем на живо. Задавайки маршрута натам в Google Maps, забелязах, че в непосредствено съседство до офиса се намира заведение, наречено „Jazz башта“.
Реших да интерпретирам това като някакво шеговито намигване от баща ми по случай Деня на детето, който той така и не бе спрял да ми честити дълго след като вече не бях в детска възраст. Стана ми мило и малко мъчно.
Чувството за носталгия се засили, когато стигнах до сградата, където се помещаваше асоциацията – на фасадата наистина висеше табела Bašta, този път на латиница, но съвсем неподготвена всъщност ме хвана това, че малкото дворно пространство отпред беше покрито с жълти павета – досущ като софийските! Освен родния ми баща, сякаш и родният ми град, където бях прекарала детството си, ми „намигваше“ по случай Деня на детето.
Залисана в проследяването на произхода на паветата, който, разбира се, тръгва от Будапеща, тогава така и не проверих значението на думата, нито разбрах какъв ще да е този джазов „башта“.
Няколко седмици по-късно дойде мой ред мислено да намигна на баща си – знаех, че на много места по света Денят на бащата се чества в третата неделя на месец юни, макар и никога да не го бяхме отбелязвали, докато баща ми беше жив. Точно в тази неделя обаче се случи да мина покрай Bašta u Mišarskoj – заведение с двор на улица „Мишарска“, което точно в този ден се оказа затворено, но онлайн ревю го описваше като „Једна од најпријатнијих башти у граду“.
Тогава разбрах, че сръбската дума „башта“, освен че е в женски, а не в мъжки род и се произнася с ударение върху първата, а не върху втората сричка,
всъщност означава не „баща“, а „градина“.
По-точна дефиниция на думата получих скоро след това от изтъкнатата преводачка от и на сръбски език Мария-Йоанна Стоядинович: „Обикновено „башта“ се ползва както за малка домашна градина със зеленчук, тук-там цвете и по някое плодно дръвче, така и за двор.“ Обяснението ѝ се появи под пост на Георги Господинов във Facebook, където той бе публикувал няколко снимки на цъфнали рози, череши и други растения, които доста точно илюстрираха горната дефиниция, а неговото пояснение към снимките – „Градината на баща ми…“ – идеално, макар и напълно случайно обхващаше моето първоначално объркване между „башта“ и „баща“.
Случи се така, че попаднах на снимките, докато пътувах с автобус към хотела на майка ми и вуйчо ми¹, които току що бяха пристигнали в Белград. Когато в следващия момент отворих Google Maps, за да проверя колко спирки ми остават, попаднах на поредно странно съвпадение. Синята точка, която показваше местоположението ми на картата, тъкмо преминаваше покрай голям зелен петоъгълник, чието обозначение звучеше, все едно някой на шега е превел гореспоменатото „Градината на баща ми…“, без да знае сръбски: Botanička bašta.
През изминалите няколко седмици бях минавала покрай желязната ограда² на „Булевар деспота Стефана“ десетки пъти, но така и не бях обърнала внимание, че от другата ѝ страна се намира Ботаническата градина „Јевремовац“, принадлежаща на белградската алма-матер. (Моята собствена и съвсем буквална „майка хранителка“ междувременно ме очакваше няколко спирки по-нататък.)
С малко допълнителни проучвания разбрах, че сръбската дума „башта“ – подобно на остарялата диалектна българска дума за зеленчукова градина „бахча“ (макар че и тук ударенията се разминават) – произлиза от османотурската باغچه (bâğçe), преминала в съвременния турски като bahçe, тоест „градина“. Първоначално думата е заета от персийски – باغچه (bâğče), умалителна от باغ (bâğ), която тя на свой ред означава „градина“ или „лозе“, но също така и – забележете! – „светът“ и „лицето на любимия/любимата“³. За неин първоизточник се смята праиндоиранската дума *bʰāgás („част“, „дял“, „парцел“), съответно от праиндоевропейската *bʰeh₂g- („разделям“, „разпределям“).
Това може и да обяснява произхода на сръбската „башта“, но не помага особено за изясняването на етимологията на българската дума „баща“. Самата дума „баща“ не се среща в останалите славянски езици, като в повечето от тях родителят от мъжки пол се обозначава със сходни на съществуващите и на български синоними, макар те да принадлежат към доста различни регистри. В македонския език например за „баща“ се използва „татко“, в сръбски и хърватски – „отац“ и otac, в чешки и словашки – otec, в полски – ojciec, и т.н.
Любопитен е случаят с украинския, на който „баща“ – тоест най-неутралната дума за „мъжа родител“ – е „батько“. А на руски, макар и прекият еквивалент на „баща“ да е „отец“, речниците предлагат и думите „батька“, „батя“, „батюшка“ като синоними, но определят първите две като остарели и/или рядко използвани думи, а „батюшка“ – като обръщение към възрастен човек или свещеник. Същевременно нито на украински, нито на руски съществува еквивалент на българската дума „батко“ – вместо нея и двата езика използват описателната фраза „старший брат“.
Обяснението за произхода на думата „баща“, както се оказва, се крие точно в тези роднински връзки и тяхното преплитане.
Българският етимологичен речник проследява произхода на „баща“ до праславянската дума *bat-(i)-ja, умалително от *brаt(r)ъ,
и набързо ни отпраща към заглавките „бате“ и „брат“. Други източници стигат по-назад, сочейки индоевропейската дума *bʰréh₂tēr („брат“) за първоизточник на праславянската *bratrъ.
Не става съвсем ясно точно как и защо думата освен „по-голям брат“ приема и значението на „баща“, но се смята, че праславянската *batę (умалителна от *batь⁴) вече съдържа и двете значения, както и по-общото „по-възрастен роднина“⁵.
Руският лингвист и славист Алексей Соболевски пък развива теория, според която праславянската *batь произлиза от праиранската *pHtā („баща“), която на свой ред идва от праиндоевропейската *ph₂tḗr („баща“) – от *peh₂- („защитавам, грижа се, водя“, както пастир води стадо). Ако приемем тази теория за достоверна, може да се окаже, че българската дума „баща“ всъщност споделя праиндоевропейските корени на своите германски и романски еквиваленти (father, Vater, père, padre и т.н.)
И докато сме на темата за корените: въпреки че, както споменах по-горе, думата „баща“ сама по себе си не съществува на останалите славянски езици, тя все пак се появява като основа на някои думи в тях. Етимологичният речник посочва сърбохърватските „баштина“ (‘родно място’, ‘бащино наследство’) и „баштиник“/„баштиница“ (‘наследник/наследница на бащин имот’) като нейни производни. „Баштина“ на сръбски и македонски означава „наследство“, а на сръбски съществува и думата „разбаштинити“, тоест „лишаване от наследство“.
Но още по-изненадващо се оказва преминаването на думата „баща“ като корен на думи на несродни на българския езици, например румънската baştină („произход“) и гръцката μπάστινα (bastina, „имот, имение“)⁶. С по-старото си значение думата даже е стигнала и до родното място на жълтите павета заедно с множеството славянски думи, свързани с градинарството – на унгарски bátya се използва за „по-голям брат“, а вече остарялата nagybátya (буквално „голям батко“) означава „чичо“.⁷
И още нещо за корените:
Моят баща никога през живота си не бе проявявал градинарски наклонности. Стана така обаче, че есента, преди да си отиде – под вещото ръководство на майка ми, – той засади цяла леха рози в двора (сърбите биха казали „баштата“) на семейната ни къща, покри резниците с буркани за през зимата, но така и не доживя пролетта, за да ги види как разцъфват. С всяка изминала година, откакто го няма, розите на баща ми стават все по-големи, а първите им пъпки неизменно се появяват около 1 юни.
1 В произхода на думата „вуйчо“ също се наблюдава смесване на понятия за мъже роднини от различни възрасти: смята се, че тя произлиза от праславянската дума *ujь, която на свой ред произлиза от праиндоевропейската *h₂ewh₂yos, означаваща както „чичо по майчина линия“, така и „дядо“, пак по майчина линия.
2 Думата „ограда“ споделя произхода си с думата „градина” – не само на български и на останалите славянски езици (особено видимо е на полски, където ogród означава „градина“), но и на много други езици, на които и двете думи произлизат от праиндоевропейската *gʰórdʰos („плет, ограда, заграждение“).
3 Източник на дефинициите на персийската дума باغ (bâğ): Steingass, Francis Joseph. A Comprehensive Persian-English dictionary, including the Arabic words and phrases to be met with in Persian literature. London: Routledge & K. Paul, 1892.
4 Особено трогателна е теорията на немския лингвист и славист Ерик Бернекер и на чешкия лингвист Вацлав Махек, които предполагат, че умалителната форма *batь се появява в резултат от бебешкото произношение на праславянската дума *bratrъ („брат“).
5 Някои източници отбелязват морфологичната прилика на *batь с други праславянски думи, които също завършват на *-tь и се отнасят към роднини от мъжки пол: например *zętь („зет“), *tьstь („тъст“) и *netь („племенник“). Въпреки че последната дума не съществува в съвременния български език, тя споделя един и същ праиндоевропейски корен (*népōts, тоест „племенник“, „внук“) с думата „непотизъм“.
6 Особено хубаво ми се струва, че думата „градина“ (γραδίνα) е заета в гръцки, където – както е отбелязано в Българския етимологичен речник – означава „вид грозде“. Това пък създава асоциации с персийския корен на думата, който освен „градина“ означава и „лозе“.
7 В българския език думата „чичо“ е заета от османотурския – چیچه (çiçe). Но и тук понятията се смесват между възрасти и родове – на съвременен турски език, където отсъстват маркери за граматичен род, освен „чичо“ думата çiçe може да означава както „леля“, така и „по-голяма сестра“. Тъй като думата е диалектна, а не книжовна обаче, търсенето ѝ в речници обикновено отправя към друга доста близка, макар и не етимологично свързана дума: çiçek. А тя означава „цвете“.
В рубриката „От дума на дума“ Екатерина Петрова търси актуални, интересни или новопоявили се думи от нашето ежедневие и проследява често изненадващия им произход, развитието на значенията им във времето и взаимовръзките им с близки и далечни езици.
Go module proxy at Grab
Post Syndicated from Grab Tech original https://engineering.grab.com/go-module-proxy
At Grab, we rely heavily on a large Go monorepo for backend development, which offers benefits like code reusability and discoverability. However, as we continue to grow, managing a large monorepo brings about its own set of unique challenges.
As an example, using Go commands such as go get and go list can be incredibly slow when fetching Go modules residing in a large multi-module repository. This sluggishness takes a toll on developer productivity, burdens our Continuous Integration (CI) systems, and strains our Version Control System host (VCS), GitLab.
In this blog post, we look at how Athens, a Go module proxy, helps to improve the overall developer experience of engineers working with a large Go monorepo at Grab.
Key highlights
- We reduced the time of executing the
go getcommand from ~18 minutes to ~12 seconds when fetching monorepo Go modules. - We scaled in and scaled down our entire Athens cluster by 70% by utilising the fallback network mode in Athens along with Golang’s
GOVCSmode, resulting in cost savings and enhanced efficiency.
Problem statements and solutions
1. Painfully slow performance of Go commands
Problem summary: Running the go get command in our monorepo takes a considerable amount of time and can lead to performance degradation in our VCS.
When working with the Go programming language, go get is one of the most common commands that you’ll use every day. Besides developers, this command is also used by CI systems.
What does go get do?
The go get command is used to download and install packages and their dependencies in Go. Note that it operates differently depending on whether it is run in legacy GOPATH mode or module-aware mode. In Grab, we’re using the module-aware mode in a multi-module repository setup.
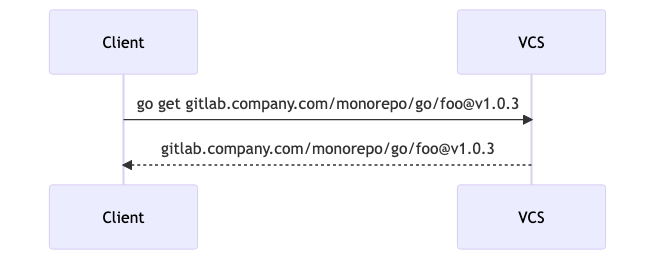
Every time go get is run, it uses Git commands, like git ls-remote, git tag, git fetch, etc, to search and download the entire worktree. The excessive use of these Git commands on our monorepo contributes to the long processing time and can be strenuous to our VCS.
How big is our monorepo?
To fully grasp the challenges faced by our engineering teams, it’s crucial to understand the vast scale of the monorepo that we work with daily. For this, we use git-sizer to analyse our monorepo.
Here’s what we found:
- Overall repository size: The monorepo has a total uncompressed size of 69.3 GiB, a fairly substantial figure. To put things into perspective, the Linux kernel repository, known for its vastness, currently stands at 55.8 GiB.
- Trees: The total number of trees is 3.21M and tree entries are 99.8M, which consume 3.65 GiB. This may cause performance issues during some Git operations.
- References: Totalling 10.7k references.
- Biggest checkouts: There are 64.7k directories in our monorepo. This affects operations like
git statusandgit checkout. Moreover, our monorepo has a maximum path depth of 20. This contributes to a slow processing time on Git and negatively impacts developer experience. The number of files (354k) and the total size of files (5.08 GiB) are also concerns due to their potential impact on the repository’s performance.
To draw a comparison, refer to the git-sizer output of the Linux repository.
How slow is “slow”?
To illustrate the issue further, we will compare the time taken for various Go commands to fetch a single module in our monorepo at a 10 MBps download speed.
This is an example of how a module is structured in our monorepo:
gitlab.company.com/monorepo/go
  |-- go.mod
  |-- commons/util/gk
        |-- go.mod
| Go commands | GOPROXY | Previously cached? | Description | Result (time taken) |
|---|---|---|---|---|
go get -x gitlab.company.com/monorepo/go/commons/util/gk |
proxy.golang.org,direct | Yes | Download and install the latest version of the module. This is a common scenario that developers often encounter. | 18:50.71 minutes |
go get -x gitlab.company.com/monorepo/go/commons/util/gk |
proxy.golang.org,direct | No | Download and install the latest version of the module without any module cache | 1:11:54.56 hour |
go list -x -m -json -versions gitlab.company.com/monorepo/go/util/gk |
proxy.golang.org,direct | Yes | List information about the module | 3.873 seconds |
go list -x -m -json -versions gitlab.company.com/monorepo/go/util/gk |
proxy.golang.org,direct | No | List information about the module without any module cache | 3:18.58 minutes |
In this example, using go get to fetch a module took over 18 minutes to complete. If we needed to retrieve more than one module in our monorepo, it can be incredibly time-consuming.
Why is it slow in a monorepo?
In a large Go monorepo, go get commands can be slow due to several factors:
- Large number of files and directories: When running
go get, the command needs to search and download the entire worktree. In a large multi-module monorepo, the vast number of files and directories make this search process very expensive and time-consuming. - Number of refs: A large number of refs (branches or tags) in our monorepo can affect performance. Ref advertisements (
git ls-remote), which contain every ref in our monorepo, are the first phase in any remote Git operation, such asgit cloneorgit fetch. With a large number of refs, performance takes a hit when performing these operations. - Commit history traversal: Operations that need to traverse a repository’s commit history and consider each ref will be slow in a monorepo. The larger the monorepo, the more time-consuming these operations become.
The consequences: Stifled productivity and strained systems
Developers and CI
When Go command operations like go get are slow, they contribute to significant delays and inefficiencies in software development workflows. This leads to reduced productivity and demotivated developers.
Optimising Go command operations’ speed is crucial to ensure efficient software development workflows and high-quality software products.
Version Control System
It’s also worth noting that overusing go get commands can also lead to performance issues for VCS. When Go packages are frequently downloaded using go get, we saw that it caused a bottleneck in our VCS cluster, which can lead to performance degradation or even cause rate-limiting queue issues.
This negatively impacts the performance of our VCS infrastructure, causing delays or sometimes unavailability for some users and CI.
Solution: Athens + fallback Network Mode + GOVCS + Custom Cache Refresh Solution
Problem summary: Speed up go get command by not fetching from our VCS
We addressed the speed issue by using Athens, a proxy server for Go modules (read more about the GOPROXY protocol).
How does Athens work?
The following sequence diagram describes the default flow of go get command with Athens.
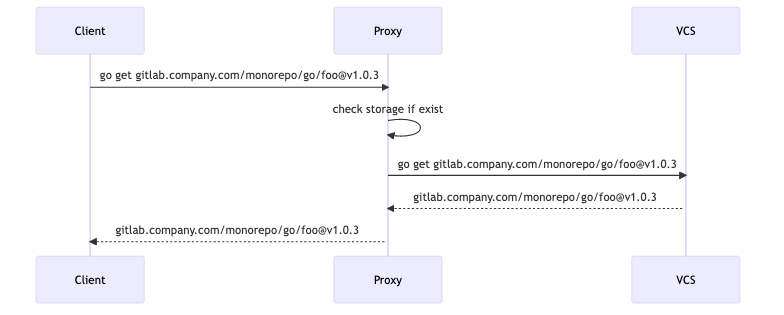
Athens uses a storage system for Go module packages, which can also be configured to use various storage systems such as Amazon S3, and Google Cloud Storage, among others.
By caching these module packages in storage, Athens can serve the packages directly from storage rather than requesting them from an upstream VCS while serving Go commands such as go mod download and certain go build modes. However, just using a Go module proxy didn’t fully resolve our issue since the go get and go list commands still hit our VCS through the proxy.
With this in mind, we thought “what if we could just serve the Go modules directly from Athens’ storage for go get?” This question led us to discover Athens network mode.
What is Athens network mode?
Athens NetworkMode configures how Athens will return the results of the Go commands. It can be assembled from both its own storage and the upstream VCS. As of Athens v0.12.1, it currently supports these 3 modes:
- strict: merge VCS versions with storage versions, but fail if either of them fails.
- offline: only get storage versions, never reach out to VCS.
- fallback: only return storage versions, if VCS fails. Fallback mode does the best effort of giving you what’s available at the time of requesting versions.
Our Athens clusters were initially set to use strict network mode, but this was not ideal for us. So we explored the other network modes.
Exploring offline mode
We initially sought to explore the idea of putting Athens in offline network mode, which would allow Athens to serve Go requests only from its storage. This concept aligned with our aim of reducing VCS hits while also leading to significant performance improvement in Go workflows.

However in practice, it’s not an ideal approach. The default Athens setup (strict mode) automatically updates the module version when a user requests a new module version. Nevertheless, switching Athens to offline mode would disable the automatic updates as it wouldn’t connect to the VCS.
Custom cache refresh solution
To solve this, we implemented a CI pipeline that refreshes Athens’ module cache whenever a new module is released in our monorepo. Employing this with offline mode made Athens effective for the monorepo but it resulted in the loss of automatic updates for other repositories
Restoring this feature requires applying our custom cache refresh solution to all other Go repositories. However, implementing this workaround can be quite cumbersome and significant additional time and effort. We decided to look for another solution that would be easier to maintain in the long run.
A balanced approach: fallback Mode and GOVCS
This approach builds upon our aforementioned custom cache refresh which is specifically designed for the monorepo.
We came across the GOVCS environment variable, which we use in combination with the fallback network mode to effectively put only the monorepo in “offline” mode.
When GOVCS is set to gitlab.company.com/monorepo/go:off, Athens encounters an error whenever it tries to fetch modules from VCS:
gitlab.company.com/monorepo/go/commons/util/[email protected]: unrecognized import path "gitlab.company.com/monorepo/go/commons/util/gk": GOVCS disallows using git for private gitlab.company.com/monorepo/go; see 'go help vcs'
If Athens network mode is set to strict, Athens returns 404 errors to the user. By switching to fallback mode, Athens tries to retrieve the module from its storage if a GOVCS failure occurs.
Here’s the updated Athens configuration (example default config):
GoBinaryEnvVars = ["GOPROXY=direct",
"GOPRIVATE=gitlab.company.com",
"GOVCS=gitlab.company.com/monorepo/go:off"]

NetworkMode = "fallback"
With the custom cache refresh solution coupled with this approach, we not only accelerate the retrieval of Go modules within the monorepo but also allow for automatic updates for non-monorepo Go modules.
Final results
This solution resulted in a significant improvement in the performance of Go commands for our developers. With Athens, the same command is completed in just ~12 seconds (down from ~18 minutes), which is impressively fast.
| Go commands | GOPROXY | Previously cached? | Description | Result (time taken) |
|---|---|---|---|---|
go get -x gitlab.company.com/monorepo/go/commons/util/gk |
goproxy.company.com | Yes | Download and install the latest version of the module. This is a common scenario that developers often encounter. | 11.556 seconds |
go get -x gitlab.company.com/monorepo/go/commons/util/gk |
goproxy.company.com | No | Download and install the latest version of the module without any module cache | 1:05.60 minutes |
go list -x -m -json -versions gitlab.company.com/monorepo/go/util/gk |
goproxy.company.com | Yes | List information about the monorepo module | 0.592 seconds |
go list -x -m -json -versions gitlab.company.com/monorepo/go/util/gk |
goproxy.company.com | No | List information about the monorepo module without any module cache | 1.023 seconds |
 |
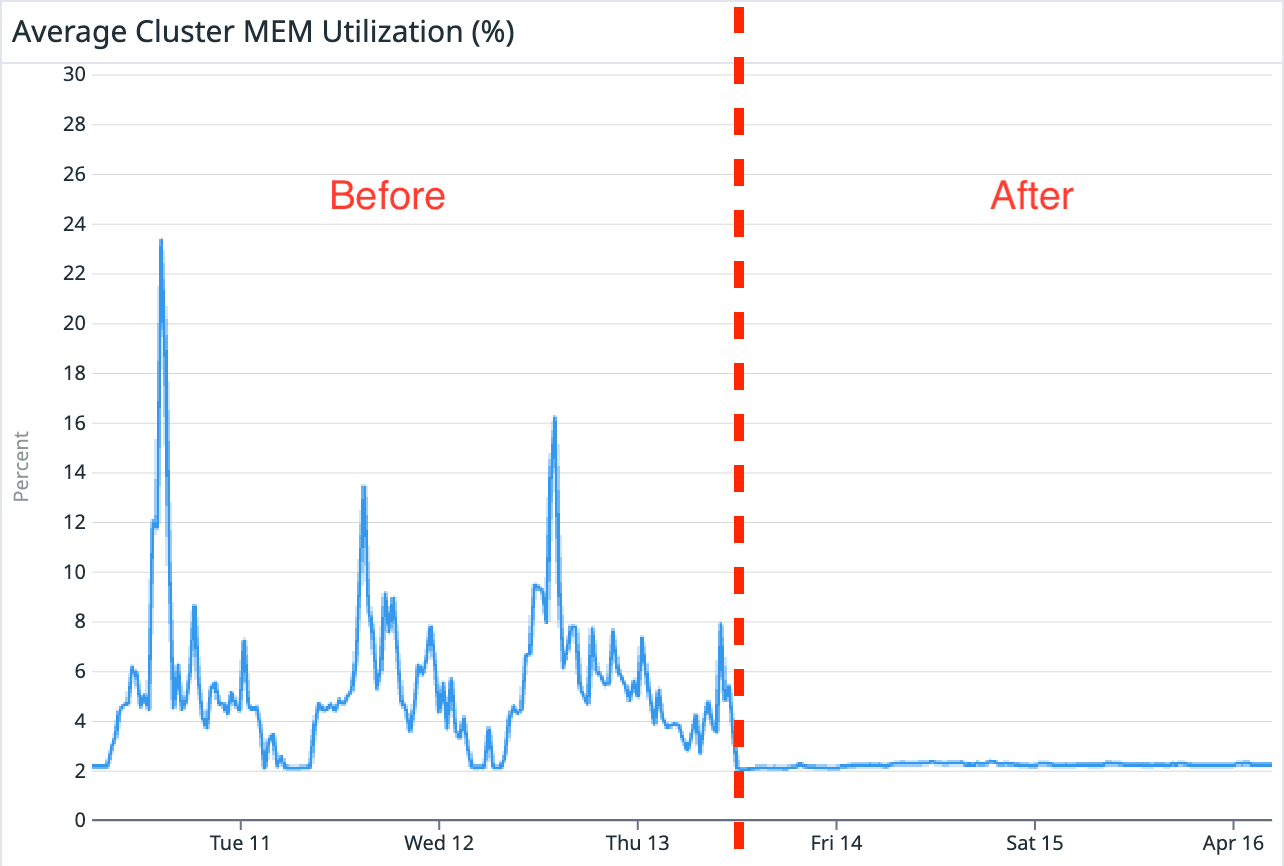 |
In addition, this change to our Athens cluster also leads to substantial reduction in average cluster CPU and memory utilisation. This also enabled us to scale in and scale down our entire Athens cluster by 70%, resulting in cost savings and enhanced efficiency. On top of that, we were also able to effectively eliminate VCS’s rate-limiting issues while making the monorepo’s command operation considerably faster.
2. Go modules in GitLab subgroups
Problem summary: Go modules are unable to work natively with private or internal repositories under GitLab subgroups.
When it comes to managing code repositories and packages, GitLab subgroups and Go modules have become an integral part of the development process at Grab. Go modules help to organise and manage dependencies, and GitLab subgroups provide an additional layer of structure to group related repositories together.
However, a common issue when using Go modules is that they do not work natively with private or internal repositories under a GitLab subgroup (see this GitHub issue).
For example, using go get to retrieve a module from gitlab.company.com/gitlab-org/subgroup/repo will result in a failure. This problem is not specific to Go modules, all repositories under the subgroup will face the same issue.
A cumbersome workaround
To overcome this issue, we had to use workarounds. One workaround is to authenticate the HTTPS calls to GitLab by adding authentication details to the .netrc file on your machine.
The following lines can be added to the .netrc file:
machine gitlab.company.com
    login [email protected]
    password <personal-access-token>
In our case, we are using a Personal Access Token (PAT) since we have 2FA enabled. If 2FA is not enabled, the GitLab password can be used instead. However, this approach would mean configuring the .netrc file in the CI environments as well as on the machine of every Go developer.
Solution: Athens + .netrc
A feasible solution is to set up the .netrc file in the Go proxy server. This method eliminates the need for N number of developers to configure their own .netrc files. Instead, the responsibility for this task is delegated to the Go proxy server.
3. Sharing common libraries
Problem summary: Distributing internal common libraries within a monorepo without granting direct repository access can be challenging.
At Grab, we work with various cross-functional teams, and some could have distinct network access like different VPNs. This adds complexity to sharing our monorepo’s internal common libraries with them. To maintain the security and integrity of our monorepo, we use a Go proxy for controlled access to necessary libraries.
The key difference between granting direct access to the monorepo via VCS and using a Go proxy is that the former allows users to read everything in the repository, while the latter enables us to grant access only to the specific libraries users need within the monorepo. This approach ensures secure and efficient collaboration across diverse network configurations.
Without Go module proxy
Without Athens, we would need to create a separate repository to store the code we want to share and then use a build system to automatically mirror the code from the monorepo to the public repository.
This process can be cumbersome and lead to inconsistencies in code versions between the two repositories, ultimately making it challenging to maintain the shared libraries.
Furthermore, copying code can lead to errors and increase the risk of security breaches by exposing confidential or sensitive information.
Solution: Athens + Download Mode File
To tackle this problem statement, we utilise Athens’ download mode file feature using an allowlist approach to specify which repositories can be downloaded by users.
Here’s an example of the Athens download mode config file:
downloadURL = "https://proxy.golang.org"

mode = "sync"

download "gitlab.company.com/repo/a" {
    mode = "sync"
}

download "gitlab.company.com/repo/b" {
    mode = "sync"
}

download "gitlab.company.com/*" {
    mode = "none"
}
In the configuration file, we specify allowlist entries for each desired repo, including their respective download modes. For example, in the snippet above, repo/a and repo/b are allowed (mode = “sync”), while everything else is blocked using mode = “none”.
Final results
By using Athens’ download mode feature in this case, the benefits are clear. Athens provides a secure, centralised place to store Go modules. This approach not only provides consistency but also improves maintainability, as all code versions are managed in one single location.
Additional benefits of Go proxy
As we’ve touched upon the impressive results achieved by implementing Athens Go proxy at Grab, it’s crucial to explore the supplementary advantages that accompany this powerful solution.
These unsung benefits, though possibly overlooked, play a vital role in enriching the overall developer experience at Grab and promoting more robust software development practices:
- Module immutability: As the software world continues to face issues around changing or disappearing libraries, Athens serves as a useful tool in mitigating build disruptions by providing immutable storage for copied VCS code. The use of a Go proxy also ensures that builds remain deterministic, improving consistency across our software.
- Uninterrupted development: Athens allows users to fetch dependencies even when VCS is down, ensuring continuous and seamless development workflows.
- Enhanced security: Athens offers access control by enabling the blocking of specific packages within Grab. This added layer of security protects our work against potential risks from malicious third-party packages.
- Vendor directory removal: Athens prepares us for the eventual removal of the vendor directory, fostering faster workflows in the future.
What’s next?
Since adopting Athens as a Go module proxy, we have observed considerable benefits, such as:
- Accelerated Go command operations
- Reduced infrastructure costs
- Mitigated VCS load issues
Moreover, its lesser-known advantages like module immutability, uninterrupted development, enhanced security, and vendor directory transition have also contributed to improved development practices and an enriched developer experience for Grab engineers.
Today, the straightforward process of exporting three environment variables has greatly influenced our developers’ experience at Grab.
export GOPROXY="goproxy.company.com|proxy.golang.org,direct"

export GONOSUMDB="gitlab.company.com"

export GONOPROXY="none"
At Grab, we are always looking for ways to improve and optimise the way we work, so we contribute to open-sourced projects like Athens, where we help with bug fixes. If you are interested in setting up a Go module proxy, do give Athens (github.com/gomods/athens) a try!
Special thanks to Swaminathan Venkatraman, En Wei Soh, Anuj More, Darius Tan, and Fernando Christyanto for contributing to this project and this article.
Join us
Grab is the leading superapp platform in Southeast Asia, providing everyday services that matter to consumers. More than just a ride-hailing and food delivery app, Grab offers a wide range of on-demand services in the region, including mobility, food, package and grocery delivery services, mobile payments, and financial services across 428 cities in eight countries.
Powered by technology and driven by heart, our mission is to drive Southeast Asia forward by creating economic empowerment for everyone. If this mission speaks to you, join our team today!
Real Estate Analysis
Post Syndicated from original https://xkcd.com/2796/

Martin Jerry Pre-Flashed TASMOTA
Post Syndicated from digiblurDIY original https://www.youtube.com/watch?v=a7dLmXKuRQY
Four Signs You Need to Consolidate Your Tech Stack
Post Syndicated from Rapid7 original https://blog.rapid7.com/2023/06/29/four-signs-you-need-to-consolidate-your-tech-stack/

Recently, Gartner surveyed security professionals and found that over 50% of the respondents were looking to consolidate their security tech stack. Why? These professionals recognized that consolidation is key to achieving their goals of improving productivity, visibility, and reporting as well as bridging staff resourcing gaps.
Additionally, threat actors are leveraging artificial intelligence (AI) and machine learning tools to launch more sophisticated, high-impact attacks. Defending against AI-assisted attacks requires greater network visibility and operational efficiency—not to mention the automated detection and response capabilities in most consolidation offerings. As the threat landscape evolves, streamlining your tech stack can also improve your organization’s security posture and protect against financial losses. This is an important consideration, as the cost of the average data breach has reached $9.44 million in the U.S.
While the benefits of consolidation are clear, organizations often miss the tell-tale signs that it is time to consolidate their tech stack. Recognizing these signs can help your organization identify the areas where it’s most needed and develop a seamless implementation strategy that minimizes disruption.
Four tell-tale signs it’s time to consolidate your security tools
Sign #1: You can’t track (or visualize) your tech stack
When was the last time you cataloged your resources? This may seem a little on the nose, but one of the best ways to tell if your organization is in need of consolidation is that you’re unable to track or visualize your tech stack.
In 2021, IBM found that 45% of security teams used more than 20 tools when investigating and responding to a cybersecurity incident. These tools are a drain on your budget and can even present security risks. Excess tech is less likely to be monitored for compliance and needlessly broadens your network’s attack surface.
Visibility into your tech stack is just as important as visibility across your network. The inability to track and visualize your tech stack can indicate that your organization is working with tools that are obsolete, underutilized, or ignored.
Sign #2: Your mean time to resolve (MTTR) is high
Did you know it takes the average company a staggering 277 days to identify and contain a breach? Finding and resolving breaches quickly is key to protecting your systems and data. When your MTTR is high, it’s indicative of operational inefficiencies in your security responses.
Working with too many vendors and tools can make it difficult to prioritize and respond to threats. For example, if you’re working with redundant tools, event data from one tool may conflict with another, and your team is forced to spend precious time confirming which dataset is correct before it can respond to the security incident.
Siloed tools from a variety of vendors are another common pain point. Even if you’re using “best of breed” tools, a cobbled together security solution of multiple vendors can create issues. Tools from different vendors may not integrate well (if at all). Consequently, your team may be missing crucial alerts and experiencing a breakdown in workflows as data is transferred from one tool to another.
Sign #3: Your processes are manual
If your team is wasting valuable time manually investigating false positives, prioritizing risks, and drawing context from massive datasets, consolidation could be the solution. Manual investigation is also error-prone, and teams often find that important security events are missed entirely or slip through the cracks until they become pervasive, system-wide concerns. As a result, you may be able to track your team’s elevated MTTR rate back to manual resolution workflows.
Consolidated security platforms offer the crucial automation features that companies need to close skill and staffing resource gaps, as well. Consolidating with automation in mind can simplify and improve your team’s workflows, ensuring that your team is able to respond to threats faster and reduce overall risk across your infrastructure—even if your organization is understaffed. Finally, removing the burden of manual investigation can increase your team’s productivity, free up resources, and create space for senior staff to work on other projects.
Sign #4: Compliance is a struggle
If you’re working with a variety of vendors and security tools, compliance can be problematic. You may find that each vendor’s approach to compliance varies widely, and it’s nearly impossible to impose a consistent standard of compliance across your entire network.
Network applications are difficult to update and secure if your organization struggles to maintain visibility in its tech stack. Also, gathering data across your infrastructure for compliance audits is complicated when you have redundant tools, disagreement between the datasets, and no single source of truth.
Whether your organization is in a highly regulated industry or not, maintaining a compliant network is important. Organizations that maintain compliant networks can resolve configuration-related vulnerabilities faster, creating a baseline for security practices and IT operations.
Following governmental compliance regulations can help your organization enhance its data management capabilities. There are also serious drawbacks to a non-compliant network. Depending on your industry, if your network is non-compliant, you may be required to pay hefty fines. Additionally, non-compliant networks are less secure; they’re prone to configuration vulnerabilities and a host of other issues.
When it comes to consolidation, don’t ignore the signs
Knowing the signs of a tech stack in need of consolidation can save your organization a considerable amount of time, money, and frustration. Some companies worry about giving up “best of breed” security options. However, consolidation is increasingly considered more secure than “best of breed.”
For many organizations, the security advantage of narrowing your attack surface, automating processes, and streamlining data far outweighs the individual benefits of separate solutions and multiple vendors. As the threat landscape evolves, it’s increasingly important to have a streamlined tech stack that can deliver the security support needed to effectively mitigate risk.
Want to learn more about consolidation and where to get started? Check out our eBook, “The Case for Security Vendor Consolidation.”
Exploring Breakthroughs, From Steam Engines to AI Chatbots | The Atlantic’s Progress Summit
Post Syndicated from The Atlantic original https://www.youtube.com/watch?v=10FQuXN78j0
Migrate from Amazon Kinesis Data Analytics for SQL Applications to Amazon Kinesis Data Analytics Studio
Post Syndicated from Nicholas Tunney original https://aws.amazon.com/blogs/big-data/migrate-from-amazon-kinesis-data-analytics-for-sql-applications-to-amazon-kinesis-data-analytics-studio/
Amazon Kinesis Data Analytics makes it easy to transform and analyze streaming data in real time.
In this post, we discuss why AWS recommends moving from Kinesis Data Analytics for SQL Applications to Amazon Kinesis Data Analytics for Apache Flink to take advantage of Apache Flink’s advanced streaming capabilities. We also show how to use Kinesis Data Analytics Studio to test and tune your analysis before deploying your migrated applications. If you don’t have any Kinesis Data Analytics for SQL applications, this post still provides a background on many of the use cases you’ll see in your data analytics career and how Amazon Data Analytics services can help you achieve your objectives.
Kinesis Data Analytics for Apache Flink is a fully managed Apache Flink service. You only need to upload your application JAR or executable, and AWS will manage the infrastructure and Flink job orchestration. To make things simpler, Kinesis Data Analytics Studio is a notebook environment that uses Apache Flink and allows you to query data streams and develop SQL queries or proof of concept workloads before scaling your application to production in minutes.
We recommend that you use Kinesis Data Analytics for Apache Flink or Kinesis Data Analytics Studio over Kinesis Data Analytics for SQL. This is because Kinesis Data Analytics for Apache Flink and Kinesis Data Analytics Studio offer advanced data stream processing features, including exactly-once processing semantics, event time windows, extensibility using user-defined functions (UDFs) and custom integrations, imperative language support, durable application state, horizontal scaling, support for multiple data sources, and more. These are critical for ensuring accuracy, completeness, consistency, and reliability of data stream processing and are not available with Kinesis Data Analytics for SQL.
Solution overview
For our use case, we use several AWS services to stream, ingest, transform, and analyze sample automotive sensor data in real time using Kinesis Data Analytics Studio. Kinesis Data Analytics Studio allows us to create a notebook, which is a web-based development environment. With notebooks, you get a simple interactive development experience combined with the advanced capabilities provided by Apache Flink. Kinesis Data Analytics Studio uses Apache Zeppelin as the notebook, and uses Apache Flink as the stream processing engine. Kinesis Data Analytics Studio notebooks seamlessly combine these technologies to make advanced analytics on data streams accessible to developers of all skill sets. Notebooks are provisioned quickly and provide a way for you to instantly view and analyze your streaming data. Apache Zeppelin provides your Studio notebooks with a complete suite of analytics tools, including the following:
- Data visualization
- Exporting data to files
- Controlling the output format for easier analysis
- Ability to turn the notebook into a scalable, production application
Unlike Kinesis Data Analytics for SQL Applications, Kinesis Data Analytics for Apache Flink adds the following SQL support:
- Joining stream data between multiple Kinesis data streams, or between a Kinesis data stream and an Amazon Managed Streaming for Apache Kafka (Amazon MSK) topic
- Real-time visualization of transformed data in a data stream
- Using Python scripts or Scala programs within the same application
- Changing offsets of the streaming layer
Another benefit of Kinesis Data Analytics for Apache Flink is the improved scalability of the solution once deployed, because you can scale the underlying resources to meet demand. In Kinesis Data Analytics for SQL Applications, scaling is performed by adding more pumps to persuade the application into adding more resources.
In our solution, we create a notebook to access automotive sensor data, enrich the data, and send the enriched output from the Kinesis Data Analytics Studio notebook to an Amazon Kinesis Data Firehose delivery stream for delivery to an Amazon Simple Storage Service (Amazon S3) data lake. This pipeline could further be used to send data to Amazon OpenSearch Service or other targets for additional processing and visualization.
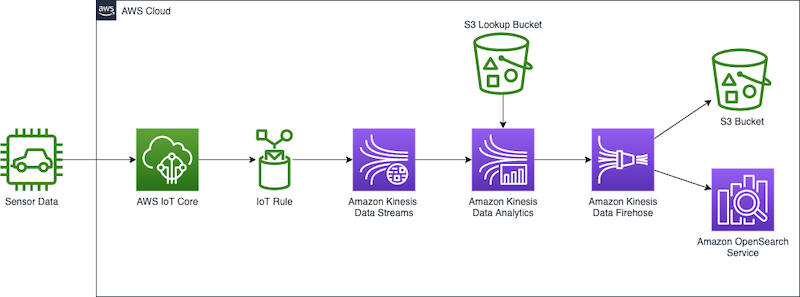
Kinesis Data Analytics for SQL Applications vs. Kinesis Data Analytics for Apache Flink
In our example, we perform the following actions on the streaming data:
- Connect to an Amazon Kinesis Data Streams data stream.
- View the stream data.
- Transform and enrich the data.
- Manipulate the data with Python.
- Restream the data to a Firehose delivery stream.
To compare Kinesis Data Analytics for SQL Applications with Kinesis Data Analytics for Apache Flink, let’s first discuss how Kinesis Data Analytics for SQL Applications works.
At the root of a Kinesis Data Analytics for SQL application is the concept of an in-application stream. You can think of the in-application stream as a table that holds the streaming data so you can perform actions on it. The in-application stream is mapped to a streaming source such as a Kinesis data stream. To get data into the in-application stream, first set up a source in the management console for your Kinesis Data Analytics for SQL application. Then, create a pump that reads data from the source stream and places it into the table. The pump query runs continuously and feeds the source data into the in-application stream. You can create multiple pumps from multiple sources to feed the in-application stream. Queries are then run on the in-application stream, and results can be interpreted or sent to other destinations for further processing or storage.
The following SQL demonstrates setting up an in-application stream and pump:
CREATE OR REPLACE STREAM "TEMPSTREAM" (
   "column1" BIGINT NOT NULL,
   "column2" INTEGER,
   "column3" VARCHAR(64));

CREATE OR REPLACE PUMP "SAMPLEPUMP" AS
INSERT INTO "TEMPSTREAM" ("column1",
                          "column2",
                          "column3")
SELECT STREAM inputcolumn1,
      inputcolumn2,
      inputcolumn3
FROM "INPUTSTREAM";
Data can be read from the in-application stream using a SQL SELECT query:
SELECT *
FROM "TEMPSTREAM"
When creating the same setup in Kinesis Data Analytics Studio, you use the underlying Apache Flink environment to connect to the streaming source, and create the data stream in one statement using a connector. The following example shows connecting to the same source we used before, but using Apache Flink:
CREATE TABLE `MY_TABLE` (
   "column1" BIGINT NOT NULL,
   "column2" INTEGER,
   "column3" VARCHAR(64)
) WITH (
   'connector' = 'kinesis',
   'stream' = sample-kinesis-stream',
   'aws.region' = 'aws-kinesis-region',
   'scan.stream.initpos' = 'LATEST',
   'format' = 'json'
 );
MY_TABLE is now a data stream that will continually receive the data from our sample Kinesis data stream. It can be queried using a SQL SELECT statement:
SELECT column1,
       column2,
       column3
FROM MY_TABLE;
Although Kinesis Data Analytics for SQL Applications use a subset of the SQL:2008 standard with extensions to enable operations on streaming data, Apache Flink’s SQL support is based on Apache Calcite, which implements the SQL standard.
It’s also important to mention that Kinesis Data Analytics Studio supports PyFlink and Scala alongside SQL within the same notebook. This allows you to perform complex, programmatic methods on your streaming data that aren’t possible with SQL.
Prerequisites
During this exercise, we set up various AWS resources and perform analytics queries. To follow along, you need an AWS account with administrator access. If you don’t already have an AWS account with administrator access, create one now. The services outlined in this post may incur charges to your AWS account. Make sure to follow the cleanup instructions at the end of this post.
Configure streaming data
In the streaming domain, we’re often tasked with exploring, transforming, and enriching data coming from Internet of Things (IoT) sensors. To generate the real-time sensor data, we employ the AWS IoT Device Simulator. This simulator runs within your AWS account and provides a web interface that lets users launch fleets of virtually connected devices from a user-defined template and then simulate them to publish data at regular intervals to AWS IoT Core. This means we can build a virtual fleet of devices to generate sample data for this exercise.
We deploy the IoT Device Simulator using the following Amazon CloudFront template. It handles creating all the necessary resources in your account.
- On the Specify stack details page, assign a name to your solution stack.
- Under Parameters, review the parameters for this solution template and modify them as necessary.
- For User email, enter a valid email to receive a link and password to log in to the IoT Device Simulator UI.
- Choose Next.
- On the Configure stack options page, choose Next.
- On the Review page, review and confirm the settings. Select the check boxes acknowledging that the template creates AWS Identity and Access Management (IAM) resources.
- Choose Create stack.
The stack takes about 10 minutes to install.
- When you receive your invitation email, choose the CloudFront link and log in to the IoT Device Simulator using the credentials provided in the email.
The solution contains a prebuilt automotive demo that we can use to begin delivering sensor data quickly to AWS.
- On the Device Type page, choose Create Device Type.
- Choose Automotive Demo.
- The payload is auto populated. Enter a name for your device, and enter
automotive-topicas the topic.

- Choose Save.

Now we create a simulation.
- On the Simulations page, choose Create Simulation.
- For Simulation type, choose Automotive Demo.
- For Select a device type, choose the demo device you created.
- For Data transmission interval and Data transmission duration, enter your desired values.
You can enter any values you like, but use at least 10 devices transmitting every 10 seconds. You’ll want to set your data transmission duration to a few minutes, or you’ll need to restart your simulation several times during the lab.
- Choose Save.


Now we can run the simulation.
- On the Simulations page, select the desired simulation, and choose Start simulations.
Alternatively, choose View next to the simulation you want to run, then choose Start to run the simulation.
- To view the simulation, choose View next to the simulation you want to view.
If the simulation is running, you can view a map with the locations of the devices, and up to 100 of the most recent messages sent to the IoT topic.
We can now check to ensure our simulator is sending the sensor data to AWS IoT Core.
- Navigate to the AWS IoT Core console.
Make sure you’re in the same Region you deployed your IoT Device Simulator.
- In the navigation pane, choose MQTT Test Client.
- Enter the topic filter
automotive-topicand choose Subscribe.
As long as you have your simulation running, the messages being sent to the IoT topic will be displayed.

Finally, we can set a rule to route the IoT messages to a Kinesis data stream. This stream will provide our source data for the Kinesis Data Analytics Studio notebook.
- On the AWS IoT Core console, choose Message Routing and Rules.
- Enter a name for the rule, such as
automotive_route_kinesis, then choose Next.

- Provide the following SQL statement. This SQL will select all message columns from the
automotive-topicthe IoT Device Simulator is publishing:

- Choose Next.
- Under Rule Actions, select Kinesis Stream as the source.
- Choose Create New Kinesis Stream.
This opens a new window.
- For Data stream name, enter
automotive-data.
We use a provisioned stream for this exercise.

- Choose Create Data Stream.
You may now close this window and return to the AWS IoT Core console.
- Choose the refresh button next to Stream name, and choose the
automotive-datastream.

- Choose Create new role and name the role
automotive-role. - Choose Next.
- Review the rule properties, and choose Create.

The rule begins routing data immediately.
Set up Kinesis Data Analytics Studio
Now that we have our data streaming through AWS IoT Core and into a Kinesis data stream, we can create our Kinesis Data Analytics Studio notebook.
- On the Amazon Kinesis console, choose Analytics applications in the navigation pane.
- On the Studio tab, choose Create Studio notebook.

- Leave Quick create with sample code selected.
- Name the notebook
automotive-data-notebook.

- Choose Create to create a new AWS Glue database in a new window.
- Choose Add database.

- Name the database
automotive-notebook-glue. - Choose Create.

- Return to the Create Studio notebook section.
- Choose refresh and choose your new AWS Glue database.
- Choose Create Studio notebook.

- To start the Studio notebook, choose Run and confirm.

- Once the notebook is running, choose the notebook and choose Open in Apache Zeppelin.
- Choose Import note.
- Choose Add from URL.

- Enter the following URL:
https://aws-blogs-artifacts-public.s3.amazonaws.com/artifacts/BDB-2461/auto-notebook.ipynb. - Choose Import Note.

- Open the new note.


Perform stream analysis
In a Kinesis Data Analytics for SQL application, we add our streaming course via the management console, and then define an in-application stream and pump to stream data from our Kinesis data stream. The in-application stream functions as a table to hold the data and make it available for us to query. The pump takes the data from our source and streams it to our in-application stream. Queries may then be run against the in-application stream using SQL, just as we’d query any SQL table. See the following code:
CREATE OR REPLACE STREAM "AUTOSTREAM" (
    `trip_id` CHAR(36),
    `VIN` CHAR(17),
    `brake` FLOAT,
    `steeringWheelAngle` FLOAT,
    `torqueAtTransmission` FLOAT,
    `engineSpeed` FLOAT,
    `vehicleSpeed` FLOAT,
    `acceleration` FLOAT,
    `parkingBrakeStatus` BOOLEAN,
    `brakePedalStatus` BOOLEAN,
    `transmissionGearPosition` VARCHAR(10),
    `gearLeverPosition` VARCHAR(10),
    `odometer` FLOAT,
    `ignitionStatus` VARCHAR(4),
    `fuelLevel` FLOAT,
    `fuelConsumedSinceRestart` FLOAT,
    `oilTemp` FLOAT,
    `location` VARCHAR(100),
    `timestamp` TIMESTAMP(3));

CREATE OR REPLACE PUMP "MYPUMP" AS
INSERT INTO "AUTOSTREAM" ("trip_id",
    "VIN",
    "brake",
    "steeringWheelAngle",
    "torqueAtTransmission",
    "engineSpeed",
    "vehicleSpeed",
    "acceleration",
    "parkingBrakeStatus",
    "brakePedalStatus",
    "transmissionGearPosition",
    "gearLeverPosition",
    "odometer",
    "ignitionStatus",
    "fuelLevel",
    "fuelConsumedSinceRestart",
    "oilTemp",
    "location",
    "timestamp")
SELECT VIN,
    brake,
    steeringWheelAngle,
    torqueAtTransmission,
    engineSpeed,
    vehicleSpeed,
    acceleration,
    parkingBrakeStatus,
    brakePedalStatus,
    transmissionGearPosition,
    gearLeverPosition,
    odometer,
    ignitionStatus,
    fuelLevel,
    fuelConsumedSinceRestart,
    oilTemp,
    location,
    timestamp
FROM "INPUT_STREAM"
To migrate an in-application stream and pump from our Kinesis Data Analytics for SQL application to Kinesis Data Analytics Studio, we convert this into a single CREATE statement by removing the pump definition and defining a kinesis connector. The first paragraph in the Zeppelin notebook sets up a connector that is presented as a table. We can define columns for all items in the incoming message, or a subset.

Run the statement, and a success result is output in your notebook. We can now query this table using SQL, or we can perform programmatic operations with this data using PyFlink or Scala.
Before performing real-time analytics on the streaming data, let’s look at how the data is currently formatted. To do this, we run a simple Flink SQL query on the table we just created. The SQL used in our streaming application is identical to what is used in a SQL application.

Note that if you don’t see records after a few seconds, make sure that your IoT Device Simulator is still running.
If you’re also running the Kinesis Data Analytics for SQL code, you may see a slightly different result set. This is another key differentiator in Kinesis Data Analytics for Apache Flink, because the latter has the concept of exactly once delivery. If this application is deployed to production and is restarted or if scaling actions occur, Kinesis Data Analytics for Apache Flink ensures you only receive each message once, whereas in a Kinesis Data Analytics for SQL application, you need to further process the incoming stream to ensure you ignore repeat messages that could affect your results.
You can stop the current paragraph by choosing the pause icon. You may see an error displayed in your notebook when you stop the query, but it can be ignored. It’s just letting you know that the process was canceled.

Flink SQL implements the SQL standard, and provides an easy way to perform calculations on the stream data just like you would when querying a database table. A common task while enriching data is to create a new field to store a calculation or conversion (such as from Fahrenheit to Celsius), or create new data to provide simpler queries or improved visualizations downstream. Run the next paragraph to see how we can add a Boolean value named accelerating, which we can easily use in our sink to know if an automobile was currently accelerating at the time the sensor was read. The process here doesn’t differ between Kinesis Data Analytics for SQL and Kinesis Data Analytics for Apache Flink.

You can stop the paragraph from running when you have inspected the new column, comparing our new Boolean value to the FLOAT acceleration column.
Data being sent from a sensor is usually compact to improve latency and performance. Being able to enrich the data stream with external data and enrich the stream, such as additional vehicle information or current weather data, can be very useful. In this example, let’s assume we want to bring in data currently stored in a CSV in Amazon S3, and add a column named color that reflects the current engine speed band.
Apache Flink SQL provides several source connectors for AWS services and other sources. Creating a new table like we did in our first paragraph but instead using the filesystem connector permits Flink to directly connect to Amazon S3 and read our source data. Previously in Kinesis Data Analytics for SQL Applications, you couldn’t add new references inline. Instead, you defined S3 reference data and added it to your application configuration, which you could then use as a reference in a SQL JOIN.
NOTE: If you are not using the us-east-1 region, you can download the csv and place the object your own S3 bucket. Reference the csv file as s3a://<bucket-name>/<key-name>

Building on the last query, the next paragraph performs a SQL JOIN on our current data and the new lookup source table we created.

Now that we have an enriched data stream, we restream this data. In a real-world scenario, we have many choices on what to do with our data, such as sending the data to an S3 data lake, another Kinesis data stream for further analysis, or storing the data in OpenSearch Service for visualization. For simplicity, we send the data to Kinesis Data Firehose, which streams the data into an S3 bucket acting as our data lake.
Kinesis Data Firehose can stream data to Amazon S3, OpenSearch Service, Amazon Redshift data warehouses, and Splunk in just a few clicks.
Create the Kinesis Data Firehose delivery stream
To create our delivery stream, complete the following steps:
- On the Kinesis Data Firehose console, choose Create delivery stream.
- Choose Direct PUT for the stream source and Amazon S3 as the target.

- Name your delivery stream automotive-firehose.

- Under Destination settings, create a new bucket or use an existing bucket.
- Take note of the S3 bucket URL.

- Choose Create delivery stream.


The stream takes a few seconds to create.
- Return to the Kinesis Data Analytics console and choose Streaming applications.
- On the Studio tab, and choose your Studio notebook.

- Choose the link under IAM role.

- In the IAM window, choose Add permissions and Attach policies.

- Search for and select AmazonKinesisFullAccess and CloudWatchFullAccess, then choose Attach policy.
- You may return to your Zeppelin notebook.


Stream data into Kinesis Data Firehose
As of Apache Flink v1.15, creating the connector to the Firehose delivery stream works similar to creating a connector to any Kinesis data stream. Note that there are two differences: the connector is firehose, and the stream attribute becomes delivery-stream.

After the connector is created, we can write to the connector like any SQL table.

To validate that we’re getting data through the delivery stream, open the Amazon S3 console and confirm you see files being created. Open the file to inspect the new data.
In Kinesis Data Analytics for SQL Applications, we would have created a new destination in the SQL application dashboard. To migrate an existing destination, you add a SQL statement to your notebook that defines the new destination right in the code. You can continue to write to the new destination as you would have with an INSERT while referencing the new table name.
Time data
Another common operation you can perform in Kinesis Data Analytics Studio notebooks is aggregation over a window of time. This sort of data can be used to send to another Kinesis data stream to identify anomalies, send alerts, or be stored for further processing. The next paragraph contains a SQL query that uses a tumbling window and aggregates total fuel consumed for the automotive fleet for 30-second periods. Like our last example, we could connect to another data stream and insert this data for further analysis.

Scala and PyFlink
There are times when a function you’d perform on your data stream is better written in a programming language instead of SQL, for both simplicity and maintenance. Some examples include complex calculations that SQL functions don’t support natively, certain string manipulations, the splitting of data into multiple streams, and interacting with other AWS services (such as text translation or sentiment analysis). Kinesis Data Analytics for Apache Flink has the ability to use multiple Flink interpreters within the Zeppelin notebook, which is not available in Kinesis Data Analytics for SQL Applications.
If you have been paying close attention to our data, you’ll see that the location field is a JSON string. In Kinesis Data Analytics for SQL, we could use string functions and define a SQL function and break apart the JSON string. This is a fragile approach depending on the stability of the message data, but this could be improved with several SQL functions. The syntax for creating a function in Kinesis Data Analytics for SQL follows this pattern:
CREATE FUNCTION ''<function_name>'' ( ''<parameter_list>'' )
    RETURNS ''<data type>''
    LANGUAGE SQL
    [ SPECIFIC ''<specific_function_name>''  | [NOT] DETERMINISTIC ]
    CONTAINS SQL
    [ READS SQL DATA ]
    [ MODIFIES SQL DATA ]
    [ RETURNS NULL ON NULL INPUT | CALLED ON NULL INPUT ]
  RETURN ''<SQL-defined function body>''
In Kinesis Data Analytics for Apache Flink, AWS recently upgraded the Apache Flink environment to v1.15, which extends Apache Flink SQL’s table SQL to add JSON functions that are similar to JSON Path syntax. This allows us to query the JSON string directly in our SQL. See the following code:
%flink.ssql(type=update)
SELECT JSON_STRING(location, ‘$.latitude) AS latitude,
JSON_STRING(location, ‘$.longitude) AS longitude
FROM my_table
Alternatively, and required prior to Apache Flink v1.15, we can use Scala or PyFlink in our notebook to convert the field and restream the data. Both languages provide robust JSON string handling.
The following PyFlink code defines two user-defined functions, which extract the latitude and longitude from the location field of our message. These UDFs can then be invoked from using Flink SQL. We reference the environment variable st_env. PyFlink creates six variables for you in your Zeppelin notebook. Zeppelin also exposes a context for you as the variable z.


Errors can also happen when messages contain unexpected data. Kinesis Data Analytics for SQL Applications provides an in-application error stream. These errors can then be processed separately and restreamed or dropped. With PyFlink in Kinesis Data Analytics Streaming applications, you can write complex error-handling strategies and immediately recover and continue processing the data. When the JSON string is passed into the UDF, it may be malformed, incomplete, or empty. By catching the error in the UDF, Python will always return a value even if an error would have occurred.
The following sample code shows another PyFlink snippet that performs a division calculation on two fields. If a division-by-zero error is encountered, it provides a default value so the stream can continue processing the message.
%flink.pyflink
@udf(input_types=[DataTypes.BIGINT()], result_type=DataTypes.BIGINT())
def DivideByZero(price):
	try:
		price / 0
	except:
		return -1
st_env.register_function("DivideByZero", DivideByZero)
Next steps
Building a pipeline as we’ve done in this post gives us the base for testing additional services in AWS. I encourage you to continue your streaming analytics learning before tearing down the streams you created. Consider the following:
- Publish your Kinesis Data Analytics Studio notebook as an application with durable state.
- Use your Kinesis Data Firehose delivery stream to write directly to OpenSearch Service.
- Use OpenSearch Dashboards to visualize your streaming data.
- Review the Migrating to Kinesis Data Analytics for Apache Flink: Examples docs for side-by-side translations of common SQL-based Kinesis Data Analytics application queries to Kinesis Data Analytics Studio.
Clean up
To clean up the services created in this exercise, complete the following steps:
- Navigate to the CloudFormation Console and delete the IoT Device Simulator stack.
- On the AWS IoT Core console, choose Message Routing and Rules, and delete the rule
automotive_route_kinesis. - Delete the Kinesis data stream
automotive-datain the Kinesis Data Stream console. - Remove the IAM role
automotive-rolein the IAM Console. - In the AWS Glue console, delete the
automotive-notebook-gluedatabase. - Delete the Kinesis Data Analytics Studio notebook
automotive-data-notebook. - Delete the Firehose delivery stream
automotive-firehose.
Conclusion
Thanks for following along with this tutorial on Kinesis Data Analytics Studio. If you’re currently using a legacy Kinesis Data Analytics Studio SQL application, I recommend you reach out to your AWS technical account manager or Solutions Architect and discuss migrating to Kinesis Data Analytics Studio. You can continue your learning path in our Amazon Kinesis Data Streams Developer Guide, and access our code samples on GitHub.
About the Author
 Nicholas Tunney is a Partner Solutions Architect for Worldwide Public Sector at AWS. He works with global SI partners to develop architectures on AWS for clients in the government, nonprofit healthcare, utility, and education sectors.
How to list over 1000 email addresses from account-level suppression list
Post Syndicated from vmgaddam original https://aws.amazon.com/blogs/messaging-and-targeting/how-to-list-over-1000-email-addresses-from-account-level-suppression-list/
Overview of solution
Amazon Simple Email Service (SES) offers an account-level suppression list, which assists customers in avoiding sending emails to addresses that have previously resulted in bounce or complaint events. This feature is designed to protect the sender’s reputation and enhance message delivery rates. There are various types of suppression lists available, including the global suppression List, account-level suppression list, and configuration set-level suppression. The account-level suppression list is owned and managed by the customer, providing them with control over their list and account reputation. Additionally, customers can utilize the configuration set-level suppression feature for more precise control over suppression list management, which overrides the account-level suppression list.
Maintaining a healthy sender reputation with email providers (such as Gmail, Yahoo, or Hotmail) increases the probability of emails reaching recipients’ inboxes instead of being marked as spam. One effective approach to uphold sender reputation involves refraining from sending emails to invalid email addresses and disinterested recipients.
The account-level suppression list can be managed using Amazon SES console or AWS CLI which provides an easy way to manage addresses including bulk actions to add or remove addresses.
Currently, If the account-level suppression list contains more than 1000 records, we need to use NextToken to obtain a complete list of email addresses in a paginated manner. If the email address you are looking for is not within the first 1000 records of the response, you won’t be able to obtain the information from the account-level suppression list with one single command. To list all the email addresses within the account-level suppression, we use Amazon SES ListSuppressedDestinations API. This API allows you to fetch the NextToken and pass it to a follow-up request in order to retrieve another page of results.
The code below creates a loop that makes multiple requests, in each iteration, the next token is replaced, aiding in retrieving all email addresses that have been added to the account-level suppression list.
Prerequisite
The code below can be used to run in your local machine or using AWS CloudShell As part of this blog spot, we will be using AWS CloudShell to fetch the list.
Note: Python 3 and Python 2 are both ready to use in the shell environment. Python 3 is now considered the default version of the programming language (support for Python 2 ended in January 2020).
1) An active AWS account.
2) User logged in to AWS management console must have “ses:ListSuppressedDestinations” permissions.
Walkthrough
- Sign in to AWS management console and select the region where you are using Amazon SES
- Launch AWS CloudShell
- Save the code specified below as a file in your local environment. Example: List_Account_Level.py
- Click Actions and Upload File (List_Account_Level.py)

5. Run Python code.
Python3 List_Account_Level.py >> Email_Addresses_List.json
6. The file Email_Addresses_List.json will be saved in current directory
7. To download the file – Click Actions and Download File providing File name Email_Addresses_List.json

List the Email addresses in your Amazon SES account suppression list added to recent bounce or complaint event using Python.
We used the ListSuppressedDestinations operation in the SES API v2 to create a list with all the email addresses that are on your account-level suppression list for your account including bounces and complaints.
Note: SES account-level suppression list applies to your AWS account in the current AWS Region.
import boto3
from datetime import datetime
import json

def showTimestamp(results):
    updated_results = []
    for eachAddress in results:
        updated_address = eachAddress.copy()
        updated_address['LastUpdateTime'] = eachAddress['LastUpdateTime'].strftime("%m/%d/%Y, %H:%M:%S")
        updated_results.append(updated_address)
    return updated_results

def get_resources_from(supression_details):
    results = supression_details['SuppressedDestinationSummaries']
    next_token = supression_details.get('NextToken', None)
    return results, next_token

def main():
    client = boto3.client('sesv2')
    next_token = ''  # Variable to hold the pagination token
    results = []   # List for the entire resource collection
    # Call the `list_suppressed_destinations` method in a loop

    while next_token is not None:
        if next_token:
            suppression_response = client.list_suppressed_destinations(
                PageSize=1000,
                NextToken=next_token
            )
        else:
            suppression_response = client.list_suppressed_destinations(
                PageSize=1000
            )
        current_batch, next_token = get_resources_from(suppression_response)
        results += current_batch

    results = showTimestamp(results)

    print(json.dumps(results, indent=2, sort_keys=False))

if __name__ == "__main__":
    main()
Sample Response
Returns all of the email addresses and the output resembles the following example:
Cleaning up
The response file Email_Addresses_List.json will contain the list of all the email addresses on your account-level suppression list even if there are more than 1000 records. Please free to delete files that were created as part of the process if you no longer need them.
Conclusion
In this blog post, we explained listing of all email addresses if the account-level suppression list contains more than 1000 records using AWS CouldShell. Having complete list of email addresses will help you identify email addresses you are looking for and that are not included in the first 1000 records of the response. You can validate email address and determine who can receive email that can be removed from the account-level suppression list. This protect the sender reputations and improving delivery rates.
Follow-up
- https://docs.aws.amazon.com/ses/latest/dg/sending-email-suppression-list.html
- https://repost.aws/knowledge-center/ses-remove-email-from-suppresion-list
About the Author

Venkata Manoj Gaddam is Cloud Support Engineer II at AWS and Service Matter Expert in Amazon Simple Email Service (SES) and Amazon Simple Storage Service (S3). Along with Amazon SES and S3, he is AWS Snow Family enthusiast. In his free time, he enjoys hanging out with friends and traveling.