How GoDaddy Implemented a Multi-Region Event-Driven Platform at Scale

Post Syndicated from Marcia Villalba original https://aws.amazon.com/blogs/aws/how-godaddy-implemented-a-multi-region-event-driven-platform-at-scale/

GoDaddy, a leading global provider of domain registration and web hosting services, has served over 84 million domains and 22 million customers since its establishment in 1997. Among its various internal systems, the Customer Signal Platform provides tooling to capture, analyze, and act on customer and product data to drive better business outcomes. With this platform, GoDaddy can track user visits and interactions on its website and use meaningful event data to improve its customer experience and overall business performance.

Nowadays, the Customer Signal Platform processes 400 million events every day. As GoDaddy expands its integrations, it aims to increase this number to 2 billion events per day in the near future.

When building the Customer Signal Platform, GoDaddy had three main requirements for the system architecture:

  1. Minimize their operational load.
  2. Scale automatically as traffic changes.
  3. Provide high availability and ensure that all the customer signals are captured.

Amazon EventBridge Event Bus
After evaluating many options against their requirements, GoDaddy decided to implement the customer signal platform using Amazon EventBridge Event Bus. EventBridge Event Bus is a serverless event bus that helps you receive, filter, transform, route, and deliver events. Because EventBridge is serverless, it requires minimal configuration to get started and scales automatically—GoDaddy’s first two requirements were checked.

To comply with the third requirement, the solution needed to provide business continuity and ensure that no event is lost from the moment the client produces it until it gets to the platform to be analyzed. EventBridge Event Bus comes with many features that helped GoDaddy build their application with this requirement in mind.

The main feature that GoDaddy took advantage of was global endpoints. EventBridge global endpoints provide a reliable and simple way to improve the business continuity of event-driven applications. This new feature, added in 2022, allows customers to build a multi-Region event-driven application.

EventBridge Global Endpoints
Global endpoints allow you to configure a managed DNS endpoint in EventBridge, to which your applications will send events. Then you need to configure two custom event buses in two distinct AWS Regions. One is the primary Region, and the other is the failover, or secondary Region. The failover of events is decided based on the health indicated by an Amazon Route 53 health check. When the health check is healthy, the events are routed from the global endpoint to the custom event bus in the primary Region. And if the health check is unhealthy, then the global endpoint will send the events to the event bus in the secondary Region.

Healthcheck status

The simplest configuration for global endpoints is the active/archive configuration. This configuration provides business continuity and simplicity at the same time. The active/archive configuration defines two different Regions. The primary Region is where the application is deployed and all the business processes are happening. The archive Region is where only a custom bus is deployed and all the events are archived.

In addition, there is a bidirectional replication rule between the buses in separate Regions. In the normal case, when there are no errors, whenever an event arrives at the custom bus in the primary Region, the event is automatically replicated to the archive custom bus in the secondary Region.

In the case of failover, the global endpoint redirects the events to the secondary Region, where they get archived for processing at another time.

Active/ Archive configuration

GoDaddy Implementation of Global Endpoints
GoDaddy was looking for a solution that minimized their operations load while still providing business continuity, and that is why they adopted global endpoints and the active/archive configuration. In this way, they could have the event processing logic in their primary Region and have a secondary Region in case of any issues.

In their configuration, events are archived in the secondary Region for 30 days, after which the events expire. In the case of a failover, because they don’t need to process the events in real time, they collect them in the archive. If the issue is resolved within 24 hours, the retention period for the replication rule, the events are sent automatically to the primary Region. If the issue is solved in more than 24 hours the events need to be replayed to the primary Region.

The following image shows what their current solution looks like. They are working with two Regions. US West (Oregon) is their primary Region and is the location of the data lake, which is the primary consumer of the events. US East (N. Virginia) is the secondary Region. Events are being produced in different clients; from the clients, they are sent to Amazon API Gateway. GoDaddy deployed two API Gateways in their two Regions. The events are sent to the API Gateway with the smallest latency from the client. To do that, they use latency-based routing provided by Amazon Route 53. Then events are sent to an AWS Lambda function that validates the events and forwards them to the EventBridge global endpoint at the DNS level.

GoDaddy architecture

The global endpoint is configured with the active/archive setup, and the failover is configured to be triggered via a Route 53 health check that monitors an Amazon CloudWatch alarm. That alarm observes the IngestionToInvocationStartLatency metric in the primary Region.

IngestionToInvocationStartLatency is a service-level metric that exposes the time to process events from the point at which they are ingested by EventBridge to the point the first invocation of a target in the configured rules is made. This metric is measured across all the rules in your bus and provides an indication of the health of the EventBridge service. Any extended periods of high latency over 30 seconds indicate a service disruption.

When the system is in the normal state, the events are forwarded from the global endpoint to the custom ingress event bus in the primary Region. That custom event bus has replication enabled; this means that all the events that arrive at the bus get replicated automatically in the secondary Region custom ingress event bus.

All the events received by the ingress event bus are sent to the enrichment function. This function performs basic validation and authentication, and it enriches the event data to make sure that all the events from different clients are standard.

From there, the events are forwarded to the data platform event bus to be sent to the different consumer targets. The main target is their data lake solution, which analyzes all the events.

What Was the Impact?
For GoDaddy, business continuity is important, and their customer signals are not getting lost due to any issue with their platform. This makes them confident that they can expand their customer signal platforms from 400 million events per day to 2 billion events per day without introducing any additional operations overhead.

Now, they can confidently process hundreds of millions of events per day to their system, and they can keep on growing. The following image shows the number of events ingested by global endpoints in a normal day.

Events ingested

While GoDaddy’s use of the active/archive pattern enables them to ensure they never lose any events, they’re already starting to see certain use cases where they want to minimize any delays in processing their events, even when service disruptions occur. Because they’re already replicating their events to a secondary Region, they can deploy their most critical consumers to both Regions and enable an active/active configuration for their mission-critical systems. Active/active configuration allows you to process parallel events in both the primary and secondary Regions, simplifying the processing of events even during disruptions and enabling business continuity.

The vision when building the Customer Signal Platform was to align with GoDaddy’s high bar for reliability, scalability, and maintainability and, at the same time, keep the platform self-service so that developers can focus on business needs. This led GoDaddy to choose Amazon EventBridge global endpoints and serverless technologies to build this solution.

GoDaddy Customer Signal Platform is an excellent example of what serverless technologies enable. By leveraging the cloud to handle as much of the undifferentiated heavy lifting as possible, GoDaddy has reduced the operational complexity of setting up an event bus for a multi-Region strategy, implemented failover mechanisms in the case of Regional distruptions, and ensured that events are not lost by enabling replication. Global endpoints active/archive configuration improves the availability of customer applications with the least amount of configuration changes.

If you want to get started with EventBridge global endpoints, you can check out this talk on event-driven applications. For a working demo on how to use EventBridge global endpoints for failover events, check out this Serverless Land repository.

— Marcia

Похвално слово за Сарафов разкри конфликт на интереси и недекларирана вила

Post Syndicated from Екип на Биволъ original https://bivol.bg/bobi-vilata-prolesha.html

петък 16 юни 2023


Новоизбраният и.ф. главен прокурор Борислав Сарафов е бил следовател по шумно дело за тежко хулиганство, изтезания и изнудване срещу бизнесмен от Божурище, който обаче се измъква с условна присъда. Години…

What’s Up, Home? – 7 things to beware of if you monitor your home

Post Syndicated from Janne Pikkarainen original https://blog.zabbix.com/whats-up-home-7-things-to-beware-of-if-you-monitor-your-home/26035/

When reading this blog, you could easily think that everything is smooth sailing all the time. No. When you monitor your home IoT — or frankly, just USE your home IoT — you have plenty of small details to watch out for. I list them for you, so you don’t have to find them out the hard way like I’ve done over this 1+ year of journey.

1. The status is not what it seems

This is especially true with the IoT devices operating on 433 MHz radio frequency. Your home smart hub sends the signal like a radio station hoping for your IoT device to catch it, and to my understanding, it does not get a reply back from the device. If anything is interfering with the signal, your device will miss the signal and thus your home smart hub will be showing the wrong status.

So, you will need to either get rid of these devices and replace them with devices that use a two-way communication protocol such as ZigBee or if that’s not possible, to set up extra monitoring to try to guess if the command your home smart hub sent actually went through. Did you attempt to power on/off a smart power socket connected to a radiator? Keep an eye on the smart temperature meter and react soon if the temperature does not start to rise after the power socket got powered on, or so.

2. Battery-low messages can be deceiving

Two of my Philips Hue motion sensors have been complaining about low battery status for about six months now, but they are still operating just fine. I’ll let you know when I finally have to replace the batteries on them. 

On the contrary, the batteries on some 433 MHz frequency Telldus thermometers can just die without too much warning. For them, your monitoring need to react fast if the values are not coming in. To make things more complicated, not TOO fast though, as sometimes these thermometers can hibernate for some time before reporting new values; possibly when there’s no change in temperature, they will enter some power save mode or something. I don’t know.

3. Bluetooth devices and 2.4 GHz Wi-Fi can interfere with each other

Even though my devices do not use 2.4 GHz Wi-Fi too much, I have some devices like Sonos smart speaker where it’s a must. So, for example, when playing music through that speaker, it’s possible that my Raspberry Pi 4 cannot hear the RuuviTag environmental sensor very reliably. It did help somewhat when I found out that on my Asus router, it was possible to enable some kind of “Bluetooth coexistence” mode, but it’s not a 100% solution for my issue.

4. Make sure any helper components are really up

Along with Zabbix and Grafana, my Raspberry Pi 4 runs Home Assistant to harvest some values about my iPhone and so on. It runs as a Docker image and generally is stable, but sometimes it just stops working. I have an automatic daily restart of that Docker image and so far that has been a relatively good way to keep the image running.

5. APIs can and will change

Monitoring something over some API? Or through web scenarios? Rest assured that your joy won’t last forever. This is IT, and things just won’t remain the same. SOMETHING is guaranteed to change every now and then and the more your monitoring relies on 3rd party things, the less you can trust that your monitoring just would keep on working. No, it’s likely you will need to alter things every now and then.

6. Monitor your monitoring

Even though Raspberry Pi 4 and Zabbix are very reliable and are very unlikely to cause you any trouble, of course, they can fail, or more likely something else will not be like it should. Your home router or Internet connection can die. Electricity can go down. Hardware can die. If you want to be really sure, monitor your monitoring from outside somehow. Have a separate monitoring running on the cloud somehow. 

In our case, the electricity and ISP are very reliable, and Cozify smart home hub has a nice feature where the Cozify cloud will text me if the hub loses connectivity — that’s usually a good indication that either the ISP or power went down. Also, I’m about to roll out a small cron job on this site which would check if my Zabbix has updated a test file in a while. If not, it would indicate my Zabbix would be down or otherwise unreachable, so then whatsuphome.fi could e-mail me.

7. You will get paranoid

With more knowledge comes more pain. With some devices, you’ll start to think that they are going to break soon. As an example, the freezer I keep referring to — sometimes it has short periods of time when its temperature for some reason rises a bit and then it goes down again. I don’t know if that has something to do with the fact that our freezer is one of those which does not form ice everywhere so it’s maintenance-free, or if that’s something else, but we keep observing spikes like this about once a week.

I have been working at Forcepoint since 2014 and have learnt not to trust the technology. — Janne Pikkarainen

This post was originally published on the author’s page.

The post What’s Up, Home? – 7 things to beware of if you monitor your home appeared first on Zabbix Blog.

[$] Reports from OSPM 2023, part 2

Post Syndicated from original https://lwn.net/Articles/934459/

The fifth conference on Power
Management and Scheduling in the Linux Kernel
(abbreviated “OSPM”) was
held on April 17 to 19 in Ancona, Italy. LWN was not there,
unfortunately, but the attendees of the event have gotten together to write
up summaries of the discussions that took place and LWN has the privilege
of being able to publish them. Reports from the second day of the event
appear below.

Security updates for Friday

Post Syndicated from original https://lwn.net/Articles/934939/

Security updates have been issued by Debian (chromium, openjdk-17, and wireshark), Fedora (iniparser, mariadb, mingw-glib2, perl-HTML-StripScripts, php, python3.7, and syncthing), Oracle (.NET 6.0, c-ares, kernel, nodejs, and python3.9), Slackware (libX11), SUSE (amazon-ssm-agent and chromium), and Ubuntu (gsasl, libx11, and sssd).

Затворът на ХХI век: Архитектура, правосъдие и (не)свобода

Post Syndicated from Анета Василева original https://www.toest.bg/zatvorut-na-21-vek/

Затворът на ХХI век: Архитектура, правосъдие и (не)свобода

Този текст е базиран на проучванията, направени заедно с Дарина Банова през есента на 2022 г. в рамките на изследователския и експериментален проект на тема „Форми на несвобода. Затворът на ХХI век“: тя – като дипломант към катедра „История и теория на архитектурата“ в УАСГ, а аз – като неин ръководител.

Във времена, в които бъдещето на демокрацията в България изглежда объркано и все по-обвързано със съдебната система, има едно място, където правораздаването се пресича с архитектурата, при това буквално. Състоянието на затворите и условията, в които живеят лишените от свобода и работят техните надзиратели, е активна тема вече няколко години, включително за няколко български правосъдни министри. Междувременно български затворници съдят България в Европейския съд по правата на човека. Служители на затворите провеждат национални протести. А в дупнишкото село Самораново, където в момента се изгражда нов затвор за 400 души на мястото на бившето военно поделение, хората са притеснени.

Всъщност темата за затворите, макар на пръв поглед периферна и често пренебрегвана, говори много за обществото ни днес. А архитектурата на затворите е добър повод да анализираме еволюцията на идеите ни за контрол, наказание и морал, за свобода и несвобода и как пространствата всъщност формират хората.

Властта на пространството

Архитектурата не е даденост. Тя е среда, която ни определя и изгражда дори само през чисто физическото изживяване на пространството, заобикалящо телата ни. Това е най-устойчивото клише на архитектурната теория, което е също толкова непоклатимо вярно. Замислете се, че има сгради, които ви карат да се чувствате добре, и други, които ви потискат. По определени настилки вървите бързо, по други – бавно и несигурно. Има места, където с удоволствие се спирате, и други, в които се чувствате напрегнати. Има публични пространства, които естествено припознавате като места за протест, и други, които носят със себе си невидим, но неизбежен контрол.

Популярен пример от архитектурната история е планът за тотална реконструкция на Париж, осъществен от барон Осман след средата на XIX в. и формирал онзи парижки център с широки булеварди и красиви сгради, който познаваме и до днес. Но това е план не само за модернизиране на един град със средновековни тесни улици, с липса на въздух и светлина и с много болести. Това е план и за контрол над гражданите му, които успешно преграждат тези тесни улици с барикади в поредица въоръжени въстания през първата половина на века и особено по време на Френската революция от 1848 г.

Пространствата обаче могат не само да контролират. Ето още два известни примера.

През 60-те години на ХХ в. Лудвиг Ерхарт, канцлер на ФРГ, поръчва нова резиденция на властта, т.нар. Kanzlerbungalow в Бон – изящен едноетажен павилион с много стъкло, който дава усещането за прозрачност, достъпност и човешки мащаб. До обединението на Германия това е мястото, където западногерманските канцлери живеят, забавляват се и посрещат чуждестранни дипломатически делегации. Сградата е представителната „дневна“ на ФРГ, а светлите ѝ модернистични пространства стават символ на демокрацията.

Държавната детска болница Alder Hey в Ливърпул, завършена през 2015 г., е друг вид сграда. Тя не е просто здание в парк, а сграда, органично свързана с природата. Развита е около светъл многоетажен атриум, от който излизат три ръкава – като отворени пръсти на ръка – с отделения и клинични пространства, сливащи се постепенно с парка. Целта на архитектите е ясна – те създават пространство, което лекува: дава усещане за добър живот, има дизайн, който повдига духа, свързано е с природата за максимален терапевтичен ефект.

Но да се върнем на затворите. Още по-интересен е въпросът

дали пространствата ни правят лоши, или добри, дали могат да влияят на моралния ни избор.

Морално ли е изобщо архитектите да проектират места за изолация? И как трябва да изглежда наказателната архитектура днес?

Паноптикумът

В холандския град Бреда има една сграда, която се вижда отдалеч – голяма, цилиндрична, четириетажна и покрита с купол. Няма нищо общо с тесните къщички по уютните улички и каналите на града. Вътре сградата е куха, с кръгъл покрит двор, колкото половин футболно игрище, а около него по извитите тухлени стени се виждат стотици еднакви оранжеви врати, равномерно разпръснати из четирите етажа нагоре, гледащи към двора. Зад всяка врата има по една малка стая, която някога е била затворническа килия. Но това не е обикновен затвор. Сградата, построена през 1886 г., е паноптикум.

Паноптикумът е най-популярният идеален теоретичен модел за затвор.

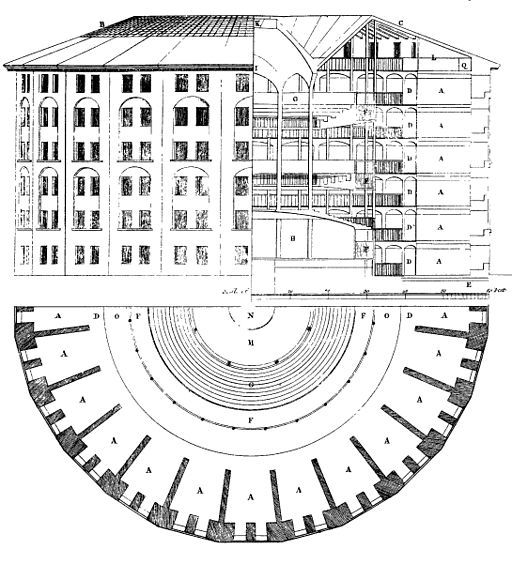
Създаден през 1791 г. от английския философ и юрист Джереми Бентъм, той е планиран така, че всеки затворник да бъде отделен в килия и скрит от погледа на останалите. Килиите са построени около централната наблюдателна кула, откъдето се предполага, че всеки затворник е видим единствено за надзирателя. Бентъм смята, че изолацията е ключова за успешното функциониране на един затвор. Индивидуалните килии ограничават побоищата и конспирациите. Контролът e съвършен.

Бентъм така и не успява да построи своя идеален затвор през XVIII в., но сто години по-късно холандците издигат един от малкото истински паноптикуми в Бреда. И какво се оказва? Оказва се, че скъпият революционен експеримент е грандиозен провал.

Изолацията не превъзпитава никого. Напротив, причинява остри умствени заболявания и смърт сред затворниците.

А тоталният контрол – другият инструмент на паноптицизма, става олицетворение на модерната дисциплинарна власт с всички нейни плашещи последствия. За френския философ Мишел Фуко паноптикумът е не просто сграда, а властта, дестилирана до нейната есенция. Надзирателят невинаги гледа към затворниците; ключовото е, че може да го направи по всяко време, когато пожелае. Тъй като затворниците не могат да разберат дали са наблюдавани, или не, те трябва винаги да се държат така, сякаш са. В резултат на това контролът става самоконтрол – чувството, че някой те наблюдава, е достатъчно.

Затворът на ХХI век: Архитектура, правосъдие и (не)свобода
Паноптикумът на Джереми Бентъм. Източник: Wikimedia

Възстановителното правосъдие

През XXI век нещата са различни. Ясно е, че изолацията не помага нито на престъпниците, нито на обществото. Възстановителното правосъдие е метод, който се налага напоследък и в България и цели поемането на отговорност от страна на правонарушителите, създаването на усещане за принадлежност към общността и чувство за безопасност от страна на обществото спрямо престъпилите закона. Окуражават се самоконтролът и самонаблюдението сред затворниците, превъзпитанието се осъществява чрез образование и развитие на различни умения, чрез разговори и срещи.

Положителен съвременен пример за лишаване от свобода, който прилага принципите на възстановителното правосъдие, са норвежките затвори.

Затворът Халден многократно е отличаван като пример за „най-хуманния затвор в света“ въпреки най-високата степен на сигурност, която предоставя.

Пространствената организация се изразява в павилионна структура с множество открити пространства и озеленяване, което кара лишените от свобода да се чувстват в природна среда. Надзорът се извършва директно, на малки групи, а служителите са в постоянно взаимодействие с криминално проявените и участват в дейностите им.

Но каква е ситуацията в България?

Затворът на ХХI век и България

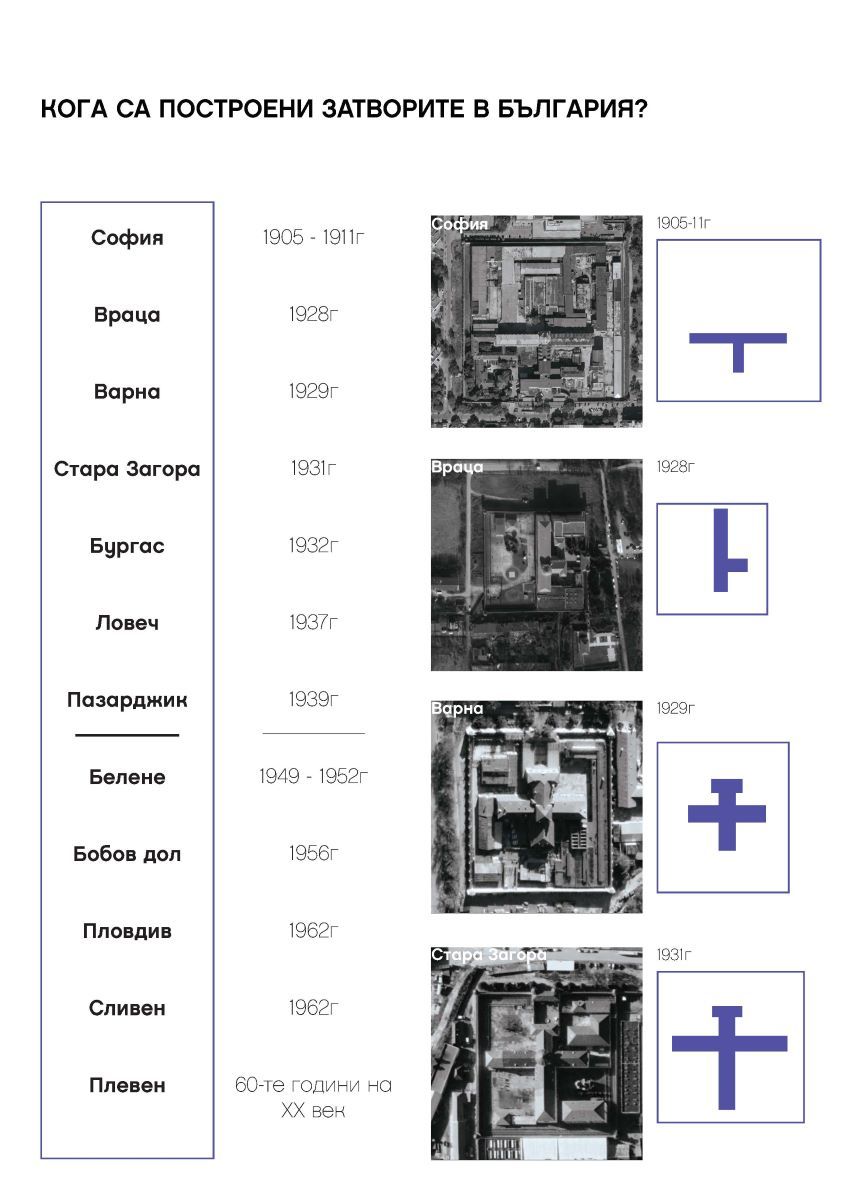
Първите български затвори са проектирани в началото на ХХ век по стандартна схема с кръстосан план с главна наблюдателна кула в центъра и жилищни корпуси с дълги коридори, от които се стига до килиите. Надзирателят наблюдава от кулата и има видимост към всички крила на сградата. Това де факто е вид паноптикум. Такива са затворите в София, Враца, Варна и Стара Загора, проектирани между 1905 и 1931 г. Характерни елементи на тези сгради са масивните огради, централните наблюдателни кули с т.нар. колело в тях и второстепенните охранителни кули. Последният нов затвор, построен в България, е Сливенският женски затвор от 1961 г.

Местата за лишаване от свобода в България се делят на няколко вида: затвори, затворнически общежития от закрит тип и затворнически общежития от открит тип. Диференцирането на лишените от свобода в съответния вид заведение се извършва според режима на изтърпяване на наказанието – специален, строг, общ и лек.

Статистически данни показват, че за последните 10 години лишените от свобода са намалели почти двойно. Това, както и откриването на нови затворнически общежития за по-леките режими, облекчава системата и дава възможност за подобряване на условията в заведенията за лишаване от свобода. Фактори като намалелия брой престъпления и респективно лишени от свобода, влизането на България в Европейския съюз и налагането на Европейските правила за затворите, както и финансирането на програми за подобряване на местата за лишаване от свобода дават оптимистичен шанс за промяна на сегашното състояние.

Какъв би могъл да бъде новият универсален архитектурен модел на тази промяна?

Моделът

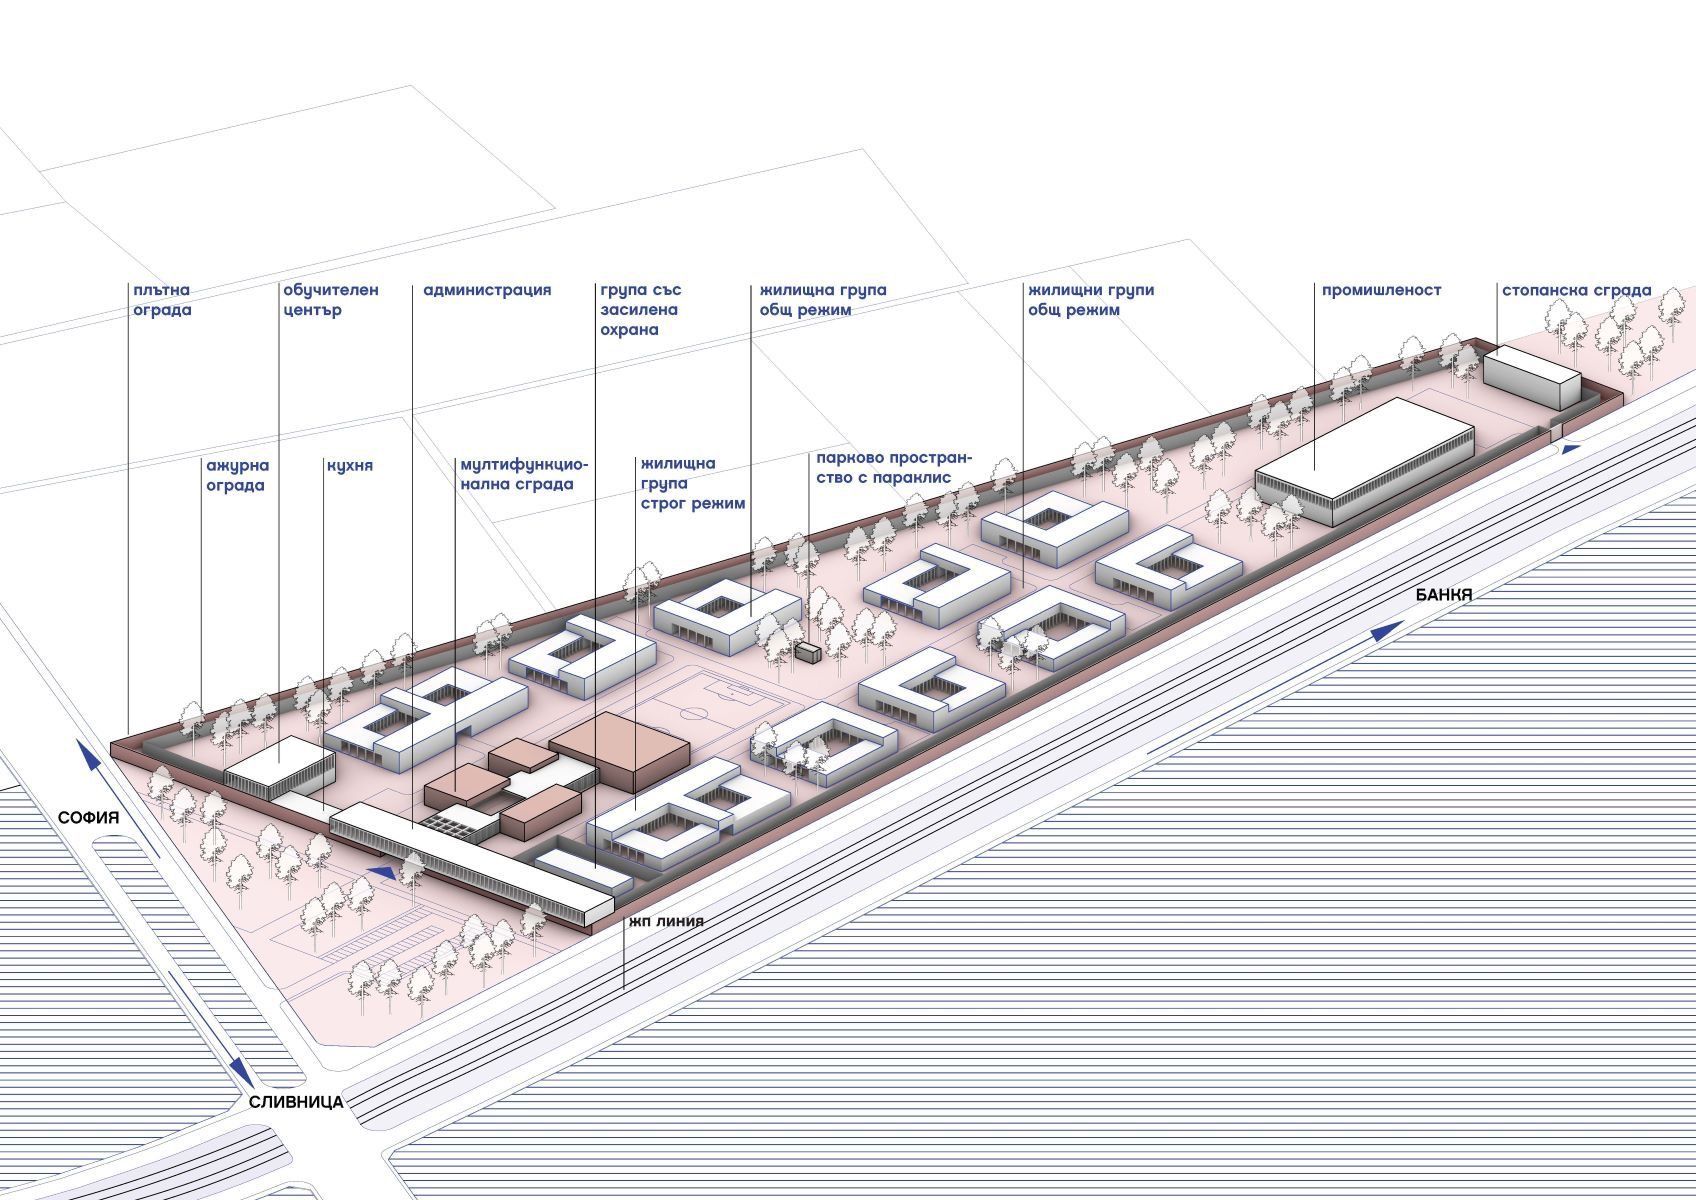
Първо, килията трябва да загуби ролята си на централно място в живота на затворниците, отстъпвайки мястото на модел, организиран на принципа на самодостатъчни жилищни единици. В рамките на всяка жилищна единица затворниците да могат сами да управляват времето си и да организират разпределението на отговорностите по отношение на общите части. Това овластява хората и предразполага към проактивно поведение. Жилищните единици да бъдат балансирана организация между индивидуални пространства за самостоятелни дейности и колективни пространства за социално взаимодействие с фокус върху вторите – отново с цел изграждане на микрообщности.

После, нужна е борба със стереотипите – премахване на плашещия образ на затворите и стигмата на лишаването от свобода. Като социална институция пенитенциарното заведение трябва, доколкото е възможно, да бъде интегрирано в общността, в която ще бъде освободен затворникът, и да взаимодейства с околността.

Разбира се, не може без бариери към външния свят за поддържане на сигурността. Но архитектурният образ трябва да деинституционализира сградата и да я интегрира в по-широката общност чрез представяне на нормализиран, съвременен, ориентиран към гражданите облик и подходящ мащаб. Затворът трябва да е във връзка с външния свят, за да не се превърне в непроницаем елемент, неотзивчив към стимулите, идващи от града.

Възможно ли е такова бъдеще на затворите? Вероятно да. Възможно ли е в България? Разбира се. Но то е в пряка връзка и с осъзнаването на властта на архитектурата да решава социални проблеми, като създава смислени пространства.

По буквите: Ю Дзиен

Post Syndicated from Зорница Христова original https://www.toest.bg/po-bukvite-yu-dzien/

„Давам име на една врана“, Ю Дзиен

По буквите: Ю Дзиен

превод Веселин Карастойчев, София, „Издателство за поезия ДА“, 2023

Признавам, че разтворих Ю Дзиен с очаквания, породени от предишния превод на Веселин Карастойчев, този на великолепния поет Бей Дао. С други думи, очаквах поезия, в която значещи са и образите, и паузите, смисловите разстояния между тях, съпоставянето; поезия, която се възприема цялостно, като калиграфски знак. „Поезия на забулената луна“ я наричат в Китай – но това, както каза някой на премиерата, е удобен начин да обезопасиш чуждия глас. Да го обявиш за неясен. Още повече че тази привидна „неяснота“ може да бъде свързана със също тъй приемливите за режима древни поетически традиции. Независимо от реалната сила на стиха.

Че Ю Дзиен пише коренно различна поезия, се вижда отведнъж. И без да четем послеслова, и без да знаем за тълпата следовници на Бей Дао и за „втвърдяването“ на тази поетика в литературна мода. Ако разтворите „Давам име на една врана“ напосоки и прочетете първото попаднало Ви стихотворение,

може изобщо да не разберете, че това е китайски поет.

Може да речете, че е Гинзбърг, примерно. Заради бурната смесица от романтическа стихийност, домогване до сюблимното и постиндустриална материя, урбанистични отломки, които са част от вихрения космичен пейзаж а ла Уилям Блейк. Или заради самата форма на стихотворенията, които се доближават до изговорената реч, до „изстъплението“ в буквален смисъл – човек, който стъпва някъде и говори пред другите или пред пустошта, но говори на глас. Прави паузи, които в говоримата реч не са обозначени нито със запетаи, нито с точки, нито с други препинателни знаци – те са просто паузи, отстояния между думите. Така са маркирани и у Ю Дзиен. Или заради изобилието от неща, от думи, от образи, които следват един след друг – и тук асоциацията, разбира се, е първо Уитман, после Гинзбърг. Последният, прочее, се появява действително в едно от стихотворенията, значи не съм се догаждала напусто.

Всичко това обаче никак не прави поезията на Ю Дзиен по-малко китайска.

Неговият Китай е пределно и буквално съвременен; старите пътища на думите са асфалтирани, предметният свят е ремонтиран, човекът, който някога е имал „душа на царевица“, днес живее в огромен град – и не смята да се преструва, че това не е така.

Това е съвременен Китай, който по някакъв начин е по-херметичен за западното око от своята древност, защото е съвременен по свой начин; който не е директно допълнение на представата ни за себе си, а нещо друго. От една страна, този Китай е комунистически. Как се отнася поезията на Ю Дзиен към въпросния факт? Не пряко – не очаквайте някакви лозунгаджийско-бунтовни стихотворения, въпреки че поетът има какво да каже (родителите му са жертви на Културната революция, самият той прекарва младежките си години в работа по фабрики).

Ю Дзиен рисува не самата система (предполагам, и там основана на доносничеството и конформизма като цена на успеха), а ефекта ѝ върху съкровените човешки отношения. Върху приятелството и любовта. Има една серия стихотворения за срещи между приятели, които не са се виждали от много години – приятели, които разбират, че са изгубили общия си език, че няма какво да си кажат.

Две от тези стихотворения са почти диаметрално противоположни – в едното говорещият, нарекъл се в последния стих Ю Дзиен, тихо се озлобява срещу свой преуспял и зализан някогашен другар. В другото пък насреща ни сяда човек с бутилка алкохол, която до края на стихотворението пресушава и си тръгва заедно с целия си едновремешен потенциал. Любовта, прочее, присъства в момента на раздялата (като не се обичаме вече, да се разделим) и в момента на предварителното проучване… описано като полицейски разпит. Ето това описание на разпит, в който човек малодушно предава себе си до най-съкровените си неща, всъщност е най-политическото стихотворение в сборника. Въпреки че привидно иде реч за любов.

С някакво абсурдно самодоволство си казвам, че западният читател няма как да го разбере, но ние, живелите преди 1989-а, можем.

Намерила съм с какво да се хваля – все едно да се похваля, че разбирам добре стихотворението за спирането на тока. Или тези за коронавируса; има цял цикъл, като са уловени различни болезнени точки: изречението „Ясно ли е“, повтаряно при разпита на заговорилия за опасността учен; опита на човек да придаде достойнство и спокойствие на гласа си, докато съобщава по телефона, че е заразен, все едно се държи джентълменски на борда да потъващ кораб; неповторимостта на всяко име срещу статистиката на „случаите“ и т.н.

По буквите: Ю Дзиен

Изобщо, поезията на Ю Дзиен е обърната към реалността и се стреми да я види, стреми се да я разбере. Друг е въпросът, че постоянно се блъска в стъклената преграда пред нея; постоянно остава уловена в собственото си съзнание, колкото и да иска да постигне нещото само по себе си. Стихотворението, дало име на сборника, говори точно за това – за

трудността да говориш за враната сама по себе си, да проумееш света извън собствената си представа за него.

Впрочем същата тема според мен е присмехулно подхваната в „Хей, свят, ела“. Ю Дзиен говори от името на човек, който в самотата си иска да приветства целия свят, всяка душа, която би дошла при него – жена, мъж, старица, мравка, комар, готов в проститутката да види невеста, в дрипавия – побратим, в покритата със струпеи баба – майка и т.н. Но когато в самотата му навлизат реални хора – съвсем банални жена, мъж, старица, мравка, комар, – те му остават напълно чужди, не будят никакво желание за общуване. Пропъжда ги, убива комара и отново започва да копнее светът да дойде при него. Въображаемият свят, разбира се.

С други думи, не бива да гледаме на поезията на Ю Дзиен като на реалистична поезия, тоест като описваща реалността. Тя е по-скоро хипнотизирана от пълнокръвието на света, от изобилието на случващото се в него и описва именно този свой захлас. Това много често е и функцията на метафората в много стихотворения – не да обясни реалността, а да добави към нея случване, размах, сюблимност. Което също си е романтически жест.


В емблематичната си колонка, започната още през 2008 г. във в-к „Култура“, Марин Бодаков ни представяше нови литературни заглавия и питаше с какво точно тези книги ни променят. Вярваме, че е важно тази рубрика да продължи. От човек до човек, с нова книга в ръка.

Best practices for enabling business users to answer questions about data using natural language in Amazon QuickSight

Post Syndicated from Amy Laresch original https://aws.amazon.com/blogs/big-data/best-practices-for-enabling-business-users-to-answer-questions-about-data-using-natural-language-in-amazon-quicksight/

In this post, we explain how you can enable business users to ask and answer questions about data using their everyday business language by using the Amazon QuickSight natural language query function, Amazon QuickSight Q.

QuickSight is a unified BI service providing modern interactive dashboards, natural language querying, paginated reports, machine learning (ML) insights, and embedded analytics at scale. Powered by ML, Q uses natural language processing (NLP) to answer your business questions quickly. Q empowers any user in an organization to start asking questions using their own language. Q uses the same QuickSight datasets you use for your dashboards and reports so your data is governed and secured. Just as data is prepared visually using dashboards and reports, it can be readied for language-based interactions using a topic. Topics are collections of one or more datasets that represent a subject area that your business users can ask questions about. To learn how to create a topic, refer to Creating Amazon QuickSight Q topics.

With automated data preparation in QuickSight Q, the model will do a lot of the topic setup for you, but there is some context that is specific to your business that you need to provide. To learn more about the initial setup work that Q does behind the scenes, check out New – Announcing Automated Data Preparation for Amazon QuickSight Q.

Business users can access Q from the QuickSight console or embedded in your website or application. To learn how to embed the Q bar, refer to Embedding the Amazon QuickSight Q search bar for registered users or anonymous (unregistered) users. To see examples of embedded dashboards with Q, refer to the QuickSight DemoCentral.

Once you have a topic shared with your business users, they can ask their own questions and save questions to their pinboard as seen in GIF 1.

QuickSight authors can also add their Q visuals straight to an analysis to speed up dashboard creation, as seen in GIF 2.

This post assumes you’re familiar with building visual analytics in dashboards or reports, and shares new and different strategies needed to build natural language interfaces that are simple to use.

In this post, we discuss the following:

  • The importance of starting with a narrow and focused use case
  • Why and how to teach the system your unique business language
  • How to get success by providing support and having a feedback loop

If you don’t have Q enabled yet, refer to Getting started with Amazon QuickSight Q or watch the following video.

Follow along

In the following examples, we often refer to two out-of-the-box sample topics, Product Sales and Student Enrollment Statistics, so you can follow along as you go. We recommend creating the topics now before continuing with this post, because they take a few minutes to be ready.

Understand your users

Before we jump into solutions, let’s talk about when natural language query (NLQ) capabilities are right for your use case. NLQ is a fast way for a business user who is an expert in their business area to flexibly answer a large variety of questions from a scoped data domain. NLQ doesn’t replace the need for dashboards. Instead, when designed to augment a dashboard or reporting use case, NLQ helps business users get customized answers about specific details without asking a business analyst for help.

It’s critical to have a well-understood use case because language is inherently complex. There are many ways to refer to the same concept. For example, a university might refer to “classes” several ways, such as “courses,” “programs,” or “enrollments.” Language also has inherent ambiguity—“top students” might mean by highest GPA to one person and highest number of extracurriculars to another. By understanding the use case up front, you can uncover areas of potential ambiguity and build that knowledge directly into the topic.

For example, the AWS Analytics sales leadership team uses QuickSight and Q to track key metrics for their region as part of their monthly business review. When I worked with the sales leaders, I learned their preferred terminology and business language through our usability sessions. One observation I made was that they referred to the data field Sales Amortized Revenue as “adrr”. With these learnings, I could easily add this context to the topic using synonyms, which I cover in detail below. One of the sales leaders shared, “This will be awesome for next month when I write my MBR. What previously took a couple of hours, I can now do in a few minutes. Now I can spend more time working to deliver my customer’s outcomes.” If the sales leader asked a question about “adrr” but that connection was not included in their Q topic, then the leader would feel misunderstood and revert back to their original, but slower, ways of finding the answer. Check out more QuickSight use cases and success stories on the AWS Big Data Blog.

Start small

In this section, we share a few common challenges and considerations when getting started with Q.

Data can contain overlapping words

One pitfall to look out for is any fields with long strings, like survey write-in responses, product descriptions, and so on. This type of data introduces additional lexical complexity for readers to navigate. In other words, when an end-user asks a question, there is a higher chance that a word in one of the strings will overlap with other relevant fields, such as a survey write-in that mentions a product name in your Product field. Other non-descriptor fields can also contain overlaps. You can have two or more field names with lexical overlap, and the same across values, and even between fields and values. For example, let’s say you have a topic with a Product Order Status field with the values Open and Closed and a Customer Complaint Status field also with the values Open and Closed. To help avoid this overlap, consider alternate names that would be natural to your end-users to avoid the potential ambiguity. In our example, I’d keep the Product Order Status values and change the Customer Complaint Status to Resolved and Unresolved.

Avoid including aggregation names in your fields and values

Another common pitfall that introduces unnecessary ambiguity is including calculated fields for basic aggregations that Q can do on the fly. For example, business users might track average clickthrough rates for a website or month-to-date free to paid conversions. Although these types of calculations are necessary in a dashboard, with Q, these calculated fields are not needed. Q can aggregate metrics using natural language, like simply asking “year over year sales” or “top customers by sales” or “average product discount,” as you can see in Figure 1. Defining a field with the name YoY Sales adds an additional potential answer choice to your topic, leaving end-users to select between the pre-defined YoY Sales field, or using Q’s built-in YoY aggregation capability, whereas you may already know which of these choices is likely to bring them the best outcome. If you have complex business logic built into calculated fields, those are still relevant to include (and if you create the topic from your existing analysis, then Q will bring them over.)

Q answer showing MoM sales

Figure 1: Q visual showing MoM sales for EMEA

Start with a single use case

For this post, we recommend defining a use case as a well-defined set of questions that actual business users will ask. Q gives the ability to answer questions not already answered in dashboards and reports, so simply having a dashboard or a dataset doesn’t mean you necessarily have a Q-ready use case. These questions are the real words and phrases used by business users, like “how are my customers performing?” where the word “performing” might map in the data to “sales amortized revenue,” but a business user might not ask questions using the precise data names.

Start with a single use case and the minimum number of fields to meet it. Then incrementally layer in more as needed. It’s better to introduce a topic with, for example, 10 fields and a 100% success rate of answering questions as expected vs. starting with 30 fields and a 70% success rate to help users feel confident.

To help you start small, Q enables you to create your topic in one click from your existing analysis (Figure 2).

Enable a Q topic from a QuickSight analysis

Figure 2: Enable a Q topic from a QuickSight analysis

Q will scan the underlying metadata in your analysis and automatically select high-value columns based on how they are used in the analysis. You’ll also get all your existing calculated fields ported over to the new topic so you don’t have to re-create them.

Add lexical context

Q knows English well. It understands a variety of phrases and different forms of the same word. What it doesn’t know is the unique terms from your business, and only you can teach it.

There are some key ways to provide Q this context, including adding synonyms, semantic types, default aggregations, primary date, named filters, and named entities. If you created your Q topic as described in the previous section, you will be a few steps ahead, but it’s always good to check the model’s work.

Add synonyms

In a dashboard, authors use visual titles, text boxes, and filter names to help business users navigate and find their answers. With NLQ, language is the interface. NLQ empowers business users to ask their questions in their own words. The author needs to make those business lexicon connections for Q using synonyms. Your business users might refer to revenue as “gross sales,” “amortized revenue,” or any number of terms specific to your business. From the topic authoring page, you can add relevant terms (Figure 3).

Add Q synonyms

Figure 3: Adding relevant synonyms

If your business users refer to the data values in multiple ways, you can use value synonyms to create those connections for Q (Figure 4). For example, in the Student Enrollment topic, let’s say your business users sometimes use First Years to map to Freshmen and so on for each classification type. If you don’t have that data directly in your dataset, you can create those mappings using value synonyms (Figure 5).

Configure Q value synonyms

Figure 4: Configure field value synonyms

Add Q value synonyms

Figure 5: Example value synonyms for Student Enrollment topic

Check semantic types

When you create a topic using automatic data prep, Q will automatically select relevant semantic types that it can detect. Q uses semantic types to understand which specific fields to use to answer vague question like who, where, when, and how many. For example, in the student enrollment statistics example, Q already set Home of Origin as Location so if someone asks “where,” Q knows to use this field (Figure 6). Another example is adding Person for the Student Name and Professor fields so Q knows what fields to use when your business users ask for “who.”

Home of origin semantic type

Figure 6: Semantic Type set to “Location”

Another important semantic type is the Identifier. This tells Q what to count when your business users ask questions like “How many were enrolled in biology in 2021?” (Figure 7). In this example, Student ID is set as the Identifier.

Q answer showing a KPI of 3

Figure 7: Q visual showing a “how many” question

Here is a list of semantic types that map to implicit question phrases:

  • Location: Where?
  • Person or Organization: Who?
    • If there are no person or organization fields, then Q will use the identifier
  • Identifier: How many? What is the number of?
  • Duration: How long?
  • Date Part: When?
  • Age: How old?
  • Distance: How far?

Semantic types also help the model in several other ways, including mapping terms like “most expensive” or “cheapest” to Currency. There is not always a relevant semantic type, so it’s okay to leave those empty.

Set default aggregations

Q will always aggregate measure values a business user asks for, so it’s important to use measures that retain their meaning when brought together with other values. As of this writing, Q works best with underlying data that is summative, for example, a currency value or a count. Examples of metrics that are not summative are percentages, percentiles, and medians. Measures of this type can produce misleading or statistically inaccurate results when added with one another. Q can be used to produce averages, percentiles, and medians by end-users without first performing those calculations in underlying data.

Help Q understand the business logic behind your data by setting default aggregations. For example, in the Student Enrollment topic, we have student test scores for every course, which should be averaged and not summed, because it’s a percentage. Therefore, we set Average as the default and set Sum as a not allowed aggregation type (Figure 8).

Percentage semantic type

Figure 8: Setting “Sum” as a “Not allowed aggregation” for a percentage data field

To ensure end-users get a correct count, consider whether the default aggregation type for each dimensional field should be Distinct Count or Count and set accordingly. For example, if we wanted to ask “how many courses do we offer,” we would want to set Courses to Distinct Count because the underlying data contains multiple records for the same course to track each student enrolled.

If we have a count, we get over 6,000 courses, which is a count of all rows that have data in the Courses field, covering every student in the dataset (Figure 9).

Q KPI showing 6,277

Figure 9: Q visual showing a count of courses

If we set the default aggregation to Distinct Count, we get the count of unique course names, which is more likely to be what the end-user expects (Figure 10).

Q KPI showing 15

Figure 10: Q visual showing the unique count of courses

Review the primary date field

Q will automatically select a primary date field for answering time related questions like “when” or “yoy”. If your data includes more than one date field, you may want to choose a different date than Q’s default choice. End-users can also ask about additional date fields by explicitly naming them (Figure 12). You can always specify a different date if you’d like. To review or change the primary date, go to the topic page, navigate to the Data section, and choose the Datasets tab. Expand the dataset and review the value for Default date (Figure 11).

Reviewing the Q default date

Figure 11: Reviewing the default date

You can change the date as needed.

Changing the date field

Figure 12: Asking about non-default dates

Add named filters

In a dashboard, filters are critical to allow users to focus in on their area of interest. With Q, traditional filters aren’t required because users can automatically ask to filter any field values included in the Q topic. For example, you could ask “What were sales last week for Acme Inc. for returning shoppers?” Instead of building the filters in a dashboard (date, customer name, and returning vs. new customer), Q does the filtering on the fly to instantly provide the answer.

With Q, a filter is a specific word or phrase your business users will use to instruct Q to filter returned results. For example, you have student test scores but you want a way for your users to ask about failing test scores. You can set up a filter for “Failing” defined as test scores less than 70% (Figure 13).

Q filter configuration

Figure 13: Filter configuration example using a measure

Additionally, maybe you have a field for Student Classification, which includes Freshmen, Sophomore, Junior, Senior, and Graduate, and you want to let users ask about “undergrads” vs. “graduates” (Figure 14). You can make a filter that includes the relevant values.

Q undergrad named filter example

Figure 14: Filter configuration example using a dimension

Add named entities

Named entities are a way to get Q to return a set of fields as a table visual when a user asks for a specific word or phrase. If someone wanted to know “sales for retail december” and they get a KPI saying $6,169 without any extra context, it is hard to understand all data this number includes (Figure 15).

Q KPI showing $6,169

Figure 15: A Q visual showing “sales for retail december”

By presenting the KPI in a table view with other relevant dimensions, the data includes additional context making it easier to understand meaning (Figure 16).

Q named entity as a table visual

Figure 16: A Q visual showing “sales details for retail december”

By building these table views, you can happily surprise your business users by anticipating the information they want to see without having to explicitly ask for each piece of data. The best part is your business users can easily filter the table using language to answer their own data questions. For example, in the Student Enrollment topic, we created a Student information named entity with some important student details like their name, major, email, and test scores per course.

Q named entity for student information

Figure 17: Named entity example

If a university administrator wanted to reach out to students who are failing biology, they can simply ask for “student information for failing biology majors.” In one step, they get a filtered list that already includes their emails and test scores so they can reach out (Figure 18).

Q named entity filtered down for failing biology students

Figure 18: Filtering a named entity

If the university administrator wanted to also see the phone numbers of the students to send texts offering free tutoring, they could simply ask Q “Student information for failing biology majors with phone numbers.” Now, Mobile is added as the first column (Figure 19).

Q named entity adding phone number

Figure 19: Adding a column to a named entity

Entities can also be referenced using synonyms in order to capture all the ways your business users might refer to this group of data. In our example, we could also add “student contact info” and “academic details” based on the common terminology the university admins use.

Besides looking for patterns in the data fields, ask yourself about what your business users care about. For example, let’s assume we have data for our HR specialists, and we know they care about job postings, candidates, and recruiters. Each author might think of the groups slightly differently, but as long as it’s rooted in your business jobs to be done, then your groupings are providing value. With those three groups in mind, we can sort all the data into one of those buckets. For this use case, our Candidate bucket is pretty large, with about 20 fields. We can scan the list and notice that we track information for rejected and accepted candidates, so we start splitting the metrics into two groups: Successful Candidates and Rejected Candidates. Now information like Offer Letter Date, Accept Date, and Final Salary are all in the Successful Candidate group, and related fields about Rejected Candidates are clearly grouped together.

If you’re curious about strategies for how to create entities, check out card sorting techniques.

In the Product Sales sample topic, after scanning the data, we would start with Sales, Product, and Customer as three key groupings of information to analyze. Try out the exercise on your own data and feel free to ask any questions on the QuickSight Community. To learn how to create named entities, refer to Adding named entities to a topic dataset.

Drive NLQ adoption

After you have refined your topic, tested it out with some readers, and made it available for a larger audience, it’s important to follow two strategies to drive adoption.

First, provide your business users with support. Support might look like a short tutorial video or newsletter announcement. Consider keeping an open channel like a Slack or Teams chat where active users can post questions or enhancements.

Here at Amazon, the Prime team has a dedicated Product Manager (PM) for their embedded Q application that they call PrimeQ. The PM hosts regular demo and training sessions where the Prime team can ask them any questions and get ideas about what types of answers they can get. The PM also sends out a monthly newsletter to announce the availability of new data and topics along with sample questions, FAQs, and quotes from Prime team members who get value out of Q. The PM also has an active Slack channel where every single question gets answered within 24 hours, either by the PM or a data engineer on the Prime team.

Pro tip: Make sure your business users know who they can reach out to if they get stuck. Avoid the black box of “reach out to your author” so readers feel confident their questions will be answered by a known person. For embedded applications, be sure to build an easy way to get support.

Second, maintain a healthy feedback loop. Look at the usage data directly in the product and schedule 1-on-1 sessions with your readers. Use the usage data to track adoption and identify readers who are asking unanswerable questions (Figure 20). Engage with both your successful and struggling readers to learn how to continue to iterate and improve the experience. Talking to business users is especially important to uncover the implicit ambiguity of language.

Another example here at Amazon, after first launching the Revenue Insights topic for the AWS Analytics sales team, a QuickSight Solution Architect (SA) and myself checked the usage tab on a daily basis to track unanswerable questions and directly reach out to the sales team member to let them know how to adjust their question or that we made a change so their question would now work. For example, we initially had a field turned off for Market Segment and noticed a question from a sales leader asking about sales by segment. We turned the field on and let him know those questions would now work. The SA and I have a Slack channel with other stakeholders so we can troubleshoot asynchronously with ease. Now that the topic has been available for several months, we check the usage tab on a weekly basis.

Q user activity tab

Figure 20: User Activity tab in Q

Conclusion

In this post, we discussed how language is inherently complex and what context you need to provide Q to teach the system about your unique business language. Q’s automated data prep will get you started, but you need to add the context that is specific to your business user’s language. As we mentioned at the start of the post, consider the following:

  • Start with a narrow and focused use case
  • Teach the system your unique business language
  • Get success by providing support and having a feedback loop

Follow this post to enable your business users to answer questions of data using natural language in QuickSight.

Ready to get started with Q? Watch our quick tutorial on enabling QuickSight Q.

Want some tutorial videos to share with your team? Check out the following:

To see how Q can answer the “Why” behind data changes and forecast future business performance, refer to New analytical questions available in Amazon QuickSight Q: “Why” and “Forecast”.


About the Author

Amy Laresch is a product manager for Amazon QuickSight Q. She is passionate about analytics and is focused on delivering the best experience for every QuickSight Q reader. Check out her videos on the @AmazonQuickSight YouTube channel for best practices and to see what’s new for QuickSight Q.

[$] Scope-based resource management for the kernel

Post Syndicated from original https://lwn.net/Articles/934679/

The C language does not provide the sort of resource-management features
found in more recent languages. As a result, bugs involving
leaked memory or failure to release a lock are relatively common in
programs written in C — including the kernel. The kernel project has never
limited itself to the language features found in the C standard, though;
kernel developers will happily
use extensions provided by compilers if they prove helpful. It looks like
a relatively simple compiler-provided feature may lead to a significant
change in some common kernel coding patterns.

Efficiently crawl your data lake and improve data access with an AWS Glue crawler using partition indexes

Post Syndicated from Srividya Parthasarathy original https://aws.amazon.com/blogs/big-data/efficiently-crawl-your-data-lake-and-improve-data-access-with-aws-glue-crawler-using-partition-indexes/

In today’s world, customers manage vast amounts of data in their Amazon Simple Storage Service (Amazon S3) data lakes, which requires convoluted data pipelines to continuously understand the changes in the data layout and make them available to consuming systems. AWS Glue crawlers provide a straightforward way to catalog data in the AWS Glue Data Catalog that removes the heavy lifting when it comes to schema management and data classification. AWS Glue crawlers extract the data schema and partitions from Amazon S3 to automatically populate the Data Catalog, keeping the metadata current.

But with data growing exponentially over time, the number of partitions in a given table can grow significantly. Because analytics services like Amazon Athena query a table containing millions of partitions, the time needed to retrieve the partition increases and can cause query runtime to increase.

Today, AWS Glue crawler support has been expanded to automatically add partition indexes for newly discovered tables to optimize query processing on the partitioned dataset. Now, when the crawler creates a new Data Catalog table during a crawler run, it also creates a partition index by default, with the largest permutation of all numeric and string type partition columns as keys. The Data Catalog then creates a searchable index based on these keys, reducing the time required to retrieve and filter partition metadata on tables with millions of partitions. The creation of partition indexes benefits the analytics workloads running on Athena, Amazon EMR, Amazon Redshift Spectrum, and AWS Glue.

In this post, we describe how to create partition indexes with an AWS Glue crawler and compare the query performance improvement when accessing the crawled data with and without a partition index from Athena.

Solution overview

We use an AWS CloudFormation template to create our solution resources. In the following steps, we demonstrate how to configure the AWS Glue crawler to create a partition index using either the AWS Glue console or the AWS Command Line Interface (AWS CLI). Then we compare the query performance improvements using Athena.

Prerequisites

To follow along with this post, you must have access to an AWS Identity and Access Management (IAM) administrator role to create resources using AWS CloudFormation.

Set up your solution resources

The CloudFormation template generates the following resources:

  • IAM roles and policies
  • An AWS Glue database to hold the schema
  • An AWS Glue crawler pointing to a highly partitioned dataset
  • An Athena workgroup and bucket to store query results

Complete the following steps to set up the solution resources:

  1. Log in to the AWS Management Console as an IAM administrator.
  2. Choose Launch Stack to deploy the CloudFormation template:
  3. For DatabaseName, keep the default blog_partition_index_crawlerdb.
  4. Choose Next.
  5. Review the details on the final page and select I acknowledge that AWS CloudFormation might create IAM resources.
  6. Choose Create stack.
  7. When the stack is complete, on the AWS CloudFormation console, navigate to the Outputs tab of the stack.
  8. Note down values of DatabaseName and GlueCrawlerName.

Some of the resources that this stack deploys incur costs when in use.

Edit and run the AWS Glue crawler

To configure and run the AWS Glue crawler, complete the following steps:

  1. On the AWS Glue console, choose Crawlers in the navigation pane.
  2. Locate the crawler blog-partition-index-crawler and choose Edit.
  3. In the Set output and scheduling section, under Advanced options, select Create partition indexes automatically.
  4. Review and update the crawler settings.

Alternatively, you can configure your crawler using the AWS CLI (provide your IAM role and Region):

aws glue create-crawler --name blog-partition-index-crawler --targets '{ "S3Targets": [{ "Path": "s3://awsglue-datasets/examples/highly-partitioned-table/"}] }' --database-name "blog_partition_index_crawlerdb" --role <Crawler_IAM_role> --configuration "{\"Version\":1.0,\"CreatePartitionIndex\":true}" --region <region_name>
  1. Now run the crawler and verify that the crawler run is complete.

This is highly partitioned dataset and will take approximately 90 minutes to complete.

Verify the partitioned table

In the AWS Glue database blog_partition_index_crawlerdb, verify that the table highly_partitioned_table is created.

By default, the crawler determines an index based on the largest permutation of partition columns of valid column types in the same order of partition columns, which are either numeric or string. For the table created by the crawler (highly_partitioned_table), we have partition columns year (string), month (string), day (string), and hour (string).

Based on this definition, the crawler created an index on the permutation of year, month, day, and hour. The crawler created the indexes prefixed with crawler_ on any partition index created by default.

Verify the same by navigating to the table highly_partitioned_table on the AWS Glue console and choosing the Indexes tab.

The crawler was able to crawl the S3 data source and successfully populate the partition indexes for the table.

Compare the query performance improvements using Athena

First, we query the table in Athena without using the partition index. To verify the tables using Athena, complete the following steps:

  1. On the Athena console, choose crawler-primary-workgroup as the Athena workgroup and choose Acknowledge.
  2. Run the following query:
    select count(*), sum(value) from blog_partition_index_crawlerdb.highly_partitioned_table where year='1980' and month='01' and day ='01'

The following screenshot shows the query took approximately 32 seconds without filtering enabled using the partition index.

  1. Now we enable the partition index on the Athena query:
    ALTER TABLE blog_partition_index_crawlerdb.highly_partitioned_table
    SET TBLPROPERTIES ('partition_filtering.enabled' = 'true')

  2. Run the following query again and note the runtime:
    select count(*), sum(value) from blog_partition_index_crawlerdb.highly_partitioned_table where year=‘1980’ and month=‘01’ and day =‘01’

The following screenshot shows the query took only 700 milliseconds, which is much faster with filtering enabled using the partition index.

Clean up

To avoid unwanted charges to your AWS account, you can delete the AWS resources:

  1. Sign in to the CloudFormation console as the IAM admin used for creating the CloudFormation stack.
  2. Delete the CloudFormation stack you created.

Conclusion

In this post, we explained how to configure an AWS crawler to create partition indexes and compared the query performance when accessing the data with indexes from Athena.

If no partition indexes are present on the table, AWS Glue loads all the partitions of the table, and then filters the loaded partitions, which results in inefficient retrieval of metadata. Analytics services like Redshift Spectrum, Amazon EMR, and AWS Glue ETL Spark DataFrames can now utilize indexes for fetching partitions, resulting in significant query performance.

For more information on partition indexes and query performance across various analytical engines, refer to Improve Amazon Athena query performance using AWS Glue Data Catalog partition indexes and Improve query performance using AWS Glue partition indexes.

Special thanks to everyone who contributed to this crawler feature launch: Yuhang Chen, Kyle Duong,and Mita Gavade.


About the authors

Srividya Parthasarathy is a Senior Big Data Architect on the AWS Lake Formation team. She enjoys building data mesh solutions and sharing them with the community.

Sandeep Adwankar is a Senior Technical Product Manager at AWS. Based in the California Bay Area, he works with customers around the globe to translate business and technical requirements into products that enable customers to improve how they manage, secure, and access data.

[$] XFS online filesystem check and repair

Post Syndicated from original https://lwn.net/Articles/934561/

Darrick Wong has been doing work on XFS online
repair
for a number of years
and things are getting to the point where most of the filesystem-internal work
has been completed and is under review. The work remaining mostly concerns
the user-space side
to set up a periodic scan and repair cycle, so he wanted to discuss what
user space needs from this kind of feature in a filesystem session at the
2023 Linux Storage, Filesystem,
Memory-Management and BPF Summit
that he led remotely. The session may
not have gone quite as he hoped, as it got somewhat derailed by topics that
spilled over from the earlier session on
unprivileged image mounts
.

Insane 48-Port 2.5GbE 2x 25GbE 2x 10GbE Managed Chinese e-Sports Cafe and Hotel Switch

Post Syndicated from Rohit Kumar original https://www.servethehome.com/insane-48-port-2-5gbe-2x-25gbe-2x-10gbe-managed-chinese-e-sports-cafe-and-hotel-switch-microchip-micron-sandisk/

We show an insane and popular 48-port 2.5GbE switch with 25GbE. Designed at under $400 this switch is powering hotels and e-Sports cafes

The post Insane 48-Port 2.5GbE 2x 25GbE 2x 10GbE Managed Chinese e-Sports Cafe and Hotel Switch appeared first on ServeTheHome.

The collective thoughts of the interwebz