This
Laravel News article digs into the many enhancements that have found
their way into the PHP language in the last couple of years or so.
Lovely Enums, the savior of pointless database tables and floating
constants across the codebases of the world. Enums have quickly
become one of my favorite features of PHP 8.1 – I can now push my
roles into Enums instead of keeping them in a table that never
changes.
On October 25, 2022, VMware published VMSA-2022-0027 on two vulnerabilities in its Cloud Foundation solution. By far the more severe of these is CVE-2021-39144, an unauthenticated remote code execution vulnerability with a CVSSv3 score of 9.8. The vulnerability arises from a deserialization flaw in an open-source library called XStream, which is used to serialize objects to XML and back again. According to VMware’s advisory, an unauthenticated endpoint that leverages XStream for input serialization in VMware Cloud Foundation (NSX-V) provides a vector for attackers to obtain remote code execution in the context of ‘root’ on the appliance.
Vulnerability details and a proof of concept for CVE-2021-39144 are publicly available from prominent security researchers. While we are not aware of exploitation as of October 27, the severity of the vulnerability combined with the popularity of VMware solutions makes it a highly attractive target for attackers. Notably, VMware has gone so far as to release a patch for end-of-life (EOL) products—a testament to the criticality of the issue.
VMware Cloud Foundation customers should update to a fixed version immediately, without waiting for a typical patch cycle to occur. For additional information, see VMSA-2022-0027.
Rapid7 customers
InsightVM and Nexpose customers will be able to assess their exposure to CVE-2021-39144 with an authenticated vulnerability check expected to be available in the October 27 content release.
Mara Bos has written a lengthy
blog post on whether the Rust language needs to be standardized.
The answer is “no” — but she draws a distinction between a “standard”
(maintained by some distant standards body) and a “specification”.
While no official decision has been made yet, there does seem to be
a general agreement that we should indeed work towards having and
maintaining an official complete Rust specification from within the
Rust project. It’s just a lot of work, so I’m afraid we won’t get
there with just some enthusiastic volunteers, even if we can use
the Ferrocene specification as a start. We’ll need support and
funding from the Rust Foundation and interested companies.
This post is written by Michael Havey, Senior Specialist Solutions Architect, AWS
This post shows how to model a Unified Modeling Language (UML) state machine as an AWS Step Functions workflow. A UML state machine models the behavior of an object, naming each of its possible resting states and specifying how it moves from one state to another. A Step Functions state machine implements the object behavior. This post shows how the UML diagram guides the state machine implementation and traces back to it.
State machines are often used to model real-time systems and devices. This post uses a stock order as an example. What drives a business object from one state to another is its interaction with applications through services. When the object enters a new state, it typically responds by calling the application through a service. It is typically an event arising from that application that transitions the business object to the next state. The UML model declares each state and the service interactions. Step Functions, which is designed for service orchestration, implements the behavior.
Overview
This is the approach discussed in this post:
A developer implements a Step Functions state machine guided by a UML state machine designed in a third-party UML modeling tool. The implementation explicitly traces back to the UML model by logging execution of state machine activities.
To invoke the target application, the Step Functions state machine invokes an AWS Lambda handler function. This invocation implements a UML state machine activity.
The handler function, in turn, invokes the application. The implementation of the call is application-specific.
If a callback from the application is expected, the application sends an event to a Lambda event dispatcher function. The implementation of this message exchange is application-specific.
If a callback is expected, the Lambda event dispatcher function calls back the Step Functions state machine with the application event. This enables the Step Functions state machine to implement a UML state transition to the next state.
Traceability is the best way to link the Step Functions implementation to the UML model. This is because it ensures that the implementation is doing what the model intends.
An alternative is to generate Step Functions code based on the UML model using a standard XML format known as XML Metadata Interchange (XMI). A code generator tool can introspect the XMI to generate code from it. While technically feasible, UML state machines are highly expressive with many patterns and idioms. A generator often can’t produce code as lean and readable as that of a developer.
Walkthrough
This example shows a UML state machine in MagicDraw, a UML design tool. This diagram is the basis for the Step Functions implementation. This Git repository includes the XMI file for the UML diagram and the code to set up the Step Functions implementation.
Begin with the following UML model (also available in the GitHub repository).
In the model:
The black dot on the upper left is the initial state. It has an arrow (a transition) to CheckingStockPrice (a state).
CheckingStockPrice has an activity, called checkStockPrice, of type do. When that state is visited, the activity is automatically run. When the activity finishes, the machine transitions automatically (a completion transition) to the next state.
That state, GeneratingBuySellRecommendation, has its own do activity generateBuySellRecommendation. Completion of that activity moves to the next state.
The next state is Approving, whose activity routeForApproval is of type entry. That activity is run when the state is entered. It waits for an event to move the machine forward. There are three transitions from Approving. Each has a trigger, indicating the type of event expected, called approvalComplete. Each has a guard that distinguishes the outcome of the approval.
If the guard is sell, transition to the state SellingStock.
If it’s buy, transition to the state BuyingStock.
If it’s reject, transition to the terminate state (denoted by an X) and run a transition activity called logReject.
BuyingStock and SellingStock each have a do activity – buyStock and sellStock – and transition on completion to the state ReportingResult. That state has do activity reportResult.
Transition to the final state (the black dot enclosed in a circle).
Explore Step Functions implementation
Find the Step Functions implementation in the AWS Console. Under the list of State Machines, select the function with a name starting with BlogBuySell. Choose Edit to view the design of the machine. From there, open it in Workflow Studio to show the state machine workflow visualization:
The Step Function state machine implements all the activities from the UML state machine. There are Lambda tasks to implement the major state do activities: Check Stock Price, Generate Buy/Sell Recommendation, Buy Stock,Sell Stock, Report Result. There is also a Lambda function for the transition activity: Log Reject. Each Lambda function traces back to the UML state machine and uses the following format to log trace records:
{
 "sourceState": S,
 "activityType": stateEntry|stateExit|stateDo|transition,
 "activityName": N
 "trigger" T, // if transition activity
 "guard": G // if transition activity and has a guard
}
The control flow in the Step Functions state machine intuitively matches the UML state machine. The UML model has mostly completion transitions, so the Step Functions state machine largely flows from one Lambda task to another. However, I must consider the Approving state, where the machine waits for an event and then transitions in one of three directions from the choice stateBuy or Sell. For this, use the Step Functions callback capability. Route For Approval is a Lambda task with the Wait For Callback option enabled. The Lambda task has three responsibilities:
Executes the UML state entry activity routeForApproval by calling the application.
Logs a tracing record that it has executed that activity.
Passes the task token provided by the Step Functions state machine to the application.
When the application has an approval decision, it sends an event through messaging. A separate Lambda event dispatcher function receives the message and, using the Step Functions API, calls back the Step Functions state machine with key details from the message: task token, trigger, guard.
Finally, notice the fail step after Log Reject. This implements the terminate state in the UML model.
Execute the Step Functions state machine
Execute the state machine by choosing Start Execution for the BlogBuySell state machine in the Step Functions console. Use this input:
{"appData": "Insert your JSON here"}
The console shows a graph view of the progress of the state machine. It should pause at the Route For Approval task.
Confirm traceability
Check the event view to confirm the tracing back to the UML model. The Task Scheduled event for Check Stock Price shows:
The state machine is waiting at Route For Approval. Simulate an application event to continue it forward. First, copy the task token value from above, excluding the quotes.
In a separate browser tab, open the Lambda console and find the function whose name contains BlogDummyUMLEventDispatcher. In the Test tab, create a new event:
Choose Test to call the Lambda function with this input, which calls back the state machine.
Confirm execution of approval
In the Step Functions console, confirm that the flow is completed and taken the Buy stock path.
More examples and patterns
The AWS SAM application deploys two additional examples, which show important patterns:
Hierarchical or composite states.
Parallel or orthogonal states
Cancellation events
Internal transitions
Transition to history
Using an event loop for complex flow
You can find a discussion of these examples in the Git repo.
Comparing UML and Step Functions state machines
Step Functions transitions tasks in sequence with the ability to conditionally branch, loop, or parallelize tasks. These tasks aren’t quite the same as states in a UML model. In this approach, tasks map to UML states or transition activities.
A UML state machine spends most of its time waiting in its current state for the next event to happen. A standard workflow in Step Functions can wait too. It can run for up to one year because some activities can pause until they are called back by an external trigger. I used that capability to implement a pattern to trigger the next transition by calling back the Step Functions state machine.
Cleaning up
To avoid incurring future charges, navigate to the directory where you deployed the application and run sam delete to undeploy it.
Conclusion
This post shows code recipes for implementing UML state machines using Step Functions. If your organization already uses modeling tools, this discussion helps you understand the Step Functions implementation path. If you are a Step Functions designer, this discussion shows UML’s expressive power as the model for your implementation.
If you’re running a privacy-oriented application or service on the Internet, your options to provably protect users’ privacy are limited. You can minimize logs and data collection but even then, at a network level, every HTTP request needs to come from somewhere. Information generated by HTTP requests, like users’ IP addressesand TLS fingerprints, can be sensitive especially when combined with application data.
Meaningful improvements to your users’ privacy require a change in how HTTP requests are sent from client devices to the server that runs your application logic. This was the motivation for Privacy Gateway: a service that relays encrypted HTTP requests and responses between a client and application server. With Privacy Gateway, Cloudflare knows where the request is coming from, but not what it contains, and applications can see what the request contains, but not where it comes from. Neither Cloudflare nor the application server has the full picture, improving end-user privacy.
We recently deployed Privacy Gateway for Flo Health, a period tracking app, for the launch of their Anonymous Mode. With Privacy Gateway in place, all request data for Anonymous Mode users is encrypted between the app user and Flo, which prevents Flo from seeing the IP addresses of those users and Cloudflare from seeing the contents of that request data.
With Privacy Gateway in place, several other privacy-critical applications are possible:
Browser developers can collect user telemetry in a privacy-respecting manner– what extensions are installed, what defaults a user might have changed — while removing what is still a potentially personal identifier (the IP address) from that data.
Users can visit a healthcare site to report a Covid-19 exposure without worrying that the site is tracking their IP address and/or location.
The main innovation in the Oblivious HTTP standard – beyond a basic proxy service – is that these messages are encrypted to the application’s server, such that Privacy Gateway learns nothing of the application data beyond the source and destination of each message.
Privacy Gateway enables application developers and platforms, especially those with strong privacy requirements, to build something that closely resembles a “Mixnet”: an approach to obfuscating the source and destination of a message across a network. To that end, Privacy Gateway consists of three main components:
Client: the user’s device, or any client that’s configured to forward requests to Privacy Gateway.
Privacy Gateway: a service operated by Cloudflare and designed to relay requests between the Client and the Gateway, without being able to observe the contents within.
Application server: the origin or application web server responsible for decrypting requests from clients, and encrypting responses back.
If you were to imagine request data as the contents of the envelope (a letter) and the IP address and request metadata as the address on the outside, with Privacy Gateway, Cloudflare is able to see the envelope’s address and safely forward it to its destination without being able to see what’s inside.
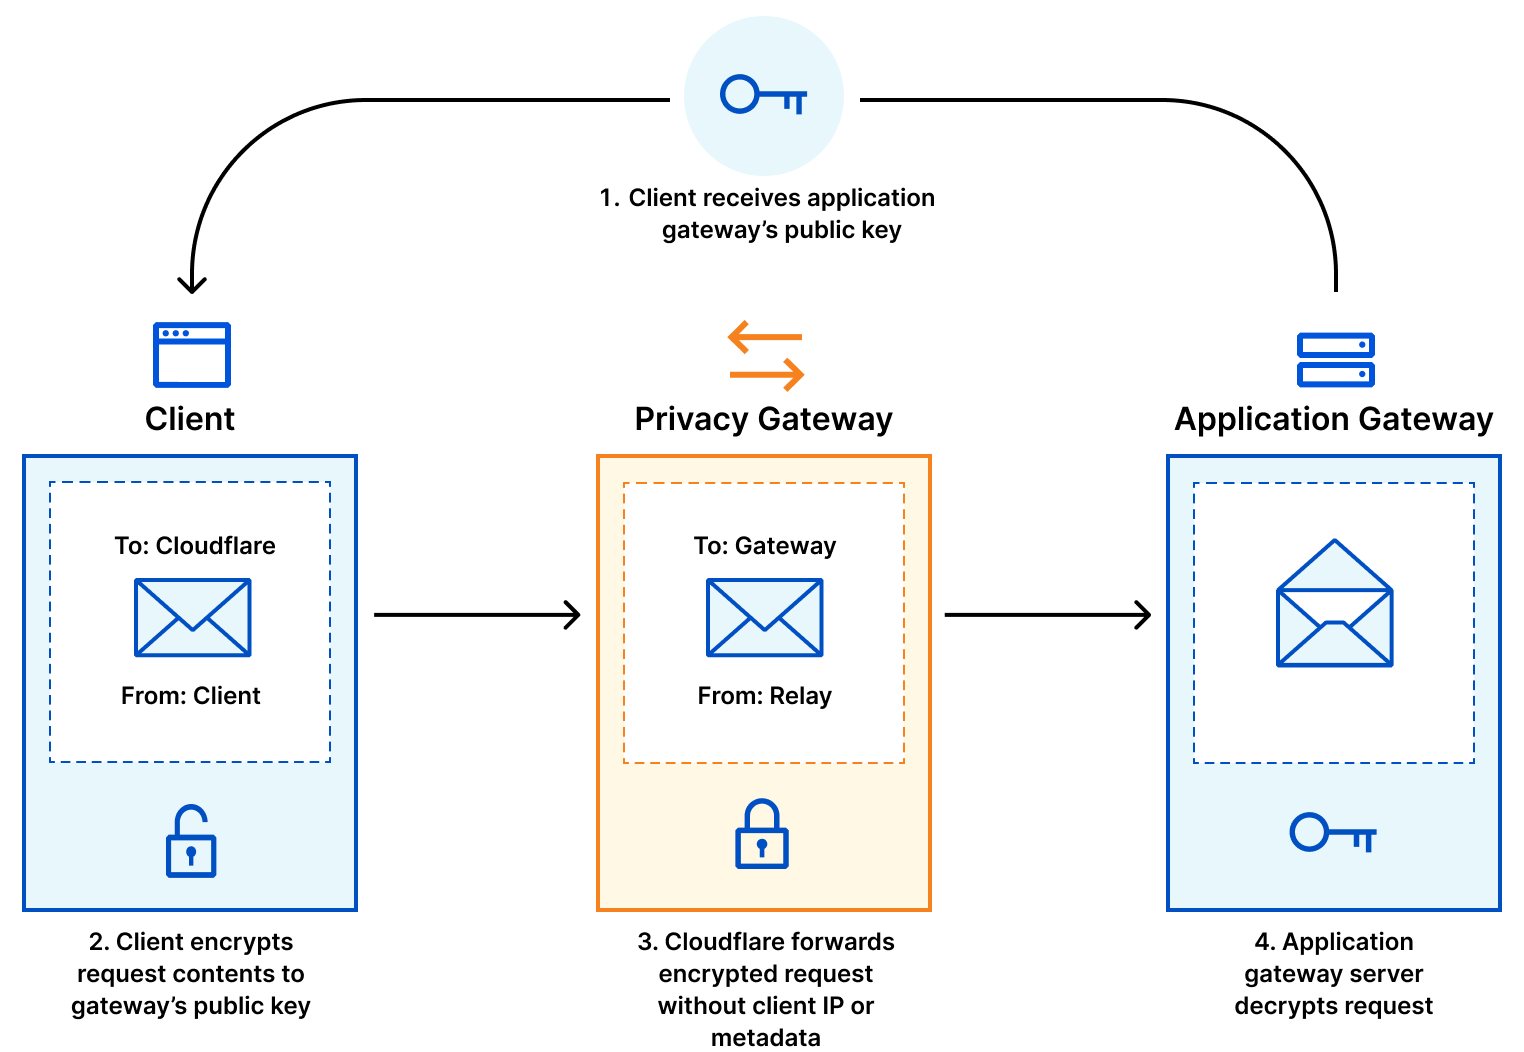
An Oblivious HTTP transaction using Privacy Gateway
In slightly more detail, the data flow is as follows:
Client encapsulates an HTTP request using the public key of the application server, and sends it to Privacy Gateway over an HTTPS connection.
Privacy Gateway forwards the request to the server over its own, separate HTTPS connection with the application server.
The application server decapsulates the request, forwarding it to the target server which can produce the response.
The application server returns an encapsulated response to Privacy Gateway, which then forwards the result to the client. As specified in the protocol, requests from the client to the server are encrypted using HPKE, a state-of-the-art standard for public key encryption – which you can read more about here. We’ve taken additional measures to ensure that OHTTP’s use of HPKE is secure by conducting a formal analysis of the protocol, and we expect to publish a deeper analysis in the coming weeks.
How Privacy Gateway improves end-user privacy
This interaction offers two types of privacy, which we informally refer to as request privacy and client privacy.
Request privacy means that the application server does not learn information that would otherwise be revealed by an HTTP request, such as IP address, geolocation, TLS and HTTPS fingerprints, and so on. Because Privacy Gateway uses a separate HTTPS connection between itself and the application server, all of this per-request information revealed to the application server represents that of Privacy Gateway, not of the client. However, developers need to take care to not send personally identifying information in the contents of requests. If the request, once decapsulated, includes information like users’ email, phone number, or credit card info, for example, Privacy Gateway will not meaningfully improve privacy.
Client privacy is a stronger notion. Because Cloudflare and the application server are not colluding to share individual user’s data, from the server’s perspective, each individual transaction came from some unknown client behind Privacy Gateway. In other words, a properly configured Privacy Gateway deployment means that applications cannot link any two requests to the same client. In particular, with Privacy Gateway, privacy loves company. If there is only one end-user making use of Privacy Gateway, then it only provides request privacy (since the client IP address remains hidden from the Gateway). It would not provide client privacy, since the server would know that each request corresponds to the same, single client. Client privacy requires that there be many users of the system, so the application server cannot make this determination.
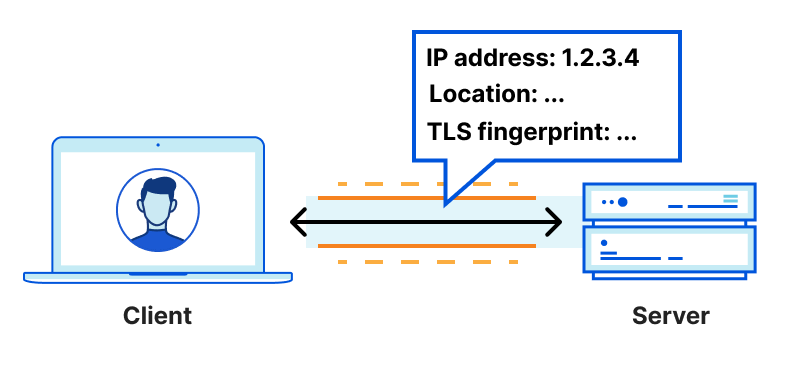
To better understand request and client privacy, consider the following HTTP request between a client and server:
Normal HTTP configuration with a client anonymity set of size 1
If a client connects directly to the server (or “Gateway” in OHTTP terms), the server is likely to see information about the client, including the IP address, TLS cipher used, and a degree of location data based on that IP address:
- ipAddress: 192.0.2.33 # the client’s real IP address
- ASN: 7922
- AS Organization: Comcast Cable
- tlsCipher: AEAD-CHACHA20-POLY1305-SHA256 # potentially unique
- tlsVersion: TLSv1.3
- Country: US
- Region: California
- City: Campbell
There’s plenty of sensitive information here that might be unique to the end-user. In other words, the connection offers neither request nor client privacy.
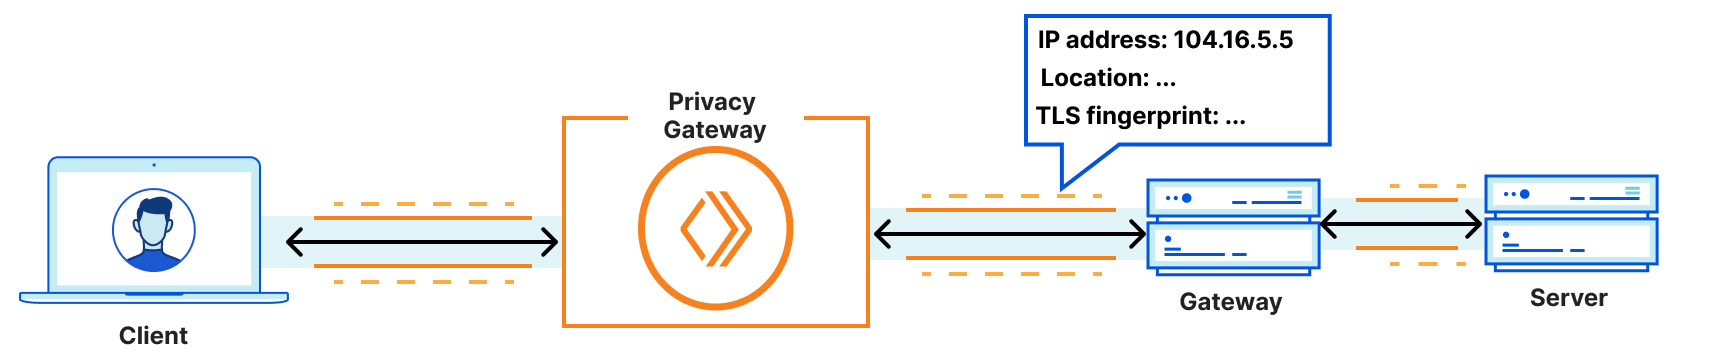
With Privacy Gateway, clients do not connect directly to the application server itself. Instead, they connect to Privacy Gateway, which in turn connects to the server. This means that the server only observes connections from Privacy Gateway, not individual connections from clients, yielding a different view:
- ipAddress: 104.16.5.5 # a Cloudflare IP
- ASN: 13335
- AS Organization: Cloudflare
- tlsCipher: ECDHE-ECDSA-AES128-GCM-SHA256 # shared across several clients
- tlsVersion: TLSv1.3
- Country: US
- Region: California
- City: Los Angeles
Privacy Gateway configuration with a client anonymity set of size k
This is request privacy. All information about the client’s location and identity are hidden from the application server. And all details about the application data are hidden from Privacy Gateway. For sensitive applications and protocols like DNS, keeping this metadata separate from the application data is an important step towards improving end-user privacy.
Moreover, applications should take care to not reveal sensitive, per-client information in their individual requests. Privacy Gateway cannot guarantee that applications do not send identifying info – such as email addresses, full names, etc – in request bodies, since it cannot observe plaintext application data. Applications which reveal user identifying information in requests may violate client privacy, but not request privacy. This is why – unlike our full application-level Privacy Proxy product – Privacy Gateway is not meant to be used as a generic proxy-based protocol for arbitrary applications and traffic. It is meant to be a special purpose protocol for sensitive applications, including DNS (as is evidenced by Oblivious DNS-over-HTTPS), telemetry data, or generic API requests as discussed above.
Integrating Privacy Gateway into your application
Integrating with Privacy Gateway requires applications to implement the client and server side of the OHTTP protocol. Let’s walk through what this entails.
Server Integration
The server-side part of the protocol is responsible for two basic tasks:
Publishing a public key for request encapsulation; and
Decrypting encapsulated client requests, processing the resulting request, and encrypting the corresponding response.
A public encapsulation key, called a key configuration, consists of a key identifier (so the server can support multiple keys at once for rotation purposes), cryptographic algorithm identifiers for encryption and decryption, and a public key:
HPKE Symmetric Algorithms {
  HPKE KDF ID (16),
  HPKE AEAD ID (16),
}

OHTTP Key Config {
  Key Identifier (8),
  HPKE KEM ID (16),
  HPKE Public Key (Npk * 8),
  HPKE Symmetric Algorithms Length (16),
  HPKE Symmetric Algorithms (32..262140),
}
Clients need this public key to create their request, and there are lots of ways to do this. Servers could fix a public key and then bake it into their application, but this would require a software update to rotate the key. Alternatively, clients could discover the public key some other way. Many discovery mechanisms exist and vary based on your threat model – see this document for more details. To start, a simple approach is to have clients fetch the public key directly from the server over some API. Below is a snippet of the API that our open source OHTTP server provides:
func (s *GatewayResource) configHandler(w http.ResponseWriter, r *http.Request) {
	config, err := s.Gateway.Config(s.keyID)
	if err != nil {
		http.Error(w, http.StatusText(http.StatusInternalServerError), http.StatusInternalServerError)
		return
	}
	w.Write(config.Marshal())
}
Once public key generation and distribution is solved, the server then needs to handle encapsulated requests from clients. For each request, the server needs to decrypt the request, translate the plaintext to a corresponding HTTP request that can be resolved, and then encrypt the resulting response back to the client.
Open source OHTTP libraries typically offer functions for request decryption and response encryption, whereas plaintext translation from binary HTTP to an HTTP request is handled separately. For example, our open source server delegates this translation to a different library that is specific to how Go HTTP requests are represented in memory. In particular, the function to translate from a plaintext request to a Go HTTP request is done with a function that has the following signature:
While there exist several open source libraries that one can use to implement OHTTP server support, we’ve packaged all of it up in our open source server implementation available here. It includes instructions for building, testing, and deploying to make it easy to get started.
Client integration
Naturally, the client-side behavior of OHTTP mirrors that of the server. In particular, the client must:
Discover or obtain the server public key; and
Encode and encrypt HTTP requests, send them to Privacy Gateway, and decrypt and decode the HTTP responses.
Discovery of the server public key depends on the server’s chosen deployment model. For example, if the public key is available over an API, clients can simply fetch it directly:
Encoding, encrypting, decrypting, and decoding are again best handled by OHTTP libraries when available. With these functions available, building client support is rather straightforward. A trivial example Go client using the library functions linked above is as follows:
A standalone client like this isn’t likely very useful to you if you have an existing application. To help integration into your existing application, we created a sample OHTTP client library that’s compatible with iOS and macOS applications. Additionally, if there’s language or platform support you would like to see to help ease integration on either or the client or server side, please let us know!
Interested?
Privacy Gateway is currently in early access – available to select privacy-oriented companies and partners. If you’re interested, please get in touch.
We recently announced Privacy Gateway, a fully managed, scalable, and performant Oblivious HTTP (OHTTP) relay. Conceptually, OHTTP is a simple protocol: end-to-end encrypted requests and responses are forwarded between client and server through a relay, decoupling who from what was sent. This is a common pattern, as evidenced by deployed technologies like Oblivious DoH and Apple Private Relay. Nevertheless, OHTTP is still new, and as a new protocol it’s imperative that we analyze the protocol carefully.
To that end, we conducted a formal, computer-aided security analysis to complement the ongoing standardization process and deployment of this protocol. In this post, we describe this analysis in more depth, digging deeper into the cryptographic details of the protocol and the model we developed to analyze it. If you’re already familiar with the OHTTP protocol, feel free to skip ahead to the analysis to dive right in. Otherwise, let’s first review what OHTTP sets out to achieve and how the protocol is designed to meet those goals.
Decoupling who from what was sent
OHTTP is a protocol that combines public key encryption with a proxy to separate the contents of an HTTP request (and response) from the sender of an HTTP request. In OHTTP, clients generate encrypted requests and send them to a relay, the relay forwards them to a gateway server, and then finally the gateway decrypts the message to handle the request. The relay only ever sees ciphertext and the client and gateway identities, and the gateway only ever sees the relay identity and plaintext.
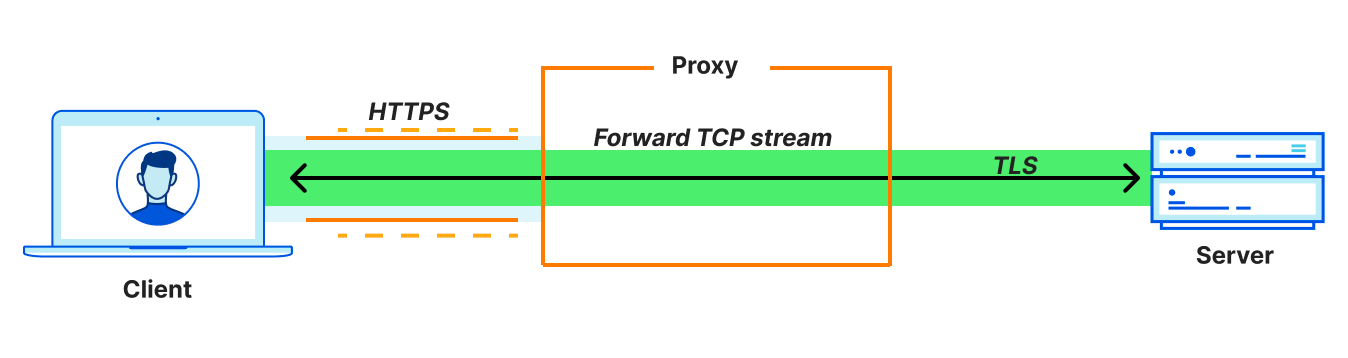
In this way, OHTTP is a lightweight application-layer proxy protocol. This means that it proxies application messages rather than network-layer connections. This distinction is important, so let’s make sure we understand the differences. Proxying connections involves a whole other suite of protocols typically built on HTTP CONNECT. (Technologies like VPNs and WireGuard, including Cloudflare WARP, can also be used, but let’s focus on HTTP CONNECT for comparison.)
Connection-oriented proxy depiction
Since the entire TCP connection itself is proxied, connection-oriented proxies are compatible with any application that uses TCP. In effect, they are general purpose proxy protocols that support any type of application traffic. In contrast, proxying application messages is compatible with application use cases that require transferring entire objects (messages) between a client and server.
Message-oriented proxy depiction
Examples include DNS requests and responses, or, in the case of OHTTP, HTTP requests and responses. In other words, OHTTP is not a general purpose proxy protocol: it’s fit for purpose, aimed at transactional interactions between clients and servers (such as app-level APIs). As a result, it is much simpler in comparison.
Applications use OHTTP to ensure that requests are not linked to either of the following:
Client identifying information, including the IP address, TLS fingerprint, and so on. As a proxy protocol, this is a fundamental requirement.
Future requests from the same client. This is necessary for applications that do not carry state across requests.
These two properties make OHTTP a perfect fit for applications that wish to provide privacy to their users without compromising basic functionality. It’s served as the foundation for a widespread deployment of Oblivious DoH for over a year now, and as of recently, serves as the foundation for Flo Health’s Anonymous Mode feature.
It’s worth noting that both of these properties could be achieved with a connection-oriented protocol, but at the cost of a new end-to-end TLS connection for each message that clients wish to transmit. This can be prohibitively expensive for all entities that participate in the protocol.
So how exactly does OHTTP achieve these goals? Let’s dig deeper into OHTTP to find out.
Oblivious HTTP protocol design
A single transaction in OHTTP involves the following steps:
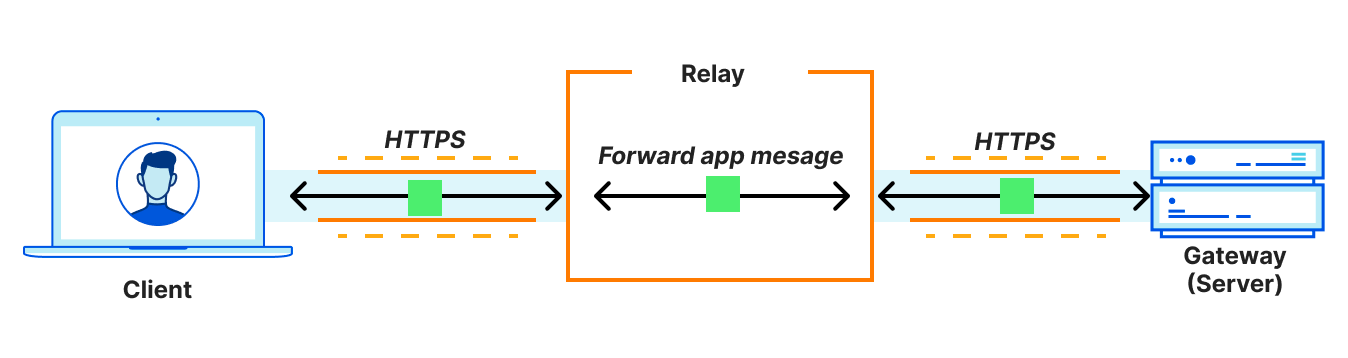
A client encapsulates an HTTP request using the public key of the gateway server, and sends it to the relay over a client<>relay HTTPS connection.
The relay forwards the request to the server over its own relay<>gateway HTTPS connection.
The gateway decapsulates the request, forwarding it to the target server which can produce the resource.
The gateway returns an encapsulated response to the relay, which then forwards the result to the client.
Observe that in this transaction the relay only ever sees the client and gateway identities (the client IP address and the gateway URL, respectively), but does not see any application data. Conversely, the gateway sees the application data and the relay IP address, but does not see the client IP address. Neither party has the full picture, and unless the relay and gateway collude, it stays that way.
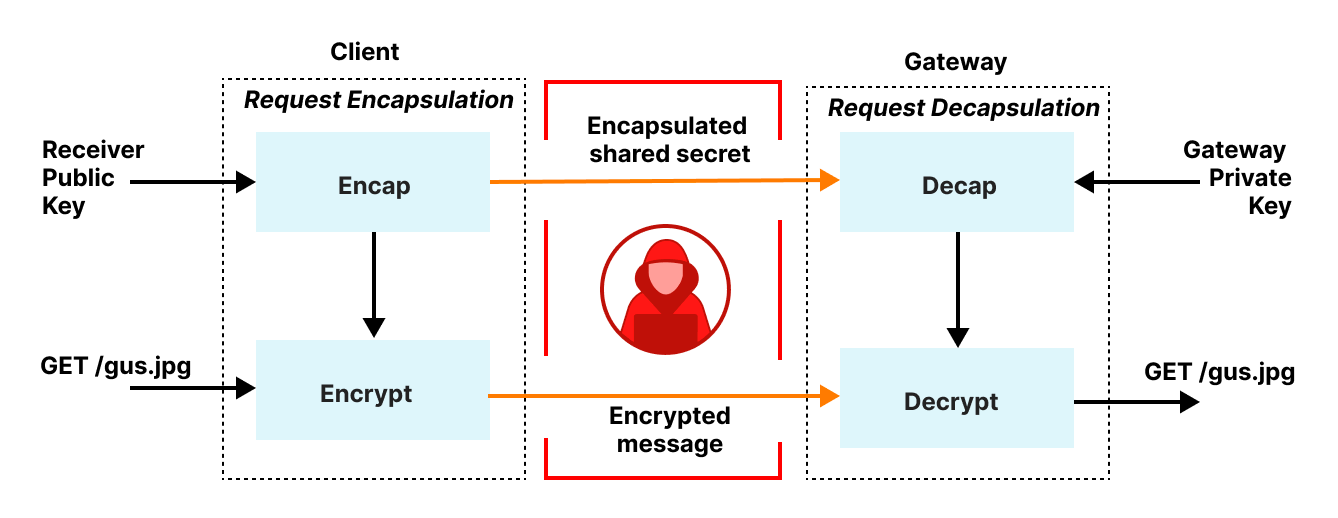
The HTTP details for forwarding requests and responses in the transaction above are not technically interesting – a message is sent from sender to receiver over HTTPS using a POST – so we’ll skip over them. The fascinating bits are in the request and response encapsulation, which build upon HPKE, a recently ratified standard for hybrid public key encryption.
Let’s begin with request encapsulation, which is hybrid public key encryption. Clients first transform their HTTP request into a binary format, called Binary HTTP, as specified by RFC9292. Binary HTTP is, as the name suggests, a binary format for encoding HTTP messages. This representation lets clients encode HTTP requests to binary-encoded values and for the gateway to reverse this process, recovering an HTTP request from a binary-encoded value. Binary encoding is necessary because the public key encryption layer expects binary-encoded inputs.
Once the HTTP request is encoded in binary format, it is then fed into HPKE to produce an encrypted message, which clients then send to the relay to be forwarded to the gateway. The gateway decrypts this message, transforms the binary-encoded request back to its equivalent HTTP request, and then forwards it to the target server for processing.
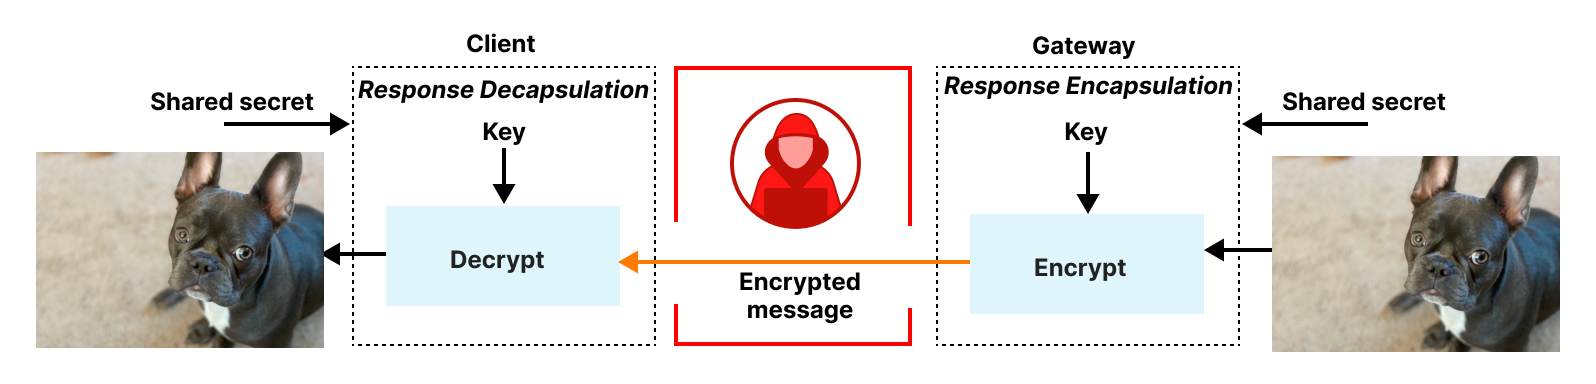
Responses from the gateway are encapsulated back to the client in a very similar fashion. The gateway first encodes the response in an equivalent binary HTTP message, encrypts it using a symmetric key known only to the client and gateway, and then returns it to the relay to be forwarded to the client. The client decrypts and transforms this message to recover the result.
Simplified model and security goals
In our formal analysis, we set out to make sure that OHTTP’s use of encryption and proxying achieves the desired privacy goals described above.
To motivate the analysis, consider the following simplified model where there exists two clients C1 and C2, one relay R, and one gateway, G. OHTTP assumes an attacker that can observe all network activity and can adaptively compromise either R or G, but not C1 or C2. OHTTP assumes that R and G do not collude, and so we assume only one of R and G is compromised. Once compromised, the attacker has access to all session information and private key material for the compromised party. The attacker is prohibited from sending client-identifying information, such as IP addresses, to the gateway. (This would allow the attacker to trivially link a query to the corresponding client.)
In this model, both C1 and C2 send OHTTP requests Q1 and Q2, respectively, through R to G, and G provides answers A1 and A2. The attacker aims to link C1 to (Q1, A1) and C2 to (Q2, A2), respectively. The attacker succeeds if this linkability is possible without any additional interaction. OHTTP prevents such linkability. Informally, this means:
Requests and responses are known only to clients and gateways in possession of the corresponding response key and HPKE keying material.
The gateway cannot distinguish between two identical requests generated from the same client, and two identical requests generated from different clients, in the absence of unique per-client keys.
And informally it might seem clear that OHTTP achieves these properties. But we want to prove this formally, which means that the design, if implemented perfectly, would have these properties. This type of formal analysis is distinct from formal verification, where you take a protocol design and prove that some code implements it correctly. Whilst both are useful they are different processes, and in this blog post we’ll be talking about the former.But first, let’s give some background on formal analysis.
Formal analysis programming model
In our setting, a formal analysis involves producing an algebraic description of the protocol and then using math to prove that the algebraic description has the properties we want. The end result is proof that shows that our idealized algebraic version of the protocol is “secure”, i.e. has the desired properties, with respect to an attacker we want to defend against. In our case, we chose to model our idealized algebraic version of OHTTP using a tool called Tamarin, a security-focused theorem prover and model checker. Tamarin is an intimidating tool to use, but makes intuitive sense once you get familiar with it. We’ll break down the various parts of a Tamarin model in the context of our OHTTP model below.
Modeling the Protocol Behavior
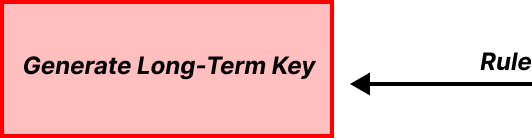
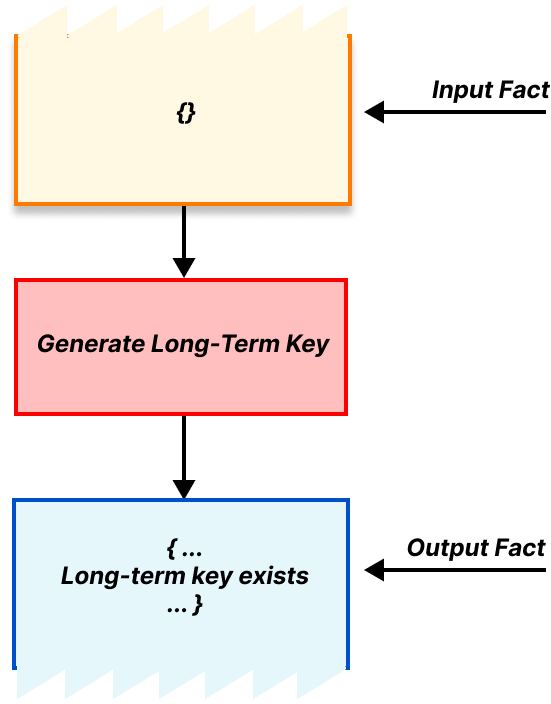
Tamarin uses a technique known as multiset rewriting to describe protocols. A protocol description is formed of a series of “rules” that can “fire” when certain requirements are met. Each rule represents a discrete step in the protocol, and when a rule fires that means the step was taken. For example, we have a rule representing the gateway generating its long-term public encapsulation key, and for different parties in the protocol establishing secure TLS connections. These rules can be triggered pretty much any time as they have no requirements.
Basic rule for OHTTP gateway key generation
Tamarin represents these requirements as “facts”. A rule can be triggered when the right facts are available. Tamarin stores all the available facts in a “bag” or multiset. A multiset is similar to an ordinary set, in that it stores a collection of objects in an unordered fashion, but unlike an ordinary set, duplicate objects are allowed. This is the “multiset” part of “multiset rewriting”.
The rewriting part refers to the output of our rules. When a rule triggers it takes some available facts out of the bag and, when finished, inserts some new facts into the bag. These new facts might fulfill the requirements of some other rule, which can then be triggered, producing even more new facts, and so on1. In this way we can represent progress through the protocol. Using input and output facts, we can describe our rule for generating long-term public encapsulation keys, which has no requirements and produces a long-term key as output, as follows.
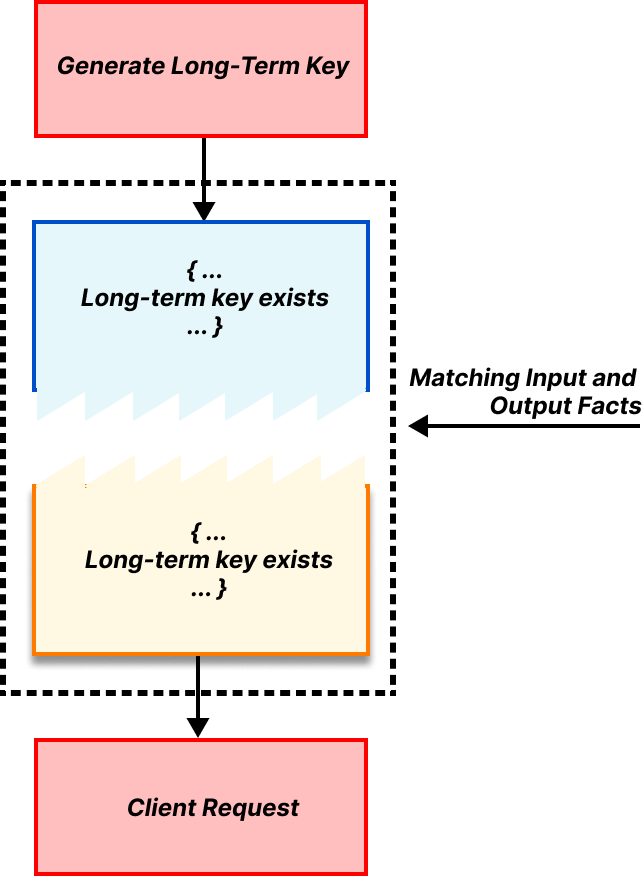
A rule requirement is satisfied if there exist output facts that match the rule’s input facts. As an example, in OHTTP, one requirement for the client rule for generating a request is that the long-term public encapsulation key exists. This matching is shown below.
Let’s put some of these pieces together to show a very small but concrete part of OHTTP as an example: the client generating its encapsulated request and sending it to the relay. This step should produce a message for the relay, as well as any corresponding state needed to process the eventual response from the relay. As a precondition, the client requires (1) the gateway public key and (2) a TLS connection to the relay. And as mentioned earlier, generating the public key and TLS connection do not require any inputs, so they can be done at any time.
Modeling events in time
Beyond consuming and producing new facts, each Tamarin rule can also create side effects, called “action facts.” Tamarin records the action facts each time a rule is triggered. An action fact might be something like “a client message containing the contents m was sent at time t.” Sometimes rules can only be triggered in a strict sequence, and we can therefore put their action facts in a fixed time order. At other times multiple rules might have their prerequisites met at the same time, and therefore we can’t put their action facts into a strict time sequence. We can represent this pattern of partially ordered implications as a directed acyclic graph, or DAG for short.
Altogether, multiset rewriting rules describe the steps of a protocol, and the resulting DAG records the actions associated with the protocol description. We refer to the DAG of actions as the action graph. If we’ve done our job well it’s possible to follow these rules and produce every possible combination of messages or actions allowed by the protocol, and their corresponding action graph.
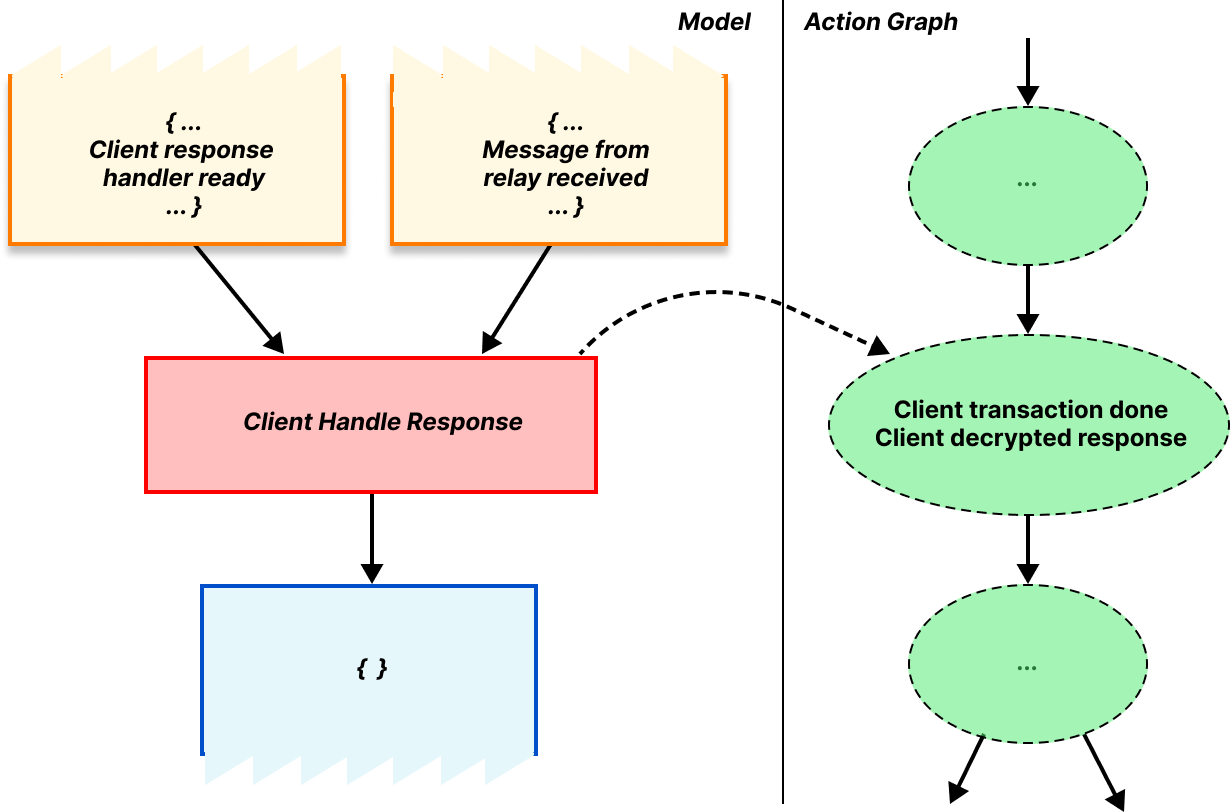
As an example of the action graph, let’s consider what happens when the client successfully finishes the protocol. When the requirements for this rule are satisfied, the rule triggers, marking that the client is done and that the response was valid. Since the protocol is done at this point, there are no output facts produced.
Action graph for terminal client response handler rule
Modeling the attacker
The action graph is core to reasoning about the protocol’s security properties. We can check a graph for various properties, e.g. “does the first action taken by the relay happen after the first action taken by the client?”. Our rules allow for multiple runs of the protocol to happen at the same time. This is very powerful. We can look at a graph and ask “did something bad happen here that might break the protocol’s security properties?”
In particular, we can prove (security and correctness) properties by querying this graph, or by asserting various properties about it. For example, we might say “for all runs of the protocol, if the client finishes the protocol and can decrypt the response from the gateway, then the response must have been generated and encrypted by an entity which has the corresponding shared secret.”
This is a useful statement, but it doesn’t say much about security. What happens if the gateway private key is compromised, for example? In order to prove security properties, we need to define our threat model, which includes the adversary and their capabilities. In Tamarin, we encode the threat model as part of the protocol model. For example, when we define messages being passed from the client to the relay, we can add a special rule that allows the attacker to read it as it goes past. This gives us the ability to describe properties such as “for all runs of the protocol in our language the attacker never learns the secret key.”
For security protocols, we typically give the attacker the ability to read, modify, drop, and replay any message. This is sometimes described as “the attacker controls the network”, or a Dolev-Yao attacker. However, the attacker can also sometimes compromise different entities in a protocol, learning state associated with that entity. This is sometimes called an extended Dolev-Yao attacker, and it is precisely the attacker we consider in our model.
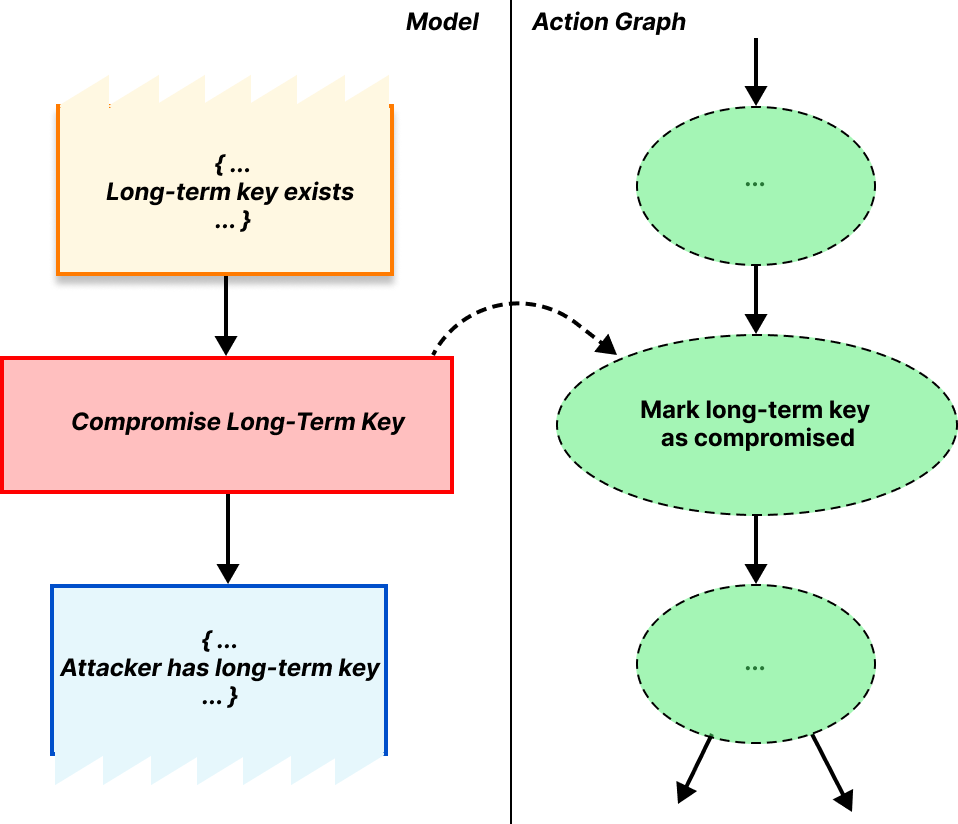
Going back to our model, we give the attacker the ability to compromise long-term key pairs and TLS sessions as needed through different rules. These set various action facts that mark the fact that compromise took place.
Action graph for key compromise rule
Putting everything together, we have a way to model the protocol behavior, attacker capabilities, and security properties. Let’s now dive into how we applied these to prove OHTTP secure.
OHTTP Tamarin model
In our model, we give the attacker the ability to compromise the server’s long-term keys and the key between the client and the relay. Against this attacker, we aim to prove these two informal statements stated above:
Requests and responses are known only to clients and gateways in possession of the corresponding response key and HPKE keying material.
The gateway cannot distinguish between two requests generated from the same client, and two requests generated from different clients, in the absence of unique per-client keys.
To prove these formally, we express them somewhat differently. First, we assert that the protocol actually completes. This is an important step, because if your model has a bug in it where the protocol can’t even run as intended, then Tamarin is likely to say it’s “secure” because nothing bad ever happens.
For the core security properties, we translate the desired goals into questions we ask about the model. In this way, formal analysis only provides us proof (or disproof!) of the questions we ask, not the questions we should have asked, and so this translation relies on experience and expertise. We break down this translation for each of the questions we want to ask below, starting with gateway authentication.
Gateway authenticationUnless the attacker has compromised the gateway’s long term keys, if the client completes the protocol and is able to decrypt the gateway’s response, then it knows that: the responder was the gateway it intended to use, the gateway derived the same keys, the gateway saw the request the client sent, and the response the client received is the one the gateway sent.
This tells us that the protocol actually worked, and that the messages sent and received were as they were supposed to be. One aspect of authentication can be that the participants agree on some data, so although this protocol seems to be a bit of a grab bag of properties they’re all part of one authentication property.
Next, we need to prove that the request and response remain secret. There are several ways in which secrecy may be violated, e.g., if encryption or decryption keys are compromised. We do so by proving the following properties.
Request and response secrecy The request and response are both secret, i.e., the attacker never learns them, unless the attacker has compromised the gateway’s long term keys.
In a sense, request and response secrecy covers the case where the gateway is malicious, because if the gateway is malicious then the “attacker” knows the gateway’s long term keys.
Relay connection security The contents of the connection between the client and relay are secret unless the attacker has compromised the relay.
We don’t have to worry about the secrecy of the connection if the client is compromised because in that scenario the attacker knows the query before it’s even been sent, and can learn the response by making an honest query itself. If your client is compromised then it’s game over.
AEAD nonce reuse resistance If the gateway sends a message to the client, and the attacker finds a different message encrypted with the same key and nonce, then either the attacker has already compromised the gateway, or they already knew the query.
In translation, this property means that the response encryption is correct and not vulnerable to attack, such as through AEAD nonce reuse. This would obviously be a disaster for OHTTP, so we were careful to check that this situation never arises, especially as we’d already detected this issue in ODoH.
Finally, and perhaps most importantly, we want to prove that an attacker can’t link a particular query to a client. We prove a slightly different property which effectively argues that, unless the relay and gateway collude, then the attacker cannot link the encrypted query to its decrypted query together. In particular, we prove the following:
Client unlinkability If an attacker knows the query and the contents of the connection sent to the relay (i.e. the encrypted query), then it must have compromised both the gateway and the relay.
This doesn’t in general prove indistinguishability. There are two techniques an attacker can use to link two queries. Direct inference and statistical analysis. Because of the anonymity trilemma we know that we cannot defend against statistical analysis, so we have to declare it out of scope and move on. To prevent direct inference we need to make sure that the attacker doesn’t compromise either the client, or both the relay and the gateway together, which would let it directly link the queries. So is there anything we can protect against? Thankfully there is one thing. We can make sure that a malicious gateway can’t identify that a single client sent two messages. We prove that by not keeping any state between connections. If a returning client acts in exactly the same way as a new client, and doesn’t carry any state between requests, there’s nothing for the malicious gateway to analyze.
And that’s it! If you want to have a go at proving some of these properties yourself our models and proofs are available on our GitHub, as are our ODoH models and proofs. The Tamarin prover is freely available too, so you can double-check all our work. Hopefully this post has given you a flavor of what we mean when we say that we’ve proven a protocol secure, and inspired you to have a go yourself. If you want to work on great projects like this check out our careers page.
1Depending on the model, this process can lead to an exponential blow-up in search space, making it impossible to prove anything automatically. Moreover, if the new output facts do not fulfill the requirements of any remaining rule(s) then the process hangs.
If you’re new to teaching programming or looking to build or refresh your programming knowledge, we have a free resource that is perfect for you. Our ‘Learn to program in Python’ online course pathway is for educators who want to develop their understanding of the text-based language Python. Each course is packed with information and activities to help you apply what you learn in your classroom teaching.
Why learn to program in Python?
Writing a program in Python is very similar to writing in English, which makes starting to program much easier. Python is also a general-purpose programming language, so once you’ve learned the basics, you can use Python for lots of different programming activities.
That’s why Python is a perfect choice for learning to program, and why many of our educational resources involve Python. Our seven online Python courses cover aspects from taking your first steps into programming, to writing a program to control an electronic circuit, to learning about object-oriented programming.
With time and practice, you will be able to use Python programming to create unique solutions to problems, build helpful tools, and make things that are important to you.
How does the Python course pathway work?
The courses in the pathway have been written by our educators and include advice and activities to help you teach programming in your classroom. You can reuse the course activities to explain programming concepts to your learners and get them to write programs themselves. Because you will have first-hand experience of the activities, you’ll be able to anticipate your learners’ difficulties and adapt your lessons to suit them.
All the courses are designed to take three or four weeks to complete, based on you spending two hours a week on participating. You can have free time-limited access to each course for the length of time it’s designed to take to complete. For example, if it’s a four-week course, like ‘Programming 101’, you can sign up for free to get four weeks of access.
The seven courses in the Python path can be completed in any order you like, and you can choose the courses that match your interests and needs.
Each course involves activities that help you create a programming project using the concepts that you’re learning about. These activities are designed to be a fun and interactive way to reinforce what you’ve learned and can also be used with your learners in the classroom.
Course spotlight: Programming 101
If programming is completely new to you, our ‘Programming 101’ course is the best place to start. In ‘Programming 101’, we use this definition of programming to start with the idea that programming is about you telling a computer what to do:
“Programming is how you get computers to solve problems.”
We see programming as a chance to think creatively about a problem and about all the different ways it could be solved. While you might be unfamiliar with terms like programming, algorithms, or selection, the ‘Programming 101’ course demonstrates how they touch on things that many of us know from other areas of our lives.
On the course, you will:
Learn about basic programming concepts such as sequencing and repetition
Start to write your own programs
Discover how to interpret error messages to find and fix mistakes in your programs
What will you make in the courses?
Through building an understanding of programming, you will see how you can write your own programs to make games, quizzes, physical computing projects, and more. Here’s look at some of the things you could make in three of the seven courses:
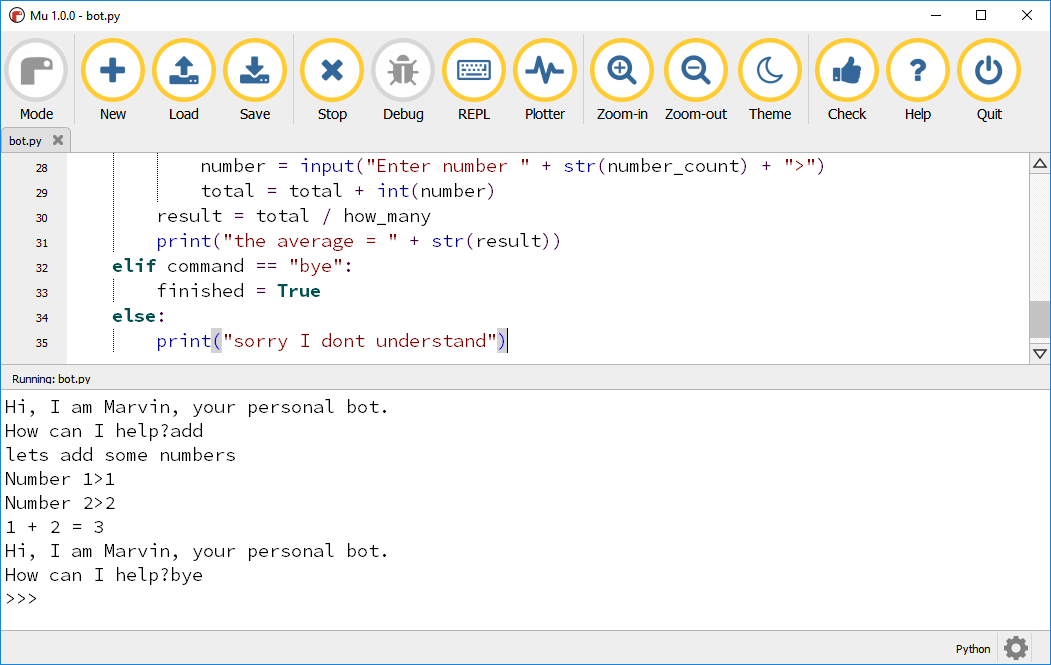
Programming 101: Write your first program in Python to make a personal assistant bot. You’ll discover how to make the output of your program respond to the user’s input.
You’ll write a program to create personal assistant bot in the ‘Programming 101’ course for beginners.
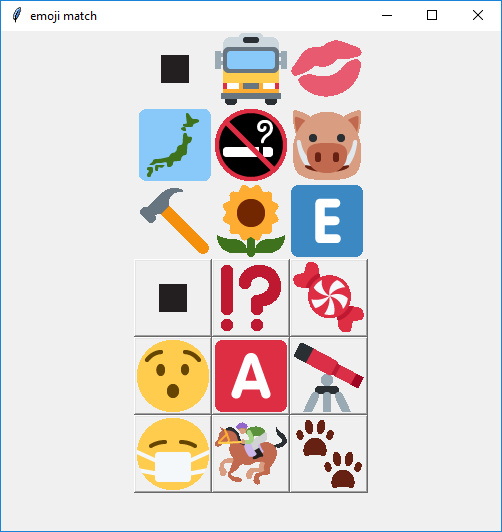
Programming with GUIs: Build a game where players compare two sets of emoji to find the emoji that matches. To make this game, you’ll use what you learn in the course to design the layout of a graphic user interface (GUI) and make sure only one emoji appears twice.
You’ll make an interactive graphic game in the ‘Programming with GUIs’ course.
Object-oriented Programming: Create a text-based adventure game with a character on a quest through different rooms! You’ll discover how to write a program that reacts to user input, and how to write your own code to create more challenges within the game based on your ideas.
If you want to help your learners develop their understanding of programming in Python, you’ll be interested in these free resources we’ve created for young people:
Introduction to Python: Our guided project path for learners who are new to text-based programming. We have created these projects with young people around the age of 9 to 13 in mind. Each project takes one hour to complete, and learners can make their own fun programs while learning about Python.
More Python: Our guided project path for learners who want to move beyond the ‘Intro to Python’ path to write programs that contain charts, artwork, and more. We’ve written these projects for young people around the age of 10 to 13.
Isaac Computer Science: This learning platform we’ve created for GCSE and A level students (age 14 to 18) uses Python and other text-based languages to teach the programming concepts within England’s computer science curriculum.
Amazon Neptune is a fully managed graph database service that makes it easy to build and run applications that work with highly connected datasets. With Neptune, you can use open and popular graph query languages to execute powerful queries that are easy to write and perform well on connected data. You can use Neptune for graph use cases such as recommendation engines, fraud detection, knowledge graphs, drug discovery, and network security.
Neptune has always been fully managed and handles time-consuming tasks such as provisioning, patching, backup, recovery, failure detection and repair. However, managing database capacity for optimal cost and performance requires you to monitor and reconfigure capacity as workload characteristics change. Also, many applications have variable or unpredictable workloads where the volume and complexity of database queries can change significantly. For example, a knowledge graph application for social media may see a sudden spike in queries due to sudden popularity.
Introducing Amazon Neptune Serverless Today, we’re making that easier with the launch of Amazon Neptune Serverless. Neptune Serverless scales automatically as your queries and your workloads change, adjusting capacity in fine-grained increments to provide just the right amount of database resources that your application needs. In this way, you pay only for the capacity you use. You can use Neptune Serverless for development, test, and production workloads and optimize your database costs compared to provisioning for peak capacity.
With Neptune Serverless you can quickly and cost-effectively deploy graphs for your modern applications. You can start with a small graph, and as your workload grows, Neptune Serverless will automatically and seamlessly scale your graph databases to provide the performance you need. You no longer need to manage database capacity and you can now run graph applications without the risk of higher costs from over-provisioning or insufficient capacity from under-provisioning.
With Neptune Serverless, you can continue to use the same query languages (Apache TinkerPop Gremlin, openCypher, and RDF/SPARQL) and features (such as snapshots, streams, high availability, and database cloning) already available in Neptune.
Let’s see how this works in practice.
Creating an Amazon Neptune Serverless Database In the Neptune console, I choose Databases in the navigation pane and then Create database. For Engine type, I select Serverless and enter my-database as the DB cluster identifier.
I can now configure the range of capacity, expressed in Neptune capacity units (NCUs), that Neptune Serverless can use based on my workload. I can now choose a template that will configure some of the next options for me. I choose the Production template that by default creates a read replica in a different Availability Zone. The Development and Testing template would optimize my costs by not having a read replica and giving access to DB instances that provide burstable capacity.
Finally, I choose Create database. After a few minutes, the database is ready to use. In the list of databases, I choose the DB identifier to get the Writer and Reader endpoints that I am going to use later to access the database.
Using Amazon Neptune Serverless There is no difference in the way you use Neptune Serverless compared to a provisioned Neptune database. I can use any of the query languages supported by Neptune. For this walkthrough, I choose to use openCypher, a declarative query language for property graphs originally developed by Neo4j that was open-sourced in 2015 and contributed to the openCypher project.
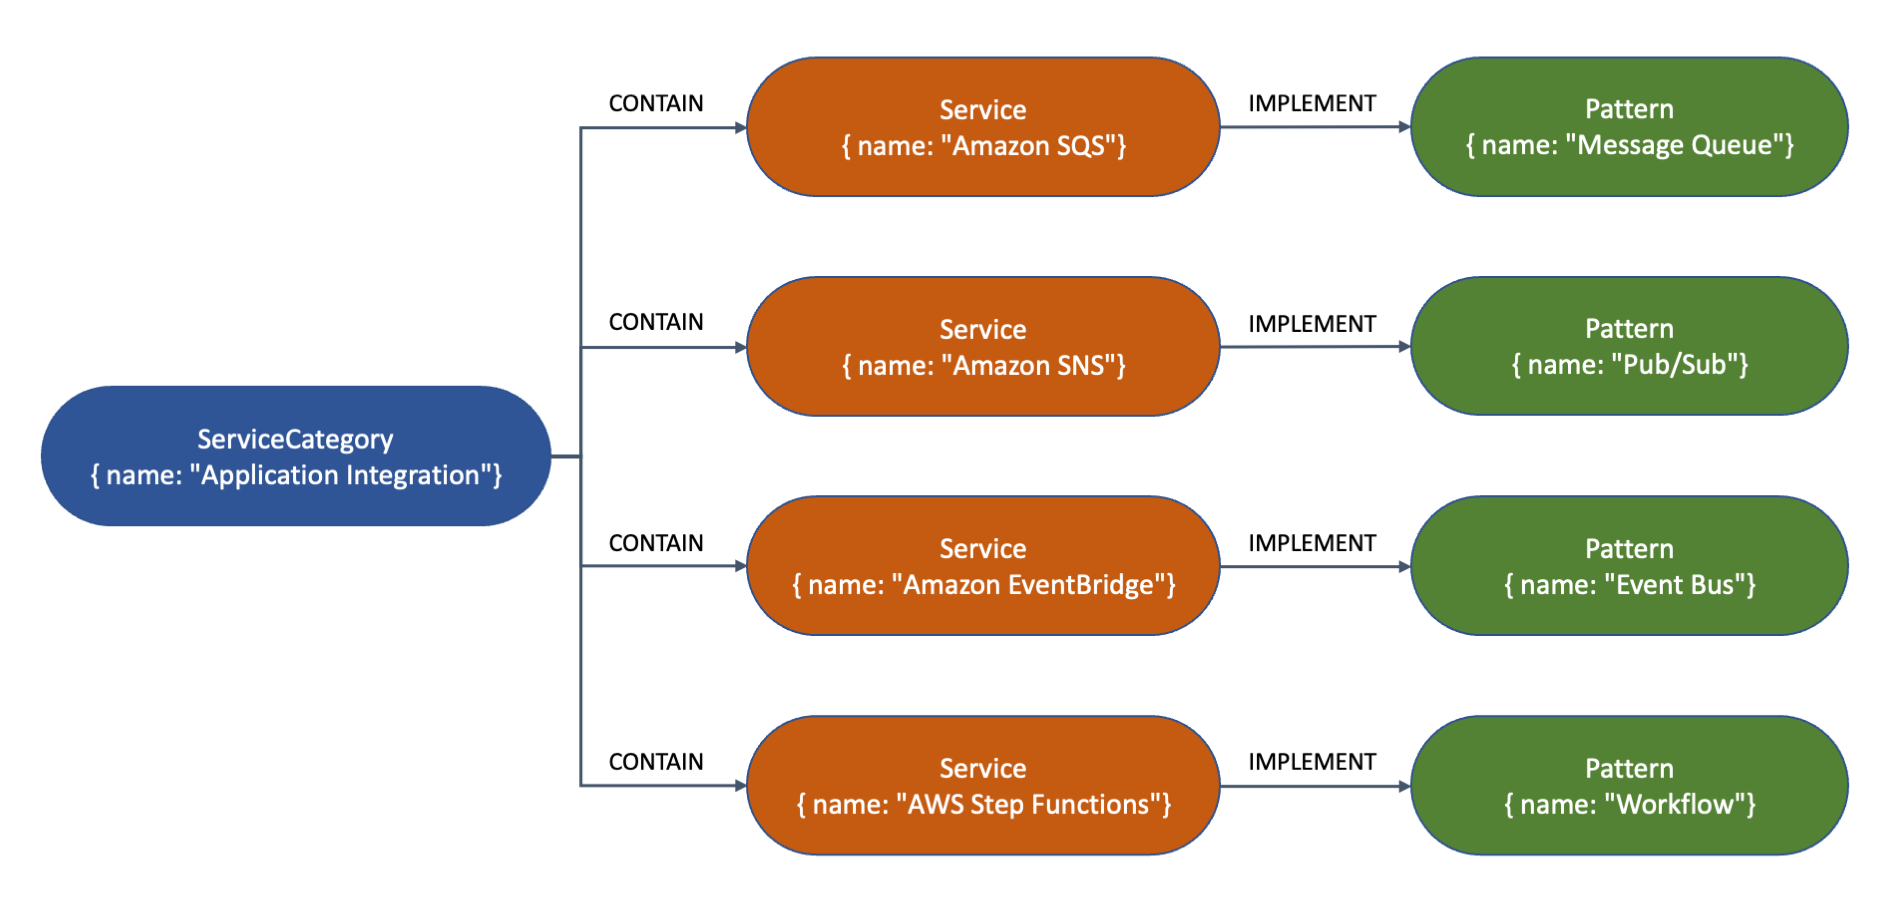
With a property graph I can represent connected data. In this case, I want to create a simple graph that shows how some AWS services are part of a service category and implement common enterprise integration patterns.
I use curl to access the WriteropenCypher HTTPS endpoint and create a few nodes that represent patterns, services, and service categories. The following commands are split into multiple lines in order to improve readability.
This is a visual representation of the nodes and their relationships for the graph created by the previous command. The type (such as Service or Pattern) and properties (such as name) are shown inside each node. The arrows represent the relationships (such as CONTAIN or IMPLEMENT) between the nodes.
Now, I query the database to get some insights. To query the database, I can use either a Writer or a Reader endpoint. First, I want to know the name of the service implementing the “Message Queue” pattern. Note how the syntax of openCypher resembles that of SQL with MATCH instead of SELECT.
There are many options now that I have this graph database up and running. I can add more data (services, categories, patterns) and more relationships between the nodes. I can focus on my application and let Neptune Serverless manage capacity and infrastructure for me.
Availability and Pricing Amazon Neptune Serverless is available today in the following AWS Regions: US East (Ohio, N. Virginia), US West (N. California, Oregon), Asia Pacific (Tokyo), and Europe (Ireland, London).
With Neptune Serverless, you only pay for what you use. The database capacity is adjusted to provide the right amount of resources you need in terms of Neptune capacity units (NCUs). Each NCU is a combination of approximately 2 gibibytes (GiB) of memory with corresponding CPU and networking. The use of NCUs is billed per second. For more information, see the Neptune pricing page.
Having a serverless graph database opens many new possibilities. To learn more, see the Neptune Serverless documentation. Let us know what you build with this new capability!
Amazon Redshift Query Editor V2.0 is a web-based analyst workbench that you can use to author and run queries on your Amazon Redshift data warehouse. You can visualize query results with charts, and explore, share, and collaborate on data with your teams in SQL through a common interface.
With SQL Notebooks, Amazon Redshift Query Editor V2.0 simplifies organizing, documenting, and sharing of data analysis with SQL queries. The notebook interface enables users such as data analysts, data scientists, and data engineers to author SQL code more easily, organizing multiple SQL queries and annotations on a single document. You can also collaborate with your team members by sharing notebooks. With SQL Notebooks, you can visualize the query results using charts. SQL Notebooks support provides an alternative way to embed all queries required for a complete data analysis in a single document using SQL cells. Query Editor V2.0 simplifies development of SQL notebooks with query versioning and export/import features. You can use the built-in version history feature to track changes in your SQL and markdown cells. With the export/import feature, you can easily move your notebooks from development to production accounts or share with team members cross-Region and cross-account.
In this post, we demonstrate how to use SQL Notebooks using Query Editor V2.0 and walk you through some of the new features.
Use cases for SQL Notebooks
Customers want to use SQL notebooks when they want reusable SQL code with multiple SQL statements and annotations or documentations. For example:
A data analyst might have several SQL queries to analyze data that create temporary tables, and runs multiple SQL queries in sequence to derive insights. They might also perform visual analysis of the results.
A data scientist might create a notebook that creates some training data, creates a model, tests the model, and runs sample predictions.
A data engineer might have a script to create schema and tables, load sample data, and run test queries.
For our use case, a data scientist wants to perform unsupervised learning with Amazon Redshift ML by creating a machine learning (ML) model, and then generate insights from the dataset, create multiple versions of the notebook, visualize using charts, and share the notebook with other team members.
Prerequisites
To use the SQL Notebooks feature, you must add a policy for SQL Notebooks to a principal—an AWS Identity and Access Management (IAM) user or role—that already has one of the Query Editor V2.0 managed policies. For more information, see Accessing the query editor V2.0.
Import the sample notebook
To import the sample SQL notebook in Query Editor V2.0, complete the following steps:
When you’re connected to the database, choose Notebooks in the navigation pane.
Choose Import to use the SQL notebook downloaded in the first step. After the notebook is imported successfully, it will be available under My notebooks.
To open the notebook, right-click on the notebook and choose Open notebook, or double-click on the notebook.
Perform data analysis
Let’s explore how you can run different queries from the SQL notebook cells for your data analysis.
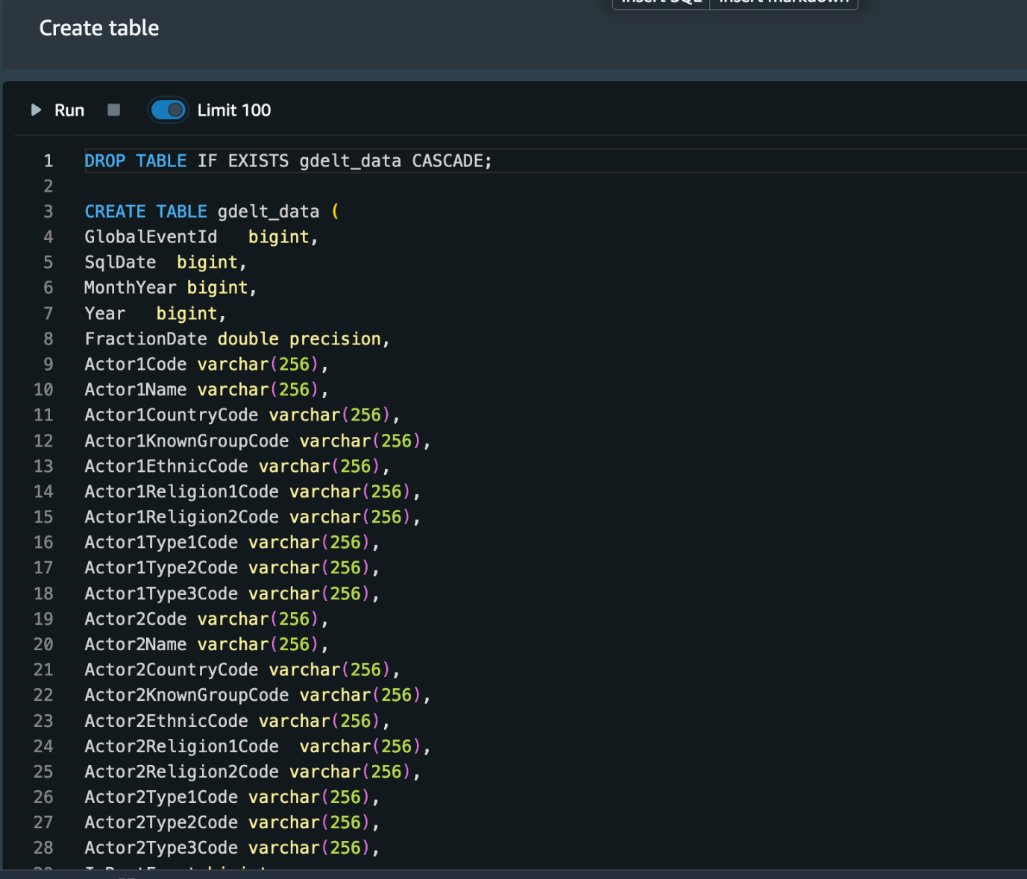
Let’s start by creating the table.
Next, we load data into the table using COPY command. Before running the COPY command in the notebook, you need to have a default IAM role attached to your Amazon Redshift cluster, or replace the default keyword with the IAM role ARN attached to the Amazon Redshift cluster:
COPY gdelt_data FROM 's3://gdelt-open-data/events/1979.csv'
region 'us-east-1' iam_role 'arn:aws:iam::<account-id>:role/<role-name>' csv delimiter '\t';
Before we create the ML model, let’s examine the training data.
Before you run the cell to create the ML model, replace the <your-amazon-s3-bucket-name> with the S3 bucket of your account to store intermediate results.
Create the ML model.
To check the status of the model, run the notebook cell Show status of the model. The model is ready when the Model State key value is READY.
Let’s identify the clusters associated with each GlobalEventId.
Let’s get insights into the data points assigned to one of the clusters.
In the preceding screenshot, we can observe the data points assigned to the clusters. We see clusters of events corresponding to interactions between the US and China (probably due to the establishment of diplomatic relations), between the US and RUS (probably corresponding to the SALT II Treaty), and those involving Iran (probably corresponding to the Iranian Revolution).
To add text and format the appearance to provide context and additional information for your data analysis tasks, you can add a markdown cell. For example, in our sample notebook, we have provided a description about the query in the markdown cells to make it simpler to understand. For more information on markdown cells, refer to Markdown Cells.
To run all the queries in the SQL notebook at once, choose Run all.
Add new SQL and markdown cells
To add new SQL queries or markdown cells, complete the following steps:
After you open the SQL notebook, hover over the cell and choose Insert SQL to add a SQL cell or Insert markdown to add a markdown cell.
The new cell is added before the cell you selected.
You can also move the new cell after a specific cell by choosing the up or down icon.
Visualize notebook results using charts
Now that you can run the SQL notebook cell and get the results, you can display a graphic visualization of the results by using the chart option in Query Editor V2.0.
Let’s run the following query to get more insights into the data points assigned to one of the cluster’s results and visualize using charts.
To visualize the query results, configure a chart on the Results tab. Choose actor2name for the X-axis and totalarticles for the Y-axis dropdown. By default, the graph type is a bar chart.
Charts can be plotted in every cell, and each cell can have multiple result tables, but only one of them can have a chart. For more information about working with charts in Query Editor V2.0, refer to Visualizing query results.
Versioning in SQL Notebooks
Version control enables easier collaboration with your peers and reduces the risks of any mistakes. You can create multiple versions of the same SQL notebook by using the Save version option in Query Editor V2.0.
In the navigation pane, choose Notebooks.
Choose the SQL notebook that you want to open.
Choose the options menu (three dots) and choose Save version. SQL Notebooks creates the new version and displays a message that the version has been created successfully. Now we can view the version history of the notebook.
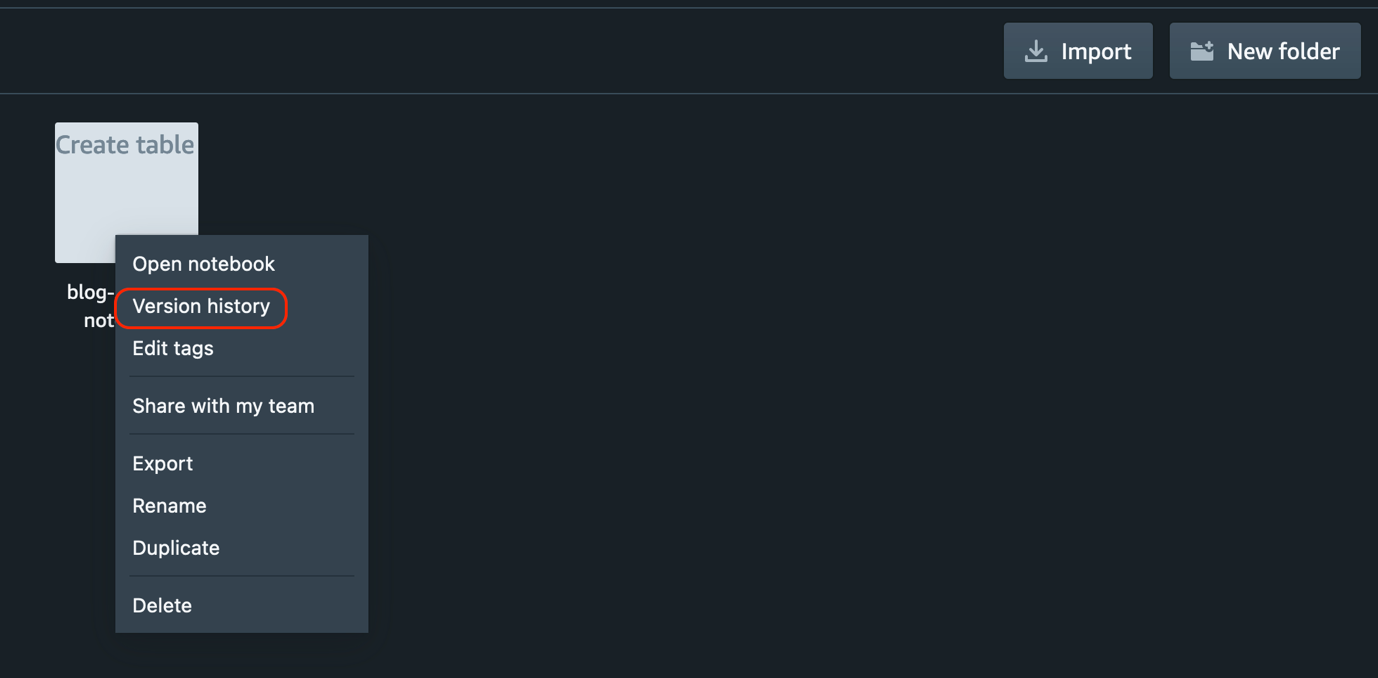
Choose the SQL notebook for which you created the version (right-click) and choose Version history. You can see a list of all the versions of the SQL notebook.
To revert to a specific version of the notebook, choose the version you want and choose Revert to version.
To create a new notebook from a version, choose the version you want and choose Create a new notebook from the version.
Duplicate the SQL notebook
While working with your peers, you might need to share your notebook, but you also need to continue making changes in your notebook. To avoid any impact with the shared version, you can duplicate the notebook and keep working on your changes in the duplicate copy of the notebook.
In the navigation pane, choose Notebooks.
Open the SQL notebook.
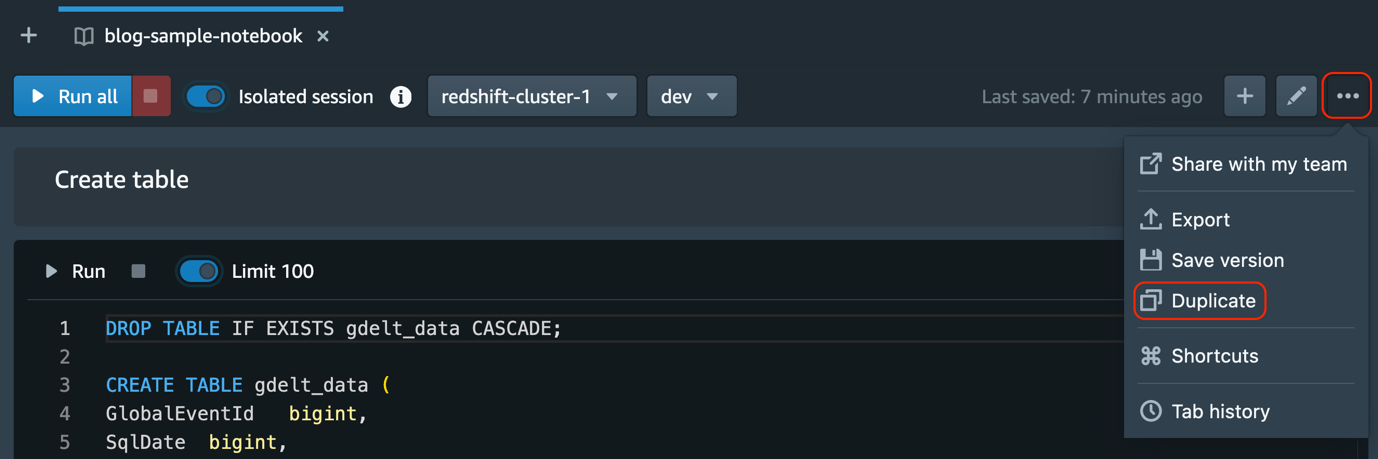
Choose the options menu (three dots) and choose Duplicate.
Provide the duplicate notebook name.
Choose Duplicate.
Share notebooks
You often need to collaborate with other teams, for example to share the queries for integration testing, deploy the queries from dev to the production account, and more. You can achieve this by sharing the notebook with your team.
A team is defined for a set of users who collaborate and share Query Editor V2.0 resources. An administrator can create a team by adding a tag to an IAM role.
Before you start sharing your notebook with your team, make sure that you have the principal tag sqlworkbench-team set to the same value as the rest of your team members in your account. For example, an administrator might set the value to accounting-team for everyone in the accounting department. To create a team and tag, refer to Permissions required to use the query editor v2.0.
To share a SQL notebook with a team in the same account, complete the following steps:
Open the SQL notebook you want to share.
Choose the options menu (three dots) and choose Share with my team.Notebooks that are shared to the team can be seen in the notebooks panel’s Shared to my team tab, and the notebooks that are shared by the user can be seen in Shared by me tab.You can also use the export/import feature for other use cases. For example, developers can deploy notebooks from lower environments to production, or customers can provide a SAAS solution sharing notebook with their end-users in different accounts or Regions. Complete the following steps to export and import SQL notebooks:
Open the SQL notebook you want to share.
Choose the options menu (three dots) and choose Export. SQL Notebooks saves the notebook in your local desktop as a .ipynb file.
Import the notebook into another account or Region.
Run parameterized queries in a SQL notebook
Database users often need to pass parameters to the queries with different values at runtime. You can achieve this in SQL Notebooks by using parameterized queries. It can be defined in the query as ${parameter_name}, and when the query is run, it prompts to set a value for the parameter.
Let’s look at the following example, in which we pass the events_cluster parameter.
Insert a SQL cell in the SQL notebook and add the following SQL query:
select news_monitoring_cluster ( AvgTone, EventCode, NumArticles, Actor1Geo_Lat, Actor1Geo_Long, Actor2Geo_Lat, Actor2Geo_Long ) as events_cluster, eventcode, actor1name, actor2name, sum(numarticles) as totalarticles
from gdelt_data
where events_cluster = ${events_cluster}
and actor1name <> ' 'and actor2name <> ' '
group by 1,2,3,4
order by 5 desc
When prompted, input the value of the parameter events_cluster, (for this post, we set the value as 4).
Choose Run now to run the query.
The following screenshot shows the query results with the events_cluster parameter value set to 4.
Conclusion
In this post, we introduced SQL Notebooks using the Amazon Redshift Query Editor V2.0. We used a sample notebook to demonstrate how it simplifies data analysis tasks for a data scientist and how you can collaborate using notebooks with your team.
About the Authors
Ranjan Burman is an Analytics Specialist Solutions Architect at AWS. He specializes in Amazon Redshift and helps customers build scalable analytical solutions. He has more than 15 years of experience in different database and data warehousing technologies. He is passionate about automating and solving customer problems with the use of cloud solutions.
Erol Murtezaoglu, a Technical Product Manager at AWS, is an inquisitive and enthusiastic thinker with a drive for self-improvement and learning. He has a strong and proven technical background in software development and architecture, balanced with a drive to deliver commercially successful products. Erol highly values the process of understanding customer needs and problems in order to deliver solutions that exceed expectations.
Cansu Aksu is a Frontend Engineer at AWS. She has several years of experience in building user interfaces that simplify complex actions and contribute to a seamless customer experience. In her career in AWS, she has worked on different aspects of web application development, including front end, backend, and application security.
Andrei Marchenko is a Full Stack Software Development Engineer at AWS. He works to bring notebooks to life on all fronts—from the initial requirements to code deployment, from the database design to the end-user experience. He uses a holistic approach to deliver the best experience to customers.
Debu Panda is a Senior Manager, Product Management at AWS. He is an industry leader in analytics, application platform, and database technologies, and has more than 25 years of experience in the IT world. Debu has published numerous articles on analytics, enterprise Java, and databases and has presented at multiple conferences such as re:Invent, Oracle Open World, and Java One. He is lead author of the EJB 3 in Action (Manning Publications 2007, 2014) and Middleware Management (Packt, 2009)
Python has lots of different options for mutable data structures, both
directly in
the language and in the standard library. Lists, dictionaries (or “dicts”), and
sets are the foundation, but two of those maintain an order based on how
the elements are added, while sets do not. A recent discussion on the Python Discourse forum raised the
idea of adding an ordered variant of sets; while it does not look like
there is a big push to add the feature, the discussion did show some of
what is generally needed to get new things into the language—and could well
lead to its inclusion.
In this episode of Security Nation, Jen and Tod talk to renowned password security expert Jeremi Gosney about how we are all guilty of bad password practices. He discusses the psychology of how we develop the various words/phrase combinations that become our crackable passwords.
Stick around for the Rapid Rundown, where Tod and Jen dive into a great story for Cybersecurity Awareness Month as well as bad data-governance practices.
Jeremi Gosney
Jeremi Gosney is a renowned password cracker and password security expert. He is a member of the Hashcat core development team, the former CEO of the password cracking firm Terahash, and the author of the Pufferfish and hmac-bcrypt password hashing functions. He also helps run the DEF CON Password Village and the PasswordsCon track at Security BSides Las Vegas.
Like the show? Want to keep Jen and Tod in the podcasting business? Feel free to rate and review with your favorite podcast purveyor, like Apple Podcasts.
Want More Inspiring Stories From the Security Community?
Arturo Borrero González has posted a detailed
summary of the Netfilter workshop that was recently held in Seville.
“This year, the number of participants was just eight people, and this
allowed the setup to be a bit more informal. We had kind of an
un-conference style meeting, in which whoever had something prepared just
went ahead and opened a topic for debate.”
This post is co-written with Darren Demicoli from The Mill Adventure.
The Mill Adventure is an iGaming industry enabler offering customizable turnkey solutions to B2B partners and custom branding enablement for its B2C partners. They provide a complete gaming platform, including licenses and operations, for rapid deployment and success in iGaming, and are committed to improving the iGaming experience by being a differentiator through innovation. The Mill Adventure already provides its services to a number of iGaming brands and seeks to continuously grow through the ranks of the industry.
In this post, we show how The Mill Adventure is helping its partners answer business-critical iGaming questions by building a data analytics application using modern data strategy using AWS. This modern data strategy approach has led to high velocity innovation while lowering the total operating cost.
With a gross market revenue exceeding $70 billion and a global player base of around 3 billion players (per a recent imarc Market Overview 2022-2027), the iGaming industry has, without a doubt, been booming over the past few years. This presents a lucrative opportunity to an ever-growing list of businesses seeking to tap into the market and attract a bigger share as their audience. Needless to say, staying competitive in this somewhat saturated market is extremely challenging. Making data-driven decisions is critical to the growth and success of iGaming businesses.
Business challenges
Gaming companies typically generate a massive amount of data, which could potentially enable meaningful insights and answer business-critical questions. Some of the critical and common business challenges in iGaming industry are:
What impacts the brand’s turnover—its new players, retained players, or a mix of both?
How to assess the effectiveness of a marketing campaign? Should a campaign be reinstated? Which games to promote via campaigns?
Which affiliates drive quality players that have better conversion rates? Which paid traffic channels should be discontinued?
For how long does the typical player stay active within a brand? What is the lifetime deposit from a player?
How to improve the registration to first deposit processes? What are the most pressing issues impacting player conversion?
Though sufficient data was captured, The Mill Adventure found two key challenges in their ability to generate actionable insights:
Lack of analysis-ready datasets (not raw and unusable data formats)
Lack of timely access to business-critical data
For example, The Mill Adventure generates over 50 GB of data daily. Its partners have access to this data. However, due to the data being in a raw form, they find it of little value in answering their business-critical questions. This affects their decision-making processes.
To address these challenges, The Mill Adventure chose to build a modern data platform on AWS that was not only capable of providing timely and meaningful business insights for the iGaming industry, but also efficiently manageable, low-cost, scalable, and secure.
Modern data architecture
The Mill Adventure wanted to build a data analytics platform using a modern data strategy that would grow as the company grows. Key tenets of this modern data strategy are:
Build a modern business application and store data in the cloud
Unify data from different application sources into a common data lake, preferably in its native format or in an open file format
Innovate using analytics and machine learning, with an overarching need to meet security and governance compliance requirements
A modern data architecture on AWS applies these tenets. Two key features that form the basic foundation of a modern data architecture on AWS are serverless and microservices.
The Mill Adventure solution
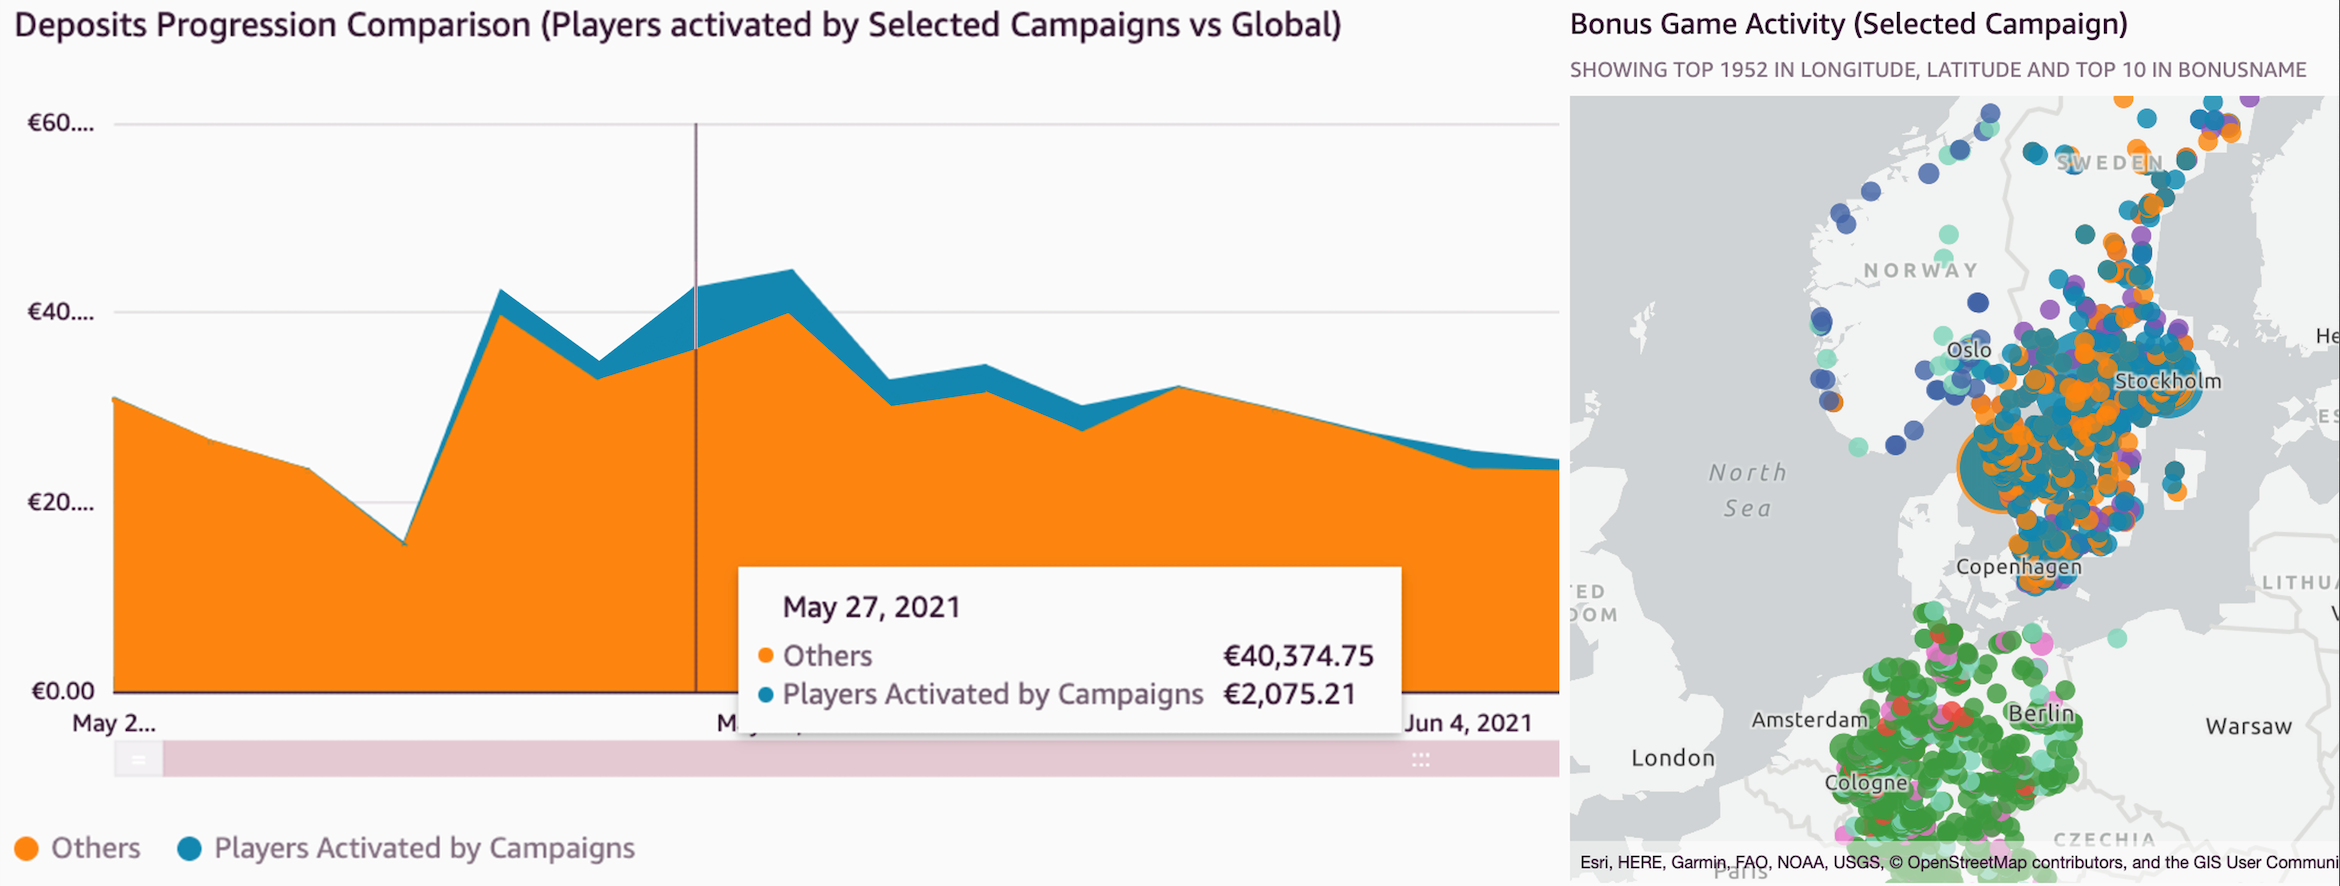
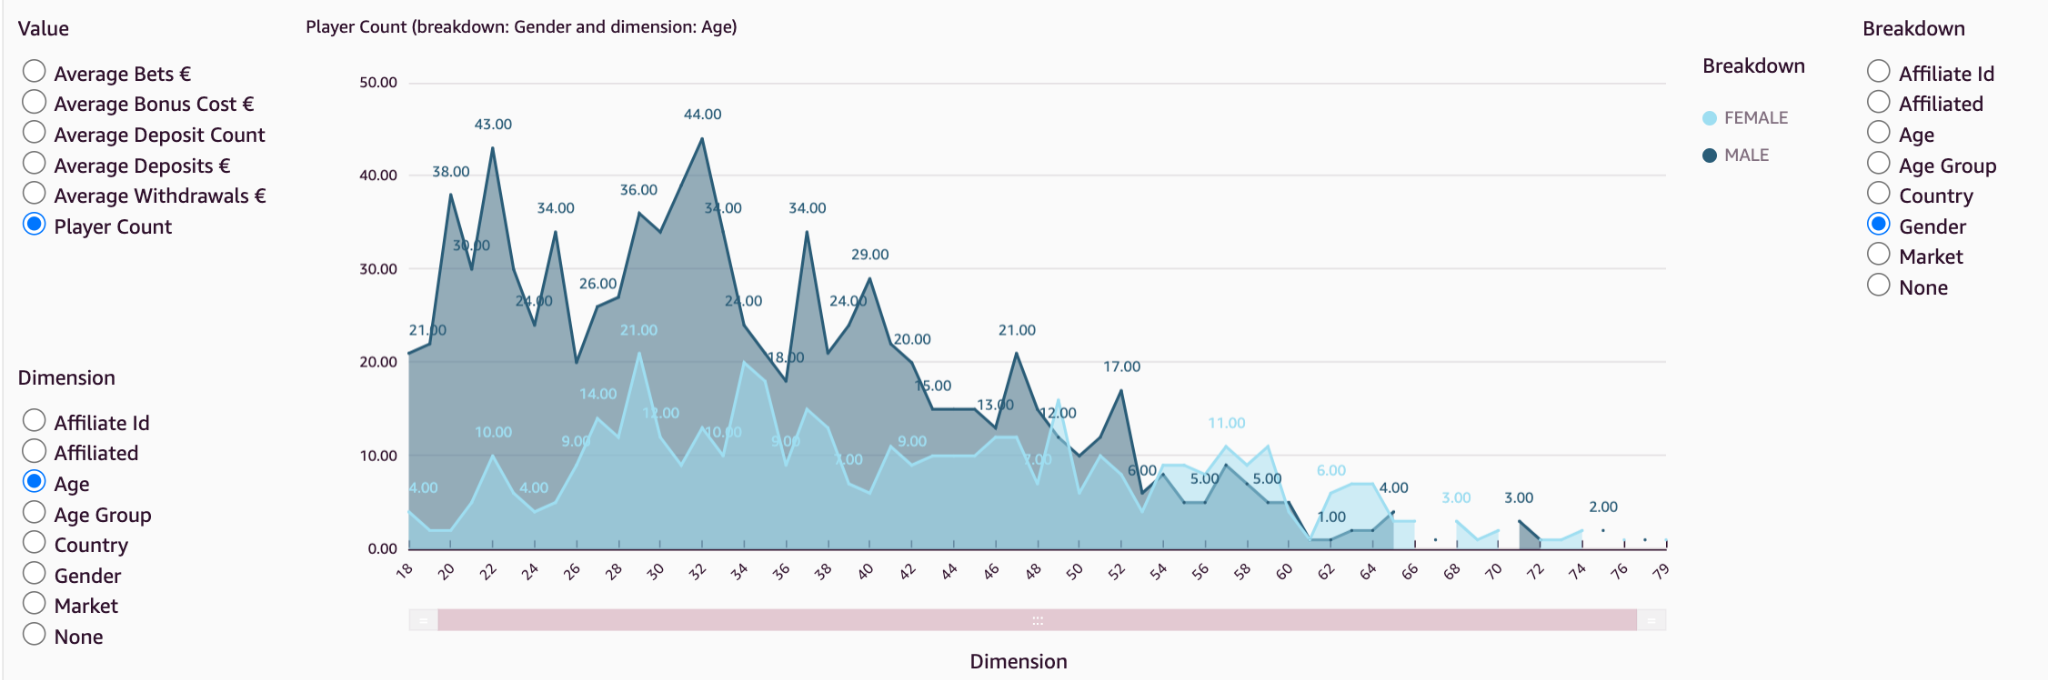
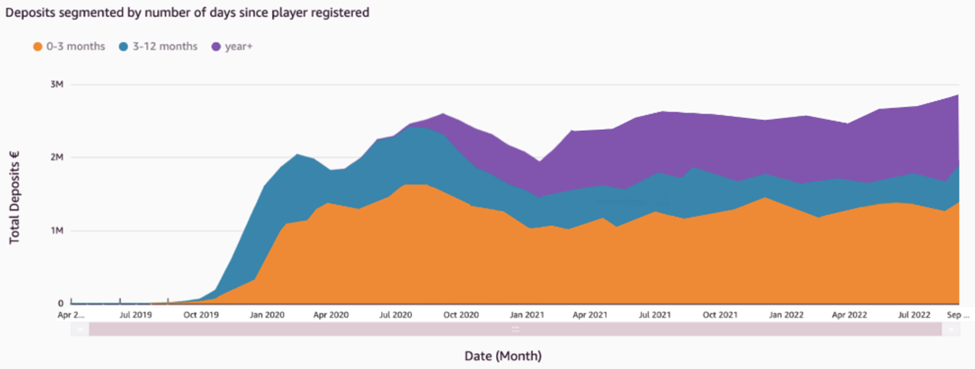
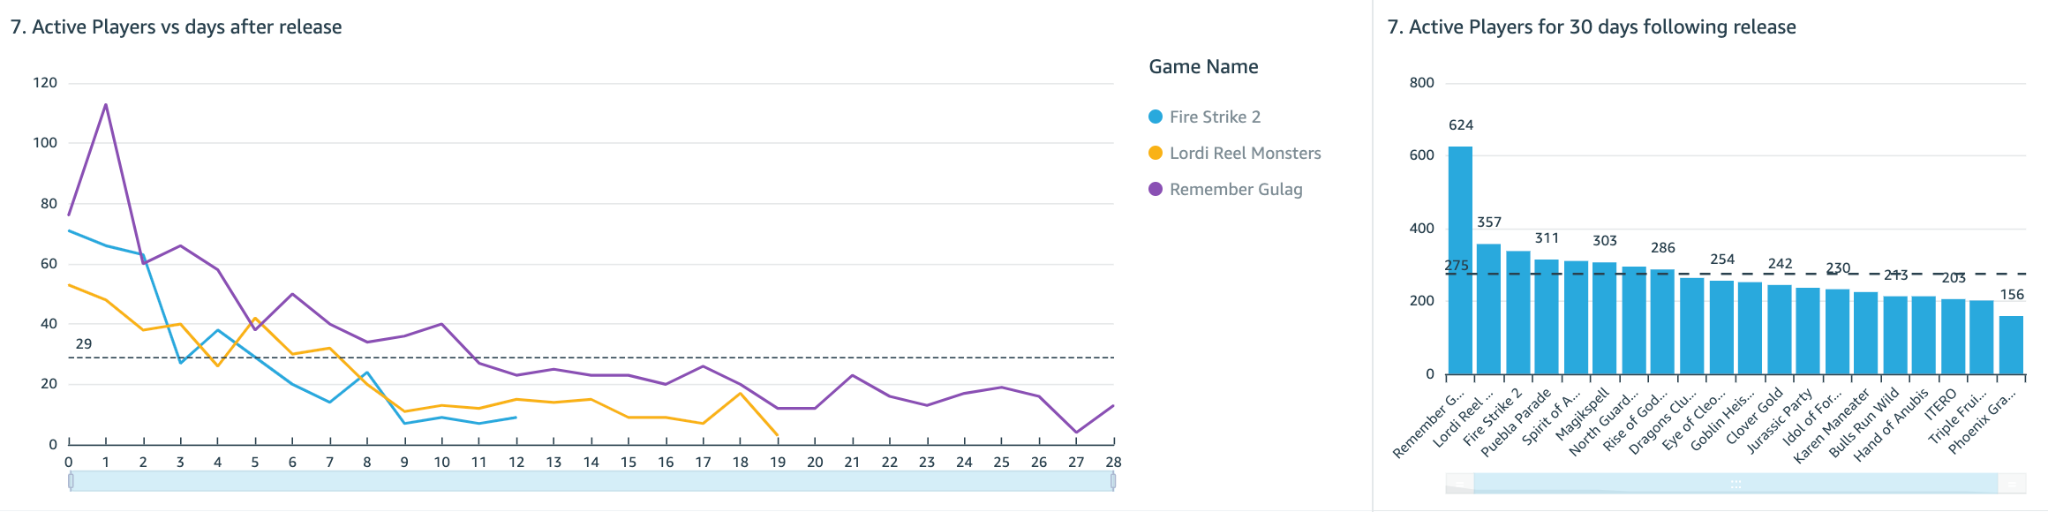
The Mill Adventure built a serverless iGaming data analytics platform that allows its partners to have quick and easy access to a dashboard with data visualizations driven by the varied sources of gaming data, including real-time streaming data. With this platform, stakeholders can use data to devise strategies and plan for future growth based on past performance, evaluate outcomes, and respond to market events with more agility. Having the capability to access insightful information in a timely manner and respond promptly has substantial impact on the turnover and revenue of the business.
A serverless iGaming platform on AWS
In building the iGaming platform, The Mill Adventure was quick to recognize the benefits of having a serverless microservice infrastructure. We wanted to spend time on innovating and building new applications, not managing infrastructure. AWS services such as Amazon API Gateway, AWS Lambda, Amazon DynamoDB, Amazon Kinesis Data Streams, Amazon Simple Storage Service (Amazon S3), Amazon Athena, and Amazon QuickSight are at the core of this data platform solution. Moving to AWS serverless services has saved time, reduced cost, and improved productivity. A microservice architecture has enabled us to accelerate time to value, increase innovation speed, and reduce the need to re-platform, refactor, and rearchitect in the future.
The following diagram illustrates the data flow from the gaming platform to QuickSight.
The data flow includes the following steps:
As players access the gaming portal, associated business functions such as gaming activity, payment, bonus, accounts management, and session management capture the relevant player actions.
Each business function has a corresponding Lambda-based microservice that handles the ingestion of the data from that business function. For example, the Session service handles player session management. The Payment service handles player funds, including deposits and withdrawals from player wallets. Each microservice stores data locally in DynamoDB and manages the create, read, update, and delete (CRUD) tasks for the data. For event sourcing implementation details, see How The Mill Adventure Implemented Event Sourcing at Scale Using DynamoDB.
Data records resulting from the CRUD outputs are written in real time to Kinesis Data Streams, which forms the primary data source for the analytics dashboards of the platform.
Amazon S3 forms the underlying storage for data in Kinesis Data Streams and forms the internal real-time data lake containing raw data.
The raw data is transformed and optimized through custom-built extract, transform, and load (ETL) pipelines and stored in a different S3 bucket in the data lake.
Both raw and processed data are immediately available for querying via Athena and QuickSight.
Raw data is transformed, optimized, and stored as processed data using an hourly data pipeline to meet analytics and business intelligence needs. The following figure shows an example of record counts and the size of the data being written into Kinesis Data Streams, which eventually needs to be processed from the data lake.
These data pipeline jobs can be broadly classified into six main stages:
Cleanup – Filtering out invalid records
Deduplicate – Removing duplicate data records
Aggregate at various levels – Grouping data at various aggregation levels of interest (such as per player, per session, or per hour or day)
Optimize – Writing files to Amazon S3 in optimized Parquet format
Report – Triggering connectors with updated data (such as updates to affiliate providers and compliance)
Ingest – Triggering an event to ingest data in QuickSight for analytics and visualizations
The output of this data pipeline is two-fold:
A transformed data lake that is designed and optimized for fast query performance
A refreshed view of data for all QuickSight dashboards and analyses
Cultivating a data-driven mindset with QuickSight
The Mill Adventure’s partners access their data securely via QuickSight datasets. These datasets are purposefully curated views on top of the transformed data lake. Each partner can access and visualize their data immediately. With QuickSight, partners can build useful dashboards without having deep technical knowledge or familiarity with the internal structure of the data. This approach significantly reduces the time and effort required and speeds up access to valuable gaming insights for business decision-making.
The Mill Adventure also provides each partner with a set of readily available dashboards. These dashboards are built on the years of experience that The Mill Adventure has in the iGaming industry, cover the most common business intelligence requirements, and jumpstart a data-driven mindset.
In the following sections, we provide a high-level overview of some of The Mill Adventure iGaming dashboard features and how these are used to meet the iGaming business analytics needs.
Key performance indicators
This analysis provides a comprehensive set of iGaming key performance indicators (KPIs) across different functional areas, including but not limited to payment activity (deposits and withdrawals), game activity (bets, gross game wins, return to player) and conversion metrics (active customers, active players, unique depositing customers, newly registered customers, new depositing customers, first-time depositors). These are presented concisely in both a quantitative view and in more visual forms.
In the following example KPI report, we can see how by presenting different iGaming metrics for key periods and lifetime, we can identify the overall performance of the brand.
Affiliates analysis
This analysis presents metrics related to the activity generated by players acquired through affiliates. Affiliates usually account for a large share of the traffic driven to gaming sites, and such a report helps identify the most effective affiliates. It informs performance trends per affiliate and compares across different affiliates. By combining data from multiple sources via QuickSight cross-data source joins, affiliate provider-related data such as earnings and clicks can be presented together with other key gaming platform metrics. By having these metrics broken down by affiliate, we can determine which affiliates contribute the most to the brand, as shown in the following example figure.
Cohort analysis
Cohort analyses track the progression of KPIs (such as average deposits) over a period of time for groups of players after their first deposit day. In the following figure, the average deposits per user (ADPU) is presented for players registering in different quarters within the last 2 years. By moving horizontally along each row on the graph, we can see how the ADPU changes for successive quarters for the same group of players. In the following example, the ADPU decreases substantially, indicating higher player churn.
We can use cohort analyses to calculate the churn rate (rate of players who become inactive). Additionally, by averaging the ADPU figures from this analysis, you can extract the lifetime value (LTV) of the ADPU. This shows the average deposit that can be expected to be deposited by players over their lifetime with the brand.
Player onboarding journey
Player onboarding is not a single-step process. In particular, jurisdictional requirements impose a number of compliance checks that need to be fulfilled along various stages during registration flow. All these, plus other steps along the registration (such as email verification), could pose potential pitfalls for players, leading them to fail to complete registration. Showing these steps in QuickSight funnel visuals helps identify such issues and pinpoint any bottlenecks in such flows, as shown in the following example. Additionally, Sankey visuals are used to monitor player movement across registration steps, identifying steps that need to be optimized.
Campaign outcome analysis
Bonus campaigns are a valuable promotional technique used to reward players and boost engagement. Campaigns can drive turnover and revenue, but there is always an inherent cost associated. It’s critical to assess the performance of campaigns and determine the net outcome. We have built a specific analysis to simplify the task of evaluating these promotions. A number of key metrics related to players activated by campaigns are available. These include both monetary incentives for game activity and deposits and other details related to player demographics (such as country, age group, gender, and channel). Individual campaign performance is analyzed and high-performance ones are identified.
In the following example, the figure on the left shows a time series distribution of deposits coming from campaigns in comparison to the global ones. The figure on the right shows a geographic plot of players activated from selected campaigns.
Demographics distribution analysis
Brands may seek to improve player engagement and retention by tailoring their content for their player base. They need to collect and understand information about their players’ demographics. Players’ demographic distribution varies from brand to brand, and the outcome of actions taken on different brands will vary due to this distribution. Keeping an eye on this demographic (age, country, gender) distribution helps shape a brand strategy in the best way that suits the player base and helps choose the right promotions that appeal most to its audience.
Through visuals such as the following example, it’s possible to quickly analyze the distribution of the selected metric along different demographic categories.
In addition, grouping players by the number of days since registration indicates which players are making a higher contribution to revenue, whether it is existing players or newly registered players. In the following figure, we can see that players who registered in the last 3 months continually account for the highest contribution to deposits. In addition, the proportion of deposits coming from the other two bands of players isn’t increasing, indicating an issue with player retention.
Compliance and responsible gaming
The Mill Adventure treats player protection with the utmost priority. Each iGaming regulated market has its own rules that need to be followed by the gaming operators. These include a number of compliance reports that need to be regularly sent to authorities in the respective jurisdictions. This process was simplified for new brands by creating a common reports template and automating the report creation in QuickSight. This helps new B2B brands meet these reporting requirements quickly and with minimal effort.
In addition, a number of control reports highlighting different areas of player protection are in place. As shown in the following example, responsible gaming reports such as those outlining player behavior deviations help identify accounts with problematic gambling patterns.
Players whose gaming pattern varies from the identified norm are flagged for inspection. This is useful to identify players who may need intervention.
Assessing game play and releases
It’s important to measure the performance and popularity of new games post release. Metrics such as unique player participation and player stakes are monitored during the initial days after the release, as shown in the following figures.
Not only does this help evaluate the overall player engagement, but it can also give a clear indication of how these games will perform in the future. By identifying popular games, a brand may choose to focus marketing campaigns on those games, and therefore ensure that it’s promoting games that appeal to its player base.
As shown in these example dashboards, we can use QuickSight to design and create business analytics insights of the iGaming data. This helps us answer real-life business-critical questions and take measurable actions using these insights.
Conclusion
In the iGaming industry, decisions not backed up by data are like an attempt to hit the bullseye blindfolded. With QuickSight, The Mill Adventure empowers its B2B partners and customers to harness data in a timely and convenient manner and support decision-making with winning strategies. Ultimately, in addition to gaining a competitive edge in maximizing revenue opportunities, improved decision-making will also lead to enhanced player experiences.
Reach out to The Mill Adventure and kick-start your iGaming journey today.
Explore rich set of out-of-the-box Amazon QuickSight ML Insights. Amazon QuickSight Q enables dashboards with natural language querying capabilities. For more information and resources on how to get started with free trial, visit Amazon QuickSight.
About the authors
Darren Demicoli is a Senior Devops and Business Intelligence Engineer at The Mill Adventure. He has worked in different roles in technical infrastructure, software development and database administration and has been building solutions for the iGaming sector for the past few years. Outside work, he enjoys travelling, exploring good food and spending time with his family.
Padmaja Suren is a Technical Business Development Manager serving the Public Sector Field Community in Market Intelligence on Analytics. She has 20+ years of experience in building scalable data platforms using a variety of technologies. At AWS she has served as Specialist Solution Architect on services such as Database, Analytics and QuickSight. Prior to AWS, she has implemented successful data and BI initiatives for diverse industry sectors in her capacity as Datawarehouse and BI Architect. She dedicates her free time on her passion project SanghWE which delivers psychosocial education for sexual trauma survivors to heal and recover.
Deepak Singh is a Solution Architect at AWS with specialization in business intelligence and analytics. Deepak has worked across a number of industry verticals such as Finance, Healthcare, Utilities, Retail, and High Tech. Throughout his career, he has focused on solving complex business problems to help customers achieve impactful business outcomes using applied intelligence solutions and services.
The 6.0.4, 5.15.75, 5.10.150, 5.4.220, 4.19.262, 4.14.296, and 4.9.331
stable kernel updates have all been released; each contains a relatively
large set of important fixes. The 6.0.5
update followed about 90 seconds later with a couple of additional
small fixes.
Collect structured data in bulk and use Zabbix preprocessing to extract and transform the necessary metrics.
Collecting data from custom monitoring endpoints such as web applications or custom in-house software can result in the collected data requiring further extraction or transformation to fit our requirements.
Use Zabbix preprocessing to extract metrics from structured data:
Extract data with JSONPath and XPath expressions
Transform XML and CSV data to JSON structures
Check for error messages in JSON and XML structures
Extract and transform metrics from Prometheus exporter endpoints
Check out the video to learn how to use Zabbix preprocessing to extract metrics from structured data.
Extract metrics from structured data with Zabbix preprocessing:
Navigate to Configuration → Hosts
Find the host where structured data is collected
Click on the Items button next to the host
Create or open an item collecting structured data
For this example, we will transform CSV to JSON
Open the Preprocessing tab
Select a structured data preprocessing rule
If required, provide the necessary parameters
Optionally, select a validation preprocessing step
For this example, we will check for errors in JSON
Extract a value by using JSONPath or XML XPath preprocessing steps
Press Test to open the test window
Press Get value and test to test the item
Close the test window and press Add or Update to add or update the item
Optionally, create dependent items to extract values from this item
Tips and best practices
You check the Handy Tips #37 to learn how to collect structured data from HTTP end-points
For CSV to JSON preprocessing the first parameter allows you specify a CSV delimiter, while the second parameter specifies the quotation symbol
For CSV to JSON preprocessing If the With header row checkbox is marked, the header line values will be interpreted as column names
For details on XML to JSON preprocessing, refer to our serialization rules for more details.
Learn how to leverage the many types of data collection provided by Zabbix and empower your data collection and processing. Sign up for our Zabbix Certified Specialist course, where under the guidance of a Zabbix certified trainer you will learn more about different types and technologies of monitoring and learn how to get the most out of your Zabbix instance.
To provide the best experiences, we use technologies like cookies to store and/or access device information. Consenting to these technologies will allow us to process data such as browsing behavior or unique IDs on this site. Not consenting or withdrawing consent, may adversely affect certain features and functions.
Functional
Always active
The technical storage or access is strictly necessary for the legitimate purpose of enabling the use of a specific service explicitly requested by the subscriber or user, or for the sole purpose of carrying out the transmission of a communication over an electronic communications network.
Preferences
The technical storage or access is necessary for the legitimate purpose of storing preferences that are not requested by the subscriber or user.
Statistics
The technical storage or access that is used exclusively for statistical purposes.The technical storage or access that is used exclusively for anonymous statistical purposes. Without a subpoena, voluntary compliance on the part of your Internet Service Provider, or additional records from a third party, information stored or retrieved for this purpose alone cannot usually be used to identify you.
Marketing
The technical storage or access is required to create user profiles to send advertising, or to track the user on a website or across several websites for similar marketing purposes.